Gotic et al J Mol Struct 993 2011 167-176
11
This article appeared in a journal published by Elsevier. The attached copy is furnished to the author for internal non-commercial research and education use, including for instruction at the authors institution and sharing with colleagues. Other uses, including reproduction and distribution, or selling or licensing copies, or posting to personal, institutional or third party websites are prohibited. In most cases authors are permitted to post their version of the article (e.g. in Word or Tex form) to their personal website or institutional repository. Authors requiring further information regarding Elsevier’s archiving and manuscript policies are encouraged to visit: http://www.elsevier.com/copyright
Transcript of Gotic et al J Mol Struct 993 2011 167-176

This article appeared in a journal published by Elsevier. The attachedcopy is furnished to the author for internal non-commercial researchand education use, including for instruction at the authors institution
and sharing with colleagues.
Other uses, including reproduction and distribution, or selling orlicensing copies, or posting to personal, institutional or third party
websites are prohibited.
In most cases authors are permitted to post their version of thearticle (e.g. in Word or Tex form) to their personal website orinstitutional repository. Authors requiring further information
regarding Elsevier’s archiving and manuscript policies areencouraged to visit:
http://www.elsevier.com/copyright
Author's personal copy
Hydrothermal synthesis of a-Fe2O3 nanorings with the help of divalent metalcations, Mn2+, Cu2+, Zn2+ and Ni2+
M. Gotic a,⇑, G. Drazic b, S. Music a
a Ru -der Boškovic Institute, Bijenicka 54, HR-10002 Zagreb, Croatiab Jozef Stefan Institute, Jamova 39, SI-1000 Ljubljana, Solvenia
a r t i c l e i n f o
Article history:Available online 23 January 2011
Keywords:HematiteAlpha-Fe2O3
PhosphateNanoringsDivalent cations
a b s t r a c t
The morphologies of a-Fe2O3 spindles and nanotubes was modified by the addition of divalent metal cat-ions M2+ (M = Mn, Cu, Zn, Ni). Divalent metal cations gradually modify the spindle to pseudosphere andthe nanotube to nanoring particle morphologies. At a higher concentration of added divalent cations thenanodisc morphology was obtained. The SEM/EDS and TEM/EDX analyses showed that precipitates con-tained Fe, O and P elements, but none of the precipitates contained divalent metal cations. The XRD pat-terns of each investigated sample fitted well to pure hematite (a-Fe2O3) and there were no other phasesobserved. The Mössbauer and XRD lines broadened with the addition of divalent metal cations. The meancrystallite sizes were calculated using the Scherrer equation from XRD line broadening of 104 and 110lines of hematite. With the addition of a Mn2+ cation the mean crystallite size gradually increased inthe a-axis direction. The relative high value of the mean crystallite size in the a-axis direction was foundfor nanorings modified by a Cu2+ cation. This high crystal distortion in the a-axis direction upon addingCu2+ was explained by a strong Jahn–Teller effect of Cu2+ that has a tetragonally distorted coordinationsphere in an octahedral coordination. Thus, quite opposite to a pure system, the modification by divalentmetal cations induced the preferential growth of a-Fe2O3 crystals in the a-axis direction. It was suggestedthat divalent metal cations introduced the defects into the planes parallel to the basal plane (0 0 1) andthus changed the type of hydroxyl groups on hematite planes, which as a consequence switched the pref-erential growth of the a-Fe2O3 along the c-axis to the growth along the a-axis.
� 2011 Elsevier B.V. All rights reserved.
1. Introduction
There is a long tradition in the synthesis of iron oxide particleswith tailored chemical composition, shape and size [1]. Moreover,this topic has recently expanded rapidly due to the application ofiron oxide nanoparticles in biomedical research. In order to modifythe shape of iron oxide particles a lot of different surfactants,organic molecules, cations and anions were used [1–4]. In particu-lar, phosphate anions were often used to modify the shape of ironoxide particles [5–7]. For instance, Ozaki et al. [5] synthesizeduniform spindle-shape colloidal hematite particles of narrow sizedistribution by the forced hydrolysis of ferric chloride solutionsat an elevated temperature. It was shown that the concentrationof phosphate ions had a significant effect on the axial ratio ofhematite particles. Sugimoto et al. [6] synthesized monodispersedpeanut-type hematite particles from condensed ferric hydroxidegel with the addition of phosphate. However, in spite of a longtradition in synthetic iron oxide chemistry a convenient and repro-
ducible one-pot procedure for a large scale synthesis of iron oxidenanotubes and nanorings has been developed just recently by Jiaet al. [8]. These authors have shown that phosphate anions can in-duce the preferential dissolution of the hematite spindle precursorto form single-crystalline iron oxide nanotubes. The same authors[9] introduced sulphate anions into the system in order to achievea better control of its morphology and this double anion mediationresulted in the synthesis of iron oxide nanorings. However, despitea series of works using the etching process in an acid environmentto produce hollow or nanotube morphology, it still remains a chal-lenge for materials scientists to synthesize uniform nanoringsusing wet-chemistry methods. For instance, Luo et al. [10] synthe-sized single-crystal tetragonal a-MnO2 nanotubes by hydrother-mal treatment of KMnO4 in a hydrochloric acid solution. Wanget al. [11] synthesized single-crystalline Cu2O hollow nanocubesvia a wet chemical route by means of a reducing (L-ascorbic acid)and simultaneously etching process with chloride ions in an acidicaqueous solution. Wang et al. [12] synthesized cobalt nanoskel-etons with all six nanocube surfaces etching with fluoride ions.Lv et al. [13] prepared the spindle porous zerovalent iron (a-Fe)particles in two steps, first they synthesized the spindle-shapea-Fe2O3 via the Jia’s procedure [8], then reduced the pre-synthe-
0022-2860/$ - see front matter � 2011 Elsevier B.V. All rights reserved.doi:10.1016/j.molstruc.2010.12.063
⇑ Corresponding author.E-mail address: [email protected] (M. Gotic).
Journal of Molecular Structure 993 (2011) 167–176
Contents lists available at ScienceDirect
Journal of Molecular Structure
journal homepage: www.elsevier .com/ locate /molst ruc

Author's personal copy
sized spindle-shape a-Fe2O3 particles by hydrogen gas. Fan et al.[14] modified the Jia’s procedure [8] to synthesize ferrite MFe2O4
(M = Co, Mn, Ni, Cu) nanotubes. Hu et al. [15] modified the Jia’sprocedure [8] by introducing microwave radiation in the hydro-thermal process.
Nanorings have also attracted a significant attention owing totheir magnetic properties. The magnetic nanoring possesses thevortex state characterized by a magnetic moment circulatingaround the ring [8,16]. In such a state magnetization turns out ofthe plane at the very centre of the vortex structure. A magneticvortex can store two bits of information by switching the vortexcore polarization [17]. The magnetic properties of a nanoring aregoverned by its geometry rather than by intrinsic materials prop-erties. a-Fe2O3 particles could be easily converted to ferrimagneticFe3O4 or c-Fe2O3 particles under the hydrogen flow or in statichydrogen conditions at temperatures about 350 �C [18]. The mor-phology of a-Fe2O3 nanorings is perfectly preserved upon theirconversion to Fe3O4 or c-Fe2O3 [8,16].
In this work we successfully turn the a-Fe2O3 nanotube tonanoring morphology by modifying the hydrothermal method forobtaining a-Fe2O3 nanotubes, previously reported by Jia et al.[8,9]. In our modification we use the benefit of introducing divalentmetal cations M2+ (M = Mn, Cu, Zn, Ni) into the system. With anincreased M2+ addition the aspect ratio of iron oxide nanotubesgradually decreases and as a result a-Fe2O3 nanorings are formed.The formed a-Fe2O3 nanorings do not contain any trace of M2+
impurities, because upon exposure to hydrothermal and acidicconditions at temperatures above 220 �C divalent cations do notprecipitate or adsorb on the a-Fe2O3 precipitate. It is suggestedthat the addition of divalent metal cations played an importantrole in changing the nanotube to nanoring morphology. However,quite opposite to a pure system where the crystal growth anddissolution of a-Fe2O3 along the c-axis was observed, the modifica-tion by divalent metal cations induced the preferential growth ofa-Fe2O3 crystal grains along the a-axis.
2. Experimental
2.1. Chemicals
The chemicals NH4H2PO4, FeCl3�6H2O, MnCl2�4H2O and ZnCl2
(anhydrous) supplied by Kemika, and CuCl2�2 H2O and NiCl2�6H2Osupplied by Merck were used. All chemicals were of analytical pur-ity and used as obtained, without further purification. Double dis-tilled water and absolute ethanol (Kemika) were also used.
2.2. Synthesis
a-Fe2O3 nanotubes and spindle-shaped nanoparticles were syn-thesized by hydrothermal treatment of a mixture of FeCl3 andNH4H2PO4 at 231 �C according to the Jia’s procedure [8]. The exper-imental procedure was as follows: 3.2 mL of aqueous FeCl3 solution(0.5 M) and 2.9 mL of aqueous NH4H2PO4 solution (0.02 M) weremixed by stirring in a glass flask with a magnetic glass stirrer. Dou-ble distilled water was then added to the final volume of 80 mL. Themixture was stirred for 15 min, then transferred to two 50-mL Tef-lon-lined stainless steel autoclaves for hydrothermal treatment at231 �C for 2 h (spindle-shaped nanoparticles) or 48 h (nanotubenanoparticles). The autoclaves were cooled down to room temper-ature, the precipitates were separated by centrifugation, rinsedwith double distilled water and absolute ethanol, and dried over-night at 60 �C. In order to add two-valent cations to the system,100 mL of 0.5 M aqueous solution of FeCl3, MnCl2, ZnCl2, CuCl2,and NiCl2 were freshly prepared, then mixed by stirring in a prede-termined volume using the glass flask and the magnetic stirrer witha glass envelope. For example, for 30 mol% of Mn2+ in solution,30 mL of 0.5 M aqueous solution of MnCl2 were added to 70 mL ofthe 0.5 M aqueous solution of FeCl3, stirred for 15 min and then6.4 mL of this solution (with [Mn2+]/[Fe3+] + [Mn2+] = 0.3) wasmixed with 5.8 mL of aqueous NH4H2PO4 solution (0.02 M) follow-ing exactly the same procedure as described above for obtaining a-Fe2O3 nanotubes [8]. The concentration of Mn2+ was varied,whereas the concentrations of Cu2+, Zn2+ and Ni2+ were fixed to30 mol%, the concentration of nanoring formation. The experimen-tal conditions for the synthesis of all samples are given in Table 1.
2.3. Characterization
X-ray diffraction (XRD) patterns were recorded at 20 �C usingthe APD 2000 X-ray powder diffractometer, with Cu Ka (k =1.54059 Å) radiation (40 kV and 30 mA conditions), graphitemonochromator, NaI-Tl detector) manufactured by ItalStructures,Riva Del Garda, Italy. The XRD patterns were recorded over the20–100� 2h range with a 2h step of 0.03� and a counting time perstep of 9–13 s. The samples were mixed with Silicon paste P4(Wacker) and put on XRD zero-quartz holder in the form of a thinlayer.
The thermal field emission scanning electron microscope(FE-SEM), model JSM-7000F, manufactured by Jeol Ltd., was con-nected to the EDS/INCA 350 (energy dispersive X-ray spectroscopy)manufactured by Oxford Instruments Ltd. In order to prevent the
Table 1Experimental conditions for the hydrothermal synthesis of a-Fe2O3 nanoparticles of different morphologies.
Sample FeCl3
(mmol)NH4H2PO4 (mmol) Molar ratio
[Fe3+]/[PO3�4 ]
M2+Cl2
(mmol)M2+
(mol%)Autoclavingat 231 �C (h)
Size (h/w)(nm/nm)
Aspect ratio(height/width)
a-Fe2O3
morphology
S0 1.60 0.0576 27.8 – – 2 �380/�90 �4.2 SpindlesS1 1.44 0.0576 25.0 0.16 (Mn2+) 10 2 �320/�80 �4.0 SpindlesS2 1.28 0.0576 22.2 0.32 (Mn2+) 20 2 �200/�80 �2.5 SpindlesS3 1.12 0.0576 19.4 0.48 (Mn2+) 30 2 �94/�88 �1.1 PseudospheresS4 0.96 0.0576 16.7 0.64 (Mn2+) 40 2 �100 – Ellipsoids, discsS5 0.80 0.0576 13.9 0.80 (Mn2+) 50 2 �100 – Ellipsoids, discsS6 1.12 0.0576 19.4 0.48 (Mn2+) 30 6 �100 – Nanorings, capsulesS7 1.12 0.0576 19.4 0.48 (Mn2+) 30 24 �110 – Nanorings, capsulesS8 1.60 0.0576 27.8 – – 48 �250/�100 �2.5 NanotubesS9 1.44 0.0576 25.0 0.16 (Mn2+) 10 48 �200/�80 �2.5 NanotubesS10 1.28 0.0576 22.2 0.32 (Mn2+) 20 48 �150/�100 �1.5 NanotubesS11 1.12 0.0576 19.4 0.48 (Mn2+) 30 48 �110 – NanoringsS12 0.96 0.0576 16.7 0.64 (Mn2+) 40 48 �110 – Nanorings, discsS13 0.80 0.0576 13.9 0.80 (Mn2+) 50 48 �110 – DiscsS14 1.12 0.0576 19.4 0.48 (Cu2+) 30 48 �110 – NanoringsS15 1.12 0.0576 19.4 0.48 (Zn2+) 30 48 �110 – NanoringsS16 1.12 0.0576 19.4 0.48 (Ni2+) 30 48 �110 – Nanorings
168 M. Gotic et al. / Journal of Molecular Structure 993 (2011) 167–176
Author's personal copy
surface charging of some samples, a thin Au/Pd film was sputteredusing Precision Etching Coating System, GATAN Model 682equipped with a thickness monitor, GATAN Model 681.
A JEOL 2010F analytical electron microscope, equipped with afield-emission gun, was used for high-resolution transmissionelectron microscopy (HRTEM) investigations for all samples. Themicroscope was operated at 200 kV, and an energydispersive X-ray spectrometer (EDXS) LINK ISIS-300 from Oxford Instrumentswith an UTW Si–Li detector employed for the chemical analysis.The samples for TEM were prepared from a diluted suspension ofnanoparticles in ethanol. A drop of the dispersion was placed ona holey carbon film deposited on a copper grid and left to dry atambient temperature.
The 57Fe Mössbauer spectra were recorded in the transmissionmode using a standard instrumental configuration by WissEl GmbH(Starnberg, Germany). 57Co in the rhodium matrix was used as a
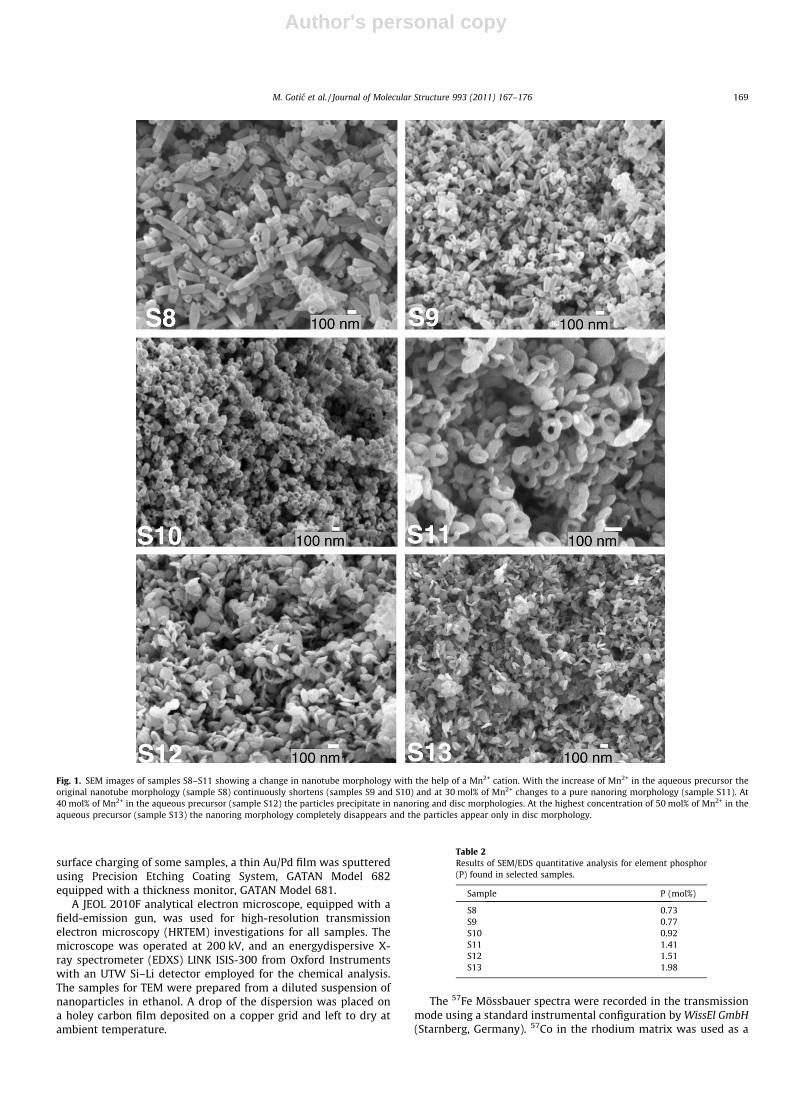
Fig. 1. SEM images of samples S8–S11 showing a change in nanotube morphology with the help of a Mn2+ cation. With the increase of Mn2+ in the aqueous precursor theoriginal nanotube morphology (sample S8) continuously shortens (samples S9 and S10) and at 30 mol% of Mn2+ changes to a pure nanoring morphology (sample S11). At40 mol% of Mn2+ in the aqueous precursor (sample S12) the particles precipitate in nanoring and disc morphologies. At the highest concentration of 50 mol% of Mn2+ in theaqueous precursor (sample S13) the nanoring morphology completely disappears and the particles appear only in disc morphology.
Table 2Results of SEM/EDS quantitative analysis for element phosphor(P) found in selected samples.
Sample P (mol%)
S8 0.73S9 0.77S10 0.92S11 1.41S12 1.51S13 1.98
M. Gotic et al. / Journal of Molecular Structure 993 (2011) 167–176 169
Author's personal copy
Mössbauer source. The spectrometer was calibrated at 20 �C usingthe standard a-Fe foil spectrum. The velocity scale and all the datarefer to the metallic a-Fe absorber at 20 �C. The experimentallyobserved Mössbauer spectra were fitted using the MossWinnprogram.
The Fourier transform infrared (FT-IR) spectra were recorded at20 �C using a Perkin–Elmer spectrometer model 2000. The speci-mens were pressed into small discs using a spectroscopically pureKBr matrix. The spectra were recorded using a KBr beam splitter inthe mid IR region (4000–400 cm�1) and a Mylar beam splitter inthe far IR region (700–200 cm�1).
3. Results and discussion
Fig. 1 shows the SEM images of samples S8–S11. It illustratesthe changing nanotube morphology as divalent cations are beingadded, in this case the Mn2+ cation. With an increase in Mn2+ inthe aqueous precursor, the length of nanotubes (sample S8) contin-uously decreases (samples S9 and S10). At 30 mol% of Mn2+ nano-tubes alter to nanoring morphology (sample S11). At 40 mol% ofMn2+ in the aqueous precursor (sample S12) the particles precipi-tate in nanoring and disc morphologies. At a concentration of50 mol% of Mn2+ (sample S13) the nanoring morphology com-pletely disappears and the particles appear only in discmorphology.
The determination of P in samples was performed using FE-SEM/EDS. These measurements of P were very accurate and repro-ducible. Table 2 sums up the results of SEM/EDS analysis for theelement phosphorus. The elements Mn, Cu, Ni and Zn were notfound in any of the samples, not even by PIXE or TEM/EDXanalyses.
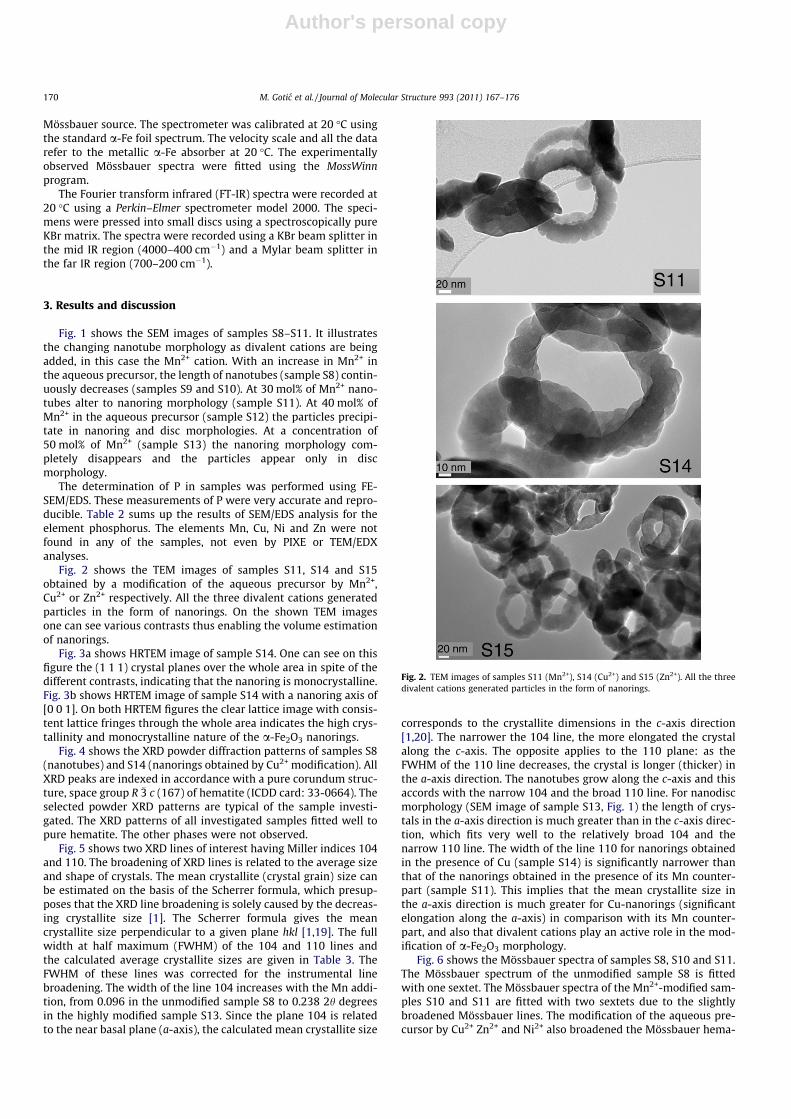
Fig. 2 shows the TEM images of samples S11, S14 and S15obtained by a modification of the aqueous precursor by Mn2+,Cu2+ or Zn2+ respectively. All the three divalent cations generatedparticles in the form of nanorings. On the shown TEM imagesone can see various contrasts thus enabling the volume estimationof nanorings.
Fig. 3a shows HRTEM image of sample S14. One can see on thisfigure the (1 1 1) crystal planes over the whole area in spite of thedifferent contrasts, indicating that the nanoring is monocrystalline.Fig. 3b shows HRTEM image of sample S14 with a nanoring axis of[0 0 1]. On both HRTEM figures the clear lattice image with consis-tent lattice fringes through the whole area indicates the high crys-tallinity and monocrystalline nature of the a-Fe2O3 nanorings.
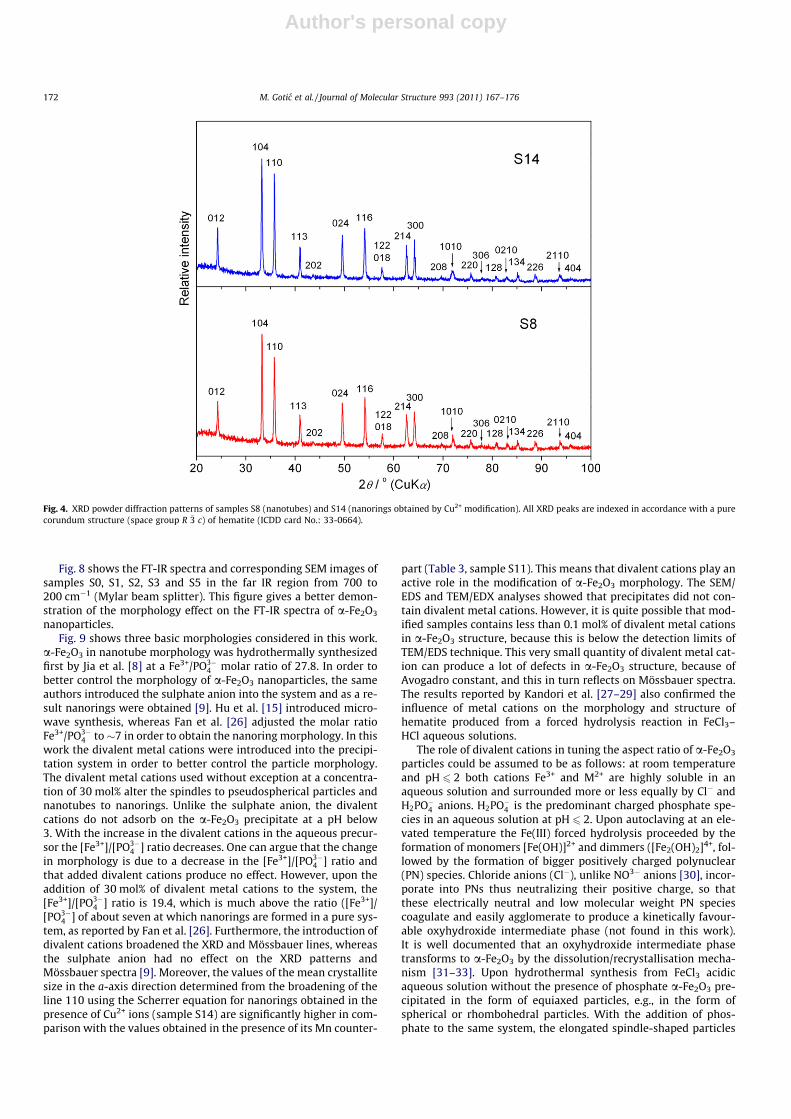
Fig. 4 shows the XRD powder diffraction patterns of samples S8(nanotubes) and S14 (nanorings obtained by Cu2+ modification). AllXRD peaks are indexed in accordance with a pure corundum struc-ture, space group R �3 c (167) of hematite (ICDD card: 33-0664). Theselected powder XRD patterns are typical of the sample investi-gated. The XRD patterns of all investigated samples fitted well topure hematite. The other phases were not observed.
Fig. 5 shows two XRD lines of interest having Miller indices 104and 110. The broadening of XRD lines is related to the average sizeand shape of crystals. The mean crystallite (crystal grain) size canbe estimated on the basis of the Scherrer formula, which presup-poses that the XRD line broadening is solely caused by the decreas-ing crystallite size [1]. The Scherrer formula gives the meancrystallite size perpendicular to a given plane hkl [1,19]. The fullwidth at half maximum (FWHM) of the 104 and 110 lines andthe calculated average crystallite sizes are given in Table 3. TheFWHM of these lines was corrected for the instrumental linebroadening. The width of the line 104 increases with the Mn addi-tion, from 0.096 in the unmodified sample S8 to 0.238 2h degreesin the highly modified sample S13. Since the plane 104 is relatedto the near basal plane (a-axis), the calculated mean crystallite size
corresponds to the crystallite dimensions in the c-axis direction[1,20]. The narrower the 104 line, the more elongated the crystalalong the c-axis. The opposite applies to the 110 plane: as theFWHM of the 110 line decreases, the crystal is longer (thicker) inthe a-axis direction. The nanotubes grow along the c-axis and thisaccords with the narrow 104 and the broad 110 line. For nanodiscmorphology (SEM image of sample S13, Fig. 1) the length of crys-tals in the a-axis direction is much greater than in the c-axis direc-tion, which fits very well to the relatively broad 104 and thenarrow 110 line. The width of the line 110 for nanorings obtainedin the presence of Cu (sample S14) is significantly narrower thanthat of the nanorings obtained in the presence of its Mn counter-part (sample S11). This implies that the mean crystallite size inthe a-axis direction is much greater for Cu-nanorings (significantelongation along the a-axis) in comparison with its Mn counter-part, and also that divalent cations play an active role in the mod-ification of a-Fe2O3 morphology.
Fig. 6 shows the Mössbauer spectra of samples S8, S10 and S11.The Mössbauer spectrum of the unmodified sample S8 is fittedwith one sextet. The Mössbauer spectra of the Mn2+-modified sam-ples S10 and S11 are fitted with two sextets due to the slightlybroadened Mössbauer lines. The modification of the aqueous pre-cursor by Cu2+ Zn2+ and Ni2+ also broadened the Mössbauer hema-
Fig. 2. TEM images of samples S11 (Mn2+), S14 (Cu2+) and S15 (Zn2+). All the threedivalent cations generated particles in the form of nanorings.
170 M. Gotic et al. / Journal of Molecular Structure 993 (2011) 167–176

Author's personal copy
tite lines. The Mössbauer parameters are given in Table 4. The cou-pling between the primary a-Fe2O3 particles as well as introducingthe defects into the a-Fe2O3 crystal grains may cause a reduction inthe hyperfine magnetic field and a broadening of Mössbauer lines.
Fig. 7 shows the FT-IR spectra of samples S0–S5. The spectrawere recorded using the KBr beam splitter in the mid IR regionfrom 4000 to 400 cm�1. The characteristic region between 2000and 400 cm�1 is shown. The IR bands at 1163, 1074, 1039, 1007,972 and 935 cm�1 are due to a specifically adsorbed phosphatein the form of both monodentate and bidentate surface complexes.Both complexes could be protonated in low pH conditions associ-ated with hydrothermal synthesis examined in this work(pH 6 2). The relative intensities of phosphate bands increase fromsample S0 to S5, which is in accordance with SEM/EDS analysis Ta-ble 2). The strong IR bands from 800 to 400 cm�1 correspond to thehematite lattice vibration. Hematite has six IR active modes, twoA2u modes with polarization parallel to the hexagonal c-axis (sym-bol || in Fig. 5) and four Eu modes with polarization perpendicularto the hexagonal c-axis (symbol ? in Fig. 5). For that reason the po-sition and intensities of IR bands are sensitive to particle size andmorphology [21–25]. Due to a high aspect ratio, the || and ?modes
at 584 and 537 cm�1 respectively in sample S0 are fully resolved.With the decrease in the nanoparticle aspect ratio the || modeshifts significantly to higher wavenumbers and the ? mode shiftsslightly to lower wavenumbers. Accordingly, these two bandsoverlap into one IR band at 565 cm�1 (sample S3). Samples S4and S5 have quite a different morphology (discs) in comparisonwith samples S0–S3 (spindles to pseudosphere). The disc morphol-ogy is more comparable to a plate-like morphology. The IR positionand relative intensity of || and ?modes for plate-like morphologiesdiffer from those of the spindles. Rendon and Serna [21] assignedIR bands at 650 and 400 cm�1 in irregular lath-shaped hematiteparticles to || mode and IR bands at 525, 440, 300 and 230 cm�1
to ? mode. Blanchard et al. [25] computed the IR spectrum ofhematite using ab initio quantum mechanical calculations. Thecomputed IR spectra for platy, spherical and ellipsoidal particleswith a different aspect ratio showed a qualitative agreement withexperimental observations. In accordance with the theoreticalhematite spectra computed by Blanchard et al. [25] and the resultsof Serna et al. [22], the IR bands for samples S4 and S5 at 541 or544 cm�1 are assigned to the ? mode, whereas the IR band at629 cm�1 is assigned to the || mode.
Fig. 3. (a) HRTEM image of sample S14 (inset right bottom) where (1 1 1) crystal planes are observed over the entire area, indicating that the nanoring is monocrystalline. Thenanoring is not in the exact low-zone axis orientation, so just fringes of one planes are visible (left top inset is FFT of the HRTEM image). Note (1 1 1) facetting at inner andouter ring surfaces; (b) HRTEM image of sample S14 and indexed FFT (inset left top) indicating that the nanoring is monocrystalline and in [0 0 1] zone axis.
M. Gotic et al. / Journal of Molecular Structure 993 (2011) 167–176 171
Author's personal copy
Fig. 8 shows the FT-IR spectra and corresponding SEM images ofsamples S0, S1, S2, S3 and S5 in the far IR region from 700 to200 cm�1 (Mylar beam splitter). This figure gives a better demon-stration of the morphology effect on the FT-IR spectra of a-Fe2O3
nanoparticles.Fig. 9 shows three basic morphologies considered in this work.
a-Fe2O3 in nanotube morphology was hydrothermally synthesizedfirst by Jia et al. [8] at a Fe3+/PO3�
4 molar ratio of 27.8. In order tobetter control the morphology of a-Fe2O3 nanoparticles, the sameauthors introduced the sulphate anion into the system and as a re-sult nanorings were obtained [9]. Hu et al. [15] introduced micro-wave synthesis, whereas Fan et al. [26] adjusted the molar ratioFe3+/PO3�
4 to �7 in order to obtain the nanoring morphology. In thiswork the divalent metal cations were introduced into the precipi-tation system in order to better control the particle morphology.The divalent metal cations used without exception at a concentra-tion of 30 mol% alter the spindles to pseudospherical particles andnanotubes to nanorings. Unlike the sulphate anion, the divalentcations do not adsorb on the a-Fe2O3 precipitate at a pH below3. With the increase in the divalent cations in the aqueous precur-sor the [Fe3+]/[PO3�
4 ] ratio decreases. One can argue that the changein morphology is due to a decrease in the [Fe3+]/[PO3�
4 ] ratio andthat added divalent cations produce no effect. However, upon theaddition of 30 mol% of divalent metal cations to the system, the[Fe3+]/[PO3�
4 ] ratio is 19.4, which is much above the ratio ([Fe3+]/[PO3�
4 ] of about seven at which nanorings are formed in a pure sys-tem, as reported by Fan et al. [26]. Furthermore, the introduction ofdivalent cations broadened the XRD and Mössbauer lines, whereasthe sulphate anion had no effect on the XRD patterns andMössbauer spectra [9]. Moreover, the values of the mean crystallitesize in the a-axis direction determined from the broadening of theline 110 using the Scherrer equation for nanorings obtained in thepresence of Cu2+ ions (sample S14) are significantly higher in com-parison with the values obtained in the presence of its Mn counter-
part (Table 3, sample S11). This means that divalent cations play anactive role in the modification of a-Fe2O3 morphology. The SEM/EDS and TEM/EDX analyses showed that precipitates did not con-tain divalent metal cations. However, it is quite possible that mod-ified samples contains less than 0.1 mol% of divalent metal cationsin a-Fe2O3 structure, because this is below the detection limits ofTEM/EDS technique. This very small quantity of divalent metal cat-ion can produce a lot of defects in a-Fe2O3 structure, because ofAvogadro constant, and this in turn reflects on Mössbauer spectra.The results reported by Kandori et al. [27–29] also confirmed theinfluence of metal cations on the morphology and structure ofhematite produced from a forced hydrolysis reaction in FeCl3–HCl aqueous solutions.
The role of divalent cations in tuning the aspect ratio of a-Fe2O3
particles could be assumed to be as follows: at room temperatureand pH 6 2 both cations Fe3+ and M2+ are highly soluble in anaqueous solution and surrounded more or less equally by Cl� andH2PO�4 anions. H2PO�4 is the predominant charged phosphate spe-cies in an aqueous solution at pH 6 2. Upon autoclaving at an ele-vated temperature the Fe(III) forced hydrolysis proceeded by theformation of monomers [Fe(OH)]2+ and dimmers ([Fe2(OH)2]4+, fol-lowed by the formation of bigger positively charged polynuclear(PN) species. Chloride anions (Cl�), unlike NO3� anions [30], incor-porate into PNs thus neutralizing their positive charge, so thatthese electrically neutral and low molecular weight PN speciescoagulate and easily agglomerate to produce a kinetically favour-able oxyhydroxide intermediate phase (not found in this work).It is well documented that an oxyhydroxide intermediate phasetransforms to a-Fe2O3 by the dissolution/recrystallisation mecha-nism [31–33]. Upon hydrothermal synthesis from FeCl3 acidicaqueous solution without the presence of phosphate a-Fe2O3 pre-cipitated in the form of equiaxed particles, e.g., in the form ofspherical or rhombohedral particles. With the addition of phos-phate to the same system, the elongated spindle-shaped particles
Fig. 4. XRD powder diffraction patterns of samples S8 (nanotubes) and S14 (nanorings obtained by Cu2+ modification). All XRD peaks are indexed in accordance with a purecorundum structure (space group R �3 c) of hematite (ICDD card No.: 33-0664).
172 M. Gotic et al. / Journal of Molecular Structure 993 (2011) 167–176

Author's personal copy
precipitated due to the selective adsorption of phosphate ions onthe surfaces parallel to the c-axis in hematite (Fig. 9, left). Jiaet al. [8,9] explained the selective adsorption of phosphate by thehigh adsorption capacities and affinities for phosphate to hematitefor planes parallel to the c-axis. The planes parallel to the c-axishave single coordinated surface hydroxyl groups, which areresponsible for high capacities and preferential adsorption as wellas dissolution of Fe3+ along the c-axis. On the other hand, the basalplane (0 0 1) that has doubly coordinated hydroxyl groups is virtu-ally inactive to phosphate adsorption. Almeida et al. [31–33] sug-gest that the phosphate ions are adsorbed preferentially on facesparallel to the c-axis of a-Fe2O3 because of the better matchingof O–O interatomic distance of PO3�
4 anions (2.5 Å) with the Fe–Fe spacing parallel (2.88 Å) rather than perpendicular (5.02 Å) tothe c-axis. Both explanations are complementary and satisfactorilyexplain the preferential growth of a-Fe2O3 particles along the c-axis in the presence of phosphate. However, in the presence ofdivalent cations in an early stage of reaction divalent metal cationscan form surface complexes with hydroxyl groups of polynuclearcomplex (PN). Such mono- and binuclear complexes involve thecoordination of metal cations and release the protons from the sur-face as proposed by Kandori et al. [27–29]:
ðPNÞFeIII—OHþM2þ ! ðPNÞFeIII—OM2þ þHþ ð1Þ
There is also a possibility that surface binuclear bidentate com-plexes are formed:
2ðPN—OHÞ þM2þ ! ðPN—OÞ2Mþ 2Hþ ð2Þ
Fig. 5. XRD powder diffraction patterns of samples S8 to S13 (nanotubes tonanodiscs) showing the region of two hematite lines with Miller indices 104 and110.
Table 3The values of full width at half maximum (FWHM) for 104 and 110 XRD lines ofhematite (a-Fe2O3), corrected for instrumental broadening. The mean crystallite(crystal grains) size perpendicular to the 104 plane along the near c-axis (D104) andthe mean crystallite size in the a-axis direction (D110), were calculated using theScherrer formula (Dhkl = 0.94k/b cos h where k is the X-ray wave length, b the fullwidth of the diffraction line at one half of the maximum intensity and h the Braggangle). The ratio D104/D110 is an estimation of the crystallite aspect ratio.
Sample FWHMa 104 FWHMa 110 D104 (nm) D110 (nm) D104/D110
S8 0.12 0.15 72 58 1.24S9 0.11 0.14 79 62 1.27S10 0.12 0.14 72 62 1.16S11 0,20 0.15 43 58 0.74S12 0.22 0.09 39 97 0.40S13 0.28 0.11 31 79 0.39S14 0.15 0.07 58 125 0.46
a The corrected FWHM values are presented, which are obtained from the plot forthe corrections of the observed diffraction profile for instrumental broadening.
Fig. 6. Mössbauer spectra of samples S8, S10 and S11 recorded at 20 �C. TheMössbauer spectrum of unmodified sample S8 is fitted with one sextet. TheMössbauer spectra of modified samples S10 and S11 are fitted with two sextets dueto slightly broadened Mössbauer lines. Mössbauer parameters are given in Table 2.
M. Gotic et al. / Journal of Molecular Structure 993 (2011) 167–176 173

Author's personal copy
where M = Mn2+, Cu2+, Zn2+ and Ni2+.These surface complexes, i.e., PN species with incorporated
divalent metal cations are building blocks for the precipitation ofkinetically more favourable oxyhydroxide primary particles. In thiswork we do not analyse the precipitate in an early stage of synthe-sis and hence we found no oxyhydroxide primary particles in oursamples. When metastable oxyhydroxide primary particles growto some critical size they start to dissolve, thus supplying theFe3+ for a-Fe2O3 nucleation.
The experimental results undoubtedly showed the influence ofM2+ cations on changes in the morphology of a-Fe2O3 particles.This process started with nucleation and was followed by the crys-tal growth of a-Fe2O3. In spite of the fact that the actual mecha-nism of nanoring formation in the present work cannot beidentified with certainty, it can be suggested that surface interac-tions between M2+ cations and phosphates and specific a-Fe2O3
planes (starting with nucleation) play an important role in the
changing of a-Fe2O3 nanotube to nanoring morphology. Likewise,the fact is the absence of M2+ cations in a-Fe2O3 particles. How-ever, the microstructural changes resulting from the presence ofM2+ cations during the synthesis of a-Fe2O3 nanorings were clearlyevidenced by experimental techniques used in this work. Besides,the change of the preferential crystallite growth from occurringalong the c-axis for a pure system to along the a-axis for samplesmodified by M2+ cations was determined using the Scherrer equa-tion from the diffraction line broadening of 104 and 110 lines of a-Fe2O3. The mean crystallite size gradually increased in the a-axisdirection with the addition of Mn2+ cations. The highest value ofthe mean crystallite size in the a-axis direction was found for nan-orings modified by a Cu2+ cation. This high crystal distortion in thea-axis direction upon adding Cu2+ can be explained by a strongJahn–Teller effect of Cu2+ that has a tetragonally distorted coordi-nation sphere in an octahedral coordination [27–29]. It can be in-ferred that divalent metal cations brought defects into the planes
Table 457Fe Mössbauer parameters at 20 �C calculated for selected samples using the MossWinn program.
Sample Sextet IS (mm s�1) QS (mm s�1) Bhf (T) LW (mm s�1) Relative area A (%) Phase composition Chi
S8 H1 0.37 �0.22 51.0 0.30 100 a-Fe2O3 1.36
S10 H1 0.37 �0.21 51.0 0.26 62.7 a-Fe2O3 1.64H2 0.36 �0.20 49.5 0.55 37.3
S11 H1 0.37 �0.21 50.8 0.24 54.0 a-Fe2O3 1.78H2 0.38 �0.19 49.3 0.51 37.3
S14 H1 0.37 �0.20 51.2 0.26 63.6 a-Fe2O3 1.77H2 0.37 �0.20 49.6 0.45 36.4
S15 H1 0.37 �0.21 51.1 0.26 61.7 a-Fe2O3 1.21H2 0.38 �0.23 49.5 0.54 38.3
S16 H1 0.37 �0.21 51.2 0.25 56.4 a-Fe2O3 1.66H2 0.36 �0.20 49.7 0.49 43.6
Key: IS = isomer shift given relative to a-Fe at 20 �C; QS = quadrupole shift; Bhf = hyperfine magnetic field; LW = line width; Chi = goodness of fitting (1.00 = relatively verygood fitting; 2.00 = relatively weak fitting).Error: IS = ±0.01 mm s�1; QS = ±0.01 mm s�1; Bhf = ±0.2 T.Remarks: H1 = sextet of hematite; H2 = sextet introduced due to broadness of lines.
Fig. 7. FT-IR spectra of samples S0–S5. The spectra were recorded using the KBr beam splitter in the mid IR region from 4000 to 400 cm�1. The characteristic region between2000 and 400 cm�1 is shown. Symbols ? and || indicate the IR mode perpendicular (Eu) and parallel (A2u) to the c-axis direction.
174 M. Gotic et al. / Journal of Molecular Structure 993 (2011) 167–176

Author's personal copy
parallel to the basal plane (0 0 1), thus changing the type and coor-dination of hydroxyl groups on hematite planes, which as a conse-quence switched the preferential growth of the a-Fe2O3 crystalgrains along the c-axis to that along the a-axis.
4. Conclusion
It has been shown that the addition of divalent metal cationshas a strong impact on the morphology and orientation of a-Fe2O3 crystal growth and dissolution. The addition of divalent me-tal cations gradually modified the spindle to pseudosphere andnanotube to nanoring particle morphologies. At a higher concen-tration of added divalent cations the nanodisc morphology wasobtained.
The SEM/EDS and TEM/EDX analyses showed that the precipi-tates contained elements Fe, O and P, but none of the precipitatescontained any of the divalent cations.
The developing a-Fe2O3 particle morphologies were clearlydemonstrated by FT-IR spectroscopy. It was found that the positionand intensities of IR bands depended strongly on the a-Fe2O3 par-ticle morphologies. The a-Fe2O3 particles with a high aspect ratiohad fully resolved A2u (||) and Eu (?) modes at 584 and 537 cm�1,respectively.
The Mössbauer and XRD lines broadened with an increasingM2+ addition. The XRD line broadening of 104 and 110 lines showsa change in the crystallite size and shape of a-Fe2O3. The meancrystallite size gradually increased in the a-axis direction withthe addition of Mn2+ cations. The highest value of the mean crystal-lite size in the a-axis direction showed the nanorings modified by30 mol% of Cu2+ cations. This high crystal distortion in the a-axisdirection upon the addition of Cu2+ could be attributed to a strongJahn–Teller effect of Cu2+ that has a tetragonally distorted coordi-nation sphere in an octahedral coordination.
Quite opposite to a pure system the divalent metal cations in-duced the preferential growth of a-Fe2O3 crystal grains in the a-axis direction. It was suggested that divalent cations introduced
Fig. 8. FT-IR spectra and corresponding SEM images of samples S0, S1, S2, S3 andS5. The spectra were recorded using a Mylar beam splitter in the far IR region from700 to 200 cm�1. This figure is an illustration of the aspect ratio effect on the FT-IRspectra of a-Fe2O3 nanoparticles. The aspect ratios continuously decrease from�4.5for spindle to �1.1 for pseudospherical nanoparticles. Symbols ? and || indicate theIR mode perpendicular (Eu) and parallel (A2u) to the c-axis direction.
Fig. 9. SEM images of three basic morphologies important for this work. The a-Fe2O3 in nanotube morphology was hydrothermally synthesized first by Jia et al. [8]. The sameauthors introduced modification by a sulphate anion to obtain nanorings [9]. Hu et al. [15] introduced microwave synthesis, whereas Fan et al. adjusted the molar ratio ofFe3+/PO3�
4 to �7 in order to obtain the nanoring morphology. In this work the modification by divalent metal cations was introduced in order to obtain nanorings and to bettercontrol the particle morphology.
M. Gotic et al. / Journal of Molecular Structure 993 (2011) 167–176 175

Author's personal copy
the defects into the planes parallel to the basal plane (0 0 1), thuschanging the type of hydroxyl groups on hematite planes, whichin turn switched the preferential growth of a-Fe2O3 along the c-axis to the growth along the a-axis.
The modification by divalent metal cations could be used as ageneral approach to the control of nanoparticle morphology usingforced hydrolysis in highly acidic aqueous solutions without pro-ducing any changes in the chemical and phase composition ofthe product.
Acknowledgments
The authors thank Dr. Stjepko Krehula, Prof. Stanko Popovic andDr. Mira Ristic for valuable discussion. Also, the authors wish tothank Mr. Jasmin Foric for help in experimental work.
References
[1] R.M. Cornell, U. Schwertmann, The Iron Oxides: Structure, Properties,Reactions, Occurrences and Uses, second ed., Wiley-VCH Verlag GmbH & Co.KgaA, Weinheim, 2003.
[2] S. Music, M. Gotic, N. Ljubešic, Mater. Lett. 25 (1995) 69.[3] M. Gotic, S. Popovic, N. Ljubešic, S. Music, J. Mater. Sci. 29 (1994) 2474.[4] S. Krehula, S. Music, Mater. Chem. Phys. 123 (2010) 67.[5] M. Ozaki, S. Kratohvil, E. Matijevic, J. Colloid Interf. Sci. 102 (1984) 146.[6] T. Sugimoto, M.M. Khan, A. Muramatsu, Colloids Surf. A 70 (1993) 167.[7] M. Gotic, S. Music, S. Popovic, L. Sekovanic, Croat. Chem. Acta 81 (2008) 569.[8] C.-J. Jia, L.-D. Sun, Z.-G. Yan, L.-P. You, F. Luo, X.-D. Han, Y.-C. Pang, Z. Zhang, C.-
H. Yan, Angew. Chem. Int. Ed. 44 (2005) 4328.[9] C.-J. Jia, L.-D. Sun, F. Luo, X.-D. Han, L.J. Heyderman, Z.-G. Yan, C.-H. Yan, K.
Zheng, Z. Zhang, M. Takano, N. Hayashi, M. Eltschka, M. Kläui, U. Rüdiger, T.
Kasama, L. Cervera-Gontard, R.E. Dunin-Borkowski, G. Tzvetkov, J. Raabe, J. Am.Chem. Soc. 130 (2008) 16968.
[10] J. Luo, H.T. Zhu, H.M. Fan, J.K. Liang, H.L. Shi, G.H. Rao, J.B. Li, Z.-M. Du, Z.X.Shen, J. Phys. Chem. C 112 (2008) 12594.
[11] Z. Wang, H. Wang, L. Wang, L. Pan, J. Phys. Chem. Solids 70 (2009) 719.[12] X. Wang, H. Fu, A. Peng, T. Zhai, Y. Ma, F. Yuan, J. Yao, Adv. Mater. 21 (2009)
1636.[13] B. Lv, Y. Hu, D. Wu, Y. Sun, Mater. Res. Bull. 44 (2009) 961.[14] H.-M. Fan, J.-B. Yi, Y. Yang, K.-W. Kho, H.-R. Tan, Z.-X. Shen, J. Ding, X.-W. Sun,
M.C. Olivo, Y.-P. Feng, ACSNano 3 (2009) 2798.[15] X. Hu, J.C. Yu, J. Gong, Q. Li, G. Li, Adv. Mater. 19 (2007) 2324.[16] M. Eltschka, M. Kläui, U. Rüdiger, T. Kasama, L. Cervera-Gontard, R.E. Dunin-
Borkowski, F. Luo, L.J. Heyderman, C.-J. Jia, L.-D. Sun, C.-H. Yan, Appl. Phys. Lett.92 (2008) 222508.
[17] B. Van Waeyenberge, A. Puzic, H. Stoll, K.W. Chou, T. Tyliszczak, R. Hertel, M.Fähnle, H. Brückl, K. Rott, G. Reiss, I. Neudecker, D. Weiss, C.H. Back, G. Schütz,Nature 444 (2006) 461.
[18] M. Gotic, G. Košcec, S. Music, J. Mol. Struct. 924–926 (2009) 347.[19] M. Ristic, S. Popovic, S. Music, Mater. Lett. 58 (2004) 2494.[20] V. Barrón, J.L. Rendon, J. Torrent, C.J. Serna, Clays Clay Miner. 32 (1984) 475.[21] J.L. Rendon, C.J. Serna, Clay Miner. 16 (1981) 375.[22] C.J. Serna, J.L. Rendon, J.E. Iglesias, Spectrochim. Acta 38 (1982) 797.[23] Y. Wang, A. Muramatsu, T. Sugimoto, Colloids Surf. A 134 (1998) 281.[24] I. Chamritski, G. Burns, J. Phys. Chem. B 109 (2005) 4965.[25] M. Blanchard, M. Lazzeri, F. Mauri, E. Balan, Am. Miner. 93 (2008) 1019.[26] H.M. Fan, G.J. You, Y. Li, Z. Zheng, H.R. Tan, Z.X. Shen, S.H. Tang, Y.P. Feng, J.
Phys. Chem. C 113 (2009) 9928.[27] K. Kandori, Y. Aoki, A. Yasukawa, T. Ishikawa, J. Mater. Chem. 8 (1998) 2287.[28] K. Kandori, A. Yasukawa, T. Ishikawa, Ind. Eng. Chem. Res. 39 (2000) 2635.[29] K. Kandori, J. Sakai, T. Ishikawa, Phys. Chem. Chem. Phys. 2 (2000) 3293.[30] S. Music, A. Vertes, G.W. Simmons, I. Czako-Nagy, H. Leidheiser Jr., J. Colloid
Interf. Sci. 85 (1982) 256.[31] T.P. Almeida, M.W. Fay, Y. Zhu, P.D. Brown, Nanoscale (2010), doi:10.1039/
c0nr00280a.[32] T.P. Almeida, M.W. Fay, Y. Zhu, P.D. Brown, J. Phys. Chem. C 113 (2009) 18689.[33] T.P. Almeida, M.W. Fay, Y. Zhu, P.D. Brown, Cryst. Eng. Commun. 12 (2010)
1700.
176 M. Gotic et al. / Journal of Molecular Structure 993 (2011) 167–176


![arXiv:2010.10019v2 [cs.CV] 3 Jan 2021 - X-MOL](https://static.fdokumen.com/doc/165x107/631ee34e63f0eba196069ef9/arxiv201010019v2-cscv-3-jan-2021-x-mol.jpg)