Global gradients of avian longevity support the classic evolutionary theory of ageing
9
Early View (EV): 1-EV Why do species and populations vary so dramatically in lifespan? e classical evolutionary theory of ageing (ETA) predicts that exposure of adult individuals to high rates of mortality due to predation, parasites or other stochastic events will hinder the evolution of increased lifespans, because most individuals will already have died from these extrinsic causes before natural selection can act on reducing intrinsic causes of mortality that lead to longer lifespans (e.g. favoring mutations that lead to healthier ageing) (Williams 1957, Hamilton 1966, Williams and Day 2003, Williams et al. 2006, Caswell 2007). Conversely, natural selection will favor slower ageing and thus increased lifespan when extrinsic mortality is low. Recent theoretical work challenged the ETA, demonstrating that its funda- mental prediction is not universally valid (Abrams 1993, Williams et al. 2006). It fails to work under particular circumstances, most notably when mortality affects all age classes equally or when the population is not regulated by density-dependent processes (Abrams 1993, Williams et al. 2006). Moreover, it has been argued on theoretical grounds (Williams and Day 2003, Williams et al. 2006) and shown experimentally (Chen and Maklakov 2012) that the ETA’s main prediction can even be reversed. Indeed, if mortality is condition-dependent (i.e. intrinsic), higher mortality should lead to the evolution of longer, not shorter, lifespans. Under this scenario, predation or diseases would act as the selective agents promoting health- ier ageing (i.e. improved condition). Two approaches have been used to test the ETA. First, experimental evolution studies on laboratory populations maintained under different selection pressures demonstrated that subjecting populations to high random mortality led to the evolution of short lifespans (or correlates of it) and vice versa (Stearns et al. 2000, Chen and Maklakov 2012). Second, interspecific comparisons have been used to test whether adaptations that presumably reduce the risk of extrinsic mortality are associated with longer lifespans. Because predation is one of the key biotic factors controlling mortality rates in animals, and predators are usu- ally larger than their prey (Cohen et al. 1993), the evolution of large body size is an obvious way to reduce mortality (Ricklefs 2010a). Even though at lower mortality levels, decreased body size should be favored by natural selection (Brown and Sibly 2006), body size is indeed the strongest predictor of lifespan in most vertebrate species (de Magalhães et al. 2007, Wasser and Sherman 2010). However, selection experiments show that the link between larger body sizes and longer life is not obligate; selection for rapid maturation and fast growth rate led to decreased lifespan while increasing body size in mice (Miller et al. 2002). Other adaptations predicted to reduce predation include hiberna- tion (Turbill 2011), arboreality (Shattuck and Williams 2010), chemical protection (Blanco and Sherman 2005) and eusociality (Keller and Genoud 1997). ese adaptations correlate with increased lifespan, independent of body size (Keller and Genoud 1997, Blanco and Sherman 2005, © 2014 e Authors. Ecography © 2014 Nordic Society Oikos Subject Editor: Mikko Mönkkönen. Accepted 20 March 2014 Ecography 37: 001–009, 2014 doi: 10.1111/ecog.00929 Global gradients of avian longevity support the classic evolutionary theory of ageing M. Valcu, J. Dale, M. Griesser, S. Nakagawa and B. Kempenaers M. Valcu ([email protected]) and B. Kempenaers, Dept of Behavioural Ecology and Evolutionary Genetics, Max Planck Inst. for Ornithology, Eberhard Gwinner Str, DE-82319 Seewiesen, Germany. – J. Dale, Inst. of Natural and Mathematical Sciences, Massey Univ., Private Bag 102 904, North Shore Mail Centre, Auckland, New Zealand. – M. Griesser, Anthropological Inst. and Museum, Univ. of Zurich, Switzerland. – S. Nakagawa, Dept of Zoology, Univ. of Otago, Dunedin, New Zealand. Senescence, the process of physiological deterioration associated with growing old, is a shared characteristic of a wide range of animals. Yet, lifespan varies dramatically among species. To explain this variation, the evolutionary theory of ageing has been proposed more than 50 yr ago. Although the theory has been tested experimentally and through comparative analyses, there remains debate whether its fundamental prediction is empirically supported. Here, we use a comprehensive database on avian life history traits to test the evolutionary theory of ageing at a global scale. We show that pronounced geographical gradients of maximum longevity exist, that they are predicted by measures of predator diversity and only partly depend on correlated life-history traits. e results are consistent with species-level analyses and can be replicated across bio-geographical regions. Our analyses suggest that stochastic predation is an important driver of the evolution of lifespan, at least in birds.
Transcript of Global gradients of avian longevity support the classic evolutionary theory of ageing
Early View (EV): 1-EV
Why do species and populations vary so dramatically in lifespan? The classical evolutionary theory of ageing (ETA) predicts that exposure of adult individuals to high rates of mortality due to predation, parasites or other stochastic events will hinder the evolution of increased lifespans, because most individuals will already have died from these extrinsic causes before natural selection can act on reducing intrinsic causes of mortality that lead to longer lifespans (e.g. favoring mutations that lead to healthier ageing) (Williams 1957, Hamilton 1966, Williams and Day 2003, Williams et al. 2006, Caswell 2007). Conversely, natural selection will favor slower ageing and thus increased lifespan when extrinsic mortality is low. Recent theoretical work challenged the ETA, demonstrating that its funda-mental prediction is not universally valid (Abrams 1993, Williams et al. 2006). It fails to work under particular circumstances, most notably when mortality affects all age classes equally or when the population is not regulated by density-dependent processes (Abrams 1993, Williams et al. 2006). Moreover, it has been argued on theoretical grounds (Williams and Day 2003, Williams et al. 2006) and shown experimentally (Chen and Maklakov 2012) that the ETA’s main prediction can even be reversed. Indeed, if mortality is condition-dependent (i.e. intrinsic), higher mortality should lead to the evolution of longer, not shorter, lifespans. Under this scenario, predation or diseases would act as the selective agents promoting health-ier ageing (i.e. improved condition).
Two approaches have been used to test the ETA. First, experimental evolution studies on laboratory populations maintained under different selection pressures demonstrated that subjecting populations to high random mortality led to the evolution of short lifespans (or correlates of it) and vice versa (Stearns et al. 2000, Chen and Maklakov 2012). Second, interspecific comparisons have been used to test whether adaptations that presumably reduce the risk of extrinsic mortality are associated with longer lifespans.
Because predation is one of the key biotic factors controlling mortality rates in animals, and predators are usu-ally larger than their prey (Cohen et al. 1993), the evolution of large body size is an obvious way to reduce mortality (Ricklefs 2010a). Even though at lower mortality levels, decreased body size should be favored by natural selection (Brown and Sibly 2006), body size is indeed the strongest predictor of lifespan in most vertebrate species (de Magalhães et al. 2007, Wasser and Sherman 2010). However, selection experiments show that the link between larger body sizes and longer life is not obligate; selection for rapid maturation and fast growth rate led to decreased lifespan while increasing body size in mice (Miller et al. 2002). Other adaptations predicted to reduce predation include hiberna-tion (Turbill 2011), arboreality (Shattuck and Williams 2010), chemical protection (Blanco and Sherman 2005) and eusociality (Keller and Genoud 1997). These adaptations correlate with increased lifespan, independent of body size (Keller and Genoud 1997, Blanco and Sherman 2005,
© 2014 The Authors. Ecography © 2014 Nordic Society OikosSubject Editor: Mikko Mönkkönen. Accepted 20 March 2014
Ecography 37: 001–009, 2014 doi: 10.1111/ecog.00929
Global gradients of avian longevity support the classic evolutionary theory of ageing
M. Valcu, J. Dale, M. Griesser, S. Nakagawa and B. Kempenaers
M. Valcu ([email protected]) and B. Kempenaers, Dept of Behavioural Ecology and Evolutionary Genetics, Max Planck Inst. for Ornithology, Eberhard Gwinner Str, DE-82319 Seewiesen, Germany. – J. Dale, Inst. of Natural and Mathematical Sciences, Massey Univ., Private Bag 102 904, North Shore Mail Centre, Auckland, New Zealand. – M. Griesser, Anthropological Inst. and Museum, Univ. of Zurich, Switzerland. – S. Nakagawa, Dept of Zoology, Univ. of Otago, Dunedin, New Zealand.
Senescence, the process of physiological deterioration associated with growing old, is a shared characteristic of a wide range of animals. Yet, lifespan varies dramatically among species. To explain this variation, the evolutionary theory of ageing has been proposed more than 50 yr ago. Although the theory has been tested experimentally and through comparative analyses, there remains debate whether its fundamental prediction is empirically supported. Here, we use a comprehensive database on avian life history traits to test the evolutionary theory of ageing at a global scale. We show that pronounced geographical gradients of maximum longevity exist, that they are predicted by measures of predator diversity and only partly depend on correlated life-history traits. The results are consistent with species-level analyses and can be replicated across bio-geographical regions. Our analyses suggest that stochastic predation is an important driver of the evolution of lifespan, at least in birds.

2-EV
Shattuck and Williams 2010, Turbill et al. 2011). The ETA also predicts longer lifespans in safe versus hazardous envi-ronments, and this has been confirmed by comparing popu-lations that differ in levels of predation (Austad 1993).
Reproductive effort is another life-history trait that can covary inversely with lifespan (Jeschke and Kokko 2009) however, the link between reproductive effort and lifespan is not necessarily obligate. An experimental study in fruit flies showed that dietary restrictions can extend the individuals lifespan regardless their reproductive effort (Mair et al. 2004).
Despite a large body of research, there is still no consen-sus that the ETA explains the observed variation in animal lifespans (Williams et al. 2006). Although experimental evolution studies convincingly show that extrinsic mortality can be a strong force driving the evolution of lifespan in the laboratory, they remain restricted to a handful of inverte-brate species. Comparative studies have provided a set of examples that indirectly support a link between longevity and extrinsic mortality, but alternative models that incorpo-rate population dynamics and condition-dependent mortal-ity have been proposed (Abrams 1993, Williams and Day 2003). Most importantly, it has been argued that in natural systems mortality is often condition-dependent, so that higher mortality should lead to the evolution of longer lifespans (Chen and Maklakov 2012). Furthermore, some laboratory and field studies did not support the ETA (Kamilar et al. 2010) or even showed a pattern opposite to the one expected (Reznick et al. 2004).
Testing the generality of the ETA requires three compo-nents: 1) a measure of predation risk experienced by a prey species during its recent evolutionary history, 2) a measure of lifespan that reflects intrinsic mortality and 3) evidence for a consistent correlation between these two measures.
1) The total number of sympatric predators of a given prey species (predator richness) is a measure of predation risk, reflecting both current and historical predation risk. Overall predator densities are more stable over time in pop-ulations with more predators because communities with higher species richness – and thus higher predator richness (Sandom et al. 2013) – exhibit increased temporal stability (Mikkelson et al. 2011). Higher predator richness can have risk-reducing effects on particular prey species (Sih et al. 1998). However, since predator–predator interactions are often of a predatory nature themselves (Sergio and Hiraldo 2008), this does not necessarily translate into a lower predation risk at community level. On the contrary, a higher predator richness can have risk-enhancing effects (Sih et al. 1998, Caro 2005) because a prey’s response to one predator species (e.g. changing habitat to evade the predator) typically increases its risk to be predated by other predators. Indeed, a worldwide meta-analysis of mam-malian and bird predator manipulation experiments sug-gested that reduced predator richness could positively affect prey population sizes (Salo et al. 2010).
2) A reliable measure for lifespan needs to reflect mortality independent of predation or other extrinsic risks. Maximum longevity is a valid index of lifespan because it reflects a species ageing rate and – under controlled conditions – its genetic constraints on lifespan (de Magalhães et al. 2007). This is supported by the observation that domesticated
animals (i.e. those well cared for and predation free) and populations of related wild species have a very similar aging-related component of mortality (Ricklefs 2010a). Moreover, analyses using survival-based ageing rates corroborate results based on maximum longevities among vertebrate species (Ricklefs 2010b). However, estimates of maximum longevity are potentially biased by the total research effort spent on a given species (Carey 2003) and, when measured in the wild, by predation pressure or other extrinsic mortality fac-tors. Hence, in practice, one needs to account for research effort and data origin (wild vs captivity) in the analyses.
3) Ideally, the covariation between lifespan and predation risk measures should be tested across multiple levels of analysis (i.e. species and above-species levels). Extending the analysis from the non-spatial level of species to spatially explicit above-species levels is done on the basis of species geographical ranges (Valcu et al. 2012 and references therein). The results obtained at species level can thus be validated across multiple geographical areas with independent evolu-tionary histories (Jetz and Fine 2012).
Here, we use a comprehensive database on avian life history traits, research effort metrics and species geographi-cal distributions to test the fundamental prediction of the ETA at a global scale.
We investigate the explicit link between avian lifespan and different aspects of predator diversity (e.g. predator richness) at three levels of analysis: the species level (inter-specific, controlled for phylogeny), the above-species level (assemblage, i.e. all bird species that share a common geographical region, controlled for spatial autocorrelation and bioregion), and across bio-geographical regions.
Methods
Maximum longevity data and lifespan
Maximum longevity data were available for 1396 avian species, of which 1128 were obtained in the wild and 268 in captivity. For 168 species for which data from both sources were available, maximum longevity in the wild correlated with longevity in captivity (Pearson’s r 0.66, t166 11.3, p 0.001).
We compiled species estimates of maximum longevity from six databases: AnAge – Build 1 (de Magalhaes et al. 2009), Appendix 1 in (Wasser and Sherman 2010), Bird Banding Laboratory (Bird Banding Laboratory), EURING (Fransson et al. 2010), Australian Bird and Bat Banding Scheme (Kuffer 2012) and Birds of South Africa Banding Scheme (Maclean and Robert 1985). To correct for inherent biases associated with maximum longevity estimates (Carey 2003) a measure of research effort (the number of independent entries per species in the Zoological Record database) and origin (wild or captivity) were included as a covariates in all models.
Life-history trait estimates
We compiled data on body mass (n 8085 species) (Dunning 2008) and mean or modal clutch size (n 6827 species) (del Hoyo et al. 1992–2010). When more than one
3-EV
body mass entry was available for a species, we computed the mean weighted by sample size.
Mapping
Global distribution mapping was performed based on breed-ing range maps of all extant birds using rangeMapper 0.2-3 (Valcu et al. 2012). We digitized breeding ranges (i.e. the geographical extent of occurrence of each species in the reproductive season) from various sources (Valcu et al. 2012) (and references within) onto a 720 360 pixel template of the earth and converted these raster images into geo-referenced vector files. A rangeMapper project was set on a grid of 112.5 112.5 km using a Mollweide projec-tion. Bioregions (n 45) were defined through the inter-section of biomes (Olson et al. 2001) with major zoogeographic realms (Holt et al. 2013) amounting to 10 708 grid cells (Supplementary material Appendix 1, Fig. A1A).
Assemblage longevity was computed as median of maxi-mum longevity values for species existing within each grid cell. Similarly, mean values within each grid cell were computed for log (body mass), clutch size, research effort and origin of the data. Predicted longevity was computed as the median of maximum species longevities predicted from the species-level phylogenetic gls models averaged per species (see below).
Indices of predation
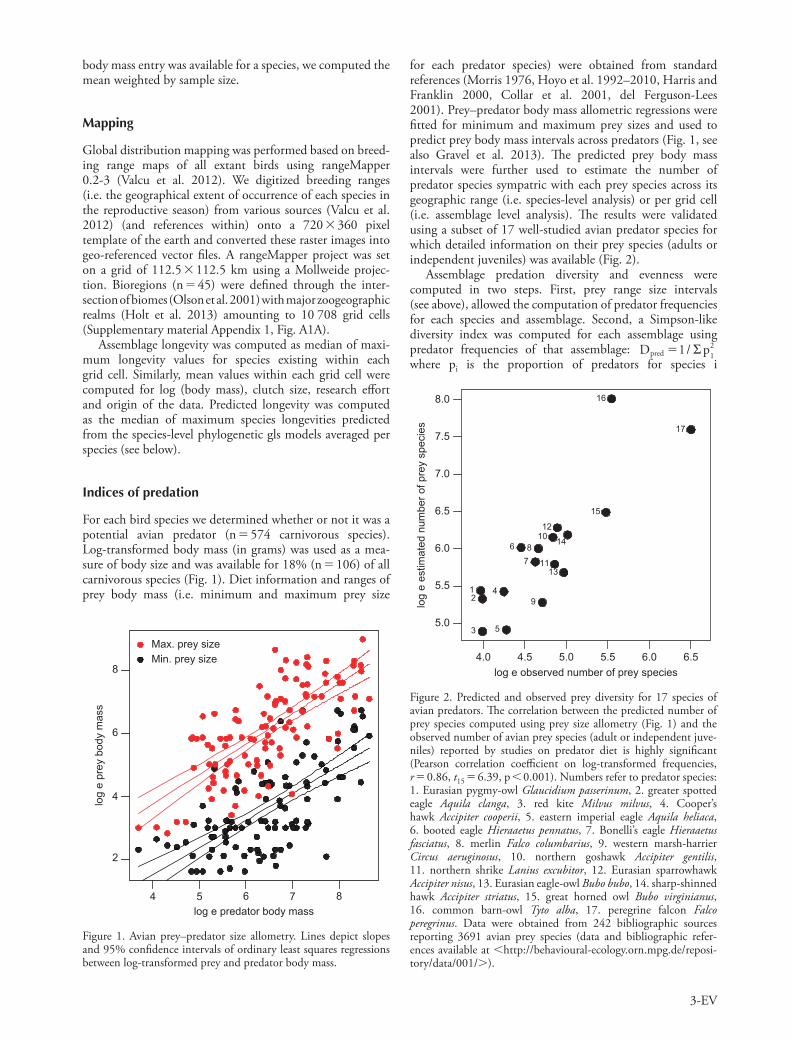
For each bird species we determined whether or not it was a potential avian predator (n 574 carnivorous species). Log-transformed body mass (in grams) was used as a mea-sure of body size and was available for 18% (n 106) of all carnivorous species (Fig. 1). Diet information and ranges of prey body mass (i.e. minimum and maximum prey size
log e observed number of prey species
log
e es
timat
ed n
umbe
r of p
rey
spec
ies
12
3
4
5
4.5 5.0
5.0
5.5
6.0
6.5
7.0
7.5
8.0
5.5 6.0 6.54.0
678
9
10
11
12
13
14
15
16
17
Figure 2. Predicted and observed prey diversity for 17 species of avian predators. The correlation between the predicted number of prey species computed using prey size allometry (Fig. 1) and the observed number of avian prey species (adult or independent juve-niles) reported by studies on predator diet is highly significant (Pearson correlation coefficient on log-transformed frequencies, r 0.86, t15 6.39, p 0.001). Numbers refer to predator species: 1. Eurasian pygmy-owl Glaucidium passerinum, 2. greater spotted eagle Aquila clanga, 3. red kite Milvus milvus, 4. Cooper’s hawk Accipiter cooperii, 5. eastern imperial eagle Aquila heliaca, 6. booted eagle Hieraaetus pennatus, 7. Bonelli’s eagle Hieraaetus fasciatus, 8. merlin Falco columbarius, 9. western marsh-harrier Circus aeruginosus, 10. northern goshawk Accipiter gentilis, 11. northern shrike Lanius excubitor, 12. Eurasian sparrowhawk Accipiter nisus, 13. Eurasian eagle-owl Bubo bubo, 14. sharp-shinned hawk Accipiter striatus, 15. great horned owl Bubo virginianus, 16. common barn-owl Tyto alba, 17. peregrine falcon Falco peregrinus. Data were obtained from 242 bibliographic sources reporting 3691 avian prey species (data and bibliographic refer-ences available at http://behavioural-ecology.orn.mpg.de/reposi-tory/data/001/).
Max. prey sizeMin. prey size
log e predator body mass4 5
2
4
6
8
6 7 8
log
e pr
ey b
ody
mas
s
Figure 1. Avian prey–predator size allometry. Lines depict slopes and 95% confidence intervals of ordinary least squares regressions between log-transformed prey and predator body mass.
for each predator species) were obtained from standard references (Morris 1976, Hoyo et al. 1992–2010, Harris and Franklin 2000, Collar et al. 2001, del Ferguson-Lees 2001). Prey–predator body mass allometric regressions were fitted for minimum and maximum prey sizes and used to predict prey body mass intervals across predators (Fig. 1, see also Gravel et al. 2013). The predicted prey body mass intervals were further used to estimate the number of predator species sympatric with each prey species across its geographic range (i.e. species-level analysis) or per grid cell (i.e. assemblage level analysis). The results were validated using a subset of 17 well-studied avian predator species for which detailed information on their prey species (adults or independent juveniles) was available (Fig. 2).
Assemblage predation diversity and evenness were computed in two steps. First, prey range size intervals (see above), allowed the computation of predator frequencies for each species and assemblage. Second, a Simpson-like diversity index was computed for each assemblage using predator frequencies of that assemblage: D ppred 1 1
2/ Σ where pi is the proportion of predators for species i
4-EV
Table 1. Predictors of avian longevity at the species level.
Model Predictor Estimate SE z-value p-value
A Intercept 7.72 0.76Research effort 3.27 0.36 9.14 0.001Origin 4.92 0.56 8.72 0.001log-range size 0.50 0.43 1.16 0.25log-predator species 21.35 0.51 2.66 0.008
B Intercept 11.04 0.25Research effort 3.18 0.34 9.42 0.001Origin 3.61 0.09 39.04 0.001log-range size 1.07 0.42 2.53 0.011log-body mass 8.12 0.58 14.13 0.001Clutch size 22.72 0.34 8.01 0.001log-predator species 21.82 0.44 4.16 0.001
C Intercept 15.35 0.30 50.82Research effort 5.76 1.10 5.24 0.001log-range size 3.97 1.15 3.45 0.001log-body mass 12.03 0.86 14.03 0.001Clutch size 24.09 0.59 26.95 0.001log-predator species 23.87 0.75 25.14 0.001
Notes: species-level phylogenetic gls models are based on 100 model-averaged predictions (using randomly generated phyloge-netic trees available at http://birdtree.org), with maximum lon-gevity as the dependent variable. ‘Research effort’ is the number of independent entries in the Zoological Record database, ‘Origin’ is zero when maximum longevity was recorded from individuals in the wild or one when it was recorded in captivity. ‘log-range size’ is the total area of the breeding range (log-transformed). ‘log- predator species’ is the number of sympatric predators (log- transformed) corresponding to each species. Model C includes only species (n 268) with lifespan recorded in captivity. The phylogenetic signal, estimated as Pagel’s l coefficient, was l 0.73 (0.70, 0.76) for model A (mean and 95% CI), l 0.58 (0.54, 0.63) for model B and l 0.62 for model C respectively.
(for the properties of the estimator see Supplementary material Appendix 1, Fig. A2). Accordingly, predator even-ness was computed as Dpred/N where N is the species richness of the given assemblage.
Statistical analyses
All statistical analyses were performed in R 2.15.1 (R Development Core Team). To account for phylogenetic non-independence in the species-level analysis phyloge-netic generalized least square (gls) models were employed using the package nlme (Pinheiro and Bates 2000). The gls models included a phylogenetic correlation structure (cor-Pagel) (Paradis et al. 2004) and, due to the heteroscedastic-ity of the residuals, the models contained a variance correlation structure (varIdent) (Pinheiro and Bates 2000) allowing for different variances for each taxonomic order. Phylogenetic analyses were conducted using phylo-genetic trees available at http://birdtree.org (Jetz et al. 2012). To account for phylogenetic uncertainty gls models were constructed using 100 trees (Hackett back-bone Jetz et al. 2012). We employed model averaging, using MuMIn package (Bartoń 2009) to construct a final gls model and we additionally computed the mean and standard error value of Pagel’s l coefficient of phylogenetic signal (Freckleton et al. 2002).
For assemblage-level modeling we used general linear mixed effect (glmm) models (Pinheiro and Bates 2000). Two random effect structures were selected: a random intercept for bioregion and a random slope for predator diversity or predator evenness. A spatial correlation struc-ture (corExp), including a nugget effect (i.e. variance estimate of adjacent assemblages), was defined for each bioregion. We used the Akaike’s information criterion (AIC) to search for the best fitted models in term of spatial and random correlation structure (Supplementary material Appendix 1, Table A1).
Predictors at the bioregion level were defined as averages of predictors at the assemblage-level and analyzed using ordi-nary least squares (ols) multiple regression. In all analyses, all continuous predictors are mean-centered and scaled (divided by two standard deviations) (Gelman 2008). Confidence intervals (95% CI) are percentiles based on 10 000 bootstrap replicates.
Results
Lifespan is longer with fewer sympatric predator species
At the species level, maximum longevity is negatively related to the number of sympatric predator species. This effect was robust even after controlling for phylogeny and potentially confounding variables such as variation in research effort, species range size, and whether the longevity data stem from birds held in captivity or from the wild (Table 1A). Moreover, the effect of the number of sympatric predator species on maximum longevity is not confounded by body mass and clutch size, key life-history variables known to
affect longevity (Table 1B). The same effect is observed even when only the subset of species with lifespan recorded in captivity is considered (Table 1C).
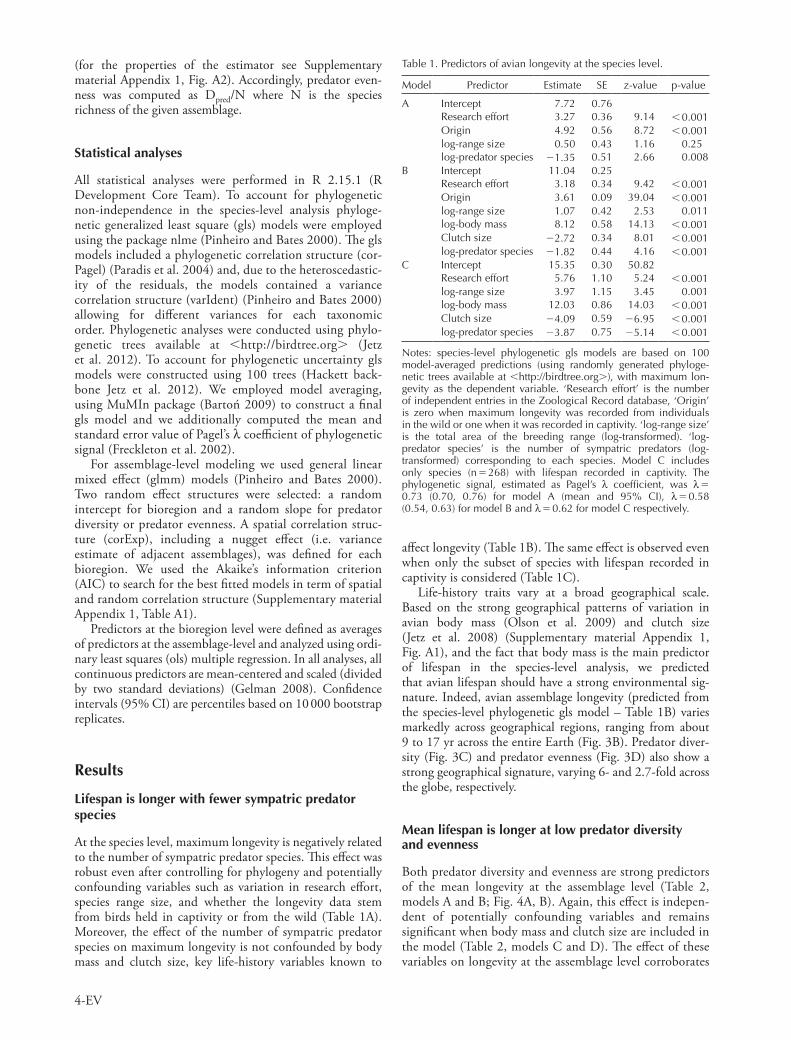
Life-history traits vary at a broad geographical scale. Based on the strong geographical patterns of variation in avian body mass (Olson et al. 2009) and clutch size (Jetz et al. 2008) (Supplementary material Appendix 1, Fig. A1), and the fact that body mass is the main predictor of lifespan in the species-level analysis, we predicted that avian lifespan should have a strong environmental sig-nature. Indeed, avian assemblage longevity (predicted from the species-level phylogenetic gls model – Table 1B) varies markedly across geographical regions, ranging from about 9 to 17 yr across the entire Earth (Fig. 3B). Predator diver-sity (Fig. 3C) and predator evenness (Fig. 3D) also show a strong geographical signature, varying 6- and 2.7-fold across the globe, respectively.
Mean lifespan is longer at low predator diversity and evenness
Both predator diversity and evenness are strong predictors of the mean longevity at the assemblage level (Table 2, models A and B; Fig. 4A, B). Again, this effect is indepen-dent of potentially confounding variables and remains significant when body mass and clutch size are included in the model (Table 2, models C and D). The effect of these variables on longevity at the assemblage level corroborates
5-EV
Figure 3. Biogeographic distribution of avian longevity and predator diversity. For each grid cell, the figure shows (A) longevity, computed as median of maximum species longevities (in years); (B) predicted longevity, computed as median of maximum species longevities predicted from the species-level phylogenetic gls models averaged per species (see Table 1 for details); (C) predator diversity and (D) predator evenness. Predator diversity is a modified Simpson’s diversity index whereby frequencies associated with a species are the number of estimated predators for that species. Predator evenness is predator diversity divided by species richness. Maps are shown in (equal area) Mollweide projection at a resolution of 112.5 112.5 km grid cells. Color scale is defined based on quantile intervals.
6-EV
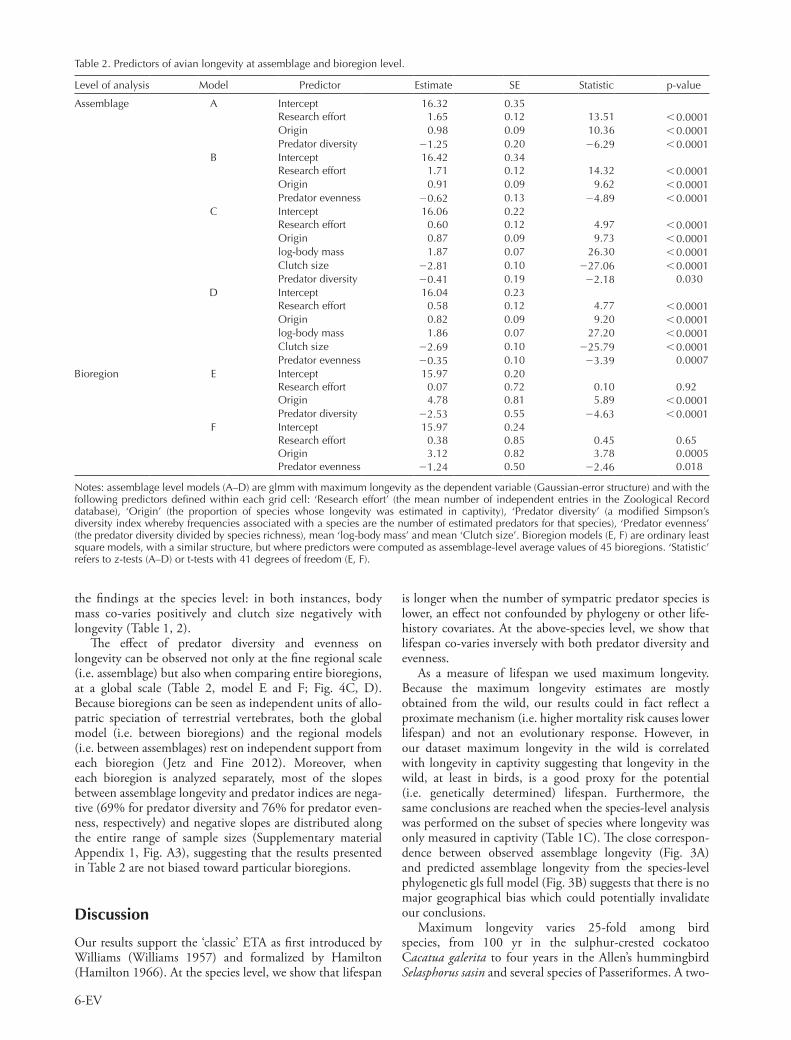
Table 2. Predictors of avian longevity at assemblage and bioregion level.
Level of analysis Model Predictor Estimate SE Statistic p-value
Assemblage A Intercept 16.32 0.35Research effort 1.65 0.12 13.51 0.0001Origin 0.98 0.09 10.36 0.0001Predator diversity 21.25 0.20 26.29 0.0001
B Intercept 16.42 0.34Research effort 1.71 0.12 14.32 0.0001Origin 0.91 0.09 9.62 0.0001Predator evenness 20.62 0.13 24.89 0.0001
C Intercept 16.06 0.22Research effort 0.60 0.12 4.97 0.0001Origin 0.87 0.09 9.73 0.0001log-body mass 1.87 0.07 26.30 0.0001Clutch size 22.81 0.10 227.06 0.0001Predator diversity 20.41 0.19 22.18 0.030
D Intercept 16.04 0.23Research effort 0.58 0.12 4.77 0.0001Origin 0.82 0.09 9.20 0.0001log-body mass 1.86 0.07 27.20 0.0001Clutch size 22.69 0.10 225.79 0.0001Predator evenness 20.35 0.10 23.39 0.0007
Bioregion E Intercept 15.97 0.20Research effort 0.07 0.72 0.10 0.92Origin 4.78 0.81 5.89 0.0001Predator diversity 22.53 0.55 24.63 0.0001
F Intercept 15.97 0.24Research effort 0.38 0.85 0.45 0.65Origin 3.12 0.82 3.78 0.0005Predator evenness 21.24 0.50 22.46 0.018
Notes: assemblage level models (A–D) are glmm with maximum longevity as the dependent variable (Gaussian-error structure) and with the following predictors defined within each grid cell: ‘Research effort’ (the mean number of independent entries in the Zoological Record database), ‘Origin’ (the proportion of species whose longevity was estimated in captivity), ‘Predator diversity’ (a modified Simpson’s diversity index whereby frequencies associated with a species are the number of estimated predators for that species), ‘Predator evenness’ (the predator diversity divided by species richness), mean ‘log-body mass’ and mean ‘Clutch size’. Bioregion models (E, F) are ordinary least square models, with a similar structure, but where predictors were computed as assemblage-level average values of 45 bioregions. ‘Statistic’ refers to z-tests (A–D) or t-tests with 41 degrees of freedom (E, F).
the findings at the species level: in both instances, body mass co-varies positively and clutch size negatively with longevity (Table 1, 2).
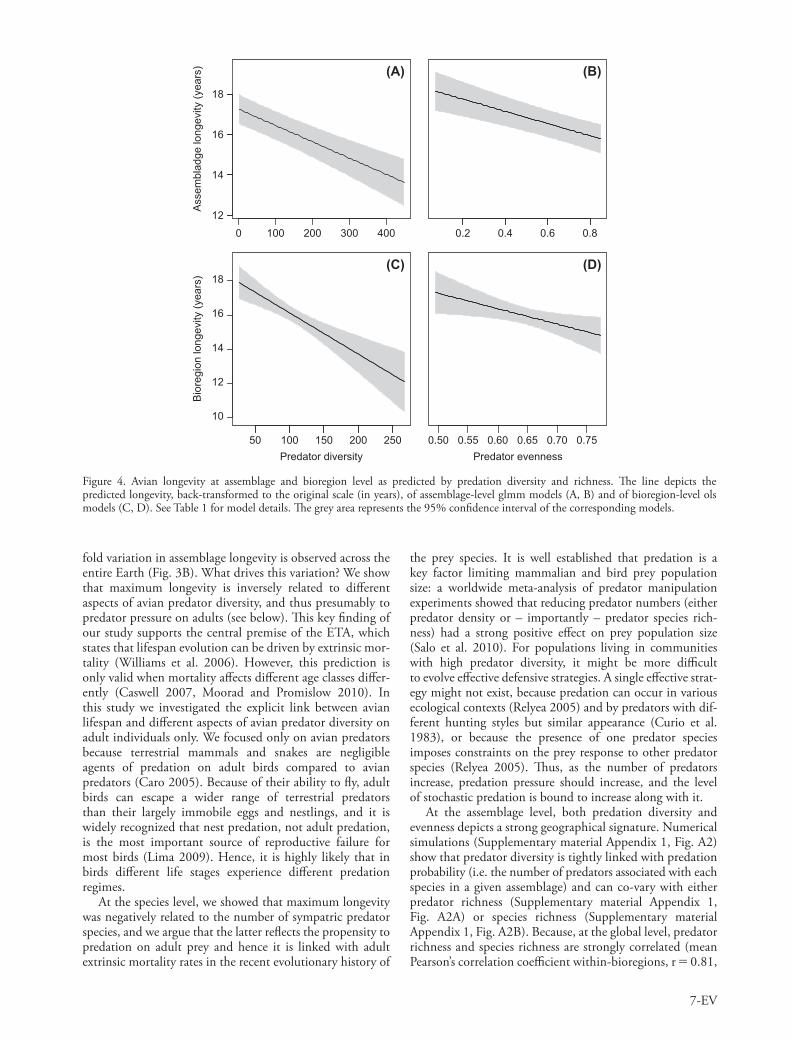
The effect of predator diversity and evenness on longevity can be observed not only at the fine regional scale (i.e. assemblage) but also when comparing entire bioregions, at a global scale (Table 2, model E and F; Fig. 4C, D). Because bioregions can be seen as independent units of allo-patric speciation of terrestrial vertebrates, both the global model (i.e. between bioregions) and the regional models (i.e. between assemblages) rest on independent support from each bioregion (Jetz and Fine 2012). Moreover, when each bioregion is analyzed separately, most of the slopes between assemblage longevity and predator indices are nega-tive (69% for predator diversity and 76% for predator even-ness, respectively) and negative slopes are distributed along the entire range of sample sizes (Supplementary material Appendix 1, Fig. A3), suggesting that the results presented in Table 2 are not biased toward particular bioregions.
Discussion
Our results support the ‘classic’ ETA as first introduced by Williams (Williams 1957) and formalized by Hamilton (Hamilton 1966). At the species level, we show that lifespan
is longer when the number of sympatric predator species is lower, an effect not confounded by phylogeny or other life-history covariates. At the above-species level, we show that lifespan co-varies inversely with both predator diversity and evenness.
As a measure of lifespan we used maximum longevity. Because the maximum longevity estimates are mostly obtained from the wild, our results could in fact reflect a proximate mechanism (i.e. higher mortality risk causes lower lifespan) and not an evolutionary response. However, in our dataset maximum longevity in the wild is correlated with longevity in captivity suggesting that longevity in the wild, at least in birds, is a good proxy for the potential (i.e. genetically determined) lifespan. Furthermore, the same conclusions are reached when the species-level analysis was performed on the subset of species where longevity was only measured in captivity (Table 1C). The close correspon-dence between observed assemblage longevity (Fig. 3A) and predicted assemblage longevity from the species-level phylogenetic gls full model (Fig. 3B) suggests that there is no major geographical bias which could potentially invalidate our conclusions.
Maximum longevity varies 25-fold among bird species, from 100 yr in the sulphur-crested cockatoo Cacatua galerita to four years in the Allen’s hummingbird Selasphorus sasin and several species of Passeriformes. A two-
7-EV
0 100 200 300 40012
14
16
18
0.2 0.4 0.6 0.8
50 100 150 200 250
10
12
14
16
18
0.50 0.55 0.60 0.65 0.70 0.75
(A) (B)
(C) (D)
Asse
mbl
adge
long
evity
(yea
rs)
Bior
egio
n lo
ngev
ity (y
ears
)
Predator diversity Predator evenness
Figure 4. Avian longevity at assemblage and bioregion level as predicted by predation diversity and richness. The line depicts the predicted longevity, back-transformed to the original scale (in years), of assemblage-level glmm models (A, B) and of bioregion-level ols models (C, D). See Table 1 for model details. The grey area represents the 95% confidence interval of the corresponding models.
fold variation in assemblage longevity is observed across the entire Earth (Fig. 3B). What drives this variation? We show that maximum longevity is inversely related to different aspects of avian predator diversity, and thus presumably to predator pressure on adults (see below). This key finding of our study supports the central premise of the ETA, which states that lifespan evolution can be driven by extrinsic mor-tality (Williams et al. 2006). However, this prediction is only valid when mortality affects different age classes differ-ently (Caswell 2007, Moorad and Promislow 2010). In this study we investigated the explicit link between avian lifespan and different aspects of avian predator diversity on adult individuals only. We focused only on avian predators because terrestrial mammals and snakes are negligible agents of predation on adult birds compared to avian predators (Caro 2005). Because of their ability to fly, adult birds can escape a wider range of terrestrial predators than their largely immobile eggs and nestlings, and it is widely recognized that nest predation, not adult predation, is the most important source of reproductive failure for most birds (Lima 2009). Hence, it is highly likely that in birds different life stages experience different predation regimes.
At the species level, we showed that maximum longevity was negatively related to the number of sympatric predator species, and we argue that the latter reflects the propensity to predation on adult prey and hence it is linked with adult extrinsic mortality rates in the recent evolutionary history of
the prey species. It is well established that predation is a key factor limiting mammalian and bird prey population size: a worldwide meta-analysis of predator manipulation experiments showed that reducing predator numbers (either predator density or – importantly – predator species rich-ness) had a strong positive effect on prey population size (Salo et al. 2010). For populations living in communities with high predator diversity, it might be more difficult to evolve effective defensive strategies. A single effective strat-egy might not exist, because predation can occur in various ecological contexts (Relyea 2005) and by predators with dif-ferent hunting styles but similar appearance (Curio et al. 1983), or because the presence of one predator species imposes constraints on the prey response to other predator species (Relyea 2005). Thus, as the number of predators increase, predation pressure should increase, and the level of stochastic predation is bound to increase along with it.
At the assemblage level, both predation diversity and evenness depicts a strong geographical signature. Numerical simulations (Supplementary material Appendix 1, Fig. A2) show that predator diversity is tightly linked with predation probability (i.e. the number of predators associated with each species in a given assemblage) and can co-vary with either predator richness (Supplementary material Appendix 1, Fig. A2A) or species richness (Supplementary material Appendix 1, Fig. A2B). Because, at the global level, predator richness and species richness are strongly correlated (mean Pearson’s correlation coefficient within-bioregions, r 0.81,
8-EV
95% CI 0.79, 0.90), the predator diversity reflects both predator and species richness. A similar strong association between predator and prey richness has been recently documented in mammals independent of climate and pro-ductivity covariates (Sandom et al. 2013) suggesting a more direct connection between longevity and predator diversity. As a case in point, assume that community A has 1 species of hawk and 1 species of pigeon (ratio predator species/ prey species 1, predator diversity 1). In that case, the pigeon will only have one predator species to cope with. In comparison, consider a community B with 5 species of pigeons and 5 species of hawks (ratio predator species/ prey species 1, maximum predator diversity 5). In this case, there will be up to 5 potential predators for each spe-cies of pigeon. Additionally, because bigger hawk species may eat smaller ones – super-predation is common in birds (Lourenço et al. 2011) – the overall predation pressure at community level can be even stronger. Predator evenness however, is an index independent of species richness. Predator evenness increases proportionally with both preda-tion probability and predator richness (Supplementary material Appendix 1, Fig. A2A, C). Hence, predator evenness reflects both uniformity in the relative proportions of predators associated with each species in an assemblage and also the total number of predator species in that assemblage.
At the above-species level, we showed that lifespan indices were negatively related to both predation diversity and evenness suggesting that similar evolutionary drivers are acting across all spatial scales. The analyses at both species and assemblage level are in accordance with the slow–fast life-history continuum hypothesis (Ricklefs and Wikelski 2002), which states that life-history trait variation, due to constraints imposed by physiological mechanisms, has to be restricted along a limited set of axes (Bielby et al. 2007). In line with the theory, our analyses show that increased lifespan is associated with increased body mass and decreased fecundity. However, our analyses also suggest that natural selection can promote adaptations away from the main slow–fast continuum such that decreased preda-tion pressure can lead to longer lifespans independent of body mass and reproductive effort. Conversely, if predation is largely non-random, such that only adult individuals in prime condition can escape it, theory predicts that longer lifespan should evolve under increased predation regimes (Abrams 1993, Williams and Day 2003). This scenario has been supported by an experimental evolution study (Chen and Maklakov 2012) and may be more common in nature, but – if generally applicable – would lead to the opposite relationship to the one reported here. An alterna-tive scenario is that the relationship between predation and lifespan depends on the scale of the analysis: at species and population level lifespan evolution may be driven by different processes (condition-dependent survival, stochas-tic predation, or a combination of the two), while a between-species comparison could still reveal the observed pattern of a negative covariance between lifespan and predation pres-sure. Indeed, predation is bound to impose both random and condition-dependent mortality, and empirical work showed that both can affect lifespan (Chen and Maklakov 2012). Our results suggest that stochastic predation is an
important driver of the evolution of lifespan in birds. However, our study does not allow excluding other explana-tions for the observed variation in longevity patterns.
In sum, we found a negative relationship between esti-mates of predation pressure and avian lifespan, independent of other life-history traits. This relationship was robust when analyzed at the above species (assemblage and bio- region) level. Our study thus confirms the key prediction of the ETA across broad bio-geographical ranges, suggesting the general validity of this theory to explain variation in lifespan, at least in birds.
Acknowledgements – We thank the many ornithologists and scien-tists who have published their data or contributed data to public databases, allowing us to conduct this study, A. Kuffer for providing data collected by the Australian Bird and Bat Banding Scheme and Cristina Valcu for literature search. We also thank M. Mönkkönen which comments helped improving the manuscript. We used Zoological Record data with permission from Web of Knowledge – Thomson Reuters. This work was supported by the Max Planck Society. MV, BK and JD designed the study; MV, JD and MG collected the data; MV developed the methods and conducted the analyses with input from SN; MV and BK wrote the paper with input from the other authors. The data are deposited at (http://behavioural-ecology.orn.mpg.de/repository/data/001/).
References
Abrams, P. A. 1993. Does increased mortality favor the evolution of more rapid senescence? – Evolution 47: 877–887.
Austad, S. N. 1993. Retarded senescence in an insular population of Virginia opossums (Didelphis virginiana). – J. Zool. 229: 695–708.
Bartoń, K. 2009. MuMIn: multi-model inference. – R package ver. 0.12. p r18.
Bielby, J. et al. 2007. The fast-slow continuum in mammalian life history: an empirical reevaluation. – Am. Nat. 169: 748–757.
Blanco, M. A. and Sherman, P. W. 2005. Maximum longevities of chemically protected and non-protected fishes, reptiles, and amphibians support evolutionary hypotheses of aging. – Mech. Ageing Dev. 126: 794–803.
Brown, J. H. and Sibly, R. M. 2006. Life-history evolution under a production constraint. – Proc. Natl Acad. Sci. USA 103: 17595–17599.
Carey, J. R. 2003. Longevity: the biology and demography of life span. – Princeton Univ. Press.
Caro, T. 2005. Antipredator defenses in birds and mammals. – Univ. of Chicago Press.
Caswell, H. 2007. Extrinsic mortality and the evolution of senescence. – Trends Ecol. Evol. 22: 173–174.
Chen, H.-Y. and Maklakov, A. 2012. Longer life span evolves under high rates of condition-dependent mortality. – Curr. Biol. 22: 2140–2143.
Cohen, J. E. et al. 1993. Body sizes of animal predators and animal prey in food webs. – J. Anim. Ecol. 62: 67–78.
Collar, N. J. et al. 2001. Threatened birds of Asia: the BirdLife International red data book. – Birdlife international Cam-bridge, UK.
Curio, E. et al. 1983. An anti-predator response in the great tit (Parus major): is it tuned to predator risk? – Oecologia 60: 83–88.
de Magalhães, J. P. et al. 2007. An analysis of the relationship between metabolism, developmental schedules, and longevity using phylogenetic independent contrasts. – J. Gerontol. Ser. A 62: 149–160.
9-EV
Miller, R. A. et al. 2002. Longer life spans and delayed maturation in wild-derived mice. – Exp. Biol. Med. 227: 500–508.
Moorad, J. A. and Promislow, D. E. 2010. Evolution: aging up a tree? – Curr. Biol. 20: R406–R408.
Morris, F. T. 1976. Birds of prey of Australia: a field guide. – Landsdowne.
Olson, D. M. et al. 2001. Terrestrial ecoregions of the world: a new map of life on earth. – BioScience 51: 933–938.
Olson, V. A. et al. 2009. Global biogeography and ecology of body size in birds. – Ecol. Lett. 12: 249–259.
Paradis, E. et al. 2004. APE: analyses of phylogenetics and evolution in R language. – Bioinformatics 20: 289–290.
Pinheiro, J. C. and Bates, D. M. 2000. Mixed-effects models in S and S-PLUS. – Springer.
Relyea, R. A. 2005. Constraints on inducible defenses phylogeny, ontogeny, and phenotypic trade-offs. – In: Barbosa, P. and Castellanos, I. (eds), Ecology of predator–prey interactions. Oxford Univ. Press, pp. 189–207.
Reznick, D. N. et al. 2004. Effect of extrinsic mortality on the evolution of senescence in guppies. – Nature 431: 1095–1099.
Ricklefs, R. E. 2010a. Insights from comparative analyses of aging in birds and mammals. – Aging Cell 9: 273–284.
Ricklefs, R. E. 2010b. Life-history connections to rates of aging in terrestrial vertebrates. – Proc. Natl Acad. Sci. USA 107: 10314–10319.
Ricklefs, R. E. and Wikelski, M. 2002. The physiology/life-history nexus. – Trends Ecol. Evol. 17: 462–468.
Salo, P. et al. 2010. Predator manipulation experiments: impacts on populations of terrestrial vertebrate prey. – Ecol. Monogr. 80: 531–546.
Sandom, C. et al. 2013. Mammal predator and prey species richness are strongly linked at macroscales. – Ecology 94: 1112–1122.
Sergio, F. and Hiraldo, F. 2008. Intraguild predation in raptor assemblages: a review. – Ibis 150: 132–145.
Shattuck, M. R. and Williams, S. A. 2010. Arboreality has allowed for the evolution of increased longevity in mammals. – Proc. Natl Acad. Sci. USA 107: 4635–4639.
Sih, A. et al. 1998. Emergent impacts of multiple predators on prey. – Trends Ecol. Evol. 13: 350–355.
Stearns, S. et al. 2000. Experimental evolution of aging, growth, and reproduction in fruitflies. – Proc. Natl Acad. Sci. USA 97: 3309–3313.
Turbill, C. et al. 2011. Hibernation is associated with increased survival and the evolution of slow life histories among mammals. – Proc. R. Soc. B 278: 3355–3363.
Valcu, M. et al. 2012. rangeMapper: a platform for the study of macroecology of life-history traits. – Global Ecol. Biogeogr. 21: 945–951.
Wasser, D. and Sherman, P. 2010. Avian longevities and their interpretation under evolutionary theories of senescence. – J. Zool. 280: 103–155.
Williams, G. C. 1957. Pleiotropy, natural-selection, and the evolution of senescence. – Evolution 11: 398–411.
Williams, P. D. and Day, T. 2003. Antagonistic pleiotropy, mortality source interactions, and the evolutionary theory of senescence. – Evolution 57: 1478–1488.
Williams, P. D. et al. 2006. The shaping of senescence in the wild. – Trends Ecol. Evol. 21: 458–463.
de Magalhaes, J. P. et al. 2009. The Human Ageing Genomic Resources: online databases and tools for biogerontologists. – Aging Cell 8: 65–72.
del Ferguson-Lees, J. 2001. Raptors of the world. – Houghton Mifflin Harcourt.
del Hoyo, J. et al. 1992–2010. Handbook of the birds of the World. Vol. 1–16. – Lynx Edicions.
Dunning, J. B. 2008. CRC handbook of avian body masses. – CRC Press.
Fransson, T. et al. 2010. EURING list of longevity records for European birds – www.euring.org/data_and_codes/ longevity.htm.
Freckleton, R. et al. 2002. Phylogenetic analysis and comparative data: a test and review of evidence. – Am. Nat. 160: 712–726.
Gelman, A. 2008. Scaling regression inputs by dividing by two standard deviations. – Stat. Med. 27: 2865–2873.
Gravel, D. et al. 2013. Inferring food web structure from predator–prey body size relationships. – Methods Ecol. Evol. doi: 10.1111/2041-210X.12103
Hamilton, W. D. 1966. The moulding of senescence by natural selection. – J. Theor. Biol. 12: 12–45.
Harris, T. and Franklin, K. 2000. Shrikes & bush-shrikes: including wood-shrikes, helmet-shrikes, flycatcher-shrikes, philentomas, batises and wattle-eyes. – Christopher Helm.
Holt, B. G. et al. 2013. An update of Wallace’s zoogeographic regions of the World. – Science 339: 74–78.
Jeschke, J. M. and Kokko, H. 2009. The roles of body size and phylogeny in fast and slow life histories. – Evol. Ecol. 23: 867–878.
Jetz, W. and Fine, P. V. A. 2012. Global gradients in vertebrate diversity predicted by historical area-productivity dynamics and contemporary environment. – PLoS Biol. 10: e1001292.
Jetz, W. et al. 2008. The worldwide variation in avian clutch size across species and space. – PLoS Biol. 6: 2650–2657.
Jetz, W. et al. 2012. The global diversity of birds in space and time. – Nature 491: 444–448.
Kamilar, J. M. et al. 2010. Is group size related to longevity in mammals? – Biol. Lett. 6: 736–739.
Keller, L. and Genoud, M. 1997. Extraordinary lifespans in ants: a test of evolutionary theories of ageing. – Nature 389: 958–960.
Kuffer, A. 2012. Australian Bird and Bat Banding Scheme. The – <www.environment.gov.au/topics/science-and-research/bird-and-bat-banding/banding-data/search-abbbs-database>.
Lima, S. L. 2009. Predators and the breeding bird: behavioral and reproductive flexibility under the risk of predation. – Biol. Rev. 84: 485–513.
Lourenço, R. et al. 2011. Superpredation patterns in four large European raptors. – Popul. Ecol. 53: 175–185.
Maclean, G. L. and Robert, A. 1985. Roberts’ birds of southern Africa. – Trustees of the John Voelcker Bird Book Fund, Cape Town.
Mair, W. et al. 2004. Lifespan extension by dietary restriction in female Drosophila melanogaster is not caused by a reduction in vitello-genesis or ovarian activity. – Exp. Gerontol. 39: 1011–1019.
Mikkelson, G. M. et al. 2011. Multiple links between species diversity and temporal stability in bird communities across North America. – Evol. Ecol. Res. 13: 361–372.
Supplementary material (Appendix ECOG-00929 at ecography.org/readers/appendix ). Appendix 1.