The Influence of Superintendent Longevity and Continuity on ...
192
Seton Hall University Seton Hall University eRepository @ Seton Hall eRepository @ Seton Hall Seton Hall University Dissertations and Theses (ETDs) Seton Hall University Dissertations and Theses Spring 2-27-2020 The Influence of Superintendent Longevity and Continuity on The Influence of Superintendent Longevity and Continuity on Student Achievement and Faculty Mobility Student Achievement and Faculty Mobility Craig M. Hutcheson [email protected] Follow this and additional works at: https://scholarship.shu.edu/dissertations Part of the Educational Administration and Supervision Commons, and the Educational Leadership Commons Recommended Citation Recommended Citation Hutcheson, Craig M., "The Influence of Superintendent Longevity and Continuity on Student Achievement and Faculty Mobility" (2020). Seton Hall University Dissertations and Theses (ETDs). 2735. https://scholarship.shu.edu/dissertations/2735
-
Upload
khangminh22 -
Category
Documents
-
view
3 -
download
0
Transcript of The Influence of Superintendent Longevity and Continuity on ...

Seton Hall University Seton Hall University
eRepository @ Seton Hall eRepository @ Seton Hall
Seton Hall University Dissertations and Theses (ETDs) Seton Hall University Dissertations and Theses
Spring 2-27-2020
The Influence of Superintendent Longevity and Continuity on The Influence of Superintendent Longevity and Continuity on
Student Achievement and Faculty Mobility Student Achievement and Faculty Mobility
Craig M. Hutcheson [email protected]
Follow this and additional works at: https://scholarship.shu.edu/dissertations
Part of the Educational Administration and Supervision Commons, and the Educational Leadership
Commons
Recommended Citation Recommended Citation Hutcheson, Craig M., "The Influence of Superintendent Longevity and Continuity on Student Achievement and Faculty Mobility" (2020). Seton Hall University Dissertations and Theses (ETDs). 2735. https://scholarship.shu.edu/dissertations/2735
The Influence of Superintendent Longevity and Continuity
on Student Achievement and Faculty Mobility
Craig M. Hutcheson
Seton Hall University
Dissertation Committee
Michael Kuchar, Ph.D.
Christopher Tienken Ed.D.
G. Kennedy Greene, Ed.D.
Gerald Babo, Ed.D.
Submitted in Partial Fulfillment of the Requirements for the Degree
Doctor of Education
Department of Education Leadership, Management, and Policy Seton Hall University
2020

ii
© 2020 Craig M. Hutcheson

iii

iv
Acknowledgments
The completion of the dissertation process would not be possible without the guidance,
motivation, and academic assistance from many people who have contributed to this body of
work.
First and foremost, I want to thank my mentor, Dr. Michael Kuchar, who was the
consummate educator, motivating me to stop procrastinating and dedicate myself to the process
of completing this dissertation. Dr. Kuchar, without your constant “kick in the pants”
motivational talks, down-to-earth attitude and true dedication to me through this process, I would
not be writing a dissertation acknowledgement at all. You have been a great role model and a
better friend and I cannot ever express to you how much I appreciate you guiding me through
this process. You’re the best!
To my second reader, Dr. Tienken, you have been an incredible addition to my
committee. I have greatly respected your work since the first curriculum class I had with you
many years ago. When things were looking bleak last spring, you stepped up and became a huge
part of my dissertation process. Thank you for being my statistical guru, a constant positive
motivator, and a true role model.
Dr. Greene, you have been a wonderful colleague and a true friend over the last ten years.
I was honored when you said you would be on my committee. I have always respected your
dedication to your craft and as one of the most intelligent people I know, how could I not want
your input and guidance as I traversed this process.
In memoriam ... to Dr. Babo for your tough words and clear feedback through the review
process. As my initial second reader, I was not sure how to take all the numerous corrective
comments, but for the first time in many years, I had to reflectively look upon my work and
v
rededicate myself to the art of writing. Thank you.
I also acknowledge and thank Maureen Hoatsma who has absolutely been a rock in the
ELMP Department. Whenever I needed help, I could always count on you to come and save me!
Thank you to the Kittatinny Regional S.D. Board of Education for allowing me to
undertake this long-term intensive process and for supporting my efforts to continue my
education. To my colleagues at Kittatinny and Hampton Township S.D. whom I can always
count on to be dedicated professionals!
Thank you to Jami (aka—the redpengirl) for your editing and review process to make my
final dissertation product truly final. It looks great!
vi
Dedication
This dissertation is dedicated to my wife, my mother, and father. I cannot imagine more
loving and caring people to help me through this difficult and time-consuming process. I would
have never achieved this amazing goal without your nonstop motivation.
Lisa, you have been a godsend to my life and I cannot imagine going through each day
without your never-ending love and complete understanding of what it means not only to be a
public school superintendent, but also to dedicate my off time to this project. Having your
complete support allowed me to take time from “us” to dedicate to writing and researching and I
thank and love you for this. I cannot wait to provide you with the same support, motivation, and
love as you complete your dissertation research. Let’s go, future Dr.!
Thank you, Mom and Dad. You both worked so hard to make sure we always had the
opportunity to better ourselves educationally, even though you were not afforded those same
educational chances. It is sometimes hard to understand how life works, but you have always
valued education and supported (required) my sister and me to learn, experience, and grow.
When I promised you that I would complete this process six years ago, I thought it would be
easy, but obviously it has not been a smooth road to travel. My only regret is not being a Dr.
while Dad was here, but I know he is proud as he looks down on me now. Dad, I did it! Mom,
you are the most dedicated, hardworking, and kindest person I have ever seen. It is no mystery
where I get my “workaholic” tendencies, but you have shown me what it takes to do more each
day and without your communication every few days about “where are you with your paper,”
this would have not been possible. Thank you so much and I love you!
To my little sister, Lisa, you’ve shown me what it means to be dedicated to others outside
your own little bubble. Your ability to juggle your work and other daily tasks, be an amazing

vii
mom to Tre’ and Talaney, and dedicate your life to fostering children like Jakisha, Demetrius,
Thaddius, and many more is truly inspiring. I’m so glad to be your brother, but not your child—
you are too tough.
Thank you to all my supportive friends who always pushed me to finish this process. I
could not be more grateful to have a lifelong circle of friends who are all very accomplished in
their own lives and who value education. Thank you everyone!

viii
Abstract
In New Jersey public schools, one constant measure of academic success is defined by the
outcomes on the Partnership for Assessment of Readiness for College and Careers (PARCC).
The purpose of this research was to examine the impact of the relationship between the school
district superintendent and resulting PARCC scores, while also examining the strength of the
relationship between the superintendent and the teacher mobility rate of each school district.
The conceptual framework for this study was based on theories and research by the Mid-
Continent Research for Education and Learning’s (McREL) School District Leadership That
Works; The Effects of Superintendent Leadership on Student Achievement, a working paper by
Waters and Marzano (2006), and Fullan’s (2006) Change Theory: A Force For School
Improvement. This research study utilized publicly available data from multiple sources
including the New Jersey Department of Education.
This study examined the strength of eight independent variables, two focus variables of
superintendent experience in the school district and overall experience, and six control variables:
teachers with advanced degrees, teacher attendance rate, students with free and reduced lunch,
student chronic absenteeism, English language learners, and special education percentage in
districts. The dependent variables in this research were 2017 PARCC scores for Grade 5 math
and English Language Arts/Literacy, Algebra 1, Grade 10 English Language Arts/Literacy, and
faculty mobility rate. Ten models were analyzed using SPSS V. 26 providing numerous
statistical outputs including a correlational bivariate analysis and a simultaneous multiple
regression analysis.
The results from this statistical analysis indicate four significant independent variables
impacted the student academic outcomes of 2017 PARCC scores. The most significant variables
impacting PARCC scores were teachers with advanced degrees, students receiving free and

ix
reduced lunch, and teacher attendance rate. In eight of the ten models, the percentage of teachers
with advanced degrees was the most significant variable, accounting for the most variance of
2017 PARCC scores, with students on free and reduced lunch being the next most significant
predictor and teacher attendance rate being third. Superintendent years in district was significant
in one model indicating that there was a statistically significant relationship between
superintendent longevity and 2017 PARCC Algebra 1 scores. Remaining models indicated no
statistically significant relationship between independent and dependent variables in this study.
Outcomes and insights of this research can assist local policy makers, legislators, and
boards of education to recognize the importance of school district leaders and shape their beliefs
that stability in educational leaders is important to create stable educational environments. This
research identified three aspects of the school community that have significant influences on
student academic outcomes and the results of this research can assist federal, state, and local
school leaders develop new policies and practices to improve student academic environments.
The significance of socioeconomics and characteristics of teachers continues to be an area of
focus for improving the academic outcomes of the students served by the public school systems
and can shape hiring practices, professional development opportunities, and contractual
negotiations.
keywords: education, superintendent longevity, PARCC, achievement, teacher mobility,
teacher characteristics, student achievement, multiple regression, socioeconomic

x
Table of Contents
Acknowledgments……………………………………………………………………………….iv Dedication………………………………………………………………………………..………vi Abstract………………………………………………………………………………..……….viii List of Tables………………………………………………………………………………..…..xii Chapter I: Introduction………………………………………………………………………….1
Conceptual Framework……………………………………………………………………4 Statement of the Problem………………………………………………………………….6 Purpose of the Study………………………………………………………………………8 Research Questions………………………………………………………………………12 Null Hypothesis………………………………………………………………………….13 Study Design and Methods..……………………………………………………………..13 Significance of the Study…………..…………………………………………………….15 Variables…………………………………………………………………………………18 Limitations and Delimitations of the Study……………………………………………...18 Definitions of Terms………...…………………………………………………………...20 Organization of the Dissertation…………………………………………………………21
Chapter II: Review of the Literature………………………………………………………….23 Inclusion and Exclusion Criteria for the Literature Review……………………………..25 Purpose of the Review…………………………………………………………………...25 Literature Review Procedures…………………………………………………………....28 Public Schools: A Historical Perspective………………………………………………..29 School District Accountability.…………………………………………………………..31 No Child Left Behind Act ……………………………………………………….31
Common Core State Standards…………………………………………………..35 Testing Developments and Implementation–PARCC…………………………...36
Teacher Mobility…………………………………………………………………………44 School District Superintendent: A Historical Perspective……………………………….46 Superintendent Salary Caps……………………………………………………………...47 Roles of the Superintendent and Impacts on Longevity…………………………………50 Superintendent Longevity Related to Student Achievement…………….………………52 Institutional Change……………………………………………………………………...54 District Factor Groups……………………………………………………………………56 School District Report Cards/School Performance Report………………………………58 Summary…………………………………………………………………………………59
Chapter III: Methodology……………………………………………………………………...62 Research Questions………………………………………………………………………63 Research Design and Methods…………………………………………………………...64 Sample……………………………………………………………………………………67 Instrumentation…………………………………………………………………………..68

xi
Reliability…….………………………………………………………………………….69 Validity………………………………………..…………………………………………71 Variables…………………………………………………………………………………72 Analysis of Data………………………………………………………………………….74 Summary…………………………………………………………………………………78
Chapter IV: Analysis of the Data……………………………………………………………....81 Purpose of the Study……………………………………………………………………...81 Organization of the Chapter……………………………………………………………...82 Research Questions………………………………………………………………………83 Independent and Dependent Variables…………………………………………………..84 Descriptive Statistics……………………………………………………………………..87 Analysis and Results…………………………………………………………….……….94 Summary of Results…………………………………………………………………….139
Chapter V: Conclusions and Recommendations………………………………………….....141 Purpose of the Research……………………………………………………………...…142 Organization of the Chapter………………………………………………………….…143 Research Questions, Null Hypotheses, and Answers…………………………………..144 Conclusions and Discussions………………………………………………………...…151 Recommendations for Policy and Practice……………………………………………..154 Recommendations for Future Research……………………………………………...…161 Summary………………………………………………………………………...……...164
References…………………………………………………………………………………...…167

xii
List of Tables
Table 1. Gender (Q44) and longevity in present position (Q8) …………………………………17 Table 2. Gender (Q44) and longevity as a superintendent (Q9) ………………………………..17
Table 3. Independent/Dependent/Control Variables Used in this Study………………………...86 Table 4. Descriptive Statistics……………………………………………………………………87
Table 5. Descriptive Exploratory Analysis………………………………………………………90 Table 6. Superintendent Years in District–Grade 5 PARCC Math Variables Entered/Removed……………………………………………………….95 Table 7. Model Summary………………………………………………………………………...96
Table 8. ANOVAa………………………………………………………………………………...96 Table 9. Coefficientsa…………………………………………………………………………….98
Table 10. Collinearity Diagnosticsa……………………………………………………………...98 Table 11. Total Years as a Superintendent–Grade 5 PARCC Math Variables Entered/Removed……………………………………………………….99 Table 12. Model Summary……………………………………………………………………...100
Table 13. ANOVAa……………………………………………………………………………...100 Table 14. Coefficientsa………………………………………………………………………….102
Table 15. Collinearity Diagnosticsa…………………………………………………………….102 Table 16. Superintendent Years in District–Grade 5 ELA/L Variables Entered/Removeda…………………………………………………………...104 Table 17. Model Summary……………………………………………………………………...105
Table 18. ANOVAa……………………………………………………………………………...105 Table 19. Coefficientsa………………………………………………………………………….107
Table 20. Collinearity Diagnosticsa……………………………………………………………108 Table 21. Total Years as a Superintendent Years–2017 PARCC Grade 5 ELA/L Variables Entered/Removeda……………………………………………………108 Table 22. Model Summary……………………………………………………………………...109
Table 23. ANOVAa……………………………………………………………………………...109 Table 24. Coefficienctsa………………………………………………………………………...111
Table 25. Collinearity Diagnosticsa…………………………………………………………….112 Table 26. Superintendent Years in District–2017 PARCC Algebra 1 Variables Entered/Removeda…………………………………………………………...114 Table 27. Model Summary……………………………………………………………………...115
Table 28. ANOVAa……………………………………………………………………………...115

xiii
Table 29. Coefficientsa………………………………………………………………………….117 Table 30. Collinearity Diagnostics……………………………………………………………..118 Table 31. Total Number of Years as a Superintendent–2017 PARCC Algebra 1 Scores Variables Entered/Removeda…………………………………………………………...118
Table 32. Model Summary……………………………………………………………………...119 Table 33. ANOVAa……………………………………………………………………………...119
Table 34. Coefficientsa………………………………………………………………………….121 Table 35. Collinearity Diagnosticsa…………………………………………………………….122 Table 36. Superintendent Years in District–2017 PARCC Grade 10 ELA/L Variables Entered/Removeda…………………………………………………………...124
Table 37. Model Summary……………………………………………………………………...125 Table 38. ANOVAa……………………………………………………………………………...125
Table 39. Coefficientsa………………………………………………………………………….127 Table 40. Collinearity Diagnosticsa…………………………………………………………….127 Table 41. Total Number of Years as a Superintendent–2017 PARCC Grade 10 ELA/L Scores Variables Entered/Removeda……………………………………………128
Table 42. Model Summary……………………………………………………………………...129 Table 43. ANOVAa……………………………………………………………………………...129
Table 44. Coefficientsa………………………………………………………………………….131 Table 45. Collinearity Diagnosticsa…………………………………………………………….131
Table 46. Variables Entered/Removeda………………………………………………………...133 Table 47. Model Summary……………………………………………………………………...134
Table 48. ANOVAa……………………………………………………………………………...134 Table 49. Coefficientsa………………………………………………………………………….135
Table 50. Collinearity Diagnosticsa…………………………………………………………….135 Table 51. Variables Entered/Removeda………………………………………………………...136
Table 52. Model Summary……………………………………………………………………...137 Table 53. ANOVAa……………………………………………………………………………...137
Table 54. Coefficientsa………………………………………………………………………….138 Table 55. Collinearity Diagnosticsa……………………………………………………………138

1
Chapter I
Introduction
The position of superintendent has long been associated with school district leadership
and connected to the quality of the educational program within a particular school district.
Research conducted at the Mid-Continent Research for Education and Learning (McREL) by
Waters and Marzano in 2006 indicated that a statistically significant positive relationship exists
between district leadership and student achievement. It is important to continue to examine the
association of superintendent continuity and student academic success at the district level.
Since the inception of the No Child Left Behind Act in 2001 and the multiple public
school reform efforts over the past 10–15 years, school districts have been thrust into the
spotlight with the assessment and evaluation of the educational programs offered. The call for
accountability across the nation and in the state of New Jersey focuses on many variables, but
always includes the examination of student success on state administered assessments, such as
the New Jersey Assessment for Skills and Knowledge (NJ ASK, 2004–2014), the upper grade
High School Proficiency Assessment (HSPA, 2001–2014), the Partnership for Assessment of
Readiness for College and Careers (PARCC, 2015–present) [New Jersey Department of
Education Website, “Historical Context: Overview of New Jersey’s Statewide Testing Program,”
2017], and the New Jersey Student Learning Assessments. All were developed to annually assess
specific grades of students and their comprehension levels of the Department of Education
approved curriculum standards for students in New Jersey public schools. According to the No
Child Left Behind legislation (2001), by 2014, every student was expected to be proficient on the
approved exams and each school and district was to have 100% proficiency for all students
taking the state assessment. School districts that did not meet this 100% student proficiency

2
requirement by 2014 were identified as in need of improvement or failing districts. The districts
were required to implement a number of mandatory reformation policies and procedures in order
to receive federal educational funding. This included the adoption of a new model curricula for
mathematics and Language Arts, more recently referred to as the Common Core State Standards.
These reforms were in addition to new efforts to assess teacher effectiveness in the classrooms
by utilizing a number of different assessment methods including a new testing consortium that
measured the readiness of students for college and careers. According to the Pearson
Corporation, the Partnership for Assessment of Readiness for College and Careers (PARCC) was
a combined effort of several states working together to develop a set of assessments that measure
whether students are on track to be successful in college and careers (Pearson, 2015). This
assessment was the student academic assessment tool for math and English Language
Arts/Literacy (ELA/L) in New Jersey from 2015 to 2018. In 2019, the New Jersey Department
of Education switched to a PARCC-like assessment built from former PARCC questions, titled
the New Jersey Student Learning Assessment (NJSLA).
In addition to the relationship between superintendent longevity and student achievement,
this research included an examination of the relationship between faculty mobility rate of each
school district and the length of tenure of the district superintendent. The faculty mobility rate
allowed for an examination of district stability of certificated staff members, the stability of
program implementation, and satisfaction levels of the certificated staff serving the sample
districts. The PARCC scores, along with other factors including the faculty mobility rates of
districts, were examined to measure and assess the success of a school district, the effectiveness
of district leadership, and specifically the efficacy of the superintendent as the district chief
educational officer. For these reasons, this research focused on the 2017 PARCC Grade 5 math

3
& ELA/L, the Algebra 1 and ELA/L 10 assessment scores and the district faculty mobility rate
for each kindergarten through Grade 12 school district selected for this study to determine
success of academic achievement of students as influenced by the continuity of school district
leadership.
The focal areas of this research was to determine if superintendent longevity and
continuity had an association with overall district level student achievement and faculty stability,
indicating district success. The five research questions focused on the outcome variables of the
2017 PARCC Grade 5 math and ELA/L, PARCC Algebra 1 and PARCC ELA/L 10 test scores at
the district level, along with the district level faculty mobility rate for the sample districts
selected. Through a meta-analysis of 27 different studies since 1970, Waters and Marzano
(2006) identified a number of positive relationships between the superintendent and effective
school districts. One aspect, not originally intended to be studied by Waters and Marzano, was
the effect of superintendent tenure on student academic achievement. “Two studies that we
examined reported correlations between superintendent tenure and student academic
achievement” (Waters & Marzano, 2006). This research study expanded upon this ancillary
finding from Waters and Marzano and applied it to kindergarten through twelfth grade districts
with a focus on Grade five through Grade ten 2017 PARCC scores and faculty mobility rates of
public school districts across New Jersey.
According to Waters and Marzano (2006), “Of the 27 reports examined in the meta-
analysis, 14 (excluding statistical outliers) contained information about the relationship between
overall district-level leadership and average student academic achievement in the district. These
14 reports included data from 1,210 districts. The computed correlation between district
leadership and student achievement was .24 (95 percent confidence interval: .19 to .30). The fact

4
that the 95 percent confidence interval does not include 0 indicates this correlation is significant
at the .05 level.” In line with Waters and Marzano’s meta-analysis, the position of
superintendent should continue to be viewed as an educational leader who has a direct impact on
student academic success.
Conceptual Framework
In addition to his previous works, Fullan’s Change Theory, A Force for School
Improvement (2006) was utilized to guide this study to examine the theoretically based process
for effective school improvement and the impact of the superintendent on effectuating change
and improvement within a school district. Fullan’s research on effective school improvement in
the early 2000s has led to a number of conceptual philosophies on the implementation of change
beyond superficially implemented programs that will not result in long-term school
improvements. Fullan identified flawed theories of change along with outlining his effective
change strategies. Fullan (2006) stated that:
There are seven core premises that underpin our use of change knowledge. (True to the
theory of action itself, it should be noted that the seven premises have been ‘discovered’ via
reflective action, especially over the past decade). The seven premises are:
1. A focus on motivation
2. Capacity building, with a focus on results
3. Learning in context
4. Changing context
5. A bias for reflective action
6. Tri-level engagement
7. Persistence and flexibility in staying the course

5
Fullan’s work expanded upon each premise and outlined important practices within each
change premise. In addition to the change theories by Fullan, the research focused on premise 7,
persistence and flexibility in staying the course. The research by Waters and Marzano in the
meta-analysis, School District Leadership That Works: The Effect of Superintendent Leadership
on Student Achievement, a working paper (2006) served as the main base theory for this study
and continued to be the main research-based theoretical concept guiding this research. One key
finding of this meta-analysis is outlined below:
“In addition, the positive correlations that appear between the length of superintendent
service and student achievement confirms the value of leadership stability.
Superintendents should note the importance of remaining in a district long enough to see
the positive impact of their leadership on student learning and achievement.”
Understanding the results of Fullan’s change theory on educational organizational
improvement, the shorter average length of tenure for New Jersey superintendents—five years or
less (Kolu, 2014)—may impact the effectiveness of the superintendent. They cannot experience
the full outcomes of Fullan’s seven premises, thus leading to ineffective school district
educational programs.
A dearth of research examines the relationship between superintendent longevity, student
academic performance, and faculty mobility at the district level. As identified previously,
Waters and Marzano (2006) conducted a wide-ranging research review of the effects of school
district leadership, and one ancillary finding of this research review was in the relationship
between district superintendent leadership and its influence on student academic performance.
This study has greatly contributed to the development of the conceptual framework of this
research. Although it did not directly study New Jersey public school districts or the specific

6
outcome variables of this research, this study was used as a key research basis for the
examination of the association between superintendent longevity on the success of public school
districts. More recent research efforts, although limited in nature, confirm the McREL study and
include additional characteristics of successful school districts by studying the relationship
between superintendent longevity and student outcomes. This research includes studies looking
at the state of the American school superintendent by Glass and Franceschini (2007), studies on
superintendent longevity by Alborano (2002), Gianquinto (2011), and Plotts (2011), and a
limited number of other studies focusing on longevity and school district success. Utilizing
research by Marzano and Waters and other related studies, the outcomes and findings associated
with superintendent longevity, student academic success, and faculty mobility rate at the district
level were examined.
Statement of the Problem
The problem examined in this research was the association of superintendent longevity in
a public school district on district effectiveness in the areas of academic performance of students
on state assessments in New Jersey and the local district faculty mobility rates. Across our
nation, superintendent longevity has decreased significantly over the past 65 years and shorter
superintendent tenure lengths could have a long-term negative impact on district success
(Cooper, Fusarelli, & Carelle 2000; Winters, 2000; Alborano, 2002; Waters, 2005; Waters &
Marzano 2006; Glass & Franceschini, 2007; Plotts 2011; Gianquinto, 2011, Petty 2018). Adding
to the decreases in superintendent longevity across our country, in February of 2011, New Jersey
implemented “superintendent salary caps” that have been referenced by many news outlets and
professional organizations as having a negative effect on the continuing service of many
established, experienced, and seated school superintendents. In 2014, the New Jersey School

7
Boards Association conducted a survey that indicated over 100 superintendents “cited the salary
cap as a factor” for leaving their position as superintendent between the implementation of the
salary caps and February 2014 (Jahn, 2014). In New Jersey, “statewide tenure for
superintendents averages five years; in the context of district grade configurations, the average
tenure for superintendents in K–12 and K–8 districts drops to 2.7 years and increases to 7.5 years
for superintendents in special school districts” (Kolu, 2014). When combined with the New
Jersey superintendent salary caps instituted in 2011, these reform efforts have led to an increased
exodus of experienced school district leaders.
According to the New Jersey Schools Boards report and additional research and reports,
“approximately 38.4% of the state’s 570 operating districts have experienced turnover; over the
same period, there were 295 instances of turnover with several districts having two or more
interim superintendents” (C. Jahn, NJSBA, Final Report on the Study of the Impact of the Salary
Cap on Chief School Administrators, 2014; M. Hayes, Panel Paper: The Effect of NJ
Superintendents; NJPSA 11/2016; Kachmar, K. & Yi, K., APP.com; Superintendent Salary Cap
Fails Taxpayers, 2/2016). The reduction of the average superintendent tenure in public schools
directly coincides with the increase in accountability and influence of reform efforts in the public
school sector, along with the limiting or cutting of school superintendent salaries (C. Jahn,
NJSBA, Final Report on the Study of the Impact of the Salary Cap on Chief School
Administrators, 2014). “Since the enactment of the superintendent’s salary cap, there has been a
significant increase in the mobility rate of experienced superintendents—either to retirement or
to take out-of-state positions” (M. Hayes, Panel Paper: The Effect of NJ Superintendents; NJPSA
11/2016). On a national level, 61.4% of superintendents have served in their current position
less than five years according to the American Association of School Administrators (AASA)

8
2016 superintendent survey (Finnan & McCord, 2017, p. 3). Although this research did not
include superintendent salary caps as a variable, it examined the impact of these salary
limitations as a result of the current rates of longevity in the state of New Jersey on district level
student academic success and teacher mobility.
The demands for improvement in our schools have tremendously increased since the
implementation of the No Child Left Behind efforts of the early 2000s. In the age of reform,
consistent school district leadership is essential to systematic school change and implementation
of academic improvement programs. According to Fullan (2006), school district leadership
persistence is a key component to implementing true organizational change. Fullan’s “Theory of
Action with Merit” outlines seven core premises including motivation, capacity building,
learning in context, changing context, a bias for reflective action, tri-level engagement, and
persistence and flexibility in staying the course (Fullan, M. 2006). Limited quantitative,
correlational research exists that examines the relationship between superintendent longevity and
student academic performance and faculty mobility at the district level.
As indicated throughout this chapter, these seven (7) core elements cannot be supported
through constant school district leadership change. Understanding Fullan’s core elements of
change and the environment needed to effectuate real organizational improvement, true change
cannot be accomplished with ever-changing leadership philosophies that accompany short-term
school superintendents.
Purpose of Study
The purposes for this correlational, explanatory, cross-sectional study were to examine
the association of superintendent longevity and continuity on district level student achievement
and faculty mobility. This research examined the relationship of the length of service of a
9
superintendent in a district on student achievement as evidenced by 2017 PARCC Grade 5 math
and ELA/L, Algebra 1, and ELA/L 10 scores of the K–12 public school districts in New Jersey.
An additional measure of district success examined was the district level faculty mobility rate.
According to research conducted by Allensworth, Ponisciak, and Mazzeo (2009), “Teachers are
more likely to stay in schools where they have positive, trusting, working relationships with each
other. Likewise, teachers are more likely to remain teaching in schools where they feel that their
colleagues are innovative; that is, where teachers have a “can do” attitude and work together on
improving the school” (Allensworth, et al., 2009). Understanding the loose connection between
the faculty mobility rate, school district success, and faculty satisfaction in the district, retaining
effective teachers is a key to student, school, and district success. The question was if
superintendent longevity has a direct positive association with student achievement and district
success on five different outcome variables. This research analyzed the relationship between
superintendent longevity and the identified factors of district success. Understanding that these
outcome variables were the research focus, the researcher acknowledges that other variables may
influence the selected outcomes variables of student/district success as measured by PARCC
assessments. Other influencing variables that may impact success in a school district can range
from attendance rates, free and reduced lunch rates, ethnicity, and other district demographic
factors, but these factors were outlined in the limitations of the research study.
Through the review of the literature and process of conducting this research, the
researcher identified any statistically significant relationship between superintendent longevity
and school district success as defined by student PARCC scores at three different grade levels.
Also examined was the relationship between superintendent longevity and the retention of
district faculty members through the examination of the district faculty mobility rate. The results

10
of this research furthered the understanding of how important the leadership position of
superintendent is to the effective implementation of academic programs within a school district
based on the two main factors of district academic success and retention of staff members.
School Board members in New Jersey and beyond the state’s borders can gain valuable insight
on the importance of the ongoing relationship between the superintendent and the board of
education. This research also identified how increasing superintendent tenure may positively
impact education by resulting in improved educational programs, continuity and consistency
within a district, and effective instruction delivery by experienced and knowledgeable staff.
The study and resulting data analysis may assist aspiring superintendents to develop
deeper district ties and longer lengths of service that may result in more successful public school
districts. This research study allowed the practicing superintendent, school boards of education,
legislators, and Department of Education officials the opportunity to examine the data regarding
the relationship between reduced lengths of service of superintendents because of a number of
influencing factors. Longer periods of superintendent tenure within a public school district may
lead to having a more vested and involved professional advocate for the well-being of the
district, its staff, and the students who are served by the public school district. At this time,
public school superintendents bear much of the burden of school accountability with the advent
of the No Child Left Behind legislation of 2001. Superintendents have recently experienced a
call from the New Jersey legislature to shift many school and district level responsibilities from
the superintendent to the school principal level. This could be the result of a perception that
there has been a concerted effort by New Jersey state politicians, in particular Governor Christie,
with salary cap implementation, to reduce the importance of a centralized leadership in the
public school districts in New Jersey and lead to a fragmented and schools-based program

11
development model. The minimization of the position of superintendent could also be a political
push to marginalize the leadership of smaller districts in an effort to combine and regionalize the
locally controlled school districts.
School district accountability continues to be a main focus of our Department of
Education at the state and federal level. According to the NCLB legislation, New Jersey was
approved for a waiver relaxing the mandate of 100% proficiency for all students by 2014.
However, as part of the waiver, New Jersey public school districts still had to meet yearly
improvement levels established from base scores from state assessments in 2012. The
information gained through this research called for a more introspective examination of a school
board’s effort to create district leadership positions that focus on creating longer lengths of
service and creating a sense of urgency to retain experienced superintendents to improve student
academic success and overall district success. The insight gained through this research provided
pertinent information about the impact of district leadership on district success for educators
interested in becoming a superintendent, but have not yet chosen to ascend to the position of
superintendent because of many factors including the uncertainty of job stability, impact of new
mandates, and other political and fiscal variables impacting the climate with our public schools.
The outcomes of this research can help the education community understand the relationship
between the leadership stability at the district level and how this longevity may transition down
into the schools, leading to improved student academic success and decreased faculty mobility
rates. This research and resulting information may help seated superintendents in effectively
assisting district and school administrators with the skills, knowledge, and consistency to
increase student achievement on the PARCC assessments. This may lessen the mobility rate of
teachers and other district measures of success by identifying key relationships between district

12
leadership stability and the implementation of effective instructional improvement programs for
the school district.
Research Questions
1. What is the relationship between New Jersey public school superintendent longevity and
student achievement as measured by Spring 2017 Partnership for Assessment of
Readiness for College and Careers (PARCC) Grade 5 math when controlling for school
and student characteristics?
2. What is the relationship between New Jersey public school superintendent longevity and
student achievement as measured by Spring 2017 Partnership for Assessment of
Readiness for College and Careers (PARCC) Grade 5 English Language Arts/Literacy
when controlling for school and student characteristics?
3. What is the relationship between New Jersey public school superintendent longevity and
student achievement as measured by 2017 Partnership for Assessment of Readiness for
College and Careers (PARCC) Algebra 1 when controlling for school and student
characteristics?
4. What is the relationship between New Jersey public school superintendent longevity and
student achievement as measured by Spring 2017 Partnership for Assessment of
Readiness for College and Careers (PARCC) English Language Arts/Literacy 10 when
controlling for school and student characteristics?
5. What is the relationship between New Jersey superintendent longevity and district faculty
mobility as evidenced by the 2017 School Performance Report faculty mobility rate
percentage when controlling for school and student characteristics?
13
Null Hypothesis
No statistically significant relationship exists between a New Jersey school
superintendent’s length of time in a school district and student academic achievement, as
evidenced by the 2017 PARCC scores in Grade 5 mathematics when controlling for school and
student characteristics.
No statistically significant relationship exists between a New Jersey school
superintendent’s length of time in a school district and student academic achievement, as
evidenced by the 2017 PARCC scores in Grade 5 English Language Arts/Literacy when
controlling for school and student characteristics.
No statistically significant relationship exists between a New Jersey school
superintendent’s length of time in a school district and student academic achievement, as
evidenced by the 2017 PARCC scores in Algebra 1 when controlling for school and student
characteristics.
No statistically significant relationship exists between a New Jersey school
superintendent’s length of time in a school district and student academic achievement, as
evidenced by the 2017 PARCC scores in English Language Art/Literacy 10 when controlling for
school and student characteristics.
No statistically significant relationship exists between a New Jersey school
superintendent’s length of time in a school district and district success, as evidenced by the 2017
district faculty mobility rate when controlling for school and student characteristics.
Study Design and Methods
This research study used a non-experimental, exploratory, cross-sectional design with
quantitative methods. The quantitative method allowed for an examination of the strength of

14
relationships between the longevity of the school superintendent and multiple measures of school
district success. The research methods allowed for further examination of the relationship
between length of service of superintendents and resulting student academic performance and
faculty stability as identified by the annual mobility rate of teachers. This research provided a
more in-depth analysis examining if a superintendent’s length of tenure in a public school district
can influence district level student achievement in multiple grade levels and academic areas.
The New Jersey school districts examined were a cross section of kindergarten through
twelfth grade public schools in New Jersey in all District Factor Groups (DFG) of A through J
(218 schools) that provided valid PARCC assessment scores in Grades 5, 9, and 10 in both math
and ELA/L exams as reported by the New Jersey Department of Education. Student academic
success at the district level was determined by the percentage of students scoring a minimum of
750 on the PARCC assessments during the 2017 school year. Faculty mobility rate success at
the district level was defined as having a percentage of faculty arriving at or leaving the district
at a percentage level lower than the sample districts mean. The resulting data points were
analyzed using multiple analysis methods of the Statistical Package for the Social Sciences
(SPSS) including descriptive, exploratory, correlational, and multiple regression analysis to
examine the strength of relationship of the predictor variables on the dependent variables in this
quantitative data analysis.
Data were gathered utilizing three different sources. Information was collected from data
sets contained at the website operated by the Asbury Park Press, Data Universe, which annually
lists the name, school district, salary, years of service, and date of enrollment in the pension
system. New Jersey Department of Education information was reviewed from publicly available
files located at the New Jersey Department of Education website including the “staff
15
submission” report required to be submitted to the Department of Education each year by all
New Jersey school districts, and the annual School Performance Report. Lastly, data were
requested from the New Jersey Association for School Administrators, which conducted a
number of surveys regarding superintendent employment, years of service, and salary data, and a
number of other data points. Data points retrieved are the years of service as a superintendent,
and years of service to K–12 public school districts that meet the sample criteria. Also reviewed
was the 2017 School Performance Report of up to 218 sample school districts that provide the
Department of Education with data on the levels of successful passing rates on the 2017 PARCC
score reports for the predetermined dependent variables. This includes data on the PARCC
Grade 5 math and ELA/L assessments, Algebra 1 assessment, and the 2017 PARCC ELA/L 10
assessment for public school students. There are minimal threats to the reliability of the data
because of misreporting of the data by school districts and the range of students taking the
required PARCC state assessments. The School Performance Report was utilized to collect data
on control variables of all the districts in the sample as outlined in the variable section of this
chapter and the research design of the study.
The data sets from the predictive variable of superintendent longevity and the dependent
variable of PARCC scores and faculty mobility was collected from the annual School
Performance Report and other publicly available resources and reports (https://rc.doe.state.nj.us),
Data Universe (php.app.com), and the School Performance report
https://www.nj.gov/education/schools/achievement).
Significance of the Study
This study is significant as it further explores the limited research on the relationship
between the superintendent’s length of tenure and continuity relative to student academic success

16
and district faculty stability and satisfaction. Public school effectiveness is an important factor in
the success of our students and to the future of our country. Superintendents are under
increasing pressures to develop programming that will result in the success of their student body
and as result of this increased emphasis on results and the need for immediate positive impacts as
expected by Boards of Education and local communities, the position of superintendent has
become a position where there is less continuity and more superintendent migration across our
country.
Developing successful educational programming takes time to research, educate,
professionally develop, and implement. Once implemented it takes, on average, two to five
years for full implementation as indicated by current research by Fullan, (2006); Waters &
Marzano, (2006); and Togneri & Anderson, (2003). After implementation, each program should
be thoroughly evaluated for effectiveness. “While statewide tenure for superintendents averages
at five years, in the context of district grade configurations, the average tenure for
superintendents in K–12 and K–8 districts drops to 2.7 years and increases to 7.5 years for
superintendents in special school districts” (Kolu, 2014). Understanding this, when the average
superintendent tenure is two to five years, district academic programming may be adversely
affected by inadequate implementation timelines and lack of superintendent continuity for
districts (Fullan 2006; Waters & Marzano, 2006; Gianquinto, 2011; Plotts, 2011, Kolu et al.,
2014). In the 2016 AASA Superintendent Salary and Benefits study, Tables 1/2 indicate that the
average tenure of respondents across the country in their current position indicated that 60.1%
have been with their current district for less than five years of service time (Finnan, L. &
McCord, 2017).

17
Table 1 Gender (Q44) and longevity in present position (Q8)
Longevity in Present Position Gender 1 Year or
Less 1-5
Years 6-10
Years 11-15 Years
16 Years or More
Omitted Longevity
Total
Male 67 (6.4%)
576 (54.9%)
285 (27.1%)
73 (7%)
42 (4%)
7 (0.7%)
1050 (100%)
Female 17 (5.4%)
166 (52.7%)
84 (26.7%)
32 (10.2%)
15 (4.8%)
1 (0.3%)
315 (100%)
Omitted 1 (3.7%)
10 (31%)
6 (22.2%)
2 (7.4%)
0 (0%)
8 (29.6%)
27 (100%)
Total 85 (6.1%)
752 (54%)
375 (26.9%)
107 (7.7%)
57 (4.1%)
16 (1.2%)
1392 (100%)
(Finnan, L. & McCord, 2017)
Table 2 Gender (Q44) and Longevity as a Superintendent (Q9)
Longevity in Present Position Gender 1 Year or
Less 1-5
Years 6-10
Years 11-15 Years
16 Years or More
Omitted Longevity
Total
Male 34 (3.2%)
398 (37.9%)
305 (29%)
169 (16.1%)
138 (13.1%)
6 (0.6%)
1050 (100%)
Female 13 (4.1%)
122 (38.7%)
85 (27%)
62 (19.7%)
32 (10.2%)
1 (0.3%)
315 (100%)
Omitted 0 (0%)
10 (37%)
7 (25.9%)
2 (7.4%)
2 (7.4%)
6 (22.2%)
27 (100%)
Total 47 (3.4%)
530 (38.1%)
397 (28.5%)
233 (16.7%)
172 (12.4%)
13 (0.9%)
1392 (100%)
(Finnan, L. & McCord, 2017)
This research allowed school districts to better understand the association between
superintendent stability on district success and will assist districts in making informed data-based
decisions on the retention of school district leaders. In addition, this research can assist boards of
education to have better insight when assessing the merits of policies developed by the
Department of Education in relationship to the local school superintendent (i.e., superintendent
salary caps).

18
Variables
• Years of superintendent service to the a school district
• Total number of years as a superintendent
• District PARCC Algebra 1 percentage of students meeting expectations
• District PARCC English Language Arts/Literacy percentage of students meeting
expectations
• District PARCC Grade 5 math percentage of students meeting expectations
• District PARCC English Language Arts/Literacy percentage of students meeting
expectations
• District faculty mobility rate percentage
• District free and reduced lunch percentage
• District student chronic absenteeism percentage
• District special education percentage
• District English language learner percentage
• District faculty attendance percentage
• District faculty with advanced degrees percentage
Limitations and Delimitations
Prudence was used when examining the results and attempting to generalize the findings
as there are a number of limitations and delimitations to this quantitative research study.
Correlational studies such as this cannot determine cause and effect. The results from this study
cannot be generalized to the school level or other states. Another limitation of this study is that
some superintendents enter or leave mid-year prior to the PARCC assessment administration
periods. The research in this study only focused on one year, 2017, of testing data for the sample

19
school districts. The research was limited by the fact that only data collected in the academic
realm was the PARCC data for the sample school districts. As reported by the Department of
Education, the New Jersey School Boards Association (NJSBA School Board Notes, 4/21/15),
and New Jersey Advanced Media (A. Clark, 2/8/16), in 2015 and 2016 participation rates on the
PARCC ranged between 86.4% on the PARCC Algebra 1 as reported by the Department of
Education in 2015 and 89% as reported by NJ Advanced Media for all Grades 3–11 in February
of 2016. According to NJ Advanced Media, approximately 124,000 students from Grades 3–11
who were supposed to participate in the math assessment “did not participate and did not receive
a score.” The participation rates on the PARCC assessment were significantly reduced as
compared to the participation rates of the HSPA as reported on the School Performance Reports.
Based on these same district level reports, student proficiency and outcomes were also
significantly reduced in comparison to the previous assessment of the HSPA. Understanding
these opt-out and test motivation statistics, there may be issues with reliability and validity of the
PARCC data. The PARCC data test results could be limited by accuracy of reporting and coding
students at the local school level along with the accuracy of the reporting of the New Jersey
Department of Education. The test-taking environment was diverse across the state at local
district schools and for this reason there may be more and less optimal testing procedures and
environments for the students sitting for the exam. The outcomes of this research can only be
generalized to the same populations that were selected as the study sample.
A delimitation of this research is that all the data collected was from K–12 school
districts in New Jersey who have a permanent school superintendent. A second delimitation was
that the data from all school districts was collected from Grades 5, 9, and 10, in addition to the
accounting of the faculty mobility rate for each K–12 district in the state.

20
There could be additional limitations or delimitation through the process of collecting and
analyzing the data that were not identified.
Definitions of Terms
The following terms are defined as used in this proposed study:
Academic Achievement: Academic achievement is based on 2017 Partnership for
Assessment for Readiness for Colleges and Careers (PARCC) Algebra 1 scores and 2017
Partnership for Assessment for Readiness for Colleges and Careers (PARCC) English Language
Arts–Literacy 10 test scores for students.
Continuity: Uninterrupted duration or continuation especially without essential change
while working in an educational setting. In terms of the superintendent, it is the uninterrupted
service to a school district while employed as the superintendent.
Mid-continent Research for Education and Learning (McREL): McREL is a
501(c)(3) non-profit, nonpartisan education research and development organization that—for
more than 50 years—has turned knowledge about what works in education into practical,
effective guidance and training for K–12 teachers and education leaders.
District Factor Group: The DFGs represent an approximate measure of a community’s
relative socioeconomic status (SES). The classification system provides a useful tool for
examining student achievement and comparing similarly situated school districts in other
analyses. This research focused on high schools within the DFG of CD through GH districts
(www.nj.gov/education; New Jersey Department of Education website 2018).
The Partnership for Assessment of Readiness for College and Careers: A set of
assessments that measure whether students are on track to be successful in college and careers
(https://parcc.pearson.com). In the 2014–15 school year, New Jersey transitioned from its

21
former assessments to the Partnership for Assessment of Readiness for College and Careers
(PARCC) in mathematics and English Language Arts/Literacy. The PARCC assessments more
accurately measure the higher-level skills developed under the New Jersey Student Learning
Standards and provide parents and educators with meaningful information to improve teaching
and learning (NJ DOE PARCC website 2018).
High School Superintendent: Provides educational leadership by directing the
formulation of district-wide goals, plans, policies, and budgets, by recommending their approval
by the district board of education and by directing their district-wide implementation.
Chief educational officers of the school district contracted and hired by the members of the
school district Board of Education. The superintendent is employed for a specific number of
years and can be an interim (temporary) position or a full-time position.
School District: The geographical boundaries outlining the borders of the school district
unit responsible for the local administration of schools. Included in this research are all New
Jersey K–12 school districts with a permanent school superintendent.
Longevity: Length of service, tenure, seniority, etc. (Dictionary.com 2018). The number
of consecutive years that the superintendent serves a specific school district in the same position.
Turnover: The number or percentage of workers who leave an organization and are
replaced by new employees (smallbusiness.chron.com/employee-turnover-definitions). The rate
of movement and replacement of superintendents because of resignations, non-renewals,
retirements, and other separation of service reasons.
Organization of the Dissertation
Chapter I outlined the purpose of the proposed study, the background of the research
problems, hypothesis of the study, and the significance of the study. It concluded with the

22
limitations and delimitations of the research, the definition of terms, and the organization of the
research study. Chapter II is an in-depth review of the history of the superintendent and the ever-
changing roles and responsibilities of the chief educational officer in addition to the changing
face of accountability in our public schools in New Jersey and across our country. Critical
changes in policy and regulations affecting public schools were examined as well as how this
increased attention to improve public schools was not a new phenomenon and has occurred for
many years with many different titles and phases. This research focused on more recent
regulations that have had an impact on local schools districts ranging from superintendent salary
caps, changing the state assessment program, to new reform efforts across our nation and in New
Jersey. Chapter III outlines the design of the research project, the methodology employed for the
data collection, and what statistical analysis tools were utilized in the analysis of the relationship
between the independent variable of superintendent longevity on the multiple outcome variables
measuring school district success. Chapter IV focuses upon a full presentation of the statistical
analysis of the data points used for this research. It provides the findings and results of the
investigation. This chapter outlines an interpretive and detailed explanation of the research
findings as connected to the research questions posed in this study. Chapter V discusses the
important findings as they link to previous studies and current practices. The present research
findings, guided by the research questions and the purpose of the study, were utilized to suggest
future research, and examine current educational policy and leadership practices employed by
local school districts, and the New Jersey Department of Education.

23
Chapter II
Review of the Literature
The position and perception of the public schools system has changed significantly in the
past two decades. According to Mendoza-Jenkins (2009), “The superintendency position has
transitioned from a managerial-focused position to one focused on instructional leadership. As a
result, it is critical that system leaders have both the skill set and knowledge base necessary to
direct multi-dimensional, district-wide action toward a single objective: improving student
achievement.” The purpose of the review was to critique empirical studies that examined the
history, evolution, and changing role of the school district superintendent, investigate
superintendent leadership longevity and its resulting influence on the New Jersey public school
district; and consider the effect the school leader has on student achievement and organizational
stability and retentions of staff while controlling for specific student predictor variables that past
literature had identified as an influencing factor of student achievement (i.e., student attendance,
student socioeconomic status, students with disabilities).
The increasing calls for accountability by multiple community and state entities, the
release of President Reagan’s commissioned report “Nation at Risk” led by Education Secretary
Bell in 1983, and amendments to the No Child Left Behind and the Every Student Succeeds Act
have significantly impacted the way public schools are held accountable (Alborano, 2002; Glass
& Franceschini, 2007; Plotts, 2011; Gianquinto, 2011). In addition, aspects of each of these
reauthorizations, like the NCLB Act’s call for testing students at multiple times at every grade
level each year from Grade 3 through 11, have pushed for greater testing accountability and a
larger investment in the assessment program (Alborano, 2002; Glass & Franceschini, 2007;
Plotts, 2011; Gianquinto, 2011). In 2014, President Obama began his administration with

24
revision of the educational law; these changes brought an increased federal presence in state
educational realms with the implementation of the Common Core State Standards and in New
Jersey, the PARCC assessments.
Former New Jersey Governor Chris Christie implemented new regulations on
superintendent salaries that capped them at certain levels based upon enrollment numbers. The
executive order led to many superintendents in New Jersey leaving the profession, creating a
vacuum in experienced school superintendents in the public school districts.
The changes and the clear call for increased accountability have had significant influence
on the delivery of instruction in all New Jersey public school districts. Understanding these
changes and the ever-evolving face of the educational landscape, the lack of district leadership
longevity in a district could affect the academic success of students in the district, along with
overall district success. Additionally, the lack of longevity could have negative impacts on the
effective implementation of program improvement plans and the resulting professional
development of the teaching staff. The resulting dissatisfaction of the staff may lead to an
increased exodus of staff from the district, resulting in a loss of institutional knowledge.
Combined with other public school accountability concerns, numerous influences at the
local district level have impacted school districts and led to ineffectual programmatic changes.
The lack of stability in district leadership is in direct contrast to the guidelines set forth by the
expectations of the Change Theory as explained by Fullan (2006) in his research findings. For
these reasons, this research examined the effects of the increasing demands on the position of
superintendent and the resulting drain upon experienced superintendents as reported by various
agencies including the New Jersey Association for School Administrators (NJASA), New Jersey
School Boards Association (NJSBA), and numerous news outlets and employment surveys

25
conducted by the American Association of School Administrators (AASA). Understanding these
reports, combined with the research conducted by Waters and Marzano (2006) indicating that
superintendent longevity can positively influence student academic outcomes, the position of
superintendent and the recent exodus of experienced and stable school district leaders have had
an impact on school district success.
Inclusion and Exclusion Criteria for the Literature Review
Research and statistics used in this review had to contain the following criteria in order to
be included:
1. Experimental, quasi-experimental, and non-experimental studies with control variables or
groups
2. Peer reviewed research including dissertations and governmental reports
3. Peer reviewed journals and reference or governmentally based news articles
4. Studies that focused on student achievement included Grades 5–11 or included faculty
mobility rates
5. Literature found in government reports that meet previous criteria outlined
6. Research conducted within the last 35 years
7. Seminal works
Purpose for the Review
This literature review examined research-based articles and studies on the topic of
superintendent longevity relative to student achievement, culture and climate, staff morale, and
teacher transience leading to organizational stability. This review expanded upon the identified
positive relationship between superintendent tenure and student academic success, district
stability, and retention of experienced successful staff through effectual district leadership. The
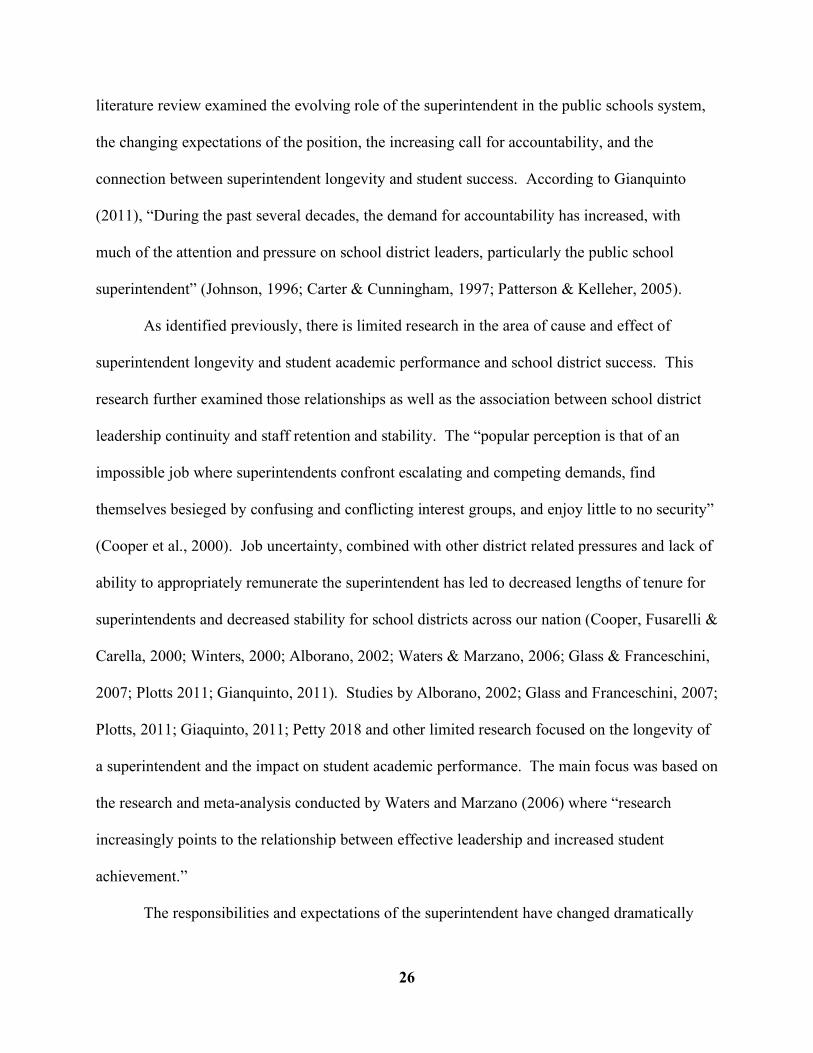
26
literature review examined the evolving role of the superintendent in the public schools system,
the changing expectations of the position, the increasing call for accountability, and the
connection between superintendent longevity and student success. According to Gianquinto
(2011), “During the past several decades, the demand for accountability has increased, with
much of the attention and pressure on school district leaders, particularly the public school
superintendent” (Johnson, 1996; Carter & Cunningham, 1997; Patterson & Kelleher, 2005).
As identified previously, there is limited research in the area of cause and effect of
superintendent longevity and student academic performance and school district success. This
research further examined those relationships as well as the association between school district
leadership continuity and staff retention and stability. The “popular perception is that of an
impossible job where superintendents confront escalating and competing demands, find
themselves besieged by confusing and conflicting interest groups, and enjoy little to no security”
(Cooper et al., 2000). Job uncertainty, combined with other district related pressures and lack of
ability to appropriately remunerate the superintendent has led to decreased lengths of tenure for
superintendents and decreased stability for school districts across our nation (Cooper, Fusarelli &
Carella, 2000; Winters, 2000; Alborano, 2002; Waters & Marzano, 2006; Glass & Franceschini,
2007; Plotts 2011; Gianquinto, 2011). Studies by Alborano, 2002; Glass and Franceschini, 2007;
Plotts, 2011; Giaquinto, 2011; Petty 2018 and other limited research focused on the longevity of
a superintendent and the impact on student academic performance. The main focus was based on
the research and meta-analysis conducted by Waters and Marzano (2006) where “research
increasingly points to the relationship between effective leadership and increased student
achievement.”
The responsibilities and expectations of the superintendent have changed dramatically

27
from the establishment of public schools in the middle seventeenth century to today’s
educational climate. This role has evolved tremendously over the past 150 years, but much more
so in the last twenty years with the inception of the No Child Left Behind Act and the Every
Student Succeeds Act (ESSA). The federal educational law has inspired public school reforms at
the state level in the area of teacher evaluation with NJ Achieve, the Pearson-developed online
state assessment with the approval of the Partnership for Assessment for College and Careers
(PARCC) test, annual school assessment monitoring, and numerous other reform mandates. In
addition to federal reforms, state mandated reforms, including the superintendent salary caps,
were instituted in New Jersey on February 7, 2011. The culmination of all these reform
initiatives, along with local district level expectations, has changed the position of superintendent
forever.
The literature examined through this chapter reflected the fact that research indicated
increased accountability on public schools has transitioned to the district leadership and these
accountability measures and expectations for success has impacted the role of the superintendent.
The expectation for public school improvement has required school superintendents to develop,
evaluate, and implement initiatives to positively impact district educational programs. The task
of public school program improvement rests upon the position of superintendent and as the
district leader, the outcomes of the improvement plans continue to further delineate the role and
success of the superintendent. Combining the increased accountability measures with the New
Jersey superintendent salary caps and other influencing factors, the ability of superintendents to
effectuate meaningful changes over an adequate period of time may negatively be impacted by
the shorter periods of longevity for school district leaders.
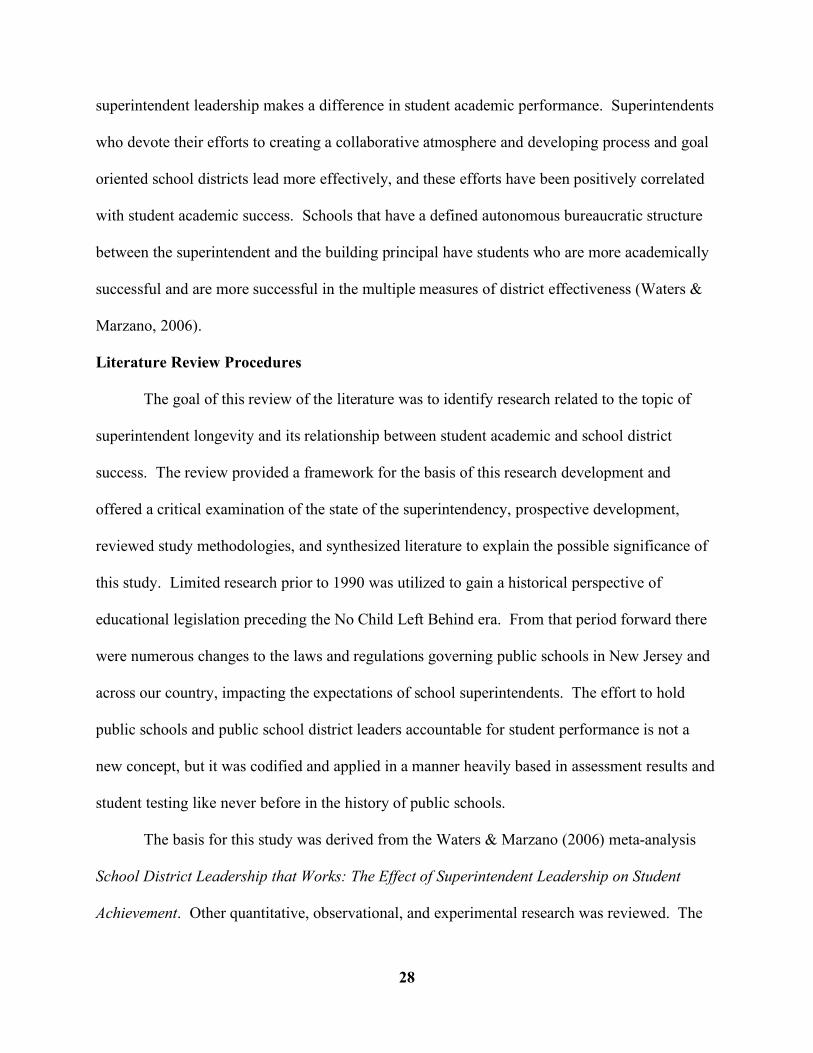
Research conducted by Waters and Marzano (2006) and other researchers indicates that
28
superintendent leadership makes a difference in student academic performance. Superintendents
who devote their efforts to creating a collaborative atmosphere and developing process and goal
oriented school districts lead more effectively, and these efforts have been positively correlated
with student academic success. Schools that have a defined autonomous bureaucratic structure
between the superintendent and the building principal have students who are more academically
successful and are more successful in the multiple measures of district effectiveness (Waters &
Marzano, 2006).
Literature Review Procedures
The goal of this review of the literature was to identify research related to the topic of
superintendent longevity and its relationship between student academic and school district
success. The review provided a framework for the basis of this research development and
offered a critical examination of the state of the superintendency, prospective development,
reviewed study methodologies, and synthesized literature to explain the possible significance of
this study. Limited research prior to 1990 was utilized to gain a historical perspective of
educational legislation preceding the No Child Left Behind era. From that period forward there
were numerous changes to the laws and regulations governing public schools in New Jersey and
across our country, impacting the expectations of school superintendents. The effort to hold
public schools and public school district leaders accountable for student performance is not a
new concept, but it was codified and applied in a manner heavily based in assessment results and
student testing like never before in the history of public schools.
The basis for this study was derived from the Waters & Marzano (2006) meta-analysis
School District Leadership that Works: The Effect of Superintendent Leadership on Student
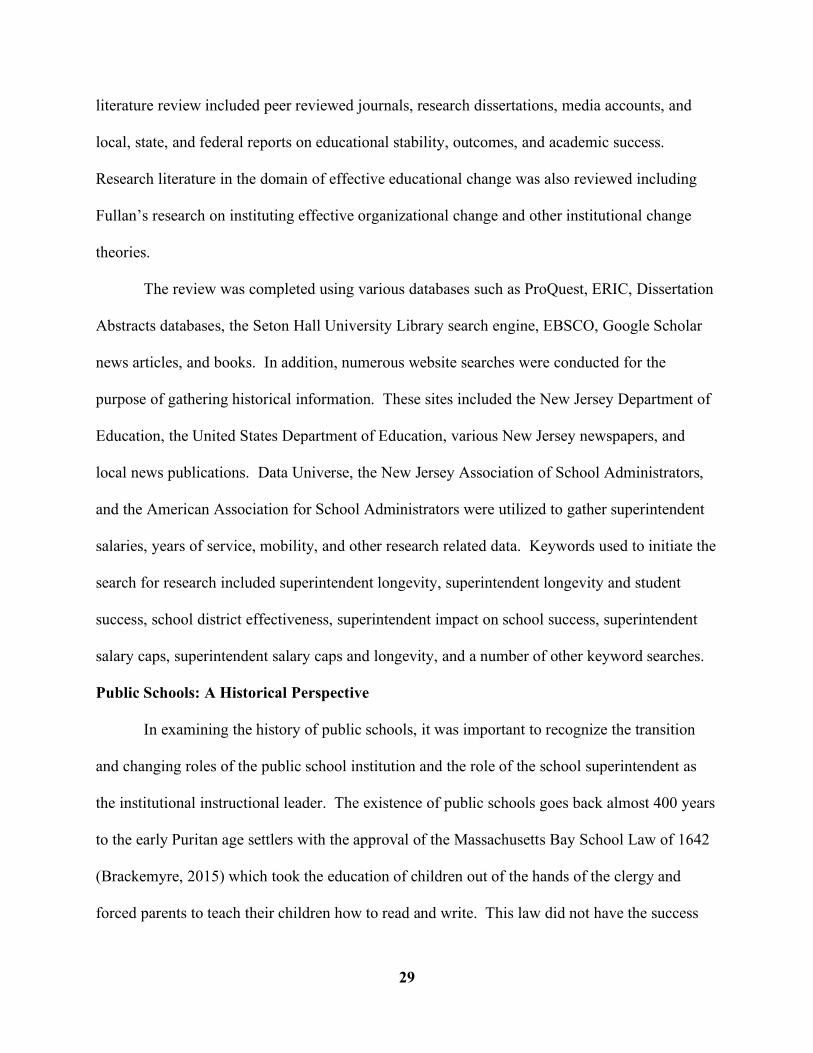
Achievement. Other quantitative, observational, and experimental research was reviewed. The
29
literature review included peer reviewed journals, research dissertations, media accounts, and
local, state, and federal reports on educational stability, outcomes, and academic success.
Research literature in the domain of effective educational change was also reviewed including
Fullan’s research on instituting effective organizational change and other institutional change
theories.
The review was completed using various databases such as ProQuest, ERIC, Dissertation
Abstracts databases, the Seton Hall University Library search engine, EBSCO, Google Scholar
news articles, and books. In addition, numerous website searches were conducted for the
purpose of gathering historical information. These sites included the New Jersey Department of
Education, the United States Department of Education, various New Jersey newspapers, and
local news publications. Data Universe, the New Jersey Association of School Administrators,
and the American Association for School Administrators were utilized to gather superintendent
salaries, years of service, mobility, and other research related data. Keywords used to initiate the
search for research included superintendent longevity, superintendent longevity and student
success, school district effectiveness, superintendent impact on school success, superintendent
salary caps, superintendent salary caps and longevity, and a number of other keyword searches.
Public Schools: A Historical Perspective
In examining the history of public schools, it was important to recognize the transition
and changing roles of the public school institution and the role of the school superintendent as
the institutional instructional leader. The existence of public schools goes back almost 400 years
to the early Puritan age settlers with the approval of the Massachusetts Bay School Law of 1642
(Brackemyre, 2015) which took the education of children out of the hands of the clergy and
forced parents to teach their children how to read and write. This law did not have the success

30
that the legislators planned and this lack of success led to new laws like the Old Deluder Act of
1647. This decree “ordered that every township in this jurisdiction, after the Lord hath increased
them to fifty households shall forthwith appoint one within their town to teach all such children
as shall resort to him to write and read.” (The Governor and Company of the Massachusetts Bay,
1853). Although these early laws were developed to address an upper class family’s issue, it was
these early established laws that led to the push to educate our children in common facilities,
eventually establishing the early concepts of a public school system.
The system has developed from these seventeenth century schooling laws to the current
form of public schools with regulations, monitoring, and school reforms including the
Elementary and Secondary Education Act (ESEA) proposed by Lyndon Johnson and approved in
1965 (Fuhrman & Lazerson, 2005; Spring 2002). The ESEA regulations included the Title I
changes that focused increased attention to the disadvantaged learner. The No Child Left Behind
Reauthorization (2001), the Common Core State Standards implementation in 2009, and the
more recent Every Student Succeeds Act (2015) have all impacted the state of accountability for
public schools across our nation. Each of these initiatives, along with a number of additional
laws and reforms, have all led to an increased push for accountability and an environment where
superintendents are expected to efficiently perform the executive functions of the district and
produce students’ academic outcomes that are exceptional. These remediation measures and
regulations come with additional accountability and expectations put upon the school
superintendent.
In the 1990s the attention to student outcomes and public school accountability increased
and the scrutiny of what school district leaders were doing to improve educational delivery and
outcomes in the schools came to the forefront of the educational platform. The perceived

31
failures of schools to address disadvantaged learners gained attention when high profile federal
legislators such as Senator Ted Kennedy and Representative George Miller grew frustrated that
increased federal education spending didn’t seem to be making an academic difference for
students. The rationale was that the federal ESEA funding was not improving results for
disadvantaged learners (Hess, 2015) and there needed to be additional educational reforms to
continue to address the learning gaps for the Title 1 students. In addition, other federal
legislative leaders felt there was a need to increase accountability in schools because of the
continued failures to improve student performance.
These efforts were the precipitating factors leading up to the approval of the No Child
Left Behind Act from the early 2000s to the current Every Student Succeeds Act (ESSA)
approved on December 10, 2015 (U.S. Department of Education, 2018).
School District Accountability
No Child Left Behind Act: A Historical Perspective
The NCLB Act was the reauthorization of the 1965 educational law passed and signed by
Lyndon B. Johnson titled Elementary and Secondary Education Act (ESEA). The ESEA law
was part of President Johnson’s Great Society Program that clearly established a federal role in
the K–12th grade policy by providing $1,000,000,000 in public schools aid under the “Title I”
section of the law (Klein, 2015). This funding was intended to be used to improve the
educational experiences for lower socio-income and disadvantaged students. As Barbara
Micheleman stated, “K–12 education was a longstanding state and local responsibility, with
more than 90 percent of the cost of public school funding being provided by the states and
districts. The federal government reserved most of its authority to ensuring that its resources
helped disadvantaged children and those with special needs. Over the years, federal

32
policymakers and presidents increasingly discussed education as a national priority, yet their
conversations did not necessarily translate into policies because of the limited federal
government funding and role in education decision making” (Micheleman, 2012). The ESEA act
was the first major funding program instituted at the federal level that directly affected public
school policy. From 1965 until 2015, the ESEA laws have been reauthorized seven times.
In 2001 the reauthorization was completed, once again, under the direction of President
George W. Bush, renamed The No Child Left Behind Act (NCLB). One of President Bush’s
early initiatives was to address the reauthorization of the ESEA and to institute new reforms to
the aging ESEA educational laws. The NCLB Act was updated in January of 2001 and
“effectively scaled up the federal role in holding schools accountable for student outcomes”
(Klein, 2015). The new law was developed out of concern that the United States was no longer
competitive on an international level. This reauthorization significantly increased the federal
role in holding schools responsible for the academic progress of all students (Klein, 2015). A
main component of the law was to make sure that 100% of students in the assessed grades from
three through eight and eleventh grade were able to successfully pass a state Department of
Education approved assessment for students. Under the NCLB law, states were required to
institute a number of new initiatives in their public schools including a requirement to “test
students in reading and math in Grades 3 through 8 each year and once in high school” (Klein,
2015). In addition to the new testing requirements, each school was required to report out the
results of the testing program “for both the student population as a whole and for particular
‘subgroups’ of students, including English language learners and students in special education,
racial minorities, and children from low-income families” (Klein, 2015). The final goal of the
NCLB testing program was that all students would be proficient by the conclusion of the 2014

33
school year. This would be measured at 100% proficiency in both math and English subject
areas. In addition to the new testing goals, schools were required to establish Annual
Measurable Objectives (AMO) to track the progress of the school and then report to the
Department of Education on the Annual Yearly Progress (AYP) toward the 100% proficiency
level (No Child Left Behind Act, 2002). These provisions would act as the annual criterion to
measure the school’s success in progression to the ultimate goal of 100% proficiency for all
students.
For the purposes of this research, this literature review focus was on the changes in
educational accountability as a result of the No Child Left Behind Act from its enactment in
2001 until December of 2015. The research examined the relationship between high stakes
testing in New Jersey public schools and the resulting student success on the PARCC ELA/L and
math assessments as related to superintendent longevity. The increased accountability as a result
of the NCLB laws and the associated testing requirements has impacted the position of school
superintendent.
The new NCLB regulations included provisions to increase oversight by the Department
of Education for schools that did not meet the requirements outlined in the law including the goal
setting AMOs and the adequate yearly progress targets. The sanctions, which would increase
each time a school did not meet their goals, ranged from increased paperwork and dedicated Title
I instructions to complete takeover by state educational agencies. According to Klein (2015), a
school that missed its annual goal for the overall student population or for a certain subgroup
could face the following penalties:
• A school that misses AYP two years in a row has to allow students to transfer to a better
performing public school in the same district.

34
• If a school misses AYP for three years in a row it must offer tutoring.
• Schools that continue to miss achievement targets could face state intervention. The state
can choose to shut these schools down, turn them into charter schools, take them over, or
use another, significant turnaround strategy.
• What’s more, schools that don’t make AYP have to set aside a portion of the federal Title
I dollars for tutoring and school choice. Schools at the point of having to offer school
choice would have to hold back ten percent of their Title I money (Klein, 2015).
According to Sybrant (2012), The No Child Left Behind Act was designed to close the
achievement gap between high and low performing students, hold all public schools accountable
for improving academic achievement for all students, promote school wide reform, and ensure
access to effective scientifically based instructional strategies and challenging academic content.
With the implementation of NCLB, the efforts to increase accountability in schools have
significantly changed the administrative and academic environment in public schools. The high
level of accountability and the public concerns for improved educational outcomes has
significantly shifted the role of superintendent. Much more time and attention is dedicated to the
increased regulations and standards, which have required the superintendent to be more
accountable for academic outcomes of the students they serve in the public schools.
In 2012 the ESEA/NCLB laws were relaxed for school districts and then in 2014 each
state had the opportunity to take part in the ESEA/NCLB flexibility requirements. During this
period it was evident that the schools across our nation were not going to meet the NCLB
requirement of 100% proficiency in the 2014 year. President Obama began to address the issue
of local and state failures to meet the NCLB requirements through reauthorization in 2014 and
Congress passed the Every Student Succeeds Act in December of 2015. The federal Department

35
of Education and the president introduced the option that “each state agency may request
flexibility on its own behalf and on the behalf of local educational agencies and the associated
regulatory, administrative, and reporting requirements” (United States Department of Education,
2017). As a result of all these changes, the increased regulations and reform measures intended
to improve our public schools and the call for improved student success, the position of
superintendent became much more difficult. This research examined the reform platforms, the
effect on superintendent longevity, and the resulting students’ and school district success in the
New Jersey public high school system.
Common Core State Standards as a Result of NCLB
Common Core State Standards were developed as a new set of standards to be used
across the United States to homogenize the process of curriculum development. The effort to
develop the Common Core State Standards across the nation continued to be pursued in 2009
by state leaders, including governors and state commissioners of education from 48 states,
two territories, and the District of Columbia, through their membership in the National
Governors Association Center for Best Practices (NGA Center) and the Council of Chief
State School Officers (CCSSO) (Common Core State Standards Initiative, 2017). According
to the Common Core State Standards Initiative site, state school chiefs and governors
recognized the value of consistent, real-world learning goals and launched this effort to
ensure all students, regardless of where they live, are graduating high school prepared for
college, career, and life (Common Core State Standards Initiative, 2017). Another goal was
to standardize state-to-state educational standards so that students with transient families and a
lack of stability in school and residency would be accommodated with similar curriculum and
grade level standards (Common Core State Standards Initiative, 2017). The standardization of

36
grade level goals would lead to a more simplistic transition for students moving from district to
district compared to the current individual, state-led efforts to develop local sets of standards.
The effort to approve and adopt the CCSS came with some opposition as it was viewed as
national curriculum. The idea of a national curriculum comes with some controversy and is
highly controversial in a local control state like New Jersey that takes pride in the development
of community based, locally led school districts. Opponents of the CCSS indicated it was an
overreach of the federal government to implement national standards; others criticized the
quality of the standards, claiming they hadn’t been field tested, they weren’t grounded in
research, and that it was unclear if they have been appropriately benchmarked against
international standards (Bidwell, 2014).
A large percentage of states that originally adopted the CCSS have since dropped out of
the testing consortiums or have changed and adopted newer standards that are more locally
developed for their state’s school districts. The expressed concerns by many New Jersey
residents did not prevent the New Jersey Department of Education from approving these
standards in 2009 and more recently, revising these standards with minimal changes and titling
them the New Jersey Student Learning Standards for all New Jersey school districts to follow for
curriculum standards in 2017.
Testing Developments and Implementation–PARCC
In the 2014–2015 school year, the PARCC test was adopted as the state assessment and
administered to students in Grades 3 through 8 and 11 in New Jersey. As a result of the federal
government awarding approximately $330 million dollars in grant money to two different test
development companies, state departments of education now had an online test for measuring the
comprehension levels of students in the CCSS. According to Arne Duncan, U.S. Secretary of

37
Education in 2010, “The grant requests, totaling approximately $330 million, are part of the Race
to the Top competition and will be awarded to the Partnership for Assessment of Readiness for
College and Careers (PARCC) and the SMARTER Balanced Assessment Consortium (SBAC) in
the amounts of approximately $170 and $160 million respectively (Duncan, 2010, p. 1). The
secretary’s 2010 press release went on to state that the Partnership for Assessment of Readiness
for College and Careers was a coalition of 26 states including AL, AR, AZ, CA, CO, DC, DE,
FL, GA, IL, IN, KY, LA, MA, MD, MS, ND, NH, NJ, NY, OH, OK, PA, RI, SC and TN. The
SMARTER Balanced Assessment Consortium was a coalition of 30 states including AL, CO,
CT, DE, GA, HI, IA, ID, KS, KY, ME, MI, MO, MT, NC, ND, NH, NM, NV, OH, OK, OR, PA,
SC, SD, UT, VT, WA, WI, and WV. States could choose to be a member of one of the two
groups or could be members of both consortia. According to Education Next writers Jochim and
McGuinn, “In 2010, the PARCC and SBAC consortia reported having 26 and 30 member states,
respectively, representing diverse political environments. Only Alaska, Minnesota, Nebraska,
Texas, and Virginia declined to join by the end of that year. As of March 2017, many states had
dropped out of each of these consortiums and the remaining states, seven in the PARCC and 14
in the Smarter Balanced consortiums, are still utilizing the testing services of these companies”
(Gewertz, 2016). Only 32% of U.S. public school students live in states that are using the
federally funded PARCC or Smarter Balanced tests statewide to measure mastery of the common
core. This number is a significant percentage drop from only a year ago, when 46% of students
participated in these assessments (Gewertz, 2016). The remaining states either use a provider
that is something other than one of the federal grant approved trainers or they use a combination
of Smarter Balance and PARCC and other test development providers including local, state, and
Department of Education (Gewertz, 2016).
38
The PARCC and Smarter Balance took similar approaches in the design phase of
assessment development. According to Jochim and McGuinn, both companies sought to develop
state-of-the-art assessments that focused on problem solving and the application of knowledge
and moved away from former tests’ reliance on multiple-choice questions and the testing of
factual recall. The new assessments would be administered online using computers, reducing the
time needed to evaluate and grade results leading to enhancements to the timeliness and
usefulness of this information for teachers and school districts. Finally, both consortia
committed to transparent communication of student-achievement data to stakeholders (Jochim &
McGuinn, 2016). The development of the PARCC exam was based upon a mid-year assessment
and a final end-of-year assessment that would act as the measurement of comprehension of the
Common Core State Standards. The PARCC was developed to more accurately measure
comprehension of the Common Core State Standards in math and English Language Arts for
New Jersey students and is purported to be especially strong in the content and depth of the ELA
and mathematics assessments in Grades 5 and 8. The PARCC assessment was rated higher than
both ACT Aspire and the Massachusetts MCAS, the latter of which was previously considered
the leading assessment in the country (Doorey & Polikoff, 2106). Doorey and Polikoff (2016)
stated in their report that the PARCC was more accessible to students with disabilities and
English language learners than previous state tests. The accommodation of the IEP learner,
although taken into account in the new PARCC assessment, continued to face challenges in the
process of administration of the PARCC assessment in this student population subgroup.
PARCC math and ELA exams were developed to measure the career and college
readiness of students as compared to the cognition and comprehension of the ELA and
Mathematics standards as outlined by the Common Core State Standards. According to PARCC

39
and as outlined in Maroun (2018 p. 34), “the assessments are designed to achieve several
purposes including providing:
evidence to determine whether students are on track for college and career readiness,
provide the structure needed to access the full range of CCSS and measure the total
breadth of student performance and to provide data to help inform classroom instruction,
student interventions and professional development.”
To achieve these broad goals, PARCC developers had to have a clear understanding of
the Common Core State Standards as adopted by the states associated and aligned with Pearson
and the PARCC exam (Doorey & Polikoff, 2106).
In the development stages of the PARCC exam, Pearson and test developers started with
‘Master’ claims and then broke the Master claims into ‘Major’ claims and/or a subset of ‘Sub’
claims according to Pearson and PARCC guidance sheets (ETS; Pearson, 2016). The overall
Master claim for both ELA and math was that the students were “on track or ready for college
and careers” as indicated in the research and by the PARCC website. In the ELA assessment, the
‘Major’ claims were broken up the exam into reading and writing activities to be assessed by the
measurement tool. The claims outlined in ELA as five (5) sub-claims: three (3) in reading and
two (2) in literacy. The sub-claims indicated that in reading, the assessment would focus on
reading literacy text area, reading informational text area, vocabulary, and information as part of
the assessment (ETS; Pearson, 2016). In the literacy area, the two sub-claims were written
expression and conventions and knowledge of language measured by the PARCC ELA
assessment (ETS; Pearson, 2016). In mathematics, the Master claim transitioned into five sub-
claims ranging from ‘major content’ to ‘fluency in applicable grades.’ Each of these Major

40
claims were broken into sub-claims as evidence statements in each sub-claim area to further
outline the structure of the PARCC exam (ETS; Pearson, 2016).
Taking a closer examination at the PARCC ELA exam, the NJ Department of Education
(2018) stated that “PARCC is a more thorough academic measurement tool” as it is more
technology based, moving away from the old paper and pencil test heavily reliant on multiple
choice and true/false questions that were based in the rote memorization abilities of students.
The PARCC intention was to measure reasoning and higher order thinking skills of the students.
According to the PARCC Resource Center, unlike previous New Jersey assessments, PARCC
ELA allowed students to “read and analyze passages from real texts fiction and nonfiction and
sometimes watch video or listen to audio. They write, using what they’ve learned from the
passages and multimedia to support their arguments. These skills are critically important for
students in college and in the workplace” (Partnership for Assessment of Readiness for College
and Careers, 2018). This assessment was intended to more accurately measure the proficiency of
students to be successful in careers and college as they proceed through their schooling
experience.
Performance levels of the ELA were broken down into three areas: text complexity, range
of accuracy in expressing reading comprehension demonstrated in student responses, and quality
of evidence (Partnership for Assessment of Readiness for College and Careers, 2018). These
three areas were combined to demonstrate the ability of the students to read the text, develop a
solution or answer, and then support their argument, solution, or answer with appropriate
evidence. These comprehension and higher order thinking skills, intended to be developed by
following the new curriculum based on the CCCS and the measured success on the PARCC
exam, were designed to more accurately indicate the ability of students to be successful in

41
college or careers post high school.
PARCC exam results were intended to provide immediate and informative feedback to
schools, teachers, students, and parents to assist in shaping educational decisions. For schools,
the test results were used to shape curriculum decisions, adjust the delivery of unit content, and
allow for inspection of student academic growth from year to year. The individual student scores
were used to adjust individual educational plans for students based on the feedback results
broken into five different levels of proficiency. The Individual Score Reports (ISR) for students
focused on overall performance and then further as one of five performance levels in each tested
area. As cited in Petty (2018) and identified at the Department of Education website (2018), the
performance levels were as follows:
• Level 1: Did Not Yet Meet Expectations
• Level 2: Partially Met Expectations
• Level 3: Approached expectations
• Level 4: Met Expectations
• Level 5: Exceeded Expectations
These five performance levels were expected to more clearly outline to the students and
schools the current performance levels of the students on the questions formulated to assess the
comprehension of the Common Core State Standards. As Maroun (2018) stated in his research
study from Pearson (2016, pg. 193), the PARCC questions were designed “to elicit evidence
from the students that support valid and reliable claims about which they are college and career
ready or on track toward that goal and making expected academic gains based on the Common
Core State Standards (CCCS).”
Overall, the implementation of the PARCC assessment program was not without its
42
challenges and detractors. The exam faced both technical and political pressures since its
implementation in 2015. In the initial testing window, the examination was met with many local
technology issues and these deficiencies prevented schools from taking the test or having access
to the online assessment. Issues with the specification standards set forth by Pearson for the
testing devices were common experiences as students were unable to utilize some computers for
the online testing program. In addition to the technical issues, there was a strong political
opposition to the PARCC assessment and as previously stated, a large segment of the population
were opposed to the new test and thus refused to take the assessment. This opposition continued
to occur through the time period when the PARCC exam was used. To address the PARCC
opposition, some districts took the opportunity to educate schools, parents, and students about
the exam to better understand it and be less resistant to taking the PARCC. Furthermore, the
implementation schedule to account for using PARCC as a graduation qualification assessment
was delayed by the Department of Education. There are multiple paths to graduation as students
could use a number of other qualifying exams ranging from SAT and Accuplacer scores to the
submission of a portfolio assessment to the New Jersey Department of Education. These
pathways, along with additional options, were used to substitute for the requirement of PARCC
scores.
The following requirements were outlined for the classes of 2018 and future New Jersey
public school seniors. (Currently being addressed in the New Jersey court systems as of May of
2019):
“The Classes of 2018 and 2019 – Students graduating as members of the Classes of 2018
and 2019 could meet graduation assessment requirements through any of these three
pathways: (1) Achieving passing scores on high-level PARCC assessments; (2)
43
Achieving certain scores on alternative assessments such as the SAT, ACT, or
Accuplacer; or (3) The submission by the district of a student portfolio through the
Department’s portfolio appeals process. Special Education students whose
Individualized Education Plans (IEPs) specify an alternative way to demonstrate
proficiencies are required to continue to follow the graduation requirements set forth in
their IEPs” (NJDOE website, 2018).
The Class of 2020 – Students in the Class of 2020 can demonstrate graduation assessment
proficiency through the same three pathways as those in the Classes of 2017 through 2019,
provided that students in the Class of 2020 take all PARCC assessments associated with the
high-school level courses for which they are eligible and receive valid scores. As of the
September 6, 2016 effective date the amendments were adopted by the State Board of Education.
In 2018 the New Jersey Department of Education moved away from the title of PARCC
assessment, recommending to the State Board of Education a change for the Class of 2023 and
beyond that students would have two pathways to meet the high school graduation assessments
requirements: (1) Pass the newly adopted New Jersey Student Learning Assessments for ELA/L
10 and Algebra 1 exams; or submission by the district of a student portfolio through the
Department’s portfolio appeals process, assuming the student had taken all PARCC or NJSLA
assessments associated with the high-school level courses for which they were eligible and
received valid scores” (New Jersey Department of Education, 2018).
As expected with these challenges, there was an uphill climb to getting students
comfortable and motivated to take the exam in New Jersey as they had multiple methods to use
as a graduation requirement up until the class of 2023. The Class of 2023 was to be the first
class to be required to take the NJSLA as part of allowing them to graduate from their respective

44
New Jersey public schools. The funding stream provided to the PARCC consortium was
depleted from the federal Department of Education and the contract between the New Jersey
Department of Education and Pearson expired after the 2018 school year. The Department of
Education Commissioner, Dr. Lamont Repollet, formulated a test advisory committee made up
of school leaders, teachers, students, and members from the Department of Education to review
and develop options for future test assessment for public schools in New Jersey (Clark, 2018).
The local issue this advisory team faced was how to meet the requirements of the Every Student
Succeeds Act requiring that assessments were taken to “measure every child’s progress in
reading and math in each of Grades 3 through 8 and at least once during Grades 10 through 12”
(U.S. Department of Education, 2017; Repollet, 2018).
In 2018, the New Jersey Department of Education dropped the PARCC name and
adopted a new exam entitled the New Jersey Student Learning Assessment for the 2019 school
year. The State Board of Education approved this recommendation by the Education
Commissioner and additional modifications to the exam, and administrative aspects of the test
were implemented, but the content of the exam remained mostly unchanged from the 2018
PARCC assessments. In a number of NJ DOE broadcasts the Department of Education indicated
that additional assessment changes would be implemented in the future, although no specifics
have been outlined for public school districts across New Jersey.
Teacher Mobility
Teacher mobility has been a concern for school district leaders for many years; the ability
to retain district employees who are professionally trained and experienced educational
practitioners is a concern for district leaders. Each year across the nation, for a variety of
reasons, massive numbers of teachers leave their teaching position. The exodus of these teachers

45
can lead to a lack of continuity in schools and may have an impact on student academic success.
According to Vagi (2017), “a significant body of research has been devoted to
understanding the factors that are associated with a teacher leaving his or her school. These
factors can be grouped into three broad categories: characteristics of teachers, characteristics of
students, and school contextual factors.” The ability of a school superintendent to develop a
successful orientation program, developing school ownership in the teaching and learning
process, and a successful indoctrination process may lead to higher teacher satisfaction and less
teacher mobility. Research indicated finding the right fit for a teacher led to lower teacher
mobility rates. Researchers have identified that teacher mobility is higher among young and
older teachers as opposed to teachers who are middle-aged and in the middle years of their
employment (Barbieri et al., 2011; Elfers et al., 2006; Gilbert, 2011). This phenomenon was
attributed to the fact that mobility among young teachers often results from a mismatch with
either their initial teaching placement or their career choice, while mobility among older teachers
often reflects a decision to retire (Vagi, 2017).
As identified by Fullan (2006), organizational change takes time and persistence, a
clearly articulated vision, and a system-wide comprehensive plan and framework for continuous
improvement. A stable school leader can create these environmental conditions to allow for the
elements of Fullan to effectuate change and teacher stability leading to student academic success.
Anderson (2006) identified a key element to district success in the ability of the district
leadership and school level staff to develop a district-wide and school-level emphasis on
teamwork and professional community (including, in several cases, positive partnerships with
unions).
Factors leading to teacher stability and the ability to develop a strong sense of school

46
community among the educational professionals has led to a more stable district workforce. In
his examination of teacher mobility and student academic success, Sullivan et al. (2017) found
that there were significant positive correlations between teacher mobility and student academic
success on the Texas Assessment of Academic Skills (TAAS). School and district level teacher
satisfaction, as identified by teacher mobility, may have a significant impact on student outcomes
and overall district success in New Jersey public school districts. It was important to examine
the relationship between the teacher mobility rate and the length of tenure of the school
superintendent.
School District Superintendency: A Historical Perspective
The position of the public school superintendent has vastly changed from the early days
of public schools to its current incarnation relative to the recent changes in public school
accountability (Waters & Marzano, 2006; Plotts, 2011; Gianquinto 2012). “The American
school superintendency is an institution that is now over 150 years old. With the pressures and
demands from the educational community and public at large for high performing schools that
offer diversified curricular and extracurricular programs in the informational age, a series of
great challenges fall on the top leaders of the nation’s school systems” (Alborano, 2002). Along
with accountability changes, many other factors contribute to the ever-changing role of the
superintendent including recent changes to salary structure, changing political climates, and the
loss of public school superintendent longevity. It is for these reasons that research was examined
more closely as it relates to the success of public school districts and the students who are served
by these educational institutions. The constant evolution of the position, combined with a
significant increase in accountability measures, motivated this research and required a closer
look at the evolution of the district leadership position and the multitude of influences that have

47
both positive and negative impacts upon the successful fulfillment of the expected job
responsibilities.
In today’s educational environment, the role of district leader is one of many contending
roles that compete for the attention of the superintendent. Accountability and academic
outcomes are utilized to measure the success, or lack thereof, of the school superintendent. Job
performance is directly linked to the successful management of these competing forces. School
superintendents must now adapt and change the way they function on a daily basis. Throughout
this chapter, the researcher referenced the history of the responsibilities of the public school
superintendent and documented the transitions and emergence of the job responsibilities as the
accountability of public schools was more closely scrutinized. As a result of numerous
legislative changes in public education, the district leadership position has been forced to adapt
and change to address community needs and desires, in addition to the expectation of increased
success for student performance. The stability of the district leadership position is important to
overall success in program implementation in districts (Fullan, 2006) and shorter lengths of
tenure may have an impact on overall district success.
According to the New Jersey Association of School Administrators Executive Director
Richard Bozza, “It’s become a cottage industry, you don’t have stable permanent leadership and
what you have is a significant amount of turnover” (Katchmar, 2016). The constant turnover of
school superintendents leading to fewer average years of service to school districts (Finn,
McCord, 2017, pg.11) could lead to lower student performance as indicated in Waters and
Marzano and associated other studies as outlined in Chapter I and II.
Superintendent Salary Caps
Since 2011, New Jersey superintendents were required to follow an executive order

48
implemented by the governor of New Jersey and executed by the commissioner of education for
all public school superintendents in New Jersey that limits salary based purely upon school
district enrollment. The exceptions to this executive order were the largest public school districts
with more than 10,000 students, public charter schools, public special education, and county
vocational/technical schools who were not required to follow the outlined standards for salaries.
Numerous sources indicated that the salary caps have led to an exodus of experienced,
qualified superintendents from New Jersey to retirement or surrounding states that do not employ
this same salary-limiting regulation. According to an article in the Daily Record, “Some school
districts are finding it difficult to find qualified superintendents; fewer candidates are applying
for openings, experts say. In other cases, top bosses have moved across the border to
Westchester and other New York counties, where districts pay $100,000 above New Jersey’s
average superintendent salary of $152,000” (Kachmar, 2016).
Although often mentioned in media reports and discussed by state governors and
legislators, relatively few states—three, actually—have employed the use of salary caps as
evidenced by a recent study and survey conducted by the American Association of School
Administrators. According to the last 2017 salary survey conducted by AASA, there was a
decrease of superintendents surveyed being impacted by a state or legislative salary cap on
superintendents. As indicated in Table 7.13 from the 2016 survey, the percentage of impacted
superintendents was 6.4% of those responding. In the 2017 AASA survey, the impacted
decreased by 1.4% to an overall level of 5% indicated that salary caps have had a lower impact
on a superintendent’s ability to develop compensation packages without having the restrictions
of salary caps (Finnan & McCord 2016; Finnan & McCord, 2017).
As we explored the associations between the imposition of salary caps on school

49
superintendent longevity, we had to keep in mind that this was a local phenomenon limited to
specific states and superintendents, and the results of these caps on superintendent terms of
service could only be applied to the specific states or areas where caps were imposed and cannot
be understood to apply generally across the country. Across the United States, there are a very
limited number of states that have or are currently utilizing the practice of capping or limiting
superintendent salaries. New Jersey, New York, and Minnesota were among a limited number of
states that have historically utilized superintendent salary caps. According to the New Jersey
School Boards Association and the New Jersey Association of School Administrators, the result
of these imposed salary caps has been an increase in school mobility, a loss of experienced
school district leaders of up to 40% (Sitran, 2018), and a smaller candidate pool for open
positions. According to a 2017 article written by Deena Yellen from the NorthJersey.com
website, “Over 54.3% of the districts that responded to a 2014 study by the New Jersey School
Boards Association underwent a change in superintendents since the state salary cap went into
effect” (Yellen, 2017). Another associated impact in New Jersey would be in the increase in the
use of ‘interim’ superintendents across the state.
Many school districts with open leadership positions choose to fill these open chief
school administrator roles with temporary, former administrators who were retired and then
started careers as temporary fill-in administrators for up to two full years for school districts
searching for a new superintendent. As of 2015 in New Jersey, approximately 30 to 40% of
superintendents were practicing interim superintendents who were considered to be a contracted
service in the school district. Although they have all the legal responsibility and opportunity to
act as a regularly employed school superintendent, the reality is that they were temporary
employees who served the district for no more than two years, which often created a feeling of

50
instability within the district.
The lack of continuity may negatively affect long-term planning and goals setting as they
were legally mandated to leave the district after two years. According to Waters and Marzano
(2006), district stability and leadership matters and the implementation of salary restrictions led
to a reduction of experienced and stable superintendents heading New Jersey’s public school
districts.
Roles of the Superintendent and Impacts on Longevity
In the last three decades, the attention given to school accountability rose dramatically
because of the widespread concern about the quality of public education. “During the last
decade, the scope, complexity, and intensity of reforms have increased interest in large scale
systematic reforms” (Barnett, Ferrigino, et al., 2005). As a result of the increased interest in
reforming and improving public schools, superintendents were viewed as the instructional
leaders charged to implement widespread reforms and were held accountable for the outcomes of
the improvement activities. The superintendent’s role in providing leadership beyond the school
district was associated with political realities and professional responsibilities. In the political
framework, superintendents were commonly seen as public property (Blumberg, Blumberg,
1985; Kowalski, 1995; Kowalski, McCord, Petersen, Young, & Ellerson, 2011). Local taxpayers
who support public schools viewed superintendents as gatekeepers to the schools; the public face
of the district, and the view of the role of superintendent was one that shifted depending upon the
context of reviewer on how the position of superintendent was perceived. Although considered
public servants, many did not only see superintendents as public servants; they also viewed them
as public resources filling multiple roles within the school system (Kowalski, 1995). In this
light, many citizens believed that the responsibilities of the position extended beyond managing

51
the school district to include activities such as attending public functions and speaking publicly
at events and serving on the boards of various civic groups (Lober, 1993).
Understanding the multiple roles that must be fulfilled by the superintendent, the
increased intensity and attention to system-wide school reforms, and the ever-increasing fiscal
demands put upon local taxpayers, the role of superintendent became increasingly complex,
political, and demanding. These multiple factors, combined with a loss of job stability through
the loss of tenure in 1991, superintendent mobility increased and the average length of term of
service decreased over the past two decades (Giaquinto, 2011). The average superintendents’
longevity decreased by approximately 16 years from reported rates in the 1950s to the early
1980s and into the present times. The decrease is even greater in urban school districts.
With the combined forces of the public and business communities’ call for school reform,
and the high-stakes accountability of NCLB, the need for public schools to change their culture
and practices seemed inevitable. It became clear that school district leadership was a key to
effective school improvement and reform. But understanding organizational change takes time;
there exists a need for superintendent longevity (Renchler, 1992; Kowalski, 1995; Austermuhl,
2000; Alborano, 2002; Natkins, Cooper, & Alborano, 2002; Maritz, 2006, Fullan (2006),
Giaquinto, 2011). The resulting loss of longevity in the position of superintendent led to issues
with educational continuity and consistency. As superintendents entered a new school district,
they needed time to acclimate to the new environment, conduct needs assessments for the
districts and then work with key personnel as agents of change and reform through a
collaborative process so that change was sustainable and effective. Without the necessary time
to conduct these important tasks, improvements to schools districts were destined to fail. Rapid
turnover and lack of stability negatively affected a public school system (Kowalski, 1995,

52
Alborano, 2000; Cooper, et al., 2000, Kowalski, et al., 2011, Giaquinto, 2011 Petty, 2018). In
addition to the factors that affect school superintendent longevity identified in Alborano (2002),
including support for school construction and bonds in the district, levels of board intrusiveness
into the domain of the superintendent, whether the district was recently merged or not,
socioeconomic level of the district, as measured by the percentage of students on free or reduced
lunch support, the ethnicity of the superintendent (White or African American), and whether the
district hired an insider or an outsider as superintendent, schools became much more political in
recent years with the push for reduced tax burdens for residents, increased school curriculum
rigor, and overall national push for school reforms. This meant that a number of superintendents
survived shorter service time and the stable, long-term standing in a position was necessary to
make significant change happen (Alborano, 2002; Fullan (2006); Giaquinto, 2011).
With these combined factors and the institution of the New Jersey superintendent salary
caps, there was a continued reduction of the length of term of service for superintendents in New
Jersey school districts. Alborano (2002) asserted, “one can assume from the study that six years
is the median length of service. Understanding that this is an average number of years of service,
a number of superintendents survive less than that time, and that stable, long-term standing in a
position is necessary to make significant change happen.” This phenomenon created less
effective environments for school reform, as the educational leaders were not stable, long-term
participants in the reform efforts.
Superintendent Longevity Related to Student Achievement
Waters and Marzano (2006) conducted a meta-analysis of research on superintendents
and the following five questions were used to guide their analysis:
• What is the strength of relationship between leadership at the district level and average
53
student academic achievement in the district?
• What specific district-level leadership responsibilities are related to student academic
achievement?
• What specific leadership practices are used to fulfill these responsibilities?
• What is the variation in the relationship between district leadership and student
achievement?
• Is there a relationship between length of superintendent service and student achievement?
According to Waters & Marzano (2006), “the answers we found to these five questions
affirm the long-held, but previously undocumented, belief that sound school leadership at the
district level adds value to an educational system.” The researchers went on to identify, “Two
studies that were examined reported correlations between superintendent tenure and student
academic achievement. The weighted average correlation (corrected for attenuation) from these
two studies was .19 significant to the .05 level.” This finding supported the idea that
superintendent longevity does have a positive effect on school academic achievement. These
findings were in direct contrast to other research indicating there was a distanced and limited
impact on student achievement by extending superintendent continuity.
According to Bennett, Finn, and Cribb (1999), “The public school establishment is one of
the most stubbornly intransigent forces on the planet. It is full of people and organizations
dedicated to protecting established programs and keeping things just the way they are.
Administrators talk of reform even as they are circling the wagons to fend off change, or
promoting to outflank your innovations.” The perception of superintendent inefficiency,
considered the ‘blob’ from Bennett’s research as far back as 1987, was contradicted by Waters
and Marzano’s research indicating that an effective leader with clear goals and autonomy could

54
lead to positive impacts on student achievement and school district efficacy. Waters and
Marzano (2006) maintained, “certainly one could find examples of local school district
bureaucracies that stand in the way of efforts to improve students’ learning. Indeed our research
supports the assertion that not all superintendents’ behaviors produce a positive impact on
student achievement. However our research does not support Bennett’s broad-stroke
condemnation of superintendents, district office staff and school board members.”
The findings of Waters and Marzano (2006) indicated that with the proper setting and
clear expectations of responsibilities, “profound, positive impact on student achievement can be
achieved in school districts.” This research was the basis for this dissertation study on the
impact of school superintendents on school district successes.
Institutional Change
As the association between superintendent longevity and student academic achievement
was examined in this study, an accompanying review of the theories of organizational change
was conducted to investigate the needed conditions to implement effective programs. An
investigation on how to best implement educational policies and programs was essential as the
intention of this research was to determine if the time of service in a district had an influence on
effective change or could contribute to institutional fatigue. Researchers like Fullan, Burke,
Bolman & Deal, and others examined the process of organizational change and present relevant
and important theories as to the most effective methods of change. This research focused on the
work of Fullan’s Change Theory to frame the aspects of effective educational institutional
change. As described in Chapter I, Fullan’s Change Theory, “Theory of Action with Merit,” is
based on seven core elements: motivation; capacity building; learning in context; changing
context; a bias for reflective action; tri-level engagement; and persistence and flexibility in
55
staying the course (Fullan, 2006).
The research was focused on the relationships between the superintendent longevity and
resulting academic success and teacher stability, the core elements of Fullan’s theory that
concerned the ability of a superintendent to motivate staff members in a designated period of
time, engagement on multiple levels, and persistence and flexibility to stay the course, all of
which were impacted by the time of service of the school leader.
The ability to develop strong, trusting relationships is essential to begin building
instructional teams that possess a shared vision and mission. A way to provide for the
development of these important relationships is to have a continuous and clear message from
school district leaders. Once this is established, the central office teams can be professionally
trained on the district’s vision and can act as key stakeholders in the change process. One way to
effectuate change is to provide the institutional leaders with lateral supports to refocus the role of
mid-level central office staff to act as brokers, “cultivating the exchange of information and
expertise within and across schools, between schools and third parties, and between instructional
leaders working at the very top of the system and those running reforms from inside the school”
(Burch & Spillane, 2004, p. 4; Pfeiffer, 2015).
The lack of institutional consistency and constant turnover of school superintendents can
have a negative impact on district success (Velazquez, 2017, pg. 34; Pfeiffer, 2015). “Each
superintendent turnover affects student achievement because every superintendent has different
priorities or motives” Velazquez (2017, pg. 34). Frequent superintendent turnover can lead to
fractured program implementation and ineffective implementation of organizational change if
not immediate and “systemic reform could take five years or more, and the negative impacts of
high turnover could last even longer (Fullan & Stiegelbauer, 1991). According to Velasquez

56
(2017, pg. 35), “This, in turn, ultimately affects teacher and staff job satisfaction and staff morale
and ultimately impacts the culture of a school district and the schools that comprise it (Alsbury,
2008). However, existing literature offered little theoretical basis for the cultural impacts of
superintendent turnover (Grissom & Anderson, 2012).”
Research was ample in the area of superintendent longevity and its impact on
organizational change. The negative impact of inconsistent policies, changing missions and
visions, as well as ineffective short-term impacts of short-term superintendents had clear
negative impacts on institutional health.
For these reasons this research examined the relationship of superintendent longevity in
New Jersey, as impacted by superintendent salary caps, and the resulting outcomes of student
achievement and teacher mobility leading to school district success.
District Factor Groups
School districts in New Jersey were classified into District Factor Groups (DFG) since
1975 when the New Jersey Department of Education classified schools into categories based
upon a number of factors ranging from the socio-economic status of the residents located within
the district boundaries, the educational levels of the community, to population density and other
factors (New Jersey Department of Education, 2017). According to the New Jersey Department
of Education website (2017):
“The District Factor Groups (DFGs) were first developed in 1975 for the purpose of
comparing students’ performance on statewide assessments across demographically
similar school districts. The categories are updated every ten years when the Census
Bureau releases the latest Decennial Census data. Since the DFGs were created, they
have been used for purposes other than analyzing test score performance. In particular,
57
the DFGs played a significant role in determining the initial group of districts that were
classified as Abbott districts. Additionally, subsequent to the Abbott IV court ruling, the
DFGs were also used to define the group of school districts on which Abbott v Burke
parity remedy aid would be based.”
In the late 1990s the NJ Department of Education updated the formula to exclude
population density of the school district and included elements that were more closely tied to
socioeconomic status. Six factors were utilized to determine the DFG classifications using the
2000 census data. The New Jersey Department of Education used the percentage of adults with
no high school diploma, percentage of adults with some college education, occupational status,
unemployment rate, percentage of individuals in poverty, and median family income (New
Jersey Department of Education, 2017). Each decade the District Factor Group classification is
updated with the latest United States census data.
The research utilized school districts from all DFG categories for the sample and
examined the impact on district success by using multiple control variables including free and
reduced lunch percentages as a socioeconomic control variable in this research study.

58
School District Report Card / School Performance Report
In New Jersey numerous reports were available to review and assess the success of public
school districts with data in multiple areas including the Department of Education’s published
School Report Card, now entitled the School Performance Report. The New Jersey Department
of Education organized and compiled information from a number of New Jersey state reports
including the certificated staff submission, statewide assessment results from each school and
district, and a number of additional data points using the new student tracking system NJ
SMART. These annual reports were designed to take specific school district data and organize it
in a manner that the community could review and assess the success of each school and district
within New Jersey. The development of the reports were a direct result of the call to increase
accountability in districts while providing transparency through the attainment of educational
progress of the students who were served by school districts across New Jersey. In his 1988
State of the State Address, then Governor Thomas Kean proposed an annual report (Van Tassel,
1989, p. 12) to be developed in New Jersey to collect school data and publish it for public
review. The reports were to be used by parents and community members to evaluate how
schools in their neighborhoods were doing compared to others in the local area and across the
state. According to Governor Kean, “We happen to believe the more parents know, the more
involved they can be; this is a way to arm them with that knowledge” (Van Tassel, 1989, p. 12).
The expansion of accountability was evident in this report and according to Sal Cooperman, the
New Jersey Department of Education commissioner at the time, “With knowledge, hopefully,
will come the ability to act intelligently to improve the schools” (Van Tassel, 1989, p. 12).
Initially, the School Performance Reports were not universally accepted, as there was opposition
to the idea of reporting statistics on public schools because of the fact that this data could have
59
been used to cast an unfavorable picture of local schools.
As a result of the implementation of a new reporting procedure, some felt it was unfair to
compare schools that were not on even socio-economic grounds. “Karen Joseph, a
spokeswoman for the New Jersey Education Association in February 1989, said it was time to
quit reporting and to act more aggressively to improve schools” (Associated Press, 1989). She
went on to say, “Regardless of the positive attitude the governor and commissioner seem to be
putting forth, they’re still going to be comparing a Camden to a Livingston,” (Associated Press,
1989). In addition, opposition came from the leadership of school districts across the state.
James A. Moran, executive director of the New Jersey Association of School Administrators,
which represented the state’s public school superintendents, said, “We don’t believe it will do
good for the students of New Jersey or the school districts” (Hanley, 1989). In the 2013–14
school year, the Department of Education developed and approved a new school performance
accountability report aptly named the School Performance Report. This report replaced the New
Jersey School Report Card that had been used in New Jersey since 1995. This report was
utilized to collect district specific data to complete this research.
Summary
As identified in previous chapters and throughout the literature review, the role of school
superintendent is constantly evolving. Understanding the ever-changing role of superintendents,
and the increased accountability for school districts and instructional leaders, it is very important
to create a learning environment that has effective academic program assessments,
implementation, and evaluation. According to Mendoza-Jenkins, (2009), “The superintendent
position has transitioned from managerial-focused position to one focused on instructional
leadership. As a result, it is critical that system leaders have both the skill set and knowledge

60
base necessary to direct multi-dimensional, district wide action towards a single objective:
improving student achievement” (The Superintendent and Reform: A Case Study of Action by
the System Leader to Improve Student Achievement in a Large Urban District, Mendoza-
Jenkins, 2009, pg. xi). Understanding this shift in position over the past fifty years, the position
of superintendent continues to be one in which there are multiple responsibilities including
acting as the chief educational officer of the district, facilities planner, budget developer,
community outreach coordinator, and a plethora of other daily responsibilities. In review of
these responsibilities, it was concerning that there has been a mass exodus of school district
leadership from New Jersey since 2011 because of a number of collaborative factors mainly
focusing on working conditions and salary cap restriction imposed by the State of New Jersey
Department of Education.
For program implementation, a stable and consistent school leader is essential.
According to Fullan (2006), the key steps to effective program implementation includes step
seven that outlines “persistence and flexibility staying the course” (Fullan, 2006). A key aspect
of step seven would be to have a superintendent with longevity in the district leadership position.
On average, according to a number of studies including Fullan (2006), organizational change
could take a minimum of two to three years and in many cases a longer period of time.
Understanding that the longevity rate of superintendents at this time is less than five years (Kolu,
2014), the impact on effective educational programming may be affected.
Focusing on the work by Waters and Marzano’s School District Leadership That Works:
The Effect of Superintendent Leadership on Student Achievement, a working paper (2006), this
research was an extension of a key finding that superintendent longevity had a positive
correlation to student academic success. It was imperative that this relationship be further

61
examined to assess the strength and direction of this relationship. Superintendent longevity and
leadership continuity could be a large contributor to creating a positive and effective academic
environment.
In New Jersey, superintendent salary caps, increased regulations, and the call for public
school accountability were factors contributing to the exodus of experienced superintendents
across the state. The loss of experience and stability among school district leadership was an
important and concerning topic in this research and the decreasing superintendent length of
service also contributed to the positive or negative nature of the educational environment.
This subject of superintendent longevity connected to school district success became of
utmost importance to the stability of our public schools across the State of New Jersey. The
possible impact of the district leader on district success was an important and essential question
that deserved further introspection and examination.

62
Chapter III
Methodology
The purposes for this correlational, explanatory, cross-sectional study were to examine
the association of superintendent longevity and continuity on district level student achievement
and faculty mobility. Through this process was the examination of the length of service for a
school district leader and how it influenced district level student assessment scores on the
PARCC exam and faculty mobility rate at the district level for traditional school districts in New
Jersey that included kindergarten through Grade 12. The dependent variables of Grade 5 ELA/L,
math, Algebra 1, and ELA/L 10 PARCC scores for the 2017 assessment year in addition to the
2017 district faculty mobility rate for the sample school districts were utilized as the measures of
district success for the purposes of this research. As explained previously, researchers indicated
that many factors influence school districts success.
For this study, a multiple regression statistical analysis was used to examine the strength
of relationship between the predictor variables of superintendent longevity in a school district
and overall service time as a superintendent in New Jersey on the multiple outcome variables in
the academic realm using the PARCC assessments, and an additional measure of district stability
by using the outcome variable of faculty mobility rate. Understanding the limitations in the
research having used state based geographical boundary, all New Jersey kindergarten through
Grade 12 school districts utilized had seated, annually contracted school superintendents and not
interim titled superintendents. Using all statewide K–12 schools, the research sample reached
across regional and socioeconomic lines as all DFG schools allowed access to identify
differences between these sample school districts. This method of selecting all K–12 school
districts allowed a more complete review and comparison by school boards and school district

63
leaders as they attempt to understand the relationship of superintendent longevity and school
district success.
Research Questions
The following five (5) research questions guided this study:
1. What is the relationship between New Jersey public school superintendent longevity and
student achievement as measured by Spring 2017 Partnership for Assessment of
Readiness for College and Careers (PARCC) Grade 5 math when controlling for school
and student characteristics?
2. What is the relationship between New Jersey public school superintendent longevity and
student achievement as measured by Spring 2017 Partnership for Assessment of
Readiness for College and Careers (PARCC) Grade 5 English Language Arts/Literacy
when controlling for school and student characteristics?
3. What is the relationship between New Jersey public school superintendent longevity and
student achievement as measured by 2017 Partnership for Assessment of Readiness for
College and Careers (PARCC) Algebra 1 when controlling for school and student
characteristics?
4. What is the relationship between New Jersey public school superintendent longevity and
student achievement as measured by Spring 2017 Partnership for Assessment of
Readiness for College and Careers (PARCC) English Language Arts/Literacy 10 when
controlling for school and student characteristics?
5. What is the relationship between New Jersey superintendent longevity and district faculty
mobility as evidenced by the 2017 School Performance Report faculty mobility rate
percentage when controlling for school and student characteristics?
64
Research Design and Methods
This research study used a non-experimental, exploratory, cross sectional design with
quantitative methods. Data collection procedures for this quantitative research were conducted
by a thorough and complete review of local, regional, and state reports directly related to New
Jersey public school district performance. Annually, all New Jersey public school districts are
required by the New Jersey Department of Education to complete data reports related to
attendance rates, PARCC test scores, suspension rates, faculty/staff mobility rates, and a number
of additional data points. School districts must also complete a number of demographic reports
including, but not limited to race, socio-economics, educational program placement, student
district enrollment history, ethnicity, and numerous other demographic data points. These public
Department of Education reports were used to collect outcome variable data points of PARCC
exam scores and school district faculty mobility percentages. The specific data points were
collected from the School Performance Report and PARCC score report for each selected school
district. The outcome variable grade level examined were the school district level PARCC
scores of students enrolled in Grades 5, 9 and 10. The School Performance Report was utilized
to collect each sample school district’s faculty mobility rate as this information is required to be
reported annually by New Jersey public school districts. School district profiles and additional
state educational reports were utilized to confirm the data points used in this study. The New
Jersey Department of Education annual Staff Report, Data Universe, and APP.com were
reviewed to collect information on superintendent longevity in a school district and overall
experience as a superintendent in New Jersey. Other local, state, and national professional
organizations (i.e., county Department of Education, New Jersey Association for School
Administrators, American Association of School Administrators) have developed data sets

65
directly related to salary levels, benefits of superintendents, longevity in the position, as well as
additional superintendent demographic data important to this research. These professional
associations were referenced when collecting the information needed to conduct this research.
All data points were entered in a comma separated value method into a simple excel
spreadsheet to organize the data points for eventual entry into the SPSS statistical program for
analytical purposes. Specific data to be reported for the predictor variable of superintendent
longevity were the years of continual service to the current school district and years of service of
each superintendent in New Jersey. Outcome variable data examined included the 2017 district
faculty mobility rate, 2017 PARCC assessment scores for Grade 5 ELA/L and math, and Grade 9
Algebra 1 and Grade 10 English Language Arts/Literacy in New Jersey Public School districts.
In addition to these outcome data points, additional district level demographic data were
collected, including free and reduced lunch percentage, faculty education levels, English
Language Learner percentage, teacher attendance rates, percentage of chronic absenteeism and
other demographic information during the 2017 school year from the sample districts for each
K–12 public school district across New Jersey with contracted superintendents.
The data were entered into and analyzed using the SPSS statistical software program. A
non-experimental explanatory multiple regression statistical analysis was utilized to examine any
statistically significant relationships between the independent variable of superintendent
longevity in the school district and overall experience and the outcome variables of the school
district level student academic performance as evidenced by scores on the 2017 PARCC exams
for Grade 5, Algebra 1 and ELA/L 10 assessment scores for enrolled students of the sample
public school districts and the district faculty mobility rate for the 2017 school year. As
previously identified, the control variables entered into the regression statistical analysis were the

66
2017 free and reduced lunch percentages, district free and reduced lunch percentage, district
student chronic absenteeism percentage, district special education percentage, district English
language learner percentage, district faculty attendance percentage, district faculty with advanced
degrees percentage, and chronic absenteeism percentage for the sample kindergarten through
Grade 12 school districts.
This study focused on relational associations of superintendent longevity and district
academic performance as identified by Waters and Marzano (2006) and further researched by
Glass & Franceschini (2007), Mendoza-Jenkins (2009), Giaquinto (2011), Plotts (2011), Petty
(2018), and other similar studies conducted to examine the educational impact of the
superintendent on student success. This research examined the length of tenure of
superintendents within the school district as a measure of district effectiveness or ineffectiveness
as identified by Graziano (2012) in her research studying the effect of faculty mobility rate on
HSPA scores of New Jersey public schools. In reviewing research involving superintendent
longevity and school district success, limited research specifically focused on the relationship
between superintendent longevity and school district success as evidenced by resulting state
assessment scores and overall district faculty mobility rate. The meta-analysis by Waters and
Marzano (2006) indicated a statistically significant relationship between superintendent
longevity and student success and for these reasons, this non-experimental study focused on the
longevity of the district superintendent and the relationship of this variable on district academic
scores for the PARCC and faculty mobility rates of the district. This research was non-
experimental as it focused on an educational research problem in regards to superintendent
longevity and its possible resulting educational impacts.
This research focused on any identified statistically significant relational associations

67
between the length of service of the superintendent and the PARCC scores and faculty mobility
percentage rate as reported in the district level School Performance Report during the 2017
school year.
Sample
The research sample for this study was limited to the public school districts located
within New Jersey. In addition, only kindergarten through Grade 12 school districts were used
as the sample selection for this research. Each of the New Jersey public school districts must
have administered the 2017 PARCC ELA/L and math exams in Grade 5, Algebra 1, and the
English Language Arts/Literacy 10 to the required student populations at each of the district
schools during the data sample period. Each school district must have had valid student and
district score results for the 2017 PARCC Grade 5 ELA/L and math, Algebra 1 and ELA/L 10
assessments reported to the New Jersey Department of Education for each public high school in
the K–12 school district.
Additionally, this research focused on each of the sample district’s state reported 2017
faculty mobility rate as a secondary measure of school district effectiveness. In the 2016–2017
school year there were 590 operating school districts across the state that ranged from regular
operating public schools to charter schools and schools for disabled students. Of the 590
districts, 218 of these New Jersey public school districts were organized in a kindergarten
through Grade 12 format (New Jersey Department of Education, Public School Fact Sheet,
2017). This grade configuration allowed for the selected outcome variable data that were
focused on in this study. On an annual basis, the New Jersey Department of Education posts the
scores for each school district on the New Jersey PARCC Score Reports at the Department of
Education website and through the New Jersey School Performance Report. This research

68
focused on the 218 kindergarten through Grade 12 school districts (New Jersey Department of
Education, Public School Fact Sheet, 2017; Rutgers University, New Jersey Data Book, 2019)
that are regular operating public schools within New Jersey. Sample school districts eliminated
were charter, magnet, and schools for disabled students because of the student population not
being a heterogeneous district boundary established student sample The 218 schools selected for
this research were all school districts within New Jersey that educate kindergarten through Grade
12 students in a regular operating district format. All district factor group (DFG) school districts
were included in the study sample so that there was a complete cross section of school district
DFGs from A to J and regional differences are addressed by sampling from the north, central,
and south region of the state.
Instrumentation
This study examined the association between the overall number of years a
superintendent served a specific school district and the identified school district’s measurements
of success. The final percentage of students who achieve proficiency on the PARCC assessment
for the school district was utilized as the main academic indicator of success for the school
district. An additional measurement of school district stability was indicated to be a lower
percentage for the faculty mobility rate of the sample school districts. During the 2017 school
year, the minimum score of 750 on the PARCC exam was considered proficient. This PARCC
score was used as the qualifying numeric minimum score used for a measurement of success for
the purposes of the research. The PARCC has been the New Jersey assessment exam since 2015.
The PARCC was developed to measure the competency and comprehension of students’ success
on the New Jersey State Board of Education approved New Jersey Student Learning Standards
and the previous standards called the Common Core Curriculum Content Standards. All students
69
in New Jersey were expected to take the state assessment including general education students,
special education students, English Language Learners, and all levels of socio-economic status
students in the public school system. School districts were permitted by the federal Every
Student Succeeds Act and New Jersey Department of Education regulations to have up to 1% of
Individualized Educational Plan students exempted from this required testing program. The
2017 test administration method included one exam administered in the Spring to all Grade 3
through Grade 11 students. This exam was utilized as a culminating assessment of the New
Jersey Student Learning Standards.
The results of this assessment can be used to improve classroom instruction, to assess the
comprehension of standards by students and the development of academic interventions. Overall
assessment data may assist with shaping and developing school and district wide professional
development plans. There were no state Department of Education graduation requirements to
pass the exam through the 2017 year. Understanding there were no requirements to take and
pass the exam during these years, the Department of Education did establish baseline scores and
minimum passing scores on the Grade 5 ELA/L, math, Algebra 1, and ELA/L 10 exam.
As identified in this chapter, the minimum passing scores were determined to be 750 by
the New Jersey State Department of Education. This research used this passing score and the
overall percentage of students reaching the proficient level as a measure of student academic
success in each school district.
Reliability
Reliability is the ability of the assessment tool to provide test score scales that are
consistent in measuring the success of comprehension (levels of understanding) of the intended
targets skill sets it is developed to assess. A high reliability indicates that the results of the test

70
are consistent and repeatable in measuring the true differences in student comprehension levels
rather than score fluctuation that is a result of chance. The PARCC is a nationally developed
criterion referenced exam developed by Pearson Education that was administered to all students
in Grades 3 through 11, except those exempted by the Individual Educational Plans, and seniors
who successfully achieved the minimum basic passing score as juniors. According to Petty
(2018) in his research of a principal’s impact on local test scores, “There are many ways of
estimating reliability. The type reported in Person’s Final Technical Report for 2016
Administration was an internal-consistency measure. This measure was derived from analysis of
the consistency in the performance of individuals across items within the test.” According to the
2017 PARCC Score Technical Report for the PARCC English Arts/Literacy, “The average
reliability estimates for the CBT tests for Grades 3 through 11 ELA/L range from a low of .91 to
a high of .94. The average reliability estimates for the PBT tests for ELA/L Grades 3 through 11
ranges from a low of .86 to a high of .94. The tests for Grades 3 through 5 have fewer maximum
possible points than for the Grades 6 through 11 tests. The average reliability estimates are at
least .90 except for Grades 4 and 5 PBT tests, which are .88, and Grade 11 PBT, which is .86.
The average raw score SEM is consistently between five to six percent of the maximum possible
score.” The 2017 PARCC math reliability “The average reliability estimates for the Grades 3
through 8 mathematics assessments range from .90 to .94 for the CBT tests and from .86 to .93
for the PBT tests. Most of the average reliability estimates are above .90 except for two PBT and
one CBT. The raw score SEM consistently ranges from four percent to six percent of the
maximum score.” The high levels of reliability (over .86) as outlined in the 2017 PARCC
Technical Report indicate a consistency of the PARCC scores to measure, in a repeatable
manner, the comprehension of the New Jersey Student Learning Standards and the former
71
Common Core State Standards.
Validity
Validity is different from reliability in the fact that it is not examining the ability of the
assessment tool to produce consistent and repeatable scale scores, but rather examining if the
assessment tool developed is accurate in measuring the comprehension levels of the students of
the NJSLS and CCSS as intended by the PARCC developers. According to the 2017 PARCC
Technical Report, “The Standards for Educational and Psychological Testing, issued jointly by
the American Educational Research Association [AERA], American Psychological Association
[APA], and National Council on Measurement in Education [NCME] (2014) reports:
Validity refers to the degree to which evidence and theory support the interpretations of
test scores for proposed uses of tests. Validity is, therefore, the most fundamental
consideration in developing tests and evaluating tests. The process of validation involves
accumulating relevant evidence to provide a sound scientific basis for the proposed score
interpretations (p. 11). The purpose of test validation is not to validate the test itself, but
to validate interpretations of the test scores for particular uses. Test validation is not a
quantifiable property but an ongoing process, beginning at initial conceptualization and
continuing throughout the lifetime of an assessment.”
PARCC developers took a number of precautions to increase the validity of the exam
from annual field testing of PARCC test question items to continuous collection of feedback
from students, staff, test coordinators, and administrators about testing issues, concerns, and the
online testing format. The PARCC test was intended to measure the ability of a student to be
successful in college or a career by the proficient completion of the PARCC exam by achieving a
score of 750. According to the 2017 PARCC Technical Report, “The PARCC determined that
72
this level means graduating from high school and having at least a 75% likelihood of earning a
grade of “C” or better in credit-bearing courses without the need for remedial coursework.” The
PARCC assessment annual report review indicates validity of the assessment to measure college
and career readiness by showing a “high total group internal consistencies as well as similar
reliabilities across subgroups provide additional evidence of validity. High reliability of test
scores implies that the test items within a domain are measuring a single construct, which is a
necessary condition for validity when the intention is to measure a single construct” (New Jersey
Department of Education; PARCC Technical Report, 2017).
It is for these reasons the study focused on using the PARCC assessment at different
grade levels in K–12 the sample school districts to produce a valid measurement of academic
success in a school district.
Variables
The outcome/dependent variables for this research were the district level New Jersey
PARCC assessment scores for the Grade 5 ELA/L, math, high school Algebra 1, English
Language Arts/Literacy 10 exams, and the district faculty mobility rate for the K–12 school
districts in the research sample. The assessment year used for this research was the Spring 2017
assessment of the PARCC exam for New Jersey public school districts selected as the research
sample group. A secondary measure of district stability and success utilized as an outcome
variable for the purposes of this research was the 2017 faculty mobility rate of the school
districts sampled. The district faculty mobility rate was measured by the percentage of teachers
arriving and/or leaving the school district during the 2016–2017 school year.
Focused on Waters & Marzano’s meta-analysis of 27 different studies, additional
research work from Alborano (2002), Glass & Franceschini (2007), Mendoza-Jenkins (2009),

73
Plotts (2011), Giaquinto (2011), Petty (2018), and others, this study focused on the association
between superintendent longevity and the outcome variables of student academic achievement.
A secondary relational analysis was conducted during this research examining superintendent
years of service in the district (longevity) and the 2017 school district faculty mobility rates as
reported by the School Performance Report for all kindergarten through Grade 12 New Jersey
public school districts.
The PARCC exam was the New Jersey Department of Education mandated assessment
required to be administered in each of the selected sample high schools in New Jersey. For this
reason the focus on the four academic outcome variables of Grade 5 ELA/L, math (Grade 5
being the culminating grade of the primary school educational experience), Algebra 1, and
ELA/L 10 as the high school assessments were selected. The high school assessments were
chosen for this research as they were the New Jersey Department of Education required high
school graduation exams for the class of 2021. In 2018, the graduation regulations faced a legal
challenge as the sole graduation requirement in New Jersey and the PARCC exit exam
requirement was struck down by the state appellate court. The New Jersey Department of
Education considered its options and informed the public school districts that the spring 2019
NJSLA assessment would continue to be administered as planned. Although prior to 2021, there
are a number of graduation exit exam options, the New Jersey Department of Education
determined that students who successfully passed the Algebra 1 and ELA/L 10 possessed the
college and career ready skills to be successful at the next level of their schooling or employment
without further remediation. As referenced previously, the Pearson PARCC manual, as stated in
Maroun (2018), the PARCC assessment outlines “the academic knowledge, skills, and practices
students must demonstrate to show readiness for success in entry level, credit-bearing college

74
courses, and relevant technical courses” (Pearson, 2016, p. 120; Maroun, 2018, p. 64).
All data points and variables used in this research were collected and aggregated by the
Department of Education and published in multiple public reports including the PARCC
Assessment Score reports (https://www.nj.gov/education/schools/achievement), the School
Performance Reports (https://rc.doe.state.nj.us), the New Jersey Staff Submission Report
(https://www.state.nj.us/education/njsmart/staff/staff), Data Universe
(https://php.app.com/agent), and data mined at the New Jersey Department of Education website
(https://www.state.nj.us/education).
Analysis of Data
This researched used publicly available data and did not utilize human subjects so it did
not need a pre-research approval by the Institutional Review Board (IRB) of Seton Hall
University. The data were analyzed using SSPS software and statistical methods consistent with
previous studies of superintendent longevity and academic achievement as outlined in previous
research by Waters and Marzano (2006), Alborano (2002), Plotts (2011), Giaquinto (2011), and
Petty (2018). The data were mined from a number of authentic sources ranging from the New
Jersey Department of Education (New Jersey School Report Card and the New Jersey
Certificated Staff Report), Data Universe, and the New Jersey Association for School
Administrators. The data were organized in an excel spreadsheet for review and cleaning of the
data prior to importing the data sets into SPSS. All school districts (219) were reviewed with 14
school districts being eliminated from the sample because of incomplete data points. The
remaining 205 school districts were reviewed to determine if there was an interim superintendent
during the 2016–2017 school year. As a result of this examination an additional 16 school
districts were eliminated from the data sample leaving 189 sample school districts for analysis.

75
The variables were analyzed using a variety of methods including a descriptive analysis,
descriptive exploratory, frequency analysis, correlational bivariate analysis, and multiple
regressional analysis. These statistical analysis methods were used to measure the strength of
relationship between the predictive variables of years of service as a superintendent in a school
district and overall years as a superintendent to the dependent variables of district level PARCC
Grade 5 ELA/L and math, Algebra 1 and ELA/L 10 scores, and the district faculty mobility rate.
The five research questions were evaluated via continuous multiple regression analyses
examining the correlational relationships between the independent variables of superintendent
years in district and total number of years as a superintendent, and the dependent variables of
PARCC scores and teacher satisfaction as evidenced by the district teacher mobility rate.
Control variables included in this research were 2016–2017 free and reduced lunch percentages,
district free and reduced lunch percentage, district special education percentage, district English
language learner percentage, district faculty attendance percentage, district faculty with advanced
degrees percentage, and chronic absenteeism percentage reported by the district School
Performance Report. The collected data were aggregated into units based on predictor variables
(length of service in the district as superintendent and overall years as a superintendent) and
outcome variables (district level 2017 PARCC Grade 5 ELA/L and math, PARCC Algebra 1 and
ELA/L 10 scores, and district level faculty mobility rate) collected from various federal, state,
and local resources and reports. The elements of the data sets were titled and coded to align with
each of the five research questions in the study. The data were reviewed to identify any
similarities or themes based upon the assigned codes as it was entered into the data recording
sheets. Once any statistically significant relationships were identified by the regression analysis,
these results were examined in relationship to the outlined research questions. The data from the

76
various sources were to be downloaded into a Microsoft Excel spreadsheet in the “comma
separated value” format allowing for the disaggregation of the data. The data were analyzed in
response to each of the research questions. The main data analysis was completed using the
Statistical Package for Social Sciences (SPSS). Demographic information was collected from
the 218 school districts in the sample with the understanding each sample school district must be
a kindergarten to Grade 12 school district. As previously outlined, in the demographic
information reviewed from each school district a number of control variables were included in
the statistical analysis. Each sample district’s superintendent employment status was considered
and designated whether the superintendent was a regularly employed superintendent or an
interim temporarily assigned superintendent. If the New Jersey school district was employing an
interim superintendent, the district was eliminated from the K–12 sample district population for
this study.
The following steps were utilized to analyze the data:
1. The data were imported from an excel spread sheet that was reviewed to remove the non-
qualifying sample districts. Sample cleaning included removing districts with incomplete
data sets and districts with seated interim superintendents during the 2017–2017 school
year. The spreadsheet contained the independent and dependent variable for this cross
sectional correlational study. The independent variables were superintendent years of
service in a district and superintendent total years of service. Dependent variables
outlined were 2017 PARCC scores for Grade 5 math and ELA/L, 2017 PARCC Algebra
1, 2017 PARCC Grade 10 ELA/L, and the 2017 faculty mobility rate. All were properly
aligned with identifiable titled columns.
2. A descriptive analysis was conducted with all the continuous variables to examine and

77
determine the maximum and the minimum variable levels, the established mean for each
variable, and the standard deviation for each continuous variable.
3. The variables were then analyzed using a descriptive exploratory method analysis to
establish whether the variables met the assumption of normality and to examine any
skewness of the data set variables assuming the range of normality is from -1 to 1.
4. A two-tailed Pearson bivariate correlational analysis was conducted on the independent
and dependent variables to examine the strength and direction of the relationship between
the independent and dependent variables as outlined.
5. Using the independent variables of superintendent experience in the district and total
years as a superintendent, a simultaneous multivariate regression analysis was conducted,
which included a correlational analysis examining the standardized coefficients (beta).
This analysis provided the strength and direction of variable relationships and the
significance of the impact of the independent variables.
6. This process was conducted for each of the independent variables on the dependent
variables selected for this research. Also included were control variables as outlined
previously in the methods section of this chapter.
7. A multivariate diagnostic was used to examine collinearity between the independent
variables by running a variance inflation factor (VIF) analysis. The resulting table was
examined for a VIF score of above 4.000 suggesting a potential threat to statistical
analysis interpretation.
8. A number of simultaneous multiple regression models were run utilizing the independent
variables impact on our dependent and control variables. Each model was examined to
determine the best fit model that predicts the impact of superintendent experience on the

78
academic outcomes of PARCC testing in Grade 5, Algebra 1, ELA/L 10, and district
employee satisfaction as measured by the teacher mobility rate for public school districts.
Each model analysis also examined the impact of the control variables on the outcome
variables of academic success and teacher mobility.
9. The best fit models were reviewed to determine if there was linear strength present on the
scatterplots and if there were any significant relationships as a result of the simultaneous
multiple regression analysis. The confidence interval of .05 was determined to be the
threshold for significance and the models were examined to determine if the relationships
between variables were significant at the 95% confidence level for each model.
Summary
Chapter III described the rationale for this research, including the statement of the
problem that the research focused upon during the study. This chapter outlined the steps to
complete the study, the research questions, research methods and design, sample size and
designation of participants, the methods used to mine the relevant data, what statistical analysis
was utilized and what the independent and dependent variables were identified for the study.
PARCC was selected as the academic outcome variable because of its widespread administration
in all public schools in New Jersey. The PARCC exam supplanted the High School Proficiency
Exam (HSPA) which was used by the Department of Education as the graduation requirement
from 2002 until 2015. PARCC was replaced by the NJSLA for the 2019 school year. The
research focused on the 2017 primary Grade 5 PARCC exams, Algebra 1, and English Language
Arts–Literacy 10 exams as they were designated by the New Jersey Department of Education as
the thresholds students needed to successfully complete to graduate.
The association and relationship between superintendent longevity and district level

79
student success and faculty mobility rate as a measure of district success needed to be examined
more closely as the public accountability of school districts increased with the new federal Every
Student Succeeds Act and the revised New Jersey Department of Education QSAC monitoring
process. Superintendents are considered district decision makers and the decisions and choices
they make each day have a direct impact educational programming. This study built upon the
limited research in the area of district leadership’s impact on specific measures of district
success. As Waters and Marzano (2006) identified in their meta-analysis, School District
Leadership that Works: The effect of superintendent leadership on student achievement,
“research increasingly points to the relationship between effective leadership and increased
student achievement.” It is for these reasons that this research focused on the relationship of
superintendent longevity on student academic achievement and faculty stability in New Jersey
public school districts.
This non-experimental, exploratory, cross sectional, quantitative research study utilized
the SPSS data analyzation tool to conduct a multiple regression model analysis for the data
points collected from various public data resources as outlined in this chapter. The results of this
study will build upon previous research by Waters and Marzano (2006), Alborano, (2002), Glass
& Franceschini (2007), Mendoza-Jenkins (2009), Plotts (2011), Giaquinto (2011), Petty (2018),
and limited other research papers focusing on the longevity of a superintendent and impacts on
student academic performance and faculty mobility and stability. This information will be useful
to school district administrators, school boards of education, and numerous local, state, and
national associations that support school districts and employees as they strive to achieve
improved student academic success. Additionally, the results of this study may provide valuable
insights on the impact and relationship of school district leadership stability, and the stability

80
created within the faculty ranks of each district used as a sample and selected academic measures
of district success.
Furthermore, this study can be used as a basis to further examine the long-term effect of
superintendent stability on school district success as the research in this area is limited and
should be explored in a more in-depth manner to determine new policies, procedures, and
hiring/firing practices.

81
Chapter IV
Analysis of the Data
The position and responsibilities of the public school superintendent has evolved
tremendously over the past 100 years. Initially considered a position of organizational
responsibilities, management, and implementation of state and local curricula, the position has
become one of diversity having responsibilities across the entire educational spectrum including
political and community outreach activities. With added responsibilities, the push for public
school reform and constant call for school improvement came a significant increase in
accountability for student and school district success. The superintendent, acting as the chief
educational officer, has inherited the responsibility to assure the community that the schools are
highly functioning and students are afforded opportunities to succeed as they transition out of K–
12 educational experiences and into higher education, the armed services, or a vocation.
School district leaders are no longer able to have a singular focus of student achievement,
as the 21st century school leader must be a multidimensional community leader who is an expert
in matters of curriculum, budget, human resources, community activism, and a plethora of other
district leadership responsibilities.
Purpose of the Study
The purpose of this research study was to build upon the research by Waters and
Marzano (2006) and Fullan (2006) examining the impact of superintendent longevity and
continuity on district level student achievement and faculty mobility at the school district level.
This research examined superintendent years of service in a school district and success measures
of district level 2017 PARCC Grade 5 math and English Language Arts/Literacy scores and
PARCC Algebra 1 and English Language Arts/Literacy scores in addition to district level faculty
mobility rates as reported on the 2017 School Performance Reports.

82
This chapter contains an overview of the process and procedures for a non-experimental,
exploratory, cross sectional design with a quantitative research data analysis from a population of
219 New Jersey school districts. Twenty school districts were excluded because of certain
criteria, including not having a permanent school superintendent, valid PARCC scores, or other
unreported data points.
The chapter includes the procedures within the analysis of the data and description of
additional demographics of the data points collected for this research. This chapter describes
how the data were collected and analyzed using a correlational analysis and reports the results of
the statistical analysis. This chapter includes the descriptive statistic of the sample, the
procedure of the data analysis, and the output analysis using the Statistical Package for the Social
Sciences (SPSS) and provides the research findings that respond to the research questions and
the null hypothesis.
Organization of the Chapter
Chapter IV contains a review of the procedures and steps for the quantitative data
analysis of the research sample of 219 kindergarten through Grade 12 public school districts in
New Jersey selected for this research. It includes a description of how the sample schools were
selected and includes elimination factors utilized to clean the data set. The chapter outlines how
the data sets were collected, analyzed, and reported using multiple statistical analysis procedures
summarizing the results.
The chapter provides a descriptive and exploratory analysis of the sample looking for
data skewness and data set outliers utilizing the Statistical Package for the Social Sciences
(SPSS, Version 26) software. The chapter further examines the output models using SPSS by
examining the correlational analysis and a review of the multiple regression analysis of the

83
selected school districts, variables, and complete data samples. The chapter ends with providing
the research findings that answer the five research questions and the null hypothesis.
Research Questions
The research questions that steered this study were:
What is the relationship between New Jersey public school superintendent longevity and
student achievement as measured by Spring 2017 Partnership for Assessment of Readiness for
College and Careers (PARCC) Grade 5 math when controlling for school and student
characteristics?
No statistically significant relationship exists between a New Jersey school
superintendent’s length of time in a school district and student academic achievement, as
evidenced by the 2017 PARCC scores in Grade 5 mathematics when controlling for school and
student characteristics.
What is the relationship between New Jersey public school superintendent longevity and
student achievement as measured by Spring 2017 Partnership for Assessment of Readiness for
College and Careers (PARCC) Grade 5 English Language Arts/Literacy when controlling for
school and student characteristics?
No statistically significant relationship exists between a New Jersey school
superintendent’s length of time in a school district and student academic achievement, as
evidenced by the 2017 PARCC scores in Grade 5 English Language Arts/Literacy when
controlling for school and student characteristics.
What is the relationship between New Jersey public school superintendent longevity
and student achievement as measured by 2017 Partnership for Assessment of Readiness for
College and Careers (PARCC) Algebra 1 when controlling for school and student

84
characteristics?
No statistically significant relationship exists between a New Jersey school
superintendent’s length of time in a school district and student academic achievement, as
evidenced by the 2017 PARCC scores in Algebra 1 when controlling for school and student
characteristics.
What is the relationship between New Jersey public school superintendent longevity and
student achievement as measured by Spring 2017 Partnership for Assessment of Readiness for
College and Careers (PARCC) English Language Arts/Literacy 10 when controlling for school
and student characteristics?
No statistically significant relationship exists between a New Jersey school
superintendent’s length of time in a school district and student academic achievement, as
evidenced by the 2017 PARCC scores in English Language Art/Literacy 10 when controlling for
school and student characteristics.
What is the relationship between New Jersey superintendent longevity and district faculty
mobility as evidenced by the 2017 School Performance Report faculty mobility rate percentage
when controlling for school and student characteristics?
No statistically significant relationship exists between a New Jersey school
superintendent’s length of time in a school district and district success, as evidenced by the 2017
district faculty mobility rate when controlling for school and student characteristics.
Independent and Dependent Variables
In reviewing the literature and specifically the research conducted by Waters and
Marzano (2006) and other identified researchers, it is suggested that certain predictor variables
have a significant relationship with student academic achievement, teacher satisfaction, and

85
school district success. The independent variable of superintendent longevity with a school
district was collected through the use of the 2017 New Jersey Department of Education annual
School District Fall Staff Report, NJASA member survey data, and Data Universe at (Asbury
Park Press website) APP.COM. The dependent variables, for the purposes of this research, were
the 2017 PARCC scores from Grade 5, Grade 9, Grade 10, and the district teacher mobility rate
were sourced from multiple school and state reports. The PARCC scores for all grades were
retrieved from the New Jersey Department of Education website, the New Jersey School
Performance Report for each school district, and each district’s school approved website. The
district teacher mobility rate was retrieved from the district level 2017 New Jersey School
Performance Report for each school district.

86
Table 3 Independent / Dependent / Control Variables Used In This Study Variables Label Description Superintendent Years of Experience In District – Independent Variable (Scale)
SuperYrs
Total number of years superintendent has served in the district
Superintendent Years of Experience Overall – Independent Variable (Scale)
SuperYrsTtl Total number of years the experiences as a superintendent
District PARCC English Language Arts / Literacy Grade 5 – Dependent Variable (Scale)
PARCCELALGr5
Percentage of students who meet or exceed (4/5) the expected score on this section of the PARCC assessment
District PARCC Math Grade 5 – Dependent Variable (Scale)
PARCCMathGr5
Percentage of students who meet or exceed (4/5) the expected scores on this section of the PARCC assessment
District PARCC Algebra 1 - Dependent Variable (Scale)
PARCCAlg1
Percentage of students who meet or exceed (4/5) the expected scores on this section of the PARCC assessment
District PARCC English Language Arts / Literacy Grade 10 - Dependent Variable (Scale)
PARCCELALGr10
Percentage of students who meet or exceed (4/5) the expected scores on this section of the PARCC assessment
District Faculty Mobility Rate - Dependent Variable (Scale)
FacMobRate
One year retention rate – percentage of teachers assigned to the district in 2015–16 that were still assigned to the district in 2016–17
District Faculty Advance Academic Degrees – Control Variable (Scale)
FacAdvDeg
Highest level of education attained by the teachers based on BA/MA/Ed.D/Ph.D
District Faculty Attendance Rate - Control Variable (Scale)
FacAtttendance
Percentage of days that faculty members were present during the school year
District Free and Reduced Lunch Percentage - Control Variable (Scale)
FreeRedLunch
Percentage of economically disadvantaged students who qualify for free and reduced lunches
District English Language Learners Percentage - Control Variable (Scale)
ELLRate
Percentage of students identified by the district as needing English language proficiency services
District Chronic Absenteeism Percentage - Control Variable (Scale)
ChronAbsent Percentage of students that were absent for 10% or more of the school year
District Special Education Percentage - Control Variable (Scale)
SpEdPercent Percentage of students that were classified with an Individualized Educational Plan (I.E.P)

87
Descriptive Statistics
A descriptive analysis was performed using the statistical package SPSS Version 26 to examine
the variables included in this study. The independent variable of superintendent years of
experience in the district and overall superintendent experience was analyzed as were the
dependent variables of NJ PARCC Grade 5 ELA/L and math, NJ PARCC Algebra 1 assessment,
NJ PARCC ELA/L 10 assessment, and teacher mobility rate for each school district. Control
variable examined were district faulty advanced degree percentage, faculty attendance rate,
district free and reduced lunch percentage, district ELL percentage, district chronic absenteeism
percentage, and district special education percentage. The analysis was utilized to examine
sample size, minimum and maximum values, mean of each variable and the standard deviation
for all variable included in this research. The results of this analysis are provided in Table 4.
Table 4 Descriptive Statistics N Minimum Maximum Mean Std. Deviation SuperYrs 189 1.00 19.00 4.6402 3.41892 SuperYrsTtl 189 1.00 26.00 7.9788 5.02754 PARCCELALGr5 189 19.00 95.00 62.4074 16.48591 PARCCELALGr10 189 12.00 84.00 48.0317 15.92533 PARCCMathGr5 189 5.00 86.00 49.5556 17.86007 PARCCAlg1 189 12.00 97.00 41.9788 18.74804 FacAdvDeg 189 12.00 78.00 45.4762 14.43163 FacMobRate 189 58.00 95.00 88.4497 4.15957 FacAtttendance 189 89.00 100.00 96.2275 1.86972 SpEdPercent 189 8.00 28.00 16.3122 3.22769 FreeRedLunch 189 .00 100.00 31.6402 24.82123 ELLRate 189 .00 30.00 4.9947 5.44557 ChronAbsent 189 1.80 29.70 9.2688 4.81784 Valid N (listwise) 189
This research study included 189 kindergarten through Grade 12 public school districts.
The average years of experience for the district superintendent was 4.64 years in districts and

88
overall experience as a superintendent averaged 7.98 years. The minimum and maximum for
years in district area were 1 year to 19 years respectively. The total years of experience for
superintendents ranges from 1 year to 26 years in the K–12 grade sample districts. Examining
the dependent variables, the mean passing score for the Grade 5 ELA/L and Grade 10 ELA/L
scores were 62.41% and 48.03% respectively, with minimum scores of 19% and maximum
scores of 95% passing for Grade 5 ELA/L. Grade 10 ELA/L minimum and maximum districts
passing scores were 12% and 84% for students. The math score passing rate averages were
49.56% for Grade 5 math and 41.97% for Algebra 1 assessments, each having minimum scores
of 5% and 12% respectively and maximum scores of 86% and 97% respectively. The faculty
mobility rate, staying with the school district from year to year averaged 88.45%, meaning that
88.45% of the current staff returned in the 2016–17 school year from the previous year. The
minimum faculty mobility rate was 58% and the maximum retainage of certificated staff was
96%. The descriptive analysis was performed for the control variables and the following means
were identified: 45.48% of the teachers had advanced degrees in the schools sampled with a
minimum of 12% and a maximum of 68%; faculty attendance rate averaged 96.23% daily with a
minimum of 89% and a maximum of 100%; Special education classification percentages for the
sample schools averaged 16.31% for students with a minimum of 8% and a maximum of 28%;
free and reduced lunch percentage means for the districts was 16.31% of students with minimum
of 0% and a maximum of 100%; English Language Learner mean rates were 4.99% with a
minimum of 0% and a maximum of 30%; chronic absenteeism for the 189 schools districts
averaged 9.27% for students enrolled in these identified districts with a minimum of 1.8% to
29.7%.
A descriptive exploratory analysis was conducted on each of the independent, dependent,

89
and control variables to examine additional statistical qualities of confidence levels, means,
variance, skewness, and kurtosis of each variable. After the first analysis, there were some
variables with significant skewness issues and as a result, the explorative descriptive analysis
was conducted again after reviewing all data points and removing outliers within the data set.
This process of winsoring the data set minimized the undue influence on the data set and
outcomes of the analysis. Winsorization of data is an acceptable practice within the research
community. The focus of this exploratory analysis was the skewness of the data looking for all
variable to be within the + or – 1.0 range. The skewness for the independent variables of
superintendent years in district and total experience as a superintendent were 1.489 and 0.843.
The skewness level for the dependent variables were as follows: 2017 PARCC ELA/L 5 at -
0.374; 2017 PARCC ELA/L 10 at -0.030; 2017 PARCC math 5 at -0.126; 2017 PARCC Algebra
1 at -0.708; 2017 faculty mobility rate at -0.621. The control variables utilized for this research
study were included in the exploratory analysis and skewness was determined to be -0.602 for
faculty with advanced degrees; -1.346 for faculty attendance rate; 0.205 for special education
classification percentage; 0.695 for free and reduced lunch percentage; 2.225 for English
language learner percentage rate, and 1.209 for chronic absenteeism rate for the sample school
district in this study. Additional analysis points can be reviewed in Table 5.

90
Table 5 Descriptive Exploratory Analysis Statistic Std. Error SuperYrs Mean 4.6402 .24869
95% Confidence Interval for Mean Lower Bound 4.1496 Upper Bound 5.1308
5% Trimmed Mean 4.3010 Median 4.0000 Variance 11.689 Std. Deviation 3.41892 Minimum 1.00 Maximum 19.00 Range 18.00 Interquartile Range 4.00 Skewness 1.489 .177 Kurtosis 2.920 .352
SuperYrsTtl Mean 7.9788 .36570 95% Confidence Interval for Mean Lower Bound 7.2574
Upper Bound 8.7002 5% Trimmed Mean 7.6890 Median 7.0000 Variance 25.276 Std. Deviation 5.02754 Minimum 1.00 Maximum 26.00 Range 25.00 Interquartile Range 6.50 Skewness .843 .177 Kurtosis .586 .352
PARCCELALGr5
Mean 62.4074 1.19917 95% Confidence Interval for Mean Lower Bound 60.0418
Upper Bound 64.7730 5% Trimmed Mean 62.8539 Median 64.0000 Variance 271.785 Std. Deviation 16.48591 Minimum 19.00 Maximum 95.00 Range 76.00 Interquartile Range 24.50 Skewness -.374 .177 Kurtosis -.596 .352
PARCCELALGr10
Mean 48.0317 1.15840 95% Confidence Interval for Mean Lower Bound 45.7466
Upper Bound 50.3169 5% Trimmed Mean 48.0497 Median 49.0000 Variance 253.616 Std. Deviation 15.92533

91
Minimum 12.00 Maximum 84.00 Range 72.00 Interquartile Range 24.50 Skewness -.030 .177 Kurtosis -.638 .352
PARCCMathGr5
Mean 49.5556 1.29913 95% Confidence Interval for Mean Lower Bound 46.9928
Upper Bound 52.1183 5% Trimmed Mean 49.7055 Median 50.0000 Variance 318.982 Std. Deviation 17.86007 Minimum 5.00 Maximum 86.00 Range 81.00 Interquartile Range 27.50 Skewness -.126 .177 Kurtosis -.776 .352
PARCCAlg1 Mean 41.9788 1.36372 95% Confidence Interval for Mean Lower Bound 39.2887
Upper Bound 44.6690 5% Trimmed Mean 41.4256 Median 40.0000 Variance 351.489 Std. Deviation 18.74804 Minimum 12.00 Maximum 97.00 Range 85.00 Interquartile Range 31.50 Skewness .374 .177 Kurtosis -.708 .352
FacAdvDeg Mean 45.4762 1.04975 95% Confidence Interval for Mean Lower Bound 43.4054
Upper Bound 47.5470 5% Trimmed Mean 45.3918 Median 46.0000 Variance 208.272 Std. Deviation 14.43163 Minimum 12.00 Maximum 78.00 Range 66.00 Interquartile Range 20.50 Skewness .048 .177 Kurtosis -.602 .352
FacMobRate Mean 88.6508 .23731 95% Confidence Interval for Mean Lower Bound 88.1827
Upper Bound 89.1189 5% Trimmed Mean 88.7963
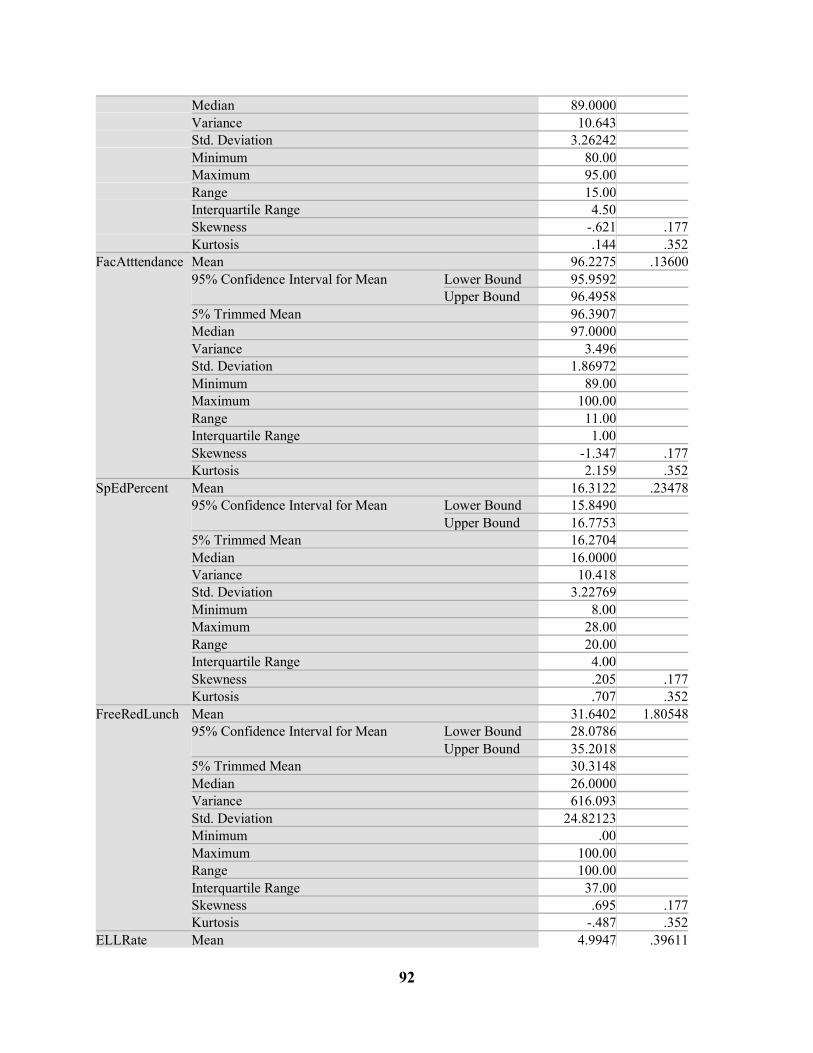
92
Median 89.0000 Variance 10.643 Std. Deviation 3.26242 Minimum 80.00 Maximum 95.00 Range 15.00 Interquartile Range 4.50 Skewness -.621 .177 Kurtosis .144 .352
FacAtttendance Mean 96.2275 .13600 95% Confidence Interval for Mean Lower Bound 95.9592
Upper Bound 96.4958 5% Trimmed Mean 96.3907 Median 97.0000 Variance 3.496 Std. Deviation 1.86972 Minimum 89.00 Maximum 100.00 Range 11.00 Interquartile Range 1.00 Skewness -1.347 .177 Kurtosis 2.159 .352
SpEdPercent Mean 16.3122 .23478 95% Confidence Interval for Mean Lower Bound 15.8490
Upper Bound 16.7753 5% Trimmed Mean 16.2704 Median 16.0000 Variance 10.418 Std. Deviation 3.22769 Minimum 8.00 Maximum 28.00 Range 20.00 Interquartile Range 4.00 Skewness .205 .177 Kurtosis .707 .352
FreeRedLunch Mean 31.6402 1.80548 95% Confidence Interval for Mean Lower Bound 28.0786
Upper Bound 35.2018 5% Trimmed Mean 30.3148 Median 26.0000 Variance 616.093 Std. Deviation 24.82123 Minimum .00 Maximum 100.00 Range 100.00 Interquartile Range 37.00 Skewness .695 .177 Kurtosis -.487 .352
ELLRate Mean 4.9947 .39611

93
95% Confidence Interval for Mean Lower Bound 4.2133 Upper Bound 5.7761
5% Trimmed Mean 4.2622 Median 3.0000 Variance 29.654 Std. Deviation 5.44557 Minimum .00 Maximum 30.00 Range 30.00 Interquartile Range 4.00 Skewness 2.225 .177 Kurtosis 5.334 .352
ChronAbsent Mean 9.2688 .35045 95% Confidence Interval for Mean Lower Bound 8.5775
Upper Bound 9.9601 5% Trimmed Mean 8.9072 Median 8.2000 Variance 23.212 Std. Deviation 4.81784 Minimum 1.80 Maximum 29.70 Range 27.90 Interquartile Range 6.25 Skewness 1.209 .177 Kurtosis 2.000 .352
A simultaneous multiple regressional analysis was performed based on each of the five
research questions. The simultaneous multiple regression was performed to determine the
variance of the predictor variables of years of service to the district as superintendent and total
number of years as a superintendent on the dependent variables of 2017 PARCC scores and 2017
teacher mobility rate percentage. Additionally, simultaneous multiple regressional was
performed for the identified control variables to analyze the variance and impact on the outcome
variables previously identified. The statistical analysis was used to determine the significance
between the independent, control, and dependent variables.
The independent and dependent variables were examined using a simultaneous multiple
regressional statistical analysis testing method to determine the resulting strength of relationship
between variable and if the variable relationships were statistically significant to the 95%

94
confidence level. This analysis was completed to determine which variables were statistically
significant predictors on the dependent variables outlined for this research and the strength of the
relationship.
The following statistical analysis outcomes were noted as the data were reviewed:
The models all included a review of the R and R2 to identify which independent or
dependent variables contributed the most to the final adjusted R2 value. As the adjusted R2
outcomes were reviewed, the F and P values were also examined for each model to indicate the
variance between the means of the samples and probability or statistical probability of rejecting
the null hypothesis of each model run for each research question. Each model included an
Analysis of the Variance (ANOVA) test, which indicated the overall significance level for each
model test. The coefficients tables were examined in each model to review the Beta (B) values
to identify each statistically significant standardized coefficients. The tolerance and VIF
(variance inflation factor) were outlined in the coefficients table of the statistical analysis. The
assumptions of linearity, normally distributed errors, and uncorrelated errors were checked and
met. The reported collinearity statistics for the model indicated no observable multicollinearity
issues between the predictor variables.
Analysis and Results
Research Question 1:
What is the relationship between New Jersey public school superintendent longevity and
student achievement as measured by Spring 2017 Partnership for Assessment of Readiness for
College and Careers (PARCC) Grade 5 math when controlling for school and student
characteristics?
In an attempt to answer this research question a simultaneous multiple regression analysis

95
was conducted using the SPSS V. 26 program that included 1 predictor variable of
superintendent years of experience in district, the six control variables, and the dependent
variable of 2017 district PARCC Grade 5 math scores as indicated in Table 6. This analysis was
conducted to determine how much of the variance in 2017 PARCC Grade 5 math scores could be
explained by the predictor variables of superintendent years in the district and the control
variables of free and reduced lunch, special education percentage, faculty attendance rate, faculty
with advanced degrees, student chronic absenteeism, and English language learner rates.
Table 6 Superintendent Years in District – Grade 5 PARCC Math Variables Entered/Removeda
Model Variables Entered Variables Removed Method 1 SuperYrs,
FreeRedLunch, SpEdPercent, FacAtttendance, FacAdvDeg, ChronAbsent, ELLRateb
. Enter
a. Dependent Variable: PARCCMathGr5 b. All requested variables entered.
In Table 7 and Table 8, the model summary indicated an R2 value of 0.289 and an
Adjusted R2 value of 0.261. The maximum and minimum values of R2 were +1.00 to -1.00.
The values identified positive and negative direction of relationship. This model indicated a
positive relationship between year in district as a superintendent and 2017 PARCC Grade 5 math
scores. The regression analysis reported an R2 value of 0.289 indicating the overall model could
explain 28.9% of the variance in the outcome variable of 2017 PARCC Grade 5 math scores. An
adjusted R2 of 0.261 was reported indicating that 26.1% of the variance could be explained if the
model was run using the entire population as a sample. This model summary R2 values between
26.1% and 28.9% of the passing student scores on the 2017 PARCC Grade 5 math assessment
can be explained by the superintendent number of years in the public school districts and the

96
control variables in this model. The Analysis of Variance (ANOVA–Table 8) analysis indicates
that the regression model was statistically significant to the .001 level (p < .000) in predicting
2017 PARCC Grade 5 math scores for the public school districts using the outlined predictor
variables with values of F (7, 181) = 10.505, p < 0.001.
Table 7 Model Summary
Table 8 ANOVAa
Model Sum of Squares df Mean Square F Sig. 1 Regression 17325.054 7 2475.008 10.505 .000b
Residual 42643.613 181 235.600 Total 59968.667 188
a. Dependent Variable: PARCCMathGr5 b. Predictors: (Constant), SuperYrs, FreeRedLunch, SpEdPercent, FacAtttendance, FacAdvDeg, ChronAbsent, ELLRate
In Table 9 (coefficients table), the beta and standardized beta and the statistical
significance were examined for the independent variable and control variables. Analyzing this
table, three of the seven predictor variables were indicated as statistically significant. The
predictor variables identified as statistically significant to the explained variance of 2017
PARCC Grade 5 math scores were as follows: faculty advanced degree (b = 0.440, B = 0.356, t
(188) = 5.428, p = 0.000); free and reduced lunch (b = -0.223, B = -0.311, t (188) = -2.585, p =
0.011), and faculty attendance rate (b = 1.725, B = 0.625, t (188) = 2.762, p = 0.006). The focus
independent variable of superintendent years in district indicated as not being a statistically
significant relationship at the P =< .05 level with a value of (p = 0.051). Coefficients Table 9
Table 7: Model Summary
Model R R Square Adjusted R
Square Std. Error of the Estimate
Change Statistics R Square Change
F Change df1 df2
1 .537a .289 .261 15.34927 .289 10.505 7 181

97
indicates no issues with multicollinearity and variance inflation factors (VIF) ranging from 1.056
to 3.674.
Based on the standardized beta weights for the significant predictor variables in
coefficients Table 9, it is assumed that the amount of variance on the outcome variable can be
explained by the predictor variable. Squaring the standardized beta values of each of the four
significant predictor variables denotes the strength of the variable on the dependent variable,
district 2017 PARCC Grade 5 math scores. The strongest contributor to the academic success of
students in this model was the percentage of faculty advanced degrees (b = 0.440, B = 0.356, t
(188) = 5.428, p = 0.000) explaining 12.67% of the overall variance for 2017 PARCC Grade 5
math district scores. The positive beta score indicated that when there was a higher percentage
of faculty with advanced degrees the percentage of students meeting or exceeding 2017 PARCC
scores thresholds increased. For every unit increase in a district’s faculty with advanced degrees,
the district 2017 PARCC Grade 5 math score increased by 0.440 units.
The next strongest predictor of academic success was free and reduced lunch percentages
for the district (b = -0.223, B = -0.311, t (188) = -2.585, p = 0.011) which explains 9.67% of the
variance in 2017 PARCC Grade 5 math district scores. The negative beta value in this predictor
variable indicated that when free and reduced lunch percentages increased, the percentage of
students meeting or exceeding threshold scores on the 2017 PARCC Grade 5 math assessment
decreased. For every unit increase in a district’s percentage of free and reduced lunch students,
the district 2017 PARCC Grade 5 math score decreased by 0.223 units.
Faculty attendance rate percentage (b = 1.725, B = 0.181, t (188) = 2.762, p = 0.006) was
the third strongest predictor variable, accounting for 3.28% of the overall variance of the
outcome variable district 2017 PARCC Grade 5 math scores. The positive beta score indicated

98
that the higher faculty attendance rate percentage, the higher percentage of students meeting or
exceeding the 2017 PARCC math score levels, resulting in a higher district passing percentage.
For every unit increase in a district’s faculty with advanced degrees, the district 2017 PARCC
Grade 5 math scores increased by 1.75 units. The model indicated that faculty with advanced
degrees, free and reduced lunch percentages, and faculty attendance rate were significant
predictors to the 2017 PARCC Grade 5 math district level scores. No other variables were
considered significant in this regression model inclusive of the focus control variable of
superintendent years in the district.
Table 9 Coefficientsa
Table 10 Collinearity Diagnosticsa
Model Dimension Eigen value
Condition Index
Variance Proportions
(Constant) Fac
AdvDeg Fac
MobRate Fac
Atttendance SpEd
Percent 1 1 7.048 1.000 .00 .00 .00 .00 .00
2 .453 3.946 .00 .00 .00 .00 .00
3 .299 4.856 .00 .03 .00 .00 .01
4 .101 8.348 .00 .01 .00 .00 .00
5 .075 9.713 .00 .73 .00 .00 .12
6 .023 17.342 .00 .19 .01 .00 .85
7 .001 83.547 .02 .00 .85 .09 .00
8 .000 216.361 .98 .03 .15 .91 .01
Table 9: Coefficientsa
Model Unstandardized Coefficients
Standardized Coefficients
t Sig. Collinearity Statistics
B Std. Error Beta Tolerance VIF 1 (Constant) -138.849 61.233 -2.268 .025
FacAdvDeg .440 .081 .356 5.428 .000 .914 1.094 FacAtttendance 1.725 .625 .181 2.762 .006 .919 1.089 SpEdPercent .320 .379 .058 .843 .400 .837 1.195 FreeRedLunch -.223 .086 -.311 -2.585 .011 .272 3.674 ELLRate .260 .339 .079 .768 .443 .369 2.712 ChronAbsent -.016 .310 -.004 -.051 .960 .561 1.783 SuperYrs .662 .336 .127 1.966 .051 .947 1.056

99
The second aspect of research question 1 was the impact of the total number of years as a
superintendent on the outcome variable of 2017 PARCC Grade 5 math scores. The following
model was developed and run through a multiple regression using SPSS using the following
variables in Table 11:
Table 11 Total Years as a Superintendent–Grade 5 PARCC Math Variables Entered/Removed Model Variables Entered Variables Removed Method 1 SuperYrsTtl,
FreeRedLunch, FacAtttendance, SpEdPercent, FacAdvDeg, ChronAbsent, ELLRateb
. Enter
a. Dependent Variable: PARCCMathGr5 b. All requested variables entered.
In Table 12 and Table 13, the model summary indicated an R2 value of 0.281 and an
adjusted R2 value of 0.253. The maximum and minimum values of R2 were +1.00 to -1.00. The
values identified positive and negative direction of relationship. This model indicated a positive
relationship between total number of years as a superintendent and 2017 PARCC Grade 5 math
scores. The regression analysis reported an R2 value of 0.281 indicating the overall model could
explain 28.1% of the variance in the outcome variable of 2017 PARCC Grade 5 math scores. An
adjusted R2 of 0.253 was reported indicating that 25.3% of the variance could be explained if the
model was run using the entire population as a sample. This model summary R2 values between
25.3% and 28.1% of the passing student scores on the 2017 PARCC Grade 5 math assessment
can be explained by the total number of years as a superintendent in the public school districts
and the control variables in this model. The Analysis of Variance (ANOVA–Table 13) analysis
indicated that the regression model was statistically significant to the 0.001 level (p < 0.001) in
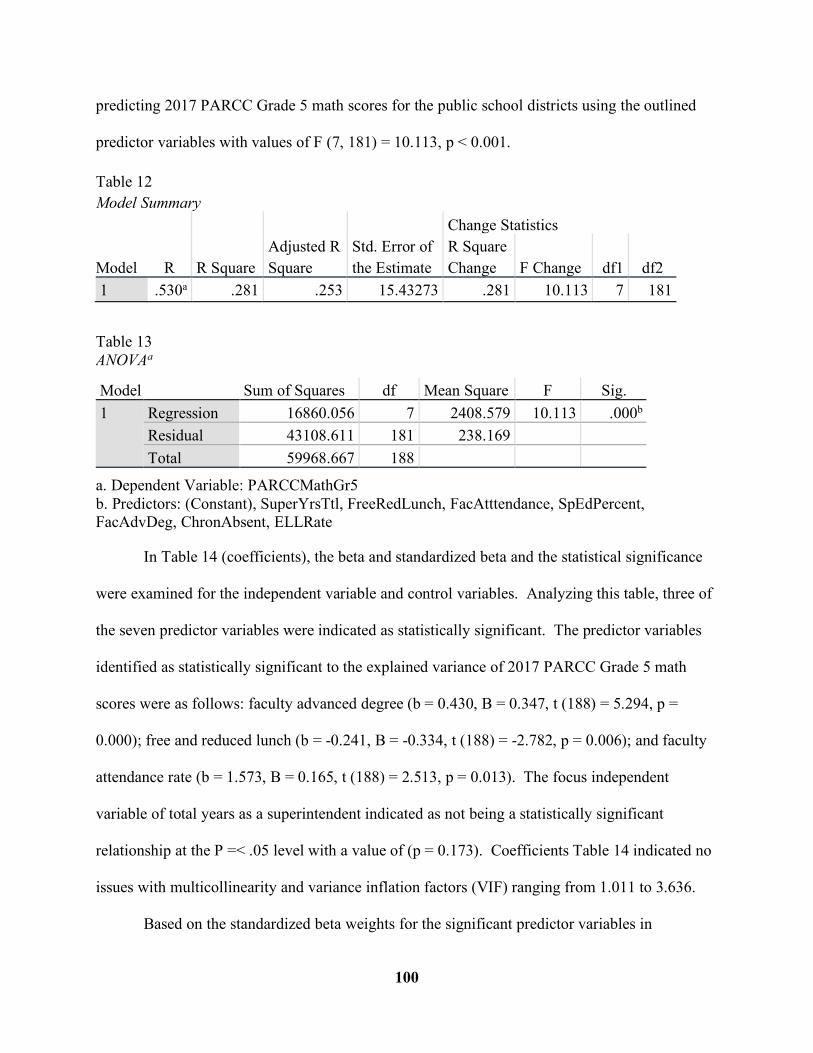
100
predicting 2017 PARCC Grade 5 math scores for the public school districts using the outlined
predictor variables with values of F (7, 181) = 10.113, p < 0.001.
Table 12 Model Summary
Model R R Square Adjusted R Square
Std. Error of the Estimate
Change Statistics R Square Change F Change df1 df2
1 .530a .281 .253 15.43273 .281 10.113 7 181
Table 13 ANOVAa
Model Sum of Squares df Mean Square F Sig. 1 Regression 16860.056 7 2408.579 10.113 .000b
Residual 43108.611 181 238.169 Total 59968.667 188
a. Dependent Variable: PARCCMathGr5 b. Predictors: (Constant), SuperYrsTtl, FreeRedLunch, FacAtttendance, SpEdPercent, FacAdvDeg, ChronAbsent, ELLRate
In Table 14 (coefficients), the beta and standardized beta and the statistical significance
were examined for the independent variable and control variables. Analyzing this table, three of
the seven predictor variables were indicated as statistically significant. The predictor variables
identified as statistically significant to the explained variance of 2017 PARCC Grade 5 math
scores were as follows: faculty advanced degree (b = 0.430, B = 0.347, t (188) = 5.294, p =
0.000); free and reduced lunch (b = -0.241, B = -0.334, t (188) = -2.782, p = 0.006); and faculty
attendance rate (b = 1.573, B = 0.165, t (188) = 2.513, p = 0.013). The focus independent
variable of total years as a superintendent indicated as not being a statistically significant
relationship at the P =< .05 level with a value of (p = 0.173). Coefficients Table 14 indicated no
issues with multicollinearity and variance inflation factors (VIF) ranging from 1.011 to 3.636.
Based on the standardized beta weights for the significant predictor variables in

101
coefficients Table 14, the amount of variance on the outcome variable could be explained by the
predictor variable. Squaring the standardized beta values of each of the three significant
predictor variables denotes the strength of the predictor variables on the dependent variable,
district 2017 PARCC Grade 5 math scores. The strongest contributor to the academic success of
students in this model was the percentage of faculty advanced degrees (b = 0.430, B = 0.347, t
(188) = 5.294, p = 0.000), explaining 12.00% of the overall variance for 2017 PARCC Grade 5
math district scores. The positive beta score indicated that when there was a higher percentage
of faculty with advanced degrees the percentage of students meeting or exceeding 2017 PARCC
scores thresholds increased. For every unit increase in a district’s faculty with advanced degrees,
the district 2017 PARCC Grade 5 math scores increased by 0.430 units.
The next strongest predictor of academic success was free and reduced lunch percentages
for the district (b = -0.241, B = -0.334, t (188) = -2.782, p = 0.006), explaining 11.20% of the
variance in 2017 PARCC Grade 5 math district scores. The negative beta value in this predictor
variable indicated that when free and reduced lunch percentages increased, the percentage of
students meeting or exceeding threshold scores on the 2017 PARCC Grade 5 math assessment
decreased. For every unit increase in a district’s percentage of free and reduced lunch students,
the district 2017 PARCC Grade 5 math score decreased by 0.241 units.
Faculty attendance rate percentage (b = 1.573, B = 0.165, t (188) = 2.513, p = 0.013) was
the third strongest predictor variable accounting for 2.72% of the overall variance of the outcome
variable district 2017 PARCC Grade 5 math scores. The positive beta score indicated that the
higher faculty attendance rate percentage, the higher percentage of students meeting or
exceeding the 2017 PARCC math score levels, resulting in a higher district passing percentage.
For every unit increase in a district’s faculty with advanced degrees, the district 2017 PARCC

102
Grade 5 math scores increased by 1.573 units.
The model indicated that faculty with advanced degrees, free and reduced lunch
percentages, and faculty attendance rate were significant predictors to the 2017 PARCC Grade 5
math district level scores. No other variables were considered significant in this regression
model inclusive of the focus control variable of total number of years as a superintendent.
Table 14 Coefficientsa
Model
Unstandardized Coefficients
Standardized Coefficients
t Sig. Collinearity Statistics
B Std. Error Beta Tolerance VIF 1 (Constant) -121.895 61.037 -1.997 .047
FacAdvDeg .430 .081 .347 5.294 .000 .922 1.085 FacAtttendance 1.573 .626 .165 2.513 .013 .925 1.081 SpEdPercent .261 .381 .047 .685 .494 .837 1.195 FreeRedLunch -.241 .086 -.334 -2.782 .006 .275 3.636 ELLRate .341 .338 .104 1.008 .315 .374 2.676 ChronAbsent -.031 .312 -.008 -.100 .920 .562 1.781 SuperYrsTtl .308 .225 .087 1.368 .173 .989 1.011
a. Dependent Variable: PARCCMathGr5
Table 15 Collinearity Diagnosticsa
Model Dimension Eigen value
Condition Index
Variance Proportions
(Constant) FacAdvDeg
FacAtttendance
SpEd Percent
FreeRed Lunch
1 1 6.702 1.000 .00 .00 .00 .00 .00 2 .691 3.114 .00 .01 .00 .00 .04 3 .254 5.137 .00 .02 .00 .00 .00 4 .197 5.831 .00 .06 .00 .00 .07 5 .078 9.298 .00 .27 .00 .11 .21 6 .060 10.541 .00 .47 .00 .02 .58 7 .018 19.412 .00 .15 .00 .83 .09 8 .000 197.352 1.00 .03 1.00 .03 .01
In reviewing Tables 4–15, three predictor variables were determined to be statistically
significant in both models. The predictor variable of faculty with advanced degrees was a
significant influencer of 2017 PARCC Grade 5 math scores to the p < .001 level in both models

103
with the significance p = 0.000. The next biggest impacting variable significant in both models
was the free and reduced lunch percentage rates for the public school districts. Both models
indicated a statistical significance to the p < .01 level with model 1 and 2 indicating a
significance level of 0.003 and 0.006. This relationship was negative in both models, which
indicated that when the percentage of students with free and reduced lunch status increased, the
Grade 5 math scores decreased. The third most impactful predictor variable for the dependent
variable of Grade 5 math scores was the faculty attendance percentage rate for the public school
districts with a p value of 0.006 and 0.013. Both models indicated a positive relationship
between increased faculty attendance rates and the increased percentage of students meeting or
exceeding threshold levels for the 2017 PARCC Grade 5 math assessment levels for the sample
public school districts. All other variables input into these models were not considered
significant including the main target predictor variables of superintendent years in the district
and total years as a superintendent and their impact on Grade 5 math PARCC district scores.
Null Hypothesis 1:
No statistically significant relationship exists between a New Jersey school
superintendent’s length of time in a school district and student academic achievement, as
evidenced by the 2017 PARCC scores in grade 5 mathematics when controlling for school and
student characteristics.
The null hypothesis is retained for research question one based on the data analysis and
findings discussed from the SPSS output tables in the multiple regression. Superintendent years
of experience in district and total years of experience were determined not to be a significant
predictor variable of 2017 PARCC Grade 5 math district scores. SuperYrs (B = 0.127, p =
0.051); SuperYrsTtl (B = 0.087, p = 0.173).
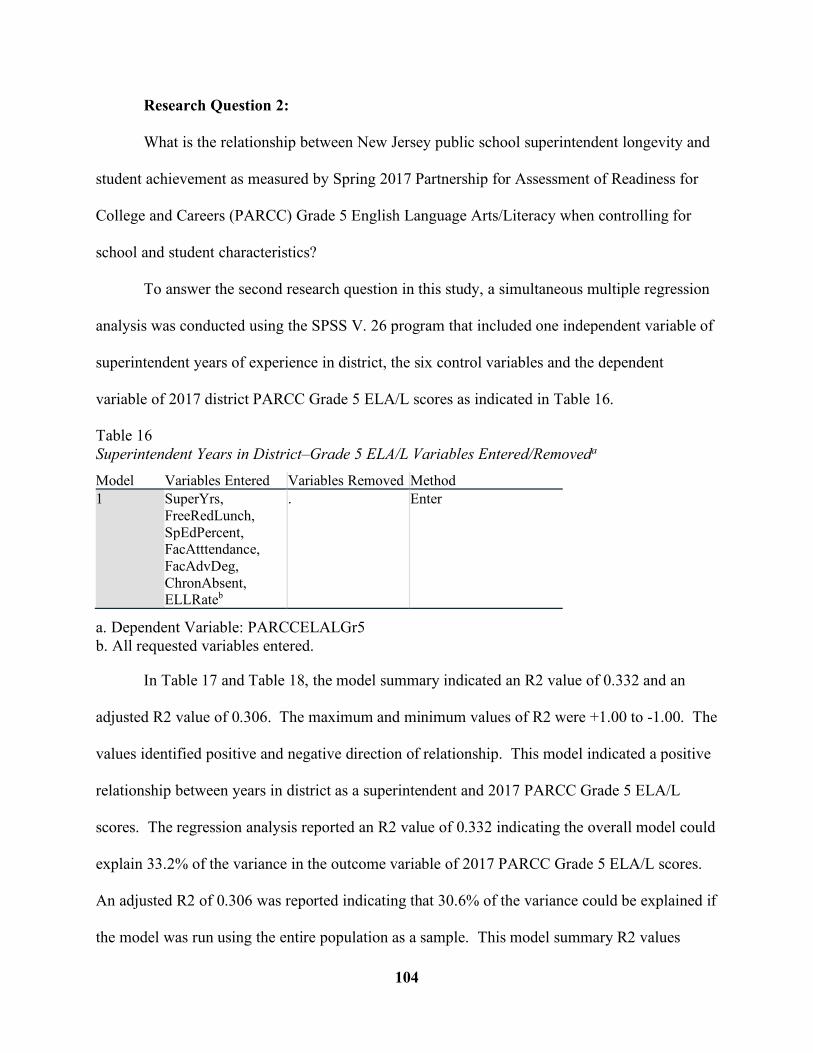
104
Research Question 2:
What is the relationship between New Jersey public school superintendent longevity and
student achievement as measured by Spring 2017 Partnership for Assessment of Readiness for
College and Careers (PARCC) Grade 5 English Language Arts/Literacy when controlling for
school and student characteristics?
To answer the second research question in this study, a simultaneous multiple regression
analysis was conducted using the SPSS V. 26 program that included one independent variable of
superintendent years of experience in district, the six control variables and the dependent
variable of 2017 district PARCC Grade 5 ELA/L scores as indicated in Table 16.
Table 16 Superintendent Years in District–Grade 5 ELA/L Variables Entered/Removeda Model Variables Entered Variables Removed Method 1 SuperYrs,
FreeRedLunch, SpEdPercent, FacAtttendance, FacAdvDeg, ChronAbsent, ELLRateb
. Enter
a. Dependent Variable: PARCCELALGr5 b. All requested variables entered.
In Table 17 and Table 18, the model summary indicated an R2 value of 0.332 and an
adjusted R2 value of 0.306. The maximum and minimum values of R2 were +1.00 to -1.00. The
values identified positive and negative direction of relationship. This model indicated a positive
relationship between years in district as a superintendent and 2017 PARCC Grade 5 ELA/L
scores. The regression analysis reported an R2 value of 0.332 indicating the overall model could
explain 33.2% of the variance in the outcome variable of 2017 PARCC Grade 5 ELA/L scores.
An adjusted R2 of 0.306 was reported indicating that 30.6% of the variance could be explained if
the model was run using the entire population as a sample. This model summary R2 values

105
between 30.6% and 33.2% of the passing student scores on the 2017 PARCC Grade 5 ELA/L
assessment can be explained by the superintendent number of years in the public school districts
and the control variables in this model. The Analysis of Variance (ANOVA–Table 8) analysis
indicated that the regression model was statistically significant to the 0.001 level (p < 0.000) in
predicting 2017 PARCC Grade 5 ELA scores for the public school districts using the outlined
predictor variables with values of F (7, 181) = 12.832, p < 0.001.
Table 17 Model Summary
Model R R Square Adjusted R
Square Std. Error of the Estimate
Change Statistics R Square Change F Change df1 df2
1 .576a .332 .306 13.73721 .332 12.823 7 181
Table 18 ANOVAa Model Sum of Squares df Mean Square F Sig. 1 Regression 16938.961 7 2419.852 12.823 .000b
Residual 34156.668 181 188.711 Total 51095.630 188
a. Dependent Variable: PARCCELALGr5 b. Predictors: (Constant), SuperYrs, FreeRedLunch, SpEdPercent, FacAtttendance, FacAdvDeg, ChronAbsent, ELLRate
In Table 19 (coefficients), the beta and standardized beta and the statistical significance
were examined for the independent variable and control variables. Analyzing this table, three of
the seven predictor variables were indicated as statistically significant. The predictor variables
identified as statistically significant to the explained variance of 2017 PARCC Grade 5 ELA/L
scores were as follows: faculty advanced degree (b = 0.480, B = 0.420, t (188) = 6.608, p =
0.000); free and reduced lunch (b = -0.169, B = -0.254, t (188) = -2.184, p = 0.030); and faculty
attendance rate (b = 1.474, B = 0.167, t (188) = 2.637, p = 0.009). The focus independent
variable of years as superintendent in the district indicated as not being a statistically significant

106
relationship at the p = < .05 level with a value of (p = 0.083). Coefficients Table 19 indicated no
issues with multicollinearity and variance inflation factors (VIF) ranging from 1.056 to 3.674.
Based on the standardized beta weights for the significant predictor variables in
coefficients Table 19, the amount of variance on the outcome variable could be explained by the
predictor variable. Squaring the standardized beta values of each of the three significant
predictor variables denotes the strength of the predictor variables on the dependent variable,
district 2017 PARCC Grade 5 ELA/L scores. The strongest contributor to the academic success
of students in this model was the percentage of faculty advanced degrees (b = 0.480, B = 0.420, t
(188) = 6.608, p = 0.000), explaining 17.64% of the overall variance for 2017 PARCC Grade 5
ELA/L district scores. The positive beta score indicated that when there was a higher percentage
of faculty with advanced degrees, the percentage of students meeting or exceeding 2017 PARCC
threshold scores increased. For every unit increase in a district’s faculty with advanced degrees,
the district 2017 PARCC ELA/L Grade 5 scores increased by 0.480 units.
The next strongest predictor of academic success was free and reduced lunch percentages
for the district (b = -0.169, B = -0.254, t (188) = -2.184, p = 0.030), explaining 6.45% of the
variance in 2017 PARCC Grade 5 ELA/L district scores. The negative beta value in this
predictor variable indicated that when free and reduced lunch percentages increased, the
percentage of students meeting or exceeding threshold scores on the 2017 PARCC Grade 5
ELA/L assessment decreased. For every unit increase in a district’s percentage of free and
reduced lunch students, the district 2017 PARCC ELA/A Grade 5 score decreased by 0.169
units.
Faculty attendance rate percentage (b = 1.474, B = 0.167, t (188) = 2.637, p = 0.009) was
the third strongest predictor variable, accounting for 2.79% of the overall variance of the

107
outcome variable district 2017 PARCC Grade 5 ELA/L scores. The positive beta score indicated
that the higher faculty attendance rate percentage, the higher percentage of students meeting or
exceeding the 2017 PARCC ELA/L score levels, resulting in a higher district passing percentage.
For every unit increase in a district’s faculty with advanced degrees, the district 2017 PARCC
ELA/L Grade 5 scores increased by 1.474 units.
The model indicated that faculty with advanced degrees, free and reduced lunch
percentages, and faculty attendance rate were significant predictors to the 2017 PARCC Grade 5
ELA/L district level scores. No other variables were considered significant in this regression
model inclusive of the focus predictor variable of years as superintendent in the district.
Table 19 Coefficientsa
Model
Unstandardized Coefficients
Standardized Coefficients
t Sig.
Collinearity Statistics
B Std. Error Beta Tolerance VIF 1 (Constant) -99.689 54.802 -1.819 .071
FacAdvDeg .480 .073 .420 6.608 .000 .914 1.094
FacAtttendance 1.474 .559 .167 2.637 .009 .919 1.089
SpEdPercent .092 .339 .018 .270 .787 .837 1.195
FreeRedLunch -.169 .077 -.254 -2.184 .030 .272 3.674 ELLRate .048 .303 .016 .159 .874 .369 2.712 ChronAbsent -.043 .278 -.013 -.155 .877 .561 1.783
SuperYrs .526 .301 .109 1.746 .083 .947 1.056
a. Dependent Variable: PARCCELALGr5

108
Table 20 Collinearity Diagnosticsa
Model Dimension Eigen value
Condition Index
Variance Proportions
(Constant) FacAd
Deg Fac
Atttendance SpEd
Percent FreeRed Lunch
1 1 6.636 1.000 .00 .00 .00 .00 .00 2 .680 3.123 .00 .01 .00 .00 .04 3 .342 4.405 .00 .01 .00 .00 .00 4 .187 5.959 .00 .07 .00 .00 .06 5 .079 9.162 .00 .27 .00 .10 .21 6 .058 10.712 .00 .46 .00 .03 .61 7 .018 19.457 .00 .16 .00 .83 .07 8 .000 197.555 1.00 .02 .99 .03 .01
The second aspect of research question 2 was the impact of the total number of years as a
superintendent on the outcome variable of 2017 PARCC Grade 5 ELA/L scores. The following
model was developed and run through a multiple regression using SPSS utilizing the following
variables in Table 21.
Table 21 Total Years as a Superintendent Years – 2017 PARCC Grade 5 ELA/L Variables Entered/Removeda
Model Variables Entered Variables Removed Method
1 SuperYrsTtl, FreeRedLunch, FacAtttendance, SpEdPercent, FacAdvDeg, ChronAbsent, ELLRateb
. Enter
a. Dependent Variable: PARCCELALGr5 b. All requested variables entered.
In Table 22 and Table 23, the model summary indicated an R2 value of 0.321 and an
adjusted R2 value of 0.295. The maximum and minimum values of R2 were +1.00 to -1.00. The
values identified positive and negative direction of relationship. This model indicated a positive
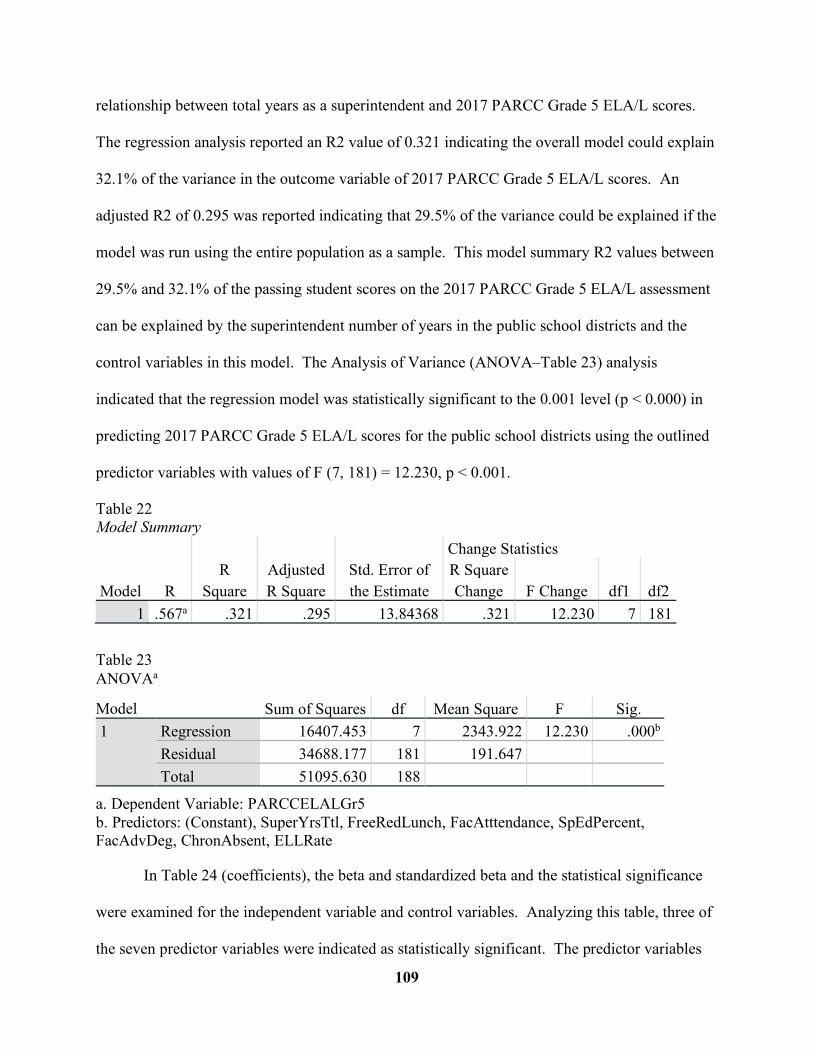
109
relationship between total years as a superintendent and 2017 PARCC Grade 5 ELA/L scores.
The regression analysis reported an R2 value of 0.321 indicating the overall model could explain
32.1% of the variance in the outcome variable of 2017 PARCC Grade 5 ELA/L scores. An
adjusted R2 of 0.295 was reported indicating that 29.5% of the variance could be explained if the
model was run using the entire population as a sample. This model summary R2 values between
29.5% and 32.1% of the passing student scores on the 2017 PARCC Grade 5 ELA/L assessment
can be explained by the superintendent number of years in the public school districts and the
control variables in this model. The Analysis of Variance (ANOVA–Table 23) analysis
indicated that the regression model was statistically significant to the 0.001 level (p < 0.000) in
predicting 2017 PARCC Grade 5 ELA/L scores for the public school districts using the outlined
predictor variables with values of F (7, 181) = 12.230, p < 0.001.
Table 22 Model Summary
Model R R
Square Adjusted R Square
Std. Error of the Estimate
Change Statistics R Square Change F Change df1 df2
1 .567a .321 .295 13.84368 .321 12.230 7 181
Table 23 ANOVAa
Model Sum of Squares df Mean Square F Sig. 1 Regression 16407.453 7 2343.922 12.230 .000b
Residual 34688.177 181 191.647 Total 51095.630 188
a. Dependent Variable: PARCCELALGr5 b. Predictors: (Constant), SuperYrsTtl, FreeRedLunch, FacAtttendance, SpEdPercent, FacAdvDeg, ChronAbsent, ELLRate
In Table 24 (coefficients), the beta and standardized beta and the statistical significance
were examined for the independent variable and control variables. Analyzing this table, three of
the seven predictor variables were indicated as statistically significant. The predictor variables

110
identified as statistically significant to the explained variance of 2017 PARCC Grade 5 ELA/L
scores were as follows: faculty advanced degree (b = 0.467, B = 0.409, t (188) = 6.414, p =
0.000); free and reduced lunch (b = -0.183, B = -0.275, t (188) = -2.356, p = 0.020); and faculty
attendance rate (b = 1.372, B = 0.156, t (188) = 2.443, p = 0.016). The focus independent
variable of total years as a superintendent indicated as not being a statistically significant
relationship at the p = < .05 level with a value of (p = 0.634). Coefficients Table 24 indicated no
issues with multicollinearity and variance inflation factors (VIF) ranging from 1.011 to 3.636.
Based on the standardized beta weights for the significant predictor variables in
coefficients Table 24, the amount of variance on the outcome variable could be explained by the
predictor variable. Squaring the standardized beta values of each of the three significant
predictor variables denotes the strength of the predictor variables on the dependent variable,
district 2017 PARCC Grade 5 ELA/L scores. The strongest contributor to the academic success
of students in this model was the percentage of faculty advanced degrees (b = 0.467, B = 0.409, t
(188) = 6.414, p = 0.000), explaining 16.73% of the overall variance for 2017 PARCC Grade 5
ELA/L district scores. The positive beta score indicated that when there was a higher percentage
of faculty with advanced degrees the percentage of students meeting or exceeding 2017 PARCC
threshold scores increased. For every unit increase in a district’s faculty with advanced degrees,
the district 2017 PARCC Grade 5 ELA/L scores increased by 0.467 units.
The next strongest predictor of academic success was free and reduced lunch percentages
for the district (b = -0.183, B = -0.275, t (188) = -2.356, p = 0.020) explaining 7.56% of the
variance in 2017 PARCC Grade 5 ELA/L district scores. The negative beta value in this
predictor variable indicated that when free and reduced lunch percentages increased, the
percentage of students meeting or exceeding threshold scores on the 2017 PARCC Grade 5

111
ELA/L assessment decreased. For every unit increase in a district’s percentage of free and
reduced lunch students, the district 2017 PARCC ELA/L Grade 5 scores decreased by 0.183
units.
Faculty attendance rate percentage (b = 1.372, B = 0.156, t (188) = 2.443, p = 0.016) was
the third strongest predictor variable accounting for 2.43% of the overall variance of the outcome
variable district 2017 PARCC Grade 5 ELA/L scores. The positive beta score indicated that the
higher faculty attendance rate percentage, the higher percentage of students meeting or
exceeding the 2017 PARCC ELA/L score levels, resulting in a higher district passing percentage.
For every unit increase in a district’s faculty with advanced degrees, the district 2017 PARCC
ELA/L Grade 5 scores increased by 1.372 units.
The model indicated that faculty with advanced degrees, free and reduced lunch
percentages, and faculty attendance rate were significant predictors to the 2017 PARCC Grade 5
ELA/L district level scores. No other variables were considered significant in this regression
model inclusive of the focus control variable of total number of years as a superintendent.
Table 24 Coefficientsa
Model
Unstandardized Coefficients
Standardized Coefficients
t Sig.
Collinearity Statistics
B Std. Error Beta Tolerance VIF 1 (Constant) -86.762 54.753 -1.585 .115
FacAdvDeg .467 .073 .409 6.414 .000 .922 1.085 FacAtttendance 1.372 .562 .156 2.443 .016 .925 1.081 SpEdPercent .056 .342 .011 .165 .869 .837 1.195 FreeRedLunch -.183 .078 -.275 -2.356 .020 .275 3.636 ELLRate .110 .303 .036 .363 .717 .374 2.676 ChronAbsent -.057 .280 -.017 -.204 .838 .562 1.781 SuperYrsTtl .096 .202 .029 .476 .634 .989 1.011
a. Dependent Variable: PARCCELALGr5

112
Table 25 Collinearity Diagnosticsa
Model Dimension Eigen value
Condition Index
Variance Proportions
(Constant) FacAdv
Deg Fac
Atttendance SpEd
Percent FreeRed Lunch
1 1 6.702 1.000 .00 .00 .00 .00 .00 2 .691 3.114 .00 .01 .00 .00 .04 3 .254 5.137 .00 .02 .00 .00 .00 4 .197 5.831 .00 .06 .00 .00 .07 5 .078 9.298 .00 .27 .00 .11 .21 6 .060 10.541 .00 .47 .00 .02 .58 7 .018 19.412 .00 .15 .00 .83 .09
In reviewing Tables 16–25, three predictor variables were determined to be statistically
significant in both models. The predictor variable of faculty with advanced degrees was a
significant influencer of 2017 PARCC Grade 5 ELA/L scores to the p < 0.001 level in both
models as the significance was p = 0.000.
The next biggest impacting variable significant in both models was the free and reduced
lunch percentage rates for the public school districts. Both models indicated a statistical
significance to the p < 0.05 level with models 3 and 4 indicating a significance level of 0.030 and
0.020 respectively. This relationship was a negative one in both models which indicated that
when the percentage of students with free and reduced lunch status increased, the Grade 5
ELA/L scores decreased. In the regression models for Grade 5 ELA/L, the faculty attendance
percentage rate was also considered significant at the p < .05 level as the values for the
significance were 0.009 and 0.016.
All other predictor variables input into these models were not considered significant to
the p =< 0.05 level, including the main target predictor values of superintendent years in the
district and total years as a superintendent and the superintendent longevity impact on Grade 5
ELA/L PARCC district scores.

113
Null Hypothesis 2:
No statistically significant relationship exists between a New Jersey school
superintendent’s length of time in a school district and student academic achievement, as
evidenced by the 2017 PARCC scores in Grade 5 English Language Arts/Literacy when
controlling for school and student characteristics.
The null hypothesis is retained for research question one based on the data analysis and
findings discussed from the SPSS output tables in the multiple regression. Superintendent years
of experience in district and total years of experience was determined not to be a significant
predictor variable of 2017 PARCC ELA/L Grade 5 district scores. SuperYrs (B = 0.109, p =
0.083); SuperYrsTtl (B = 0.029, p = 0.476)
Research Question 3:
What is the relationship between New Jersey public school superintendent longevity and
student achievement as measured by 2017 Partnership for Assessment of Readiness for College
and Careers (PARCC) Algebra 1 when controlling for school and student characteristics?
To answer this research question regarding district leadership and PARCC Algebra 1
scores, a simultaneous multiple regression analysis was conducted that included one independent
variable of superintendent years of experience in district, the six control variables, and the
dependent variable of 2017 district PARCC Algebra 1 district scores as indicated in Table 26.

114
Table 26 Superintendent Years in District – 2017 PARCC Algebra 1 Variables Entered/Removeda
Model Variables Entered Variables Removed Method 1 SuperYrs,
FreeRedLunch, SpEdPercent, FacMobRate, FacAtttendance, FacAdvDeg, ChronAbsentb
. Enter
a. Dependent Variable: PARCCAlg1 b. All requested variables entered
In Table 27s and 28, the model summary indicated an R2 value of 0.347 and an adjusted
R2 value of 0.321. The maximum and minimum values of R2 were +1.00 to -1.00. The values
identified positive and negative direction of relationship. This model indicated a positive
relationship between years in district as a superintendent and 2017 PARCC Algebra 1 scores.
The regression analysis reported an R2 value of 0.347 indicating the overall model could explain
34.7% of the variance in the outcome variable of 2017 PARCC Algebra 1 scores. An adjusted
R2 of 0.321 was reported indicating that 32.1% of the variance could be explained if the model
was run using the entire population as a sample.
This model summary R2 values between 32.1% and 34.7% of the passing student scores
on the 2017 PARCC Algebra 1 assessment can be explained by the superintendent number of
years in the public school district and the control variables in this model. The Analysis of
Variance (ANOVA–Table 28) analysis indicated that the regression model was statistically
significant to the 0.001 level (p < 0.000) in predicting 2017 PARCC Algebra 1 scores for the
public school districts using the outlined predictor variables with values of F (7, 181) = 13.710, p
< 0.001.

115
Table 27 Model Summary
Model R R
Square Adjusted R Square
Std. Error of the Estimate
Change Statistics R Square Change F Change df1 df2
1 .589a .347 .321 15.44607 .347 13.710 7 181
Table 28 ANOVAa
Model Sum of Squares df Mean Square F Sig. 1 Regression 22896.734 7 3270.962 13.710 .000b
Residual 43183.181 181 238.581 Total 66079.915 188
a. Dependent Variable: PARCCAlg1
In Table 29 (coefficients), the beta and standardized beta and the statistical significance
were examined for the independent variable and control variables. Analyzing this table, four of
the seven predictor variables were indicated as statistically significant including the main focus
predictor variable of superintendent years in the district. The predictor variables identified as
statistically significant to the explained variance of 2017 PARCC Algebra 1 scores were as
follows: faculty advanced degree (b = 0.520, B = 0.400, t (188) = 6.368, p = 0.000); free and
reduced lunch (b = -0.264, B = -0.350, t (188) = -3.040, p = 0.003); faculty attendance rate (b =
2.341, B = 0.233, t (188) = 3.724, p = 0.000); and the focus predictor variable of superintendent
years in district indicated as being a statistically significant relationship (b = 0.669, B = 0.122, t
(188) = 1.975, p = 0.050. Coefficients Table 29 indicated no issues with multicollinearity and
variance inflation factors (VIF) ranging from 1.056 to 3.674.
Based on the standardized beta weights for the significant predictor variables in
coefficients Table 29, the amount of variance on the outcome variable could be explained by the
predictor variable. Squaring the standardized beta values of each of the four significant predictor

116
variables denotes the strength of the predictor variables on the dependent variable, district 2017
PARCC Algebra 1 scores. The strongest contributor to the academic success of students in this
model was the percentage of faculty advanced degrees (b = 0.520, B = 0.400, t (188) = 6.368, p =
0.000), explaining 16% of the overall variance for 2017 PARCC Algebra 1 district scores. The
positive beta score indicated that when there was a higher percentage of faculty with advanced
degrees the percentage of students meeting or exceeding 2017 PARCC threshold scores
increased. For every unit increase in a district’s faculty with advanced degrees, the district 2017
PARCC Algebra 1 scores increased by 0.520 units.
The next strongest predictor of academic success was free and reduced lunch percentages
for the district (b = -0.264, B = -0.350, t (188) = -3.040, p = 0.003), explaining 12.25% of the
variance in 2017 PARCC Algebra 1 district scores. The negative beta value in this predictor
variable indicated that when free and reduced lunch percentages increased, the percentage of
students meeting or exceeding threshold scores on the 2017 PARCC Algebra 1 assessment
decreased. For every unit increase in a district’s percentage of free and reduced lunch students,
the district 2017 PARCC Algebra 1 scores decreased by 0.264 units.
Faculty attendance rate percentage (b = 2.341, B = 0.233, t (188) = 3.724, p = 0.000) was
the third strongest predictor variable accounting for 5.43% of the overall variance of the outcome
variable district 2017 PARCC Algebra 1 scores. The positive beta score indicated that the higher
faculty attendance rate percentage, the higher percentage of students meeting or exceeding the
2017 PARCC Algebra 1 score levels, resulting in a higher district passing percentage. For every
unit increase in a district’s faculty with advanced degrees, the district 2017 PARCC Algebra 1
scores increased by 2.341 units.
In this model the focus predictor variable of superintendent years in the district was the

117
fourth strongest significant variable (b = 0.669, B = .122, t (188) = 1.975, p = 0.050) accounting
for 1.49% of the overall variance of the outcome variable district 2017 PARCC Algebra 1 scores.
The positive beta score indicated that the higher faculty attendance rate percentage, the higher
percentage of students meeting or exceeding the 2017 PARCC Algebra 1 score levels, resulting
in a higher district passing percentage. For every unit increase in years of experience of the
superintendent in district, the district 2017 PARCC Algebra 1 scores increased by 0.669 units.
The model indicated that faculty with advanced degrees, free and reduced lunch
percentages, faculty attendance rate, and superintendent years in district were significant
predictors to the 2017 PARCC Algebra 1 district level scores. No other variables were
considered significant in this regression.
Table 29 Coefficientsa
Model
Unstandardized Coefficients
Standardized Coefficients
t Sig.
Collinearity Statistics
B Std. Error Beta Tolerance VIF 1 (Constant) -207.151 61.619 -3.362 .001
FacAdvDeg .520 .082 .400 6.368 .000 .914 1.094 FacAtttendance 2.341 .629 .233 3.724 .000 .919 1.089 SpEdPercent .080 .382 .014 .209 .835 .837 1.195 FreeRedLunch -.264 .087 -.350 -3.040 .003 .272 3.674 ELLRate .400 .341 .116 1.175 .242 .369 2.712 ChronAbsent .235 .312 .060 .753 .452 .561 1.783 SuperYrs .669 .339 .122 1.975 .050 .947 1.056
a. Dependent Variable: PARCCAlg1

118
Table 30 Collinearity Diagnostics
Model Dimension Eigen value
Condition Index
Variance Proportions
(Constant) FacAdv
Deg Fac
Atttendance SpEd
Percent FreeRed Lunch
1 1 6.636 1.000 .00 .00 .00 .00 .00 2 .680 3.123 .00 .01 .00 .00 .04 3 .342 4.405 .00 .01 .00 .00 .00 4 .187 5.959 .00 .07 .00 .00 .06 5 .079 9.162 .00 .27 .00 .10 .21 6 .058 10.712 .00 .46 .00 .03 .61 7 .018 19.457 .00 .16 .00 .83 .07 8 .000 197.555 1.00 .02 .99 .03 .01
The second aspect of research question 3 focused on the impact of the total number of
years as a superintendent on the outcome variable of 2017 PARCC Algebra 1 district math
scores. The following model was developed and run through a simultaneous multiple regression
using SPSS using the variables in Table 31.
Table 31 Total Number of Years as a Superintendent – 2017 PARCC Algebra 1 Scores Variables Entered/Removeda
Model Variables Entered Variables Removed Method 1 SuperYrsTtl,
FreeRedLunch, FacAtttendance, SpEdPercent, FacAdvDeg, ChronAbsent, ELLRateb
. Enter
a. Dependent Variable: PARCCAlg1 b. All requested variables entered
In Table 32 and Table 33, the model summary indicated an R2 value of 0.339 and an
adjusted R2 value of 0.313. The maximum and minimum values of R2 were +1.00 to -1.00. The
values identified positive and negative direction of relationship. This model indicated a positive

119
relationship between total years as a superintendent and 2017 PARCC Algebra 1 scores. The
regression analysis reported an R2 value of 0.339 indicating the overall model could explain
33.9% of the variance in the outcome variable of 2017 PARCC Algebra 1 Grade 5 scores. An
adjusted R2 of 0.313 was reported indicating that 31.3% of the variance could be explained if the
model was run using the entire population as a sample. This model summary R2 values between
31.3% and 33.9% of the passing student scores on the 2017 PARCC Algebra 1 assessment can
be explained by the total years as a superintendent and the control variables in this model. The
Analysis of Variance (ANOVA–Table 32) analysis indicated that the regression model was
statistically significant to the 0.001 level (p < 0.000) in predicting 2017 PARCC Algebra 1
scores for the public school districts using the outlined predictor variables with values of F (7,
181) = 13.240, p < 0.001.
Table 32 Model Summary
Model R R
Square Adjusted R Square
Std. Error of the Estimate
Change Statistics R Square Change F Change df1 df2
1 .582a .339 .313 15.53872 .339 13.240 7 181
Table 33 ANOVAa
Model Sum of Squares df Mean Square F Sig.
1 Regression 22377.149 7 3196.736 13.240 .000b Residual 43702.766 181 241.452 Total 66079.915 188
a. Dependent Variable: PARCCAlg1 b. Predictors: (Constant), SuperYrsTtl, FreeRedLunch, FacAtttendance, SpEdPercent, FacAdvDeg, ChronAbsent, ELLRate
In Table 34 (coefficients), the beta and standardized beta and the statistical significance
were examined for the independent variable and control variables. Analyzing this table, three of
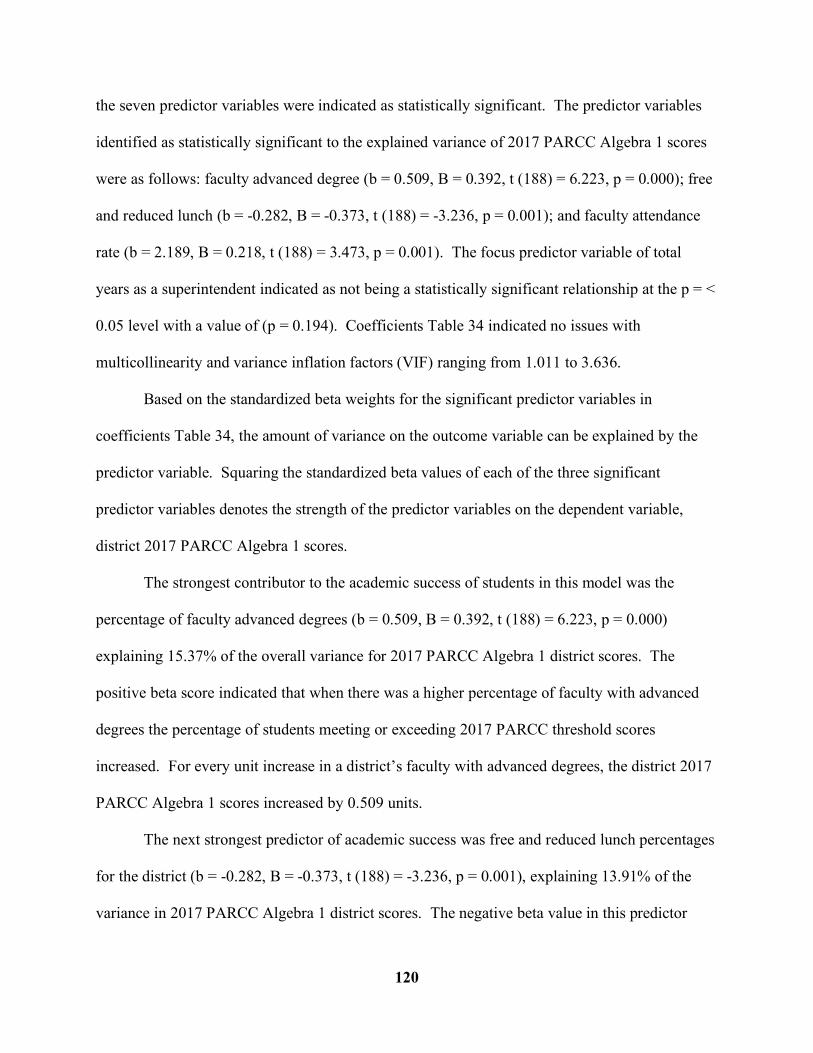
120
the seven predictor variables were indicated as statistically significant. The predictor variables
identified as statistically significant to the explained variance of 2017 PARCC Algebra 1 scores
were as follows: faculty advanced degree (b = 0.509, B = 0.392, t (188) = 6.223, p = 0.000); free
and reduced lunch (b = -0.282, B = -0.373, t (188) = -3.236, p = 0.001); and faculty attendance
rate (b = 2.189, B = 0.218, t (188) = 3.473, p = 0.001). The focus predictor variable of total
years as a superintendent indicated as not being a statistically significant relationship at the p = <
0.05 level with a value of (p = 0.194). Coefficients Table 34 indicated no issues with
multicollinearity and variance inflation factors (VIF) ranging from 1.011 to 3.636.
Based on the standardized beta weights for the significant predictor variables in
coefficients Table 34, the amount of variance on the outcome variable can be explained by the
predictor variable. Squaring the standardized beta values of each of the three significant
predictor variables denotes the strength of the predictor variables on the dependent variable,
district 2017 PARCC Algebra 1 scores.
The strongest contributor to the academic success of students in this model was the
percentage of faculty advanced degrees (b = 0.509, B = 0.392, t (188) = 6.223, p = 0.000)
explaining 15.37% of the overall variance for 2017 PARCC Algebra 1 district scores. The
positive beta score indicated that when there was a higher percentage of faculty with advanced
degrees the percentage of students meeting or exceeding 2017 PARCC threshold scores
increased. For every unit increase in a district’s faculty with advanced degrees, the district 2017
PARCC Algebra 1 scores increased by 0.509 units.
The next strongest predictor of academic success was free and reduced lunch percentages
for the district (b = -0.282, B = -0.373, t (188) = -3.236, p = 0.001), explaining 13.91% of the
variance in 2017 PARCC Algebra 1 district scores. The negative beta value in this predictor

121
variable indicated that when free and reduced lunch percentages increased, the percentage of
students meeting or exceeding threshold scores on the 2017 PARCC Algebra 1 assessment
decreased. For every unit increase in a district’s percentage of free and reduced lunch students,
the district 2017 PARCC Algebra 1 score decreased by 0.282 units.
Faculty attendance rate percentage (b = 2.189, B = 0.218, t (188) = 3.473, p = 0.001) was
the third strongest predictor variable accounting for 4.75% of the overall variance of the outcome
variable district 2017 PARCC Algebra 1 scores. The positive beta score indicated that the higher
faculty attendance rate percentage, the higher percentage of students meeting or exceeding the
2017 PARCC Algebra 1 score levels, resulting in a higher district passing percentage. For every
unit increase in a district’s faculty attendance rate, the district 2017 PARCC Algebra 1 score
increased by 2.189 units.
The model indicated that faculty with advanced degrees, free and reduced lunch
percentages, and faculty attendance rate were significant predictors to the 2017 PARCC Algebra
1 district level scores. No other variables were considered significant in this regression model
inclusive of the focus control variable of total number of years as a superintendent.

122
Table 35 Collinearity Diagnosticsa
Model Dimension Eigen value
Condition Index
Variance Proportions
(Constant) FacAdv
Deg Fac
Atttendance SpEd
Percent FreeRed Lunch
1 1 6.702 1.000 .00 .00 .00 .00 .00 2 .691 3.114 .00 .01 .00 .00 .04 3 .254 5.137 .00 .02 .00 .00 .00 4 .197 5.831 .00 .06 .00 .00 .07 5 .078 9.298 .00 .27 .00 .11 .21 6 .060 10.541 .00 .47 .00 .02 .58 7 .018 19.412 .00 .15 .00 .83 .09 8 .000 197.352 1.00 .03 1.00 .03 .01
In reviewing Tables 26–35, it is clear that once again in our models, there are three
predictor variables that were determined to be statistically significant in multiple times across all
six models. The predictor variable of faculty with advanced degrees was a significant influencer
of 2017 PARCC Algebra 1 math scores to the p < 0.001 level in all six models as the
significance was 0.000.
The next biggest impacting variable significant in all of the models five and six tested
was the free and reduced lunch percentage rates for the public school districts. All three models
indicated a statistical significance to the p < 0.01 level with model five and six indicating a
significance level ranging from 0.001 to 0.003. This relationship was a negative one in all six
models which indicates that when the percentage of students with free and reduced lunch status
increased, the Algebra 1 scores decreased for students and districts.
The third most impactful predictor variable for the dependent variable of Algebra 1
scores was the faculty attendance percentage rate for the public school districts. All six models
indicated a positive relationship between increased districts faculty attendance rate and the
increased percentage of students meeting or exceeding threshold levels for the 2017 PARCC
Algebra 1 assessment levels for the sample public school districts. An area of significance in

123
this model not been present in previous models was the focus predictor variable of
superintendent years in the district which in the model run for Algebra 1 indicated it was a
significant predictor variable that had a positive influence on the outcome variable of 2017
PARCC Algebra 1 math scores for the sample districts tested. All other variables input into
these models were not considered significant, including the main target predictor variable of total
years as a superintendent and its impact on 2017 PARCC Algebra 1 assessment district scores.
Null Hypothesis 3:
No statistically significant relationship exists between a New Jersey school
superintendent’s length of time in a school district and student academic achievement, as
evidenced by the 2017 PARCC scores in Algebra 1 when controlling for school and student
characteristics.
The null hypothesis is rejected for aspect one of research question three, superintendent
years of experience in district and 2017 PARCC Algebra 1 district scores based on the data
analysis and findings discussed from the SPSS multiple regression. The predictor variable was
determined to be statistically significant (B = 0.122, p = 0.050). The null hypothesis is retained
for aspect two of research question three based on the data analysis and findings discussed from
the SPSS output tables in the multiple regressions. Total years of experience was not determined
to be a significant predictor variable of 2017 PARCC Algebra 1 district scores. SuperYrsTtl (B
= 0.079, p = 0.194).
Research Question 4:
What is the relationship between New Jersey public school superintendent longevity and
student achievement as measured by Spring 2017 Partnership for Assessment of Readiness for
College and Careers (PARCC) English Language Arts/Literacy 10 when controlling for school

124
and student characteristics?
In an attempt to answer research question four regarding Grade 10 ELA/L PARCC
scores, a simultaneous multiple regression analysis was conducted using the SPSS program that
included one independent variable of superintendent years of experience in district, the six
control variables, and the dependent variable of 2017 district PARCC Grade 10 ELA/L scores as
indicated in Table 36.
Table 36 Superintendent Years in District – 2017 PARCC Grade 10 ELA/L Variables Entered/Removeda
Model Variables Entered Variables Removed Method 1 SuperYrs,
FreeRedLunch, SpEdPercent, FacMobRate, FacAtttendance, FacAdvDeg, ChronAbsentb
. Enter
a. Dependent Variable: PARCCELALGr10 b. All requested variables entered
In Tables 37 and 38, the model summary indicated an R2 value of 0.284 and an adjusted
R2 value of 0.256. The maximum and minimum values of R2 were +1.00 to -1.00. The values
identified positive and negative direction of relationship. This model indicated a positive
relationship between years in district as a superintendent and 2017 PARCC Grade 10 ELA/L
scores. The regression analysis reported an R2 value of 0.284 indicating the overall model can
explain 28.4% of the variance in the outcome variable of 2017 PARCC Grade 10 ELA/L scores.
An adjusted R2 of 0.256 was reported indicating that 25.6% of the variance could be explained if
the model was run using the entire population as a sample. This model summary R2 values
between 25.6% and 28.4% of the proficient student scores on the 2017 PARCC Grade 10 ELA/L

125
assessment can be explained by the superintendent number of years in the public school districts
and the control variables in this model. The Analysis of Variance (ANOVA–Table 38) analysis
indicated that the regression model was statistically significant to the 0.001 level (p < 0.000) in
predicting 2017 PARCC Grade 10 ELA/L scores for the public school districts using the outlined
predictor variables with values of F (7, 181) = 10.260, p < 0.001.
Table 37 Model Summary
Model R R Square Adjusted R
Square Std. Error of the Estimate
Change Statistics R Square Change F Change df1 df2
1 .533a .284 .256 13.73297 .284 10.260 7 181
Table 38 ANOVAa
Model Sum of Squares df Mean Square F Sig.
1 Regression 13544.236 7 1934.891 10.260 .000b Residual 34135.574 181 188.594 Total 47679.810 188
a. Dependent Variable: PARCCELALGr10 b. Predictors: (Constant), SuperYrs, FreeRedLunch, SpEdPercent, FacAtttendance, FacAdvDeg, ChronAbsent, ELLRate
In Table 39 (coefficients), the beta and standardized beta and the statistical significance
were examined for the independent variable and control variables. Analyzing this table, three of
the seven predictor variables were indicated as statistically significant. The predictor variables
identified as statistically significant to the explained variance of 2017 PARCC Grade 10 ELA/L
scores were as follows: faculty advanced degree (b = 0.404, B = 0.366, t (188) = 5.541, p =
0.000); free and reduced lunch (b = -0.160, B = -0.249, t (188) = -3.104, p = 0.002); and faculty
attendance rate (b = 1.687, B = 0.198, t (188) = 3.014, p = 0.003). The focus independent
variable of years as superintendent in the district indicated as not being a statistically significant

126
relationship at the p = < 0.05 level with a value of (p = 0.068). Coefficients Table 39 indicated
no issues with multicollinearity and variance inflation factors (VIF) ranging from 1.056 to 3.674.
Based on the standardized beta weights for the significant predictor variables in
coefficients Table 39, the amount of variance on the outcome variable can be explained by the
predictor variable. Squaring the standardized beta values of each of the three significant
predictor variables denotes the strength of the predictor variables on the dependent variable,
district 2017 PARCC Grade 10 ELA/L scores. The strongest contributor to the academic success
of students in this model was the percentage of faculty advanced degrees (b = 0.404, B = 0.366, t
(188) = 5.541, p = 0.000), explaining 12.39% of the overall variance for 2017 PARCC Grade 10
ELA/L district scores. The positive beta score indicated that when there was a higher percentage
of faculty with advanced degrees the percentage of students meeting or exceeding 2017 PARCC
threshold scores increased. For every unit increase in a district’s faculty with advanced degrees,
the district 2017 PARCC Grade 10 ELA/L scores increased by 0.404 units.
The next strongest predictor of academic success was free and reduced lunch percentages
for the district (b = -0.160, B = -0.249, t (188) = -3.104, p = 0.002), explaining 6.20% of the
variance in 2017 PARCC Grade 10 ELA/L district scores. The negative beta value in this
predictor variable indicated that when free and reduced lunch percentages increased, the
percentage of students meeting or exceeding threshold scores on the 2017 PARCC Grade 10
ELA/L assessment decreased. For every unit increase in a district’s percentage of free and
reduced lunch students, the district 2017 PARCC Grade 5 math scores decreased by 0.160 units.
Faculty attendance rate percentage (b = 1.687, B = 0.198, t (188) = 3.014, p = 0.003) was
the third strongest predictor variable accounting for 3.92% of the overall variance of the outcome
variable district 2017 PARCC Grade 10 ELA/L scores. The positive beta score indicated that the

127
higher faculty attendance rate percentage, the higher percentage of students meeting or
exceeding the 2017 PARCC Grade 10 ELA/L score levels, resulting in a higher district passing
percentage. For every unit increase in a district’s faculty with advanced degrees, the district
2017 PARCC Grade 10 ELA/L score increased by 1.687 units.
Table 39 Coefficientsa
Model
Unstandardized Coefficients
Standardized Coefficients
t Sig.
Collinearity Statistics
B Std. Error Beta Tolerance VIF 1 (Constant) -112.903 63.031 -1.791 .075
FacAdvDeg .404 .073 .366 5.541 .000 .908 1.102 FacMobRate -.211 .312 -.043 -.675 .501 .969 1.032 FacAtttendance 1.687 .560 .198 3.014 .003 .917 1.090 SpEdPercent .013 .317 .003 .040 .968 .961 1.040 FreeRedLunch -.160 .051 -.249 -3.104 .002 .617 1.621 ChronAbsent .129 .265 .039 .488 .626 .618 1.619 SuperYrs .552 .300 .118 1.838 .068 .953 1.050
Table 40 Collinearity Diagnosticsa
Model Dimension Eigen value
Condition Index
Variance Proportions
(Constant) FacAdv
Deg Fac
Atttendance SpEd Percent
FreeRed Lunch
1 1 6.636 1.000 .00 .00 .00 .00 .00 2 .680 3.123 .00 .01 .00 .00 .04 3 .342 4.405 .00 .01 .00 .00 .00 4 .187 5.959 .00 .07 .00 .00 .06 5 .079 9.162 .00 .27 .00 .10 .21 6 .058 10.712 .00 .46 .00 .03 .61 7 .018 19.457 .00 .16 .00 .83 .07 8 .000 197.555 1.00 .02 .99 .03 .01
The secondary aspect of research question four focuses on the impact of the total number
of years as a superintendent on the outcome variable of 2017 PARCC Grade 10 ELA/L district

128
scores. The following model was developed and run through a simultaneous multiple regression
using SPSS using the variables in Table 41.
Table 41 Total Number of Years as a Superintendent – 2017 PARCC Grade 10 ELA/L scores Variables Entered/Removeda Model Variables Entered Variables Removed Method 1 SuperYrsTtl,
FreeRedLunch, FacAtttendance, SpEdPercent, FacMobRate, FacAdvDeg, ChronAbsentb
. Enter
a. Dependent Variable: PARCCELALGr10 b. All requested variables entered
In Table 42 and Table 43 below, the model summary indicated an R2 value of 0.276 and
an adjusted R2 value of 0.248. The maximum and minimum values of R2 were +1.00 to -1.00.
The values identified positive and negative direction of relationship. This model indicated a
positive relationship between total number of years as a superintendent and 2017 PARCC Grade
10 ELA/L scores. The regression analysis reported an R2 value of 0.276 indicating the overall
model can explain 27.6% of the variance in the outcome variable of 2017 PARCC Grade 10
ELA/L scores. An adjusted R2 of 0.248 was reported indicating that 24.8% of the variance
could be explained if the model was run using the entire population as a sample. This model
summary R2 values between 24.8% and 27.6% of the passing student scores on the 2017
PARCC Grade 10 ELA/L assessment can be explained by the total number of years as a
superintendent in the public school districts and the control variables in this model. The
Analysis of Variance (ANOVA–Table 43) analysis indicated that the regression model was
statistically significant to the 0.001 level (p < 0.000) in predicting 2017 PARCC Grade 10

129
ELA/L scores for the public school districts using the outlined predictor variables with values of
F (7, 181) = 9.878, p < 0.001.
Table 42 Model Summary
Model R R Square Adjusted R Square
Std. Error of the Estimate
Change Statistics R Square Change F Change df1 df2
1 .526a .276 .248 13.80611 .276 9.878 7 181
Table 43 ANOVAa
Model Sum of Squares df Mean Square F Sig. 1 Regression 13179.663 7 1882.809 9.878 .000b
Residual 34500.146 181 190.609 Total 47679.810 188
a. Dependent Variable: PARCCELALGr10 b. Predictors: (Constant), SuperYrsTtl, FreeRedLunch, FacAtttendance, SpEdPercent, FacAdvDeg, ChronAbsent, ELLRate
In Table 44 (coefficients), the beta and standardized beta and the statistical significance
were examined for the independent variable and control variables. Analyzing this table, three of
the seven predictor variables were indicated as statistically significant. The predictor variables
identified as statistically significant to the explained variance of 2017 PARCC Grade 10 ELA/L
scores were as follows: faculty advanced degree (b = 0.387, B = 0.351, t (188) = 5.331, p =
0.000); free and reduced lunch (b = -0.218, B = -0.339, t (188) = -2.813, p = 0.005); and faculty
attendance rate (b = 1.648, B = 0.193, t (188) = 2.942, p = 0.004). The focus independent
variable of total years as a superintendent indicated as not being a statistically significant
relationship at the p = < 0.05 level with a value of (p = 0.346). Coefficients Table 44 indicated
no issues with multicollinearity and variance inflation factors (VIF) ranging from 1.011 to 3.636.
Based on the standardized beta weights for the significant predictor variables in
coefficients Table 44, the amount of variance on the outcome variable can be explained by the

130
predictor variable. Squaring the standardized beta values of each of the three significant
predictor variables denotes the strength of the predictor variables on the dependent variable,
district 2017 PARCC Grade 10 ELA/L scores. The strongest contributor to the academic success
of students in this model was the percentage of faculty advanced degrees (b = 0.387, B = 0.351, t
(188) = 5.331, p = 0.000), explaining 12.32% of the overall variance for 2017 PARCC Grade 10
ELA/L district scores. The positive beta score indicated that when there was a higher percentage
of faculty with advanced degrees the percentage of students meeting or exceeding 2017 PARCC
threshold scores increased. For every unit increase in a district’s faculty with advanced degrees,
the district 2017 PARCC Grade 10 ELA/L scores increased by 0.387 units.
The next strongest predictor of academic success was free and reduced lunch percentages
for the district (b = -0.218, B = -0.339, t (188) = -2.813, p = 0.005), explaining 11.49% of the
variance in 2017 PARCC Grade 10 ELA/L district scores. The negative beta value in this
predictor variable indicated that when free and reduced lunch percentages increased, the
percentage of students meeting or exceeding threshold scores on the 2017 PARCC Grade 10
ELA/L assessment decreased. For every unit increase in a district’s percentage of free and
reduced lunch students, the district 2017 PARCC Grade 10 ELA/L score decreased by 0.218
units.
Faculty attendance rate percentage (b = 1.648, B = 0.193, t (188) = 2.942, p = 0.004) was
the third strongest predictor variable accounting for 3.72% of the overall variance of the outcome
variable district 2017 PARCC Grade 10 ELA/L scores. The positive beta score indicated that the
higher faculty attendance rate percentage, the higher percentage of students meeting or
exceeding the 2017 PARCC Grade 10 ELA/L score levels, resulting in a higher district passing
percentage. For every unit increase in a district’s faculty with advanced degrees, the district

131
2017 PARCC Grade 10 ELA/L score increased by 1.648 units.
The model indicated that faculty with advanced degrees, free and reduced lunch
percentages, and faculty attendance rate were significant predictors to the 2017 PARCC Grade
10 ELA/L district level scores. No other variables were considered significant in this regression
model inclusive of the focus control variable of total number of years as a superintendent.
Table 44 Coefficientsa
Model
Unstandardized Coefficients
Standardized Coefficients
t Sig.
Collinearity Statistics
B Std. Error Beta Tolerance VIF 1 (Constant) -126.872 54.604 -2.323 .021
FacAdvDeg .387 .073 .351 5.331 .000 .922 1.085 FacAtttendance 1.648 .560 .193 2.942 .004 .925 1.081 SpEdPercent .055 .341 .011 .160 .873 .837 1.195 FreeRedLunch -.218 .077 -.339 -2.813 .005 .275 3.636 ELLRate .305 .303 .104 1.007 .315 .374 2.676 ChronAbsent .182 .279 .055 .651 .516 .562 1.781 SuperYrsTtl .190 .201 .060 .946 .346 .989 1.011
a. Dependent Variable: PARCCELALGr10 Table 45 Collinearity Diagnosticsa
Model Dimension Eigen value
Condition Index
Variance Proportions
(Constant) FacAdv
Deg Fac
Atttendance SpEd
Percent FreeRed Lunch
1 1 6.702 1.000 .00 .00 .00 .00 .00 2 .691 3.114 .00 .01 .00 .00 .04 3 .254 5.137 .00 .02 .00 .00 .00 4 .197 5.831 .00 .06 .00 .00 .07 5 .078 9.298 .00 .27 .00 .11 .21 6 .060 10.541 .00 .47 .00 .02 .58 7 .018 19.412 .00 .15 .00 .83 .09 8 .000 197.352 1.00 .03 1.00 .03 .01

132
In reviewing Tables 36–45, in models seven and eight three predictor variables were
determined to be statistically significant in multiple times across models. The predictor variable
of faculty with advanced degrees was a significant influencer of 2017 PARCC ELA/L 10 scores
to the p < 0.001 level in models seven and eight as the significance was 0.000 in both outputs.
The next biggest impacting variable significant in all of the models tested was the free
and reduced lunch percentage rates for the public school districts. Models seven and eight
indicated a statistical significance to the p < 0.01 level with models seven and eight indicating a
significance level ranging from 0.009 to 0.005. This relationship was negative in all models
indicating that when the percentage of students with free and reduced lunch status increased, the
PARCC ELA/L 10 scores decreased for students and districts.
The third most impactful predictor variable for the dependent variable of ELA/L10 scores
in models seven and eight was the faculty attendance percentage rate for the public school
districts. All models indicated a positive relationship between increased districts faculty
attendance rate and the increased percentage of students meeting or exceeding threshold levels
for the 2017 PARCC ELA/L 10 assessment levels for the sample public school districts. All
other variables input into models seven and eight were not considered significant, including the
main target predictor variable of total years as a superintendent and its impact on 2017 PARCC
Grade 10 ELA/L assessment district scores.
Null Hypothesis 4:
No statistically significant relationship exists between a New Jersey school
superintendent’s length of time in a school district and student academic achievement, as
evidenced by the 2017 PARCC scores in English Language Art/Literacy 10 when controlling for
school and student characteristics.

133
The null hypothesis is retained for research question one based on the data analysis and
findings discussed from the SPSS output tables in the multiple regression. Superintendent years
of experience in district and total years of experience was not determined to be a significant
predictor variable of 2017 PARCC ELA/L Grade 10 district scores. SuperYrs (B = 0.109, p =
0.094); SuperYrsTtl (B = 0.060, p = 0.346).
Research Question 5:
What is the relationship between New Jersey superintendent longevity and district faculty
mobility as evidenced by the 2017 School Performance Report faculty mobility rate percentage
when controlling for school and student characteristics?
In an attempt to answer this research question five regarding the impact of superintendent
longevity and experience with faculty mobility rate, a simultaneous multiple regression analysis
was conducted using the SPSS V. 26 program that included one independent variable of
superintendent years of experience in district, the six control variables, and the dependent
variable of 2017 district faculty mobility rate as indicated in Table 46.
Table 46 Variables Entered/Removeda
Model Variables Entered Variables Removed Method 1 SuperYrs,
FreeRedLunch, SpEdPercent, FacAtttendance, FacAdvDeg, ChronAbsent, ELLRateb
. Enter
a. Dependent Variable: FacMobRate b. All requested variables entered
In Tables 47 and Table 48, the model summary indicated an R2 value of 0.026 and an
adjusted R2 value of -0.012. The maximum and minimum values of R2 were +1.00 to -1.00.

134
The values identified positive and negative direction of relationship. This model indicated both a
positive and negative relationship between year in district as a superintendent and 2017 district
faculty mobility rate percentage. The regression analysis reported an R2 value of 0.026 and an
adjusted R2 value of -0.012 and a significance level of p = .678 indicating this was not a
statistically significant model. Inferences or assumptions cannot be made on this simultaneous
multiple regression analysis of the predictor and outcomes variables as the model was not
statistically significant. The Analysis of Variance analysis (ANOVA Table 48) confirmed that
this model was not a significant model and could not predict within the p =< .01 level the impact
of the predictor variables on the outcome variable of 2017 faculty mobility rate. The analysis
indicated that the simultaneous multiple regression model was not statistically significant to the
0.001 level (p < 0.001) in predicting 2017 faculty mobility rate for the public school districts
with values of F (7, 181) = 0.693, p = 0.678.
Table 47 Model Summary
Model R R Square Adjusted R Square
Std. Error of the Estimate
Change Statistics R Square Change F Change df1 df2
1 .162a .026 -.012 4.18354 .026 .693 7 181
Table 48 ANOVAa
Model Sum of Squares df Mean Square F Sig. 1 Regression 84.913 7 12.130 .693 .678b
Residual 3167.859 181 17.502 Total 3252.772 188
a. Dependent Variable: FacMobRate b. Predictors: (Constant), SuperYrs, FreeRedLunch, SpEdPercent, FacAtttendance, FacAdvDeg, ChronAbsent, ELLRate

135
In Tables 49 and 50 (coefficients and collinearity), the beta and standardized beta and the
statistical significance were examined for the predictor variable and control variables. Analyzing
this table there were no significant predictor variables on the outcome variable of faculty
mobility rate. The model was not considered statistically significant indicating assumed and
variable impacts cannot be determined to the p =< 0.05 level.
Based on the standardized beta weights for the significant predictor variables in
coefficients Table 49, any amount of variance on the outcome variable cannot be explained by
the predictor variable as this model was not statistically significant.
Table 49 Coefficientsa
Model
Unstandardized Coefficients
Standardized Coefficients
t Sig.
Collinearity Statistics
B Std. Error Beta Tolerance VIF 1 (Constant) 84.234 16.689 5.047 .000
FacAdvDeg .031 .022 .107 1.398 .164 .914 1.094 FacAtttendance .026 .170 .011 .150 .881 .919 1.089 SpEdPercent .017 .103 .013 .167 .868 .837 1.195 FreeRedLunch .011 .024 .065 .460 .646 .272 3.674 ELLRate -.095 .092 -.124 -
1.025 .307 .369 2.712
ChronAbsent -.032 .085 -.037 -.375 .708 .561 1.783 SuperYrs .106 .092 .087 1.157 .249 .947 1.056
a. Dependent Variable: FacMobRate Table 50 Collinearity Diagnosticsa
Model Dimension Eigen value
Condition Index
Variance Proportions
(Constant) FacAdv
Deg Fac
Atttendance SpEd
Percent FreeRed Lunch
1 1 6.636 1.000 .00 .00 .00 .00 .00 2 .680 3.123 .00 .01 .00 .00 .04 3 .342 4.405 .00 .01 .00 .00 .00 4 .187 5.959 .00 .07 .00 .00 .06 5 .079 9.162 .00 .27 .00 .10 .21 6 .058 10.712 .00 .46 .00 .03 .61 7 .018 19.457 .00 .16 .00 .83 .07 8 .000 197.555 1.00 .02 .99 .03 .01

136
The second aspect of research question 5 focused on the impact of the total number of
years as a superintendent on the outcome variable of 2017 faculty mobility rate percentages for
the sample school districts. The following model was developed and run through a multiple
regression using SPSS using the variables in Table 51.
Table 51 Variables Entered/Removeda
Model Variables Entered Variables Removed Method 1 SuperYrsTtl,
FreeRedLunch, FacAtttendance, SpEdPercent, FacAdvDeg, ChronAbsent, ELLRateb
. Enter
a. Dependent Variable: FacMobRate b. All requested variables entered.
In Tables 52 and Table 53, the model summary indicated an R2 value of 0.027 and an
adjusted R2 value of -0.011. The maximum and minimum values of R2 were +1.00 to -1.00.
The values identified positive and negative direction of relationship. This model indicated both a
positive and negative relationship between total years as a superintendent and 2017 district
faculty mobility rate percentage. The regression analysis reported an R2 value of 0.027 and an
R2 value of -0.011 and a significance level of p = 0.662 indicating this was not a statistically
significant model. Inferences or assumptions cannot be made on this simultaneous multiple
regression analysis of the predictor and outcomes variables as the model was not statistically
significant. The Analysis of Variance analysis (ANOVA Table 53) confirmed that this model
was not a significant model and could not predict within the p =< 0.01 level the impact of the
predictor variables on the outcome variable of 2017 faculty mobility rate. The analysis indicated

137
that the simultaneous multiple regression model was not statistically significant to the 0.001 level
(p < 0.001) in predicting 2017 faculty mobility rate for the public school districts with values of
F (7, 181) = 0.712, p = 0.662.
Table 52 Model Summary
Model R R
Square Adjusted R
Square Std. Error of the Estimate
Change Statistics R Square Change F Change df1 df2
1 .164a .027 -.011 4.18202 .027 .712 7 181
Table 53 ANOVAa
Model Sum of Squares df Mean Square F Sig. 1 Regression 87.214 7 12.459 .712 .662b
Residual 3165.558 181 17.489 Total 3252.772 188
a. Dependent Variable: FacMobRate b. Predictors: (Constant), SuperYrsTtl, FreeRedLunch, FacAtttendance, SpEdPercent, FacAdvDeg, ChronAbsent, ELLRate
In Tables 54 and 55 (coefficients and collinearity), the beta and standardized beta and the
statistical significance with values of F (7, 181) = 0.693, p = 0.678 for model nine and F (7, 181)
= 0.712, p = 0.662 for model 10 examined the impact of years as superintendent in the distirct
and total years as a superintendent, the control predictor variables, and the outcome variable of
district faculty mobility rate percetnage. Analyzing this table there were no significant predictor
variables on the outcome variable of faculty mobility rate. The model was not considered
statistically significant indicating assumed and variable impacts cannot be determined to the p =<
0.05 level.

138
Based on the standardized beta weights for the significant predictor variables in
coefficients Table 54, any amount of variance on the outcome variable cannot be explained by
the predictor variable as this model was not statistically significant.
Table 54 Coefficientsa
Model
Unstandardized Coefficients
Standardized Coefficients
t Sig.
Collinearity Statistics
B Std. Error Beta Tolerance VIF 1 (Constant) 87.042 16.540 5.262 .000
FacAdvDeg .030 .022 .104 1.361 .175 .922 1.085 FacAtttendance -.002 .170 -.001 -.011 .991 .925 1.081 SpEdPercent .006 .103 .005 .058 .954 .837 1.195 FreeRedLunch .008 .023 .049 .347 .729 .275 3.636 ELLRate -.081 .092 -.106 -.886 .377 .374 2.676 ChronAbsent -.034 .084 -.039 -.401 .689 .562 1.781 SuperYrsTtl .074 .061 .089 1.213 .227 .989 1.011
a. Dependent Variable: FacMobRate
Table 55 Collinearity Diagnosticsa
Model Dimension Eigen value
Condition Index
Variance Proportions
(Constant) FacAdv
Deg Fac
Atttendance SpEd
Percent FreeRed Lunch
1 1 6.702 1.000 .00 .00 .00 .00 .00 2 .691 3.114 .00 .01 .00 .00 .04 3 .254 5.137 .00 .02 .00 .00 .00 4 .197 5.831 .00 .06 .00 .00 .07 5 .078 9.298 .00 .27 .00 .11 .21 6 .060 10.541 .00 .47 .00 .02 .58 7 .018 19.412 .00 .15 .00 .83 .09 8 .000 197.352 1.00 .03 1.00 .03 .01
In reviewing Tables 46–55, models nine and ten were not statistically significant for the
model or any predictor variables input into the SSPS software program with values of F (7, 181)
= 0.693, p = 0.678 for model nine and F (7, 181) = 0.712, p = 0.662. The focus predictor
variables superintendent years in the district and total number of years as a superintendent were

139
not statistically significant nor were any of the control variables in these models. Contrary to the
previous eight models utilized, the model examining the dependent variable of faculty mobility
rate was determined not to be statistically significant to the P =< 0.001 level nor were any of the
predictor variables significant to the p =< 0.05 significance level.
Null Hypothesis 5:
No statistically significant relationship exists between a New Jersey school
superintendent’s length of time in a school district and district success, as evidenced by the 2017
district faculty mobility rate when controlling for school and student characteristics.
The null hypothesis is retained for research question one based on the data analysis and
findings discussed from the SPSS output tables in the multiple regression. Superintendent years
of experience in district and total years of experience was determined not to be a significant
predictor variable of 2017 faculty mobility rate district percentages. SuperYrs (B = 0.087, p =
0.249); SuperYrsTtl (B = 0.089, p = 0.227).
Summary
In conclusion, the null hypothesis for four of the five research questions presented in this
research paper were retained. Ten models of statistical analysis were developed based on the
five research questions and nine of the ten models indicated that no significant relationship exists
between superintendent longevity and resulting academic achievement on the 2017 PARCC
assessment in Grade 5 math/ELA/L, Algebra 1, or Grade 10 ELA/L at the district level. There
was one exception of superintendent years in the district and 2017 PARCC Algebra 1 district
scores. Model five indicated that there was a statistically significant relationship between
superintendent years in district and 2017 PARCC Algebra 1 scores. Of the remaining predictor
variables, three control variables were determined to have a statistically significant impact on the

140
outcome variables of academic success. Percentage of faculty with advanced degrees, free and
reduced lunch percentages, and faculty attendance rate percentages were all found to be
statistically significant predictors of academic success at the district level. Models nine and ten
had no statistically significant predictor variables indicating the focus predictor variables and the
control variables have no statistically significant impact on faculty mobility rate. A further
analysis and discussion are included in Chapter V of this study.

141
Chapter V
Conclusions and Recommendations
District level leadership matters in the health and wellbeing of any educational
organization. With increased attention to state mandates and school district accountability, the
school superintendent is charged with managing many different aspects of a changing public
school landscape. Superintendents are essential components of the comprehensive process of
school improvement by being active partners in most, if not all, aspects of the educational
landscape from human resources and hiring to professional development of staff and the fiscal
oversight of the local public school districts. In order to continually evaluate and improve
educational programs for students, school district leaders must be knowledgeable about
curriculum development, human resource management, organizational change dynamics, and
possess a vision for program implementation. These are important skills for district leaders to
possess to be a successful school leader. Superintendents must possess an expansive skill set to
successfully implement new educational programming, but in today’s educational climate, that is
not enough.
Superintendents must also be the public face of the organization by engaging the
community as a public relations expert, a district resource for information, a fiscal and budget
expert, and be proficient in the area of buildings and grounds, as these are all skills and
knowledge that will be called upon through the process of serving as a school superintendent.
A limited number of studies have examined with mixed results the relationship between
school district leaders and their impact on students’ academic performance. A meta-study of 27
studies at McREL conducted by Waters and Marzano (2006) was one study that examined the
role of the superintendent and academic success. This study, used as a basis for this research,
142
indicated a statistically significant relationship between superintendent continuity and academic
success of students. As discussed in the Chapter II literature review, numerous influencing
factors may contribute to student success beyond school district leaders. Influencers on students’
academic success are expansive, but the role of the chief school administrator should be
considered an essential component of educational process. Waters and Marzano (2006)
identified this relationship as one in which was significant and it can be assumed that a positive
impact could be identified in other research, but limited studies have focused on this relationship
and fewer have identified a positive, statistically significant relationship between school
superintendents and academic success.
For these reasons, the intention of this research was to focus on the role of the
superintendent, continuity of district leadership, and any relationship between leadership and
academic success recognizing the ever-changing face of the public school landscape in New
Jersey adding to the empirical research conducted in this area.
Purpose of the Research
The purpose for this study was to examine and explain the nature of the relationship and
influence of superintendent longevity and experience on New Jersey student scores on the 2017
Partnership for Assessment of Readiness for College and Careers (PARCC) for math and English
language arts and literacy multiple grade level assessments. Additionally, the research was
conducted to examine and explain the relationship between superintendent longevity and
experience and its impact on teacher mobility rates of school districts. The results and findings
of this research can be used to assist policy makers, school district leaders, school boards of
education, and educational professionals to identify the influencing factors and variables that can
positively impact student academic success resulting in higher achieving school districts.

143
Having a deeper understanding of the studied variables and how they impact academic
success can assist decision making at the local, state, and federal levels of educational
organizations. Furthermore, it may provide information for school district boards of education to
assess the importance of continuity of school district leaders and the influencing factors that can
result in higher levels of district success and improved students’ academic achievement.
This research can provide aspiring superintendents with the knowledge and information
to better assess school district leadership opportunities and help identify the influencing factors
that can lead to improved academic success at the district level.
In addition to the focal variables in this research, this study examined the influence and
impact of other staff, students, and district variables on academic achievement and faculty
mobility rate. These variables included faculty with advanced degrees, faculty attendance rate
percentage, percentage of students on free and reduced lunch, special education classification
rates, chronic absenteeism rates, and English language learner percentages all measured at the
district level.
Organization of the Chapter
This chapter provides a summary of the research findings, expands and expounds upon
the results of this research compared to previous studies that are similar in nature, and provides
recommendations that are evidence based for policy and practice, along with suggestions for
future research. This study adds to the empirical body of research, existing literature base in the
educational field, and can assist educational leaders with the information, data, and background
to make informed decisions that may positively impact educational policy and practice.

144
Research Questions, Null Hypotheses, and Answers
Research Question 1:
What is the relationship between New Jersey public school superintendent longevity and
student achievement as measured by Spring 2017 Partnership for Assessment of Readiness for
College and Careers (PARCC) Grade 5 math when controlling for school and student
characteristics?
No statistically significant relationship exists between a New Jersey school
superintendent’s length of time in a school district and student academic achievement, as
evidenced by the 2017 PARCC scores in Grade 5 mathematics when controlling for school and
student characteristics.
The null hypothesis is retained. Model 1 contained the predictor variable of
superintendent years in the district and the focus outcome variable of 2017 PARCC Grade 5
math district scores. This model also utilized six control predictor variables of percentage of
faculty with advanced degrees, percentage of students on free and reduced lunch, faculty
attendance percentage rate, English language learner percentage rate, student chronic
absenteeism district rate, and district percentage of classification or special education rate.
Model 1 accounted for 26.1% of the variance for the 2017 PARC Grade 5 math district scores.
Three of the seven predictor variables were statistically significant with the best predictor of
Grade 5 math performance being the percentage of faculty with advanced degrees. Also
significant was the free and reduced lunch percentages (negative relationship) and faculty
attendance rates. Superintendent years in the district was not a statistically significant predictor
variable (B = 0.127, p = 0.051) in this model, thus the null hypothesis is retained.
The null hypothesis is retained. Model 2 contained the predictor variable of total number

145
of years as a superintendent and the focus outcome variable of 2017 PARCC Grade 5 math
district scores. This model also utilized six control predictor variables of percentage of faculty
with advanced degrees, percentage of students on free and reduced lunch, faculty attendance
percentage rate, English language learner percentage rate, student chronic absenteeism district
rate, and district percentage of classification or special education rate. Model 2 accounted for
25.3% of the variance for the 2017 PARC Grade 5 math district scores. Three of the seven
predictor variables were statistically significant with the best predictor of Grade 5 math
performance being the percentage of faculty with advanced degrees. Also significant was the
percentage of students on free and reduced lunch (negative relationship) and faculty attendance
rates. Total number of years as a superintendent was not a statistically significant predictor
variable (B = 0.087, p = 0.173) in this model, thus the null hypothesis is retained.
Research Question 2:
What is the relationship between New Jersey public school superintendent longevity and
student achievement as measured by Spring 2017 Partnership for Assessment of Readiness for
College and Careers (PARCC) Grade 5 English Language Arts/Literacy when controlling for
school and student characteristics?
No statistically significant relationship exists between a New Jersey school
superintendent’s length of time in a school district and student academic achievement, as
evidenced by the 2017 PARCC scores in Grade 5 English Language Arts/Literacy when
controlling for school and student characteristics.
The null hypothesis is retained. Model 3 contained the predictor variable of
superintendent years in the district and the focus outcome variable of 2017 PARCC Grade 5
ELA/L district scores. This model also utilized six control predictor variables of percentage of

146
faculty with advanced degrees, percentage of students on free and reduced lunch, faculty
attendance percentage rate, English language learner percentage rate, student chronic
absenteeism district rate, and district percentage of classification or special education rate.
Model 3 accounted for 30.6% of the variance for the 2017 PARC Grade 5 ELA/L district scores.
Three of the seven predictor variables were statistically significant with the best predictor of
Grade 5 math performance being the percentage of faculty with advanced degrees. Also
significant was the percentage of students on free and reduced lunch (negative relationship) and
faculty attendance rates. Superintendent years in the district was not a statistically significant
predictor variable (B = 0.109, p = 0.083) in this model, thus the null hypothesis is retained.
The null hypothesis is retained. Model 4 contained the predictor variable of total number
of years as a superintendent and the focus outcome variable of 2017 PARCC Grade 5 ELA/L
district scores. This model also utilized six control predictor variables of percentage of faculty
with advanced degrees, percentage of students on free and reduced lunch, faculty attendance
percentage rate, English language learner percentage rate, student chronic absenteeism district
rate, and district percentage of classification or special education rate. Model 4 accounted for
29.5% of the variance for the 2017 PARC Grade 5 ELA/L district scores. Three of the seven
predictor variables were statistically significant with the best predictor of Grade 5 math
performance being the percentage of faculty with advanced degrees. Also significant was the
percentage of students on free and reduced lunch (negative relationship) and faculty attendance
rates. Total number of years as a superintendent was not a statistically significant predictor
variable (B = 0.029, p = 0.634) in this model, thus the null hypothesis is retained.

147
Research Question 3:
What is the relationship between New Jersey public school superintendent longevity and
student achievement as measured by 2017 Partnership for Assessment of Readiness for College
and Careers (PARCC) Algebra 1 when controlling for school and student characteristics?
No statistically significant relationship exists between a New Jersey school
superintendent’s length of time in a school district and student academic achievement, as
evidenced by the 2017 PARCC scores in Algebra 1 when controlling for school and student
characteristics.
The null hypothesis is retained. Model 5 contained the predictor variable of
superintendent years in the district and the focus outcome variable of 2017 PARCC Algebra 1
district scores. This model also utilized six control predictor variables of percentage of faculty
with advanced degrees, percentage of students on free and reduced lunch, faculty attendance
percentage rate, English language learner percentage rate, student chronic absenteeism district
rate, and district percentage of classification or special education rate. Model 5 accounted for
32.1% of the variance for the 2017 PARCC Algebra 1 district scores. Four of the seven
predictor variables were statistically significant including the focus predictor variable of
superintendent years in the district. The best predictor of Grade 10 ELA/L performance was the
percentage of faculty with advanced degrees. Also significant was the percentage of students on
free and reduced lunch (negative relationship) and faculty attendance rates. Superintendent years
in the district was a statistically significant predictor variable (B = 0.122, p = 0.050) in this
model, thus the null hypothesis is rejected.
The null hypothesis is retained. Model 6 contained the predictor variable of total number
of years as a superintendent and the focus outcome variable of 2017 PARCC Algebra 1 district

148
scores. This model also utilized six control predictor variables of percentage of faculty with
advanced degrees, percentage of students on free and reduced lunch, faculty attendance
percentage rate, English language learner percentage rate, student chronic absenteeism district
rate, and district percentage of classification or special education rate. Model 6 accounted for
31.3% of the variance for the 2017 PARCC Algebra district scores. Three of the seven predictor
variables were statistically significant with the best predictor of Grade 10 Algebra performance
being the percentage of faculty with advanced degrees. Also significant was the percentage of
students on free and reduced lunch (negative relationship) and faculty attendance rates. Total
number of years as a superintendent was not a statistically significant predictor variable (B =
0.079, p = 0.194) in this model, thus the null hypothesis is retained.
Research Questions 4:
What is the relationship between New Jersey public school superintendent longevity and
student achievement as measured by Spring 2017 Partnership for Assessment of Readiness for
College and Careers (PARCC) English Language Arts/Literacy 10 when controlling for school
and student characteristics?
No statistically significant relationship exists between a New Jersey school
superintendent’s length of time in a school district and student academic achievement, as
evidenced by the 2017 PARCC scores in English Language Art/Literacy 10 when controlling for
school and student characteristics.
The null hypothesis is retained. Model 7 contained the predictor variable of
superintendent years in the district and the focus outcome variable of 2017 PARCC Grade 10
ELA/L district scores. This model also utilized six control predictor variables of percentage of
faculty with advanced degrees, percentage of students on free and reduced lunch, faculty

149
attendance percentage rate, English language learner percentage rate, student chronic
absenteeism district rate, and district percentage of classification or special education rate.
Model 7 accounted for 25.6% of the variance for the 2017 PARC Grade 10 ELA/L district
scores. Three of the seven predictor variables were statistically significant with the best
predictor of Grade 10 ELA/L performance being the percentage of faculty with advanced
degrees. Also significant was the free and reduced lunch percentages (negative relationship) and
faculty attendance rates. Superintendent years in the district was not a statistically significant
predictor variable (B = 0.109, p = 0.094) in this model, thus the null hypothesis is retained.
The null hypothesis is retained. Model 8 contained the predictor variable of total number
of years as a superintendent and the focus outcome variable of 2017 PARCC Grade 10 ELA/L
district scores. This model also utilized six control predictor variables of percentage of faculty
with advanced degrees, percentage of students on free and reduced lunch, faculty attendance
percentage rate, English language learner percentage rate, student chronic absenteeism district
rate, and district percentage of classification or special education rate. Model 8 accounted for
24.8% of the variance for the 2017 PARC Grade 10 ELA/L district scores. Three of the seven
predictor variables were statistically significant with the best predictor of Grade 10 ELA/L
performance being the percentage of faculty with advanced degrees. Also significant was the
free and reduced lunch percentages (negative relationship) and faculty attendance rates. Total
number of years as a superintendent was not a statistically significant predictor variable (B =
0.060, p = 0.346) in this model, thus the null hypothesis is retained.
Research Question 5:
What is the relationship between New Jersey superintendent longevity and district faculty
mobility as evidenced by the 2017 School Performance Report faculty mobility rate percentage
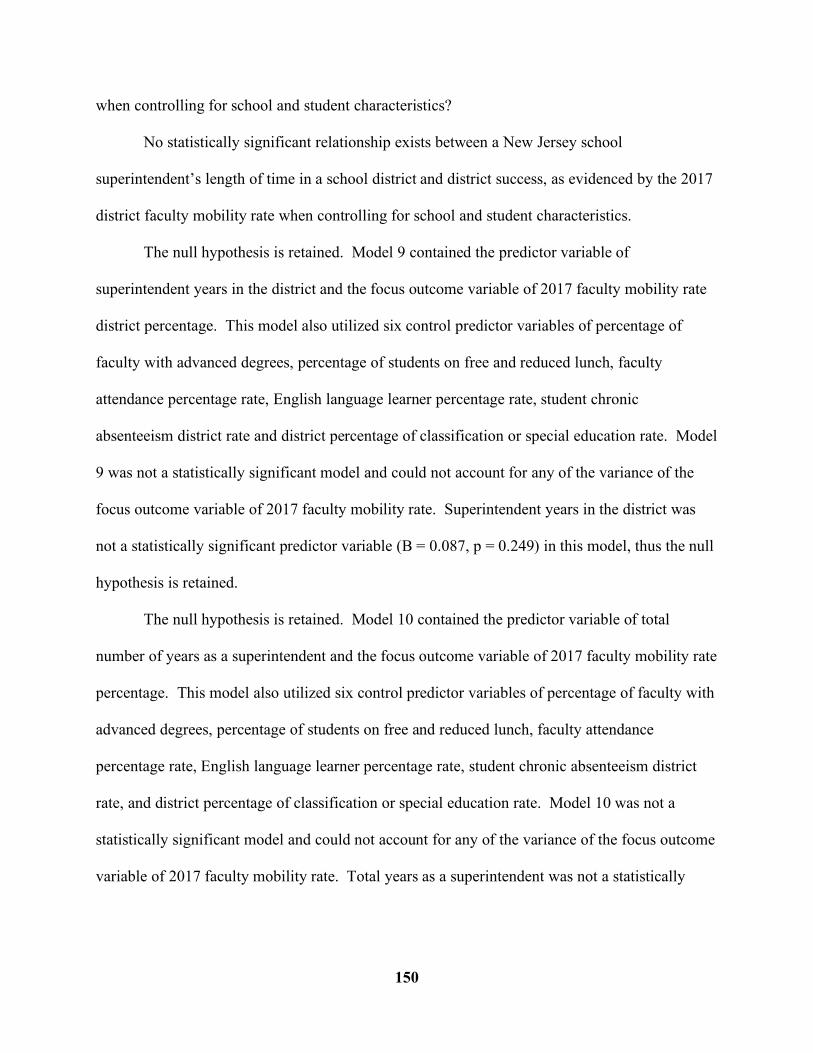
150
when controlling for school and student characteristics?
No statistically significant relationship exists between a New Jersey school
superintendent’s length of time in a school district and district success, as evidenced by the 2017
district faculty mobility rate when controlling for school and student characteristics.
The null hypothesis is retained. Model 9 contained the predictor variable of
superintendent years in the district and the focus outcome variable of 2017 faculty mobility rate
district percentage. This model also utilized six control predictor variables of percentage of
faculty with advanced degrees, percentage of students on free and reduced lunch, faculty
attendance percentage rate, English language learner percentage rate, student chronic
absenteeism district rate and district percentage of classification or special education rate. Model
9 was not a statistically significant model and could not account for any of the variance of the
focus outcome variable of 2017 faculty mobility rate. Superintendent years in the district was
not a statistically significant predictor variable (B = 0.087, p = 0.249) in this model, thus the null
hypothesis is retained.
The null hypothesis is retained. Model 10 contained the predictor variable of total
number of years as a superintendent and the focus outcome variable of 2017 faculty mobility rate
percentage. This model also utilized six control predictor variables of percentage of faculty with
advanced degrees, percentage of students on free and reduced lunch, faculty attendance
percentage rate, English language learner percentage rate, student chronic absenteeism district
rate, and district percentage of classification or special education rate. Model 10 was not a
statistically significant model and could not account for any of the variance of the focus outcome
variable of 2017 faculty mobility rate. Total years as a superintendent was not a statistically
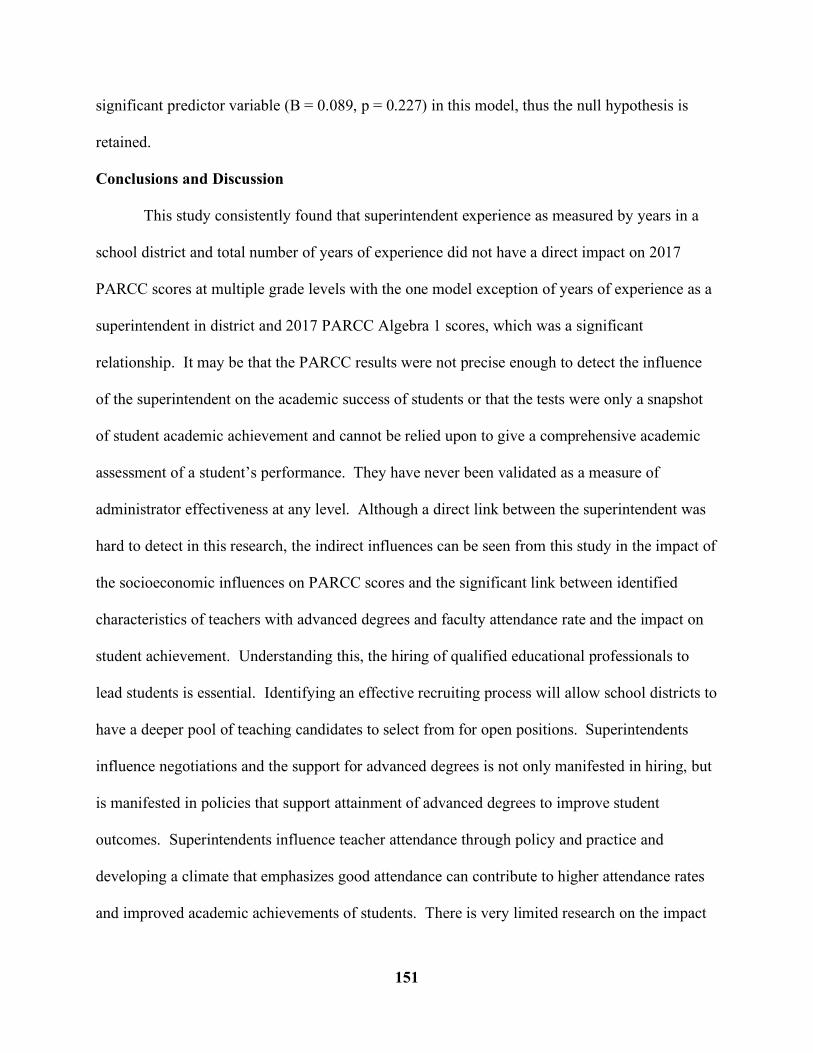
151
significant predictor variable (B = 0.089, p = 0.227) in this model, thus the null hypothesis is
retained.
Conclusions and Discussion
This study consistently found that superintendent experience as measured by years in a
school district and total number of years of experience did not have a direct impact on 2017
PARCC scores at multiple grade levels with the one model exception of years of experience as a
superintendent in district and 2017 PARCC Algebra 1 scores, which was a significant
relationship. It may be that the PARCC results were not precise enough to detect the influence
of the superintendent on the academic success of students or that the tests were only a snapshot
of student academic achievement and cannot be relied upon to give a comprehensive academic
assessment of a student’s performance. They have never been validated as a measure of
administrator effectiveness at any level. Although a direct link between the superintendent was
hard to detect in this research, the indirect influences can be seen from this study in the impact of
the socioeconomic influences on PARCC scores and the significant link between identified
characteristics of teachers with advanced degrees and faculty attendance rate and the impact on
student achievement. Understanding this, the hiring of qualified educational professionals to
lead students is essential. Identifying an effective recruiting process will allow school districts to
have a deeper pool of teaching candidates to select from for open positions. Superintendents
influence negotiations and the support for advanced degrees is not only manifested in hiring, but
is manifested in policies that support attainment of advanced degrees to improve student
outcomes. Superintendents influence teacher attendance through policy and practice and
developing a climate that emphasizes good attendance can contribute to higher attendance rates
and improved academic achievements of students. There is very limited research on the impact

152
of superintendent experience on the student achievement levels of students. Waters and Marzano
(2006) in their research work, School District Leadership That Works: The Effect of
Superintendent Leadership on Student Achievement, a working paper, identified a significant
relationship between the experience of a superintendent and student outcomes in their meta-
analysis. The researchers indicated, “Two studies that we examined reported correlations
between superintendent tenure and student academic achievement.” Other studies by Metcalfe
(2007), Mendoza-Jenkins (2009), and Plotts (2011) all examine the impact of the superintendent
on the outcome of student achievement with mixed results. Expanding upon this ancillary
finding from Waters and Marzano, this research took into consideration other research and
looked at multiple grade levels of the educational experience and incorporated both stability
within a school district and overall experience of a superintendent.
In comparison to Waters and Marzano (2006), there was limited success at rejecting the
null hypothesis for most models in this study, but there was confirmation that superintendent
years in the district is a statistically significant influencer of Algebra 1 scores. Plotts (2011)
indicated in his results that there was a significant relationship between superintendent longevity
and third grade New Jersey Assessment of Skills and Knowledge Language Arts test results,
which is contrary to this research that indicates no significant correlation between academic
outcomes in the primary grades and superintendent longevity. One similarity of the research is
the fact that the control variable of free and reduced lunch percentages were significant
predictors of the success rates of students and districts on the state approved assessments that
were administered. Previous studies and educational articles from Perry & McConney (2003),
Lee & Wong (2004), Plotts (2011), and Tienken (2011, 2016, 2019) have indicated that socio-
economic status has consistently been a significant predictor of students’ academic performance

153
and this study supports the theory that community and family factors have significant impacts on
student academic success. With beta scores ranging from (B = -0.254, p = 0.030 to B = -0.373, p
= 0.001), the variance of the outcome variable explained by free and reduced lunch percentages
ranged from 6.45% to a high of 13.91% of the PARCC assessment scores for the district. Free
and reduced lunch was the second strongest predictor variable in this study.
The strongest predictor of district academic success on the 2017 PARCC assessment in
eight of the significant SPSS models was the percentage of faculty with advanced degrees.
Consistently between models this control predictor variable was the strongest influencing factor
to academic success. Beta scores ranged from B = 0.347 to B = 0.420, explaining between
12.04% and 17.64 of the variance of the specific outcome variable of PARCC assessment score
with significance levels of p = 0.000.
The third strongest predictor variable of academic success was the faculty attendance rate
percentages of the sample districts included in this research. Again, research is limited in the
specific area of teacher attendance rates impact and relationship on student academic success.
Studies that focus on teacher characteristics sometimes included teacher attendance rate as a
predictor variable, but this research is limited in nature. Castellane (2004) was one researcher
who included this variable as a teacher characteristic; his study determined that there was no
statistically significant relationship between the attendance rate of teachers and student academic
outcomes. Contrary to this research, faculty attendance indicated as a consistent positive and had
a statistically significant relationship on 2017 PARCC scores at multiple grade levels in this
research. Eight of ten models in this study identified faculty attendance rate significant with
each model containing an outcome variable of a 2017 PARCC score indicated that there is a
significant relationship between faculty attendance and student outcomes with a beta score

154
ranging from B = 0.156 and p = 0.016 to a high beta score of B = 0.223 and a significance of
0.000. This research supports the positive correlation between these variables, but takes it a step
further with a statistically significant result that a more present faculty can have a positive
influence on student academic scores as evidenced the 2017 PARCC scores at the grade levels
selected for this research.
The focus variable of superintendent years in district was the only focus predictor
variable that was determined to be statistically significant in this research. Model 5 analyzed the
impact of superintendent years in the school district and the relationship to the 2017 Algebra 1
district level scores. In this model the predictor variable was statistically significant (B = 0.122,
p = 0.050), explaining 1.48% of the variance of the outcome variable of 2017 PARCC Algebra
10 district level score. This beta score and significance level indicates that years of experiences
in the district did have a positive impact on the district scores in the sample K–12 grade school
districts.
Recommendations for Policy and Practice
The results of this study presents important information to assist policy makers, boards of
education, the Department of Education, and state leaders to the importance of continuity and
consistency in the district leadership of the educational process. This study can be utilized to
support the process of boards of education and assist them in the recruiting, hiring, and retention
of qualified school district leaders for maximum school district efficacy. The outcomes of this
research have shown that school district leadership does matter and in one model the experience
of the district superintendent was proven to be a statistically significant relationship to student
academic outcomes. As we view this significant result, it cannot be ignored that the three most
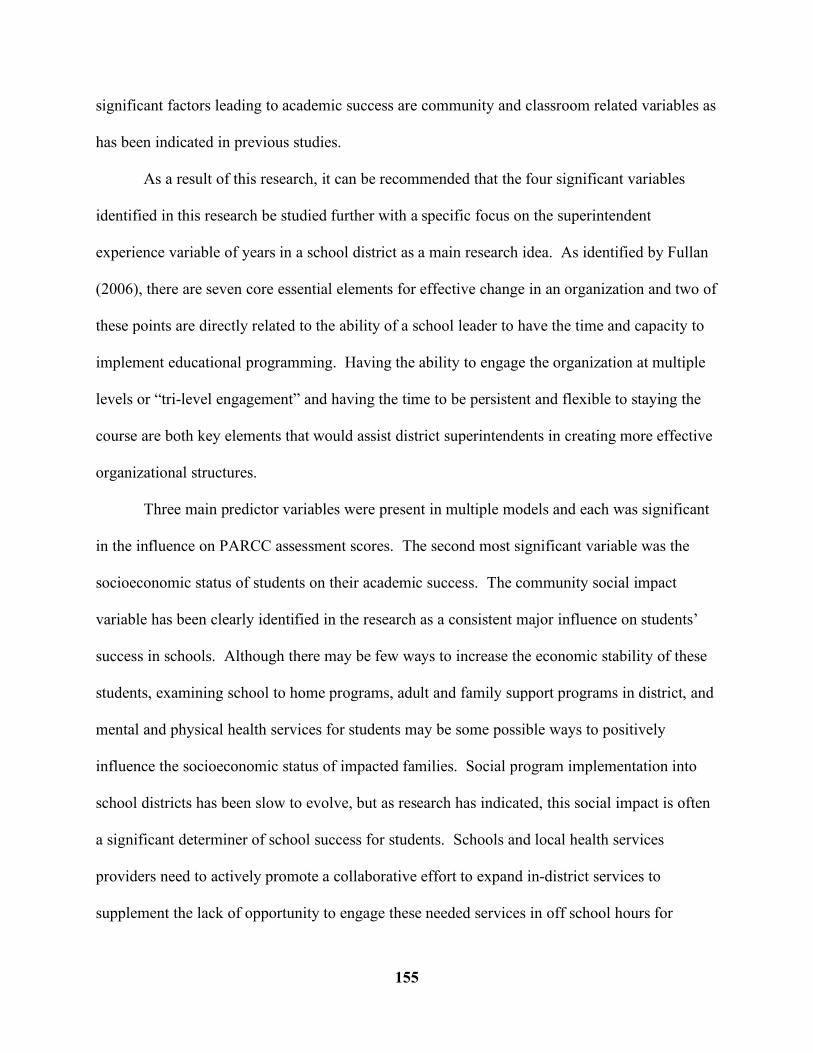
155
significant factors leading to academic success are community and classroom related variables as
has been indicated in previous studies.
As a result of this research, it can be recommended that the four significant variables
identified in this research be studied further with a specific focus on the superintendent
experience variable of years in a school district as a main research idea. As identified by Fullan
(2006), there are seven core essential elements for effective change in an organization and two of
these points are directly related to the ability of a school leader to have the time and capacity to
implement educational programming. Having the ability to engage the organization at multiple
levels or “tri-level engagement” and having the time to be persistent and flexible to staying the
course are both key elements that would assist district superintendents in creating more effective
organizational structures.
Three main predictor variables were present in multiple models and each was significant
in the influence on PARCC assessment scores. The second most significant variable was the
socioeconomic status of students on their academic success. The community social impact
variable has been clearly identified in the research as a consistent major influence on students’
success in schools. Although there may be few ways to increase the economic stability of these
students, examining school to home programs, adult and family support programs in district, and
mental and physical health services for students may be some possible ways to positively
influence the socioeconomic status of impacted families. Social program implementation into
school districts has been slow to evolve, but as research has indicated, this social impact is often
a significant determiner of school success for students. Schools and local health services
providers need to actively promote a collaborative effort to expand in-district services to
supplement the lack of opportunity to engage these needed services in off school hours for

156
students. Professionally developing staff to the social-emotional needs of students can be a more
pervasive way to positively impact the student academic experience in schools. As part of this
process, having a better understanding of the social-emotional impacts of society on students will
assist public school staff to recognize struggling students, refer them to the proper supplemental
services, creating a more comfortable and positive experience for these students. School districts
personnel should review their enrollment procedures to identify any deficiencies in the process
that would hinder school district staff from identifying families that may be in need of social
services as a supplemental service to the free and appropriate public education (FAPE). Having
better screening services may allow families to engage the social services needed before the
student experiences academic crisis. Although having major impacts on the outside social
variables that affect students and families may not be a reality for school districts, better
identification, assessment, and referrals to services may assist students in addressing essential
basic needs to allow them to be more focused on academics without the outside social influences.
One conclusion that can be understood from this research is that teacher characteristics
have a positive influence on student academic success as evidenced by district state assessment
scores. Teacher characteristics have been identified in a number of studies as being statistically
significant when determining academic success. Understanding this, the hiring of qualified
educational professionals to lead students is essential. Identifying an effective recruiting process
will allow school districts to have a deeper pool of teaching candidates to select from for open
positions. A complete review of the hiring process with the human resources department and the
school administration could identify any procedural weaknesses in the identification of qualified
candidates, including issues with the process of interviewing candidates. Once candidates are
effectively identified, the district leadership should have a developed and outlined orientation

157
and indoctrination program for staff to assist them to acclimate to the environment of the district
with clear expectations and an understanding of all procedures of the district.
The strongest predictor of academic success of student in this research was the
percentage of faculty with advanced degrees. In all eight significant models, the strongest
predictor of district success on the 2017 PARCC assessment was the percentage of faculty with
advanced degrees. As a result of this statistically significant result, it can be suggested that
through the process of hiring candidates, an essential aspect of credentials review should be the
degree attainment of potential candidates. To further delineate motivated candidates, the current
degree level should not be the only factor reviewed, but through the vetting process the
motivation to further their education as a process to continue to develop their knowledge, skill
set, and improve their classroom effectiveness. In addition to the degree level of potential
faculty candidates, an effective professional development plan for each district should be
implemented to assist new faculty to gain valuable skills and knowledge to improve classroom
teaching techniques. An essential component for boards of education to consider is the
opportunity for teachers to further their education at the graduate degree level as part of the
employment benefits for staff. Understanding that advanced degrees of faculty have a positive
influence on academic success, it would benefit school districts to have fair reimbursement
policies and practices for staff to allow them to gain new experiences and information to assist
them in the effective delivery of the curriculum for students. There are multiple opportunities to
gain graduate degree credit and having the flexibility to offer in-house degree programs or
hosting cooperative programs with universities may be a cost effective way to offer professional
development to staff at a more local venue. Providing opportunities for staff to continue to be
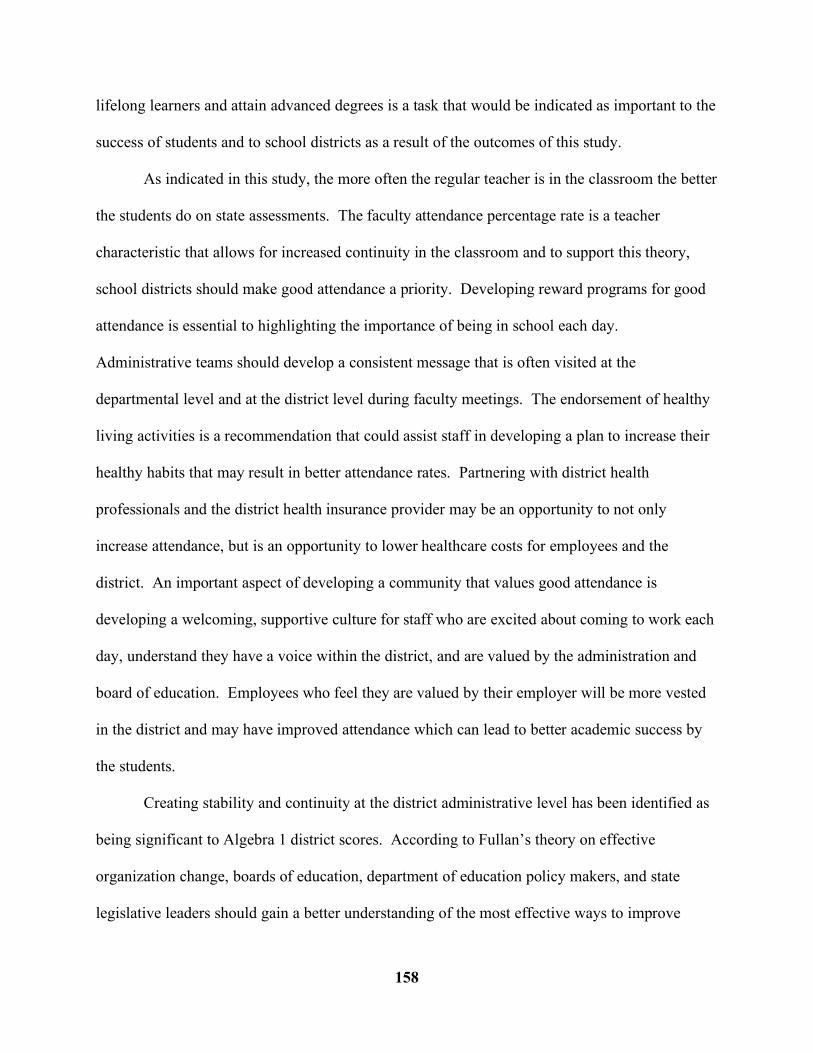
158
lifelong learners and attain advanced degrees is a task that would be indicated as important to the
success of students and to school districts as a result of the outcomes of this study.
As indicated in this study, the more often the regular teacher is in the classroom the better
the students do on state assessments. The faculty attendance percentage rate is a teacher
characteristic that allows for increased continuity in the classroom and to support this theory,
school districts should make good attendance a priority. Developing reward programs for good
attendance is essential to highlighting the importance of being in school each day.
Administrative teams should develop a consistent message that is often visited at the
departmental level and at the district level during faculty meetings. The endorsement of healthy
living activities is a recommendation that could assist staff in developing a plan to increase their
healthy habits that may result in better attendance rates. Partnering with district health
professionals and the district health insurance provider may be an opportunity to not only
increase attendance, but is an opportunity to lower healthcare costs for employees and the
district. An important aspect of developing a community that values good attendance is
developing a welcoming, supportive culture for staff who are excited about coming to work each
day, understand they have a voice within the district, and are valued by the administration and
board of education. Employees who feel they are valued by their employer will be more vested
in the district and may have improved attendance which can lead to better academic success by
the students.
Creating stability and continuity at the district administrative level has been identified as
being significant to Algebra 1 district scores. According to Fullan’s theory on effective
organization change, boards of education, department of education policy makers, and state
legislative leaders should gain a better understanding of the most effective ways to improve

159
educational programs and as part of the improvement process should recognize the importance of
sustainable district leadership as a lynchpin of the improvement process. This research supports
the idea that there can be a positive influence of longevity of the superintendent on the academic
success of students and to create a culture of stability and continuity, boards of education, district
staff, and the superintendent should build a collaborative, supportive, and shared vision that will
allow the district to thrive and move forward in a positive manner. To allow for this
collaborative environment, the key stakeholders must discuss contractual language for the
superintendent that will allow the district leader to implement a long-term strategy for district
improvement and will not impede the process by changing members of boards of education or
political influences. One recommendation would be to implement a policy and procedure to
address concerns about political influences on the employment of the district leader including
protections for superintendents to neutralize agenda driven political attacks.
Internal recruitment and training of administrators is a chance to increase the
opportunities to build collaborative relationships in schools and could allow for a strengthened
relationship between boards of education and locally trained district leaders. This process allows
for a longer term relationship building opportunity and in many cases removes the ‘unknown
entity’ issues that accompany a hire outside the district. Developing in-house leadership
opportunities and collective bargaining agreements that provide for continuing education for
aspiring district leaders is a recommendation for boards of education. It is recommended that the
department of education investigate opportunities to provide professional development for
faculty to gain valuable knowledge and to assist them in achieving the background and
experiences to apply for administrative certificates and or school administrator certification.
Providing these opportunities in a regional format would allow staff to become certified without

160
the extensive travel that may be needed to get the graduate level academic work for certification.
Increasing online professional development opportunities is a convenient way for staff to
continue to be actively employed and get the education needed for state certifications.
Recruitment from within the district shortens the learning curve for leaders, allows for an
opportunity to have continued relationship building, and can assist in the needs assessment phase
of organizational change as they are more familiar with the school district, the staff, and the
educational community of the school district.
In summary, district level PARCC scores can be increased by understanding the factors
that positively influence the academic success of students. Student achievement can be increased
by developing consistency in the district leadership level by allowing superintendents to create a
culture of collaboration, develop educational improvement programs and needs assessments of
program implementation by having longer terms of tenure within the district. Continuity of
effective district leaders will reduce staff concerns about a cyclic, ever-changing vision for a
school district and will allow for the time to implement improvement programs by allowing the
“flexibility and persistence to stay the course” as indicated by Fullan (2006) in implementing
effective organizational change. Addressing community influences on children by developing
assistance programs for children and families will be an important aspect of developing a
supportive educational environment for students that will reduce the impacts on social-emotional
or socioeconomic influences on academic outcomes. Consistently within the research, SES
impacts are significant influencers of academic outcomes and districts that develop effective
screening processes and implement other programs to help families address these issues will see
better academic outcomes for these affected students. Understanding that teachers make a
difference on student outcomes is important and this study supports the suggestion that better

161
educated teachers who are in school more often results in the improvement of academic success
in students. This study has shown how the influencing factors identified in this research study
have an impact on student outcomes and recognizing these factors will allow schools to better
address the needs of the students, the staff, the district, and the overall school community.
Recommendations for Future Research
The results of this research have implications for future research and policy making in the
educational realm. The following recommendations for future research are based on the findings
and limitations of this study.
This research only included 219 schools districts that was reduced to 189 sample
kindergarten through Grade 12 school districts. Future studies may want to expand upon this
sample size and include the approximately 600 local public school districts in New Jersey. This
expansion of the sample size may influence the outcomes of academic success resulting from
district leadership tenure as it will examine smaller K–6 and K–8 school districts in the state who
may or may not have a harder time creating district leadership stability based on entry level
positions in these smaller districts. There is also the recommendation of increasing the sample
size by expanding this K–12 sample to adjoining states who record the same data points as this
research study.
It is recommended that the control variables be expanded to include additional social and
community impacts on student academic success. This research included SES, language impacts
and chronic absenteeism, but could be expanded to include student mobility and dropout rates
and other possible impacts on student academics. The inclusion of these variables may help
further explain the variance of the student academic outcomes. Additional recommendations for

162
future research would be to focus on the significant variables from this study that are less
researched and inclusive of the impact of teacher characteristics on academic outcomes.
In this study the state of New Jersey was utilized to formulate the sample size. It is
recommended that future research expand to neighboring states, but in doing so, also includes the
designation of rural, suburban, or urban as a district classification to examine the differences
between these public school districts. This examination would include the comparison of
average longevity tenure of each classification to determine if there are regional issues with the
longevity of district leaders. This recommendation would also allow for a comparison of
average years of tenure of superintendents between regionalized states. This information would
be helpful to aspiring district leaders.
This was a quantitative study that utilized the publicly available data to examine the
impact of superintendent longevity on student success and faculty mobility rate. To examine this
relationship in a deeper manner it is recommended that the structure of this research be changed
to utilize a qualitative or mixed method approach to study the relationship and impact of
longevity on student academic success. Utilizing surveys or interviews of school district leaders
may create more in-depth understanding of district health or board–superintendent relationships
that may impact longevity or environmental climate. These factors could more deeply explain
the impediments to a cohesive district mission and vision. Using a mixed method approach
would allow a future researcher to examine the core values of Fullan’s theory of organizational
change on the current status of the sample districts. Comparing the current practices of the
districts to the outlined recommendations of Fullan theories of change can help district leaders
develop a more functional plan for organizational change.
163
Future research should examine later versions of the state PARCC assessment or possibly
shift the focus to the scholastic aptitude test or the nationally administered National Assessment
for Educational Progress (NAEP) so that regional comparisons of data and results can be made
between states and by state departments of education and policy makers. This suggestion would
also limit the reliability and validity issues that are faced by some state educational agencies.
This research basis could be utilized to examine the impact of superintendent longevity and
teacher characteristics on other state assessments including the possibility of utilizing the
Smarter Balance based assessment.
Recommending expanding variables to include the new teacher evaluation system in New
Jersey may allow researchers to make comparisons between specific teacher characteristics, the
rating system for evaluations and student outcomes. Examining the relationship between the
classroom teacher, the specific qualities of the teacher, the evaluation scores for the instructor,
and the resulting student academic outcomes could further advance the research basis for
improving student academic achievement in schools and identify important qualities of the
teacher for hiring practices.
A recommendation for future research would include expanding the examination of
teacher characteristics and their impact on student success. As there were two statistically
significant control variables in this study that were consistent through most models, it is
important to further explore the impact of additional teacher qualities on student success.
Specifically, the variables of teachers with advanced degrees and teacher attendance rates should
be studied further as these control variables were statistically significant in all eight models that
focused on 2017 PARCC scores. Although these teacher characteristic variables were not the
focus variables, the outcomes showing significant influences on student academic achievement

164
warrants a deeper analysis of these influences. It is important to examine the specifics of the
advanced degree of the instructor as this could further explain the importance of a general
advanced degree or if the advanced degree has to be in the certification area of the teacher. A
difference in these two advanced degrees could be identified in future research. Additional
teacher characteristic variables to be studied may include average years of teaching, average and
starting salary of districts, teacher–student ratios, and administrator–student ratios. Looking
more closely at the importance of teacher characteristics and conducting additional research in
these areas will allow a more in-depth analysis of the academic impact of highly qualified
teachers in the classroom. This examination would allow boards of education and administrators
to develop a candidate qualities informational sheet to assist in the recruitment and hiring of
district personnel.
Summary
As a result of this research, four predictor variables were identified as having a
statistically significant impact on district test scores. Most significant were three control
variables: percentage of faculty with advanced degrees, percentage of students on free and
reduced lunch, and faculty attendance rates for districts. It is clear that these teacher
characteristics, along with socioeconomic status, have significant impacts on students’ abilities
to be successful on state administered tests. Understanding this, it is imperative that school
districts focus on the community influences and impacts that contribute to academic strains for
students so that these issues can be addressed and students can experience greater academic
success. It may seems as though the PARCC may be more accurate at measuring the SES of
students rather than their true academic levels and curricular understandings.

165
This research supports the significant impact that well trained and highly qualified
teachers can have on the academic outcomes of students. Teacher quality is essential to
developing an effective classroom environment for students. This research supports the idea that
boards of education and administrators must be vested in the process of recruitment, vetting, and
hiring of dedicated educational professionals. An effective hiring process will lead to a more
effective educational environment with increased student academic outcomes. Across the United
States there has been a recognized shortage of teachers in math and science specialty areas,
which presents a challenge for school district leaders. Expanding the recruitment process from
the traditional newspaper or online advertisements may be of benefit to school districts
experiencing small applicant pools as this research supports the concept of highly effective
teachers creating classroom environments that produce more successful results on state level
assessments. As a result of this study it was determined that teacher characteristics and access to
good teachers results in higher assessment scores.
This study focused on the longevity of superintendents and its impact on students’
assessment scores at the district level and the mobility rate of teachers. Although not statistically
significant on most models, one model indicated a statistically significant outcome and this
should be noted. In line with research conducted by Waters and Marzano (2006), the length of
tenure of the superintendent within the district has a positive impact on PARCC assessment
scores in Algebra 1. This finding supports the need to focus on creating better relationships
between boards and school district leaders and for increasing stability and continuity within the
ranks of superintendent to have a positive impact on student academic outcomes. Assisting
boards of education and policy makers in state agencies and local communities to value the
experience and background of superintendents is essential to creating school district

166
environments that value relationships, allow for the development of long-term district
improvement plans, and allow for constant assessment and adjustment of the programs.
Allowing superintendents to develop deeper levels of engagement, be flexible, persistent, and
stay the course will result in more effective educational environments.
It is evident that the position of superintendent has evolved tremendously over the past 20
years. Additionally, the call for accountability has increased because of numerous factors
including the increased costs of providing a free and appropriate educational experiences for
students. As the position has evolved, the longevity of superintendent has decreased and this
instability has created a lack of continuity leading to insufficient educational program
implementation. This research provides evidence that the position of superintendent is an
important resource for school leaders, including administrators, to help them assess and develop
effective professional development programs and congruent educational programs that will lead
to increased student success.
The research completed in this study can contribute to future policy making and the
recommendations provided for policy and practice can assist current school leaders, boards of
education, state agencies, and state departments of education with the data and information
needed to address the continuing issues faced by school districts with shortening length of
leadership tenure and continuing revolving doors of district superintendents. Utilizing this
information and recommendations can lead to an increase in student academic performance and
district level state assessment success.

167
References
Alborano, J. A. (2002). American superintendent longevity and time study (Doctoral
dissertation). Retrieved from ProQuest Dissertations and Theses database.
Allensworth, E., Ponisciak, S., & Mazzeo, C. (2009). The schools teachers leave: Teacher
mobility in Chicago Public Schools. Chicago: Consortium on Chicago School Research–
University of Chicago.
Anderson, Bart G. “Best practice in superintendent search and selection: A discrepancy analysis
of superintendents, search consultants, and the boards of education they serve” (2006).
Dissertations available from ProQuest. AAI3227717.
https://repository.upenn.edu/dissertations/AAI3227717
Archer, J. (2003). Payout Prompts Review of Minnesota School Chiefs’ Contracts. Education
Week, 22(26), 6.
Associated Press. (1989, February 19). Jersey Will Send Home Report Card On Schools. New
York Times [New York], p. 1001062. Retrieved from
https://www.nytimes.com/1989/02/19/nyregion/jersey-will-send-home-report-cards-on-
schools.html
Austermuhl, E. (2000). The board-superintendent relationship in the wake of the recent statutes
on tenure for the superintendent. Doctoral Dissertation, New Brunswick, NJ: Rutgers
University (ProQuest Learning and Information Company UMI No. 9970966).
Bidwell, A. (2014, February 27). The History of Common Core State Standards. U.S. News &
World Report. Retrieved from https://www.usnews.com/news/special-
reports/articles/2014/02/27/the-history-of-common-core-state-standards
Blumberg, A. & Blumberg, P. (1985). The School Superintendent: Living With Conflict. New

168
York, NY: Teachers College, Columbia University.
Blumberg, A. & Blumberg, P. (1987). The School Superintendent: Living with Conflict.
Administrative Science Quarterly, 32(2), 294. doi:10.2307/2393135
Brackemyre, T. (2015, April 11). Education to the Masses–The Rise of Public Education in Early
America. Retrieved from http://ushistoryscene.com/article/rise-of-public-education/
Burch, P. & Spillane, J. (2004). Leading from the middle: Mid-level central office staff and
instructional improvement. Chicago, IL: Cross City Campaign for Urban School Reform.
Retrieved from http://files.eric.ed.gov/fulltext/ED509005.pdf
Castellane, W. S. (2019). An investigation of the relationship between teacher factors and
academic performance of high school students (Order No. 13878735). Available from
Dissertations & Theses @ Seton Hall University. (2225449123). Retrieved from
https://search.proquest.com/docview/2225449123?accountid=13793
Carter, G. R. & Cunningham, W. G. (1997). The American school superintendent: Leading in an
age of pressure. San Francisco: Jossey-Bass.
Clark, A. (2018, March). N.J. just took another step closer to ending PARCC testing. New Jersey
Star-Ledger [Iselin]. Retrieved from
https://www.nj.com/education/2018/03/no_more_parcc_nj_to_search_for_new_state_exa
ms.html
Cooper, B.S.; Fusarelli, L.D.; & Carella, V.A. (2000). Career crisis in the school
superintendency? The results of a national survey. Arlington, VA: American Association
of School Administrators. (ERIC Document Reproduction Service No. ED443 167).
Crozier, J. (2008). Collins dictionary. Glasgow, NJ: Collins.
Dao, J. (1993, February 25). Report Details School Superintendents’ Salaries. New York Times,

169
p. B1. Retrieved from https://www.nytimes.com/1993/02/25/nyregion/report-details-
school-superintendents-salaries.html
Development process | Common Core State Standards initiative. (2017). Retrieved from
http://www.corestandards.org/about-the-standards/development-process/
Doorey, N. & Polikoff, M. (2106). Evaluating the Content and Quality of Next Generation
Assessments. Washington D.C., District of Columbia: Thomas B. Fordham Institute.
Duncan, A. (2010). U.S. Secretary of Education Duncan Announces Winners of Competition to
Improve Student Assessments. Retrieved from U.S. Department of Education website:
https://www.ed.gov/news/press-releases/us-secretary-education-duncan-announces-
winners-competition-improve-student-assessments
ETS; Pearson. (2016). Final Technical Report for 2015 Administration. Retrieved from
Educational Testing Service; Pearson PARCC; Measured Progress website:
https://www.nj.gov/education/assessment/district/PARCCTechReport15.pdf
Finn, C. E., Bennett, W. J., & Cribb, J. T. (1999). The educated child: A parent’s guide from
preschool through eighth grade. New YORK, NY: The Free Press.
Finnan, L. A. & McCord, R. S. (2017). 2016 AASA Superintendent Salary & Benefits Study (5).
Retrieved from American Association of School Administrators website:
https://www.aasa.org/uploadedFiles/Banners/2016%20Superintendent%20Salary%20and
%20Benefits%20Study%20Non-Member%20Edition.pdf
Finnan, L. A. & McCord, R. S. (2018). 2017–18 AASA superintendents salary & benefits study
(6). Alexandria, VA: American Association of School Administrators.
Fuhrman, S. & Lazerson, M. (2005). The public schools. New York, NY: Oxford University
Press.

170
Fullan, M. (2006). Change Theory as a Force for School Improvement. Intelligent Leadership,
27–39. doi:10.1007/978-1-4020-6022-9_3
Fullan, M. (2009.). The Principal and Change. The Challenge of Change: Start School
Improvement Now! 55–70. doi:10.4135/9781452218991.n6
Gewertz, K. (2016, March 28). Reach of PARCC, Smarter Balanced Tests Drops Sharply in
2015–16. Educational Week, 35(26). Retrieved from
http://blogs.edweek.org/edweek/high_school_and_beyond/2016/03/Reach_of_PARCC_S
marter_Balanced_tests_drops_sharply.html
Giaquinto, A. C. (2011). Longevity in the superintendency: a case study of New Jersey district
factor group CD superintendents (Doctoral dissertation). Retrieved from Seton Hall
University Dissertations and Theses (ETDs).
Glass, T. E. & Franceschini, L. A. (2007). The State of the American School Superintendency: A
Mid-Decade Study. Lanham, MD: Rowman & Littlefield Education.
Graziano, Dana. “The Relative Influence of Faculty Mobility on NJ HSPA Scores” (2012). Seton
Hall University Dissertations and Theses (ETDs). 1830.
https://scholarship.shu.edu/dissertations/1830
Hanley, R. (1989, November 27). Educators Belittle New Jersey’s ‘Report Cards’ on Schools.
New York Times [New York], p. B1. Retrieved from
https://www.nytimes.com/1989/11/27/nyregion/educators-belittle-new-jersey-s-report-
cards-on-schools.html
Hess, F. M. (2015). Cage-busting leadership. Cambridge, MA: Harvard Education Press.
Hess, F. M. (2015). The cage-busting teacher. Cambridge, MA: Harvard Education Press.
Historical Context: Overview of New Jersey’s Statewide Testing Program. (2015). Retrieved

171
from https://www.nj.gov/education/assessment/history.shtml
https://scholarship.shu.edu/dissertations/2506
Jahn, C. (2014). Final Report on the Study of the Impact of the Salary Cap on Chief School
Administrators (1). Retrieved from New Jersey Schools Boards Association website:
https://www.njsba.org/wp-content/uploads/2016/02/news-csa-salary-cap-report.pdf
Jochim, A. & Mcguinn, P. (2016, September). The Politics of the Common Core Assessments–
Why states are quitting the PARCC and Smarter Balanced testing consortia. Education
Next, 16(4). Retrieved from https://www.educationnext.org/the-politics-of-common-core-
assessments-parcc-smarter-balanced/
Johnson, S. M. (1996). Leading to change: The challenge of the new superintendency. San
Francisco: Jossey-Bass.
Kachmar, K. (2016, March 6). Superintendent salary cap fails taxpayers. Daily Record
[Rockaway]. Retrieved from
https://www.dailyrecord.com/story/news/2016/03/06/superintendent-salary-cap-fails-
taxpayers/81402156/
Klein, A. (2015, April 15). No Child Left Behind: An overview. Educational Week, 34(27).
Kolu, K. M. (2014). A longitudinal analysis of New Jersey school superintendents, their
professional profiles and career paths (Doctoral dissertation). Retrieved from
https://doi.org/10.7282/T33R0R4H
Kowalski, T. J., McCord, R. S., Petersen, G. J., Young, P. I., & Ellerson, N. M. (2011). The
American school superintendent: 2010 decennial study. Lanham, MD: Rowman &
Littlefield Education.
Kowalski, Theodore J. “Case Studies on Educational Administration” (1995). Educational

172
Leadership Faculty Publications. 54. https://ecommons.udayton.edu/eda_fac_pub/54
La Gorce, T. (2016, September 2). PARCC Tests Remain a Hot-Button Issue. New Jersey
Monthly Magazine, 7(9). Retrieved from https://njmonthly.com/articles/just-for-the-
web/parcc-tests-hot-button-issue/
Leithwood, K., Louis, K. S., Anderson, S., & Wahlstrom, K. (2004). Review of research–How
leadership influences student learning. The Wallace Foundation Center for Applied
Research and Educational Improvement and Ontario Institute for Studies in Education
New York NY. October 20, 1–90. Retrieved from: http://doi.org/10.1007/978-90-481-
2660-6
Lee, J. & Wong, K. (2004). The impact of accountability on racial and socioeconomic equity:
considering both school resources and achievement outcomes. American Educational
Research Journal, 41 (4), 797–832.
Maritz, E.J. (2006). A study of the relationship between superintendent longevity, board member
longevity, board member training, and districts demonstration of adequate yearly
progress. Doctoral Dissertation, Pittsburg, PA: Duquesne University (ProQuest
Information and Learning Company UMI No. 3220539).
Maroun, Jamil. “The Predictive Power of Out-of-School Community and Family Level
Demographic Factors on District Level Student Performance on the New Jersey PARCC
in Algebra 1 and Grade 10 English Language Arts/Literacy” (2018). Seton Hall
University Dissertations and Theses (ETDs). 2506.
Mendoza-Jenkins, L. R. (2009). The superintendent and reform: A case study of action by the
system leader to improve student achievement in a large urban school district (Doctoral
dissertation). Retrieved from ProQuest Dissertations and Theses database.

173
Metcalfe, A. (2007). The Relationship Between Superintendent Tenure and Student
Achievement in Indiana (Doctoral Dissertation). Retrieved from ProQuest Dissertations
and Theses Global. UMI Number 3307461.
Michel, A. P. (2004). What is the relative influence of teacher educational attainment on student
NJASK 4 scores? ( Order No. 3136106). Available from Dissertations & Theses @ Seton
Hall University. (305048871). Retrieved from
https://search.proquest.com/docview/305048871?accountid=13793
Michelman, B. (2012). The never-ending story of ESEA reauthorization. Association for
Supervision and Curriculum Development, 18(1). Retrieved from
http://www.ascd.org/publications/newsletters/policy_priorities/vol18/num01/The_Never-
Ending_Story_of_ESEA_Reauthorization.aspx
Mills, Gemar, “The Influence of Principal Longevity and Continuity on Student Achievement”
(2017). Seton Hall University Dissertations and Theses (ETDs). 2250.
https://scholarship.shu.edu/dissertations/2250
Natkins, G.L.; Cooper, B.S.; Albarano, J.A.; Padilla, A,; & Ghosh, S. (2002). Predicting and
modeling superintendent turnover. Paper presented at the Annual Meeting of the
American Educational Research Association. New Orleans, LA. April 1, 2002.
New Jersey Department of Education. (2017). New Jersey Public Schools Fact Sheet. Retrieved
from https://www.state.nj.us/education/data/fact.htm
New Jersey Department of Education. (2017). The Official Web Site for The State of New
Jersey, Department of Education. Retrieved from
https://www.nj.gov/education/finance/rda/dfg.shtml)
New Jersey Department of Education. (2018, May). High School Graduation Assessment

174
Requirements. Retrieved from
http://www.state.nj.us/education/assessment/parents/GradReq.pdf
New Jersey Department of Education. (2018). Year 2 of PARCC ... Parent PARCC Questions
Answered. Retrieved from https://www.nj.gov/education/assessment/PARCCFAQ.pdf
New Jersey State Legislature website: Http://www.njleg.state.nj.us/20122013/PL12/26_.HTM
New Jersey State Legislature. (2012). New Jersey Public Law 2012 Chapter 26. Retrieved from
New Jersey State Legislature website:
http://www.njleg.state.nj.us/20122013/PL12/26_.HTM
New Jersey State Legislature. (2012). New Jersey Public Law 2012 Chapter 26. Retrieved from
New Jersey State Legislature website:
http://www.njleg.state.nj.us/20122013/PL12/26_.HTM
New York School Boards Association. (2018, May 14). Call To Action: Reform BOCES District
Superintendent Compensation. Retrieved from
https://www.nyssba.org/clientuploads/nyssba_pdf/gr/s3203-a2112-boces-salary-
05072018.pdf
Partnership for Assessment of Readiness for College and Careers. (2018, March 5).
ELA/Literacy–PARCC Resource Center. Retrieved from https://parcc-
assessment.org/ela-literacy/
Patterson, J. L., Kelleher, P., & Ebrary, Inc. (2005). Resilient school leaders: Strategies for
turning adversity into achievement. Alexandria, VA: Association for Supervision and
Curriculum Development.
Pearson, (2015). PARCC Field Test–Lessons Learned. Retrieved from https://parcc-
assessment.org/content/uploads/2014/09/field-test-lessons-learned-final_0.pdf

175
Perry, L., McConney, A. (2003) “Does the SES of the School Matter? An Examination of
Socioeconomic Status and Student Achievement Using PISA 2003.” Teachers College
Record Volume 112, Number 4, April 2010, pp. 1137–1162 Copyright © by Teachers
College, Columbia University 0161–4681.
Petty, Douglas J. “The Relationship Between Principal Longevity and Student Achievement in
Middle Schools in New Jersey” (2018). Seton Hall University Dissertations and Theses
(ETDs). 2550. https://scholarship.shu.edu/dissertations/2550
Pfeiffer, Danielle. “District Support Team Model as a Manifestation of Central Office
Transformation: Experiences from Central Office and School Based Staff” (2014). Seton
Hall University Dissertations and Theses (ETDs). 2032.
https://scholarship.shu.edu/dissertations/2032
Plotts, T. (2011). A Multiple Regression Analysis of Factors Concerning Superintendent
Longevity and Continuity Relative to Student Achievement (Doctoral dissertation).
Retrieved from Seton Hall University Dissertations and Theses (ETDs).
Ponders, V. E. (2001). The influence of teacher characteristics and preparation on student
achievement in publicly funded Detroit schools (Order No. 3001031). Available from
ProQuest Dissertations & Theses Global. (230826792). Retrieved from
https://search.proquest.com/docview/230826792?accountid=13793
Rencher, R. (1992). School Leadership and Student Motivation (71). Retrieved from ERIC
Digest website: https://files.eric.ed.gov/fulltext/ED346558.pdf
Repollet, L. (2018, July 12). New Jersey Department of Education Statewide Assessment
Outreach–Summary of Findings, Recommendations for Next Steps. Retrieved from
https://www.nj.gov/education/assessment/AssessmentReportSummary.pdf
176
Richardson, J. (1995). As Free Agents, District Chiefs Vie in Competitive Marketplace.
Education Week, 15(4). Retrieved from
https://www.edweek.org/ew/articles/1995/12/06/14supes.h15.html
Sitran, C. (2018, January 26). Time to Scrap the Superintendent Salary Cap? NJ Spotlight.
Retrieved from http://www.njspotlight.com/stories/18/01/25/time-to-scrap-the-
superintendent-salary-cap/
Spring, J. H. (2002). Conflict of interests: The politics of American education. Boston, MA:
McGraw-Hill.
Sullivan, K., Barkowski, E., Lindsay, J., Lazarev, V., Nguyen, T., Newman, D., & Lin, L.
(2017). Trends in teacher mobility in Texas and associations with teacher, student, and
school characteristics (REL 2018–283). Washington, DC: U.S. Department of Education,
Institute of Education Sciences, National Center for Education Evaluation and Regional
Assistance, Regional Educational Laboratory Southwest. Retrieved from
http://ies.ed.gov/ncee/edlabs.
Sybrant, D. B. (2012). How does superintendent longevity create conditions or context that
influences student achievement–A multiple case study (doctoral dissertation). Retrieved
from ProQuest Dissertations and Theses database.
The Governor and Company of the Massachusetts Bay. (1853). The Old Deluder Act (1647).
Retrieved from http://www.constitution.org/primarysources/deluder.html
The Politics of the Common Core Assessments: Why states are quitting the PARCC and Smarter
Balanced testing consortia. (2017, November 27). Retrieved from
https://www.educationnext.org/the-politics-of-common-core-assessments-parcc-smarter-
balanced/
177
Tienken, C. H. (2011). Structured inequity: The intersection of socioeconomic status and the
standard error of measurement of state mandated high school test results. NCPEA
Yearbook, 257–271.
Tienken, C. H. & Orlich, D. C. (2013). The school reform landscape: Fraud, myth, and lies. New
York, NY: Rowman and Litlefield, LLC.
Tienken, C. H. (2016). Standardized test results can be predicted, so stop using them to drive
education policymaking. In C. Tienken & C. Mullen (Eds.), Education policy perils:
Tackling the tough issues (pp. 157–185). Philadelphia, PA: Taylor Francis Routledge.
U.S. Department of Education. (2017, December 7). EVERY STUDENT SUCCEEDS ACT–
Assessments under Title I, Part A & Title I, Part B: Summary of Final Regulations.
Retrieved from
https://www2.ed.gov/policy/elsec/leg/essa/essaassessmentfactsheet1207.pdf
United States Department of Education. (2017). Every Student Succeeds Act–State and local
reports cards non-regulatory guidance. Retrieved from United States Department of
Education website: https://www2.ed.gov/policy/elsec/leg/essa/essastatereportcard.pdf
United States Department of Education. (2018). Every Student Succeeds Act (ESSA) Fact Sheet.
Retrieved from https://www.ed.gov/ESSA
Velazquez, V. C. (2017). A case study on the influence of frequent superintendent turnover on
the culture of a K-12 suburban school district (Order No. 10270928). Available from
Dissertations & Theses @ Seton Hall University. (1891348420). Retrieved from
https://search-proquest-com.ezproxy.shu.edu/docview/1891348420?accountid=13793
Van Tassel, P. (1989, September 3). As schools Open, Kean’s Impact is Assessed. New York
Times [New York] p. 12. Retrieved from

178
https://www.nytimes.com/1989/09/03/nyregion/as-schools-open-kean-s-impact-iss-
assessed.html
Waters, J. T. & Marzano, R. J. (2006). School leadership that works: From research to results.
Aurora, CO: Mid-Continent Research for Education and Learning McREL.