GIS-based hydrostratigraphic modeling of the city of Rome (Italy): analysis of the geometric...
21
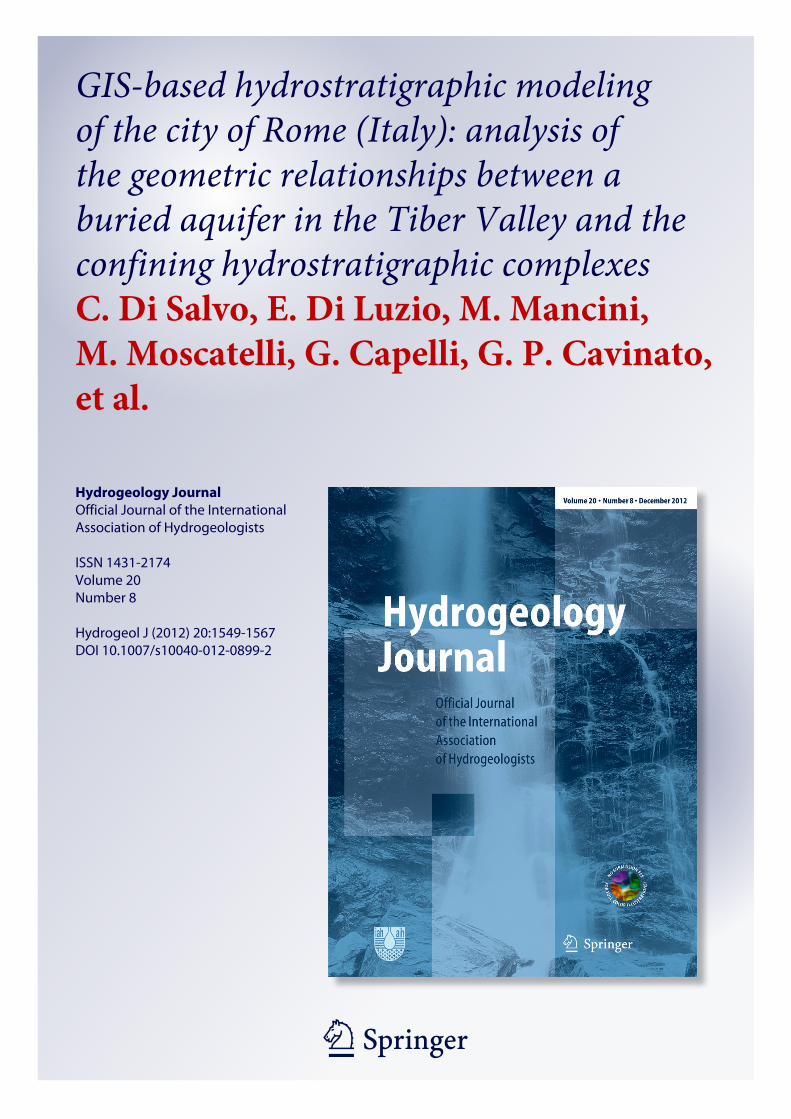
1 23 Hydrogeology Journal Official Journal of the International Association of Hydrogeologists ISSN 1431-2174 Volume 20 Number 8 Hydrogeol J (2012) 20:1549-1567 DOI 10.1007/s10040-012-0899-2 GIS-based hydrostratigraphic modeling of the city of Rome (Italy): analysis of the geometric relationships between a buried aquifer in the Tiber Valley and the confining hydrostratigraphic complexes C. Di Salvo, E. Di Luzio, M. Mancini, M. Moscatelli, G. Capelli, G. P. Cavinato, et al.
-
Upload
independent -
Category
Documents
-
view
1 -
download
0
Transcript of GIS-based hydrostratigraphic modeling of the city of Rome (Italy): analysis of the geometric...
1 23
Hydrogeology JournalOfficial Journal of the InternationalAssociation of Hydrogeologists ISSN 1431-2174Volume 20Number 8 Hydrogeol J (2012) 20:1549-1567DOI 10.1007/s10040-012-0899-2
GIS-based hydrostratigraphic modelingof the city of Rome (Italy): analysis ofthe geometric relationships between aburied aquifer in the Tiber Valley and theconfining hydrostratigraphic complexesC. Di Salvo, E. Di Luzio, M. Mancini,M. Moscatelli, G. Capelli, G. P. Cavinato,et al.

1 23
Your article is protected by copyright and
all rights are held exclusively by Springer-
Verlag. This e-offprint is for personal use only
and shall not be self-archived in electronic
repositories. If you wish to self-archive your
work, please use the accepted author’s
version for posting to your own website or
your institution’s repository. You may further
deposit the accepted author’s version on a
funder’s repository at a funder’s request,
provided it is not made publicly available until
12 months after publication.

GIS-based hydrostratigraphic modeling of the city
of Rome (Italy): analysis of the geometric relationships
between a buried aquifer in the Tiber Valley and the confining
hydrostratigraphic complexes
C. Di Salvo & E. Di Luzio & M. Mancini & M. Moscatelli &G. Capelli & G. P. Cavinato & R. Mazza
Abstract A preliminary hydrostratigraphic model of thecity of Rome (Italy) was completed through the analysisof geological and hydrogeological data, and by usinggeographic information system (GIS)-based operations.The complex lithostratigraphic setting of a local Quater-nary volcano-sedimentary multilayer was simplified intohydrostratigraphic complexes considering textural proper-ties of terrains and hydraulic conductivity values. TheTiber River Valley, in the middle of the urban area, wasanalyzed separately from the surrounding areas. GIS toolswere used in a multiple-step procedure to reconstruct thegeometry of bounding surfaces of the main hydrostrati-graphic complexes. Particular care was given to thecharacterization of a confined gravelly aquifer lying atthe base of the upper Pleistocene–Holocene alluvium thatfills the Tiber Valley. Updated isobaths and thicknessmaps of this layer were produced. Three-dimensionalreconstruction identifies areas of potential recharge be-tween the alluvium aquifer and the surrounding hydro-stratigraphic complexes. In the central sector of the city,the gravel deposits are laterally confined by a thickaquitard corresponding to the Pliocene clayey bedrock of
the city; in contrast, a potential recharge area can behypothesized in the northern areas, where the upperPleistocene–Holocene valley cross cuts the PaleotiberGraben, filled with older and highly permeable gravelsand clays.
Keywords Hydrostratigraphic modeling . Urbangroundwater . Geographic information systems . Italy
Introduction
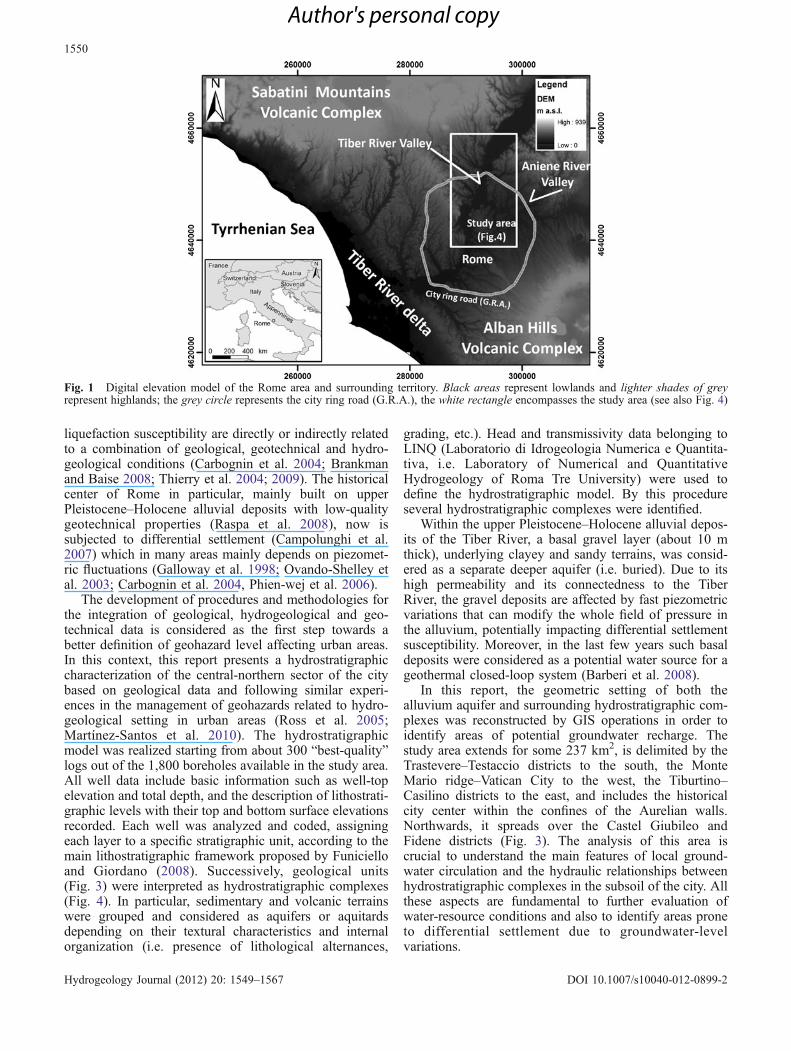
The territory of the Rome municipality (Italy) spreadsover the Tiber River Valley which is delimited by theSabatini Mts. Volcanic Complex, to the north-west, andthe Alban Hills Volcanic Complex, to the south-east. TheTiber River, coming from the Apennines, passes throughthe city and flows in a north–south direction towards theTyrrhenian Sea, receiving several tributary streams in-cluded the Aniene River on its left bank (Fig. 1).
In the last four decades the land urbanization of the cityhas proceeded intensely stressing the geological andnatural environment, and increasing geohazards as wellas hydrogeological risks in the urban and suburban areas.Moreover, the development of the city has increased theneed for water supply both for civil and industrial uses.
The UrbiSIT project, led by the CNR-IGAG (Institutefor Environmental Geology and Geoengineering of theNational Research Council) in collaboration with theUniversity of Rome “Roma Tre” (Geological SciencesDepartment) and other CNR institutes under the promo-tion and funding of the Italian Civil Protection NationalService (DPC), has the goal of realizing tools andguidelines for geohazard evaluation in urban areas. Theproject follows similar experiences of research projects inthe field of urban geosciences (Thierry et al. 2000;Rosenbaum 2003; Culshaw 2005; Bourgine et al. 2006;Marache et al. 2009; Kessler et al. 2010). The city ofRome was chosen as a case study due to the large amountof available well data and the exposure to differentgeohazards. Differential settlement, land subsidence, and
Received: 4 October 2011 /Accepted: 9 August 2012Published online: 13 September 2012
* Springer-Verlag 2012
C. Di Salvo ()) :M. Mancini :M. Moscatelli :G. P. CavinatoCNR-IGAG, Istituto di Geologia Ambientale e Geoingegneria,Area della Ricerca di Roma1 - Montelibretti, Via Salaria Km29,300, Monterotondo, Rome, 00010, Italye-mail: [email protected]
E. Di LuzioCNR-ITABC, Istituto per le Tecnologie Applicate ai Beni Culturali,Area della Ricerca di Roma1 - Montelibretti, Via Salaria Km29,300, Monterotondo, 00010 Rome, Italy
G. Capelli :R. MazzaDipartimento di Scienze Geologiche, Laboratorio di IdrogeologiaNumerica e Quantitativa (LINQ),Università degli Studi Roma Tre,Largo San Leonardo Murialdo 1, 00146 Rome, Italy
Hydrogeology Journal (2012) 20: 1549–1567 DOI 10.1007/s10040-012-0899-2
Author's personal copy
liquefaction susceptibility are directly or indirectly relatedto a combination of geological, geotechnical and hydro-geological conditions (Carbognin et al. 2004; Brankmanand Baise 2008; Thierry et al. 2004; 2009). The historicalcenter of Rome in particular, mainly built on upperPleistocene–Holocene alluvial deposits with low-qualitygeotechnical properties (Raspa et al. 2008), now issubjected to differential settlement (Campolunghi et al.2007) which in many areas mainly depends on piezomet-ric fluctuations (Galloway et al. 1998; Ovando-Shelley etal. 2003; Carbognin et al. 2004, Phien-wej et al. 2006).
The development of procedures and methodologies forthe integration of geological, hydrogeological and geo-technical data is considered as the first step towards abetter definition of geohazard level affecting urban areas.In this context, this report presents a hydrostratigraphiccharacterization of the central-northern sector of the citybased on geological data and following similar experi-ences in the management of geohazards related to hydro-geological setting in urban areas (Ross et al. 2005;Martínez-Santos et al. 2010). The hydrostratigraphicmodel was realized starting from about 300 “best-quality”logs out of the 1,800 boreholes available in the study area.All well data include basic information such as well-topelevation and total depth, and the description of lithostrati-graphic levels with their top and bottom surface elevationsrecorded. Each well was analyzed and coded, assigningeach layer to a specific stratigraphic unit, according to themain lithostratigraphic framework proposed by Funicielloand Giordano (2008). Successively, geological units(Fig. 3) were interpreted as hydrostratigraphic complexes(Fig. 4). In particular, sedimentary and volcanic terrainswere grouped and considered as aquifers or aquitardsdepending on their textural characteristics and internalorganization (i.e. presence of lithological alternances,
grading, etc.). Head and transmissivity data belonging toLINQ (Laboratorio di Idrogeologia Numerica e Quantita-tiva, i.e. Laboratory of Numerical and QuantitativeHydrogeology of Roma Tre University) were used todefine the hydrostratigraphic model. By this procedureseveral hydrostratigraphic complexes were identified.
Within the upper Pleistocene–Holocene alluvial depos-its of the Tiber River, a basal gravel layer (about 10 mthick), underlying clayey and sandy terrains, was consid-ered as a separate deeper aquifer (i.e. buried). Due to itshigh permeability and its connectedness to the TiberRiver, the gravel deposits are affected by fast piezometricvariations that can modify the whole field of pressure inthe alluvium, potentially impacting differential settlementsusceptibility. Moreover, in the last few years such basaldeposits were considered as a potential water source for ageothermal closed-loop system (Barberi et al. 2008).
In this report, the geometric setting of both thealluvium aquifer and surrounding hydrostratigraphic com-plexes was reconstructed by GIS operations in order toidentify areas of potential groundwater recharge. Thestudy area extends for some 237 km2, is delimited by theTrastevere–Testaccio districts to the south, the MonteMario ridge–Vatican City to the west, the Tiburtino–Casilino districts to the east, and includes the historicalcity center within the confines of the Aurelian walls.Northwards, it spreads over the Castel Giubileo andFidene districts (Fig. 3). The analysis of this area iscrucial to understand the main features of local ground-water circulation and the hydraulic relationships betweenhydrostratigraphic complexes in the subsoil of the city. Allthese aspects are fundamental to further evaluation ofwater-resource conditions and also to identify areas proneto differential settlement due to groundwater-levelvariations.
Fig. 1 Digital elevation model of the Rome area and surrounding territory. Black areas represent lowlands and lighter shades of greyrepresent highlands; the grey circle represents the city ring road (G.R.A.), the white rectangle encompasses the study area (see also Fig. 4)
1550
Hydrogeology Journal (2012) 20: 1549–1567 DOI 10.1007/s10040-012-0899-2
Author's personal copy
Geological setting of Rome
The geological setting of the investigated area is the combinedresult of the sedimentary and volcanic processes that featuredthe peri-Tyrrhenian Sea areas in central Italy in Pliocene–Quaternary times. The oldest sediments were deposited in adeep marine environment during the Pliocene; indeed, theclays and sandy clays of theMonte VaticanoUnit (Marra et al.1998; Funiciello and Giordano 2008) form the geologicalbedrock of the whole municipality of Rome (MV unit in thisreport, see Figs. 2 and 3). During the Pliocene–Pleistoceneboundary, the Rome area experienced local-scale uplift anderosion (Cosentino et al. 2009). A marine depositionalenvironment re-established in the early Pleistocene, the sandsand clays of the Monte Mario Unit (Conato et al. 1980; Marraet al. 1998; Marra and Rosa 1995; Funiciello and Giordano2008), MM unit in Figs. 2 and 3, covered the Pliocenesubstratum with angular unconformity. A definitive transitionto a continental environment occurred at the end of the earlyPleistocene with the onset of fluvio-deltaic and coastalsedimentation fed by a juvenile Tiber River (Mancini andCavinato 2005). Fluvial and coastal deposits composed ofcomplex alternated gravels, sands and pelites, overlie withunconformity the previous units and are associated with the
Ponte Galeria Unit (PGT, see Figs. 2 and 3). This unit includesspace and time-separated, eustatically controlled, sedimentarycycles predating the emission of volcanic deposits (Marra andRosa 1995; Milli 1997; Marra et al. 1998; Funiciello andGiordano 2008). Part of the PGT Unit was deposited in aNW–SE trending extensional, tectonic structure known as“Paleotiber Graben”, that is located in the north-east of theurban area (Fig. 3). The fluvio-palustrine deposits filling thegraben formed a sequence of gravels and clays, andsubordinate sands, with a maximum thickness of about150 m. Its deposition was controlled by syn-sedimentarytectonics at the early–middle Pleistocene time boundary(Funiciello and Giordano 2008; Florindo et al. 2007).
During the middle–late Pleistocene, the explosivevolcanism from the Sabatini Mts. and Alban Hills districtsproduced huge volumes of pyroclastic deposits (Karner etal. 2001). The interplay among eustatism, volcanism andfluvio-deltaic sedimentation determined the deposition ofa widespread and 50–60-m-thick volcano-sedimentarymultilayer (VTA in Figs. 2 and 3). The last global sealevel fall and lowstand, from 116,000 years (ky) to 14 kyago, forced the Tiber River to incise a deep and narrowvalley within the Plio-Pleistocene units (Milli 1997;Funiciello and Giordano 2008). The basal erosive surface
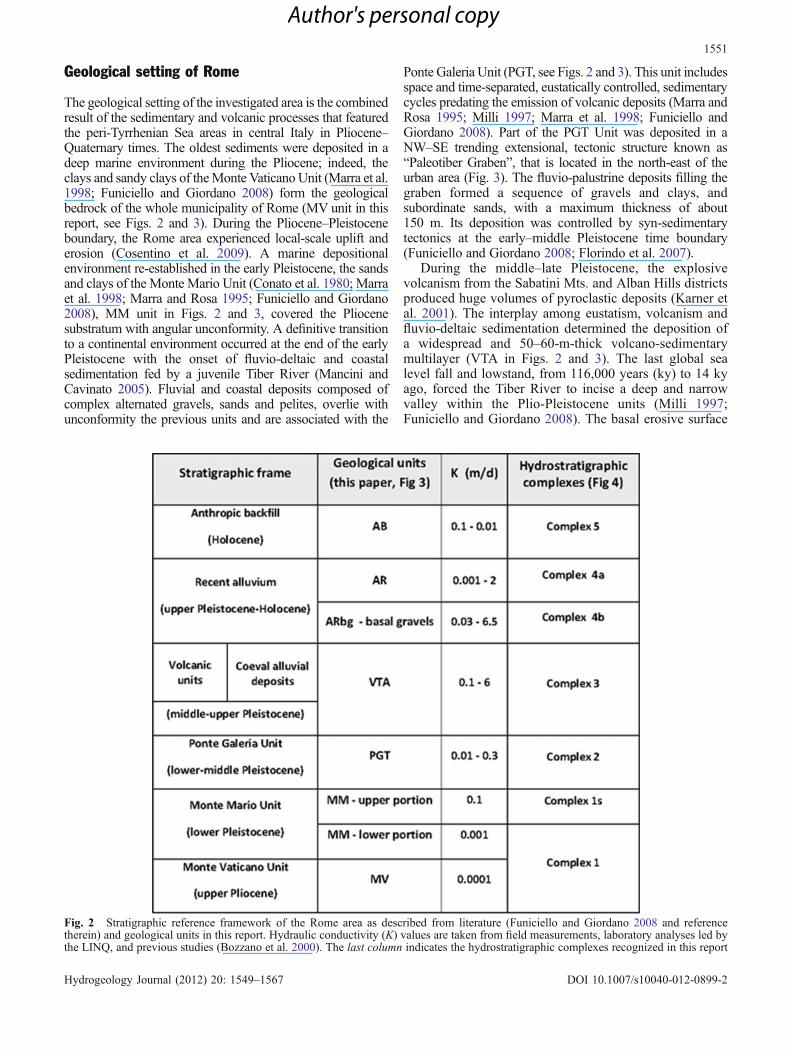
Fig. 2 Stratigraphic reference framework of the Rome area as described from literature (Funiciello and Giordano 2008 and referencetherein) and geological units in this report. Hydraulic conductivity (K) values are taken from field measurements, laboratory analyses led bythe LINQ, and previous studies (Bozzano et al. 2000). The last column indicates the hydrostratigraphic complexes recognized in this report
1551
Hydrogeology Journal (2012) 20: 1549–1567 DOI 10.1007/s10040-012-0899-2
Author's personal copy

of the upper Pleistocene–Holocene alluvium deposits(these last having a maximum thickness of more than60 m) reaches a minimum elevation of −50 m above sealevel (a.s.l.) in the city of Rome (Bozzano et al. 2000,2008). The alluvium filling the valley, deposited after thelower Pleistocene–Holocene sea level rise and high stand(14–0 ky BP), is mainly constituted by fine deposits (AR
in Figs. 2 and 3) overlying a basal level of sandy andsilty gravels deposited mostly during the lowstand phase(ARbg in Fig. 2). Finally, the whole urban area iscovered by an almost continuous blanket of anthropicbackfill deposits (AB in Fig. 2), reaching a maximumthickness of 15–20 m in the historical city center(Ciotoli et al. 2011).
Fig. 3 Geological map of the Rome area beneath the anthropic backfill deposits. Legend: ARHolocene alluvial deposits; VTA middle–upperPleistocene volcanic units including syn-volcanic sedimentary deposits; PGTlower-middle Pleistocene continental deposits; MMlowerPleistocene continental deposits; MVupper Pliocene marine deposits. The coordinate grid is referred to the ED50 Utm N33 projection system
1552
Hydrogeology Journal (2012) 20: 1549–1567 DOI 10.1007/s10040-012-0899-2
Author's personal copy
Definition of the hydrostratigraphic complexesin the study area and basic characterizationof groundwater hydraulics
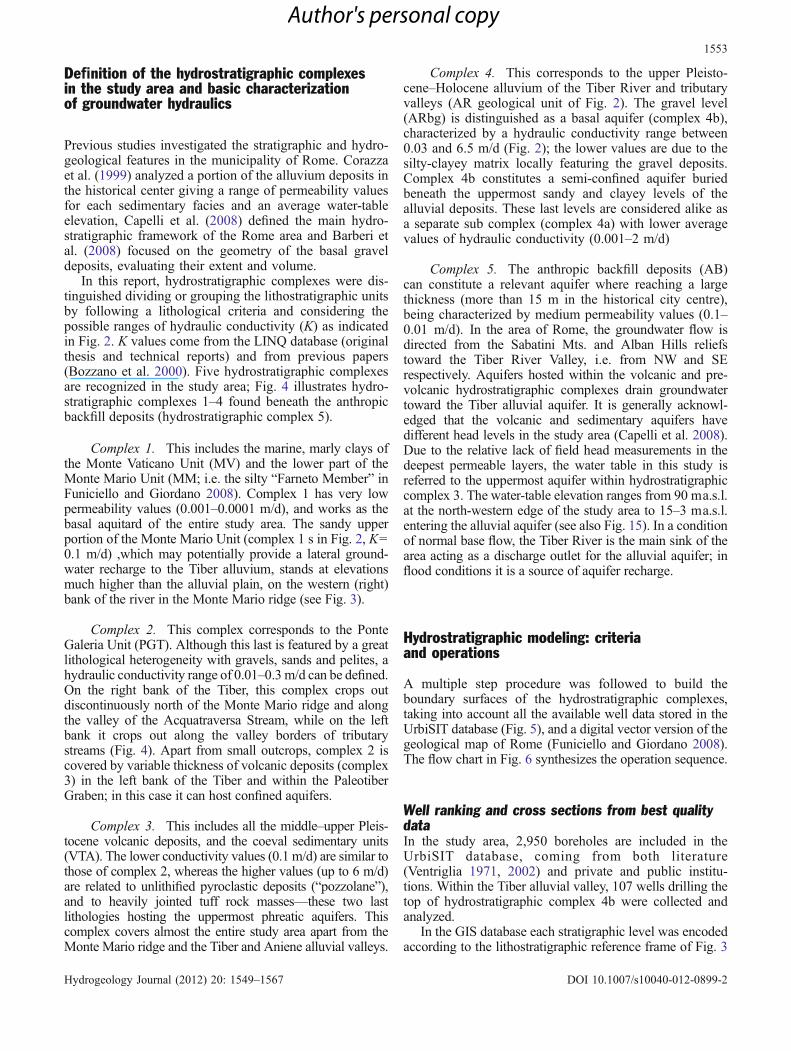
Previous studies investigated the stratigraphic and hydro-geological features in the municipality of Rome. Corazzaet al. (1999) analyzed a portion of the alluvium deposits inthe historical center giving a range of permeability valuesfor each sedimentary facies and an average water-tableelevation, Capelli et al. (2008) defined the main hydro-stratigraphic framework of the Rome area and Barberi etal. (2008) focused on the geometry of the basal graveldeposits, evaluating their extent and volume.
In this report, hydrostratigraphic complexes were dis-tinguished dividing or grouping the lithostratigraphic unitsby following a lithological criteria and considering thepossible ranges of hydraulic conductivity (K) as indicatedin Fig. 2. K values come from the LINQ database (originalthesis and technical reports) and from previous papers(Bozzano et al. 2000). Five hydrostratigraphic complexesare recognized in the study area; Fig. 4 illustrates hydro-stratigraphic complexes 1–4 found beneath the anthropicbackfill deposits (hydrostratigraphic complex 5).
Complex 1. This includes the marine, marly clays ofthe Monte Vaticano Unit (MV) and the lower part of theMonte Mario Unit (MM; i.e. the silty “Farneto Member” inFuniciello and Giordano 2008). Complex 1 has very lowpermeability values (0.001–0.0001 m/d), and works as thebasal aquitard of the entire study area. The sandy upperportion of the Monte Mario Unit (complex 1 s in Fig. 2, K=0.1 m/d) ,which may potentially provide a lateral ground-water recharge to the Tiber alluvium, stands at elevationsmuch higher than the alluvial plain, on the western (right)bank of the river in the Monte Mario ridge (see Fig. 3).
Complex 2. This complex corresponds to the PonteGaleria Unit (PGT). Although this last is featured by a greatlithological heterogeneity with gravels, sands and pelites, ahydraulic conductivity range of 0.01–0.3 m/d can be defined.On the right bank of the Tiber, this complex crops outdiscontinuously north of the Monte Mario ridge and alongthe valley of the Acquatraversa Stream, while on the leftbank it crops out along the valley borders of tributarystreams (Fig. 4). Apart from small outcrops, complex 2 iscovered by variable thickness of volcanic deposits (complex3) in the left bank of the Tiber and within the PaleotiberGraben; in this case it can host confined aquifers.
Complex 3. This includes all the middle–upper Pleis-tocene volcanic deposits, and the coeval sedimentary units(VTA). The lower conductivity values (0.1 m/d) are similar tothose of complex 2, whereas the higher values (up to 6 m/d)are related to unlithified pyroclastic deposits (“pozzolane”),and to heavily jointed tuff rock masses—these two lastlithologies hosting the uppermost phreatic aquifers. Thiscomplex covers almost the entire study area apart from theMonte Mario ridge and the Tiber and Aniene alluvial valleys.
Complex 4. This corresponds to the upper Pleisto-cene–Holocene alluvium of the Tiber River and tributaryvalleys (AR geological unit of Fig. 2). The gravel level(ARbg) is distinguished as a basal aquifer (complex 4b),characterized by a hydraulic conductivity range between0.03 and 6.5 m/d (Fig. 2); the lower values are due to thesilty-clayey matrix locally featuring the gravel deposits.Complex 4b constitutes a semi-confined aquifer buriedbeneath the uppermost sandy and clayey levels of thealluvial deposits. These last levels are considered alike asa separate sub complex (complex 4a) with lower averagevalues of hydraulic conductivity (0.001–2 m/d)
Complex 5. The anthropic backfill deposits (AB)can constitute a relevant aquifer where reaching a largethickness (more than 15 m in the historical city centre),being characterized by medium permeability values (0.1–0.01 m/d). In the area of Rome, the groundwater flow isdirected from the Sabatini Mts. and Alban Hills reliefstoward the Tiber River Valley, i.e. from NW and SErespectively. Aquifers hosted within the volcanic and pre-volcanic hydrostratigraphic complexes drain groundwatertoward the Tiber alluvial aquifer. It is generally acknowl-edged that the volcanic and sedimentary aquifers havedifferent head levels in the study area (Capelli et al. 2008).Due to the relative lack of field head measurements in thedeepest permeable layers, the water table in this study isreferred to the uppermost aquifer within hydrostratigraphiccomplex 3. The water-table elevation ranges from 90 ma.s.l.at the north-western edge of the study area to 15–3 ma.s.l.entering the alluvial aquifer (see also Fig. 15). In a conditionof normal base flow, the Tiber River is the main sink of thearea acting as a discharge outlet for the alluvial aquifer; inflood conditions it is a source of aquifer recharge.
Hydrostratigraphic modeling: criteriaand operations
A multiple step procedure was followed to build theboundary surfaces of the hydrostratigraphic complexes,taking into account all the available well data stored in theUrbiSIT database (Fig. 5), and a digital vector version of thegeological map of Rome (Funiciello and Giordano 2008).The flow chart in Fig. 6 synthesizes the operation sequence.
Well ranking and cross sections from best qualitydataIn the study area, 2,950 boreholes are included in theUrbiSIT database, coming from both literature(Ventriglia 1971, 2002) and private and public institu-tions. Within the Tiber alluvial valley, 107 wells drilling thetop of hydrostratigraphic complex 4b were collected andanalyzed.
In the GIS database each stratigraphic level was encodedaccording to the lithostratigraphic reference frame of Fig. 3
1553
Hydrogeology Journal (2012) 20: 1549–1567 DOI 10.1007/s10040-012-0899-2
Author's personal copy

and successively attributed to one of the identified hydro-stratigraphic complexes (Fig. 2). Previous to coding opera-tion, a well quality ranking was established based on thefollowing three criteria:
1. Well depth2. Ratio between well depth and number of geological
levels described in each well log
3. Nearness to a lithostratigraphic boundary in thegeological map of Fig. 3
According to such criteria, a ranking was assigned toeach well and three classes were distinguished—highquality (HQ), medium quality (MQ), low quality (LQ) inFig. 5. Wells with the highest rank (class HQ) in the studyarea where firstly analyzed and coded (Fig. 6, step 1a).
Fig. 4 Hydrostratigraphic complexes 1–4 beneath the anthropic backfill deposits (hydrostratigraphic complex 5) in the study area
1554
Hydrogeology Journal (2012) 20: 1549–1567 DOI 10.1007/s10040-012-0899-2
Author's personal copy
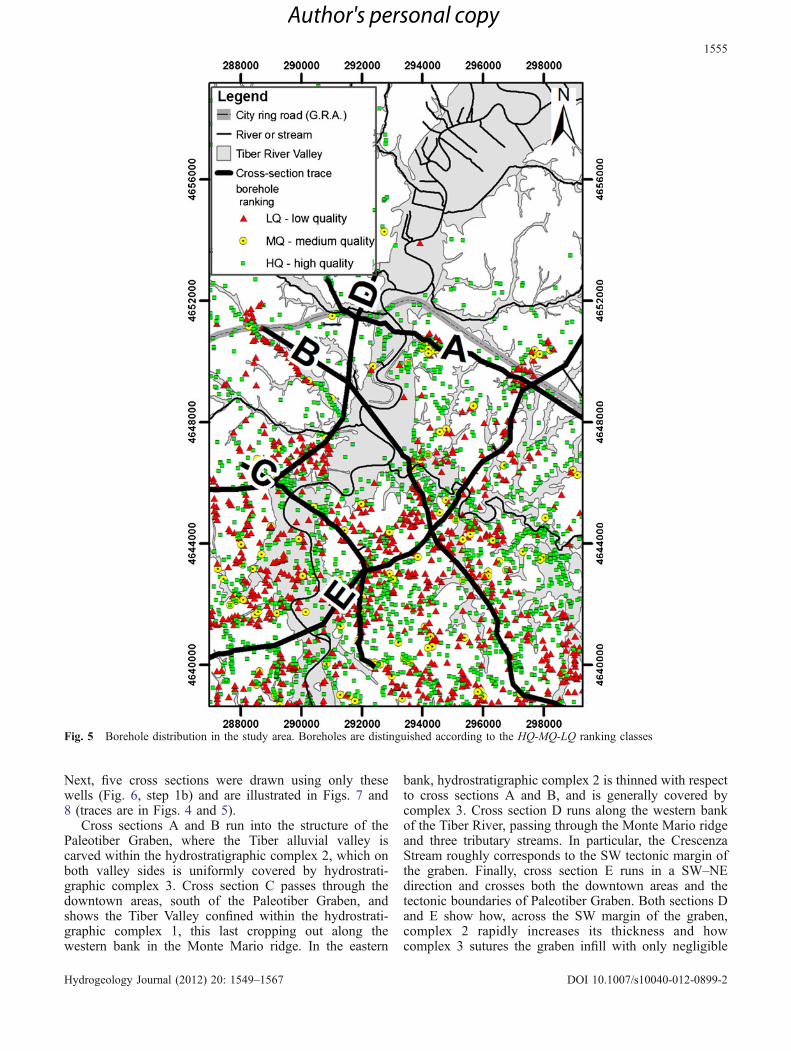
Next, five cross sections were drawn using only thesewells (Fig. 6, step 1b) and are illustrated in Figs. 7 and8 (traces are in Figs. 4 and 5).
Cross sections A and B run into the structure of thePaleotiber Graben, where the Tiber alluvial valley iscarved within the hydrostratigraphic complex 2, which onboth valley sides is uniformly covered by hydrostrati-graphic complex 3. Cross section C passes through thedowntown areas, south of the Paleotiber Graben, andshows the Tiber Valley confined within the hydrostrati-graphic complex 1, this last cropping out along thewestern bank in the Monte Mario ridge. In the eastern
bank, hydrostratigraphic complex 2 is thinned with respectto cross sections A and B, and is generally covered bycomplex 3. Cross section D runs along the western bankof the Tiber River, passing through the Monte Mario ridgeand three tributary streams. In particular, the CrescenzaStream roughly corresponds to the SW tectonic margin ofthe graben. Finally, cross section E runs in a SW–NEdirection and crosses both the downtown areas and thetectonic boundaries of Paleotiber Graben. Both sections Dand E show how, across the SW margin of the graben,complex 2 rapidly increases its thickness and howcomplex 3 sutures the graben infill with only negligible
Fig. 5 Borehole distribution in the study area. Boreholes are distinguished according to the HQ-MQ-LQ ranking classes
1555
Hydrogeology Journal (2012) 20: 1549–1567 DOI 10.1007/s10040-012-0899-2
Author's personal copy
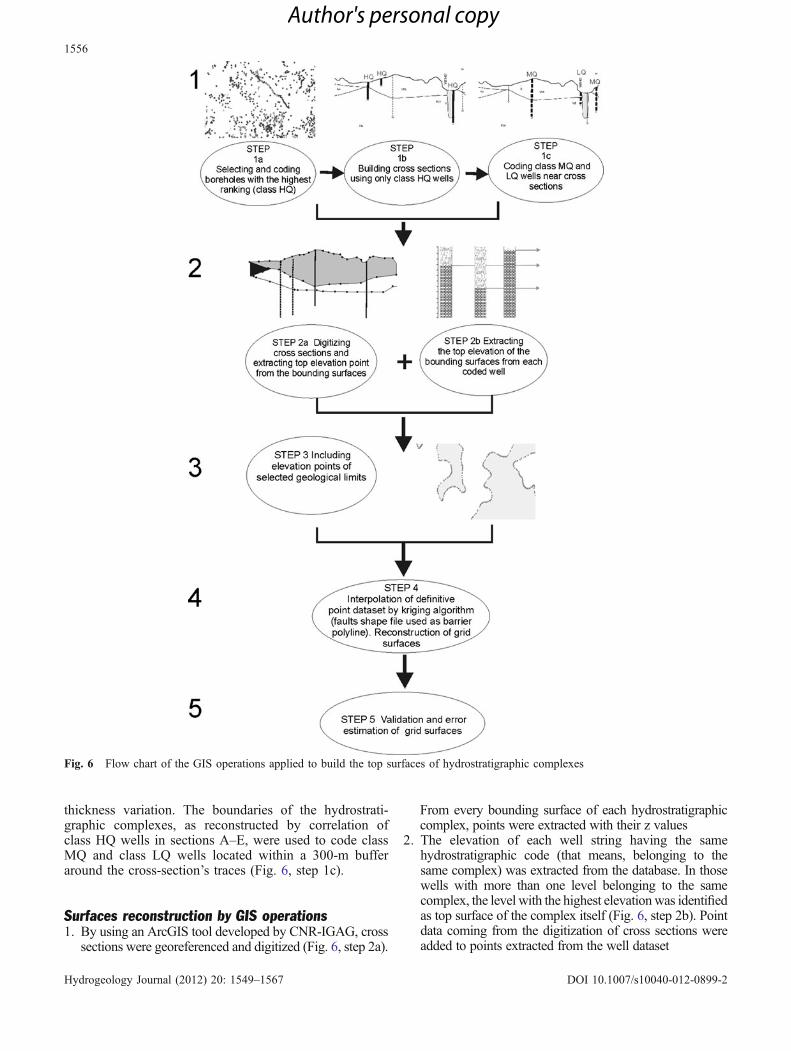
thickness variation. The boundaries of the hydrostrati-graphic complexes, as reconstructed by correlation ofclass HQ wells in sections A–E, were used to code classMQ and class LQ wells located within a 300-m bufferaround the cross-section’s traces (Fig. 6, step 1c).
Surfaces reconstruction by GIS operations1. By using an ArcGIS tool developed by CNR-IGAG, cross
sections were georeferenced and digitized (Fig. 6, step 2a).
From every bounding surface of each hydrostratigraphiccomplex, points were extracted with their z values
2. The elevation of each well string having the samehydrostratigraphic code (that means, belonging to thesame complex) was extracted from the database. In thosewells with more than one level belonging to the samecomplex, the level with the highest elevationwas identifiedas top surface of the complex itself (Fig. 6, step 2b). Pointdata coming from the digitization of cross sections wereadded to points extracted from the well dataset
Fig. 6 Flow chart of the GIS operations applied to build the top surfaces of hydrostratigraphic complexes
1556
Hydrogeology Journal (2012) 20: 1549–1567 DOI 10.1007/s10040-012-0899-2
Author's personal copy
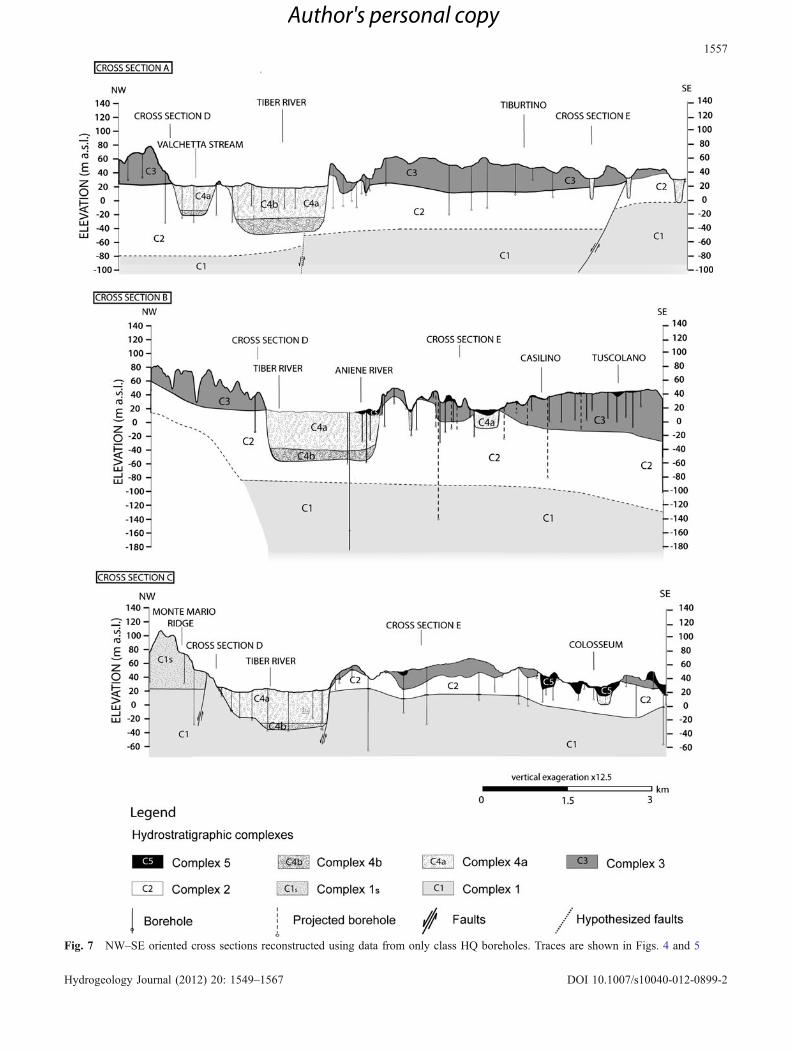
Fig. 7 NW–SE oriented cross sections reconstructed using data from only class HQ boreholes. Traces are shown in Figs. 4 and 5
1557
Hydrogeology Journal (2012) 20: 1549–1567 DOI 10.1007/s10040-012-0899-2
Author's personal copy

3. Points elevation from those geological limits in thegeological map of Rome corresponding to boundingsurfaces of the hydrostratigraphic complex wereextracted, thus obtaining a further point dataset(Fig. 6, step 3) which was added to the previousdatasets, whereby a definitive point dataset wasobtained.
4. The definitive point dataset was interpolated using theOrdinary Kriging algorithm (Fig. 6, step 4). The faultsshape file from the geological map was used as abarrier polyline. Variogram models were definedincluding a nugget and a spherical model. Parameterswere optimized to obtain a model best fitting thevariogram. Then, grid surfaces were built (Figs. 9, 10and 11).
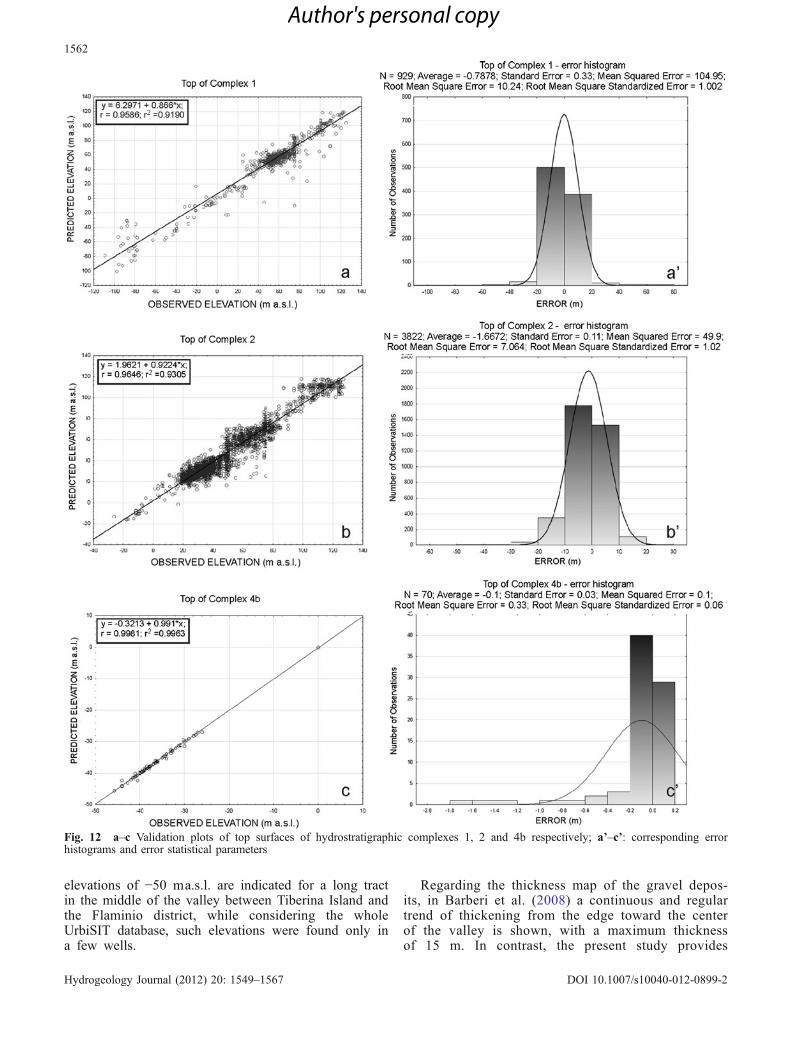
Finally, dataset was divided into two subsets: a“training dataset”, owing the 70 % of data, and a “testdataset” owing the remaining 30 %. As validationprocedure, grid surfaces were newly reconstructed usingthe “training dataset”. Then, the “test dataset” were usedto evaluate the difference between observed and predictedelevation. Validation plots are shown in Figs. 12a–c for
each bounding surface. Figures 12a’–c’ reports errorhistograms as well as error statistical parameters.
Discussions
The multiple-step procedure adopted to integrate andelaborate well data, cross sections and surface informationallowed the reconstruction of the bounding surfaces of themain hydrostratigraphic complexes listed in Fig. 2. In thisway, it was possible in particular to investigate thegeometric relationships between complex 4b at the baseof the Tiber Valley alluvial infill and the confiningcomplexes.
In the hydrostratigraphic model, the lowermost surfacecorresponds to the top of the basal aquitard, i.e. the top ofcomplex 1. Figure 9 shows how along the western flank ofTiber River Valley, this surface reaches the highestelevations, up to 130 ma.s.l., in the Monte Mario ridge.In the eastern bank of the Tiber, beneath the historical citycenter within the Aurelian walls perimeter, its elevationranges between +20 and −20 ma.s.l., with a gentle dip
Fig. 8 SW–NE oriented cross sections reconstructed using data from only class HQ boreholes. Traces are shown in Figs. 4 and 5
1558
Hydrogeology Journal (2012) 20: 1549–1567 DOI 10.1007/s10040-012-0899-2
Author's personal copy
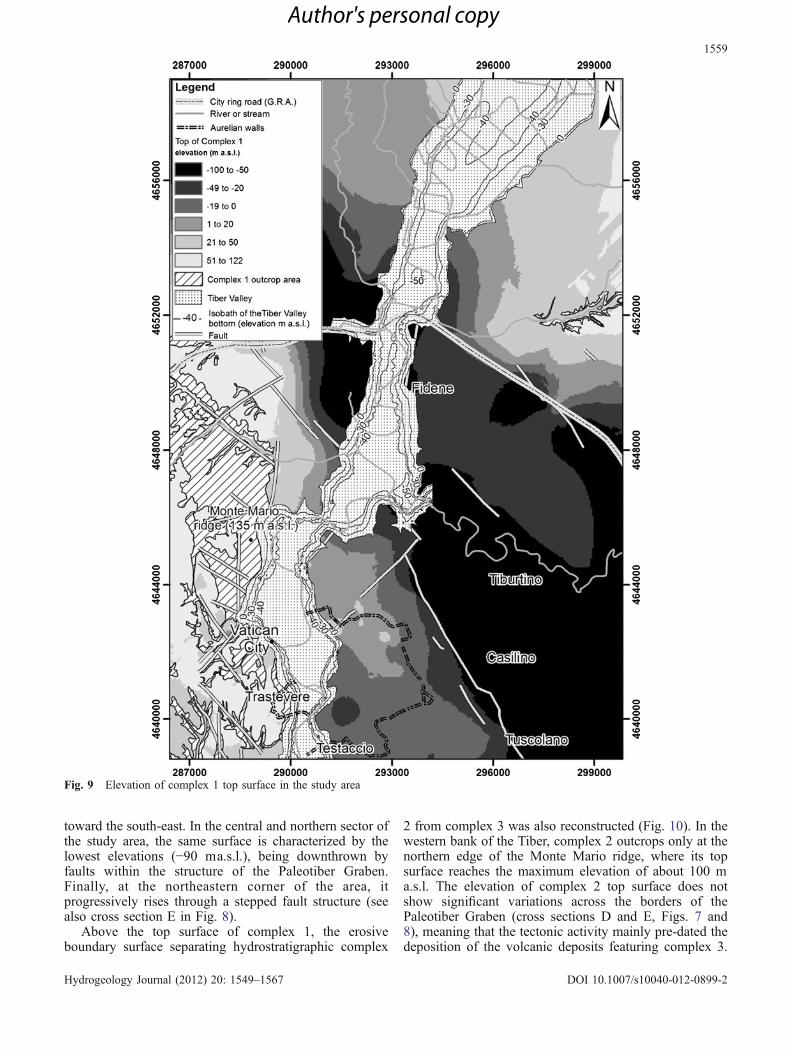
toward the south-east. In the central and northern sector ofthe study area, the same surface is characterized by thelowest elevations (−90 ma.s.l.), being downthrown byfaults within the structure of the Paleotiber Graben.Finally, at the northeastern corner of the area, itprogressively rises through a stepped fault structure (seealso cross section E in Fig. 8).
Above the top surface of complex 1, the erosiveboundary surface separating hydrostratigraphic complex
2 from complex 3 was also reconstructed (Fig. 10). In thewestern bank of the Tiber, complex 2 outcrops only at thenorthern edge of the Monte Mario ridge, where its topsurface reaches the maximum elevation of about 100 ma.s.l. The elevation of complex 2 top surface does notshow significant variations across the borders of thePaleotiber Graben (cross sections D and E, Figs. 7 and8), meaning that the tectonic activity mainly pre-dated thedeposition of the volcanic deposits featuring complex 3.
Fig. 9 Elevation of complex 1 top surface in the study area
1559
Hydrogeology Journal (2012) 20: 1549–1567 DOI 10.1007/s10040-012-0899-2
Author's personal copy

The sedimentary terrains of complex 2 entirely fill thePaleotiber structural depression; along its axis, the mainelevations (up to 50 ma.s.l.) are between the Fidene andTiburtino districts, whereas a decreasing trend can beobserved both toward the north-west and south-east whereminimum elevations of 30 and −10 ma.s.l. were detected,respectively (Fig. 10).
The top surface of the gravel deposits at the base ofthe Tiber Valley infilling (complex 4b) was finallyreconstructed and is shown in Fig. 11. A couple ofremarks are important about the modeling of thissurface. Firstly, well-data distribution did not allowits reconstruction north of the city ring road. Secondly,coarse clastic deposits coming from tributary streamssuch as the Aniene River, the Crescenza and Valchettastreams were included in complex 4b, which wasbecause such deposits directly overly the basal gravel
of the Tiber Valley and have a similar hydraulicconductivity.
The top-surface elevation shows a general trend ofdecrease from the north (2 to −30 ma.s.l.) to the south(−35 to −40 ma.s.l.). Minimum elevations are observed atTestaccio, Tiberina Island and close to the Vatican City.Local erosive effects probably determined the lowestelevation at the confluence between the Aniene and Tiberrivers.
The thickness map of hydrostratigraphic complex4b is shown in Fig. 13. The thickness of the basalgravel ranges from 0 to 30 m. The greatest thickness(15–30 m) corresponds with the confluence of theValchetta Stream, at the northern edge of the studyarea. Areas of substantial thickness (about 8–10 m)are found at the confluence with the Aniene River andalong the eastern side of the Tiber Valley, beneath the
Fig. 10 Elevation of complex 2 top surface in the study area
1560
Hydrogeology Journal (2012) 20: 1549–1567 DOI 10.1007/s10040-012-0899-2
Author's personal copy

Flaminio and Testaccio districts and south of VillaBorghese.
Comparing the results of this study to the one byBarberi et al. (2008), a few differences arise. Although thetop surface of the basal gravel shows a similar deepeningtrend from north to south, the isobaths trend appears less
regular in the present work and it does not strictly followthe boundaries of the alluvial valley; local N–S trendingthickenings can be observed in the map of Fig. 13, andcan be interpreted as a buried stream’s hydrologicalflow structures (i.e. “riffle and pool” sequence).Moreover, in the maps by Barberi et al. (2008),
Fig. 11 Elevation of complex 4b top surface within the Tiber River Valley
1561
Hydrogeology Journal (2012) 20: 1549–1567 DOI 10.1007/s10040-012-0899-2
Author's personal copy
elevations of −50 ma.s.l. are indicated for a long tractin the middle of the valley between Tiberina Island andthe Flaminio district, while considering the wholeUrbiSIT database, such elevations were found only ina few wells.
Regarding the thickness map of the gravel depos-its, in Barberi et al. (2008) a continuous and regulartrend of thickening from the edge toward the centerof the valley is shown, with a maximum thicknessof 15 m. In contrast, the present study provides
Fig. 12 a–c Validation plots of top surfaces of hydrostratigraphic complexes 1, 2 and 4b respectively; a’–c’: corresponding errorhistograms and error statistical parameters
1562
Hydrogeology Journal (2012) 20: 1549–1567 DOI 10.1007/s10040-012-0899-2
Author's personal copy

evidence of an irregular pattern with isolated areas ofmajor thickening mainly located along the easternedge of the Tiber Valley (Fig. 13). Besides, thethickness of the complex 4b only rarely exceeds10 m and there are zones of very reduced thickness(1–5 m) such as north of the Flaminio district and
west of Fidene station, meaning that the basal aquiferis discontinuous.
By combining the top surfaces of Figs. 9, 10 and 11(complexes 1, 2 and 4b) in the ArcScene environment, athree-dimensional (3D) representation of the geometricrelationship between the buried aquifer (complex 4b) and
Fig. 13 Thickness map of complex 4b within the Tiber River Valley
1563
Hydrogeology Journal (2012) 20: 1549–1567 DOI 10.1007/s10040-012-0899-2
Author's personal copy
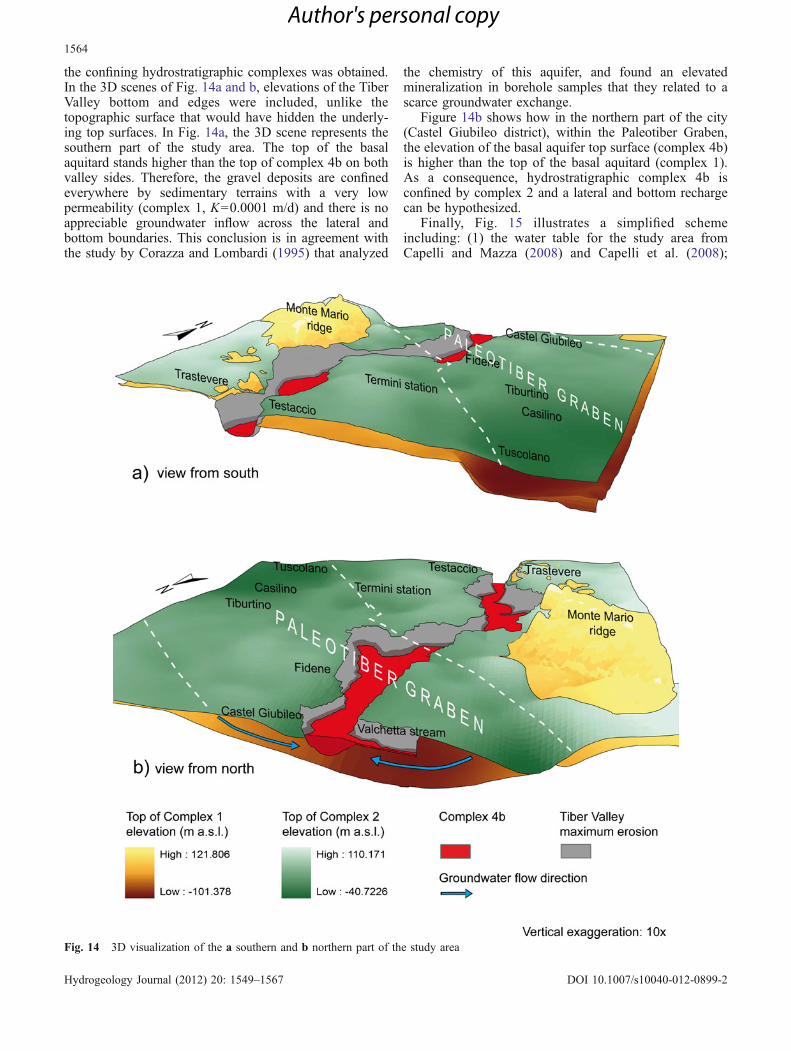
the confining hydrostratigraphic complexes was obtained.In the 3D scenes of Fig. 14a and b, elevations of the TiberValley bottom and edges were included, unlike thetopographic surface that would have hidden the underly-ing top surfaces. In Fig. 14a, the 3D scene represents thesouthern part of the study area. The top of the basalaquitard stands higher than the top of complex 4b on bothvalley sides. Therefore, the gravel deposits are confinedeverywhere by sedimentary terrains with a very lowpermeability (complex 1, K=0.0001 m/d) and there is noappreciable groundwater inflow across the lateral andbottom boundaries. This conclusion is in agreement withthe study by Corazza and Lombardi (1995) that analyzed
the chemistry of this aquifer, and found an elevatedmineralization in borehole samples that they related to ascarce groundwater exchange.
Figure 14b shows how in the northern part of the city(Castel Giubileo district), within the Paleotiber Graben,the elevation of the basal aquifer top surface (complex 4b)is higher than the top of the basal aquitard (complex 1).As a consequence, hydrostratigraphic complex 4b isconfined by complex 2 and a lateral and bottom rechargecan be hypothesized.
Finally, Fig. 15 illustrates a simplified schemeincluding: (1) the water table for the study area fromCapelli and Mazza (2008) and Capelli et al. (2008);
Fig. 14 3D visualization of the a southern and b northern part of the study area
1564
Hydrogeology Journal (2012) 20: 1549–1567 DOI 10.1007/s10040-012-0899-2
Author's personal copy
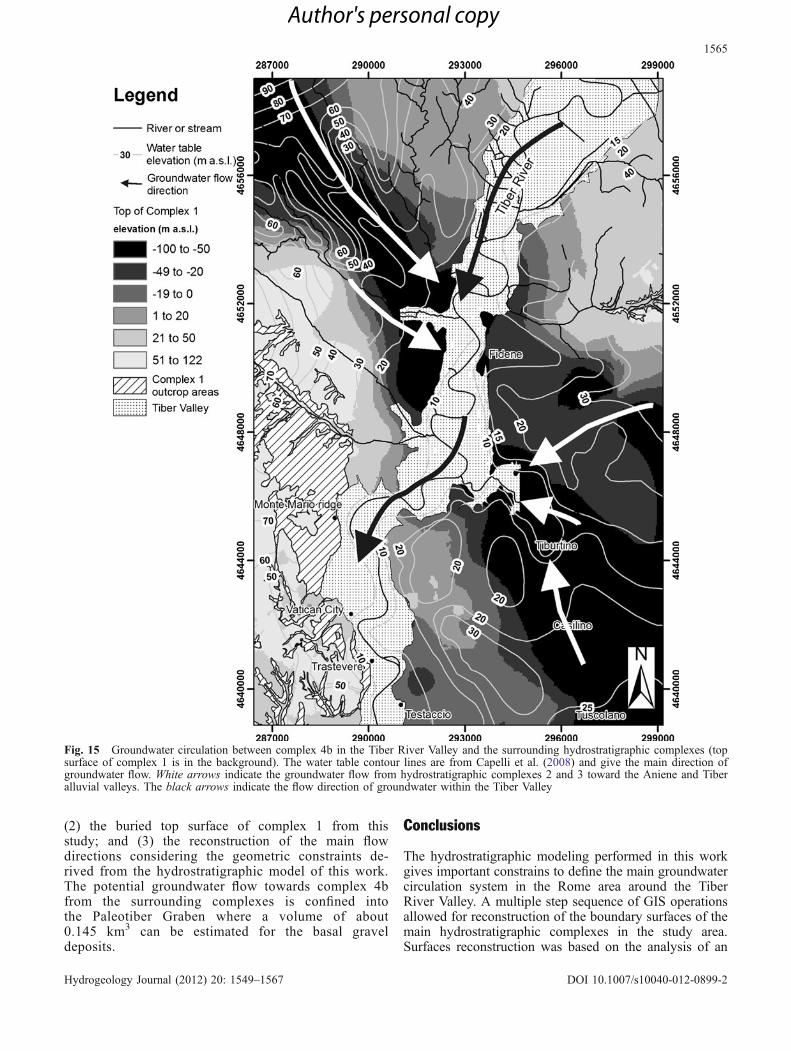
(2) the buried top surface of complex 1 from thisstudy; and (3) the reconstruction of the main flowdirections considering the geometric constraints de-rived from the hydrostratigraphic model of this work.The potential groundwater flow towards complex 4bfrom the surrounding complexes is confined intothe Paleotiber Graben where a volume of about0.145 km3 can be estimated for the basal graveldeposits.
Conclusions
The hydrostratigraphic modeling performed in this workgives important constrains to define the main groundwatercirculation system in the Rome area around the TiberRiver Valley. A multiple step sequence of GIS operationsallowed for reconstruction of the boundary surfaces of themain hydrostratigraphic complexes in the study area.Surfaces reconstruction was based on the analysis of an
Fig. 15 Groundwater circulation between complex 4b in the Tiber River Valley and the surrounding hydrostratigraphic complexes (topsurface of complex 1 is in the background). The water table contour lines are from Capelli et al. (2008) and give the main direction ofgroundwater flow. White arrows indicate the groundwater flow from hydrostratigraphic complexes 2 and 3 toward the Aniene and Tiberalluvial valleys. The black arrows indicate the flow direction of groundwater within the Tiber Valley
1565
Hydrogeology Journal (2012) 20: 1549–1567 DOI 10.1007/s10040-012-0899-2
Author's personal copy
updated borehole database and on a hydrogeologicalcharacterization of the stratigraphic units. Updated mapswere produced illustrating the elevation of the top surfacesof the hydrostratigraphic complexes. Particular attentionwas dedicated to the setting and thickness of hydrostrati-graphic complex 4b, corresponding to a buried aquifer inthe Tiber Valley, made of gravel deposits. Results werecompared to those from previous published works. Themain difference is that in this study the basal aquifer ishighly discontinuous, being characterized by a wide rangeand irregular distribution of thickness values.
Analyzing the geometric relationship between the topsurface of the buried aquifer within the Tiber alluvialvalley and the confining complexes, it was possible todistinguish two different areas: in the southern zone,around the downtown area, the basal gravel deposits areconfined on both valley sides by the low permeabilityterrains of hydrostratigraphic complex 1, i.e. the basalaquitard of the entire area; in the northernmost part of thecity, within the tectonic structure of the Paleotiber Graben,the top of the complex 1 lies below the bottom of theTiber alluvial valley. Therefore, a direct hydraulic con-nectivity between complex 4b and surrounding terrainsbelonging to complex 2 is hypothesized.
Results of this work set the basis for further studiesdedicated to groundwater numerical modeling in the samearea. Indeed, the improvement of the database, includinghydraulic and hydrogeological data, is necessary. Oncethis operation is completed, an advanced hydrogeologicalnumerical model will be implemented to quantify therecharge of the alluvial aquifer (complex 4b) and verifythe river–aquifer connectivity. These operations will allowfor simulation of the effect of piezometric fluctuationswithin alluvial terrains, strongly improving the assessmentof geohazard regarding differential settlements.
Acknowledgements Authors are grateful to the Italian CivilProtection National Service (i.e., DPC) for financing this study,(this report is part of the PhD thesis of CDS, funded within theUrbiSIT project). In particular, authors thank A. Corazza, L.Cavarra and F. Leone from DPC for their support. Authors alsothank F. Marconi and F. Pennica, and G. Ciotoli, for their help inArcGis and geostatistical applications, respectively. Authors aregrateful to the LINQ- Laboratorio di Idrogeologia Numerica eQuantitativa, Dipartimento Scienze Geologiche, Università RomaTre for providing hydrogeological data. Finally, the authors wish toremember the late Prof. Zuppi, Director of IGAG-CNR, who diedrecently.
References
Barberi F, Carapezza ML, Giordano G, Pensa A, Ranaldi M (2008)L’acquifero nelle ghiaie di base del Tevere: una risorsageotermica per la città di Roma [The Tiber basal gravel aquifer:a geothermal resource for the city of Rome]. In: Funiciello R,Praturlon A, Giordano G (eds) La geologia di Roma. Dal centrostorico alla periferia II [The geology of Rome: from thehistorical center to the suburbs]. Mem Desc Carta Geologicad’Italia 80, Istituto Poligrafico e Zecca di Roma, Rome
Bourgine B, Dominique S, Marache A, Thyerry P (2006) Tools andmethods for constructing 3D geological models in the urban
environment: the case of Bordeaux. Proceedings of the 10th IAEGCongress, 6–10 September 2006, Nottingham, UK, Paper no. 72
Bozzano F, Andreucci A, Gaeta M, Salucci R (2000) A geologicalmodel of the buried Tiber River valley beneath the historicalcentre of Rome. Bull Eng Geol Env 59:1–21
Bozzano F, Caserta A, Govoni A, Marra F, Martino S (2008) Staticand dynamic characterization of alluvial deposits in the TiberRiver Valley: new data for assessing potential ground motion inthe city of Rome. J Geophys Res. doi:10.1007/s001090000086
Brankman CM, Baise LG (2008) Liquefaction susceptibilitymapping in Boston, Massachusetts. Environ Eng Geosci 14(1):1–16
Campolunghi MP, Capelli G, Funiciello R, Lanzini M (2007)Geotechnical studies for foundation settlement in Holocenicalluvial deposits in the city of Rome (Italy). Eng Geol 89(1–2):9–35
Capelli G, Mazza R (2008) Cenni di idrogeologia dell’area romana[Outline of the hydrogeology of Rome]. In: Funiciello R,Giordano G (ed) Explanatory notes to the Geological Map ofItaly 1:50.000, sheet 374 “Roma”. Servizio Geologico d’Italia.Se.l.c.a., Florence, Italy
Capelli G, Mazza R, Taviani S (2008) Acque sotterranee nella cittàdi Roma [Groundwater in the city of Rome]. In: Funiciello R,Praturlon A, Giordano G (ed) La geologia di Roma: dal centrostorico alla periferia. Mem Desc della Carta Geologica d’ItaliaLXXX, Istituto Poligrafico e Zecca di Roma, Rome, pp 221–245
Carbognin L, Teatini P, Tosi L (2004) Eustacy and land subsidencein the Venice lagoon at the beginning of the new millennium. JMar Syst 51:345–353
Ciotoli G, Stigliano F, Marconi F, Moscatelli M, Mancini M,Cavinato GP (2011) Mapping the anthropic backfill of thehistorical center of Rome (Italy) by using intrinsic randomfunctions of order k (IRF-K). In: Murgante B, Gervasi O,Iglesias A, Taniar D, Apoluhan B O (eds) Computationalsciences and its applications, ICCSA 2011, part I, Proceedingsof the 11th International Conference, Santander, Spain, 20–23June 2011, Lecture notes in computer science, Springer,Heidelberg
Conato V, Esu D, Malatesta A, Zarlenga F (1980) New data on thePleistocene of Rome. Quaternaria 22:131–176
Corazza A, Lombardi L (1995) Idrogeologia dell’area del centrostorico di Roma [Hydrogeology of the historic center of Rome].In: Funiciello R (ed) La geologia di Roma. Il centro storico.Mem Desc della Carta Geologica d’Italia 50, Istituto Poligraficoe Zecca di Roma, Rome
Corazza A, Lanzini M, Rosa C, Salucci R (1999) Caratteristratigrafici, idrogeologici e geotecnici delle alluvioni tiberinenel settore del centro storico di Roma [Stratigraphic character-istics, and hydrogeological and geotechnical investigations ofthe Tiber floods in the historical center of Rome]. It J Quat Sci12(2):215–235
Cosentino D, Cipollari P, Di Bella L, Esposito A, Faranda C,Giordano G, Gliozzi E, Mattei M, Mazzini I, Porreca M,Funiciello R (2009) Tectonics, sea-level changes and palae-oenvironments in the early Pleistocene of Rome (Italy). QuatRes 72:143–155
Culshaw MG (2005) From concept towards reality: developing theattributed 3D geological model of the shallow subsurface. Q JEng Geol Hydrogeol 38:231–284
Florindo F, Karner DB, Marra F, Renne PR, Roberts AP, Weaver R(2007) Radioisotopic age constraints for Glacial TerminationsIX and VII from aggradational sections of the Tiber River deltain Rome, Italy. Earth Planet Sci Lett 256:61–80. doi:10.1016/j.epsl.2007.01.014
Funiciello R, Giordano G (2008) The geological map of Rome:lithostratigraphy and stratigraphic organization. In: Funiciello R,Praturlon A, Giordano G (eds) La geologia di Roma. Dal centrostorico alla periferia II. Mem Desc Carta Geologica d’Italia 80,Istituto Poligrafico e Zecca di Roma, Rome, pp 39–85
Galloway DL, Hudnut KW, Ingebritsen SE, Philips SP, Peltzer G,Rogez F (1998) Detection of aquifer system compaction andland subsidence using interferometric synthetic aperture radar,
1566
Hydrogeology Journal (2012) 20: 1549–1567 DOI 10.1007/s10040-012-0899-2
Author's personal copy
Antelope Valley, Mojave Desert, California. Water Resour Res34:2573–2585
Karner DB, Marra F, Renne P (2001) The history of the MontiSabatini and Alban Hills volcanoes: groundwork for assessingvolcanic-tectonic hazards for Rome. J Volcanol Geotherm Res107:185–219
Kessler H, Turner AK, Culshaw MG, Royse KR (2010) Unlockingthe potential of digital 3D geological subsurface models forgeotechnical engineers. In: European econference of theInternational Association for Engineering Geology, Madrid,15–20 Sept 2008. Asociacion Espanola de Geologia Aplicada ala Ingenieria, Madrid
Mancini M, Cavinato GP (2005) The Middle Valley of the TiberRiver, central Italy: Plio-Pleistocene fluvial and coastal sedi-mentation, extensional tectonics and volcanism. In: Blum M D,Marriott S B, Leclair SF (eds) Fluvial Sedimentology VII,International Association of Sedimentologists, Spec Publ 35,Blackwell, Oxford, UK, pp 373–396
Marache A, Breysse D, Piette C, Thierry P (2009) Geotechnicalmodeling at the city scale using statistical and geostatisticaltools: the Pessac case (France). Eng Geol. doi:10.1016/j.enggeo.2009.04.003
Marra F, Rosa C (1995) Stratigrafia e assetto geologico dell’arearomana [Stratigraphy and geological setting of Rome]. In:Funiciello R (ed) La geologia di Roma. Il centro storico. MemDesc della Carta Geologica d’Italia 50, Istituto Poligrafico eZecca di Roma, Rome, pp 49–118
Marra F, Rosa C, De Rita D, Funiciello R (1998) Stratigraphic andtectonic features of the middle Pleistocene sedimentary andvolcanic deposits in the area of Rome (Italy). Quat Intern 47(48):51–63
Martínez-Santos P, Martínez-Alfaro PE, Sanz E, Galindo A (2010)Daily scale modelling of aquifer–river connectivity in the urbanalluvial aquifer in Langreo, Spain. Hydrogeol J 18:1525–1537
Milli S (1997) Depositional setting and high frequency sequencestratigraphy of themiddle-upper Pleistocene to Holocene depositsof the Roman Basin. Geol Rom 33:99–136
Ovando-Shelley E, Romo MP, Contreras N, Giralt A (2003)Effects on soil properties of future settlements in downtown
Mexico City due to ground water extraction. Geof Intern42:185–204
Phien-wej N, Giao PH, Nutalaya P (2006) Land subsidence inBangkok, Thailand. Eng Geol 82:187–201
Raspa G, Moscatelli M, Stigliano F, Patera A, Marconi F, Folle D,Vallone R, Mancini M, Cavinato GP, Milli S, Cooimbra JF,Costa L (2008) Geotechnical characterization of the upperPleistocene–Holocene alluvial deposits of Roma (Italy) bymeans of multivariate geostatistics: cross-validation results.Eng Geol 101:251–268. doi:10\1016\j.enggeo.2008.06.007
Rosenbaum MS (2003) Characterization of the shallow subsurface:implications for urban infrastructure and environmental assess-ment. In: Rosenbaum MS, Turner AK (eds) New paradigms insubsurface prediction. Lecture Notes in Earth Sciences. Springer,Berlin
Ross M, Parent M, Lefebvre R (2005) 3D geologic frameworkmodels for regional hydrogeology and land-use management: acase study from a Quaternary basin of southwestern Quebec,Canada. Hydrogeol J 13:690–707
Thierry P, Bourgine B, Vairon J, Vinet P (2000) Methods and toolsfor constructing a 3D geological model in an urban environ-ment: an example from the west of Greater Lyons. In:Proceedings of the 2nd International Conference on Decisionmaking in Urban and Civil Engineering, vol 1, Lyon, France,20–22 November 2000, pp 525–537
Thierry P, Raucoles D, Felenc J, King C (2004) Vertical movementsin Paris: coupling 3D geological model and SAR interferometryresults. In: IGC 32nd International Geological Congress,Florence, Italy, August 2004
Thierry P, Prunier-Leparmentier A, Lembezat C, Vanoudheusden E,Vernoux JF (2009) 3D geological modeling at urban scale andmapping of ground movement susceptibility from gypsumdissolution: the Paris example (France). Eng Geol 105:51–64.doi:10.1016/j.enggeo.2008.12.010
Ventriglia U (1971) Geologia della città di Roma [Geology of thecity of Rome]. Amministrazione Provinciale di Roma, Rome
Ventriglia U (2002) Geologia del territorio del Comune di Roma[Geology of the Municipality of Rome]. Amministrazione Provin-ciale di Roma, Servizio Geologico, Difesa del Suolo, Rome
1567
Hydrogeology Journal (2012) 20: 1549–1567 DOI 10.1007/s10040-012-0899-2
Author's personal copy