Location of Buried Mineshafts and Adits Using Reconnaissance Geophysical Methods
11
30 Terrestrial Laser Scanning as a New Field Measurement and Monitoring Technique Siefko Slob and Robert Hack ITC, Mijnbouwstraat 120, Delft, The Netherlands {slob,hack}®itc.nl Tel: +31 15 2789673, +31 15 2789671 Tel: +31 15 2789676 Abstract. 3D terrestrial laser scanning is a relatively new, but already revolutionary, sur- veying technique. The survey yield a digital data set, which is essentially a dense "point cloud", where each point is represented by a coordinate in 3D space. The most important advantage of the method is that a very high point density can be achieved, in the order of 5 to 10 mm resolution. In order to analyse the character and shape of the scanned surfaces it is necessary to convert the irregularly distributed point data into 3D surface information using surface reconstruction. The reconstructed surface can subsequently be visualized using a variety of 3D visualization techniques. From the reconstructed 3D surfaces, it is also possible to generate 2D profiles or elevation contour lines for use in regular GIS or CAD packages. A number of applications are described in this paper, which may illustrate the possible benefits of using laser scanning as a technique in engineering geological prac- tice and research: volume analysis and monitoring, detailed and large-scale topographic mapping, tunnelling, rock face surveying, and digital outcrop mapping. Keywords: 3D Laser scanning, surface reconstruction, survey, monitoring, digital outcrop mapping, volume analysis, tunnelling, rock face Introduction 3D terrestrial laser scanning is a relatively new, but already revolutionary, survey- ing technique. Different laser scanning systems exist, but the technique used out- doors for geodetic surveying or for measuring large civil engineering structures is the "time-of-flight" or "laser range finding" technique. The "time-of-flight" or "ranging" scanners have a laser diode that sends a pulsed laser beam to the scanned object. The pulsed laser beam moves trough a rapidly changing elevation and azimuth angle of a mirror inside the instrument. The pulse is diffusely re- flected by the surface of the scene or object and part of the light returns to the receiver. The time that light needs to travel from the laser diode to the object sur- face and return is very precisely measured. Knowing the speed of light, the dis- tance from the scanner to the object and the azimuth and angle of the beam, the position of each point where the beam is reflected can be calculated. The survey yields a digital data set, which is essentially a dense "point cloud", where each point is represented by a coordinate in 3D space (X, Y and Z, relative to the scan- Slob, S., Hack, R., 2004. 3D terrestrial laser scanning as a new field measurement and monitoring technique. In: Hack, R., Azzam, R., Charlier, R. (Eds), Engineering geology for infrastructure planning in Europe; A European perspective. Lecture notes in earth sciences. Springer, Berlin, New York (104). ISBN: 354021075X. DOI: 10.1007/978-3-540-39918-6_22. pp. 179-189.
-
Upload
independent -
Category
Documents
-
view
0 -
download
0
Transcript of Location of Buried Mineshafts and Adits Using Reconnaissance Geophysical Methods
30 Terrestrial Laser Scanning as a New Field Measurement and Monitoring Technique
Siefko Slob and Robert Hack
ITC, Mijnbouwstraat 120, Delft, The Netherlands {slob,hack}®itc.nl Tel: +31 15 2789673, +31 15 2789671 Tel: +31 15 2789676
Abstract. 3D terrestrial laser scanning is a relatively new, but already revolutionary, surveying technique. The survey yield a digital data set, which is essentially a dense "point cloud", where each point is represented by a coordinate in 3D space. The most important advantage of the method is that a very high point density can be achieved, in the order of 5 to 10 mm resolution. In order to analyse the character and shape of the scanned surfaces it is necessary to convert the irregularly distributed point data into 3D surface information using surface reconstruction. The reconstructed surface can subsequently be visualized using a variety of 3D visualization techniques. From the reconstructed 3D surfaces, it is also possible to generate 2D profiles or elevation contour lines for use in regular GIS or CAD packages. A number of applications are described in this paper, which may illustrate the possible benefits of using laser scanning as a technique in engineering geological practice and research: volume analysis and monitoring, detailed and large-scale topographic mapping, tunnelling, rock face surveying, and digital outcrop mapping.
Keywords: 3D Laser scanning, surface reconstruction, survey, monitoring, digital outcrop mapping, volume analysis, tunnelling, rock face
Introduction
3D terrestrial laser scanning is a relatively new, but already revolutionary, surveying technique. Different laser scanning systems exist, but the technique used outdoors for geodetic surveying or for measuring large civil engineering structures is the "time-of-flight" or "laser range finding" technique. The "time-of-flight" or "ranging" scanners have a laser diode that sends a pulsed laser beam to the scanned object. The pulsed laser beam moves trough a rapidly changing elevation and azimuth angle of a mirror inside the instrument. The pulse is diffusely reflected by the surface of the scene or object and part of the light returns to the receiver. The time that light needs to travel from the laser diode to the object surface and return is very precisely measured. Knowing the speed of light, the distance from the scanner to the object and the azimuth and angle of the beam, the position of each point where the beam is reflected can be calculated. The survey yields a digital data set, which is essentially a dense "point cloud", where each point is represented by a coordinate in 3D space (X, Y and Z, relative to the scan-
Slob, S., Hack, R., 2004. 3D terrestrial laser scanning as a new field measurement and monitoring technique. In: Hack, R., Azzam, R., Charlier, R. (Eds), Engineering geology for infrastructure planning in Europe; A European perspective.
Lecture notes in earth sciences. Springer, Berlin, New York (104). ISBN: 354021075X. DOI: 10.1007/978-3-540-39918-6_22. pp. 179-189.
180 Siefko Slob and Robert Hack
ner s po ' Ill on and the refle red inten ' ity (J) of the laser beam. With thjs data the D shape of any object or en ironment can be determined and analysed. A new
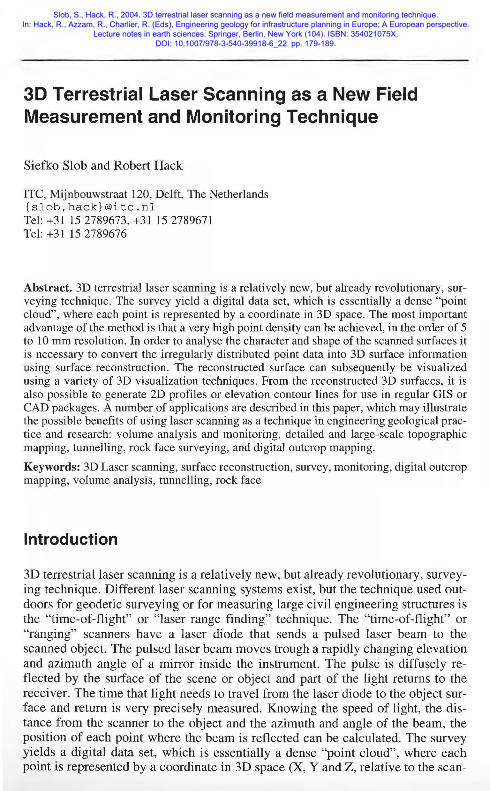
generation of ranging laser scanners al o yield for each point the passive colour (i.e.: red green, and blue reflection value ). Very large and complex object: can aJ. o be cann d from different posjtion . Mo t oftware u._<;ed to captw·e the -urvey data allow to merge different surveys into a single point cloud. In this way, the "shadow" areas of surveys can be complemented with scans where the previously hidden areas can be "seen" by the laser beam. The most important advantage of the method is that a very high point density can be achieved, in the order of 5 to 10 mm resolution. Therefore, the shape of the surveyed object or scene can be modelled at a very high detail and accuracy in three dimensions. The method can measure objects and scenes at a distance of nearly 200 meters under ideal conditions. In real-world situations however, 50-100 meters is more usual. The method is also rapid: a full 360° scan can be carried out with the latest models in less than 4 mjnutes. The laser scanner fits on a regular surveying tripod and has a normal laptop attached to operate the scanner and to store the survey data. Most of the software used to operate the scanner also allow the user to instantly georeference the scanned (X,Y,Z) data to a local or global reference grid. Currently, a number of 3D laser scanning devices are on the market that use the ranging principle, from different manufacturers (E.g. Leica-Cyrax, Riegl, Trimble-Mensi) (Figure 1). The underlying principles of the different laser scanners are essentially the same, but the quality of the generated data (for instance: resolution, accuracy, precision, scanning speed, and laser beam divergence) may vary between manufacturers and models.
Fig. 1. Three current models from differen t manufac turers, from left to right: Mensi GS200, Leica (Cyrax) HDS3000, Riegl LMS Z21 0.
Surface Reconstruction Techniques
The mere visualisation of the point cloud gives the user already a very good 3D perspective of the scanned scene or object. Some end-users actually prefer to use
Slob, S., Hack, R., 2004. 3D terrestrial laser scanning as a new field measurement and monitoring technique. In: Hack, R., Azzam, R., Charlier, R. (Eds), Engineering geology for infrastructure planning in Europe; A European perspective.
Lecture notes in earth sciences. Springer, Berlin, New York (104). ISBN: 354021075X. DOI: 10.1007/978-3-540-39918-6_22. pp. 179-189.

3D Terrestri al Laser canni·ng as a New Field Measuremenl 181
the georeferenced or raw point cloud data "as is" and to integrate it into existing 3D modelling programs and databases such as AutoCad. However, in order to analyse the character and shape of the scanned surfaces it is necessary to convert the irregularly distributed point data into 3D surface information. Particularly for the design industry and the medical imaging industry, 30 prototyping and visualization software has been developed that make use of advanced 30 surface reconstruction techniques and algorithms. In 3D geological modelling, surface reconstruction techniques are also being used (Cowan et al. , 2002). However, the objective here is to reconstruct large (small-scale) 30 geological shapes (volumes) based on mostly very limited borehole data and geophysical profiles. In surface reconstruction of point cloud data, however, the objective is to reconstruct relatively small (large-scale) 30 surfaces based on very dense data . Surface reconstruction algorithms can roughly be divided into Polygonal and Parametric. An example of polygonal techo.ique is 30 Delaunay triangulation , which create irregular, triangular patche based on simple linear i.nlerp lation between the points in 3D space. Examples of parametric technique are NURBS ( on-Uo.iform Rational B-Spline ) or Fast RB F Radial Basis Functioi1 ), whi h use parametric functions to define surface patche . Parametri techniques create more '·naturallooking" surfaces and more accurate repre entat ions, particularly for area where data are missing. but it requires more computing power and time than polygonal interp lation technique . A comparison of the two interpolation technique is given in figure - ·
Fig. 2. Compari son of 3D triangulation (a) and a parametric surface (b) of a geological shape after digital rendering (from: Cowan et al. , 2002).
Visualisation and Analysis
The recon tructed urface can ubsequemJy be i.omalized using a variety of 3D visualization techniques. The main purpose i. to allow rh user to interact ively view objects or scene. from different angles and directions. Different lighting techniques may for example b u ed to highlight shapes and urface cbaracteri~tic~, such a. roughness. ln practice. however, il i not sufficient to mere! view lhe . nrfaces. Mo lly the end-user wants to integrate and analy e the data in ex.i tin~ 'oftware packages. Fmm the reconsu·ucled 30 surfaces, it is po ible to generate 2D profiJes or elevation contqur unes (Figure 4). This d ri ved information can
Slob, S., Hack, R., 2004. 3D terrestrial laser scanning as a new field measurement and monitoring technique. In: Hack, R., Azzam, R., Charlier, R. (Eds), Engineering geology for infrastructure planning in Europe; A European perspective.
Lecture notes in earth sciences. Springer, Berlin, New York (104). ISBN: 354021075X. DOI: 10.1007/978-3-540-39918-6_22. pp. 179-189.
182 Siefko Slob and Robert Hack
subsequently be used in regular GIS or CAD systems for further analysis integration with existing information. A number of applications are described in the remainder of this paper, which may illustrate the possible benefits of using laser scanning as a technique in engineering geological practice and research.
Applications
Volume Analysis and Monitoring
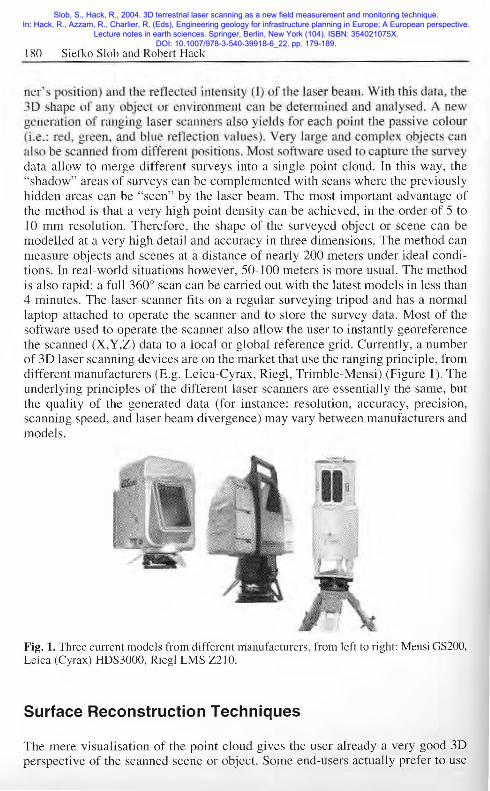
An obvious fi wl applications that t: me to mjnd in wh.ich advantages in terms of urvey peed and preci ion :.rre achieved, is urveying a11d monitoring volume of
earth fill or spoil he.aps. lf -et previous base level j known , the amount of earth ful an be c mputed by . urveyjng t.hc new top graphk urface and subtracting irs
ba e levd. For e ample . monitoring the izc f poil heap during quarrying or mining operation bas alway been a very e l ~:~borate process. Through regul.;otr surveying with a 3D la er canner, this can be done much faster and m re accurate compared to traditional geodetic ·urveying technjgues. An e ~1 mple i ' given in figure 3.
Fig. 3. Example of a 3D laser scan survey (point cloud with reflected intensity) of a sand pile. (From: Mensi, 2003)
Detailed and Large-Scale Topographic Mapping
Another application is for detailed topographic mapping of a specific site. Particularly for large building construction sites, in quarries or areas affected by mass
Slob, S., Hack, R., 2004. 3D terrestrial laser scanning as a new field measurement and monitoring technique. In: Hack, R., Azzam, R., Charlier, R. (Eds), Engineering geology for infrastructure planning in Europe; A European perspective.
Lecture notes in earth sciences. Springer, Berlin, New York (104). ISBN: 354021075X. DOI: 10.1007/978-3-540-39918-6_22. pp. 179-189.

3D Terrestrial Laser Scanning as a New Field Measurement 183
movement or subsidence, this technique can be very useful. A detailed topographic survey can be done very rapidly, without having to access the (hazardous or busy) site. This obviously gives many advantages. A good example where laser scanning proved its benefit was after the dike collapse of August 2003 in Wilnis, The Netherlands (see figure 4). The terrain affected by the dike failure was very complex and chaotic, but through a laser scan survey a detailed digital terrain model could be made without having to access the site (Anonymous, 2003).
Fig. 4. 3D laser scan point cloud of the dike burst in Wilnis, August 2003 . The colour indicates reflected colour intensity (Picture courtesy: Jan Berends, Geometius).
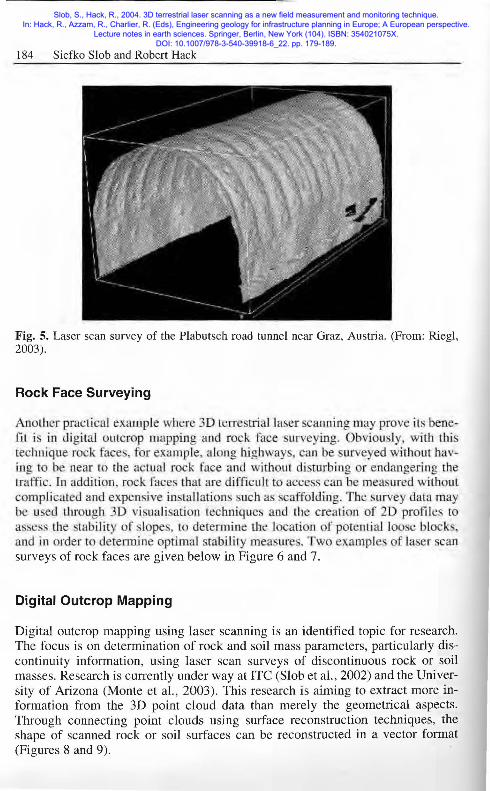
Tunnelling
Specialised laser scanners have been developed to measure the geometry of tunnel alignments. For this purpose a different type of laser scanner can be used that measures differences in phase of the emitted and reflected laser beam, rather than the difference in time. This type can measure (only for short ranges) the geometry with a higher detail, accuracy, and speed than the ranging scanners. Mounted on a small vehicle or carriage along rails allows for rapid surveying of tunnel alignments. For instance, the thickness of the applied shotcrete can be monitored and control on the final geometry of the tunnel can be done with this method. Since the internal geometry can be captured at a very high precision, it may also be suitable to monitor deformation with this phase-based scanner. An example is given in the figure below (Figure 5).
Slob, S., Hack, R., 2004. 3D terrestrial laser scanning as a new field measurement and monitoring technique. In: Hack, R., Azzam, R., Charlier, R. (Eds), Engineering geology for infrastructure planning in Europe; A European perspective.
Lecture notes in earth sciences. Springer, Berlin, New York (104). ISBN: 354021075X. DOI: 10.1007/978-3-540-39918-6_22. pp. 179-189.
184 Siefko Slob and Robert Hack
Fig. 5. Laser scan survey of the Plabutsch road tunnel near Graz, Austria. (From: Riegl, 2003).
Rock Face Surveying
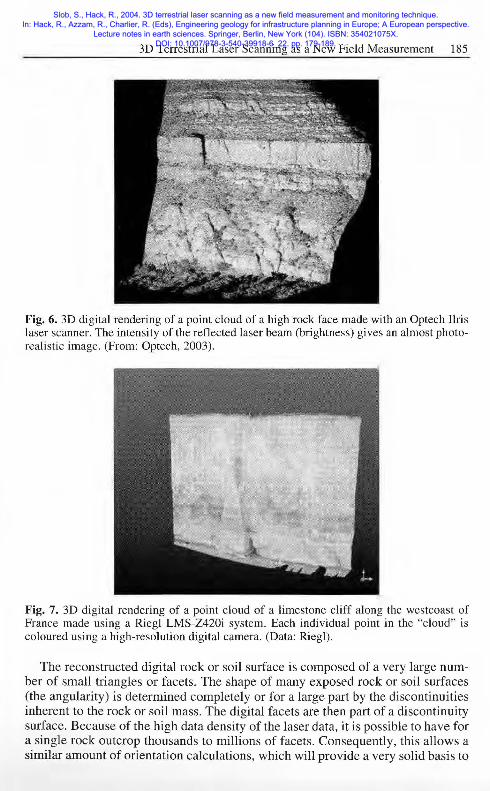
Another practical example wher 3D terrestrial Jaser scanning may prove its benefit is in di!<itaJ outcrop mapping and rock face urveying. Obviously with this technique r ck faces, fore ·ample, along highway • can be urve ed without ha -ing to be near to the actuaJ rock face ami without d.isturbiJlg or endangeri ng the traffic. In addition, ro k face that are difficult to access can be measured without complicated and expensive installations uch a caffolding. The urvey data n:iay be used thmugh 3D visua li ation technique:-, and the creation of 2D profiles to a ess the tability of slope , to detemune the Lo arion of potential loo e block.. and in order to d termine optimal tability measmes. Two examples of la er scan surveys of rock faces are given below in Figure 6 and 7.
Digital Outcrop Mapping
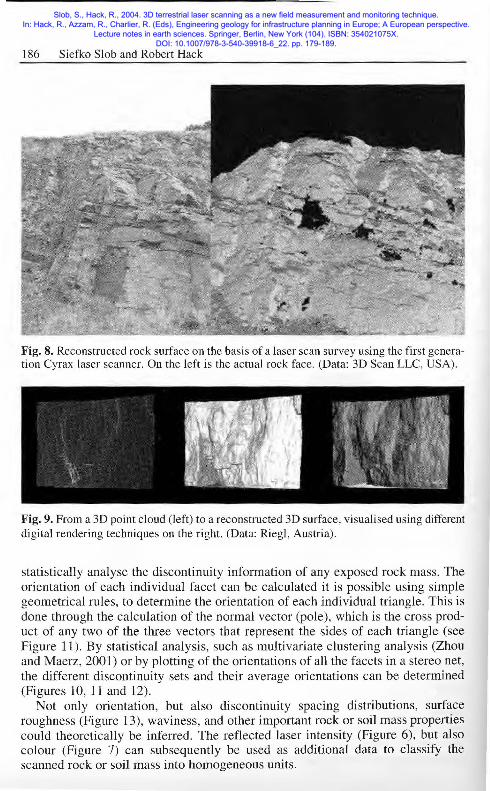
Digital outcrop mapping using laser scanning is an identified topic for research. The focus is on determination of rock and soil mass parameters, particularly discontinuity information, using laser scan surveys of discontinuous rock or soil masses. Research is currently under way at ITC (Slob et al. , 2002) and the University of Arizona (Monte et al. , 2003). This research is aiming to extract more information from the 3D point cloud data than merely the geometrical aspects. Through connecting point clouds using surface reconstruction techniques, the shape of scanned rock or soil surfaces can be reconstructed in a vector format (Figures 8 and 9).
Slob, S., Hack, R., 2004. 3D terrestrial laser scanning as a new field measurement and monitoring technique. In: Hack, R., Azzam, R., Charlier, R. (Eds), Engineering geology for infrastructure planning in Europe; A European perspective.
Lecture notes in earth sciences. Springer, Berlin, New York (104). ISBN: 354021075X. DOI: 10.1007/978-3-540-39918-6_22. pp. 179-189.
3D Terrestrial Laser Scanning as a New Field Measurement 185
Fig. 6. 3D digital rendering of a point cloud of a high rock face made with an Optech Ilris laser scanner. The intensity of the reflected laser beam (brightness) gives an almost photorealistic image. (From: Optech, 2003).
Fig. 7. 3D digital rendering of a point cloud of a limestone cliff along the westcoast of France made using a Riegl LMS-Z420i system. Each individual point in the "cloud" is coloured using a high-resolution digital camera. (Data: Riegl).
The reconstructed digital rock or soil surface is composed of a very large number of small triangles or facets. The shape of many exposed rock or soil surfaces (the angularity) is determined completely or for a large part by the discontinuities inherent to the rock or soil mass. The digital facets are then part of a discontinuity surface. Because of the high data density of the laser data, it is possible to have for a single rock outcrop thousands to millions of facets. Consequently, this allows a similar amount of orientation calculations, which will provide a very solid basis to
Slob, S., Hack, R., 2004. 3D terrestrial laser scanning as a new field measurement and monitoring technique. In: Hack, R., Azzam, R., Charlier, R. (Eds), Engineering geology for infrastructure planning in Europe; A European perspective.
Lecture notes in earth sciences. Springer, Berlin, New York (104). ISBN: 354021075X. DOI: 10.1007/978-3-540-39918-6_22. pp. 179-189.
186 Siefko Slob and Robert Hack
Fig. 8. Reconstructed rock surface on the basis of a laser scan survey using the first generation Cyrax laser scanner. On the left is the actual rock face. (Data: 3D Scan LLC, USA).
Fig. 9. From a 3D point cloud (left) to a reconstructed 3D surface, visualised using different digital rendering techniques on the right. (Data: Riegl, Austria).
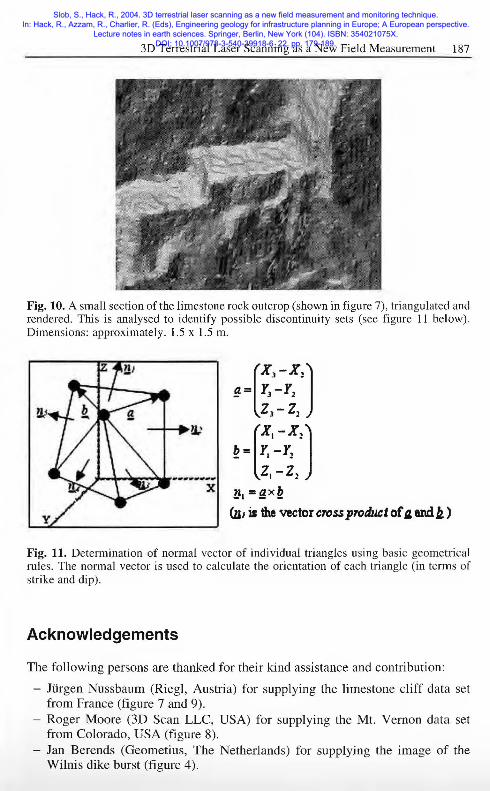
statistically analyse the discontinuity information of any exposed rock mass. The orientation of each individual facet can be calculated it is possible using simple geometrical rules, to determine the orientation of each individual triangle. This is done through the calculation of the normal vector (pole), which is the cross product of any two of the three vectors that represent the sides of each triangle (see Figure 11). By statistical analysis, such as multivariate clustering analysis (Zhou and Maerz, 2001) or by plotting of the orientations of all the facets in a stereo net, the different discontinuity sets and their average orientations can be determined (Figures 10, 11 and 12).
Not only orientation, but also discontinuity spacing distributions, surface roughness (Figure 13), waviness, and other important rock or soil mass properties could theoretically be inferred. The reflected laser intensity (Figure 6), but also colour (Figure 7) can subsequently be used as additional data to classify the scanned rock or soil mass into homogeneous units.
Slob, S., Hack, R., 2004. 3D terrestrial laser scanning as a new field measurement and monitoring technique. In: Hack, R., Azzam, R., Charlier, R. (Eds), Engineering geology for infrastructure planning in Europe; A European perspective.
Lecture notes in earth sciences. Springer, Berlin, New York (104). ISBN: 354021075X. DOI: 10.1007/978-3-540-39918-6_22. pp. 179-189.
3D Terrestrial Laser Scanning as a New Field Measurement 187
Fig. 10. A small section of the limestone rock outcrop (shown in figure 7), triangulated and rendered. This is analysed to identify possible discontinuity sets (see figure 11 below). Dimensions: approximately. 1.5 x 1.5 m.
Fig. 11. Determination of normal vector of individual triangles using basic geometrical rules. The normal vector is used to calculate the orientation of each triangle (in terms of strike and dip).
Acknowledgements
The following persons are thanked for their kind assistance and contribution:
- Jiirgen Nussbaum (Riegl, Austria) for supplying the limestone cliff data set from France (figure 7 and 9).
- Roger Moore (3D Scan LLC, USA) for supplying the Mt. Vernon data set from Colorado, USA (figure 8).
- Jan Berends (Geometius, The Netherlands) for supplying the image of the Wilnis dike burst (figure 4).
Slob, S., Hack, R., 2004. 3D terrestrial laser scanning as a new field measurement and monitoring technique. In: Hack, R., Azzam, R., Charlier, R. (Eds), Engineering geology for infrastructure planning in Europe; A European perspective.
Lecture notes in earth sciences. Springer, Berlin, New York (104). ISBN: 354021075X. DOI: 10.1007/978-3-540-39918-6_22. pp. 179-189.

188 Siefko Slob and Robert Hack
Fig. 12. A polar plot of all individual facets (about 10.000) composing the small rock outcrop from fi gure 10. It is evident that several discontinuity sets can be distinguished.
Fig. 13. Detail of a rock face scan (Mt Vernon data set) , where surface roughness can easily be observed.
Slob, S., Hack, R., 2004. 3D terrestrial laser scanning as a new field measurement and monitoring technique. In: Hack, R., Azzam, R., Charlier, R. (Eds), Engineering geology for infrastructure planning in Europe; A European perspective.
Lecture notes in earth sciences. Springer, Berlin, New York (104). ISBN: 354021075X. DOI: 10.1007/978-3-540-39918-6_22. pp. 179-189.
3D Terrestrial Laser Scanning as a New Field Measurement 189
References
Anonymous (2003) 3D Model van dijk in Wilnis. VI Matrix oktober 2003. Cowan EJ et. al. (2002). Rapid geological modeling. Applied Structural Geology for Min
eral Exploration and Mining, International Symposium, Australian Institute of Geologists, International Structural Conference, Kalgoorlie, WA, Australia, 23-25 September 2002.
Leica (Cyra) (2003) Cyra Technologies- 3D Laser Scanning. http://www.cyra.com Mensi (2003) MENSI - 3D laser scanner I 3D scanners for surveying applications.
http://www.mensi.com. Monte J, Kemeny J and Nasrallah J (2003) Using laser scanning and photogrammetry to
collect rock discontinuity data for slope stability analysis. AEG News, Program with abstracts. 2003 Annual Meeting, Vail, USA.
Optech (2003) Manufacturer of Laser-Based Ranging, Mapping and Detection Systems. http://www .optech.on.ca.
Riegl (2003) Laser Measurement Systems. http://www.riegl.co.at. SlobS, Hack HRGK and Turner AK (2002). An approach to automate discontinuity meas
urements of rock faces using laser scanning techniques. ISRM International Symposium on Rock Engineering for Mountainous Regions. Eurock 2002 Funchal, Portugal.
Zhou, W. and Maerz, N.H. Rock Mechanics and Explosives Research Center, University of Missouri-Rolla. Multivariate Clustering Analysis of Discontinuity Data: Implementation and Applications Rock Mechanics in the National Interest; Proceedings of the 38th U.S. Rock Mechanics Symposium, Washington, D.C., July 7-10, 2001, pp 861-868.
Slob, S., Hack, R., 2004. 3D terrestrial laser scanning as a new field measurement and monitoring technique. In: Hack, R., Azzam, R., Charlier, R. (Eds), Engineering geology for infrastructure planning in Europe; A European perspective.
Lecture notes in earth sciences. Springer, Berlin, New York (104). ISBN: 354021075X. DOI: 10.1007/978-3-540-39918-6_22. pp. 179-189.