An Experiment with Forced Oxygenation of the Deepwater of the Anoxic By Fjord, Western Sweden

ARTICLE IN PRESS
0278-4343/$ - se
doi:10.1016/j.cs
�CorrespondiTel.: +44(0)163
E-mail addre
Continental Shelf Research 25 (2005) 571–587
www.elsevier.com/locate/csr
A preliminary investigation of basin water response to climateforcing in a Scottish fjord: evaluating the influence of the NAO
P.A. Gillibranda,b,�, A.G. Cagec, W.E.N. Austinc
aMarine Laboratory, Fisheries Research Services, Aberdeen AB11 9DB, UKbDunstaffnage Marine Laboratory, Scottish Association for Marine Science, Oban, Argyll PA37 1QA, UK
cSchool of Geography and Geosciences, University of St. Andrews, St. Andrews KY16 9AL, UK
Received 11 December 2003; received in revised form 21 September 2004; accepted 15 October 2004
Abstract
The sea lochs (fjords) of NW Scotland bridge the land–ocean interface in a region of Europe which is particularly well
situated to monitor changes in westerly air streams. Inter-annual atmospheric circulation changes at this latitude are
largely governed by the North Atlantic Oscillation (NAO). Comparing two recent extreme NAO years, a two-
dimensional model of Loch Sunart, NW Scotland, is used to examine the potential effects of climate oscillations on the
magnitude and frequency of deep-water renewal events and the resulting water properties in the fjord basins. In the
upper basin of the fjord, meteorological forcing during the high NAO index year (1988–89) resulted in less-frequent
deep-water renewal, greater variability in basin salinity and a lower annual-mean salinity (by 0.52) than that predicted
for the low NAO index year (1995–96). In the main basin, variations in meteorological forcing had much less effect on
basin water properties. In both basins, predicted deep water inflow was significantly greater during the negative phase
NAO, with annual inflow to the upper and main basins being respectively 50% and 300% greater during 1995–96
relative to 1988–99. Through a sensitivity analysis, the NAO is shown to affect upper basin water properties through the
influence of low-frequency anomalies in the meteorological forcing, particularly the enhanced westerly wind stress
associated with positive phases, which inhibits deep water renewal over the winter months. The salinity of the main and
upper basins respond differently to the boundary forcing due to differential tidal mixing above the respectively sub- and
super-critical entrance sills. Predictions of basin water isotope ratios are made by applying the salinity:d18Owater mixingline for the region to the salinity results; the combination of the weak dependence of d18Owater on salinity and the stablesalinity predicted for the main basin suggests that some fjord basins may provide ideal sites for palaeotemperature
studies.
r 2004 Elsevier Ltd. All rights reserved.
Keywords: Scottish sea loch; NAO; Basin water salinity; Oxygen isotopes; Numerical model
e front matter r 2004 Elsevier Ltd. All rights reserved.
r.2004.10.011
ng author. Dunstaffnage Marine Laboratory, Scottish Association for Marine Science, Oban, Argyll PA37 1QA, UK.
1 559327; fax: +44(0)1631 559001.
ss: [email protected] (P.A. Gillibrand).

ARTICLE IN PRESS
P.A. Gillibrand et al. / Continental Shelf Research 25 (2005) 571–587572
1. Introduction
The North Atlantic Oscillation (NAO) is adominant mode of atmospheric variability in theNorthern Hemisphere. During winter, the NAOaccounts for more than one-third of the totalvariance in sea-level pressure (Cayan, 1992). TheNAO index is determined as the sea-level pressuredifference between the Icelandic Low and theAzores High, and is responsible for generatingsystematic large-amplitude changes of wind speed,latent and sensible heat fluxes, and sea-surfacetemperatures over much of the mid-latitude NorthAtlantic (Cayan, 1992). It has been suggested thatinter-annual and longer-term changes in the NAOindex determine, or modulate, deep water tem-perature and salinity (Reverdin et al., 1997)and hence deep convection in the Atlantic(Dickson et al., 1996).High index (positive) phases of the NAO are
characterised by the occurrence of a strong high-pressure system over the Azores region along withan intense Icelandic low pressure. Such phasescoincide with stronger (8m s�1 above normal)mid-latitude westerly winds (Hurrell, 1995). Dur-ing this high index phase, the well-developedAzores ‘high’ deflects the Atlantic storm tracknorthwards, bringing warm and saturated ‘ocea-nic’ air masses to NW Europe (Ruprecht et al.,2002). As a result, positive phases of the NAO areassociated with milder and wetter winters over thisregion. The change in atmospheric circulationduring low index (negative) phases of the NAOresults in cold, dry winter conditions in NWEurope. Hurrell (1995) showed the correlationcoefficients between winter (December–March)precipitation and the NAO index for a numberof European stations, with coastal stations (e.g.Bergen: 0.77 and Stornoway: 0.75) having highercorrelation coefficients than inland stations (Oslo:0.21 and Frankfurt: 0.19). Chandler and Wheater(2002) have also demonstrated the seasonallyvarying impact of the NAO upon rainfall varia-bility from the west of Ireland. The coastalcatchments of NW Scotland receive high meanannual precipitation and are also expectedto exhibit high correlation coefficients with theNAO. Thin and poorly developed soils in these
mountainous regions, together with generally steepslopes and low soil moisture deficits, translaterainfall rapidly into surface runoff (Black andCranston, 1995). Therefore, periods of prolongedand heavy rainfall result in a pronounced increasein freshwater input into the fjords that inundatethe coastline.Scottish fjords exhibit many of the physical and
hydrodynamic characteristics observed in otherfjords around the world. They are deep,steep-sided, glacially carved basins that are com-monly connected to the open coastal oceanby shallow, narrow sill regions and are oftensubject to relatively high freshwater discharge,leading to the formation of distinct brackishlayers at the water surface and a two-layerestuarine circulation in the upper water column.Circulation in the deep water is often decoupledfrom the surface circulation, due to the presence ofentrance and, commonly, internal sills; the basinwater becomes isolated and is exchangedby diffusive processes and, episodically, duringadvective renewal events. In Scottish fjords,deep water renewal events have average periodi-cities ranging from a few weeks in LochSunart (Gillibrand et al., 1995) and Loch Linnhe(Allen and Simpson, 1998) to 16 months in LochEtive (Edwards and Edelsten, 1977), and occurduring periods of low freshwater discharge(e.g. Edwards and Edelsten, 1977), driven princi-pally by local wind forcing (e.g. Gillibrandet al., 1995) with tidal range sometimes animportant factor (Edwards et al., 1980; Allen andSimpson, 1998). Water density in shallow-silledfjords is generally dominated by salinity, withtemperature usually of secondary importance(Edwards and Edelsten, 1977), although tempera-ture was found to play an important role in theoverturning of the Clyde Sea, a larger fjord(Rippeth and Simpson, 1996).Biochemical properties of fjord basin water are
strongly influenced by hydrograpic processes(Watts et al., 1998). Concentrations of thestable oxygen isotopes 18O and 16O, the ratio ofwhich provides a powerful tool in our under-standing of the global hydrological cycle,are strongly dependent on salinity. In mid-latitudecoastal regions, freshwater runoff and ground

ARTICLE IN PRESS
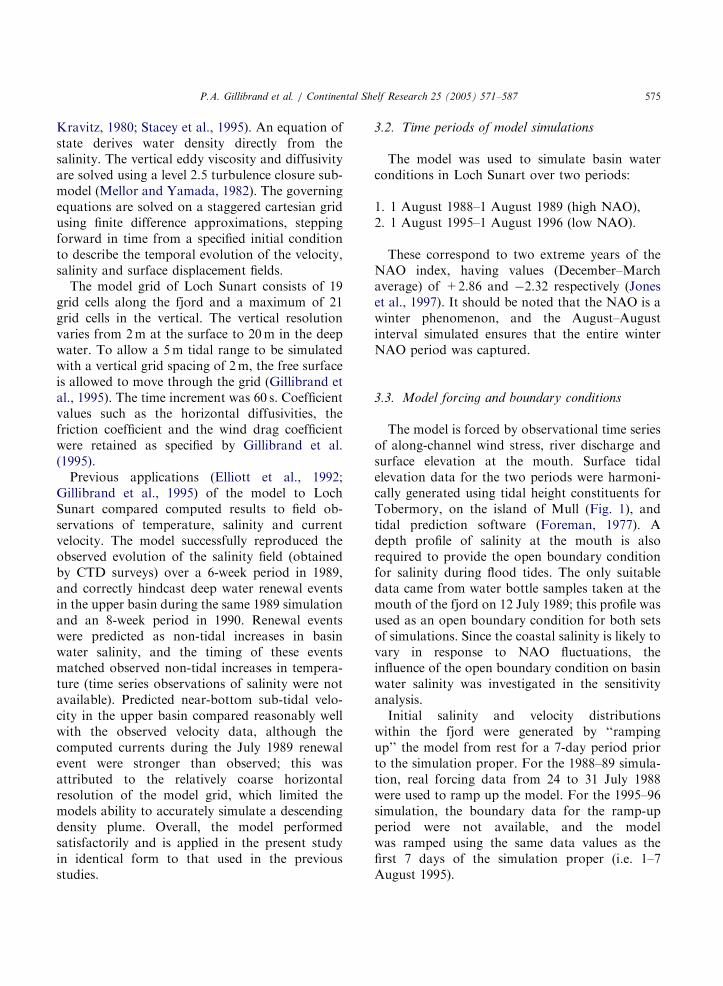
Fig. 1. Map of Loch Sunart and the surrounding area,
including the locations of Tiree and the River Polloch.
P.A. Gillibrand et al. / Continental Shelf Research 25 (2005) 571–587 573
waters (depleted in 18O) mix with oceanic(shelf) water (enriched in 18O) to define salinity:d18O relationships (e.g. Austin and Inall, 2002). Anunderstanding of the quantitative salinity:d18Orelationship provides a means of modelling thed18O response in these fjord basin waters. If basinwater salinity (BWS) changes in response to NAOforcing, then so too will the d18O of that water.Palaeoclimate studies based on marine proxiesoften utilise the d18O signature of carbonatefossils, which is both a function of salinity andtemperature (e.g. Craig and Gordon, 1965).Significant changes in BWS have the potential tobe recorded in the palaeoclimate record ofcarbonate d18O. It is therefore highly desirable tounderstand the factors (both spatial and temporal)which drive changes in d18O within modern fjordenvironments.The potential link between the climate fluctua-
tions of the North Atlantic Oscillation andthe physio-chemical properties of the basin waterof Scottish fjords is clear. By modifyingrainfall patterns and westerly air-flows on anannual basis, the NAO could have a significantinfluence on the frequency and strength of renewalevents in these isolated basins. The aim ofthis preliminary study was to examine whethersuch a link could produce a significant effect onbasin water properties on inter-annual timescales that might be detectable in the palaeoclimaterecord. We focus on two recent extreme years ofthe NAO: 1988–89 and 1995–96. The formerwas a strongly positive NAO phase, the latterstrongly negative (Jones et al., 1997). Becauselong observational time series of relevant environ-mental variables are not available from Scottishfjords, a modelling approach has been adopted.By using a model to simulate the response ofthe basin waters to the wind forcing and fresh-water discharge during these two extremeyears, we hope to establish whether fluctuationsin climate can have a significant, and measurable,impact on the salinity and isotopic composition ofthe deep water of the fjord. Since there arefew observational data against which to test themodel results, we conduct a sensitivity analysis toassess the significance of any differences in thesimulations.
2. Study area
The fjord selected for this study is Loch Sunart,in the west of Scotland (Fig. 1). The fjord is 33 kmlong, with an average width of 1.5 km, a maximumdepth of 124m, and consisting nominally of sixsills and basins (Edwards and Sharples, 1986). Thetidal regime in the fjord is predominantly semi-diurnal, with a range of 4m at springs and 1m atneaps. The total catchment area is 299 km2, withmountainous ground to the north and east, andapproximately half the freshwater enters thesystem in the upper basin. River catchments areshown in Fig. 2. Loch Sunart has one of thesmallest freshwater discharge to tidal flow ratiosamong Scottish fjords (Edwards and Sharples,1986), which probably contributes to the relativelyfrequent renewal of its basin waters (Gillibrand etal., 1995). In this paper, we discuss the main andupper basins within the fjord (Fig. 2). The mainbasin is separated from the adjacent coastal watersby a sill 33m deep (relative to Mean Sea Level)and extends eastward from there as far as theupper basin (thus incorporating the outer 5nominal basins of Edwards and Sharples, 1986).This latter is separated from the main fjord by asill 500m long, 600m wide and 8m deep (belowMSL) at the Laudale Narrows. The maximumwater depths in the two basins are 124m and 91m,respectively. The fjord has been the subject of

ARTICLE IN PRESS
Fig. 2. Catchment areas for the streams and rivers discharging into Loch Sunart. The catchments were combined as appropriate to
determine the freshwater input at each model transect. The sills to the upper and main basins are located at transects 6 and 14,
respectively. A profile of water depth along the central axis of the fjord is also shown.
P.A. Gillibrand et al. / Continental Shelf Research 25 (2005) 571–587574
previous field studies and modelling work (Elliottet al., 1992; Gillibrand et al., 1995) and thesalinity:d18O relationship has been established(Austin and Inall, 2002).
3. Methods
3.1. Description of model
We used a two-dimensional, width-averagedmodel, which resolves longitudinally and verti-cally. The capability of such models to reproducethe most important features of the circulation in
long and deep fjords has been demonstrated incase studies of Canadian inlets (e.g. Puget Sound,Lavelle et al., 1991; Knight Inlet, Stacey et al.,1995; and Indian Arm, Dunbar and Burling 1987;Stacey et al., 2002) and Scottish fjords (e.g. LochSunart, Elliott et al., 1992, Gillibrand et al., 1995;Loch Fyne, Gillibrand, 2001). The application ofthis model to study the circulation in Loch Sunarthas been described previously by Elliott et al.(1992) and Gillibrand et al. (1995) and the model istherefore described only briefly here.The model solves a set of laterally averaged
equations describing the conservation of volume,momentum and salt in an estuary (e.g. Wang and
ARTICLE IN PRESS
P.A. Gillibrand et al. / Continental Shelf Research 25 (2005) 571–587 575
Kravitz, 1980; Stacey et al., 1995). An equation ofstate derives water density directly from thesalinity. The vertical eddy viscosity and diffusivityare solved using a level 2.5 turbulence closure sub-model (Mellor and Yamada, 1982). The governingequations are solved on a staggered cartesian gridusing finite difference approximations, steppingforward in time from a specified initial conditionto describe the temporal evolution of the velocity,salinity and surface displacement fields.The model grid of Loch Sunart consists of 19
grid cells along the fjord and a maximum of 21grid cells in the vertical. The vertical resolutionvaries from 2m at the surface to 20m in the deepwater. To allow a 5m tidal range to be simulatedwith a vertical grid spacing of 2m, the free surfaceis allowed to move through the grid (Gillibrand etal., 1995). The time increment was 60 s. Coefficientvalues such as the horizontal diffusivities, thefriction coefficient and the wind drag coefficientwere retained as specified by Gillibrand et al.(1995).Previous applications (Elliott et al., 1992;
Gillibrand et al., 1995) of the model to LochSunart compared computed results to field ob-servations of temperature, salinity and currentvelocity. The model successfully reproduced theobserved evolution of the salinity field (obtainedby CTD surveys) over a 6-week period in 1989,and correctly hindcast deep water renewal eventsin the upper basin during the same 1989 simulationand an 8-week period in 1990. Renewal eventswere predicted as non-tidal increases in basinwater salinity, and the timing of these eventsmatched observed non-tidal increases in tempera-ture (time series observations of salinity were notavailable). Predicted near-bottom sub-tidal velo-city in the upper basin compared reasonably wellwith the observed velocity data, although thecomputed currents during the July 1989 renewalevent were stronger than observed; this wasattributed to the relatively coarse horizontalresolution of the model grid, which limited themodels ability to accurately simulate a descendingdensity plume. Overall, the model performedsatisfactorily and is applied in the present studyin identical form to that used in the previousstudies.
3.2. Time periods of model simulations
The model was used to simulate basin waterconditions in Loch Sunart over two periods:
1.
1 August 1988–1 August 1989 (high NAO), 2. 1 August 1995–1 August 1996 (low NAO).These correspond to two extreme years of theNAO index, having values (December–Marchaverage) of +2.86 and �2.32 respectively (Joneset al., 1997). It should be noted that the NAO is awinter phenomenon, and the August–Augustinterval simulated ensures that the entire winterNAO period was captured.
3.3. Model forcing and boundary conditions
The model is forced by observational time seriesof along-channel wind stress, river discharge andsurface elevation at the mouth. Surface tidalelevation data for the two periods were harmoni-cally generated using tidal height constituents forTobermory, on the island of Mull (Fig. 1), andtidal prediction software (Foreman, 1977). Adepth profile of salinity at the mouth is alsorequired to provide the open boundary conditionfor salinity during flood tides. The only suitabledata came from water bottle samples taken at themouth of the fjord on 12 July 1989; this profile wasused as an open boundary condition for both setsof simulations. Since the coastal salinity is likely tovary in response to NAO fluctuations, theinfluence of the open boundary condition on basinwater salinity was investigated in the sensitivityanalysis.Initial salinity and velocity distributions
within the fjord were generated by ‘‘rampingup’’ the model from rest for a 7-day period priorto the simulation proper. For the 1988–89 simula-tion, real forcing data from 24 to 31 July 1988were used to ramp up the model. For the 1995–96simulation, the boundary data for the ramp-upperiod were not available, and the modelwas ramped using the same data values as thefirst 7 days of the simulation proper (i.e. 1–7August 1995).

ARTICLE IN PRESS
Fig. 3. Daily mean discharge data (m3 s�1) for the River
Polloch during the two simulation periods (a) 1988–89 and (b)
1995–96. A 30-day running-mean time series is also shown for
each case (heavy line). The two running-mean time series were
averaged (c, heavy line) and the two ‘climate discharge
anomalies’ are given by the difference between the running
mean time series for each year and the averaged time series (c).
P.A. Gillibrand et al. / Continental Shelf Research 25 (2005) 571–587576
There are no precipitation/discharge data read-ily available for the Sunart catchment, and Blackand Cranston (1995) note that very few Scottishcatchments of less than 50 km2 are gauged. Dailyprecipitation data from a meteorological stationbased within the Polloch river catchment (OSGB793688) and mean daily flow data (MDF) for theRiver Polloch were supplied by the ScottishEnvironmental Protection Agency (SEPA) for1988–1999. The Polloch catchment(area ¼ 7.9 km2) lies adjacent to the Sunart catch-ment (total area ¼ 299 km2), north of Strontian(Fig. 1).The catchment and sub-catchment areas of
Loch Sunart were delineated on an OrdnanceSurvey map (Sheets 40, 49), and the areas of thesub-catchments were estimated to the nearest0.1 km2 (Fig. 2). Assuming no significant precipi-tation gradient across the Sunart catchment, andsimilar sub-catchment hydrological responses, thePolloch MDF values were scaled to each sub-catchment by simply weighting the flow data byrelative catchment area. The mean river flows forthe R. Polloch and total discharge into LochSunart during the two simulation periods are givenin Table 1 and the flow time series are presented inFig. 3.Hourly values of wind speed (m s�1) and
direction were obtained for Tiree (Fig. 1), whichis the closest meteorological station to LochSunart that collects wind data. The data from1988–89 and 1995–96 are presented as vector plotsin Fig. 4. The means and standard deviations ofthe westerly wind speed and stress over the twoperiods are given in Table 1.
Table 1
Means and standard deviations of the model forcing parameters for
Parameter
Mean flow in river Polloch, catchment ¼ 7.9 km2 (m3 s�1)
Mean flow into Loch Sunart, catchment ¼ 299km2 (m3 s�1)
Westerly wind speed—mean (m s�1)
Westerly wind speed—standard deviation (m s�1)
Westerly wind stress—mean (Nm�2)
Westerly wind stress—standard deviation (Nm�2)
The westerly wind stress, tA; is calculated by tA ¼ rACDW j W j wher
coefficient and W is the westerly component of wind velocity (m s�1)
3.4. Model output
The principal outputs from the model runs wereyear-long time series of predicted salinity andinflow for the main and upper basins. From thesetime series, basic statistical variables (i.e. the mean,minimum, maximum and standard deviation) werecalculated. In addition, the predicted frequency ofdeep water renewal of each basin was calculated byconverting the hourly predictions of salinity to
the two NAO simulations
1988–89 1995–96
0.76 0.44
28.76 16.65
2.32 �0.64
5.00 5.73
0.025 �0.011
0.067 0.082
e rA ¼ 1:2 kgm�3 is the air density, CD ¼ 1:1� 10�3 is the drag.

ARTICLE IN PRESS
P.A. Gillibrand et al. / Continental Shelf Research 25 (2005) 571–587 577
daily mean values and defining a renewal event asan increase in salinity on a daily basis.Inflow into each basin was calculated by
extracting hourly volume flux data at each modelgrid point, low-pass filtering the flux data toremove tidal oscillations, and then verticallyintegrating the resulting residual fluxes from theseabed to the level of no motion at the grid columnimmediately inside each sill. The inflowing trans-port, QI; is therefore given by
QI ¼
Z zðu¼0Þ
�H
uðzÞBðzÞdz; (1)
Fig. 4. Vector plots of daily mean wind velocity (m s�1) at Tiree
during the two simulation periods (a) 1988–89 and (b) 1995–96.
Fig. 5. Hourly westerly wind velocity (light lines, m s�1) for the
two simulation periods (a) 1988–89 and (b) 1995–96. The 30-
day running-mean time series are overlain (heavy lines).
where uðzÞ is the filtered horizontal velocity (m s�1)at depth z; BðzÞ is the channel width (m), and H isthe maximum water depth (m). QI was onlycalculated when the velocity immediately abovethe seabed was into the basin (thus mid-depthinflows and outflow from the basin are notcalculated), and the depth of the sill was specifiedas an upper bound on zðu ¼ 0Þ so that flows abovesill depth were not included.
3.5. Sensitivity analysis
To help interpret any predicted differences inbasin water properties from the two NAO simula-tions, and to assess the relative importance of thevarious forcing mechanisms, a sensitivity analysiswas performed on the response of the fjordbasin water to the various boundary conditions.The simulations described above were repeatedwith modified values of, variously, the windforcing, river flow and coastal salinity profile.The simulations and results are described inSection 4.2 (Fig. 5).
4. Results
4.1. Simulations with forcing from extreme NAO
years
The predicted time series of basin water salinityfor the upper and main basins from 1988–89 and1995–96 are presented in Fig. 6. The limitedobservational CTD data from 1988–89 (Gillibrandet al., 1995) are also shown for comparativepurposes; no data are available from 1995–96.Although not ideal, the data do suggest that, afterthe year-long simulation, the model predicts basinsalinities close to those observed, and is thereforeperforming acceptably for the present purposes.In the upper basin, clear differences are appar-
ent between the time series from the 2 years.The high NAO index year (1988–89) exhibited areduced frequency of deep-water renewal anda greater range of basin salinity over the year(Table 2). The renewal events resulted in greaterchanges in BWS, and were followed by extendedperiods of falling salinity. The low index year

ARTICLE IN PRESS
Fig. 6. Time series of predicted bottom water salinity for 1988–89 (greyscale) and 1995–96 (black) from the upper and main basins.
Scales for both salinity and d18O (%) are shown. The symbols denote observed basin water salinities in the upper (K) and main (m)
basins from CTD surveys in August 1988, July 1989 and August 1989 (Gillibrand et al., 1995). No data from 1995–96 are available.
Table 2
Results of the two simulations for positive (1988–89) and negative (1995–96) phases of the NAO
1988–89 1995–96
Salinity Inflow (m3 s�1) Salinity Inflow (m3 s�1)
Upper basin
Mean 33.13 129.6 33.65 203.7
Minimum 31.50 0 32.73 0
Maximum 34.02 1159.5 34.18 1824.7
Standard deviation 0.652 213.4 0.319 278.9
Number of renewal days 108 — 158 —
Main basin
Mean 34.18 238.8 34.16 694.0
Minimum 34.10 0 34.08 0
Maximum 34.32 2628.9 34.25 7373.6
Standard deviation 0.034 338.4 0.031 974.6
Number of renewal days 120 — 171 —
P.A. Gillibrand et al. / Continental Shelf Research 25 (2005) 571–587578
(1995–96) featured more frequent deep-waterrenewal, but with typically smaller salinity changesand a smaller salinity range over the year. Thepredicted annual-mean salinity in the upper basinwas about 0.5 greater for 1995–96 thanor 1988–89 (Table 2), reflecting the reducedfreshwater discharge associated with a negativephase NAO.
Predicted deep inflow (as defined by Eq. (1)) intothe upper basin was over 50% greater during1995–96 than 1988–89 (Fig. 7), and the maximuminflow and standard deviation were also higher(Table 2). These results suggest that total annualinflow into the upper basin in 1988–89 and1995–96 amounted to 4.1 and 6.4 km3, respec-tively. Since the volume of the basin below sill

ARTICLE IN PRESS
P.A. Gillibrand et al. / Continental Shelf Research 25 (2005) 571–587 579
depth is about 0.09 km3, the basin water waseffectively replaced 45 and 71 times over duringthe two simulated periods.In the main basin, predicted differences in
salinity for the 2 years were much smaller. Themean salinity during 1988–89 was marginallygreater than during 1995–96 by 0.02, and therange of predicted salinity was also slightly larger,
Fig. 7. Time series of predicted cumulative near-bed inflow
(km3) into the (a) upper and (b) main basins of Loch Sunart
during 1988–89 (solid line) and 1995–96 (broken line). The
inflowing transport was calculated by vertically integrating the
flow from the seabed to the level of no motion at the grid
location immediately inside each sill.
Table 3
Modelled monthly-mean salinities for 1988–89 and 1995–96
Month Upper basin
1988–89 1995–96 Difference
Aug 33.21 34.00 0.79
Sep 32.78 33.79 1.01
Oct 33.18 33.36 0.19
Nov 33.55 33.42 �0.14
Dec 33.33 33.85 0.52
Jan 32.40 33.78 1.38
Feb 31.94 33.74 1.81
Mar 32.38 33.51 1.13
Apr 33.41 33.90 0.49
May 33.68 33.76 0.08
Jun 33.90 33.44 �0.46
Jul 33.66 33.31 �0.35
The monthly differences between 1988–89 and 1995–96 are also show
with higher minimum and maximum values (Table2). Predicted deep-water renewal was over 40%more frequent during 1995–96 than 1988–89,although the standard deviation of the fluctuationsin salinity was slightly less.Despite the similar salinity time series, predicted
inflow into the main basin was much strongerduring 1995–96, about three times that of 1988–89.Total inflows into the main basin for 1988–89 and1995–96 were 7.5 and 21.9 km3, respectively,replacing the basin water 22 and 65 times over(basin volume ¼ 0.34 km3).These results suggest that the different condi-
tions of wind forcing, precipitation and riverdischarge effective for 1988–89 and 1995–96 mayhave a significant (and measurable) influence onthe salinity of the upper basin water in LochSunart, but a much weaker effect in the mainbasin. It is notable that the greatest divergencebetween the two time series of upper basin salinityoccurred during the winter months (Table 3), whenthe NAO is most influential (Slonosky and Yiou,2001). In the main basin, the salinity more closelyreflected the coastal salinity prescribed as theboundary condition, with wind and river flowhaving less effect. The time series of predictedcumulative inflow for both basins also divergedmost rapidly during the winter months (Fig. 7). Inthe upper basin, this corresponds well with the
Main basin
1988–89 1995–96 Difference
34.16 34.14 �0.02
34.20 34.14 �0.07
34.22 34.15 �0.06
34.19 34.19 0.00
34.18 34.16 �0.01
34.21 34.18 �0.03
34.19 34.17 �0.02
34.18 34.15 �0.03
34.15 34.18 0.03
34.15 34.18 0.03
34.15 34.13 �0.03
34.15 34.14 �0.01
n.

ARTIC
LEIN
PRES
S
Table 4
Run no. Description 1988–89 1995–96
S NR (days) QI (km3) S NR (days) QI (km
3)
Description and results of the sensitivity analysis for the upper basin
1 Control run 33.13 108 4.09 33.65 158 6.44
2 River discharge+10% 33.13 (0.00) 111 (+3) 4.12 (+0.03) 33.64 (�0.01) 157 (�1) 6.51 (+0.07)
3 River discharge �10% 33.11 (�0.02) 113 (+5) 4.09 (0.00) 33.67 (+0.02) 154 (�4) 6.36 (�0.08)
4 Mean discharge ¼ long-term average 33.10 (�0.03) 121 (+13) 4.09 (0.00) 33.62 (�0.03) 152 (�6) 6.57 (+0.13)
5 Westerly wind stress+20% 33.08 (�0.05) 114 (+6) 4.39 (+0.30) 33.64 (�0.01) 160 (+2) 7.26 (+0.82)
6 Westerly wind stress �20% 33.15 (+0.02) 115 (+7) 3.81 (�0.28) 33.66 (+0.01) 154 (�4) 5.70 (�0.74)
7 Westerly wind stress—‘climatic’ signal 33.51 (+0.38) 144 (+36) 4.91 (+0.82) 33.67 (+0.02) 158 (0) 4.57 (�1.87)
8 River discharge—‘climatic’ signal 33.05 (�0.08) 116 (+8) 4.43 (+0.34) 33.50 (�0.15) 136 (�22) 7.15 (0.71)
9 Both ‘climatic’ signals removed 33.51 (+0.38) 138 (+30) 5.11 (+1.02) 33.53 (�0.12) 142 (�16) 5.13 (�1.31)
10 Open boundary salinity+1.0% 33.46 (+0.33) 111 (+3) 4.12 (+0.03) 33.98 (+0.33) 159 (+1) 6.55 (+0.11)
11 Open boundary salinity�1.0% 32.80 (�0.33) 111 (+3) 4.03 (�0.06) 33.33 (�0.32) 147 (�11) 6.39 (�0.05)
Description and results of the sensitivity analysis for the main basin
1 Control run 34.18 120 7.53 34.16 171 21.95
2 River Discharge+10% 34.18 (0) 119 (�1) 7.13 (�0.40) 34.17 (+0.01) 159 (�12) 20.71 (�1.24)
3 River discharge �10% 34.17 (�0.01) 125 (+5) 7.93 (+0.40) 34.16 (0) 169 (�2) 21.66 (�0.29)
4 Mean discharge ¼ long-term average 34.16 (�0.02) 171 (+51) 8.38 (+0.84) 34.16 (0) 166 (�5) 22.27 (+0.32)
5 Westerly wind stress +20% 34.16 (�0.02) 140 (+20) 10.08 (+2.55) 34.15 (�0.01) 171 (0) 26.54 (+4.59)
6 Westerly wind stress �20% 34.20 (+0.02) 118 (�2) 5.06 (�2.47) 34.17 (+0.01) 142 (�29) 17.11 (�4.84)
7 Westerly wind stress—‘climatic’ signal 34.19 (+0.01) 115 (�5) 6.69 (�0.84) 34.15 (�0.01) 160 (�11) 14.99 (�6.96)
8 River discharge—‘climatic’ signal 34.16 (�0.02) 119 (�1) 8.30 (+0.77) 34.15 (�0.01) 168 (�3) 21.28 (�0.67)
9 Both ‘climatic’ signals removed 34.18 (0) 107 (�13) 7.82 (+0.29) 34.15 (�0.01) 165 (�6) 12.95 (�9.00)
10 Open boundary salinity+1.0% 34.52 (+0.34) 124 (+4) 8.13 (+0.60) 34.50 (+0.34) 177 (+6) 22.71 (+0.76)
11 Open boundary salinity �1.0% 33.88 (�0.30) 107 (�13) 6.86 (�0.67) 33.87 (�0.29) 140 (�31) 20.92 (�1.03)
The annual-mean basin water salinity ðSÞ; number of days when renewal occurred (NR, days) and the total annual inflow of water (QI, km3) are shown. Differences from
the control run are shown in parentheses for Runs 2–11. The control runs are highlighted in bold.
P.A
.G
illibra
nd
eta
l./
Co
ntin
enta
lS
helf
Resea
rch2
5(
20
05
)5
71
–5
87
580

ARTICLE IN PRESS
P.A. Gillibrand et al. / Continental Shelf Research 25 (2005) 571–587 581
diverging salinity time series, with salinity fallingas inflow reduced during the winter of 1988–89. Inthe main basin the results suggest that increasedinflow during 1995–96 was not reflected in thesalinity record, indicating that the basin water is inopen connection with adjacent coastal water andthat mixing over the sill only weakly modifies theinflowing water characteristics.
4.2. Sensitivity analysis
Four sets of simulations were performed inorder to investigate the relative sensitivity of thepredicted basin water salinity and deep inflow toriver discharge, hourly wind stress, low-frequency‘climatic’ forcing, and the coastal salinity profile.Results of the sensitivity analysis are presented inTable 4.
4.2.1. River discharge
Initially, the daily freshwater discharge wasmodified by 710%. Further simulations modifiedthe river flows by �20% and +35% for 1988–89and 1995–96, respectively; these values werechosen so that the discharge over each simulationperiod matched the long-term average flows intoLoch Sunart, as determined from the RiverPolloch gauging station.The modified river discharge did not signifi-
cantly affect the basin water salinity, renewal orinflow. The annual-mean salinity from the controlrun was modified by at most 0.03 (Run 4), which isan order of magnitude less than the predicteddifference in mean salinity between the two NAOsimulations (DS ¼ 0:52 in the upper basin). Thefrequency of renewal in 1988–89 changed notice-ably when the river discharge was reduced by 20%(Run 4), but otherwise the effects of riverdischarge on basin waters were rather small.
4.2.2. Wind strength
For these simulations, the westerly componentof the hourly wind stress was modified by 720%.The westerly component was modified because theNAO most strongly influences westerly air-flowsover the UK.These simulations produced only very weak
effects on the annual-mean salinity in both basins,
with a maximum change in mean salinity from thecontrol run of 0.05 in the upper basin for 1988–89(Run 5). The 40% difference in westerly windstress between Runs 5 and 6 only produceddifferences in mean salinity of up to 0.07, still anorder of magnitude less than the predicteddifference between the NAO results. In each year,a reduced westerly wind component produced asmall increase in the mean salinity in both basinsand, with the exception of the upper basin in1988–89, a reduction in the frequency of renewal(NR).Effects due to modified wind stress were more
notable on the volume inflow to each basin,producing changes of up to 12% and 33% in theupper and main basins, respectively (Table 4).Inflow volume increased with an increased east–-west component of wind stress, probably as aconsequence of the stronger easterly winds thatresult and which enhance the estuarine circulationin the fjord. The wind stress clearly influences thedeep circulation in each basin, but predictedinflows are not necessarily accompanied bymarked salinity signals.
4.2.3. Low-frequency ‘climatic’ influences
The NAO introduces a significant anomaly intothe mean strength of westerly air-flows over thewinter months (Trigo et al., 2002), which isapparent from the hourly wind vectors (Fig. 4).Here, we approximate the climate anomaly bycalculating an arbitrary 30-day running-mean ofthe hourly westerly wind velocity (Fig. 5). Theaveraged westerly wind velocity is strongly positive(negative) during the winter of 1988–89 (1995–96),corresponding to the positive (negative) phase ofthe NAO. Model simulations were performed withthis low-frequency time series removed entirelyfrom the hourly wind record; these runs constitutea simple attempt to remove climate-scale varia-bility from the wind forcing. A similar low-frequency ‘climatic’ signal was then removed fromthe daily discharge data; in this case, the anomalieswere calculated as the deviation of each running-mean time series from the average of the two,giving a positive anomaly during the winter of1988–89 and a negative anomaly during the winterof 1995–96 (Fig. 3).

ARTICLE IN PRESS
Fig. 8. Predicted time series of upper basin water salinity from
all the sensitivity analysis simulations for 1988–89. All time
series are shown in greyscale except the control run, which is
highlighted in black. Time series from other runs discussed in
the text are also indicated.
P.A. Gillibrand et al. / Continental Shelf Research 25 (2005) 571–587582
Removing the low-frequency ‘climatic’ signalfrom the wind forcing condition produced somesignificant effects in the upper basin (Table 4a,Run 7). For 1988–89, annual-mean salinity in-creased by 0.38 relative to the control run, thefrequency of renewal increased by 36 days and theinflow volume increased by 20%. The correspond-ing changes for Run 8, with the low-frequencydischarge signal removed, were �0.08, 8 days and8%. When both low-frequency ‘climatic’ timeseries were removed (Run 9), the mean salinity inthe upper basin still increased by 0.38 and therenewal frequency increased by 30 days. For theequivalent 1995–96 simulation (Run 9), the meansalinity and renewal frequency decreased by 0.12and 16 days, respectively. Notably, the threecalculated variables for the upper basin fromRun 9 have very similar values for both 1988–89and 1995–96 simulations (Table 4a), stronglysuggesting that the low-frequency variability inthe boundary forcing, which is absent from thisrun, is a significant factor in producing thedifferences in annual-mean properties predictedfor the two control runs.In contrast to the upper basin, removing the low-
frequency signals from the forcing conditions hadrelatively little effect on the annual-mean salinityand frequency of renewal in the main basin, withsalinity changing by less than 0.02 (as observed inthe main simulations). These results support theearlier suggestion that low-frequency forcing in thewind and freshwater boundary conditions have lessinfluence on water properties in this basin. Inflowwas more strongly affected: with both ‘climatic’signals removed (Run 9), predicted inflow to themain basin in 1988–89 was 60% of that in 1995–96,whereas it was 34% in the control runs.The influence of the NAO during winter was
again demonstrated. The greatest deviations fromthe control simulations occurred from Decemberto March (Fig. 8). When the underlying westerlywind anomaly was removed (Runs 7 and 9), thepredicted salinity in the upper basin in 1988–89 didnot steadily decrease over the wind months butremained above 33; thereafter, from April on-wards, the predicted time series from these twosimulations showed little difference from thecontrol run.
4.2.4. Coastal salinity profile
Although not an intrinsic characteristic of theNAO, the coastal salinity profile may be modifiedby fluctuations in climate. It is also necessary toestablish how the use of an identical salinity profilefor both the 1988–89 and 1995–96 simulations mayhave affected the results. From the archives of theBritish Oceanographic Data Centre, a total of 32CTD salinity profiles were obtained for the areaoutside the entrance to Loch Sunart (to the northof Tobermory, Fig. 1), taken between 1981 and2001. Near-surface salinity typically varied from33 to 34.5. Data from 1975 to 1981 presented byEllett and Edwards (1983) also showed surfacesalinity in this inshore region of the continentalshelf fluctuating over the same range. In deeperwater below about 30m, which most likelyprovides the source water for intrusions into LochSunart, the salinity varied between �34 and 34.6.This constitutes a variation of 71% around thedeep water salinity used in the control simulations(maximum value S ¼ 34:35), and the open bound-ary salinity profile was therefore modified by71% for the sensitivity runs.The results show that these changes were fully
communicated to the main and upper basins, withthe annual-mean salinity in both modified by71% from control values (Table 4, Runs 10 and11). These modifications to the BWS, typically

ARTICLE IN PRESS
Table 5
Correlation coefficients, r; between the predicted daily meanbottom water salinity and daily mean wind stress and river flow
data
Upper basin Main basin
1988–89 1995–96 1988–89 1995–96
Q �0.56 (4) �0.44 (9) 0.26 (3) �0.10 (5)
t �0.51 (7) �0.31 (17) 0.19 (2) �0.25 (16)
P.A. Gillibrand et al. / Continental Shelf Research 25 (2005) 571–587 583
70.3, are of a similar order of magnitude as thepredicted difference in the upper basin meansalinity from the main simulations, and greatlyexceed the predicted change in the main basin.There are some predicted effects on the frequencyof renewal and inflow volume, most of whichoccur in the early part of the simulation as thesalinity field in the fjord readjusts to the modifiedboundary condition (Fig. 8).
QC �0.80 (14) �0.48 (9) 0.22 (6) 0.06 (4)
tC �0.89 (15) �0.39 (18) 0.40 (0) �0.33 (0)
Daily mean values of wind stress and river flow were calculated
from both the raw observed data (t; Q) and the low-frequency
(running-mean) time series (tC; QC). The time lag (in days)
which gave the maximum correlation is shown in parentheses.
All values of r are significant at 95% except those that are
italicised.
5. Discussion
The results described above suggest that thefluctuations in the North Atlantic Oscillation,acting through modified wind stress and riverdischarge patterns, could have significant effectson the salinity of the deep water in the upper basinof Loch Sunart. The influence of the NAO appearsto be exerted primarily through the enhancedwesterly winds which are prevalent during thepositive phase, rather than through the associatedincreased precipitation and river discharge. Strongpersistent westerlies inhibit deep water renewal ofthe upper basin during the winter months, resultingin a steady decline in basin salinity until the spring.Similar effects were less apparent in the main basin,where the salinity was much more stable anddominated by the prescribed open boundary con-dition. The influence of the low-frequency climaticforcing associated with the NAO on the salinity ofthe upper basin is further demonstrated by thestatistical correlations between the predicted dailymean salinity from the two control simulations andthe westerly wind stress and river discharge data(Table 5). In the upper basin, the BWS exhibitedstronger correlations with the low-frequency windstress and river flow than with the daily observeddata, particularly for 1988–89. Maximum correla-tions were obtained when the BWS was laggedrelative to the forcing variables by about 2 weeks.Correlation coefficients for the main basin weremuch weaker, indicating the limited influence thatlocal wind forcing and freshwater runoff have onthe BWS in this basin.The contrasting influence of the NAO on the
two basins of Loch Sunart is due to the strongermixing that inflowing water undergoes as it passes
over the inner sill compared to the outer sill. Themodelled annual-mean profiles of salinity, verticaleddy diffusivity and vertical eddy flux of salt aboveeach sill are shown in Fig. 9. Mean eddydiffusivities in the lower water column are largerabove the inner sill than the outer sill and, with thestronger vertical salinity gradient immediatelyabove the inner sill, produce a mean vertical fluxof salt (Kz@S=@z; Fig. 9) that is an order ofmagnitude larger than that immediately above theouter sill. This flux produces a greater modifica-tion of the inflowing water as it traverses the innersill, and is therefore responsible, at least in part,for the larger mean horizontal salinity difference inthe lower water column predicted across the innersill (DSsill � 0:220:5) than across the outer sill(DSsill � 0:07). Typical Froude Number (see e.g.Baines, 1995, p. 176) values for the inner and outersills were calculated to be F ¼ 629 and 0.7–1.0,respectively. Strong mixing over the super-critical(F41) inner sill gives the inflowing water char-acteristics that reflect recent fluctuations in surfacelayer properties (and therefore recent rainfallpatterns); it also means that deep water renewalof the basin is controlled by wind and runoffforcing conditions (Gillibrand et al., 1995). Incontrast, the water passing over the sub-critical(Fo1) outer sill undergoes less mixing and is lesssensitive to surface layer properties, insteadretaining the characteristics of the source waterseaward of the sill.

ARTICLE IN PRESS
S Kz∂S/∂zKz ∆Ssill S Kz∂S/∂zKz ∆Ssill
Main Basin Upper Basin
32 33 34
5
10
15
20
25
Hei
ght a
bove
sea
bed
(m)
0 10 20
0 0.1 0.2
0 0.2 0.4
32 33 34
2
3
4
5
Hei
ght a
bove
sea
bed
(m)
0 10 20
0 0.2 0.4
0 0.3 0.6
(b)(a)
Fig. 9. Modelled annual-mean profiles of salinity (S), vertical eddy diffusivity (Kz; 10�4m2 s�1), the vertical turbulent flux of salt
(Kz@S=@z; 10�4m s�1) and the horizontal difference in salinity across the sill (DSsill) for 1988–89 (solid line) and 1995–96 (broken line).
The variable DSsill is calculated from grid cells at the landward and seaward ends of each sill; the horizontal distance is the same for
both sills. Note the different vertical scales in (a) and (b).
P.A. Gillibrand et al. / Continental Shelf Research 25 (2005) 571–587584
The results described here have implications forother basin water properties besides salinity.Water column concentrations of d18O are ofparticular interest since they may be incorporatedinto the palaeoclimate record of carbonate(d18Ocalcite) preserved in fjord sediments (which isalso dependent on the temperature at the time ofcalcification). The regional salinity:d18Owater rela-tionship (mixing line) for Loch Sunart has beendefined previously by Austin and Inall (2002) as
d18Owater ¼ 0:18S � 6:0; (2)
where S is the salinity. Tributaries entering thefjord in July 1999 ranged in d18Owater from –5.76to –6.32% and are therefore in reasonably goodagreement with the predicted d18Owater at zerosalinity (S ¼ 0). Weighted annual d18Owater inprecipitation from this region of North-westEurope typically ranges from –5 to –8%.By combining the observed salinity:d18Owater
relationship with the predicted time series of basinsalinity, we obtain predicted time series ofd18Owater. The linear relationship described in Eq.(2) allows us to simply superimpose d18Owater ontothe salinity time series (Fig. 6). The predictedrange of d18Owater in the upper basin wassignificantly greater (0.45%) during 1988–89 than1995–96 (0.19%), with mean values of –0.01% and0.08% respectively. If fully translated to the
sedimentary carbonate record, the difference inannual-mean d18Owater of 0.09% is marginallygreater than the 70.05% measurement accuracyof d18Ocalcite; detecting inter-annual variability inBWS from the sedimentary record thereforeremains a possibility in this basin. In the mainbasin, predicted ranges of d18Owater for 1988–89and 1995–96 were 0.04% and 0.03%, respectively,with mean values of 0.18% for both years; inter-annual variability of this order would currently beimpossible to detect from the sedimentary record.Changes in salinity need to be relatively large if
they are to significantly alter the d18Owater in fjordbasins because regional precipitation is not sig-nificantly depleted in 18O (hence the low regressionslope in (2)). While this may be a problem in termsof reconstructing the NAO-driven changes insalinity in some basins, it does offer a distinctadvantage where palaeotemperature is the primaryrecord of interest (see Austin and Inall (2002) fordiscussion). The weak salinity:d18O mixing linesobtained to date in Scottish and other NorthEuropean waters (e.g. Mikalsen and Sejrup, 2000),combined with the predicted stability of thesalinity signal in response to climate fluctuationsdescribed here for the main basin of Loch Sunart,suggests that carefully selected fjord basins mayprovide useful sampling sites for palaeotempera-ture studies.

ARTICLE IN PRESS
P.A. Gillibrand et al. / Continental Shelf Research 25 (2005) 571–587 585
The sensitivity analysis demonstrated that var-iations in the salinity boundary condition werefully communicated to both basins, causingchanges in the annual-mean BWS (70.3) thatare comparable to the predicted difference inannual-mean salinity in the upper basin due tothe NAO (DS ¼ 0:5). The possibility exists, there-fore, that the direct response of the basin water tothe NAO may be enhanced or partially masked bythe response of the coastal salinity to the NAO. Ashortage of carefully calibrated time series ofsalinity from this region of the European con-tinental shelf means that the response of coastalsalinity to the NAO, and the consequent implica-tions for basin water properties, cannot beascertained at present. Those salinity time seriesthat do exist, e.g. from the Tiree Passage betweenColl and Mull, need careful calibration before thedata can be considered reliable (Inall and Griffiths,2003).The east–west orientation of many fjords along
the Scottish and Scandinavian coastlines suggeststhat a response of basin water properties to theNAO, and in particular the enhanced westerly air-flow, may be quite common. Renewal of basinwater in other Scottish fjords with shallow sills isthought to be dependent on particular combina-tions of wind forcing, low freshwater dischargeand tidal range (e.g. Edwards and Edelsten, 1977;Allen and Simpson, 1998) and it seems likely,therefore, that the magnitude and frequency ofrenewal of these fjord basins may also respond toNAO variability. In Gullmar Fjord, Sweden,Nordberg et al. (2000) suggested that changes tothe benthic foraminifera in the 1970s may have acausal link to the NAO through modification ofbottom water properties, particularly oxygenconcentration. The results presented here suggestthat such a link is entirely plausible.The work presented here formed a preliminary
study investigating the potential for climatefluctuations, in particular the NAO, to impactbottom water conditions in Scottish fjords; assuch, the model was not modified from previousapplications (Gillibrand et al., 1995) and severaldevelopments could be envisaged for further work.In particular, the absence of temperature from thepresent simulations was certainly a shortcoming in
regard to assessing the implications of the work forpalaeoceanographic studies. In addition, the rela-tively coarse spatial resolution of the model needsto be improved and the influence of the oceansalinity boundary condition addressed. Furtherwork may develop the modelling to include thesefeatures, and to investigate in more detail themechanisms by which the NAO, and other large-scale climate fluctuations, affect water propertiesin enclosed coastal waters. Longer observationaltime series of temperature and salinity from thebasins of Loch Sunart have been collected and arebeing analysed, and further data sampling toinvestigate the seasonal variability in the isotopiccomposition of freshwater in the Loch Sunartcatchment is underway.
6. Summary
A preliminary modelling study has suggestedthat the basin water salinity (and associatedproperties) in some fjord basins may exhibit aperceptible response to the North Atlantic Oscilla-tion. The case study of Loch Sunart indicated thatclimate effects on water salinity and d18Owater willbe felt most strongly in the upper, shallow-silledbasin, where the model forcing from extremephases of the NAO produced a predicted differ-ence in annual-mean basin water salinity of 0.52.The influence of the NAO was exerted primarilythrough the enhanced westerly wind stress anom-aly associated with a positive phase whichinhibited renewal of the basin water and alloweda steady decline in BWS over the winter.The predicted volume of water flowing annually
into the fjord basins was significantly greaterunder the low phase of the NAO than the highphase; annual inflows into the upper and mainbasins were respectively 50% and 300% greater in1995–96 than 1988–89. Stronger inflow, particu-larly to the main basin, was not always accom-panied by a marked salinity signal.The more open exchange and weaker mixing
over the deeper, sub-critical sill between the mainbasin and the adjacent coastal water resulted inmore stable salinity and d18Owater records in thatbasin, and a much weaker predicted response to

ARTICLE IN PRESS
P.A. Gillibrand et al. / Continental Shelf Research 25 (2005) 571–587586
the NAO (difference in annual-mean sal-inity ¼ 0.02). The predicted stability of deep-watersalinity, combined with the inter-annual variabilityin coastal water temperature, may make such fjordbasins ideal sites for palaeotemperature studies.
Acknowledgements
We thank Prof. Phil Jones for his helpfulcomments on an early draft of this manuscript.The Tiree wind data was supplied by the UKMeteorological Office through the British Atmo-spheric Data Centre, and the Scottish Environ-ment Protection Agency (SEPA) provided theriver flow data for the River Polloch. CTD datafrom the Sound of Mull were obtained from theBritish Oceanographic Data Centre. We thank twoanonymous reviewers for their constructive advice.
References
Allen, G.L., Simpson, J.H., 1998. Deep water inflows to Upper
Loch Linnhe. Estuarine Coastal and Shelf Science 47,
487–498.
Austin, W.E.N., Inall, M.E., 2002. Deep-water renewal in a
Scottish fjord: temperature, salinity and oxygen isotopes.
Polar Research 21 (2), 251–258.
Baines, P.G., 1995. Topographic Effects in Stratified Flows.
Cambridge University Press, Cambridge, UK 482pp.
Black, A.R., Cranston, M.D., 1995. River flow gauging station
data usage and network evolution in Scotland. Proceedings
of Fifth National Hydrology Symposium, Edinburgh,
September 1995, vol. 6. British Hydrological Society,
Wallingford, pp. 6.19–6.25.
Cayan, D.R., 1992. Latent and sensible heat flux anomalies
over the northern oceans: the connection to monthly
atmospheric circulation. Journal of Climate 5, 354–369.
Chandler, R.E., Wheater, H.S., 2002. Analysis of rainfall
variability using generalized linear models: a case study
from the west of Ireland. Water Resources Research 38 (10),
1192.
Craig, H., Gordon, L., 1965. Deuterium and oxygen-18
variations in the ocean and the marine atmosphere. In:
Tongiorgio, E. (Ed.), Stable isotopes in Oceanographic
Studies and Paleotemperatures, Spoleto, 1965. pp. 9–130.
Dickson, R., Lazier, J., Meincke, J., Rhines, P., Swift, J., 1996.
Long-term coordinated changes in the convective activity of
the North Atlantic. Progress in Oceanography 38, 241–295.
Dunbar, D.S., Burling, R.S., 1987. A numerical model of
stratified circulation in Indian arm, British Columbia.
Journal of Geophysical Research 92 (C12), 13075–13105.
Edwards, A., Edelsten, D.J., 1977. Deep-water renewal of Loch
Etive: a three basin Scottish fjord. Estuarine and Coastal
Marine Science 5, 575–593.
Edwards, A., Sharples, F., 1986. Scottish sea lochs: a catalogue.
Scottish Marine Biological Association/Nature Conser-
vancy Council. Dunstaffnage Marine Laboratory, Oban,
UK.
Edwards, A., Edelsten, D.J., Saunders, M.A., Stanley, S.O.,
1980. Renewal and entrainment in Loch Eil: a periodically
ventilated Scottish fjord. In: Freeland, H.J., Farmer, D.M.,
Levings, C.D. (Eds.), Fjord Oceanography. Plenum Press,
London, pp. 523–530.
Ellett, D.J., Edwards, A., 1983. Oceanography and inshore
hydrography of the Inner Hebrides. Proceedings of the
Royal Society of Edinburgh 83B, 143–160.
Elliott, A.J., Gillibrand, P.A., Turrell, W.R., 1992. Tidal mixing
near the sill of a Scottish sea loch. In: Prandle, D. (Ed.),
Dynamics and Exchanges in Estuaries and the Coastal
Zone, Coastal and Estuarine Studies, vol. 40. American
Geophysical Union, Washington DC, pp. 35–56.
Foreman, M.G.G., 1977. Manual for tidal heights analysis and
prediction. Pacific Marine Science Report 77-10, Institute of
Ocean Sciences, Victoria, BC, Canada, 58pp.
Gillibrand, P.A., 2001. Calculating exchange times in a Scottish
fjord using a two-dimensional, laterally integrated numer-
ical model. Estuarine Coastal and Shelf Science 53, 437–449.
Gillibrand, P.A., Turrell, W.R., Elliott, A.J., 1995. Deep-water
renewal in the upper basin of Loch Sunart, a Scottish fjord.
Journal of Physical Oceanography 25, 1488–1503.
Hurrell, J.W., 1995. Decadal trends in the North Atlantic
oscillation: regional temperatures and precipitation. Science
269, 676–679.
Inall, M.E., Griffiths, C.R., 2003. MECN: the tiree passage
time series: 1981–2003. DEFRA Report 11/03, DEFRA,
UK, 22pp.
Jones, P.D., Jonsson, T., Wheeler, D., 1997. Extension to the
North Atlantic oscillation using instrumental pressure
observations from Gibraltar and south-west Iceland. Inter-
national Journal of Climatology 17, 1433–1450.
Lavelle, J.W., Cokelet, E.D., Cannon, G.A., 1991. A model
study of density intrusions into and circulation within a
deep silled estuary: Puget Sound. Journal of Geophysical
Research C 96, 16779–16800.
Mellor, G.L., Yamada, T., 1982. Development of a turbulence
closure model for geophysical fluid problems. Reviews of
Geophysics and Space Physics 20, 851–875.
Mikalsen, G., Sejrup, H.P., 2000. Oxygen isotope composition
of fjord and river water in the Sognefjorden drainage area,
western Norway. Implications for paleoclimate studies.
Estuarine Coastal and Shelf Science 50, 441–448.
Nordberg, K., Gustafsson, M., Krantz, A-L., 2000. Decreasing
oxygen concentrations in the Gullmar Fjord, Sweden, as
confirmed by benthic foraminifera, and the possible
association with NAO. Journal of Marine Systems 23,
303–316.
Reverdin, G., Cayan, D.R., Kushnir, Y., 1997. Decadal
variability of hydrography in the upper northern North

ARTICLE IN PRESS
P.A. Gillibrand et al. / Continental Shelf Research 25 (2005) 571–587 587
Atlantic in 1948–1990. Journal of Geophysical Research 102
(C4), 8505–8531.
Rippeth, T.P., Simpson, J.H., 1996. The frequency and
duration of episodes of complete vertical mixing in the
Clyde Sea. Continental Shelf Research 16, 933–947.
Ruprecht, E., Schroder, S.S., Ubl, S., 2002. On the relation
between NAO and water vapour transport towards Europe.
Meteorologische Zeitschrift 11 (6), 395–401.
Slonosky, V.C., Yiou, P., 2001. The North Atlantic oscillation
and its relationship with near surface temperature. Geo-
physical Research Letters 28 (5), 807–810.
Stacey, M.W., Pieters, R., Pond, S., 2002. The simulation of
deep water exchange in a fjord: Indian Arm, British
Columbia, Canada. Journal of Physical Oceanography 32,
2753–2765.
Stacey, M.W., Pond, S., Nowak, Z.P., 1995. A numerical model
of the circulation in Knight Inlet, British Columbia,
Canada. Journal of Physical Oceanography 25, 1037–1062.
Trigo, R.M., Osborn, T.J., Corte-Real, J.M., 2002. The North
Atlantic Oscillation influence on Europe: climate impacts
and associated physical mechanisms. Climate Research 20,
9–17.
Wang, D.-P., Kravitz, D.W., 1980. A semi-implicit two-
dimensional model of estuarine circulation. Journal of
Physical Oceanography 10, 441–454.
Watts, L.J., Rippeth, T.P., Edwards, A., 1998. The roles of
hydrographic and biogeochemical processes in the distribu-
tion of dissolved inorganic nutrients in a Scottish sea-loch:
consequences for the spring phytoplankton bloom. Estuar-
ine Coastal and Shelf Science 46, 39–50.
Copyright © 2022 FDOKUMEN