Quality Predictability and the Welfare Benefits from New ...

Origin and predictability of the extreme negativeNAO winter of 2009/10
T. Jung,1,2 F. Vitart,1 L. Ferranti,1 and J.‐J. Morcrette1
Received 17 January 2011; revised 18 February 2011; accepted 2 March 2011; published 9 April 2011.
[1] The winter of 2009/2010 was one of the most negativewinters of the North Atlantic Oscillation (NAO) during thelast 150 years. While most operational extended‐rangeforecasting systems had difficulties in predicting the onset ofthe negative NAO phase, once established, extended‐rangeforecasts were relatively skilful in predicting its persistence.Here, the origin and predictability of the unusual winter of2009/10 are explored through numerical experimentationwith the ECMWF Monthly forecasting system. Morespecifically, the role of anomalies in sea surface temperature(SST) and sea ice, the tropical atmospheric circulation, thestratospheric polar vortex, solar insolation and near surfacetemperature (proxy for snow cover) are examined. None ofthese anomalies is capable of producing the observed NAOanomaly, especially in terms of its magnitude. The results ofthis study support the hypothesis that internal atmosphericdynamical processes were responsible for the onset andpersistence of the negative NAO phase during the 2009/10winter. Citation: Jung, T., F. Vitart, L. Ferranti, and J.‐J. Morcrette(2011), Origin and predictability of the extreme negative NAOwinter of 2009/10, Geophys. Res. Lett., 38, L07701, doi:10.1029/2011GL046786.
1. Introduction
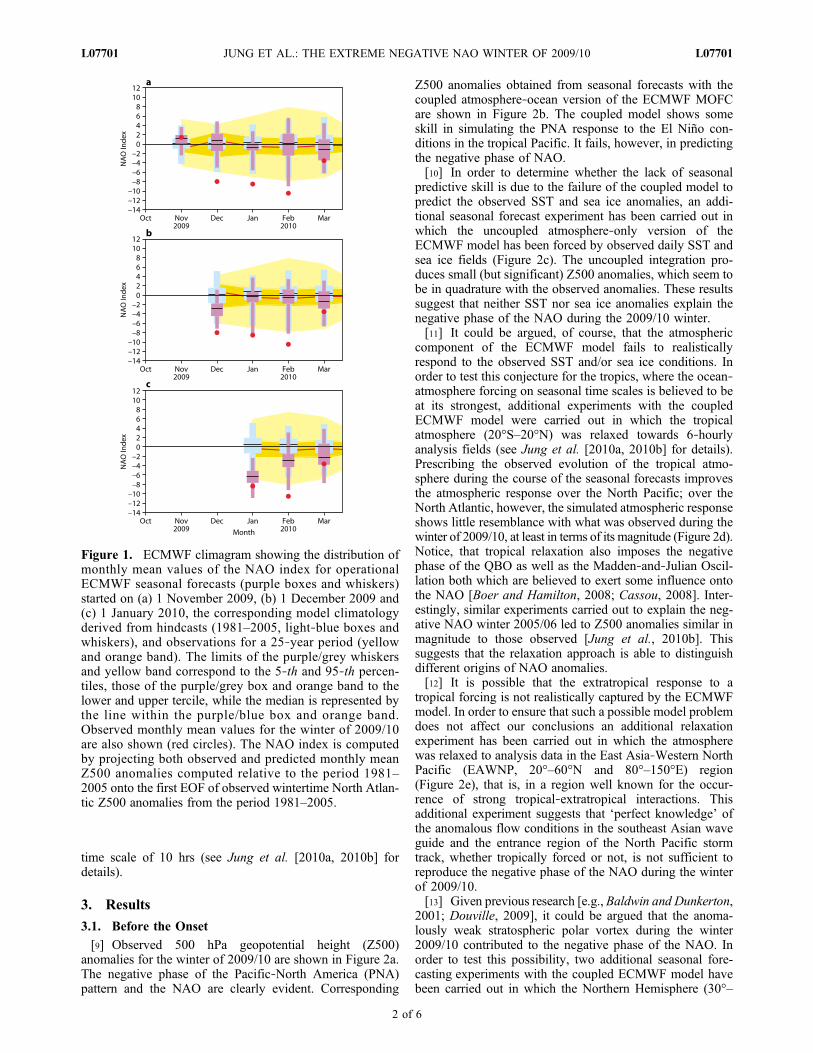
[2] The winter season of 2009/10 was one of the coldestand snowiest in central North America and northwesternEurope for decades and it was suggested that this was aresult of the extremely negative phase of the NAO [Seageret al., 2010]. The so‐called ECMWF climagrams show thatthe observed NAO index lay below the 5‐th percentile forall of the three winter months December 2009 to February2010, with February being the most extreme of the threemonths (Figure 1a). Interestingly, the NAO remained neg-ative throughout the subsequent spring season, althoughwith reduced amplitude.[3] In terms of extended‐range forecast skill the winter of
2009/10 can be divided into two parts. During late autumnand early winter the extended‐range forecast skill of theECMWF seasonal forecasting system in predicting the neg-ative NAO winter was poor to modest (Figures 1a and 1b).However, once the negative phase of the NAO was wellestablished the extended‐range forecast skill increased sub-stantially (Figure 1c and forecasts started on 1 February2010, not shown).
[4] What caused the unusually extreme and persistentnegative NAO phase during the winter of 2009/10? A rea-sonable null hypothesis is to assume that the negative NAOphase was a result of atmospheric non‐linear dynamicalprocesses which are known to explain a large amount ofinterannual atmospheric variability in the extratropics [e.g.,James and James, 1989], including that of the NAO [Kushniret al., 2006]. However, given the outstanding magnitude andpersistence of the negative NAO winter in 2009/10 it issometimes argued that some ‘external’ forcing must havecontributed. Here ‘external’ shall refer to anything beyondtropospheric dynamics in the North Atlantic region.[5] A number of ‘external’ phenomena, which prevailed
during the 2009/10 winter, have been suggested in the past toincrease the frequency of occurrence of the negative NAOphase. The list of phenomena considered in this study com-prises El Niño [Fraedrich, 1994;Greatbatch and Jung, 2007;Brönnimann, 2007; Ineson and Scaife, 2009], the negativephase of the Quasi‐Biennial Oscillation (QBO) [e.g., Boerand Hamilton, 2008], a weakened stratospheric polar vortex[Baldwin and Dunkerton, 2001], reduced incoming solarradiation (for a review see Gray et al. [2010]) and NorthernHemisphere snow cover anomalies [Cohen et al., 2010].[6] The aim of this study is to explore possible causes and
the predictability of the negative NAO winter 2009/10.
2. Methods
[7] Seasonal forecasting experiments presented in thisstudy were carried out using the ECMWF Monthly Fore-casting system (MOFC) [Vitart, 2004], which is based on acoupled atmosphere‐ocean model. The atmospheric compo-nent consists of a recent version (36r1) of the ECMWFIntegrated Forecasting System at TL159 with 60 levels in thevertical. The ocean component consists of the HamburgOcean Primitive Equation (HOPE) model at 1° × 1° hori-zontal resolution and with 29 levels in the vertical. Ensembleforecasts (40 members) for the winter of 2009/10 (Decemberthrough February) were started on 1 November 2009. In orderto be able to compute anomalies, for each of the differentexperiment types, 4 member ‘calibration’ ensembles werealso produced for all winters of the period 1991–2008. Detailsabout how the ensembles were generated are described byVitart [2004].[8] In order to explore whether the negative phase of the
NAO was caused by atmospheric circulation anomalies incertain ‘remote’ regions such as the tropics, a relaxationapproach was employed; that is, during the integration themodel was relaxed towards interpolated, 6‐hourly ECMWFanalysis fields of zonal and meridional wind, temperatureand surface pressure in certain regions using a relaxation
1European Centre for Medium-Range Weather Forecasts, Reading,UK.
2Alfred-Wegener-Institute for Polar and Marine Research,Bremerhaven, Germany.
Copyright 2011 by the American Geophysical Union.0094‐8276/11/2011GL046786
GEOPHYSICAL RESEARCH LETTERS, VOL. 38, L07701, doi:10.1029/2011GL046786, 2011
L07701 1 of 6
time scale of 10 hrs (see Jung et al. [2010a, 2010b] fordetails).
3. Results
3.1. Before the Onset
[9] Observed 500 hPa geopotential height (Z500)anomalies for the winter of 2009/10 are shown in Figure 2a.The negative phase of the Pacific‐North America (PNA)pattern and the NAO are clearly evident. Corresponding
Z500 anomalies obtained from seasonal forecasts with thecoupled atmosphere‐ocean version of the ECMWF MOFCare shown in Figure 2b. The coupled model shows someskill in simulating the PNA response to the El Niño con-ditions in the tropical Pacific. It fails, however, in predictingthe negative phase of NAO.[10] In order to determine whether the lack of seasonal
predictive skill is due to the failure of the coupled model topredict the observed SST and sea ice anomalies, an addi-tional seasonal forecast experiment has been carried out inwhich the uncoupled atmosphere‐only version of theECMWF model has been forced by observed daily SST andsea ice fields (Figure 2c). The uncoupled integration pro-duces small (but significant) Z500 anomalies, which seem tobe in quadrature with the observed anomalies. These resultssuggest that neither SST nor sea ice anomalies explain thenegative phase of the NAO during the 2009/10 winter.[11] It could be argued, of course, that the atmospheric
component of the ECMWF model fails to realisticallyrespond to the observed SST and/or sea ice conditions. Inorder to test this conjecture for the tropics, where the ocean‐atmosphere forcing on seasonal time scales is believed to beat its strongest, additional experiments with the coupledECMWF model were carried out in which the tropicalatmosphere (20°S–20°N) was relaxed towards 6‐hourlyanalysis fields (see Jung et al. [2010a, 2010b] for details).Prescribing the observed evolution of the tropical atmo-sphere during the course of the seasonal forecasts improvesthe atmospheric response over the North Pacific; over theNorth Atlantic, however, the simulated atmospheric responseshows little resemblance with what was observed during thewinter of 2009/10, at least in terms of its magnitude (Figure 2d).Notice, that tropical relaxation also imposes the negativephase of the QBO as well as the Madden‐and‐Julian Oscil-lation both which are believed to exert some influence ontothe NAO [Boer and Hamilton, 2008; Cassou, 2008]. Inter-estingly, similar experiments carried out to explain the neg-ative NAO winter 2005/06 led to Z500 anomalies similar inmagnitude to those observed [Jung et al., 2010b]. Thissuggests that the relaxation approach is able to distinguishdifferent origins of NAO anomalies.[12] It is possible that the extratropical response to a
tropical forcing is not realistically captured by the ECMWFmodel. In order to ensure that such a possible model problemdoes not affect our conclusions an additional relaxationexperiment has been carried out in which the atmospherewas relaxed to analysis data in the East Asia‐Western NorthPacific (EAWNP, 20°–60°N and 80°–150°E) region(Figure 2e), that is, in a region well known for the occur-rence of strong tropical‐extratropical interactions. Thisadditional experiment suggests that ‘perfect knowledge’ ofthe anomalous flow conditions in the southeast Asian waveguide and the entrance region of the North Pacific stormtrack, whether tropically forced or not, is not sufficient toreproduce the negative phase of the NAO during the winterof 2009/10.[13] Given previous research [e.g., Baldwin and Dunkerton,
2001; Douville, 2009], it could be argued that the anoma-lously weak stratospheric polar vortex during the winter2009/10 contributed to the negative phase of the NAO. Inorder to test this possibility, two additional seasonal fore-casting experiments with the coupled ECMWF model havebeen carried out in which the Northern Hemisphere (30°–
Figure 1. ECMWF climagram showing the distribution ofmonthly mean values of the NAO index for operationalECMWF seasonal forecasts (purple boxes and whiskers)started on (a) 1 November 2009, (b) 1 December 2009 and(c) 1 January 2010, the corresponding model climatologyderived from hindcasts (1981–2005, light‐blue boxes andwhiskers), and observations for a 25‐year period (yellowand orange band). The limits of the purple/grey whiskersand yellow band correspond to the 5‐th and 95‐th percen-tiles, those of the purple/grey box and orange band to thelower and upper tercile, while the median is represented bythe line within the purple/blue box and orange band.Observed monthly mean values for the winter of 2009/10are also shown (red circles). The NAO index is computedby projecting both observed and predicted monthly meanZ500 anomalies computed relative to the period 1981–2005 onto the first EOF of observed wintertime North Atlan-tic Z500 anomalies from the period 1981–2005.
JUNG ET AL.: THE EXTREME NEGATIVE NAO WINTER OF 2009/10 L07701L07701
2 of 6

90°N) stratosphere was relaxed towards analysis dataupward of about 30 hPa (Figure 2f) and upward of about85 hPa (Figure 2g). Like for the other experiments, thesestratospheric relaxation experiments fail to reproduce themagnitude of the observed NAO anomaly (Figure 2f). Both
experiments employ a smooth transition zone in the verticalfor the relaxation [Jung et al., 2010a]. For the experimentwith relaxation of model levels 1–22 this means that therelaxation coefficient decreases from 0.05 hr−1 at about55 hPa to 0.01 hr−1 at about 85 hPa. It is conceivable that
Figure 2. Ensemble mean geopotential height anomalies (in m) at 500 hPa for the winter (December through February)2009/10: (a) observed, (b) coupled control integration, (c) uncoupled control integration with observed SST and sea ice,(d) tropical relaxation, (e) relaxation in the East Asia‐Western North Pacific region, relaxation of the Northern Hemispherestratosphere for model levels (f) 1–17 (about 0.1–30 hPa) and (g) 1–22 (about 0.1–85h Pa), (h) relaxation of near‐surfacetemperatures (five lowest model levels from about 990–1013 hPa) over the Northern Hemisphere and (i) experiment withreduced incoming UV radiation. Notice the larger contour interval in Figure 2a. Differences statistically significant at the95% confidence level in Figures 2b–2i are hatched. Anomalies in Figures 2b–2i were computed as the difference betweenthe ensemble mean for 2009/10 (40 members) and the long‐term mean from respective 4 member hindcast integrationscovering the period 1991/92–2008/09 (one separate hindcast for each experiment type).
JUNG ET AL.: THE EXTREME NEGATIVE NAO WINTER OF 2009/10 L07701L07701
3 of 6
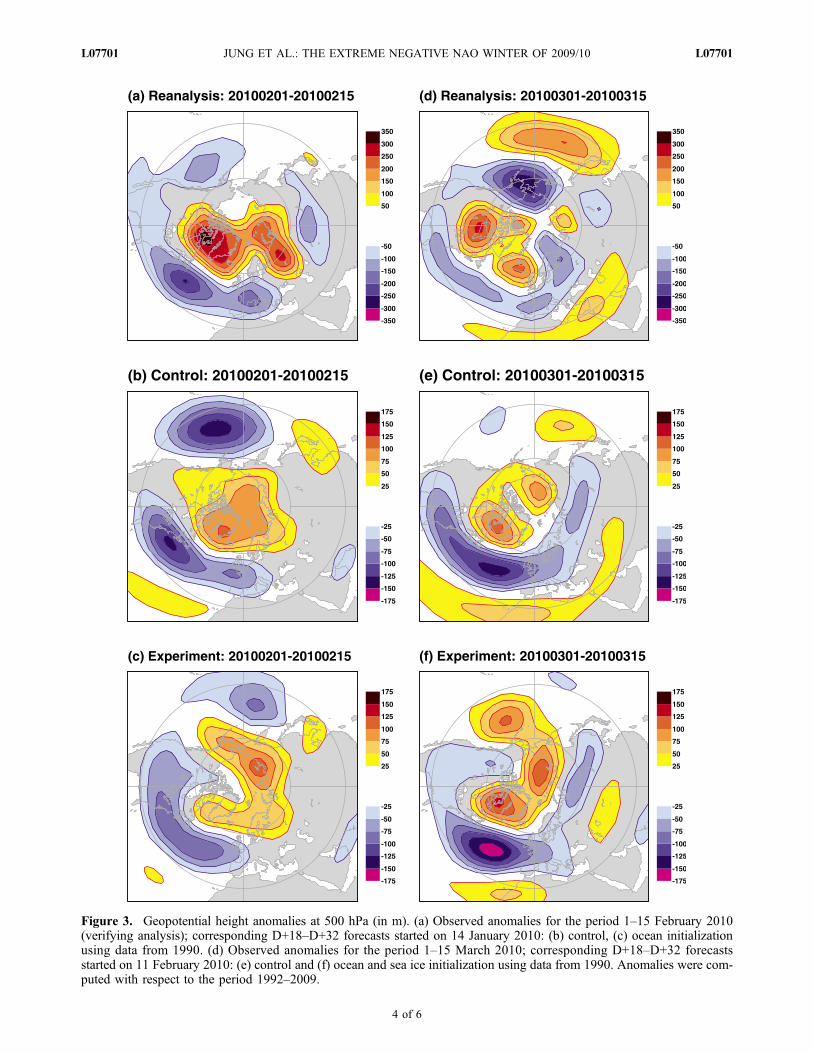
Figure 3. Geopotential height anomalies at 500 hPa (in m). (a) Observed anomalies for the period 1–15 February 2010(verifying analysis); corresponding D+18–D+32 forecasts started on 14 January 2010: (b) control, (c) ocean initializationusing data from 1990. (d) Observed anomalies for the period 1–15 March 2010; corresponding D+18–D+32 forecastsstarted on 11 February 2010: (e) control and (f) ocean and sea ice initialization using data from 1990. Anomalies were com-puted with respect to the period 1992–2009.
JUNG ET AL.: THE EXTREME NEGATIVE NAO WINTER OF 2009/10 L07701L07701
4 of 6

stronger relaxation of the lower stratosphere would give alarger ‘signal ’in the troposphere [Douville, 2009]. However,this would also pose the risk of explicitly forcing the uppertroposphere. We have repeated the above experiments byrelaxing only stratospheric zonal winds, which are betteranalysed by data assimilation systems. Relaxing zonal windsonly, however, does not change the conclusions of this study(not shown).[14] It has been argued that the negative NAO winter
2009/10 can be explained by Eurasian snow cover anoma-lies [Cohen et al., 2010]. To test this hypothesis, anotherseasonal forecast experiment has been carried out in whichtemperature in the lowest five model levels (about lowest300 m) has been relaxed towards analysis data over theNorthern Hemisphere in order to prescribe (amongst others)snow‐driven temperature anomalies on the lower part of theplanetary boundary layer. The resulting Z500 anomalies(Figure 2h) show little resemblance with the observations.The spatial structure of the Z500 response, for example, is inquadrature with the observed Z500 anomalies. The impliedweak role of snow cover anomalies is consistent with otherresearch: Firstly, additional seasonal forecast experimentswith the ECMWF model for the winter of 2009/10 withdifferent snow initial conditions indicate that the impact onearly winter snow was negligible (G. Balsamo, personalcommunication, 2011). Secondly, snow appears to affect theatmosphere primarily in late spring, summer and earlyautumn rather than winter [e.g., Bojariu and Gimeno, 2003].[15] It is increasingly being accepted that solar variability
has an influence on climate including the NAO [e.g., Grayet al., 2010; Lockwood et al., 2010; Woollings et al., 2010].Given the existence of such a link together with the fact thatsolar activity in 2009/10 had fallen to values unknown sincethe start of the 20th century [Lockwood et al., 2010], it seemsnatural to explain the negative NAO winter 2009/10 byunusually low solar activity. In order to test this conjecture,additional experiments were carried out in which theincoming solar radiation in the UV‐B and UV‐C band hasbeen reduced by 4% and 6%, respectively. This reflects theusual drop in UV observed over the last two 11‐yr cycles.Changing solar radiation in the UV part of the spectrum onlyrather than the solar constant reflects the fact that most of thesolar variability associated with the 11‐yr cycle is concen-trated in the UV band [Gray et al., 2010]. Notice, that allintegrations were carried out with interactive radiation andprognostic ozone. The experiments carried out in this studysuggest that the impact of anomalously low incoming UVradiation on the tropospheric circulation in the North Atlanticregion are very small (Figure 2i) suggesting that the unusu-ally low solar activity contributed little, if any, to theobserved NAO anomaly during the 2009/10 winter.
3.2. After the Onset
[16] Operational monthly forecasts carried out with theECMWF Variable Resolution Ensemble Prediction System(VAREPS) [Vitart et al., 2008] in January and February2010 were very skilful in predicting the negative phase ofthe NAO three to four weeks in advance (Figures 3a, 3b, 3d,and 3e). This large skill appears to be primarily associatedwith the unusually persistent character of the NAO duringthis period. The high skill of these forecasts suggests that theECMWF VAREPS, which is similar to the model used inthe previous section except for higher horizontal resolution,
realistically captures the relevant processes contributing tothe atmospheric persistence in the North Atlantic region inmid to late winter 2009/10. This fact has been exploitedto further test the role of SST and sea ice anomalies inexplaining the origin of the persistence of the negativeNAO phase. For each of the two forecasts considered here(forecasts started on 14 January and 11 February 2010,respectively) the initial conditions for ocean temperaturesand sea ice were replaced by those taken from 1990, that is,from one of the strongest positive NAO winters during thelast 150 years. The fact that the forecasts in the NorthAtlantic‐European region are virtually unchanged in theseexperiments (Figures 3c and 3f) suggests that SST and seaice anomalies, especially those in the North Atlantic region,were not crucial for explaining the persistence of the negativephase of the NAO once it was established. Similar resultswere obtained with ocean and sea ice initial conditions takenfrom January and February of the years 1994, 2005 and 2006(not shown).
4. Discussion
[17] The origin and predictability of the extremely nega-tive phase of the NAO during the winter of 2009/10 havebeen explored by means of numerical experimentation.Different possible forcing mechanisms have been tested suchas El Niño, the QBO, and reduced solar insolation. However,none of the forcings considered in this study was able toreproduce the negative phase of the NAO, especially in termsof its magnitude. The results of this study, therefore, supportthe hypothesis that both the development and persistence ofnegative NAO phase resulted from internal atmosphericdynamical processes. This may explain why most operationalseasonal forecasting systems had problems in predicting thenegative NAO winter when started in late autumn (e.g.,forecasts issued in October and November 2009). The resultsof this study suggest that internal atmospheric dynamics arean important source of low‐frequency atmospheric interan-nual variability [see also James and James, 1989] includingextreme atmospheric circulation anomalies. Furthermore,this study suggests that internal atmospheric dynamics areable to produce extremely persistent atmospheric circulationanomalies which are associated with substantial extended‐range predictive skill. From a dynamical point of view it willbe interesting to better understand the processes responsiblefor the persistence of the negative NAO throughout most ofthe 2009/10 winter.
[18] Acknowledgments. We acknowledge access to operational sea-sonal forecast products from Meteo‐France and the Met Office throughEUROSIP. The authors benefitted from useful suggestions by Adam Scaifeand two anonymous reviewers.[19] The Editor thanks the two anonymous reviewers for their assistance
in evaluating this paper.
ReferencesBaldwin, M. P., and T. J. Dunkerton (2001), Stratospheric harbingers of
anomalous weather regimes, Science, 244, 581–584.Boer, G. J., and K. Hamilton (2008), QBO influence on extratropical pre-
dictive skill, Clim. Dyn., 31, 987–1000.Bojariu, R., and L. Gimeno (2003), The role of snow cover fluctuations
in multiannual NAO persistence, Geophys. Res. Lett., 30(4), 1156,doi:10.1029/2002GL015651.
Brönnimann, S. (2007), Impact of El Niño–Southern Oscillation on Euro-pean climate, Rev. Geophys., 45, RG3003, doi:10.1029/2006RG000199.
JUNG ET AL.: THE EXTREME NEGATIVE NAO WINTER OF 2009/10 L07701L07701
5 of 6

Cassou, C. (2008), Intraseasonal interaction between the Madden JulianOscillation and the North Atlantic Oscillation, Nature, 455, 523–527.
Cohen, J., J. Foster, M. Barlow, K. Saito, and J. Jones (2010), Winter2009–2010: A case study of an extreme Arctic Oscillation event, Geo-phys. Res. Lett., 37, L17707, doi:10.1029/2010GL044256.
Douville, H. (2009), Stratospheric polar vortex influence on NorthernHemisphere winter climate variability, Geophys. Res. Lett., 36,L18703, doi:10.1029/2009GL039334.
Fraedrich, K. (1994), An ENSO impact on Europe? A review, Tellus, Ser.A, 46, 541–552.
Gray, L. J., et al. (2010), Solar influences on climate, Rev. Geophys., 48,RG4001, doi:10.1029/2009RG000282.
Greatbatch, R. J., and T. Jung (2007), Local versus tropical diabatic heatingand the winter North Atlantic Oscillation, J. Clim., 20, 2058–2075.
Ineson, S., and A. A. Scaife (2009), The role of the stratosphere in theEuropean climate response to El Niño, Nat. Geosci., 2, 32–36.
James, I. N., and P. M. James (1989), Ultra‐low frequency variability in asimple atmospheric circulation model, Nature, 342, 53–55.
Jung, T., M. J. Miller, and T. N. Palmer (2010a), Diagnosing the origin ofextended‐range forecast error, Mon. Weather Rev., 138, 2434–2446.
Jung, T., T. N. Palmer, M. J. Rodwell, and S. Serrar (2010b), Understand-ing the anomalously cold European winter 2005/06 using relaxationexperiments, Mon. Weather Rev., 138, 3157–3174.
Kushnir, Y., W. A. Robinson, P. Chang, and A. W. Robertson (2006),The physical basis for predicting Atlantic sector seasonal‐to‐interannualclimate variability, J. Clim., 19, 5949–5970.
Lockwood, M., R. G. Harrison, T. Woollings, and S. K. Solanki (2010),Are cold winters in Europe associated with solar activity?, Environ.Res. Lett., 5, doi:10.1088/1748-9326/5/2024001.
Seager, R., Y. Kushnir, J. Nakamura, M. Ting, and N. Naik (2010), NorthernHemisphere winter snow anomalies: ENSO, NAO and the winter of 2009/10, Geophys. Res. Lett., 37, L14703, doi:10.1029/2010GL043830.
Vitart, F. (2004), Monthly forecasting at ECMWF, Mon. Weather Rev.,132, 2761–2779.
Vitart, F., R. Buizza, M. A. Balmaseda, G. Balsamo, J.‐R. Bidlot, A. Bonet,M. Fuentes, A. Hofstadler, F. Moleni, and T. N. Palmer (2008), The newVAREPS‐monthly forecasting system: A first step towards seamlessprediction, Q. J. R. Meteorol. Soc., 134, 1789–1799.
Woollings, T., M. Lockwood, G. Masato, C. Bell, and L. Gray (2010),Enhanced signature of solar variability in Eurasian winter climate,Geophys. Res. Lett., 37, L20805, doi:10.1029/2010GL044601.
L. Ferranti, T. Jung, J.‐J. Morcrette, and F. Vitart, European Centre forMedium‐Range Weather Forecasts, Shinfield Park, Reading RG2 9AX,UK. ([email protected])
JUNG ET AL.: THE EXTREME NEGATIVE NAO WINTER OF 2009/10 L07701L07701
6 of 6
Copyright © 2022 FDOKUMEN