
Getting Started in Project Data - APM
19
-
Upload
khangminh22 -
Category
Documents
-
view
1 -
download
0
Transcript of Getting Started in Project Data - APM
GETTING STARTED IN PROJECT DATA2
Acknowledgements
Introduction
Imagine
Who’s the guide for?
What is project data analytics?
What does it cover?
What are the opportunities? Making a tactical start
Taking a strategic approach
What tools help
Fequently asked questions
3
4
5
6
7
8
9
10
12
15
18
CONTENTS

GETTING STARTED IN PROJECT DATA3
ACKNOWLEDGEMENTS
This collaborative report is part of our research collaborations. Research collaborations seek to bring together like-minded individuals and organisations to develop and generate innovative research that supports the needs of practice whilst helping to promote a profession built around learning and collaboration. For more information, please visit apm.org.uk/research
Contributors
Alex Robertson, Petrofac
Andy Murray, Major Projects Association
Gareth Parkes, Sir Robert McAlpine
Martin Paver, Projecting Success
Reviewers
Daniel Nicholls, APM
Eleni Papadonikolaki, UCL
Grant Mills, UCL
James Dowle, PA Consulting
John McGlynn, Atkins
GETTING STARTED IN PROJECT DATA

GETTING STARTED IN PROJECT DATA4
INTRODUCTION
We’re pleased to publish this report on behalf of the Data Advisory Group and PDA Taskforce. This guide is part of a wider leading collaboration between the Data Advisory Group and the PDA Taskforce which aims to explain how data analytics can help projects and what you can do to get started. Other collaborative activity includes events, blogs, and interactive media, as well as a Data Maturity Model from our partners.
What is the Data Advisory Group and PDA Taskforce?
We have convened a Data Advisory Group to bring together professional bodies including APM and the Major Projects Association (MPA); government including the Infrastructure and Projects Authority (IPA); academia including the Universities of Oxford, Warwick, and UCL; funding providers such as UKRI; industry representatives including Network Rail and PA Consulting and leading organisations in the field of project data and analytics such as Projecting Success and Sir Robert McAlpine. The group aims to improve ‘data literacy’ enabling individuals and organisations to understand how they might be able to make better use of data, supporting and signposting developments and like-minded initiatives such as the PDA Taskforce and Project X and sharing learning across the profession.
More information on the Data Advisory Group can be found at: apm.org.uk/resources/what-is-project-management/what-is-project-data-analytics/
The PDA Taskforce comprises a team of senior level professionals who have a mission to use data to transform project performance with a focus on delivery and action, working in the interests of the collective rather than any organisation or sector. The team is made up of a broad cross section of expertise covering: public sector, private sector, academia, and a membership body; large corporates through to SMEs; clients through to vendors; project delivery and data professions covering several industry sectors. The team has been structured to include an ideal mix of expertise to drive forward a bold and aspirational agenda. The team is not exclusive as we encourage the broadest possible engagement via our workstreams and associated events.
More information on the PDA Taskforce can be found at: pdataskforce.com
GETTING STARTED IN PROJECT DATA5
Imagine a world where data from previous projects predicts where future projects are likely to diverge from the plan. Where we understand the return on investment and long-term benefits realisation or know where best to invest contingency. These insights are encapsulated in the experience we accrue through projects. Often, we distil this down into selective abstracts and call it lessons learned or codify it in processes, methods, and handbooks but we all know that there are complex relationships and cause-effects that exist that are difficult to summarise into a paragraph, page or book. We can now deploy the latest methods in data science to find patterns in data that help us to gain insights that would otherwise have been difficult to uncover. Data analytics can give project professionals new superpowers. This may sound far-fetched, but such uses of data analytics are already being used on projects and are well established in other domains.
Imagine as a step along this journey you can access all your project information within three clicks of a mouse, without logging in to multiple systems or searching through your emails for an attachment. Imagine fully automated daily reports and the extra time your site supervision will have to manage safety and increase site performance. Imagine, also, that your project management office (PMO) have set up role-based data rules that trigger automated actions to your team, effectively ensuring a standardised minimum expected level of performance with little ongoing effort – both for the customer and the contractors. Performance will increase, mistakes will decrease, decisions will be quicker.
The project management community want predictable project performance and better outcomes. We should always know, before sanction and during delivery, the likelihood of our project being a success, however we don’t currently, as proven by academic literature.
This guide aims to explain how data analytics can help projects and what you can do to get started.
IMAGINE
GETTING STARTED IN PROJECT DATA6
Our guide is aimed at project professionals or senior leaders of project-
based organisations who wish to improve project delivery on a specific
project or across their organisation, e.g. CEOs, CTOs, PMO lead, project/
programme managers, and also business intelligence directors, directors of
education and heads of talent etc. This guide will also be of interest to the
new roles that are emerging such as head of digital, data leader, head of
data and more.
This guide assumes you’re experienced in project management and
implementing business change, therefore we don’t cover general change
management approaches for adopting new practices or innovation. Instead,
we focus on what is meant by project data analytics, what the opportunities
are, what’s happening now, and the technology and practices being used.
We also aim to debunk some myths.
This guide will help you understand opportunities for improvement made
possible through project data analytics and how to get started. This will
include tactical activities to generate momentum and strategic activities to
maximise potential. It will also help you avoid pitfalls, reinventing wheels or
racking up unnecessary costs from advisors or solution providers.
Project data analytics will impact every project delivery role, not just project
management. This guide has application beyond the traditional boundaries
of the APM and is intended to encourage collaboration across professions.
WHO’S THE GUIDE FOR?

GETTING STARTED IN PROJECT DATA7
Project data analytics is the use of past and current project data to enable effective decisions on project initiation, delivery and efficient automation of project tasks. This can be done in three ways:
� Firstly, by using algorithms to respond to data inputs to perform routine tasks faster with fewer errors than if processed manually; � secondly by collecting, cleaning, analysing, structuring and presenting data in the most effective format to make better decisions; � and thirdly, by using it to predict future performance to make timely decisions and actions.
Analytics
Analytics is the process of using data to enable effective decisions or efficiently automate tasks. In this respect, the project world has been applying rudimentary project data analytics for a long time, be that reviewing project dashboards, holding lessons learned workshops or running Monte Carlo analysis of risk registers. However, until recently such analysis has been limited by the high cost and low performance of data collection, data cleaning and processing capabilities. Today, the rapid cost-performance improvement in data processing combined with advances in data science means the handbrake of such limitations is off. We can now move from making decisions based on manipulated and out-of-date data which is limited to a handful of datapoints to making decisions on near real time source data across large volumes of datapoints. We are moving from guesswork derived from anecdotes to genuinely data driven decisions.
Project data
Projects generate lots of data from the day they’re first conceived to many years after they’ve finished, and impacts/benefits are assessed. Data may range from content in project documentation, project correspondence, project operational systems, or project logs and records to name a few – for example data in a project schedule, data in a supplier contract, and purchasing records or minutes of project meetings. Current technological advancements and data infrastructures have contributed to an increase in historical data that could be used for performance monitoring. This data may be used to inform decisions relating to the project that generated it or it may be used by the host organisation, industry associations or academics to inform decisions on other similar projects or on methodologies and project management practices generally.
WHAT IS PROJECT DATA ANALYTICS?
GETTING STARTED IN PROJECT DATA8
Project data analytics covers a wide range of capabilities. Whilst artificial intelligence (AI) grabs the headlines, that’s just one form of data analytics. On a scale of least intelligent/autonomous to most intelligent/autonomous we have robotic process automation, machine learning and artificial intelligence. They are very different, as described below.
Robotic Process Automation (RPA)
Uses technology to automate business processes by applying business logic to process inputs (e.g. receiving an invoice or a progress update). Using RPA tools, an organisation can configure a software robot (or ‘Bot’) to control computers to process a transaction, manipulate data, trigger responses and communicate between digital systems. RPA scenarios range from something as simple as generating an automatic response to an email to deploying thousands of Bots, each programmed to automate jobs in a system such as a project management tool or finance system. With RPA, businesses can automate mundane rules-based business processes, enabling individuals and teams to devote more time to performing higher-value work. In a project context RPA can be used for regular routine project tasks where predetermined actions can be defined on the vast majority of expected inputs (e.g. producing project status reports, updating project finance records). It’s like workflow but without manual entry or manipulation.
Application Programming Interface (API)
An API is a connection between computers or between software applications. It’s a type of software interface, offering a service to other pieces of software. APIs are needed for allowing different applications, especially legacy systems, to talk to one another. APIs and extracting data from disparate sources are increasingly becoming part of the job of data analysts.
Machine learning
RPA is transactional by its very nature and therefore limited to the business logic that is configured for the bot – so unintelligent processing that won’t handle unexpected input and won’t adapt as context changes. Whereas, Machine Learning, is intelligent processing in that it involves computer algorithms that ‘learn from doing’. For example, when reading a form, such as an invoice, RPA Bots will be told where to look for items such as the date, the supplier’s name, invoice number, and amount. If these are in various places or in different formats it may not read them properly. With machine learning, the can be trained to understand the characteristics of these items and therefore detect them regardless of where they are or if they’re in different formats. This process gets more accurate the more it’s used or trained. In project terms, machine learning, can be used to spot patterns between some characteristic of projects and some aspects of project performance to provide insights to aiddecision-making.
Artificial Intelligence
In a project context, AI systems could advise on or even make project decisions, which would certainly enhance or change the roles and status of many project professionals. Narrow AI is created to solve a specific problem, such as recommender systems or chatbots. General AI does not rely on human programme to accomplish tasks; it will need to understand context and environment and adapt accordingly. Although General AI may still be decades away, Narrow AI will increasingly dominate project delivery based use cases. Solutions are beginning to proliferate; low code capabilities make them increasingly accessible to all of us. Our challenge will be how we integrate these capabilities and standardise, whilst retaining a degree of control over the data.
Other digital innovations
There are lots of other digital innovations which will improve project delivery e.g. blockchain technology applications such as smart contracts, use of augmented reality in design development and stakeholder engagement, use of drones for quality control or earned value on construction sites, Building Information Modelling (BIM), Digital Twins, Internet of Things (IoT), etc. This guide is focused on data analytics therefore we will not cover these other digital innovations.
WHAT DOES IT COVER?
GETTING STARTED IN PROJECT DATA9
WHAT ARE THE OPPORTUNITIES?
One of our recent reports estimated that project management creates between £150-170bn of economic value annually in the UK 2. Yet, successful project delivery in terms of effectiveness and efficiency remains stubbornly low. Analysis by the University of Oxford’s Bent Flyvbjerg and Alexander Budzier on ~12,000 global major projects concluded that the probability of a project being delivered on budget, on time, and delivering the full benefits defined in the business case is only 0.5% 3. That is only one in 200 projects delivering on all their promises, so the scope to improve the initiation and delivery of projects is huge, as is the scale of the economic impact.
So, how can project data analytics help improve project performance? If a project was a manufacturing process it would have hundreds, if not thousands, of sensors generating performance data to be analysed in near real-time with the ability to spot trends, model options, optimise controls and maximise yield. However, the typical project dashboard comprises around 10-20 data items reported a week or two after month end. Indeed, a recent RICS report 4 claimed that 95% of project data is not even used. Projects therefore need to make the shift from being managed as temporary initiatives operating outside of business-as-usual structures (resulting in slow and manual collection and manipulation of data) to being treated more akin to an operational process that routinely collects and uses performance data. The data is there, it’s just that we need to establish the mechanisms and habits to collect and analyse more of it, more often and from the start.
Project data permeates all aspects of project management and project delivery, so the opportunities for project data analytics cover the full
spectrum of project activities. If you’ve ever uttered the phrase “if only we had known” or “I wish we had done X instead” then it’s likely that data analytics may have helped.
Data analytics can help with project level decisions such as understanding changes in stakeholder sentiment, assessing productivity of individuals and teams or understanding supply chain risks. It can also help at portfolio level such as understanding project predisposition to succeed/fail and therefore which projects need the most leadership support or how many projects are affected by socio-economic or environmental trends or risks.
The cost-performance improvement of analytical tools and advances in data science means that solutions are readily available and viable for nearly all projects – some tools may even be already part of your enterprise license. So, don’t feel that data analytics is out of reach or would take too much effort to make it worthwhile. We have included some examples to show what’s currently possible.
2 Association for Project Management (2019). The Golden Thread – A Study of the Contribution of Project Management to the UK’ Economy and Society. 3 oxfordglobalprojects.com/portfolio and parliament.uk/business/committees/committees-a-z/commons-select/public-administration-and-constitutional-affairs-committee/inquiries/parliament-2017/inquiry1/publications/ 4 rics.org/globalassets/rics-website/media/news/news--opinion/rics-future-report-2.pdf
“Better use of data in infrastructure project delivery could save £23bn a year. At root that’s about tackling poor decision making. We now have more data than ever on our projects to help us make better decisions – but project data analytics isn’t widely understood or adopted. We need to understand why and what can be done about it.”
Naomi Brookes, Professor of Complex Programme ManagementUniversity of Warick
GETTING STARTED IN PROJECT DATA10
Firstly, don’t put off getting started. Many people will have already done some form of data analytics, but without necessarily knowing it. This could be a macro in a spreadsheet, a rule to process emails in your inbox or a morning routine with your smart speaker at home. Project data analytics can build on such macros, rules or routines.
A challenge for some organisations is that they may not know what data they own, what they have rights to, where it is and whether it’s good enough to enable a data-driven approach to project delivery. If that’s your organisation, don’t worry - all organisations have access to sufficient data to make a start. Project data analytics is different from big data, so you don’t necessarily need lots of data and a top-down big budget solution to get you started. Project data analytics can be undertaken on very small data volumes such as <100 rows of data in a risk register. Such data may only be updated every two weeks or more, so that data volumes aren’t that high. Eventually, you could move into big data challenges when you interconnect and correlate data, version control it and feed in data streams for recording project activities. But for those starting out on project data analytics, you are unlikely to be grappling with big data type challenges, to begin with.
There are three tactical approaches. You can look to apply project data analytics on a single project, or you can apply it at enterprise level but on single issue (e.g. risk). Or you could do both! Whichever approach you choose, resist the temptation to go for predictive analytics initially as that requires machine learning, underpinned by a more strategic approach.
Identify opportunities to deploy solutions on a pilot basis. Identify and develop advocates, working with senior project leaders to facilitate data access and experimentation. Leverage existing community driven solutions such as from Project:Hack, tailoring to your business rather than starting from scratch.
Initial solutions at project level could include introducing some simple automation for aspects of the project with high levels of repetitive transactions, e.g. logging, progress chasing, categorising and allocating design queries or autogenerating project updates for specific stakeholder groups. For automation, look for resource intensive activities which are mundane, are error prone or take longer to complete than the timeframe that makes them most useful. To help identify initial solutions at the enterprise level your PMO probably has a backlog of improvement ideas that have either not delivered or were put on the too-hard pile. Alternatively, speak to internal audit who will be able to highlight issues they see on a repeated basis.
Have a look at those as there are likely to be some candidate issues/opportunities where data analytics can help including:
� Reporting - transitioning from PowerPoint reporting to real time dashboards, with integrated supply chain data.
� Automation - from simple progress chasing workflows through to automatically updating disparate corporate systems.
� Risk analytics - how often is the risk register updated? Are the updates substantial? How well are the risks defined? How effective is the management action? Are the risks what you would expect to see for this type of project?
� Schedule variance analytics - how good is the project team at estimating? Which work packages are more predisposed to variance?
MAKING A TACTICAL START
GETTING STARTED IN PROJECT DATA11
Secondly, raise data literacy and awareness. What we have seen is that if you bring in PhD level data scientists into a project delivery organisation and they spend most of their time sorting out data and battling with IT departments, then they’re unlikely to stay around for very long. Although it’s good to take a strategic approach, we would advocate starting off with awareness raising and gaining rudimentary skills before moving to a strategic approach to skills development:
� Upskill your own team in PowerBI or Tableau and begin to make the most of visualising data using dashboards. Ensure that people understand the fundamentals rather than using the capabilities as a glorified charting tool otherwise it will be difficult to scale up.
� Provide key people who have a passion for the topic with an opportunity to advance themselves via structured training. Identify and develop superusers.
� Explore opportunities to deploy automation. Begin with no code or low code solutions, but also consider Python code-based solutions. The latter avoids licensing costs but can result in a higher maintenance burden compared to procuring off-the-shelf automation solutions. Try running localised pilots for automation before sharing across projects and departments.
� Mobilise a local community of practice with people who have expressed an interest in upskilling.
Some organisations have taken this first step by employing third parties who help to illustrate the art of the possible and secure buy in at board level. They tend to get there more quickly, but skills transfer should be considered. Some will address this tactically, addressing
specific pain points and building momentum. Others will take a more strategic approach, underpinned by a roadmap and an organisational champion with responsibility for making things happen.
For practitioners we recommend attending some meetups or joining a hackathon, further details of which can be found at the back of this guide. There are an increasing number of training providers but also consider using Massive Open Online Courses (MOOCs) such as from edx.org, Future Learn, Coursera or Linkedin Learning for upskilling your project teams and PMOs.
Thirdly, showcase what’s possible and then make the case for a strategic approach. Focusing on tactical improvements on an opportunity/pilot basis, driven by the advocates within the business who have a passion for a specific technology enables the organisation to gain a deeper understanding of the capabilities.
Develop a shared pipeline of ideas, working together to drive change. Prioritise the pipeline, focusing on solutions with a tangible business impact that attracts senior management attention and helps to inspire others. Demonstrate the art of the possible, starting small and experimenting with higher-end solutions – making sure to track the benefits. When you have secured a senior sponsor develop the case for a more strategic approach using your own examples of what’s been achieved so far.
MAKING A TACTICAL START
“Start small and iterate – use tactical improvements to create capacity. Build your understanding and that of your team, you’ll steadily see more of what’s possible. Find and grow pioneers and other leaders, then work together to develop your ideas to get senior and strategic support.”
Gareth Parkes, Head of Data & AnalyticsSir Robert McAlpine Ltd
GETTING STARTED IN PROJECT DATA12
Taking a strategic approach means taking an enterprise approach - a proven way to effectively invest in capability is by taking a maturity model approach. We have produced a report that highlights the current use of project data analytics. This section highlights some key considerations of a strategic approach regarding data strategy, data audits, data architecture, skills and embedding it within your organisational culture.
Data strategy
Every project delivery organisation should look at developing a data strategy, irrespective of how immature your understanding of project data analytics is. If you don’t have a strategy, how do you know where you’re heading? Map out a high-level vision and roadmap for change. This is likely to be a multiyear journey that blends short term benefit with longer term improvement and integration of data pipelines. The strategy should also capture any constraints. This will include considerations such as:
� Affordability - does budget exist for additional software, licensing, cloud services, technical support, and training?
� People and culture - how open is your organisation to making data accessible and how will you overcome any barriers? What are the new roles and responsibilities that are needed?
� Governance - will you be allowed to deploy solutions? What constraints will your IT department impose?
� Legacy systems - most organisations won’t be starting from a
blank sheet of paper. Are you locked into legacy solutions? Do the systems talk together via an Application Programming Interface (API) or does the data sit in silos and need to be manually collected or transferred?
� Scope - does the data you capture cover everything about the project that you need to know, or do you have several suppliers, partners, and clients who each hold data required to complete the project jigsaw?
Underpin the strategy with a maturity model so that you can measure progress. Deploying project data analytics should be treated as a change program, it isn’t simply a matter of supplying licences for the latest and greatest tools. Our data advisory group are working in conjunction with WMG on developing a data analytics maturity model which may be able help with this.
TAKING A STRATEGIC APPROACH
“You do have to get into the detail. It’s imperative to understand the question you want to ask of the data, what outcome you want for different users, what processes the data is driving. You also need permission and time to explore, test and iterate. That’s how you get confidence.“
Daniel ByrneInfrastructure and Projects Authority
GETTING STARTED IN PROJECT DATA13
Project management review
Where can project data analytics be deployed to deliver maximum benefit? What are the current performance issues within your project delivery organisation? Are there any areas that have proven particularly stubborn? Your sponsor or senior responsible owner (SRO) and senior project leadership teams will have a clear line of sight to current areas of concern. Gaining early visibility of issues before they catch fire is a major driver for many. There will be an element of chicken and egg; if you don’t know what can be done, you’re likely to artificially constrain your horizons. It’s important to develop an understanding of the art of the possible.
Data health-check or audit
As momentum builds, you can spend more time exploring what data you have, how good it is, what you can do with it and what is missing:
� A positive step forward is to document what data you have and where it’s stored.
� Then assess its quality. Initially you may choose to do this manually on a sample basis. As your skills develop, you’ll introduce data science solutions to automate this process.
� Then perform a gap analysis between the data that you currently have and the benefit that you want to get from it (or the problem statements that you want to answer).
� Then develop a plan to close the gap. � Also develop a data dictionary to help drive commonality.
It can take up to 10 years to gather sufficient data to support high end use cases so the quicker that you start this journey the sooner you’ll realise the benefits. Imagine a world where main contractor A has a deep and comprehensive repository of data and contractor B has a more ad hoc approach. Contractor A will be able to deliver machine learning based insights two-10 years before contractor B; this could seriously impede contractor B’s competitiveness.
There is a correlation between the opportunities/problems that we would like answered, the magnitude of these opportunities/problems (sizing the benefit and disbenefit), the potential solutions and the availability/quality of data. This helps to prioritise which problems to solve first. The Project Data Analytics Task Force solutions development workstream is developing a model to do this at a sector level, allowing organisations to pool resources to solve common problems.
Data architecture and engineering
What is your data ecosystem and how does it all fit together? Does your licencing model encourage small-scale roll outs or is it heavily swayed towards large scale deployment? Will the model enable you to build momentum and develop sufficient integrated solutions to achieve critical mass?
Where will data be saved? How is it permissioned? Do you have a centralised data lake or common data environment? How will GDPR issues be considered? How will you buy compute to train your models? This rapidly gets into the realms of your IT department. But you’ll need to understand how it all fits together so you can operate within it. Some organisational IT departments are enablers to the business, working collaboratively to put the infrastructure in place to enable you to deliver your vision. Others will see their role more in terms of governance and will be focused on protecting the business. You’ll need to gauge how to approach them and set out a plan to win them over. From experience, this could be the biggest challenge for most deployments.
Skills, roles and accountability
The vision will only become a reality if someone is responsible for it, with board level sponsorship. The best approach we have seen is when one person is responsible for developing the strategy, plan and implementation; including securing resources, unblocking issues with IT and identifying advocates who have a passion for driving the change.
TAKING A STRATEGIC APPROACH
GETTING STARTED IN PROJECT DATA14
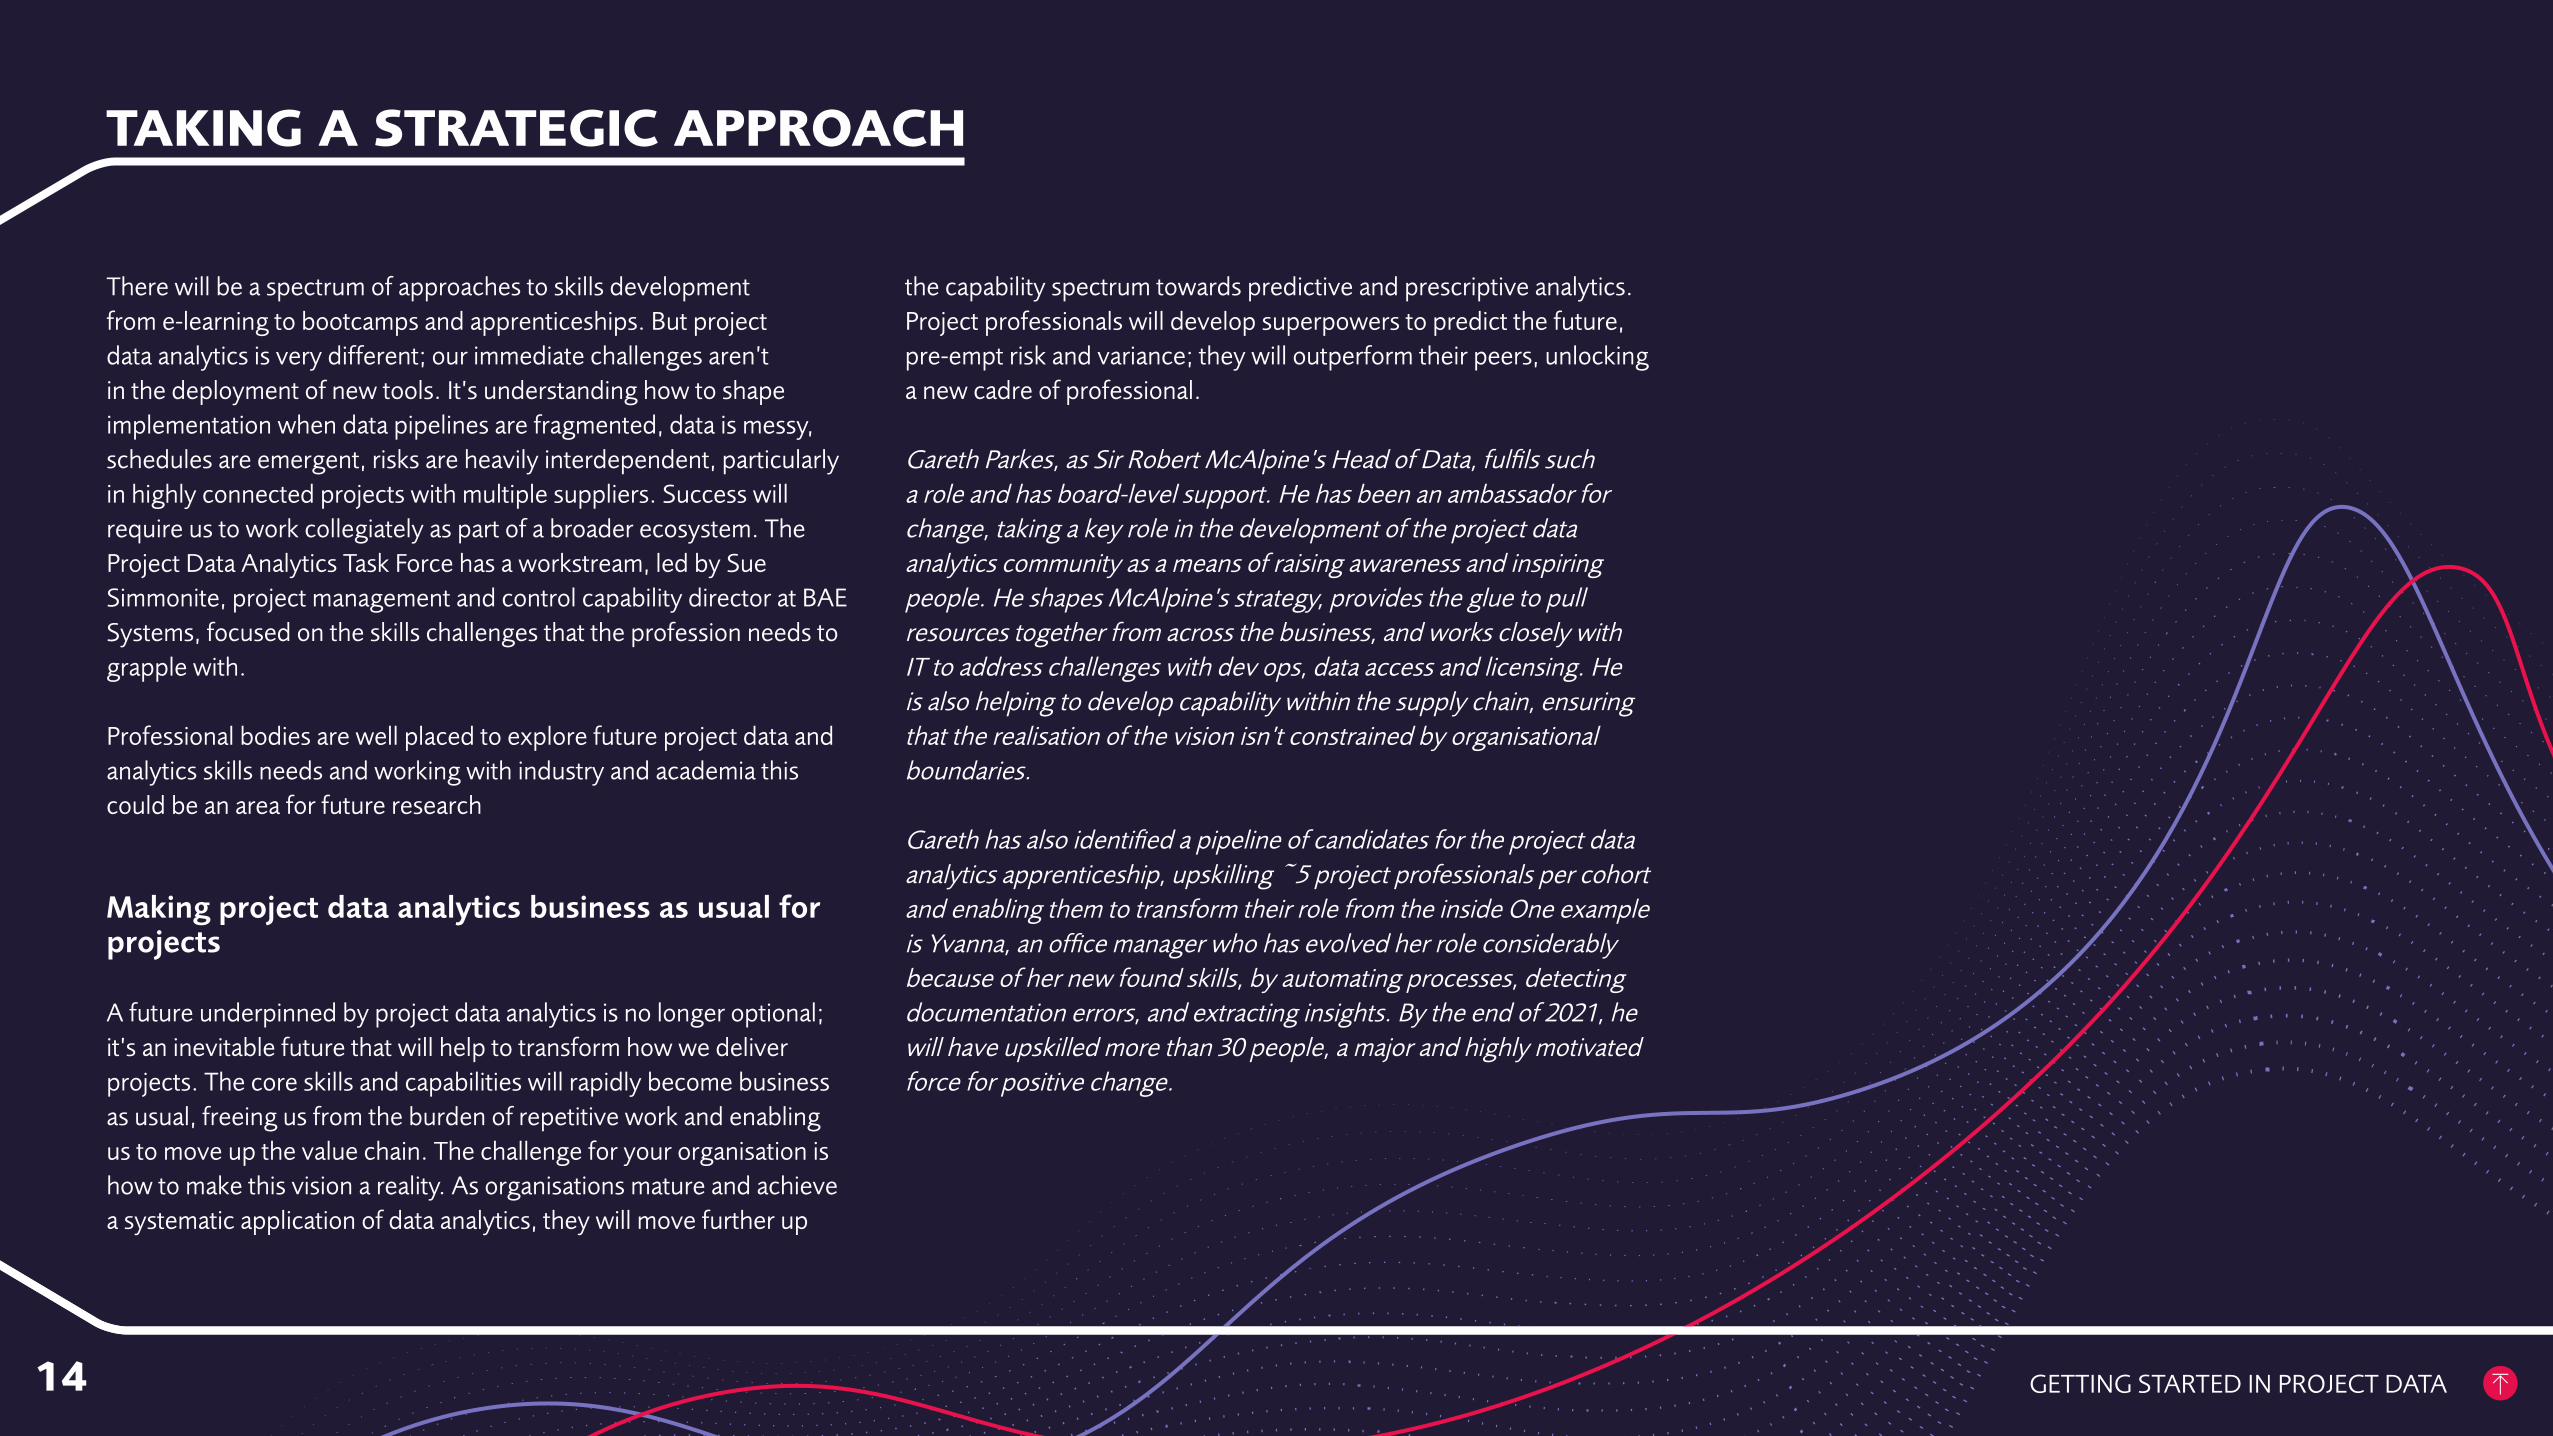
There will be a spectrum of approaches to skills development from e-learning to bootcamps and apprenticeships. But project data analytics is very different; our immediate challenges aren’t in the deployment of new tools. It’s understanding how to shape implementation when data pipelines are fragmented, data is messy, schedules are emergent, risks are heavily interdependent, particularly in highly connected projects with multiple suppliers. Success will require us to work collegiately as part of a broader ecosystem. The Project Data Analytics Task Force has a workstream, led by Sue Simmonite, project management and control capability director at BAE Systems, focused on the skills challenges that the profession needs to grapple with.
Professional bodies are well placed to explore future project data and analytics skills needs and working with industry and academia this could be an area for future research
Making project data analytics business as usual for projects
A future underpinned by project data analytics is no longer optional; it’s an inevitable future that will help to transform how we deliver projects. The core skills and capabilities will rapidly become business as usual, freeing us from the burden of repetitive work and enabling us to move up the value chain. The challenge for your organisation is how to make this vision a reality. As organisations mature and achieve a systematic application of data analytics, they will move further up
the capability spectrum towards predictive and prescriptive analytics. Project professionals will develop superpowers to predict the future, pre-empt risk and variance; they will outperform their peers, unlocking a new cadre of professional.
Gareth Parkes, as Sir Robert McAlpine’s Head of Data, fulfils such a role and has board-level support. He has been an ambassador for change, taking a key role in the development of the project data analytics community as a means of raising awareness and inspiring people. He shapes McAlpine’s strategy, provides the glue to pull resources together from across the business, and works closely with IT to address challenges with dev ops, data access and licensing. He is also helping to develop capability within the supply chain, ensuring that the realisation of the vision isn’t constrained by organisational boundaries.
Gareth has also identified a pipeline of candidates for the project data analytics apprenticeship, upskilling ~5 project professionals per cohort and enabling them to transform their role from the inside One example is Yvanna, an office manager who has evolved her role considerably because of her new found skills, by automating processes, detecting documentation errors, and extracting insights. By the end of 2021, he will have upskilled more than 30 people, a major and highly motivated force for positive change.
TAKING A STRATEGIC APPROACH
GETTING STARTED IN PROJECT DATA15
WHAT TOOLS CAN HELP?
Overview
There are so many different tools available, many providing overlapping services. Some are free, or are already included in your organisation’s licenses. Some can be cheap and quick to deploy, and some can be expensive and take time to deploy at scale. The key is to remember they are tools to help you do a job.
Automated dashboards
This tends to be the place where most organisations start. The barriers to entry are low and the returns on investment are rapid. There’s plenty of online content to enable you to get started and make the transition away from presentations, documents, and spreadsheets.
In larger projects, with lengthy reporting cycles, the report can sometimes be up to two months out of date. The project leadership team then lose confidence in what they’re being told. Dashboards provide an opportunity to move towards real time reporting. But this requires a move towards more advanced data engineering and data pipelines; the end-to-end process from ingesting, integrating, cleaning, processing, and preparing data. It’s likely to require the use of Python and Data Analysis Expressions (DAX) which help with calculations, data integration and error checking.
Experience from more advanced organisations indicates that without an overarching strategy, dashboards will rapidly proliferate, which
become difficult to maintain. Mature organisations are beginning to move away from ‘death by dashboards’ towards role-based insights, with adaptive content based on criticality. If specific data exceeds defined parameters (typically set by the organisation’s PMO) it will be flagged, reported upon and insights will be inferred, rather than providing hundreds of charts all requiring interpretation.
Simply put, project personnel can be guided as to what they should action via automated prompts, rather than searching through multiple dashboards and figuring out what their actions are which is not only time consuming but can be a barrier to people adopting dashboards. The more serious or urgent the prompts are, the higher up the project organisation actions can flow resulting in the right action being undertaken by the right person at the right time. What this all means is that PMO’s have built in levels of assurance and ensuring the weaker members of the project team better understand the expectations set of them.
� Start with simple dashboards � Then drill downs � Then role-based dashboards � Then integrated data pipelines � Then Python and DAX � Then automated triggers to individuals to prompt action
“We wanted to create a single set of central reports that everybody had access to and could trust - sponsors, clients, project, delivery teams, audit teams. We also wanted to make curated datasets available so that we could empower our colleagues to develop their own dashboards and reports that meet their needs. We link the outputs of our reports into the decision-making process. This is important to show people that the effort they’re putting into providing the data is resulting in their concerns being addressed at the right level of the organisation. Be flexible, be prepared to learn new tools, be professionally curious, and look around for inspiration. When we developed our reports, we looked at other people’s reports, but we also looked at websites and apps that people regularly use, so the interface is familiar.“
Milla Mazilu, Network Rail
GETTING STARTED IN PROJECT DATA16
Automation
The next step is to explore how automation can be used to remove the human from the loop of data ingestion and processing. This could include everything from timesheets through to invoice processes. By doing this we release capability for higher value-added activities.
There are a variety of vendors including UI Path, Blue Prism and Microsoft Power Automate. All of which begin with low code solutions, providing a low barrier to entry. This enables users to get going quickly to solve immediate automation needs, tackling low hanging fruit. The short-term benefits can be considerable. This could be a simple workflow, or it could help to integrate disparate corporate tools that don’t speak to each other. The authors have used automation for everything from onboarding apprentices, preparation of contract documentation through to automated naming of BIM files in accordance with a defined standard. The capability becomes more powerful through ‘hyperautomation’ which combines the workflow type automation with machine learning to overcome some of the data structure constraints with robotic process automation. The use cases are vast.
But as the level of ambition increases, the need for governance and training also grows. Some use cases will require the processing of personal data, with GDPR considerations. Others will integrate data from supply chain systems, requiring error checking and automation resilience, particularly where payments are involved. It requires a higher level of skill to build code that is resilient to changes in the location or definition of data.
Getting started with automation:
� Start with something like UI Path or Power Automate. Understand the principles and get a feel for what it can do.
� Experiment with the community editions or free trials. Note that the IT and governance challenges for some organisations may be considerable.
� Deploy simple solutions. � Then investigate how to scale, including addressing licencing
requirements.
App development
With low code solutions the barriers to entry for app developers are largely removed. It’s easy to develop an app to record progress, trackhealth and safety observations, read invoices, track risks or similar.
Although an app is relatively easy to develop, it can take time to integrate the app within the data ecosystem, covering everything from database integration to role-based permissions. It requires a degree of governance. We would advocate the deployment of apps locally within a project team using ‘innovation at the edge’ principles, but as soon as it begins to scale across the organisation or into the supply chain, it requires more careful consideration.
Your IT department will also have a key role to play to ensure that they keep control of the implications of licencing, cloud compute etc.
Ticking the wrong box or leaving computer running over a weekend can rack up hundreds of dollars.
More advanced organisations will use apps as part of a data ecosystem, integrating them into dashboards and other solutions.
WHAT TOOLS CAN HELP?
GETTING STARTED IN PROJECT DATA17
Python
Python is a programming language that provides modules and libraries to process and interpret data. It doesn’t take long to learn, it’s free and there are vast online resources which can be adapted to suit your particular use case. But it helps tremendously if you understand how the code works before cut and pasting it into your own model. Python opens up vast model libraries to provide access to data pipelines, sentiment analysis and machine learning.
There are alternatives to Python such as R, which helps the creation of bespoke dashboards using Shiny. Solutions such as Alteryx offer a drag and drop functionality, removing some of the learning overhead with solutions such as Python. Microsoft also offers drag and drop solutions via its Power Platform. Your personal choice of programming language will probably be constrained by whichever language your colleagues use, so that you can share and develop code.
Have a conversation with your IT department and understand what options are available to you. Then explore the art of the possible. Understand what can be done and how challenging it is. Then start small, experiment and build outwards. If you’re unconstrained, then learn by doing. Develop solutions and use online resources to support you.
Graph databases
We’re starting to see a number of organisations deploy graph databases. These are well suited to a project delivery environment where there’s a high level of connectivity between work packages, functions, risks etc. It’s now possible to model these connections and leverage the database to run complex queries and deploy machine learning algorithms. Work is in train to develop project-based ontologies, which capture concepts and categories in project delivery that shows their properties and the relations between them. The Project Data Analytics Task Force are building, differentiating between the built asset (the digital twin) and how the asset was built (everything from contracts, risk, schedules and resources through to logistics and carbon).
Project management tools
There are a number of software vendors who offer data driven solutions within their project management tool. Some offer integrated platforms, such as Procure, with the intent of providing a one stop shop for project delivery solutions. But organisations will need to wrestle with the overlap between corporate systems, their standard technology (e.g. Microsoft) stack and new platforms. The increasing availability of APIs provide a facility for users to overcome some of these integration challenges, allowing the integration of disparate data
sets; but you’ll need a clear strategy for how your stack of tools will work together. There is also a vast array of niche tools. For example, nPlan has developed a capability to challenge schedule envelopes when the project is sanctioned; a work package level version of reference class forecasting. Nodes and Links are focusing on resolving the complexity inherent within megaprojects. There are many others such as ones for stakeholder and team sentiment analysis or ones for project assurance insights.
WHAT TOOLS CAN HELP?
GETTING STARTED IN PROJECT DATA18
FREQUENTLY ASKED QUESTIONS
Will automation take over my job?
Our Projecting the Future: The adaptive professional report (APM, 2020), identified that in an era of unprecedented technological, social and environmental change, the project profession will be the profession at the heart of creating and delivering change. To deliver change successfully, project management’s future is as the adaptive profession. In order to do this, project professionals will need to respond to shifting contexts, continuous learning continually, and develop new skills and competencies such as data analytics. Gartner predicts that 80% of today’s project management tasks will be eliminated by 2030, but new ones will emerge. If we no longer have the burden of such tasks there is capacity to work on more value-adding tasks and therefore roles that we enjoy more. These are roles that have yet to materialise, but will help us to unlock a crystal ball to provide predictive insights to shape decision making. Automation may impact your job, but if you adapt and upskill new opportunities will emerge.
Do we need advanced coding skills to deploy project data analytics?
Not to start with. Tools such as the PowerPlatform offer a wealth of capabilities which are promoted as low code solutions. As you gain experience and gain confidence to tackle more sophisticated requirements you will have gained a good understanding of the coding capabilities needed and how to get it.
Can project data analytics works on transformation programmes?
Data analytics can be used on any type of project/programme. The reason there are lots of examples coming from capital programmes, is because of the existing level of data maturity through things such as Digital Twins,
Building Information Modelling (BIM) and project controls tools, so they have been early adopters. But we’re seeing data analytics being used in helping transformation programmes gain a better understanding of stakeholder needs and relationships.
Can data analytics be introduced for in-flight projects or only for those being planned/initiated?
The short answer is both, but the approach may differ. A challenge with in-flight projects may be a lack of data standards across the organisations involved or a lack of understanding of where source data sits. But it doesn’t take long to find and cleanse data using analytical support tools.
Is data analytics expensive to deploy?
That depends on how far and wide you wish to deploy it and what issues/opportunities you’re seeking to address. Getting started may cost you nothing more than some of your own time as you may already have the tools you need. For example, most organisations already use Microsoft products, so it makes sense to have a look at what’s provided within your current licenses, but there are a vast array of alternatives, some of which are open-source.
How is APM addressing the impacts of data analytics on the project profession? We have undertaken a wide variety of activity to raise awareness and understanding of project data analytics and its impact on the profession by:
� convening a Data Advisory Group which brings together a broad range oflikeminded organisations whilst aiming to improve ‘data literacy’ enabling
individuals and organisations to understand how they might be able to make better use of data;
� funding and undertaking research in relation to project data and analytics. This has included the creation of a PDA Pathfinder report, Project Data Analytics: the state of the art and science, led by the WMG and partners which provides a concise overview of project data analytics. Our Dynamic conditions for project success highlighted the importance of project data and technology identifying this as one of its nine dynamic conditions for organisational success. We have sponsored three ongoing research fund projects around project data analytics which are due to be published in spring 2022. More on these can be found on the What is project data analytics webpage below. Our 2021/22 research fund also focusses on project data as one of its two key themes for funding;� producing a broad range of resources around the topic including blogs,
podcasts, events and webinars and a data analysis and storytelling for success e-learning module available for our members. These resources can be accessed at apm.org.uk/resources/what-is-project-management/what-is-project-data-analytics/;� collaborating with partners such as supporting the development of a project
data maturity model being delivered by WMG at the University of Warwick;� working with our Specific Interest Groups (SIGs) and branches to discuss
the PDA developments including the role of data analytics in specialist areas. For example, the Planning Monitoring and Controls (PMC) SIG have created a PDA working group, has set up a PDA sub-group which aims to share data ideas and insights from across organisations. For more information on this please contact Milla at [email protected].

Association for Project Management is incorporated by Royal Charter RC000890 and a registered charity No. 1171112. Principal office as shown.
Ibis House, Regent ParkSummerleys RoadPrinces RisboroughBuckinghamshire HP27 9LE
Tel (UK) 0845 458 1944Tel (int) +44 1844 271 640 Email [email protected] apm.org.uk
Association for Project Management
apmprojectmgmtAPMProjectMgmtAssociationForProjectManagementAssociation for Project Management

![PIPEPHASE Getting Started Guide[1] - baixardoc](https://static.fdokumen.com/doc/165x107/6315b7d1aca2b42b580df6a1/pipephase-getting-started-guide1-baixardoc.jpg)