Geospatial analysis of potential water use, water stress, and eutrophication impacts from US dairy...
13
Geospatial analysis of potential water use, water stress, and eutrophication impacts from US dairy production Marty Matlock a, b, * , Greg Thoma c, d , Eric Cummings b , Jackson Cothren e , Mansoor Leh b , John Wilson e a Department of Agricultural and Biological Engineering, 203 Engineering Hall, University of Arkansas, Fayetteville, AR 72701, USA b Center for Agricultural and Rural Sustainability, 217 Agriculture Building, University of Arkansas, Fayetteville, AR 72701, USA c Ralph E. Martin Department of Chemical Engineering, 3202 Bell Engineering Center, University of Arkansas, Fayetteville, AR 72701, USA d The Sustainability Consortium, Applied Sustainability Center, WCOB 475, University of Arkansas, Fayetteville, AR 72701, USA e Center for Advanced Spatial Technologies, 304 JBHT, University of Arkansas, Fayetteville, AR 72701, USA article info Article history: Received 18 November 2011 Received in revised form 26 April 2012 Accepted 2 May 2012 abstract Water resource impacts from US dairy production include water use (scarcity impacts) and water quality (eutrophication impacts). These impacts are location-specific, depending upon characteristics of the region and watershed where on-farm dairy and feed production occurs. The objectives of this analysis were to evaluate the impact of US on-farm dairy production on water scarcity across the US, and evaluate dairy production’s impact on eutrophication processes within watersheds as well as on the Gulf of Mexico hypoxic zone. The primary water-utilization challenge for dairy producers is irrigation for growing feed rather than on-farm use. Most dairy production in the US does not occur in water stressed areas with the exception of production in some western states. The potential impacts on local (P pollution) and regional (N pollution to the Gulf of Mexico) watershed eutrophication are more likely to occur from feed production than from on-farm dairy activities. Ó 2012 Elsevier Ltd. All rights reserved. 1. Introduction Water-related impacts are particularly sensitive to spatial vari- ability. Water scarcity is by its nature a local phenomenon; thus, the impact of water use will also be local (Matlock et al., 1999). Simi- larly, water quality impacts have significant local implications, though they can be cumulative under certain circumstances. Therefore, the impacts of dairy production on water resources and quality are dependent on the location of the production facility (Matlock et al., 1999). Conventional life cycle assessment does not explicitly consider spatial variables in the inventory or impact assessment process (Reap, Roman, Duncan, & Bras, 2008). A geo- spatial assessment is necessary to evaluate these impacts. 1.1. Water resources management Water resource demand in a region is generally characterized by the drainage area (Gleick, 1996). Water resources include surface water (streams, rivers, lakes, and reservoirs) and groundwater (ri- parian and geologic). Most hydrologic characteristics (timing and magnitude of water availability) that define water resources are contained geographically within a drainage area; the exception is geologic groundwater. Geologic groundwater includes water from geologic strata that are not directly connected to a water body. Riparian groundwater resources are those that are directly con- nected to a stream, river, or lake through a saturated subsurface conveyance. Management from the watershed level allows the manager and ecological engineer to consider factors beyond chemical pollution in protecting water quality, including habitat destruction, geo- morphologic changes, and changes in land use (Ludwig, Matlock, Haggard, Matlock, & Cummings, 2008; Matlock et al., 1994). For programmatic proposes and uniformity, watersheds are often delimited by government agencies. In the United States, the Natural Resources Conservation Service and the United States Geological Survey (USGS) delineate watersheds in a hierarchical scheme with sub-watersheds nested inside watersheds inside larger drainage basins. These delineations are referred to as hydrologic units, and each is identified by a hydrologic unit code (HUC). Data are avail- able from many government databases describing HUC areas (www.nationalatlas.gov). In the US, there are six levels of delinea- tion, with smaller HUCs nested within larger units (Watermolen, 2006). In order of descending area, the HUCs divide the country into 21 hydrologic regions, 222 sub-regions, 352 accounting units, * Corresponding author. Tel.: þ1 479 575 2849. E-mail address: [email protected] (M. Matlock). Contents lists available at SciVerse ScienceDirect International Dairy Journal journal homepage: www.elsevier.com/locate/idairyj 0958-6946/$ e see front matter Ó 2012 Elsevier Ltd. All rights reserved. http://dx.doi.org/10.1016/j.idairyj.2012.05.001 International Dairy Journal 31 (2013) S78eS90
Transcript of Geospatial analysis of potential water use, water stress, and eutrophication impacts from US dairy...

at SciVerse ScienceDirect
International Dairy Journal 31 (2013) S78eS90
Contents lists available
International Dairy Journal
journal homepage: www.elsevier .com/locate/ idairyj
Geospatial analysis of potential water use, water stress,and eutrophication impacts from US dairy production
Marty Matlock a,b,*, Greg Thoma c,d, Eric Cummings b, Jackson Cothren e,Mansoor Leh b, John Wilson e
aDepartment of Agricultural and Biological Engineering, 203 Engineering Hall, University of Arkansas, Fayetteville, AR 72701, USAbCenter for Agricultural and Rural Sustainability, 217 Agriculture Building, University of Arkansas, Fayetteville, AR 72701, USAcRalph E. Martin Department of Chemical Engineering, 3202 Bell Engineering Center, University of Arkansas, Fayetteville, AR 72701, USAd The Sustainability Consortium, Applied Sustainability Center, WCOB 475, University of Arkansas, Fayetteville, AR 72701, USAeCenter for Advanced Spatial Technologies, 304 JBHT, University of Arkansas, Fayetteville, AR 72701, USA
a r t i c l e i n f o
Article history:Received 18 November 2011Received in revised form26 April 2012Accepted 2 May 2012
* Corresponding author. Tel.: þ1 479 575 2849.E-mail address: [email protected] (M. Matlock)
0958-6946/$ e see front matter � 2012 Elsevier Ltd.http://dx.doi.org/10.1016/j.idairyj.2012.05.001
a b s t r a c t
Water resource impacts from US dairy production include water use (scarcity impacts) and water quality(eutrophication impacts). These impacts are location-specific, depending upon characteristics of theregion and watershed where on-farm dairy and feed production occurs. The objectives of this analysiswere to evaluate the impact of US on-farm dairy production on water scarcity across the US, and evaluatedairy production’s impact on eutrophication processes within watersheds as well as on the Gulf ofMexico hypoxic zone. The primary water-utilization challenge for dairy producers is irrigation forgrowing feed rather than on-farm use. Most dairy production in the US does not occur in water stressedareas with the exception of production in some western states. The potential impacts on local (Ppollution) and regional (N pollution to the Gulf of Mexico) watershed eutrophication are more likely tooccur from feed production than from on-farm dairy activities.
� 2012 Elsevier Ltd. All rights reserved.
1. Introduction
Water-related impacts are particularly sensitive to spatial vari-ability. Water scarcity is by its nature a local phenomenon; thus, theimpact of water use will also be local (Matlock et al., 1999). Simi-larly, water quality impacts have significant local implications,though they can be cumulative under certain circumstances.Therefore, the impacts of dairy production on water resources andquality are dependent on the location of the production facility(Matlock et al., 1999). Conventional life cycle assessment does notexplicitly consider spatial variables in the inventory or impactassessment process (Reap, Roman, Duncan, & Bras, 2008). A geo-spatial assessment is necessary to evaluate these impacts.
1.1. Water resources management
Water resource demand in a region is generally characterized bythe drainage area (Gleick, 1996). Water resources include surfacewater (streams, rivers, lakes, and reservoirs) and groundwater (ri-parian and geologic). Most hydrologic characteristics (timing and
.
All rights reserved.
magnitude of water availability) that define water resources arecontained geographically within a drainage area; the exception isgeologic groundwater. Geologic groundwater includes water fromgeologic strata that are not directly connected to a water body.Riparian groundwater resources are those that are directly con-nected to a stream, river, or lake through a saturated subsurfaceconveyance.
Management from the watershed level allows the manager andecological engineer to consider factors beyond chemical pollutionin protecting water quality, including habitat destruction, geo-morphologic changes, and changes in land use (Ludwig, Matlock,Haggard, Matlock, & Cummings, 2008; Matlock et al., 1994). Forprogrammatic proposes and uniformity, watersheds are oftendelimited by government agencies. In the United States, the NaturalResources Conservation Service and the United States GeologicalSurvey (USGS) delineate watersheds in a hierarchical scheme withsub-watersheds nested inside watersheds inside larger drainagebasins. These delineations are referred to as hydrologic units, andeach is identified by a hydrologic unit code (HUC). Data are avail-able from many government databases describing HUC areas(www.nationalatlas.gov). In the US, there are six levels of delinea-tion, with smaller HUCs nested within larger units (Watermolen,2006). In order of descending area, the HUCs divide the countryinto 21 hydrologic regions, 222 sub-regions, 352 accounting units,

M. Matlock et al. / International Dairy Journal 31 (2013) S78eS90 S79
and 2150 cataloging units. Parts of the country are further delin-eated into watersheds and sub-watersheds.
A hydrologic region is defined by a two-digit HUC and may bethe drainage basin of amajor river, like the UpperMississippi, or thecombined drainage area of several rivers, such as New England.Hydrologic sub-regions divide regions and include the area drainedby a river system, a section of a river and its tributaries in that reach,a closed basin or basins, or a group of streams forming a coastaldrainage area (Watermolen, 2006). Sub-regions are defined by afour-digit HUC. The first two digits are the same as the largerregional HUC, and the last two define the sub-region. Accountingunits, or basins, subdivide the sub-regions. They are used by theUSGS for managing national water data (Watermolen, 2006). Ac-counting regions are defined by a six-digit HUC. The last two digitsof the HUC are the accounting unit; the preceding digits describethe region and sub-region. The most common scale for waterresource analysis, and the scale used in this project, is the hydro-logic accounting region (HAR, or six-digit HUC).
1.2. Water supply stress index (WaSSI)
Approximately 70% of the world’s freshwater withdrawals arefor agricultural use (irrigation and livestock) (FAO, 2010). There areother competing demands for water resources locally and region-ally. These include commercial, domestic, industrial, mining, andthermoelectric uses. Understanding the current and potentialfuture demand for water across each demand sector is critical foranticipating stress caused by shortages. Numerous strategies foranalyzing water stress have been developed. The commonapproach to analyzing water stress is to divide demand by avail-ability (Sun, McNulty, Moore Myers, & Cohen, 2008). The resultingindex is a measure of the proportion of water resources that havebeen allocated or are being used relative to the availability of waterresources. For this project the Water Supply Stress Index (WaSSI)developed by Sun et al. (2008) was selected, as it provides highgeographic resolution for the United States.
1.3. Eutrophication
Eutrophication is the process of water quality degradationassociated with nutrient pollution to a water body (Matlock,Matlock, Storm, Smolen, & Henley, 1998; Sharpley, Kleinman,McDowell, Gitau, & Bryant, 2002). Nutrient pollution can comefrom agricultural, industrial, and municipal sources. Agriculturalnutrient pollution generally comes from field and farm runoff, andthus is considered a non-point source load. Dairies with herd sizesgreater than 700 mature dairy cows or 1000 total head (federalmandated minimum) are required to have National PollutantDischarge Elimination System (NPDES) permits under the CleanWater Act for discrete discharges, mostly from animal waste treat-ment systems. State agency regulations can be more strict thanfederal rules. Municipal and industrial nutrient pollution is gener-ally limited to point source discharges, permitted under the NPDESprogram. Industries can have non-point loads from storm waterrunoff, but these are increasingly regulated under the NPDES permitprogram. These loads can vary widely, depending on the history,size, and location of the discharge facilities. Non-point source loadsare driven by rainfall and runoff events, while point source loads areoften continuous discharges. Determining the allocation of theproportional impact of point and non-point source nutrient loads isvery complex. The degree of eutrophication from those nutrientloads depends on avariety of local variables, including other sourcesof nutrients, sensitivity of the aquatic ecosystem to nutrients, andother impacts on streams such as riparian zone destruction andhydrologic regime alteration (Matlock et al., 1998).
1.4. Objectives
The purpose of this study was to analyze the impact of dairyproduction in the United States on water resources and eutrophi-cation due to location of production activities. Because the deter-mination of background agricultural impacts in individualwatersheds is based onmeasured data and not attributed to specificsources, this is a semi-quantitative analysis of relative impacts on aregional basis. Because of the large uncertainties associated withmuch of the data the absolute values of water use and nutrient lossshould be viewed with the appropriate understanding that they areapproximations made for comparisons at large spatial scales. Thisanalysis includes qualitative assessments of direct water use bydairy production facilities, water stress associated with dairy pro-duction, and eutrophication potential resulting from direct and in-direct activities of dairy producers. The objectives were to evaluatethe relative impact of US dairy production on water scarcity withinwatersheds across the US, to evaluate the potential for US dairyproduction to contribute to eutrophication processes within wa-tersheds, and to evaluate the relative impact of US dairy productionin the Mississippi River Basin on the Gulf of Mexico hypoxic zone.
2. Approach and methods
The approach used to determine the qualitative potential impactof dairy production in the US on water resources, water stress, andeutrophication is described in this section. The common strategieswere to develop an inventory of input data by HAR and calculateimpact using a process-based analysis. Dairy production waterresource impacts were aggregated to HAR scale using an area-weighted average approach.
2.1. Watershed boundary dataset
TheWatershed Boundary Dataset (WBD), defined by the USGS as“a complete digital hydrologic unit national boundary layer compiledat the sub-watershed (12-digit) level”, was used to define HARs forthis analysis. According to the metadata “the data consists of geo-referenced digital data and associated attributes created in accor-dancewith the FGDC (Federal Geographic Data Committee) Proposal,Version 1.0 e Federal Standards For Delineation of Hydrologic UnitBoundaries3/01/02”. Polygons in thedataset containuniquecodes foridentifying watersheds and their derivatives. This dataset wasdeveloped by National Resource Conservation Services “for water-resource management and planning activities, particularly for site-specific and localized studies requiring a level of detail provided bylarge-scalemap information.” (USDA, 2011a). The six digit HUCswereused as the geographical computational elements for this assessment.
2.2. Water resources
The USGS provides water supply and use for the US within HARsevery five years (Kenny et al., 2009). This dataset provides values forwater use in millions of gallons per day (MGD) at the eight-digitHUC level and subdivided into eight separate sectors includingirrigation and livestock. The 2005 estimates (Kenny et al., 2009)were aggregated to the six digit level and converted tomillion cubicmeters (Mm3) per day for use in this analysis (Fig. 1).
2.3. United States department of agriculture (USDA) census ofagriculture
The Census of Agriculture is described by the USDA as “theleading source of facts and figures about American agriculture.Conducted every five years, the Census provides a detailed picture

Fig. 1. United States hydrologic accounting regions with USGS estimated total water use (Mm3 per Day) (Data modified from: Kenny et al., 2009).
M. Matlock et al. / International Dairy Journal 31 (2013) S78eS90S80
of US farms and ranches and the people who operate them. It is theonly source of uniform, comprehensive agricultural data for everystate and county in the United States.” (USDA, 2011b). Dairy cattleare differentiated from beef cattle in the report. The 2002 year datafrom the 2007 Census of Agriculture was used to estimate dairycowdensity and corn grain and silage production at county levels inthe US (USDA, 2009a). The 2002 year data was used to more closelymatch other datasets in the analysis which ranged from 1992 to2005. County geospatial files were obtained from United StatesCensus files (U.S. Census Bureau, 2002).
Fig. 2. United States hydrologic accounting regions with dairy h
2.3.1. Allocation of dairy cows to watershed boundariesIn order to report dairy cattle contributions to processes within
HARs, data were aggregated from county to HAR using an area-weighted approach (Fig. 2). Dairy cattle population at the countylevel was extracted from the 2007 Census of Agriculture (USDA,2009a). In counties where the total number of milk cows wasbelow a certain threshold, the USDA did not report the number ofmilk cows per farm to preserve the privacy of the producer. Inthese cases, the number of milk cows per farm was estimatedusing the state average of milk cows per farm. Estimates were
erd population (Data modified from: USDA, 2009a, 2009b).

M. Matlock et al. / International Dairy Journal 31 (2013) S78eS90 S81
required in approximately 5% of the counties throughout the studyarea. Dairy cow populations for each HAR were calculated using anarea weighted approach where an even distribution of dairypopulation was assumed across each county (head per unit area).For each HAR, the area of each county within the HAR wascalculated and multiplied by the dairy cow density (head per unitarea) for the county. The resulting values were then summed forthe HAR to determine the total dairy cow population. These valuesincluded only first-calf heifers, mature cows, and dry cows. Ac-cording to USDA herd demographic estimates this accounts foronly 51.92% of the actual dairy herd, which includes bulls, calves,and un-bred heifers. To account for this, the population in eachHAR was divided by 0.5192 to determine a total dairy herd finalvalue.
2.3.2. Calculation of annual water use by dairy operations per HARAnnual water use by dairy production facilities was calculated
using an annual water use rate of 42 m3 per year per head. Thiswas applied to the entire herd, not just milking cows. The value of42 m3 per year per head was determined by using estimatedaverage consumption of water by dairy herd demographic groups.This value was arrived at using the following method which takesinto account differences in consumption values between differentlife and production stages of the dairy herd population. Theaverage demographic group consumption values were multipliedby the total population of the demographic group then summedacross the groups to find the total consumption value. This valuewas doubled to account for non-consumptive uses of water inproduction (flush, wash, etc.) then divided by the total herdpopulation to obtain average herd water use per head. Manydetailed variables such as heat stress were not considered due tolack of data. This was conducted on population values for fiveseparate regions, and the average of these five regions used.Average demographic consumption values and doubling for non-consumptive uses were approximations based on values fromthe “Estimating Water Use for Dairy Operations” spreadsheet(Ishler, 2011).
Fig. 3. Water Supply Stress Index (WaSSI) for hydrologic accounting regions, with dairy prdairy cows in that HAR) (Data modified from: Sun et al., 2008 and USDA, 2009a, 2009b).
2.4. The water supply stress index (WaSSI)
Anthropogenic (human-derived) water supplies are those thatare managed and used to support human activities. These aredifferentiated from environmental water supplies, which supportecosystem services and functions. McNulty, Sun, Cohen, and MooreMyers (2007) and Sun et al. (2008) developed the Water SupplyStress Index (WaSSI) to quantitatively assess the relative magnitudeof anthropogenic and environmental water supply and demand(Eq. (1)):
WaSSIx ¼ WDx=WSx (1)
where WDx is water demand from anthropogenic sector x, andWSxis water supply from anthropogenic and/or environmental sector x.The WaSSI can be used to determine current, historic, and futurewater supply and/or demand from environmental and anthropo-genic sectors. Water demand and supply has been calculated foreach 8-digit HUC watershed in the United States (Sun et al., 2008).The WaSSI model was used to determine the water stress index forHARs as defined in this study (Fig. 3). The initial analysis by Sunet al. (2008) was performed at the eight digit HUC level. Theseanalyses were aggregated to the six digit HUC level HAR andreanalyzed from data provided by the developers of the WaSSImodel (G. Sun and S. McNulty, personal communications, July,2010). WaSSI is unique from other water availability measurementtools in that it factors in anthropogenic water demand. Therefore, itis possible to have areas with high annual levels of precipitation tohave a high WaSSI value. Though unique, it is basic in principle andis similar to most current strategies to measure water stress byusing a ratio of demand to supply. The transition to water stressoccurs at 0.2 and from stress to scarce at 0.4.
Sun et al. (2008) analyzed scenarios for water supply stress inthe US using two climate change models. Both climate projectionswere derived from transient global climate models and are widelyused by the climate change research community (McNulty et al.,2007). The Hadley Climate Scenario Model (HadCM2Sul)
oduction density represented by randomly located dots (one dot equals 2,000 head of

M. Matlock et al. / International Dairy Journal 31 (2013) S78eS90S82
predicted that by 2020, the region east of the Mississippi River willexperience up to 20% increase in annual precipitation whencompared with the average historic climate (1985e1993). TheHadleymodel predicted that areas west of theMississippi River willexperience a decrease in annual precipitation of up to 10% and anincrease in air temperature (>0.5 �C). In contrast, the Climate andGlobal Change General CirculationModel (CGC1) predicts that mostof the southern US will have a 10% decrease in annual precipitationand a larger increase in average annual air temperature in northernparts of the country by 2020. The impact of both model scenariosand increasing urban demand were simulated in this analysis todetermine potential increases in water scarcity in important dairyregions.
2.5. Eutrophication
Eutrophication is the direct result of nutrient loads to waterbodies (Sharpley et al., 2002). As indicated previously, the impact ofnutrient loads is both local and regional; phosphorus (P) loads in-fluence eutrophication in freshwater systems (Ludwig et al., 2008),while nitrogen (N) loads influence eutrophication in estuaries likethe Gulf of Mexico (Sharpley et al., 2002). Estimating the impact ofdairy farms on eutrophication required an inventory of nutrientsources and impact assessment for nutrient loads. Nutrient loadswere estimated from relative N and P loads at two scales: 1) theHAR level and 2) the Mississippi River Basin (MRB). The impact ofthose loads was qualitatively evaluated by calculating the relativeamount of N and P delivered from each HAR to theMississippi Riverestuary, where the presumed impact was manifested in low oxygenin the Gulf of Mexico.
2.5.1. Estimation of nutrient loads for each HAR using SPARROWThe results of a 2008 USGS study utilizing the SPARROW
(SPAtially Referenced Regressions On Watershed Attributes) modelwere used to characterize spatial and categorical sources of N and Pfrom HARs within the Mississippi River Basin (Alexander et al.,2008). SPARROW is a watershed modeling technique based on ahybrid statistical and process-based approach to estimate sourcesand contaminant transport in watersheds and surface waters(Schwarz, Hoos, Alexander, & Smith, 2006). The method wasdesigned to reduce the problems of data interpretation caused bysparse sampling, network bias, and basin heterogeneity (Smith,Schwarz, & Alexander, 1997). Statistically based relations betweenstream-water quality and environmental factors such as contami-nant sources, land-surface characteristics, and in-stream contami-nant losses were considered (Schwarz, Smith, Alexander, & Gray,2005). The Alexander et al. (2008) study standardized loads to1992 land use conditions and mean annual flow from the period of1975e2000. Accuracy of the model for unmonitored reaches wasgiven as 55e76% of the mean value. This represented higher ac-curacy than previous SPARROWmodels, and makes this dataset thebest available for large scale comparative analysis. Loads wereaggregated to the HAR level through summation of the loads foreach 8 digit HUC. This analysis was limited to the Mississippi RiverBasin because this was the only basin with SPARROW modelingcompleted. SPARROW models are currently being developed for allregions in the US except California and the US Southwest. Theseshould be completed by the end of 2012, and will support a morecomprehensive analysis.
2.5.2. Estimation of dairy production contribution of nutrient loadsat the HAR scale
The proportion of nutrient loads from each HAR attributable todairy production was estimated by making a series of broad as-sumptions about agricultural non-point source loads of N and P.
Incremental dairy loads at the HAR scale were estimated using theamount of nutrients (N and P) excreted by an average animal eachyear multiplied by the number of animals in each HAR. Manurenutrient excretion values were obtained from USDA research(Gollehon et al., 2001). Nitrogen from cows in confined manage-ment operations was multiplied by 0.4 to account for manuremanagement reductions, and all manure nutrients were multipliedby to 0.1 as the land-applied runoff coefficient. The value of 0.4came from the ratio of excreted N to available N in the Gollehonet al. (2001) dataset. The value of 0.1 was an average estimatefrom the wide range of potential nutrient transport values, whichcan range from 0 to 0.9 (Johnes, 1996), and the necessity ofsimplicity in calculations in this screening analysis. While this maybe a low estimate in some instances, the streamlined nature of thisanalysis provides comparative utility despite the absence of site-specific fate and transport analysis.
2.5.3. Estimation of nutrient loads from each HAR from corn grainand silage
The inventory of nutrients from feed (predominantly corn andsilage) were estimated bymultiplying the bushels of corn and silageproduced in each HAR by the application rate per bushel andassuming a field loss rate of 10%. Corn grain and silage yields wereadjusted to the HARs from county level data (USDA, 2009a). Cropyields (m3 for corn and kg for silage) for each HAR were calculatedusing an area weighted approach, where an even distribution oftotal corn or silage productionwas assumed across each county (m3
or kg per unit area). For each HAR, the area of each county withinthe HAR was calculated and multiplied by the crop productiondensity (m3 or kg per unit area) for the county. The resulting valueswere then summed for the HAR to determine the total crop pro-duction (m3 or kg). The fertilizer application rates assumed for cornwere 38 kg N per m3 per hectare and 11 kg P per m3 per hectare (1.2and 0.34 pounds N and P respectively per bushel corn yield peracre). The fertilizer application rates assumed for silage were0.01 kg N per kg per hectare and 0.003 kg P per kg per hectare (10.4and 3.0 pounds N and P respectively per ton silage yield per acre).These nutrient application rates were developed as national aver-ages from reported rates of application (Brown, Hart, Horneck, &Moore, 2010; Dahnke, Fanning, & Cattanach, 1992; Davis &Westfall, 2009). Spatial allocation of corn grain and corn silageused for dairy feed was beyond the scope of this analysis. Estimatesof the percent of corn grain and silage use for feed by dairy pro-duction based on average national dairy feed rations (Thoma et al.,2013), as well as national level data on milk production and cropproduction (USDA, 2009b), were approximately 4% of corn grainand approximately 55% of corn silage. However, given the complexnature of corn distribution, geographic correlation between cornproducing watershed and dairy use of corn and silage for feed wasnot possible with this analysis. Therefore results of this crop anal-ysis are presented as total loads even though dairy use only con-stitutes 4% of corn grain and 55% of corn silage production on anannual basis.
2.5.4. Estimation of nutrient loads delivered from each HAR to theGulf of Mexico
Only a portion of the nutrients that leave each HAR reach theGulf of Mexico. Nutrients continue to cycle in the aquatic envi-ronment and can be deposited in sediments (Chaubey, Sahoo,Haggard, Matlock, & Costello, 2007; Ludwig et al., 2008; Matlocket al., 1998). The nutrient loads for each HAR from each source(total, dairy production, corn, and silage) were multiplied by theSPARROW Gulf Transport Ratio. This ratio was determined bydividing the delivered load by the incremental load of each nutrientfrom the SPARROW data (Alexander et al., 2008).
M. Matlock et al. / International Dairy Journal 31 (2013) S78eS90 S83
3. Results and discussion
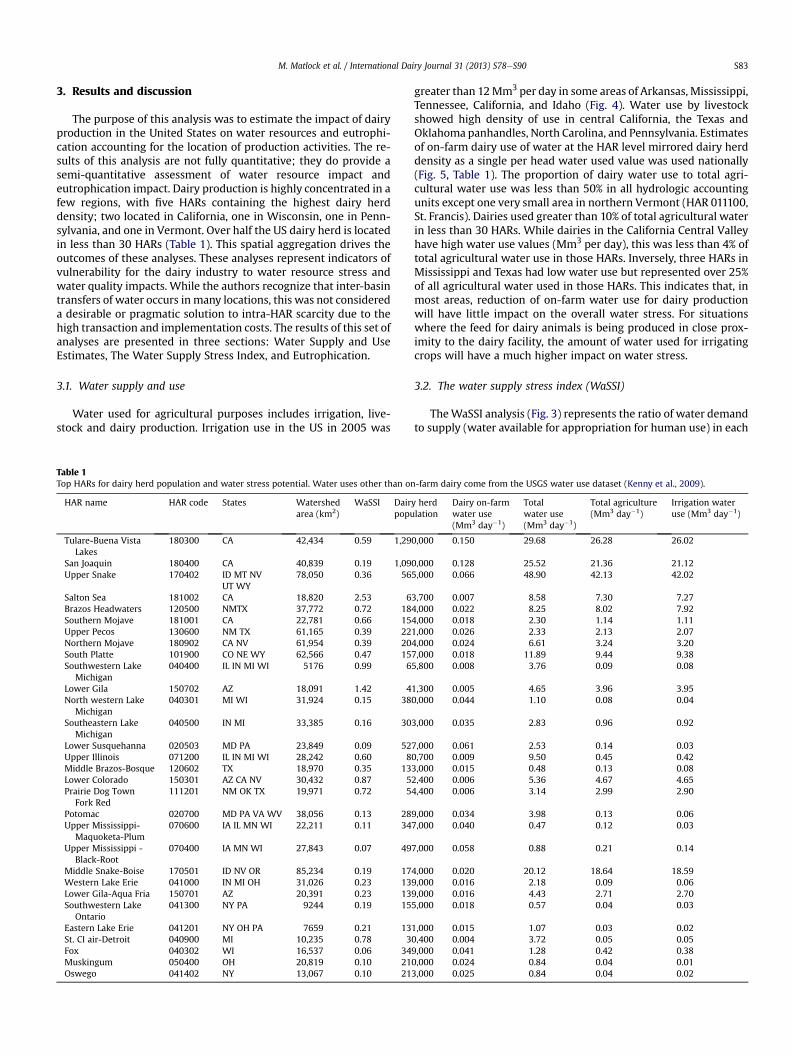
The purpose of this analysis was to estimate the impact of dairyproduction in the United States on water resources and eutrophi-cation accounting for the location of production activities. The re-sults of this analysis are not fully quantitative; they do provide asemi-quantitative assessment of water resource impact andeutrophication impact. Dairy production is highly concentrated in afew regions, with five HARs containing the highest dairy herddensity; two located in California, one in Wisconsin, one in Penn-sylvania, and one in Vermont. Over half the US dairy herd is locatedin less than 30 HARs (Table 1). This spatial aggregation drives theoutcomes of these analyses. These analyses represent indicators ofvulnerability for the dairy industry to water resource stress andwater quality impacts. While the authors recognize that inter-basintransfers of water occurs in many locations, this was not considereda desirable or pragmatic solution to intra-HAR scarcity due to thehigh transaction and implementation costs. The results of this set ofanalyses are presented in three sections: Water Supply and UseEstimates, The Water Supply Stress Index, and Eutrophication.
3.1. Water supply and use
Water used for agricultural purposes includes irrigation, live-stock and dairy production. Irrigation use in the US in 2005 was
Table 1Top HARs for dairy herd population and water stress potential. Water uses other than on
HAR name HAR code States Watershedarea (km2)
WaSSI Dairpopu
Tulare-Buena VistaLakes
180300 CA 42,434 0.59 1,29
San Joaquin 180400 CA 40,839 0.19 1,09Upper Snake 170402 ID MT NV
UT WY78,050 0.36 56
Salton Sea 181002 CA 18,820 2.53 6Brazos Headwaters 120500 NMTX 37,772 0.72 18Southern Mojave 181001 CA 22,781 0.66 15Upper Pecos 130600 NM TX 61,165 0.39 22Northern Mojave 180902 CA NV 61,954 0.39 20South Platte 101900 CO NE WY 62,566 0.47 15Southwestern Lake
Michigan040400 IL IN MI WI 5176 0.99 6
Lower Gila 150702 AZ 18,091 1.42 4North western Lake
Michigan040301 MI WI 31,924 0.15 38
Southeastern LakeMichigan
040500 IN MI 33,385 0.16 30
Lower Susquehanna 020503 MD PA 23,849 0.09 52Upper Illinois 071200 IL IN MI WI 28,242 0.60 8Middle Brazos-Bosque 120602 TX 18,970 0.35 13Lower Colorado 150301 AZ CA NV 30,432 0.87 5Prairie Dog Town
Fork Red111201 NM OK TX 19,971 0.72 5
Potomac 020700 MD PA VA WV 38,056 0.13 28Upper Mississippi-
Maquoketa-Plum070600 IA IL MN WI 22,211 0.11 34
Upper Mississippi -Black-Root
070400 IA MN WI 27,843 0.07 49
Middle Snake-Boise 170501 ID NV OR 85,234 0.19 17Western Lake Erie 041000 IN MI OH 31,026 0.23 13Lower Gila-Aqua Fria 150701 AZ 20,391 0.23 13Southwestern Lake
Ontario041300 NY PA 9244 0.19 15
Eastern Lake Erie 041201 NY OH PA 7659 0.21 13St. CI air-Detroit 040900 MI 10,235 0.78 3Fox 040302 WI 16,537 0.06 34Muskingum 050400 OH 20,819 0.10 21Oswego 041402 NY 13,067 0.10 21
greater than 12Mm3 per day in some areas of Arkansas, Mississippi,Tennessee, California, and Idaho (Fig. 4). Water use by livestockshowed high density of use in central California, the Texas andOklahoma panhandles, North Carolina, and Pennsylvania. Estimatesof on-farm dairy use of water at the HAR level mirrored dairy herddensity as a single per head water used value was used nationally(Fig. 5, Table 1). The proportion of dairy water use to total agri-cultural water use was less than 50% in all hydrologic accountingunits except one very small area in northern Vermont (HAR 011100,St. Francis). Dairies used greater than 10% of total agricultural waterin less than 30 HARs. While dairies in the California Central Valleyhave high water use values (Mm3 per day), this was less than 4% oftotal agricultural water use in those HARs. Inversely, three HARs inMississippi and Texas had low water use but represented over 25%of all agricultural water used in those HARs. This indicates that, inmost areas, reduction of on-farm water use for dairy productionwill have little impact on the overall water stress. For situationswhere the feed for dairy animals is being produced in close prox-imity to the dairy facility, the amount of water used for irrigatingcrops will have a much higher impact on water stress.
3.2. The water supply stress index (WaSSI)
TheWaSSI analysis (Fig. 3) represents the ratio of water demandto supply (water available for appropriation for human use) in each
-farm dairy come from the USGS water use dataset (Kenny et al., 2009).
y herdlation
Dairy on-farmwater use(Mm3 day�1)
Totalwater use(Mm3 day�1)
Total agriculture(Mm3 day�1)
Irrigation wateruse (Mm3 day�1)
0,000 0.150 29.68 26.28 26.02
0,000 0.128 25.52 21.36 21.125,000 0.066 48.90 42.13 42.02
3,700 0.007 8.58 7.30 7.274,000 0.022 8.25 8.02 7.924,000 0.018 2.30 1.14 1.111,000 0.026 2.33 2.13 2.074,000 0.024 6.61 3.24 3.207,000 0.018 11.89 9.44 9.385,800 0.008 3.76 0.09 0.08
1,300 0.005 4.65 3.96 3.950,000 0.044 1.10 0.08 0.04
3,000 0.035 2.83 0.96 0.92
7,000 0.061 2.53 0.14 0.030,700 0.009 9.50 0.45 0.423,000 0.015 0.48 0.13 0.082,400 0.006 5.36 4.67 4.654,400 0.006 3.14 2.99 2.90
9,000 0.034 3.98 0.13 0.067,000 0.040 0.47 0.12 0.03
7,000 0.058 0.88 0.21 0.14
4,000 0.020 20.12 18.64 18.599,000 0.016 2.18 0.09 0.069,000 0.016 4.43 2.71 2.705,000 0.018 0.57 0.04 0.03
1,000 0.015 1.07 0.03 0.020,400 0.004 3.72 0.05 0.059,000 0.041 1.28 0.42 0.380,000 0.024 0.84 0.04 0.013,000 0.025 0.84 0.04 0.02

Fig. 4. United States hydrologic accounting regions with USGS estimates of water use by crop irrigation (Mm3 per day) in 2005 (Data modified from: Kenny et al., 2009).
M. Matlock et al. / International Dairy Journal 31 (2013) S78eS90S84
HAR in the US. The green HARs have water demands less than 20%of supply on an annual basis. The yellow and orange HARs havewater demands between 20 and 40% of supply. The red HARs showareas where water demand exceeds 40% of supply on an annualbasis. For the most part, the results are consistent with commonunderstanding of water scarcity in the US. However, the region ofhigh water stress around Lake Michigan (Wisconsin, Illinois, andIndiana) was unexpected. This area has dense urban land use withhigh municipal and industrial demand. The proximity to LakeMichigan suggests that water stress in this region is the result oflagging infrastructure or model methodology constraints (such as
Fig. 5. United States hydrologic accounting regions with
interbasin transfer), and is not water resource driven. The highstress in the James River Basin in Virginiawas also unexpected. Thisarea is also urbanizing rapidly. The competing demand for waterresources from urban use (industrial, municipal, thermo-electric)will increase in regions with increasing urban population.
3.3. Eutrophication
The impact of dairy production on nutrient loading and eutro-phication at local and regional scales is the result of the densitywithin HARs of dairy herd, crop production, and proximity to the
dairy production on farm water use (Mm3 per day).

Fig. 6. Mississippi River Basin hydrologic accounting regions with corn grain production area ratio.
M. Matlock et al. / International Dairy Journal 31 (2013) S78eS90 S85
Gulf of Mexico, among other things. Dairy herds in the MississippiRiver Basin are most densely concentrated in the Great Lake states(Minnesota, Wisconsin, and Illinois) and Iowa, with some highdensity in Ohio. Corn production is most dense across this northernregion, commonly referred to as the Corn Belt (Fig. 6). More than 20
Fig. 7. Mississippi River Basin hydrologic accounting
HARs had greater than 20% of their area in corn production, withsome greater than 30%. Silage production was shifted west into theDakotas, Nebraska, and Kansas (Fig. 7). The highest proportionalarea for silage production within an HAR was less than 3%. Whilethese numbers are low, much of the silage produced in these HARs
regions with corn silage production area ratio.

Fig. 8. SPARROW model nitrogen delivered annual yield (kg N per km2) to the Gulf of Mexico from the Mississippi River Basin, with dairy herd population indicated by dots (onedot ¼ 2000 head).
M. Matlock et al. / International Dairy Journal 31 (2013) S78eS90S86
goes to feed dairy cattle, while only a small fraction of the cornproduced is destined to be dairy feed. Thus the relative impact ofdairy corn silage on local and regional nutrient loads is notinsignificant.
Fig. 9. SPARROW model phosphorus delivered annual yield (kg P per km2) to the Gulf of Medot ¼ 2000 head).
3.3.1. Local eutrophication impactsIncremental yield of nutrients from each HAR indicated the
potential eutrophication impact on local water bodies. The SPAR-ROW model result for N yield (kg N per km2 HAR) indicated that
xico from the Mississippi River Basin, with dairy herd population indicated by dots (one

Fig. 10. Ratio of on farm dairy production nitrogen load delivered to the Gulf of Mexico to total nitrogen load from SPARROW model.
M. Matlock et al. / International Dairy Journal 31 (2013) S78eS90 S87
most of the highest yielding HARs were proximal to theMississippi,Missouri, and Ohio Rivers, and were in the high density corn HARs.Phosphorus rather than N is generally the limiting nutrient infreshwater systems (Chaubey et al., 2007;Matlock et al., 1998,1999;
Fig. 11. Ratio of corn grain production nitrogen load delivered to th
Sharpley et al., 2002). Incremental P yields (kg P per km2 HAR) weremuch more distributed across the Mississippi River Basin. Phos-phorus is transported predominantly through attachment toeroded soils (Chaubey et al., 2007; Matlock et al., 1999; Sharpley
e Gulf of Mexico to total nitrogen load from SPARROW model.

Fig. 12. Ratio of on farm dairy production phosphorous load delivered to the Gulf of Mexico to total phosphorous load from SPARROW model.
M. Matlock et al. / International Dairy Journal 31 (2013) S78eS90S88
et al., 2002); clearly the P loads from HARs across the MississippiRiver are not as spatially correlated to corn production as N loads.Predominant freshwater eutrophication impacts from dairy pro-duction are spatially associated with P loss in corn and corn silage
Fig. 13. Ratio of corn grain production phosphorous load delivered to th
production rather than dairy herd density. The HARs with thehighest herd density did not have the highest incremental yields ofN or P in their basins, suggesting sources other than runoff fromdairy facilities as the major load source.
e Gulf of Mexico to total phosphorous load from SPARROW model.

M. Matlock et al. / International Dairy Journal 31 (2013) S78eS90 S89
3.3.2. Regional eutrophication impactsThe regional eutrophication impact from dairy production is
best estimated by the amount of N and P reaching the Gulf ofMexico. The SPARROW model predicted relative nutrient contri-butions from each HAR to Gulf loading using a statistical analysis ofobserved data across a broad network of monitoring stations(Fig. 8). The N delivered to the Gulf of Mexico from HARs in theMississippi River Basin is significantly lower than the incrementalyields from the HARs at the point of exit from each basin. SPARROWsimulations of P yield delivered to the Gulf showed the significanceof proximity to the conveyance through major rivers to movesediment and P to the Mississippi River and out to the Gulf (Fig. 9).
The results of the assessment of the impact of dairy productionon nutrients delivered to the Gulf of Mexico relative to the totalsimulated load showed that on-farm dairy production and silageproduction contributed a very small fraction to the total N loads tothe Gulf, while corn production contributed a significant propor-tion of total N loads to the Gulf. Analysis of N loads from on-farmdairy activities (primarily manure application to fields) showedthe HARs with the largest loads contributed less than 0.1% of total Nto the Gulf of Mexico (Fig. 10). Cumulative (from all dairies in theMRB) on-farm dairy impacts to N loading in the Gulf of Mexicowere less than 3% of total loads. The HARs of highest contributionwere those with highest density of herds. Corn production had thehighest impact on Gulf of Mexico N loads (Fig. 11). This analysis of Nloads is for total corn production. The proportion allocated to thedairy industry would be roughly the proportion of feed corn pro-duced that is fed to dairy cattle (about 4% of corn grain, 55% of cornsilage). Corn silage contributions of N loads in the Gulf of Mexicowere estimated to be as much as 50 times lower than that of corn,though much of the load is attributable to dairy production since asignificant portion (55%) of corn silage is fed to dairy cattle.
A different pattern was observed with the impact of dairy pro-duction on P load from HARs relative to total Gulf of Mexico P loads.Analysis of P loads fromon-farm dairy activities (manure applicationto fields) indicated that on-farm manure management couldcontribute up to approximately 3% of total P to the Gulf of Mexico(Fig.12). AswithN, theHARs of highest contributionwere thosewiththe highest density of herds. Corn production showed the highestimpactonGulf ofMexicoP loads (Fig.13). This analysisof P loads is fortotal corn production. The proportion allocated to the dairy industrywould be 4%, the proportion of total yield fed to dairy cattle. Silagecontributions of P loads in theGulf ofMexicowere estimated to be asmuch as 30 times lower than that of corn, althoughmost of this loadis attributable to dairy production since a significant portion of silageis fed to dairy cattle, and those producers who use silage for feed areconcentrated in thewestern region of the upperMRB. These findingssuggest that dairy production would be a small but still significantcontributor of nutrient loads in the Mississippi Basin.
4. Conclusions
The objective of this project was to analyze the impact of dairyproduction in the United States on water resources and eutrophica-tion due to location of production activities. The approach used todetermine the impact of dairy production in the US on water re-sources, water stress, and eutrophication incorporated consistentand, to the extent possible, unbiased assumptions. The conclusionsdrawn from this analysis are broad. The lack of availability ofcomprehensive data from contemporary analysis necessitated theuse of datasets from different years. This adds to the uncertainty ofthe analysis since conditions of hydrology and agricultural produc-tion change on a year to year basis. Despite the inherent uncertaintyof these methods, the resulting analyses are reasonable indicators ofvulnerability of the US Dairy Industry to water resources stress and
eutrophicationpotential. Amore comprehensive analysis, supportedby higher spatially resolved data, could provide a quantitativelyrigorous assessment of these vulnerability indicators. Much of thedata for this study was based on county, state, or national level agstatistics. Resolving these stats to the watershed level resulted in ananalysis at the HUC6 (HAR) level. More spatially resolved data ondairy population and feed stock allocation would allow for an anal-ysis on an 8 or 12 digit HUC level where most water resource issuesare manifested. A more comprehensive analysis of the dairy pro-duction system should include identification of the geographicsources variability of feed rations so that impacts can be properlydistributed, and more detailed watershed-specific input data andmethods to estimate the transport of nutrients from manure appli-cation and crop fertilization. The primary transport mechanisms forN are infiltration and runoff associated with solubilization of nitro-gen fertilizers in water. The primary mechanism for P transport iserosion where P is associated with soil particles.
4.1. Water supply and use estimates
Water scarcity in agricultural production is a regional phe-nomenon, based on climate and agricultural intensity. The majorityof agricultural water use is found in crop irrigation. Current on-farm dairy production water use (Mm3) is less than 0.5% of irriga-tion water use in most HARs. The challenge for dairy producers insustainable water supply appears to be tied to irrigation forgrowing feed rather than on-farm use.
4.2. The water supply stress index (WaSSI)
Most dairy production in the US does not occur inwater stressedareas with the exception of production in some areas of California,Arizona, New Mexico, Texas, Utah, and Idaho. The WaSSI analysisshowed that competing demands for water resources, compoundedwith likely decreases in precipitation in the western US, couldresult in increased regional scarcity. The arid West will likelyexperience significant decreases in precipitation in the comingdecades, resulting in exacerbated scarcity in California, Arizona,NewMexico, Texas, Utah, and Idaho. More significantly for US dairyproduction, the decrease in precipitation in the Great Plains couldresult in reduced yield and production of silage and corn for feed.
4.3. Eutrophication
This analysis of the impacts of dairy productionon eutrophicationfrom the Mississippi River Basin indicated that nutrients have bothlocal and regional impacts. The predominant impacts from N wereassociatedwith cornproduction, andmanifestedat the regional (Gulfof Mexico) scale. The impacts from P on eutrophication were morecomplex; corn produced the largest local and regional loads tostreams, resulting in local potential for eutrophication. On-farmcontributions of P to local streams have the potential to increasethe rate and extent of eutrophication. Where the density of dairyherds is high in awatershed this impact can be significant. However,impact on the Gulf of Mexico from dairy phosphorus is very lowrelative to overall P loads, and relative to stream-level impacts. Theseanalyses are based on assumptions made regarding the aggregationand allocation of data for dairy and on the assumptions used in theSPARROWmodels implemented byUSGS. The quantitative estimatesof loads are less resilient than the relative estimates of loads fromvarious sources. The most effective approach to reducing US dairyproducers’ impact on eutrophicationwould be to reduce N loss fromcorn, reduce sediment loss from fields to reduce P transport, andreduceP loss frommanure applicationon-farm(Chaubeyet al., 2007;Matlock et al., 1999; Sharpley et al., 2002).

M. Matlock et al. / International Dairy Journal 31 (2013) S78eS90S90
Role of the funding source
The funding organizations provided guidance in framing thegoals of the research and developing the suite of manuscripts forsubmittal for publication.
Acknowledgments
This project was funded through a grant from the InnovationCenter for US Dairy and the Dairy Research Institute, Rosemont, IL,and the University of Arkansas Division of Agriculture through theUSDA CRIS Program. The project team would like to acknowledgethe contribution of Dr. David Shonnard (Michigan TechnologicalInstitute) and Zara Neiderman (University of Arkansas). This workwould not have been possible without the vision and leadership ofErin Fitzgerald (Innovation Center for US Dairy) and project supportfrom Ying Wang (Innovation Center for US Dairy).
References
Alexander, R., Smith, R., Schwarz, G., Boyer, E., Nolan, J., & Brakebill, J. (2008). Dif-ferences in phosphorus and nitrogen delivery to the Gulf of Mexico from theMississippi River Basin. Environmental Science & Technology, 42, 822e830.
Brown, B., Hart, J., Horneck, D., & Moore, A. (2010). Nutrient management for fieldcorn silage and grain in the inland Pacific Northwest. [PDF file]. URL. http://www.cals.uidaho.edu/edcomm/pdf/PNW/PNW0615.pdf.
Chaubey, I., Sahoo, D., Haggard, B., Matlock, M., & Costello, T. (2007). Nutrient-retention, nutrient-limitation, and sediment-nutrient interactions in a pasturedominated stream. Transactions of the ASABE, 50, 35e44.
Dahnke, W. C., Fanning, C., & Cattanach, A. (1992). Fertilizing corn grain, popcorn,silage corn, and sweet corn. [WWW page]. URL. http://www.ag.ndsu.edu/pubs/plantsci/soilfert/sf722w.htm.
Davis, J. G., & Westfall, D. G. (2009). Fertilizing corn. [WWW page]. URL. http://www.ext.colostate.edu/pubs/crops/00538.html.
Food and Agriculture Organization (FAO). (2010). AQUASTAT: Water use. [WWWpage]. URL. http://www.fao.org/nr/water/aquastat/water_use/index6.stm.
Gleick, P. H. (1996). Basic water requirements for human activities: meeting basicneeds. Water International, 21, 83e92.
Gollehon, N., Caswell, M., Ribaudo, M., Kellogg, R., Lander, C., & Letson, D. (2001).Confined animal production and manure nutrients. [WWW page]. URL. http://www.ers.usda.gov/Data/manure/default.asp?ERSTab¼2.
Ishler, V. (2011). Estimating water use for dairy operations [spreadsheet file]. URL.http://resources.cas.psu.edu/WaterResources/pdfs/dairywateruse1.xls.
Johnes, P. J. (1996). Evaluation and management of the impact of land use change onthe nitrogen and phosphorous load delivered to surface waters: the exportcoefficient modeling approach. Journal of Hydrology, 183, 323e349.
Kenny, J. F., Barber, N. L., Hutson, S. S., Linsey, K. S., Lovelace, J. K., & Maupin, M. A.(2009). Estimated use of water in the United States in 2005. In U.S. GeologicalSurvey Circular, 1344, 52.
Ludwig, A., Matlock, M. D., Haggard, B., Matlock, M. E., & Cummings, E. (2008).Identification and evaluation of nutrient limitation of periphyton growth inheadwater streams in the Pawnee Nation, Oklahoma. Journal of Ecological En-gineering, 32, 178e186.
McNulty, S. G., Sun, G., Cohen, E. C., & Moore Myers, J. A. (2007). Change in theSouthern U.S. water demand and supply over the next forty years. In W. Ji (Ed.),Wetland and water resource modeling and assessment: A watershed perspective(pp. 43e56). Boca Raton, FL, USA: CRC Press.
Matlock, M. D., Matlock, M. E., Storm, D. E., Smolen, M. D., & Henley, W. J. (1998).Limiting nutrient determination in lotic ecosystems using a quantitativenutrient enrichment periphytometer. Journal of the American Water ResourcesAssociation, 35, 1141e1147.
Matlock, M. D., Storm, D. E., Sabbagh, G. J., Burks, S. L., Smolen, M. D., & Haan, C. T.(1994). An ecological risk assessment paradigm using the spatially integratedmodel for phosphorus loading and erosion (SIMPLE). Journal of AquaticEcosystem Health, 3, 1e8.
Matlock, M. D., Storm, D. E., Smolen, M. D., Matlock, M. E., McFarland, A., & Hauck, L.(1999). Development and application of a lotic ecosystem trophic status index.Transactions of ASAE, 42, 651e656.
Reap, J., Roman, F., Duncan, S., & Bras, B. (2008). A survey of unresolved problems in lifecycle assessment. The International Journal of Life Cycle Assessment, 13, 374e388.
Schwarz, G. E., Hoos, A. B., Alexander, R. B., & Smith, R. A. (2006). The SPARROWsurface water-quality modeldtheory, applications and user documentation.InU.S. geological survey, techniques and methods, Vol. 6, (pp. 248). Reston, VA,USA: U.S. Geological Survey. [PDF file] URL. http://pubs.usgs.gov/tm/2006/tm6b3/PDF.htm.
Schwarz, G. E., Smith, R. A., Alexander, R. B., & Gray, J. R. (2005). Development of aSPARROW model of fluvial sediment for the conterminous United States. InProceedings from: USeChina workshop on advanced computational modelling inhydroscience & engineering. Oxford, MS, USA. [PDF file] URL. http://www.irtces.org/zt/us_China/proceedings/Gray_Man_Revised.pdf.
Sharpley, A. N., Kleinman, P. J. A., McDowell, R. W., Gitau, M., & Bryant, R. B. (2002).Modeling phosphorus transport in agricultural watersheds: processes andpossibilities. Journal of Soil and Water Conservation, 57, 425e439.
Smith, R. A., Schwarz, G. E., & Alexander, R. B. (1997). Regional interpretation ofwater-quality monitoring data. Water Resources Research, 33, 2781e2798.
Sun, G., McNulty, S. G., Moore Myers, J. A., & Cohen, E. C. (2008). Impacts of multiplestresses on water demand and supply across the southeastern United States.Journal of American Water Resources Association, 44, 1441e1457.
Thoma, G., Popp, J., Shonnard, D., Nutter, D., Ulrich, R., Matlock, M., et al. (2013).Greenhouse gas emissions from milk production and consumption in theUnited States: a cradle to grave life cycle assessment circa 2008. InternationalDairy Journal, 31, S3eS14.
United States Census Bureau. (2002). UA census 2000 TIGER/line files [machine-readable data files]. Washington, DC, USA: U.S. Census Bureau. URL. http://www.census.gov/geo/www/tiger/tigerua/ua_tgr2k.html.
United States Department of Agriculture (USDA). (2009a). Table 11: cattle andcalves e inventory and sales: 2007 and 2002 [text version] and Table 9: har-vested cropland by size of farm and area harvested: 2007 and 2002 [textversion]. In National Agriculture Statistics Service (Ed.), Agriculture census 2007,state and county level reports. URL. http://www.agcensus.usda.gov/Publications/2002/index.asp.
United States Department of Agriculture (USDA). (2009b). Milk cows and productionfinal estimates 2003e2007. (Nass statistical Bulletin No. 1022). [PDF] URL. http://usda01.library.cornell.edu/usda/nass/SB988/sb1022.pdf.
United States Department of Agriculture (USDA). (2011a).Water boundary data e 12Digit hydrologic Units. [WWW page]. URL. http://datagateway.nrcs.usda.gov/Catalog/ProductDescription/WBDHU12.html.
United States Department of Agriculture (USDA). (2011b). Census of agriculture eAbout the census. [WWW page]. URL. http://www.agcensus.usda.gov/About_the_Census/.
Watermolen, J. (2006). 1:2,000,000-Scale hydrologic unit boundaries: National atlas ofthe United States. Reston, VA, USA. [WWW page]. URL. http://nationalatlas.gov/articles/water/a_hydrologic.html.