Geophysical exploration for lithological control of arsenic contamination in groundwater in Middle...
11
This article appeared in a journal published by Elsevier. The attached copy is furnished to the author for internal non-commercial research and education use, including for instruction at the authors institution and sharing with colleagues. Other uses, including reproduction and distribution, or selling or licensing copies, or posting to personal, institutional or third party websites are prohibited. In most cases authors are permitted to post their version of the article (e.g. in Word or Tex form) to their personal website or institutional repository. Authors requiring further information regarding Elsevier’s archiving and manuscript policies are encouraged to visit: http://www.elsevier.com/copyright
-
Upload
independent -
Category
Documents
-
view
0 -
download
0
Transcript of Geophysical exploration for lithological control of arsenic contamination in groundwater in Middle...
This article appeared in a journal published by Elsevier. The attachedcopy is furnished to the author for internal non-commercial researchand education use, including for instruction at the authors institution
and sharing with colleagues.
Other uses, including reproduction and distribution, or selling orlicensing copies, or posting to personal, institutional or third party
websites are prohibited.
In most cases authors are permitted to post their version of thearticle (e.g. in Word or Tex form) to their personal website orinstitutional repository. Authors requiring further information
regarding Elsevier’s archiving and manuscript policies areencouraged to visit:
http://www.elsevier.com/copyright
Author's personal copy
Geophysical exploration for lithological control of arsenic contaminationin groundwater in Middle Ganga Plains, India
Subash Chandra a,⇑, Shakeel Ahmed a, E. Nagaiah a, Shashi Kant Singh b, P.C. Chandra b
a National Geophysical Research Institute, Council of Scientific & Industrial Research, Hyderabad, Indiab Central Ground Water Board, Mid Eastern Region, Patna, India
a r t i c l e i n f o
Article history:Received 30 April 2010Received in revised form 6 April 2011Accepted 12 May 2011Available online 24 May 2011
Keywords:GroundwaterArsenic contaminationClaybarrierGeophysical surveysERTTEM
a b s t r a c t
A hydrogeochemical analysis of water samples in Middle Ganga Plains (MGP) revealed patchy occurrenceof arsenic contamination in groundwater with high spatial variability. An integrated study consists ofhydrochemical, 2-d DC resistivity and IP chargeability, and 1-d transient electromagnetic measurements(TEM) was carried out in the Ganga–Son interfluves region, which helped in identifying the contrast inlithological set up in the form of low resistivity (10–25 Om) and high chargeability (5–20 mV/V) claydeposits between the arsenic contaminated and arsenic free aquifers. It revealed that the clay acts as con-trolling factor to the arsenic contamination in the groundwater regime. Knowledge of impermeable claybarrier helps in reducing the uncertainties that exist in the hypothesis of arsenic in groundwater in theMGP, as the clay boundaries inferred from the geophysical interpretations coincide very closely with theboundary of arsenic free and arsenic contaminated groundwater obtained from the water qualityanalysis.
� 2011 Elsevier Ltd. All rights reserved.
1. Introduction
Arsenic (As) contamination in groundwater is of increasingconcern due to its high toxicity. The first arsenic-caused skin prob-lem was diagnosed in Bangladesh in 1995 (Das et al., 1995). Lateron many cases of acute and chronic arsenic poisoning were reportedin various parts of the world (Gray et al., 1989; WHO, 1993; Senesseet al., 1999; Saha, 2003). The deep (�100 m or more) aquifers insouthern Bangladesh (initially free from arsenic contamination,where arsenic in solid phase was not available) started picking upwith time and became arsenicferous with accelerated groundwaterextraction (Muralidharan, 1998; Acharyya et al., 2000; Sambu andWilson, 2008). Slowly, after Bangladesh, the adjacent areas such asWest Bengal in India also switched their water supply from surfacewater to groundwater. Around 10 million additional domestic wellswere installed to provide potable water to over 100 million people(Harvey et al., 2005). The excessive pumping of deep aquifers causedimbalance in the groundwater dynamics and resulted induced leak-age of arsenic contamination from shallow aquifers to the deep aqui-fers. Muralidharan (1998) advocated for construction of deep wellsonly in areas with thick clay layer overlying the deeper aquifer toavoid any vertical leakage and also optimization of the groundwaterwithdrawal.
Subsequently, As contaminations in the groundwater were re-ported from the Middle Ganga Plains (MGP) falling in Jharkhand, Bi-har and Uttar Pradesh (UP) states of India (Chakraborti et al., 2003;Bhattacharjee et al., 2005; Acharyya and Shah, 2007; Shah, 2008;Chandra et al., 2009). UP Jal Nigam, Public Health EngineeringDepartments of Bihar and Jharkhand states and other Ground WaterAgencies have done extensive work analyzing water samples for ar-senic content in 30 districts of Uttar Pradesh and 15 districts of Bi-har. In several areas of these districts, As concentration ingroundwater has been found exceeding the Indian permissible limitof 50 lg/l. As per the recommendation of WHO (1993), the requiredpermissible limit of As concentration in potable water is reduced to10 lg/l. However in absence of an alternate source, the permissiblelimits has been relaxed to 50 lg/l in India (BIS, 2003).
The above fact drew attention of the geoscientists to look intothe probable reasons responsible and provide a sustainable solu-tion for mitigation. There are number of studies in this directionmostly dealing with geochemical aspects of the contaminationand designing of various filters for removal of arsenic (Shen,1973; Cheng et al., 1994; Hering et al., 1996; Joshi and Chaudhuri,2001; Ning, 2002; Hug and Leupin, 2003; Wickramasinghe et al.,2004; Shih, 2005). The sludge coming out of the filter became amatter of great concern as it goes again into the subsurface andadds to the contamination of groundwater regime in the surround-ings. There is a need of a dependable solution to sustainably pro-vide potable water in the arsenic affected regions. It requires a
1474-7065/$ - see front matter � 2011 Elsevier Ltd. All rights reserved.doi:10.1016/j.pce.2011.05.009
⇑ Corresponding author. Tel.: +91 40 23434711x2644; fax: +91 40 23434651.E-mail addresses: [email protected], [email protected] (S. Chandra).
Physics and Chemistry of the Earth 36 (2011) 1353–1362
Contents lists available at ScienceDirect
Physics and Chemistry of the Earth
journal homepage: www.elsevier .com/locate /pce
Author's personal copy
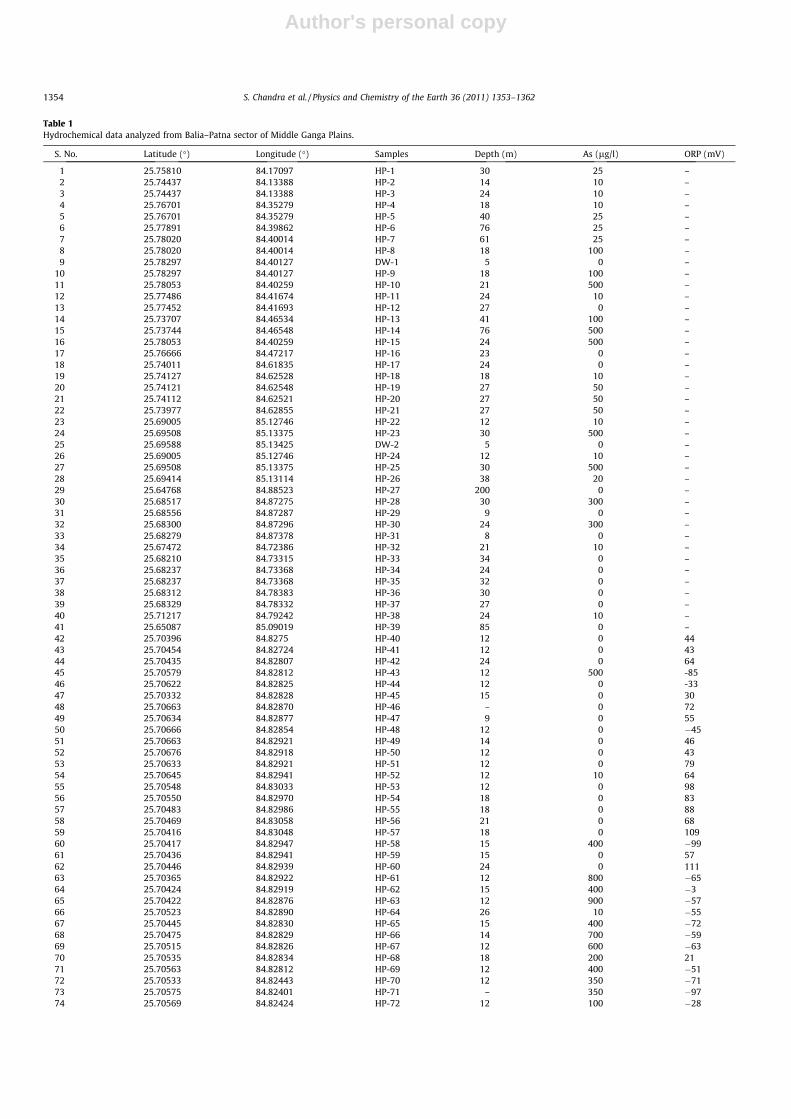
Table 1Hydrochemical data analyzed from Balia–Patna sector of Middle Ganga Plains.
S. No. Latitude (�) Longitude (�) Samples Depth (m) As (lg/l) ORP (mV)
1 25.75810 84.17097 HP-1 30 25 –2 25.74437 84.13388 HP-2 14 10 –3 25.74437 84.13388 HP-3 24 10 –4 25.76701 84.35279 HP-4 18 10 –5 25.76701 84.35279 HP-5 40 25 –6 25.77891 84.39862 HP-6 76 25 –7 25.78020 84.40014 HP-7 61 25 –8 25.78020 84.40014 HP-8 18 100 –9 25.78297 84.40127 DW-1 5 0 –
10 25.78297 84.40127 HP-9 18 100 –11 25.78053 84.40259 HP-10 21 500 –12 25.77486 84.41674 HP-11 24 10 –13 25.77452 84.41693 HP-12 27 0 –14 25.73707 84.46534 HP-13 41 100 –15 25.73744 84.46548 HP-14 76 500 –16 25.78053 84.40259 HP-15 24 500 –17 25.76666 84.47217 HP-16 23 0 –18 25.74011 84.61835 HP-17 24 0 –19 25.74127 84.62528 HP-18 18 10 –20 25.74121 84.62548 HP-19 27 50 –21 25.74112 84.62521 HP-20 27 50 –22 25.73977 84.62855 HP-21 27 50 –23 25.69005 85.12746 HP-22 12 10 –24 25.69508 85.13375 HP-23 30 500 –25 25.69588 85.13425 DW-2 5 0 –26 25.69005 85.12746 HP-24 12 10 –27 25.69508 85.13375 HP-25 30 500 –28 25.69414 85.13114 HP-26 38 20 –29 25.64768 84.88523 HP-27 200 0 –30 25.68517 84.87275 HP-28 30 300 –31 25.68556 84.87287 HP-29 9 0 –32 25.68300 84.87296 HP-30 24 300 –33 25.68279 84.87378 HP-31 8 0 –34 25.67472 84.72386 HP-32 21 10 –35 25.68210 84.73315 HP-33 34 0 –36 25.68237 84.73368 HP-34 24 0 –37 25.68237 84.73368 HP-35 32 0 –38 25.68312 84.78383 HP-36 30 0 –39 25.68329 84.78332 HP-37 27 0 –40 25.71217 84.79242 HP-38 24 10 –41 25.65087 85.09019 HP-39 85 0 –42 25.70396 84.8275 HP-40 12 0 4443 25.70454 84.82724 HP-41 12 0 4344 25.70435 84.82807 HP-42 24 0 6445 25.70579 84.82812 HP-43 12 500 -8546 25.70622 84.82825 HP-44 12 0 -3347 25.70332 84.82828 HP-45 15 0 3048 25.70663 84.82870 HP-46 – 0 7249 25.70634 84.82877 HP-47 9 0 5550 25.70666 84.82854 HP-48 12 0 �4551 25.70663 84.82921 HP-49 14 0 4652 25.70676 84.82918 HP-50 12 0 4353 25.70633 84.82921 HP-51 12 0 7954 25.70645 84.82941 HP-52 12 10 6455 25.70548 84.83033 HP-53 12 0 9856 25.70550 84.82970 HP-54 18 0 8357 25.70483 84.82986 HP-55 18 0 8858 25.70469 84.83058 HP-56 21 0 6859 25.70416 84.83048 HP-57 18 0 10960 25.70417 84.82947 HP-58 15 400 �9961 25.70436 84.82941 HP-59 15 0 5762 25.70446 84.82939 HP-60 24 0 11163 25.70365 84.82922 HP-61 12 800 �6564 25.70424 84.82919 HP-62 15 400 �365 25.70422 84.82876 HP-63 12 900 �5766 25.70523 84.82890 HP-64 26 10 �5567 25.70445 84.82830 HP-65 15 400 �7268 25.70475 84.82829 HP-66 14 700 �5969 25.70515 84.82826 HP-67 12 600 �6370 25.70535 84.82834 HP-68 18 200 2171 25.70563 84.82812 HP-69 12 400 �5172 25.70533 84.82443 HP-70 12 350 �7173 25.70575 84.82401 HP-71 – 350 �9774 25.70569 84.82424 HP-72 12 100 �28
1354 S. Chandra et al. / Physics and Chemistry of the Earth 36 (2011) 1353–1362
Author's personal copy
precise mapping of the lithological set up in the arsenic affectedregions.
The geomorphological and morphostratigraphic studies of theMGP covering parts of Uttar Pradesh–Bihar shows that the interflu-ves upland terraces of Older alluvium (Pleistocene) are free from Ascontamination, while the organic rich gray to black colored NewerAlluvium (Holocene) are rich in As (Acharyya and Shah, 2007;Shah, 2008). It is also observed that most of the As affected areasin MGP are preferentially located close to the abandoned or pres-ent meander channels. The Quaternary alluvium of MGP acts as alife line to a large number of people living in the area due to itsvery fertile to agriculture. People depend mostly on groundwaterfor their domestic and agricultural needs. The contamination dueto irrigation with arsenic laced groundwater is not only limitedto the water, but also entered into the food chain (Sanyal andNaser, 2002), making the problem more complex.
It is quite obvious, at least in the Indian conditions, that the filtersas well as local water treatments suffer from many obvious prob-lems of waste disposal, power supply as well as maintenance, andhence are not a sustainable solution. Thus, it is important to analyzethe small scale variability in lithological set up in the arsenic af-fected region to delineate the zones that are free from As contami-nation in 3-dimension and design some in situ remediation. Ofcourse, borehole drilling could be one of the best ways to analyzethe small scale variability, but it is tedious as several bore wells ofdifferent depths are to be drilled and carry out core sample analysiswhich are time consuming and uneconomical as well. Not only this,the drilled wells may act as short circuiting of the As-safe and As-contaminated aquifers resulting in mixing of contaminated andnon-contaminated groundwater due to their hydrostatic headdifferences. In such conditions application of non-invasive surfacegeophysical methods could be of great relevance yielding reason-ably factual subsurface information without any destruction withina relatively much shorter time. The geoelectrical method providesthe most relevant information on electrical resistivity with widerange of variations associated with water content and lithology,and hence is one of the most powerful geophysical methods to beapplied for hydrogeological problems (Kelley, 1977; Sri Niwas andSinghal, 1981; Yadav, 1995; Loke, 2001; Chand et al., 2004; Chandraet al., 2006; Dhakate et al., 2008; Chandra et al., 2008; Corriols et al.,2009; Chandra et al., 2010, 2011).
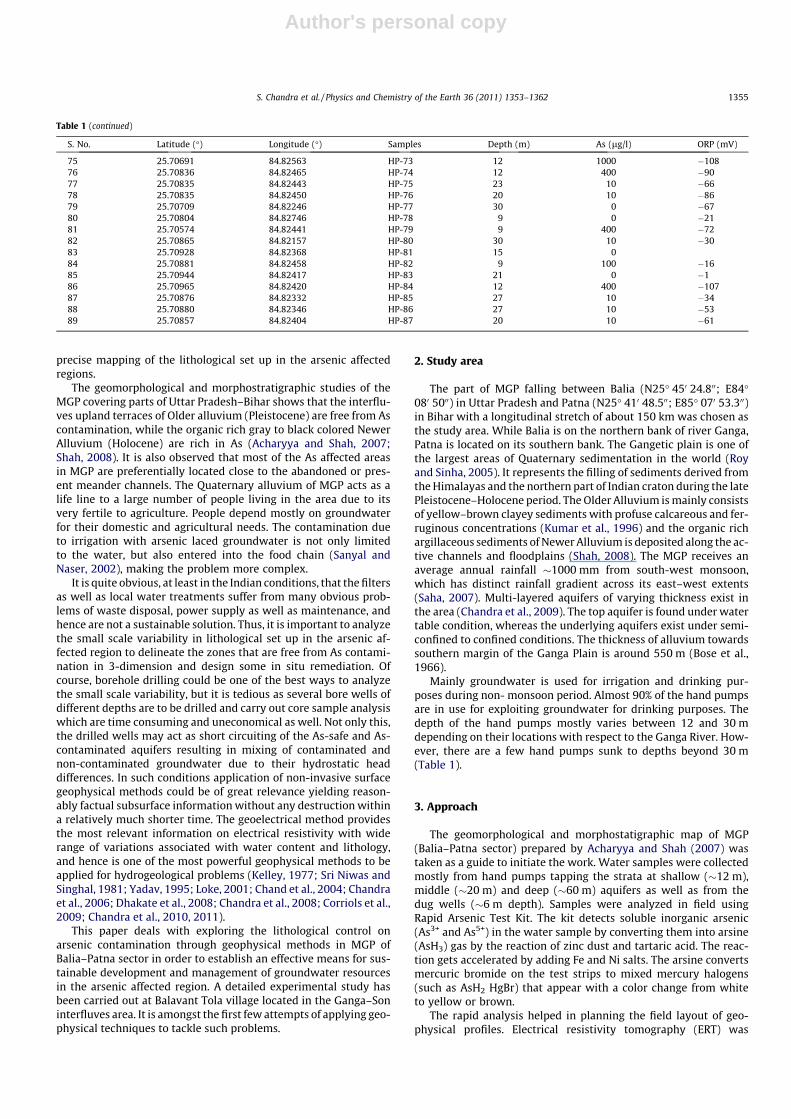
This paper deals with exploring the lithological control onarsenic contamination through geophysical methods in MGP ofBalia–Patna sector in order to establish an effective means for sus-tainable development and management of groundwater resourcesin the arsenic affected region. A detailed experimental study hasbeen carried out at Balavant Tola village located in the Ganga–Soninterfluves area. It is amongst the first few attempts of applying geo-physical techniques to tackle such problems.
2. Study area
The part of MGP falling between Balia (N25� 450 24.800; E84�080 5000) in Uttar Pradesh and Patna (N25� 410 48.500; E85� 070 53.300)in Bihar with a longitudinal stretch of about 150 km was chosen asthe study area. While Balia is on the northern bank of river Ganga,Patna is located on its southern bank. The Gangetic plain is one ofthe largest areas of Quaternary sedimentation in the world (Royand Sinha, 2005). It represents the filling of sediments derived fromthe Himalayas and the northern part of Indian craton during the latePleistocene–Holocene period. The Older Alluvium is mainly consistsof yellow–brown clayey sediments with profuse calcareous and fer-ruginous concentrations (Kumar et al., 1996) and the organic richargillaceous sediments of Newer Alluvium is deposited along the ac-tive channels and floodplains (Shah, 2008). The MGP receives anaverage annual rainfall �1000 mm from south-west monsoon,which has distinct rainfall gradient across its east–west extents(Saha, 2007). Multi-layered aquifers of varying thickness exist inthe area (Chandra et al., 2009). The top aquifer is found under watertable condition, whereas the underlying aquifers exist under semi-confined to confined conditions. The thickness of alluvium towardssouthern margin of the Ganga Plain is around 550 m (Bose et al.,1966).
Mainly groundwater is used for irrigation and drinking pur-poses during non- monsoon period. Almost 90% of the hand pumpsare in use for exploiting groundwater for drinking purposes. Thedepth of the hand pumps mostly varies between 12 and 30 mdepending on their locations with respect to the Ganga River. How-ever, there are a few hand pumps sunk to depths beyond 30 m(Table 1).
3. Approach
The geomorphological and morphostatigraphic map of MGP(Balia–Patna sector) prepared by Acharyya and Shah (2007) wastaken as a guide to initiate the work. Water samples were collectedmostly from hand pumps tapping the strata at shallow (�12 m),middle (�20 m) and deep (�60 m) aquifers as well as from thedug wells (�6 m depth). Samples were analyzed in field usingRapid Arsenic Test Kit. The kit detects soluble inorganic arsenic(As3+ and As5+) in the water sample by converting them into arsine(AsH3) gas by the reaction of zinc dust and tartaric acid. The reac-tion gets accelerated by adding Fe and Ni salts. The arsine convertsmercuric bromide on the test strips to mixed mercury halogens(such as AsH2 HgBr) that appear with a color change from whiteto yellow or brown.
The rapid analysis helped in planning the field layout of geo-physical profiles. Electrical resistivity tomography (ERT) was
Table 1 (continued)
S. No. Latitude (�) Longitude (�) Samples Depth (m) As (lg/l) ORP (mV)
75 25.70691 84.82563 HP-73 12 1000 �10876 25.70836 84.82465 HP-74 12 400 �9077 25.70835 84.82443 HP-75 23 10 �6678 25.70835 84.82450 HP-76 20 10 �8679 25.70709 84.82246 HP-77 30 0 �6780 25.70804 84.82746 HP-78 9 0 �2181 25.70574 84.82441 HP-79 9 400 �7282 25.70865 84.82157 HP-80 30 10 �3083 25.70928 84.82368 HP-81 15 084 25.70881 84.82458 HP-82 9 100 �1685 25.70944 84.82417 HP-83 21 0 �186 25.70965 84.82420 HP-84 12 400 �10787 25.70876 84.82332 HP-85 27 10 �3488 25.70880 84.82346 HP-86 27 10 �5389 25.70857 84.82404 HP-87 20 10 �61
S. Chandra et al. / Physics and Chemistry of the Earth 36 (2011) 1353–1362 1355
Author's personal copy
carried out in resistivity and induced polarization (IP) modes tomeasure the 2-d resistivity and chargeability variations of the
subsurface in order to map the small scale variations in lithologicalset up between As contaminated and non-contaminated hand
74 76 78 80 82 84 86 88
22
24
26
28
30
PatnaBalia
Lucknow 70 75 80 85 90 95
10
15
20
25
30
35
84.2 84.3 84.4 84.5 84.6 84.7 84.8 84.9 85 85.1 85.225.6
25.65
25.7
25.75
84.822 84.823 84.824 84.825 84.826 84.827 84.828 84.829 84.83 84.831
25.704
25.705
25.706
25.707
25.708
25.709
40
4142
43
44
45
4647
48 4950
5152
5354
5556
57585960
61
6263
64
65
66
6768
69
70
71 72
73
747576
77
78
79
80
81
82
8384
858687
T9 T10T11T12
T13T14
T15T16
0 m 110 m 220 m 330 m 440 m
As affected HPAs free HP
ERT LineTEM Sounding
A
A'B
B'
C
C'
E
E'
D
D'
T9
53
61
Longitude
Latit
ude
As:NIL 0<As<50 ppb As: >50 ppb
Ganga R
Ghaghara R
Son
R
Gandak
MGP (Balia-Patna Sector)
Balavant Tola
Longitude
Latit
ude
Fig. 1. Location map of Balavant Tola, Middle Ganga Plain (Balia–Patna Sector) in Ganga River Basin, India.
1356 S. Chandra et al. / Physics and Chemistry of the Earth 36 (2011) 1353–1362
Author's personal copy
pumps tapping the same depth level. The area in and around theBalavant Tola village located in the interfluves of Ganga and Sonrivers was selected for detailed study due to the high variabilityin arsenic contamination within a narrow zone (�200 m wide).
The collected apparent resistivity and chargeability data were in-verted using the standard RES2DINV program (Loke and Barker,1996; Loke, 2001) through finite difference numerical approach toproduce the subsurface true resistivity and chargeability distribu-tions, which were finally interpreted in terms of lithological set up.
The ERT results were further validated by TEM sounding mea-surements at a few selected points along the ERT profiles.TEM-FAST 48 equipment was used with the coincident loop of25 m � 25 m as well as 12.5 m � 12.5 m and varying the controlparameters such as current injections (1A and 4A), stacking (4–6)and maximum time recording (2–16.5 ms). TEM-RES program
was used to invert the 1-d TEM sounding data to determine theformation resistivity (AEMR, 2004).
4. Hydrochemical concentrations
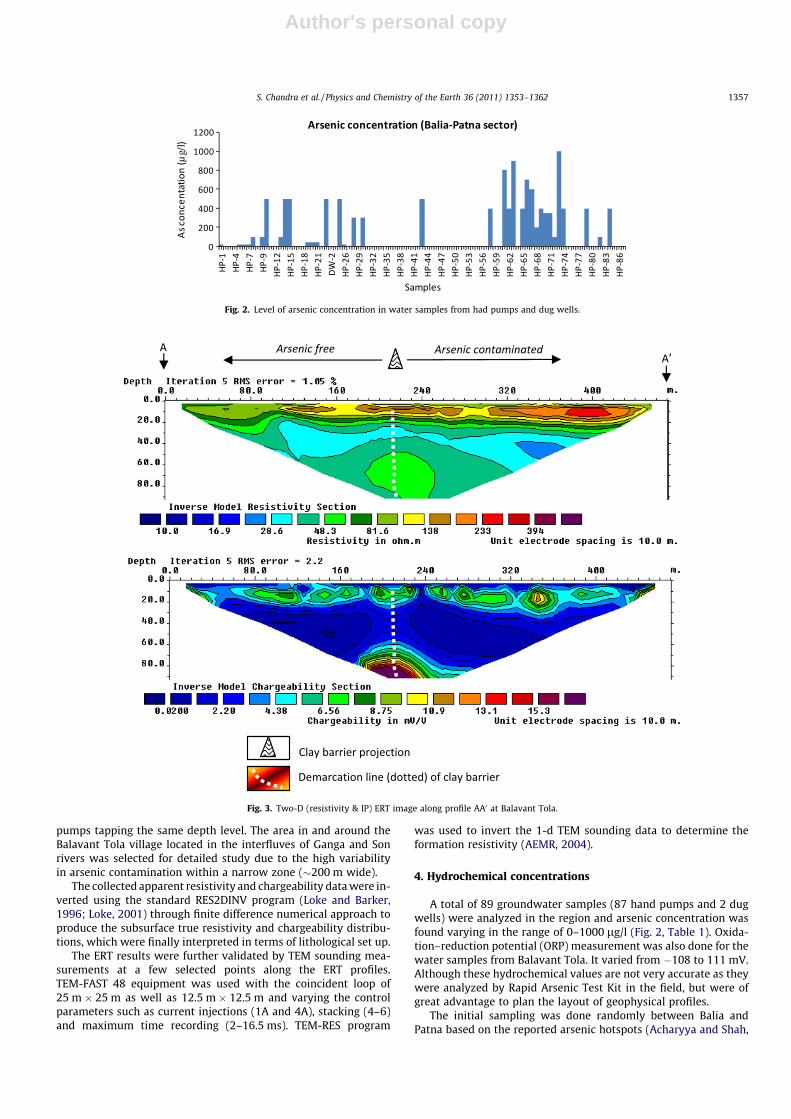
A total of 89 groundwater samples (87 hand pumps and 2 dugwells) were analyzed in the region and arsenic concentration wasfound varying in the range of 0–1000 lg/l (Fig. 2, Table 1). Oxida-tion–reduction potential (ORP) measurement was also done for thewater samples from Balavant Tola. It varied from �108 to 111 mV.Although these hydrochemical values are not very accurate as theywere analyzed by Rapid Arsenic Test Kit in the field, but were ofgreat advantage to plan the layout of geophysical profiles.
The initial sampling was done randomly between Balia andPatna based on the reported arsenic hotspots (Acharyya and Shah,
Fig. 2. Level of arsenic concentration in water samples from had pumps and dug wells.
Fig. 3. Two-D (resistivity & IP) ERT image along profile AA0 at Balavant Tola.
S. Chandra et al. / Physics and Chemistry of the Earth 36 (2011) 1353–1362 1357
Author's personal copy
2007), which was followed by dense sampling at Balavant Tola. Outof the total 87 groundwater samples 63 samples have shown thepresence of As, where 18 samples found exceeding the permissiblelimit of 50 lg/l. The spatial distributions of As contamination wasnot wide spread but in patches. The hand pumps sunk to differentdepth levels at a site showed different degrees of As concentrations.The As contaminated patches are mostly found in the shallow aqui-fer, whereas dug wells (i.e.�6 m) and deep hand pumps (i.e. >40 m)are free from As contamination. It is well known fact that the dugwells lying even within the arsenic contaminated regions arenormally safe due to the oxidizing nature (Acharyya and Shah,2007). A very narrow (i.e.�200 m wide) arsenic contaminated patchelongated in NW–SE direction was traced at Balavant Tola, wherethe hand pumps located 20 m apart showed wide contrast in arsenicconcentration (i.e. one is highly contaminated and other is free fromarsenic contamination).
5. Results and discussions
5.1. Conceptualization and field studies
The ground reality check of arsenic contamination in MGP re-vealed the contamination mostly confined to first shallow aquiferwithin 10–15 m depth range with its localized spread in small
patches, scattered throughout the region. The fact needed confir-mation by ground test analysis and called for the experimentalgeophysical surveys, which were carried out at Balavant Tola vil-lage (Fig. 1). The village is located around 1 km south of the GangaRiver. Six ERT profiles along five lines (AA0, BB0, CC0, DD0 and EE0)were carried out with Wenner–Schlumberger configuration ofelectrodes for resistivity and induced polarization measurementswith varying electrode spacing (2–10 m).
The first ERT profile AA0 was carried out with 10 m electrodespacing to characterize the subsurface lithologic variation betweenarsenic free HP-40 & 45 and arsenic contaminated HP-61 handpumps of 12–15 m depth. The 2-d subsurface resistivity distribu-tion after inversion of the measured apparent resistivity datarevealed first aquifer (sand) of resistivity �100 Om between 5and 25 m depth with underneath thick (�20 m) sandy clay(resistivity 20–35 Om) and clayey sand (35–50 Om) layers(Fig. 3). Resistivity P50 Om represents sand layer in the area(Chandra et al., 2009). The alluvial deposits are normally knownfor its stratified layering with insignificant lateral variations. How-ever, a lateral resistivity variation with low resistivity anomalycould be seen downwards between 200 and 250 m on lateral scaleattributed to the lateral lithological variation. The above anomalyis well resolved with relatively high chargeability in the range of5–20 mV/V in the corresponding induced polarization image.
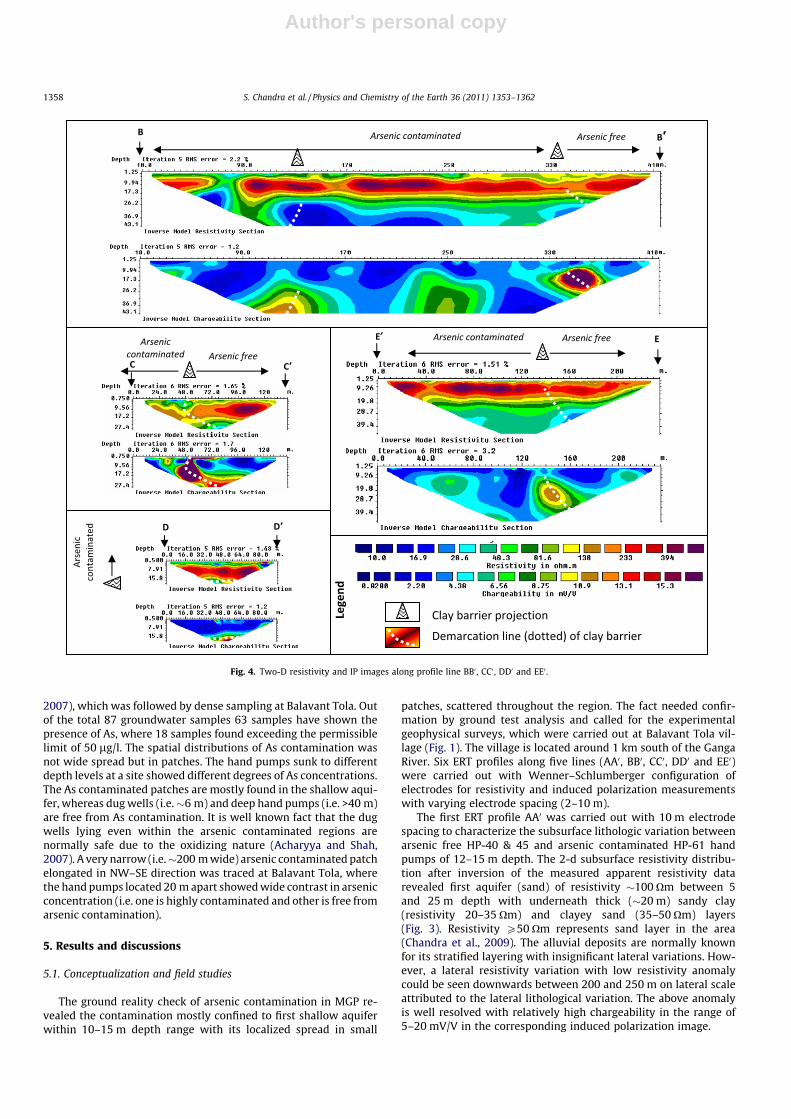
Fig. 4. Two-D resistivity and IP images along profile line BB0 , CC0 , DD0 and EE0 .
1358 S. Chandra et al. / Physics and Chemistry of the Earth 36 (2011) 1353–1362
Author's personal copy
The induced polarization originates due to two distinct sourcesclassified as: (i) membrane polarization, and (ii) electrode polariza-tion. The membrane polarization is mainly due to the presence ofclay particles, which is negatively charged and attracts positiveions from the electrolytes present in the capillaries of clay aggre-gate and hence behaves as ion-selective membrane impendingtheir movement through the capillaries. The electrode polarizationproduces similar effect but occurs when metallic minerals are pres-ent. The flow of electrons through metal is much faster than theflow of ions in the electrolyte and hence opposite charges accumu-late on the surface of a metallic grains that block the path of ionicflow through the pore fluid.
Since area is in the Ganga–Son interfluves with prominent rivermeandering, the first reason for lateral resistivity variation is con-sidered as the presence of localized clay pockets. The clay impres-sion is very clear and distinct at deeper level (�80 m), but hasshown less contrast at shallow level probably due to large elec-trode spacing for ERT measurements. Once the electrode spacingis reduced, the resistivity variations associated with clay barrierat shallow level could also be deciphered.
To increase the resolution of ERT measurements at shallowlevel, electrode spacing was reduced to 5 m and performed alongthe line BB0 running N–S direction with two profiles overlappingof 12 electrodes with each other. This was to map the lithologicalset up between arsenic free HP-44 & 48 and arsenic contaminatedHP-43, 63, and 65–69 hand pumps. As previous, the resistivityimage with 5 m electrode spacing also could not map preciselythe lithological contrast separating the contaminated and non-
contaminated aquifers. However, the induced polarization imageresponded to the lithological contrast indicating high chargeabilitypeaks at 340 m on lateral scale (Fig. 4). Another relatively lessprominent anomaly in IP image was observed at �140 m on lateralscale, which indicates clay deposits at deeper level. The pooranomaly at the center is result of interpolation due to overlappingof the two ERT profiles and hence was ignored. In addition to this,the clay pockets were identified at 15–20 m depth and downward.
Since first aquifer lies roughly between 5 and 25 m belowground level and clay pockets are marked at 15 m depth onwards,how the clay deposits act as barrier to the groundwater movementcontrolling the arsenic contamination was not clear. To answer theabove, another ERT profile with still lesser electrode spacing of 3 mwas carried out along the line CC0 in NW–SE direction. It was alsoto investigate the lithological set up across the hand pumps HP-43(contaminated) and HP-44 (arsenic free). Both resistivity and IPimages revealed the clay signature up to the ground level at around51 m on lateral scale. Of course, the IP image once again is betterthan the resistivity image demarcating clearly the clay depositsup to the ground level. The high chargeability vertical signatureat shallow level (from the ground level) becomes more or less hor-izontal at around 15–20 m depth (Fig. 4). Thus, the clay pocket isnot only confined to deeper level but at shallow level too andhence acts as barrier to groundwater flow even in the first aquifer.A suitable electrode spacing and methodology need to be adoptedto map lithological variations precisely. The DD0 profile in NE–SWdirection with 2 m electrode spacing further supported the CC0 re-sults with horizontal clay layer just below the first aquifer at
0
-10
-20
-30
-40
-50
-60
-70
-80
-90
Elev
atio
n,m
0 50 100 150Distance,m
T9 T10 T11 T12E-W profile
Ohm-m20
30
40
50
60
70
8080
0
-10
-20
-30
-40
-50
Elev
atio
n, m
0 25 50Distance,m
T13 T14 T15 T16N-S profile
Ohm-m20
30
4050607090
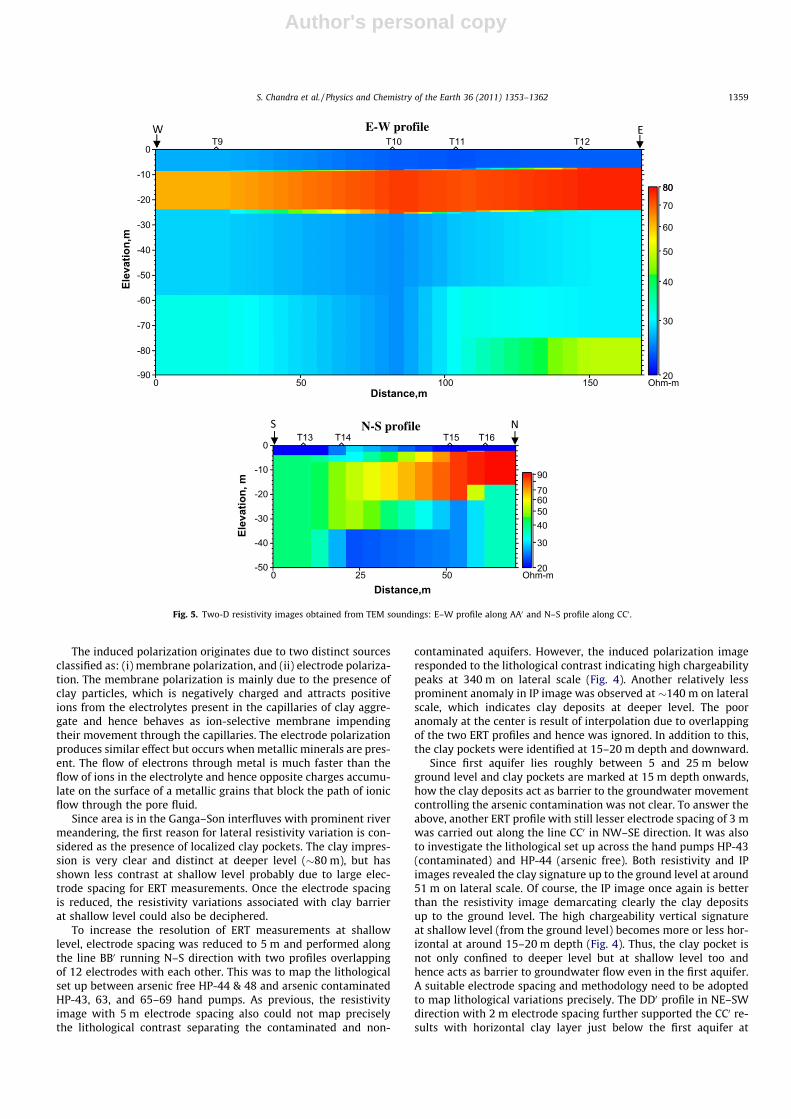
Fig. 5. Two-D resistivity images obtained from TEM soundings: E–W profile along AA0 and N–S profile along CC0 .
S. Chandra et al. / Physics and Chemistry of the Earth 36 (2011) 1353–1362 1359
Author's personal copy
�25 m depth. The southern clay pocket observed along BB0 profiledoes not act as barrier as it is below the existing water table(�6 m).
The profile EE0 with 5 m electrode spacing traced the clay signa-ture in the NW portion of Balavant Tola between two contrastingHP-78 (arsenic free) and HP-73 (1000 lg/l arsenic) aquifers. Likethe previous one, a high chargeability zone was found at 140 m(as marked with dotted line in IP image) mapping the clay barrierbetween the contaminated and non-contaminated zones.
5.2. Validation
Validation of the above results was carried out by measuringthe vertical variations in resistivity using TEM 1D soundings viz.,T9, T10, T11 and T12 (Fig. 1). One dimensional resistivity distribu-tion obtained after inversion at each sounding point was used toprepare a 2d resistivity section and compared with the ERT imagesof the respective profiles. TEM resistivity image was found corrob-orating well with the AA0 ERT image. All the four TEM soundingsmapped the first aquifer (i.e. sand with resistivity 50–80 Xm) be-tween 8 and 24 m depth followed by underlying clay layer (24–58 m depth) and sandy clay layer till 90 m depth. Like ERT imagea contrasting signature with low resistivity was obtained for thelast layer in T10 and hence it validated the clay barrier at deeperlevel (Fig. 5). The clay barrier is probably getting narrowed downat shallow level and hence contributing insignificant signal to thelarge (10 m) electrode spacing ERT and large loop (25 m � 25 m)TEM soundings.
TEM soundings (T13, T14, T15 and T16) with 12.5 m � 12.5 mloop size correspond to line CC0, which revealed resistivity distribu-tion up to 50 m depth. Like the ERT, here also first aquifer wasmapped between 5 and 25 m depth with underneath clay layer
up to the bottom. The 15 m thick sand layer with high resistivity(�90 Xm) obtained at the northern end starts dipping towardssouth as well as the resistivity decreases gradually and attainsvalue of �45 Xm at the southern end, which corresponds to theclay signature obtained as high chargeability in ERT (Fig. 5).
5.3. Integration of the information
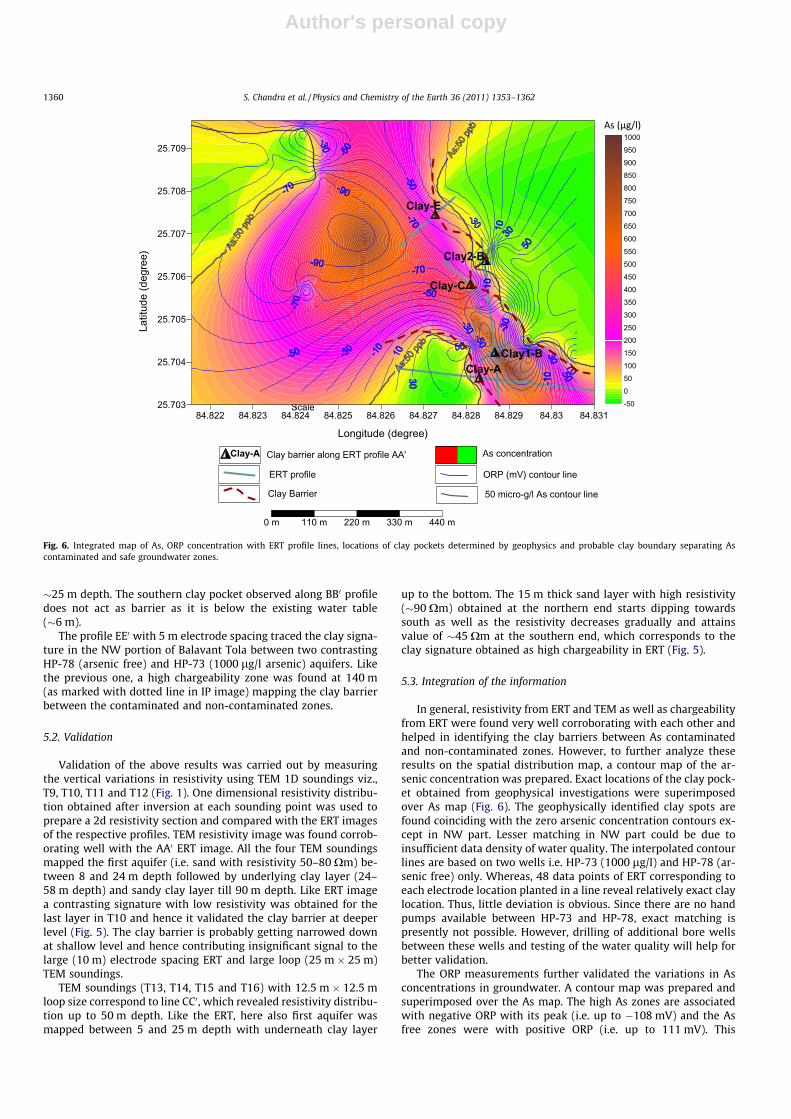
In general, resistivity from ERT and TEM as well as chargeabilityfrom ERT were found very well corroborating with each other andhelped in identifying the clay barriers between As contaminatedand non-contaminated zones. However, to further analyze theseresults on the spatial distribution map, a contour map of the ar-senic concentration was prepared. Exact locations of the clay pock-et obtained from geophysical investigations were superimposedover As map (Fig. 6). The geophysically identified clay spots arefound coinciding with the zero arsenic concentration contours ex-cept in NW part. Lesser matching in NW part could be due toinsufficient data density of water quality. The interpolated contourlines are based on two wells i.e. HP-73 (1000 lg/l) and HP-78 (ar-senic free) only. Whereas, 48 data points of ERT corresponding toeach electrode location planted in a line reveal relatively exact claylocation. Thus, little deviation is obvious. Since there are no handpumps available between HP-73 and HP-78, exact matching ispresently not possible. However, drilling of additional bore wellsbetween these wells and testing of the water quality will help forbetter validation.
The ORP measurements further validated the variations in Asconcentrations in groundwater. A contour map was prepared andsuperimposed over the As map. The high As zones are associatedwith negative ORP with its peak (i.e. up to �108 mV) and the Asfree zones were with positive ORP (i.e. up to 111 mV). This
-50050100
1502002503003504004505005506006507007508008509009501000
Longitude (degree)
Scale
Clay-A
84.822 84.823 84.824 84.825 84.826 84.827 84.828 84.829 84.83 84.83125.703
25.704
25.705
25.706
25.707
25.708
25.709
As concentration
Clay-AClay1-B
Clay2-B
Clay-C
Clay-E
Clay barrier along ERT profile AA'
ERT profile ORP (mV) contour line
Clay Barrier 50 micro-g/l As contour line
0 m 110 m 220 m 330 m 440 m
Latit
ude
(deg
ree)
Fig. 6. Integrated map of As, ORP concentration with ERT profile lines, locations of clay pockets determined by geophysics and probable clay boundary separating Ascontaminated and safe groundwater zones.
1360 S. Chandra et al. / Physics and Chemistry of the Earth 36 (2011) 1353–1362
Author's personal copy
indicates reducing chemical environment over As contaminatedregion favorable to release the As to the groundwater.
Arsenic being a trace element certainly may not influence theresistivity measurement directly. Therefore, the low resistivity ofthe order of �25 Xm indicates the presence of clay. Since the geo-physically identified clay pockets (except the Clay1-B falling alongBB line) coincide with the zero arsenic concentration contours, itconfirms that these spots are nothing but geological clay actingas barrier and containing the arsenic contamination (Fig. 6). Hence,all these clay spots were joined together to show the probabletrack of the clay boundary set up separating the arsenic free andcontaminated groundwater zones. However, dense and high reso-lution mapping will bring in more realistic lithological set up.
This is an important and major contribution of groundwatergeophysics to contaminant hydrogeology. The knowledge of theclay boundaries will be helpful in suitable planning for hand pumpinstallation sites and also manage the groundwater resources judi-ciously for safe withdrawal providing potable water to the peoplein arsenic affected regions sustainably. Also, there is a need of fur-ther study on how long these clays act as barrier and device anoptimal pumping scheme for safe groundwater withdrawal with-out disturbing the hydrodynamics.
6. Conclusion
The integrated hydrogeophysical studies in the arsenic affectedregion of Balia–Patna sector in Middle Ganga Plain of the states ofUttar Pradesh and Bihar in India led to an important finding thatthe lithological set up plays a major role in understanding the ar-senic contamination in groundwater. Although alluvial depositsare known for their hydrogeological homogeneity and stratifica-tion, the heterogeneities found in stratification close to the riverand are the probable reason of arsenic contaminations in patches.The thickness of clay pockets varies pinching out at some places.The high resolution of electrical resistivity tomography has pro-vided subsurface lithological discontinuities from the surface toeven deeper level (say 90 m). The discontinuity of the layer maycreate leakage from upper aquifer to lower and contaminate thesafe zones.
The clay layers are found as localized pockets, acting as barrierto the groundwater flow and indirectly behave as a controlling fac-tor to the groundwater contamination. The spatial variations inclay deposits are the result of river meandering. Geophysics hashelped demarcating the clay barriers, which coincides with thecontour line demarcating the arsenic contaminated and safe zones.At present the first aquifer is found contaminated with arsenicspread in patches. A non-judicious pumping may cause contamina-tion of the deep safe aquifers also.
The knowledge of the clay barrier is very important for the pol-icy makers to plan habitation of the people in order to avoid ar-senic contaminated water for drinking purposes. The results onone hand provided an insight into the process of Arsenic contami-nation, on the other hand depicted the aquifer set up that helpsseparating and safeguarding the zones free from contaminationin the multi-aquifer system existing in the MGP, India.
ERT and TEM were found corroborating well with each otherand proved their combined applicability in identifying small scalevariations in aquifer geometry in alluvial areas. Along with ERT,application of IP is more useful particularly in identifying the claylayers.
Acknowledgements
We acknowledge CSIR (New Delhi) and Director, NGRI for pro-viding opportunity to work on the societal sector and funding
the project. Special thanks to the Chairman, CGWB for taking inter-est and support. Mr. Syed Ali, Md. Ahmeduddin, Mr. D. Mallesh andMr. P. Raghvendra actively participated in the field surveys.Discussion with Dr. D. Saha, superintendent hydrogeologists,CGWM-MER, Patna was very valuable in planning the field studies.Finally, we would like to express our thanks to the Editor andanonymous reviewers for their critical review and the most impor-tantly the valuable suggestions, which has really improved thepaper quality.
References
Acharyya, S.K., Lahiri, S., Raymahashay, B.C., Bhowmik, A., 2000. Arsenic toxicity ofgroundwater in parts of the Bengal basin in India and Bangladesh: the role ofquaternary stratigraphy and Holocene sea-level fluctuation. Environ. Geol. 39,1127–1137.
Acharyya, S.K., Shah, B.A., 2007. Groundwater arsenic contamination affectingdifferent geologic domains in India – a review: influence of geological setting,fluvial geomorphology and quaternary stratigraphy. J. Environ. Sci. Health A 42,1795–1805.
AEMR, 2004. TEM-FAST 49 mannual, Applied Electromagnetic Research, TheNetherlands.
Bhattacharjee, S., Chakravarty, S., Maity, S., Dureja, V., Gupta, K.K., 2005. Metalcontents in the groundwater of Sahebgunj district, Jharkhand, India, withspecial reference to arsenic. Chemosphere 58, 1203–1217.
Bose, P.K., Saikia, B.C., Mukherjee, B.B., 1966. Refraction seismic survey forgroundwater in Patna and Gaya, Patna and Munger districts, Bihar.Unpublished Report, Geological Survey of India, Calcutta.
Bureau of Indian Standards, 2003. Indian standard: drinking water. Specification(first revision), Amendment No. 2, September 2003, New Delhi.
Chakraborti, D., Mukherjee, S.C., Pati, S., Sengupta, M.K., Rahman, M.M., Chowdary,U.K., Lodh, D., Chanda, C.R., Chakraborti, A.K., Basu, G.K., 2003. Arsenicgroundwater contamination in middle Ganga Plain, Bihar, India: a futuredanger? Environ. Health Persp. 111, 1194–1201.
Chand, R., Chandra, S., Rao, V.A., Singh, V.S., Jain, S.C., 2004. Estimation of naturalrecharge and its dependency on subsurface geoelectric parameters. J. Hydrol.299, 67–83.
Chandra, S., Mallesh, D., Ahmeduddin, M., Krishnamraju, P., Ali, S., 2009. Multi layeraquifer mapping by ERT and TEM techniques in arsenic affected region of Balia–Patna sector in north of middle Ganga plains. Tech. Rep. No. NGRI-2009-GW-670, pp. 46.
Chandra, S., Ahmed, S., Rangarajan, R., 2011. Lithologically constrained rainfall (LCR)method to estimate spatio-temporal natural recharge distribution in hard rocks.J. Hydrol., (in press). doi: 10.1016/j.jhydrol.2011.03.018.
Chandra, S., Ahmed, S., Ram, A., Dewandel, B., 2008. Estimation of hard rock aquifershydraulic conductivity from geoelectrical measurements: a theoreticaldevelopment with field application. J. Hydrol. 35, 218–227.
Chandra, S., Dewandel, B., Dutta, S., Ahmed, S., 2010. Geophysical model ofgeological discontinuities in a granitic aquifer: analyzing small scale variabilityof electrical resistivity for groundwater occurrences. J. Appl. Geophys. 71, 137–148.
Chandra, S., Rao, V.A., Krishnamurthy, N.S., Dutta, S., Ahmed, S., 2006. Integratedstudies for characterization of lineaments to locate groundwater potentialzones in hard rock region of Karnataka, India. Hydrogeol. J. 14, 767–776.
Cheng, R.C., Liang, S., Wang, H.C., Beulher, M.D., 1994. Emhanced coagulation forarsenic removal. J. AWWA. 86 (9), 79–90.
Corriols, M., Ryom Nielsen, M.R., Dahlin, T., Christensen, N.B., 2009. Aquiferinvestigations in the Lio9n-Chinandega plains, Nicargua, using electromagneticand electrical methods. Near Surf. Geophys. 7, 413–425.
Das, D., Samanta, G., Mandal, B.K., Chowdhury, T.R., Chanda, C.R., Chowdhary, P.P.,Basu, G.K., Chakraborti, D., 1995. Arsenic in groundwater in six districts of WestBengal, India: the biggest arsenic calamity in the world in part2 Arsenicconcentration in drinking water, hairs, nails, urine, skin-scale and liver tissues(biopsy) of the affected people. Analyst 120, 917–924.
Dhakate, R., Singh, V.S., Negi, B.C., Chandra, S., Rao, V.A., 2008. Geomorphologicaland geophysical approach for locating favourable groundwater zones in graniticterrain, Andhra Pradesh, India. J. Environ. Manage. 88 (4), 1373–1383.
Gray, J.R., Khalil, A., Prior, J.C., 1989. Acute arsenic toxicity: an opaque poison. Can.Assoc. Radiol. J. 40, 226–227.
Harvey, C.F., Swartz, C.H., Badruzzaman, B., Keon, N.E., et al., 2005. Groundwaterarsenic contamination on the Ganges delta: biogeochemistry, hydrology,human perturbations, and human suffering on a large scale. Comptes-Rendus.Geosci. 337, 258–296.
Hering, J.G., Chen, P.Y., Wikie, J.A., Elimelech, M., Liang, S., 1996. Arsenic removal byferric chloride. J. AWWA 88 (4), 155–167.
Hug, S.J., Leupin, O., 2003. Iron catalyzed oxidation of arsenic (III) by oxygen and byhydrogen peroxide: pH-dependent formations of oxidants in the fentonreaction. Environ. Sci. Technol. 37, 2734–2742.
Joshi, A., Chaudhuri, M., 2001. Removing arsenic from groundwater by iron oxide–coated sand. J. Environ. Eng. 122 (8), 769–784.
Kelley, W.E., 1977. Geoelectrical sounding for estimating hydraulic conductivity.Ground Water 15, 420–425.
S. Chandra et al. / Physics and Chemistry of the Earth 36 (2011) 1353–1362 1361

Author's personal copy
Kumar, G., Khanna, P.C., Prasad, S., 1996. Sequence stratigraphy of the foredeep andevolution of the Indo-Gangetic plain, Uttar Pradesh. Geol. Surv. India Spec. Publ.21, 173–207.
Loke, M.H., 2001. Tutorial: 2-D and 3-D electrical imaging surveys. pp. 118.Loke, M.H., Barker, R.D., 1996. Rapid least-squares inversion of apparent resistivity
pseudosections using a quasi-Newton method. Geophys. Prosp. 44, 131–152.Muralidharan, D., 1998. Protection of deep aquifers from arsenic contamination in
Bengal Basin. Curr. Sci. 75 (4), 351–353.Ning, R.Y., 2002. Arsenic removal by reverse osmosis. Desalination 143, 237–241.Roy, N.G., Sinha, R., 2005. Alluvial geomorphology and confluence dynamics in the
Gangetic plains, Farrukhabad–Kannauj area, Uttar Pradesh, India.Saha, D., 2007. The aquifer system and evaluation of its hydraulic parameters in
parts of South Ganga Plain, Bihar. Jour. Geol. Soc. India 69, 1031–1041.Saha, K.C., 2003. Review of arsenicosis in West Bengal, India: a clinical perspective.
Crit. Rev. Environ. Sci. Technol. 30, 127–163.Sambu, S., Wilson, R., 2008. Arsenic in food and water – a brief history. Toxicol. Ind.
Health 24, 217–226.Sanyal, S.K., Naser, S.K.T., 2002. Arsenic contamination in groundwater in West
Bengal, India: build-up in soil crop systems. Int. Conf. Water Related Disasters,Kolkata. Dec02. E:/Arsenic I/sanyal-naser-2002-As.doc 4/26/04.
Senesse, P., Justrabo, E., Boschi, F., Goegebeur, G., Collet, E., Boutron, M.C., et al.,1999. Cronkhite–Canada syndrome and arsenic poisoning: fortuitousassociation or new etiological hypothesis? Gastroenterol Clin. Biol. 23, 399–402.
Shah, B.A., 2008. Role of quaternary stratigraphynon arsenic-contaminatedgroundwater from parts of middle Ganga Plain, UP–Bihar, India. Environ.Geol. 53, 1553–1561.
Shen, Y.S., 1973. Study of arsenic removal from drinking water. J. AWWA 65 (8),543–547.
Shih, M., 2005. An overview of arsenic removal by pressure driven membraneprocess. Desalination 172, 85–97.
Niwas, Sri, Singhal, D.C., 1981. Estimation of aquifer transmissivity from DarZarrouk parameters in porous media. J. Hydrol. 50, 393–399.
WHO, 1993. Guidelines for drinking water quality, second ed. Recommendations.World Health Organization.
Wickramasinghe, S.R., Han, B., Zimbron, J., Shen, Z., Karim, M.N., 2004. Arsenicremoval by coagulation and filtration: comparision of groundwaters from theUnited States and Bangladesh. Desalination 169, 231–244.
Yadav, G.S., 1995. Relating hydraulic and geoelectric parameters of the JayantAquifer, India. J. Hydrol. 167, 23–28.
1362 S. Chandra et al. / Physics and Chemistry of the Earth 36 (2011) 1353–1362