Geometry and kinematics of compressional growth structures and diapirs in the La Popa basin of...
21
Geometry and kinematics of compressional growth structures and diapirs in the La Popa basin of northeast Mexico: Insights from sequential restoration of a regional cross section and three-dimensional analysis He ´ctor Milla ´n-Garrido A ´ rea de Geodina ´mica Interna, Departamento de Ciencias de la Tierra, Universidad de Zaragoza, Zaragoza, Spain Received 8 May 2003; revised 2 May 2004; accepted 24 May 2004; published 8 October 2004. [1] Diapirism in the La Popa basin NE Mexico was triggered and sustained by compressional de ´collement tectonics. Coeval development of contractional structures and diapirs was recorded by growth strata of Late Cretaceous-Tertiary age. A palinspastic reconstruction of a regional cross section, based on the restoration of growth strata related to both diapirs and detachment folds, was carried out. On the basis of this reconstruction and field data, a three-dimensional geometrical study was done to quantify the movement of evaporites within the detachment horizon and two diapirs. The latter allowed determining the tectonodiapiric potential of a structure or set of structures (i.e., the amount of ductile rocks forced to flow in association with the growth of a tectonic structure, which is not accommodated by thickening of the ductile horizon nor by the tectonic structure itself, and is capable of producing diapiric phenomena). This study demonstrates that there is a direct coupling between tectonodiapiric potential and diapiric activity. Geometrical results show that the main factors that controlled the amount of ductile material moved as a consequence of compressional tectonics were shortening, the depth to detachment, the folding style, and the style of deformation process (i.e., pure shear/simple shear). In response to folding, the overburden experienced a downward movement that was the major cause of diapiric phenomena. In addition to field and geometrical data, mechanical data indicate that forceful intrusion was the prevailing emplacement mechanism. Temperatures (>150° –197°C) and strain rates (in the order of 10 16 –10 17 s 1 ) calculated for top of the evaporite layer were adequate for the flow of these rocks from the initiation of compression onward. However, an inferred overpressure in the ductile layer should be considered the key factor for the emplacement mechanism. INDEX TERMS: 8005 Structural Geology: Folds and folding; 8099 Structural Geology: General or miscellaneous; 8094 Structural Geology: Instruments and techniques; KEYWORDS: growth strata restoration, diapirism, salt tectonics, 3-D analysis, tectonodiapiric potential, La Popa basin (Mexico). Citation: Milla ´n-Garrido, H. (2004), Geometry and kinematics of compressional growth structures and diapirs in the La Popa basin of northeast Mexico: Insights from sequential restoration of a regional cross section and three-dimensional analysis, Tectonics, 23, TC5011, doi:10.1029/2003TC001540. 1. Introduction [2] One of the most efficient ways to decipher the kinematics and timing of deformation in compressional and extensional settings is to combine growth strata anal- ysis with cross-section balancing. Growth strata analysis is a key to accurately determine both the timing and the kinematics of tectonic structures [e.g., Riba, 1976; Suppe et al., 1992, 1997; Ford et al., 1997; Marzo et al., 2002] and cross-section balancing has been successfully applied to test the validity of a cross section as well as to determine the evolution of a structure or a set of structures [e.g., Mitra and Namson, 1989; Mount et al., 1990; DeCelles et al., 1991; Verge ´s et al., 1996; Schneider et al., 1996; Rowan, 1996; Meigs, 1997]. Nevertheless, there are some tectonic environments where these types of analyses have been rarely applied, as for instance, in regions character- ized by the existence of folding/thrusting and diapirism. In these compressional environments the kinematics and in- terrelation between tectonic structures and diapirs are little known (exceptions include Jackson et al. [1995], Cotton and Koyi [2000]). To some extent this is because palins- pastic restoration of evaporitic structures has often been considered unreliable because of the potential of the evaporites to flow out of the plane of a section, and thus invalidating plane strain. Hossack [1995] faced this prob- lem in a pragmatic way; he proposed that constant-area conditions be assumed for the sediment structures, while salt area may change through time. A further step in the task of visualizing the development of evaporitic struc- tures, that is also implied by Hossack [1995], can be done when diapirism and compressional structures are coeval and genetically related. It is herein proposed that, in this situation and following a three-dimensional (3-D) approach mainly based on the geometric analysis of restored and partially restored sections that include diapiric structures, the movement of the evaporites within a properly selected TECTONICS, VOL. 23, TC5011, doi:10.1029/2003TC001540, 2004 Copyright 2004 by the American Geophysical Union. 0278-7407/04/2003TC001540$12.00 TC5011 1 of 21
Transcript of Geometry and kinematics of compressional growth structures and diapirs in the La Popa basin of...

Geometry and kinematics of compressional growth
structures and diapirs in the La Popa basin of northeast
Mexico: Insights from sequential restoration of a regional
cross section and three-dimensional analysis
Hector Millan-Garrido
Area de Geodinamica Interna, Departamento de Ciencias de la Tierra, Universidad de Zaragoza, Zaragoza, Spain
Received 8 May 2003; revised 2 May 2004; accepted 24 May 2004; published 8 October 2004.
[1] Diapirism in the La Popa basin NE Mexico wastriggered and sustained by compressional decollementtectonics. Coeval development of contractionalstructures and diapirs was recorded by growth strataof Late Cretaceous-Tertiary age. A palinspasticreconstruction of a regional cross section, based onthe restoration of growth strata related to both diapirsand detachment folds, was carried out. On the basis ofthis reconstruction and field data, a three-dimensionalgeometrical study was done to quantify themovement of evaporites within the detachmenthorizon and two diapirs. The latter alloweddetermining the tectonodiapiric potential of astructure or set of structures (i.e., the amount ofductile rocks forced to flow in association with thegrowth of a tectonic structure, which is notaccommodated by thickening of the ductile horizonnor by the tectonic structure itself, and is capable ofproducing diapiric phenomena). This studydemonstrates that there is a direct coupling betweentectonodiapiric potential and diapiric activity.Geometrical results show that the main factors thatcontrolled the amount of ductile material moved as aconsequence of compressional tectonics wereshortening, the depth to detachment, the foldingstyle, and the style of deformation process (i.e., pureshear/simple shear). In response to folding, theoverburden experienced a downward movement thatwas the major cause of diapiric phenomena. In additionto field and geometrical data, mechanical data indicatethat forceful intrusion was the prevailing emplacementmechanism. Temperatures (>150�–197�C) and strainrates (in the order of 10�16–10�17 s�1) calculated fortop of the evaporite layer were adequate for the flowof these rocks from the initiation of compressiononward. However, an inferred overpressure in theductile layer should be considered the key factor forthe emplacement mechanism. INDEX TERMS: 8005
Structural Geology: Folds and folding; 8099 Structural Geology:
General or miscellaneous; 8094 Structural Geology: Instruments
and techniques; KEYWORDS: growth strata restoration, diapirism,
salt tectonics, 3-D analysis, tectonodiapiric potential, La Popa basin
(Mexico). Citation: Millan-Garrido, H. (2004), Geometry and
kinematics of compressional growth structures and diapirs in the
La Popa basin of northeast Mexico: Insights from sequential
restoration of a regional cross section and three-dimensional
analysis, Tectonics, 23 , TC5011, doi:10.1029/2003TC001540.
1. Introduction
[2] One of the most efficient ways to decipher thekinematics and timing of deformation in compressionaland extensional settings is to combine growth strata anal-ysis with cross-section balancing. Growth strata analysis isa key to accurately determine both the timing and thekinematics of tectonic structures [e.g., Riba, 1976; Suppe etal., 1992, 1997; Ford et al., 1997; Marzo et al., 2002] andcross-section balancing has been successfully applied totest the validity of a cross section as well as to determinethe evolution of a structure or a set of structures [e.g.,Mitra and Namson, 1989; Mount et al., 1990; DeCelles etal., 1991; Verges et al., 1996; Schneider et al., 1996;Rowan, 1996; Meigs, 1997]. Nevertheless, there are sometectonic environments where these types of analyses havebeen rarely applied, as for instance, in regions character-ized by the existence of folding/thrusting and diapirism. Inthese compressional environments the kinematics and in-terrelation between tectonic structures and diapirs are littleknown (exceptions include Jackson et al. [1995], Cottonand Koyi [2000]). To some extent this is because palins-pastic restoration of evaporitic structures has often beenconsidered unreliable because of the potential of theevaporites to flow out of the plane of a section, and thusinvalidating plane strain. Hossack [1995] faced this prob-lem in a pragmatic way; he proposed that constant-areaconditions be assumed for the sediment structures, whilesalt area may change through time. A further step in thetask of visualizing the development of evaporitic struc-tures, that is also implied by Hossack [1995], can be donewhen diapirism and compressional structures are coeval andgenetically related. It is herein proposed that, in thissituation and following a three-dimensional (3-D) approachmainly based on the geometric analysis of restored andpartially restored sections that include diapiric structures,the movement of the evaporites within a properly selected
TECTONICS, VOL. 23, TC5011, doi:10.1029/2003TC001540, 2004
Copyright 2004 by the American Geophysical Union.0278-7407/04/2003TC001540$12.00
TC5011 1 of 21
volume of rocks can be adequately constrained. This canbe done by considering that the whole, or a part, of theevaporites forced to flow during structural evolution(specifically those not consumed by thickening of theductile layer and/or the development of a tectonic struc-ture) can be consumed by the development of diapir(s).The resulting diapiric structure must be admissible; itsgeometry and size must be coherent with field observa-tions and/or with the data deduced from restorations, andpalinspastic reconstructions of the overall structure mustbe admissible and viable.[3] The La Popa basin, located in the Coahuila Mar-
ginal Folded Province of northeast Mexico [Murray,1959], is an ideal place to study these topics becauseof the outstanding exposure of growth strata associatedwith contractional and diapiric structures developed abovea thick ductile detachment (Figures 1 and 2). This paperdocuments and discusses relationships between folding,thrusting, and diapirism that were contemporaneous withLate Cretaceous and Tertiary sedimentation [Laudon,1996] in the La Popa basin.
2. Regional Geology
[4] In broad terms the stratigraphic succession thatcrops out in the La Popa basin consists of at least1200 m of Jurassic evaporites [e.g., Weidie and Murray,1967], overlain by �3000 m of carbonates and shales ofLate Jurassic age. These pass up to �1500 m of marineshales and siltstones of Campanian age named the ParrasShale, and in turn overlain by up to 4000 m of shallowmarine to deltaic deposits that constitute the DifuntaGroup [e.g., Murray et al., 1962; McBride et al., 1974;Laudon, 1984; Espinoza, 1989]. The latter are of LateCretaceous-Tertiary age and comprise the Muerto, Potre-rillos, Adjuntas, Viento, and Carroza Formations [e.g.,Wolleben, 1977; Vega-Vera et al., 1989; Soegaard, 1997;Vega-Vera, 1997] (Figure 1b). McBride et al. [1974]stated a Maastrichtian age for the oldest formations ofthe Difunta Group in the La Popa basin. Several speciesof crabs have been found by Vega-Vera and Perrilliat[1989] in the Maastrichtian deposits of the PotrerillosFormation. These authors also reported the presence ofPaleocene deposits in the upper portion of the PotrerillosFormation, as well as the presence of early Eocene stratain lowermost Adjuntas Formation. Neither the Viento norCarroza Formations have been dated.[5] The existence of growth strata in the La Popa basin
was originally stated by Laudon [1984, 1996], who recog-nized that the Upper Member of the Potrerillos Formationand the Viento Formation was deposited simultaneouslywith the movement of the El Papalote diapir and the LaPopa reverse fault.[6] In the region the cover rocks were mainly shortened
by regional-scale detachment folding [e.g.,Wall et al., 1961;De Cserna, 1989; Gray and Johnson, 1995; Fischer andJackson, 1999]. The study area exhibits superposed foldingwith angular, box, and parallel fold forms. The dominantstructural trends are defined by NW–SE folds related to the
Coahuila Marginal Fold Belt and E–W folds related to themost external structures of the Sierra Madre Transverse FoldBelt [e.g., Mitre-Salazar, 1981; Ye, 1997].
2.1. Synsedimentary Folds and Diapiric Structures
[7] Two types of kilometric-scale synsedimentary struc-tures occur at the La Popa basin near San Jose de la Popa;namely, contractional structures and diapirs. The 42 kmlong regional cross section presented herein includes themajority of the growth structures recognized in the area,such as the Los Lobos anticline, the E–W trending folds,the La Popa reverse fault, and the El Papalote diapir. Theregional cross section also includes the El Gordo diapir andthe Venado anticline in which no evidence that could provetheir synsedimentary growth has been found (Figure 2). Thegeometrical analysis carried out in this research refers onlyto the folds showing growth strata including the sequentialrestoration. A general description of the aforementionedsynsedimentary structures and both diapirs, as well as theirgenetic interpretation, is presented below.2.1.1. La Popa Reverse Fault[8] The La Popa reverse fault (Figures 1, 2, and 3) is
27 km long and varies in orientation from WNW–ESE toNW–SE. It crops out as a vertical to subvertical surfacealong which the Upper Jurassic to Eocene cover rocks havebeen translated southwestward and uplifted about 3 km. Thetrace of the fault is marked by allochthonous gypsummasses up to 10 m thick [McBride et al., 1974]. The faultdepicts a ramp-on-ramp configuration with high to veryhigh cutoff angles except within the middle portion of theParras Formation where it shows a flat over ramp geometry.In the hanging wall, the Parras Formation and the growthstrata of the Difunta Group dip from 90� to 45� northeast-ward on the southern limb of the Arco syncline. The MuertoFormation exhibits northward thickening; in the apical partof the wedge there is an intraformational unconformity, andthe base of the unit unconformably overlies the Parras shale;no thickness variations have been observed in relation to theadjacent anticline to the north. The marked fan-like geom-etry of the lower package of the Potrerillos Formation is dueto the combination of a rotational onlap (developed on theSan Jose Lentil) and the thinning of the overlying andunderlying units. In the footwall to the La Popa fault, thesequences of the Difunta Group dip from 50� to 10�southwestward and are involved in the upward narrowinglimb of the La Popa syncline. The Carroza Formationrepresents the youngest syntectonic deposits related to theLa Popa reverse fault.[9] The interpretation of the nature of the La Popa
structure is controversial since it was originally interpretedas a reverse fault [McBride et al., 1974; Laudon, 1984,1996] and subsequently reinterpreted as a secondary saltweld [Giles and Lawton, 1999]. Taking into account (1) thecrosscutting relationship between the fracture and the strataof both fault blocks; (2) the geometry of the pre andsyntectonic strata of the folds adjacent to the fracture (theLa Popa syncline and the Arco anticline; Figures 2 and 3);(3) the tectonostratigraphic evolution of other adjacent andcontemporary structures that share the same detachment
TC5011 MILLA N-GARRIDO: GROWTH STRUCTURES AND DIAPIRS
2 of 21
TC5011
horizon (e.g., the Los Lobos anticline; Figures 3 and 4);(4) the presence of relict gypsum and diabase localizedalong the fault implying that there was extrusion ofevaporitic rocks along the fracture [e.g., McBride et al.,1974; Laudon, 1996]; (5) the presence of growth strata
within the Difunta Group related with E–W trendingcompressive structures to the SW of the mapped area(e.g., the Tulillo anticline; Figure 1), which is consistentwith the compressional setting deduced for the regionsince Late Cretaceous; and (6) the coherent development
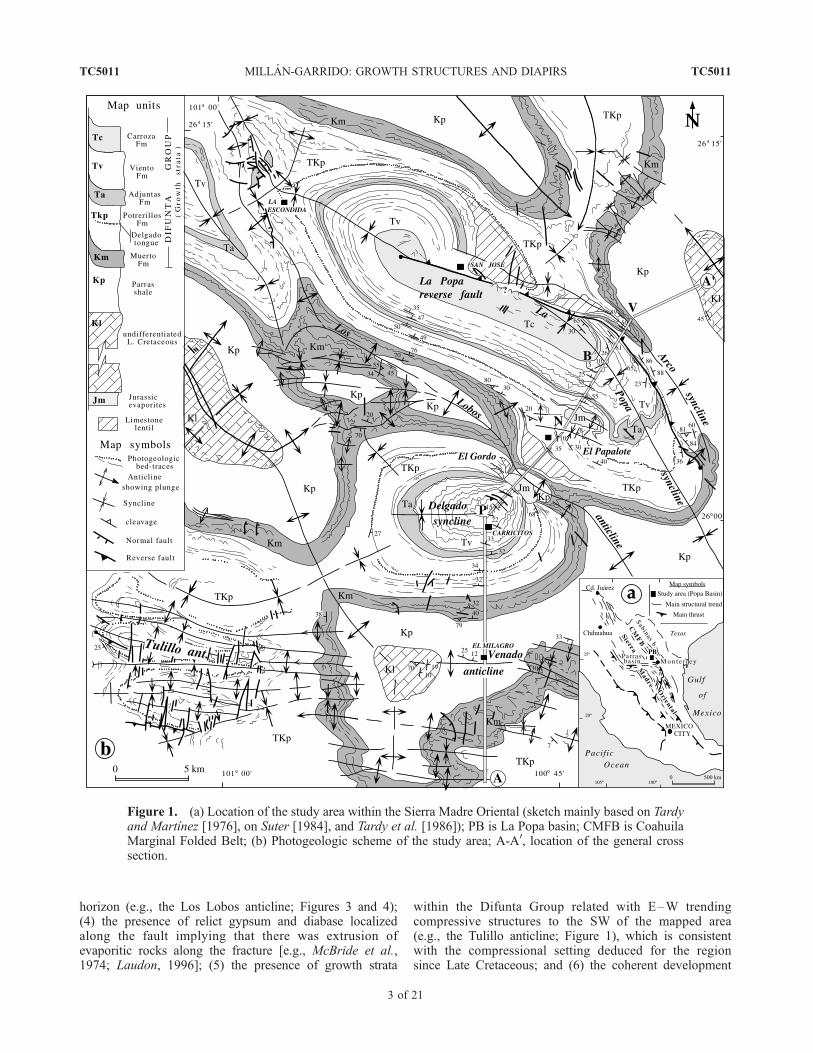
Figure 1. (a) Location of the study area within the Sierra Madre Oriental (sketch mainly based on Tardyand Martınez [1976], on Suter [1984], and Tardy et al. [1986]); PB is La Popa basin; CMFB is CoahuilaMarginal Folded Belt; (b) Photogeologic scheme of the study area; A-A0, location of the general crosssection.
TC5011 MILLA N-GARRIDO: GROWTH STRUCTURES AND DIAPIRS
3 of 21
TC5011
deduced for the La Popa structure through time by meansof palinspastic restoration which in turn is consistent withthe geometry [Price and Cosgrove, 1990, Figure 13.34]and evolution [Cotton and Koyi, 2000] of angular and boxfolds predicted by physical modeling of multilayeredsequences (Figure 3), the La Popa structure is interpretedas a reverse-fault weld. From the present and partiallyrestored cross section it is inferred that continued com-
pression caused breaching of the frontal limb of the LaPopa anticline, extrusion of the evaporitic material andultimately the folding of the fault, which was probablyintimately related to the welding of the structure (Figures 3and 4).2.1.2. Los Lobos Anticline[10] The Los Lobos anticline is a NW–SE trending
growth fold that can be traced along 30 km (Figure 1). At
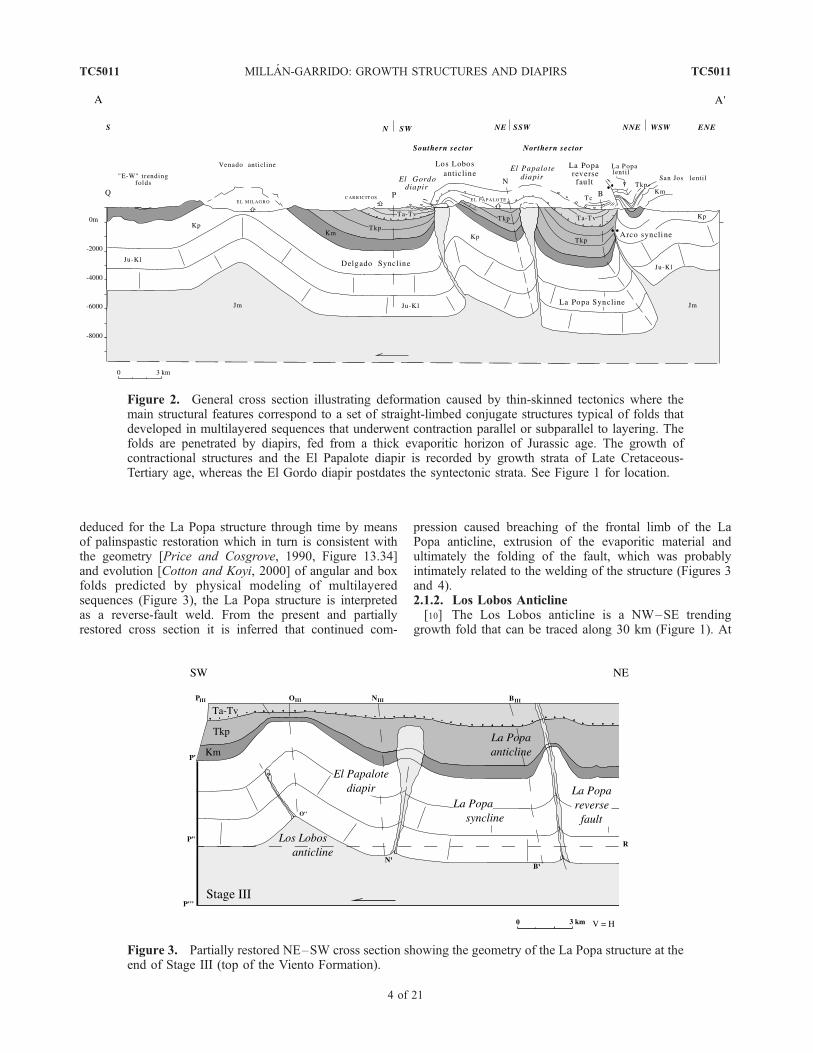
Figure 2. General cross section illustrating deformation caused by thin-skinned tectonics where themain structural features correspond to a set of straight-limbed conjugate structures typical of folds thatdeveloped in multilayered sequences that underwent contraction parallel or subparallel to layering. Thefolds are penetrated by diapirs, fed from a thick evaporitic horizon of Jurassic age. The growth ofcontractional structures and the El Papalote diapir is recorded by growth strata of Late Cretaceous-Tertiary age, whereas the El Gordo diapir postdates the syntectonic strata. See Figure 1 for location.
Figure 3. Partially restored NE–SW cross section showing the geometry of the La Popa structure at theend of Stage III (top of the Viento Formation).
TC5011 MILLA N-GARRIDO: GROWTH STRUCTURES AND DIAPIRS
4 of 21
TC5011

Figure 4
TC5011 MILLA N-GARRIDO: GROWTH STRUCTURES AND DIAPIRS
5 of 21
TC5011
the studied transect the southeastern segment of the anticlineconnects to the north and south with the La Popa and theDelgado growth synclines, respectively. The Los Lobosanticline is a south verging, angular, steeply inclined, openfold (Figures 2 and 3) with an average width of 2.6 km andan average height of 1 km; along the pregrowth strata thefold increases in height and width up-section.[11] Considerable syntectonic thinning of the formations
of the Difunta Group can be seen northward across theDelgado syncline. The Muerto Formation completelydescribes the fold and is thinnest around the hinge of theanticline. Close to the crest of the fold, where the MuertoFormation forms a saddle, several rotational onlaps havebeen preserved; the oldest one, as well as an angularunconformity, lies within the upper part of the MuertoFormation; a younger sequence of onlaps includes the lowerhalf of the Potrerillos Formation; the last onlap developsover both the Delgado sandstone member and the UpperLentil, and involves the upper half of the PotrerillosFormation. Finally, the Adjuntas and Viento Formationsshow a significant thinning toward the anticline. Note thatthe timing of the Los Lobos anticline coincides with that ofthe La Popa anticline (Figure 3).2.1.3. E--W Detachment Folds[12] The southern sector of the study area is characterized
by a train of E–W to WNW–ESE trending folds thatbelong to the so-called Sierra Madre Transverse Fold Belt[Charleston, 1981]. The relatively symmetric E–W foldsare decoupled in the shales of the Las Parras Formation(Figure 2) and involve the Muerto and the PotrerillosFormations. These folds started to grow not later than thePaleocene as it is documented in the southern limb of the ElTulillo anticline where the Delgado sandstone member isclearly onlapped by the overlying Paleocene strata of thePotrerillos Formation (Figure 1). On a smaller scale, pack-ages recording sequences of onlaps and a general thinningtoward the anticline hinge were also recognized.2.1.4. El Papalote Diapir[13] The El Papalote diapir is a well-known synsedi-
mentary structure [Laudon, 1984; Lawton and Giles,1997] that distorts the geometry of the northern limb ofthe Los Lobos anticline (Figure 2). The exposed area ofthe diapir has an elliptical shape (�0.7 � �1.7 km) and
strikes WNW–ESE. The Potrerillos Formation is syndia-piric [Laudon, 1984]. The fan-like Potrerillos strata thatsurround the diapir are composed of a lower onlappingunit followed by an overlapping succession starting ap-proximately at the Delgado sandstone member. Theonlapping unit is characterized by a dramatic fanningcaused by both a rapid transition from steeply dippinglayers (locally strongly overturned) to much lower dip-ping younger beds and the presence of several angularunconformities [Lawton and Giles, 1997]. The Adjuntasand the Viento Formations show an upward convergingfan of beds at the northern side of the diapir.[14] From the strong uplift and folding of the beds that
surround the diapir, the uplift of the roof strata aboveregional datum, and the coexistence of diapiric rise withcompressional tectonics, it can be inferred that El Papalotediapir has principally gone through active diapirism duringthe deposition of the Potrerillos and probably the Viento andCarroza Formations.2.1.5. El Gordo Diapir[15] The El Gordo diapir (Figure 2) deforms the southern
limb and the hinge zone of the Los Lobos anticline. Thediapir is a narrow evaporitic stock with an elliptical expo-sure similar in shape, size, and orientation to that of the ElPapalote. No conclusive evidences have been found todemonstrate the growth of the diapir during folding. Thegeometric relationship between the diapir and the overbur-den suggests that the lower and middle units of the DifuntaGroup (Muerto, Potrerillos, Adjunta, and Viento Forma-tions) were shortened before the piercing of the diapir. Thediapir would have been compressed after cessation ofdiapiric movement and/or its late movements took placeduring an active phase as demonstrated by the southwardthrusting of the overburden and tight folding of the Eocenefootwall beds that rim the diapir.
2.2. Timing of Deformation
[16] The tectonostratigraphic evolution of the La Popabasin was registered by the growth strata preserved inthe synsedimentary structures of the study area. Fromthe structural and photogeological study presented hereinit can be deduced that compression started not later than
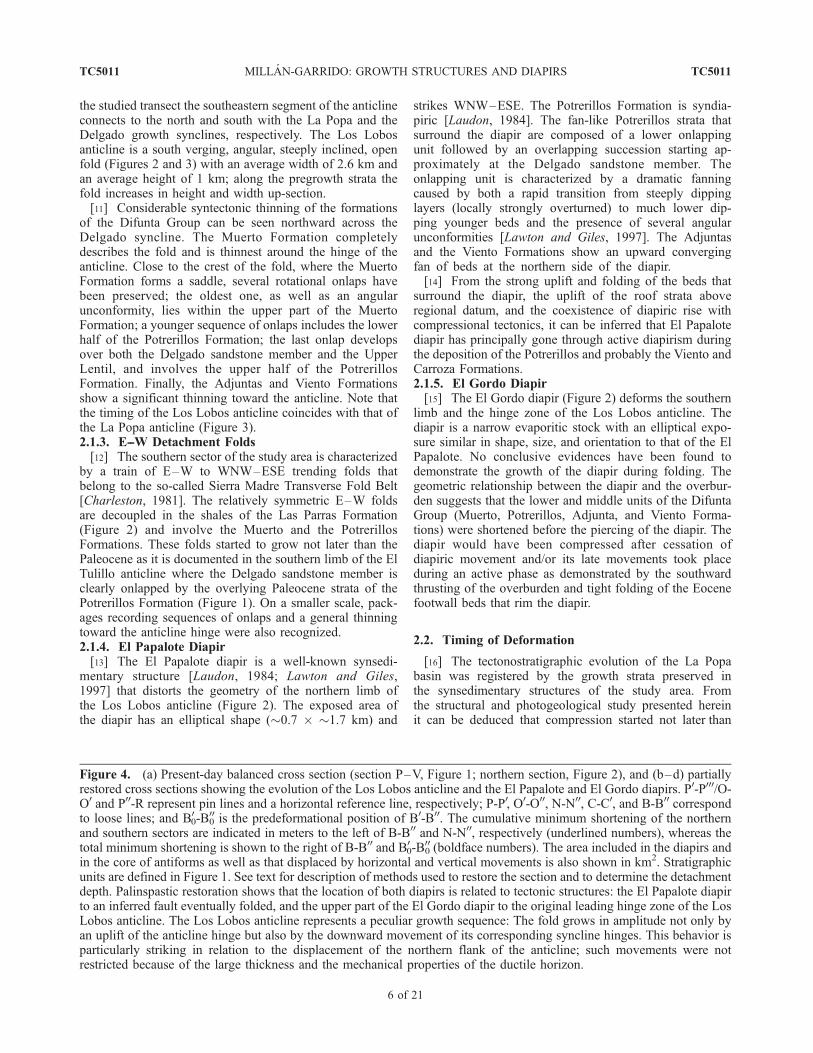
Figure 4. (a) Present-day balanced cross section (section P–V, Figure 1; northern section, Figure 2), and (b–d) partiallyrestored cross sections showing the evolution of the Los Lobos anticline and the El Papalote and El Gordo diapirs. P0-P000/O-O0 and P00-R represent pin lines and a horizontal reference line, respectively; P-P0, O0-O00, N-N00, C-C0, and B-B00 correspondto loose lines; and B0
0-B000 is the predeformational position of B0-B00. The cumulative minimum shortening of the northern
and southern sectors are indicated in meters to the left of B-B00 and N-N00, respectively (underlined numbers), whereas thetotal minimum shortening is shown to the right of B-B00 and B0
0-B000 (boldface numbers). The area included in the diapirs and
in the core of antiforms as well as that displaced by horizontal and vertical movements is also shown in km2. Stratigraphicunits are defined in Figure 1. See text for description of methods used to restore the section and to determine the detachmentdepth. Palinspastic restoration shows that the location of both diapirs is related to tectonic structures: the El Papalote diapirto an inferred fault eventually folded, and the upper part of the El Gordo diapir to the original leading hinge zone of the LosLobos anticline. The Los Lobos anticline represents a peculiar growth sequence: The fold grows in amplitude not only byan uplift of the anticline hinge but also by the downward movement of its corresponding syncline hinges. This behavior isparticularly striking in relation to the displacement of the northern flank of the anticline; such movements were notrestricted because of the large thickness and the mechanical properties of the ductile horizon.
TC5011 MILLA N-GARRIDO: GROWTH STRUCTURES AND DIAPIRS
6 of 21
TC5011
Campanian-Maastrichtian times (there is a local unconfor-mity between the Potrerillos and the Muerto Formationsrelated to the movement of the La Popa reverse fault) andthat it continued, at least, until the Tertiary strata of theCarroza Formation. Particularly, the photogeologic analysisshown in Figure 1 demonstrates that a stratigraphic corre-lation can be established between the growth strata thatrecord the development of the El Papalote diapir above theDelgado sandstone member, also called the Delgado tongue[see, e.g., Lawton and Giles, 1997] and the growth strata ofthe Los Lobos and the Tulillo anticlines located above thesame reference level.
3. Methodology and Geologic Constraints
[17] After preparing a photogeologic map, structural datawere mainly collected along a traverse across two diapirsand several fault-related fold structures. Afterward, a geo-logic map was constructed as well as a regional-scaledeformed-state cross section along the previously selectedtraverse (Figure 2). The north central portion of the regionalcross section, which is parallel to the transport direction and
includes the main synsedimentary structures of the area, hasbeen chosen for restoration (Figure 4).
3.1. Growth Strata
[18] One of the important elements in constructing theregional cross section was to constrain the geometry andthickness of the growth strata. The photogeologic study,which was especially useful for identifying the growth strataand for defining its internal geometry, field data and localobservations were used to establish the geometry andthickness variations of the syntectonic deposits. The geom-etry of the growth strata shown above ground was usuallyprojected from contiguous areas (e.g., the La Popa reversefault or the inner core of the Los Lobos anticline). Therewas little information on the shape of the Adjuntas and theViento Formations situated in the crest of the Los Lobosanticline. Their shape was drawn following the geometrydelineated by the Muerto Formation, which is well exposedin the field. The thickness variation of the Adjuntas and theViento Formations was deduced from the thickness of theirexposures in both flanks of the Los Lobos anticline. In thesouthern flank these units depict a decrease in thicknesstoward the hinge of the anticline with a minimum valueclose to the anticline hinge, which was taken as a referenceto draw the hinge zone. From the crest of the fold to thethickest exposures of northern flank the units were progres-sively thickened using the dips measured along the traverseand those from the SW of San Jose (Figures 1 and 2).
3.2. Restorations
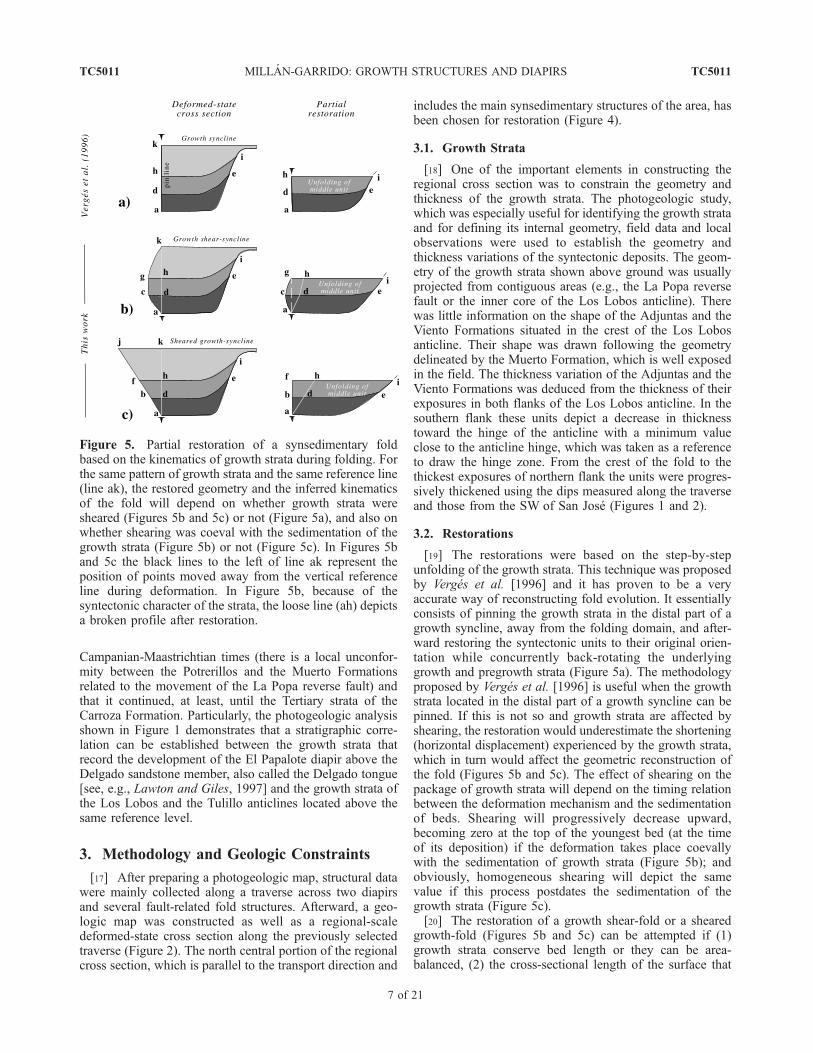
[19] The restorations were based on the step-by-stepunfolding of the growth strata. This technique was proposedby Verges et al. [1996] and it has proven to be a veryaccurate way of reconstructing fold evolution. It essentiallyconsists of pinning the growth strata in the distal part of agrowth syncline, away from the folding domain, and after-ward restoring the syntectonic units to their original orien-tation while concurrently back-rotating the underlyinggrowth and pregrowth strata (Figure 5a). The methodologyproposed by Verges et al. [1996] is useful when the growthstrata located in the distal part of a growth syncline can bepinned. If this is not so and growth strata are affected byshearing, the restoration would underestimate the shortening(horizontal displacement) experienced by the growth strata,which in turn would affect the geometric reconstruction ofthe fold (Figures 5b and 5c). The effect of shearing on thepackage of growth strata will depend on the timing relationbetween the deformation mechanism and the sedimentationof beds. Shearing will progressively decrease upward,becoming zero at the top of the youngest bed (at the timeof its deposition) if the deformation takes place coevallywith the sedimentation of growth strata (Figure 5b); andobviously, homogeneous shearing will depict the samevalue if this process postdates the sedimentation of thegrowth strata (Figure 5c).[20] The restoration of a growth shear-fold or a sheared
growth-fold (Figures 5b and 5c) can be attempted if (1)growth strata conserve bed length or they can be area-balanced, (2) the cross-sectional length of the surface that
Figure 5. Partial restoration of a synsedimentary foldbased on the kinematics of growth strata during folding. Forthe same pattern of growth strata and the same reference line(line ak), the restored geometry and the inferred kinematicsof the fold will depend on whether growth strata weresheared (Figures 5b and 5c) or not (Figure 5a), and also onwhether shearing was coeval with the sedimentation of thegrowth strata (Figure 5b) or not (Figure 5c). In Figures 5band 5c the black lines to the left of line ak represent theposition of points moved away from the vertical referenceline during deformation. In Figure 5b, because of thesyntectonic character of the strata, the loose line (ah) depictsa broken profile after restoration.
TC5011 MILLA N-GARRIDO: GROWTH STRUCTURES AND DIAPIRS
7 of 21
TC5011
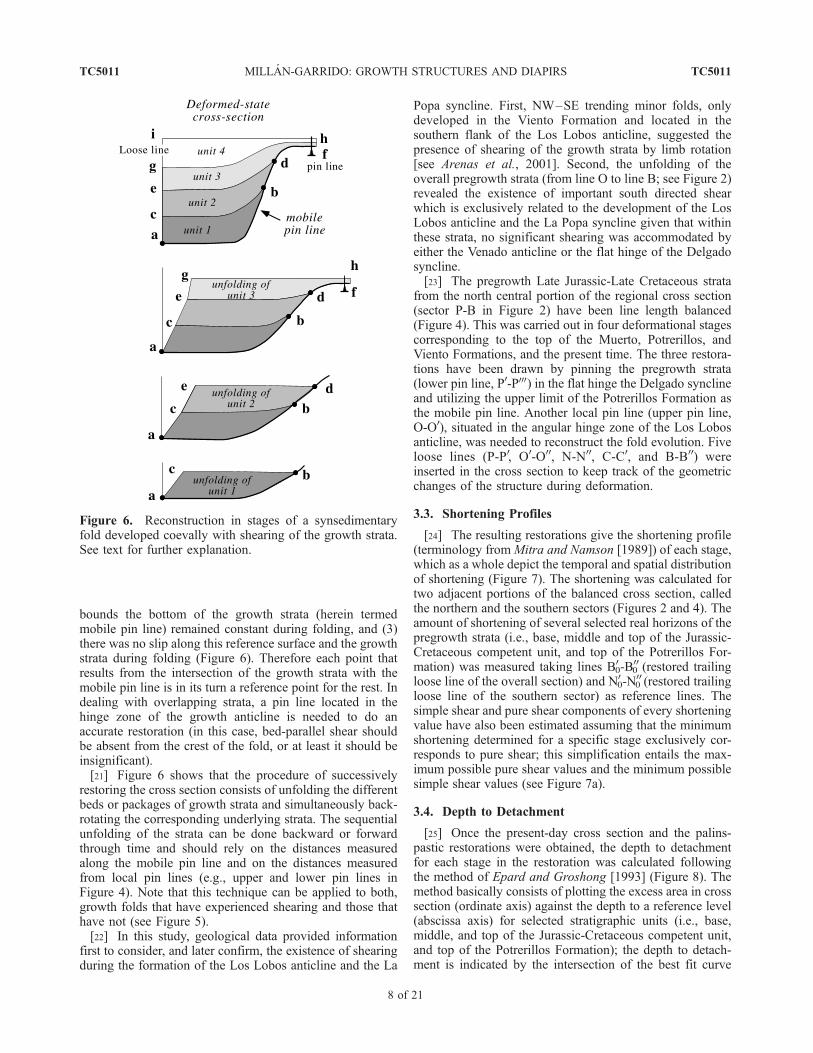
bounds the bottom of the growth strata (herein termedmobile pin line) remained constant during folding, and (3)there was no slip along this reference surface and the growthstrata during folding (Figure 6). Therefore each point thatresults from the intersection of the growth strata with themobile pin line is in its turn a reference point for the rest. Indealing with overlapping strata, a pin line located in thehinge zone of the growth anticline is needed to do anaccurate restoration (in this case, bed-parallel shear shouldbe absent from the crest of the fold, or at least it should beinsignificant).[21] Figure 6 shows that the procedure of successively
restoring the cross section consists of unfolding the differentbeds or packages of growth strata and simultaneously back-rotating the corresponding underlying strata. The sequentialunfolding of the strata can be done backward or forwardthrough time and should rely on the distances measuredalong the mobile pin line and on the distances measuredfrom local pin lines (e.g., upper and lower pin lines inFigure 4). Note that this technique can be applied to both,growth folds that have experienced shearing and those thathave not (see Figure 5).[22] In this study, geological data provided information
first to consider, and later confirm, the existence of shearingduring the formation of the Los Lobos anticline and the La
Popa syncline. First, NW–SE trending minor folds, onlydeveloped in the Viento Formation and located in thesouthern flank of the Los Lobos anticline, suggested thepresence of shearing of the growth strata by limb rotation[see Arenas et al., 2001]. Second, the unfolding of theoverall pregrowth strata (from line O to line B; see Figure 2)revealed the existence of important south directed shearwhich is exclusively related to the development of the LosLobos anticline and the La Popa syncline given that withinthese strata, no significant shearing was accommodated byeither the Venado anticline or the flat hinge of the Delgadosyncline.[23] The pregrowth Late Jurassic-Late Cretaceous strata
from the north central portion of the regional cross section(sector P-B in Figure 2) have been line length balanced(Figure 4). This was carried out in four deformational stagescorresponding to the top of the Muerto, Potrerillos, andViento Formations, and the present time. The three restora-tions have been drawn by pinning the pregrowth strata(lower pin line, P0-P000) in the flat hinge the Delgado synclineand utilizing the upper limit of the Potrerillos Formation asthe mobile pin line. Another local pin line (upper pin line,O-O0), situated in the angular hinge zone of the Los Lobosanticline, was needed to reconstruct the fold evolution. Fiveloose lines (P-P0, O0-O00, N-N00, C-C0, and B-B00) wereinserted in the cross section to keep track of the geometricchanges of the structure during deformation.
3.3. Shortening Profiles
[24] The resulting restorations give the shortening profile(terminology fromMitra and Namson [1989]) of each stage,which as a whole depict the temporal and spatial distributionof shortening (Figure 7). The shortening was calculated fortwo adjacent portions of the balanced cross section, calledthe northern and the southern sectors (Figures 2 and 4). Theamount of shortening of several selected real horizons of thepregrowth strata (i.e., base, middle and top of the Jurassic-Cretaceous competent unit, and top of the Potrerillos For-mation) was measured taking lines B0
0-B000 (restored trailing
loose line of the overall section) and N00-N
000 (restored trailing
loose line of the southern sector) as reference lines. Thesimple shear and pure shear components of every shorteningvalue have also been estimated assuming that the minimumshortening determined for a specific stage exclusively cor-responds to pure shear; this simplification entails the max-imum possible pure shear values and the minimum possiblesimple shear values (see Figure 7a).
3.4. Depth to Detachment
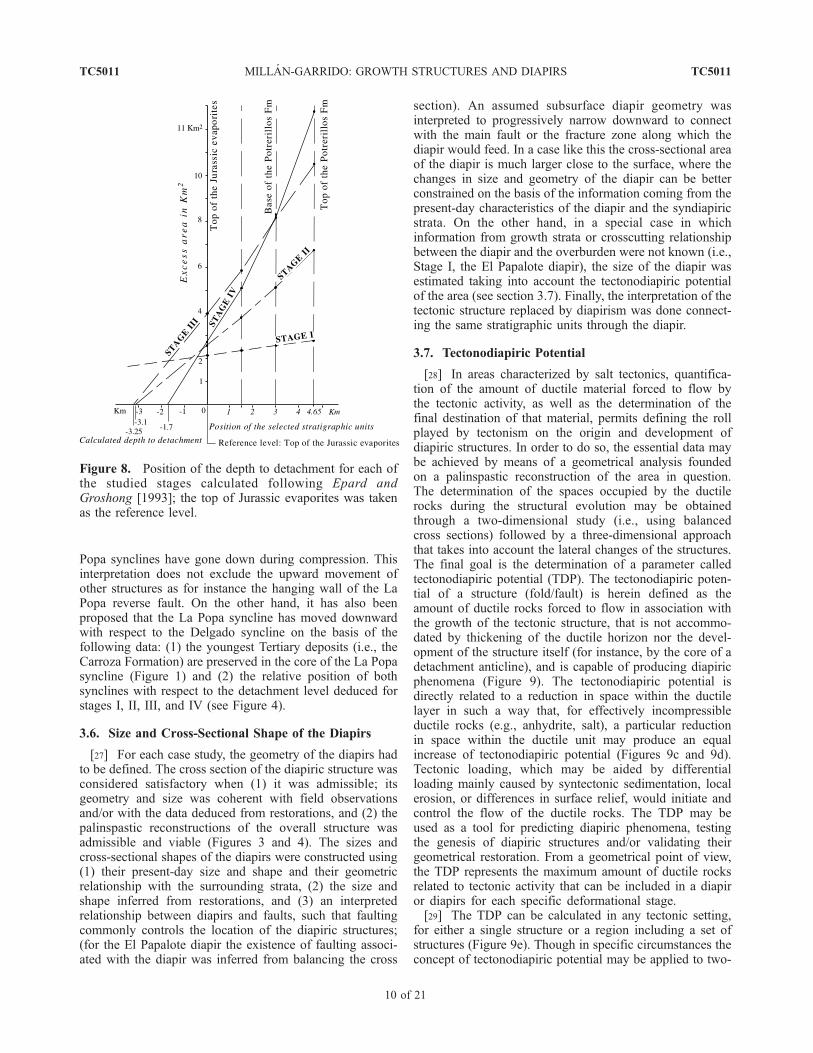
[25] Once the present-day cross section and the palins-pastic restorations were obtained, the depth to detachmentfor each stage in the restoration was calculated followingthe method of Epard and Groshong [1993] (Figure 8). Themethod basically consists of plotting the excess area in crosssection (ordinate axis) against the depth to a reference level(abscissa axis) for selected stratigraphic units (i.e., base,middle, and top of the Jurassic-Cretaceous competent unit,and top of the Potrerillos Formation); the depth to detach-ment is indicated by the intersection of the best fit curve
Figure 6. Reconstruction in stages of a synsedimentaryfold developed coevally with shearing of the growth strata.See text for further explanation.
TC5011 MILLA N-GARRIDO: GROWTH STRUCTURES AND DIAPIRS
8 of 21
TC5011
with the depth axis. This method also enables the internalconsistency of the cross section to be tested and to decidewhether the analyzed anticlines are best interpreted asdetachment/fault propagation anticlines or fault bend folds.On the excess-area graph those anticlines deformed byhomogeneous bed-parallel shear produce straight line plotsof excess area versus depth; a detachment/fault propagationfold, regardless of its internal structure, produces a singlestraight line, whereas a fault bend anticline is defined by asegmented straight line whose intersection indicates theposition of the upper flat. If the stratigraphic sequenceexperienced additional shortening of stratigraphically higherunits, the points representing their area-depth fall in a linewith an upwardly concave curvature.
3.5. Relative Vertical Movements
[26] The relative vertical movement of the folds and ofthe La Popa fault had to be deduced in order to determinethose structures whose downward movement, along with
the horizontal displacement of the detachment horizon, gaverise to the flow of evaporites. In the La Popa basin, and alsoin the surrounding Las Parras and South Sabinas basins(Figure 1a), the youngest Tertiary formations (i.e., theViento and the Carroza Formations) are located in thenonplunging segments of the Delgado and La Popa syn-clines. Besides, these formations present similar altitudes tomuch older deposits of Cretaceous age involved in foldswith the same structural attitude as the Delgado and La Popasynclines (see Figures 1 and 2). As can be inferred from theregional cross section (Figure 2), this distribution is essen-tially related to vertical movements of the folds and the LaPopa reverse fault. In view of the structural data presentedherein, the possibility of a regional upward shift of theoverburden with respect to a ‘‘fixed’’ small area of the basin(i.e., the Delgado syncline-Los Lobos anticline-La Popasyncline) was rejected. It seems more reasonable to con-clude that within a compressional setting governed by athick ductile horizon, the hinges of the Delgado and the La
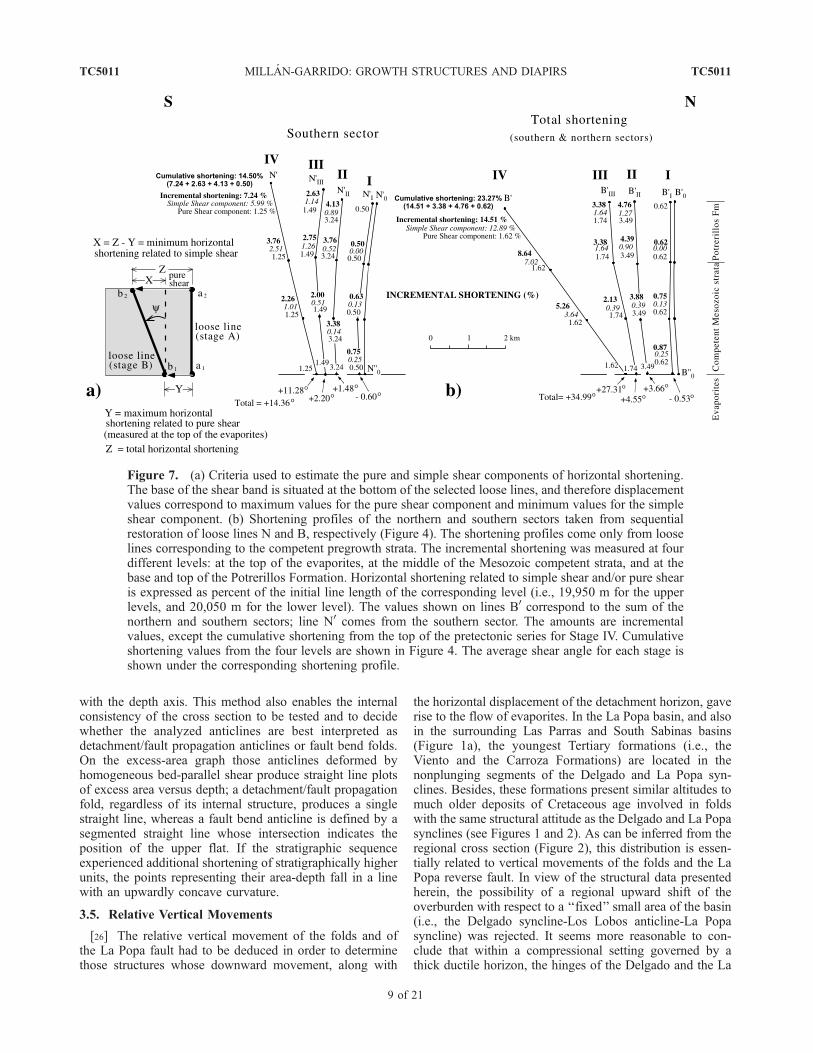
Figure 7. (a) Criteria used to estimate the pure and simple shear components of horizontal shortening.The base of the shear band is situated at the bottom of the selected loose lines, and therefore displacementvalues correspond to maximum values for the pure shear component and minimum values for the simpleshear component. (b) Shortening profiles of the northern and southern sectors taken from sequentialrestoration of loose lines N and B, respectively (Figure 4). The shortening profiles come only from looselines corresponding to the competent pregrowth strata. The incremental shortening was measured at fourdifferent levels: at the top of the evaporites, at the middle of the Mesozoic competent strata, and at thebase and top of the Potrerillos Formation. Horizontal shortening related to simple shear and/or pure shearis expressed as percent of the initial line length of the corresponding level (i.e., 19,950 m for the upperlevels, and 20,050 m for the lower level). The values shown on lines B0 correspond to the sum of thenorthern and southern sectors; line N0 comes from the southern sector. The amounts are incrementalvalues, except the cumulative shortening from the top of the pretectonic series for Stage IV. Cumulativeshortening values from the four levels are shown in Figure 4. The average shear angle for each stage isshown under the corresponding shortening profile.
TC5011 MILLA N-GARRIDO: GROWTH STRUCTURES AND DIAPIRS
9 of 21
TC5011
Popa synclines have gone down during compression. Thisinterpretation does not exclude the upward movement ofother structures as for instance the hanging wall of the LaPopa reverse fault. On the other hand, it has also beenproposed that the La Popa syncline has moved downwardwith respect to the Delgado syncline on the basis of thefollowing data: (1) the youngest Tertiary deposits (i.e., theCarroza Formation) are preserved in the core of the La Popasyncline (Figure 1) and (2) the relative position of bothsynclines with respect to the detachment level deduced forstages I, II, III, and IV (see Figure 4).
3.6. Size and Cross-Sectional Shape of the Diapirs
[27] For each case study, the geometry of the diapirs hadto be defined. The cross section of the diapiric structure wasconsidered satisfactory when (1) it was admissible; itsgeometry and size was coherent with field observationsand/or with the data deduced from restorations, and (2) thepalinspastic reconstructions of the overall structure wasadmissible and viable (Figures 3 and 4). The sizes andcross-sectional shapes of the diapirs were constructed using(1) their present-day size and shape and their geometricrelationship with the surrounding strata, (2) the size andshape inferred from restorations, and (3) an interpretedrelationship between diapirs and faults, such that faultingcommonly controls the location of the diapiric structures;(for the El Papalote diapir the existence of faulting associ-ated with the diapir was inferred from balancing the cross
section). An assumed subsurface diapir geometry wasinterpreted to progressively narrow downward to connectwith the main fault or the fracture zone along which thediapir would feed. In a case like this the cross-sectional areaof the diapir is much larger close to the surface, where thechanges in size and geometry of the diapir can be betterconstrained on the basis of the information coming from thepresent-day characteristics of the diapir and the syndiapiricstrata. On the other hand, in a special case in whichinformation from growth strata or crosscutting relationshipbetween the diapir and the overburden were not known (i.e.,Stage I, the El Papalote diapir), the size of the diapir wasestimated taking into account the tectonodiapiric potentialof the area (see section 3.7). Finally, the interpretation of thetectonic structure replaced by diapirism was done connect-ing the same stratigraphic units through the diapir.
3.7. Tectonodiapiric Potential
[28] In areas characterized by salt tectonics, quantifica-tion of the amount of ductile material forced to flow bythe tectonic activity, as well as the determination of thefinal destination of that material, permits defining the rollplayed by tectonism on the origin and development ofdiapiric structures. In order to do so, the essential data maybe achieved by means of a geometrical analysis foundedon a palinspastic reconstruction of the area in question.The determination of the spaces occupied by the ductilerocks during the structural evolution may be obtainedthrough a two-dimensional study (i.e., using balancedcross sections) followed by a three-dimensional approachthat takes into account the lateral changes of the structures.The final goal is the determination of a parameter calledtectonodiapiric potential (TDP). The tectonodiapiric poten-tial of a structure (fold/fault) is herein defined as theamount of ductile rocks forced to flow in association withthe growth of the tectonic structure, that is not accommo-dated by thickening of the ductile horizon nor the devel-opment of the structure itself (for instance, by the core of adetachment anticline), and is capable of producing diapiricphenomena (Figure 9). The tectonodiapiric potential isdirectly related to a reduction in space within the ductilelayer in such a way that, for effectively incompressibleductile rocks (e.g., anhydrite, salt), a particular reductionin space within the ductile unit may produce an equalincrease of tectonodiapiric potential (Figures 9c and 9d).Tectonic loading, which may be aided by differentialloading mainly caused by syntectonic sedimentation, localerosion, or differences in surface relief, would initiate andcontrol the flow of the ductile rocks. The TDP may beused as a tool for predicting diapiric phenomena, testingthe genesis of diapiric structures and/or validating theirgeometrical restoration. From a geometrical point of view,the TDP represents the maximum amount of ductile rocksrelated to tectonic activity that can be included in a diapiror diapirs for each specific deformational stage.[29] The TDP can be calculated in any tectonic setting,
for either a single structure or a region including a set ofstructures (Figure 9e). Though in specific circumstances theconcept of tectonodiapiric potential may be applied to two-
Figure 8. Position of the depth to detachment for each ofthe studied stages calculated following Epard andGroshong [1993]; the top of Jurassic evaporites was takenas the reference level.
TC5011 MILLA N-GARRIDO: GROWTH STRUCTURES AND DIAPIRS
10 of 21
TC5011
dimensional analysis, because of the mobility of the ductilerocks it is advisable to restrict its use to a three-dimensionalanalysis where the movement of material out of the selectedvolume of rock can be discarded or considered irrelevant.3.7.1. TDP of the Studied Area[30] Different scale structural data (i.e., field and photo-
geological data; geological map) indicate that the tectonicstructures from the NE–SW trending strip of 5–6 km widththat runs parallel to the balanced cross section, extends fromthe hinge of the Delgado syncline to the hinge of the LaPopa syncline (PB), and includes both diapirs, do notpresent any significant along-strike structural variation(see Figure 1). Taking this into account, a 2-D investigation
followed by a 3-D study of the movement of the evaporitesduring shortening was done to determine the tectonodiapiricpotential.[31] The 3-D analysis was conducted in the inner
portion of the aforementioned strip, along a 3 km widthband (wide enough to include the diapirs completely),parallel to the balanced cross section. The study wascarried out considering that the 3 km width band wasbounded by parallel and identical vertical cross sections(Figure 9b) that except for the diapiric structure, corre-spond to those presented in Figure 4. Moreover, it hasbeen assumed that (1) the whole or the majority of theevaporites displaced by shortening remained within the
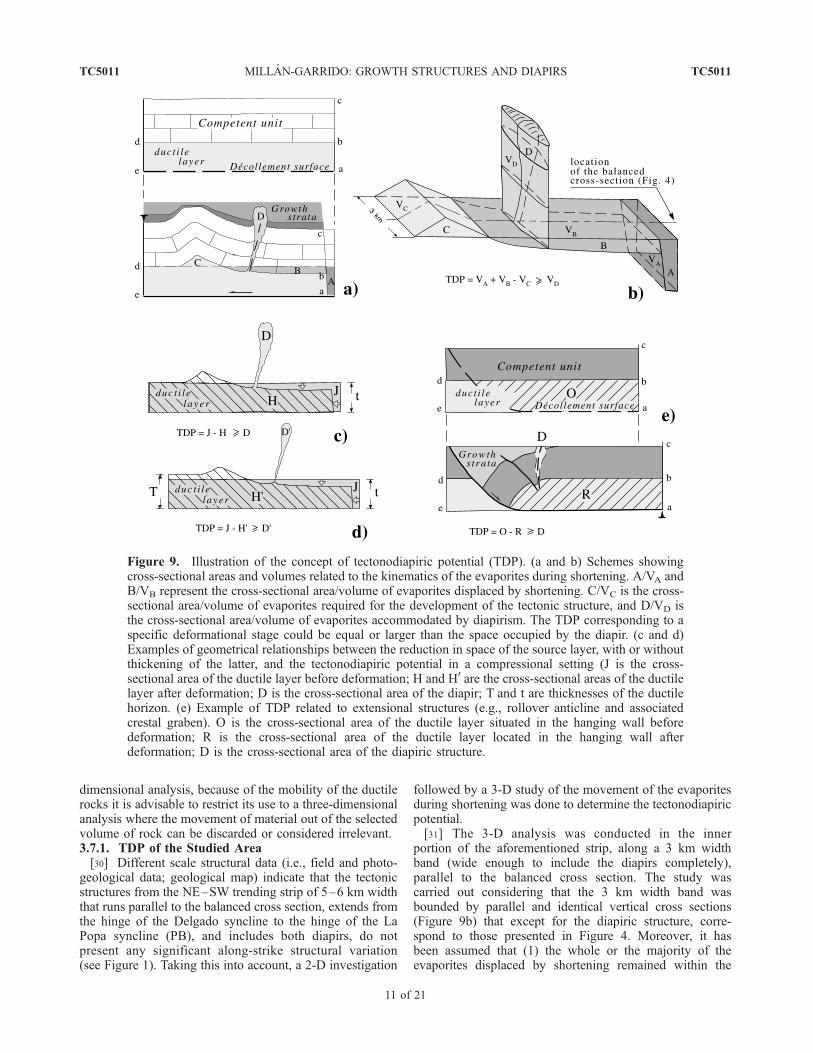
Figure 9. Illustration of the concept of tectonodiapiric potential (TDP). (a and b) Schemes showingcross-sectional areas and volumes related to the kinematics of the evaporites during shortening. A/VA andB/VB represent the cross-sectional area/volume of evaporites displaced by shortening. C/VC is the cross-sectional area/volume of evaporites required for the development of the tectonic structure, and D/VD isthe cross-sectional area/volume of evaporites accommodated by diapirism. The TDP corresponding to aspecific deformational stage could be equal or larger than the space occupied by the diapir. (c and d)Examples of geometrical relationships between the reduction in space of the source layer, with or withoutthickening of the latter, and the tectonodiapiric potential in a compressional setting (J is the cross-sectional area of the ductile layer before deformation; H and H0 are the cross-sectional areas of the ductilelayer after deformation; D is the cross-sectional area of the diapir; T and t are thicknesses of the ductilehorizon. (e) Example of TDP related to extensional structures (e.g., rollover anticline and associatedcrestal graben). O is the cross-sectional area of the ductile layer situated in the hanging wall beforedeformation; R is the cross-sectional area of the ductile layer located in the hanging wall afterdeformation; D is the cross-sectional area of the diapiric structure.
TC5011 MILLA N-GARRIDO: GROWTH STRUCTURES AND DIAPIRS
11 of 21
TC5011
limits of the 3 km width band and that part of thoseevaporites could have been extruded onto the paleosur-face and (2) within the bounds of the band, there wereno lateral changes in the kinematics of each tectonicstructure.3.7.2. Two-Dimensional Geometric Analysis[32] The redistribution of the evaporites during short-
ening was computed graphically for each stage (Figure 4).The cross-sectional geometry of the evaporites was con-strained utilizing two types of geometric criteria: (1) thelimits represented by the pin line (P0-P000) and the trailingloose line at the rear of the section (B line); by an upperline (i.e., the base of the overburden competent units); bya horizontal reference line (line P00-R: which constrainsthe lower limit of the evaporites involved in folding); bya horizontal line drawn at the predicted depth to detach-ment, and (2) the interpreted cross-sectional geometry andcross-sectional area of the diapiric structure. In order tographically determine the area of evaporites displaced byhorizontal shortening, the B lines have been extendeddownward to the detachment. With the exception of Stage
IV, the resulting values of evaporites displaced by hori-zontal shortening are nearly the same as those computedfor the core of the anticline. All the areas used toquantify the movement of the ductile horizon are shownin Figure 4; the area displaced by the lowering of thesyncline below the P00-R horizontal reference line (affectedby vertical movements), the area displaced at the rear ofthe section (accompanying horizontal shortening) as wellas the one contained in the diapirs and in the core of theanticline. Table 1 summarizes these quantities and theircorresponding incremental values for each stage.3.7.3. Three-Dimensional Geometric Analysis[33] The first part of this study consisted in calculating,
for each stage, the volume corresponding to the evapor-ites displaced by vertical and horizontal movements aswell as the volume included in both the diapir(s) and inthe core of the anticline (Figure 10). Except for thevolumes of the diapirs, the rest of the volumes couldbe readily determined because they correspond to poly-hedrons in which the areas of their bases were alreadycalculated (Figure 4 and Tables 1 and 2). The diapirs
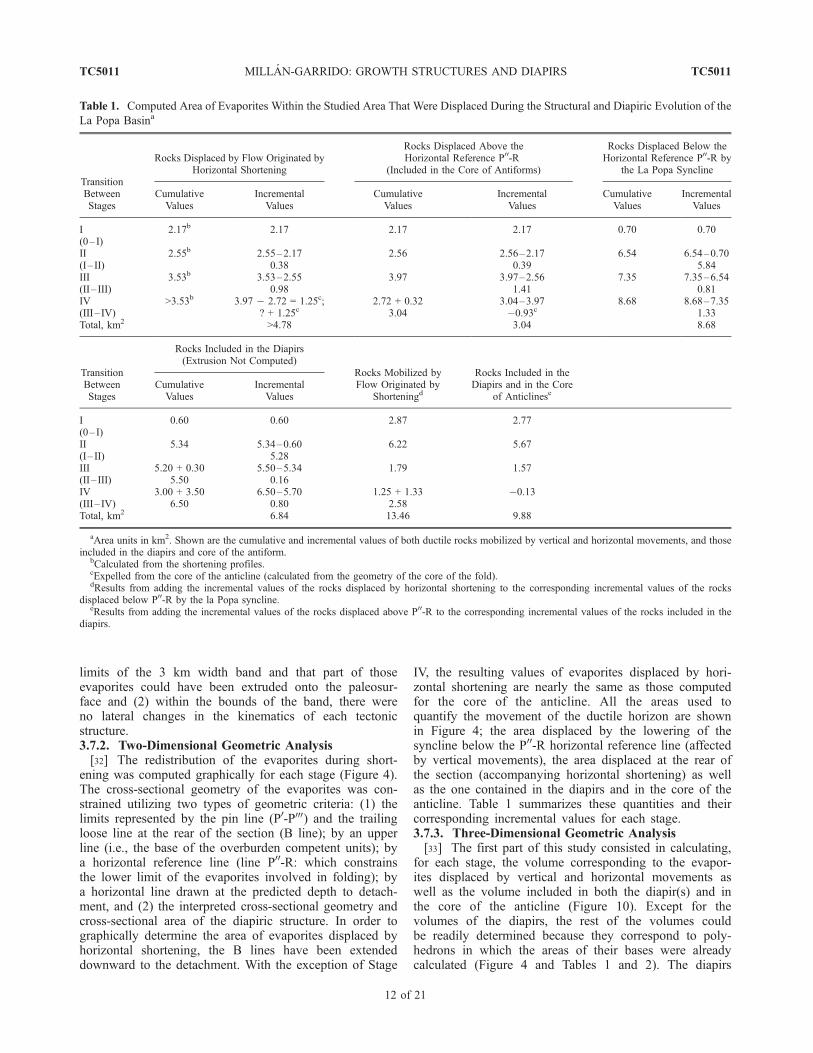
Table 1. Computed Area of Evaporites Within the Studied Area That Were Displaced During the Structural and Diapiric Evolution of the
La Popa Basina
TransitionBetweenStages
Rocks Displaced by Flow Originated byHorizontal Shortening
Rocks Displaced Above theHorizontal Reference P00-R
(Included in the Core of Antiforms)
Rocks Displaced Below theHorizontal Reference P00-R by
the La Popa Syncline
CumulativeValues
IncrementalValues
CumulativeValues
IncrementalValues
CumulativeValues
IncrementalValues
I 2.17b 2.17 2.17 2.17 0.70 0.70(0– I)II 2.55b 2.55–2.17 2.56 2.56–2.17 6.54 6.54–0.70(I– II) 0.38 0.39 5.84III 3.53b 3.53–2.55 3.97 3.97–2.56 7.35 7.35–6.54(II – III) 0.98 1.41 0.81IV >3.53b 3.97 � 2.72 = 1.25c; 2.72 + 0.32 3.04–3.97 8.68 8.68–7.35(III – IV) ? + 1.25c 3.04 �0.93c 1.33Total, km2 >4.78 3.04 8.68
TransitionBetweenStages
Rocks Included in the Diapirs(Extrusion Not Computed)
Rocks Mobilized byFlow Originated by
Shorteningd
Rocks Included in theDiapirs and in the Core
of AnticlineseCumulativeValues
IncrementalValues
I 0.60 0.60 2.87 2.77(0– I)II 5.34 5.34–0.60 6.22 5.67(I– II) 5.28III 5.20 + 0.30 5.50–5.34 1.79 1.57(II – III) 5.50 0.16IV 3.00 + 3.50 6.50–5.70 1.25 + 1.33 �0.13(III – IV) 6.50 0.80 2.58Total, km2 6.84 13.46 9.88
aArea units in km2. Shown are the cumulative and incremental values of both ductile rocks mobilized by vertical and horizontal movements, and thoseincluded in the diapirs and core of the antiform.
bCalculated from the shortening profiles.cExpelled from the core of the anticline (calculated from the geometry of the core of the fold).dResults from adding the incremental values of the rocks displaced by horizontal shortening to the corresponding incremental values of the rocks
displaced below P00-R by the la Popa syncline.eResults from adding the incremental values of the rocks displaced above P00-R to the corresponding incremental values of the rocks included in the
diapirs.
TC5011 MILLA N-GARRIDO: GROWTH STRUCTURES AND DIAPIRS
12 of 21
TC5011

were usually divided into four to five simple bodies toestimate their total volume where it has been assumedthat the width of the selected band (i.e., 3 km) coincides,in plan view, with the length of the long axes of thediapirs (see Figure 10). This might overestimate thevolume of the diapirs since the exposed long axes areapproximately 2 km long. Secondly, the results of theanalysis on the ductile unit movements shown in Table 2allowed determination of the tectonodiapiric potential(TDP) of the studied area.
3.8. Shortening Rates and Growth Rates
[34] The shortening and growth rates experienced by theLos Lobos anticline and the growth rate of the El Papalotediapir, as well as the rates of evaporite migration withinthe section, were estimated in order to analyze the geneticrelationship between the fold and the diapir (Figures 11,12, and 13). To obtain these rates, the age of the upperlimits of the Muerto, the Potrerillos, and the VientoFormations had to be estimated since they are not known.The decompacted thickness of the aforementioned unitswas calculated using the formula proposed by Van Hinte[1978] and the porosity constants given by Sclater andChristie [1980] and by Schmoker and Halley [1982].The maximum thickness and the percent of differentlithologies within each unit were taken into account anda sedimentation rate of 1000 m Ma�1 was assumed since itis an average value that is common to prodelta and deltaplain-tidal flat depositional environments [see Einsele,1992]. This approach predicts an age of approximately74–72, 72–50, and 50–47 Ma for the Muerto, Potrerillos,and Adjuntas-Viento Formations, respectively.
3.9. Temperatures and Strain Rates
[35] In order to evaluate the rheological behavior ofthe evaporites during compression, the strain rate and thetemperature from the top of the Jurassic evaporites, at therear of the La Popa syncline (line B0-B00, Figure 4), werecalculated for Stages I, II, and III.[36] A gradient of 30�C km�1 and a surface temperature
of 10�C were assumed for the paleotemperature calcula-tions. From the beginning of Stage I onward temperaturewas always higher than 150�C, and at the end of Stages IIand III temperature could reach 167� and 197�C, respec-tively (note that these figures represent minimum values forthe evaporitic horizon). On the other hand, the age of thedifferent stages and the shortening values shown in Figure 4were used to obtain the strain rates. The results reveal low tovery low strain rates such as �1.3 � 10�16 s�1, �4.7 �10�17 s�1, and �1.9 � 10�16 s�1, for Stages I, II, and IIIrespectively (see also Figure 11).
4. Sequential Restorations of the Cross
Section: Geometry, Detachment Level,
Shortening, and Evaporite Transport //Balance
[37] The restorations and the present-day stage (Figure 4)will be described following the chronological evolution ofthe structures.
4.1. Stage I
[38] The restoration to the end of Stage I reveals that theLos Lobos anticline was an open synsedimentary box foldwith a broad hinge zone (Figure 4d). The line of excess-area
Figure 10. Volume balancing (V1, V2, V3, . . .) with the corresponding formulas to estimate thetectonodiapiric potential (TDP) of the studied area. The h1, h2, h3, and h represent the height of thebodies. A1, A2, A3 are cross-sectional areas. B/b represents ellipse areas; x/y represents the short and longsemiaxes of an ellipse; the length of the long semiaxis ( y) is 1.5 km, whereas the length of the shortsemiaxis (x) is variable and was determined taking into account information from both, the geologicalmap and the balanced/restored cross sections. P00-R represents the position of the balanced cross section.
TC5011 MILLA N-GARRIDO: GROWTH STRUCTURES AND DIAPIRS
13 of 21
TC5011

diagram (Figure 8) suggests an anomalously high value forthe depth to detachment (>15 km) and the large interlimbangle (>165�) [see Jamison, 1992] is, in principle, incom-patible with a detachment or a fault propagation foldinterpretation of the anticline. The deep structure may besolved by constructing a fault bend fold with the lowerand upper flats located, for instance, at �1250 m and�550 m below the reference level (P00-R), respectively.Nevertheless, although this interpretation is satisfactoryfrom a geometrical and kinematic point of view, it maybe considered inconsistent with the expected ductile be-havior of the thick evaporite Jurassic horizon. There is analternative interpretation based on the folding style inferredfor stages II, III, and IV (i.e., detachment fold), the depthto detachment inferred for stages II and III (i.e., 3100–3250 m), and on the sense of shear inferred for the ductile
horizon during Stage I. The geometrical and mechanicalrequirements of Stage I can be fulfilled if a depth todetachment similar to those inferred for Stages II and III,and a downward increase of shear within the ductilehorizon, are assumed. In this case the evaporites wouldhave been displaced by flow, and the fold can be inter-preted as a detachment anticline (Figure 4d).[39] The restoration of the El Papalote diapir lower
structure is compatible with the presence of a south dippingfault with a small displacement. This fracture would havepermitted the injection of evaporites and later growth of theEl Papalote diapir. Considering its original attitude and thecompressional context in which it developed, the fault maybe interpreted as a reverse fault, as a ‘‘back-thrust’’ in aninitial conjugate set with the north dipping fault at the baseof the El Gordo diapir.
Table 2. Computed Volume of Evaporites Within the Studied Area That Were Displaced During the Structural and Diapiric Evolution of
the La Popa Basina
TransitionBetweenStages
Rocks Displaced by Flow Originated byHorizontal Shortening
Rocks Displaced Above theHorizontal Reference P00-R
(Included in the Core of Antiforms)
Rocks Displaced Below the Hor-izontal Reference P00-R by the La
Popa Syncline
CumulativeValues
IncrementalValues
CumulativeValues
IncrementalValues
CumulativeValues
IncrementalValues
I 6.51b 6.51 6.51 6.51 2.10 2.10(0– I)II 7.65b 7.65–6.51 7.68 7.68–6.51 19.62 19.62–2.10(I– II) 1.14 1.17 17.52III 10.59b 10.59–7.65 11.91 11.91–7.68 22.05 22.05–19.62(II – III) 2.94 4.23 2.43IV >10.59b 11.91 � 8.16 = 3.75c; 8.16 + 0.96 9.12–11.91 26.04 26.04–22.05(III – IV) ? + 3.75c 9.12 �2.79c 3.99Total, km3 >14.34 9.12 26.04
TransitionBetweenStages
Rocks Included in the Diapirs(Extrusion Not Computed)
Rocks Mobilized byFlow Originated by
Shorteningd
Rocks Included in theDiapirs and in the Core of
AnticlineseTectono-Diapiric
PotentialfCumulativeValues
IncrementalValues
I 1.77 1.77 8.61 8.28 8.61–6.51(0– I) 2.10II 13.00 13.00–1.77 18.66 12.40 18.66–1.17(I– II) 11.23 17.49III 2.63 + 10.40 13.03–13.00 5.37 4.26 5.37–4.23(II – III) 13.03 0.03 1.11IV 6.55 + 8.64 15.19–13.03 3.75 + 3.99 �0.63 7.74–(�2.79)(III – IV) 15.19 2.16 7.74 10.53Total, km3 15.19 40.38 24.31 31.23
aUnits in km3. Shown are the tectonodiapiric potential (TDP) as well as the cumulative and incremental values of both ductile rocks mobilized by verticaland horizontal movements, and those included in the diapirs and core of the anticline. The results reveal that Stages I and III present very lowtectonodiapiric potential, whereas this magnitude was high or very high for Stages II and IV. The cumulative mass displaced by horizontal shorteningcorresponding to Stage IV (see second column) would be larger than 10.59 km3 either if we interpret a gradual uplift of the detachment, or, as proposedherein, if the detachment remained steady after Stage III. Note that the amount of evaporites expelled from the anticline calculated from the geometricchanges of its core (3.75 km3) is the incremental value selected for Stage IV.
bCalculated from the shortening profiles.cExpelled from the core of the anticline (calculated from the geometry of the core of the fold).dResults from adding the incremental values of the rocks displaced by horizontal shortening to the corresponding incremental values of the rocks
displaced below P00-R by the la Popa syncline.eResults from adding the incremental values of the rocks displaced above P00-R to the corresponding incremental values of the rocks included in the
diapirs.fResults from subtracting the incremental values of the rocks displaced above P00-R (included in the core of antiforms) from the corresponding values of
the rocks mobilized by flow originated by shortening.
TC5011 MILLA N-GARRIDO: GROWTH STRUCTURES AND DIAPIRS
14 of 21
TC5011
[40] Shortening of the strata overlying the detachmenthorizon was less than 200 m, and it was mainly accommo-dated by the Los Lobos anticline (Figure 4d). The shorten-ing profile may be considered perpendicular to thedetachment, which means that at the working scale, theoverburden suffered a homogeneous bed-parallel shear(Figure 7). If the Los Lobos anticline is interpreted as adetachment fold with the same depth to detachment as inStages II and III, bed-parallel shear cannot be extrapolatedto the underlying evaporites because it would not havecaused enough migration of evaporites to fill the core of theanticline. Within the studied section, the minimum evapo-ritic movement for Stage I would be �6.51 km3. Given thatthe tectonodiapiric potential was very small (particularly ifthe anticline were interpreted as a fault bend fold) it isassumed that diapiric activity was not significant and, if it
existed, it could have been driven mainly by the downwardmovement of the La Popa syncline (Table 2 and Figure 4).
4.2. Stage II
[41] At the end of Stage II the Los Lobos anticline was anasymmetric box fold slightly verging to the south. Therestoration demonstrates that the amplification of the foldentailed the migration of axial surfaces and the simultaneousformation of an angular fold in the lower strata which is acommon evolution in conjugate folds developed by buck-ling of multilayers [see Price and Cosgrove, 1990]. Foldamplification implied an increase in length of the northernlimb of the Los Lobos anticline as well as a downwardmovement of the hinge of the La Popa syncline into theunderlying ductile layer.[42] The excess-area diagram predicts a detachment lo-
cated �3100 m below the P00-R reference line, and the shapeof the curve indicates that the Los Lobos anticline was not afault bend fold during Stage II (Figure 8). From this stageonward the Los Lobos anticline is interpreted as a detach-ment fold taking into account the following factors: (1) theresults from the excess-area diagram; (2) the progressivechange in dip of the back limb inferred from the restora-tions; (3) the absence of surface faults that could begenetically related to the Los Lobos anticline; (4) the
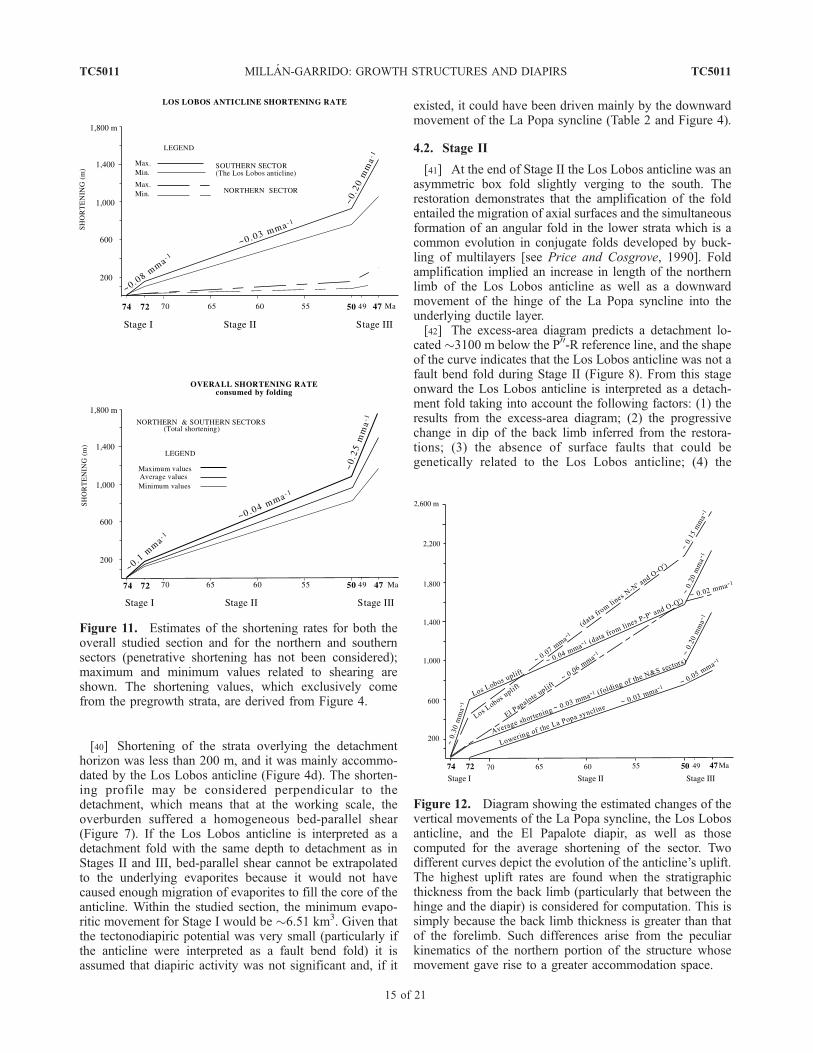
Figure 11. Estimates of the shortening rates for both theoverall studied section and for the northern and southernsectors (penetrative shortening has not been considered);maximum and minimum values related to shearing areshown. The shortening values, which exclusively comefrom the pregrowth strata, are derived from Figure 4.
Figure 12. Diagram showing the estimated changes of thevertical movements of the La Popa syncline, the Los Lobosanticline, and the El Papalote diapir, as well as thosecomputed for the average shortening of the sector. Twodifferent curves depict the evolution of the anticline’s uplift.The highest uplift rates are found when the stratigraphicthickness from the back limb (particularly that between thehinge and the diapir) is considered for computation. This issimply because the back limb thickness is greater than thatof the forelimb. Such differences arise from the peculiarkinematics of the northern portion of the structure whosemovement gave rise to a greater accommodation space.
TC5011 MILLA N-GARRIDO: GROWTH STRUCTURES AND DIAPIRS
15 of 21
TC5011
presence of a thick ductile unit that could potentially fill thecore of the anticline. The characteristics of the evaporiticunit make it an ideal detachment horizon, and thus it hasbeen assumed that a deeper depth to detachment, such asthat calculated for stage III, would also be located within aductile horizon; (5) detachment folds are the prevailingfolding style in the region [e.g., De Cserna, 1989; Grayand Johnson, 1995; Fischer and Jackson, 1999], and (6) thetype of folding style where the deformed area remains insection (detachment/fault propagation folds) may betteraccount for folding and coeval diapirism than fold bendfolding which consumes most of the shortening in trans-porting area out of section. Diapiric activity is more likely tooccur with detachment folds than with fault propagationfolds because the former may share the same source horizonand genetic mechanism (i.e., flow of ductile rocks).[43] The shortening profile for Stage II indicates that this
long period of time (�22 Ma) was characterized by nearlyhomogeneous layer-parallel shear (Figure 7) and that short-ening was mainly consumed in the southern sector by theLos Lobos anticline.[44] Table 2 and Figure 13 illustrate that during Stage II,
an important amount of evaporites (�18.66 km3) wereforced to migrate firstly by the downward shift of the LaPopa syncline (�17.52 km3) and secondly by horizontalcompression (�1.14 km3). The tectonodiapiric potentialwas very high (�17.49 km3) and could easily account forthose evaporites consumed by the El Papalote diapir(�13.00 km3); the difference may be considered as rocks
that were extruded onto the paleosurface and/or rocks thatmoved out of the studied band.
4.3. Stage III
[45] From a geometrical point of view there are nosignificant differences between Stages II and III. Thecomputed detachment level for Stage III is 3250 m belowthe P00-R reference which is slightly deeper than the oneinferred for Stage II (3100 m). The shortening profile is alsosimilar though simple shear became more relevant(Figure 7). The main difference arises in relation to thetectonodiapiric potential. The ductile mass pushed byshortening (�2.94 km3 + �2.43 km3) was mostly consumedin the core of the anticline (�4.23 km3) and the tectono-diapiric potential is dramatically reduced (�1.11 km3). ThusStage III may be considered a period of diapiric quiescence,which on the other hand is consistent with field data. In fact,given that the El Papalote diapir was sealed by the upperdeposits of the Potrerillos Formation, it is assumed thatcompression could squeeze evaporites out of the diapir.
4.4. Stage IV
[46] The present day balanced cross section (Stage IV)shows the Los Lobos anticline as an angular fold, except forthe uppermost hinge zone, whose forelimb and back limbhave been locally deformed by the El Gordo diapir and theEl Papalote diapir, respectively.[47] The calculated depth to detachment is 1700 m below
the selected reference, which would imply a substantial riseon the position of the depth to detachment (Figure 8). Thechange in depth to detachment cannot be discarded whendealing with the evolution of detachment folds [see Homzaand Wallace, 1995], and it is easy to verify when there aredownward shifts (e.g., Stage III in this paper) but difficultwhen it corresponds to upward shifts. In our case theprediction may not be real because, even though it satisfiesthe geologic and geometric requirements, those require-ments can also be fulfilled without varying the depthcalculated for Stage III.[48] Stage IV is characterized by the predominance of
simple shear over pure shear and by the largest values ofshortening (Figure 7). Moreover, both sectors took upanalogous amounts of shortening, which for the northernone implies an important increment with regard to previousstages. In fact, during this stage the Los Lobos anticlineincreased its tightness and vergence, the strata that sur-rounded the El Papalote diapir were strongly tilted, those inthe crest were uplifted, and the reverse fault that fed thediapir was overturned acquiring a normal attitude.[49] Concerning halokinesis, the flow of the evaporites
would have been affected by the structural evolution inStage IV. Particularly, the large amount of shorteninginferred for this stage (which, because of the importanceof the simple shear component was progressively greater instratigraphically upper units) was likely to squeezeevaporites out of the El Papalote diapir. The latter assump-tion is consistent with the inferred expulsion of evaporitesfrom the core of the Los Lobos anticline (see Figure 4 andTable 2), which in turn would have favored the injection of
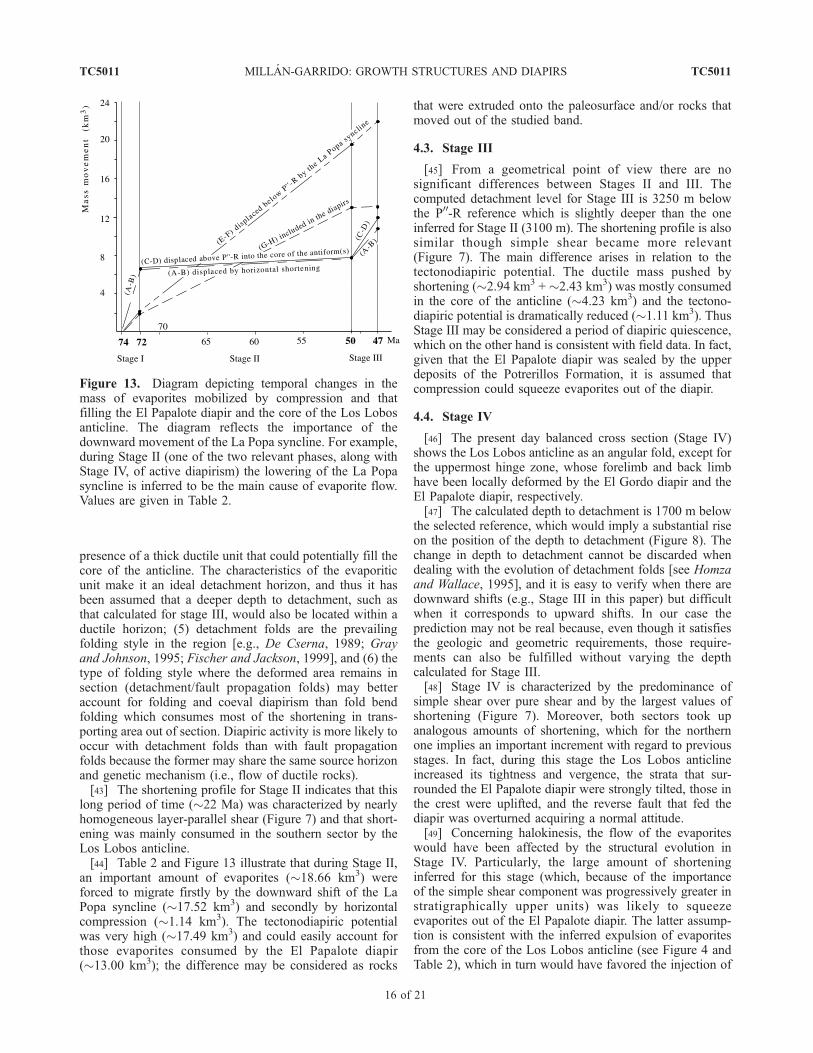
Figure 13. Diagram depicting temporal changes in themass of evaporites mobilized by compression and thatfilling the El Papalote diapir and the core of the Los Lobosanticline. The diagram reflects the importance of thedownward movement of the La Popa syncline. For example,during Stage II (one of the two relevant phases, along withStage IV, of active diapirism) the lowering of the La Popasyncline is inferred to be the main cause of evaporite flow.Values are given in Table 2.
TC5011 MILLA N-GARRIDO: GROWTH STRUCTURES AND DIAPIRS
16 of 21
TC5011
evaporites into the El Gordo diapir. For this period, thetectonodiapiric potential, (>10.53 km3, including the rocksexpelled from the core of the anticline because of areduction of space) would have been large enough toaccount for the rocks included in the El Gordo diapir.
5. Discussion
5.1. Shortening, Uplift, and Evaporite Transport Rates
[50] The computed shortening values (Figure 7) showthat during each stage of structural development there weresubstantial differences between the northern and the south-ern sectors. These differences became less important atStage IV. In addition, inspection of the shortening ratesobtained for Stages I, II, and III indicates that there aresignificant variations between these three stages (Figure 11).The average values of total shortening consumed by foldingindicate that there was a decrease in shortening rate duringStage II and an abrupt increase during Stage III. In any casethe shortening rates obtained herein for the La Popa basin(e.g., �0.04–0.25 mm yr�1) are comparable with thosededuced for other contractional environments also charac-terized by detachment tectonics (e.g., Southern Pyreneesthrust front) [see Poblet and Hardy, 1995] where the ratesare usually below 1 mm yr�1.[51] A comparison between the rates of growth of the Los
Lobos anticline, the La Popa syncline, the El Papalotediapir, and overall shortening is presented in Figure 12.The studied period lasts �27 Ma, from the base of theMuerto Formation to the top of the Viento Formation. Thereis a direct relationship between the shortening taken up inthe internal deformation of the thrust sheet (i.e., thatconsumed by the development of the detachment anticline),the uplift of the diapir, and the subsidence of the synclinehinge; the latter relation is especially evident during StageII. Thus field observations and the results presented hereinstrongly suggest that compressional tectonics primarilycontrolled the evolution of diapirism of the La Popa basin.[52] When comparing Figures 12 and 13 it is evident that
shortening and the mass of evaporites mobilized by flow aredirectly related. Shortening consumed by horizontal dis-placement (here called horizontal shortening) can be differ-entiated from the shortening accommodated by verticalmovements (like the downward movement of the La Popasyncline). In this case, the latter always played the mostrelevant role, probably because of the geometry and foldingstyle of the tectonic structures. In fact, the main phase ofactive diapirism (Stage II) coincided with a decrease of theshortening rate but with a significant increase in the verticalmovement accommodated by the sinking of the La Popasyncline.[53] There are three notable aspects about the interrela-
tionships between evaporite movements and tectonics high-lighted in this work. First, the fact that the increase indiapiric activity does not depend on the total mass ofevaporites mobilized but on the tectonodiapiric potential.For instance, Table 2 shows that similar amounts of evap-orites were forced to migrate by shortening during Stages Iand IV (8.61 and 7.74 km3 respectively); however, they
were mainly consumed by the growth of the anticline duringStage I, whereas during Stage IV they could feed the ElGordo diapir because ‘‘they were not required’’ for thedevelopment of any tectonic structure. Secondly, it goeswithout saying that for the same or similar amounts ofshortening, the deeper the depth to detachment, the largerthe mass of ductile rocks mobilized by tectonism. The thirdaspect deals with the effect of pure/simple shearing inhalokinesis. Note that the remarkable increase of shorteninginferred for Stage IV, mainly taken up by simple shear, didnot provoke an equivalent increment of flow (see Tables 1and 2). Apart from the depth to detachment, this was mainlythe result of the prevailing type of deformation process.Deformation in Stage IV was conducted by simple shearingand, for a given amount of total shortening, simple shearwas less efficient than pure shear in causing the migration ofthe ductile rocks because the greatest shortening wasconsumed by folding of the upper competent strata.
5.2. Structural and Diapiric Evolution
[54] The evolution of the Los Lobos anticline and the ElPapalote and El Gordo diapirs may be summarized asfollows:[55] During Stage I (Muerto Formation), that lasted
�2 Ma, the Los Lobos detachment anticline experienced arapid growth. It would have been accompanied by a high rateof evaporite movement produced by horizontal shortening ifthe anticline is interpreted as a detachment fold (Figures 12and 13). It is not possible to say with certainty if there wasdiapirism during Stage I because the oldest syndiapiricdeposits that crop out around the El Papalote diapir belongto the Potrerillos Formation. It has been assumed thatdiapiric phenomena, because of the low tectonodiapiricpotential (if they existed), were only of minor importance.[56] Stage II (Potrerillos Formation) is the longest period
studied (�22 Ma), and records the greatest development ofthe El Papalote diapir. During this stage the greater part ofthe displacement was transmitted to the southern sectorwhere it was consumed by the growth of the anticline. Inthe northern sector, during the most active phase of diapirdevelopment, the horizontal shortening accommodated bycompetent strata was not significant. The most outstandingprocess was the downward movement of the syncline that,along with an increase in shortening dominated by pureshear mechanisms, provoked a remarkable increase in thetectonodiapiric potential (Table 2 and Figure 4c). Althoughthe extrusion of evaporites stopped before the end of thisstage the existence of syndiapiric strata covering the diapirindicates that its growth did not cease with the sealing of thestructure [e.g., Laudon, 1996; Lawton and Giles, 1997].[57] During the �3 Ma that lasted the sedimentation of
the Adjuntas and the Viento Formations (Stage III) both theuplift and the shortening rates of the anticline increased(Figure 12). Evidence for reactivation of the El Papalotediapir comes from the Viento Formation, which thickensaway from the El Papalote diapir [Laudon, 1996] and thinstoward the hinge of the Los Lobos anticline, suggesting thatboth structures were active contemporaneous with sedimen-tation. It has been considered that there was not a significant
TC5011 MILLA N-GARRIDO: GROWTH STRUCTURES AND DIAPIRS
17 of 21
TC5011
development of the El Gordo diapir because of the lowTDP; most of the increment of the ductile mass displaced byshortening would have been consumed in the core of theanticline (Figure 4b and Tables 1 and 2).[58] After sedimentation of the Viento Formation (Stage
IV; 47 Ma � ?), and coevally with the main development ofthe La Popa reverse fault, the Los Lobos anticline experi-enced the largest shortening increment; in the northernsector compression mainly deformed the El Papalote diapir(Figure 4a). On the basis of the present restoration, it can beinferred that the major development of the El Gordo diapirwas most probably coeval with this stage because anothermajor phase of evaporite movement free from tectonicrequirements occurred during this time. In addition, therewould have been a significant contribution of those evap-orites evacuated from the core of the anticline (Tables 1, 2),as well as evaporites squeezed out of existing sealed diapirs.Simple shearing was the principal type of displacement thatprovoked the structural change attained during Stage IV.This displacement was likely to be less efficient than pureshear in causing the migration of the ductile rocks becausethe greatest shortening was consumed by the upper strata.[59] Taking into account the kinematics deduced for the
Los Lobos anticline and the La Popa syncline, and that thelarge thickness of the ductile horizon would not haverestricted the movements of the overburden, it seemsreasonable to think that during Stage IV the depth todetachment remained in the same or in a similar positionto that during Stages II–III. Finally, if the depth to detach-ment did not vary significantly but the competent stratainvolved in the Delgado, Los Lobos, and La Popa foldssubsided (see Figure 2), there would have been a muchlarger evacuation of ductile rocks and as a consequence alarger increment of tectonodiapiric potential than that com-puted here. Note that the detachment would be higher thanthe one shown in Figure 2.
6. Mechanism of Emplacement: Discussion
[60] Many extensive regions of mountain belts or evap-oritic provinces developed by compressional decollementtectonics are affected by diapiric structures that fed from thesame ductile source (e.g., Zagros belt of Iran, Salt Rangearea of Pakistan, Pyrenean chain, . . .). In these regions, as inother geological environments dominated by salt tectonics,the mechanism of diapiric emplacement greatly depends onthe intrinsic material properties (ductility, density, etc.) andabundance of the ductile material, on the physical-geolog-ical characteristics of the overburden (e.g., density, strength,thickness, etc.), on the timing relationships between diapir-ism and tectonics, and on the effect of deformation on boththe overburden and the underlying source horizon [e.g.,Koyi, 1988; Schultz-Ela et al., 1993; Davison et al., 1993;Daudre and Cloething, 1994; Letouzey et al., 1995;Waltham, 1997; Cotton and Koyi, 2000; Sans, 2003].[61] The evaporites of the La Popa basin and adjacent
regions depict the following geological features: (1) theoldest evaporitic rocks exposed in the region consist of salt,anhydrite, and gypsum generally accepted as of Callovian
age and known as Minas Viejas Formation [Salvador,1987]; (2) the minimum thickness of the evaporate sequenceis 1240 m, which corresponds to 470 m of salt are overlainby 770 m of anhydrite and gypsum [Weidie and Murray,1967]; (3) the evaporites included in the El Papalote and ElGordo diapirs contain inclusions of Jurassic to Early Cre-taceous carbonates and/or plutonic-igneous and metavol-canic rocks [McBride et al., 1974; Laudon, 1984, 1996;Garrison and McMillan, 1997]. According to Garrison andMcMillan [1997], the igneous and metavolcanic basementblocks are from the salt/basement interface.[62] In a nearby area, between Monterrey and the La
Popa basin, the existence of large amounts of salt in the coreof anticlines is proven from well data; in Potrero MinasViejas a wildcat well cut over 10,000 feet of halite [Grayand Johnson, 1995]. Wall et al. [1961] studied the relationbetween the tectonic and diapiric structures of the afore-mentioned area (specifically in Sierra del Fraile) and con-cluded that compressional forces triggered the upwardmovement of salt and were of primary importance in thedevelopment of diapirs.[63] Salt, anhydrite, and gypsum are among the most
efficient gliding and diapiric materials because of theirrheological characteristics. Experimental work on anhydrite[Muller and Briegel, 1978; Muller et al., 1981] and obser-vations of Jordan and Nuesch [1989], de Ruig [1995],demonstrate that anhydrite can flow at low temperatureand at relatively shallow depths (>1.6 km). Muller et al.[1981], on the basis of deformation experiments on anhy-drite rocks of different grain sizes, indicate that fine-grainaggregates weaken rapidly above temperatures of 100� to200�C, especially at slow strain rates. On the other hand,because of the relative high density of anhydrite, anhydrite-bearing diapirs have been considered the result of thecombination of active diapirism and low viscosity ratherthan to the effect of buoyancy [e.g., de Ruig, 1995].Moreover, within an open system with respect to fluids,the role of anhydrite in diapirism and salt tectonics wouldmainly be limited to depths below 800 m because fromapproximately that depth upward anhydrite is not stable andgenerally hydrates to gypsum [e.g., Murray, 1964; Braitsch,1971].[64] Rock salt may be considered extraordinarily weak
(see, e.g., Talbot and Rogers, 1980] though its resistance todeformation is a function of the strain rate. The lower thestrain rate, the smaller the resistance to deformation. Saltmay flow by dislocation creep at response to very low shearstresses (<1 MPa) [Carter and Hansen, 1983). Furthermore,as other evaporites, under the effect of trace amount ofwater, salt will deform by solution transfer creep at muchlower stresses and more rapidly [e.g., Urai, 1983, 1985;Spiers et al., 1986; Urai et al., 1986].[65] In the La Popa basin, field and geometrical data
presented herein indicate that the El Gordo and El Papalotediapirs developed as active diapirs during Late Cretaceous-Tertiary compression. Under this scenario, the initiation ofdiapirism would have taken place as the result of flexuralfolding and thrusting long after the deposition of theJurassic evaporites. Thus evaporites would have had to
TC5011 MILLA N-GARRIDO: GROWTH STRUCTURES AND DIAPIRS
18 of 21
TC5011

force their intrusion by piercing and displacing a thick andstrong overburden.[66] The basic mechanism that explains this type of
diapiric emplacement was proposed by N. J. Price in 1969(quoted from Ala [1974]), and later by Price and Cosgrove[1990]. They proposed the hydraulic fracturing theory as amechanism of salt injection. The essence of the matter is (1)the diapiric material must behave as a fluid by the combinedeffect of pressure and temperature, (2) across the boundarybetween the overburden and the ductile layer, the pressure(magnitudes of stress) in the salt must be much higher thanthe pressure of the overlying rocks plus the cohesivestrength, and (3) a weakness in the overburden that reducesor eliminates the cohesive strength of the rock, such as afault, and that establishes a conduit to surface is needed. Thelarge imbalance between the pressure in the salt and thefluid pressure in the fault, at the salt-overburden boundary,causes the salt to be injected into the fracture.[67] Price and Cosgrove [1990] maintained that the salt
rises, occupying the space formerly filled by the overlyingrocks, and that this may be accomplished by pushing up andback the overburden (i.e., flexuring, compaction of theoverburden, . . .) and by the mechanism of stoping. Oncebegun, the process goes on with the aid of tectonic forces,though other forces such as buoyancy could aid the diapiricrise of the salt. The recurrence of the process gives rise tothe widening of the diapiric structure, which tends tobecome progressively more pronounced as the surface isapproached, where the cover rocks are usually weaker.Because salt intrudes along a fracture, the lower levels ofthe diapiric structure are likely to be elliptical rather thancircular in plan. Along with flexuring and compaction of thecover rocks, the creation of space will also be accomplishedby the displacement of the roof of the diapir upward eitherby faulting, folding, or by the conjunction of both mecha-nisms [e.g., Schultz-Ela et al., 1993; Davison et al., 1993;Tikoff et al., 1999].[68] In the La Popa basin, the estimated values of strain
rate and temperature may be considered favorable for theflowage of anhydrite and salt subjected to the Late Creta-ceous-Tertiary compression. Besides these two propitiousfactors, there is a third one that played a key role on theforceful intrusion of the evaporites. This is the pressureimbalance between cover and source rocks. The pressure inthe ductile layer was attained by the action of lithostaticloading and compressional forces that tend to reduce thespace occupied by the evaporites and that eventually forcedtheir expulsion. In the La Popa basin the space of theevaporitic horizon suffered a dramatic reduction becauseshortening was accommodated not only by the lateraldisplacement of the cover rocks but also by their downwarddisplacement (see Figures 3 and 4). For the studied struc-ture, and departing from an initial space of 184.8 km3
(Figures 4 and 9), the cumulative space reduction of theevaporite horizon was 1.13%, 10.62%, 11.22%, and 16.93%for Stages I, II, III, and IV respectively. Thus such a notablereduction in space can be interpreted as the result of anincrease of pressure within the evaporitic layer, in otherwords, as the result of a significant augmentation of the
diapiric overpressure, and subsequent expulsion of theductile rocks, caused by tectonic compression.[69] The importance of diapiric overpressure can be
assessed when comparing its role with the one played bytemperature and strain rate after the first major phase ofdiapiric uprise (i.e., Stage II), that is to say, once anappropriate temperature for diapiric flowage had beenreached. Compression went on during Stage III and, theo-retically, the temperature in the evaporites was higher thanthe previous stage and there existed an adequate strain rate(i.e., �1.9 � 10�16 s�1). However, the second major phaseof diapiric uprise took place during Stage IV, coincidingwith a new large increase in diapiric pressure (i.e., a largereduction of space in the evaporite layer).[70] On the other hand, from a mechanical point of view,
the occurrence of Jurassic to Lower Cretaceous carbonateblocks in the diapirs may be interpreted as the result ofstoping, which is also consistent with a forceful injectionmechanism. The existence of igneous and metavolcanicinclusions in the diapirs may be related to the entrainmentof basement blocks at or near the salt/basement interface,and uplifting through the diapir, because of dragging of theductile material mobilized by tectonic shortening.[71] Finally, in view of the tectonic setting, the syntec-
tonic character of the upper Cretaceous-Tertiary deposits,and the physical properties of the evaporites involved in thestructure of the La Popa basin, it seems reasonable to thinkthat differential loading and buoyancy have also contributedto the redistribution of the evaporites and its diapiric uprise.Differential loading was likely to act from Stage I onwardmainly in response to thickness variations in the syntectonicdeposits and to differences in surface relief caused byfolding and thrusting. On the other hand, because of thelow density and the viscosity of salt, it is likely that from theinitiation of diapirism buoyancy forces enhanced diapiricuprising. Furthermore, above �800 m depth the substantialvolume increase caused by rehydration of anhydrite togypsum could also aid to sustain diapiric rise. However,the relevance of differential loading and buoyancy effectmust have been small in comparison to tectonic loading.The large control of tectonic forces on the evolution ofdiapirism is well reflected in Figure 12 that shows similar(Stage II) or higher values (Stage III) of shortening rateswith regard to the rate of lowering of the la Popa syncline.This cause and effect relationship, which is also coherentwith the structural evolution inferred for Stage IV (seeFigure 4), confirms that the deepening of the La Popasyncline, and its implications in terms of horizontal-over-pressure and mass movements, was a direct consequence oftectonic contraction.
7. Conclusions
[72] Deformation in the La Popa basin took place in acontractional setting where detachment folding was thedominant style and tectonic evolution was controlled bythe Upper Jurassic evaporite horizon. A photogeologicalstudy as well as field data from the Upper Cretaceous-Tertiary rocks involved in the Los Lobos and the Tulillo
TC5011 MILLA N-GARRIDO: GROWTH STRUCTURES AND DIAPIRS
19 of 21
TC5011
anticlines as well as in the La Popa reverse fault reveal theexistence of syntectonic sediments extending from Maas-trichtian to Eocene (i.e., Difunta Group). The depth todetachment for the partially restored sections correspondingto Latest Cretaceous and Early Tertiary age (Stages II andIII) predicts maximum values of 3250 m below the over-burden which can be interpreted as the minimum originalthickness of the ductile horizon.[73] Geometric analysis provided a methodology for the
restoration of growth folds that developed coevally withshearing and the determination the tectonodiapiric potential(TDP) of an area undergoing several deformational stages.There is a direct correspondence between tectonodiapiricpotential and diapiric activity in the La Popa basin such thatthe highest tectonodiapiric potential coincides with the twomajor phases of diapirism (Stages II and IV), whereas thoseperiods of diapiric quiescence or low diapiric activity (e.g.,Stage III) were characterized by much lower or irrelevanttectonodiapiric potential.[74] The shortening profiles from consecutive palinspas-
tic restorations allowed the calculation of the amount ofshortening and an investigation of the prevailing type ofdeformation process (pure/simple shear) experienced by amultilayered sequence during the structural evolution of thebasin. Within the studied section the deformation of theoverburden during stages I, II and III was mainly caused bypure shear; simple shear progressively increased, and moreso at the end of Stage II. Stage IV was characterized by thepredominance of simple shear over pure shear and by thelargest values of shortening.[75] Tectonostratigraphic and structural data, the predic-
tions of the tectonodiapiric potential, as well as the infor-mation resulting from restored and partially restored crosssections demonstrate that contractional tectonics can ac-count for the diapirism of the La Popa basin. Vertical andhorizontal movements were the primary processes thatcontrolled the onset and/or evolution of the evaporitic flowand, as a consequence, the ones that drove the diapiricphenomena. The efficiency of those processes depended onthe folding style, amount of shortening, the depth todetachment, and also on the type of displacement (pure/simple shear).[76] The evaporites displaced by horizontal shortening
and those displaced by the lowering of the syncline hinge of
the La Popa syncline constituted the main mass that fedthe diapirs and filled the space generated at the core of theanticline; other processes such as the withdrawal of theevaporites squeezed by compression out of the core ofthe anticline reintegrated evaporites to the system. Thetwo major diapiric phases correspond to Stages II and IV,whereas Stages I and III were periods of diapiric quies-cence. The vertical movements due to the lowering of thesyncline displaced an amount of evaporites that, in theoverall deformation process, was greater than that displacedby horizontal movements and, in some cases, such as duringthe deposition of the Potrerillos Formation (Stage II), wasthe main driving force for diapirism.[77] Field, geometrical, and mechanical data indicate that
forceful intrusion was the prevailing emplacement mecha-nism for diapiric structures of the La Popa basin. Contem-poraneous development of compressional structures withdiapirs, the elevation of the diapirs’ roof strata aboveregional datum, the strong uplift and folding of beds thatsurround the diapirs, the presence of reverse faults associ-ated with the diapirs, as well as the inclusion of Jurassic andEarly Cretaceous carbonate blocks in the diapirs are coher-ent with a forceful intrusion mechanism. From a mechanicalpoint of view, the temperatures (in the interval 150�–197�C) and strain rates (in the order of 10�16–10�17 s�1)calculated for the top of the evaporite layer were adequatefor the flowage of these rocks from the initiation ofcompression onward. However, an inferred outstandingoverpressure in the ductile layer should be considered thekey element for the injection mechanism proposed here.
[78] Acknowledgments. I am indebted to A. Pocovı, G. Pardo, andJ. L. Simon for their support in obtaining a postdoctoral grant from theSpanish Government. I would like to thank T. Lawton for his company inSierra Madre in April 1998, and T. Giordano, G. Mack, B. Seager,N. McMillan, Lee, and also T. Lawton and Diana Lawton from the GeologyDepartment of the NMSU for their hospitality. I am indebted to F. Vega forgetting the aerial photographs. I am very grateful to R. Lisle and S. Ralserfor comments on an earlier version of the manuscript, and also to A. Meigs,C. Simpson, J. Verges, and an anonymous reviewer for constructivesuggestions and especially for their questions that contributed to improvethis work. I am especially thankful to my brother Michael for his constantand always generous support during my stay in New Mexico. Financialsupport was provided by a postdoctoral grant from the Spanish Government(project ‘‘Interacciones entre el diapirismo salino y el acortamiento encuencas de antepaıs: estructuras laramicas del NE de Mexico’’), by theNMSU, and by the projects BTE 2002-04168-C03-01/221-193 (DGA).
References
Ala, M. A. (1974), Salt diapirism in Southern Iran,AAPG Bull., 58, 1758–1770.
Arenas, C., H. Millan, G. Pardo, and A. Pocovı (2001),Ebro basin continental sedimentation associatedwith late compressional Pyrenean tectonics (north-eastern Iberia): Controls on basin margin fans andfluvial systems, Basin Res., 13, 65–89.
Braitsch, O. (1971), Salt Deposits: Their Origin andComposition, 297 pp., Springer-Verlag, New York.
Carter, N. L., and F. D. Hansen (1983), Creep of rocksalt, Tectonophysics, 92, 233–275.
Charleston, S. (1981), A summary of the structuralgeology and tectonics of the State of Coahuila,Mexico, in Lower Cretaceous Stratigraphy and
Structure, edited by C. I. Smith and S. B. Katz,W. Tex. Geol. Soc. Publ., 81–74, 28– 36.
Cotton, J. T., and H. A. Koyi (2000), Modeling of thrustfronts above ductile and frictional detachments: Ap-plication to structures in the Salt Range and PotwarPlateau, Pakistan, Geol. Soc. Am. Bull., 112, 351–363.
Daudre, B., and S. Cloetingh (1994), Numerical mod-elling of salt diapirism: Influence of the tectonicregime, Tectonophysics, 240, 59– 79.
Davison, I., M. Insley, M. Harper, P. Weston,D. Blundell, K. McClay, and A. Quallington(1993), Physical modelling of overburden deforma-tion around salt diapirs, Tectonophysics, 228,255–274.
DeCelles, P. G., M. B. Gray, K. D. Ridgway, R. B.Cole, P. Srivastava, N. Pequera, and D. A. Pivnik(1991), Kinematic history of a foreland uplift from
Paleocene synorogenic conglomerate, BeartoothRange, Wyoming and Montana, Geol. Soc. Am.Bull., 103, 1458–1475.
De Cserna, Z. (1989), An outline of the geology ofMexico, in The Geology of North America, vol. A,The Geology of North America: An Overview,edited by W. Bally and A. R. Palmer, pp. 233–264, Geol. Soc. of Am., Boulder, Colo.
de Ruig, M. J. (1995), Extension diapirism in the East-ern Prebetic foldbelt, southeastern Spain, in Salt
Tectonics: A Global Perspective, edited by M. P.A. Jackson, D. G. Roberts, and S. Snelson, AAPGMem., 65, 353–367.
Einsele, G. (1992), Sedimentary Basins: Evolution,
Facies and Sediment Budget, 628 pp., Springer-Verlag, New York.
TC5011 MILLA N-GARRIDO: GROWTH STRUCTURES AND DIAPIRS
20 of 21
TC5011
Epard, J. L., and R. H. Groshong Jr. (1993), Excess areaand depth to detachment, AAPG Bull., 77, 1291–1302.
Espinoza, E. F. (1989), Stratigraphy and sedimentologyof the Upper Cretaceous terrigenous rocks and coalof the Sabinas-Monclova area, northern Mexico,Ph.D. thesis, 315 pp., Univ. of Tex., Austin.
Fischer, M. P., and P. B. Jackson (1999), Stratigraphiccontrols on deformation patterns in fault-relatedfolds: A detachment fold example from the SierraMadre Oriental, northeast Mexico, J. Struct. Geol.,21, 613–633.
Ford, M., E. A. Williams, A. Artoni, J. Verges, andS. Hardy (1997), Progressive evolution of a fault-related fold pair from growth strata geometries,Sant Llorenc de Morunys, SE Pyrenees, J. Struct.Geol., 19, 413–441.
Garrison, J. M., and N. J. McMillan (1997), Geochem-istry of allochthogenic igneous and metavolcanicblocks from the Papalote evaporite diapir, La Popabasin, Nuevo Leon, Mexico, Geol. Soc. Am. Abstr.Programs, 29, 10.
Giles, K. A., and T. F. Lawton (1999), Attributes andevolution of an exhumed salt weld, La Popa basin,northeastern Mexico, Geology, 27, 323–324.
Gray, G. C., and C. A. Johnson (1995), Structural andtectonic evolution of the Sierra Madre Oriental,with emphasis on the Saltillo-Monterrey corridor,in Field Trip Guidebook 10, pp. 1 – 17, Am. Assoc.of Pet. Geol., Tulsa, Okla.
Homza, T. X., and W. K. Wallace (1995), Geometricand kinematic models for detachment folds withfixed and variable detachment depths, J. Struct.Geol., 17, 575–588.
Hossack, J. R. (1995), Geometric rules of sectionbalancing for salt structures, in Salt Tectonics: AGlobal Perspective, edited by M. P. A. Jackson,D. G. Roberts, and S. Snelson, AAPG Mem., 65,29– 40.
Jackson, M. P. A., D. G. Roberts, and S. Snelson (Eds.)(1995), Salt Tectonics: A Global Perspective, AAPGMem., 65, 454 pp.
Jamison, W. R. (1992), Stress controls on fold thruststyle, in Thrust Tectonics, edited by K. R. McClay,pp. 155–164, Chapman and Hall, New York.
Jordan, P., and R. Nuesch (1989), Deformation struc-tures in the Muschelkalk anhydrites of the Scha-fisheim well Jura overthrust, Northern Switzerland,Eclogae Geol. Helv., 82, 429–454.
Koyi, H. (1988), Experimental modeling of role ofgravity and lateral shortening in Zagros mountainbelt, AAPG Bull., 72, 1381–1394.
Laudon, R. C. (1984), Evaporite diapirs in the La Popabasin, Nuevo Leon, Mexico, Geol. Soc. Am. Bull.,95, 1219–1225.
Laudon, R. C. (1996), Salt Dome growth, thrust faultgrowth, and syndeformational stratigraphy, La Popabasin, northern Mexico, Trans. Gulf Coast Assoc.Geol, Soc., XLVI, 219–228.
Lawton, T. F., and K. A. Giles (1997), El Papalotediapir, La Popa basin: Structure, stratigraphyand paleontology of Late Cretaceous-Early Ter-tiary Parras-La Popa foreland basin near Monter-rey, northeast Mexico, in Field Trip Guidebook
10, pp. 55–74, Am. Assoc. of Pet. Geol., Tulsa,Okla.
Letouzey, L., B. Colleta, R. Vially, and J. C. Chermette(1995), Evolution of salt-related structures in com-pressional settings, in Salt Tectonics: A Global Per-spective, edited by M. P. A. Jackson, D. G. Roberts,and S. Snelson, AAPG Mem., 65, 41–60.
Marzo, M., J. A. Munoz, and J. Verges (Eds.) (2002),Growth strata, Sediment. Geol., 146, 208 pp.
McBride, E. F., A. E. Weidie, J. A. Wolleben, and R. C.Laudon (1974), Stratigraphy and structure of theParras and La Popa basins, northeastern Mexico,Geol. Soc. Am. Bull., 84, 1603–1622.
Meigs, A. J. (1997), Sequential development ofselected Pyrenean thrusts, J. Struct. Geol., 19,481–502.
Mitra, S., and J. Namson (1989), Equal-area balancing,Am. J. Sci., 289, 563–599.
Mitre-Salazar, L.M. (1981), Las imagenes LANDSAT—Unaherramienta util en la interpretacion geologico-estructural, un ejemplo en el noreste de Mexico,Rev. Inst. Geol. Univ. Nac. Auton. Mex., 5, 37–46.
Mount, V. S., J. Suppe, and S. C. Hook (1990),A forward modeling strategy for balancing cross-sections, AAPG Bull., 74, 521–531.
Muller, W. H., and U. Briegel (1978), The rheologicalbehaviour of polycrystalline anhydrite, EclogaeGeol. Helv., 70, 397–407.
Muller, W. H., S. M. Schmidt, and U. Briegel (1981),Deformation experiments on anhydrite rocks of dif-ferent grain sizes: Rheology and microfabric, Tec-tonophysics, 78, 527–543.
Murray, G. E. (1959), Introduction and regional geo-logic summary of field trip area, southeasternCoahuila and Nuevo Leon, in South Texas Geolog-ical Society Field Guidebook, pp. 1 – 14, S. Tex.Geol. Soc., San Antonio, Tex.
Murray, G. E., A. E. Weidie Jr., D. R. Boyd, R. H.Forde, and P. D. Lewis Jr. (1962), Formationaldivisions of Difunta Group, Parras basin, Coahuilaand Nuevo Leon, Mexico, AAPG Bull., 46, 374 –383.
Murray, R. C. (1964), Origin and diagenesis of gypsumand anhydrite, J. Sediment. Petrol., 34, 512–523.
Poblet, P., and S. Hardy (1995), Reverse modellingof detachment folds: Application to the Pico delAguila anticline in the south central Pyrenees(Spain), J. Struct. Geol., 17, 1707–1724.
Price, N. J., and J. W. Cosgrove (1990). Analysis ofGeological Structures, 502 pp., Cambridge Univ.Press, New York.
Riba, O. (1976), Syntectonic unconformities of the AltoCardener, Spanish Pyrenees: A genetic interpreta-tion, Sediment. Geol., 15, 213–233.
Rowan, M. G. (1996), Benefits and limitations of sec-tion restoration in areas of extensional salt tec-tonics: An example from offshore Louisiana, inModern Developments in Structural Interpretation,
Validation and Modelling, edited by P. G. Buchananand D. A. Nieuwland, Geol. Soc. Spec. Publ., 99,147–161.
Salvador, A. (1987), Late Triassic-Jurassic paleogeog-raphy and origin of Gulf of Mexico basin, AAPGBull., 71, 419–451.
Sans, M. (2003), From thrust tectonics to diapirism:The role of evaporites in the kinematic evolutionof eastern South Pyrenean front, Geol. Acta, 3,239–259.
Schmoker, J. G., and R. B. Halley (1982), Carbonateporosity versus depth: A predictable relation forSouth Florida, AAPG Bull., 66, 2561–2570.
Schneider, C. L., C. Hummon, R. S. Yeats, and G. J.Huftile (1996), Structural evolution of the northernLos Angeles basin, California, based on growthstrata, Tectonics, 15, 341–355.
Schultz-Ela, D. D., M. P. A. Jackson, and B. C.Vendeville (1993), Mechanics of active saltdiapirism, Tectonophysics, 228, 275 –312.
Sclater, J., and P. Christie (1980), Continental stretch-ing: An explanation of the post mid-Cretaceoussubsidence of the central North Sea basin, J. Geo-phys. Res., 85, 3711–3739.
Soegaard, K. (1997), Tentative revision of stratigraphicsubdivision of Difunta Group in Parras, La Popaand Southern Sabinas basin, Northeast Mexico, inField Trip Guidebook 10, pp. 78–81, Am. Assoc.of Pet. Geol., Tulsa, Okla.
Spiers, C. J., J. L. Urai, G. S. Lister, B. J. Boland, andH. J. Zwart (1986), The influence of fluid-rockinteraction on the rheology of salt rock, in Nuclear
Science and Technology: EUR 10399 EN, vol. 10,131 pp., Comm. of the Eur. Communities, Brussels,Belgium.
Suppe, J. S., G. T. Chou, and S. C. Hook (1992),Rates of folding and faulting determined fromgrowth strata, in Thrust Tectonics, edited by
K. R. McClay, pp. 105–122, Chapman and Hall,New York.
Suppe, J., F. Sabat, J. A. Munoz, E. Poblet, E. Roca,and J. Verges (1997), Bed-by-bed fold growth bykink-band migration: Sant Llorenc de Morunys,eastern Pyrenees, J. Struct. Geol., 19, 443–461.
Suter, M. (1984), Cordilleran deformation along theeastern edge of the Valles-San Luis Potosıcarbonate platform, Sierra Madre Oriental fold-thrust belt, east-central Mexico, Geol. Soc. Am.Bull., 95, 1387–1397.
Talbot, C. J., and E. A. Rogers (1980), Seasonal move-ments in a salt glacier in Iran, Science, 208, 395–397.
Tardy, M., and J. Martınez (1976), Estructura de laSierra Madre Oriental (sector transversal, Estadode Coahuila), in Excursion 3: III Congreso Latino-americano de Geologıa, pp. 1 –28, Inst. de Geol.,Univ. Nac. Autom. de Mex., Mexico City.
Tardy, M., J. C. Carfantan, and C. Rangin (1986), Essayde sinthese sur la structure du Mexique, Bull. Soc.Geol. Fr., 8, 1025–1031.
Tikoff, B., M. de Saint Blanquant, and C. Teyssier(1999), Translation and the resolution of the plutonspace problem, J. Struct. Geol., 21, 1109–1117.
Urai, J. L. (1983), Water-assisted dynamic recrystalliza-tion and weakening in polycrystalline bischofite,Tectonophysics, 96, 125–157.
Urai, J. L. (1985), Water-enhanced dynamic recrystalli-zation and solution transfer in experimentallydeformed carnalite, Tectonophysics, 120, 285–317.
Urai, J. L., C. J. Spiers, H. J. Zwart, and G. S. Lister(1986), Weakening of rock salt by water duringlong-term creep, Nature, 324, 554–557.
Van Hinte, F. (1978), Geohistory analysis—Applicationof micropaleontology in exploration history, AAPGBull., 62, 201–222.
Vega-Vera, F. J. (1997), Biostratigraphy of DifuntaGroup in the La Popa and Parras basins, Cohauilaand Nuevo Leon, northeast Mexico, in Field TripGuidebook 10, pp. 75 – 77, Am. Assoc. of Pet.Geol., Tulsa, Okla.
Vega-Vera, F. J., and M. Perrilliat (1989), La presenciadel Eoceno marino en la cuenca de la Popa (GrupoDifunta), Nuevo Leon: Orogenia post-ypresiana,Inst. Geol. Rev., 8, 67– 70.
Vega-Vera, F. J., L. M. Mitre-Salazar, and E. Martınez-Hernandez (1989), Contribucion al conocimientode la estratigrafıa del Grupo Difunta (Cretacicosuperior-Terciario) en el noreste de Mexico, Rev.Inst. Geol. Univ. Nac. Auton. Mex., 8, 179–187.
Verges, J., D. W. Burbank, and A. Meigs (1996), Un-folding: An inverse approach to fold kinematics,Geology, 24, 175–178.
Wall, J. R., G. E. Murray, and T. Dıaz (1961), Geologicoccurrence of intrusive gypsum and its effect onstructural forms in Cohauila Marginal FoldedProvince of northeastern Mexico, AAPG Bull., 45,1504–1522.
Waltham, D. (1997), Why does salt start to move?,Tectonophysics, 282, 117–128.
Weidie, A. E., and G. E. Murray (1967), Geology of theParras basin and adjacent areas of Northern Mexico,AAPG Bull., 51, 678–695.
Wolleben, J. A. (1977), Paleontology of the DifuntaGroup (Upper Cretaceous-Tertiary) in northernMexico, J. Paleontol., 51, 1504–1522.
Ye, H. (1997), The arcuate Sierra Madre Oriental oro-genic belt, NE Mexico: Tectonic infilling of a recessalong the southwestern North American continentalmargin, in Field Trip Guidebook 10, pp. 82–115,Am. Assoc. of Pet. Geol., Tulsa, Okla.
���������H. Millan-Garrido, Area de Geodinamica Interna,
Departamento de Ciencias de la Tierra, Universidad deZaragoza, Pedro Cerbuna 12, E-50.009 Zaragoza,Spain. ([email protected])
TC5011 MILLA N-GARRIDO: GROWTH STRUCTURES AND DIAPIRS
21 of 21
TC5011