Kinematics of head movements accompanying speech during conversation
12
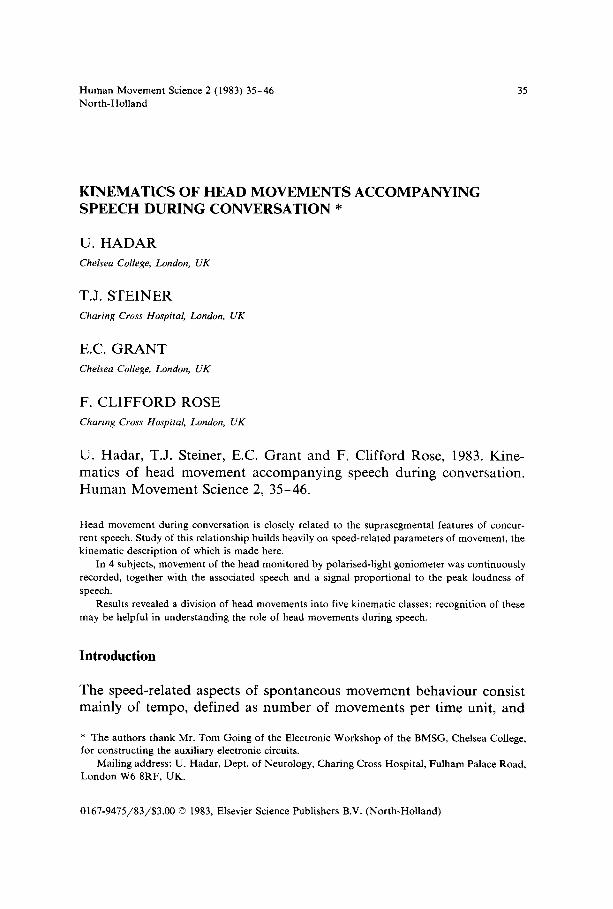
Human Movement Science 2 (1983) 35-46 North-Holland 35 KINEMATICS OF HEAD MOVEMENTS ACCOMPANYING SPEECH DURING CONVERSATION * U. HADAR Chelsea College, London, UK T.J. STEINER Charing Cross Hospital, London, UK E.C. GRANT Chelsea College, London, UK F. CLIFFORD ROSE Charrng Cross Hospital, London, UK U. Hadar, T.J. Steiner, E.C. Grant and F. Clifford Rose, 1983. Kine- matics of head movement accompanying speech during conversation. Human Movement Science 2, 35-46. Head movement during conversation is closely related to the suprasegmental features of concur- rent speech. Study of this relationship builds heavily on speed-related parameters of movement, the kinematic description of which is made here. In 4 subjects, movement of the head monitored by polarised-light goniometer was continuously recorded, together with the associated speech and a signal proportional to the peak loudness of speech. Results revealed a division of head movements into five kinematic classes: recognition of these may be helpful in understanding the role of head movements during speech. Introduction The speed-related aspects of spontaneous movement behaviour consist mainly of tempo, defined as number of movements per time unit, and * The authors thank Mr. Tom Going of the Electronic Workshop of the BMSG, Chelsea College, for constructing the auxiliary electronic circuits. Mailing address: U. Hadar, Dept. of Neurology, Charing Cross Hospital, Fulham Palace Road, London W6 8RF, UK. 0167-9475/83/$3.00 Q 1983, Elsevier Science Publishers B.V. (North-Holland)
Transcript of Kinematics of head movements accompanying speech during conversation
Human Movement Science 2 (1983) 35-46
North-Holland
35
KINEMATICS OF HEAD MOVEMENTS ACCOMPANYING SPEECH DURING CONVERSATION *
U. HADAR
Chelsea College, London, UK
T.J. STEINER
Charing Cross Hospital, London, UK
E.C. GRANT
Chelsea College, London, UK
F. CLIFFORD ROSE
Charrng Cross Hospital, London, UK
U. Hadar, T.J. Steiner, E.C. Grant and F. Clifford Rose, 1983. Kine- matics of head movement accompanying speech during conversation. Human Movement Science 2, 35-46.
Head movement during conversation is closely related to the suprasegmental features of concur-
rent speech. Study of this relationship builds heavily on speed-related parameters of movement, the
kinematic description of which is made here.
In 4 subjects, movement of the head monitored by polarised-light goniometer was continuously
recorded, together with the associated speech and a signal proportional to the peak loudness of
speech.
Results revealed a division of head movements into five kinematic classes: recognition of these
may be helpful in understanding the role of head movements during speech.
Introduction
The speed-related aspects of spontaneous movement behaviour consist mainly of tempo, defined as number of movements per time unit, and
* The authors thank Mr. Tom Going of the Electronic Workshop of the BMSG, Chelsea College, for constructing the auxiliary electronic circuits.
Mailing address: U. Hadar, Dept. of Neurology, Charing Cross Hospital, Fulham Palace Road, London W6 8RF, UK.
0167-9475/83/$3.00 Q 1983, Elsevier Science Publishers B.V. (North-Holland)
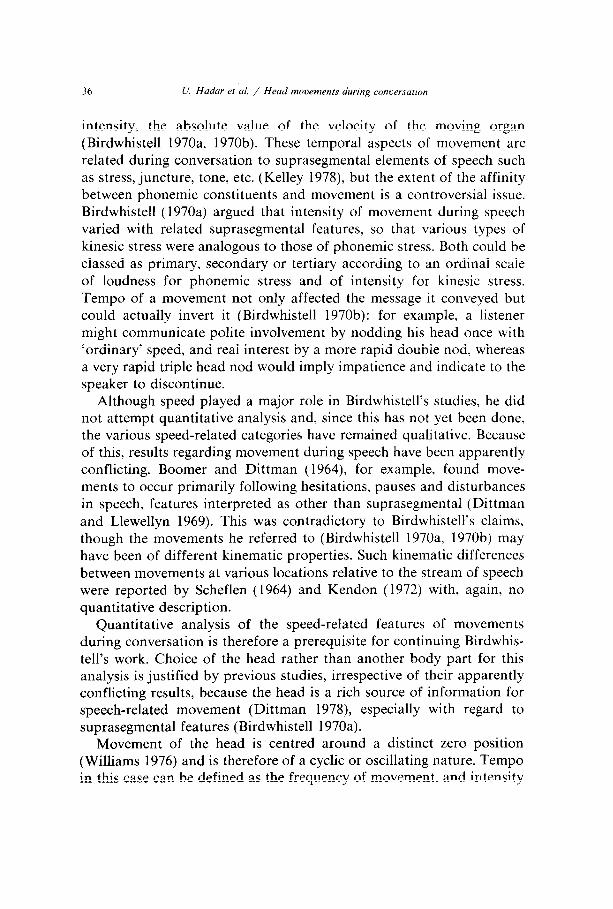
36 U. Hadar et al. / Head movements durrng conversatmn
intensity, the absolute value of the velocity of the moving organ (Birdwhistell 1970a, 1970b). These temporal aspects of movement are related during conversation to suprasegmental elements of speech such as stress, juncture, tone, etc. (Kelley 1978), but the extent of the affinity between phonemic constituents and movement is a controversial issue. Birdwhistell (1970a) argued that intensity of movement during speech varied with related suprasegmental features, so that various types of kinesic stress were analogous to those of phonemic stress. Both could be classed as primary, secondary or tertiary according to an ordinal scale of loudness for phonemic stress and of intensity for kinesic stress. Tempo of a movement not only affected the message it conveyed but could actually invert it (Birdwhistell 1970b): for example, a listener might communicate polite involvement by nodding his head once with ‘ordinary’ speed, and real interest by a more rapid double nod, whereas a very rapid triple head nod would imply impatience and indicate to the speaker to discontinue.
Although speed played a major role in Birdwhistell’s studies, he did not attempt quantitative analysis and, since this has not yet been done, the various speed-related categories have remained qualitative. Because of this, results regarding movement during speech have been apparently conflicting. Boomer and Dittman (1964), for example, found move- ments to occur primarily following hesitations, pauses and disturbances in speech, features interpreted as other than suprasegmental (Dittman and Llewellyn 1969). This was contradictory to Birdwhistell’s claims, though the movements he referred to (Birdwhistell 1970a, 1970b) may have been of different kinematic properties. Such kinematic differences between movements at various locations relative to the stream of speech were reported by Scheflen (1964) and Kendon (1972) with, again, no quantitative description.
Quantitative analysis of the speed-related features of movements during conversation is therefore a prerequisite for continuing Birdwhis- tell’s work. Choice of the head rather than another body part for this analysis is justified by previous studies, irrespective of their apparently conflicting results, because the head is a rich source of information for speech-related movement (Dittman 1978), especially with regard to suprasegmental features (Birdwhistell 1970a).
Movement of the head is centred around a distinct zero position (Williams 1976) and is therefore of a cyclic or oscillating nature. Tempo in this case can be defined as the frequency of movement, and intensity
U. Hadar et al. / Head movements during conversation 31
as the product of frequency and amplitude. These definitions, together with the importance of continuity and precision in the measurement of speech-related phenomena (Goldman-Eisler 1968) indicated the choice of experimental technique.
Method
Subjects
Subjects were four students and staff of the Department of Human Biology, Chelsea College, two men and two women of ages 25-55, A, B, C and D.
Apparatus and material
Head movements were detected by polarised-light goniometer (Crane Electronics) which operates by projecting strong light through a plane
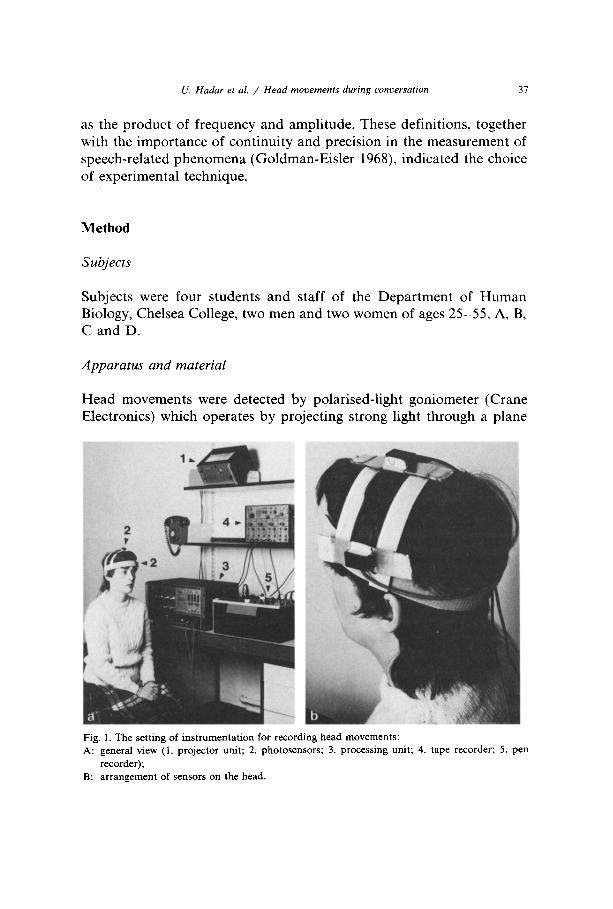
Fig. 1. The setting of instrumentation for recording head movements: A: general view (1. projector unit; 2. photosensors; 3. processing unit; 4. tape recorder; 5. pen
recorder);
B: arrangement of sensors on the head.

38 U. Hadar et al. / Head movements during conversation
polariser material and a rapidly rotating disc; phase differences be- tween a target photosensor and an external reference produce propor- tional voltage outputs which are processed and recorded (Mitchelson 1975). The target photosensors were attached to the subject’s head, one to the temple looking laterally and one to the vertex looking upward, and the polarised light was projected onto each at 45” from a distance of approximately 2 m (fig. 1). The rectified outputs of the two sensors were summed, producing a voltage proportional to the displacement of the head from a reference position, and continuously recorded on a 4-channel instrumentation recorder (Tandberg series 100) alongside the sound track of the conversation. In addition peak amplitudes of the sound waves (“peak loudness”) were recorded in synchrony with these signals (Hadar and Steiner 1982b).
Procedure
Subjects, seated facing the interviewer, were told that the sensors would record their head movements during the conversation to follow. Once the sensors were applied, they were encouraged to perform wide move- ments to ensure unrestricted movement and enhance habituation. A conversation was then conducted in which the subject described his work in detail, clarifying and discussing points raised by the inter- viewer. Conversations lasted 5- 10 minutes.
Chart analysis
Taped signals were re-played onto paper (Bioscience 400 MD 4C) at 25 mm/set, 24.8 mv/l” (fig. 2), for analysis of spectral composition. Local peaks in the movement charts were referred to as ‘extremums’, said to be of opposite signs if their curvatures were of opposite signs. The horizontal distance in mm between two extremums e, and e2 was denoted by H( e,, e,), and their vertical separation by V(e,, ez). Each triad of successive extremums e,, e2, e3, created a cycle in the chart. A cycle of non-zero velocity (see below) was ascribed to a “linear move- ment” if V( e,, e2) > 3V( e2, es). Every point P in the chart fell between two successive extremums, e,, e2, of opposite signs. The frequency F at P was given by F = 25/2H( el, ez). The absolute error involved in measurements of H gave rise to 1% error in the lowest calculated values of F, increasing proportionally with higher values to 15%. The ampli-
U. Hadar et al. / Head movements during conversation 39
I ‘1 ’ ” ” ” ” “1 t
s SECONDS
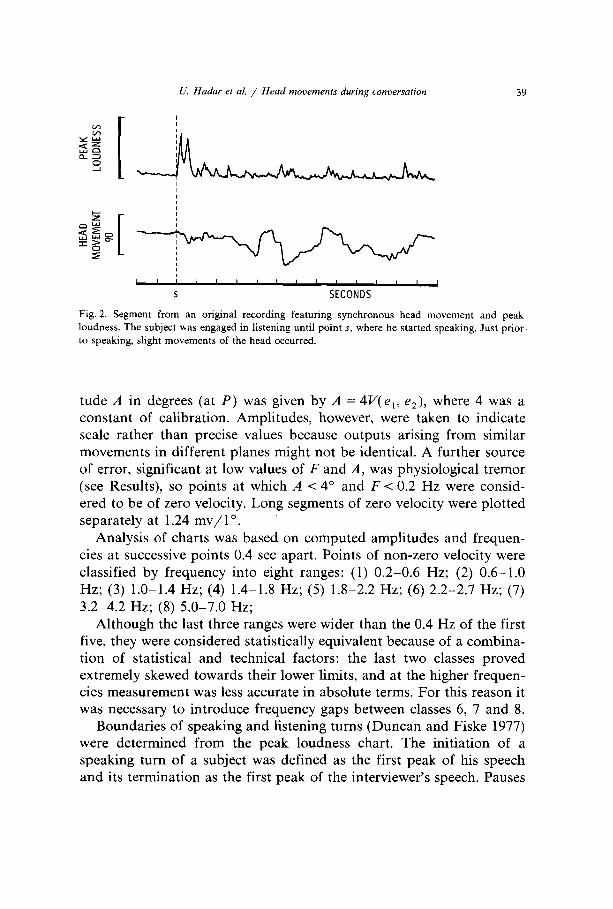
Fig. 2. Segment from an original recording featuring synchronous head movement and peak loudness. The subject was engaged in listening until point s, where he started speaking. Just prior
to speaking, slight movements of the head occurred.
tude A in degrees (at P) was given by A = 4V( e,, e2), where 4 was a constant of calibration. Amplitudes, however, were taken to indicate scale rather than precise values because outputs arising from similar movements in different planes might not be identical. A further source of error, significant at low values of F and A, was physiological tremor (see Results), so points at which A -C 4” and F-e 0.2 Hz were consid- ered to be of zero velocity. Long segments of zero velocity were plotted separately at 1.24 mv/ lo.
Analysis of charts was based on computed amplitudes and frequen- cies at successive points 0.4 set apart. Points of non-zero velocity were classified by frequency into eight ranges: (1) 0.2-0.6 Hz; (2) 0.6-1.0 Hz; (3) 1.0-1.4 Hz; (4) 1.4- 1.8 Hz; (5) 1.8-2.2 Hz; (6) 2.2-2.7 Hz; (7) 3.2-4.2 Hz; (8) 5.0-7.0 Hz;
Although the last three ranges were wider than the 0.4 Hz of the first five, they were considered statistically equivalent because of a combina- tion of statistical and technical factors: the last two classes proved extremely skewed towards their lower limits, and at the higher frequen- cies measurement was less accurate in absolute terms. For this reason it was necessary to introduce frequency gaps between classes 6, 7 and 8.
Boundaries of speaking and listening turns (Duncan and Fiske 1977) were determined from the peak loudness chart. The initiation of a speaking turn of a subject was defined as the first peak of his speech and its termination as the first peak of the interviewer’s speech. Pauses

40 U. Hadar et al. / Head movements during comersatmn
were defined as separations greater than 0.5 set between successive peaks.
Results
During speaking turns the head moved almost incessantly (see fig. 2) so that 75.7% of points recorded during speech were of non-zero velocity, with maximum values of 170” amplitude and 7 Hz frequency. During listening turns only 12.8% of points were of non-zero velocity. When pauses longer than 1.0 set were excluded from speaking turns, the occurrence of non-zero velocity increased to 89.9% of points measured. These pauses accounted for 58.8% of still positions during speech.
Amplified at high gain, “still” positions revealed a tremor of the head composed of four superimposed waveforms of variable regularity: (1) high frequency (35-45 Hz) and low amplitude ( < 0.5”); (2) frequency range 12-20 Hz and amplitude around 1”; (3) frequency range 4-6 Hz and amplitude around 2”; (4) low frequency (l-3 Hz) and “high” amplitude (3’-4’). These were not further analysed.
In table 1 is presented the distribution of 1239 points of non-zero velocity between the eight frequency classes. Probability of equivalent classes diminished with increasing frequency (fig. 3), until 1.8-2.2 Hz, where it reached a minimum. Probability then increased by 270% in the next range, 2.2-2.7 Hz, fell again by 44% in the range 3.2-4.2 Hz and
Table 1
The distribution between the various ranges of recorded points of non-zero velocity and their amplitudes.
Frequency
range (Hz)
No. of
recorded
points
Mean
frequency
(Ha)
Mean
amplitude (degrees)
SD
amplitude
0.2-0.6 314 0.36 33.9 20.0
0.6- 1 .O 205 0.81 21.8 12.8 1.0-1.4 164 1.15 20.2 10.0
1.4-1.8 116 1.52 20.0 13.2 1.8-2.2 66 1.92 22.3 22.0
2.2-2.1 179 2.5 1 17.5 11.2
3.2-4.2 79 3.37 16.0 9.6
5.0-7.0 116 5.5 11.8 12.4

U, Hadar et al. / Head movements during conoersation 41
finally increased by 146% in the last range, (G(7) = 137.3; p < 0.01). Amplitudes in each of the various ranges (table 1) were of high
variability, to the extent that no detailed analysis could be presented as definitive, though the general rule was drawn by which amplitude decreased as frequency increased (Spearman correlation coefficient Y = -0.82). Th e only exception to this rule was in the range 1.8-2.2 TIz, and the reason for this was straightforward: 45.4% of all points re- corded in this range were contributed by a single subject (D), the amplitude of whose movements was higher than others by an average of 11.2”. The overall share of this subject in the total of points recorded was 23.4% and, by proportional correction, this exception was rectified (fig. 4).
The amplitude function A(f) in fig. 4 was lower at the higher frequencies (2.2-7.0 Hz) if a distinct class of movement of high frequency and high amplitude was excluded. About 17% of the points recorded in these ranges were of amplitude greater than 25” (average 39.2”) and analysis showed that they arose from linear movements in more than 90% of cases. These linear movements were classed sep- arately as “postural shifts”. When they were excluded from the range
40
1-
1 , -
0: .-
g 0.2
m < “0 0.1 %
I I I I I I ,
1234567
FREQUENCY (Hz)
L A if)
12 3 4 5 6 7
FREQUENCY (Hz)
Fig. 3. Distribution of recorded points between the various ranges plotted against the mean frequency of each range. The graph P(f) represents a rule for the distribution of frequencies.
Fig. 4. Mean amplitude of each range plotted against mean frequencies. The graph A(f) represents
a rule by which amplitudes and frequencies are inversely related.
42
Table 2
U. Hadar et al. / Head movements during conversation
The distribution of points between classes and the mean amplitudes for each of the subjects (A. B.
C, D).
Frequency range (Hz) Subject
A B C D
0.2-0.6
Probability
Mean Amplitude
0.6- 1 .O
Probability Mean Amplitude
1.0-1.4
Probability
Mean .\mplitude
1.4-1.8
Probability Mean Amplitude
1.8-2.2
Probability
Mean Amplitude
2.2-2.1
Probability
Mean Amplitude
3.2-4.2
Probability
Mean Amplitude
5.0-7.0
Probability
Mean Amplitude
Total
Probability
0.22 0.24
21.6” 37.7” 0.33
25.2”
0.23
52.6’
0.19
17.6”
0.08
16.0” 0.25
16.8”
0.17
38.0’
0.13
12.0”
0.15
20.3’ 0.10
17.8”
0.13
30.6”
0.12
15.70 0.10 0.04 0.09
20.20 24.0’ 24.3’
0.03 0.06 0.02 0.10 13.6’ 17.3” 26.0” 28.5”
0.15 0.18
14.0” 19.1” 0.12 0.13
16.8” 19.6”
0.05 0.07
18.1’ 15.2’ 0.05 0.08
13.3O 17.00
0.11 0.12 0.09 0.07 9.2’ 10.0” 8.9” 24.4”
1.00 1.00 1 .oo 1 .oo
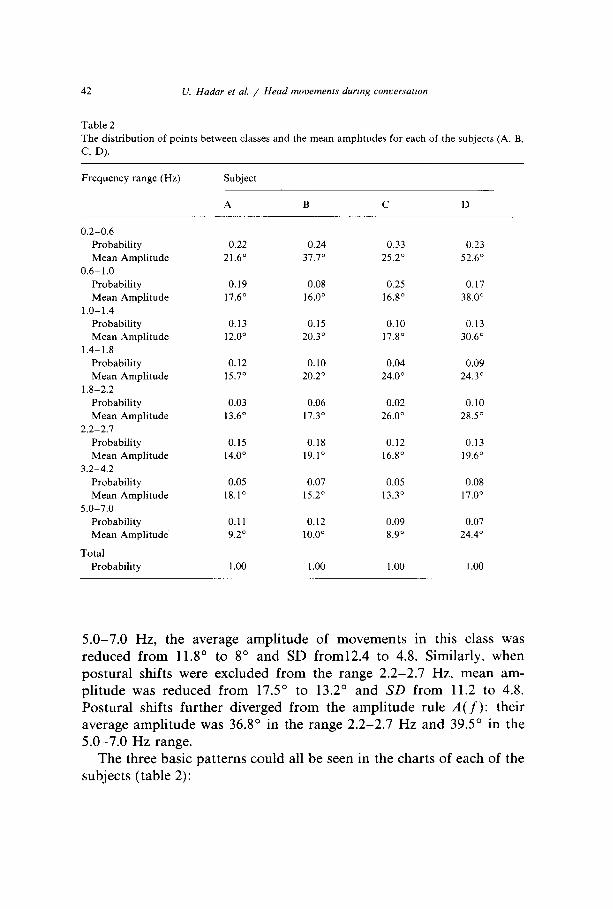
5.0-7.0 Hz, the average amplitude of movements in this class was reduced from 11.8’ to 8” and SD from12.4 to 4.8. Similarly, when postural shifts were excluded from the range 2.2-2.7 Hz, mean am- plitude was reduced from 17.5’ to 13.2’ and SD from 11.2 to 4.8. Postural shifts further diverged from the amplitude rule A(f): their average amplitude was 36.8’ in the range 2.2-2.7 Hz and 39.5” in the 5.0-7.0 Hz range.
The three basic patterns could all be seen in the charts of each of the subjects (table 2):
U. Hadar et al. / Head movements during conoersatmz 43
(1) a probability function of frequency with two minima, one at the range of 1.4-2.2 Hz and one at the range of 3.2-4.2 Hz;
(2) an amplitude function of frequency, decreasing as frequency in- creased;
(3) a separate class of linear movements of high frequency and high amplitude.
However, there was a marked difference in strictness of individual application between the probability rule P(f) and the amplitude rule A(f). Whereas the rule P(f) was fully reflected in individual cases, the rule A(f) was not, as each subject had one or two values that diverged from it.
Subject D who displayed markedly higher amplitudes also displayed an extended minimum of the probability function. The total share of this subject in the higher frequency range (5.0-7.0 Hz) was 16.3% which was substantially lower than his share in the total of points recorded (23.4%). This subject therefore displayed a consistent pattern of higher amplitudes and lower frequencies in line with the A(f) rule. No other significant individual differences were displayed.
Discussion
Probably the most fundamental of these findings is the extent to which the head moves when a person speaks. Contrary to what has been inferred (Boomer and Dittman 1964; Dittman and Llewellyn 1969), the head moves almost incessantly during speech, while still positions are associated with pauses and listening, findings in line with intuitions expressed by other authors (Pittenger et al. 1960; Birdwhistell 1970a).
While this speech-related movement of the head covers the whole range of amplitudes between 0 and 170”, as well as all frequencies up to 7.0 Hz, two ranges of frequency (1.4-2.2 Hz and 3.2-4.2 Hz) were of minimal probability, such that they distinguished between three speed- related classes of movement. Arbitrarily choosing the medians of the minimal ranges (1.8 and 3.7 Hz) gives rise to a natural classification of movement by reference to frequency alone: a class of slow movements (SM) can be said to occur in the 0.2-1.8 Hz range, a class of ordinary movements (OM) in the 1.8-3.7 Hz range and a class of rapid move- ments (RM) in the 3.7-7.0 Hz range. The probability of non-zero
44 U. Hadar et al. / Head movements during conversation
velocity occurring within 0.2 Hz of the demarcating values is not higher than 0.05, and in that sense these classes are behaviourally separated from each other.
This classification has an unmistakable affinity with Birdwhistell’s (1970a) classification of stress kinemes as primary, secondary or ter- tiary, and to that extent his observations of spontaneous motor be- haviour prove successful, but it is doubtful whether the context of kinesic stress is the most suitable for discussing the spectral classifica- tion of speech-related movement. Although it is likely that all classes of movement may occur in conjunction with stress phonemes, it is not the case that the phonemic classes of stress are strictly correlated with the kinesic classes (Dittman and Llewellyn 1969). Moreover, at least some of the classes may be associated with a variety of other suprasegmental features such as juncture, so that they may be considered classes of kinesic juncture as much as of kinesic stress. It is also possible that various features correspond with different classes; if supported empiri- cally, this may demonstrate further the affinity between movement and sound in speech (Condon and Ogston 1967).
A fourth class of head movement was shown in the charts in the form of postural shifts. Kinematically speaking, postural shifts are either Ordinary or Rapid and, being of a wide amplitude, they are of a high intensity as well. Postural shifts differ from the other classes in that, firstly, they are linear, in the sense that they shift the axis of movement, and, secondly, their amplitude is positively correlated with frequency. Movements in which speed was positively correlated with amplitude have been reported previously with regard to rapid move- ment, isolated from the continuous stream of spontaneous body move- ment, where the positive correlation between amplitude and speed may originate from inertic principles (Cooke 1980). This, in turn, is shown in the geometry of such movements by the fact that they end at a point distant from their spontaneous zero position (their point of initiation). These properties indicate a close relationship between postural shifts defined in our terms and those referred to in previous studies, so our methods could be used to determine whether postural shifts serve semantic, or rather syntactic or prosodic functions, or are social or cognitive (Scheflen 1964; Condon and Ogston 1967; Kendon 1972; Beattie 1978).
The tremor of the head observed during “stillness” is not relevant to communication studies, but is of physiological interest. The highest and
U. Hadar et al. / Head movements during conversatmn 45
the lowest frequency components in head tremor appear to have direct analogues in tremor of the eyes (Cumming 1978), and it may well be that the mechanisms generating physiological tremor are the same in both cases. A third component of 4-6 Hz may be associated with the reported “frequency of resonance” of the head, which is about 5 Hz (Sandover and Soames 1975). As the mean frequency of rapid head movements both here and in a previous study (Hadar and Steiner 1982a) was also about 5 Hz, this value may reflect biophysical con- straints on voluntary head movements, possibly the upper limit of natural frequency of the head and neck.
References
Beattie, G.W. 1978. Sequential temporal patterns of speech and gaze in dialogue. Semiotica 23, 29-52.
Birdwhistell, R.L., 1970a. ‘Kinesic stress in American English’. In: Kinesics and context, Phila- delphia, PA: University of Pennsylvania Press.
Birdwhistell, R.L., 1970b. ‘Sequence and tempo’. In: Kinesics and context. Philadelphia, PA: University of Pennsylvania Press.
Boomer, D.S. and A.T. Dittman, 1964. Speech rate, filled pause and body movement in interviews.
Journal of Nervous and Mental Disease 139, 324-327.
Condon, W.S. and W.D. Ogston, 1967. A segmentation of behaviour. Journal of Psychiatric Research 5, 221-235.
Cooke, J.D., 1980. ‘The organization of simple skilled movements’. In: G.E. Stelmach and J.
Requin (eds.), Tutorials in motor behaviour. Amsterdam: North-Holland.
Cumming, G.D., 1978. ‘Eye movement and visual perception’. In: E.C. Carterette and M.P.
Friedman (eds.), Handbook of perception, Vol. IX: Perceptual processing. London: Academic
Press.
Dittman, A.T., 1978. ‘The role of body movement in communication’. In: A.W. Siegman and S.
Feldstein (eds.), Nonverbal behaviour and communication. Hillsdale, NJ: Erlbaum.
Dittman, A.T. and L.G. Llewellyn, 1969. Body movement and speech rhythm in social conversa-
tion. Journal of Personality and Social Psychology 11, 98- 106. Duncan, Jr., S. and D. Fiske, 1977. Face to face interaction: research, methods and theory.
Hillsdale, NJ: Erlbaum.
Goldman-Eisler, F., 1968. Psycholinguistics: experiments in spontaneous speech. London:
Academic Press. Hadar, U. and T.J. Steiner, 1982a. Speed related motor activity and its implications for motor
control. Journal of Physiology 324, 32P. Hadar, U. and T.J. Steiner, 1982b. Application of the polarized light goniometer to the study of
psycho-physiology of speech production. Journal of Physiology 324, 6P.
Kelley, D.L., 1978. Toward a coherent language of movement. Semiotica 24, 177-180.
Kendon, A., 1972. ‘Some relationships between body motion and speech’. In: A.W. Siegman and H. Pope (eds.), Studies in dyadic communication. New York: Pergamon Press.
Mitchelson, D.L., 1975. ‘Recording of movement without photography’. In: D.W. Grieve, D.I.
Miller, D.L. Mitchelson, J.P. Paul and A.J. Smith, Techniques for the analysis of human
movement. London: Lepus Books.

46 U. Hadar et al. / Head movements during conversation
Pittenger, R.E., C.F. Hackett and J.J. Danehy, 1960. The first five minutes: a sample of
microscopic interview analysis. Ithaca, NY: Martineau.
Sandover, J. and R.W. Soames, 1975. Head movement during low frequency vibration. Journal of
Physiology 247, 19-20P.
Scheflen, A.E., 1964. The significance of posture in communicative systems. Psychiatry 27.
316-333.
Williams, D., 1976. Deep structure of the dance. Journal of Human Movement Studies 2, 123-144.