The role of extensional structures on experimental calderas and resurgence
Upload
univ-lille1Category
view
2download
0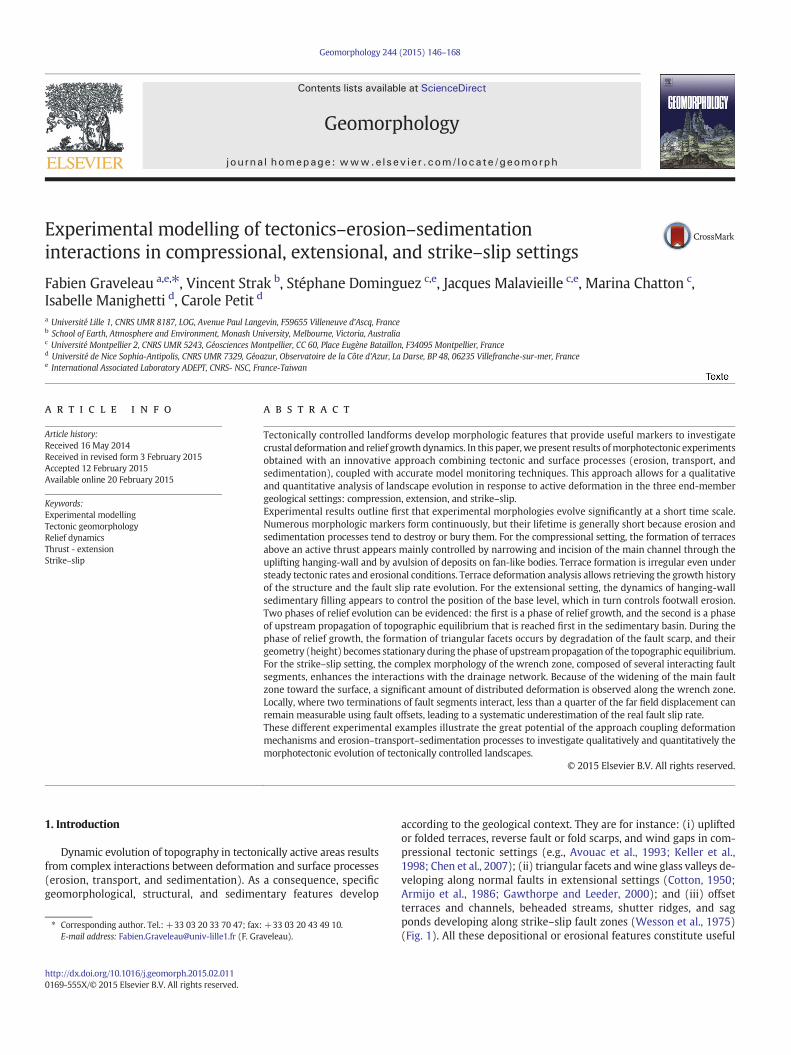
Experimental modelling of tectonics–erosion–sedimentationinteractions in compressional, extensional, and strike–slip settings
Fabien Graveleau a,e,⁎, Vincent Strak b, Stéphane Dominguez c,e, Jacques Malavieille c,e, Marina Chatton c,Isabelle Manighetti d, Carole Petit da Université Lille 1, CNRS UMR 8187, LOG, Avenue Paul Langevin, F59655 Villeneuve d'Ascq, Franceb School of Earth, Atmosphere and Environment, Monash University, Melbourne, Victoria, Australiac Université Montpellier 2, CNRS UMR 5243, Géosciences Montpellier, CC 60, Place Eugène Bataillon, F34095 Montpellier, Franced Université de Nice Sophia-Antipolis, CNRS UMR 7329, Géoazur, Observatoire de la Côte d'Azur, La Darse, BP 48, 06235 Villefranche-sur-mer, Francee International Associated Laboratory ADEPT, CNRS- NSC, France-Taiwan
a b s t r a c ta r t i c l e i n f o
Article history:Received 16 May 2014Received in revised form 3 February 2015Accepted 12 February 2015Available online 20 February 2015
Keywords:Experimental modellingTectonic geomorphologyRelief dynamicsThrust - extensionStrike–slip
Tectonically controlled landforms develop morphologic features that provide useful markers to investigatecrustal deformation and relief growth dynamics. In this paper, we present results ofmorphotectonic experimentsobtained with an innovative approach combining tectonic and surface processes (erosion, transport, andsedimentation), coupled with accurate model monitoring techniques. This approach allows for a qualitativeand quantitative analysis of landscape evolution in response to active deformation in the three end-membergeological settings: compression, extension, and strike–slip.Experimental results outline first that experimental morphologies evolve significantly at a short time scale.Numerous morphologic markers form continuously, but their lifetime is generally short because erosion andsedimentation processes tend to destroy or bury them. For the compressional setting, the formation of terracesabove an active thrust appears mainly controlled by narrowing and incision of the main channel through theuplifting hanging-wall and by avulsion of deposits on fan-like bodies. Terrace formation is irregular even understeady tectonic rates and erosional conditions. Terrace deformation analysis allows retrieving the growth historyof the structure and the fault slip rate evolution. For the extensional setting, the dynamics of hanging-wallsedimentary filling appears to control the position of the base level, which in turn controls footwall erosion.Two phases of relief evolution can be evidenced: the first is a phase of relief growth, and the second is a phaseof upstream propagation of topographic equilibrium that is reached first in the sedimentary basin. During thephase of relief growth, the formation of triangular facets occurs by degradation of the fault scarp, and theirgeometry (height) becomes stationary during the phase of upstreampropagation of the topographic equilibrium.For the strike–slip setting, the complex morphology of the wrench zone, composed of several interacting faultsegments, enhances the interactions with the drainage network. Because of the widening of the main faultzone toward the surface, a significant amount of distributed deformation is observed along the wrench zone.Locally, where two terminations of fault segments interact, less than a quarter of the far field displacement canremain measurable using fault offsets, leading to a systematic underestimation of the real fault slip rate.These different experimental examples illustrate the great potential of the approach coupling deformationmechanisms and erosion–transport–sedimentation processes to investigate qualitatively and quantitatively themorphotectonic evolution of tectonically controlled landscapes.
© 2015 Elsevier B.V. All rights reserved.
1. Introduction
Dynamic evolution of topography in tectonically active areas resultsfrom complex interactions between deformation and surface processes(erosion, transport, and sedimentation). As a consequence, specificgeomorphological, structural, and sedimentary features develop
according to the geological context. They are for instance: (i) upliftedor folded terraces, reverse fault or fold scarps, and wind gaps in com-pressional tectonic settings (e.g., Avouac et al., 1993; Keller et al.,1998; Chen et al., 2007); (ii) triangular facets andwine glass valleys de-veloping along normal faults in extensional settings (Cotton, 1950;Armijo et al., 1986; Gawthorpe and Leeder, 2000); and (iii) offsetterraces and channels, beheaded streams, shutter ridges, and sagponds developing along strike–slip fault zones (Wesson et al., 1975)(Fig. 1). All these depositional or erosional features constitute useful
Geomorphology 244 (2015) 146–168
⁎ Corresponding author. Tel.: +33 03 20 33 70 47; fax: +33 03 20 43 49 10.E-mail address: [email protected] (F. Graveleau).
http://dx.doi.org/10.1016/j.geomorph.2015.02.0110169-555X/© 2015 Elsevier B.V. All rights reserved.
Contents lists available at ScienceDirect
Geomorphology
j ourna l homepage: www.e lsev ie r .com/ locate /geomorph

geomorphic markers that provide key information to better constrainrecent Earth’s surface deformation mechanisms and kinematics(Burbank and Anderson, 2001; Keller and Pinter, 2001).
At the seismic time scale, the study of active faults aims at recoveringinformation on past (i.e., last 102–104 years) large earthquakes to un-derstand the incremental processes accounting for the growth of topog-raphy and to improve seismic risk assessment. The classical approachconsists in searching deformed or offset markers (e.g., topography,river beds, alluvial fans, drainage networks, terraces), in measuring
their shape, and finally in reconstructing their original geometry. Com-bined with marker dating, it gives quantitative information on activefault parameters, such as earthquake magnitude, time recurrence,clustering, typical failure lengths and amplitude of coseismic surfacedisplacements (e.g., Van Dissen and Berryman, 1996; Van der Woerdet al., 2001; Armijo et al., 2010; Klinger et al., 2011). However, resultsstrongly depend on the recognition and interpretation of chosendeformed markers, whose initial geometry and morphological evolu-tion following their formation and very first fault disruption are oftendifficult to determine unambiguously.
Tectonic landforms as observed in most mountain ranges generallyrise coseismically (e.g., Stein et al., 1988), following a succession of seis-mic cycles (Reid, 1910). A topographic signal is generated when defor-mation reaches the surface in the form of a fault or fold scarp. If theseismic cycle duration is shorter than the time required to totallyerode the coseismic scarp, the topographic signal accumulates throughtime and generates a long-term tectonic landform. Linking the short-term component of Earth surface deformation with the long-termcumulative landforms, as recorded in the morphology, is challenging.It requires that landforms contain a detailed and preserved message oftheir growth history (e.g., Sieh, 1984; Gaudemer et al., 1995; Kelleret al., 1998; Manighetti et al., 2001; Pazzaglia and Brandon, 2001;Carretier et al., 2002; Hubert-Ferrari et al., 2007; Li et al., 2012; LeBéon et al., 2014; Simoes et al., 2014). In that case, insights can bebrought for instance on the steadiness (both in amplitude and direc-tion) of the strain rate or the model of fault break (e.g., characteristicearthquake model). However, this approach faces some difficulties re-lated to the sparse spatial distribution of available data (e.g., from seis-mics, well logging, geodesy, thermochronology, paleomagnetism,geochemistry) and generally reveals little of past relief evolution.
Questions concerning the formation, evolution, and record of defor-mation of morphologic markers are still difficult to answer. Similarly,understanding the time scales of landscape responses to tectonic defor-mation and the spatiotemporal variations of surface fluxes (erosion andsedimentation rates) in relation to tectonic fluxes are worth investigat-ing. To tackle those issues, the development of modelling techniqueshas contributed to improving our understanding of the feedback mech-anisms between deformation and surface processes (e.g., Buiter, 2012;Corti, 2012; Dooley and Schreurs, 2012; Graveleau et al., 2012). Particu-larly, experimental modelling investigated the response of landformsto changes in internal parameters (i.e., rheology) or external forcing(i.e., tectonics, climate) with various apparatus, length, and timescales: either with the erosion box device (Ouchi, 1985, 2004, 2011;Hasbargen and Paola, 2000; Schumm et al., 2000; Bonnet and Crave,2003; Lague et al., 2003; Babault et al., 2005, 2007; Turowski et al.,2006; Douglass and Schmeeckle, 2007; Malverti et al., 2007; Bonnet,2009; Rohais et al., 2012) or the sand box device (Barrier et al., 2002,2013; Nalpas et al., 2003; Gestain et al., 2004; Persson et al., 2004;Konstantinovskaia and Malavieille, 2005; Bonnet et al., 2007, 2008;Pichot and Nalpas, 2009; Malavieille, 2010; Malavieille andKonstantinovskaya, 2010; Konstantinovskaya and Malavieille, 2011;Perrin et al., 2013). Within the community of researchers working onrelief dynamics, an original approach has been developed in the Exper-imental Tectonic Laboratory at Geosciences Montpellier, France. Activedeformation of experimental materials (including nucleation, reactiva-tion, and propagation of faults) and active morphogenesis (includingchannel and hillslope processes, transport, and sedimentation) havebeen closely combined to address the natural mechanisms of topogra-phy growth. Experiments either in compressional (Graveleau, 2008;Graveleau and Dominguez, 2008), extensional (Strak et al., 2011;Strak, 2012), or strike–slip settings (Chatton et al., 2012) have been per-formed. This experimental approach enables a survey of the formationand evolution of a fault from its immature stages up to several hundredslip events. The spatial and temporal evolution of fault kinematics andtopography is continuously recorded thanks to accurate measurementtechniques. Therefore, the impact of erosion and sedimentation on the
Fig. 1. Tectonic geomorphology with relevant morphotectonic markers in (A) thrust faultsetting, (B) normal fault setting, and (C) strike–slip fault setting.
147F. Graveleau et al. / Geomorphology 244 (2015) 146–168

fault zone topography can be investigated, and the evolution of associ-ated morphological markers can be described and quantified.
In this paper, we present themorphological evolution of tectonicallyactive experimental landforms covering compressional, extensional,and strike–slip end-member tectonic settings. Our aim is to showthrough selected striking examples that the experimental approachhas a great potential and can be successfully applied to all types of tec-tonic contexts at a wide range of temporal and spatial scales. We alsoaim to show that such tools are needed to better determine the limitsof quantitative measurements made on actively deforming naturallandscapes. In the following, we describe the experimental facilities(devices, experimental material, and scaling) and one typical experi-ment chosen to illustrate each tectonic setting. Then, a qualitative de-scription of each experiment is used to evaluate the degree of analogybetween the morphotectonic evolution of experimental markers andtheir natural equivalents. Several morphological markers are quantita-tively analysed in each setting to illustrate how they form, evolve, andrecord tectonic deformation. Finally, some challenges and potentialimprovements are exposed to target future projects.
2. Experimental procedure
2.1. Setup and boundary conditions
The experimental devices developed at Geosciences Montpellierto investigate the morphological evolution of tectonically activelandscapes result from laboratorymodelling initially focused on con-vergence zones (Malavieille, 1984; Lallemand et al., 1992, 1994;Calassou et al., 1993; Kukowski et al., 1994, 2002; Chemenda et al.,1995; Gutscher et al., 1996, 1998a, 1998b, 2001; Dominguez et al.,1998b, 2000), but also on wrench settings (Lu and Malavieille,1994; Dominguez et al., 1998a; Martinez et al., 2002) and extension-al contexts (Schlagenhauf et al., 2008). These sandbox experimentsmainly focused on the long-term structural evolution of modelswithout including surface processes (erosion and sedimentation)that were later progressively incorporated to investigate their inter-actions with tectonics (Malavieille et al., 1993; Larroque et al., 1995;
Konstantinovskaia and Malavieille, 2005; Bonnet et al., 2007, 2008;Malavieille and Trullenque, 2009; Malavieille, 2010; Malavieilleand Konstantinovskaya, 2010; Konstantinovskaya and Malavieille,2011; Perrin et al., 2013).
In the last decade, three main types of experimental setups havebeen designed to investigate the short-term morphological evolutionof tectonic landforms taking into account more realistically erosion,transport and sedimentation processes (Fig. 2). These setups share com-mon features like (i) a computerized deformation mechanical appara-tus, (ii) a programmable rainfall system composed of a sprinklernetwork, and (iii) an optical measurement device. Computerized defor-mation devices are slightly different within the three setups to face therequired boundary conditions associated to their tectonic contexts(thrusting, normal faulting, strike–slip), whereas they share the samerainfall and optical measurement systems. For the convergent setting,the deformation device is constituted by a large table (100 cm wide,2000 cm long) at the base of which a mobile film is overlaid by the ex-perimental material. As the film is pulled beneath a rigid backstop, theanalogue material is deformed along the backstop, accretes, andthickens. Relief created during the experiment is simultaneously erodedusing the rainfall system that generateswater surface runoff (Graveleauand Dominguez, 2008). For the extensional (Strak et al., 2011) andstrike–slip boundary conditions (Chatton et al., 2012), a setup derivedfrom a prototype work (Bonnet, 2002; Graveleau, 2004) has beenadapted to modulate fault strike and dip. The deformation device iscomposed of two plates (total size 130× 100 cm) representing the foot-wall and the hanging-wall of a normal or reverse fault or the two com-partments of a strike–slip fault. In the extension configuration, thefootwall is maintained as fixed, while the hanging-wall can movealong a predetermined normal fault plane separating the two plates. Arigid or a flexural tray can be used to simulate a uniform or a flexuralsubsidence of the hanging-wall, respectively. In the strike–slip configu-ration, two crossed motor-driven linear advances allow us to adjust theslip direction from purely strike–slip to normal or reverse strike–slip.The two rigid plates slide along a vertical fault plane following theimposed slip, allowing the analogue material placed on top of it to bedeformed.
Fig. 2. Experimental setups for (A) thrust fault setting, (B) normal fault setting, and (C) strike–slip fault setting. Photography of the device (upper panels), and two-dimensional cross-sectional sketch (lower panels). All apparatus are composed of three elements: (i) a computerized deformation device, iii) a rainfall system (sprinkler device), and iiii) an opticalmeasurement system (CCD camera and laser interferometer).
148 F. Graveleau et al. / Geomorphology 244 (2015) 146–168

The rainfall system is similar from one configuration to the other, al-though small changes in precipitation rate and distribution are used.The rainfall does not intend to simulate real water droplets but shouldbe considered as a mean to trigger through water runoff at the modelsurface erosional processes on hillslope and channelized processes intopographic lows. Sprinklers are arranged about 1.5 m above the exper-iment surface to deliver a homogeneous amount of water (in the rangeof 25 ± 5 mm/h), continuously or during chosen rainfall cycles.Water droplets are small enough to prevent significant splash erosionbut large enough to contribute to small-scale hillslope processes(Graveleau et al., 2011).
Continuous monitoring of the model is performed with the com-bined use of a laser interferometer and several CCD cameras. Digital pic-tures shot regularly during the experiment allow for a high-resolutionrecord of the morphological evolution of the model surface. The use ofaccurate technique of subpixel spectral image correlation derived fromsatellite imagery processing (Van Puymbroeck et al., 2000; Michel andAvouac, 2002; Dominguez et al., 2003; Avouac et al., 2006; Graveleauet al., 2014) allows us to measure the horizontal displacements overthe whole model surface, mapping in detail fault geometry and quanti-fying surface deformation, particularly fault kinematics. In addition, reg-ular stops of the rainfall device allow us tomonitor topography throughthe generation of digital elevation models (DEMs) with an average spa-tial resolution of 0.5 mm and a submillimetric vertical accuracy. Finally,models are cut in serial cross sections at the end of the experiment tostudy the three-dimensional geometry of faults and syntectonicdeposits.
2.2. Material
One of the central points of this experimental approach is the de-velopment of a specific granular material (MatIV) to model simulta-neously deformational processes (essentially faulting) and surfaceprocesses (erosion, transport, and sedimentation) as observed innatural landscapes (Graveleau et al., 2011). Its composition has
been determined using empirical and physical criteria derived fromthe comparison of deformation, erosion–transport, and sedimenta-tion processes between nature and models (Graveleau, 2003, 2004,2008). First, the material satisfies Mohr-Coulomb failure criterionand generates brittle deformation (faults and shears bands) in re-sponse to tectonic stresses. Second, it erodes by channel incisionand hillslope mass-wasting processes when submitted to water run-off. These processes trigger the development of individualized drain-age basins limited by crest lines. Finally, material grain size andshape variability promote particle sorting during transport and trig-ger stratified sedimentation.
The composition of the experimental material is made up with fourgranular components (silica powder, glass microbeads, plastic powder,and graphite; Table 1) mixed with water. It has slightly evolved alongexperimental works to improve the similarity of morphotectonic andsedimentary markers with nature. Notably, slight changes regardingthe proportion of silica powder versus plastic powder have been madeto enhance hillslope processes versus river incision (Strak et al., 2011).Nevertheless, the physical properties of the wet granular mixture arevery similar for all experiments, with an average water saturation rateof 23 ± 3%, a median grain size of 90 ± 10 μm, a porosity of 34 ± 1%,a permeability of 4.9 × 10⁻¹³ m2 (0.5 Darcy), a bulk density of 1.61 ±0.1 g/cm−3, a dynamic-stable angle of internal friction of 37 ± 3° anda dynamic-stable cohesion of 675 ± 75 Pa. These physical propertiesallow for a realistic modelling of morphotectonic and stratigraphicfeatures, including channel network with drainage basins, hillslopesand channels, fluvial terraces (strath or alluvial), knickpoints, alluvialfanswith stratigraphicmarkers, faceted spurs, fault scarps, and pressureridges (Fig. 3). All thesemarkers display strikingmorphological similar-ities with their natural counterpart that provide a validation of theapproach.
2.2.1. ScalingPrevious experimental works demonstrated that although scaling
works fairly well in tectonic sandbox modelling (Hubbert, 1937;
Table 1Mean physical properties ofMatIV, the experimental material used in our approach, both in a dry and awater-saturated state (data compiled fromGraveleau, 2008; Graveleau et al., 2011;Strak et al., 2011).
149F. Graveleau et al. / Geomorphology 244 (2015) 146–168

Horsfield, 1977; Davy and Cobbold, 1991), it is a more difficult goal toachieve in morphodynamic models (Peakall et al., 1996; Paola et al.,2009). The main reasons are notably linked to the inappropriate use of
water as erosion–transport agent and to the coexistence of severalorders of magnitude for time-dependant processes in nature, whichmakes direct downscaling in a model challenging. However, scaling in
Fig. 3. Examples ofmorphologic features obtained in the three experimental boundary conditions illustrating the experimentalmaterial ability tomodel some natural geomorphic featuresof tectonically active landscapes.
150 F. Graveleau et al. / Geomorphology 244 (2015) 146–168

geomorphic experiments respects the most important force balancesfor hydraulics (Niemann and Hasbargen, 2005; Malverti et al., 2008),which makes them of value in comparing experiments to long-termdynamics and behaviour of natural systems. As a consequence, toextrapolate quantitative results in the experiments toward nature, wegenerally consider an average length ratio L* (length in model dividedby length in nature) ranging from 2.10−4 to 2.10−5 (1 cm in themodel equals 50 to 500 m in nature), depending on the spatial scale ofthe considered experimental model (from a single fault to a mountainfront). The scaling is achieved by comparing qualitatively and quantita-tively experimental landforms to their natural counterparts throughmorphometric parameters (Graveleau et al., 2011; Strak et al., 2011).For the same reasons, the time ratio T* (time in model divided by timein nature) ranges from 10−9 to 10−10 (1 s in the model equals about30 to 300 years in nature), depending on the temporal scale of theinvestigated issue (from a 100-year seismic time scale to a 100-kymountain range front evolution). These values are estimated by com-paring average erosion rates in models and nature (Graveleau et al.,2011; Strak et al., 2011). For both ratios, we insist on the fact that theygive a rough geometric and temporal scaling relationship between themodels and their natural counterparts. Therefore, the times, distances,and rates in the experiment converted to times, distances and rates ina natural setting in the following sections (text and figures) should betaken carefully. For instance, calculation of scaled time and distance inthe extensional and compressional sections are made with L* ~2.10−5
and T* ~1.5 10−10 because models are set to simulate topography evo-lution at the scale of a mountain range. The scaling ratios allow us togive rough estimates that we consider useful to provide to geologistsand should not be taken as accurate calculations.
2.3. Reproducibility
Reproducibility of landscape formation and evolution has been test-edwithmultiple runs of a given experiment in the extensional and com-pressional settings. For instance, with identical rainfall rate and fault sliprate, the results indicate a good reproducibility, with production of thesame number of triangular facets and watersheds, the same reliefamplitude, and the same values of river and hillslope gradients. Repro-ducibility has not been intensively tested for the strike–slip setting butsimilar results can be reasonably expected.
3. Results
3.1. Compressional tectonic context
Morphotectonic experiments coupling tectonic, erosion, and sedi-mentation processes in compressional tectonic contexts were first pre-sented in a paper focused on the evolution of a fold-and-thrust belt front(Graveleau and Dominguez, 2008). They showed how the propagationof deformation, and notably the nucleation of a frontal thrust, influ-enced the dynamics of the channel network and associated alluvialdeposits. We present, hereafter, an example extracted from the experi-ment discussed in Graveleau et al. (2011) (Fig. 4), illustratinghow chan-nels and sediment deposits evolve in response to fault nucleation andconstant hanging-wall uplift. The frontal thrust (thrust 2) is locatedabout 60 cm (scaling to ~30 km in nature) in front of amajor hinterlandstructure (thrust 1; Figs. 4 and 5A). The kinematic analysis of imagesthroughout the investigated period of time indicates that convergenceis accommodated on thrusts 1 and 2 at constant but different rates(Graveleau, 2008). Shortening rate accommodated on thrust 1 is Vthrust1 = 9 mm/h (scaling to ~0.6 mm/y in nature) and Vthrust 2 = 26 mm/h(scaling to ~1.7 mm/y in nature) on thrust 2. Therefore, the frontalthrust accommodates 75% of the convergence. The subsurface geometryrevealed on thefinal cross section indicates that the frontal thrust can bedescribed through a simple fault-bend fold model (Suppe, 1983) withan average ramp dip of α = 35 ± 2°. We can therefore consider thathanging wall topography has grown at a constant rate of U = V.tanα ~ 18.2 ± 1.4 mm/h (scaling to ~1.2 mm/y in nature).
3.1.1. Morphotectonic evolution along a thrust faultA firstmovie (onlinematerial A.1) shows themorphotectonic evolu-
tion of the model and particularly the evolution of the cumulative to-pography along thrust 1, which cumulates about 12 cm of slip (scalingto ~6 km). As described in Graveleau and Dominguez (2008), such amovie enables us to understand how the nucleation of thrust 1 rapidlytriggers uplift of the hanging wall, then its progressive dissection bythe development of parallel watersheds, and the deposit of large lobedalluvial bodies in the footwall of the thrust. During this sequence oftopographic evolution, erosion and transport processes are responsiblefor the incision and widening of the channels and the headward propa-gation of catchments. Deposition of eroded particles occurs temporarilywithin the channel network and permanently in the foreland. Finally,
Fig. 4. Oblique view of the final stage of a compressional geomorphic experiment. The red box shows the location of Fig. 5. Black arrows indicate fault trace.
151F. Graveleau et al. / Geomorphology 244 (2015) 146–168

152 F. Graveleau et al. / Geomorphology 244 (2015) 146–168

large and fast landsliding structures develop along hillslopes of the ac-tive topographic front, a feature observed in nature (e.g., Pinto et al.,2008). The evolution of drainage network through time indicates a re-duction of catchment number and an increase in drainage basin area(Graveleau, 2008), a feature to be related with the regular spacingratio of transverse drainages in active topography (e.g., Hovius, 1996;Talling et al., 1997; Castelltort and Simpson, 2006).
In the following, we detail the sequence of morphotectonic evolu-tion of thrust 2 fault scarp (Fig. 5), which has undergone much less cu-mulative slip (about 4 cm, scaling to ~2 km in nature) than thrust 1. Theevolution of thrust 2 being partially framed in movie A.1, itsmorphotectonic evolution is presented as a separate movie shot intwo-dimensional map view (supporting online material A.2). The anal-ysis starts after the nucleation of thrust 2 (Fig. 5B), at about 60 min ofexperimental time (scaling to ~720 ky in nature). This step represents45% of experimental model bulk shortening. A slight component of fold-ing prior to faulting occurs beforehand, but it is minor and not repre-sented here (see Bernard et al., 2007, for a description of this foldingstage). As deformation remains localised on this frontal thrust, the ac-commodation of shortening induces the uplift of the hanging wall,which is underlined by the creation of a thrust fault scarp. Thrust faulttrace is slightly curved and displays several inflexions, which could like-ly follow local heterogeneities in thematerial strength. The topographicscarp generates a local increase in surface slope, which, once greaterthan the erosion threshold of the experimental material, is responsiblefor the initiation of incision and the development of a channel network.The geometry of the channels starts first as single-threads but it rapidlysplits upstream into a ramified pattern. The upstream growth of catch-ments occurs through headward erosion. Material particles comingfrom the erosion of the topographic scarp are transferred downstreamthrough the drainage system and accumulate on fan-shaped deposits(S1) similar to natural alluvial surfaces. At the next step (Fig. 5C;80 min scaling to ~960 ky), a new channel and associated alluvial fandevelops in the centre of the studied frame. This channel partly capturesthe water flow from the rightward watershed, which starts to starve itsalluvial body (S2). From this step, a major alluvial system develops inthe centre of the frame, and the drainage system to the right progres-sively dies out (Fig. 5D - F).Meanwhile, channels start to narrow their ac-tive bed, incise their substratum and abandon flights of terraces. A seriesof erosion terraces is identified (T1, in blue; T2, in purple; T3 in red andT4,in orange) on the central and right drainage basins. The central channelbeing very active, it illustrates an interesting history of channel incision,terrace abandonment and alluvial fan deposition. Indeed, deposition onthe alluvial fan occurs on the right side (surfaces S3 and S4), and the chan-nel abandons a first level of terrace on its left bank (T1). Then the channelavulses leftward and deposits transported particles partly over the previ-ous ones (surface S5) and partly in the left lowlands. At that time, channelflow is divided into two flumes, which create an island-shape terrace sur-face (T2). Avulsion continues and finally stops when the channel blocksleftward at an inflexion of the surface rupture. In the meantime, two ad-ditional levels of terraces are abandoned (T3 and T4) on the left bank, cre-ating a step-like pattern of incision terraces. It is worth noting here thatterraces have formed irregularly through time, although tectonic fluxesand precipitation condition were held constant.
3.1.2. Quantification of terrace deformationDuring the experiment, four digital elevation models (DEM 1, DEM
2, DEM 3, and DEM 4) have been created to quantify the surface evolu-tion of themodel (Fig. 6). They correspond to a cumulated shortening of7, 23, 51, and 58mmrelative to the initiation of the frontal structure, re-spectively. The morphology corresponding to DEMs 2, 3, and 4 areshown in Fig. 5B, D and F, respectively. This series of four DEMs allows
us to compare (i) the continuous growth of topography created abovethe active frontal thrust fault, and (ii) the deformation recorded byabandoned and deformed terraces. With this aim, we extracted (i) foreach DEM, a topographic profile at a fixed place to the left of the alluvialfan area (thick black profile on Fig. 6A) and compared its deformationpattern with (ii) the total finite deformation recorded by the flights ofdeformed terraces T1, T3 and T4 at the final stage of the experiment(Fig. 6A, C, D). Successive topographic profiles represent the deforma-tion of a pristine surface that was not affected by erosion. The T2island-shaped terrace is not investigated because its surface is toosmall to extract reliable topographic measurements.
Results reveal first that the growth of topography in the non erodedarea generates a folded surface (Fig. 6B).Maximumelevation culminatesabove the frontal lowlands at ~5 ± 1 mm for DEM 1, ~20 ± 1 mm forDEM 2, ~34 ± 1 mm for DEM 3, and ~40 ± 1 mm for the final DEM 4.This is in good agreement with calculated total uplift from cumulatedshortening (5, 16, 36, and 40 ± 1 mm, respectively), if we assume thatthe thrust dip (about 35 ± 2°) was constant throughout the experiment(Table 2). As a consequence, considering the age of each surface, which is15, 60, 100, and 130 ± 1 min, respectively (Table 2), an average upliftrate of 18.7 ± 1.0 mm/h can be calculated (scaling to ~1.2 mm/y in na-ture). This is in agreement with the value calculated from average thrustdip and shortening data (i.e., 18.2 ± 1.4 mm/h).
In addition, we have extracted the topographic profile of each ter-race (in orange, red, and blue for T1, T3, and T4, respectively) andhave compared their geometry relative to the channel bed (RB)(Fig. 6A, C, D). Raw topographic data are projected along a N25° trend,which is perpendicular to the average strike of the thrust fault (aboutN115°) at the channel position. A virtual “north” is considered here up-ward. The active channel bed profile displays a sigmoid shape with aconcave upward domain downstream and a convex upward domainupstream (Fig. 6D). The increase in local slope of the channel bed up-stream of the fault is directly a consequence of active uplift, as observedin several natural orogenic rivers (e.g., Seeber and Gornitz, 1983; Ouchi,1985; Schumm et al., 1987). With larger slope, the stream power of thechannel is increased, which allows incising through the active structure.Regarding terrace morphology, old terraces are topographically higherthan younger ones because they record a longer uplift period. Terracegradient, notably for T1, is parallel to the present active channel bed,which means that the paleochannel bed has been uplifted withouttilting. This is in agreement with the fault-bend fold style of the struc-ture and the expected uplift pattern (Hubert-Ferrari et al., 2007; Simoeset al., 2007). Terrace deformation in the field is generally calculated rel-ative to a hypothetical steady riverbed by subtracting the riverbed-longprofile from the terrace profiles (e.g., Molnar et al., 1994; Poisson andAvouac, 2004). In our model, we have measured null relief (~0.5 ±1.0 mm) for T4, ~1 ± 1 mm for T3, and ~5 ± 2 mm for T1, relative tothe channel bed (Fig. 6D). Although these measurements are verysmall and contain relatively large error bars, it is possible to calculatea mean uplift rate by considering the moment when the active channelabandoned them (0 min for T4, 5 min for T3, 11 min for T2, and 26minfor T1) and the stable vertical position of the channel during the exper-iment. Calculation yields an average uplift rate of 11.5±6mm/h,whichis acceptable with the imposed value considering the error bars. Notethat another investigation of terrace deformation was studied inGraveleau (2008) on a much bigger thrust system uplifting a set ofeight terraces (see Fig.V.42 and 43, p. 422 in Graveleau, 2008) andyielded calculated uplift rates that are consistent with imposed values.
3.1.3. Quantification of erosion and sedimentation amountAt the end of the experiment described in Figs. 4 to 6, the tectonic
deformation is stopped during 25 min (scaling to ~300 ky in nature),
Fig. 5. Evolution ofmorphotectonicmarkers along an active thrust fault. (A) Location of the investigated thrust. (B–F) Sequence starts with the initiation of the frontal thrust fault and endsafter the formation of a flight of erosional terraces on the hanging-wall. Note that shortening consumedbetween each photo is not constant. Times in the experiment converted to times innature give rough estimates. They should be taken with great precaution (see text).
153F. Graveleau et al. / Geomorphology 244 (2015) 146–168

but surface processes are maintained active. Therefore, rainfall precipi-tation continues to trigger channel incision and sediment transport dur-ing that period, and sediment deposit keeps going on alluvial surfaces.Consequently, this experimental phase simulates the relaxation of a tec-tonically driven topography during a phase of deformation quiescence.Such a phase of tectonic quiescence is generally called topographic
relaxation (e.g., Lague et al., 2003). To quantify the evolution of surfaceflux during this period, we have computed a map of erosion and sedi-mentation amounts by subtracting the two DEMs made at the end ofthe tectonic and quiescence phase (Fig. 7). Results indicate heteroge-neous topographic changes across the model surface, ranging from−2 mm (erosion) to + 2 mm (aggradation). Maximum erosion andsedimentation rates are therefore about 4 mm/h (scaling to ~0.3 mm/y in nature). Higher amounts of erosion (in blue) are observed withindrainage basins, whereas flat surfaces on top of the structure are pre-served (in white). Channel banks are particularly eroded, meaningthat channels widen. Note that former investigated terraces T3 and T4have been eroded while the downstream part of T1 still persists. Inthe main channel, incision is enhanced upstream, meaning that thebulk gradient of the channel-long profile is reduced. Sedimentation (inred) occurs in the central area of the fan meaning that it is backfillingrather than progradating (Schumm et al., 1987; DeCelles et al., 1991).This contributes also to the bulk channel gradient decrease observedupstream.
Fig. 6. Terrace deformation above an active thrust. (A) Final stage digital elevation model (DEM) showing the location of investigated topographic profiles. ‘Env.’ is for envelope profilereported in (B); RB is for channel bed; T1, T2, and T3 in blue, red, and orange, respectively, are terraces reported in (C) and (D). Topographic profiles in (D) are elevation data projectedalong a trend (N25°) perpendicular to the average strike of the thrust fault (about N115°) at the channel position; considering that a virtual ‘North’ is upward. Vertical exaggeration is×2.7for (B) and ×3.4 for (D).
Table 2Characteristics of the topographic envelope surface of the frontal structures; calculateduplift are obtained considering an average thrust dip of 35±2°; all cumulated shortening,calculated uplift, measured uplift, and age are relative to the nucleation of the frontalstructure.
DEM#
Cumulated shortening(mm)
Calculated uplift(mm)
Measured uplift(mm)
Age(min)
1 7 ± 1 5 ± 1 5 ± 1 15 ± 12 23 ± 1 16 ± 1 20 ± 1 60 ± 13 51 ± 1 36 ± 1 34 ± 1 100 ± 14 58 ± 1 40 ± 1 40 ± 1 130 ± 1
154 F. Graveleau et al. / Geomorphology 244 (2015) 146–168

3.1.4. Subsurface geometry of thrust fault and syntectonic sedimentsThe three-dimensional subsurface geometry of the thrust fault and
syntectonic deposits in the footwall basin has been imaged at the finalstage of the experiment by sectioning the model. We do not presentcross sections through the frontal thrust (thrust 2) because availablepictures were not as illustrative as those for the rear thrust (thrust1) (Fig. 8). The cross sections allow us to follow the geometry of thethrust plane from the deep décollement level up to the surface(Fig. 8A). The transversal fault plane geometry presents three changesin dip from the deepest levels (~45° then 30°) to the shallowest levels(~45° then 25–30°). These changes in dip are most probably linked tothe three changes in material rheology from bottom to top, which arethe MatII/MatIV, MatIV/stratified sequence, and stratified sequence/syntectonic deposits transitions. The longitudinal geometry of the faultplane is displayed in its shallowest portion (Fig. 8B), where topography,thrust plane and alluvial deposits interact. Because of the gentle dip ofthe thrust near the surface, the classic rule of V’s is respected as the sur-face trace of the fault makes a V pointing upstream (in red dashed line)in the direction of the thrust dip. Interestingly, the subsurface geometryof the fault plane appears slightly wavy, as the fault is deeper under-neath the drainage basin interfluves than underneath the channels. Un-dulation of the fault plane is highlighted by corrugation of the graphitereference level and microbead layers in the stratified sequence thatwere originally subhorizontal. Here, we do not describe this undulationin terms of folding because it does not result from along-strike horizon-tal stresses. Instead,we consider it as resulting from the overthrusting ofa plastic thrust sheet over a nonplanar sedimentary surface. This sedi-mentary surface presents an undulated topography owing to thelobed geometry of the syntectonic alluvial bodies. More work on thistopic would be needed to investigate if this influence of foreland
Fig. 7. Cartography of the amount of erosion and sedimentation during a phase of tectonicquiescence (25min long; scaling to ~300 ky), following a phase of steady convergence, up-lift, and rainfall precipitation.
Fig. 8. (A) Fault-perpendicular (transversal) and (B) fault-parallel (longitudinal) vertical cross sections at thefinal stage of the compressional setting experiment showing the relationshipsbetween topography, thrust geometry, and syntectonic deposits. Note the upper layer of unconformable sediments sealing the activity of the frontal thrust and therefore pointing the ini-tiation of the topographic relaxation phase.
155F. Graveleau et al. / Geomorphology 244 (2015) 146–168

sedimentation on thrust fault geometry is relevant or not in nature. Fi-nally, several tectonic slices are observed on the right portion of the lon-gitudinal cross section. Most of them appearing in the strike of majorchannels and alluvial depocenters, we consider as illustrating a typicalbreak-back sequence of thrusting caused by locally large sedimentationrates (Barrier et al., 2002, 2013).
In addition, syntectonic deposits can be investigated on the finalcross sections to correlate the geometry of bedding with the knowntopographic, tectonics and erosion/sedimentation histories (Figs. 3Band 8B). In our example, an upper layer of unconformable sedimentsseals the thrust along the longitudinal cross section and masks itssurface trace. The surface lying at the base of the unconformablesediments marks the stop in tectonic deformation during the phase oftopographic relaxation while erosion–sedimentation was still ongoing(see Section 3.1.3).
3.2. Extensional tectonic context
Laboratory morphotectonic experiments also have been applied tothe study of normal fault scarp evolution to investigate the role offault slip rate on morphology dynamics (Strak et al., 2011). To illustratethe main contributions of this approach, we report on one experimentcharacterized by a constant fault slip rate of ~2.3 cm/h (scaling to~1.5 mm/y in nature) and a 26 ± 4 mm/h rainfall rate. The cumulatedfault slip was homogeneous along the normal fault and was simulatedby mechanically imposing a flexural subsidence of the hanging-wall.The fault dip anglewas 60°, allowing us therefore to create a tectonic to-pography at a rate of ~2 cm/h (scaling to ~1.3 mm/y in nature). Theseparameters insured a good similarity with the morphotectonic markersobserved along normal faults (i.e., best preserved triangular facets;Fig. 9). The morphotectonic evolution of the model surface is featuredin supporting online material A.3. The precise sequence ofmorphotectonic evolution is described in Fig. 10 and presented as an ad-ditional movie in online material A.4.
3.2.1. Morphotectonic evolution along a normal faultSoon after the beginning of the experiment, a dense hydrographic
network with short fault-perpendicular gullies developed on the foot-wall side of the fault (movies A.3 and A4). These incipient gullies rapidly
coalesce to formmajor fault-perpendicular incising channels and associ-atedwatersheds (Fig. 10A and B). Hillslope processes dominate betweenthe major channels allowing for the formation of trapezoidal facets,which are delimited by two oblique crest lines trending a few tens of de-grees (20° on average) apart from the main crest line direction. On thehanging-wall, sorted particles deposit in alluvial fan-like bodies down-stream in the major channels and in the form of interbedded, colluvialand alluvial deposits down the trapezoidal facets. After an experimentaltime of ~45 min (scaling to ~0.6 My in nature), a stable number of trap-ezoidal/triangular facets andwatersheds is reached (Fig. 10B). Themajorincising channels continue elongating upstream by headward erosion,which in turn results in erosion of the watershed slopes by hillslope pro-cesses and incising gullies, and leads to the progressive dissection of theinitially flat topography (Fig. 10B-F). In response to continuous erodedmaterial feeding, alluvial fans progradate in the subsiding hanging-wall(Fig. 10B-F) and elongate downstream inducing the migration of thefault-parallel river that defines the base level. Geometry of the trapezoi-dal facets also evolves progressively, becoming triangular when theirtwo lateral crest lines merge upfault (Fig. 10C and D). Facet surface iseroded mainly by mass wasting processes, which induce a rapid erosionof the exhumed fault plane. As a consequence, their shape in cross sec-tion appears concave upward. Lateral facet edges are best preservedallowing us to document their geometric evolution.
3.2.2. Geometrical evolution of triangular facets and syntectonic sedimentationThe height of the triangular facets increases continuously during the
experiment and reaches an almost constant value of ~2.0–3.5 cm (scal-ing to ~1000–1750m) at the final stage (Figs. 3C and 10F). Thewidth ofthe triangular facets is ~2.5–8.0 cm (scaling to ~1250–4000 m) and isstable from the experimental time of ~60 min (scaling to ~0.8 My).These results suggest that a topographic equilibrium is reached closeto the fault only at the end of the experiment, despite the apparentsteady along-fault morphology (e.g., constant watershed spacing andwidth of triangular facets) reached earlier.
The geometry of syntectonic deposits in the hanging-wall basinshows a downstream progradation (Figs. 3D and 11A). A fault-perpendicular sorting of deposits is observed, with the relatively denserparticles (glassmicrobeads and silica powder) being deposited closer tothe fault scarp than the lighter particles (plastic and graphite powders;
Fig. 9. Oblique view of the final stage of an extensional setting geomorphic experiment. The red box shows the location of Fig. 10. White arrows indicate fault trace. Three fault perpen-dicular profiles are running along a channel (blue line), along a crest and across a facet (red line), and along a crest and a facet edge (green line).
Fig. 10. Evolution of morphotectonic markers along an active normal fault. The sequence starts just after the initiation of the normal fault (A) and ends after the formation of well-devel-oped faceted spurs and adjacent watersheds on the footwall (F). See text for a description. Note that the amount of extension accommodated between each stage is constant. Times in theexperiment converted to times in nature give rough estimates. They should be taken with great precaution (see text).
156 F. Graveleau et al. / Geomorphology 244 (2015) 146–168

157F. Graveleau et al. / Geomorphology 244 (2015) 146–168

Figs. 3D and 11A). There is also an along-fault sorting (lateral facies tran-sition) of particles with the relatively lighter grains preferentially de-posited at the base of the trapezoidal/triangular facets and the denserones at the outlet of the major channels (Fig. 11B). This indicates thaterosion–transport processes are less energetic on and at the base ofthe trapezoidal/triangular facets than those occurring in themajor incis-ing channels and on the alluvial fans. The along-fault geometry of thedeposits in the hanging-wall basin indicates moreover that avulsion isa dominant process in and down the major incising channels (see themovie in supporting online material A.4).
3.2.3. Evolution of channel-long and crest-long profilesDuring the experiment, eight DEMs were generated every 30 min
(scaling to ~0.4 My) (Table 3) allowing us to produce topographic pro-files. The evolution of one channel-long profile (blue line in Fig. 9) andone of its adjacent crest-long profile (green line in Fig. 9) is studied con-sidering either the pristine surface of the footwall (Fig. 12A and C) or thebase level (Fig. 12B and D) as a reference for elevation. In the first case,the base level falls and migrates continuously away from the fault, con-trolling the slope of the hanging-wall deposits and the slope of thechannel-long (Fig. 12A) and crest-long profiles (Fig. 12C). During thefirst half-duration of the experiment (i.e., until DEM#5, in green, at~150 min scaling to ~2 My), these slopes increase with progressiveprogradation of sediments filling the hanging-wall basin. The slopeand the height of the triangular facets also progressively increase(Fig. 12C). In the case where the base level is set as a reference for eleva-tion, a topographic equilibrium is reached close to the fault in thehanging-wall and in the footwall from the experimental time of
~150 min (DEM #5, in green). It is characterised by a topographic slopethat remains constant through time (Fig. 12B and D). At the surface ofthe alluvial deposits, the equilibrium profile elongates as the base levelmigrates with the progradation of sediments. The equilibrium profile de-velops up to ~10–15 cm upfault for the major incising channel and up to~7 cmupfault for the crest line, showing that the topographic equilibriumis reached first in the channels and propagates faster upstream in thechannels than on the hillslopes. This observation indicates that the topo-graphic equilibrium is not reached over the entire model surface. There-fore our experiment illustrates a case of growth stage of the relief alonga normal fault. During the phase of upstream propagation of the topo-graphic equilibrium, the slope of the triangular facets reaches its thresh-old value while their height progressively increases until approaching aconstant value at the end of the experiment (Fig. 12D).
3.2.4. Quantification of erosionErosion rates were measured between two successive DEMs at 2 cm
(scaling to ~1000m) and 6 cm (scaling to 3000m) upfault in the majorchannels, on the crest lines (Fig. 13A), and at drainage basin head(Fig. 13B). Incision rate in themajor channels increases up to a constantvalue reached after ~70 min at 2 cm upfault and ~90 min at 6 cmupfault, indicating an upstream propagation of the topographic equilib-rium (Fig. 13A). Erosion of the adjacent crest lines starts with a delay of~30 min (scaling to ~0.4 My) at 2 cm upfault and ~120 min (scaling to~1.6 My) at 6 cm upfault. Hillslope erosion rate rapidly increases to apeak value and then slowly decreases until reaching the same stablevalue as for the major channels. This observation indicates that themajor channels control footwall erosion by imposing the erosion rate.
Fig. 11. (A) Fault-perpendicular and (B) fault-parallel vertical cross sections at thefinal stage of thenormal fault experiment, showing the relationships between the topography developedon the footwall and the syntectonic sedimentation in the hanging-wall basin. Note that particle segregation controlled by shape and density difference allows the development of strata-like deposits.
158 F. Graveleau et al. / Geomorphology 244 (2015) 146–168

Hillslope processes respond slowly before reaching the same steadyerosion rate as for the major channels with a delay of 90 min (scalingto ~1.2 My). The constant value of erosion rate for the major channelsand for the adjacent hillslopes at 6 cm upfault at the end of the experi-ment (~0.8 cm/h, scaling to ~0.52mm/y) leads to the development of asteady state topography (i.e., constant height of triangular facets) thatwould be preserved if the experiment had continued at the same sliprate. Interestingly, this steady erosion rate represents ~40% of thevertical-component of the imposed fault slip rate (2 cm/h scaling to1.3 mm/y). This suggests that the sediment filling close to the fault inthe hanging-wall basin is significant and controls themagnitude of ero-sion in the footwall. During the same period, the evolution of headwarderosion increases abruptly up to a peak value around 30 min (scaling to~0.4My)with a value of ~19.5 cm/h (scaling to ~12.7mm/y) (Fig. 13B).Then, it decreases following a power law relationship and reaches a sta-ble value of ~4 cm/h (scaling to ~2.6 mm/y) close to the end of the ex-periment. Other experiments (Strak et al., 2011) also show that theheadward erosion rate is significantly faster than the imposed faultslip rate, indicating a fast upstreammigration of the footwall dissectionby the channels,while hillslope processes are less efficient anddelay theoccurrence of a global topographic equilibrium.
3.3. Strike–slip tectonic context
Studies of major active strike–slip faults in Turkey (North Anatolianfault, NAF) or in California (San Andreas fault, SAF) reveal that the faultzone geometry and its morphological evolution control surface fault ki-nematics as well as its seismic activity (e.g., Barka and Kadinsky-Cade,1988; Wesnousky, 1988; Wallace, 1990). We present and discuss here-after some results obtained from a typical morphotectonic experimentsimulating the morphological evolution of a strike–slip fault (Fig. 14and onlinematerial A.5 and A.6). Such experiments are particularly use-ful to better constrain how strike–slip fault discontinuities (antithetic
faults, fault bends, stepovers) evolve and interact with morphogeneticprocesses (Chatton et al., 2012). In the following, we focus on the mor-phologic evolution of the fault zone and surrounding region, the accom-modation of horizontal displacements across the shear zone and thecontrol of fault structure on sedimentation to illustrate the potentialityof the experimental approach.
3.3.1. Morphotectonic evolution along a strike–slip faultThe initial topography of themodel presented in Fig. 14 was derived
from a DEMof the right-lateralWairarapa strike–slip fault (Pigeon Bushsite) in the North Island of New Zealand. Optically stimulated lumines-cence dating results on this fault yields a dextral-slip rate of ~11 mm/yand a vertical slip rate of ~1.7 mm/y at the Pigeon Bush site (Wang,2001). In the model, fault geometry and kinematics were imposed andthen accurately monitored during the whole experiment duration.Fault kinematics was set as pure strike–slip (no dip-slip component),and incremental displacements of 2.8 mm (scaling to ~10 m in nature)were performed every 30 s (scaling to ~300 y in nature) to simulate thecumulated fault offset induced by repeated major earthquakes(M N 7.5).
Surface water runoff generated by the rainfall system induces thedevelopment of a drainage network whose geometry is controlled bythe preexisting topography of the initial stage, but also by surface defor-mation because of fault activity and local erosion–sedimentation pro-cess interactions. Fault activity induces displacement of topographicfeatures that tend to dam the channels crossing the fault zone(Fig. 15; onlinematerial A6). Associatedperturbations of the local drain-age geometry and surface runoff result into slight but noticeablereorganisation of the watersheds. In the case of a dextral strike–slipfault, channels sourced in high topography enlarge their bed width bypreferentially eroding their right bank. As expected, after a certainamount of cumulated fault slip, all the channels crossing the fault zoneexhibit right lateral en baïonnette geometry.
Surface fault trace is characterised by en-échelon segments at the be-ginning of the experiment (Fig. 15B), but rapidly evolves toward amorelinear and continuous surface rupture (Fig. 15C–E). Under the combinedeffects of slip accumulation, erosion, and sedimentation, the model sur-face develops tectonic and morphological structures (online materialA6) similar to their natural counterpart, such as Riedel’s shear planes,pressure and shutter ridges, pull-apart basins, alluvial fans and terracerisers. Their space and time evolution can be precisely analysed. Partic-ularly, deformation partitioning, sequential formation of alluvial ter-races, stream captures, development of ‘traps’ filling with sedimentsare observed. New offset markers are created continuously during theexperiment. Apparently, however, most of them only record part of
Table 3Values of the imposed normal fault slip and time in the experiment for each DEM in theextensional setting experiment; note that the fault dip is 60°.
DEM # Cumulated normal fault slip (mm) Age (min)
1 11.4 302 22.8 603 34.2 904 45.6 1205 57.1 1506 68.5 1807 79.9 2108 91.3 240
Fig. 12. Evolution of a major channel-long profile (A, B) and one of its adjacent crest-long profile (C, D). The upper panels used the pristine surface of the footwall as a reference for ele-vation, while the lower panels used the base level. Note that from DEM 5 (in green), a topographic equilibrium starts to be observed close to the fault.
159F. Graveleau et al. / Geomorphology 244 (2015) 146–168

the local cumulative offset on the fault because erosion and also sedi-mentation modify their shape. As a consequence, only very rare sitesalong the fault can beused to retrieve the real cumulated displacements.This discrepancy can be quantified in experiments because the imposedoffset and active fault segments are known at each step of modelevolution.
3.3.2. Evolution of offset along a strike–slip faultIn compressional and extensional contexts, the fault trace is general-
ly unique and continuous because the fault plane remains relativelylocalised when it reaches the surface (Figs. 4 and 9). Conversely, surfacefault geometry and morphology in strike–slip settings appear morecomplex because crustal shearing generates a broader deformation
Fig. 13. Evolution of the erosion rate measured in the major channels and on the adjacent crest lines at 2 and 6 cm upfault (A) and of the headward erosion rate (B). The black arrow in-dicates the vertical component of the imposed fault slip rate (2 cm/h). Colours are referred to Fig. 9.
Fig. 14. Oblique view of the final stage of the geomorphic experiment in the strike–slip setting. The red box shows the location of Fig. 15. Black arrows indicate fault trace.
160 F. Graveleau et al. / Geomorphology 244 (2015) 146–168
zone on both parts of the main fault plane. Several fault branches, thatare R and P’ riedel types, and R’ antithetic fault (e.g., Cunningham andMann, 2007; Fossen, 2010) propagating at a short distance of the mainfault interact, generating significant fault slip partitioning.Moreover, re-cent studies point out a possible correlation between the structural ma-turity of the fault and the amount of deep slip measurable at the surface(e.g., Dolan andHaravitch, 2014). To illustrate experimentally howdeepfault slip is accommodated along a strike–slip fault, we focus hereafteron the kinematics of surface deformation along several fault-perpendicular profiles situated at three different sites along thewrenchzone (Fig. 16). Profile A crosses a single fault segment, profile B crosses areleasing bend bounded by two fault branches, and profile C crosses acomplex deformation zone where several fault branches join together.In the case where the surface rupture exhibits a well-localised singlefault (profile A), measurements of offset markers can lead to a reason-able estimation of the true offset. Indeed, an offset of 2.3 mm can bemeasured from offset morphologies, which represents 82% of the farfield block relative displacement (imposed offset = 2.8 mm). Here,only b 20% of the strike–slip component is therefore accommodatedoff the fault by diffuse shearingdeformation. Alongprofile B, which is lo-cated on a releasing bend bounded by two subparallel faults, the strike–slip component is accommodated by a double fault zone and also by two
diffuse shear zones. Each fault accommodates respectively 0.75mmand1.0mm. The first shear zone is located inside the releasing bendwhere-as the other is located to the north of it. Considering that only sharpshear gradients can be properlymeasured in the field usingmorpholog-ical markers, offsets along the two fault zones lead to a maximum totalamount of 1.75mm,which represents about 63% of the imposed farfielddisplacement. This underestimation of fault slip is even more criticallyevidencedwhen looking at profile C, which is located at a complex junc-tion between several strike–slip branches. Only a gentle sharp gradientof 0.7 mm can be evidenced, meaning that about 75% of the strike–slipcomponent is likely accommodated by diffuse shearing extending overmore than 1.5 cm apart from the fault zone (equivalent to a few hun-dred meters in nature). Experiments highlight that measuring fault off-set from morphostructural observations along the fault is not an easytask. As in nature, instantaneous and cumulated fault offsets can belargely underestimated.
3.3.3. Subsurface fault structureSectioning the model at the end of the experiment allows for an
analysis of the fault geometry at depth and of syntectonic sedimentarylayers. This is of interest to better understand the interactions betweenfault structure and tectonic activity versus surface processes (erosion
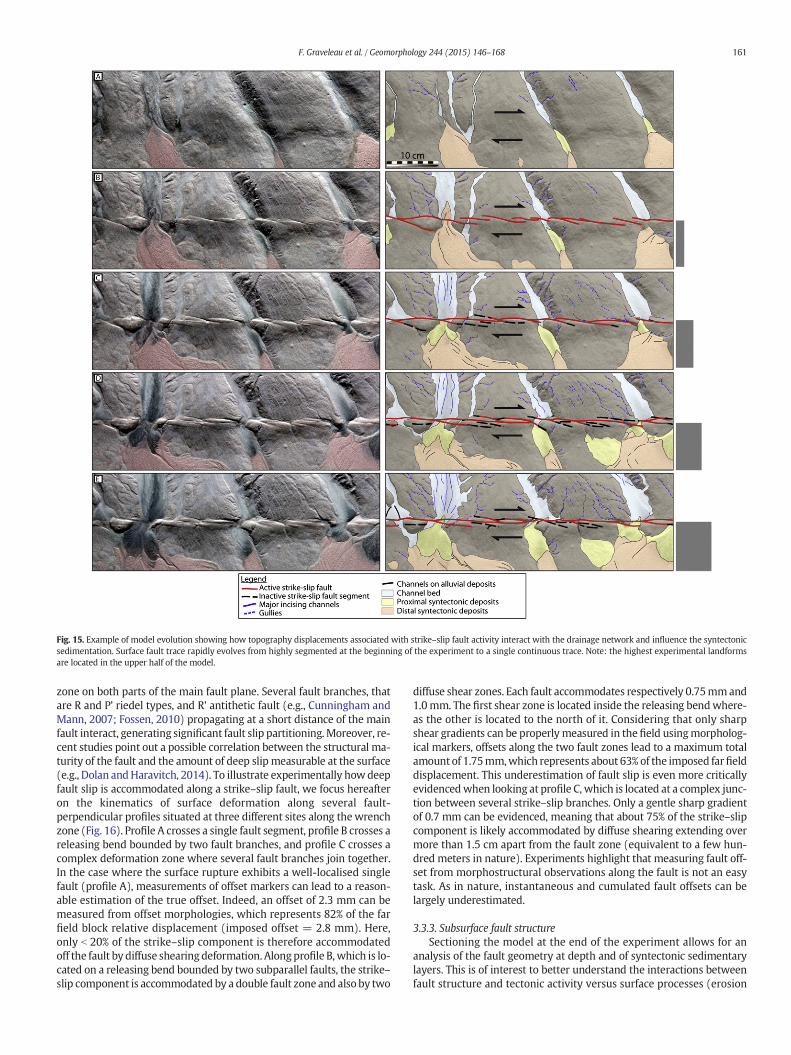
Fig. 15. Example of model evolution showing how topography displacements associated with strike–slip fault activity interact with the drainage network and influence the syntectonicsedimentation. Surface fault trace rapidly evolves from highly segmented at the beginning of the experiment to a single continuous trace. Note: the highest experimental landformsare located in the upper half of the model.
161F. Graveleau et al. / Geomorphology 244 (2015) 146–168

and sedimentation). Except in rare areas where the model exhibits aunique fault plane, the strike–slip fault zone is generally composed ofseveral branches that join together at depth into a single vertical plane(Fig. 17). This geometry is similar to the so-called negative and positiveflower structures that characterise natural strike–slip fault geometry inseismic profiles (e.g., Harding, 1985; Sylvester, 1988). Depending on the
sense of slip and the local orientation of the fault branches, a normal or areverse component is induced, resulting in the formation of sag pondsand pull-apart basins or pressure and shutter ridges, respectively. As aconsequence, bulk displacement accommodated at depth on the base-ment fault is distributed toward the surface among several faultswhose tectonic activity evolves through time. Some branches remain
Fig. 16. Quantifying fault offset, like for instance at a trench site, faces several limitations related to the local complexity of the fault trace and the amount of diffuse deformation accom-modated off the main fault. These could result in a significant underestimation of the true offset.
162 F. Graveleau et al. / Geomorphology 244 (2015) 146–168

inactive during a certain period, then they are reactivated later whentheir geometry becomes compatible again with the evolving strainfield in the wrench zone. As observed in natural cases, sediment thick-ness and facies vary significantly on both sides of the main faultbranches, which complicate the determination of fault kinematics with-out combining their analysis with surface morphology. Despite theselimitations, some interesting observations arise from the experimentalmodel. For instance, local relief apparently has a clear influence on sub-surface fault geometries. In regions of low topography or where strongriver incision traverses the wrench zone, the fault trace is deviated to-ward topographic lows, and a narrow releasing bend generally de-velops. In regions of higher relief, compression is often associated withshearing, and the fault zone appears much more deformed and seg-mented. Fault segments are short and interact more intensively. Here,the interpretation of sedimentary records is useless to constrain fault ki-nematics because, as is the case in the field, only three-dimensionaltrenching enables the reconstruction of fault slip kinematics.
4. Discussion
4.1. Comparison of models with nature
The aim of experimental modelling in the geosciences is not to re-produce the whole complexity of natural systems but to obtain first-order information on the dynamics of processes and their couplings.Therefore, it is very insightful to point out the similarities and dissimi-larities betweenmodels and their natural counterparts to assess the rel-evance of experimental results toward nature (see also discussions inGraveleau et al., 2011; Strak et al., 2011).
Initial model geometry is a key parameter of experiment boundaryconditions, which depend on the scientific objectives and also technicallimitations. In the strike–slip experiment, a decimetric-high pre-topographywas used because the observation timewindowwas focus-ing exclusively on the last thousand years (Fig. 14A). The total durationof the experiment was not long enough to generate the long-term to-pographies required to account for the real morphology of the casestudy. In the compressional and extensional tectonic contexts, the initialstage topography was maintained flat and subhorizontal whereasinherited relief always exists in nature. This solution was adopted toavoid influencing fault nucleation and deformation propagation butalso to facilitate parametric studies based on similar and easily repro-ducible initial stage (Figs. 5B and 10A). In return, a flat subhorizontal
topography significantly lengthens experiment duration because sucha surface is very difficult to dissect. A long time is needed to acquireenough slope along the active scarps to trigger erosion and activatemorphogenesis. As a consequence, remnants of the initial surface areoften overrepresented at the end of the experiment.
Inmost of ourmodels, drainage networkmorphology slightly differsfrom the natural one. Major incising channels present generally widerbeds (~0.5–5 cm scaling to ~250–2500 m; see Fig. 3) than their naturalcounterparts (~100–1000 m). This discrepancy already has beenhighlighted in other geomorphic experiments and notably attributedto the use of water as the sediment transport fluid (Paola et al., 2009).Indeed, usingwater in models entails low Reynolds numbers comparedwith nature (e.g., Niemann and Hasbargen, 2005; Graveleau et al.,2011). However, an unscaled Reynolds number is not necessarily prob-lematic as the physics of laminarmicroscale experimental rivers still ac-count for sediment transport law characterising natural turbulent rivers(Malverti et al., 2008). Another possible element of explanation couldbe related to the physical properties of our material that present achange inmaterial rheologywith depth (Graveleau et al., 2011). Indeed,the first top half-centimetre of the model is water saturated and me-chanically very weak, whereas a significant downward hardening oc-curs. The lack of fine particles and vegetation could also be mentionedas causing unsteadiness of the channel banks. Clearly, complementaryinvestigations focused on fluid shear effect in channel beds and its scal-ing with the shear resistance of the experimental material are still re-quired. One way to reconcile channel width in models with thenatural ones could be to consider the average time scaling (1 s ~200y). Indeed, it appears that experimental channel flow in our modelshould not be compared with human scale observations of river flowbut with major flooding events, which are the most efficient drivingprocesses of erosion and transport (e.g., Turowski et al., 2009). Thewide channels that develop in our experiments should thus be consid-ered as equivalent to floodplains of natural rivers and not as individualrivers. It could be like comparing channel in ourmodels to a photographof a natural river shot with a secular-long exposure time. At that scale,natural river dynamics would not appear turbulent but likely laminar.Active riverbeds would not be cloistered in the low flow channel butwould spread over the whole floodplain.
Furthermore, channel-long geometry in experiments does not al-ways fit natural river trends. For instance, in the extensional experi-ment, channel-long profiles developing across the normal fault appearconvex upward, while river-long profiles in nature are concave upward
Fig. 17. Cross section of the fault zone performed at the end of the experiment. The fault is characterised by a flower structural geometry composed of several branches. Among those, onlytwo appear to be active at this stage (in red).
163F. Graveleau et al. / Geomorphology 244 (2015) 146–168

when topography reached a steady-state equilibrium (e.g., Hack, 1957).This difference is still not well understood (see discussion in Strak et al.,2011), but the fact that the topographic equilibrium is not reached overthe entire model may play a role. However, the increase in local slopeabove the thrust hanging-wall (Fig. 6D) is a feature classically observedin nature for similar tectonic setting (Ouchi, 1985). Finally, the shape ofthe simulated triangular facets is concave upward while it is convex tolinear in nature (e.g., Petit et al., 2009; Strak, 2012). This may comefrom the substantial erosion of the escarpment by mass wasting pro-cesses in our model, whereas slower hillslope processes such as soilcreep seem to prevail in nature (e.g., Font et al., 2002).
Erosion–transport processes in experiments can be compared tonatural ones. The granular composition of the experimental materialwas determined so that once saturated in water and exposed to waterrunoff it erodes both by incision owing to channelized runoff and bygravity-driven hillslope processes. In nature, erosion occurs through awider range of processes depending on topography, climate, vegetation,lithology, land use, etc. (e.g., Carson and Kirkby, 1972). A difference inhillslope dynamics is observed when a topographic gradient of 25° isreached, corresponding to a threshold value where landslide processesare significantly activated (Roering et al., 1999; Montgomery andBrandon, 2002). In our models, we observe two different categories ofhillslope processes depending on the slope value. At shallow slopes(b15–20°), diffusive-like processes slowly transfer particles towardthe main channels; while at steeper slopes (N15–20°), landslide-likemass wasting processesmobilize the top fewmillimetres of experimen-tal material. The observed slope threshold is correlated to a significantchange in mean erosion rate (Graveleau et al., 2011) and recall the gen-eral evolution of erosion rate as a function of mean slope in nature(Montgomery and Brandon, 2002). As a consequence, despite this slightdiscrepancy between nature and model regarding the value of thresh-old hillslope gradient for activation of landslide-like processes, the ex-perimental material succeeds in reproducing the general trend of fluxevolution as a function of topographic gradient. Concerning rivers, themode of transport of solid particles in natural streams is classically di-vided into two end-members, which are suspended load and bedload(Yalin, 1977). Although suspended load represents a great proportionof drainage basin efflux because of erosion (Allen and Allen, 2005),bedload erosion–transport has been shown as a first-order mechanismof stream incision (e.g., Foley, 1980; Sklar and Dietrich, 2001; Cooket al., 2013). In our model, transport is essentially achieved by bedloadand no load is carried in suspension. Therefore, bedload transport inthe experiments provides the agent to detach particles and incisealong channel beds.
In experiments, transported particles are deposited at different dis-tances from the channel outlet depending on their nature, thereby char-acterizing different sedimentary environments. Indeed, theexperimental material (MatIV) has been designed so that particlegrain size, grain shapes and density distribution promotes particlesorting during transport and triggers stratified sedimentation. In addi-tion, the colour difference between material particles allows us to dis-tinguish alluvial features in map view and the bedding, stratigraphicdiscontinuities, and lateral facies transitions in cross section. As a result,sedimentary deposits display striking details (Figs. 3, 11 and 17). For in-stance, the fault-perpendicular geometry of the syntectonic deposits inthe extensional context exhibits a thickening toward the fault and aprogradation of sediments away from the fault, as observed in nature(e.g., Stein et al., 1988; Armijo et al., 1996). Deposits in all modelsshow lobed geometries in map-view that are very similar to natural al-luvial fans. Their slope ranges about 3–8°, which is slightly above therange of values of natural alluvial fans in orogenic contexts (1–4°)(Saito and Oguchi, 2005; Graveleau, 2008; Graveleau et al., 2008). Parti-cle segregation during transport provides a proxy of natural sedimentgrain size. Indeed, silica powder particles (density of 2.65) and glassmicrobeads (density of 2.5) are deposited in the proximal domain of al-luvial fans and represent therefore the coarse-grained sediments
(Fig. 3G). Graphite and PVC particles (density of 2.25 and 1.38, respec-tively) are deposited in the distal domain of fan deposits and can there-fore provide a proxy of fine-grained sediments.
Finally, the landforms that developed in our morphotectonic exper-iments (Fig. 3) show striking similarities with nature, as demonstratedby preliminary morphometric comparisons between experimental fea-tures and natural landforms (Graveleau and Dominguez, 2008; Straket al., 2011). For instance, in the extensional context, thewidths of trian-gular facets (~2.5–8 cm scaling to ~1250–4000m) are comparable withthose observed along natural normal faults, such as the Wasatch fault(Utah) and the Tunka half-graben fault (Western Baikal rift). The topo-graphic profile measured along the major incising channels and alongthe main crest lines also roughly scale to their natural counterparts(see Fig. 9 of Strak et al., 2011). For experiments developing quasi-linear mountain ranges like in the extensional setting, we notice themorphological similarity of the contiguous major watersheds and alsotheir regular spacing. This is favoured by the lack of preexisting topogra-phy and determined during the early stages of channel network growth(Hovius, 1996; Castelltort and Simpson, 2006). A detailed morphomet-ric analysis and comparison of the experimental and natural landformswould be certainly very insightful. Some early tests already have beencarried out regarding for instance, Hack’s law (Hack, 1957) or themountain front sinuosity (Bull and McFadden, 1977). For the former, asimilar power law relationship is observed in nature and in modelswith equivalent Hack exponents close to 0.5 (see Fig. 7 of Strak et al.,2011). For the latter, the sinuosity of the fault trace (Smf) is close to 1in the extensional setting and slightly larger in the compressional set-ting (Smf ~1.2), meaning that both piedmonts are tectonically activeand experienced sustained uplift. Further morphometric investigationsare still needed, notably to investigate how the drainage density(Horton, 1945), the hypsometry (Strahler, 1952), and the ratio of valleyfloor width to valley height (Bull and McFadden, 1977) evolve throughtime.
4.2. Morphotectonic marker formation, evolution, and record of deformation
One of themajor valuable outcomes of the experimental approach isto provide insights onhowmorphotectonicmarkers progressively form,evolve, interact, and record deformation. In the compressional setting,morphotectonic models simulate successfully the evolution of terraceforming above an active thrust (Figs. 3I and 5). This remarkable graph-ical sequence is consistent with the classical model of fluvial terrace nu-cleation and progressive uplift above an active thrust or fault-relatedfold (e.g., Avouac and Peltzer, 1993; Avouac et al., 1993; Lavé andAvouac, 2000; Daëron et al., 2007; Simoes et al., 2007; Li et al., 2013).Models allow us to observe how progressive channel incision and con-tinuous uplift of the hanging-wall trigger the abandonment of the chan-nel bed and the formation of terraces. This dynamic is associated withavulsion on alluvial deposits and channel piracy likely associated withchanges in flow stream power. Because of the steady uplift of thehanging-wall, preserved terraces remain parallel to the active riverbed(Fig. 6), a feature not always observed in the field (Le Béon et al.,2014; Simoes et al., 2014). Finally, uplift rate inferred from terrace ge-ometry is in perfect agreement with the uplift rate determined usingthe horizontal shortening rate and the geometry of the thrust. Thismethodology is classically used in the field to infer fold growth andfault slip rates (e.g., Molnar et al., 1994; Poisson and Avouac, 2004).
In the extensional setting model, the progressive mergence of trian-gular facets andwatersheds during the early stage of topographic evolu-tion has also been observed in numerical models (Petit et al., 2009). Innature, the triangular facets form and evolve by slope retreat(Hamblin, 1976). Steep slope forming at the base of the facet progres-sively decreases toward the facet summit, leading to a convex upwardprofile. In the model, however, the steep slope formed at the base ofthe facet is rapidly eroded bymass wasting processes, producing a con-cave upward profile. Furthermore, the rapid development of a steady
164 F. Graveleau et al. / Geomorphology 244 (2015) 146–168

number of triangular facets andwatershedswith constant hillslope gra-dients close to the fault is striking and suggests that natural normal faultscarps could potentially display rapidly steady along-strike topographicfeatures, even if the further upfault topography is still in a transient re-gime. Finally, a relationship has been evidenced in the model betweenthe height of triangular facets and the fault slip rate. This has beenalso evidenced in the field (Menges, 1990) and in numerical models(Petit et al., 2009).
In the strike–slip setting, the formation and evolution of specificmorphologicmarkers (such as pressure ridges and offset drainage chan-nels) appear to be well simulated considering the good analogy be-tween simulated and natural morphologies. The observed progressivediversion of the drainage network crossing the dextral strike–slip faultillustrates the classical model of beheaded stream formation and evolu-tion (Sieh and Jahns, 1984; Grapes and Wellman, 1988).
Finally, the compressional and extensional tectonic contexts show in-teresting features of geomorphic evolution over a pristine subhorizontalsurface. Formation and growth of the drainage network is controlled byheadwardmigration ofwatersheds, suggesting the occurrence of a similarprocess in nature when an old tabular erosional surface is progressivelyuplifted and dissected (e.g., Kennan et al., 1997; Coltorti and Ollier,1999; Vassallo et al., 2007).
4.3. Landscape response time scales
Time scales of landscape responses to tectonic forcing have beenevaluated for models conducted at short time scales (i.e. earthquake inthe strike–slip setting) and long time scales (i.e. piedmont evolutionin the compressional and extensional settings). A different time scaling,that is 1 s ~50 y in the former and 1 s ~200 y in the latter, is proposed. Adifference for spatial scaling is also considered, which is 1 cm ~50 m atthe earthquake spatial scale and 1 cm ~500m at the scale of amountainfront. Time and spatial scaling in the experiments can be adjusted de-pending on the temporal and spatial scales of the studied object.These scalings are rough estimations that have to be considered withcaution. However, these chosen time scalings allow delivering averageddeformation, erosion, and sedimentation rates in the range of naturalequivalents, indicating that a comparison between model and natureis relevant. Particularly, we stress that our approach provides a way toobserve some temporal relationships between deformation and surfaceprocesses that would be difficult to observe in the field. This concernsfor instance (i) the typical lifetime of morphotectonic markers, (ii) theregularity of marker formation in response to steady tectonic forcing,and (iii) the evolution in space and time of erosion rates.
First, one of the common observations made in the three tectoniccontexts is that some morphological markers (such as terraces, sagponds) can be very ephemeral compared to the total duration of the ex-periment. This is observed in the field, but the average preservationtime of such morphotectonic markers is difficult to establish. For in-stance, some terraces in the compressional context had a lifetime of afew second to tens of minutes between their formation and removalby erosion (equivalent to 1–500 ky in nature). Features that were pre-served at the end of the experiment (or to the present day, in nature)only provide a very fragmentary sampling of themorphotectonic mark-er population that actually formed along the active structures.
Second, another important observation made in the compressionalsetting experiment is that terraces form irregularly along channelsdespite tectonic and climatic forcings that were held constant. Thisunsteadiness of the geomorphic system that emerges from a steadytectonic forcing is observed in the field, but the scales and rates remainpoorly known (e.g., Sweeney et al., 2012). Further experiments focusedon the dynamics of terrace formation (e.g., Mizutani, 1998; Hancock andAnderson, 2002) and particularly the factors controlling the autogenicityor allogenicity of thismarker in all tectonic contextswouldbevery insight-ful to constrain the scales and rates of such unsteady record. Complemen-tary investigations could for instance explore the reproducibility of this
unsteadinesswithmultiplemodel runs using the same setup, parameters,and boundary conditions. Thiswould be ameasure of chaotic or nonlinearprocesses leading to the unsteadiness.
Third, measuring erosion rates in the field over a wide range of spa-tial and temporal scales is a greatmatter of research challenge to distin-guish the steady or transient states of topography evolution(e.g., Kirchner et al., 2001; Koppes and Montgomery, 2009; Cook et al.,2014). The regular monitoring of topography throughout the experi-ments allows us to investigate both the spatial and temporal evolutionof erosion and sedimentation rates. Our approach could therefore pro-vide a way to compare instantaneous and long-term averaged ratesand to document the transient and equilibrium phases of topographyevolution. In the example of a punctual quantification of erosionthrough time in the extensional context, we can help resolve two ques-tions: (i) “What is the dynamics of landscape evolution from transientstate to steady-state?” and (ii) “What is the ratio of erosion/tectonicfluxes in the long term?” First, we have shown that a topographic equi-librium is reached first in the hanging-wall basin and progressivelypropagates upstream, characterising the end of the growth phase ofthe relief that tends toward a steady state. The portion of relief wherea topographic equilibrium is observed evolves still locally throughshort-term surface processes such as landslides and channel avulsion.Furthermore, we have evidenced in our experiments that the erosionrate measured in the long term is 0.4 times the imposed vertical faultslip rate, highlighting the role of sedimentation on erosion upfault(Babault et al., 2005).
4.4. Possible improvements and lines of further research
Modelling of morphotectonic processes always evolves. Dependingon targeted scientific issues and modelling outcomes, improvementsof experimental setups and procedures can be achieved. For instance, al-though we consider that the present compositions of the experimentalmaterial give good results in terms of similarities of processes and land-forms between nature and models (i.e., Graveleau et al., 2011; Strak,2012), these compositions and associated physical properties can stillbe improved. For instance, it would be good to add in the analogue ma-terial other particles with densities between plastic (1.38) and graphite(2.25). Similarly, modulating silica powder and glass microbead grainsizes could help reduce the detachment threshold for incision that ispresently too high. These would enhance erosion of low slopes by de-creasing the average detachment threshold for incision and would in-crease the average transport distance of sedimentary deposits. It couldalso help preserve slopes steeper than 20° and thus better simulate hill-slope gradients observed in nature. In all cases, improvements in mate-rial composition could also help develop the investigation ofsedimentary basin stratigraphy and notably their recording of the evo-lution of surrounding topography. We have not deeply investigatedthis aspect in our modelling, but the approach has been used alreadyto link watershed fluxes to the geometry of alluvial fans or deltas(Heller et al., 2001; Paola et al., 2001; Raynal et al., 2007; Rohais et al.,2012). Integration of sequence stratigraphy analysis in our modellingapproach would surely be insightful in a source-to-sinkmodel integrat-ing the interactions between tectonics, topography, erosion, andsedimentation.
Water is a very useful liquid for saturating the experimentalmaterialand for eroding the model. However, some scaling issues already men-tioned above suggest that pure water is actually not an ideal liquid forsmall-scale experimental modelling. A working possibility would be totest the addition of adjuvant that would accordingly modify liquid vis-cosity or surface tension forces. This could decrease the capillarity forceswithin the experimental material composing the topography of themodel, which could also contribute to increase erosion rates andmodifythe shape of the model landforms.
Finally, further lines of research thatwe partly explored in this papercan be greatly expandedwith the continuous recording of the kinematic
165F. Graveleau et al. / Geomorphology 244 (2015) 146–168

and topographic evolution of the models. For instance, a continuousknowledge of the horizontal and vertical displacement fields allows usto investigate the spatio-temporal variability of the accommodation ofdeformation along major fault and their expression in the topography.Scientific questions addressing the influence of surface processes andtopographic evolution on the partitioning of deformation along eachtype of faults could be explored. Similarly, continuous monitoring ofthe topography evolution could provide a measure of the evolution offluxes in a source-to-sink approach, from the drainage divide to the sed-imentary basin. This would bring significant insights on the mecha-nisms of solid load transfer between zones undergoing erosion andtransient or steady storage.
5. Conclusion
Experimentalmodelling allows studying at different time and spatialscales the impact of tectonics, erosion, and sedimentation interactionson landscape evolution. In this paper, we have investigated the forma-tion and evolution of morphotectonic markers that develop in differenttectonic contexts (thrusting, normal faulting, and strike–slip faulting) toillustrate the potentialities of this approach. In the compressional set-ting, our experiment reveals that the formation of stream terraces iscontrolled by hanging-wall uplift, channel incision, and avulsion onthe alluvial fans. Similar patterns of terrace deformation above activethrusts or fault-related folds between the experiment and the field areobserved. However, terraces appeared irregularly through the experi-ment duration despite tectonic rates and erosional conditions beingheld stable. Complementary investigations are needed to constrainhow the unsteadiness of processes in the geomorphic system canemerge from the steadiness of tectonic forcing. In the extensional set-ting, sedimentary filling in the hanging-wall controls footwall erosionand triangular facet development through the position of the baselevel and the development of topographic steady-state conditions. To-pographic steady-state conditions emerge first in the footwall andthen propagate upstream in the drainage network. Along a normalfault, steady-states conditions can be locally achieved or not dependingon the topographic positionwithin the catchment. In the strike–slip set-ting, results illustrate the evolution of drainage network along an activeright-lateral wrench fault zone. They shed light on methodological is-sues, such as uncertainty assessment when calculating slip rates fromoffsetmarkers. They reveal that a systematic underestimation of severaltens of percent should be likely considered depending on the local ge-ometry of the surface rupture and the characteristics of surfacedeformation.
Our results indicate also that the experimental approach providesvaluable insights about themorphological dynamics of topography evo-lution for all tectonic settings. It can be used to constrain the mecha-nisms of morphogenesis that are difficult to assess when observing alandscape in the field or on any aerial images. Relief dynamic is particu-larly illustrated qualitatively by movies of the experiments and quanti-tatively by DEMs and kinematic analyses. Such a dynamic view could bevery useful and enlightening for a wide range of geoscientists and abroad public involved in environmental and land use planning. Geo-morphic experiments could provide a guide to neotectonic,palaeosismological, and morphological studies to help fill the gap be-tween short-term and long-term observations of tectonic deformationsand relief growth.
Supplementary data to this article can be found online at http://dx.doi.org/10.1016/j.geomorph.2015.02.011.
Acknowledgments
The experimental works have been carried on during F.G., V.S. andM.C.’s Ph.D.s at Université Montpellier II and Université Pierreet Marie Curie (UPMC), under the funding of the French Ministry ofResearch. Several scientific programs contributed to fund these studies:
the French National Research Agency (ANR Project CENTURISKRisknat09_456076) and ‘Relief’ and ‘Eclipse’ programs of INSU CNRS.
The authors thank the Binghamton Geomorphology Symposium or-ganizing committee, and particularly S.J. Bennett, for the paper invita-tion and for their editorial work. F.J. Pazzaglia and an anonymousreader are thanked for their detailed review and comments that im-proved the manuscript. C. Romano is kindly acknowledged for his cru-cial technical help when building the experimental apparatus. Severalfigures were drawn using the free software package GMT (Wessel andSmith, 1991).
References
Allen, P.A., Allen, J.R., 2005. Basin analysis – principles and applications. Blackwell Science.Armijo, R., Tapponnier, P., Mercier, J.L., Tong-Lin, H., 1986. Quaternary extension in Southern
Tibet: Field observations and Tectonic implications. J. Geophys. Res. 91 (B14),13803–13872.
Armijo, R., Meyer, B., King, G.C.P., Rigo, A., Papanastassiou, D., 1996. Quaternary evolution of theCorinth Rift and its implications for the Late Cenozoic evolution of the Aegean. Geophys.J. Int. 126 (1), 11–53.
Armijo, R., Rauld, R., Thiele, R., Vargas, G., Campos, J., Lacassin, R., Kausel, E., 2010. TheWest An-dean Thrust, the San Ramón Fault, and the seismic hazard for Santiago, Chile. Tectonics 29(2), TC2007.
Avouac, J.-P., Peltzer, G., 1993. Active tectonics in southern Xinjiang, China: Analysis of terraceriser and normal fault scarp degradation along the Hotan-Qira Fault system. J. Geophys.Res. 98 (21) (773–721 807).
Avouac, J.-P., Tapponnier, P., Bai, M., You, H., Wang, G., 1993. Active thrusting and folding alongthe northeastern Tien Shan and late Cenozoic rotation of Tarim with respect to Dzungariaand Kazakhstan. J. Geophys. Res. 98, 6755–6804.
Avouac, J.-P., Ayoub, F., Leprince, S., Konca, O., Helmberger, D.V., 2006. The 2005, Mw 7.6 Kash-mir earthquake: Sub-pixel correlation of ASTER images and seismic waveforms analysis.Earth Planet. Sci. Lett. 249 (3–4), 514–528.
Babault, J., Bonnet, S., Crave, A., Van Den Driessche, J., 2005. Influence of piedmont sedimenta-tion on erosion dynamics of an uplifting landscape: an experimental approach. Geology33 (4), 301–304.
Babault, J., Bonnet, S., Van Den Driessche, J., Crave, A., 2007. High elevation of low relief surfacesin mountain belts: Does it equate to post-orogenic surface uplift? Terra Nova 19 (4),272–277.
Barka, A.A., Kadinsky-Cade, K., 1988. Strike-slip fault geometry in Turkey and its influence onearthquake activity. Tectonics 7 (3), 663–684.
Barrier, L., Nalpas, T., Gapais, D., Proust, J.N., Casas, A.M., Bourquin, S., 2002. Influence ofsyntectonic sedimentation on thrust geometry. Field examples from the Iberian Chain(Spain) and analogue modelling. Sediment. Geol. 146 (1–2), 91–104.
Barrier, L., Nalpas, T., Gapais, D., Proust, J.-N., 2013. Impact of synkinematic sedimentation on thegeometry and dynamics of compressive growth structures: Insights from analogue model-ling. Tectonophysics 608, 737–752.
Bernard, S., Avouac, J.-P., Dominguez, S., Simoes, M., 2007. Kinematics of fault-related foldingfrom sandbox experiments. J. Geophys. Res. 112, B03S12. http://dx.doi.org/10.1029/2005JB004148.
Bonnet, C., 2002. Analyse morphostructurale des ruptures de surface associées aux séismes deforte magnitude: exemples de terrain et modélisation analogique. M.S. Thesis. UniversitéMontpellier II, Montpellier.
Bonnet, S., 2009. Shrinking and splitting of drainage basins in orogenic landscapes from the mi-gration of the main drainage divide. Nat. Geosci. 2 (11), 766–771.
Bonnet, S., Crave, A., 2003. Landscape response to climate change: insights from experimentalmodeling and implications for tectonic versus climatic uplift of topography. Geology 31(2), 123–136.
Bonnet, C., Malavieille, J., Mosar, J., 2007. Interactions between tectonics, erosion, and sedimen-tation during the recent evolution of the Alpine orogen: Analogue modeling insights. Tec-tonics 26, TC6016. http://dx.doi.org/10.1029/2006TC002048.
Bonnet, C., Malavieille, J., Mosar, J., 2008. Surface processes versus kinematics of thrust belts: im-pact on rates of erosion, sedimentation, and exhumation – Insights from analogue models.Bull. Soc. Geol. Fr. 179 (3), 179–192.
Buiter, S.J.H., 2012. A review of brittle compressional wedge models. Tectonophysics 530–531,1–17.
Bull, W.B., McFadden, L.D., 1977. Tectonic geomorphology north and south of the Garlock Fault,California. In: Doehring, D.O. (Ed.), Geomorphology in Arid Regions, Proceedings of EighthAnnual Geomorphology Symposium. State University of New York, Binghamton,pp. 115–138.
Burbank, D.W., Anderson, R.S., 2001. Tectonic geomorphology. Blackwell Scientific, Oxford.Calassou, S., Larroque, C., Malavieille, J., 1993. Transfer zones of deformation in thrust wedges:
An experimental study. Tectonophysics 221 (3–4), 325–344.Carretier, S., Ritz, J.-F., Jackson, J., Bayasgalan, A., 2002. Morphological dating of cumulative re-
verse fault scarps: examples from the Gurvan Bodg fault system, Mongolia. Geophys.J. Int. 148, 256–277.
Carson, M.A., Kirkby, M.J., 1972. Hillslope form and processes. Cambridge University Press,Cambridge.
Castelltort, S., Simpson, G., 2006. River spacing and drainage network growth in wideningmountain ranges. Basin Res. 18 (3), 267–276.
Chatton, M., Malavieille, J., Dominguez, S., Manighetti, I., Romano, C., Beauprêtre, S., Garembois,S., Larroque, C., 2012. Interaction between slip events, erosion and sedimentation along anactive strike-slip fault: Insights from analog models, EGU General Assembly. GeophysicalResearch Abstracts, Vienna (Austria).
Chemenda, A.I., Mattauer, M., Malavieille, J., Bokun, A.N., 1995. A mechanism for syn-collisionalrock exhumation and associated normal faulting: Results from physical modelling. EarthPlanet. Sci. Lett. 132 (1–4), 225–232.
166 F. Graveleau et al. / Geomorphology 244 (2015) 146–168

Chen, Y.-G., Lai, K.-Y., Lee, Y.-H., Suppe, J., Chen, W.-S., Lin, Y.-N.N., Wang, Y., Hung, J.-H., Kuo, Y.-T., 2007. Coseismic fold scarps and their kinematic behavior in the 1999 Chi-Chi earthquakeTaiwan. J. Geophys. Res. 112, B03S02. http://dx.doi.org/10.1029/2006JB004388.
Coltorti, M., Ollier, C.D., 1999. The significance of high planation surface in the Andes of Ecuador.Geol. Soc. Lond. Spec. Publ. 162 (1), 239–253.
Cook, K.L., Turowski, J.M., Hovius, N., 2013. A demonstration of the importance of bedload trans-port for fluvial bedrock erosion and knickpoint propagation. Earth Surface Processes andLandforms 38 (7), 683–695.
Cook, K.L., Turowski, J.M., Hovius, N., 2014. River gorge eradication by downstream sweep ero-sion. Nat. Geosci. 7, 682–686.
Corti, G., 2012. Evolution and characteristics of continental rifting: Analog modeling-inspiredview and comparison with examples from the East African Rift System. Tectonophysics522–523 (0), 1–33.
Cotton, C.A., 1950. Tectonic scarps and fault valleys. Geol. Soc. Am. Bull. 61 (7), 717–758.Cunningham, W.D., Mann, P., 2007. Tectonics of strike–slip restraining and releasing bends.
Geol. Soc. Lond. Spec. Publ. 290, 1–12.Daëron, M., Avouac, J.-P., Charreau, J., Dominguez, S., 2007. Modeling the shortening history of a
fault-tip fold using structural and geomorphic records of deformation. J. Geophys. Res. 112(B03S13). http://dx.doi.org/10.1029/1006JB004460.
Davy, P., Cobbold, P.R., 1991. Experiments on shortening of a 4-layer model of the continentallithosphere. Tectonophysics 188 (1–2), 1–25.
DeCelles, P.G., Gray, M.B., Ridgway, K.D., Cole, R.B., Pivnik, D.A., Pequera, N., Srivastava, P., 1991.Controls on synorogenic alluvial-fan architecture, Beartooth Conglomerate (Palaeocene),Wyoming and Montana. Sedimentology 38 (4), 567–590.
Dolan, J.F., Haravitch, B.D., 2014. How well do surface measurements track slip at depth in largestrike-slip earthquakes? The importance of fault structural maturity in controlling on-faultslip versus off-fault surface deformation. Earth Planet. Sci. Lett. 388, 38–47.
Dominguez, S., Lallemand, S., Malavieille, J., Schnuerle, P., 1998a. Oblique subduction of theGagua Ridge beneath the Ryukyu accretionary wedge system: Insights from marine obser-vations and sand-box experiments. Mar. Geophys. Res. 20 (5), 383–402.
Dominguez, S., Lallemand, S.E., Malavieille, J., von Huene, R., 1998b. Upper plate deformation as-sociated with seamount subduction. Tectonophysics 293 (3–4), 207–224.
Dominguez, S., Malavieille, J., Lallemand, S.E., 2000. Deformation of accretionary wedges in re-sponse to seamount subduction: insights from sandbox experiments. Tectonics 19 (1),182–196.
Dominguez, S., Avouac, J.-P., Michel, R., 2003. Horizontal co-seismic deformation of the 1999Chi-Chi earthquake measured from SPOT satellite images: implications for the seismiccycle along the western foothills of Central Taiwan. J. Geophys. Res. 108 (B2), 2083.http://dx.doi.org/10.1029/2001JB000951.
Dooley, T., Schreurs, G., 2012. Analogue modelling of intraplate strike-slip tectonics: A reviewand new experimental results. Tectonophysics 574–575, 1–71.
Douglass, J.C., Schmeeckle, M., 2007. Analogue modeling of transverse drainage mechanisms.Geomorphology 84, 22–43.
Foley, M.G., 1980. Bed-rock incision by streams. Geol. Soc. Am. Bull. 91 (10), 577–578.Font,M., Lagarde, J.-L., Amorese, D., Coutard, J.-P., Ozouf, J.-C., 2002. Uneméthode de quantification
de la dégradation d'un escarpement de faille au cours des cycles climatiques du Quaternaire:la faille de Jobourg (Nord Cotentin, France). Compt. Rendus Geosci. 334 (3), 171–178.
Fossen, H., 2010. Structural geology. Cambridge University Press.Gaudemer, Y., Tapponnier, P., Meyer, B., Peltzer, G., Shunmin, G., Zhitai, C., Huagung, D.,
Cifuentes, I., 1995. Partitioning of crustal slip between linked, active faults in the easternQilian Shan, and evidence for a major seismic gap, the ‘Tianzhu gap', on the westernHaiyuan Fault, Gansu (China). Geophys. J. Int. 120 (3), 599–645.
Gawthorpe, R.L., Leeder, M.R., 2000. Tectono-sedimentary evolution of active extensional basins.Basin Res. 12 (3–4), 195–218.
Gestain, V., Nalpas, T., Rouby, D., Barrier, L., 2004. Rôle des niveaux incompétentssyncinématiques sur l'évolution des zones chevauchantes – modélisations analogiques.Bull. Soc. Geol. Fr. 175 (4), 351–359.
Grapes, R., Wellman, H., 1988. The Wairarapa fault. Victoria University of Wellington,Wellington, New Zealand.
Graveleau, F., 2003. Modélisation analogique des Interactions entre Erosion, Sédimentation etTectonique: Détermination d'un protocole expérimental et étude de différents matériauxgranulaires. M.S. Thesis. Université Montpellier II, Montpellier.
Graveleau, F., 2004. Modélisation des Interactions Tectonique-Érosion-Sédimentation dans lesavant-pays de chaîne: Etude et mise en place d'un nouveau protocole expérimental. M.S.Thesis. Université Montpellier II, Montpellier.
Graveleau, F., 2008. Interactions Tectonique, Erosion, Sédimentation dans les avant-pays dechaînes: Modélisation analogique et étude des piémonts de l’est du Tian Shan (AsieCentrale). Ph.D. Dissertation. Université Montpellier II, Montpellier.
Graveleau, F., Dominguez, S., 2008. Analoguemodelling of the interactions between tectonics, ero-sion and sedimentation in foreland thrust belts. Compt. Rendus Geosci. 340 (5), 324–333.
Graveleau, F., Dominguez, S., Malavieille, J., 2008. A new analoguemodelling approach for study-ing interactions between surface processes and deformation in active mountain belt pied-monts. In: Corti, G. (Ed.), GeoMod 2008 Third International Geomodelling Conference.Bolletino di Geofisica teorica ed applicata, Villa la Pietra, Firenze, Italy, pp. 501–505.
Graveleau, F., Hurtrez, J.-E., Dominguez, S., Malavieille, J., 2011. A new experimental material formodeling interactions between tectonics and surface processes. Tectonophysics 513 (1–4),68–87.
Graveleau, F., Malavieille, J., Dominguez, S., 2012. Experimental modelling of orogenicwedges: Areview. Tectonophysics 538–540, 1–66.
Graveleau, F., Suppe, J., Chang, K.-J., Dominguez, S., Ustaszewski, M., Huang, M.-H., 2014. Incre-mental vs. geological growth of folds: Examples of Tungshih anticline and Neiwan synclineduring Taiwan Mw7.6 1999 ChiChi earthquake, EGU2014-6910, abstract. Geophys. Res.Abstr., Vienna, Austria.
Gutscher, M.-A., Kukowski, N., Malavieille, J., Lallemand, S., 1996. Cyclical behavior of thrustwedges: Insights from high basal friction sandbox experiments. Geology 24 (2), 135–138.
Gutscher, M.-A., Kukowski, N., Malavieille, J., Lallemand, S., 1998a. Episodic imbricate thrustingand underthrusting: Analog experiments and mechanical analysis applied to the Alaskanaccretionary wedge. J. Geophys. Res. 103 (B5), 10161–10176.
Gutscher, M.-A., Kukowski, N., Malavieille, J., Lallemand, S., 1998b. Material transfer in accretion-ary wedges: a quantitative analysis based on a systematic series of analog experiments.J. Struct. Geol. 20 (4), 407–416.
Gutscher, M.-A., Klaeschen, D., Flueh, E., Malavieille, J., 2001. Non-Coulombwedges, wrong-waythrusting, and natural hazard in Cascadia. Geology 29 (5), 379–382.
Hack, J.T., 1957. Studies of longitudinal stream profiles in Virginia and Maryland. U.S. Geol. Surv.Prof. Pap. 294 (B), 45–97.
Hamblin, W.K., 1976. Patterns of displacement along the Wasatch fault. Geology 4 (10),619–622.
Hancock, G.S., Anderson, R.S., 2002. Numerical modeling of fluvial terrace formation in responseto oscillating climate. Geol. Soc. Am. Bull. 114 (9), 1131–1142.
Harding, T.P., 1985. Seismic characteristics and identification of negative flower structures, pos-itive flower structures, and positive structural inversion. AAPG Bull. 69 (4), 582–600.
Hasbargen, L.E., Paola, C., 2000. Landscape instability in an experimental drainage basin. Geology28 (12), 1067–1070.
Heller, P.L., Paola, C., Hwang, I., John, B., Steel, R., 2001. Geomorphology and sequence stratigra-phy due to slow and rapid base-level changes in an experimental subsiding basin (XES96–1). Am. Assoc. Pet. Geol. Bull. 85 (5), 817–838.
Horsfield, W., 1977. An experimental approach to basement-controlled faulting. Geol. Mijnb. 56(4), 363–370.
Horton, R.E., 1945. Erosional development of stream and their drainage basins; hydrophysicalapproach to quantitative morphology. Bull. Geol. Soc. Am. 56 (3), 275–370.
Hovius, N., 1996. Regular spacing of drainage outlets from linear mountain belts. Basin Res. 8(4), 29–44.
Hubbert, M.K., 1937. Theory of scale models as applied to the study of geologic structures. Bull.Geol. Soc. Am. 48 (10), 1459–1519.
Hubert-Ferrari, A., Suppe, J., Gonzalez-Mieres, R., Wang, X., 2007. Mechanisms of active foldingof the landscape (southern Tian Shan, China). J. Geophys. Res. 112, B03S09. http://dx.doi.org/10.1029/2006JB004362.
Keller, E.A., Pinter, N., 2001. Active tectonics. Earthquakes, uplift, and landscape. Prentice Hall,Upper Saddle River, New Jersey.
Keller, E.A., Zepeda, R.L., Rockwell, T.K., Ku, T.L., Dinklage,W.S., 1998. Active tectonics atWheelerRidge, southern San Joaquin Valley, California. Geol. Soc. Am. Bull. 110 (3), 298–310.
Kennan, L., Lamb, S.H., Hoke, L., 1997. High-altitude palaeosurfaces in the Bolivian Andes: evi-dence for late Cenozoic surface uplift. Geol. Soc. Lond. Spec. Publ. 120 (1), 307–323.
Kirchner, J.W., Finkel, R.C., Riebe, C.S., Granger, D.E., Clayton, J.L., King, J.G., Megahan, W.F., 2001.Mountain erosion over 10 yr, 10 k.y., and 10 m.y timescales. Geology 29 (7), 591–594.
Klinger, Y., Etchebes, M., Tapponnier, P., Narteau, C., 2011. Characteristic slip for five great earth-quakes along the Fuyun fault in China. Nat. Geosci. 4 (6), 389–392.
Konstantinovskaia, E., Malavieille, J., 2005. Erosion and exhumation in accretionary orogens: Ex-perimental and geological approaches. Geochem. Geophys. Geosyst. 6 (Q02006).
Konstantinovskaya, E., Malavieille, J., 2011. Thrust wedges with décollement levels andsyntectonic erosion: A view from analogue models. Tectonophysics 502 (3–4), 336–350.
Koppes, M.N., Montgomery, D.R., 2009. The relative efficacy of fluvial and glacial erosion overmodern to orogenic timescales. Nat. Geosci. 2 (8), 644–647.
Kukowski, N., von Huene, R., Malavieille, J., Lallemand, S., 1994. Sediment accretion against abuttress beneath the Peruvian continental margin as simulated by sandbox modelling.Geol. Rundsch. 83 (4), 822–831.
Kukowski, N., Lallemand, S.E., Malavieille, J., Gutscher, M.-A., Reston, T.J., 2002. Mechanicaldecoupling and basal duplex formation observed in sandbox experiments with applicationto the western Mediterranean Ridge accretionary complex. Mar. Geol. 186 (1–2), 29–42.
Lague, D., Crave, A., Davy, P., 2003. Laboratory experiments simulating the geomorphic responseto tectonic uplift. J. Geophys. Res. 108, B1. http://dx.doi.org/10.1029/2002JB001785.
Lallemand, S.E., Malavieille, J., Calassou, S., 1992. Effects of oceanic ridge subduction on accre-tionary wedges: experimental modeling and marine observations. Tectonics 11 (6),1301–1313.
Lallemand, S.E., Schnurle, P., Malavieille, J., 1994. Coulomb theory applied to accretionary andnon-accretionary wedges – Possible causes for tectonic erosion and/or frontal accretion.J. Geophys. Res. 99 (B6), 12033–12055.
Larroque, C., Calassou, S., Malavieille, J., Chanier, F., 1995. Experimental modelling of forearcbasin development during accretionary wedge growth. Basin Res. 7 (3), 255–268.
Lavé, J., Avouac, J.-P., 2000. Active folding of fluvial terraces across the Siwalik Hills (Himalaya ofcentral Nepal). J. Geophys. Res. 105 (B3), 5735–5770.
Le Béon,M., Suppe, J., Jaiswal, M.K., Chen, Y.-G., Ustaszewski, M.E., 2014. Deciphering cumulativefault slip vectors from fold scarps: Relationships between long-term and coseismic defor-mations in central Western Taiwan. J. Geophys. Res. Solid Earth 119 (7) (2013JB010794).
Li, T., Chen, J., Thompson, J.A., Burbank, D.W., Xiao, W., 2012. Equivalency of geologic and geo-detic rates in contractional orogens: New insights from the Pamir Frontal Thrust. Geophys.Res. Lett. 39. http://dx.doi.org/10.1029/2012GL051782.
Li, T., Chen, J., Thompson, J.A., Burbank, D.W., Yang, X., 2013. Quantification of three-dimensionalfolding using fluvial terraces: A case study from theMushi anticline, northernmargin of theChinese Pamir. J. Geophys. Res. 118, 4628–4647.
Lu, C.-Y., Malavieille, J., 1994. Oblique convergence, indentation and rotation tectonic in TaiwanMountain belt: Insights from experimental modelling. Earth Planet. Sci. Lett. 121 (3–4),477–494.
Malavieille, J., 1984. Modélisation expérimentale des chevauchements imbriqués: Applicationaux chaînes de montagnes. Bull. Soc. Geol. Fr. 7 (1), 129–138.
Malavieille, J., 2010. Impact of erosion, sedimentation, and structural heritage on the structureand kinematics of orogenic wedges: Analog models and case studies. GSA Today 20 (1),4–10.
Malavieille, J., Konstantinovskaya, E., 2010. Impact of surface processes on the growth oforogenic wedges: insights from analog models and case studies. Geotectonics 44(6), 541–558.
Malavieille, J., Trullenque, G., 2009. Consequences of continental subduction on forearc basinand accretionary wedge deformation in SE Taiwan: insights from analogue modeling.Tectonophysics 466, 377–394.
Malavieille, J., Larroque, C., Calassou, S., 1993. Modélisation expérimentale des relationstectonique/sédimentation entre bassin avant-arc et prisme d'accrétion. Comptes rendusde l'Académie des sciences. Série 2, Mécanique, Physique, Chimie, Sciences de l'univers, Sci-ences de la Terre 316(II) pp. 1131–1137.
Malverti, L., Lajeunesse, E., Métivier, F., 2007. Experimental investigation of the response of analluvial river to a vertical offset of its bed. In: Hulscher, S., Dohmen-Janssen, C. (Eds.),River, coastal and estuarine morphodynamics: 5th IAHR Symposium. Taylor and Francis,Philadelphia, pp. 179–184.
167F. Graveleau et al. / Geomorphology 244 (2015) 146–168

Malverti, L., Lajeunesse, E., Metivier, F., 2008. Small is beautiful: Upscaling frommicroscale lam-inar to natural turbulent rivers. J. Geophys. Res. 113, F04004. http://dx.doi.org/10.1029/2007JF000974 (002008).
Manighetti, I., King, G.C.P., Gaudemer, Y., Scholz, C.H., Doubre, C., 2001. Slip accumulation andlateral propagation of active normal faults in Afar. J. Geophys. Res. Solid Earth 106 (B7),13667–13696.
Martinez, A., Malavieille, J., Lallemand, S., Collot, J.-Y., 2002. Partition de la déformation dans unprisme d'accrétion sédimentaire en convergence oblique: approche expérimentale. Bull.Soc. Geol. Fr. 173 (1), 17–24.
Menges, C.M., 1990. Soils and geomorphic evolution of bedrock facets on a tectonically activemountain front, western Sangre de Cristo Mountains, New Mexico. Geomorphology 3(3–4), 301–332.
Michel, R., Avouac, J.-P., 2002. Deformation due to the 17 August Izmit earthquake measuredfrom SPOT image. J. Geophys. Res. 107.
Mizutani, T., 1998. Laboratory experiment and digital simulation of multiple fill-cut terrace for-mation. Geomorphology 24, 353–361.
Molnar, P., Brown, E.T., Burchfiel, B.C., Qidong, D., Xianyue, F., Jun, L., Raisbeck, G.M., Jianbang, S.,Zhangming, W., Yiou, F., Huichuan, Y., 1994. Quaternary climate change and the formationof river terraces across growing anticlines on the north flank of the Tien Shan, China. J. Geol.102 (5), 583–602.
Montgomery, D.R., Brandon, M.T., 2002. Topographic controls on erosion rates in tectonically ac-tive mountain ranges. Earth Planet. Sci. Lett. 201 (3–4), 481–489.
Nalpas, T., Gapais, D., Vergès, J., Barrier, L., Gestain, V., Leroux, G., Rouby, R., Kermarrec, J.J., 2003.Effects of rate and nature of synkinematic sedimentation on the growth of compressivestructures constrained by analogue models and field examples. In: McCann, T., Saintot, A.(Eds.), Tracing tectonic deformation using the sedimentary record. Geological Society Spe-cial Publications, London, pp. 307–319.
Niemann, J.D., Hasbargen, L.E., 2005. A comparison of experimental and natural drainage basinmorphology across a range of scales. J. Geophys. Res. 110, F04017. http://dx.doi.org/10.1029/2004JF000204.
Ouchi, S., 1985. Response of alluvial rivers to slow active tectonicmovement. Geol. Soc. Am. Bull.96 (4), 504–515.
Ouchi, S., 2004. Flume experiments on the horizontal stream offset by strike-slip faults. EarthSurf. Process. Landf. 29 (2), 161–173.
Ouchi, S., 2011. Developement of experimental landforms by rainfall erosion and uplift. J. Geol.Soc. Jpn. 117 (3), 163–171.
Paola, C., Mullin, J., Ellis, C., Mohrig, D., Swenson, J.B., Parker, G., Hickson, T., Heller, P.L., Pratson,L., Syvitski, J., Sheets, B., Strong, N., 2001. Experimental stratigraphy. GSA Today 11, 4–9.
Paola, C., Straub, K., Mohrig, D., Reinhardt, L., 2009. The “unreasonable effectiveness” of strati-graphic and geomorphic experiments. Earth Sci. Rev. 97 (1–4), 1–43.
Pazzaglia, F.J., Brandon, M.T., 2001. A fluvial record of long-term steady-state uplift and erosionacross the Cascadia forearc high, westernWashington State. Am. J. Sci. 301 (4–5), 385–431.
Peakall, J., Ashworth, P.J., Best, J.L., 1996. Physical modelling in fluvial geomorphology: princi-ples, applications and unresolved issues. In: Rhoads, B.L., Thorn, C.E. (Eds.), The scientificnature of geomorphology. Wiley & Sons, Chichester, pp. 221–253.
Perrin, C., Clemenzi, L., Malavieille, J., Molli, G., Taboada, A., Dominguez, S., 2013. Impact of ero-sion and décollements on large-scale faulting and folding in orogenic wedges: analoguemodels and case studies. J. Geol. Soc. 170, 893–904.
Persson, K.S., Garcia-Castellanos, D., Sokoutis, D., 2004. River transport effects on compressionalbelts: First results from an integrated analogue-numerical model. J. Geophys. Res. 109,B01409. http://dx.doi.org/10.1029/2002JB002274.
Petit, C., Gunnell, Y., Gonga-Saholiariliva, N., Meyer, B., Séguinot, J., 2009. Faceted spurs at nor-mal fault scarps: Insights from numerical modeling. J. Geophys. Res. 114, B05403. http://dx.doi.org/10.1029/2008JB005955.
Pichot, T., Nalpas, T., 2009. Influence of synkinematic sedimentation in a thrust systemwith twodecollement levels; analogue modelling. Tectonophysics 473 (3–4), 466–475.
Pinto, L., Hérail, G., Sepúlveda, S.A., Krop, P., 2008. A Neogene giant landslide in Tarapacá, north-ern Chile: A signal of instability of the westernmost Altiplano and palaeoseismicity effects.Geomorphology 102 (3–4), 532–541.
Poisson, B., Avouac, J.-P., 2004. Holocene hydrological changes inferred from alluvial stream en-trenchment in North Tian Shan (Northwestern China). J. Geol. 112, 231–249.
Raynal, O., Graveleau, F., Séranne, M., Dominguez, S., Bouchette, F., Hurtrez, J.E., 2007. Analoguemodelling of erosion-transport-deposition processes (coastal catchments to shoreface) in re-sponse to high-frequency sea-level and precipitation changes, EGU General Assembly, Vienna(Austria).
Reid, H.F., 1910. The mechanics of the earthquake. The California Earthquake of April 18, 1906.Carnegie Institute, Washington D.C.
Roering, J.J., Kirchner, J.W., Dietrich, W.E., 1999. Evidence for non-linear, diffusive sedimenttransport on hillslopes and implications for landscape morphology. Water Resour. Res.35, 853–870.
Rohais, S., Bonnet, S., Eschard, R., 2012. Sedimentary record of tectonic and climatic ero-sional perturbations in an experimental coupled catchment-fan system. Basin Res.24, 198–212.
Saito, K., Oguchi, T., 2005. Slope of alluvial fans in humid regions of Japan, Taiwan and thePhilippines. Geomorphology 70 (1–2), 147–162.
Schlagenhauf, A., Manighetti, I., Malavieille, J., Dominguez, S., 2008. Incremental growth of nor-mal faults: insights from a laser-equipped analog experiment. Earth Planet. Sci. Lett. 273(3–4), 299–311.
Schumm, S.A., Mosley, M.P., Weaver, W.E., 1987. Experimental fluvial geomorphology. JohnWiley, New York.
Schumm, S.A., Dumont, J., Holbrook, J., 2000. Active tectonics and alluvial rivers.Seeber, L., Gornitz, V., 1983. River profiles along the Himalayan arc as indicators of active tecton-
ics. Tectonophysics 92 (4), 335–367.Sieh, K.E., 1984. Lateral offsets and revised dates of large prehistoric earthquakes at Pallett Creek,
southern California. J. Geophys. Res. Solid Earth 89 (B9), 7641–7670.Sieh, K.E., Jahns, R.H., 1984. Holocene activity of the San Andreas fault at Wallace Creek, Califor-
nia. Geol. Soc. Am. Bull. 95 (8), 883–896.Simoes, M., Avouac, J.-P., Chen, Y.-G., Singhvi, A.K., Wang, C.-Y., Jaiswal, M., Chan, Y.-C., Bernard,
S., 2007. Kinematic analysis of the Pakuashan fault tip fold, west central Taiwan: Shorteningrate and age of folding inception. J. Geophys. Res. 112 (B03S14).
Simoes, M., Chen, Y.G., Shinde, D.P., Singhvi, A.K., 2014. Lateral variations in the long-term sliprate of the Chelungpu fault, Central Taiwan, from the analysis of deformed fluvial terraces.J. Geophys. Res. Solid Earth 119 (4), 3740–3766.
Sklar, L.S., Dietrich, W.E., 2001. Sediment and rock strength controls on river incision into bed-rock. Geology 29 (12), 1087–1090.
Stein, R.S., King, G.C.P., Rundle, J.B., 1988. The growth of geological structures by repeated earth-quakes 2. Field examples of continental Dip-slip faults. J. Geophys. Res. 93 (B11),13319–13331.
Strahler, A.N., 1952. Hypsometric (area altitude) analysis of erosional topology. Bull. Am. Geol.Soc. Am. 63 (11), 1117–1142.
Strak, V., 2012. L’évolution du relief le long des escarpements de faille normale active: observa-tions, modélisations expérimentales et numériques. PhD Dissertation. Université Pierre etMarie Curie - Paris 6, Paris.
Strak, V., Dominguez, S., Petit, C., Meyer, B., Loget, N., 2011. Interactions between tectonics anderosion during normal fault growth: Insights from experimental modelling. Tectonophysics513 (1–4), 1–19.
Suppe, J., 1983. Geometry and kinematics of fault-bend folding. Am. J. Sci. 283 (7), 684–721.Sweeney, K.E., Roering, J.J., Almond, P., Reckling, T., 2012. How steady are steady-state land-
scapes? Using visible-near-infrared soil spectroscopy to quantify erosional variability. Geol-ogy 40 (9), 807–810.
Sylvester, A.G., 1988. Strike-slip faults. Geol. Soc. Am. Bull. 100, 1666–1703.Talling, P.J., Stewart, M.D., Stark, C.P., Gupta, S., Vincent, S.J., 1997. Regular spacing of drainage
outlets from linear fault blocks. Basin Res. 9 (4), 275–302.Turowski, J.M., Lague, D., Crave, A., Hovius, N., 2006. Experimental channel response to tectonic
uplift. J. Geophys. Res. 111 (F03008).Turowski, J.M., Yager, E.M., Badoux, A., Rickenmann, D., Molnar, P., 2009. The impact of excep-
tional events on erosion, bedload transport and channel stability in a step-pool channel.Earth Surf. Process. Landf. 34 (12), 1661–1673.
Van derWoerd, J., Xu, X., Li, H., Tapponnier, P., Meyer, B., Ryerson, F.J., Meriaux, A.S., Xu, Z., 2001.Rapid active thrusting along the northwestern range front of the Tanghe Nan Shan (west-ern Gansu, China). J. Geophys. Res. Solid Earth 106 (B12), 30475–30504.
Van Dissen, R.J., Berryman, K.R., 1996. Surface rupture earthquakes over the last ~1000 years inthe Wellington region, New Zealand, and implications for ground shaking hazard.J. Geophys. Res. Solid Earth 101 (B3), 5999–6019.
Van Puymbroeck, N., Michel, R., Binet, R., Avouac, J.-P., Taboury, J., 2000. Measuring earthquakesfrom optical satellite images. Appl. Opt. Inf. Process. 39 (23), 1–14.
Vassallo, R., Ritz, J.F., Braucher, R., Jolivet, M., Carretier, S., Larroque, C., Chauvet, A., Sue, C.,Todbileg, M., Bourles, D.L., Arzahnikova, N., Arzahnikov, S., 2007. Transpressional tectonicsand stream terraces of the Gobi-Altay, Mongolia. Tectonics 26, TC5013. http://dx.doi.org/10.1029/2006TC002081.
Wallace, R.E., 1990. The San Andreas Fault System, California, Washington.Wang, N., 2001. Optically stimulated luminescence dating techniques and their application to
dating the loess in southern north Island. M.Sc.. Victoria University of Wellington.Wesnousky, S.G., 1988. Seismological and structural evolution of strike-slip faults. Nature 355,
340–343.Wessel, P., Smith, W.H.F., 1991. Free software helps map and display data. In: AGU (Ed.), EOS,
Transactions American Geophysical Union, pp. 441–446.Wesson, R.L., Helley, E.J., Lajoie, K.R., Wentworth, C.M., 1975. Faults and future earthquakes. In:
Borchardt, R.D. (Ed.), Studies for Seismic Zonation of the San Francisco Bay Region. UnitedStates Geological Survey, Washington D.C., pp. 5–30.
Yalin, M.S., 1977. Mechanics of Sediment Transport. Pergamon Press, Oxford.
168 F. Graveleau et al. / Geomorphology 244 (2015) 146–168
Copyright © 2022 FDOKUMEN