producción y comercialización de chupetines energizantes ...
Upload
khangminh22Category
view
0download
0
Geomecánica para Reservorios y Producción - Aplicaciones para Incrementar la Producción y ubicaciónde nuevos pozos
Anna Paula Lougon
Business Owner Geomechanics and Drilling
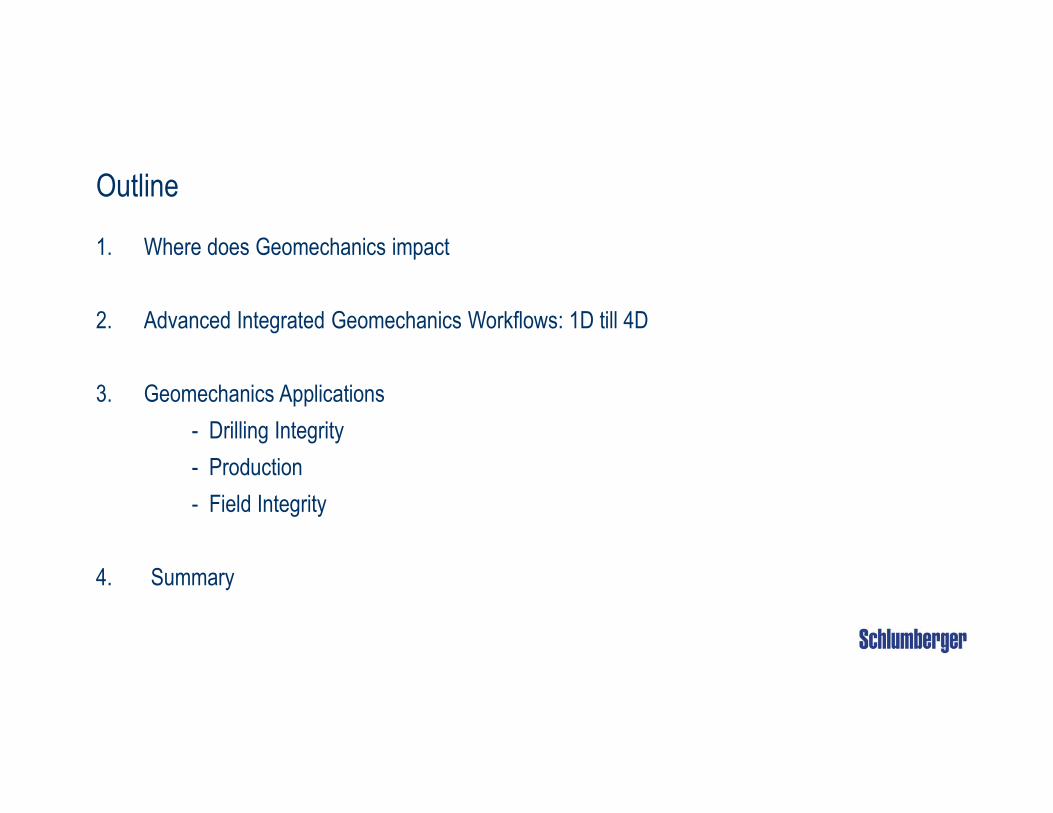
Outline
1. Where does Geomechanics impact
2. Advanced Integrated Geomechanics Workflows: 1D till 4D
3. Geomechanics Applications
- Drilling Integrity
- Production
- Field Integrity
4. Summary

What is a Geomechanical Model?

Why a rock fails ?
Because of changes in :
1. Stresses
2. Pressure (fluid flow)
3. Temperature
4. Time (creep)
5. Chemistry (fluid interaction)
... and modes of failures also depend on rock structure

In reservoir and over- and under-burden, and not just in weak or compacting rocks.From appraisal to abandonment & from well to field applications.
Where does Geomechanics impact?Im
ag
e: S
chlu
mbe
rge
r

Just drilling geomechanics approach?
1D
2D
3D4D
3D – VISAGE / PETREL
• Hazards identification at the Area
• Can represent the structure
• Complex Geology
• Equilibrated Stress
4D.. De Genaro et al. (2010). VISAGE
t =0
t =10yr
Coupled 3D reservoir geomechanics technology which models life-of-field
dynamic reservoir behavior and performance

So
urce
: : ne
ed-m
ed
ia.sm
ug
mug.co
m
Source: Schlumberger
What we do?
7
Search
(Seismic/ Basin)
Drill & Evaluate
Well-Test & Produce
Drill more wells &
Produce
Maintain & Increase
Production
Elastic Properties (E, v)Rock Strength (UCS, FANG, TSTR)
Max Horizontal StressMin Horizontal Stress
Overburden Stress
Pp
Pore Pressure
N

Well Centric Geomechanics (1D)
Rock Mechanical Parameters
Strength
UCS F
20 400
0 70
UCS
Friction Angle
Earth Stress & Pore Pressure
Pp S h S H S V
MPa0 200Stress W N E
Stress Direction S h
fault ?
Regional Trend
PR E
1Poisson’sRatio
Young’s Modulus
100
IsotropicElastic
1.0
0
10
• Formation tops• Unconformities• Faults
Structure
Performed building a Mechanical Earth Model (MEM)
Continuous description of mechanical properties and stresses along the well calibrated against measurements and observations
PredictWellbore Failure
MechanicalStratigraphy
• Rock Fabric• Mechanical support• Deformation Mechanisms
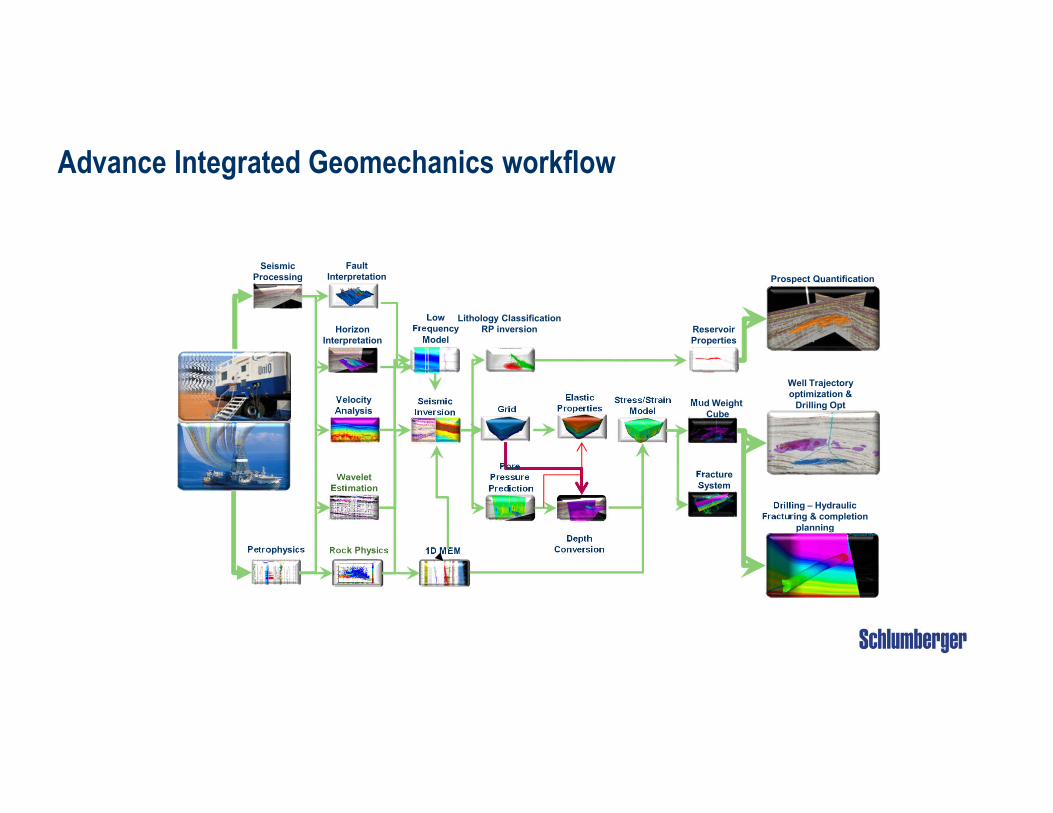
Advance Integrated Geomechanics workflow
Seismic Processing
Grid
Elastic Properties
Stress/Strain Model
Mud WeightCube
Wavelet Estimation
Seismic Inversion
Prospect Quantification
Fracture System
Well Trajectory optimization &
Drilling Opt
Drilling – Hydraulic Fracturing & completion
planning
Petrophysics Rock Physics
Lithology ClassificationRP inversion
Pore PressurePrediction
Depth Conversion
Low Frequency
Model
1D MEM
ReservoirProperties
Velocity Analysis
Fault Interpretation
Horizon Interpretation

Geomechanics Applications
10
•Wellbore Stability – right mud weight and system•Casing design and location•ROP and drill bit optimization•PAD location and attack angle
Drilling Integrity
•Hydraulic frac design and optimization•Completion optimization•(Casing, Cement, Perforation, Screen)
•Injectivity optimization (rate, cap rock)•Sand/solid production
Production Integrity
•Pore volume collapse•Compaction/Subsidence•Fault and fracture shearing – sealing•Water breakthrough•Reservoir management/EOR/
Field Integrity

Drilling Integrity
11

Problemas Geo-mecánicos en Perforación
P10 %
6%
12 %
16 %
6%
4 %22 %
13 %
10 %
10 %
10 %

Hydraulic Fracture
ShearFailure
MinimumStress
MaximumStress
Pmud
Classical Wellbore Deformation
13

Mud Weight Window and Wellbore Damage

3D Safe Mud Weight Window
Safe mud weight window prediction before and during field development.
– Pore Pressure gradient– Breakout gradient– Fracture gradient– Breakdown gradient
Analysis honours all complexity included in the 3D MEM.
Pre-production
After Production
Narrow
Wide

Wellbore Trajectory Optimization

Fault Shear Failure
Values closer to 0 (red) indicate areas of potential fault reactivation due to drilling.

Pore Pressure Cube (g/cc)
First drilled well on the field*Structural Map for the field*Anisotropy profiles– DSI- not
conclusive*Finite element modeling- VISAGE
VISAGE modeling had as main objective reducing uncertainty associated to stresses in the field, for this a geometrical analysis of the anticline and fault was performed for the determination of direction and stress gradients in the border of the study area.
Well-1DLTarget 1 3034-3360m
Azimuth Max Stress Orientation +/-200
N
Case 1 SPE-WVS-040: Field water depth 800-1050m:

Field Horizontal Stress Orientation
Well-2DL *Structural Map for the field*Finite element modeling- VISAGE *Anisotropy profiles– Scanner dispersion plots*4 arm caliper (not conclusive)*Dual-OBMI
Azimuth ~1100
Well-2DL
Well-1
Well 1: *Structural Map: Azimuth +/- 300
*VISAGE Modeling: Azimuth +/-200
Well 2DL*VISAGE Modeling: Azimuth +/- 105-1150
*Sonic Scanner Azimuth +/- 1100
*CALIBAN Analysis Not conclusive

0.95-2.15G/CC 0.95-2.15G/CC
Operational Window– Next deviated well in the South region of the field, feasibility of horizontal drilling?
0.95-2.15G/CC
-With the new information was concluded that drilling highly deviated wells at the reservoir levels is feasible
-Beginning at 60 degrees the safe drilling window becomes narrow, 0.7 g/cc (mud loss risk).
-It is recommended to use tools that confirm stress orientation in the South region of the field
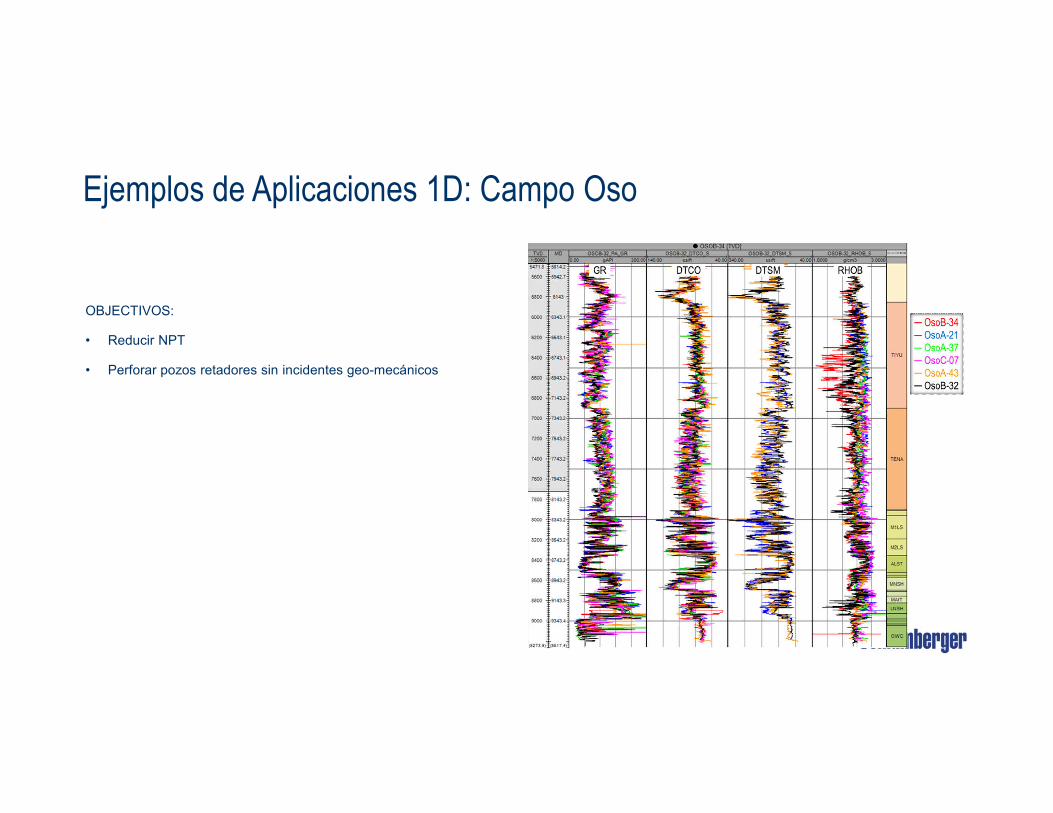
Ejemplos de Aplicaciones 1D: Campo Oso
OBJECTIVOS:
• Reducir NPT
• Perforar pozos retadores sin incidentes geo-mecánicos

Ejemplos de Aplicaciones 1D: Campo Oso

Ejemplos de Aplicaciones 1D: Campo Oso

Ejemplos de Aplicaciones 1D: Campo Oso
Desviación Azimuth
Pozo Oso A-47H
Sección de Aterrizaje: NAPO
MW 11 13ppg ECD 14.3ppg

Ejemplos de Aplicaciones 1D: Campo Oso

Ejemplos de Aplicaciones 1D: Campo Oso
2011 OsoA-47H / OsoB-48H.
2012 OsoA-49H, OsoB-52H, OsoB-54, OsoG-63H, OsoA-55H, OsoA-57H y OsoA-59H.
2013 OsoA-73, OsoA-75H, OsoA-77, OsoA-79, OsoA-91, OsoA-92H y OsoA-93H Ajustes MEM.
2013/14 OsoH-113 hasta el OsoH-122.
2014 Re-entry: OsoA-39R1, OsoA-35R1, OsoA-37R1 y OsoA-43R1. OsoA-150. y OsoI-04i
2015 OsoI-05i, OsoH-123, OsoH-124, OsoG-100, OsoI-141, OsoH-125, OsoI-142, OsoI-143, OsoH-126, OsoG-101, OsoI-144 y OsoH-127.
350
260
408356
129
460
54
443
317
225
328 331
466
397
532 553
467
565
474498
459.7
0
1
2
3
4
5
6
7
0
100
200
300
400
500
600
OSO PAD H
34
27.822.1
19.6 1924.3323.69
16.17 14.69
18.92
0
5
10
15
20
25
30
35
40
OSO I 004 OSO I 005 OSO I 141 OSO I 142 OSO I 143 OSO I 144
OSO I Tiempo Planeado x real
Tiempo Planeado Tiempo Real
4.4
4.6
4.8
5
5.2
5.4
5.6
5.8
6
-
1,000,000
2,000,000
3,000,000
4,000,000
5,000,000
6,000,000
OSO I 004 OSO I 005 OSO I 141 OSO I 142 OSO I 143
PAD I - OSO
AFE Real Cost

Production Integrity

Stress rotation

Breakout prediction, Stress Rotation

Hydraulic Fracturing Modeling
30
q h
H
P
?
Natural fracture
Near wellbore evaluation Integrated evaluation
stimulation design optimization
unconventional fracture model
Hydraulic Fracture
Natural Fracture
Cross?
Dilate?
Dilate & Reactivate?
Natural Fracture Activity
Hydraulic Fracture
Natural Fracture
Cross?
Dilate?
Dilate & Reactivate?
Natural Fracture Activity

Understanding Pad Scale Phenomena: Wolfcamp Shale, US

Problemas Geo-mecánicos en Producción
Rocas no Consolidadas Rocas muycompetentes
Reservorios poco consolidados: Oportunidad
Estado 1Falla de la Roca
Estado 1Falla de la Roca
Estado 2TransporteEstado 2
Transporte

Flujo de trabajo analítico para arenamiento
Datos de entrada: MEM
Workflow
• Definir completación
• Tasa de Depletación
• Parámetros de arenamiento
Análisis de intervaloDrawdown Crítico para tasas de depletación en intervalos definidos
Análisis a profundidad específicaCritical drawdown as a function of epletion for single depth
Def
inir
prof
undi
dad
Pro
fund
idad
In
terv
alo

Ejemplos de Aplicaciones Arenamiento: Campo Apaika
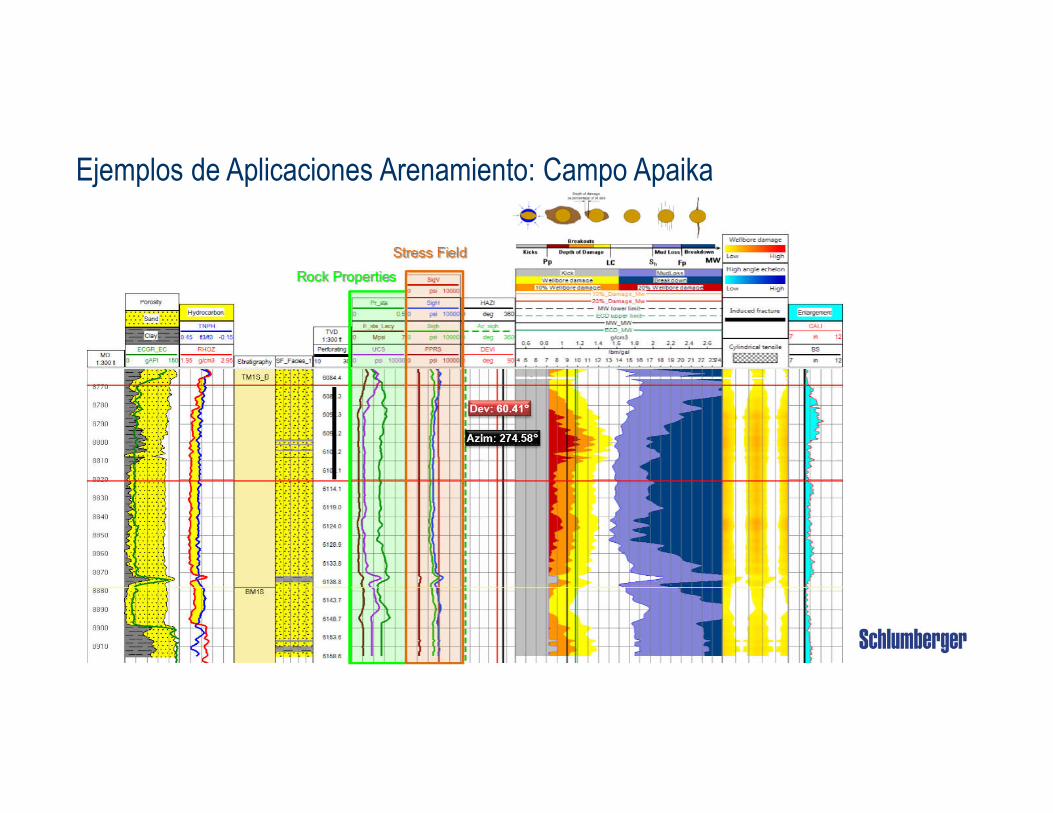
Ejemplos de Aplicaciones Arenamiento: Campo Apaika

Con este análisis, el drawdown crítico recomendado para el inicio de la producción del pozo fue de 1190 psi. (BHP=1100psi)
Ejemplos de Aplicaciones Arenamiento: Campo Apaika

Production and Well Placement : Application of Field-scale
Low Critical Drawdown
High Critical Drawdown37
Sand Production Critical Drawdown Cube

Field integrity
38

Stress transfer mechanismwellbore
depleted zone
h stress trajectories h concentration
Far
-fie
ld s
tress
es
reservoir
over-burden
under-burden
dept
h
h
initialh
depletedh
reservoir
overburden
underburden
Consequences:reduced h in the reservoirhigher h above and below the reservoir
39 NK5/29/2017

Coupled Reservoir Geomechanics Modeling

South Arne Field
Danish sector of the North Sea
Operated by Hess
Carbonate chalk reservoir

Result: Stress orientation before production
Initial State
N

Result: Stress orientation after production
N
Initial StateFinal State

Field Example: Reservoir Compaction with Production
Geomechanics Prediction
Compaction determined by two independent methods difference of ~5 cm
Prediction helped in development planning & seismic inversion confirmed prediction
4-D Seismic Inversion

Two fracture sets were
implemented
Different fracture strike,
spacing and conductivity
Field Example: Reservoir Compaction with Production
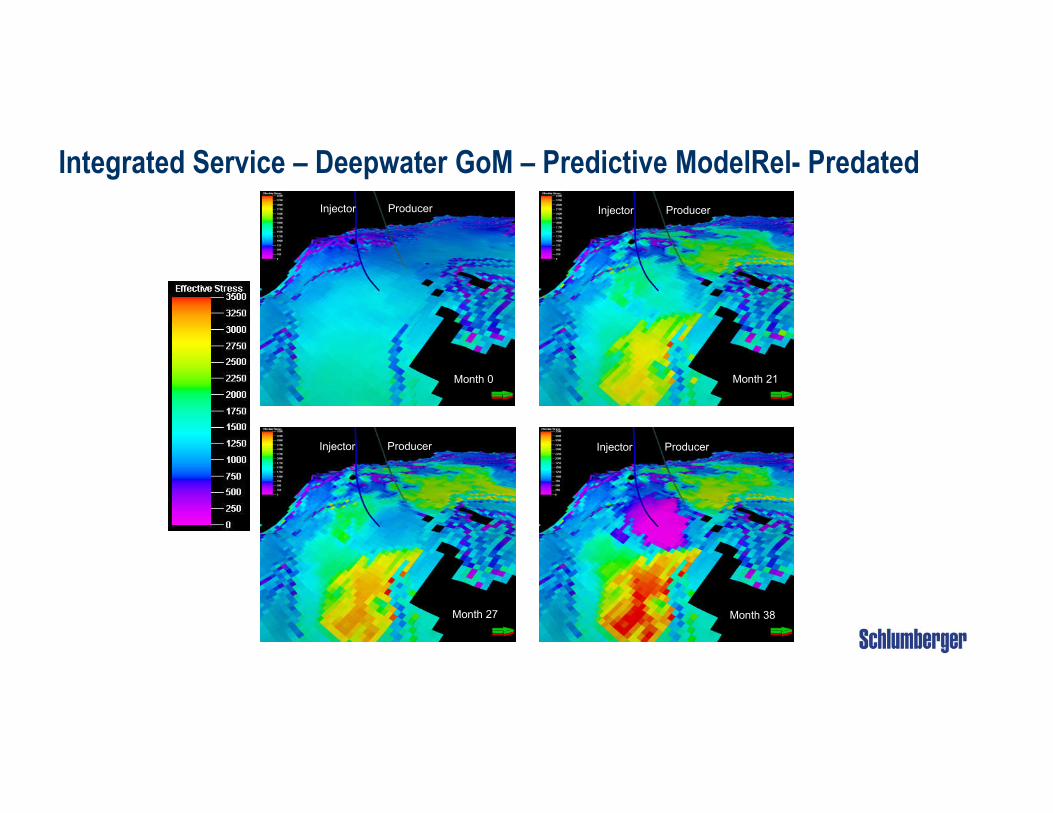
Injector Producer
Month 38
Injector Producer
Month 27
Month 0
Injector Producer
Month 21
Injector Producer
Example of Production Well FailureIntegrated Service – Deepwater GoM – Predictive ModelRel- Predated

What else the Shared Geomechanical Model can do to Minimize Operational Risk?
Well planning & optimization Stress modeling Well location and trajectory Wellbore stability and mud weights Casing design Completions
Dynamic behaviour and depletion Stress evolution Compaction and subsidence Permeability (including fractures) Sanding Fault activation, induced seismicity In-fill drilling Casing failure
IOR/EOR and treatments Frac treatments Thermal and pressure effects Water injector placement Flood directionality, sweep efficiency
Field development planning /Intervention planning
Storage and waste disposal (NORM, cuttings reinjection, fresh & waste water)
4-D seismic – Seismic Reservoir Monitoring
47

Summary
• Rock is always under-stress & stress changes with time - production/injection
• Geomechanics is critical to the optimal safety drilling side by the management of the
reservoir for maximum productivity and recovery
• Geomechanics can minimize operational risks
3D/4D Mechanical Earth models contribute to
• Plan safe well trajectories
• Ensure completion integrity under production-induced compaction
Copyright © 2022 FDOKUMEN