Geographical and age-stratified distributions of foot-and-mouth disease virus-seropositive and...
11
The Veterinary Record, September 2, 2006 FOOT-AND-MOUTH disease (FMD) is a highly contagious viral disease of even-toed ungulates caused by a single- stranded positive-sense RNA virus (Picornaviridae, genus Aphthovirus) and is one of the most economically impor- tant diseases of livestock. Although often referred to as a single disease, there are seven serotypes of the virus distrib- uted around the world: serotypes O, A, C, Asia1 and South African Territories (SAT) 1, 2 and 3. They are indistinguish- able clinically (Kitching 2002), although they may have dif- ferent geographical distributions (Kitching 1999, Vosloo and others 2002) and epidemiologies (Knowles and Samuel 2003). An important feature of FMD is that the virus may be recovered from the oropharynx for a varying period after an animal has been infected; if this period is longer than 28 days the animal is classified as persistently infected or a ‘carrier’ (van Bekkum and others 1959, Hedger and Stubbins 1971). The main site where the virus persists is the epithelium of the dorsal surface of the soft palate (Burrows 1966, Prato Murphy and others 1994, Zhang and Kitching 2001). It has been shown that the virus can persist in cattle for up to two- and-a-half years (Hedger 1970) and in sheep and goats for up to nine months (Burrows 1968, McVicar and Sutmoller 1968). The virus appears to be cleared from pigs very rap- idly and they do not become ‘carriers’ in the classical sense. In southern Africa, the Cape buffalo (Syncerus caffer) has been shown to carry the SAT type viruses (Hedger and oth- ers 1973, Ferris and others 1995) for up to five years without showing clinical signs of disease (Condy and others 1985). There are reports of the virus being transmitted from ‘car- rier’ cattle to susceptible cattle, for example, in Australia in 1871/72 (Hedger and Stubbins 1971) and more recently in small ruminants in Saudi Arabia (Hafez and others 1994) and between buffaloes and cattle (Dawe and others 1994a). In Africa, the virus has been transmitted experimentally from Cape buffaloes to cattle (Hedger and Condy 1985, Dawe and others 1994b), but it has not been demonstrated conclusively that it can be transmitted from persistently infected cattle to naive cattle. The epidemiological role of persistently infected or ‘carrier’ animals is still controversial (Sutmoller and others 1968, Wittmann 1990, Moonen and Schrijver 2000), but the possibility that they may become the focus of new outbreaks greatly influences control strategies and trade regulations. FMD is considered to be endemic in much of sub-Saharan Africa, with the exception of disease-free zones in southern Africa. At the time of this study, Cameroon was not imple- menting any FMD control measures and no vaccines were available in the markets. A small serological study in the 1980s suggested that several serotypes were present, but the data suggest that there may have been problems with heterotypic antibody responses (Tanya 1985). A later study examined iso- lates of the virus from Cameroon in the 1970s and 80s; they were typed by the World Reference Laboratory, Pirbright, UK (WRL) (Ekue and others 1990), and serotypes O and A were identified in the Adamawa province. This paper describes the results of a population-based cross-sectional study of the seroprevalence of FMD and the recovery of the virus from probang samples taken from cattle and their associated sheep flocks in the Adamawa province of Cameroon. The objectives were to identify the serotypes of the virus circulating, and to estimate the seroprevalence of each serotype and its geographical distribution. The term ‘probang-positive’ has been used when referring to the data, rather than the terms ‘carrier’ or ‘persistence’, because the exact date of infection was not known and only a single probang sample was examined from each animal. Geographical and age-stratified distributions of foot-and-mouth disease virus-seropositive and probang-positive cattle herds in the Adamawa province of Cameroon B. M. de C. Bronsvoort, J. Anderson, A. Corteyn, P. Hamblin, R. P. Kitching, C. Nfon, V. N. Tanya, K. L. Morgan Six of the seven known serotypes of foot-and-mouth disease (FMD) virus occur in Africa. This paper describes the results of a population-based cross-sectional study of the seroprevalence of FMD and the persistence of the virus in cattle herds and associated sheep flocks in the Adamawa province of Cameroon. Antibody titres measured by the virus neutralising test indicated that serotypes O, A and SAT2 viruses had been circulating in the province. The estimates of apparent seroprevalence in cattle herds, based on five juvenile animals (eight to 24 months old) per herd, were 74·8 per cent for serotype SAT2, 30·8 per cent for serotype A and 11·2 per cent for serotype O, indicating recent exposure; the estimates based on animals more than 24 months of age were 91·1 per cent for SAT2, 83·6 per cent for A and 34·2 per cent for serotype O. Epithelial and oropharyngeal samples were collected from cattle and small ruminants, cultured and typed by ELISA; serotypes A and SAT2 were isolated from both types of sample. The herd-level estimate of apparent prevalence of probang- positive herds was 19·5 per cent and the animal-level estimate of apparent prevalence was 3·4 per cent. The geographical distribution of the seropositive herds based on juveniles suggested that recent SAT2 exposure was widespread and particularly high in the more northern and western parts of the province, whereas recent exposure to serotype A was patchy and more concentrated in the south and east. This distribution corresponded very closely with the distribution of herds from which virus was recovered by probang, indicating recent exposure or infection. No serotype O viruses were recovered from cattle, and the distribution of seropositive herds suggested very localised recent exposure. The apparent prevalence of probang-positive animals declined with the age of the animal and the period since the last recorded outbreak in the herd. Veterinary Record (2006) 159, 299-308 B. M. de C. Bronsvoort, BVSc, MSc, MPVM, PhD, MRCVS, K. L. Morgan, BA, VetMB, PhD, MRCVS, Department of Veterinary Clinical Sciences, University of Liverpool, Leahurst, Neston, Cheshire CH64 7TE J. Anderson, HND, LiBiol, PhD, MBE, A. Corteyn, HNC, P. Hamblin, R. P. Kitching, BVetMed, BSc, MSc, PhD, MRCVS, Institute for Animal Health, Ash Road, Pirbright, Woking, Surrey GU24 0NF C. Nfon, DVM, MSc, PhD, V. N. Tanya, DVM, PhD, Institute of Agricultural Research for Development, Regional Centre of Wakwa, BP 65, Ngaoundere, Cameroon Dr Bronsvoort’s present address is Centre for Tropical Veterinary Medicine, University of Edinburgh, Royal (Dick) School of Veterinary Studies, Easter Bush Veterinary Centre, Roslin, Midlothian EH25 9RG Dr Kitching’s present address is National Centre for Foreign Animal Disease, Canadian Food Inspection Agency, 2539 Main Street, Winnipeg, Manitoba, R2V 4G4, Canada Dr Tanya’s present address is Ministry of Scientific Research and Innovation, PO Box 1457, Yaounde, Cameroon Papers & Articles group.bmj.com on March 9, 2013 - Published by veterinaryrecord.bmj.com Downloaded from
-
Upload
casciences -
Category
Documents
-
view
0 -
download
0
Transcript of Geographical and age-stratified distributions of foot-and-mouth disease virus-seropositive and...
The Veterinary Record, September 2, 2006
FOOT-AND-MOUTH disease (FMD) is a highly contagious viral disease of even-toed ungulates caused by a single - stranded positive-sense RNA virus (Picornaviridae, genus Aphthovirus) and is one of the most economically impor-tant diseases of livestock. Although often referred to as a single disease, there are seven serotypes of the virus distrib-uted around the world: serotypes O, A, C, Asia1 and South African Territories (SAT) 1, 2 and 3. They are indistinguish-able clinically (Kitching 2002), although they may have dif-ferent geographical distributions (Kitching 1999, Vosloo and others 2002) and epidemiologies (Knowles and Samuel 2003). An important feature of FMD is that the virus may be recovered from the oropharynx for a varying period after an animal has been infected; if this period is longer than 28 days the animal is classified as persistently infected or a ‘carrier’ (van Bekkum and others 1959, Hedger and Stubbins 1971). The main site where the virus persists is the epithelium of the dorsal surface of the soft palate (Burrows 1966, Prato Murphy and others 1994, Zhang and Kitching 2001). It has been shown that the virus can persist in cattle for up to two-and-a-half years (Hedger 1970) and in sheep and goats for up to nine months (Burrows 1968, McVicar and Sutmoller 1968). The virus appears to be cleared from pigs very rap-idly and they do not become ‘carriers’ in the classical sense. In southern Africa, the Cape buffalo (Syncerus caffer) has been shown to carry the SAT type viruses (Hedger and oth-ers 1973, Ferris and others 1995) for up to five years without showing clinical signs of disease (Condy and others 1985). There are reports of the virus being transmitted from ‘car-rier’ cattle to susceptible cattle, for example, in Australia in 1871/72 (Hedger and Stubbins 1971) and more recently in small ruminants in Saudi Arabia (Hafez and others 1994) and between buffaloes and cattle (Dawe and others 1994a).
In Africa, the virus has been transmitted experimentally from Cape buffaloes to cattle (Hedger and Condy 1985, Dawe and others 1994b), but it has not been demonstrated conclusively that it can be transmitted from persistently infected cattle to naive cattle. The epidemiological role of persistently infected or ‘carrier’ animals is still controversial (Sutmoller and others 1968, Wittmann 1990, Moonen and Schrijver 2000), but the possibility that they may become the focus of new outbreaks greatly influences control strategies and trade regulations.
FMD is considered to be endemic in much of sub-Saharan Africa, with the exception of disease-free zones in southern Africa. At the time of this study, Cameroon was not imple-menting any FMD control measures and no vaccines were available in the markets. A small serological study in the 1980s suggested that several serotypes were present, but the data suggest that there may have been problems with heterotypic antibody responses (Tanya 1985). A later study examined iso-lates of the virus from Cameroon in the 1970s and 80s; they were typed by the World Reference Laboratory, Pirbright, UK (WRL) (Ekue and others 1990), and serotypes O and A were identified in the Adamawa province.
This paper describes the results of a population-based cross-sectional study of the seroprevalence of FMD and the recovery of the virus from probang samples taken from cattle and their associated sheep flocks in the Adamawa province of Cameroon. The objectives were to identify the serotypes of the virus circulating, and to estimate the seroprevalence of each serotype and its geographical distribution. The term ‘probang-positive’ has been used when referring to the data, rather than the terms ‘carrier’ or ‘persistence’, because the exact date of infection was not known and only a single probang sample was examined from each animal.
Geographical and age-stratified distributions of foot-and-mouth disease virus-seropositive and probang-positive cattle herds in the Adamawa province of Cameroon
B. M. de C. Bronsvoort, J. Anderson, A. Corteyn, P. Hamblin, R. P. Kitching,C. Nfon, V. N. Tanya, K. L. Morgan
Six of the seven known serotypes of foot-and-mouth disease (FMD) virus occur in Africa. This paper describes the results of a population-based cross-sectional study of the seroprevalence of FMD and the persistence of the virus in cattle herds and associated sheep flocks in the Adamawa province of Cameroon. Antibody titres measured by the virus neutralising test indicated that serotypes O, A and SAT2 viruses had been circulating in the province. The estimates of apparent seroprevalence in cattle herds, based on five juvenile animals (eight to 24 months old) per herd, were 74·8 per cent for serotype SAT2, 30·8 per cent for serotype A and 11·2 per cent for serotype O, indicating recent exposure; the estimates based on animals more than 24 months of age were 91·1 per cent for SAT2, 83·6 per cent for A and 34·2 per cent for serotype O. Epithelial and oropharyngeal samples were collected from cattle and small ruminants, cultured and typed by ELISA; serotypes A and SAT2 were isolated from both types of sample. The herd-level estimate of apparent prevalence of probang-positive herds was 19·5 per cent and the animal-level estimate of apparent prevalence was 3·4 per cent. The geographical distribution of the seropositive herds based on juveniles suggested that recent SAT2 exposure was widespread and particularly high in the more northern and western parts of the province, whereas recent exposure to serotype A was patchy and more concentrated in the south and east. This distribution corresponded very closely with the distribution of herds from which virus was recovered by probang, indicating recent exposure or infection. No serotype O viruses were recovered from cattle, and the distribution of seropositive herds suggested very localised recent exposure. The apparent prevalence of probang-positive animals declined with the age of the animal and the period since the last recorded outbreak in the herd.
Veterinary Record (2006) 159, 299-308
B. M. de C. Bronsvoort, BVSc, MSc, MPVM, PhD, MRCVS,K. L. Morgan, BA, VetMB, PhD, MRCVS,Department of Veterinary Clinical Sciences, University of Liverpool, Leahurst, Neston, Cheshire CH64 7TE
J. Anderson, HND, LiBiol, PhD, MBE,A. Corteyn, HNC,P. Hamblin,R. P. Kitching, BVetMed, BSc, MSc, PhD, MRCVS,Institute for Animal Health, Ash Road, Pirbright, Woking, SurreyGU24 0NF
C. Nfon, DVM, MSc, PhD,V. N. Tanya, DVM, PhD,Institute of Agricultural Research for Development, Regional Centre of Wakwa, BP 65, Ngaoundere, Cameroon
Dr Bronsvoort’s present address is Centre for Tropical Veterinary Medicine, University of Edinburgh, Royal (Dick) School of Veterinary Studies, Easter Bush Veterinary Centre, Roslin, Midlothian EH25 9RG
Dr Kitching’s present address is National Centre for Foreign Animal Disease, Canadian Food Inspection Agency, 2539 Main Street, Winnipeg, Manitoba, R2V 4G4, Canada
Dr Tanya’s present address is Ministry of Scientific Research and Innovation, PO Box 1457, Yaounde, Cameroon
Papers & Articles
group.bmj.com on March 9, 2013 - Published by veterinaryrecord.bmj.comDownloaded from
Papers & Articles
The Veterinary Record, September 2, 2006
MATERIALS AND METHODS
Study populationThe study population has been described by Bronsvoort and others (2003). Briefly, the Adamawa province lies between latitudes 6°N and 8°N, covers an area of approximately 64,000 km2, and is the main cattle-producing region of the country. It is divided into five administrative divisions with 88 Ministry of Livestock, Fisheries and Animal Industries (MINEPIA) veterinary centres distributed across it (Fig 1). A sample frame was constructed by using the rinderpest vac-cination records from the veterinary centres. Vaccination records from 1998/99 or the next most recent year were obtained, and 13,006 herds were entered on to an Access (Microsoft) database. A cross-sectional study design was used and a stratified, two-stage random cluster sample of cattle herds was selected. The sample size was calculated by using the program Survey Toolbox (AusVet Animal Health Services) on the basis of the assumption that 50 per cent of the herds in an endemic uncontrolled region would be seropositive. In addition, the herds were clustered around the 88 veterinary centres, and an average of 150 herds per centre was used with a 10:1 cost ratio of centre to herd (that is, it was estimated that the costs of travelling to a centre were 10 times the cost of sampling an animal once there) and a 90 per cent confidence interval (CI) with 9 per cent error. A sample of 162 herds was selected by random sampling 54 veterinary centres with replacement (with sampling pro-portional to the number of herds listed at each centre, that is, centres with larger numbers of herds were more likely to be selected). A random sample of three herds was then selected from each of these centres, such that if a centre was selected twice six herds were randomly sampled, and if the same herd was selected more than once the selection was repeated (that is, herds were sampled without replace-ment). This allowed for a refusal rate of up to 10 per cent. The within-herd sampling strategy was based on a calculated limit of detection (Cannon and Roe 1982) and assumed a perfect test and a within-herd seroprevalence of 50 per cent, which seemed reasonable for a highly infectious disease such as FMD (Thomson 1994). For an average herd of 70 animals, to achieve a 95 per cent probability of finding at least one positive animal, a sample size of five was needed. A stratified
random sample of up to five juveniles (eight to 24 months of age) and five adults (more than 24 months of age) was selected from each herd.
The herds were visited between April and October 2000, and a standardised questionnaire was used to collect informa-tion from the herdsmen about the management of the herd, its movements and contacts with other herds and local wild-life. The results have been described by Bronsvoort and others (2003). The ages of the cattle estimated by the herdsmen were
(b)
RoadLakeAdamawa provinceCameroon
0-100100-200200-300
300-400
400-500
500-600
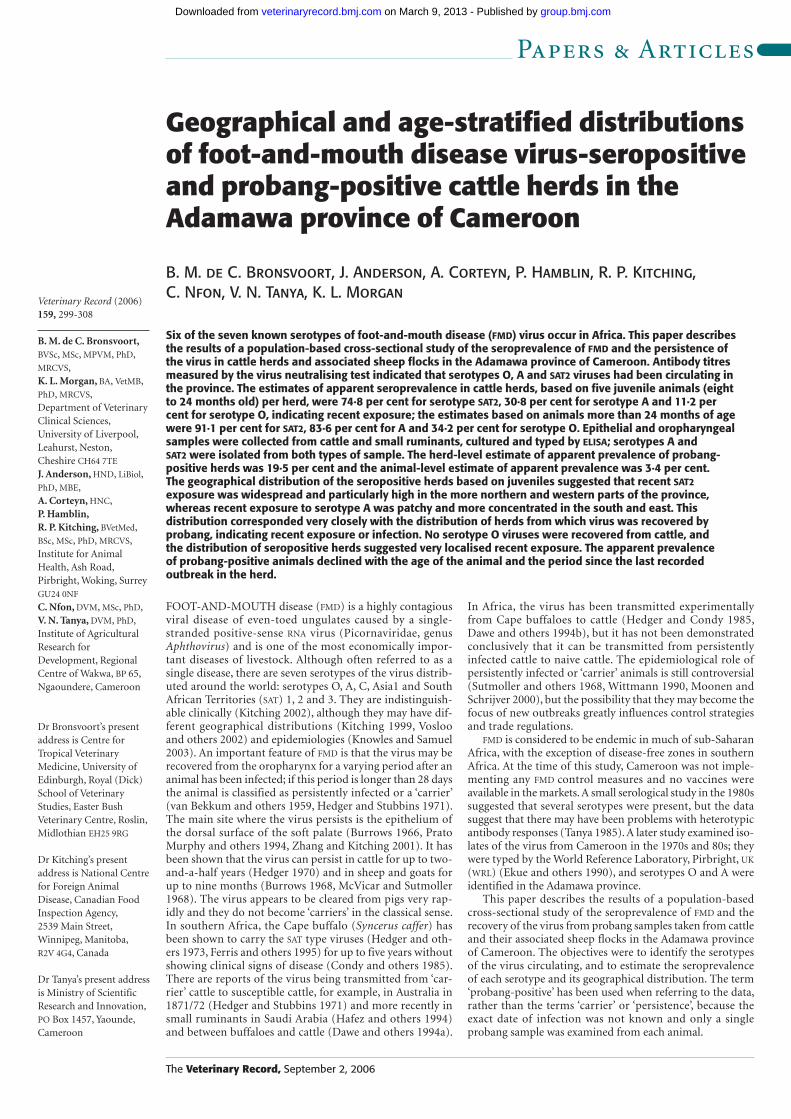
FIG 1: (a) Map of Cameroon showing the study region (green) and the five administrative divisions V Vina, M Mbere, D Djerem, B Mayo Banyo, F Faro et Deo. (b) Map showing the positions of the 88 veterinary centres; the size of the blue circles is proportional to the number of herds registered at each centre
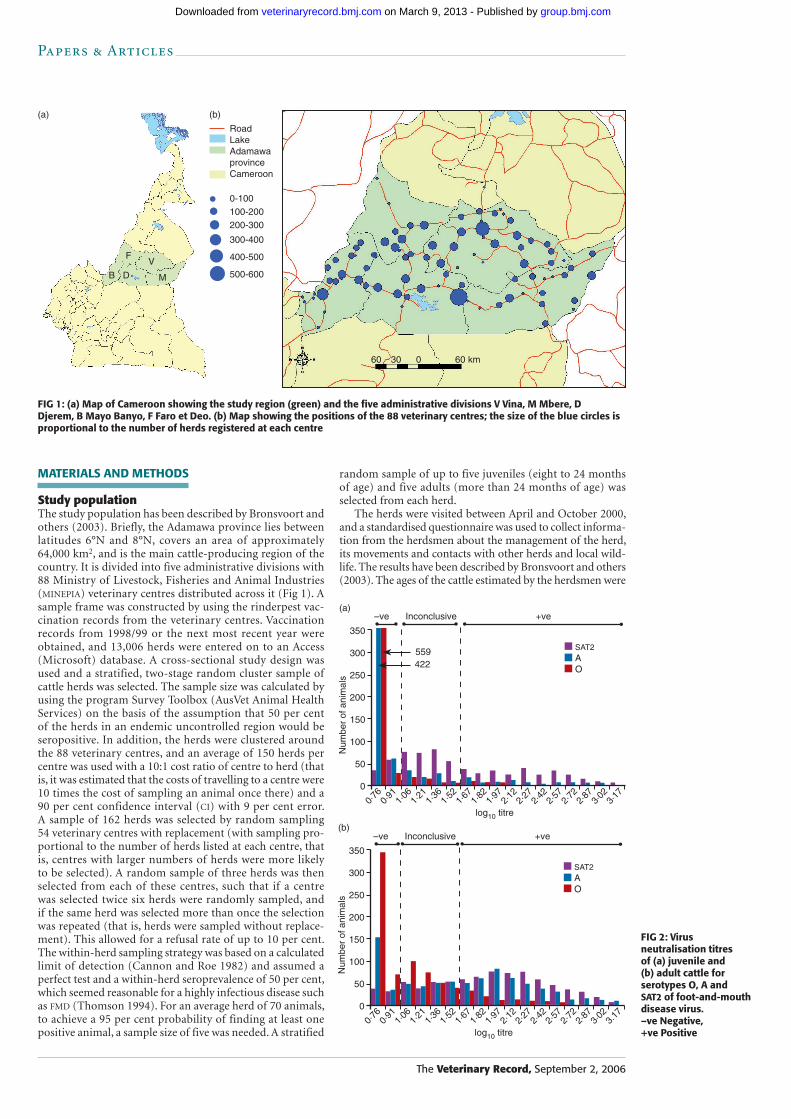
FIG 2: Virus neutralisation titres of (a) juvenile and (b) adult cattle for serotypes O, A and SAT2 of foot-and-mouth disease virus. –ve Negative, +ve Positive
60 30 0 60 km
Num
ber
of a
nim
als
350
300
250
200
150
100
50
0
log10 titre0·
760·
911·
061·
211·
361·
521·
671·
821·
972·
122·
272·
422·
572·
722·
873·
023·
17
SAT2AO
–ve Inconclusive +ve
559422
(a)
Num
ber
of a
nim
als
350
300
250
200
150
100
50
0
log10 titre0·
760·
911·
061·
211·
361·
521·
671·
821·
972·
122·
272·
422·
572·
722·
873·
023.
17
SAT2AO
–ve Inconclusive +ve(b)
(a)
D
V
MB
F
group.bmj.com on March 9, 2013 - Published by veterinaryrecord.bmj.comDownloaded from
Papers & Articles
The Veterinary Record, September 2, 2006
recorded. Each animal was cast in lateral recumbency and its feet, mouth and udder were examined for any sign of active or old lesions of FMD. A blood sample was taken from the jugular vein and allowed to clot; from herd 30 onwards, an oropha-ryngeal scraping or fluid was collected by using a probang cup (van Bekkum and others 1959). The probang cups were disinfected between animals by washing in 0·2 per cent w/v citric acid and then rinsing three times in water. At the end of each day the probang cups were sterilised in a flame.
Sample handling and processingAt the end of each day, the blood samples were centri-fuged at 1100 g for 10 minutes in a 12 V field centrifuge (Mobilespin; Vulcon Technologies) or a hand-cranked cen-trifuge (OFI Testing Equipment), and approximately 3·5 ml of serum was divided between two 1·8 ml cryovials (Nunc). The samples were kept at 4°C in a portable gas refrigerator
until they could be frozen and stored at –20°C. They were taken to the UK on dry ice and stored at –20°C at the WRL until needed.
The oropharyngeal samples were poured immediately from the probang cup into a labelled 25 ml universal bottle containing 2 to 4 ml 0·08M phosphate-buffered saline (PBS), pH 7·4, with antibiotics (Kitching and Donaldson 1987, OIE 2000). Care was taken to ensure there was some visible cel-lular material in the sample. At the end of each day, a sample was transferred into a 1·8 ml cryovial with a new 3 ml Pasteur pipette; the cryovials were then stored in a liquid nitrogen dry shipper (Taylor-Wharton) and transported to the WRL, where they were transferred to a –70°C freezer.
Virus isolationThe oropharyngeal samples were processed by the standard WRL/World Organisation for Animal Health (OIE) procedure
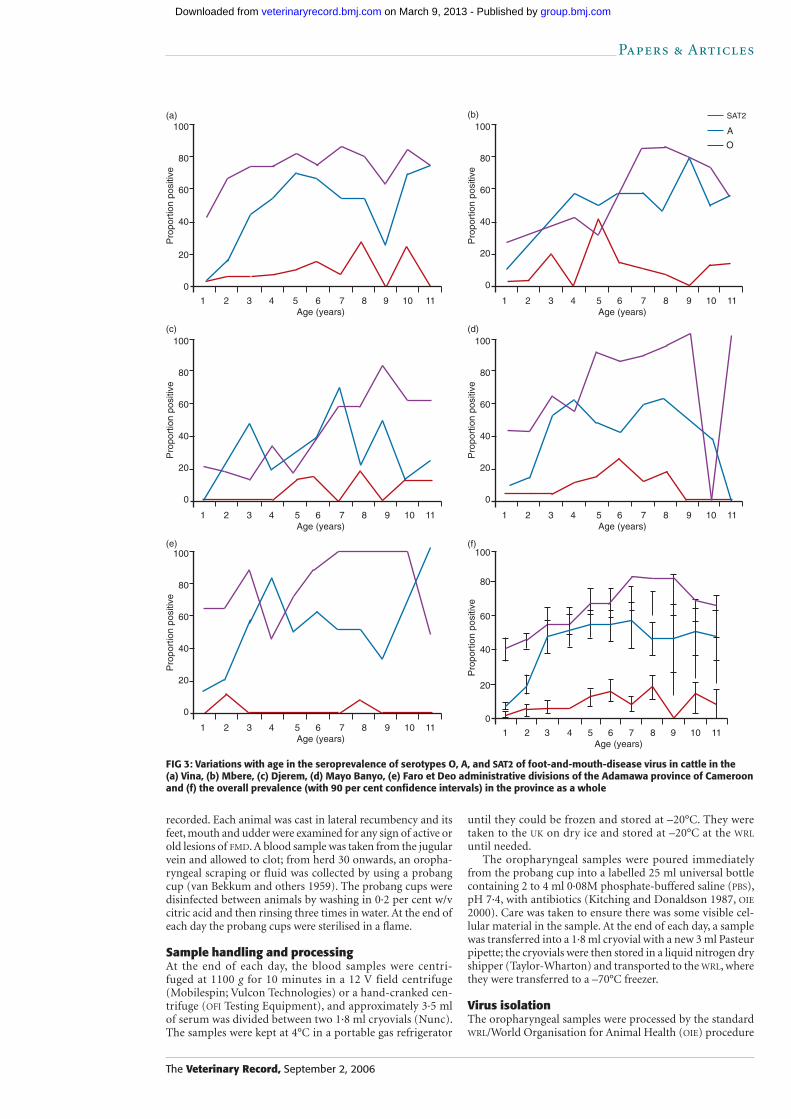
FIG 3: Variations with age in the seroprevalence of serotypes O, A, and SAT2 of foot-and-mouth-disease virus in cattle in the (a) Vina, (b) Mbere, (c) Djerem, (d) Mayo Banyo, (e) Faro et Deo administrative divisions of the Adamawa province of Cameroon and (f) the overall prevalence (with 90 per cent confidence intervals) in the province as a whole
A
SAT2
O
(f)
Pro
port
ion
posi
tive
100
80
60
40
20
0
1 2 3 4 5 6 7 8 9 10 11Age (years)
(e)
Pro
port
ion
posi
tive
100
80
60
40
20
0
1 2 3 4 5 6 7 8 9 10 11Age (years)
(d)
Pro
port
ion
posi
tive
100
80
60
40
20
0
1 2 3 4 5 6 7 8 9 10 11Age (years)
(c)
Pro
port
ion
posi
tive
100
80
60
40
20
0
1 2 3 4 5 6 7 8 9 10 11Age (years)
(b)
Pro
port
ion
posi
tive
100
80
60
40
20
0
1 2 3 4 5 6 7 8 9 10 11Age (years)
(a)
Pro
port
ion
posi
tive
100
80
60
40
20
0
1 2 3 4 5 6 7 8 9 10 11Age (years)
group.bmj.com on March 9, 2013 - Published by veterinaryrecord.bmj.comDownloaded from
Papers & Articles
The Veterinary Record, September 2, 2006
for virus isolation from probangs (OIE 2004). The samples were thawed in a 37°C water bath and 0·2 ml of probang sus-pension was inoculated on to each of five bovine thyroid cell monolayers in flat-sided culture tubes (Snowdon 1966) and
incubated for 30 minutes at 37°C. The cell layer was washed three times with 2 ml PBS, flooded with 2 ml fresh modi-fied HEPES tissue culture medium and put on a roller at 37°C for 72 hours. The cells were examined every 24 hours for a cytopathic effect (cpe) and any tubes showing a cpe were har-vested. If no cpe was observed after 72 hours the sample was classed as ‘no virus detected’. The samples were examined 12 to 18 months after they had been collected.
If a cpe was observed, the culture medium in the five tubes was pooled and cleared by centrifugation at 3000 g for 10 minutes. A 1·5 ml sample of supernatant was transferred to a bijou bottle and tested by antigen ELISA. Any samples with an atypical cpe, or with only one or two of the tubes showing a cpe, were passaged after first pooling the positive tubes and clearing by centrifugation and filtering through a 2 µm pore filter to remove bacterial contamination.
Antigen ELISATissue culture supernatants from the cpe-positive cultures of bovine thyroid cells were tested for FMD virus antigen by the WRL/OIE indirect sandwich ELISA (Roeder and Le Blanc Smith 1987) with the modifications described by Ferris and Dawson (1988) and OIE (2000). The plates were read at 492 nm with a MRX II (Dynex) automatic microplate reader. Readings were made over three wells (for each serotype) and samples were classed as positive if the mean optical density (OD) reading, after subtraction of the background, was greater than 0·1. Samples with a borderline reading were retested to confirm the result.
Virus neutralisation testsThe WRL protocol was used for the virus neutralisation tests. The serum samples were first complement-inactivated at 56°C for 30 minutes and virus neutralising (VN) antibodies were measured against FMD virus type O Manisa, homolo-gous Cameroon type A (P59/2000-VBM/153/09) and type SAT2 (P26/2000-FDL/74/10). The test sera were diluted down the plate
SerotypeAge Number of O+A+ Totalgroup animals O A SAT2 O+A O+SAT2 A+SAT2 SAT2 positive
Juvenile 651 7 34 221 2 10 40 4 318Adult 726 9 86 193 8 17 236 40 589Total 1377 16 120 414 10 27 276 44 907
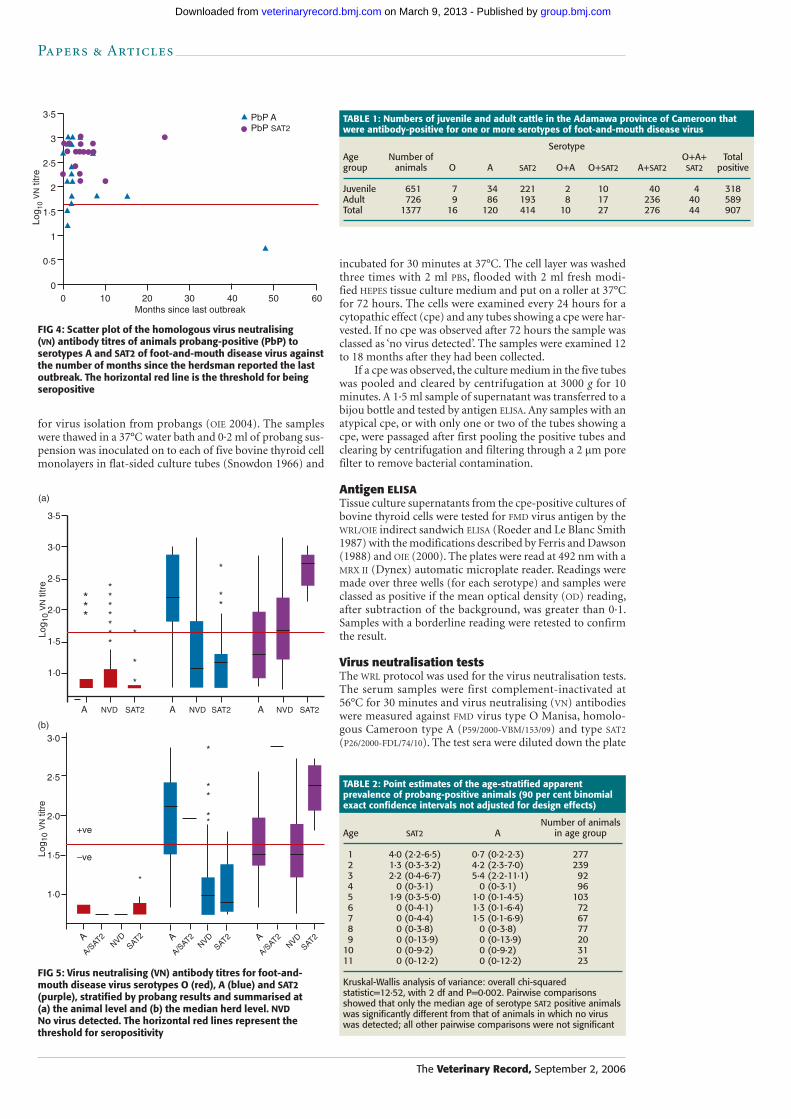
TABLE 1: Numbers of juvenile and adult cattle in the Adamawa province of Cameroon that were antibody-positive for one or more serotypes of foot-and-mouth disease virus
Number of animalsAge SAT2 A in age group
1 4·0 (2·2-6·5) 0·7 (0·2-2·3) 277 2 1·3 (0·3-3·2) 4·2 (2·3-7·0) 239 3 2·2 (0·4-6·7) 5·4 (2·2-11·1) 92 4 0 (0-3·1) 0 (0-3·1) 96 5 1·9 (0·3-5·0) 1·0 (0·1-4·5) 103 6 0 (0-4·1) 1·3 (0·1-6·4) 72 7 0 (0-4·4) 1·5 (0·1-6·9) 67 8 0 (0-3·8) 0 (0-3·8) 77 9 0 (0-13·9) 0 (0-13·9) 2010 0 (0-9·2) 0 (0-9·2) 3111 0 (0-12·2) 0 (0-12·2) 23
Kruskal-Wallis analysis of variance: overall chi-squared statistic=12·52, with 2 df and P=0·002. Pairwise comparisons showed that only the median age of serotype SAT2 positive animals was significantly different from that of animals in which no virus was detected; all other pairwise comparisons were not significant
TABLE 2: Point estimates of the age-stratified apparent prevalence of probang-positive animals (90 per cent binomial exact confidence intervals not adjusted for design effects)
FIG 4: Scatter plot of the homologous virus neutralising (VN) antibody titres of animals probang-positive (PbP) to serotypes A and SAT2 of foot-and-mouth disease virus against the number of months since the herdsman reported the last outbreak. The horizontal red line is the threshold for being seropositive
Log 1
0 V
N ti
tre
3·5
3
2·5
2
1·5
1
0·5
00 10 20 30 40 50 60
PbP APbP SAT2
Months since last outbreak
(a)
Log 1
0 V
N ti
tre
3·5
3·0
2·5
2·0
1·5
1·0
A NVD SAT2 A NVD SAT2 A NVD SAT2
***
*******
*
*
*
*
**
(b)
Log 1
0 V
N ti
tre
3·0
2·5
2·0
1·5
1·0
*
*
**
**+ve
–ve
A
A/SAT2
NVDSAT2 A
A/SAT2
NVDSAT2 A
A/SAT2
NVDSAT2
FIG 5: Virus neutralising (VN) antibody titres for foot-and-mouth disease virus serotypes O (red), A (blue) and SAT2 (purple), stratified by probang results and summarised at (a) the animal level and (b) the median herd level. NVD No virus detected. The horizontal red lines represent the threshold for seropositivity
group.bmj.com on March 9, 2013 - Published by veterinaryrecord.bmj.comDownloaded from
Papers & Articles
The Veterinary Record, September 2, 2006
in twofold dilutions in duplicate from 1:4 to 1:1024 (100·60 to 103·01). A standard dose of 100 TCID50 of virus was added to each well and incubated for 45 minutes at 37°C, followed by the addition of the cultured pig kidney cells. The plates were incubated in a 5 per cent carbon dioxide incubator at 37°C
for 48 hours. The reference sera used were type O Manisa, type A22 USSR and type SAT2 SWA 21 1/69. The control plates for virus titre and control sera titre were read first, using an inverted microscope. For the test to be accepted the virus dose had to be in the range 101·5 to 102·5 TCID50, the serum titre had to be within 10±0·3 of the running mean for the con-trol sera and the cell sheets had to be intact in the untreated control wells. When the controls were out of range the entire test was repeated. The 100 TCID50 endpoint was estimated for each sample (Karber 1931) and the standard OIE cut-off for a positive of up to 1/101·65 (1:45) was used.
Statistical analysisThe herd-level prevalences were estimated by using the svyprop command in STATA 6.0 (Stata Corp) with 90 per cent CI adjusted for stratification by division into five levels and clustering by veterinary centre (53 for the full dataset). A herd was classified as positive for a given serotype if one or more animals in the herd had a positive VN titre. The ani-mal-level prevalences were also calculated by using the svy-prop command; however, STATA 6.0 does not allow a second level of clustering (which would be the herd) to be included. As a result, the CIs for the animal-level prevalences are over-estimated (that is, they are a conservative estimate). The geographical distribution of the herds was plotted by using the ArcGIS v8.2 (ESRI) geographical information system (GIS) software package. Two maps were produced for each sero-type, one based on the results of the juvenile animals (eight to 24 months old) and one for the adult animals (more than 24 months old) examined in a herd; on the maps the size of a herd’s circle was made proportional to the number of positive samples derived from the herd. Because of the small numbers of sheep and goats sampled, only one map was produced for all age groups.
RESULTS
A total of 147 herdsmen were interviewed, and 146 of the 147 herds were examined. Of these, five (3·4 per cent) (90 per cent CI 1·06 to 5·74 per cent) had evidence of clinical disease on the day they were examined. Epithelial samples were obtained from one of these herds and a SAT2 virus was recovered. Serum samples were collected from up to 10 animals from each of the 146 herds (1377 animals) and probang samples from 118 of them (1097 animals); 38 of the probang samples were virus-positive on tissue culture and antigen ELISA, 20 of them for serotype A and 18 for serotype SAT2. One other probang sample was weakly positive (OD 0·11; positive OD>0·1) for SAT3, but no virus was cultured on a second passage and it was interpreted as a false positive. Four herds did not have any juvenile animals available for sampling. In addition, 18 flocks of sheep and/or goats were examined, and serum was collected from all of them (86 animals) and probang samples from 13 (55 animals).
Age-stratified seroprevalenceThe distributions of the individual antibody titres for the juvenile and adult cattle are shown in Fig 2. The juvenile SAT2 titres appear to have a bimodal distribution but those for serotypes A and O appear to be skewed with the majority seronegative. The distributions for the adult titres for both SAT2 and A are more normal while that of serotype O titres is again skewed. The estimates of seroprevalence among the 651 juveniles (eight to 24 months old) were 42·2 per cent (90 per cent CI 37·8 to 46·6 per cent) for serotype SAT2, 12·2 per cent (90 per cent CI 8·8 to 16·0 per cent) for serotype A and 3·5 per cent (90 per cent CI 1·8 to 5·2 per cent) for serotype O. Among the 726 adult animals (over 24 months of age) the estimates of seroprevalence were 66·9 per cent (90 per cent CI
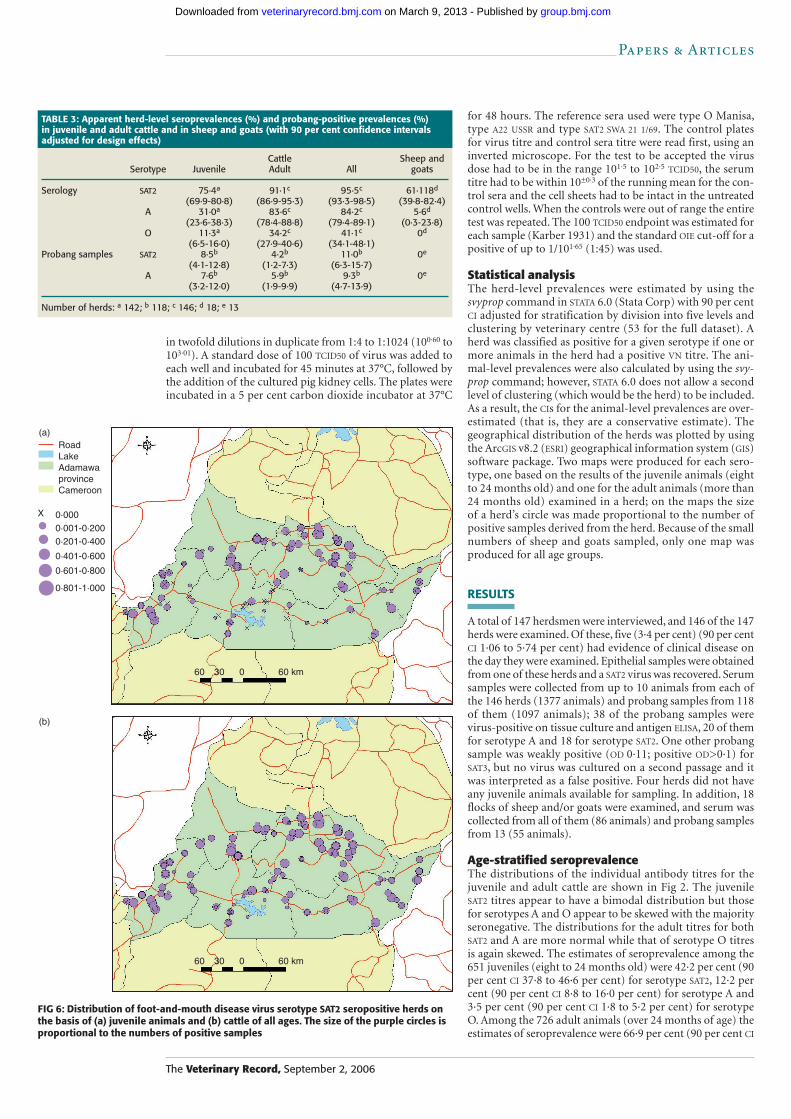
Cattle Sheep and Serotype Juvenile Adult All goats
Serology SAT2 75·4a 91·1c 95·5c 61·118d
(69·9-80·8) (86·9-95·3) (93·3-98·5) (39·8-82·4) A 31·0a 83·6c 84·2c 5·6d
(23·6-38·3) (78·4-88·8) (79·4-89·1) (0·3-23·8) O 11·3a 34·2c 41·1c 0d
(6·5-16·0) (27·9-40·6) (34·1-48·1)Probang samples SAT2 8·5b 4·2b 11·0b 0e
(4·1-12·8) (1·2-7·3) (6·3-15·7) A 7·6b 5·9b 9·3b 0e
(3·2-12·0) (1·9-9·9) (4·7-13·9)
Number of herds: a 142; b 118; c 146; d 18; e 13
TABLE 3: Apparent herd-level seroprevalences (%) and probang-positive prevalences (%) in juvenile and adult cattle and in sheep and goats (with 90 per cent confidence intervals adjusted for design effects)
FIG 6: Distribution of foot-and-mouth disease virus serotype SAT2 seropositive herds on the basis of (a) juvenile animals and (b) cattle of all ages. The size of the purple circles is proportional to the numbers of positive samples
(b)
60 30 0 60 km
(a)RoadLakeAdamawaprovinceCameroon
0·0000·001-0·2000·201-0·400
0·401-0·600
0·601-0·800
0·801-1·000
60 30 0 60 km
X
group.bmj.com on March 9, 2013 - Published by veterinaryrecord.bmj.comDownloaded from
Papers & Articles
The Veterinary Record, September 2, 2006
62·7 to 71·2 per cent) for serotype SAT2, 51·0 per cent (90 per cent CI 43·5 to 56·4 per cent) for serotype A and 10·3 per cent (90 per cent CI 8·0 to 12·7 per cent) for serotype O.
The age-stratified seroprevalences are shown in Fig 3; the results were stratified by division, and Fig 3f shows the results for the whole Adamawa province. Overall, the seroprevalence of SAT2 exceeded that of the other serotypes in all age strata, but from approximately three years of age the seroprevalence of serotype A had increased to levels close to that for SAT2, although they never appear to exceed them. The seroprevalence of serotype O was very low in all age strata, although it appeared to increase gradually with age.
Multiple exposureTable 1 gives a breakdown of the numbers of animals with antibodies to one, two or three serotypes. In the juveniles, most (82 per cent) of the seropositive animals had been exposed to only one serotype, mainly to SAT2 virus; in the animals with antibodies to more than one serotype, SAT2 virus was one of them in all but two of 56 animals. In the adults there was a higher proportion of animals with antibodies to more than one serotype, principally types SAT2 and A (40 per cent). There was a low positive correlation (coefficient 0·263, P<0·01) between the antibody titres to serotypes A and SAT2 by Spearman’s rank correlation.
Relationship between age and presence of virus in probang samplesThere was a higher prevalence of probang-positive samples in the juvenile animals (26 of 516, 5·0 per cent) than in the adults (12 of 581, 2·1 per cent); no virus was detected in the probang samples from 151 animals aged over seven years. There was a difference in the distribution of the serotypes in animals of different ages (Table 2); the median age for type A probang-positive animals was two years, for SAT2-positive animals it was one year, and the median age of animals in which no virus was detected was three years. Overall, 20·3 per cent (90 per cent CI 14·6 to 26·0 per cent) of the herds and 3·5 per cent (90 per cent CI 2·1 to 4·7 per cent) of the cattle were probang-positive. No virus was detected in any of the 55 probang samples from sheep and goats.
Relationship between serology and the presence of virus in probang samplesThe majority of the animals that were probang-positive, regardless of serotype, came from herds that had reported an outbreak in the previous 12 months (Fig 4); the median number of months since the last outbreak of FMD serotype A was two (range 0 to 48 months) and for serotype SAT2 it was four (range 0 to 24 months). There was no significant dif-ference between the SAT2 and A groups, but they were both significantly different from the group in which no virus was detected (Kruskal-Wallis analysis of variance, P<0·001). All the SAT2 probang-positive animals were strongly sero-positive for SAT2 antibodies, whereas the serotype A animals had a wider range of titres, including three that were classed as seronegative (titre <1:45). In herd 57 in Mbere division, one seronegative, serotype A probang-positive animal was detected 48 months after the last reported outbreak. No virus had been isolated from either of the two preceding herds and the animal was seronegative for all three serotypes. In addition, three of the adult animals from the herd were seropositive to A, and one juvenile and four adult animals were seropositive to SAT2. The other herds from this centre had reported outbreaks between eight and 10 months previ-ously and had juvenile SAT2-seropositive animals, suggesting that these may have been the most recent outbreaks. This gives a conflicting picture and suggests that the reported interval since the last outbreak in herd 57 may have been incorrect.
The serological data for all the animals stratified by their probang-positive status are shown in Fig 5a. In general, ani-mals that were serotype A probang-positive had higher sero-type A VN titres than animals that were SAT2 probang-positive. Similarly, animals that were SAT2 probang-positive had higher SAT2 VN titres. With several exceptions, most animals had very low titres to serotype O, regardless of whether they were probang-positive.
Herd-level prevalence of FMDThe apparent herd-level seroprevalences and apparent probang-positive prevalences are given in Table 3. The distri-butions of the herd median VN titres for each serotype, strati-fied by probang-positive status of the herd, are given in Fig 5b. Only one herd in the west of the province had two virus serotypes in the same herd, although not in the same animal. As with the animal-level estimates, the herd-level estimates show that SAT2 was the most prevalent serotype, followed by serotype A and then serotype O. The difference between the herd-level seroprevalences of serotype A in juvenile and adult animals was much more marked than SAT2, the prevalence of which was high in both groups. The estimates of herd-
60 30 0 60 km
(b)
60 30 0 60 km
(a)
RoadLakeAdamawaprovinceCameroon
0·0000·001-0·2000·201-0·400
0·401-0·600
0·601-0·800
0·801-1·000
X
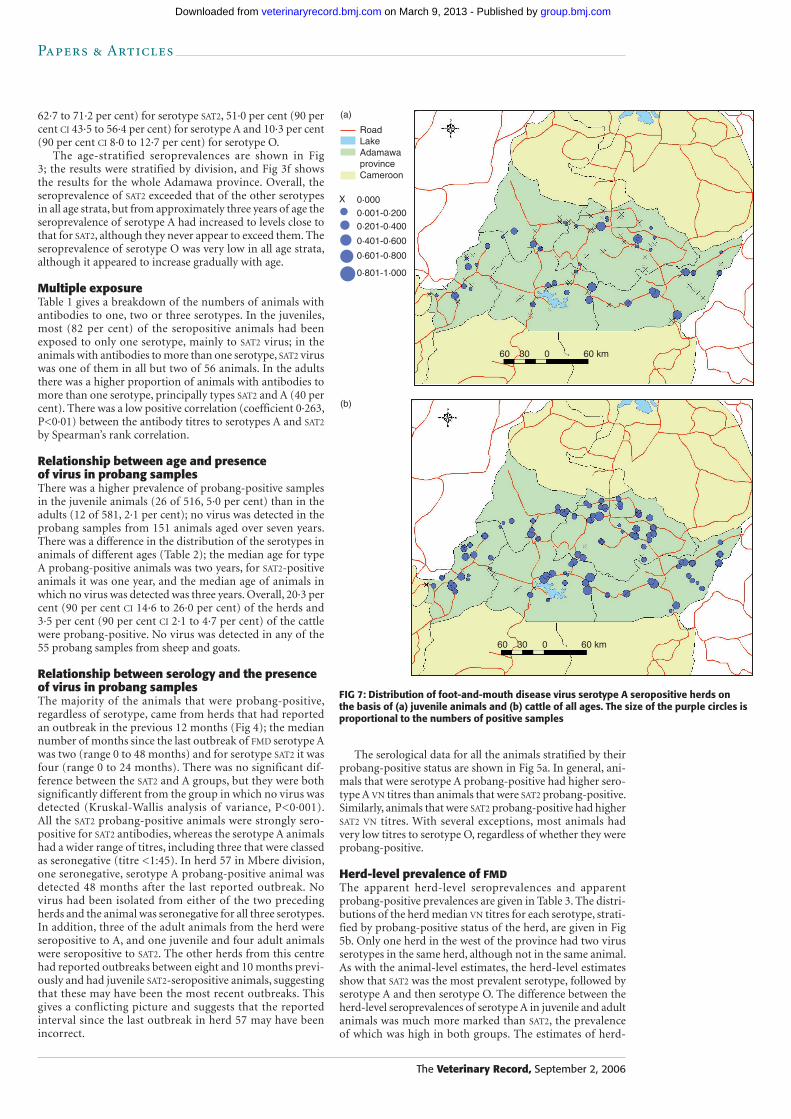
FIG 7: Distribution of foot-and-mouth disease virus serotype A seropositive herds on the basis of (a) juvenile animals and (b) cattle of all ages. The size of the purple circles is proportional to the numbers of positive samples
group.bmj.com on March 9, 2013 - Published by veterinaryrecord.bmj.comDownloaded from
Papers & Articles
The Veterinary Record, September 2, 2006
level probang-positive prevalence suggest that there was lit-tle difference in the prevalence of probang-positive herds for serotypes SAT2 and A.
Geographical distribution of seropositive and probang-positive herdsThe geographical distribution of the seropositive herds is shown in Figs 6, 7 and 8, respectively, for serotypes SAT2, A and O, and in Fig 9 for the probang-positive herds. The distri-bution of the positive herds, based on the 651 samples from juveniles in 142 herds, given an indication of the exposure to the disease during the past two years and some indication of the force of infection, from the proportion of positive sam-ples per herd. The inclusion of the samples from 1377 adult animals in 146 herds gives an indication of earlier exposures to the virus.
For serotype SAT2 (Fig 6), the exposure of juvenile ani-mals was widespread, with a high proportion of samples from each herd being seropositive. In a few areas antibodies were detected in adults where they had not been detected in juven iles, but the overall impression is that there had been recent widespread exposure to SAT2 virus. A few herds in
the Djerem and Mbere divisions appeared to be seroneg-ative.
The distribution of antibodies to serotype A viruses in juvenile animals (Fig 7a) indicates that recent exposure had been more limited geographically, with what appear to be foci of exposure dotted across the province. Historically, however, there appears to have been a much wider spread of the type A virus (Fig 6b), although possibly not as much as SAT2. A comparison of the herds with seropositive juvenile animals with the serotype A probang-positive herds shows that they coincide with the herds with a high proportion of seropositive animals.
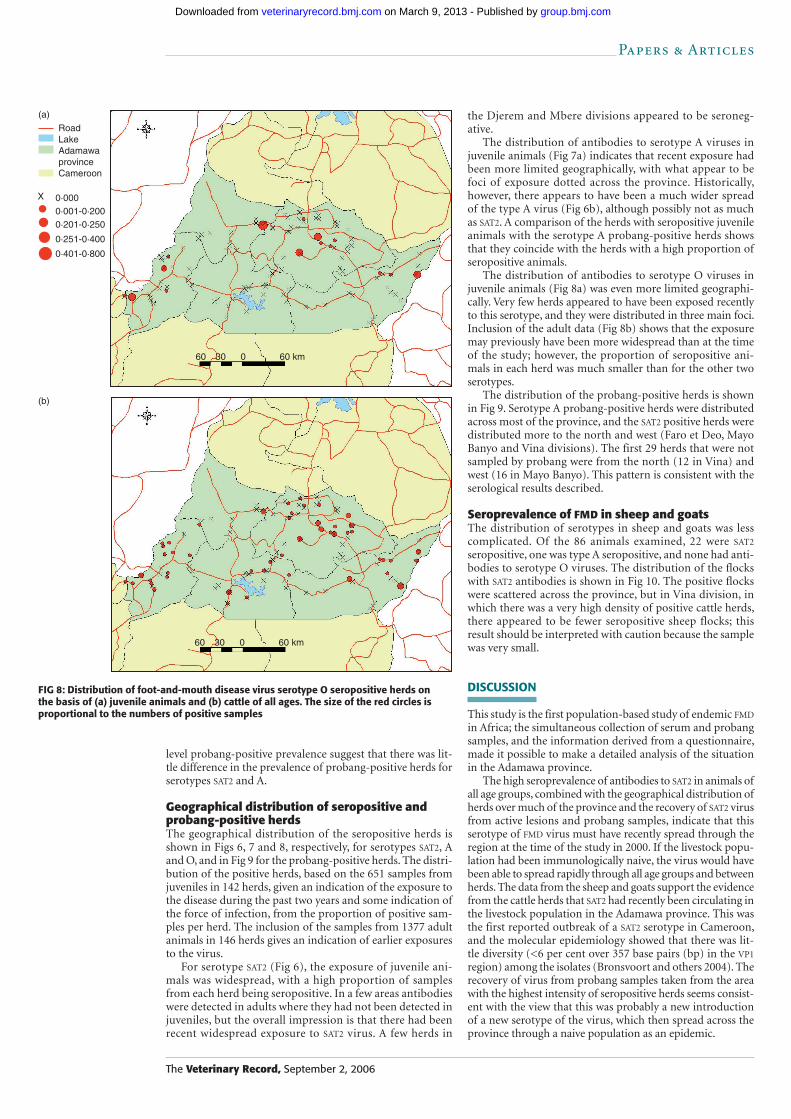
The distribution of antibodies to serotype O viruses in juvenile animals (Fig 8a) was even more limited geographi-cally. Very few herds appeared to have been exposed recently to this serotype, and they were distributed in three main foci. Inclusion of the adult data (Fig 8b) shows that the exposure may previously have been more widespread than at the time of the study; however, the proportion of seropositive ani-mals in each herd was much smaller than for the other two serotypes.
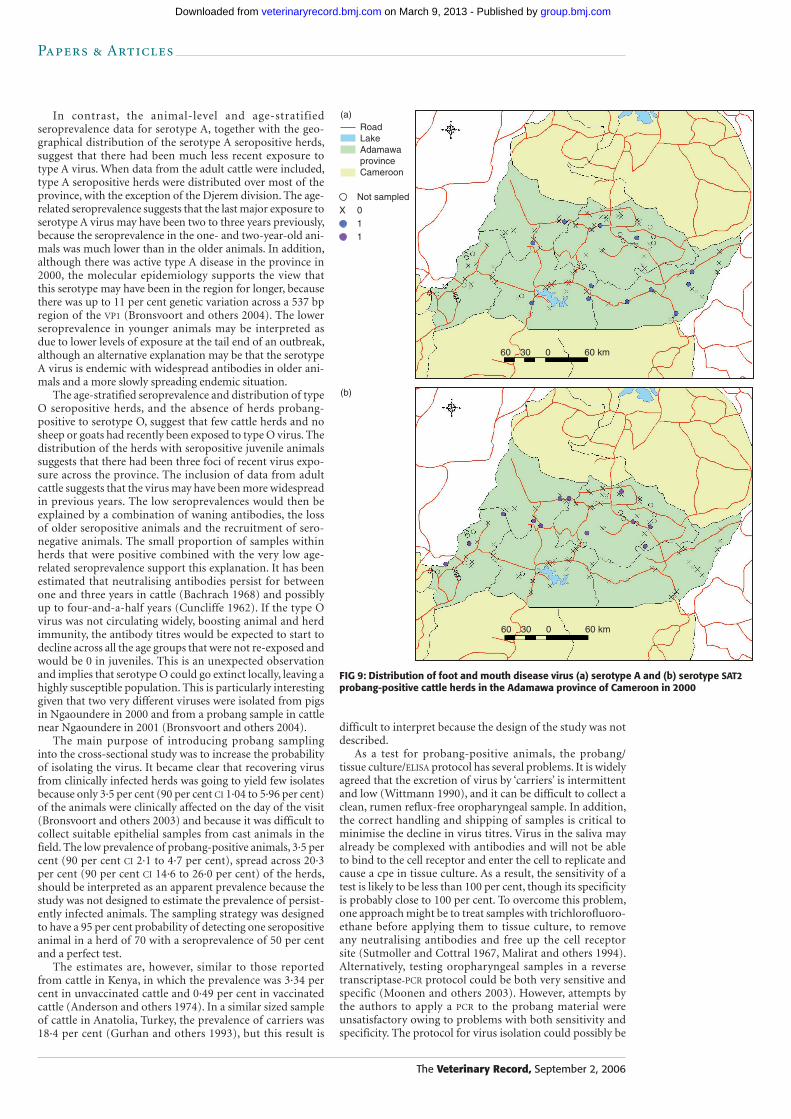
The distribution of the probang-positive herds is shown in Fig 9. Serotype A probang-positive herds were distributed across most of the province, and the SAT2 positive herds were distributed more to the north and west (Faro et Deo, Mayo Banyo and Vina divisions). The first 29 herds that were not sampled by probang were from the north (12 in Vina) and west (16 in Mayo Banyo). This pattern is consistent with the serological results described.
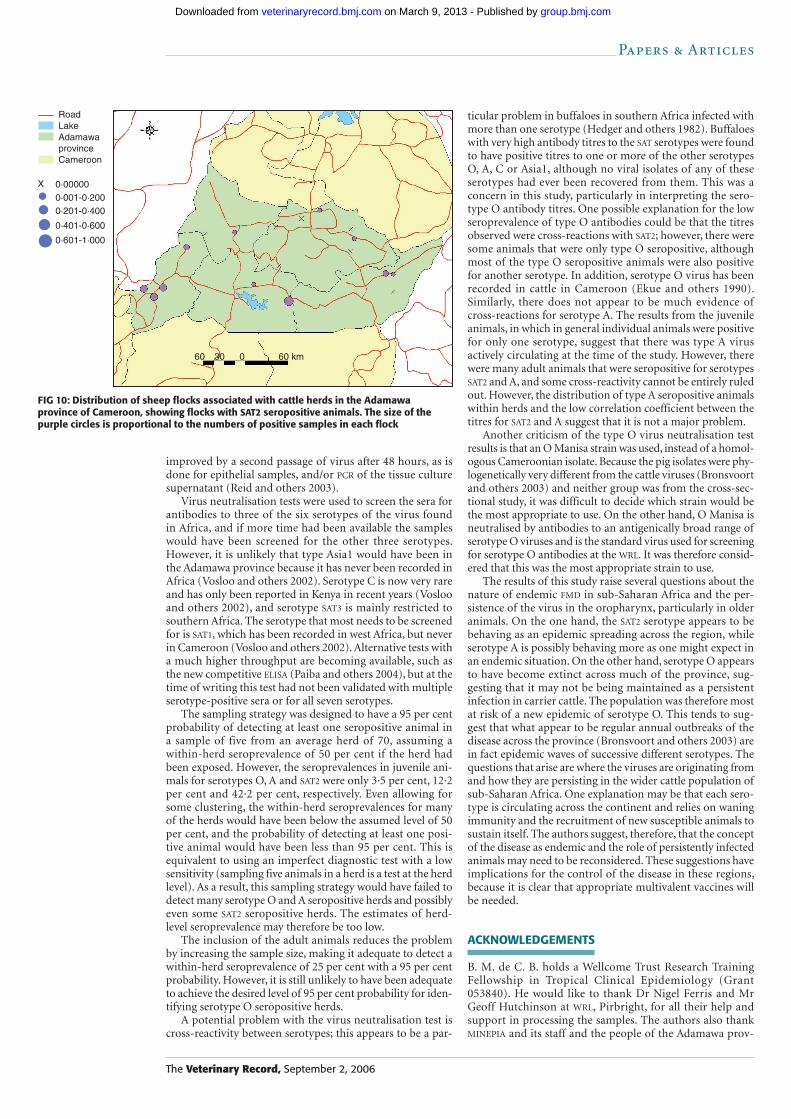
Seroprevalence of FMD in sheep and goatsThe distribution of serotypes in sheep and goats was less complicated. Of the 86 animals examined, 22 were SAT2 seropositive, one was type A seropositive, and none had anti-bodies to serotype O viruses. The distribution of the flocks with SAT2 antibodies is shown in Fig 10. The positive flocks were scattered across the province, but in Vina division, in which there was a very high density of positive cattle herds, there appeared to be fewer seropositive sheep flocks; this result should be interpreted with caution because the sample was very small.
DISCUSSION
This study is the first population-based study of endemic FMD in Africa; the simultaneous collection of serum and probang samples, and the information derived from a questionnaire, made it possible to make a detailed analysis of the situation in the Adamawa province.
The high seroprevalence of antibodies to SAT2 in animals of all age groups, combined with the geographical distribution of herds over much of the province and the recovery of SAT2 virus from active lesions and probang samples, indicate that this serotype of FMD virus must have recently spread through the region at the time of the study in 2000. If the livestock popu-lation had been immunologically naive, the virus would have been able to spread rapidly through all age groups and between herds. The data from the sheep and goats support the evidence from the cattle herds that SAT2 had recently been circulating in the livestock population in the Adamawa province. This was the first reported outbreak of a SAT2 serotype in Cameroon, and the molecular epidemiology showed that there was lit-tle diversity (<6 per cent over 357 base pairs (bp) in the VP1 region) among the isolates (Bronsvoort and others 2004). The recovery of virus from probang samples taken from the area with the highest intensity of seropositive herds seems consist-ent with the view that this was probably a new introduction of a new serotype of the virus, which then spread across the province through a naive population as an epidemic.
(a)
RoadLakeAdamawaprovinceCameroon
0·0000·001-0·2000·201-0·250
0·251-0·400
0·401-0·800
X
60 30 0 60 km
(b)
60 30 0 60 km
FIG 8: Distribution of foot-and-mouth disease virus serotype O seropositive herds on the basis of (a) juvenile animals and (b) cattle of all ages. The size of the red circles is proportional to the numbers of positive samples
group.bmj.com on March 9, 2013 - Published by veterinaryrecord.bmj.comDownloaded from
Papers & Articles
The Veterinary Record, September 2, 2006
In contrast, the animal-level and age-stratified seroprevalence data for serotype A, together with the geo-graphical distribution of the serotype A seropositive herds, suggest that there had been much less recent exposure to type A virus. When data from the adult cattle were included, type A sero positive herds were distributed over most of the province, with the exception of the Djerem division. The age-related seroprevalence suggests that the last major exposure to serotype A virus may have been two to three years previously, because the seroprevalence in the one- and two-year-old ani-mals was much lower than in the older animals. In addition, although there was active type A disease in the province in 2000, the molecular epidemiology supports the view that this serotype may have been in the region for longer, because there was up to 11 per cent genetic variation across a 537 bp region of the VP1 (Bronsvoort and others 2004). The lower seroprevalence in younger animals may be interpreted as due to lower levels of exposure at the tail end of an outbreak, although an alternative explanation may be that the serotype A virus is endemic with widespread antibodies in older ani-mals and a more slowly spreading endemic situation.
The age-stratified seroprevalence and distribution of type O seropositive herds, and the absence of herds probang- positive to serotype O, suggest that few cattle herds and no sheep or goats had recently been exposed to type O virus. The distribution of the herds with seropositive juvenile animals suggests that there had been three foci of recent virus expo-sure across the province. The inclusion of data from adult cattle suggests that the virus may have been more widespread in previous years. The low seroprevalences would then be explained by a combination of waning antibodies, the loss of older seropositive animals and the recruitment of sero-negative animals. The small proportion of samples within herds that were positive combined with the very low age-related seroprevalence support this explanation. It has been estimated that neutralising antibodies persist for between one and three years in cattle (Bachrach 1968) and possibly up to four-and-a-half years (Cuncliffe 1962). If the type O virus was not circulating widely, boosting animal and herd immunity, the antibody titres would be expected to start to decline across all the age groups that were not re-exposed and would be 0 in juveniles. This is an unexpected observation and implies that serotype O could go extinct locally, leaving a highly susceptible population. This is particularly interesting given that two very different viruses were isolated from pigs in Ngaoundere in 2000 and from a probang sample in cattle near Ngaoundere in 2001 (Bronsvoort and others 2004).
The main purpose of introducing probang sampling into the cross-sectional study was to increase the probability of isolating the virus. It became clear that recovering virus from clinically infected herds was going to yield few isolates because only 3·5 per cent (90 per cent CI 1·04 to 5·96 per cent) of the animals were clinically affected on the day of the visit (Bronsvoort and others 2003) and because it was difficult to collect suitable epithelial samples from cast animals in the field. The low prevalence of probang-positive animals, 3·5 per cent (90 per cent CI 2·1 to 4·7 per cent), spread across 20·3 per cent (90 per cent CI 14·6 to 26·0 per cent) of the herds, should be interpreted as an apparent prevalence because the study was not designed to estimate the prevalence of persist-ently infected animals. The sampling strategy was designed to have a 95 per cent probability of detecting one seropositive animal in a herd of 70 with a seroprevalence of 50 per cent and a perfect test.
The estimates are, however, similar to those reported from cattle in Kenya, in which the prevalence was 3·34 per cent in unvaccinated cattle and 0·49 per cent in vaccinated cattle (Anderson and others 1974). In a similar sized sample of cattle in Anatolia, Turkey, the prevalence of carriers was 18·4 per cent (Gurhan and others 1993), but this result is
difficult to interpret because the design of the study was not described.
As a test for probang-positive animals, the probang/tissue culture/ELISA protocol has several problems. It is widely agreed that the excretion of virus by ‘carriers’ is intermittent and low (Wittmann 1990), and it can be difficult to collect a clean, rumen reflux-free oropharyngeal sample. In addition, the correct handling and shipping of samples is critical to minimise the decline in virus titres. Virus in the saliva may already be complexed with antibodies and will not be able to bind to the cell receptor and enter the cell to replicate and cause a cpe in tissue culture. As a result, the sensitivity of a test is likely to be less than 100 per cent, though its specificity is probably close to 100 per cent. To overcome this problem, one approach might be to treat samples with trichlorofluoro-ethane before applying them to tissue culture, to remove any neutralising antibodies and free up the cell receptor site (Sutmoller and Cottral 1967, Malirat and others 1994). Alternatively, testing oropharyngeal samples in a reverse transcriptase-PCR protocol could be both very sensitive and specific (Moonen and others 2003). However, attempts by the authors to apply a PCR to the probang material were unsatisfactory owing to problems with both sensitivity and specificity. The protocol for virus isolation could possibly be
RoadLakeAdamawaprovinceCameroon
Not sampled011
(a)
60 30 0 60 km
60 30 0 60 km
FIG 9: Distribution of foot and mouth disease virus (a) serotype A and (b) serotype SAT2 probang-positive cattle herds in the Adamawa province of Cameroon in 2000
X
(b)
group.bmj.com on March 9, 2013 - Published by veterinaryrecord.bmj.comDownloaded from
Papers & Articles
The Veterinary Record, September 2, 2006
improved by a second passage of virus after 48 hours, as is done for epithelial samples, and/or PCR of the tissue culture supernatant (Reid and others 2003).
Virus neutralisation tests were used to screen the sera for antibodies to three of the six serotypes of the virus found in Africa, and if more time had been available the samples would have been screened for the other three serotypes. However, it is unlikely that type Asia1 would have been in the Adamawa province because it has never been recorded in Africa (Vosloo and others 2002). Serotype C is now very rare and has only been reported in Kenya in recent years (Vosloo and others 2002), and serotype SAT3 is mainly restricted to southern Africa. The serotype that most needs to be screened for is SAT1, which has been recorded in west Africa, but never in Cameroon (Vosloo and others 2002). Alternative tests with a much higher throughput are becoming available, such as the new competitive ELISA (Paiba and others 2004), but at the time of writing this test had not been validated with multiple serotype-positive sera or for all seven serotypes.
The sampling strategy was designed to have a 95 per cent probability of detecting at least one seropositive animal in a sample of five from an average herd of 70, assuming a within-herd seroprevalence of 50 per cent if the herd had been exposed. However, the seroprevalences in juvenile ani-mals for serotypes O, A and SAT2 were only 3·5 per cent, 12·2 per cent and 42·2 per cent, respectively. Even allowing for some clustering, the within-herd seroprevalences for many of the herds would have been below the assumed level of 50 per cent, and the probability of detecting at least one posi-tive animal would have been less than 95 per cent. This is equivalent to using an imperfect diagnostic test with a low sensitivity (sampling five animals in a herd is a test at the herd level). As a result, this sampling strategy would have failed to detect many serotype O and A seropositive herds and possibly even some SAT2 seropositive herds. The estimates of herd-level seroprevalence may therefore be too low.
The inclusion of the adult animals reduces the problem by increasing the sample size, making it adequate to detect a within-herd seroprevalence of 25 per cent with a 95 per cent probability. However, it is still unlikely to have been adequate to achieve the desired level of 95 per cent probability for iden-tifying serotype O seropositive herds.
A potential problem with the virus neutralisation test is cross-reactivity between serotypes; this appears to be a par-
ticular problem in buffaloes in southern Africa infected with more than one serotype (Hedger and others 1982). Buffaloes with very high antibody titres to the SAT serotypes were found to have positive titres to one or more of the other serotypes O, A, C or Asia1, although no viral isolates of any of these serotypes had ever been recovered from them. This was a concern in this study, particularly in interpreting the sero-type O antibody titres. One possible explanation for the low seroprevalence of type O antibodies could be that the titres observed were cross-reactions with SAT2; however, there were some animals that were only type O seropositive, although most of the type O seropositive animals were also positive for another serotype. In addition, serotype O virus has been recorded in cattle in Cameroon (Ekue and others 1990). Similarly, there does not appear to be much evidence of cross-reactions for serotype A. The results from the juvenile animals, in which in general individual animals were positive for only one serotype, suggest that there was type A virus actively circulating at the time of the study. However, there were many adult animals that were seropositive for serotypes SAT2 and A, and some cross-reactivity cannot be entirely ruled out. However, the distribution of type A seropositive animals within herds and the low correlation coefficient between the titres for SAT2 and A suggest that it is not a major problem.
Another criticism of the type O virus neutralisation test results is that an O Manisa strain was used, instead of a homol-ogous Cameroonian isolate. Because the pig isolates were phy-logenetically very different from the cattle viruses (Bronsvoort and others 2003) and neither group was from the cross-sec-tional study, it was difficult to decide which strain would be the most appropriate to use. On the other hand, O Manisa is neutralised by antibodies to an antigen ically broad range of serotype O viruses and is the standard virus used for screening for serotype O antibodies at the WRL. It was therefore consid-ered that this was the most appropriate strain to use.
The results of this study raise several questions about the nature of endemic FMD in sub-Saharan Africa and the per-sistence of the virus in the oropharynx, particularly in older animals. On the one hand, the SAT2 serotype appears to be behaving as an epidemic spreading across the region, while serotype A is possibly behaving more as one might expect in an endemic situation. On the other hand, serotype O appears to have become extinct across much of the province, sug-gesting that it may not be being maintained as a persistent infection in carrier cattle. The population was therefore most at risk of a new epidemic of serotype O. This tends to sug-gest that what appear to be regular annual outbreaks of the disease across the province (Bronsvoort and others 2003) are in fact epidemic waves of successive different serotypes. The questions that arise are where the viruses are originating from and how they are persisting in the wider cattle population of sub-Saharan Africa. One explanation may be that each sero-type is circulating across the continent and relies on waning immunity and the recruitment of new susceptible animals to sustain itself. The authors suggest, therefore, that the concept of the disease as endemic and the role of persistently infected animals may need to be reconsidered. These suggestions have implications for the control of the disease in these regions, because it is clear that appropriate multivalent vaccines will be needed.
ACKNOWLEDGEMENTS
B. M. de C. B. holds a Wellcome Trust Research Training Fellowship in Tropical Clinical Epidemiology (Grant 053840). He would like to thank Dr Nigel Ferris and Mr Geoff Hutchinson at WRL, Pirbright, for all their help and support in processing the samples. The authors also thank MINEPIA and its staff and the people of the Adamawa prov-
RoadLakeAdamawaprovinceCameroon
0·000000·001-0·2000·201-0·400
0·401-0·600
0·601-1·000
X
60 30 0 60 km
FIG 10: Distribution of sheep flocks associated with cattle herds in the Adamawa province of Cameroon, showing flocks with SAT2 seropositive animals. The size of the purple circles is proportional to the numbers of positive samples in each flock
group.bmj.com on March 9, 2013 - Published by veterinaryrecord.bmj.comDownloaded from
Papers & Articles
The Veterinary Record, September 2, 2006
ince, Cameroon, for their generosity and hospitality. The Survey Toolbox is available at www.ausvet.com.au/content.php?page=res_software#st
ReferencesANDERSON, E., DOUGHTY, W. & ANDERSON, J. (1974) The effect of
repeated vaccination in an enzootic foot-and-mouth disease area on the incidence of virus carrier cattle. Journal of Hygiene (Cambridge) 73, 229-235
BACHRACH, H. L. (1968) Foot-and-mouth disease. Annual Review of Microbiology 22, 201-244
BRONSVOORT, B. M. D., RADFORD, A., TANYA, V. N., KITCHING, R. P. & MORGAN, K. L. (2004) The molecular epidemiology of foot-and-mouth disease viruses in the Adamawa Province of Cameroon. Journal of Clinical Microbiology 42, 2186-2196
BRONSVOORT, B. M. D., TANYA, V. N., KITCHING, R. P., NFON, C., HAMMAN, S. M. & MORGAN, K. L. (2003) Foot-and-mouth disease and livestock husbandry practices in the Adamawa Province of Cameroon. Tropical Animal Health and Production 35, 491-507
BURROWS, R. (1966) Studies on the carrier state of cattle exposed to foot-and-mouth disease virus. Journal of Hygiene (Cambridge) 64, 81-90
BURROWS, R. (1968) The persistence of FMDV in sheep. Journal of Hygiene (Cambridge) 66, 633-640
CANNON, R. M. & ROE, R. T. (1982) Livestock Disease Surveys: A Field Manual for Veterinarians. Canberra, Australian Government Publishing Service
CONDY, J. B., HEDGER, R. S., HAMBLIN, C. & BARNETT, I. T. (1985) The duration of the foot-and-mouth disease virus carrier state in African buf-falo (i) in the individual animal and (ii) in a free-living herd. Comparative Immunology, Microbiology and Infectious Diseases 8, 259-265
CUNCLIFFE, H. R. (1962) Observations on the duration of immunity in cattle after experimental infection with foot-and-mouth disease. Cornell Veterinarian 54, 501-510
DAWE, P. S., FLANAGAN, F. O., MADEKUROZWA, R. L., SØRENSEN, K. J., ANDERSON, E. C., FOGGIN, C. M., FERRIS, N. P. & KNOWLES, N. J. (1994a) Natural transmission of foot-and-mouth disease virus from African buffalo (Syncerus caffer) to cattle in a wildlife area of Zimbabwe. Veterinary Record 134, 230-232
DAWE, P. S., SØRENSEN, K. J., FERRIS, N. P., BARNETT, I. T., ARMSTRONG, R. M. & KNOWLES, N. J. (1994b) Experimental transmission of foot-and-mouth disease virus from carrier African buffalo (Syncerus caffer) to cattle in Zimbabwe. Veterinary Record 134, 211-215
EKUE, N. F., TANYA, V. N. & NDI, C. (1990) Foot-and-mouth disease in Cameroon. Tropical Animal Health and Production 22, 34-36
FERRIS, N. P. & DAWSON, M. (1988) Routine application of enzyme-linked immunosorbent assay in comparison with complement fixation for the diagnosis of foot-and-mouth and swine vesicular diseases. Veterinary Microbiology 16, 201-209
FERRIS, N. P., OXTOBY, J. M. & HUGHES, J. F. (1995) Multiple-infected diagnostic specimens from foot and mouth disease endemic regions. Revue Scientifique et Technique – Office International des Epizooties 14, 557-565
GURHAN, H. I., OZTURKMEN, A., CANDAS, A., GURHAN, B., AYNAGOZ, G. & KIZIL, S. (1993) Establishment of the prevalence of persistently infected cattle and sheep in Anatolia with FMDV. Etlik Veteriner Mikrobiyologii Dergisi 7, 52-59
HAFEZ, S. M., FARAG, M. A. & AL-SUKAYRAN, A. M. (1994) The impact of live animal importation on the epizootiology of foot-and-mouth disease in Saudi Arabia. Deutsche Tierärztliche Wochenschrift 101, 397-402
HEDGER, R. (1970) Observations on the carrier state and related antibody titres during an outbreak of foot-and-mouth disease. Journal of Hygiene (Cambridge) 68, 53-60
HEDGER, R. S., BARNETT, I. T. R., GRADWELL, D. V. & TRAVASSOS DIAS, P. (1982) Serological tests for foot-and-mouth disease in bovine serum sam-ples. Problems of interpretation. Revue Scientifique et Technique – Office International des Epizooties 1, 387-393
HEDGER, R. S. & CONDY, J. B. (1985) Transmission of foot-and-mouth disease from African buffalo virus carriers to bovines. Veterinary Record 117, 205
HEDGER, R. S., FORMAN, A. J. & WOODFORD, M. H. (1973) Foot-and-mouth disease virus in East African buffalo. Bulletin of Epizootic Diseases of Africa 21, 99-101
HEDGER, R. S. & STUBBINS, A. G. J. (1971) The carrier state in FMD, and the
probang test. State Veterinary Journal 26, 45-50KARBER, G. (1931) Beitrag zur kollectiven Behandlung pharmakologischer
Reikenversuche. Archiv für Experimentelle Pathologie und Pharmakologie 162, 480-483
KITCHING, R. P. (1999) Foot-and-mouth disease: current world situation. Vaccine 17, 1772-1774
KITCHING, R. P. (2002) Clinical variation in foot and mouth disease: cat-tle. Revue Scientifique et Technique – Office International des Epizooties 21, 499-504
KITCHING, R. P. & DONALDSON, A. I. (1987) Collection and transportation of specimens for vesicular virus investigation. Revue Scientifique et Technique – Office International des Epizooties 6, 263-272
KNOWLES, N. J. & SAMUEL, A. R. (2003) Molecular epidemiology of foot-and-mouth disease virus. Virus Research 91, 65-80
MALIRAT, V., DE MELLO, P. A., TIRABOSCHI, B., BECK, E., GOMES, I. & BERGMANN, I. E. (1994) Genetic variation of foot-and-mouth disease virus during persistent infection in cattle. Virus Research 34, 31-48
MCVICAR, J. & SUTMOLLER, P. (1968) Sheep and goats as foot-and-mouth disease carriers. Proceedings of the 72nd Annual Meeting of the United States Livestock Sanitary Association. New Orleans, USA, October 6 to 11, 1968. pp 400-406
MOONEN, P. & SCHRIJVER, R. (2000) Carriers of foot-and-mouth disease virus: a review. Veterinary Quarterly 22, 193-197
MOONEN, P., BOONSTRA, J., HAKZE-VAN DER HONING, R., BOONSTRA-LEENDERTSE, C., JACOBS, L. & DEKKER, A. (2003) Validation of a LightCycler-based reverse transcription polymerase chain reaction for the detection of foot-and-mouth disease virus. Journal of Virological Methods 113, 35-41
OIE (2004) Foot-and-mouth disease. In Manual of Standards for Diagnostic Tests and Vaccines for Terrestrial Animals. 5th edn. Paris, OIE. www.oie.int/eng/normes/mmanual/A_00024.htm. Accessed August 21, 2006
PAIBA, G. A., ANDERSON, J., PATON, D. J., SOLDAN, A. W., ALEXANDERSEN, S., CORTEYN, M., WILSDEN, G., HAMBLIN, P., MACKAY, D. K. J. & DONALDSON, A. I. (2004) Validation of a foot-and-mouth disease anti-body screening solid-phase competition ELISA (SPCE). Journal of Virological Methods 115, 145-158
PRATO MURPHY, M. L., MEYER, R. F., MEBUS, C., SCHUDEL, A. A. & RODRIGUEZ, M. (1994) Analysis of sites of foot and mouth disease virus persistence in carrier cattle via the polymerase chain reaction. Archives of Virology 136, 299-307
REID, S. M., GRIERSON, S. S., FERRIS, N. P., HUTCHINGS, G. H. & ALEXANDERSEN, S. (2003) Evaluation of automated RT-PCR to acceler-ate the laboratory diagnosis of foot-and-mouth disease virus. Journal of Virological Methods 107, 129-139
ROEDER, P. L. & LE BLANC SMITH, P. M. (1987) Detection and typing of foot-and-mouth disease virus by enzyme-linked immunosorbent assay: a sensitive, rapid and reliable technique for primary diagnosis. Research in Veterinary Science 43, 225-232
SNOWDON, W. A. (1966) Growth of foot-and-mouth disease virus in mono-layer cultures of calf thyroid cells. Nature 210, 1079-1080
SUTMOLLER, P. & COTTRAL, G. E. (1967) Improved techniques for the detection of foot-and-mouth disease virus in carrier cattle. Archiv für die Gesamte Virusforschung 21, 170-177
SUTMOLLER, P., MCVICAR, J. W. & COTTRAL, G. E. (1968) The epiz-ootiological importance of foot-and-mouth disease carriers. Archiv für die Gesamte Virusforschung 23, 227-235
TANYA, V. (1985) Foot-and-mouth disease at Wakwa Ngaoundere, Cameroon: a preliminary study of its epizootiology. Revue Scientifique et Technique – Office International des Epizooties 2, 73-77
THOMSON, G. R. (1994) Foot-and-mouth disease. In Infectious Diseases of Livestock with Special Reference to Southern Africa. Vol 2. Eds J. A. W. Coetzer, G. R. Thomson, R. C. Tustin. Oxford, Oxford University Press. pp 823-852
VAN BEKKUM, J. G., FRENKEL, H. S., FREDERIKS, H. H. J. & FRENKEL, S. (1959) Observation on the carrier state of cattle exposed to foot-and-mouth disease virus. Tijdschrift voor Diergeneeskunde 84, 1159-1164
VOSLOO, W., BASTOS, A. D. S., SANGARE, O., HARGREAVES, S. K. & THOMSON, G. R. (2002) Review of the status and control of foot and mouth disease in sub-Saharan Africa. Revue Scientifique et Technique – Office International des Epizooties 21, 437-449
WITTMANN, G. (1990) The virus carrier state in FMD. Lindholm, Research Group of the Standing Technical Committee of the European Commission for the Control of Foot-and-Mouth Disease. pp 15-24
group.bmj.com on March 9, 2013 - Published by veterinaryrecord.bmj.comDownloaded from

doi: 10.1136/vr.159.10.299 2006 159: 299-308Veterinary Record
B. M. de C. Bronsvoort, J. Anderson, A. Corteyn, et al. Camerooncattle herds in the Adamawa province of virus-seropositive and probang-positivedistributions of foot-and-mouth disease Geographical and age-stratified
http://veterinaryrecord.bmj.com/content/159/10/299Updated information and services can be found at:
These include:
serviceEmail alerting
the box at the top right corner of the online article.Receive free email alerts when new articles cite this article. Sign up in
Notes
http://group.bmj.com/group/rights-licensing/permissionsTo request permissions go to:
http://journals.bmj.com/cgi/reprintformTo order reprints go to:
http://group.bmj.com/subscribe/To subscribe to BMJ go to:
group.bmj.com on March 9, 2013 - Published by veterinaryrecord.bmj.comDownloaded from