Results of a survey to estimate cattle movements and contact rates among beef herds in California,...
7
JAVMA, Vol 235, No. 5, September 1, 2009 Scientific Reports 573 RUMINANTS I t is widely assumed that an outbreak of FMD in the United States would have a serious impact on the US beef industry. In the event of an FMD outbreak in California, direct production losses to California’s beef industry alone are estimated at $54 to $746 million, whereas the estimated total of direct, indirect, and in- duced output losses to California’s beef industry ranges from $104 million to $1.4 billion. 1 National trade losses are estimated to be approximately $3 billion. 1 The Na- tional Association of State Departments of Agriculture Research Foundation reported that federal investment in and budget allocation for the USDA National Animal Health Monitoring and Surveillance program is inad- equate to address the growing risk to the $100 billion US livestock industry. 2 The FMDV can be transmitted via contact with fomites (contaminated material, vehicles, vermin, or people) or contaminated animal products, via artifi- cial insemination or exposure to carrier animals, and through airborne spread. 3 Although a case of FMD has not been reported in the United States in 80 years, all Results of a survey to estimate cattle movements and contact rates among beef herds in California, with reference to the potential spread and control of foot-and-mouth disease Edith S. Marshall, DVM, MPVM, DACVPM; Tim E. Carpenter, PhD; Clair Thunes, PhD Objective—To estimate contact rates and movement variables for shipments of beef cattle to and from producer premises in California. Design—Cross-sectional survey. Sample Population—583 beef producers in California. Procedures—Questionnaires were developed and distributed to beef cattle producers in California. The study period was from April 20, 2005, through September 7, 2006. Data from completed questionnaires were entered manually into an electronic format. Descriptive statistical analyses were performed. Results—Median number of interstate animal movements (movement of cattle into or out of California) was 0.17/mo; on the basis of this median, beef cattle were moved interstate > 2 times/y. Respondents kept beef cattle at up to 5 locations throughout the year. More than 40% of the movements from the respondents’ premises were to a sale yard or auc- tion facility. Conclusions and Clinical Relevance—Frequency of animal movements in this statewide study differed from values in another study of monthly shipments of animals to and from beef operations in 3 counties of California. The survey reported here revealed more frequent movements of animals to and from beef operations of all sizes. In addition, there were more high-risk indirect contacts on beef operations than has been reported previously. However, the number of low-risk indirect contacts was similar for small beef operations but less for large beef operations than has been reported elsewhere. Epidemic simulation models for California based on data in earlier studies likely underpredicted disease transmission involving beef herds. (J Am Vet Med Assoc 2009;235:573–579) contact activities and potential routes of exposure de- scribed in a 1971 report 3 happen on a routine basis on many beef operations. Guidelines have been pub- lished 4,5 for biosecurity on beef operations (including traffic control, animal isolation, and sanitation) to help producers minimize disease risk. In 2003, sales of cattle and calves yielded > $1.5 bil- lion for California producers. 6 Prior to the diagnosis of bovine spongiform encephalopathy in the United States in late 2003, the US beef export market was valued at almost $4 billion. 6 From 2003 through 2005, Califor- nia beef exports, including hides and skins, decreased from $214 million to < $100 million, at least in part because of the bovine spongiform encephalopathy–re- lated closure of most major export markets. 6,7 Although it has been predicted that the California beef industry should be able to return to business as usual after an FMD outbreak has ended, interstate and international export markets would likely be closed or substantially altered, possibly for years. 1 From the Center for Animal Disease Modeling and Surveillance, School of Veterinary Medicine, University of California, Davis, CA 95616. Supported by the Department of Homeland Security and the National Center for Foreign Animal and Zoonotic Disease Defense. Address correspondence to Dr. Carpenter. ABBREVIATIONS FFA Future Farmers of America FMD Foot-and-mouth disease FMDV Foot-and-mouth disease virus
Transcript of Results of a survey to estimate cattle movements and contact rates among beef herds in California,...
JAVMA, Vol 235, No. 5, September 1, 2009 Scientific Reports 573
RU
MIN
AN
TS
It is widely assumed that an outbreak of FMD in the United States would have a serious impact on the
US beef industry. In the event of an FMD outbreak in California, direct production losses to California’s beef industry alone are estimated at $54 to $746 million, whereas the estimated total of direct, indirect, and in-duced output losses to California’s beef industry ranges from $104 million to $1.4 billion.1 National trade losses are estimated to be approximately $3 billion.1 The Na-tional Association of State Departments of Agriculture Research Foundation reported that federal investment in and budget allocation for the USDA National Animal Health Monitoring and Surveillance program is inad-equate to address the growing risk to the $100 billion US livestock industry.2
The FMDV can be transmitted via contact with fomites (contaminated material, vehicles, vermin, or people) or contaminated animal products, via artifi-cial insemination or exposure to carrier animals, and through airborne spread.3 Although a case of FMD has not been reported in the United States in 80 years, all
Results of a survey to estimate cattle movements and contact rates among beef herds in California, with reference to the potential spread and control
of foot-and-mouth disease
Edith S. Marshall, dvm, mpvm, dacvpm; Tim E. Carpenter, phd; Clair Thunes, phd
Objective—To estimate contact rates and movement variables for shipments of beef cattle to and from producer premises in California.Design—Cross-sectional survey.Sample Population—583 beef producers in California.Procedures—Questionnaires were developed and distributed to beef cattle producers in California. The study period was from April 20, 2005, through September 7, 2006. Data from completed questionnaires were entered manually into an electronic format. Descriptive statistical analyses were performed.Results—Median number of interstate animal movements (movement of cattle into or out of California) was 0.17/mo; on the basis of this median, beef cattle were moved interstate > 2 times/y. Respondents kept beef cattle at up to 5 locations throughout the year. More than 40% of the movements from the respondents’ premises were to a sale yard or auc-tion facility.Conclusions and Clinical Relevance—Frequency of animal movements in this statewide study differed from values in another study of monthly shipments of animals to and from beef operations in 3 counties of California. The survey reported here revealed more frequent movements of animals to and from beef operations of all sizes. In addition, there were more high-risk indirect contacts on beef operations than has been reported previously. However, the number of low-risk indirect contacts was similar for small beef operations but less for large beef operations than has been reported elsewhere. Epidemic simulation models for California based on data in earlier studies likely underpredicted disease transmission involving beef herds. (J Am Vet Med Assoc 2009;235:573–579)
contact activities and potential routes of exposure de-scribed in a 1971 report3 happen on a routine basis on many beef operations. Guidelines have been pub-lished4,5 for biosecurity on beef operations (including traffic control, animal isolation, and sanitation) to help producers minimize disease risk.
In 2003, sales of cattle and calves yielded > $1.5 bil-lion for California producers.6 Prior to the diagnosis of bovine spongiform encephalopathy in the United States in late 2003, the US beef export market was valued at almost $4 billion.6 From 2003 through 2005, Califor-nia beef exports, including hides and skins, decreased from $214 million to < $100 million, at least in part because of the bovine spongiform encephalopathy–re-lated closure of most major export markets.6,7 Although it has been predicted that the California beef industry should be able to return to business as usual after an FMD outbreak has ended, interstate and international export markets would likely be closed or substantially altered, possibly for years.1
From the Center for Animal Disease Modeling and Surveillance, School of Veterinary Medicine, University of California, Davis, CA 95616.
Supported by the Department of Homeland Security and the National Center for Foreign Animal and Zoonotic Disease Defense.
Address correspondence to Dr. Carpenter.
Abbreviations
FFA FutureFarmersofAmericaFMD Foot-and-mouthdiseaseFMDV Foot-and-mouthdiseasevirus

574 Scientific Reports JAVMA, Vol 235, No. 5, September 1, 2009
RU
MIN
AN
TS
Given the potentially devastating consequences to the California beef industry that would result from an FMD outbreak, prevention and control strategies must address the nature of farm contacts that have the potential to transmit FMDV. Direct contact rates have been reported8 for beef operations in 3 counties in Cali-fornia. The purpose of the study reported here was to conduct a survey to quantify contact rates and animal movements to and from a statewide sample of beef cat-tle premises in California.
Materials and Methods
Sample population—As part of a larger study, questionnaires were developed to collect information from California livestock producers regarding livestock production activities, herd size (ie, number of cattle in a herd), number of employees, farm resident or em-ployee contact with other livestock premises, visitors and vehicles coming to the premises, the 3 most recent movements of livestock to and from the premises, ob-servations of wildlife in close proximity to livestock, and alternate locations where livestock are kept. Autho-rization for the study of human subjects was obtained from a university institutional review board.
Procedures—Questions included those with close-ended (n = 4), partially open-ended (10), and open-ended (3) formats. The questionnaire was reviewed by veterinarians; data, epidemiologic, and statistical ana-lysts; and livestock industry experts prior to the study. Responses from beef producers were collected by use of a general livestock questionnaire that encompassed all surveyed livestock activities (4 pages) or a questionnaire designed specifically for beef producers (5 pages).a Indi-viduals who were known to be beef producers received the specialized questionnaire, which included additional questions regarding alternate locations where cattle were kept.
The study period was from April 20, 2005, through September 7, 2006. The California Cattlemen’s Associa-tion mailed the questionnaires to each of its members on behalf of the authors. In addition, potential respon-dents who attended any of several outreach events also attended by the authors during the study period were identified at those events and requested to complete a questionnaire. No follow-up or reminder materials were sent or provided to potential survey respondents. Data from completed questionnaires were entered manually into an electronic format.
Calculations of animal movements—To evaluate cattle movements, respondents were asked to report the distance, number of animals, and number of days preceding completion of the survey for each of the 3 most recent movements to and from the premises. The frequency of animal movements per month was calcu-lated for movements to and from each premises by use of the following equation: frequency of movements per month = (number of days since most recent movement) X (n – 0.5)/30 days, where n is the maximum number of movements reported. Because it was unknown whether animals were moved on the day the survey was com-pleted, the interval between the most recent movement
and the date the survey was completed was assumed to represent half of the true interval between animal movements. Questions that the respondents did not an-swer were not included in the analysis.
Variable (No. of responses) No. of responses (%)
Production type (572)* Single (395) Cow-calf 337 (58.9) Seed stock 25 (4.4) Feedyard 12 (2.1) Stocker 14 (2.4) 4-H, FFA, or backyard operation 5 (0.9) Other† 2 (0.3) Multiple (177) Cow-calf 170 (29.7) Seed stock 47 (8.2) Feedyard 24 (4.2) Stocker 109 (19.1) 4-H or FFA 22 (3.8) Backyard hobby farm 6 (1.0) Other† 15 (2.6) No. of cattle in herd (583) 1–9 7 (1.2) 10–49 81 (13.9) 50–99 77 (13.2) 100–249 162 (27.8) 250–499 101 (17.3) 500–999 54 (9.3) 1,000–1,499 31 (5.3) 1,500–1,999 15 (2.6) 2,000 55 (9.4)
*Values exceed 572 and 100% because respondents for the multiple production type indicated 1 category. †Other includes personal consumption.
Table 1—Responses for 583 beef cattle producers for production type and herd size in a survey of producers in California conduct-ed April 20, 2005, through September 7, 2006.
Variable (No. of responses) No. of responses (%)*
Current No. of employees (572) 0 29 (5.1) 1–2 314 (54.9) 3–5 164 (28.7) 6–10 36 (6.3) 11–20 16 (2.8) 21–200 13 (2.3) Peak No. of employees (439) 0 11 (2.5) 1–2 153 (34.9) 3–5 155 (35.3) 6–10 74 (16.9) 11–20 31 (7.1) 21–200 15 (3.4) Peak season of production (486) All year 18 (3.7) Spring 116 (23.9) Summer 173 (35.6) Fall 122 (25.1) Winter 44 (9.1) Other† 13 (2.7)
*Percentages do not total to 100% because of rounding. †Other includes the response of does not apply.
Table 2—Employment practices and seasonality of production of beef cattle operations for 583 respondents in a survey of produc-ers in California conducted April 20, 2005, through September 7, 2006.

JAVMA, Vol 235, No. 5, September 1, 2009 Scientific Reports 575
RU
MIN
AN
TS
Data analysis—Descriptive statistics (count, pro-portion, median, and range) were calculated by use of commercial software.b
Results
Response to questionnaire—Of the 1,848 ques-tionnaires provided to individuals believed to raise beef cattle, 648 (35.1%) were returned. Sixty-one (9.4%) respondents indicated that they no longer raised or managed cattle at the time of the survey, and 4 (0.6%) respondents did not provide an answer to
that question. Therefore, 583 of 648 (90.0%) respon-dents indicated that they raised beef cattle during the survey period and were included in the analyses.
Herd demographics—For the question on type of production, there were 572 respondents. Of these, 395 (69.1%) indicated a single type of beef production, whereas the other 177 (30.9%) indi-cated multiple production activities (Table 1). Of the 395 respondents reporting a single production type, 337 (85.3%) indicated the type of production was cow-calf. Almost all (170 [96.0%]) of the re-
250 cattle in herd (n = 325) 250 cattle in herd (n = 251)
Movement No. of No. of days No. of No. of No. of days No. ofto or from cattle since cattle kilometers cattle since cattle kilometerspremises Movement moved were moved moved moved were moved moved
From Most recent (n = 238) 7 (1–600) 38 (1–1,440) 55 (2–3,200) 20 (1–1,750) 21 (1–355) 130 (2–1,900) Second most recent (n = 184) 7 (1–287) 150 (2–757) 55 (2–3,200) 28 (1–1,360) 60 (1–706) 65 (2–2,250) Third most recent (n = 147) 10 (1–200) 230 (4–1,122) 55 (2–3,200) 38 (1–2,800) 98 (2–1,071) 100 (5–3,050) To Most recent (n = 208) 4 (1–800) 120 (1–2,190) 55 (2–3,200) 16 (1–1,900) 90 (1–6,001) 145 (2–2,900) Second most recent (n = 168) 3 (1–635) 186 (5–2,190) 50 (2–3,200) 28 (1–2,800) 150 (1–2,190) 160 (5–2,900) Third most recent (n = 146) 3 (1–970) 250 (21–2,505) 55 (2–4,000) 28 (1–3,350) 165 (2–4,745) 175 (10–3,200)
To convert kilometers to miles, multiply value by 0.625.n = No. of responses.
Table 3—Median (range) values for characteristics of the 3 most recent movements of beef cattle to and from premises in a survey of producers in California conducted April 20, 2005, through September 7, 2006.
Most recent Second most recent Third most recent
No. of Total No. of No. of Total No. of No. of Total No. ofDestination responses responses % responses responses % responses responses %
Single location Individual business 43 491 8.8 26 377 6.9 26 315 8.3 associates Livestock dealer 20 491 4.1 13 377 3.4 11 315 3.5 Calf or heifer raiser 3 491 0.6 3 377 0.8 2 315 0.6 Feedyard 19 491 3.9 20 377 5.3 20 315 6.3 Slaughter facility 41 491 8.4 30 377 8.0 32 315 10.2 Show, fair, or 6 491 1.2 10 377 2.7 4 315 1.3 livestock exhibition Sale yard or auction 205 491 41.8 154 377 40.8 129 315 41.0 4-H, FFA, or backyard 6 491 1.2 8 377 2.1 4 315 1.3 operation Friends, neighbors, 12 491 2.4 9 377 2.4 10 315 3.2 or relatives Another location 110 491 22.4 87 377 23.1 69 315 21.9 where cattle are kept by respondent Multiple locations 26 491 5.3 17 377 4.5 8 315 2.5 Individual 8 26 30.8 6 17 35.3 4 8 50.0 Livestock dealer 8 26 30.8 5 17 29.4 3 8 37.5 Calf or heifer raiser 2 26 7.7 1 17 5.9 0 8 0 Feedyard 9 26 34.6 5 17 29.4 2 8 25.0 Slaughter facility 4 26 15.4 1 17 5.9 0 8 0 Show, fair, or 1 26 3.8 1 17 5.9 0 8 0 livestock exhibition Sale yard or auction 17 26 65.4 9 17 52.9 4 8 50.0 4-H, FFA, or backyard 3 26 11.5 1 17 5.9 0 8 0 operation Friends, neighbors, 1 26 3.8 1 17 5.9 0 8 0 or relatives Another location 8 26 30.8 5 17 29.4 2 8 25.0 where cattle are kept by owner
Values within a column exceed the total number of responses and 100% because respondents for the multiple locations indicated 1 destination.
Table 4—Destinations for the 3 most recent movements of beef cattle from premises of respondents in a survey of producers in Cali-fornia conducted April 20, 2005, through September 7, 2006.

576 Scientific Reports JAVMA, Vol 235, No. 5, September 1, 2009
RU
MIN
AN
TS
spondents with multiple production activities indi-cated that their production type included cow-calf, followed by 109 (61.6%) who indicated the pro-duction type included stocker cattle. The majority (340/583 [58.3%]) of beef producers reported that they had between 50 and 499 cattle. The herd size reported most frequently (162/583 [27.8%]) was between 100 and 249 cattle. Approximately a fourth (165 [28.3%]) of the producers had < 100 cattle, and approximately another fourth (155 [26.6%]) had > 500 cattle.
Employees—The majority of the respondents who reported the number of employees indicated that they employed 5 or fewer people at the time of the survey (507/572 [88.7%]) as well as during the peak season (319/439 [72.7%]; Table 2). The median number of employees at the time of the survey was 1.5, with a median number of 4 employees during the peak season. Summer was most commonly (173/486 [35.6%]) indicated as the peak season, followed by fall (122/486 [25.1%]), spring (116/486 [23.9%]), and winter (44/486 [9.1%]). Interestingly, 18 (3.7%) of the respondents who answered the seasonality question implied that they did not have a peak season by virtue of the fact that they considered the entire year as the peak season.
Wildlife observations—Of 583 respondents, 375 (64.3%) reported that they had seen deer within approx-imately 150 m (500 feet) of their cattle; the deer were seen a median of 8 times/mo (range, 0.08 to 720 times/mo). Elk were reportedly seen a median of 2.08 times/mo (range, 0.08 to 90.0 times/mo) on 45 (7.7%) premises. Wild pigs were seen a median of 2 times/mo (range, 0.08 to 840 times/mo) by 159 (27.3%) respondents.
Calves—A majority (409/583 [70.2%]) of beef pro-ducers reported that they sold calves at auction facili-ties. Approximately half (279 [47.9%]) of the produc-ers also reported that they raised and weaned calves, whereas other producers sold calves to other beef op-erations (160 [27.4%]), sold calves for 4-H or FFA pro-grams (93 [16.0%]), or used the calves for other pur-poses (79 [13.6%]).
Movements of cattle to and from premises—Of 583 respondents, 210 (36.0%) reported that they shipped cattle to out-of-state locations a median of 0.17 times/mo (range, 0.04 to 583 times/mo); this equated to approximately twice per year. One hundred sixty-four (28.1%) respondents reported that they received cattle from out-of-state locations a median of 0.17 times/mo (range, 0.02 to 1,500 times/mo). For the 3 most recent movements of beef cattle from premises of respondents
Most recent Second most recent Third most recent
No. of Total No. of No. of Total No. of No. of Total No. ofOrigin responses responses % responses responses % responses responses %
Single origin Individual business 75 487 15.4 40 312 12.8 36 254 14.2 associates Livestock dealer 19 487 3.9 9 312 2.9 10 254 3.9 Calf or heifer raiser 11 487 2.3 12 312 3.8 12 254 4.7 Feedyard 7 487 1.4 10 312 3.2 5 254 2.0 Slaughter facility 3 487 0.6 1 312 0.3 1 254 0.4 Show, fair, or 76 487 15.6 57 312 18.3 41 254 16.1 livestock exhibition 4-H, FFA, or backyard 20 487 4.1 15 312 4.8 14 254 5.5 operation Sale yard or auction 85 487 17.5 55 312 17.6 40 254 15.7 Friends, neighbors, 22 487 4.5 14 312 4.5 13 254 5.1 or relatives Another location 75 487 15.4 40 312 12.8 36 254 14.2 where cattle are kept by respondent Multiple origins 19 487 3.9 9 312 2.9 10 254 3.9 Individual business 9 19 47.4 6 9 33.3 7 10 70.0 associates Livestock dealer 7 19 36.8 4 9 44.4 4 10 40.0 Calf or heifer raiser 4 19 21.1 1 9 11.1 2 10 20.0 Feedyard 4 19 21.1 0 9 0 0 10 0 Slaughter facility 2 19 10.5 0 9 0 0 10 0 Show, fair, or 13 19 68.4 8 9 88.9 7 10 70.0 livestock exhibition Sale yard or auction 2 19 10.5 2 9 22.2 1 10 10.0 4-H, FFA, or backyard 6 19 31.6 5 9 55.6 4 10 40.0 operation Friends, neighbors, 5 19 26.3 5 9 55.6 4 10 40.0 or relatives Another location 0 19 0 0 14 0 0 12 0 where cattle are kept by respondent
Values within a column exceed the total number of responses and 100% because respondents for the multiple locations indicated 1 source of origin.
Table 5—Origins for the 3 most recent movements of beef cattle from premises of respondents in a survey of producers in California conducted April 20, 2005, through September 7, 2006.

JAVMA, Vol 235, No. 5, September 1, 2009 Scientific Reports 577
RU
MIN
AN
TS
with < 250 cattle, the median number of cattle moved was 7 for the most and second most recent movements and 10 for the third most recent movement (range, 1 to 600 cattle; Table 3). For each of the 3 most recent movements of cattle from premises of respondents, 488 of 1,183 (41.3%) were destined for a sale yard or auction facility (Table 4). More than a fifth (266/1,183 [22.5%]) of the movements were to another location where the respondent kept cattle. Few (< 10) of the movements were to individual business associates; live-stock dealers; calf or heifer raisers; feedyards; slaugh-ter facilities; shows, fairs, or livestock exhibitions; 4-H, FFA, or backyard operations; or friends, neighbors, or relatives. Movements of cattle bound for multiple des-tinations accounted for 51 of 1,183 (4.3%) movements from the premises of respondents. Of these multiple-destination movements, sale yards or auction facilities were included in 30 of 51 (59%), and individuals (18 [35%]), livestock dealers (16 [31%]), and feedyards (16 [31%]) each accounted for approximately a third of multiple-destination movements.
Similar numbers of cattle movements to the prem-ises of respondents originated at an individual produc-er or ranch; a show, fair, or livestock exhibition; a sale yard or auction facility; or another location where cattle were kept by the respondent. In total, these premises types accounted for 656 of 1,053 (62.3%) of the single-origin movements to the premises (Table 5). Few move-ments to the premises (171/1,053 [6.2%]) originated at livestock dealers; calf or heifer raisers; 4-H, FFA, or backyard operations; or friends, neighbors, or relatives. There were only 38 of 1,053 (3.6%) movements to the premises that originated at multiple locations. Of these multiple-origin movements, most originated at a show, fair, or livestock exhibition.
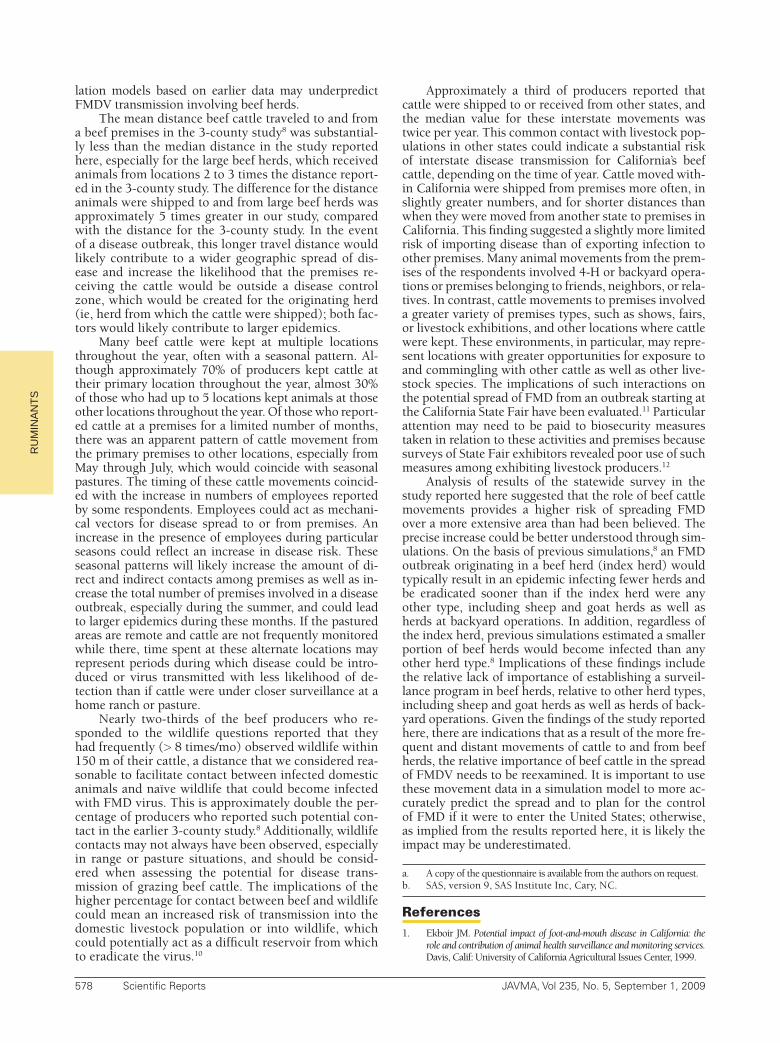
Time of year cattle were kept at other loca-tions—Respondents kept beef cattle at up to 5 loca-tions throughout the year (Figure 1). There were 337 of 488 (69.1%) respondents who kept cattle at 1 location throughout the year, compared with 17 of 61 (28%) who kept cattle at 4 or 5 locations. For respondents who did not keep cattle at 1 location throughout the
year, July and August were least frequently reported (10% each) as months when cattle were kept at that location. Several respondents (range, 41% to 54%) kept cattle at 2 to 5 locations throughout the year, with May and June reported as the months when cattle were most frequently kept at locations 2 through 5.
Discussion
To our knowledge, the potential for FMD or oth-er disease spread attributable to animal movements among US livestock populations has not been evaluated by use of data collected for an entire state. In another study,8 values for monthly shipments of animals to and from beef operations in 3 counties of California were reported.8 In that study, 81 beef producers responded to questions on animal movement, compared with the 583 respondents who responded to the survey reported here. Beef cattle producers represented in our survey were primarily medium-size cow-calf operations. This corresponds with the 2007 USDA National Agricultural Statistical Service data9 for California, which indicate that most of the beef operations in the state were cow-calf operations and that of those 11,200 cow-calf op-erations, 98% had < 499 cattle. However, the National Agricultural Statistical Service data indicate a far larger percentage (76%) of very small (< 49 cattle) operations, compared with the 15% of producers represented in our survey. Because the respondents to our survey were primarily identified through a single cattle producer organization, the respondent selection may have been biased if very small beef operations were less likely to be organization members than were larger operations. Such a bias would likely have made the results of the smaller (< 250 cattle) beef operations appear more similar to the larger (> 250 cattle) beef operations. Fur-thermore, the survey reported here included data for respondents from the entire state, compared with re-spondents in a 3-county area that had intensive dairy production, which was likely not representative of the entire state. The contact variables for very small beef operations across California are not known, and it is unclear how selection bias for the present study would
have affected calculations of disease spread across the state.
Although the authors of the aforemen-tioned 3-county study8 did not report the number of animals shipped and reported mean shipment frequency, rather than the median shipment frequency reported here, our study found movements of animals to and from beef operations of all sizes to be more frequent, compared with results for the 3-county study. Although these differ-ences may reflect differences in study area (3 counties vs the state), in sample size between that study and the study reported here, or in economic climate, the reason for these dif-ferences is not as important as the impact of the use of previously reported estimates of animal movements, compared with the es-timates obtained in our study. On the basis of the movement information obtained with our survey, it appears that epidemic simu-
Figure 1—Responses for time of year beef cattle were kept at up to 5 locations in a survey of 583 producers in California conducted April 20, 2005, through Sep-tember 7, 2006. The number of locations and number of responses are as follows: location 1 (black bars), 488 responses; location 2 (diagonal-striped bars), 235 re-sponses; location 3 (white bars), 111 responses; and location 4 or 5 (gray bars), 61 responses.
578 Scientific Reports JAVMA, Vol 235, No. 5, September 1, 2009
RU
MIN
AN
TS
lation models based on earlier data may underpredict FMDV transmission involving beef herds.
The mean distance beef cattle traveled to and from a beef premises in the 3-county study8 was substantial-ly less than the median distance in the study reported here, especially for the large beef herds, which received animals from locations 2 to 3 times the distance report-ed in the 3-county study. The difference for the distance animals were shipped to and from large beef herds was approximately 5 times greater in our study, compared with the distance for the 3-county study. In the event of a disease outbreak, this longer travel distance would likely contribute to a wider geographic spread of dis-ease and increase the likelihood that the premises re-ceiving the cattle would be outside a disease control zone, which would be created for the originating herd (ie, herd from which the cattle were shipped); both fac-tors would likely contribute to larger epidemics.
Many beef cattle were kept at multiple locations throughout the year, often with a seasonal pattern. Al-though approximately 70% of producers kept cattle at their primary location throughout the year, almost 30% of those who had up to 5 locations kept animals at those other locations throughout the year. Of those who report-ed cattle at a premises for a limited number of months, there was an apparent pattern of cattle movement from the primary premises to other locations, especially from May through July, which would coincide with seasonal pastures. The timing of these cattle movements coincid-ed with the increase in numbers of employees reported by some respondents. Employees could act as mechani-cal vectors for disease spread to or from premises. An increase in the presence of employees during particular seasons could reflect an increase in disease risk. These seasonal patterns will likely increase the amount of di-rect and indirect contacts among premises as well as in-crease the total number of premises involved in a disease outbreak, especially during the summer, and could lead to larger epidemics during these months. If the pastured areas are remote and cattle are not frequently monitored while there, time spent at these alternate locations may represent periods during which disease could be intro-duced or virus transmitted with less likelihood of de-tection than if cattle were under closer surveillance at a home ranch or pasture.
Nearly two-thirds of the beef producers who re-sponded to the wildlife questions reported that they had frequently (> 8 times/mo) observed wildlife within 150 m of their cattle, a distance that we considered rea-sonable to facilitate contact between infected domestic animals and naïve wildlife that could become infected with FMD virus. This is approximately double the per-centage of producers who reported such potential con-tact in the earlier 3-county study.8 Additionally, wildlife contacts may not always have been observed, especially in range or pasture situations, and should be consid-ered when assessing the potential for disease trans-mission of grazing beef cattle. The implications of the higher percentage for contact between beef and wildlife could mean an increased risk of transmission into the domestic livestock population or into wildlife, which could potentially act as a difficult reservoir from which to eradicate the virus.10
Approximately a third of producers reported that cattle were shipped to or received from other states, and the median value for these interstate movements was twice per year. This common contact with livestock pop-ulations in other states could indicate a substantial risk of interstate disease transmission for California’s beef cattle, depending on the time of year. Cattle moved with-in California were shipped from premises more often, in slightly greater numbers, and for shorter distances than when they were moved from another state to premises in California. This finding suggested a slightly more limited risk of importing disease than of exporting infection to other premises. Many animal movements from the prem-ises of the respondents involved 4-H or backyard opera-tions or premises belonging to friends, neighbors, or rela-tives. In contrast, cattle movements to premises involved a greater variety of premises types, such as shows, fairs, or livestock exhibitions, and other locations where cattle were kept. These environments, in particular, may repre-sent locations with greater opportunities for exposure to and commingling with other cattle as well as other live-stock species. The implications of such interactions on the potential spread of FMD from an outbreak starting at the California State Fair have been evaluated.11 Particular attention may need to be paid to biosecurity measures taken in relation to these activities and premises because surveys of State Fair exhibitors revealed poor use of such measures among exhibiting livestock producers.12
Analysis of results of the statewide survey in the study reported here suggested that the role of beef cattle movements provides a higher risk of spreading FMD over a more extensive area than had been believed. The precise increase could be better understood through sim-ulations. On the basis of previous simulations,8 an FMD outbreak originating in a beef herd (index herd) would typically result in an epidemic infecting fewer herds and be eradicated sooner than if the index herd were any other type, including sheep and goat herds as well as herds at backyard operations. In addition, regardless of the index herd, previous simulations estimated a smaller portion of beef herds would become infected than any other herd type.8 Implications of these findings include the relative lack of importance of establishing a surveil-lance program in beef herds, relative to other herd types, including sheep and goat herds as well as herds of back-yard operations. Given the findings of the study reported here, there are indications that as a result of the more fre-quent and distant movements of cattle to and from beef herds, the relative importance of beef cattle in the spread of FMDV needs to be reexamined. It is important to use these movement data in a simulation model to more ac-curately predict the spread and to plan for the control of FMD if it were to enter the United States; otherwise, as implied from the results reported here, it is likely the impact may be underestimated.
a. A copy of the questionnaire is available from the authors on request.b. SAS, version 9, SAS Institute Inc, Cary, NC.
References1. Ekboir JM. Potential impact of foot-and-mouth disease in California: the
role and contribution of animal health surveillance and monitoring services. Davis, Calif: University of California Agricultural Issues Center, 1999.

JAVMA, Vol 235, No. 5, September 1, 2009 Scientific Reports 579
RU
MIN
AN
TS
2. NationalAssociationofStateDepartmentsofAgricultureResearchFoundation(NASDARF).The Animal Health Safeguarding Review: results and recommendations. October 2001.Washington,DC:NAS-DAResearchFoundation,2001.Availableat:www.nasda-hq.org/ASGRwebsite/FullBook.pdf.AccessedMay17,2007.
3. SellersRF.Quantitativeaspectsofthespreadoffootandmouthdisease.Vet Bull1971;41:431–439.
4. ParkerR,LooperM,MathisC,etal.Biosecurity on the beef and dairy operation.GuideB-121.LasCruces,NM:CooperativeEx-tensionService,CollegeofAgricultureandHomeEconomics,NewMexicoStateUniversity,2002.
5. Buhman M, Dewell G, Griffin D. Biosecurity basics for cattle operations and good management practices (GMP) for controlling infectious diseases.NebGuideG1411.Lincoln,Neb:UniversityofNebraska–LincolnExtension,2005.
6. CaliforniaBeefCouncil.Facts for your file… California beef in-dustry.Availableat:www.calbeef.org/index/pdf/About%20the%20Beef%20Business.pdf.AccessedApr23,2007.
7. California’sagriculturalexports:year2005data,fromestimat-ingCalifornia’sagriculturalexports.Table1—CaliforniaAgri-culturalCommodityExportValuesandRankings,1995–2005.
UniversityofCaliforniaAgriculturalIssuesCenter.Availableat:aic.ucdavis.edu/pub/exports.html.AccessedApr23,2007.
8. Bates TW, Thurmond MC, Carpenter TE. Direct and indi-rectcontactratesamongbeef,dairy,goat,sheep,andswineherdsinthreeCaliforniacounties,withreferencetocontrolof potential foot-and-mouth disease transmission (Erra-tumpublished inAm J Vet Res2001;62:1477).Am J Vet Res2001;62:1121–1129.
9. USDA National Agricultural Statistics Service. Available at:www.agcensus.usda.gov/Publications/2002/index.asp.AccessedAug6,2008.
10. Pineda-KrchM,O’BrienJ,ThunesC,etal.Potentialimpactofanintroductionoffoot-and-mouthdiseasefromwildpigsintocommercialswineanddairypremisesinCalifornia.Am J Vet Res2009;70:inpress.
11. CarpenterTE,ChristiansenLE,DickeyBF,etal.Thepotentialimpactof an introductionof foot-and-mouthdisease into theCaliforniaStateFair.J Am Vet Med Assoc2007;231:1231–1235.
12. ThunesC,CarpenterTE.Biosecuritypracticesandtravelhis-toryof individualsexhibiting livestockat the2005CaliforniaStateFair.J Am Vet Med Assoc2007;231:581–585.
Selected abstract for JAVMA readers from the American Journal of Veterinary Research
Determination of plasma osmolality and agreement between measured and calculated values in healthy adult Hispaniolan Amazon parrots (Amazona ventralis)
Mark J. Acierno et al
Objective—To determine serum osmolality in healthy adult Hispaniolan Amazon parrots (Amazona ventralis) and validate osmolality equations in these parrots.Animals—20 healthy adult Hispaniolan Amazon parrots.Procedures—A blood sample (0.5 mL) was collected from the right jugular vein of each parrot and placed into a lithium heparin microtainer tube. Samples were centrifuged, and plasma was harvested and frozen at –30°C. Samples were thawed, and plasma osmolality was measured in duplicate with a freezing-point depression osmometer. The mean value was calculated for the 2 osmolality measurements.Results—Osmolality values were normally distributed, with a mean ± SD of 326.0 ± 6.878 mOsm/kg. The equations (2 X [Na+ + K+]) + (glucose/18), which resulted in bias of 2.3333 mOsm/kg and limits of agreement of –7.0940 to 11.7606 mOsm/kg, and (2 X [Na+ + K+]) + (uric acid/16.8) + (glucose/18), which resulted in bias of 5.8117 mOsm/kg and limits of agreement of –14.6640 to 3.0406 mOsm/kg, yielded calculated values that were in good agreement with the measured osmolality.Conclusions and Clinical Relevance—IV administration of large amounts of hypotonic fluids can have catastrophic consequences. Osmolality of the plasma from parrots in this study was significantly higher than that of commercially available prepackaged fluids. Therefore, such fluids should be used with caution in Hispaniolan Amazon parrots as well as other psittacines. Additional studies are needed to determine whether the estimation of osmolality has the same clinical value in psittacines as it does in other animals. (Am J Vet Res 2009;70:1151–1154)
See the midmonth issues
of JAVMA
for the expanded
table of contents
for the AJVR
or log on to
avmajournals.avma.org
for access
to all the abstracts.
September 2009