Geographic Information Systems in the Service of Alternative Tourism – Methods with Landscape...
17
Geographic Information Systems in the Service of Alternative Tourism – Methods with Landscape Evaluation and Target Group Preference Weighting VIKTOR VARJÚ*, ANDREA SUVÁK and PÉTER DOMBI Transdanubian Research Department, Institute of Regional Studies of CERS HAS, Pécs, Hungary ABSTRACT There is a large variety of types of rural areas and many of them are rich in landscape beauty. However, their preserved culture and traditions are revalued in today’s rapid transformation of lifestyles. Alternative tourism is thus an emerging potential to economically support these areas, at the same time helps to preserve natural and cultural heritage. The methods provide sophisticated means to analyse the characteristics and the potential attractiveness of landscape and cultural attractions from the viewpoint of alternative tourism development. Homogenous tourism sub-regions can be defined, and the most suitable develop- ment scenarios can be found to the certain areas. Copyright © 2013 John Wiley & Sons, Ltd. Received 5 September 2012; Revised 4 February 2013; Accepted 9 February 2013 key words alternative tourism; geographic information system (GIS); landscape evaluation; attraction evaluation; tourism target groups; segmentation INTRODUCTION In the past three decades, the structure of agriculture has considerably changed in regions that can be considered geographically, economically and geo-politically peripheral – and that last are largely located in new European Union member states. As a result, the economic role and the overall contribution to employment of agriculture have fallen quite markedly. Furthermore, these regions and societies (especially in peripheral regions such as South-West Hungary, Northern Croatia, western part of Northern Ireland) have underperforming tertiary sectors and are not characterised by strong urbanisation patterns. On the other hand, human resources have been freed up that might provide a niche for alternative development. Likewise, the relative lack of envi- ronmental degradation can also be seen as a potential resource that requires special attention. Tourism is one of the world’s largest industries (Berno and Bricker, 2001; Boxill, 2004; Hall and Page, 2006) with a major economic, social and environmental impacts. The ‘energy and environment-intensive production patterns of mass tourism today places enormous stress on natural assets...’ (Curtin and Busby, 1999:136). Alternative tourism, gaining importance from the 1980s, is defined in contrast to conventional mass tourism as ‘tourism [that] no longer concentrates on economic and technical necessities alone, but rather emphasises the demand for an unspoiled environment and consideration of the needs of local people’ (Fennell, 1999:9). This softer type of approach places natural and cultural resources in the forefront of development activities and spatial planning, with a special regard for impacts on local economic development (Fennell, 1999; Aubert, 2001; Csapó, 2004). It increases attention – being the fastest growing segments of tourism – not only as an alternative to mass tourism, but also as a means to promote a country’s/region’s economic development and environmental conservation (Dearden and Harron, 1993; Bunruamkaew and Murayama, 2012). The present study reveals some of the findings of a Hungarian-Croatian Cross-border Co-operation Programme (IPA HUHR) and presents two methodologies. The aim of the work has been to create an underlying development framework for a region with a lagging economy but consid- erable natural assets. The underlying values of dealing with the area were that of sustainable development; hence, we focused on different segments of alternative tourism. This work represents a framework for empirically grounded and competitive tourism development strategies. The goal/baseline of the research was to find a develop- ment potential for an underdeveloped region and to search for a link for the development of it – focusing on different forms of (alternative) tourism – and the preservation of the high values of the local natural and cultural assets. The study is supported by multicriteria landscape analysis. Multicriteria evaluation (MCE) methods are most commonly used to rank and designate different land use choices for certain areas in a situation of landscape scarcity. The peculiarity of the presented evaluation lies in the application of multicriteria analysis; hence, it concentrates on the assessment of areas from several parallel viewpoints (e.g. the viewpoints of different alternative tourism target groups) and instead of ranking and appraising possible (single) choices it visualises the strength of the areas according to these considerations and does not exclude a certain territory being appointed to more than one target groups. The study incorporates a multicriteria landscape evalua- tion and a more complex assessment (complex potential value [CPV] evaluation) that couples the outcomes of the landscape evaluation with other factors that were drawn from an empirical analysis of actual tourism attraction points *Correspondence to: Viktor Varjú,Transdanubian Research Department, Institute of Regional Studies of CERS HAS, 22 Papnovelde Street, Pécs 7621, Hungary. E-mail: [email protected] Copyright © 2013 John Wiley & Sons, Ltd. International Journal of Tourism Research, Int. J. Tourism Res. (2013) Published online in Wiley Online Library (wileyonlinelibrary.com) DOI: 10.1002/jtr.1943
-
Upload
independent -
Category
Documents
-
view
2 -
download
0
Transcript of Geographic Information Systems in the Service of Alternative Tourism – Methods with Landscape...

Geographic Information Systems in the Service of Alternative Tourism –Methods with Landscape Evaluation and Target Group Preference Weighting
VIKTOR VARJÚ*, ANDREA SUVÁK and PÉTER DOMBI
Transdanubian Research Department, Institute of Regional Studies of CERS HAS, Pécs, Hungary
ABSTRACT
There is a large variety of types of rural areas and many of them are rich in landscape beauty. However, their preserved culture and traditionsare revalued in today’s rapid transformation of lifestyles. Alternative tourism is thus an emerging potential to economically support theseareas, at the same time helps to preserve natural and cultural heritage.The methods provide sophisticated means to analyse the characteristics and the potential attractiveness of landscape and cultural attractionsfrom the viewpoint of alternative tourism development. Homogenous tourism sub-regions can be defined, and the most suitable develop-ment scenarios can be found to the certain areas. Copyright © 2013 John Wiley & Sons, Ltd.
Received 5 September 2012; Revised 4 February 2013; Accepted 9 February 2013
key words alternative tourism; geographic information system (GIS); landscape evaluation; attraction evaluation; tourism targetgroups; segmentation
INTRODUCTION
In the past three decades, the structure of agriculturehas considerably changed in regions that can be consideredgeographically, economically and geo-politically peripheral –and that last are largely located in new European Unionmember states. As a result, the economic role and the overallcontribution to employment of agriculture have fallenquite markedly. Furthermore, these regions and societies(especially in peripheral regions such as South-West Hungary,Northern Croatia, western part of Northern Ireland) haveunderperforming tertiary sectors and are not characterised bystrong urbanisation patterns. On the other hand, humanresources have been freed up that might provide a niche foralternative development. Likewise, the relative lack of envi-ronmental degradation can also be seen as a potential resourcethat requires special attention.
Tourism is one of the world’s largest industries (Bernoand Bricker, 2001; Boxill, 2004; Hall and Page, 2006) witha major economic, social and environmental impacts. The‘energy and environment-intensive production patterns ofmass tourism today places enormous stress on naturalassets. . .’ (Curtin and Busby, 1999:136).
Alternative tourism, gaining importance from the 1980s, isdefined in contrast to conventional mass tourism as ‘tourism[that] no longer concentrates on economic and technicalnecessities alone, but rather emphasises the demand for anunspoiled environment and consideration of the needs of localpeople’ (Fennell, 1999:9). This softer type of approach placesnatural and cultural resources in the forefront of developmentactivities and spatial planning, with a special regard forimpacts on local economic development (Fennell, 1999;Aubert, 2001; Csapó, 2004). It increases attention – being
the fastest growing segments of tourism – not only as analternative to mass tourism, but also as a means to promote acountry’s/region’s economic development and environmentalconservation (Dearden and Harron, 1993; Bunruamkaew andMurayama, 2012).
The present study reveals some of the findings of aHungarian-Croatian Cross-border Co-operation Programme(IPA HUHR) and presents two methodologies. The aim ofthe work has been to create an underlying developmentframework for a region with a lagging economy but consid-erable natural assets. The underlying values of dealing withthe area were that of sustainable development; hence, wefocused on different segments of alternative tourism. Thiswork represents a framework for empirically grounded andcompetitive tourism development strategies.
The goal/baseline of the research was to find a develop-ment potential for an underdeveloped region and to searchfor a link for the development of it – focusing on differentforms of (alternative) tourism – and the preservation of thehigh values of the local natural and cultural assets.
The study is supported by multicriteria landscape analysis.Multicriteria evaluation (MCE) methods are most commonlyused to rank and designate different land use choices forcertain areas in a situation of landscape scarcity. The peculiarityof the presented evaluation lies in the application ofmulticriteria analysis; hence, it concentrates on the assessmentof areas from several parallel viewpoints (e.g. the viewpointsof different alternative tourism target groups) and instead ofranking and appraising possible (single) choices it visualisesthe strength of the areas according to these considerationsand does not exclude a certain territory being appointed tomore than one target groups.
The study incorporates a multicriteria landscape evalua-tion and a more complex assessment (complex potentialvalue [CPV] evaluation) that couples the outcomes of thelandscape evaluation with other factors that were drawnfrom an empirical analysis of actual tourism attraction points
*Correspondence to: Viktor Varjú,Transdanubian Research Department,Institute of Regional Studies of CERS HAS, 22 Papnovelde Street, Pécs7621, Hungary.E-mail: [email protected]
Copyright © 2013 John Wiley & Sons, Ltd.
International Journal of Tourism Research, Int. J. Tourism Res. (2013)Published online in Wiley Online Library (wileyonlinelibrary.com) DOI: 10.1002/jtr.1943

(the latter includes facilities that embody the supply side oftourism in the region). Such a composition of attributesdrawn from landscape characteristics and tourism superstruc-ture evaluation is special in geographic information system(GIS)-based landscape evaluation.
The two methods presented in the paper use landscapeevaluation for two ends: on the one hand, to reflect the potentialattractiveness of territories and on the other, as a starting pointfor CPV evaluation of different target groups.
In CPV assessment, the maps that are chief outcomesof the evaluation process present concentration areas of highvalues both of landscape assessment and complex valueassessment; thus, the methods are suitable for implicit andflexible delimitation of different tourism sub-regions.
The uniqueness of the presented method lies in the simulta-neous application of the two tools. The landscape assessment(without the insights of the CPV) itself is a multicriteria analysisi.e. suitable to ensure that planners are reminded to considerstrong sustainability requirements. ‘Objective’ methods oflandscape evaluation (using map layers to assess the qualityof the landscape instead of subjective opinion on the basisof landscape photography or scenery evaluation) allows forfaster and more cost-efficient use.
LITERATURE REVIEW
Preventions and solutions to environmental problemsrequire the understanding and prediction of natural and socialpatterns. Development activities, tourism developmentdecision-making and land use planning can cause changesin landscape; hence, focus should not be only on conserva-tion and protection, but also on sustainability. Analysis oflandscape allows to define potentials for and obstacles todevelopment (Senes and Toccolini, 1998; Steinhardt andVolk, 2003; Van Eetvelde and Antrop, 2009).
Sustainable and alternative forms of tourism developmentSustainability issues, eco-development approaches appearedin the 1970s when increasing dissatisfaction occurred‘with governments and industry that were too excessiveand exploitative in their development policies’ (Fennell,2002:11). This resulted in demands for greater environmentalconsciousness in all economic activities, and a parallel increaseof attention on nature-related activities within tourism.
Paradoxically, tourism poses severe burdens on the veryfactors that are (or once were) attractions of a certain place;the mass of visitors coupled with the services and therequired logistics are threats of depletion. As Dowling andFennell (2003) pointed out, ‘with the increase in touristsvisiting natural areas it was clear that at some stage the environ-mental movement would meet tourism development and objectto the increased adverse impacts caused by mass tourists’(Dowling and Fennell, 2003:3). ‘Today, sustainability issue is. . . one of the most important the (tourism) industry has everfaced’ (Garrod and Fyall, 1998:199), however, it has severalapproaches and generates debates.
Regarding tourism, multiple approaches developedalong the sustainability paradigm. However, there are three
concepts that can be considered as embracing the wholespectrum: sustainable tourism, ecotourism and alternativetourism; albeit these three have many common attributes.
In the literature, ecotourism usually appeared alongsidesustainable tourism (Hunter, 1997), and ‘as a particularvariant of alternative tourism’ (Cater, 1993:85). Ecotourismhas broad boundaries (including amongst others nature travel,adventure travel, birding, camping, skiing, whale watching,archaeological site watching [McLaren, 1998]). Wall (1997)warns that many forms of ecotourism may not be sustainable,and it needs a careful planning and management.
Recently, researchers describe ecotourism in the context ofa broader nature-based tourism. They usually tend to differen-tiate between two or three main types of natural resource-basedtourism. For example, Graburn (1989) operates with naturetourism (including ecological tourism and environmentaltourism, the latter subdivided into recreational activities andhunting) and cultural tourism. Fennell (2002) and Tisdell(1996) use three groups: ecotourism, adventure tourism andcultural tourism. Rural tourism is also often cited in thediscussion of sustainable and alternative tourism (Hall, 1998).
Earliest appearance of the term ecotourism is in 1965 ina paper by Hetzer (1965), later reprinted in Ecosphere(Fennell, 2002). Hetzer (1965) defines the need for ‘responsible’(‘alternative’) tourism projects fulfilling four requirements:
(1) minimum environmental impact;(2) minimum impact on – and maximum respect for – host
cultures;(3) maximum economic benefits to host country ‘grassroots’;
and(4) maximum ‘recreational’ satisfaction to participating
tourists. Tourism, if it fulfils the above requirements, canbe healthy and rewarding activity for the visiting tourist,an economically sound investment for the host area, andan environment-conserving feature – an ecological tourism(‘ecotourism’) (Hetzer, 1965:1 citied in Fennell, 2002:12).
Sustainability as a horizontal policy appeared both inmass and alternative tourism. In our understanding, thereare two approaches to sustainability in tourism: one that takessustainability as a compulsory burden in developmentdecision-making (in mass tourism development planning aswell), when the development is tourism-centric; however,the development decision-making takes into considerationthe interests of the needs of future generation (reflecting theoften cited definition of sustainable development as definedin WCED (World Commission on Environment anddevelopment (1987): 43), the costs and benefits (economic,environmental and social) of the development. This is the‘weak sustainability’ approach. The other concept uses theprinciples of sustainability to revive the tourism sector andthe territory at the same time, always attentive to the environ-mental consequences of any development. The latter wayimplies the maintenance of diversity, the growth of environ-mental awareness and cultural sensitivity, the involvement oflocal communities, the change of the attitudes of developersand tour operators, the renewable resource use and thenon-tourism-centric paradigm of sustainable tourism (Butler,1993; Prosser, 1994; Hunter, 1997; Garrod and Fyall, 1998;
V. Varjú, A. Suvák and P. Dombi
Copyright © 2013 John Wiley & Sons, Ltd. Int. J. Tourism Res. (2013)
DOI: 10.1002/jtr

Fennell, 2002; Stem et al., 2003; Wan and Li, 2013). ‘Thesustainability of tourism is hence directly tied to maintainingthe integrity of the attraction and mediating the interactionbetween the tourists and attraction over time’ (Dearden andHarron, 1993:82).
Alternative tourism appeared as a remarkably importanttopic of contemporary tourism research (Weaver, 1995).Alternative tourism in the literature is usually defined withthe principles of sustainable development (‘alternative tourismas a means to contribute to sustainable development’ (Lanfantand Graburn, 1992:112), and those types of activities areconsiders as alternative tourism that have labels such as ‘soft,green, responsible, harmonious, quality, gentle, sustainable,eco, progressive, sensitive, community, appropriate’ andpreservative (Cazes, 1986; Prosser, 1994; Weaver, 1995); theircharacteristics are in direct contrast to those of conventionalmass tourism (Weaver, 1991; Cater, 1993).
Consistently with the ‘green paradigm’, Weaver (1995)summarised the attributes of alternative tourism as thefollowing:
(1) ‘accommodation: low density, dispersed, small-scale, basedon local vernacular styles, locally owned and operated;
(2) attractions: ‘authentic’ cultural and natural features, utilisedby both tourists and locals, emphasis on uniqueness ofplace, or ‘sense of place’;
(3) market: low volume, year-round flows, diverse origins,(including intra-regional), highly motivated, respective tolocal culture, in search of understanding and knowledge;
(4) economy: complements other sectors, fosters local linkages,requires minimal imports, generates high multiplier effect;
(5) regulation: local control, public sector and communityinvolvement, long-range planning, holistic emphasis; and
(6) impact: functions within environmental, social and eco-nomic carrying capacities of the destination; enhanceslocal natural environment’ (Weaver, 1995:595).
At the same time, rural tourism, cultural heritage tourism,as well as ecotourism can be ranked to alternative tourism(e.g. water-related, bicycle-related, equestrian-related, trekking-related and hiking-related activities) based on their basicfeatures (Cazes, 1986; Dearden and Harron, 1993; Cater,1994; Prosser, 1994; Fennell, 1999, 2002; Gyuricza, 2008;Handbook to Tourism Projects in the Hungary-CroatiaIPA Cross-border Co-operation Programme, 2011). Inthis paper, we refer to the above mentioned segments asalternative tourism.
Alternative forms of tourism as a potential path formarginalised regionsThe benefits and impacts of alternative tourism are widelydiscussed. The potential benefits for the local level includegeneration of financial resources, job creation and promotionof environmental learning. Threats include environmentaldegradation, unequal economic resurgence and instability,negative socio-economic and cultural changes within thelocal community. The embeddedness of alternative tourisminto the local economy requires thorough quantitative andqualitative analysis and assessment during the development
phase (Whelan, 1991; Gulinck et al., 2001; Briassoulis,2002; Hajnal, 2006; Pénzes, 2009).
The post-war socio-economic changes, the increase ofmaterial well-being and longer paid holidays resulted in aconsiderable growth in outbound tourism in the developedcountries. Parallel with this phenomenon, (international)tourism in less developed countries became an attractivepossibility for economic development (Berno and Bricker,2001; Mbaiwa, 2003). Several works have been publishedabout the economic and multiplier effects of tourism expen-ditures (e.g. Wanhill, 1983; Frechtling and Horváth, 1999);however, the impacts of tourism industry are clearly unevenlydistributed. Differences appear in local, regional and interna-tional dimensions (Hall and Page, 2006).
Beyond the development of mass tourism in distantand exotic destinations, values of disappearing traditionallandscapes and lifestyles were discovered and launched intothe tourism arena. The past century’s massive industrialand socio-economic transformations implied a depreciationof traditional agricultural activities; hence, bringing aboutrapid changes in land use patterns (Ribeiro and Marques,2002; Mörtberg et al., 2007). The areas that are unsuccessfulin changing their agricultural profile and finding alternativefunctions are threatened with peripheralisation, populationloss and degradation of landscape (Weaver, 1995). Integratedand territorial approaches of European rural development(and the Common Agricultural Policy as well) urge diversifi-cation of rural activities and emphasise the role of alternativeactivities such as food processing, light manufacturing, arts,crafts and tourism in local economic development. The roleof tourism is crucial in this respect, because it has thepossibility to integrate a wide array of the above alternativeeconomic activities (Saxena and Ilbery, 2008) and from theperspective of society it gives at least odd job opportunitiesfor local people. Thus, tourism can be regarded as a comple-mentary activity in rural areas, contributing to economicdiversification (Tao and Wall, 2009).
Alternative tourism is often regarded as a promising formof economic activity in less favoured, rural areas. Due to itssmall-scale, a more interrelated liaison with the localeconomy and a logic that prioritises local interests (job crea-tion, retention of revenues and environmental sustainability),it is more suitable for local economic development thanmass tourism. (Wood, 1984; Dearden and Harron, 1993;Ribeiro and Marques, 2002). This presumption is affirmedby Cater (1993:85); Slee et al., (1997); Aubert (2001) andCsapó (2004), declaring that the local benefits of alternativetourism are likely to be greater than those arising fromconventional, large-scale tourism, particularly in peripheral,marginalised regions.
Geographic information system as a tool for landscapeanalysis and inventory assessmentLandscape evaluation began to gain importance from the2000s when it was revealed that the diversity of traditional cul-tural landscapes were threatened, and inventory programmeswere initiated to assess landscapes and monitor changes(Van Eetvelde and Antrop, 2009). Landscape visualisationand assessment are still used to communicate complexity of
Alternative Tourism Delimitation by GIS
Copyright © 2013 John Wiley & Sons, Ltd. Int. J. Tourism Res. (2013)
DOI: 10.1002/jtr

landscape structure and the direction of possible changesto community leaders or policy-makers (Sheppard, 2001).Initially, although there were many definitions, landscapequality was identical with landscape beauty (Daniel andVining, 1983), clearly focusing on the visual properties ofthe environment. Later, the complexity of landscapes wasemphasised, andmental, social and cultural attributes were alsotackled beyond physical reality; thus, signifying their holisticand dynamic nature (Antrop, 2000; Antrop and Van Eetvelde,2000; Tress et al., 2001; Van Eetvelde and Antrop, 2004).
A number of innovative approaches have appeared inland-use management, planning and inventory assessment.Quality assessments of natural, cultural and visual valuesand landscapes in general (e.g. Daniel, 2001; Dramstadet al., 2006) and in terms of alternative tourism (e.g. Bulutand Yilmaz, 2008; Lee et al., 2013) have been completed bysociological tools, such as questionnaires or interviews. Inour research, we used map layers as a basis of classificationcompleted by scientific expert experience, assessing actualtourism attraction points through an extensive field work.
Geographic information systems have become a key toolfor scientists dealing with environmental issues (Appletonand Lovett, 2003). The ability of GIS to integrate spatial datafrom different sources, formats or levels of resolution hasmade it ‘a powerful support to spatially distributed model-ling, particularly when working with models that integratemore than one process’ (Ghadirian and Bishop, 2008:226).The analysis of structural and functional changes oflandscapes with the help of satellite photographs and computergraphics begun in the 1970s (Myklestad and Wager, 1977).Since that time, many different methods and techniques havebeen developed (Ervin and Hasbrouck, 2001). Landscapeanalysis via GIS modelling is most commonly applied topresent changes in landscapes over time, as well as to helpdecision-makers designate different types of development –and restricted areas with demand – and change modelling.
On the other hand, GIS-based landscape evaluation is anefficient tool to assess the local potential of any activity thatdirectly or indirectly gains its resources from the landscape.Tourism is such an activity, and the potential resources tobe mapped are not only landscape aesthetics, but a multiplic-ity of other features that have geographical relevance. Thesefeatures can be visualised and evaluated with MCE methods,a widely used dimension of GIS applications.
Geographic information system as a tool has many poten-tials when applied in the field of tourism. On one hand, thereis a wide array of application to inform visitors about thegeographical location of different attractions, to provide itin-eraries or give answer for specific inquiries (Bíl et al., 2012).On the other hand, GIS is an efficient tool to support tourismdevelopment (Boyd et al., 1994) and decision-making due toits integrating capacity and aptness for participative proce-dures (Dye and Shaw, 2007).
In this paper, we dealt with the latter aspect and performeda multicriteria analysis for the Drava territory. The outcomeof MCE is most commonly a decision about the division ofa certain area into different land use forms. This kind ofevaluation is usually made in a case when landscapes arescarce and a decision has to be made between conflicting
uses (e.g. industrial, agricultural, recreational and environ-mentally protected areas) (e.g. Beedasy and Whyatt, 1999).
STUDY AREA
The study area of the project is the 40� 40-km wide beltstretching along both sides of Drava River, including a smallbit of Danube River bank (Figure 1). Being a border river,the Drava cuts the study area into a Hungarian and a Croatianpart. Despite differences in administrational delimitationsand data accessibility an identical methodology for theempirical research has been applied for both countries. TheHungarian part of the study area covers 14 230 km2 in thesouth-western part of the country, including Baranya,Somogy and Zala counties, whereas the Croatian part(Međimurska, Koprivni�cko-kri�zeva�cka, Viroviti�cko-podravska,Osje�cko-baranjska, Vara�zdinska, Bjelovarsko-bilogorska,Po�ze�sko-slavonska and Vukovarsko-srijemska counties)covers 16 757 km2. This paper contains the results for theHungarian side, touching upon Croatian insights only if it isnecessary for better comprehension or comparison.
Along the Drava River, both sides of the border area arehistorically peripheral, characterised by poor economicperformance. During the soviet era, both countries were subjectto socialist ideology; however, former Yugoslavia was not partof the Soviet ascendancy area. The whole area had a veryunfavourable position in terms of investment due to thegeo-political risks on the Hungarian side and the Yugoslavcivil war in the 1990s. The area is still representing anunderdeveloped and increasingly backward region withGDP per capita levels deep under the national averages(Croatia 73% (2006) and Hungary (72%) (2007); source:Hungarian Statistical Office and Croatian Statistical Office.)
The number of settlements on the Hungarian side is veryhigh (803 in a 14 231 km2 area), however, with remarkablyuneven distribution of population. A greater part (79.33%)of the settlements in this rural area has less than 1000 inhab-itants, hosting a total of 23.20% of the population of thewhole area. The majority of these villages have an ageingdemographic structure; the population is decreasing dramati-cally in most of the villages, and the education and adaptabilitylevel of the active population is relatively low. The distinctproblem in this size category is accompanied by the increasingratio of Roma population. In many cases, the expression‘inactive settlement’ has been coined where the overwhelmingmajority of the population has neither salary nor wage, butlives on different types of allowances (Hajdú, 2003). TheEuropean Union planning period and its funding round of2007–2013 has had little if any impact on the general state ofdevelopment in the region. Subsidies have been concentratedin urban areas leaving henceforward blank rural areas espe-cially close to the border.
The weak access to transport infrastructure in the region is tobe explained by its geographical as well as macro-regionallocation, being left intact by European mega-corridors andperipheral for south-eastern countries (Erdősi, 2003).Insufficient local road and rail infrastructure is also
V. Varjú, A. Suvák and P. Dombi
Copyright © 2013 John Wiley & Sons, Ltd. Int. J. Tourism Res. (2013)
DOI: 10.1002/jtr

a result of weak economic performance stemming from theborder side position.
Due to the above historical reasons, natural assetsremained in good state. From the 1990s, high attention hasbeen drawn to the natural protection in this area. On theCroatian side, Kopa�cki rit was designated on the list ofRamsar areas in 1993. On the Hungarian side, Danube-DravaNational Park (and Directorate) was established in 1996 topay high attention on the natural heritage. In the 2000s,between the two states, several attempts can be detected tocreate an extended common natural protection area;however, the conception is still an idea as economic interests(Croatia would like to build another hydroelectric station onthe Drava) hamper the feasibility. Despite all these –especially on the Hungarian side – several visitor centres,thematic (geological and biological) trails were establishedby the National Park Directorate to exhibit the naturalheritages of the region.
Tourism has a varying economic significance within thearea. The role of tourism is relatively high in the bigger citiesdue to their heritages (e.g. Pécs and Osijek). Some areas havehigher role due to wellness and bath sites (e.g. Harkány) orbeing a quality wine area (e.g. Villány-Siklós wine area)(Somogyi, 2003; Aubert et al., 2010). Owing to the adjacentdraining systems, to the level of pollution and to relativelyheavy water-borne freight, the Danube is less attractive forwater tourism, whereas on the Drava, one of the most pristinewaterways of Europe, water tourism is on the increase in co-operation with natural protection authorities. On DravaRiver, the traffic load of large motorboats is minimal due tostrict environmental protection and the lack of river regula-tion on the one hand and to water level fluctuation and bedmotion caused by the daily performance variability of waterpower plants situated on the upper sections of the river onthe other.
Protection of natural assets and biodiversity is essential inthis region. The Danube-Drava National Park established
along the two rivers is the largest protected area of nationalimportance in the region. Wetlands are ex lege protected;waters are continuously monitored under the umbrella ofthe European Water Framework Directive (EC 2000/60).Not only is the Drava under national natural protectionfore-and-aft on the Hungarian side. Almost 20% of the studyarea is Natura 2000 area, 6.6% is under high national protec-tion and 1.1% is under strict national protection totally closedfrom the public (Figure 1).
The preserved natural environment of the study areacreates a potential for alternative tourism, which is stillunexploited, supposedly due to the backward socio-economicsituation of the region. On the other hand, tourism develop-ment bears a risk of natural degradation and thus requirescareful consideration of investment activities.
MATERIALS AND METHODS
To support the decision-making process of regional tourismdevelopment and to delimitate thematic tourism zones, atwofold methodology was applied (Figure 2). On the basisof existing geographical approaches of landscape classifica-tion (Van Eetvelde and Antrop, 2009), Figure 2 shows themodel of the whole evaluation process. First, a complexlandscape assessment (CLA) was carried out (left side ofFigure2) on the basis of available geographical and landscapedata. The second pillar of the research (right wing of Figure 2)is an empirical assessment of 2077 actual attractions that weresurveyed during field work (see details in Appendixes A and B).Here, a CPV index was created that allows in-depth evaluationof the attraction capacity of different territories from the pointof view of different tourism target groups. A commonexamination of the two aspects allowed for a complex,in-depth analysis and results. Both the landscape evaluationand the CPV were developed to guide decision-makers in theallocation of development resources. Results help to identify
Figure 1. Protected areas in the study area.
Alternative Tourism Delimitation by GIS
Copyright © 2013 John Wiley & Sons, Ltd. Int. J. Tourism Res. (2013)
DOI: 10.1002/jtr

the most promising tourism segments in certain areas or inpreviously delimited tourism zones, in some cases proposingmodifications to the delimitation of the latter.
Landscape evaluationThe methodology of landscape evaluation, especially theweighting of different factors was developed on the basisof Gyuricza’s (1998) work. The landscape experiences, thescenery, the relief and its diversity are the most importantfactors for alternative tourism (Gyuricza, 1998). Satisfactionwith landscape view, place attributes have a positive influ-ence on revisit, recommendation hence on attractive potentialintentions (Prayag, 2012). Land use type, classification of the
protected areas, surface waters as landscape aestheticfeatures and recreational potential should also be taken intoconsideration (Lóczy, 2002; Szilassi, 2003). Therefore, inthe landscape evaluation, we used seven indicators shownin Table 1 as determining factors of the landscape from thepoint of view of alternative tourism. (All landscape andgeographical data were collected from respective authoritiesand public data sources.) Each factor has a scale of basicvalues derived from the actual geographical attributes ofthe analysed spatial units. The dissection index characterisesthe orography of the surface (Gyuricza, 1998) as an attractivefeature for alternative tourism. It is calculated as the rate ofrelative and absolute relief within one cell. Other landscape
Figure 2. The model of the evaluation processes.
V. Varjú, A. Suvák and P. Dombi
Copyright © 2013 John Wiley & Sons, Ltd. Int. J. Tourism Res. (2013)
DOI: 10.1002/jtr

attributes such as lake or river proximity, dominant land usecategory, presence of protected area or watching points wereinvolved in the evaluation as well.
The factors are weighted according to their importancefor alternative tourism. To make the weights as objective aspossible, we used Gyuricza’s (1998) classification as a basis.In the weighting process relating to relief, we usedGyuricza’s (1998) weight. In the case of water, watchingpoints and vegetation, we used lower weights then Gyuricza.The reason was that we also took into considerationprotected areas as a physical geographical attraction factorfor alternative tourism, and we intended to keep a balancedweighting between relief and other factors. As Gyuricza(1998) argued, relief is one of the most important factorsfor tourists as a ‘landscape experience’ and also relief deter-mines other factors (such as density of water-network andvegetation), which all form landscape scenery (Gyuricza,1998:178). In our research, protected areas also have a highimportance for some segments of tourists (cyclists, eques-trians and hikers); hence, the strength of the protection is alsoregarded. The closeness of surface waters (lakes and rivers)was also considered as a positive factor for alternativetourism. Waters were ranged in four size categories, thelarger size entailing higher value, assuming a more diverseselection of activities. In the assessment of the scenery, wetook into consideration the evaluation methods and valuesof aesthetic importance proposed in the work of Csemezand Kollányi (2010).
The spatial units of the analysis were defined as grid cellswith sides of 0.01º (= 36 arcsec.) resulting 11 584 rectanglesof approximately 1 km2. (Recently, several researchers use
this tool e.g. Gyuricza, 1998 or Van Eetvelde and Antrop,2009). Each cell received a complex landscape value basedon its geographical and landscape attributes multiplied withthe weights of Table 1. The Shuttle Radar TopographyMission collected data for creating a digital elevation model.This digital elevation model covers all landmasses on Earthbetween 60�N and 57�S. As an altitude database, the ShuttleRadar Topography Mission project was available withresolution level of 3 arcsec. These data are publicly availableat http://seamless.usgs.gov (Rabus et al., 2003; Blumberg,2006; Ehsani and Quiel, 2009). This finer grid has 12 pointsacross in both directions in our 36� 36 arcsec. ‘evaluationcells’. Every rectangular cell holds exactly 144 altitude points.The mean (absolute relief) and standard deviation (SD) (rela-tive relief) of these 144 values in each cell were categorisedin such a way that higher CLA index belongs to higher varietyof the surface (for detailed categorisation, see Table 1).
All data were referenced to the same geographic system(World Geodetic System 1984) and combined in a GIS usingMapInfo 9.5 software (Pitney Bowes Software Inc. OneGlobal View, Troy, NY 12180 USA).
Field researchFollowing the identification of the potential attractions(desktop research), each attraction was visited during fieldwork. (Additional attractions missing from the preliminarylist were identified in situ.) At local perception, the first taskwas to decide whether the attraction was proper as a potentialdestination or facility for alternative tourism or not. If yes, adata collection template (see in Appendix B) was filled outrecording the most important attributes of the attraction andphotos that were taken on site. Then, data recorded in thetemplate were digitalised. The template was the basis ofunified data collection and analysis. The whole databaseabout the attractions was built up by the data gained fromfieldwork, completed with geographical data (i.e. relief,hydrogeology and road-system).
A total of 2077 attractions were recorded; however, due totechnical issues, the final database consists of 3900 rows.This is a matter of data-recording – since in the case of twoquestions (type of attraction and target group), a total of threevariations of answers were possible, in some cases the samepoint is recorded in two or three variations.
Forty-five types of attractions were previously definedand grouped into seven categories (Appendix A). Twelvetarget groups were identified on the basis of existing classifi-cations (Jancsik et al., 2010), tailored to the specific featuresof the project: holiday making, ecotourists, hikers, cyclists,equestrian, water-based activities, hunters, cultural tourists,wine and food lovers, wellness, health treatment and incen-tive travel. The importance of the place was decided by thefield worker. A general guide described the categories ofimportance as seen in Table 2.
Categorisation (only in the case of catering and accommo-dation facilities) and state of condition reveal qualityconditions of the attractions. The assessment of points wascomprehensive, aided by a common guide for fieldworkers;however, due to the ‘human factor’, some degree of
Table 1. Landscape evaluation factors and weights
Factor* Basic values Weight Maximum point
1. Absolute relief 1–7 1 72. Relative relief 1–8 2 163. Dissection index 1–5 3 154. Watching points 0 or 10 1 105. Surface water 0–5 2 106. Relative evaluationof vegetation/land use
0–4 4 16
7. Protected areas 3–5 4 20
Note: Basic values of landscape analysis factors:1. Elevation: < 160m, 1 point; 160–180m, 2 points; 180–200m, 3 points;200–230m, 4 points; 230–260m, 5 points; 260–300m, 6 points; 300m<,7 points (here we can calculate with mean).2. If the m/km2 is 0–5m, 1 point; 6–10m, 2 points; 11–20m, 3 points;21–30m, 4 points; 31–50m, 5 points; 50–75m, 5 points; 76–100m, 7 points;101–145m, 8 points.3. Dissection index: the rate of relative and absolute relief in one cell. Ifthe rate is between: 0–0.05, 1 point; 0.05–0.1, 2 points; 0.11–0.2, 3 points;0.21–0.3, 4 points; 0.31–0.4, 5 points; 0.41<, 6 points.4. If there is not: 0 point, if there is: 10 points.5. Concerning Gyuricza (1998) classification and regarding the size of rivers.Lake size: small (< 10 km2), 3 points; medium (10–100 km2), 4 points; large(< 100 km2), 5 points.River size (catchment basin): small (10–100 km2), 1 point; medium(100–1000 km2), 2 points; large (1000–10 000 km2), 3 points; extra large(> 10000 km2), 4 points.6. Settlements; artificial surfaces (industrial, commercial units, mine, dumpand constructions sites), 0 point: cropland; agricultural areas, 1 point:vinery/garden, 2 points: pasture; meadow; wetland, 3 points: forest, 4 points;7. Protected areas: Natura 2000 areas, 3 points; National protected areas, 4points; National Park areas 5 points.
Alternative Tourism Delimitation by GIS
Copyright © 2013 John Wiley & Sons, Ltd. Int. J. Tourism Res. (2013)
DOI: 10.1002/jtr

subjectivity is possible in the case of the information that wasdrawn from the templates.
A large amount of information was gained from the tem-plates and allowed for extensive descriptive statistical analysis.
Evaluation of the attractions based on targetgroup preferencesThe underlying aim of the entire analysis was to appointcertain territorial units (i.e. tourism zones) that have develop-ment perspectives for certain well defined target groups.Generally viewing the assessed points, no areas of heavierconcentration can be detected. However, it was supposed thata distinction of attractions along target groups would entailstronger concentration areas, facilitating the adjustment oftourism sub-regions to existing potentials. For this deeper andmore sophisticated method, a description of each of the 12target groups’ preferences was applied (Jancsik et al., 2010).
The evaluation took into consideration existing tourismdevelopment strategies and theoretical tourism zones in theregion. The classification (Aubert et al., 2010) that was abasis in this project classified the region into 11 tourismsub-regions and rendered a leading tourism product to eachof them (see details in the result section). This classificationis a useful guideline in specifying potential developmentareas; however, as it comes out later in this evaluation, insome cases the borders of sub-regions (Final Report IPARTPP HUHR, 2011, based on Aubert’s work) divide impor-tant concentration areas of tourism attractions. Thus, thisclassification is used in the evaluation, but later some modi-fications are proposed to it as a result of the CPV assessment.
The evaluation of attractions summarises all availablequalifying information for each assessed attraction and unitesthem in a CPV of different territorial units. A large part ofthis information was gained from the template, another partfrom basic GIS maps and other external sources of informa-tion. (In the concept of CPV, complexity refers on one handto the large variety of information [physical, geographicaland infrastructural] assessed for each attraction, and, on theother, the distinction of the importance of attributes fromthe viewpoint of each target group.)
On the basis of the above described information, ‘qualityfactors’ were produced. The factors are identical for eachobserved attraction and each target group. The basic valuesof each ‘quality factor’ move along a scale, according to thespecific attributes of the observed points. For example, thebasic values for the quality factor of ‘importance’ will be 1 ifimportance is ‘local’, 2 if ‘regional’, 3 if ‘national’ and 4 if‘international’. The basic value is multiplied with a weightaccording to the preferences of the different target groupsdefined before. The same quality factors will have different
weights in the case of different target groups using a 1–5 scale,where 1 shows very small preference, whereas 5 meansvery strong preference. 0 means total inadequacy. (For thebasic values and weights, see Appendix B) Weights werestandardised so that the sum of weights is identical for everytarget group. Thus, the final value – the CPV – of a certain at-traction will be the basic value multiplied with the standardisedweights according to the preferences of the given target group.
RESULTS
Landscape analysisThe complex landscape values of the grid cells were illustratedin dot density maps. The values each cell could receive variedbetween 6 and 75 points (with mean = 25.2 and SD=13.1).Figure 3 shows the final result of the landscape evaluation.
High values based on CLA belong to cells located inmountainous areas. Besides, the hilly areas high scores(typically with 40–50 scores) can be found in the Dravaand Danube river banks. Five areas (23 grid cells) can beidentified that received scores above 60. Among these, threeare located in the forestry Mecsek mountain bearing the stateof national and international (Natura 2000) level of naturalprotection. One area is also in a mountainous area (Villánymountain) with a special micro-climate, also a high level ofnatural protection with endemic, ecologically unique species.The fifth area is lying along the river bank of Drava. Manyparts of the Drava bank are nationally protected, coveredby forests. The reason for mountainous areas receiving thehighest scores is that in the method the mountainous attri-butes appear with three factors (absolute relief, relative reliefand dissection index), whereas others, e.g. water relativeness,with only one. The reason was that dissection, as a natural-related landscape view, was considered as more attractivefor alternative tourism (Gyuricza, 1998) and in a mountain-ous area attractions and outdoor activity types (trekking,hiking, mountain biking, horse riding, ecotourism, etc.) aremore diverse than near waters (Jancsik et al., 2010).
Descriptive statistics about attractionsThe descriptive statistical analysis itself revealed somediscrepancies in the tourism supply of the region. Theoverwhelmingly large proportion of observed attractions isonly of a local importance. The region’s endowment withnationally or internationally important attractions is markedlyweak. The distribution of the attractions is quite even in thecase of attractions, and, on the contrary, there are remarkablyfew services linked to attractions (e. g. boat or bicycle rentals).The most frequently mentioned target groups for the observedattractions were cultural tourists, holiday makers, cyclists,hikers and ecotourists. This fact is favourable from the pointof view of nature-related tourism, but may also indicate thatthe region is not characteristic of any target groups of a higherlevel of specialisation.
The accessibility of attractions is good; however, publictransportation service needs to be improved (Table 3).Almost all of the attractions can be reached on low trafficroads or bicycle roads (90% of the attractions are available
Table 2. Distinction of importance ranks
Importance Description
* Local Visit if you are there** Regional Worth a detour*** National Main attraction of a destination –
it is worth to go only for this attraction**** International Worth to go only for this attraction
V. Varjú, A. Suvák and P. Dombi
Copyright © 2013 John Wiley & Sons, Ltd. Int. J. Tourism Res. (2013)
DOI: 10.1002/jtr

easily by bicycle, 8% of them can be reached with difficultiesand 2% of them are not available by bicycle, based on fieldwork experience). Sites were reckoned ‘not available’ bybus, train or car if they did not have bus stop, railway stationor parking place within 1-km radius. They are generally situ-ated in mountainous areas (in Mecsek and in Zala Hills) andalongside the Drava River. Surprisingly, there are certainareas where low traffic roads or cyclist routes are available,but there are no attractions dedicated to cyclists to reach onthese routes. Another discrepancy occurs at the Drava bankin the Baranyai Drávamente tourism zone (Figure 4), wherethe majority of boat ports are located, but there are nocatering facilities nearby the sport boat ports. Results alsoreveal that alongside Drava River there are several ports withno ‘accessibility’. These are small boat ports that can behardly reached by community transport or even by car. Theycan be reached on foot or by boat, or by car on cart-roads.
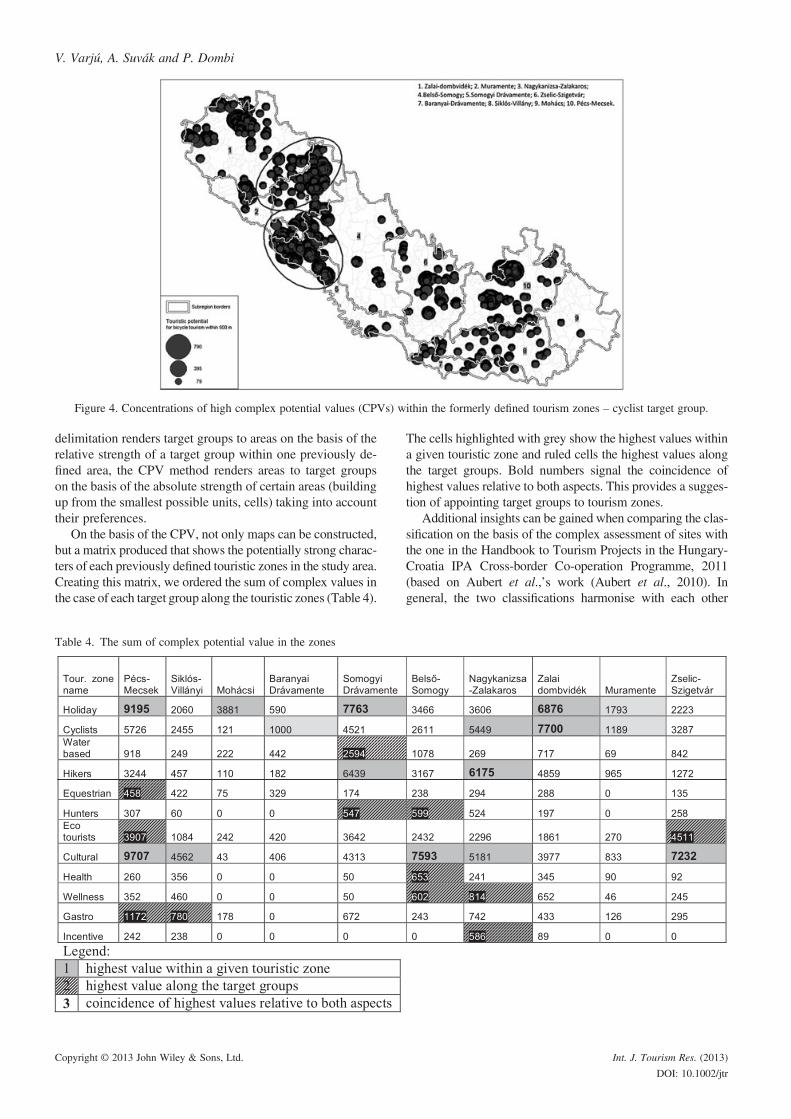
Complex evaluation based on target group preferences –complex potential valueThe results of the target group preference evaluation are12 target group tables. Each attraction in the tables has aCPV based of a certain target group preference. On the basisof these complex values, the target group specific tourismpotential of a certain area can be assessed. To have a veryrefined picture, the areas for which CPVs are summarised
are 500-m radius, overlapping circles. The centres of circlesare set on a 100� 100-m grid network. The value of a circlecentre is the sum value of complex values of observed attrac-tions within the 500-m radius circle.
For the visualisation of the CPVs allocated to the 500-mradius circles, graduated maps were used where the size ofthe bubbles refers to the strength of a given circle centre.The 12 maps produced for the target groups reveal that,despite the very even distribution of undistinguishedattractions, when regarding only the attractions dedicated tothe certain target groups, and with the calculated potentialattractiveness value described above, intensive and charac-teristic concentration areas can be found in the case of alltarget groups.
The maps also have important implications for the prelim-inary specification of tourism zones/sub-regions (whiteborderlines on Figure 4). Strikingly, some previously definedtourism zone borders indeed split important concentrationareas for almost all of the target groups. An example of thiscan be seen on Figure 4 in the case of bicycle tourism. Thisdelimitation of previously defined tourism sub-regions wasbased on statistic data (accommodation capacity andperformance data, local tourism tax), tourism networks anddevelopment activity, decisive tourism products and presentattractions (Aubert et al., 2010). The delimitation was alsobased on extensive consultation among local stakeholders,local governments and tourism experts (Handbook toTourism Projects in the Hungary-Croatia IPA Cross-borderCo-operation Programme, 2011) – this in turn bears thethreat of the picture being distorted by subjective interests.Impoundment of these sub-regions took into considerationthe peculiarities of the ecotourism activities i.e. cycling-related, equestrian-related, water-based related and hiking-related development possibilities. We argue that using theCPV method we can refine and redraw the delimitation ofthe area, allowing for more homogenous and suitable tourismzones for the specific target groups. Although the former
Figure 3. Map of complex geographical landscape assessment (CLA) with protected areas.
Table 3. Accessibility of attractions by car and by communitytransport
Accessibility of pointsAccessibility by community
transport
No Yes TotalAccessibility by car No 58 3 61
Yes 256 1751 2007Total 314 1754 2068
Note: Information not available in case of 9 points.
Alternative Tourism Delimitation by GIS
Copyright © 2013 John Wiley & Sons, Ltd. Int. J. Tourism Res. (2013)
DOI: 10.1002/jtr
delimitation renders target groups to areas on the basis of therelative strength of a target group within one previously de-fined area, the CPV method renders areas to target groupson the basis of the absolute strength of certain areas (buildingup from the smallest possible units, cells) taking into accounttheir preferences.
On the basis of the CPV, not only maps can be constructed,but a matrix produced that shows the potentially strong charac-ters of each previously defined touristic zones in the study area.Creating this matrix, we ordered the sum of complex values inthe case of each target group along the touristic zones (Table 4).
The cells highlighted with grey show the highest values withina given touristic zone and ruled cells the highest values alongthe target groups. Bold numbers signal the coincidence ofhighest values relative to both aspects. This provides a sugges-tion of appointing target groups to tourism zones.
Additional insights can be gained when comparing the clas-sification on the basis of the complex assessment of sites withthe one in the Handbook to Tourism Projects in the Hungary-Croatia IPA Cross-border Co-operation Programme, 2011(based on Aubert et al.,’s work (Aubert et al., 2010). Ingeneral, the two classifications harmonise with each other
Figure 4. Concentrations of high complex potential values (CPVs) within the formerly defined tourism zones – cyclist target group.
Table 4. The sum of complex potential value in the zones
V. Varjú, A. Suvák and P. Dombi
Copyright © 2013 John Wiley & Sons, Ltd. Int. J. Tourism Res. (2013)
DOI: 10.1002/jtr

although, in some cases, there are some important differencesin the dedication of a certain tourism sub-region to a tourismtarget group. Remaining at the example for cyclists, Table 4indicates that the areas that bear the highest importance fromtheir point of view are Zalai-dombvidék, Muramente,Nagykanizsa-Zalakaros and Somogyi Drávamente. This is incontradiction with the Aubert classification that sees develop-ment potential for the cyclist target group in different tourismzones (Table 5).
The CPV of attractiveness allows for another implication.Comparing the CPV with the sum of importance ranks(described in Appendix A) the attractions have received withina certain touristic sub-region and with regard to target groups,the development perspectives of different sub-regions can bederived. Importance ranks can be regarded as the present stateof development of the attractions and the CPV as the potentialattractiveness from the point of view of a target group. If lowlevel of importance accompanies with a high level of the com-plex value, it implies that the supply is not well developedenough compared with its potential, and there are good pros-pects for further development.
DISCUSSION
Multicriteria landscape evaluation is an important resourcefor the support of tourism development decisions, also in
the case of alternative tourism i.e. considered a viable andadmissible development sector in marginalised and environ-mentally sensitive areas. MCE methods are capable of tack-ling complexity that inevitably arises when different interest,preferences and viewpoints are conflicted.
The first and foremost issue that can be interesting todiscuss in this paper is the wider applicability or generalisa-tion of the methods used. The complex landscape evaluationand the evaluation applying tourism target group/segmentpreferences is of particular interest here, the former beingtailored and improved for the special attributes of theresearch field and the latter developed within this project.Both methods aimed to aid the appointment of potentialtourism development zones. CLA successfully combinedthree existing approaches, enriching the outcome withfavourable attributes:
(1) objectivity: the data used are derived from geographicaland landscape attributes via map layers;
(2) flexibility: the weights can be modified thus the methodcan be fine-tuned to more specific needs of certain targetgroups or areas; and
(3) refinement: the density of grid cells allows a thoroughmeasurement of the physical attributes of the landscape.
The CLA can give opportunity to appoint areas, whichbear the highest landscape values, thus the best potentialsfrom the viewpoint of alternative tourism in general.
Table 5. Sub-regional product matrix.
Alternative Tourism Delimitation by GIS
Copyright © 2013 John Wiley & Sons, Ltd. Int. J. Tourism Res. (2013)
DOI: 10.1002/jtr

The evaluation based on target group preferences has thesame advantage of flexibility due to the weights given toeach of the attributes. The main difference is that in this casethe actual information on tourism superstructure and attrac-tions were taken into consideration. The field work that gavethe basis of information gathering was spatially comprehen-sive; however, it focused on alternative tourism, thus well-ness, health, hunting or incentive tourism were to somedegree neglected parts of the assessment. The evaluationbased on target group preferences applied the informationgained from the CLA, promoting a geographical evaluationof the region on the basis of a wide range of factors. Thebenefits of applying target group preferences, combined withinformation about the actual tourism superstructure and thelandscape are unambiguous, considering that the formerlyeven-looking distribution of attractions and tourism super-structure turned to have clear concentration areas, almost inall cases of the target groups. This, i.e. concentration areasbeing revealed for different target groups allowed for a spec-ification of tourism regions and an attachment with adequatetourism products. Since there already exists such a specifica-tion (Aubert et al., 2010), a comparison has been carried out,and this revealed some discrepancies between the two. It isimportant that the existing classification used a large amountof statistical data regarding the tourism sector (e.g. accom-modation capacity and performance data and local tourismtax), whereas the present assessment based on field workobservation and took into consideration physical attributes,aesthetic values and infrastructural/accessibility conditionof the attractions. Because of the data structure, Aubertet al., (2010) could only use the settlement (administrativeborder) as an evaluation unit. However, in our methodologyin both – CLA and CPV – methods the grid cells and concen-tration circles as a geographical basis allowed for a moreflexible application for any kind of geographical area orany territorial delimitation.
The differences between the two specifications touchupon both the delimitation and the association of tourismsub-regions with specific tourism products and targetgroups. This implies a necessity for the reconsideration ofexisting tourism sub-region delimitations. Although thereare differences between the Aubert et al., (2010) methodol-ogy and our presented analysis, we argue that the former,based on supply and demand parameters and our assess-ment based on physical, geographical, cultural (land use)attributes and target group preferences complementeach other.
Beside all these, the analysis revealed some innerweaknesses of the region, namely the lack of necessarytourism superstructure at possibly important attractions, theuncoordinated and sometimes oversized support of cateringand accommodation facilities that seem to disregard thespatial allocation of important sights, as well as the very poorendowment of public transportation facilities and the lowquality of roads. The latter handicaps might as well be curedwith the development of alternative means of connection,facilitating active means of alternative transport in tourism,e.g. cycling, horse riding, hiking and paddling. These activi-ties are themselves important branches of alternative tourism,
at the same time they can operate as important means toconnect attractions in a string.
In this paper, we applied MCE to demonstrate theattractiveness of areas for different tourism target groups.We presumed that all types of areas and land uses can havesome degree of attractiveness for different types of tourists.Additionally, we did not exclude the possibility of a certainarea being developed for a multiplicity of target groups. Thismeans that more than one outcome is possible for each terri-tory, and they can be developed in parallel. This is plausibleregarding the fact that rural tourism embraces a wide array ofactivities, and a critical mass of visitors is usually achievableonly if targeting is made into several tourism segments. Theunderlying principle of sustainability and targeting within thesphere of alternative tourism decreases the possibility ofconflicting targeting. The method can be also used if a choicehas to be made between the developments of certain types oftourism within an area.
The multicriteria analysis performed on the attractionsincluded among others their importance, state of conditionand accessibility. CPV also contained the outcome of thelandscape evaluation, since natural landscapes and theirattributes are an important resource for the types of alterna-tive tourism. CPV values are calculated for each pre-definedtarget groups on the basis of their presumed preferences.Thus, the same attraction point can bear high CPV for morethan one target groups. The visualisation of CPVs of tourismattraction points indicates concentration areas of pointsattractive for different target groups, allowing the delimita-tion of tourism zones or the comparisons with existingdelimitations and targeting.
It is common in GIS-based landscape evaluation thatthe analysed area is divided into identical areas or patches,e.g. squares on a 100� 100-m grid. As novelty of theanalysis besides grid-based assessment, we summarisedand analysed the values of landscape in 500-m radius,and the maps reveal these values after categorising themin orders of magnitude.
For researchers, the presented methodologies of landscapeevaluation can be applied, beyond delimitation for differenttypes of tourism, for other aspects of regional developmentand land-use management. The methods are suitable todetect changes of natural and cultural landscape charactersover time.
CONCLUSION
The challenge of tourism development of a marginalisedregion (as in the Drava region) has been a long debatedissue. The potentials are grounded upon the natural assetsof the area. However, economic and social marginalisation,the scattered pattern of moderately attractive sights and thelack of coordination of tourism supply activities haveinhibited the breakthrough of touristic utilisation of theregion. The poor transportation accessibility increases theremoteness of the area. However, this can be an advantagefor nature-related tourism. The permeability of the regionand the accessibility of tourism attractions can be enhanced
V. Varjú, A. Suvák and P. Dombi
Copyright © 2013 John Wiley & Sons, Ltd. Int. J. Tourism Res. (2013)
DOI: 10.1002/jtr

by thorough organisation and the provision of elementaryinfrastructure for equestrian tourism, cycling, hiking andpaddling. The resolving of the scatteredness of attractionsand the smooth operation of alternative transportationmodes both demand strong coordination.
Due to the flexibility of the two methods developed in thisproject, they can be applied for the spatial appointment oftouristic investments, once the overall strategy for the wholeregion is prepared. The methods provide important comple-ments (and in some cases even challenge) for the existingdelimitations of tourism zones. A complex and comprehen-sive approach are needed during the planning to ensure
coordination, synergies and the channelling of economicbenefits and achievements throughout the region.
Strong sustainability in tourism is a crucial concern(Butler, 1993; Dearden and Harron, 1993; Prosser, 1994;Hunter, 1997; Garrod and Fyall, 1998; Fennell, 2002; Stemet al., 2003). For sustainable tourism development landscape,a complex assessment that considers tourism segmentpreferences as well as physical geographical aspects asnatural resources of aesthetics is essential. Therefore, weargue that the two presented methods should be used ascomplementary so that they entail a responsible approachof tourism development.
APPENDIX AThe distribution of assessed attractions among types
Categories Type of attractions Assessed points
Tourism suprastructure Hotels, pensions and similar 168Campsites 38Private accommodation 191Other accommodation types 84Wine cellars 34Important restaurants 168Other catering 111
Attractions Important churches 377Pilgrimage sites 1Castle/residency/manor/mansion/ruin 94Other built cultural sights 347Flora-related natural sights 89Fauna-related natural sights 26Landscape and geological formation-related natural sights 61Museums and exhibitions 134Craftsman workshop 31Study trail and forest schools 31Events 39Fishing points 109Hunting points 12Openside bathing points/potential ice skating points 20Organised trips (with starting points specified) 14Thematic parks 7Extreme sport sites 6
Services Sports-grounds/fitness/wellness centres (without accommodation) 69Bath/Spa 33Horse riding ranches 30Sports or touring equipment rentals 13
Other Ports 19Ferry boat point 3Bridges 4Bicycle resting basis/point with facilities 10Other 33
Route points Resting place 105Shelter 10Well/fount 13
Routes Walking/tracking routes 10Bicycle routes 5Horse riding routes 2Pilgrim or other thematic routes 1Other thematic routes 4
Areas Wine routes/areas 4Spectacular view of a street (more than one buildings) 2Landscape 2Visual pollution 12
Alternative Tourism Delimitation by GIS
Copyright © 2013 John Wiley & Sons, Ltd. Int. J. Tourism Res. (2013)
DOI: 10.1002/jtr

APPENDIX BBasic values and weights of qualifying factors based on the preferences of target groups
Targetgroups
Categorization ofhotels andrestaurants
Importance/significance ofaccommodations
Importance/significance of
catering
Importance/significance of
cultural attractionsImportance/significance of
natural attractions
Importance/significance offishing points
Basicvalues
* = 1, ** = 2,*** = 3, **** = 4,
***** = ,
Local = 1,regional = 2,national = 3,
international = 4
Local = 1,regional = 2,national = 3,
international = 4
Local = 1,regional = 2,national = 3,
international = 4Local = 1, regional = 2,
national = 3, international = 4
Local = 1,regional = 2,national = 3,
international = 4
WeightsIncentivetravel
5 5 5 4 3 0
Healthtreatment
5 5 5 2 3 0
Wellness 5 5 5 3 3 0Wine andfoodlovers
5 5 5 3 3 0
Culturaltourists
4 4 4 5 4 0
Hunters 5 5 5 0 4 0Water-basedactivities
3 3 3 3 5 3
Equestrian 5 5 5 3 5 0Cyclists 3 3 3 4 5 0Hikers 3 3 3 2 5 0Ecotourists 3 3 3 3 5 0Holidaymaking
3 3 3 4 4 2
Targetgroups
State of condition Access by car Access bycommunitytransport
Access by bike Location in protected area Absolute relief
Basicvalues
untended = 1,average = 2, wellmaintained = 3
no = 0, yes = 1 no = 0, yes = 1 1 = not accessible,2 = hardly, 3 =withdifficulty, 4 = easily
0 = not protected, 3 =Natura2000, 4 = national protected,
5 = national park
Actual relief/200
WeightsIncentivetravel
5 5 3 1 3 2
Healthtreatment
5 5 3 0 2 2
Wellness 5 5 3 0 1 1Wine andfoodlovers
5 4 4 2 4 3
Culturaltourists
5 4 4 3 5 4
Hunters 5 5 0 0 5 3Water-basedactivities
5 5 1 0 5 1
Equestrian 5 4 0 0 5 3Cyclists 4 3 4 5 4 51/Hikers 3 3 5 1 5 5Ecotourists 3 3 5 4 5 4Holidaymaking
5 4 4 3 4 3
*Note: Cultural attractions are the following: important churches, pilgrim sites, castle/residency/manor/mansion/ruin, other built cultural sights,museums and exhibitions, craftsman workshop, events, and thematic parks.**Natural attractions are the following: flora-related natural sights, fauna-related natural sights, landscape and geological formation-relatednatural sights, study trail and forest schools and organised trips (with starting points specified).***Sport sites are the following: openside bathing points/potential ice skating points, extreme sport sites, sports-grounds/fitness/wellnesscentres (without accommodation) and sports or touring equipment rentals
V. Varjú, A. Suvák and P. Dombi
Copyright © 2013 John Wiley & Sons, Ltd. Int. J. Tourism Res. (2013)
DOI: 10.1002/jtr

Importance/significance ofsport sites
Importance/significance of
bath/spaImportance/significance of
horse riding ranchesImportance/significance of
bicycle resting points
Importance/significanceof other resting place,shelter and well/fount
Importance ofhunting points
Local = 1,regional = 2,national = 3,
international = 4
Local = 1,regional = 2,national = 3,
international = 4Local = 1, regional = 2,
national = 3, international = 4Local = 1, regional = 2,
national = 3, international = 4
Local = 1, regional = 2,national = 3,
international = 4
Local = 1,regional = 2,national = 3,
international = 4
4 5 2 0 0 0
2 5 0 0 0 0
2 5 0 0 0 0
0 2 0 1 3 0
0 2 0 0 3 0
0 1 0 0 0 5
2 3 0 0 3 0
2 1 5 0 3 0
2 1 0 5 4 0
2 1 0 0 5 0
0 1 0 2 5 0
3 4 2 2 2 0Type of lakewithin 1 km
Type of riverwithin 1 km
Land use Type of road within 1km
1–4 according tolargest lake size,0
if none
1–4 according tolargest river size,
0 if none
Artificial = 1, cropland = 2,vineyard/garden = 3,
meadows, wetlands = 4,forest = 5
High speed/motorway = 4, firstcat road = 3, second catroad = 2, bypass/service
road=1
2 2 1 5
1 1 1 5
1 1 1 53 3 3 4
4 4 5 4
1 1 5 55 5 5 5
3 3 5 43 3 5 51/2 2 5 35 5 5 34 4 4 4
Alternative Tourism Delimitation by GIS
Copyright © 2013 John Wiley & Sons, Ltd. Int. J. Tourism Res. (2013)
DOI: 10.1002/jtr

ACKNOWLEDGEMENTS
This research has been founded by the Regional TourismProduct Plan of the Hungary-Croatia IPA Cross-border Co-operation Programme 2007–2013 (HUHR/0901/1.2.1/0002), co-financed by the European Union in the frameworkof the aforementioned programme. We are especially gratefulto the colleagues who helped the research by participating inthe field work.
REFERENCES
Antrop M. 2000. Background concepts for integrated landscapeanalysis. Agriculture, Ecosystem and Environment 77(1-2):17–28.
Antrop M, Van Eetvelde V. 2000. Holistic aspects of suburbanlandscapes: visual image interpretation and landscape metrics.Landscape and Urban Planning 50(1-3): 43–58.
Appleton K, Lovett A. 2003. GIS-based visualisation of rural land-scapes: defining‘sufficient’ realism for environmental decision-making. Landscape and Urban Planning 65: 117–131.
Aubert A. 2001. A turizmus és a területfejlesztés kapcsolataMagyarországon. [The connection between tourism and regionaldevelopment In Hungary.] Turizmus Bulletin 5(1): 29–35.
Aubert A, Csapó J, Pirkhoffer E, Puczkó L, Szabó G. 2010.A method for complex spatial delimitation of tourism destina-tions in South Transdanubia. Hungarian Geographical Bulletin59(3): 271–287.
Beedasy J, Whyatt D. 1999. Diverting the tourists: a spatialdecision-support system for tourism planning on a developingisland. International Journal of Applied Earth Observation andGeoinformation 1(3-4): 163–174.
Berno T, Bricker K. 2001. Sustainable tourism development:the long road from theory to practice. International Journal ofEconomic Development 3(3): 1–18.
Bíl M, Bílová M, Kube�cek J. 2012. Unified GIS database on cycletourism infrastructure. Tourism Management 33: 1554–1561.
Blumberg DG. 2006. Analysis of large Aeolian (wind-blown)bedforms using the Shuttle Radar Topography Mission (SRTM)digital elevation data. Remote Sensing of Environment 100(2):179–189.
Boxill I. 2004. Towards an alternative tourism for Jamaica. Interna-tional Journal of Contemporary Hospitality Management 16(4):269–272.
Boyd SW, Butler RW, Haider W, Perera A. 1994. Identifying areasfor ecotourism in northern Ontario: application of a geographicinformation system methodology. Journal of Applied RecreationResearch 19(1): 41–66.
Briassoulis H. 2002. Sustainable tourism and the question of thecommons. Annals of Tourism Research 29(4): 1065–1085.
Bulut Z, Yilmaz H. 2008. Evaluation of natural, cultural and visualvalues in terms of alternative tourism in the example ofKemaliye (Erzincan/Turkey). International Journal of Naturaland Engineering Sciences 2(2): 13–20.
Bunruamkaew K, Murayama Y. 2012. Land use and naturalresources planning for sustainable ecotourism using GIS in SuratThani, Thailand. Sustainability 4(3): 412–429.
Butler RW. 1993. Tourism – an evolutionary perspective. In NelsonJG, Butler R, Wall G. (eds.) Tourism and Sustainable Develop-ment: Monitoring, Planning, Managing. University of Waterloo:Waterloo, Ontario; 27–44.
Cater E. 1993. Ecotourism in the third world: problems for sustain-able tourism development. Tourism Management 14(2): 85–90.
Cater E. 1994. Introduction. In Cater E Lowman G (eds).Ecotourism. A Sustainable Option? John Wiley and Sons:Chichester; 3–17.
Cazes G. 1986. Le tourisme alternative: reflexion sur un conceptambigu. Problems of Tourism/Problemy Turistiky 10(3): 18–24.
Csapó J. 2004. A területfejlesztés és a turizmus rendszereírországban. [Regional development and the system of tourismdevelopment in Ireland.] Turizmus Bulletin 8(1): 49–55.
Csemez A, Kollányi L. 2010. Az egyedi tájértékektől a táji értékekkataszterezéséig. [Cadastration of unique landscape values andlandscape features.] Falu, város, régió 17(2-3): 116–125.
Curtin S, Busby G. 1999. Sustainable destination development:the tour operator perspective. International Journal of TourismResearch 1(2): 135–147.
Daniel TC. 2001. Whither scenic beauty? Visual landscape qualityassessment in the 21st century. Landscape and Urban Planning54: 267–281.
Daniel TC, Vining J. 1983. Methodological issues in the assessmentof landscape quality. In Altman I Wohlwill J (eds). Behavior andthe Natural Environment. Plenum press: New York; 39–84.
Dearden P, Harron S. 1993. Alternative tourism and adaptivechange. Annals of Tourism Research 21: 81–102.
Dowling RK, Fennell DA. 2003. The context of ecotourismpolicy and planning. In Fennell DA, Dowling RK. (eds).Ecotourism Policy and Planning. CAB International: Wallingford,UK; 1–20.
Dramstad WE, Sundly Tveit M, Fjellstad WJ, Fry GLA. 2006.Relationships between visual landscape preferences and map-based indicators of landscape structure. Landscape and UrbanPlanning 78: 465–474.
Dye AS, Shaw S-L. 2007. A GIS-based spatial decision supportsystem for tourists of Great Smoky Mountains National Park.Journal of Retailing and Consumer Services 14: 269–278.
Ehsani AH, Quiel F. 2009. A semi-automatic method for analysis oflandscape elements using Shuttle Radar Topography Missionand Landsat ETM+data. Computers and Geosciences 35(2):373–389.
Erdősi F. 2003. Transport in South Transdanubia. In Hajdú Z, PálnéKovács I (eds). Portrait of South Transdanubia: a region in tran-sition. Hungarian Academy of Sciences. Centre for RegionalStudies: Pécs; 27–37.
Ervin SM, Hasbrouck HH. 2001. Landscape Modeling: DigitalTechniques for Landscape Visualization. McGraw-Hill:NewYork; London.
Fennell DA. 1999. Ecotourism. An Introduction. Routledge: London.Fennell DA. 2002. Ecotourism Programme Planning. CABI
Publishing: Wallingford.Final Report IPA RTPP HUHR. 2011. Manuscript. Pannon Univer-
sity: Veszprém.Frechtling DC, Horváth E. 1999. Estimating the multiplier effects of
tourism expenditures on a local economy through a regional in-put-output model. Journal of Travel Research 37(4): 324–332.
Garrod B, Fyall A. 1998. Beyond the rhetoric of sustainable tour-ism? Tourism Management 19(3): 199–212.
Ghadirian P, Bishop ID. 2008. Integration of augmented reality andGIS: a new approach to realistic landscape visualisation. Land-scape and Urban Planning 86: 226–232.
Graburn NHH. 1989. Tourism: the sacred journey. Amith VL (ed.).Hosts and Guests: The Anthropology of Tourism. University ofPennsylvania Press: Philadelphia; 21–36.
Gulinck H, Vyverman N, Bouchout VK, Gobin A. 2001. Landscape asframework for integrating local subsistence and ecotourism: a casestudy in Zimbabwe. Landscape and Urban Planning 53(1-4):173–182.
Gyuricza L. 1998. Természeti és társadalmi adottságok idegenforgalmiszempontú értékelése és complex turisztikai kiskörzetek kialakításanyugat-zala példáján. [Touristcal evaluation of physical and socialgivens and creation of complex touristic micro-regions; the case ofWestern-Zala.] Földrajzi Értesítő 48(2): 173–187.
Gyuricza L. 2008. A Turizmus Nemzetközi Földrajza. [The Interna-tional Geography of Tourism.] Dialóg Campus: Budapest-Pécs.
Hajdú Z. 2003. The settlement network. In Hajdú Z Pálné Kovács I(eds). Portrait of South Transdanubia: A Region in Transition.
V. Varjú, A. Suvák and P. Dombi
Copyright © 2013 John Wiley & Sons, Ltd. Int. J. Tourism Res. (2013)
DOI: 10.1002/jtr

Hungarian Academy of Sciences, Centre for Regional Studies:Pécs; 27–37.
Hajnal K. 2006. A fenntartható fejlődés elméleti kérdései ésalkalmazása a településfejlesztésben. [Theoretical questionsand application of the sustainable development in urban devel-opment.] PhD Dissertation. University of Pécs: Pécs, http://foldrajz.ttk.pte.hu/tarsadalom/letoltes/teljes_szerkesztett_1.3.pdf[accessed 14 July 2011].
Hall DR. 1998. Tourism development and sustainability issues incentral and south-eastern Europe. Tourism management 19(5):423–431.
Hall CM, Page SJ. 2006. The geography of tourism and recreation.Environmnent, place and space. Third edition. Routledge:London.
Handbook to tourism projects in the Hungary-Croatia IPA cross-border Co-operation Programme (2011). EU Joint MonitoringCommittee, Decision No 32/2011 http://www.hu-hr-ipa.com/up-loads/editors/Handbook%20to%20Tourism%20Projects.pdf[accessed 18 July.2012].
Hetzer ND. 1965. Environment, tourism, culture. LINKS (July)(Reprinted in Ecosphere (1970) 1(2): 1–3.
Hunter C. 1997. Sustainable tourism as an adaptive paradigm.Annals of Tourism Research 24(4): 850–867.
Jancsik A, Mayer P, Pénzes E. 2010. Lifestyle Segmentation.Manuscript. Pannon University: Veszprém.
Lanfant MF, Graburn NH. 1992. International tourism reconsidered:the principle of the alternative. In Smith V, Eadington W (eds).Tourism Alternatives. University of Pennsylvania Press:Philadelphia; 88–112.
Lee S-H, Choi J-Y, Yoo S-H, Oh Y-G. 2013. Evaluating spatialcentrality for integrated tourism management in rural areasusing GIS and network analysis. Tourism Management 34(1):14–24.
Lóczy D. 2002. Tájértékelés, Földértékelés. [Landscape Evaluation,Land Evaluation.] Dialóg Campus: Budapest-Pécs.
Mbaiwa JE. 2003. The socio-economic and environmental impactsof tourism development on the Okavango Delta, north-westernBotswana. Journal of Arid Environments 54: 447–467.
McLaren D. 1998. Rethinking Tourism and Ecotravel: The Pavingof Paradise and What you can do to Stop it. Kumarian Press:Connecticut.
Mörtberg UM, Balfors B, Knol WC. 2007. Landscape ecologicalassessment: a tool for integrating biodiversity issues in strategicenvironmental assessment and planning. Journal of Environ-mental Management 82(4): 457–470.
Myklestad E, Wager JA. 1977. PREVIEW: computer assistancefor visual management of forested landscapes. Landscape andUrban Planning 4: 313–331.
Pénzes E. 2009. A turizmus környezeti hatásait vizsgáló módszerekalkalmazási lehetőségei. [Application possibilities of envi-ronmental assessment methods of tourism.] Tájökológiailapok 7(2): 361–373.
Prayag G. 2012. Paradise for who? Segmenting visitors’ satisfactionwith cognitive image and predicting behavioural loyalty. Inter-national Journal of Tourism Research 14(1): 1–15.
Prosser R. 1994. Societal change and the growth in alternativetourism. In Cater E, Lowman G (eds). Ecotourism. A Sustain-able Option? John Wiley and Sons: Chichester; 18–37.
Rabus B, Eineder M, Roth A, Bamler R. 2003. The shuttleradar topography mission—a new class of digital elevationmodels acquired by spaceborne radar. International Journalof Applied Earth Observation and Geoinformation 57(4):241–262.
Ribeiro M, Marques C. 2002. Rural tourism and the development ofless favoured areas between rhetoric and practice. Internationaljournal of tourism research 4(3): 211–220.
Saxena G, Ilbery B. 2008. Integrated rural tourism. A border casestudy. Annals of Tourism Research. 35(1): 233–254.
Senes G, Toccolini A. 1998. Sustainable land use planning inprotected rural areas in Italy. Landscape and Urban Planning41(2): 107–117.
Sheppard SRJ. 2001. Guidance for crystal ball gazers: developing acode of ethics for landscape visualization. Landscape and UrbanPlanning 54: 183–199.
Slee B, Farr H, Snowdon P. 1997. The economic impact of alterna-tive types of rural tourism. Journal of Agricultural Economics48(2): 179–192.
Somogyi G. 2003. Tourism in the economy at the turn of the millen-nium. In Hajdú Z, Pálné Kovács I (eds). Portrait of SouthTransdanubia: A Region in Transition. Hungarian Academy ofSciences, Centre for Regional Studies: Pécs; 96–104.
Steinhardt U, Volk M. 2003. Mesoscale landscape analysis on thebase of investigations of water balance and water-bound materialfluxes: problems and hierarchical approaches for their resolution.Ecological Modelling 168: 251–265.
Stem CJ, Lassoie JP, Lee DR, Deshler DJ. 2003. How ‘eco’ is eco-tourism? A comparative case study of ecotourism in Costa Rica.Journal of Sustainable Tourism 11(4): 322-247.
Szilassi P. 2003. A rekreációs szempontú tájértékelés elmélete ésmódszertana a hazai és a külföldi szakirodalom alapján. [The theoryand methodology of the recreational aspect landscape evaluationin the hungarian and foreign literature.] Földrajzi Értesítő52(3-4): 301–315.
Tao TCH, Wall G. 2009. Tourism as a sustainable livelihoodstrategy. Tourism Management 30: 90–98.
Tisdell C. 1996. Economic indicators to assess the sustainabilityof conservation farming projects: an evaluation. Agriculture,Ecosystems and Environment 57(2–3): 117–131.
Tress B, Tress G, Décamps H, d’Hauteserre AM. 2001. Bridginghuman and natural sciences in landscape research. Landscapeand Urban Planning 57(3-4): 137–141.
Van Eetvelde V, Antrop M. 2004. Analyzing structural and functionalchanges of traditional landscapes–two examples from SouthernFrance. Landscape and Urban Planning 67(1-4): 79–95.
Van Eetvelde V, Antrop M. 2009. A stepwise multi-scaled land-scape typology and characterisation for trans-regional integra-tion, applied on the federal state of Belgium. Landscape andUrban Planning 91(3): 167–170.
Wall G. 1997. Is ecotourism sustainable? Environmental Manage-ment 21(4): 483–491.
Wan YKP, Li X. 2013. Sustainability of tourism developmentin Macao, China. International Journal of Tourism Research15(1): 52–65.
Wanhill SRC. 1983. Measuring the economic impact of tourism.The Service Industries Journal 3(1): 9–20.
WCED World Commission on Environment and development1987. Our Common Future. Oxford University Press: Oxford.
Weaver D. 1991. Alternative to mass tourism in Dominica. Annalsof Tourism Research 18(3): 414–432.
Weaver DB. 1995. Alternative tourism in Montserrat. TourismManagement 16(8): 593–604.
Whelan T. 1991. Ecotourism and its role in sustainable develop-ment. In Whelan T (ed.) Nature Tourism. Managing for theEnvironment. Island Press: Washington, D.C.; 3–22.
Wood RE. 1984. Ethnic tourism: the state and cultural change inSoutheast Asia. Annals of Tourism Research 11: 353–374.
Alternative Tourism Delimitation by GIS
Copyright © 2013 John Wiley & Sons, Ltd. Int. J. Tourism Res. (2013)
DOI: 10.1002/jtr