A model for weighting image objects in home photographs
8
A Model for Weighting Image Objects in Home Photographs Jean Martinet MRIM-CLIPS-IMAG Grenoble, France +33 476514446 [email protected] Yves Chiaramella MRIM-CLIPS-IMAG Grenoble, France +33 476514899 [email protected] Philippe Mulhem MRIM-CLIPS-IMAG Grenoble, France +33 476514921 [email protected] ABSTRACT The paper presents a contribution to image indexing consisting in a weighting model for visible objects – or image objects – in home photographs. To improve its effectiveness this weighting model has been designed according to human perception criteria about what is estimated as important in photographs. Four basic hypotheses related to human perception are presented, and their validity is estimated as compared to actual observations from a user study. Finally a formal definition of this weighting model is presented and its consistence with the user study is evaluated. Categories and Subject Descriptors H.3.1. [Information Storage and Retrieval]: Content Analysis and Indexing - Indexing methods. General Terms Experimentation, Human Factors, Standardization, Theory. Keywords Image indexing, Weighting scheme, Photograph indexing. 1. INTRODUCTION Content based image retrieval systems exist now for more than 15 years [24]. Such a research domain faces many cross-community problems, ranging from vision problems, interaction problems and information retrieval problems. Most of the well known approaches (QBIC[4], NETRA[12], BLOBWORLD [3]) for CBIR come from computer vision, because this domain tackles many of the fundamentals on which the IR community can build effective models for Content Based Image Retrieval (CBIR). Despite the number of interesting contributions to CBIR systems, little attention has been dedicated to the evaluation of the importance of visual elements appearing in images for improving retrieval effectiveness. This is precisely the core problem addressed in this paper which presents a weighting scheme for image objects. The starting point of this research might be related to the well-known problem of weighting terms in textual indexing. The classical tf.idf weighting scheme [23] for indexing terms has long ago proved its effectiveness when applied to textual documents, where tf (term frequency) is an estimate of the relative importance of a given term as a content descriptor of a particular document, and idf (inverse document frequency) measures the discriminating power of the term, or its ability to differentiate a document from the others. If visible objects may be considered as the main content components of images or photographs (like words or phrases in textual information), then what would be the image equivalent of tf? Furthermore, would the classical tf.idf weighting model be also effective in the context of image retrieval? This is the core problem addressed in the context of this study. Due to space constraints we will concentrate here on the problem of providing and experimenting a definition of tf suitable for images. Our goal then is not about how visible elements can be extracted from images, but to evaluate how important such image elements are when considering image relevance. According to our definition an Image object (IO) is a 2D representation of a visible, real object which is part of the scene displayed in a photograph. Each image object IO is then named according to a term t of an indexing vocabulary suited for the application. The question is then to assign a weight to this t-IO relation to evaluate to what extent the image containing this IO is relevant for a query about t. In our approach to image indexing such image components are intended to provide a basis for image symbolic indexing, but also potentially to feature-based indexing (or signal indexing) of images. The notion of occurrence – now very classical when considering weighting of indexing terms for textual documents – is much less intuitive in the case of images. Images are 2D data and in this context one may understand that the relevance of an image showing boats is not only related to the fact that it represents one or more distinct boats. Other 2D perceptive factors are possibly more important in that matter, such as for example the spatial position or the size of these visible boats. In this study we have investigated four such criteria which are all related to 2D geometry: size, position, fragmentation and heterogeneity. These hypotheses are presented and discussed in section 3.1. Before being included in a relevance model for images these hypotheses need to be confronted to actual human perception and relevance assessments. Section 3.2 describes an experimental validation of this model based on a user study which Permission to make digital or hard copies of all or part of this work for personal or classroom use is granted without fee provided that copies are not made or distributed for profit or commercial advantage and that copies bear this notice and the full citation on the first page. To copy otherwise, or republish, to post on servers or to redistribute to lists, requires prior specific permission and/or a fee. CIKM’05, October 31–November 5, 2005, Bremen, Germany. Copyright 2005 ACM 1-59593-140-6/05/0010…$5.00. 760
Transcript of A model for weighting image objects in home photographs

A Model for Weighting Image Objects in Home Photographs
Jean Martinet MRIM-CLIPS-IMAG Grenoble, France +33 476514446
Yves Chiaramella MRIM-CLIPS-IMAG Grenoble, France +33 476514899
Philippe Mulhem MRIM-CLIPS-IMAG Grenoble, France +33 476514921
ABSTRACT The paper presents a contribution to image indexing consisting in a weighting model for visible objects – or image objects – in home photographs. To improve its effectiveness this weighting model has been designed according to human perception criteria about what is estimated as important in photographs. Four basic hypotheses related to human perception are presented, and their validity is estimated as compared to actual observations from a user study. Finally a formal definition of this weighting model is presented and its consistence with the user study is evaluated.
Categories and Subject Descriptors H.3.1. [Information Storage and Retrieval]: Content Analysis and Indexing - Indexing methods.
General Terms Experimentation, Human Factors, Standardization, Theory.
Keywords Image indexing, Weighting scheme, Photograph indexing.
1. INTRODUCTION Content based image retrieval systems exist now for more than 15 years [24]. Such a research domain faces many cross-community problems, ranging from vision problems, interaction problems and information retrieval problems. Most of the well known approaches (QBIC[4], NETRA[12], BLOBWORLD [3]) for CBIR come from computer vision, because this domain tackles many of the fundamentals on which the IR community can build effective models for Content Based Image Retrieval (CBIR). Despite the number of interesting contributions to CBIR systems, little attention has been dedicated to the evaluation of the importance of visual elements appearing in images for improving retrieval effectiveness. This is precisely the core problem addressed in this paper which presents a weighting scheme for image objects. The starting point of this research might be related
to the well-known problem of weighting terms in textual indexing. The classical tf.idf weighting scheme [23] for indexing terms has long ago proved its effectiveness when applied to textual documents, where tf (term frequency) is an estimate of the relative importance of a given term as a content descriptor of a particular document, and idf (inverse document frequency) measures the discriminating power of the term, or its ability to differentiate a document from the others.
If visible objects may be considered as the main content components of images or photographs (like words or phrases in textual information), then what would be the image equivalent of tf? Furthermore, would the classical tf.idf weighting model be also effective in the context of image retrieval? This is the core problem addressed in the context of this study. Due to space constraints we will concentrate here on the problem of providing and experimenting a definition of tf suitable for images.
Our goal then is not about how visible elements can be extracted from images, but to evaluate how important such image elements are when considering image relevance.
According to our definition an Image object (IO) is a 2D representation of a visible, real object which is part of the scene displayed in a photograph. Each image object IO is then named according to a term t of an indexing vocabulary suited for the application. The question is then to assign a weight to this t-IO relation to evaluate to what extent the image containing this IO is relevant for a query about t. In our approach to image indexing such image components are intended to provide a basis for image symbolic indexing, but also potentially to feature-based indexing (or signal indexing) of images.
The notion of occurrence – now very classical when considering weighting of indexing terms for textual documents – is much less intuitive in the case of images. Images are 2D data and in this context one may understand that the relevance of an image showing boats is not only related to the fact that it represents one or more distinct boats. Other 2D perceptive factors are possibly more important in that matter, such as for example the spatial position or the size of these visible boats.
In this study we have investigated four such criteria which are all related to 2D geometry: size, position, fragmentation and heterogeneity. These hypotheses are presented and discussed in section 3.1. Before being included in a relevance model for images these hypotheses need to be confronted to actual human perception and relevance assessments. Section 3.2 describes an experimental validation of this model based on a user study which
Permission to make digital or hard copies of all or part of this work for personal or classroom use is granted without fee provided that copies are not made or distributed for profit or commercial advantage and that copies bear this notice and the full citation on the first page. To copy otherwise, or republish, to post on servers or to redistribute to lists, requires prior specific permission and/or a fee. CIKM’05, October 31–November 5, 2005, Bremen, Germany. Copyright 2005 ACM 1-59593-140-6/05/0010…$5.00.
760
clearly demonstrates that three of these four criteria have a definite impact on the notion of image relevance: size, position and heterogeneity. We have then got some effective clues on which facts an image equivalent of the textual tf could be based. A first attempt towards a formal definition of the three criteria, which is intended to reflect the observed human behaviour about image relevance, is then given in section 4.1. The model is then completed by proposing a combination of these three relevant criteria as a “tf” equivalent for weighting image objects. Section 4.2 presents an experiment demonstrating that this weighting schema is consistent with observed users’ relevance assessments. Finally a conclusion on this study and indications about future work is given in section 5.
2. RELATED WORKS Well known CBIR systems such as QBIC [4], Blobworld [3] and Netra [12] for instance have already included weighting models aimed to enable ranking system’s responses. In these systems, whenever the query is based on image example or on explicit description of signal features (e.g. color), the image index contains “pure” signal values such as color histograms for instance. These were never clearly confronted to what users consider important or not important in images. These weighing schemas are more related to a global evaluation of image relevance.
Considering for example the color histogram of an image query, the values defining the histogram do indicate if a particular bin is larger than another. Common histogram distances (Euclidian or other L-norms, quadratic histogram distances used in QBIC) are based on such comparisons of corresponding bins. But then a question might be for example: is the difference involving the larger bin of the image as important (regarding image relevance) as the difference involving its smaller bin?
In fact, all these state-of-the-art approaches bypass one of the central ideas of Information Retrieval since 30 years stating first that effective indexing terms are related to explicit concepts (i.e. they may be denoted based on human language) and second that each term has an associated value – commonly called term weight – expressing its capacity to effectively retrieve documents among a document collection. A weighting schema such as tf.idf clearly tries to capture and combine in a single measure two basic properties of every indexing term: to which extent it accounts for the actual content of a given document, and its ability to discriminate this document among the corpus. This classical approach for term weighting is quite drastically different from pure signal-based similarity (or related distances) measures underlying CBIR. At the moment there are quite few definite and experimentally validated clues about how evolving from color histograms or texture similarity measures to more effective retrieval models integrating the user-based notion of relevance. This in turn refrains CBIR researchers to tackle this basic problem.
Instead of trying to design effective weighting models based on signal analysis and similarity, we choose to focus on a symbolic approach where images are not indexed based on their visual features but based on terms (ie. denoting concepts) providing interpretations of visual elements appearing in the image. Such kinds of approaches exist, at least partially. Some of them define an explicit labeling (via indexing terms) of image regions [5, 10,
25, 26] based on a learning process. Others also consider regions in the analysis phase but the final labeling process associates terms to the images instead of the corresponding regions [7]. Finally, others globally analyze images and assign them indexing terms as a whole, completely ignoring the notion of image regions [2].
Approaches indexing images as a whole are usually based on binary classification schemes like for example “indoor” and “outdoor” [2, 15, 16] which is much closer to the extraction of meta-information than to semantic-content indexing. When considering image indexing based on image elements, approaches vary again from binary labels [25, 26] to n-ary ones [10, 19], this later one being the closest to our approach. As far as we are concerned with information retrieval we consider that including a weighting model in this approach is preferable.
The question then is the design of such a model: what weights to assign to image components, and according to what criteria? Existing models are based on location [10, 26], on relative surfaces [11], on size, like the area percentage scheme of Simplicity [26] and [18], or on keyblock term frequencies [27].
Although interesting and sometimes close to our approach, none of these models has been validated through users’ experiments or is complete regarding weighting individual objects. Consequently most of them remain somewhat intuitive or incomplete. As an example of this situation, Jing and al propose in [8] a weighting model based on relevance feedback techniques and write in section 5 “… such as the area percentage, is probably not completely relevant to the semantic importance of regions”. Here the word “probably” is important because they do not provide experimental evidence that confirm or infirm their hypothesis (which by the way is infirmed by our experiments!). More generally, none of these models refers to a relevance-based weighting model such as tf.idf and try to experiment whether it might be adapted to image retrieval or not. When looking at the basic principles underlying this model a first problem is then: what would be a tf equivalent for images, or how to determine to what extent an image is “about” a given term? This is the basic problem we want to address here.
Considering this goal and the state of the art related to symbolic indexing of images, we are convinced that what is needed first is to define and to experimentally validate a set of hypothesis about human perception of image relevance. This constitutes the main topic of section 3 below.
3. IMAGE OBJECTS AND IMAGE ABOUTNESS 3.1 Hypotheses What do users actually consider as significant in images, and how providing a model reflecting their behavior about image relevance? According to previous experiments in the context of retrieving non-specific images1 [6] and related to home photographs [10, 17], users tend describing images based on visible objects appearing in them. This observation explains why our approach focuses on “visible objects” and not on color 1 Non specific images here means non application-specific images,
like medical images or satellite images usually are, for example.
761

regions for instance. It explains also why such visible objects are considered as basic entities in our weighting model. To be more precise about this important aspect we introduce the following notion of Image Objects (IO). This definition is inspired from the one given in [14]:
- (a) An IO is related to one and only one semantic interpretation which is defined by a label. A label stands here for an indexing term defining the semantic interpretation of the related IO. In its general definition a label may belong to any kind of indexing language (as part of a particular indexing model). Considering images, such labels usually are natural language words (“tree”, “house”, “sky”, etc.). From now on we will use this term label instead of indexing term.
- (b) An IO is defined as a bi-dimensional projection (or visualization) of one real-world, physical, object (or possibly of several such objects sharing the same label) in an image. An IO then often corresponds to a single image region2 within an image. But according to this definition, an IO may also correspond to several non-connected image regions if it corresponds to several occurrences of the same type of physical objects (e.g. several “boats”). This possibility has also been extended to the frequent case where the real-world physical object is partially occluded (like a building behind a tree for instance). We will refer further to these two situations as fragmentation cases of an IO.
We define the notion of importance of a given IO relatively to the notion of image content in a much similar way to the standard notion of term importance in the context of text retrieval.
Definition: Considering an image I, and io an image object of I, io is uniquely labeled by a term t (definition (a) above). The importance of io regarding I is directly related to the aboutness3 of I considering t.
For example, one will consider that an IO representing a boat (hence t = “boat”) in a given image is important if most users would consider that this image is about a “boat”.
Let us consider now our proposed hypotheses about image objects importance. Being associated to an image region, or a set of image regions, an IO is then basically a 2D set of pixels whose basic geometrical characteristics (area, position, etc.) can be easily computed. According to the weighting models reported above in the related works, we propose to define and investigate four hypotheses:
2 As usual an image region here is a set of connected image pixels. 3 In our opinion aboutness is a notion mainly local to a given
document. It might not be confused with relevance, a notion that usually compares a particular document to the whole corpus. All the hypotheses presented here are purely local to images and thus cannot be directly assimilated to relevance evaluation. A relation between these two notions is somewhat illustrated by the tf.idf weighting model: given a term t of document D, tf of t stands for the aboutness of D considering t, while tf.idf is an estimate of the relevance of D considering t.
1 Size – Some previous approaches mentioned in the state of the art have quoted the importance of the size criterion [11, 26], in which the authors assume a direct relationship between an image object importance and its relative size (visible surface). By definition, the size S of an IO is defined here as the size of its related region(s).
Size Hypothesis: The importance of an image object varies in the same way as its size S.
2 Position – Again some previous approaches mentioned in the previous section ([10]) have quoted the potential importance of this criterion. We share this opinion and want to investigate possible formulations and their experimental validation. Here the position of an IO is determined by the position of its barycenter.
Position hypothesis: the importance of an image object is maximal when its position P is at the center of the image, and decreases when its distance from the image center increases.
3 Fragmentation – To our knowledge, the possible impact of fragmentation on the importance of an IO has never been investigated. We thought that it could indeed have such an impact, when compared to a completely connected, appearance of the same real object or that multiple occurrences of a given type of object could also have the same kind of impact. Fragmentation F of an IO is a more complicated feature taking into account both the number and the size of the image regions composing the IO. Since this criterion has been proved ineffective in the experiment (see section 3.2), no formal modeling for F is given here.
Fragmentation Hypothesis: the importance of an image object is maximal when it is not fragmented, and decreases when its fragmentation F increases.
4 Homogeneity – Is the importance of any visible object in an image depending on the fact that it appears alone, or almost alone in the image? Is this importance decreasing when the image object appears among several others (of different nature) in the same image? What we call the homogeneity criterion H of an image expresses the extent to which an image presents several types of IO. Like the fragmentation criterion, this particular criterion has never been considered before. We suppose here that the more different IO occur in an image, the more the cognitive overload4 of the user increases, and thus the more the detection of a particular IO becomes difficult. The homogeneity criterion H is then maximal when the image contains only one type of IO and decreases when the number of occurrences of other types of IO increases. The definition of H includes the number and the relative surface of the various IO in a given image (see section 4.1).
4 Defined as “excessive demand made on the cognitive processes,
in particular memory” in [20] page 717.
762

Homogeneity Hypothesis: the importance of an image object varies in the same way as the homogeneity H of its embedding image.
Of course we do not claim that these four criteria are the only ones related to an effective definition of the importance of an IO. We propose here a first step for future evaluations of geometrical features of image objects on their importance. To our knowledge no similar study has been published about such a basic problem. From the information retrieval point of view, testing the validity of such hypotheses is a first important step towards a well-founded weighting model for image objects. This experimentation process is presented in the following section.
3.2 Validation The goal of the user's study here is to check and evaluate the four hypotheses described above. The goal of this experimental validation is to collect user's feedback preferences over images from a test set and then analyse these preferences.
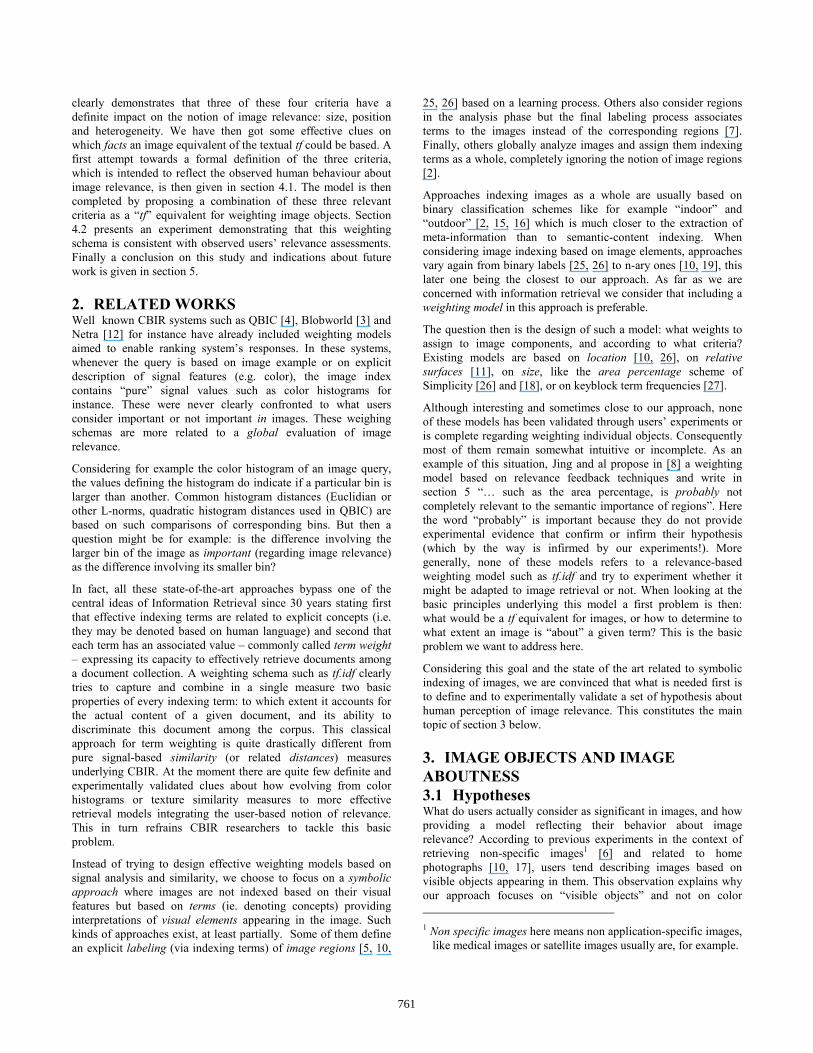
Our validation is based on presenting couples of images to each participant. For a given pair (A, B) of images, we focus on the image objects related to the same term t. For each image of the couple, we define for the t-IO its size value, big or small, its position value, centred or lateral, its fragmentation value, fragmented or aggregated, and the homogeneity value for the image, homogeneous or heterogeneous. Figure 1 presents the 16 (=24) typical examples of images considering the possible values of the four criteria, considering the disc (or group of discs) as the term t. When considering a couple (A,B), we denote by VA (resp. VB) the criterion variation from B to A (resp. A to B), according to the hypotheses. Assume that the situation for the t-IO in A is (big, centred, aggregated, heterogeneous), meaning that the t-IO is in the center of the image, big, aggregated, and that the image A is heterogeneous. Assume also that the situation for an image B is (small, centred, aggregated, heterogeneous). The image 5 (resp. 6) of Figure 1 is an example of A (resp. B). The criterion variation VA is only based on the size S (the other criterion values being equal), big in image A and small in image B, denoted by (1, 0, 0, 0) according to the size hypothesis. Dually, the criterion variation VB is denoted by (-1, 0, 0, 0).
Before actually running the experiments with participants, we determine the physical objects on which we focus on. The set of physical objects selected has to cover a wide range of possible objects appearing in home photographs, because we do not know if the hypotheses hold across different kinds of physical objects. We have chosen the following categories of objects to be studied:
- Boat: this category is used to reflect the fact that many non living objects occur in home photographs,
- Bird: we assume that animals often occur in home photographs, thus leading us to evaluate the criteria on such images,
- Children face: people faces are a very important part of home photographs, as underlined in [20]. In this test we used photographs showing on average as many girls as boys. For this object category and the following, we assume that many faces are present in home photographs.
- One specific face: in home photographs, many family of relative faces are present. During this experiment, the choice was made to use one of the authors face.
Figure 1: 16 logical image object configurations
As described above, for each of the considered objects we present a list of image pairs on which we evaluate the criteria. The criteria values were defined as a common agreement of three people (the authors of this paper) so that the visual differences between configurations are clear, easily visible and no confusion is possible. For each of the first 3 categories of physical objects, 120 pairs (i.e. all pairs of image in a set of 16 situations) of images are presented. For the last object category (one specific person), there is no fragmentation variation because the person occurs without occlusion; for this category only 28 photographs pairs are presented. So, a total of 388 (=120×3 + 28) pairs are presented to each participant. The duration of the test is about 30 minutes per participant. The images used in the experiments are normalized in term of size, quality, and typicality5. We conducted the experiment with 30 participants (16 women, 14 men) aged from 24 to 50. The participants belong to the research laboratory of the authors, but were not at all aware of the hypotheses tested in the study. Each participant chooses one image from each pair of images presented, according to its aboutness with regard to a given category term t. When a pair of images is presented to a participant, the user interface randomly picks which image is displayed at the top and which image is at the bottom of the window. The participant then selects the image which is the more about t. Consider again the image couple (A, B) presented above, with situation (big, centred, aggregated, heterogeneous) for A, and (small, centred, aggregated, heterogeneous) for B. If the participant selects the image A, then our hypothesis on the size is validated. This is denoted by the fact that the variation VA has a 1 in its first position. If the participant selects B, the size hypothesis is invalidated. By counting how many times the hypotheses are validated or invalidated using the criterion variations, we are able to draw conclusion on their usefulness. Before discussing the findings of the user's study, we verify that the size of the users set is large enough using the “split-half analysis consistency” [13]. This method randomly splits in two sets X and Y the collected data, and computes the correlation
5 Typicality refers to the most commonly agreed representation of
an object.
1 2 3 4
5 6 7 8
9 10 11 12
13 14 15 16
763

value between the two sets X and Y. If the same conclusions can be drawn from the two sets X and Y, evaluated using the correlation between the sets X and Y, then the sample size is sufficient. For 30 participants, the correlation value is equal to 0.962, meaning that the data obtained are highly consistent.
Table 1 shows the average and standard deviation (between parentheses) of each criterion variation considered independently: - Big Size selected (BS), - Center Position selected (CP), - Aggregated Object selected (AO), - Homogeneous Image selected (HI). Each of the values displayed corresponds to the count of participants choosing the criterion variation divided by the overall count of variation of the criterion presented to the participants. The value 0.76 for the criterion Big Size for boat indicates then that 76% of the time the participants chose the variation denoting that the image with a big boat was selected instead of the image with the small boat. It seems that the Big Size criterion variation, as well as the Center Position and Homogeneous Image criterion variations, is consistent with its related hypotheses. Conversely, it seems that the Aggregated Object criterion variation (average values between 0.38 and 0.60) is less important than the three others. Table 1 shows that for the named face object, the Big Size criterion is very large, showing that a big named face is almost always selected. On the contrary, the Center Position criterion value for named face is only 0.70 with a standard deviation of 0.27, showing that for named face the position seems to be less important. Table 1 also confirms the fact that the obtained results depend for some part on the category of the considered physical object.
Criterion Variation
Boat Bird Children Face
Named Face
Big Size 0.76 (0.15)
0.74 (0.18)
0.77 (0.16)
0.97 (0.09)
Center Position 0.84 (0.13)
0.82 (0.12)
0.77 (0.15)
0.70 (0.27)
Aggregated Object
0.38 (0.20)
0.53 (0.25)
0.60 (0.25)
N/A (N/A)
Homogeneous Image
0.88 (0.12)
0.65 (0.19)
0.81 (0.12)
0.86 (0.22)
Table 1: Average (and standard deviation) for the four criterion variations and the four object categories.
To go further in the evaluation of the results, we apply a statistic test to our data. We consider the discrete Bernoulli random variables6 Y{BS}, Y{CP}, Y{AO}, and Y{HI} related to the criterion variations BS, CP, AO and HI of Table 1. For each of these discrete random variables Yc, we validate statistically our results by applying a unilateral T-test [1], with the null hypothesis H0: Yc > 0.5, and the alternative hypothesis H1: Yc ≤ 0.5. The probabilities associated to the T-test are presented in the last column of Table 2, where the second column presents the probability of the criterion variations averaged over the four categories. The last column of this table presents the probability to reject wrongly the H0 hypothesis when H0 is true. The results for BS, CP and HI are highly significant with significance value smaller that 0.001. We then conclude that hypotheses 1, 2 and 4 are validated. The T-test for the Aggregated image object gives a
6 Bernoulli random variables are used here because we evaluate
probabilities of binary events.
probability of 0.948 for H0, leading us to conclude that the hypothesis 3 is not validated.
Random variable Probability T-test (H0) Y{BS} 0.81 6.57 E-13 Y{CP} 0.78 1.84 E-10 Y{AO} 0.50 0.948 Y{HI} 0.78 6.74 E-12
Table 2: Probabilities and T-test values over the four criterion variations.
Considering criterion variations separately is not enough: we need to study the behaviour when combining them. Table 3 presents the Bernoulli probabilities for the random variables considering CP, BS, AO and HI together, and the random variables considering the dual choices for one criterion variation (the dual choice is written in parentheses, e.g. (BS) means that the image with the big size object was not selected). The last column of Table 3 presents T-test results with the same H0 and H1 as in Table 2.
Random variable Probability T-test (H0) Y{BS, CP, AO, HI} 0.93 2.80 E-15 Y{(BS), CP, AO, HI} 0.83 1.55 E-10 Y{BS, (CP), AO, HI} 0.86 1.47 E-08 Y{BS, CP, (AO), HI} 0.91 1.63 E-15 Y{BS, CP, AO, (HI)} 0.80 6.20 E-10
Table 3: Probabilities and T-test values combining the four criterion variations.
Table 3 shows that the dual value of the AO has a very small effect on the probability (0.93 versus 0.91) when considering the other criteria, confirming one more time than the Fragmentation variation of image objects is not significant. However, we see also that the combination of the three criteria BS, CP and HI gives a higher probability that when we consider the dual value of any of these three criteria. All of these probabilities are highly significant (significance level smaller than 0.001), as seen on the last column of Table 3. This leads us to consider that the combination of these criteria behaves more in an additive way than a multiplicative one because one dual choice does not impact a lot the overall probability value. In summary, the results for Big Size, the Center Position and the Homogeneity of Image criterion variations confirm the hypotheses 1, 2 and 4 described in section 3.1, and the Fragmentation hypothesis is not confirmed.
4. WEIGHTING IMAGE OBJECTS 4.1 The Weighting Model We have shown in the previous section that three out of four hypotheses are valid for the definition of IO importance: the ones concerning the size and the position of the IOs and the homogeneity of the images. An important problem we are now faced with is the integration of these criteria within a model capable of reflecting the overall importance of an IO. We use the probability theory and Shannon information theory [22], which represents a formal framework suited for IO importance modeling. The aim is to associate an importance value for IOs based on each criterion value, where the criterion values are themselves related to IOs own geometric features. We first give a modeling of the three criteria, and then we show how they are combined into a single model of importance for IOs.
764

Size of IOs is directly related to their surface, and consequently our size criterion is based on IOs relative surface. Human perception of surfaces being rather logarithmic than linear [21], we define a relative surface according to the following formula:
)(log)log()log(),S( on
I
o nnnIo
I==
where I is a given image of size nI (in pixels), and o is an image object in I of size no. If we consider two IOs io1 and io2 appearing in an image im, io1 being twice as big as io2, S(io1, im) is smaller than 2×S(io2, im). S(o,I) is an increasing function of no (according to our first hypothesis) with values in [0,1].
The position criterion P is integrated in our model by defining a non-uniform probability density function:
)(),P( opIo I=
where pI is a distribution of probability that gives higher probability values to IOs in the center of an image I. An example of such a distribution is given in Figure 2, where I is a simplified image seen as a 1D segment, and a 2D distribution is shown above I. Two image objects io1 and io2 are represented as parts of the segment, and their associated probabilities correspond to the black areas below the probability density curve.
Figure 2: Example of non-uniform distribution of probability. Hence the probability associated with io1 is higher than the one associated with io2. The position values belong to [0,1], and they are greater for IOs in the center of the image, according to our second hypothesis.
We define a spatial entropy SH computed from the spatial distribution of IOs in an image, in order to represent the “disorder” in the image:
( )I
o
I
onn
IonnI log)(SH −×=∑
∈
The above definition of spatial entropy makes it possible to combine in a well known framework two important aspects of the IO surface distribution: the number of IOs and their relative size. Spatial entropy values are larger when there are many objects with the same size in the image (when one object in particular is less easily visible), and it is smaller when there are few objects with different sizes (i.e. when one object is bigger than the others and therefore more easily visible) in the image. To be consistent with our last hypothesis, the homogeneity criterion is defined as the complementary value to 1 of SH to which we apply a normalization factor. The homogeneity H is defined according to the following formula:
( )InI
III
log)(SH1
)(SH)(SH1 )(H
max
−=−=
where SHmax(I) is the maximum value of the spatial entropy, corresponding to the virtual case where the image is composed of
nI 1-pixel IOs. The homogeneity values are large for homogeneous images according to our last hypothesis, and they belong to [0,1]. This value is the same for all IOs in one image.
We now describe how the three criteria are combined into a single importance model for IOs. The importance value of an IO should be large when all criterion values are large, and inversely. Moreover, the importance value should not be close to zero when one of the criterion values is close to zero while the two others are large (see Table 3). For these reasons, a good candidate for the combination is the addition. Since the three criteria might have different variation ranges on different collections, a normalization scheme is applied in order to align both lower and upper bounds of values [9]:
min_valuemax_valuemin_valueed_valueunnormaliz_valuenormalized
−−=
where min_value (resp. max_value) is the minimum value (resp. the maximum value) of the criterion value found the whole collection. We define now the importance of an image object o in an image I as:
)(H_norm ),P_norm( ),S_norm( ),(Importance IIoIoIo ++=
where S_norm, P_norm and H_norm are the normalized values of criteria S, P and H respectively. Hence, our definition of IO importance combines the three criteria that have been experimentally validated to reflect the aboutness of images with regard to the semantic interpretation of IOs. Next section presents a final experiment dedicated to estimate how well our model fits the users’ perception of importance.
4.2 Experiment The objective of this experiment is to evaluate the quality of our weighting model with regard to users’ aboutness assessments. For this purpose, we have designed an image test collection of 800 manually indexed and segmented home photographs, disjoint from the first experiment image collection. This collection contains a wide range of authors holidays photographs. Importance values of objects are computed according to the formula given in Section 4.1. The weighting model is evaluated by comparing our system ranking of the images – in decreasing order of importance – to an assessors’ ranking – in decreasing order of aboutness – on a set of 20 queries consisting of one single term (e.g. “Horse”, “Pond”, “Foggy_sky”, “Bridge”, “American_Flag”, etc.). These terms correspond to different kinds of objects (natural like “River” and non-natural like “Bridge”), and also to different levels of genericity of the objects (specific like “American flag” and generic like “People”). The system ranking for each query is defined as the images sorted in decreasing order of importance values for the term. A group of 4 assessors7 – 2 women and 2 men aged from 23 to 25, who have a good knowledge of the collection – have ranked relevant images for each query (on average, 6 relevant images have been ranked for each query). An average ranking is generated [18] and used as a reference to which the system ranking is compared. This comparison indicates how close to the users’ perception of
7 Note that none of the assessors have participated in the first
experiment.
io1 io2
I
pI
765

0,260,240,24
0,220,170,16
0,160,160,160,16
0,150,140,14
0,110,10
0,060,04
0,000,000,00
0 0,05 0,1 0,15 0,2 0,25 0,3
Fort ress (6)Sculpture (5)
M otorbike (7)Geyser (7)
Wood boat (11)Bridge (9)Bicycle (3)Sheep (3)Pond (3)
Bell (3)Horse (5)
People (9)Bus (6)
Foggy sky (13)Tree (8)Van (10)
American f lag (6)Temple (2)
River (2)Pool (4)
Que
ry te
rms
(num
ber o
f rel
evan
t im
ages
)
Divergence values
Figure 3: Divergence values for all query terms
aboutness our weighting model is. The comparison is based on the following divergence function (inspired from [18]) that gives low divergence values to similar rankings, while penalizing more system ranking errors at the top ranked images:
( ) ( )( )( )∑
∈
−×=),1(
2
n ,,,
mdv1 ),(divergence
ni iSrankiSrankiUrankSU
where U and S are the user ranking and the system ranking of n images respectively, rank(U,i) and rank(S,i) are the ranks of image i in the user ranking and in the system ranking respectively ; mdvn is the maximum divergence value for n items8. This divergence function gives the value 0 when U=S, and it gives the value 1 when U and S are in reverse order. For instance, the ranks for “Tree” are u=[5,8,1,4,6,3,2,7] and s=[5,8,3,2,4,6,1,7], meaning that the image 1 has been ranked at the 3rd position by the assessors, while it is ranked at the 7th position by the system. The divergence value for u and s is:
( ) 10.020
80
61
10
51
39
49
716
15.761 ≈+++++++×
We use this divergence function instead of classical recall-precision measures because we are interested in the order of relevant images, rather than a simple binary relevance of images.
The system firstly implements each criterion individually, then their combination. The divergence value (DV) averaged over the 20 queries is 0.24 when considering the surface only, 0.31 for the position, and 0.63 for the homogeneity. The latter DV is high because relevant images are sorted according to their homogeneity values, which does not take into account the query term. When combined together, the 3 criteria perform better that separately, as shown in Figure 3: DVs range from 0 (for “Pool”, “River” and “Temple”) to 0.26 (for “Fortress”). The results obtained depend neither on the number of relevant images (shown in parentheses in Figure 3), nor on the type of objects considered (natural vs. non-natural, generic vs. specific or living vs. non-living). The high DVs (greater than 0.20) correspond to the queries “Fortress”, “Geyser”, “Motorbike” and “Sculpture”.
8 The maximum divergence value is reached when the two
rankings are in a reverse order.
For these query results, some of the relevant images are very similar with respect to their visual configuration, despite variations at an aesthetic level. Hence, the system is unable to discriminate between these images as the importance values, based on the visual configuration of images, are close to one another. However the average DV is 0.13, which means that our system ranking is very close to the users’ perception of aboutness. These two results lead to conclude that our weighting model is adequate according to our second study. This experiment provides a validation to both our criteria modeling and their combination.
5. CONCLUSION In this paper we have proposed a contribution to image indexing based on a weighting model for image objects. This model was viewed as a fundamental step for testing an image counterpart of the well-known tf paradigm in textual indexing. The model is fundamentally based on four perception criteria related to 2D geometry of images, namely surface, position, fragmentation and homogeneity. These four criteria have been thoroughly confronted to actual human perception of images, and to aboutness assessments through an experiment involving real users. Three of these criteria have been experimentally validated in this process, formally modeled and further combined within a single weighting model for image objects. Finally, the effectiveness of this weighting schema has been successfully compared to human-based aboutness assessments for images given symbolic definitions of topics.
Though we understand that several other perception criteria could be also considered as a basis for such a model, we consider that we have already got a good basis for designing and testing a tf.idf weighting schema adapted for images.
Future works are then mainly aimed at designing and testing a tf.idf approach for images, based on a test collection that we are designing by now. Extensions of the weighting model to other perception criteria – like visibility of image objects related to contrast or luminosity – are also foreseen, in just the same experimental and formal way used for the four criteria described in this paper. Through this first extensive attempt we have certainly comforted our feeling that in this area, modeling has to be grounded and validated by solid experiment.
766

Of course nobody knows by now whether or not such a weighting model – which has been successful for text – will be also effective for images. We view this as a much interesting and valuable challenge to face in the perspective of improving symbolic indexing and retrieval of images.
6. REFERENCES [1] G. Baillargeon, Probabilités, Statistiques et Régression,
SMG, Trois-Rivières, Québec, 1998. [2] B. Bradshaw, Semantic-based image retrieval: a
probabilistic approach, ACM Multimedia 2000, USA, pp. 167-176, 2000.
[3] C. Carson, S. Belongie, H. Greenspan and J. Malik, Blobworld: Color- and Texture-Based Image Segmentation Using EM and Its Application to Image Querying and Classification, Trans. on Pattern Analysis and Machine Intelligence, Vol. 24, No. 8, August 2002, pp. 1026-1038.
[4] C. Faloutsos, R. Barber, M. Flickner, J. Hafner, W. Niblack, D. Petrovic, and W. Equitz, Efficient and Effective Querying by Image Content. Journal of Intelligent Information Systems, 3, 1994, pp. 231-262.
[5] J. Fan, Y. Gao, H. Luo, G. Xu, Automatic image annotation by using concept-sensitive salient objects for image content representation. ACM SIGIR 2004, Sheffield, UK, 2004, pp. 361-368.
[6] L. Hollink, A. Th. Screiber. B. J. Wielinga, and M. Worring, Classification of user image descriptions, Intl. Journal of Human-Computer Studies, 61, 2004, PP. 601-626.
[7] J. Jeon, V. Lavrenko, and R. Manmatha, Automatic image annotation and retrieval using cross-media relevance models, ACM SIGIR 2003, Toronto, Canada, pp. 119-126.
[8] F. Jing, M. Li, H.-J. Zhang, B. Zhang, An Efficient end Effective Recgion-Based Image Retrieval Framework, IEEE Trans. on Image Processing, Vol. 13, No. 5, May 2004, pp. 699-709.
[9] J. H. Lee, Analyses of Multiple Evidence Combination, SIGIR’97, Philadelphia, USA , 1997, pp. 267-276.
[10] J. H. Lim, Building visual vocabulary for image indexation and query formulation, Pattern Analysis and Applications (Special Issue on Image Indexation), 4(2/3): 125-139, 2001.
[11] J. H. Lim, Q. Tian and P. Mulhem , Home Photo Content Modeling for Personalized Event-Based Retrieval, IEEE Multimedia, Special Issue on Multimedia Content Modeling and Personalization, Vol. 10, No .4, October-December, 2003, pp. 28-37.
[12] W. Y. Ma and B. S. Manjunath, NETRA: A Toolbox for navigating large image databases, IEEE International Conference on Image, Processing (ICIP'97), USA, Vol. I, pp. 568-571, 1997.
[13] P. Martin, and P. Bateson, Measuring Behaviour: An Introductory Guide, Cambridge University Press, 1986.
[14] M. Mechkour, EMIR2. An Extended Model for Image Representation and Retrieval, in DEXA'95. Database and EXpert system Applications, London, September, 1995, pp. 395-404.
[15] T. P. Minka and R. W. Picard, Interactive learning using a “society of models”, Special issue of Pattern Recognition on Image Databases, 30(4), 1997.
[16] A. Mojsilovic and B. Rogowitz , Capturing Image Semantics With Low-level Descriptors, IEEE International Conference on Image Processing, ICIP 2001, Thessaloniki, October 2001, pp. 18-20.
[17] P. Mulhem, J. H. Lim, W. K. L. and M. Kankanhalli, Advances in Digital Home Image Albums, in Multimedia Systems and Content-Based Image Retrieval, Idea Publishing, chapter IX, 2003, pp. 201-226.
[18] I. Ounis, and M. Pasca, Finding the Best Parameters for Image Ranking: a User-Oriented Approach. Proceedings of The IEEE Knowledge and Data Engineering Exchange Conference (KDEX'98), 1998, Taipei, Taiwan, pp. 50-59.
[19] M. C. S. Paterno, F. S. Lim, W. K. Leow. Fuzzy Semantic Labeling for Image Retrieval. In Proc. Int. Conf. on Multimedia and Exposition, 2004.
[20] J. Preece, Y. Rogers, H. Sharp, D. Benyon, S. Holland and T. Carrey, Human-Computer Interaction, Addison-Wesley, 1994.
[21] A. S. Rojet and E. L. Schwartz. Design considerations for a space-variant visual sensor with complex-logarithmic geometry. 10th International Conference on Pattern Recognition, 2 :278–285, 1990.
[22] C. E. Shannon, A mathematical theory for communication, Bell System Technical Journal, 27:379-423, 623-656, 1948.
[23] G. Salton, The SMART Retrieval System - experiments in automatic document processing, Perntice-Hall, Inc., Englewood Cliffs, NJ, 1971.
[24] A. Smeulders, M. Worring, S. Santini, A. Gupta, and R. Jain, Content-based image retrieval at the end of the early years. IEEE Trans. Pattern Analysis and Machine Intelligence, Vol. 22, No. 12, 2000, pp. 1349-1380.
[25] C. Town and D. Sinclair, Content-based image retrieval using semantic visual categories, Technical report 2000.14, AT&T Laboratories Cambridge, UK, 2000.
[26] J. Wang, J. Li and G. Wiederhold, SIMPLIcity: Semantic-Sensitive Integrated Matching for Picture Library, IEEE Trans. on Pattern Analysis and Machine Intelligence, Vol. 23, No. 9, September 2001, pp. 947-963.
[27] L. Zhu, A. Rao, and A. Zhang, Theory of keyblock-based image retrieval. ACM Trans. Inf. Syst, 20(2):224-257, 2002.
767