Genomic Regulation and Molecular Pathways of X ...
282
Genomic Regulation and Molecular Pathways of X Chromosome Inactivation Joseph Samson Bowness Linacre College University of Oxford A thesis submitted for the degree of Doctor of Philosophy Hilary Term 2021
-
Upload
khangminh22 -
Category
Documents
-
view
0 -
download
0
Transcript of Genomic Regulation and Molecular Pathways of X ...
Genomic Regulation and Molecular
Pathways of X Chromosome Inactivation
Joseph Samson Bowness
Linacre College
University of Oxford
A thesis submitted for the degree of
Doctor of Philosophy
Hilary Term 2021
Abstract
X chromosome inactivation (XCI) is a process by which one X chromosome in female mam-
mals is silenced to equalise the dosage of X-linked gene expression between XX females
and XY males. XCI is initiated by a long non-coding RNA (lncRNA), Xist, expressed
from the future inactive X chromosome (Xi) during embryonic development. Xist spreads
in cis to coat the chromosome and recruits molecular pathways which modify the under-
lying chromatin from an active to a repressive state, leading to complete transcriptional
silencing of almost all genes on Xi. XCI is an important paradigm for lncRNA-directed
gene repression and its study can inform our understanding of mechanisms of chromatin
regulation more widely.
This thesis presents an experimental characterisation of iXist-ChrX, a cellular model that
recapitulates the establishment of XCI during early mouse development. I perform quan-
titative, high-resolution and allele-specific genomic analyses of Xist-mediated changes to
chromatin over time courses of Xist induction, providing novel insights into the cis-
regulatory features that influence variable silencing dynamics on a gene-by-gene basis.
A key finding from these analyses is that slow-silencing genes and genes which escape
complete inactivation are marked by binding motifs for the transcription factor YY1. I
also document a pilot scRNA-seq experiment to address questions of cellular heterogene-
ity in Xist-mediated gene silencing and lay the foundations for future investigations at
single-cell resolution.
In further experiments, I use CRISPR-Cas9 genome editing to interrogate two key molec-
ular pathways acting downstream of Xist. By disrupting SPEN and Polycomb pathways
1

2
individually and in combination in iXist-ChrX cells, I dissect the relative contributions
of each pathway and demonstrate that they act in parallel, through distinct mechanisms
of chromatin modification, and additively to silence X-linked genes. These experiments
also reveal that both SPEN and PCGF3/5-PRC1 have secondary roles in ensuring correct
localisation of Xist RNA over Xi, and highlight an interplay with cellular differentiation
important for the complete establishment of silencing during the later stages of XCI.

Acknowledgements
First, I would like to thank my supervisor, Neil Brockdorff, for giving me the opportunity
to work in his lab, for providing me with all the resources and freedom to follow my own
ideas, and for prescient experimental suggestions and project guidance over the last four
years.
I am extremely grateful to Guifeng Wei, initially for teaching me bioinformatics and ever
since for fielding any questions I might have about various papers or data analysis methods;
to Tatyana Nesterova, for being absolutely invaluable to everything in the lab and always
making to time to share with me her wide practical and scientific expertise; and to Mafalda
Almeida, for caring about my experiments and well-being and for continually pushing
me to be a better scientist. All three helped experimentally in generating the cell lines
presented in this work and, more importantly, through scientific collaboration have greatly
enriched my overall experience in the Brockdorff lab.
Thanks also to Brockdorff group alumni Greta Pintacuda, for outstanding supervision
when I was an inexperienced rotation student, and Tianyi Zhang, for teaching me many
of the protocols performed here and maintaining an active interest in my project and
scientific development even after leaving Oxford. I am grateful to all members of the
Brockdorff and Klose groups for making the lab an enjoyable and fruitful place to conduct
science.
I would also like to acknowledge many others who contributed to this work. Emma Carter
kindly did the blind scoring of RNA-FISH images herein presented. Heather Coker per-
formed the sample preparation and Lisa Rodermund the imaging and analysis for the
3

4
super-resolution microscopy experiments which revealed interesting Xist RNA localisation
phenotypes in my cell lines. Thanks to Amanda Williams at the Zoology sequencing fa-
cility for loading dozens of my libraries on the NextSeq machine, and to Neil Ashley and
assistants at the WIMM Single Cell facility for processing the Smart-Seq2 experiment de-
scribed in Chapter 5. My research was made possible by generous funding from Wellcome
via the Chromosome and Developmental Biology doctoral training programme.
My gratitude also goes out to all my friends, both in and outside of Oxford, who never
fail to amaze me with their support. This was epitomised by overwhelming response I
received after a social media plea for assistance with exponential modelling. Leonardo
Buizza, Amy Kent and Paul Lang were particularly generous with their time, as I am sure
many others would have been too if they were experts in mathematical modelling.
Finally, thanks to my amazing family, whom I have been hugely lucky to have been
with at home in Oxford throughout these unprecedented times of the global COVID-19
pandemic.
I would like to dedicate this thesis to my grandfather, Alan Bowness, who passed away
during the weeks I was writing up, and who, although he was an art historian, was always
extremely supportive of my scientific interests and proud of my accomplishments.
Contents
List of Figures 10
List of Tables 13
List of Acronyms 14
1 Introduction 21
1.1 Regulation of gene expression . . . . . . . . . . . . . . . . . . . . . . . . . 21
1.1.1 Prokaryotic and eukaryotic gene regulation . . . . . . . . . . . . . 21
1.1.2 Structure and function of eukaryotic chromatin . . . . . . . . . . . 23
1.1.3 Classical epigenetic models of heterochromatin and euchromatin . 24
1.1.4 The Trithorax and Polycomb systems . . . . . . . . . . . . . . . . 28
1.1.5 The 3-D ‘regulatory landscape’ controlling gene expression . . . . 31
1.1.6 The genomics and gene-editing revolution . . . . . . . . . . . . . . 34
1.2 X chromosome inactivation . . . . . . . . . . . . . . . . . . . . . . . . . . 37
1.2.1 XCI - a mammalian paradigm of developmental gene regulation . . 37
1.2.2 Evolutionary origins of XCI . . . . . . . . . . . . . . . . . . . . . . 38
1.2.3 XCI in mouse development . . . . . . . . . . . . . . . . . . . . . . 39
1.2.4 Upstream regulation of Xist expression by the X-inactivation centre
(Xic) . . . . . . . . . . . . . . . . . . . . . . . . . . . . . . . . . . 41
1.2.5 Xist-mediated changes to chromatin during the establishment of XCI 43
1.2.6 Functional repeat elements of the Xist RNA . . . . . . . . . . . . . 45
1.3 Molecular pathways of XCI establishment . . . . . . . . . . . . . . . . . . 47
1.3.1 Identification of the Xist interactome . . . . . . . . . . . . . . . . . 47
1.3.2 Pathways of Xist RNA localisation . . . . . . . . . . . . . . . . . . 47
1.3.3 The central role of SPEN in Xist-mediating silencing . . . . . . . . 48
1.3.4 Xist recruits the Polycomb system to assist silencing . . . . . . . . 50
1.3.5 Other putative Xist silencing pathways . . . . . . . . . . . . . . . . 52
5
6
1.3.6 Later pathways related to XCI maintenance and Xi chromosomal
superstructure . . . . . . . . . . . . . . . . . . . . . . . . . . . . . 54
1.4 Summary and aims . . . . . . . . . . . . . . . . . . . . . . . . . . . . . . . 56
2 Materials and methods 58
2.1 Molecular cloning . . . . . . . . . . . . . . . . . . . . . . . . . . . . . . . . 58
2.1.1 Cloning of homology vectors for CRISPR-Cas9 targeting . . . . . . 58
2.1.2 Cloning of guide RNA vectors for CRISPR-Cas9 targeting . . . . . 59
2.2 Cell culture . . . . . . . . . . . . . . . . . . . . . . . . . . . . . . . . . . . 63
2.2.1 Derivation of mutant cell lines by CRISPR-Cas9-mediated homolo-
gous recombination . . . . . . . . . . . . . . . . . . . . . . . . . . . 64
2.2.2 Sub-cloning FKBP12F36V-PCGF3/5+SPENSPOC F6 . . . . . . . . 65
2.2.3 Neural progenitor cell (NPC) differentiation protocol . . . . . . . . 69
2.3 Xist RNA-FISH . . . . . . . . . . . . . . . . . . . . . . . . . . . . . . . . . 70
2.4 Western blot on nuclear extracts . . . . . . . . . . . . . . . . . . . . . . . 71
2.5 Chromatin-associated RNA extraction and sequencing (chrRNA-seq) . . . 72
2.6 Assay for transpose-accessible chromatin with sequencing (ATAC-seq) . . 73
2.7 Chromatin immunoprecipitation with sequencing (ChIP-seq) . . . . . . . 74
2.7.1 Double-crosslinked ChIP-seq for OCT4 . . . . . . . . . . . . . . . . 74
2.7.2 Native ChIP-seq for chromatin modifications . . . . . . . . . . . . 75
2.8 NGS library verification, quantification and sequencing . . . . . . . . . . . 78
2.9 Single cell sorting for Smart-seq2 scRNA-seq . . . . . . . . . . . . . . . . 78
2.10 Data analysis software and packages . . . . . . . . . . . . . . . . . . . . . 79
2.11 RNA-seq data analysis . . . . . . . . . . . . . . . . . . . . . . . . . . . . . 80
2.11.1 Mapping of paired-end fastq files . . . . . . . . . . . . . . . . . . . 80
2.11.2 Allelic analysis of chrRNA-seq data . . . . . . . . . . . . . . . . . 80
2.11.3 RPM/TPM comparisons and subcategorisation of genes . . . . . . 82
2.11.4 Relaxation of mismatch mapping parameters to verify targeted point
mutations . . . . . . . . . . . . . . . . . . . . . . . . . . . . . . . . 82
2.11.5 Approximate karyotyping using chrRNA-seq data sets . . . . . . . 83
2.12 Single cell RNA-seq (Smart-Seq2) data analysis . . . . . . . . . . . . . . . 83
2.13 ATAC-seq and ChIP-seq data analysis . . . . . . . . . . . . . . . . . . . . 85
2.13.1 Mapping of paired-end fastq files . . . . . . . . . . . . . . . . . . . 85
7
2.13.2 ATAC-seq data quality assessment . . . . . . . . . . . . . . . . . . 85
2.13.3 Calibration of ChIP-seq with Drosophila spike-in . . . . . . . . . . 85
2.13.4 Peak calling of ATAC-seq and ChIP-seq (for OCT4 and active chro-
matin modifications) . . . . . . . . . . . . . . . . . . . . . . . . . . 86
2.13.5 Allelic analysis of ATAC-seq and ChIP-seq (for OCT4 and active
chromatin modifications) . . . . . . . . . . . . . . . . . . . . . . . 87
2.13.6 Kinetic modelling of dynamic CRE accessibility loss . . . . . . . . 88
2.13.7 Motif enrichment analysis . . . . . . . . . . . . . . . . . . . . . . . 88
2.13.8 Modelling the effect of binomial sampling noise on allelic ratio cal-
culations . . . . . . . . . . . . . . . . . . . . . . . . . . . . . . . . 88
2.14 Analysis of Polycomb ChIP-seq data . . . . . . . . . . . . . . . . . . . . . 89
2.14.1 Comparison between Polycomb ChIP-seq and Xist RAP-seq . . . . 90
2.14.2 Meta-profiles . . . . . . . . . . . . . . . . . . . . . . . . . . . . . . 90
2.15 Publicly available data sets . . . . . . . . . . . . . . . . . . . . . . . . . . 91
3 Characterisation of changes to the regulatory landscape of chromatin
during the establishment of XCI 92
3.1 Introduction . . . . . . . . . . . . . . . . . . . . . . . . . . . . . . . . . . . 92
3.2 iXist-ChrX model cell line . . . . . . . . . . . . . . . . . . . . . . . . . . . 93
3.3 Precise measurement of gene silencing progression by chromatin RNA-seq 94
3.4 ATAC-seq reveals dynamic loss of chromatin accessibility from cis-regulatory
elements on Xi . . . . . . . . . . . . . . . . . . . . . . . . . . . . . . . . . 98
3.5 Dynamic loss of binding of the transcription factor OCT4 from binding sites
on Xi . . . . . . . . . . . . . . . . . . . . . . . . . . . . . . . . . . . . . . . 103
3.6 Xist-mediated changes to histone modifications . . . . . . . . . . . . . . . 107
3.7 Xist induction causes rapid depletion of active histone modifications . . . 109
3.8 High-resolution mapping of Polycomb deposition in XCI . . . . . . . . . . 111
3.9 H2AK119ub1 deposition as a proxy for Xist localisation over Xi . . . . . . 115
3.10 Discussion . . . . . . . . . . . . . . . . . . . . . . . . . . . . . . . . . . . . 118
4 Determinants of gene silencing kinetics and heterogeneity during XCI 123
4.1 Introduction . . . . . . . . . . . . . . . . . . . . . . . . . . . . . . . . . . . 123
4.2 An extended time course of X chromosome silencing . . . . . . . . . . . . 124
4.3 The overall trajectory of silencing in iXist-ChrX cells . . . . . . . . . . . . 126
8
4.4 Modelling individual gene silencing kinetics . . . . . . . . . . . . . . . . . 129
4.5 Heterogeneous dynamics of CRE accessibility loss . . . . . . . . . . . . . . 134
4.6 YY1 is a candidate factor mediating late silencing and escape . . . . . . . 139
4.7 Resolving cellular heterogeneity of silencing dynamics by single-cell RNA-seq 142
4.8 Smart-seq2 for iXist-ChrX cells over the ES-to-NPC differentiation protocol 143
4.9 Allelic single cell analysis of Xist-mediated gene silencing . . . . . . . . . 148
4.10 Genetic correlates of X chromosome silencing in single cells . . . . . . . . 152
4.11 Discussion . . . . . . . . . . . . . . . . . . . . . . . . . . . . . . . . . . . . 156
5 SPEN orchestrates the major pathway of Xist-mediated gene silencing
through its SPOC domain 164
5.1 Introduction . . . . . . . . . . . . . . . . . . . . . . . . . . . . . . . . . . . 164
5.2 SPEN is a central player in gene silencing downstream of Xist . . . . . . . 165
5.3 Redistribution of Xist-dependent Polycomb modifications upon loss of SPEN 167
5.4 Precise mutation to the SPEN SPOC domain strongly impairs gene silencing 171
5.5 SPOC-independent silencing of a subset of genes persists into NPC differ-
entiation . . . . . . . . . . . . . . . . . . . . . . . . . . . . . . . . . . . . . 175
5.6 SPENSPOCmut does not result in Polycomb redistribution . . . . . . . . . 177
5.7 Investigating the role of NCOR/SMRT downstream of SPEN . . . . . . . 181
5.8 HDAC3 only partially accounts for SPOC-dependent silencing . . . . . . . 185
5.9 Xist-mediated deacetylation in the absence of HDAC3 . . . . . . . . . . . 188
5.10 Discussion . . . . . . . . . . . . . . . . . . . . . . . . . . . . . . . . . . . . 190
6 Independent role of the Polycomb pathway in Xist-mediated silencing 195
6.1 Introduction . . . . . . . . . . . . . . . . . . . . . . . . . . . . . . . . . . . 195
6.2 Deletion of the Xist PID region completely abolishes Xi-specific Polycomb
enrichment . . . . . . . . . . . . . . . . . . . . . . . . . . . . . . . . . . . 196
6.3 Conditional degradation of PCGF3/5 by the dTAG system . . . . . . . . 198
6.4 PCGF3/5 is required for Xist-mediated Polycomb enrichment in iXist-ChrX
mESCs . . . . . . . . . . . . . . . . . . . . . . . . . . . . . . . . . . . . . . 203
6.5 Degradation of PCGF3/5 causes a moderate defect in Xist-mediated silencing 204
6.6 Defective NPC differentiation in FKBP12F36V-PCGF3/5 . . . . . . . . . . 208
6.7 Abrogation of SPEN SPOC and Polycomb together abolishes Xist-mediated
silencing . . . . . . . . . . . . . . . . . . . . . . . . . . . . . . . . . . . . . 209
9
6.8 Discussion . . . . . . . . . . . . . . . . . . . . . . . . . . . . . . . . . . . . 215
7 Conclusions and discussion 223
7.1 SPEN and PCGF3/5-PRC1 pathways function in parallel to establish gene
silencing in X inactivation . . . . . . . . . . . . . . . . . . . . . . . . . . . 223
7.2 Silencing pathways contribute towards correct Xist localisation . . . . . . 224
7.3 Mechanisms of silencing downstream of Xist . . . . . . . . . . . . . . . . . 226
7.4 Interplay between XCI and cellular differentiation . . . . . . . . . . . . . . 230
Bibliography 235
Appendix 271
List of Figures
1.1 Euchromatin and heterochromatin . . . . . . . . . . . . . . . . . . . . . . 25
1.2 Diversity of mammalian Polycomb repressive complexes . . . . . . . . . . 30
1.3 Gene regulation in 3-D . . . . . . . . . . . . . . . . . . . . . . . . . . . . . 34
1.4 XCI in mouse development . . . . . . . . . . . . . . . . . . . . . . . . . . 40
1.5 The X inactivation centre (Xic) in mouse . . . . . . . . . . . . . . . . . . 42
1.6 Early and late features of X chromosome inactivation . . . . . . . . . . . 44
1.7 Repeat elements and RNA-binding proteins (RBPs) of Xist RNA . . . . . 46
2.1 Example PCR screens from cell line derivations . . . . . . . . . . . . . . . 67
3.1 iXist-ChrX cell model and experimental time course . . . . . . . . . . . . 95
3.2 Chromatin RNA-seq precisely measures Xist-mediated gene silencing . . . 97
3.3 ATAC-seq identifies genomic cis-regulatory elements (CREs) . . . . . . . 99
3.4 Measuring accessibility loss from CREs on chrX1 by allelic ATAC-seq . . 102
3.5 Allelic ChIP-seq for the transcription factor OCT4 . . . . . . . . . . . . . 105
3.6 Genome-wide meta-profiles from ChIP-seq of chromatin modifications . . 108
3.7 Xist-mediated depletion of active chromatin modifications from Xi . . . . 110
3.8 Xist-mediated deposition of Polycomb modifications over Xi . . . . . . . . 112
3.9 Allelic analysis of Xist-dependent gain of Polycomb modifications . . . . . 114
3.10 Comparisons of Polycomb deposition and Xist RNA localisation . . . . . . 117
3.11 Models of Xist action on transcription factors . . . . . . . . . . . . . . . . 120
4.1 Schematic of the extended experimental time course in iXist-ChrX cells . 125
10
11
4.2 ChrRNA-seq over a complete time course of XCI establishment . . . . . . 127
4.3 Overall and single-gene trajectories of gene silencing . . . . . . . . . . . . 130
4.4 Exponential model of gene silencing in XCI . . . . . . . . . . . . . . . . . 132
4.5 ATAC-seq time course to complete XCI establishment . . . . . . . . . . . 135
4.6 Exponential model of cis-regulatory element (CRE) accessibility loss during
XCI . . . . . . . . . . . . . . . . . . . . . . . . . . . . . . . . . . . . . . . 137
4.7 Identification of YY1 as a candidate factor mediating late silencing and
escape . . . . . . . . . . . . . . . . . . . . . . . . . . . . . . . . . . . . . . 141
4.8 Single cell RNA-seq in iXist-ChrX cells . . . . . . . . . . . . . . . . . . . . 144
4.9 Dimensionality reduction analysis separates cells according to NPC differ-
entiation state . . . . . . . . . . . . . . . . . . . . . . . . . . . . . . . . . 146
4.10 Applying scRNA-seq to assay XCI . . . . . . . . . . . . . . . . . . . . . . 149
4.11 Dynamics of gene silencing at single cell resolution . . . . . . . . . . . . . 151
4.12 Genes correlating with XCI status in single cells . . . . . . . . . . . . . . 154
4.13 Model of YY1 function as a late-silencing factor . . . . . . . . . . . . . . . 160
5.1 Near-complete abrogation of gene silencing in SPEN–/∆RRM and Xist∆A
lines . . . . . . . . . . . . . . . . . . . . . . . . . . . . . . . . . . . . . . . 166
5.2 ChIP-seq of redistributed Polycomb modifications in SPEN–/∆RRM . . . . 168
5.3 Further analysis of Polycomb ChIP-seq in SPEN–/∆RRM . . . . . . . . . . 170
5.4 Characterisation of SPENSPOCmut in iXist-ChrX . . . . . . . . . . . . . . 172
5.5 Gene silencing defect of SPENSPOCmut mESCs upon 24 hours Xist induction 174
5.6 SPOC-independent silencing progresses with longer Xist induction . . . . 176
5.7 Incomplete silencing in SPENSPOCmut ‘NPC-like’ populations . . . . . . . 178
5.8 Near-normal pattern of Xist-mediated Polycomb enrichment in SPENSPOCmut 179
5.9 Further analysis of Polycomb ChIP-seq in SPENSPOCmut . . . . . . . . . . 180
5.10 Derivation of NCORmut and SMRTmut iXist-ChrX lines . . . . . . . . . . 183
5.11 Minor and variable silencing deficiency of NCORmut and SMRTmut lines . 184
12
5.12 Conditional HDAC3 degradation by the dTAG system . . . . . . . . . . . 186
5.13 Moderate silencing deficiency of HDAC3-FKBP12F36V degradation . . . . 187
5.14 Allelic H3K27ac ChIP-seq in WT and mutant lines . . . . . . . . . . . . . 189
6.1 Characterisation of Xist∆PID . . . . . . . . . . . . . . . . . . . . . . . . . 197
6.2 Abolition of Xist-mediated Polycomb enrichment in Xist∆PID . . . . . . . 199
6.3 Conditional PCGF3/5 degradation by the dTAG system . . . . . . . . . . 202
6.4 Polycomb ChIP-seq in FKBP12F36V-PCGF3/5 . . . . . . . . . . . . . . . 204
6.5 Intermediate silencing deficiency of FKBP12F36V-PCGF3/5 degradation . 206
6.6 Silencing defect of PCGF3/5 degradation persists with longer Xist induction 207
6.7 Incomplete silencing in FKBP12F36V-PCGF3/5 ‘NPC-like’ populations . . 209
6.8 Combined FKBP12F36V-PCGF3/5 and SPENSPOCmut abolishes silencing . 211
6.9 X chromosome elimination in FKBP12F36V-PCGF3/5+SPENSPOCmut NPCs 213
6.10 Combined Xist∆PID and SPENSPOCmut abolishes silencing . . . . . . . . . 214
6.11 PCGF3/5 degradation causes Xist RNA dispersal by super-resolution RNA-
FISH . . . . . . . . . . . . . . . . . . . . . . . . . . . . . . . . . . . . . . . 218
6.12 The role of Polycomb in gene repression . . . . . . . . . . . . . . . . . . . 221
7.1 Model of how SPEN and Polycomb pathways contribute to Xist RNA lo-
calisation . . . . . . . . . . . . . . . . . . . . . . . . . . . . . . . . . . . . 226
7.2 Chromatin-based pathways of Xist-mediated gene silencing . . . . . . . . 228
7.3 Heterogeneous silencing kinetics within a gene cluster close to Xist . . . . 229
7.4 Expression levels of SPEN and PCGF3/5-PRC1 genes over ES to NPC
differentiation . . . . . . . . . . . . . . . . . . . . . . . . . . . . . . . . . . 231
7.5 Late silencing pathways linked to SMCHD1 function . . . . . . . . . . . . 233
A1 Karyotype estimates from chrRNA-seq: SPEN/HDAC3 mutants . . . . . 277
A2 Karyotype estimates from chrRNA-seq: NCOR/SMRT mutants . . . . . . 278
A3 Karyotype estimates from chrRNA-seq: Polycomb pathway and combined
SPEN/Polycomb mutants . . . . . . . . . . . . . . . . . . . . . . . . . . . 279
List of Tables
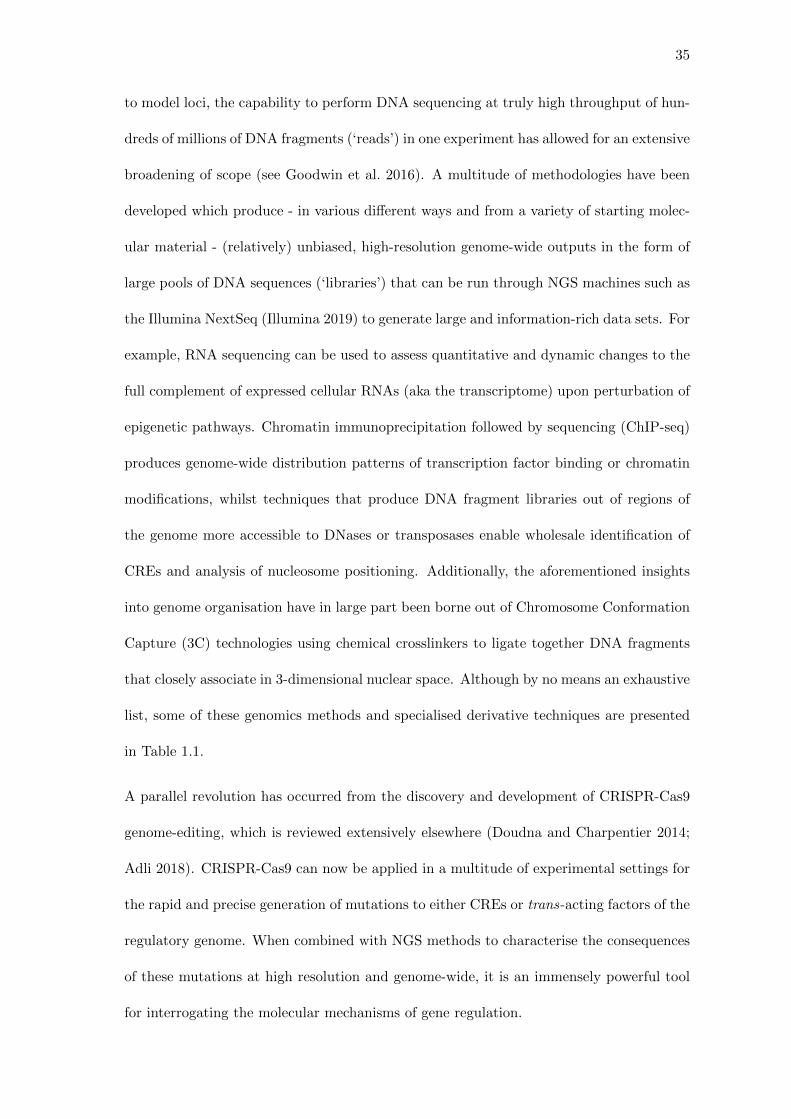
1.1 NGS methods for a wide variety of different purposes in gene regulation
research . . . . . . . . . . . . . . . . . . . . . . . . . . . . . . . . . . . . . 36
2.1 Homology vectors and other plasmids used in this study . . . . . . . . . . 60
2.2 Gibson cloning oligos used to make homology vectors . . . . . . . . . . . . 61
2.3 Primers for targeted mutagenesis of vectors . . . . . . . . . . . . . . . . . 62
2.4 CRISPR-Cas9 sgRNAs and reverse complement oligos . . . . . . . . . . . 62
2.5 Primers for PCR screening during cell line derivation . . . . . . . . . . . . 68
2.6 Antibodies used in this study . . . . . . . . . . . . . . . . . . . . . . . . . 77
2.7 Primers used for verifying ChIP enrichment . . . . . . . . . . . . . . . . . 77
2.8 Transcription Start Site Enrichment (TSSE) scores for ATAC-seq libraries 86
A1 Key information and classification of chrX genes . . . . . . . . . . . . . . 272
A2 Genes that positively correlate with allelic ratio in single cells . . . . . . . 275
A3 Genes that negatively correlate with allelic ratio in single cells . . . . . . . 276
A4 Calibration for H3K27ac ChIP in FKBP12F36V-HDAC3 . . . . . . . . . . 280
A5 Calibration for H2AK119ub1 and H3K27me3 ChIP in FKBP12F36V-PCGF3/5 281
13
List of Acronyms
3C Chromosome Conformation Capture
3D-SIM 3D-Structured Illumination Microscopy
4C Chromosome Conformation Capture-on-Chip
AR Allelic Ratio, usually Xi/(Xi+Xa)
ATAC-seq Assay for Transposase-Accessible Chromatin using sequencing
BAF BRG1- or BRM-Associated factors
bp base pair
BRG1 Brahma-Related Gene 1
BSA Bovine Serum Albumin
CAGE-seq Cap Analysis Gene Expression Sequencing
CAP Catabolite Activator Protein
Cas9 CRISPR-associated protein 9
CBX Chromobox
ChIP Chromatin Immunoprecipitation
chrRNA-seq Chromatin RNA-seq
chrX1 Chromosome X1 region
CIZ1 Cip1-Interacting Zinc finger protein
CLIP Cross-Linking Immunoprecipitation
COMPASS Complex Of Proteins Associated with Set1
CpG 5’-C-phosphate-G-3’ dinucleotides
CPM Counts Per Million
CRE Cis-Regulatory Element
CRISPR Clustered Regularly Interspaced Short Palindromic Repeats
CTCF CCCTC-binding Factor
CTRL Control
CUT&RUN Cleavage Under Targets and Release Using Nuclease
14
15
DamID DNA Adenine Methyltransferase Identification
DAPI 4’,6-diamidino-2-phenylindole
DCC Dosage Compensation Complex
DMSO Dimethyl Sulfoxide
DNAme DNA methylation
DNase Deoxyribonuclease
DNA deoxyribonucleic acid
DNMT DNA Methyltransferase
Dox Doxycycline
DTT Dithiothreitol
eCLIP Enhanced Cross-Linking Immunoprecipitation
EDTA Ethylenediamine Tetraacetic Acid
EED Embryonic Ectoderm Development
EGF Epidermal Growth Factor
EMSA Electrophoretic Mobility Shift Assay
ENCODE Encyclopedia of DNA Elements
ERV Endogenous Retrovirus
EZH1/2 Enhancer of Zeste Homolog 1/2
FACS Fluorescence-Activated Cell Sorting
FCS Foetal Calf Serum
FDR False Discovery Rate
FGF Fibroblast Growth Factor
FISH Fluorescent In Situ Hybridization
FKBP FK506 Binding Protein
FOXA1 Forkhead box protein A1
FRAP Fluorescence Recovery After Photobleaching
GEO Gene Expression Omnibus
GO Gene Ontology
GRO-seq Global Run-on Sequencing
H2AK119ub1 Monoubiquitination of Lysine 119 of Histone H2A
16
H3K27ac Acetylation of Lysine 27 of Histone H3
H3K27me1/2/3 Mono/Di/Tri-methylation of Lysine 27 of Histone H3
H3K36me3 Trimethylation of Lysine 36 of Histone H3
H3K4me1 Monomethylation of Lysine 4 of Histone H3
H3K4me3 Trimethylation of Lysine 4 of Histone H3
H3K9ac Acetylation of Lysine 9 of Histone H3
H3K9me2/3 Di/Tri-methylation of Lysine 9 of Histone H3
H4K20me1 Monomethylation of Lysine 20 of Histone H4
HDAC Hisone Deacetylase Complex
HDR Homology Directed Repair
HiChIP Hi-C Chromatin Immunoprecipitation
hnRNP Heterogeneous Nuclear Ribonucleoprotein Complex Protein
HP1 Heterochromatin Protein 1
iCLIP Individual-nucleotide resolution Cross-Linking Immunoprecipitation
IDR Intrinsically Disordered Region
IGV Integrative Genome Browser
Is1Ct/Is(In7;X)1Ct Insertion, Inverted Chr7 piece into ChrX, Cattanach 1
iXist-ChrX Inducible Xist on Chromosome X
JARID2 Jumonji, AT Rich Interactive Domain 2
KDM Lysine Demethylase
KH hnRNP K Homology
KLF Kruppel-Like Factors
KO Knockout
LBR Lamin B Receptor
LBS Lamin B Receptor Binding Site
LIF Leukemia Inhibitory Factor
LINE Long Interspersed Nuclear Element
lncRNA Long non-coding RNA
m6A N6-Methyladenosine
MAPK Mitogen-Activated Protein Kinase
17
MBD Methyl-CpG Binding Domain
MECP2 Methyl CpG Binding Protein 2
MEF Mouse Embryonic Fibroblast
MeRIP-seq Methylated RNA Immunoprecipitation sequencing
mESC Mouse Embryonic Stem Cells
METTL3/14 Methyltransferase-like 3/14
MINT Msx2-Interacting Nuclear Target protein
miRNA microRNA
MNase-seq Micrococcal Nuclease digestion with deep sequencing
MNase Micrococcal Nuclease
MPRA Massively Parallel Reporter Assay
MSL Male-Specific Lethal
NCBI National Center for Biotechnology Information
NCOR Nuclear Receptor Corepressor
ncPRC1 Non-Canonical Polycomb Repressive Complex 1
NET-seq Native Elongating Transcript Sequencing
NGS Next-Generation Sequencing
NPC Neural Progenitor Cell
NuRD Nucleosome Remodelling and Deacetylase
OCT4 Octamer-binding Transcription Factor 4
PAM Protospacer Adjacent Motif
PARIS Psoralen Analysis of RNA Interactions and Structures
PBS Phosphate Buffered Saline
PCA Principle Component Analysis
PCGF Polycomb Group RING Finger protein
PcG Polycomb Group
PCR Polymerase Chain Reaction
PEV Position Effect Variegation
PIC Protease Inhibitor Cocktail
PID Polycomb Interacting Domain
18
piRNA PIWI-interacting RNA
PIWI P-element Induced WImpy testis
polyA Polyadenylation
PRC1 Polycomb Repressive Complex 1
PRC2 Polycomb Repressive Complex 2
PRE Polycomb Response Elements
PTBP1 Polypyrimidine Tract-Binding Protein 1
QC Quality Control
RAP-seq RNA Antisense Purification sequencing
RA Retinoic Acid
RBBP4/7 Retinoblastoma Binding Protein 4/7
RBM15 RNA Binding Motif protein 15
RBP RNA-Binding Proteins
REPO Recruit Polycomb domain
RISC RNA-Induced Silencing Complex
RNA PolII RNA Polymerase II complex
RNA-seq RNA-sequencing
RNAi RNA Interference
RNA Ribonucleic Acid
RNF12 Ring Finger protein 12
RNP Ribonucleoprotein
RPM Reads Per Million
RRM RNA Recognition Motif
rRNA Ribosomal RNA
Rsx RNA on the Silent X
RYBP RING1 and YY1-Binding Protein
SAF-A Scaffold Attachment Factor A
scRNA-seq Single Cell RNA sequencing
SETDB1 SET Domain Bifurcated Histone Lysine Methyltransferase 1
SET Su(var)3-9, Enhancer-of-zeste and Trithorax
19
sgRNA Single Guide RNA
SHARP SMRT/HDAC1-Associated Repressor Protein
SMCHD1 Structural Maintenance of Chromosomes Hinge Domain containing
protein 1
SMC Structural Maintenance of Chromosomes
SMRT Silencing Mediator for Retinoid or Thyroid-hormone receptors
SNP Single Nucleotide Polymorphism
SOX2 SRY(Sex Determining Region Y)-box 2
SPEN Split End
SPOC Spen Paralog and Ortholog C-terminal
SRA Steroid Receptor Activator
STARR-seq Self-Transcribing Active Regulatory Region sequencing
Su(var) Suppressor of Variegation
SUZ12 Suppressor of Zeste 12
SWI/SNF Switch/Sucrose Non-Fermentable
t1/2 Silencing Halftime
TAD Topologically Associating Domain
TE Transposable Element
TE Tris-EDTA Buffer
TF Transcription Factor
TPM Transcripts Per Kilobase Million
TrxG Trithorax Group
TSA Trichostatin A
tSNE T-distributed Stochastic Neighbour Embedding
TSSE Transcription Start Site Enrichment
TSS Transcription Start Site
TT-seq Transient Transcriptome sequencing
UCSC University of California, Santa Cruz
UMI Unique Molecular Identifier
WIMM Weatherall Institute of Molecular Medicine
WTAP Wilms Tumor 1 Associated Protein

20
WT Wild-Type
Xa Active X Chromosome
XCI X Chromosome Inactivation
Xic X-Inactivation Centre
Xist/XIST X-Inactive Specific Transcript
Xi Inactive X Chromosome
YAF2 YY1-Associated Factor 2
YY1 Yin Yang 1
Chapter 1
Introduction
1.1 Regulation of gene expression
1.1.1 Prokaryotic and eukaryotic gene regulation
The genetic material of living organisms takes the form of sequences of base-pairing de-
oxynucleotides assembled into long polymeric chains of DNA. Genomes range in total size
from 1.6x10⁵ (Nakabachi et al. 2006) to 1.5x10¹¹ (Pellicer et al. 2010) base pairs and typ-
ically contain several thousand genes encoding traits of an organism. DNA is a stable
molecule particularly well suited for replication and inheritance but the genetic informa-
tion it contains must be ‘read’ to perform biological functions in cells. The central dogma
of molecular biology states that DNA is organised into genes, which are first transcribed
into single-stranded messages of RNA, then translated into proteins, the primary building
blocks and molecular effectors that perform dynamic biological processes (Crick 1970).
Alongside post-transcriptional and (post-)translational regulation, regulation of gene ex-
pression at the level of transcription is a fundamental tenet of all living organisms.
Single-celled prokaryotes have relatively small and ‘simple’ genomes, but nevertheless must
regulate gene expression both quantitatively, to produce appropriate amounts of gene prod-
ucts for the various functions of the cell, and temporarily in response to stimuli from their
external environments. The famous paradigm of the E. Coli Lac operon illustrates key
principles of gene regulation in bacteria (Jacob and Monod 1961). In this system, the
21
22
Lac repressor protein binds to an upstream cis operator DNA sequence to block the tran-
scription of genes encoding enzymes for lactose utilization. Upon a change in the nutrient
source to lactose, repression is relieved by allosteric binding of the metabolite allolactose
to the Lac repressor, inducing a conformational protein change and thus causing release
from the DNA operator sequence. Another DNA-binding protein, catabolite activator pro-
tein (CAP), acts as an activator of the Lac genes only when glucose (the preferred energy
source) is absent from the growth media (Hirsh and Schleif 1973). Similar genetic switches
based on the interplay between DNA-binding transcriptional activators or repressors form
the predominant models of gene regulation in prokaryotes (Struhl 1999).
By contrast, eukaryotic genomes are typically greater in both size and regulatory com-
plexity. In multicellular eukaryotes, specialised patterns of gene expression enable the
differentiation of cells into the hundreds of diverse cell types that make up functioning
tissues. The regulatory processes governing these transcriptional programmes and their
inheritance over cell divisions are collectively referred to as ‘epigenetics’1. Dynamic epi-
genetic regulation is particularly important in development from a fertilised zygote to a
mature multicellular organism, throughout which gene expression must be tightly con-
trolled in space and time but also plastic to variable external conditions, both within
individual organisms and to evolutionary selective pressures. In addition to being of great
academic interest as fundamental to life, understanding the complex mechanisms of de-
velopmental gene regulation is vital in relation to human disease. For example, many
genetic diseases are caused by non-protein-coding mutations that perturb gene expression
patterns (reviewed in Spielmann and Mundlos 2016), and reversion of cellular transcrip-
tional programmes to highly proliferative pluripotent states is a central feature of many
cancers. This often involves disruption to key epigenetic regulators such as those discussed
1An alternative definition of the term epigenetics refers only to processes that maintain transcriptionalmemory indefinitely over cell divisions. At its strictest, this limits epigenetics to discussion of DNAmethylation, which is the most stably maintained form of information in the genome above the level ofDNA sequence (Deans and Maggert 2015).
23
throughout this thesis (reviewed in Baylin and Jones 2016).
1.1.2 Structure and function of eukaryotic chromatin
Most of the eukaryotic genome is contained in the specialised organelle of the cell nu-
cleus. Within the nucleus, DNA forms continuous strands of millions of base pairs called
chromosomes, which are the units of cellular and organismal replication and inheritance
that can be visualised by microscopy as they condense and segregate during processes
of cell division. Each cell typically has at least one maternal and one paternal copy of
each chromosome, with the exception of sex chromosomes (chromosomes X and Y in most
mammals) that have unique evolutionary origins and functions related to sexual reproduc-
tion. In the cell cycle interphase, during which most gene expression occurs, chromosomes
are more decondensed and interspersed but still form largely discreet territories within the
nucleus (Cremer and Cremer 2010).
At the molecular level chromosomal DNA is packaged into chromatin, a macromolecular
complex that has a basic structure of 1.65 turns of DNA (146bp) wrapped around an
octameric complex of two copies of each of the four core histone proteins (H2A, H2B, H3
and H4) to collectively form nucleosomes (Figure 1.1; Kornberg 1977, Luger et al. 1997).
A fifth histone protein, H1, functions to protect the free (∼20bp) ‘linker’ DNA between
nucleosome core particles in higher-order packaging. Chromatin facilitates or otherwise
affects many of the complex processes of eukaryotic transcriptional regulation. For exam-
ple, nucleosomes need to be remodelled to allow the molecular transcriptional machinery,
which for most eukaryotic protein-coding genes centres around the RNA Polymerase II
complex (reviewed in Schier and Taatjes 2020), to access promoter sequences at the start
of target genes. Similarly, nucleosomes can either act as a hindrance to or promote the
binding of other protein factors with various functions in gene regulation, which has led
to the concept of chromatin ‘accessibility’ as a key feature of the epigenome (reviewed in
24
Klemm et al. 2019). Thus, beyond acting as a protective sheath for DNA and a barrier
to untimely gene expression, it is now evident that chromatin is dynamically adjusted
by regulatory cues in cells to alter transcriptional programmes during development and
disease.
In addition to structured globular domains that form the core nucleosome particle, each hi-
stone possesses a flexible N-terminal ‘tail’ that protrudes from the nucleosome and contains
numerous residues that can act as substrates for post-translational chemical modification.
Notably, specific histone modifications have been found to act as marks of either tran-
scriptional activity or gene repression (see Kouzarides 2007 for an early review). Highly
expressed genes are generally associated with modifications such as H3 and H4 acetyla-
tion and methylation of lysine 4 of histone 3 (H3K4me3). Conversely, constitutively silent
regions and in the genome are associated with H3K9me3 and DNA methylation. ‘Fac-
ultatively’ repressed genes are marked by H3K27me3 and ubiquitylation of histone H2A
(H2AK119ub1) and are of particular interest as these genes often need to be switched on
or off at the right times and places during development (see 1.1.4). In general, rather
than acting as binary signals for single genes, coincidence of multiple modifications within
wider regions demarcates characteristic chromatin ‘states’, illustrated in Figure 1.1. Chro-
matin states are established and maintained epigenetically over cell divisions by suites of
chromatin-modifying complexes incorporating functions as writers, readers and erasers
of histone modifications (reviewed in Zhang et al. 2015), which have been defined over
decades of studies in model systems such as those outlined below.
1.1.3 Classical epigenetic models of heterochromatin and euchromatin
The concept of distinct regions of active and repressive chromatin dates back almost a
century to observations made by Emil Heitz of densely-staining (‘heterochromatic’) and
lightly-staining (‘euchromatic’) regions of chromosomes in cell nuclei by microscopy (Heitz
25
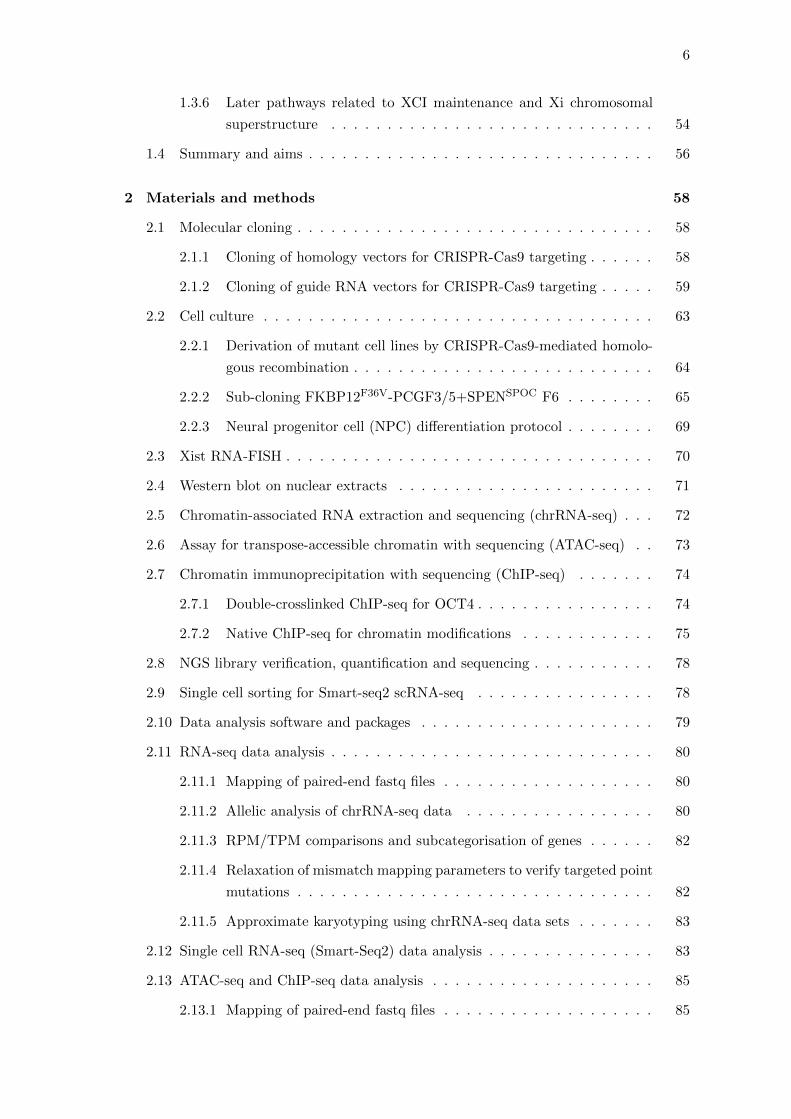
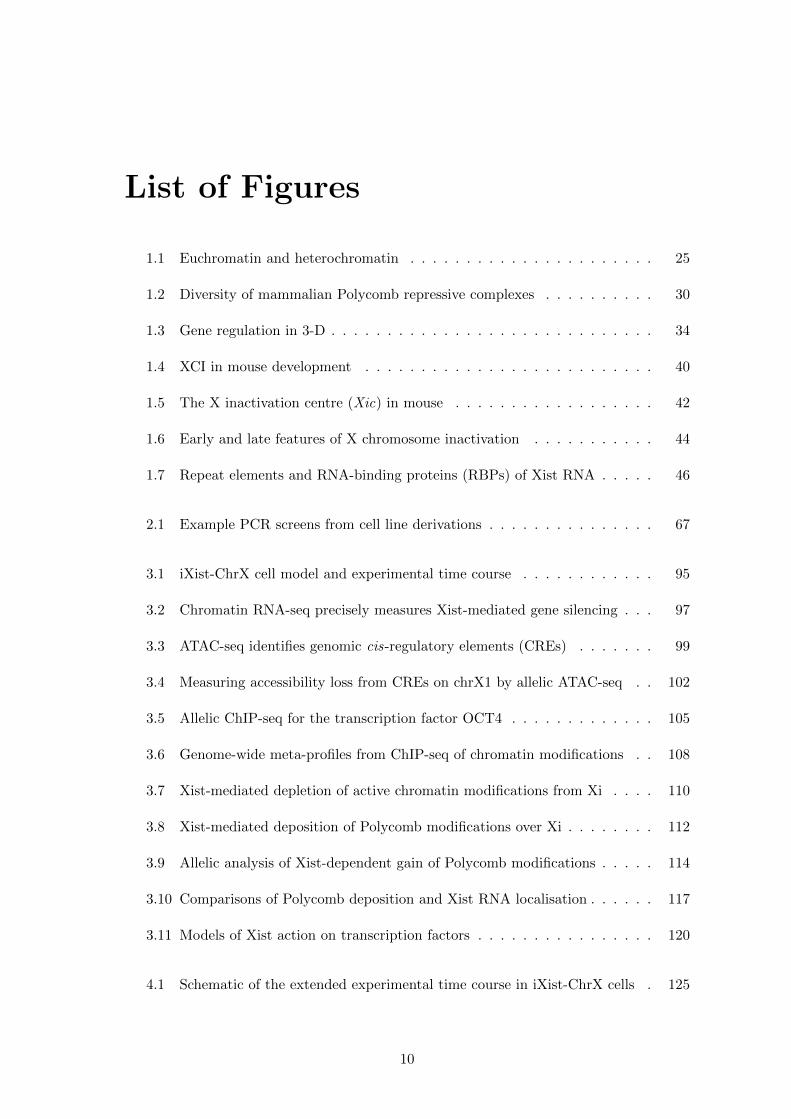
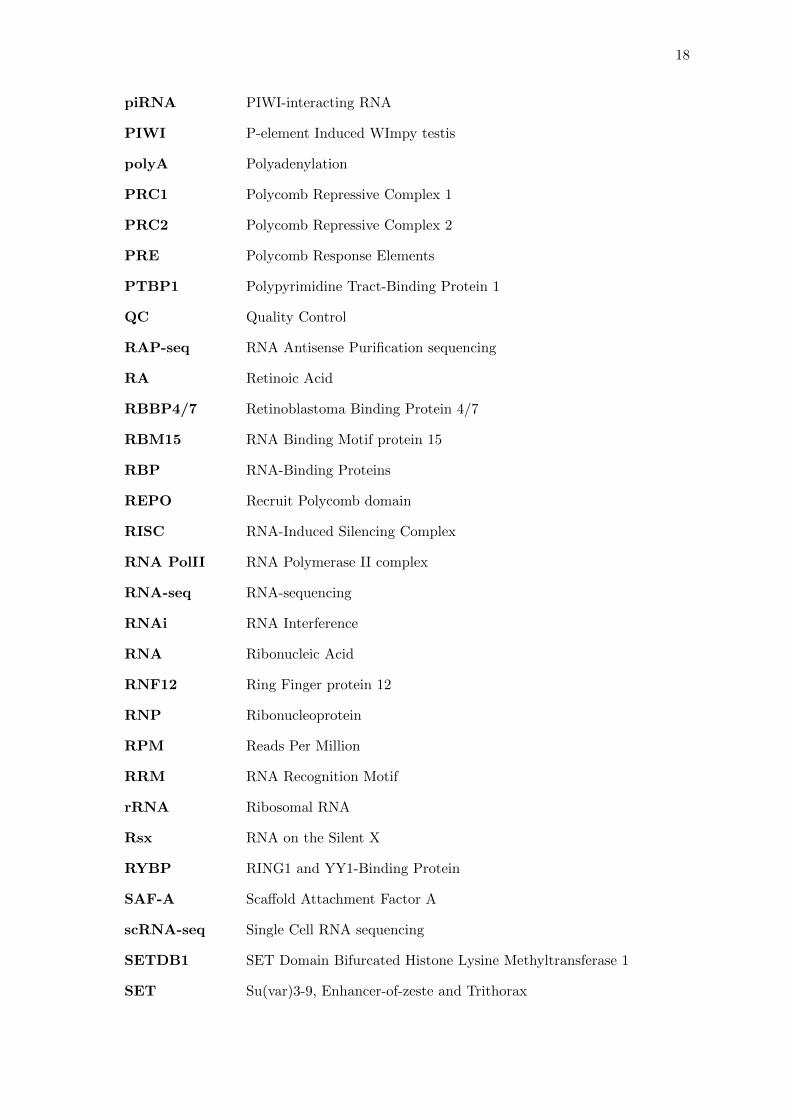
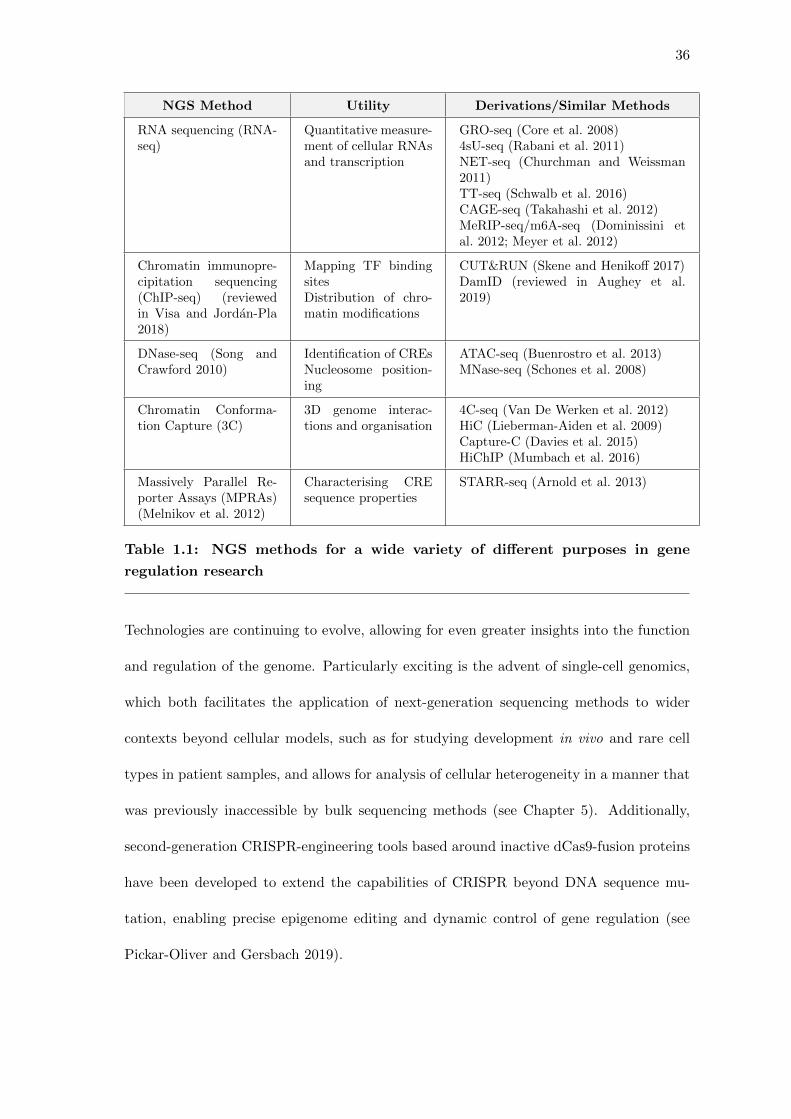
EuchromatinNucleosome
RNA Polymerase II Promoter of expressed gene
Corepressor
H3K27ac H2AK119ub1
H3K27me3
H3K9me3
H3K9acH3K4me1/3H3K36me3Non-methylated CpG DNAMethylated DNA
Epigenetic propagationCoactivator / remodeler
Constitutive HeterochromatinFacultative Heterochromatin
H4
Transcription Factor
H2B
H2B
H3
H3
H4 H1H2A
H2A
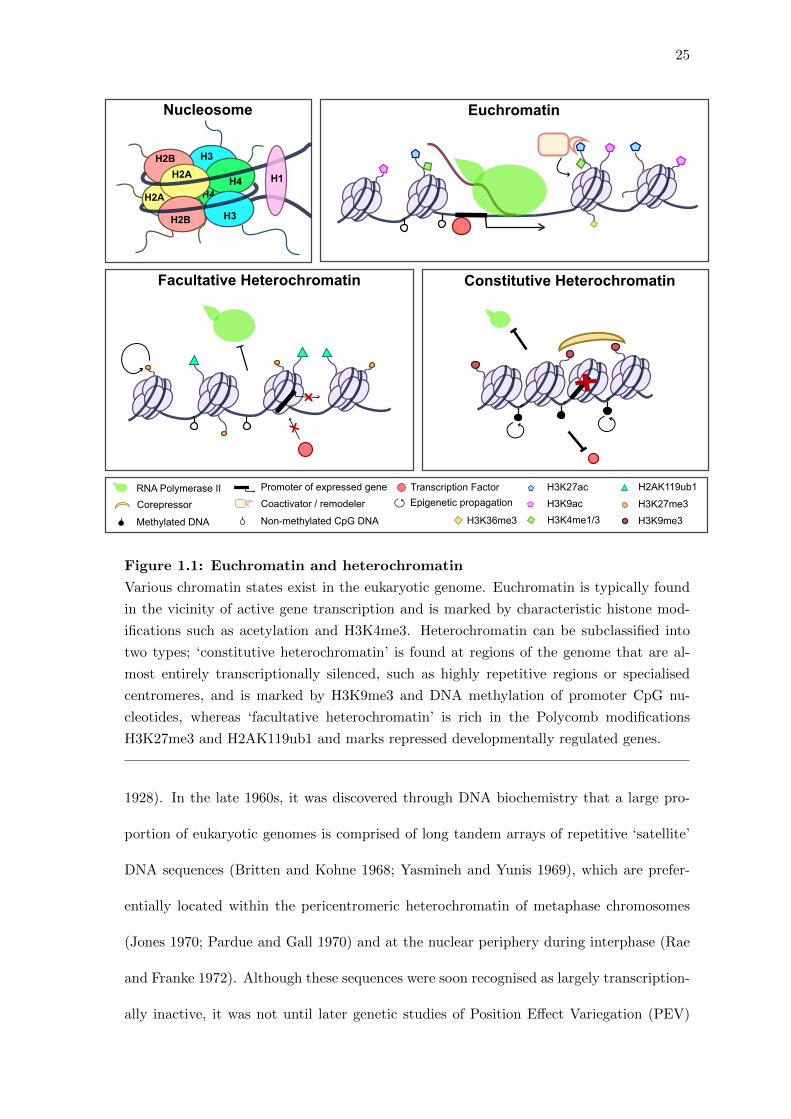
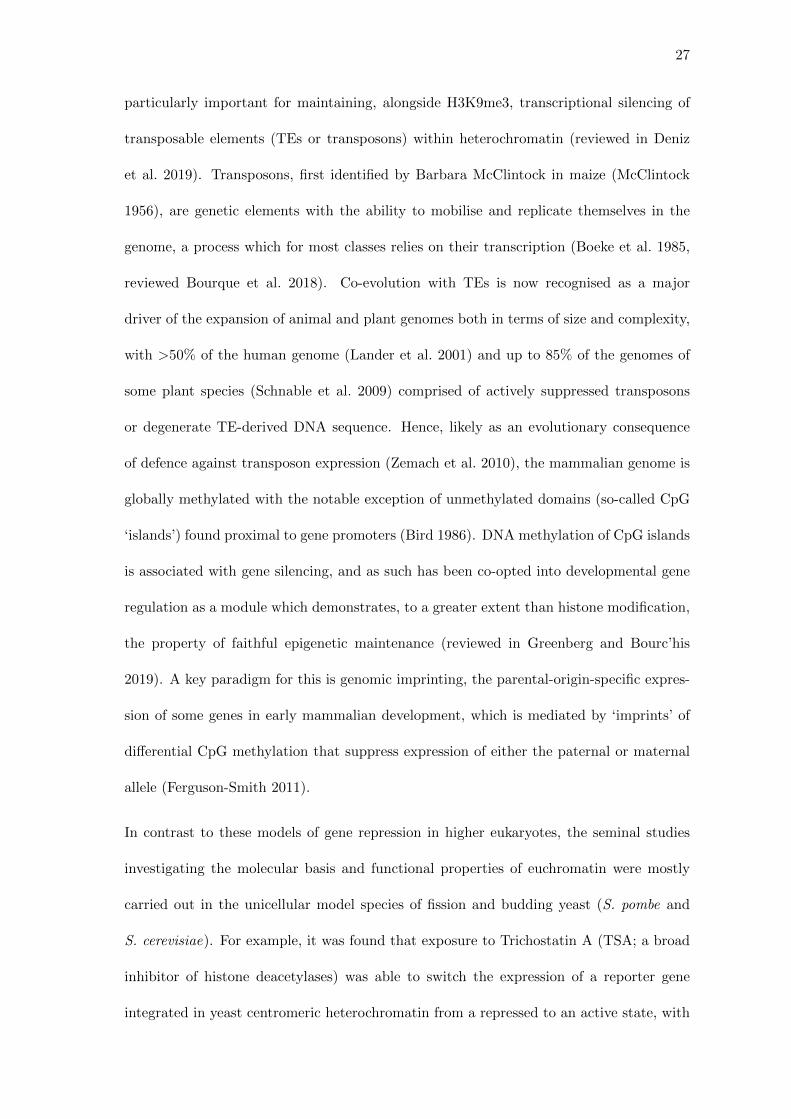
Figure 1.1: Euchromatin and heterochromatin
Various chromatin states exist in the eukaryotic genome. Euchromatin is typically found
in the vicinity of active gene transcription and is marked by characteristic histone mod-
ifications such as acetylation and H3K4me3. Heterochromatin can be subclassified into
two types; ‘constitutive heterochromatin’ is found at regions of the genome that are al-
most entirely transcriptionally silenced, such as highly repetitive regions or specialised
centromeres, and is marked by H3K9me3 and DNA methylation of promoter CpG nu-
cleotides, whereas ‘facultative heterochromatin’ is rich in the Polycomb modifications
H3K27me3 and H2AK119ub1 and marks repressed developmentally regulated genes.
1928). In the late 1960s, it was discovered through DNA biochemistry that a large pro-
portion of eukaryotic genomes is comprised of long tandem arrays of repetitive ‘satellite’
DNA sequences (Britten and Kohne 1968; Yasmineh and Yunis 1969), which are prefer-
entially located within the pericentromeric heterochromatin of metaphase chromosomes
(Jones 1970; Pardue and Gall 1970) and at the nuclear periphery during interphase (Rae
and Franke 1972). Although these sequences were soon recognised as largely transcription-
ally inactive, it was not until later genetic studies of Position Effect Variegation (PEV)
26
in Drosophila that the molecular players of constitutive heterochromatin began to be
unveiled.
The phenomenon of PEV occurs when the expression status of a gene is variable due to
its placement in or near heterochromatin. It was first studied in the context of a mo-
saic (‘variegated’) phenotype of white/red eye facets in Drosophila melanogaster (Muller
1930), and later this same model was used for a series of genetic screens for mutations
that enhanced or suppressed variegation (Su(var)) (reviewed in Henikoff 1990). In par-
ticular, many of the Su(var) loci have since been identified and biochemically charac-
terised as encoding the molecular components of the epigenetic module of constitutive
heterochromatin, centred predominantly upon the histone modification H3K9me3. For
example, the proteins SU(VAR)3-9 and SETDB1 function enzymatically as ‘writers’ of
H3K9me3 via SET methyltransferase domains, whereas the ‘reader’ protein HP1 recog-
nises H3K9me3 though its chromodomain and has an important role in heterochromatin
assembly. Although molecularly and functionally distinct varieties of heterochromatin ex-
ist in the genome, writers, readers and erasers of H3K9me3 are broadly conserved as the
central components of the constitutive heterochromatin module throughout eukaryotes
(see Allshire and Madhani 2018 for a review of the principles of heterochromatin).
In studies of other model systems, such as the filamentous fungi Neurospora crassa and
flowering plant Arabidopsis thaliana, H3K9me3 was found to be closely linked to DNA
methylation (Tamaru and Selker 2001; Jackson et al. 2002; Freitag et al. 2004), another
epigenetic module associated with heterochromatin and repression of gene expression.
DNA methylation is found at cytosine nucleotides (predominantly those followed by gua-
nine) throughout the genomes of most higher eukaryote species, and similarly to chro-
matin modification involves the interplay of suites of DNA methyltransferase (DNMTs)
‘writer’ and methyl-CpG binding domain (MBD) ‘reader’ proteins. DNA methylation is
27
particularly important for maintaining, alongside H3K9me3, transcriptional silencing of
transposable elements (TEs or transposons) within heterochromatin (reviewed in Deniz
et al. 2019). Transposons, first identified by Barbara McClintock in maize (McClintock
1956), are genetic elements with the ability to mobilise and replicate themselves in the
genome, a process which for most classes relies on their transcription (Boeke et al. 1985,
reviewed Bourque et al. 2018). Co-evolution with TEs is now recognised as a major
driver of the expansion of animal and plant genomes both in terms of size and complexity,
with >50% of the human genome (Lander et al. 2001) and up to 85% of the genomes of
some plant species (Schnable et al. 2009) comprised of actively suppressed transposons
or degenerate TE-derived DNA sequence. Hence, likely as an evolutionary consequence
of defence against transposon expression (Zemach et al. 2010), the mammalian genome is
globally methylated with the notable exception of unmethylated domains (so-called CpG
‘islands’) found proximal to gene promoters (Bird 1986). DNA methylation of CpG islands
is associated with gene silencing, and as such has been co-opted into developmental gene
regulation as a module which demonstrates, to a greater extent than histone modification,
the property of faithful epigenetic maintenance (reviewed in Greenberg and Bourc’his
2019). A key paradigm for this is genomic imprinting, the parental-origin-specific expres-
sion of some genes in early mammalian development, which is mediated by ‘imprints’ of
differential CpG methylation that suppress expression of either the paternal or maternal
allele (Ferguson-Smith 2011).
In contrast to these models of gene repression in higher eukaryotes, the seminal studies
investigating the molecular basis and functional properties of euchromatin were mostly
carried out in the unicellular model species of fission and budding yeast (S. pombe and
S. cerevisiae). For example, it was found that exposure to Trichostatin A (TSA; a broad
inhibitor of histone deacetylases) was able to switch the expression of a reporter gene
integrated in yeast centromeric heterochromatin from a repressed to an active state, with
28
histone hyperacetylation heritable over multiple generations (Ekwall et al. 1997). Likewise,
the Set1/COMPASS H3K4 methyltransferase complex was first purified and characterised
in yeast (Miller et al. 2001; Briggs et al. 2001). H3K4me3 was later found to be associated
with transcriptional activation in a variety of eukaryotic species (Martin and Zhang 2005).
At the beginning of this millennium, these discoveries and the emergence of genome-
wide correlations between histone modifications and gene expression led to considerable
excitement around the concept of a ‘histone code’ of epigenetic information on top of
the DNA sequence (Strahl and Allis 2000; Jenuwein and Allis 2001). However, much
research since has called into question stable inheritance of euchromatin (Margueron and
Reinberg 2010), and indeed if active histone modifications such as H3K4me3 actually
instruct or merely correlate with transcription (Howe et al. 2017; Morgan and Shilatifard
2020). Nevertheless, understanding how chromatin relates to gene expression is no less
important or interesting today, even if it is far more dynamic and complex than initially
thought.
1.1.4 The Trithorax and Polycomb systems
In his early studies, Heitz recognised that some regions of the nucleus were darkly stained
only in certain cell lineages and suggested this ‘facultative’ heterochromatin could have
distinct properties and important implications for development. The molecular basis of
facultative heterochromatin started to be unveiled with the identification of the Tritho-
rax and Polycomb families of genes by genetic screens for disruption to the segmentation
pattern of the Drosophila body plan during development (reviewed in Schuettengruber
et al. 2017). The Trithorax group (TrxG) family of proteins, first identified as main-
taining active expression states of Hox patterning genes after the initial transcriptional
regulators disappear from the embryo, have since broadly been found to overlap with the
characteristic complexes of the euchromatin module. Thus, TrxG proteins include chro-
29
matin modellers such as the SWI/SNF complex, components of the core transcriptional
machinery, and SET-domain containing H3K4me3 methyltransferases. These are reviewed
in greater detail in (Kingston and Tamkun 2014).
By contrast, the Polycomb genes, first identified as maintaining Hox gene repression,
were found to encode a suite of chromatin regulatory complexes almost entirely distinct
from the machineries of constitutive heterochromatin. Drosophila Polycomb group (PcG)
proteins and their mammalian homologues have since been extensively characterised by
biochemical, genetic and functional genomics experiments. Polycomb proteins assem-
ble as complexes of two main forms: Polycomb repressive complex 1 (PRC1), which
catalyses H2AK119ub1, and Polycomb repressive complex 2 (PRC2), which catalyses
H3K27me1/2/3 (reviewed in Aranda et al. 2015; Laugesen et al. 2019). Within these
groups, the diversity of subunits of PRC1 and PRC2 in mammals results in a wide variety
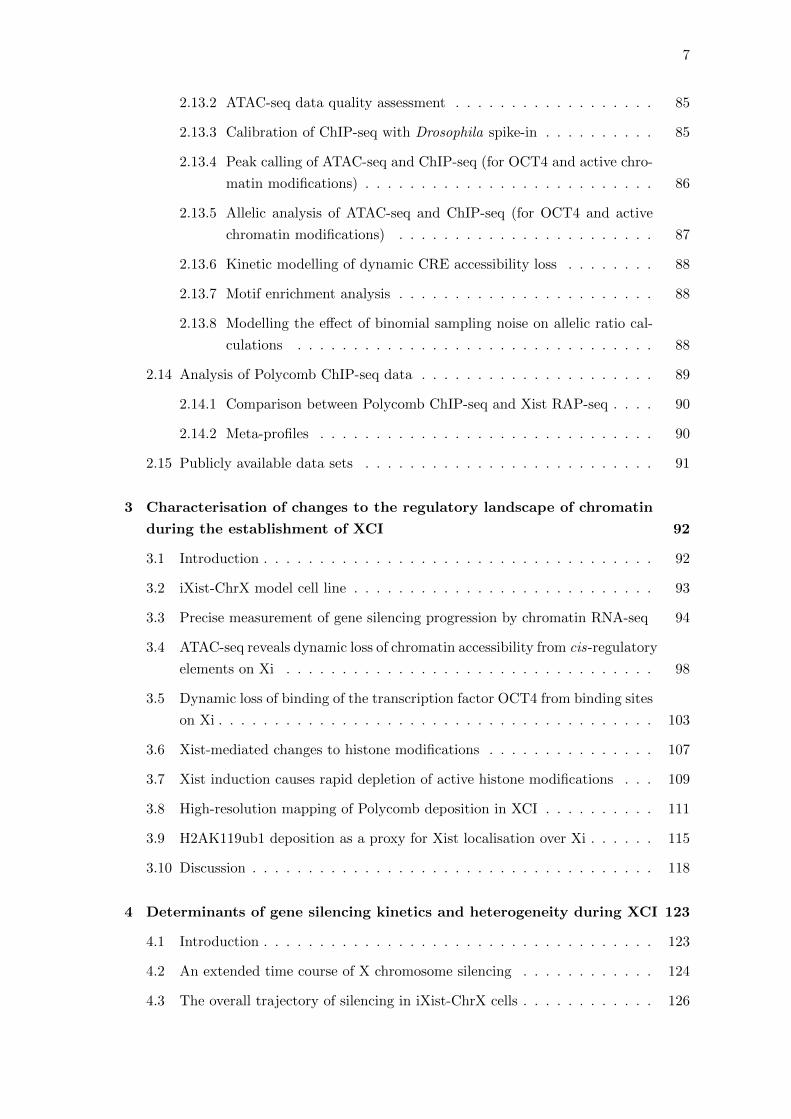
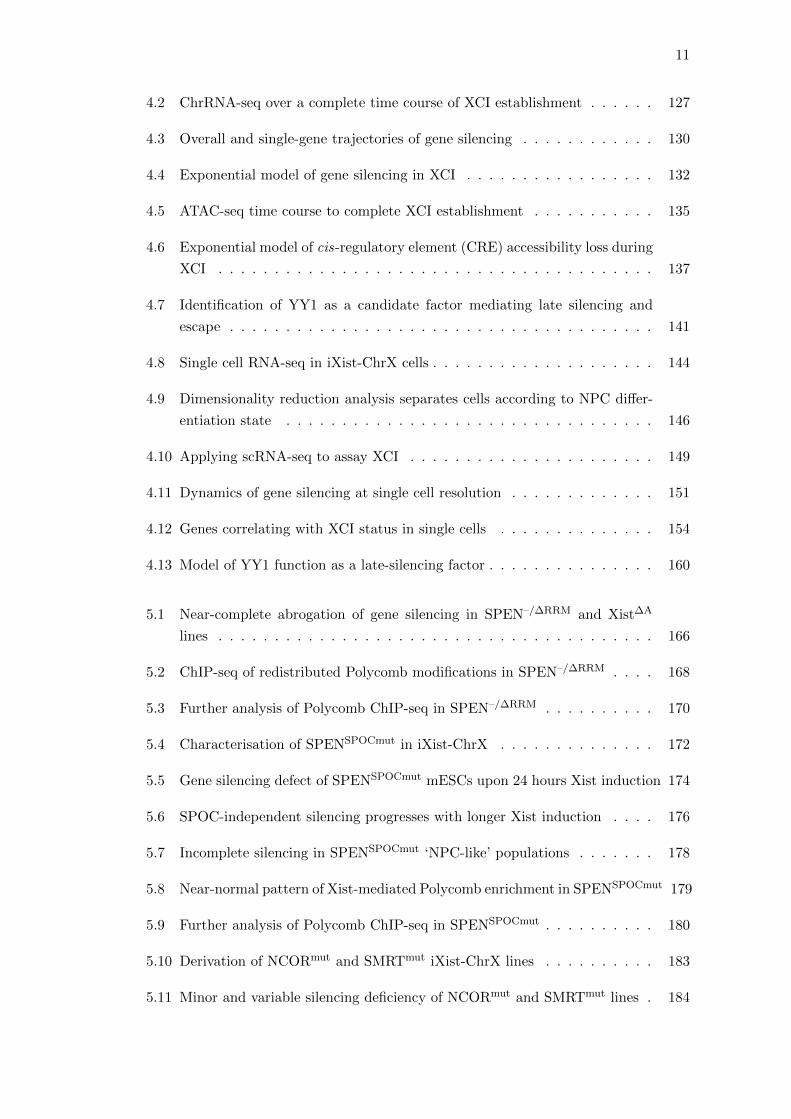
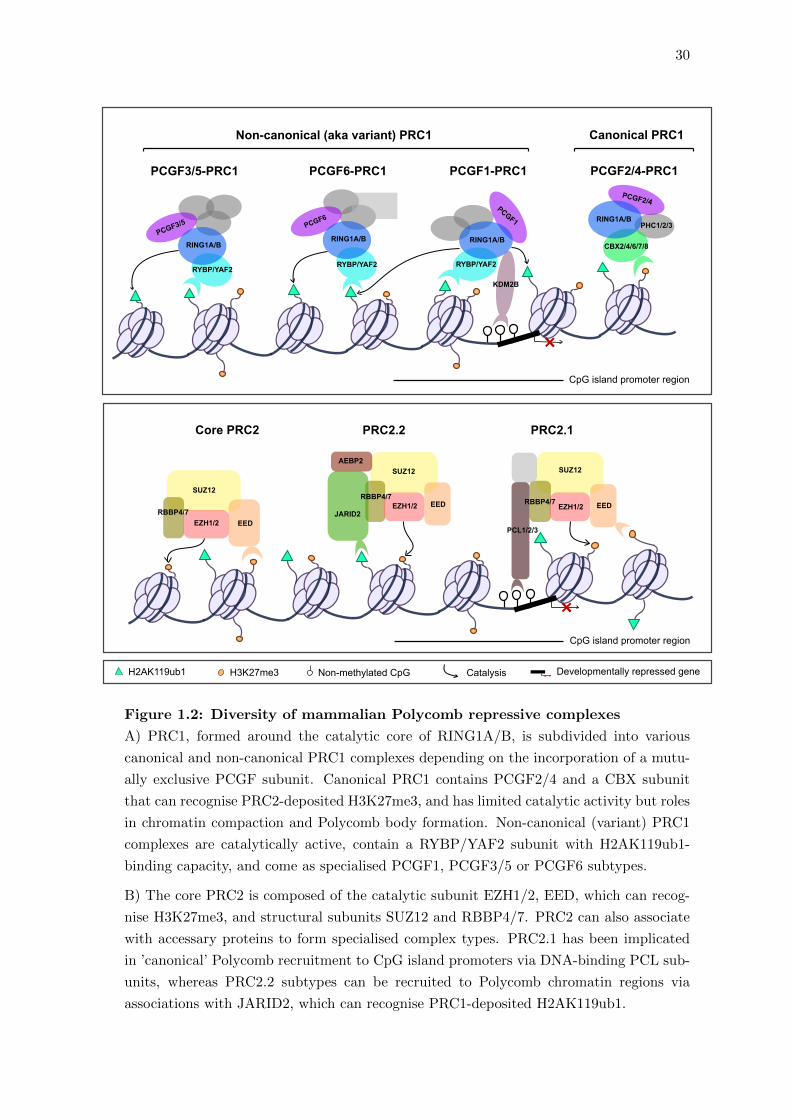
of multimeric complexes with different properties and functions (Figure 1.2).
Whereas in Drosophila, Polycomb complexes directly associate with DNA of Polycomb re-
sponse elements (PREs) at repressed genes, in mammals no homologous sequence-specific
targeting mechanism has been found despite extensive efforts (Bauer et al. 2016) and Poly-
comb recruitment to chromatin is significantly more complex. The predominant regions
of Polycomb binding in the mammalian genome lie at CpG islands of developmentally
regulated genes, where all core PRC1 and PRC2 components and associated histone mod-
ifications H2AK119ub1/H3K27me3 are enriched (Kloet et al. 2016). Classically, Polycomb
targeting to these sites was assumed to occur via PRC2 (like has been found in Drosophila),
with subsequent PRC1 recruitment by CBX binding to H3K27me3 (Cao et al. 2002; Bern-
stein et al. 2006; Li et al. 2017). However, non-classical modes of Polycomb recruitment
were later identified, which are instead based around a primary role for highly catalytically
active RYBP/YAF2-containing PRC1 variants, upstream of PRC2 recruitment via recog-
30
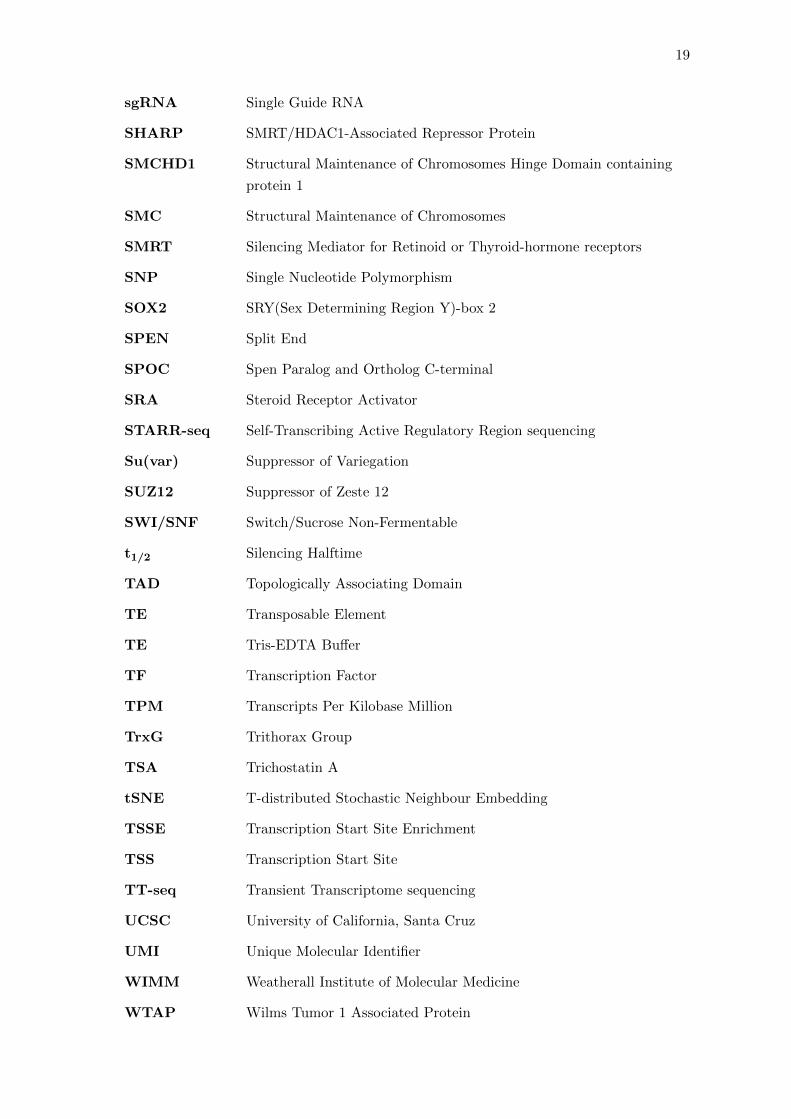
Developmentally repressed gene
RYBP/YAF2
PCGF6
RING1A/B
PCGF3/5-PRC1
Core PRC2 PRC2.2 PRC2.1
RING1A/B
RYBP/YAF2RYBP/YAF2
KDM2B
PCGF3/5
PCGF2/4PCGF1
RING1A/B
RING1A/B
CBX2/4/6/7/8
PHC1/2/3
PCGF6-PRC1
Non-canonical (aka variant) PRC1 Canonical PRC1
PCGF1-PRC1 PCGF2/4-PRC1
SUZ12
SUZ12AEBP2
JARID2EZH1/2
EZH1/2
EED
EEDRBBP4/7
SUZ12
EZH1/2 EEDRBBP4/7
PCL1/2/3
RBBP4/7
H2AK119ub1 H3K27me3 Non-methylated CpG Catalysis
CpG island promoter region
CpG island promoter region
Figure 1.2: Diversity of mammalian Polycomb repressive complexes
A) PRC1, formed around the catalytic core of RING1A/B, is subdivided into various
canonical and non-canonical PRC1 complexes depending on the incorporation of a mutu-
ally exclusive PCGF subunit. Canonical PRC1 contains PCGF2/4 and a CBX subunit
that can recognise PRC2-deposited H3K27me3, and has limited catalytic activity but roles
in chromatin compaction and Polycomb body formation. Non-canonical (variant) PRC1
complexes are catalytically active, contain a RYBP/YAF2 subunit with H2AK119ub1-
binding capacity, and come as specialised PCGF1, PCGF3/5 or PCGF6 subtypes.
B) The core PRC2 is composed of the catalytic subunit EZH1/2, EED, which can recog-
nise H3K27me3, and structural subunits SUZ12 and RBBP4/7. PRC2 can also associate
with accessary proteins to form specialised complex types. PRC2.1 has been implicated
in ’canonical’ Polycomb recruitment to CpG island promoters via DNA-binding PCL sub-
units, whereas PRC2.2 subtypes can be recruited to Polycomb chromatin regions via
associations with JARID2, which can recognise PRC1-deposited H2AK119ub1.
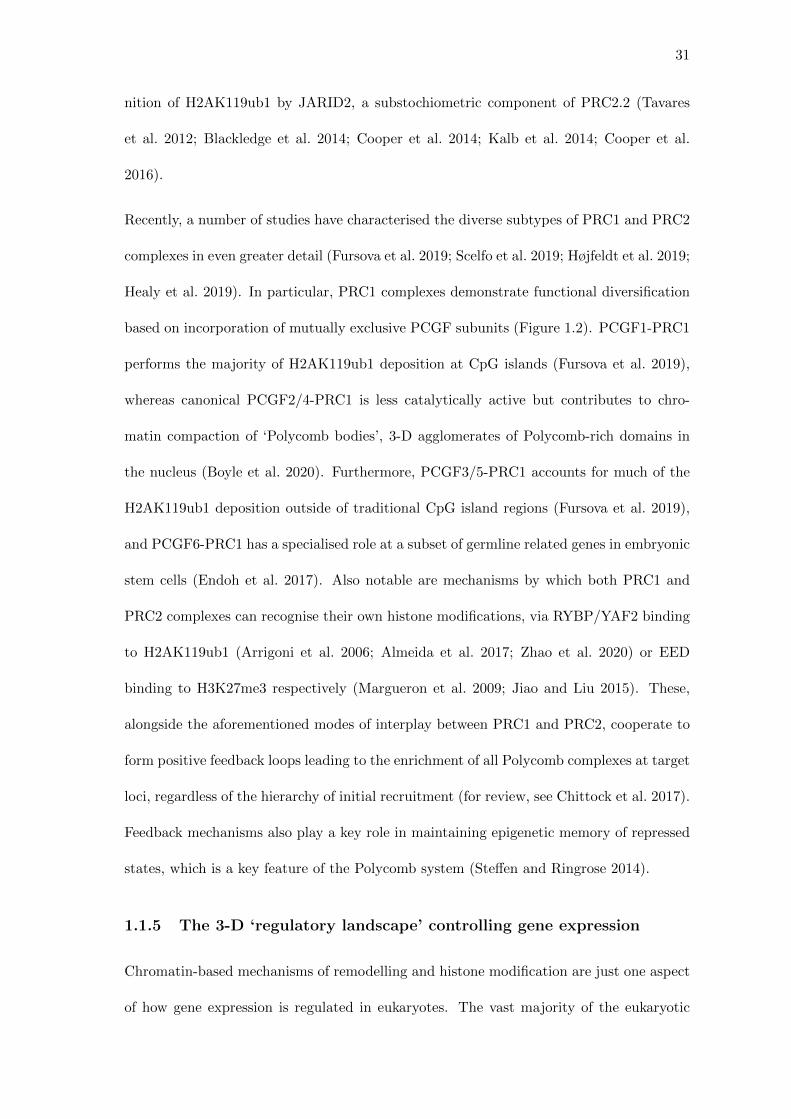
31
nition of H2AK119ub1 by JARID2, a substochiometric component of PRC2.2 (Tavares
et al. 2012; Blackledge et al. 2014; Cooper et al. 2014; Kalb et al. 2014; Cooper et al.
2016).
Recently, a number of studies have characterised the diverse subtypes of PRC1 and PRC2
complexes in even greater detail (Fursova et al. 2019; Scelfo et al. 2019; Højfeldt et al. 2019;
Healy et al. 2019). In particular, PRC1 complexes demonstrate functional diversification
based on incorporation of mutually exclusive PCGF subunits (Figure 1.2). PCGF1-PRC1
performs the majority of H2AK119ub1 deposition at CpG islands (Fursova et al. 2019),
whereas canonical PCGF2/4-PRC1 is less catalytically active but contributes to chro-
matin compaction of ‘Polycomb bodies’, 3-D agglomerates of Polycomb-rich domains in
the nucleus (Boyle et al. 2020). Furthermore, PCGF3/5-PRC1 accounts for much of the
H2AK119ub1 deposition outside of traditional CpG island regions (Fursova et al. 2019),
and PCGF6-PRC1 has a specialised role at a subset of germline related genes in embryonic
stem cells (Endoh et al. 2017). Also notable are mechanisms by which both PRC1 and
PRC2 complexes can recognise their own histone modifications, via RYBP/YAF2 binding
to H2AK119ub1 (Arrigoni et al. 2006; Almeida et al. 2017; Zhao et al. 2020) or EED
binding to H3K27me3 respectively (Margueron et al. 2009; Jiao and Liu 2015). These,
alongside the aforementioned modes of interplay between PRC1 and PRC2, cooperate to
form positive feedback loops leading to the enrichment of all Polycomb complexes at target
loci, regardless of the hierarchy of initial recruitment (for review, see Chittock et al. 2017).
Feedback mechanisms also play a key role in maintaining epigenetic memory of repressed
states, which is a key feature of the Polycomb system (Steffen and Ringrose 2014).
1.1.5 The 3-D ‘regulatory landscape’ controlling gene expression
Chromatin-based mechanisms of remodelling and histone modification are just one aspect
of how gene expression is regulated in eukaryotes. The vast majority of the eukaryotic
32
genome that does not directly code for proteins was originally seen as ‘junk DNA’ as it is
mostly repetitive sequence of transposable element origin, however a huge number of non-
coding genomic elements have now been attributed with regulatory functions (Dunham
et al. 2012). An important class of these cis-regulatory elements (CREs) are enhancers,
sequences first identified by evolutionary conservation studies and later found to function
to increase transcription of one or more specific target genes (for a historical perspective,
see Schaffner 2015). Enhancers typically contain binding sites for transcription factors
(TFs), trans-acting proteins which bind to DNA or chromatin to affect gene expression.
Crucially, both transcription factor expression and enhancer activity can be highly con-
text dependent, and there are a multitude of examples of enhancers that have spatial
or temporal specificity in developmental processes in model systems from Drosophila to
mammals (reviewed in Long et al. 2016). Furthermore, enhancer activity correlates with
characteristic ‘active’ chromatin signatures such as H3K27ac modification and increased
accessibility to DNases or transposases, which both facilitates their context-specific identi-
fication and highlights the important interplay between CREs and chromatin (Boyle et al.
2008; Buenrostro et al. 2013; Calo and Wysocka 2013).
Whereas most enhancers are located in close proximity to their target genes, there are well-
defined paradigms of enhancer activity over hundreds of kilobases of the genome, such as
the sonic hedgehog (Shh) enhancers responsible for patterning of the developing central
nervous system and limb buds (Lettice et al. 2003, 2017). Although the concept of ‘looping’
interactions is not new (Ptashne 1986), it is now well-established that enhancers tend to
physically contact the promoters of target genes in three-dimensional space, whereupon
transcription factors can associate with co-activator proteins or chromatin modifiers in
order to effect gene expression (Carter et al. 2002; Tolhuis et al. 2002). These interactions
can be highly cell-type specific, supporting a model of developmental gene regulation by
dynamic promoter-enhancer interactions (reviewed in Heinz et al. 2015).
33
In addition to enhancers, other CREs have been reported to act as ‘silencers’ or ‘insulators’
(Udvardy et al. 1985; Geyer and Corces 1992; Ogbourne and Antalis 1998; Sun and
Elgin 1999). The latter class are defined by a capability to suppress transcription when
inserted between active enhancers and their target gene promoters and predominantly
contain binding motifs for the sequence-specific DNA binding factor CTCF (Bell et al.
1999). Sites of CTCF binding play a unique role in chromatin organisation by acting
as barriers to the loop-extruding cohesin complex and thereby delineating boundaries
between topologically associated domains (TADs) in the genome (reviewed in Ong and
Corces 2014). In contrast to promoter-enhancer interactions, TAD organisation is broadly
conserved between different cell types and over differentiation (Dixon et al. 2012, 2015),
but nevertheless has an important influence guiding the context of developmental gene
regulation (reviewed in Bonev and Cavalli 2016). This is evidenced by the fact that
disruption of the cis-regulatory TAD landscape by genomic rearrangements can result
in gene misexpression and disease (reviewed in Lupianez et al. 2016), and mutations to
trans-acting components of genome organisation such as CTCF manifest as developmental
disorders in humans (Gregor et al. 2013).
A summary figure conceptualising the three-dimensional interplay between CREs and
trans-acting factors is illustrated in Figure 1.3, although the complexity of genome regu-
lation extends beyond this simple model. Notably, the model does not include non-coding
RNAs, which have also been shown to function in processes of both transcriptional and
post-transcriptional gene regulation. For example, microRNAs (miRNAs) contribute to
the degradation of specific RNAs by the RISC complex in a variety of developmental
processes (reviewed in O’Brien et al. 2018), and small piwi-interacting RNAs (piRNAs)
are involved in the PIWI pathway of transposable element silencing in the germline of
Drosophila and many other species (reviewed in Ozata et al. 2019). Long non-coding
RNAs (lncRNAs) are also widely expressed and can play important roles in gene regula-
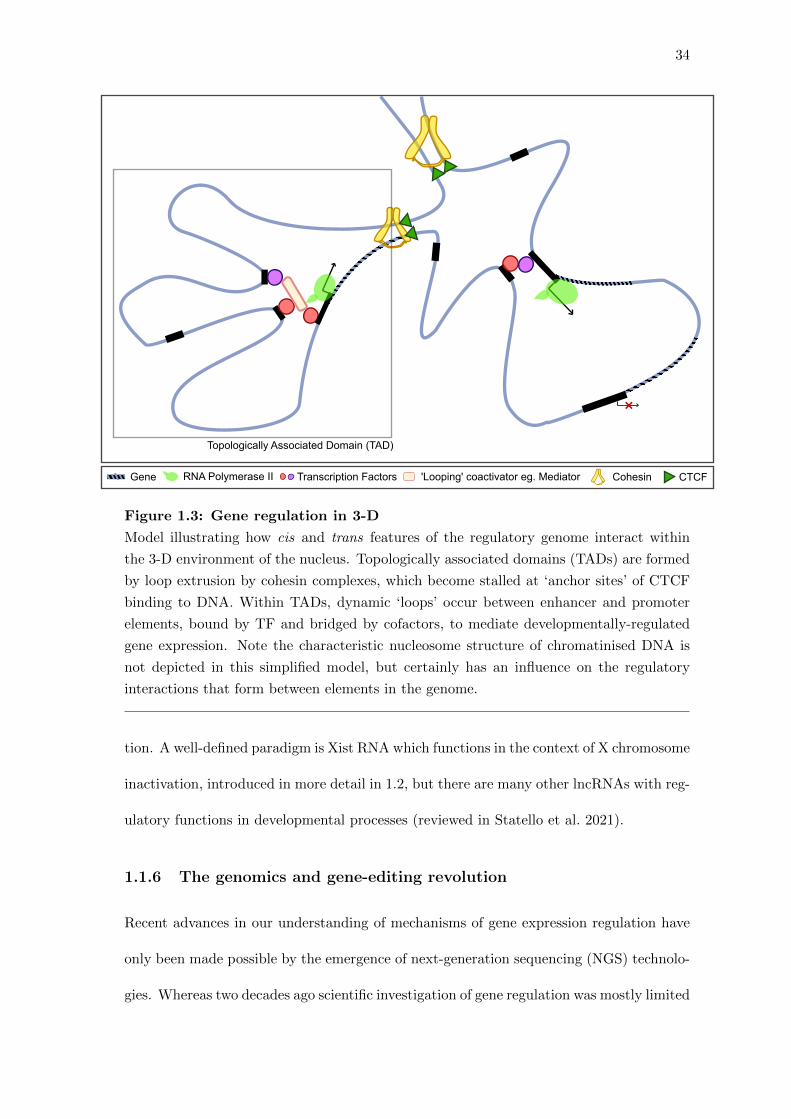
34
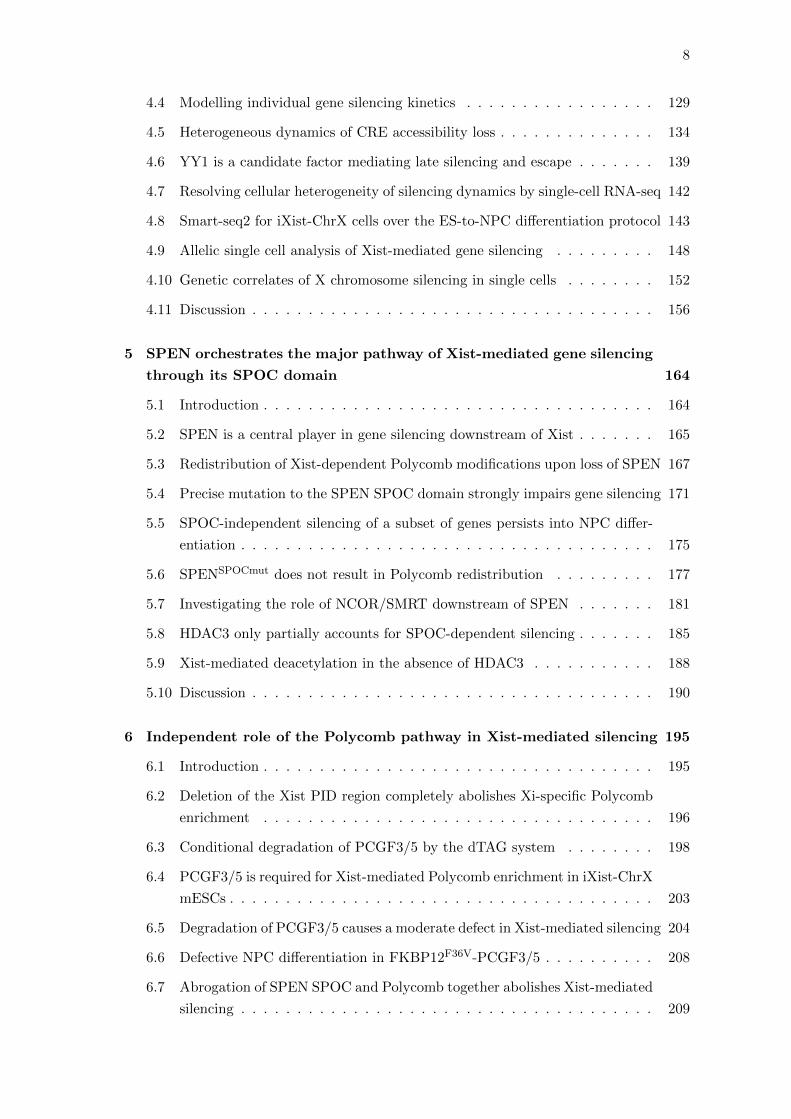
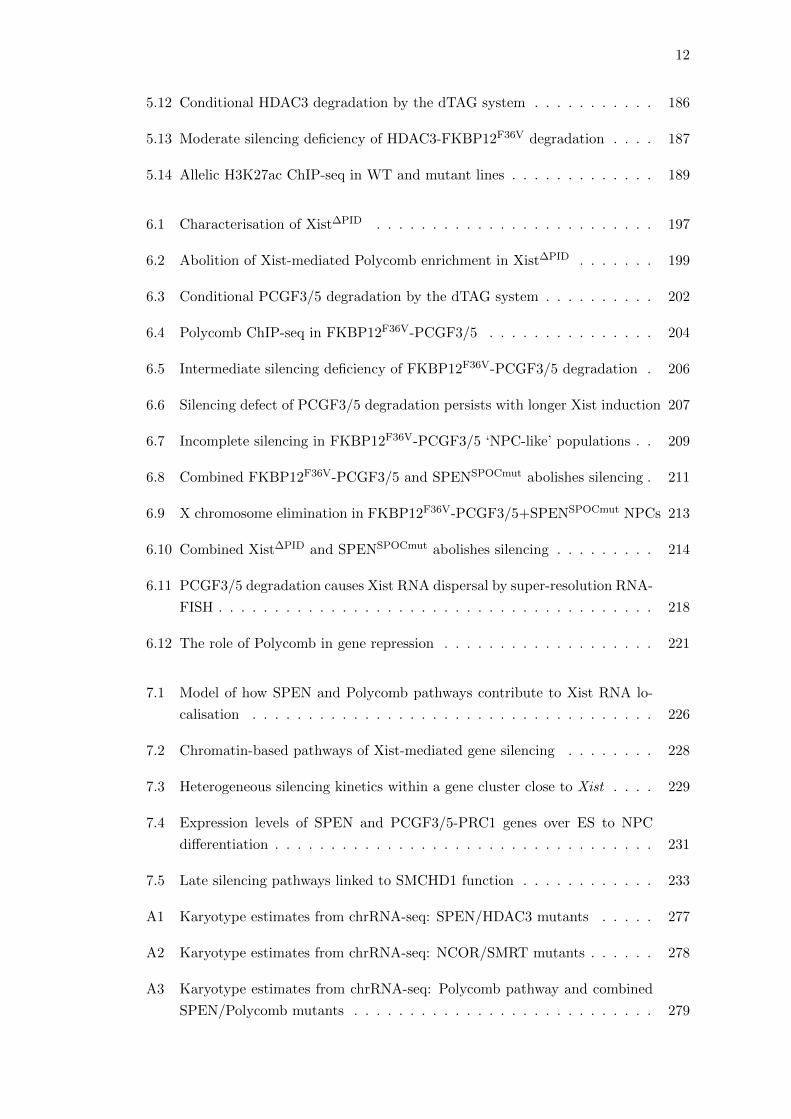
RNA Polymerase IIGene Transcription Factors 'Looping' coactivator eg. Mediator Cohesin CTCF
Topologically Associated Domain (TAD)
Figure 1.3: Gene regulation in 3-D
Model illustrating how cis and trans features of the regulatory genome interact within
the 3-D environment of the nucleus. Topologically associated domains (TADs) are formed
by loop extrusion by cohesin complexes, which become stalled at ‘anchor sites’ of CTCF
binding to DNA. Within TADs, dynamic ‘loops’ occur between enhancer and promoter
elements, bound by TF and bridged by cofactors, to mediate developmentally-regulated
gene expression. Note the characteristic nucleosome structure of chromatinised DNA is
not depicted in this simplified model, but certainly has an influence on the regulatory
interactions that form between elements in the genome.
tion. A well-defined paradigm is Xist RNA which functions in the context of X chromosome
inactivation, introduced in more detail in 1.2, but there are many other lncRNAs with reg-
ulatory functions in developmental processes (reviewed in Statello et al. 2021).
1.1.6 The genomics and gene-editing revolution
Recent advances in our understanding of mechanisms of gene expression regulation have
only been made possible by the emergence of next-generation sequencing (NGS) technolo-
gies. Whereas two decades ago scientific investigation of gene regulation was mostly limited
35
to model loci, the capability to perform DNA sequencing at truly high throughput of hun-
dreds of millions of DNA fragments (‘reads’) in one experiment has allowed for an extensive
broadening of scope (see Goodwin et al. 2016). A multitude of methodologies have been
developed which produce - in various different ways and from a variety of starting molec-
ular material - (relatively) unbiased, high-resolution genome-wide outputs in the form of
large pools of DNA sequences (‘libraries’) that can be run through NGS machines such as
the Illumina NextSeq (Illumina 2019) to generate large and information-rich data sets. For
example, RNA sequencing can be used to assess quantitative and dynamic changes to the
full complement of expressed cellular RNAs (aka the transcriptome) upon perturbation of
epigenetic pathways. Chromatin immunoprecipitation followed by sequencing (ChIP-seq)
produces genome-wide distribution patterns of transcription factor binding or chromatin
modifications, whilst techniques that produce DNA fragment libraries out of regions of
the genome more accessible to DNases or transposases enable wholesale identification of
CREs and analysis of nucleosome positioning. Additionally, the aforementioned insights
into genome organisation have in large part been borne out of Chromosome Conformation
Capture (3C) technologies using chemical crosslinkers to ligate together DNA fragments
that closely associate in 3-dimensional nuclear space. Although by no means an exhaustive
list, some of these genomics methods and specialised derivative techniques are presented
in Table 1.1.
A parallel revolution has occurred from the discovery and development of CRISPR-Cas9
genome-editing, which is reviewed extensively elsewhere (Doudna and Charpentier 2014;
Adli 2018). CRISPR-Cas9 can now be applied in a multitude of experimental settings for
the rapid and precise generation of mutations to either CREs or trans-acting factors of the
regulatory genome. When combined with NGS methods to characterise the consequences
of these mutations at high resolution and genome-wide, it is an immensely powerful tool
for interrogating the molecular mechanisms of gene regulation.
36
NGS Method Utility Derivations/Similar Methods
RNA sequencing (RNA-seq)
Quantitative measure-ment of cellular RNAsand transcription
GRO-seq (Core et al. 2008)4sU-seq (Rabani et al. 2011)NET-seq (Churchman and Weissman2011)TT-seq (Schwalb et al. 2016)CAGE-seq (Takahashi et al. 2012)MeRIP-seq/m6A-seq (Dominissini etal. 2012; Meyer et al. 2012)
Chromatin immunopre-cipitation sequencing(ChIP-seq) (reviewedin Visa and Jordan-Pla2018)
Mapping TF bindingsitesDistribution of chro-matin modifications
CUT&RUN (Skene and Henikoff 2017)DamID (reviewed in Aughey et al.2019)
DNase-seq (Song andCrawford 2010)
Identification of CREsNucleosome position-ing
ATAC-seq (Buenrostro et al. 2013)MNase-seq (Schones et al. 2008)
Chromatin Conforma-tion Capture (3C)
3D genome interac-tions and organisation
4C-seq (Van De Werken et al. 2012)HiC (Lieberman-Aiden et al. 2009)Capture-C (Davies et al. 2015)HiChIP (Mumbach et al. 2016)
Massively Parallel Re-porter Assays (MPRAs)(Melnikov et al. 2012)
Characterising CREsequence properties
STARR-seq (Arnold et al. 2013)
Table 1.1: NGS methods for a wide variety of different purposes in gene
regulation research
Technologies are continuing to evolve, allowing for even greater insights into the function
and regulation of the genome. Particularly exciting is the advent of single-cell genomics,
which both facilitates the application of next-generation sequencing methods to wider
contexts beyond cellular models, such as for studying development in vivo and rare cell
types in patient samples, and allows for analysis of cellular heterogeneity in a manner that
was previously inaccessible by bulk sequencing methods (see Chapter 5). Additionally,
second-generation CRISPR-engineering tools based around inactive dCas9-fusion proteins
have been developed to extend the capabilities of CRISPR beyond DNA sequence mu-
tation, enabling precise epigenome editing and dynamic control of gene regulation (see
Pickar-Oliver and Gersbach 2019).
37
1.2 X chromosome inactivation
1.2.1 XCI - a mammalian paradigm of developmental gene regulation
A classical model of epigenetic gene regulation in mammals is X chromosome inactivation
(XCI), a process that occurs in female embryonic development to equalise the dosage of X-
linked gene expression between XX females and XY males. The seminal hypothesis of XCI
was made by Mary Lyon in 1961 combining her pioneering work in mouse genetics with
previous observations of heterochromatic ‘Barr’ bodies specific to the nuclei of female cells
(Barr and Bertram 1949; Lyon 1961). Almost three decades later, the master regulator
of XCI was discovered and traced to the specific action in cis of a conserved X-linked
locus, Xist/XIST (Brockdorff et al. 1991; Brown et al. 1991). Xist produces a 15-18kb
lncRNA transcript that is subject to typical nuclear RNA processing of splicing, capping
and polyadenylation but is not exported from the nucleus (Brockdorff et al. 1992; Brown
et al. 1992). Instead, it accumulates and spreads to coat the chromosome from which it is
transcribed, leading to the formation of an Xist RNA ‘domain’ or ‘cloud’ over the inactive
X chromosome (Xi) visible by fluorescent in situ hybridization (RNA-FISH) (Clemson
et al. 1996).
Later work confirmed Xist RNA expression to be strictly required for the initiation and
establishment of XCI in vitro and in vivo (Penny et al. 1996; Marahrens et al. 1997). Xist
functions through the recruitment of various factors and complexes to modify the underly-
ing chromatin of Xi from a largely euchromatic state to one of repressed heterochromatin,
and alongside this engenders transcriptional silencing of X-linked genes (Brockdorff 2002).
As such, in addition to being an integral process of female mammalian development (see
1.2.3), XCI has become an important paradigm of a lncRNA with a role in gene regulation.
Furthermore, although the process of XCI is in many ways unique, many of the molecular
machineries harnessed by Xist are the same as those that repress gene expression in other
38
development contexts. Accordingly, insights derived from XCI as a model system have
made valuable contributions to our understanding of gene regulation more widely, such as
how Polycomb repressive complexes can be recruited to chromatin (reviewed in Almeida
et al. 2020) and how 3D genome organisation contributes to gene expression (reviewed in
Galupa and Heard 2018).
1.2.2 Evolutionary origins of XCI
The need for dosage compensation is an evolutionary problem that has arisen in diverse
animal species in which sex determination is coupled to specialised sex chromosomes (re-
viewed in Graves 2016). Through ‘Muller’s ratchet’, reduced homologous recombination
results in progressive degeneration of the single chromosome of the heterogametic sex
(chrY in mammals), leading eventually to imbalanced sex chromosome gene expression
dosage, both in comparison to autosomes and between the sexes (Muller 1914; Ohno
1967). Substantially different strategies for dosage compensation have evolved indepen-
dently in model animal species, co-opting the epigenetic modules described in 1.1.3 in a
variety of manners. In Drosophila, for example, the male-specific lethal (MSL) complex
is the predominant player in chromosome-wide upregulation of the sole male X chromo-
some by mechanisms such as widespread hyperacetylation of H4K16 (reviewed in Conrad
and Akhtar 2012). By contrast, in C. elegans both X chromosomes of hermaphrodites
are globally downregulated by the dosage compensation complex (DCC) through con-
trol of chromosome condensation, RNA Polymerase II exclusion, and H4K20 methylation
(reviewed in Albritton and Ercan 2018).
The particular dosage compensation solution in mammals, namely chromosome-wide si-
lencing by a cis-accumulating lncRNA, is likely related in an evolutionary context to the
increased transposable element load and prominence of epigenetic defence mechanisms
against transposon expression in the mammalian genome (see 1.1.3). Xist RNA bears
39
tandem repeat sequences suggestive of TE origin, which both provides an explanation for
its rapid evolution through transposition and tandem duplication events and leads to a
conceptual model of Xist function (Elisaphenko et al. 2008; Brockdorff 2018). According to
this model, Xist RNA has evolved as a scaffold to locally concentrate repressive epigenetic
pathways, many of which originally evolved for TE repression, over the chromatin of Xi
during development. As evidence of this, marsupial dosage compensation is also performed
by a large, repeat-rich lncRNA, Rsx, which does not share the same evolutionary origin
as Xist but can functionally compensate to recruit many of the same epigenetic pathways
and silence X-linked genes when expressed in mouse cells (Grant et al. 2012).
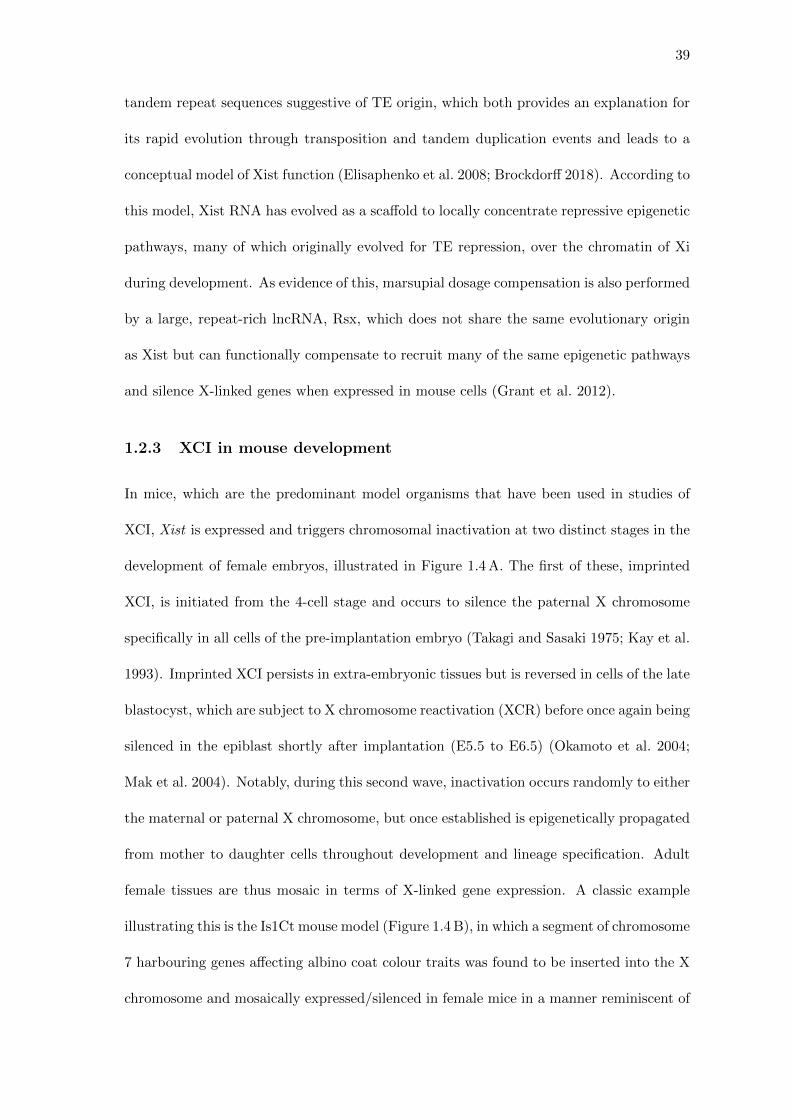
1.2.3 XCI in mouse development
In mice, which are the predominant model organisms that have been used in studies of
XCI, Xist is expressed and triggers chromosomal inactivation at two distinct stages in the
development of female embryos, illustrated in Figure 1.4 A. The first of these, imprinted
XCI, is initiated from the 4-cell stage and occurs to silence the paternal X chromosome
specifically in all cells of the pre-implantation embryo (Takagi and Sasaki 1975; Kay et al.
1993). Imprinted XCI persists in extra-embryonic tissues but is reversed in cells of the late
blastocyst, which are subject to X chromosome reactivation (XCR) before once again being
silenced in the epiblast shortly after implantation (E5.5 to E6.5) (Okamoto et al. 2004;
Mak et al. 2004). Notably, during this second wave, inactivation occurs randomly to either
the maternal or paternal X chromosome, but once established is epigenetically propagated
from mother to daughter cells throughout development and lineage specification. Adult
female tissues are thus mosaic in terms of X-linked gene expression. A classic example
illustrating this is the Is1Ct mouse model (Figure 1.4 B), in which a segment of chromosome
7 harbouring genes affecting albino coat colour traits was found to be inserted into the X
chromosome and mosaically expressed/silenced in female mice in a manner reminiscent of
40
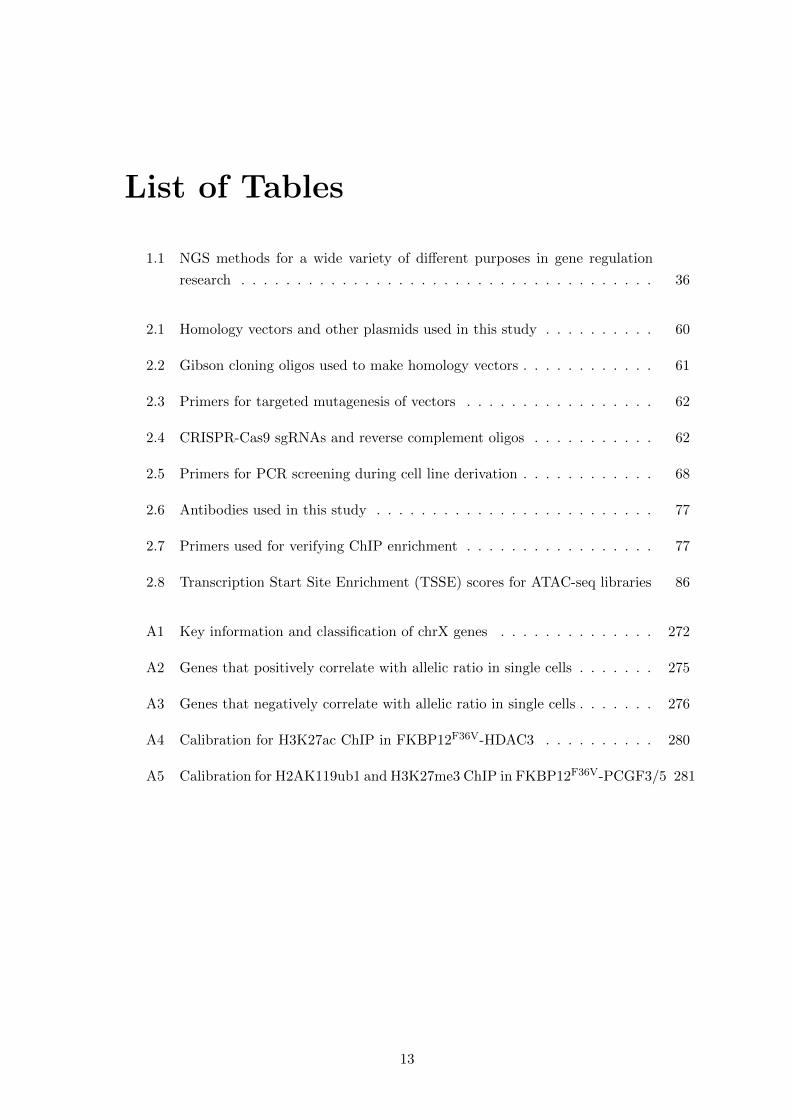
E1.5
E3.5
E5.5
E10.5
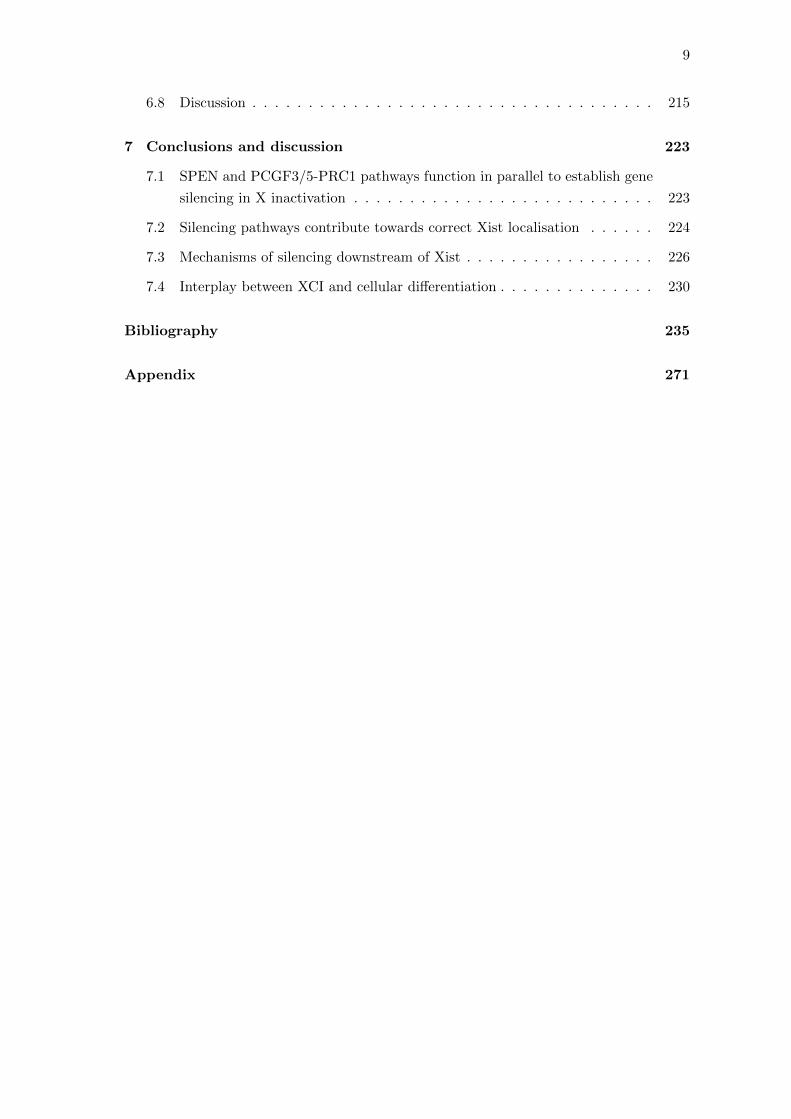
A B
Figure 1.4: XCI in mouse development
A) Figure taken from (Brockdorff et al. 2020). X inactivation occurs at two distinct stages
during mouse embryogenesis. At the two- to four-cell stage (E1.5-E2.5), imprinted XCI
occurs specifically to the paternally inherited X chromosome, and is later maintained in
extraembryonic lineages such as the trophectoderm (green) and extraembryonic endoderm
(orange). In the inner cell mass of embryo proper (blue), the paternal Xi is reactivated
at ∼E3.5, followed by random XCI of either the paternal or maternal X chromosome from
E5.5.
B) Image taken from (Disteche and Berletch 2015). Photo demonstrating the phenotype
of a female Is1Ct mouse harbouring the ’Cattanach’ insertion, which leads to mosaic ex-
pression of coat colour genes due to random X inactivation in clonal patches of ectodermal
progenitors during embryogenesis. An equivalent phenotype can be seen in calico cats.
the variegated Drosophila eye (cf. 1.1.3) (Cattanach 1974).
The developmental timings described above are specific to mice as aspects of XCI can
vary considerably between mammalian species. In humans, for example, random XCI is
initiated in pre-implantation development but accumulation of human XIST does not lead
to chromosomal inactivation until later embryonic stages (Okamoto et al. 2011), although
it may lead to some dampening of transcription (Petropoulos et al. 2016). Likewise, a
significantly higher proportion of genes escape XCI to remain bi-allelically expressed from
the Xi in adult human tissues compared to mouse (Carrel and Willard 2005; Tukiainen
et al. 2017). Despite these differences, the central role of Xist as the master regulator
41
of XCI is conserved throughout eutherian mammals (Hendrich et al. 1993), as are many
of the downstream molecular mechanisms harnessed by Xist for heterochromatinisation
and gene silencing. Thus, mouse development remains an appropriate model for studying
XCI and, furthermore, can inform the treatment of human diseases either directly related
to XCI such as Rett syndrome (Amir et al. 1999; Cheung et al. 2012) or when XCI is
reactivated in tumourigenesis (reviewed in Agrelo and Wutz 2010).
Much research in the XCI field is conducted using mouse embryonic stem cells (mESCs)
derived from the inner cell mass of the early blastocyst and immortalised to grow indefi-
nitely in culture. mESCs are an ideal workhorse because they can be expanded in bulk for
biochemistry, are widely used for optimised genomics methods, and are highly amenable
to genetic manipulation such as by CRISPR-Cas9. Moreover, female mESCs carry two
active X chromosomes in standard culture but will undergo XCI upon in vitro differen-
tiation, thus allowing for study of the dynamic processes of XCI. mESCs engineered to
allow artificial induction of Xist expression have provided an additional tool for analysis
of molecular mechanisms in XCI.
1.2.4 Upstream regulation of Xist expression by the X-inactivation cen-
tre (Xic)
Initiation of XCI is controlled by the X-inactivation centre (Xic), a complex locus con-
taining a variety of elements that act in cis and trans to regulate monoallelic upregulation
of Xist. In the case of imprinted XCI, it has recently been shown that a broad domain of
H3K27me3 over this locus in the oocyte acts as the imprint repressing Xist on the mater-
nal allele and thus biasing towards paternal-specific Xist expression (Inoue et al. 2017).
For random XCI, the mechanisms of developmental Xist regulation and stochastic allelic
choice are more complex and yet to be fully elucidated, although a rough schematic of the
Xist regulatory circuit in mouse provided in Figure 1.5. Progress to date, recently reviewed
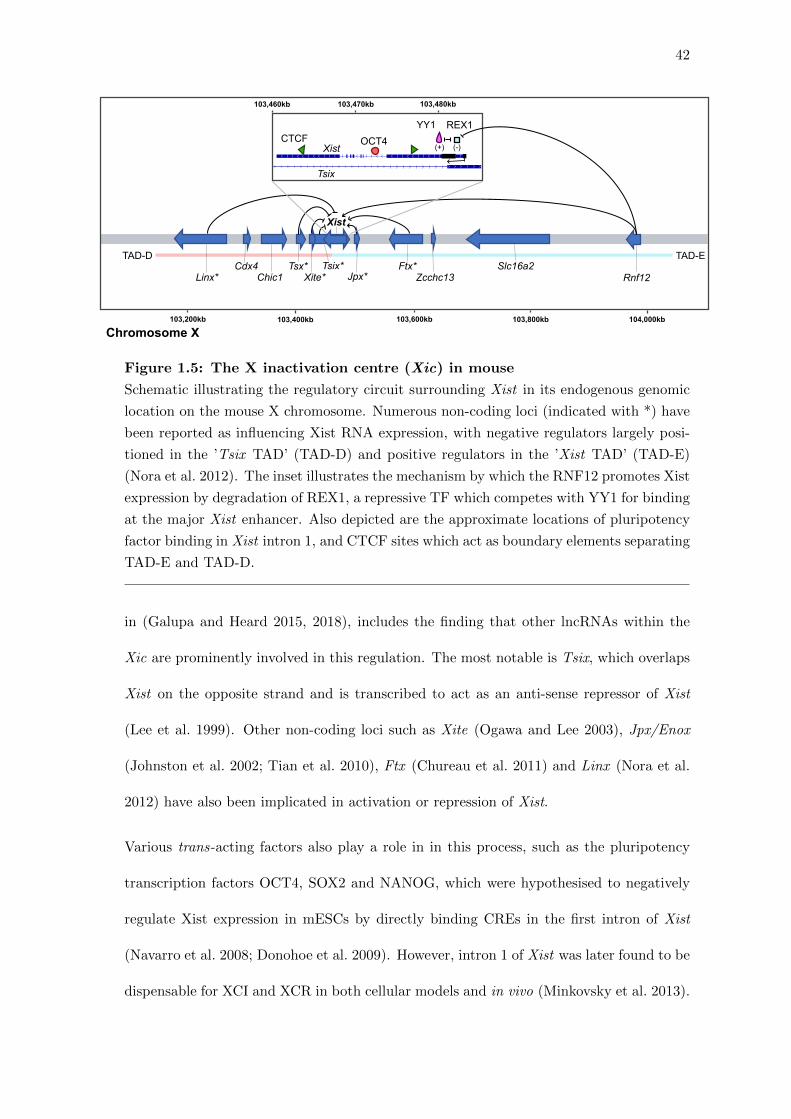
42
Linx*
TAD-D TAD-ECdx4
Chic1Tsx*
Xite*Tsix*
Jpx* Rnf12Slc16a2Ftx*
Zcchc13
YY1OCT4
Xist
Tsix
CTCFREX1
Xist
(+) (-)
103,200kb 103,400kb 103,600kb 103,800kb 104,000kb
103,480kb103,470kb103,460kb
Chromosome X
Figure 1.5: The X inactivation centre (Xic) in mouse
Schematic illustrating the regulatory circuit surrounding Xist in its endogenous genomic
location on the mouse X chromosome. Numerous non-coding loci (indicated with *) have
been reported as influencing Xist RNA expression, with negative regulators largely posi-
tioned in the ’Tsix TAD’ (TAD-D) and positive regulators in the ’Xist TAD’ (TAD-E)
(Nora et al. 2012). The inset illustrates the mechanism by which the RNF12 promotes Xist
expression by degradation of REX1, a repressive TF which competes with YY1 for binding
at the major Xist enhancer. Also depicted are the approximate locations of pluripotency
factor binding in Xist intron 1, and CTCF sites which act as boundary elements separating
TAD-E and TAD-D.
in (Galupa and Heard 2015, 2018), includes the finding that other lncRNAs within the
Xic are prominently involved in this regulation. The most notable is Tsix, which overlaps
Xist on the opposite strand and is transcribed to act as an anti-sense repressor of Xist
(Lee et al. 1999). Other non-coding loci such as Xite (Ogawa and Lee 2003), Jpx/Enox
(Johnston et al. 2002; Tian et al. 2010), Ftx (Chureau et al. 2011) and Linx (Nora et al.
2012) have also been implicated in activation or repression of Xist.
Various trans-acting factors also play a role in in this process, such as the pluripotency
transcription factors OCT4, SOX2 and NANOG, which were hypothesised to negatively
regulate Xist expression in mESCs by directly binding CREs in the first intron of Xist
(Navarro et al. 2008; Donohoe et al. 2009). However, intron 1 of Xist was later found to be
dispensable for XCI and XCR in both cellular models and in vivo (Minkovsky et al. 2013).
43
Likewise, although repression of Xist transcription is a feature of cellular reprogramming
to pluripotency (Maherali et al. 2007), the late timing of XCR during reprogramming
is more suggestive of an indirect role for pluripotency factors (Minkovsky et al. 2012),
potentially via an interplay with Tsix upregulation (Navarro et al. 2010; Pasque et al.
2014). An additional factor, RNF12, encoded from a locus ∼500kb upstream of Xist, was
shown to act independently of Tsix to positively regulate Xist expression in trans (Jonkers
et al. 2009). This is mediated through proteasomal degradation of the REX1 repressor
(Gontan et al. 2012), which binds to the major Xist enhancer in competition with YY1,
a transcription factor with a conserved role in Xist transcriptional activation (Makhlouf
et al. 2014).
Recent publications have revisited upstream regulation of Xist expression by kinetic mod-
elling of the minimal regulatory network required for random monoallelic upregulation
(Mutzel et al. 2019) or by characterising the 3D genome organisation of the Xic in high
resolution (Van Bemmel et al. 2019). Interestingly, the Xist locus lies at boundary be-
tween two TADs, with the Xist promoter and upstream positive regulators such as Rnf12
located in one TAD, and Tsix, Xite and other negative regulators in the other. It was
found that the position of the non-coding LinxP element in relation to this TAD struc-
ture determined its activity as either an enhancer or silencer of Xist (Galupa et al. 2020),
illustrating the importance of the 3D genome organisation in the context of the Xic and
for gene regulation more widely.
1.2.5 Xist-mediated changes to chromatin during the establishment of
XCI
Downstream of Xist, decades of studies have characterised many epigenetic changes that
occur to chromatin following Xist expression and coating of one X chromosome by Xist
RNA in mouse embryos or mESCs. In broad terms, these entail the removal of euchromatic
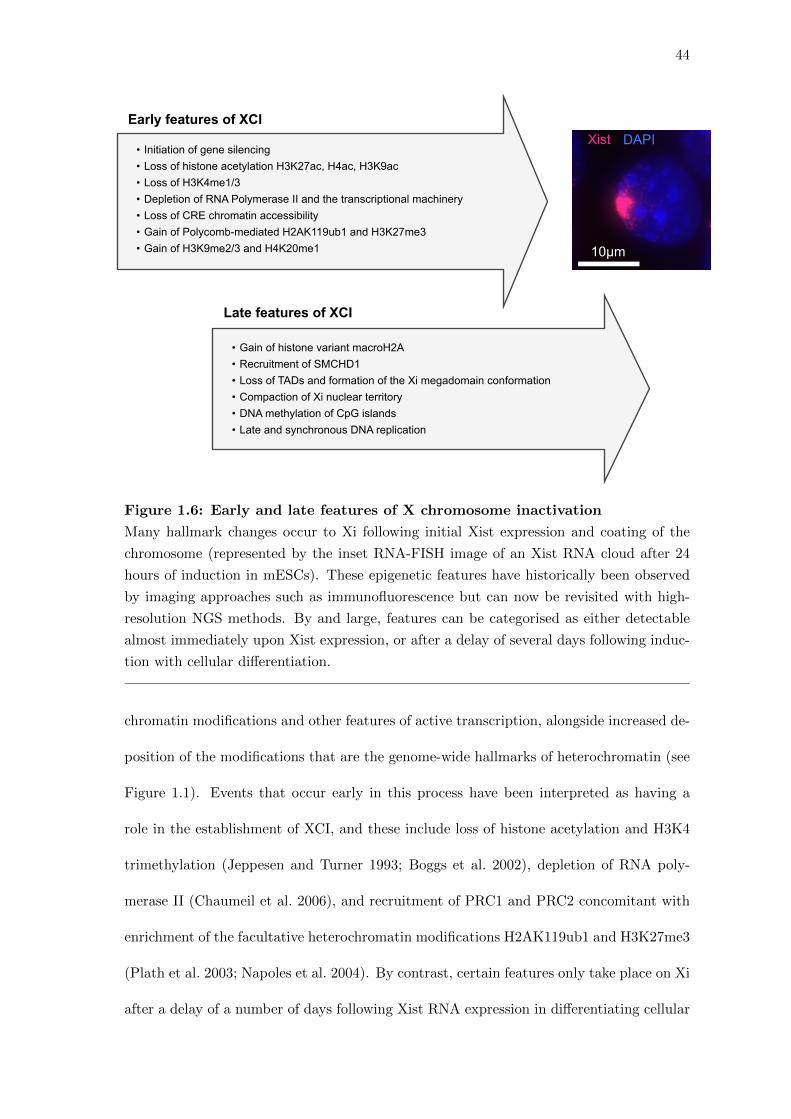
44
• Initiation of gene silencing• Loss of histone acetylation H3K27ac, H4ac, H3K9ac• Loss of H3K4me1/3• Depletion of RNA Polymerase II and the transcriptional machinery• Loss of CRE chromatin accessibility• Gain of Polycomb-mediated H2AK119ub1 and H3K27me3• Gain of H3K9me2/3 and H4K20me1
• Gain of histone variant macroH2A• Recruitment of SMCHD1• Loss of TADs and formation of the Xi megadomain conformation• Compaction of Xi nuclear territory• DNAmethylation of CpG islands• Late and synchronous DNA replication
Early features of XCI
Late features of XCI
10μm
Xist DAPI
Figure 1.6: Early and late features of X chromosome inactivation
Many hallmark changes occur to Xi following initial Xist expression and coating of the
chromosome (represented by the inset RNA-FISH image of an Xist RNA cloud after 24
hours of induction in mESCs). These epigenetic features have historically been observed
by imaging approaches such as immunofluorescence but can now be revisited with high-
resolution NGS methods. By and large, features can be categorised as either detectable
almost immediately upon Xist expression, or after a delay of several days following induc-
tion with cellular differentiation.
chromatin modifications and other features of active transcription, alongside increased de-
position of the modifications that are the genome-wide hallmarks of heterochromatin (see
Figure 1.1). Events that occur early in this process have been interpreted as having a
role in the establishment of XCI, and these include loss of histone acetylation and H3K4
trimethylation (Jeppesen and Turner 1993; Boggs et al. 2002), depletion of RNA poly-
merase II (Chaumeil et al. 2006), and recruitment of PRC1 and PRC2 concomitant with
enrichment of the facultative heterochromatin modifications H2AK119ub1 and H3K27me3
(Plath et al. 2003; Napoles et al. 2004). By contrast, certain features only take place on Xi
after a delay of a number of days following Xist RNA expression in differentiating cellular
45
models, such as replacement of histone H2A with the macroH2A variant (Costanzi and
Pehrson 1998), DNA methylation of previously unmethylated ‘CpG island’ gene promot-
ers (Gendrel et al. 2012), and recruitment of the non-canonical Smc protein SMCHD1
(Blewitt et al. 2008). These later changes are thought to predominantly function in main-
tenance of the inactive state of the chromosome rather than establishment, and thus to
account for the dispensability of Xist RNA for gene repression once XCI is fully established
(Csankovszki et al. 1999a; Wutz and Jaenisch 2000). A schematic categorising early and
late features of XCI is presented in Figure 1.6.
1.2.6 Functional repeat elements of the Xist RNA
In the quest to understand how Xist functions in XCI, it has been known for some time
that conserved tandem repeat elements of the 17kb RNA sequence in mouse mediate
specific functions (reviewed in Brockdorff 2002; Pintacuda et al. 2017a). The A-repeat
element close to the 5’ end of Xist exon 1 is the most evolutionarily conserved region
both in terms of consensus sequence and copy number of repeats (Nesterova et al. 2001).
In a seminal study, Wutz et al. investigated a large panel of deletions in the context of
an inducible Xist transgene mediating XCI with the consequence of cell lethality in XY
mESCs (Wutz et al. 2002). This identified the A-repeat as strictly necessary for gene
silencing, and also found other deletions which kept the A-repeat intact but reduced cell
death to an intermediate extent. Notably, as Xist∆A RNA was still able to accumulate
over the X chromosome in cis, this study also demonstrated genetic separability of Xist
RNA localisation and downstream silencing.
The A-repeat is highly structured into RNA stem loops, and further studies have since
characterised how these structural features relate to its function (reviewed in Jones and
Sattler 2019). Other repeats B-F in the Xist sequence are also conserved, indicating some
functionality, but to a lesser extent than the A-repeat and there is little conservation of
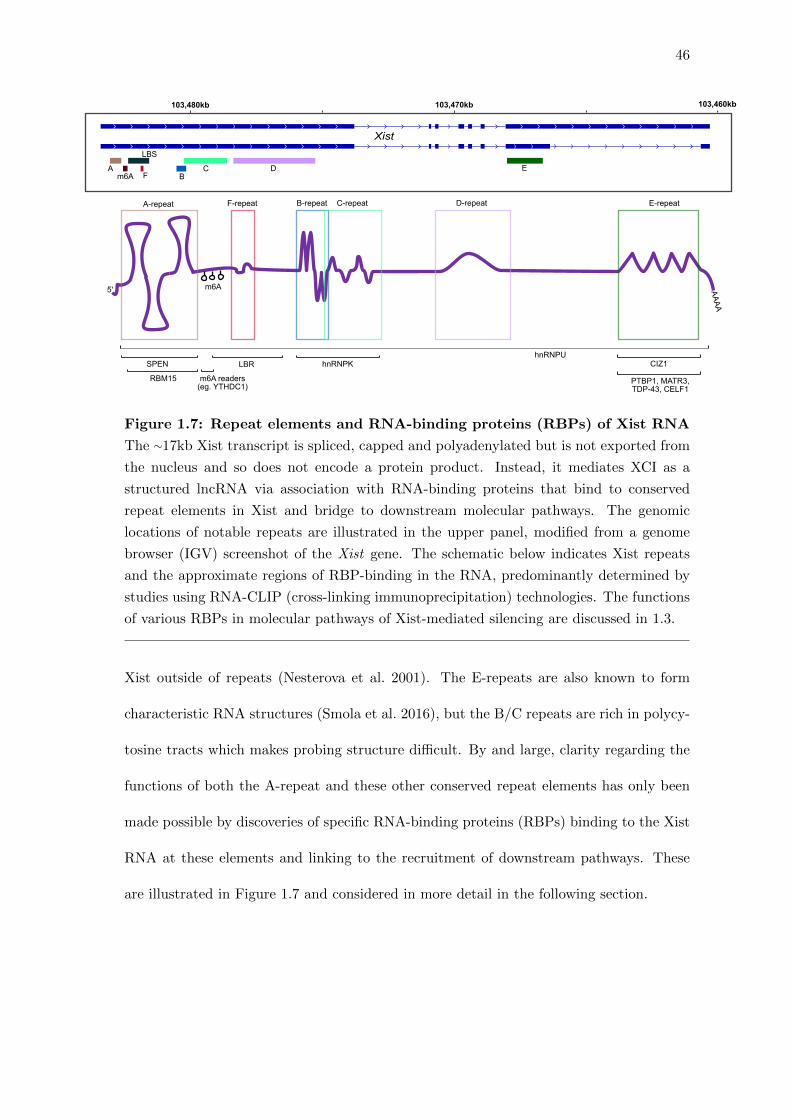
46
DCF
LBS
SPEN
RBM15
hnRNPK
5' AAAA
hnRNPU
m6A readers(eg. YTHDC1)
LBR
m6A
Bm6AA
A-repeat F-repeat B-repeat C-repeat D-repeat E-repeat
E
Xist
103,480kb 103,470kb 103,460kb
CIZ1
PTBP1, MATR3,TDP-43, CELF1
Figure 1.7: Repeat elements and RNA-binding proteins (RBPs) of Xist RNA
The ∼17kb Xist transcript is spliced, capped and polyadenylated but is not exported from
the nucleus and so does not encode a protein product. Instead, it mediates XCI as a
structured lncRNA via association with RNA-binding proteins that bind to conserved
repeat elements in Xist and bridge to downstream molecular pathways. The genomic
locations of notable repeats are illustrated in the upper panel, modified from a genome
browser (IGV) screenshot of the Xist gene. The schematic below indicates Xist repeats
and the approximate regions of RBP-binding in the RNA, predominantly determined by
studies using RNA-CLIP (cross-linking immunoprecipitation) technologies. The functions
of various RBPs in molecular pathways of Xist-mediated silencing are discussed in 1.3.
Xist outside of repeats (Nesterova et al. 2001). The E-repeats are also known to form
characteristic RNA structures (Smola et al. 2016), but the B/C repeats are rich in polycy-
tosine tracts which makes probing structure difficult. By and large, clarity regarding the
functions of both the A-repeat and these other conserved repeat elements has only been
made possible by discoveries of specific RNA-binding proteins (RBPs) binding to the Xist
RNA at these elements and linking to the recruitment of downstream pathways. These
are illustrated in Figure 1.7 and considered in more detail in the following section.
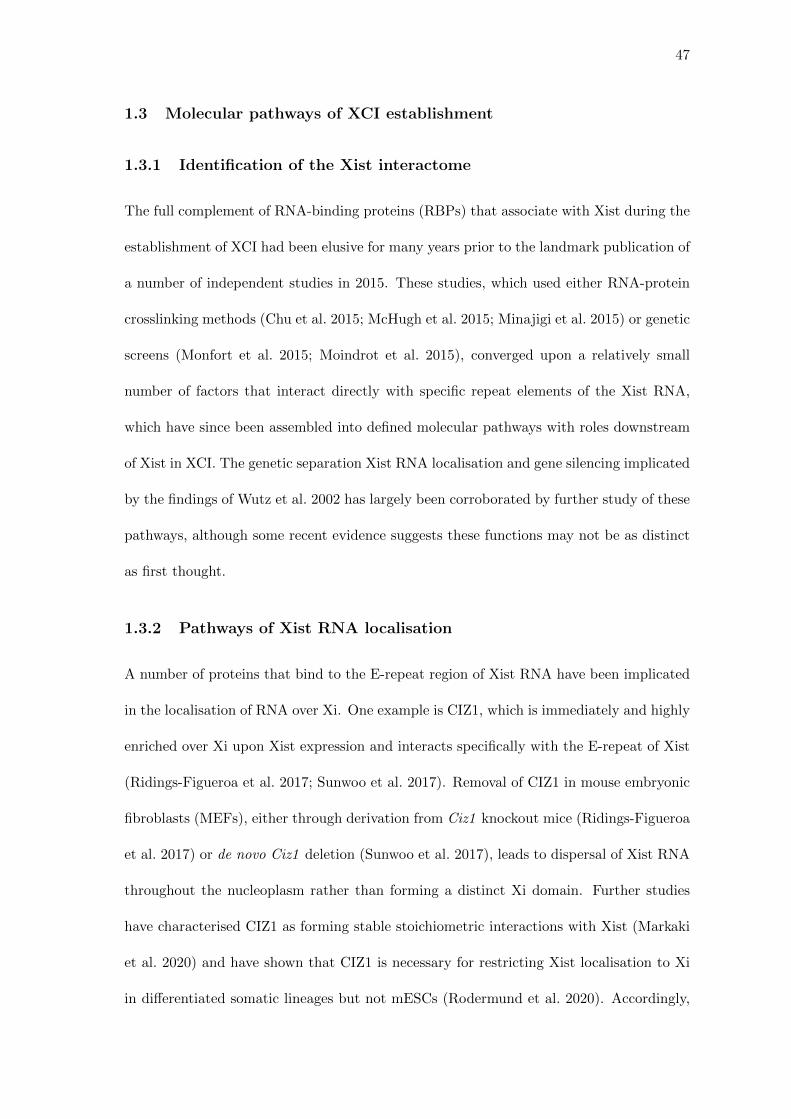
47
1.3 Molecular pathways of XCI establishment
1.3.1 Identification of the Xist interactome
The full complement of RNA-binding proteins (RBPs) that associate with Xist during the
establishment of XCI had been elusive for many years prior to the landmark publication of
a number of independent studies in 2015. These studies, which used either RNA-protein
crosslinking methods (Chu et al. 2015; McHugh et al. 2015; Minajigi et al. 2015) or genetic
screens (Monfort et al. 2015; Moindrot et al. 2015), converged upon a relatively small
number of factors that interact directly with specific repeat elements of the Xist RNA,
which have since been assembled into defined molecular pathways with roles downstream
of Xist in XCI. The genetic separation Xist RNA localisation and gene silencing implicated
by the findings of Wutz et al. 2002 has largely been corroborated by further study of these
pathways, although some recent evidence suggests these functions may not be as distinct
as first thought.
1.3.2 Pathways of Xist RNA localisation
A number of proteins that bind to the E-repeat region of Xist RNA have been implicated
in the localisation of RNA over Xi. One example is CIZ1, which is immediately and highly
enriched over Xi upon Xist expression and interacts specifically with the E-repeat of Xist
(Ridings-Figueroa et al. 2017; Sunwoo et al. 2017). Removal of CIZ1 in mouse embryonic
fibroblasts (MEFs), either through derivation from Ciz1 knockout mice (Ridings-Figueroa
et al. 2017) or de novo Ciz1 deletion (Sunwoo et al. 2017), leads to dispersal of Xist RNA
throughout the nucleoplasm rather than forming a distinct Xi domain. Further studies
have characterised CIZ1 as forming stable stoichiometric interactions with Xist (Markaki
et al. 2020) and have shown that CIZ1 is necessary for restricting Xist localisation to Xi
in differentiated somatic lineages but not mESCs (Rodermund et al. 2020). Accordingly,

48
Ciz1 -null mice are viable throughout establishment of XCI during embryogenesis but
show a fully-penetrant female-specific lymphoproliferative disorder in adults, a context
where loss of Xist from Xi can lead to reactivation of X-linked gene expression (Ridings-
Figueroa et al. 2017). This link with differentiation has also been made for another protein
involved in the localisation of Xist, hnRNPU (aka SAF-A), which binds non-specifically
over the Xist transcript and has an important role in anchoring Xist to Xi chromatin that
varies depending on the experimental and developmental context (Hasegawa et al. 2010;
Kolpa et al. 2016). Taken together, these findings suggest that the strict requirement
of additional pathways for Xist RNA anchoring to Xi manifests only at later stages of
XCI after initial chromatin-modifying pathways (discussed below) have established gene
silencing and heterochromatinisation.
1.3.3 The central role of SPEN in Xist-mediating silencing
The leading candidate highlighted by four of the aforementioned studies identifying Xist
interactors was SPEN (aka MINT, SHARP), a large2, conserved RBP containing four N-
terminal RNA recognition motif domains (RRM1-4) and a C-terminal SPOC domain. By
various biochemical methods such as EMSA (Monfort et al. 2015), PARIS (Lu et al. 2016)
and e/iCLIP (Cirillo et al. 2016) (see Acronyms), SPEN was found to directly interact with
the Xist A-repeat via three of its RRM domains (RRM2-4). SPEN has also been shown
to bind other nuclear RNAs such as Steroid receptor activator (SRA) (Arieti et al. 2014)
and endogenous retroviruses (ERV) transcripts which have some structural similarity to
the A-repeat (Carter et al. 2020). In the latter case, SPEN has been implicated in the
transcriptional and post-transcriptional silencing of ERVs in the genome, suggesting an
evolutionary explanation for how this pathway was co-opted for gene silencing in XCI
(Carter et al. 2020).
2SPEN protein has a predicted molecular weight of ∼400kDa, however in my hands migrates at a sizeabove 500kDa during polyacrylamide gel electrophoresis.
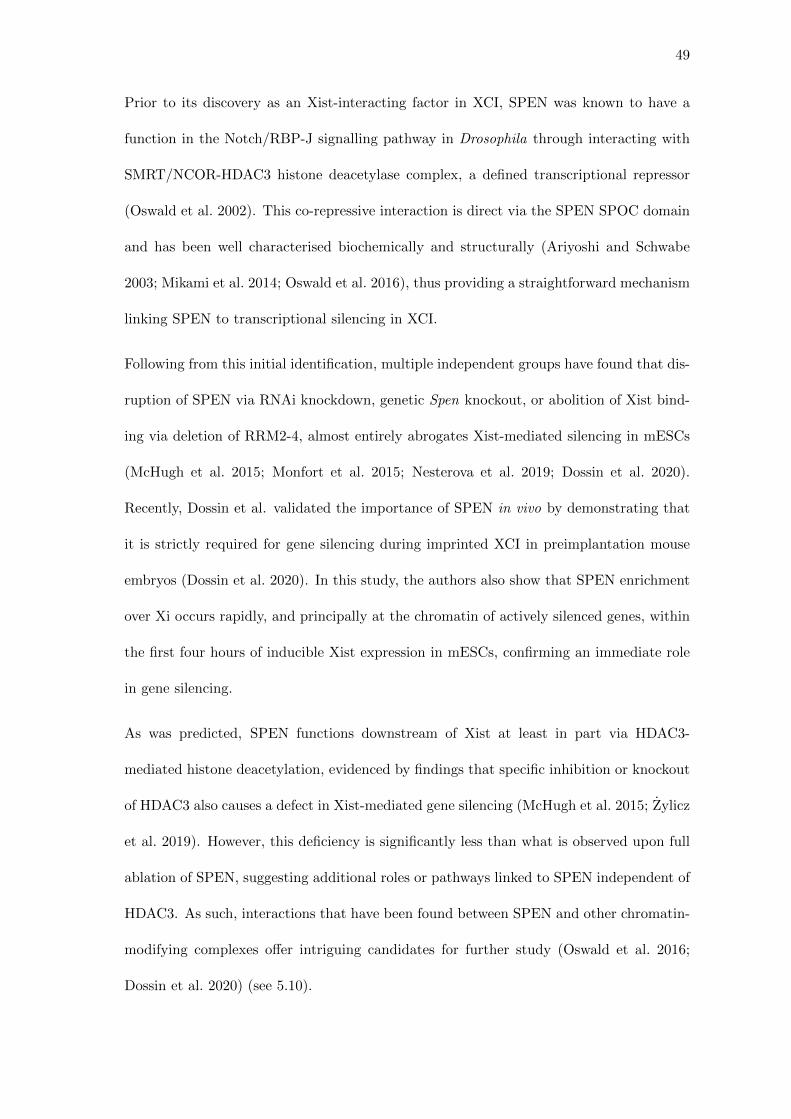
49
Prior to its discovery as an Xist-interacting factor in XCI, SPEN was known to have a
function in the Notch/RBP-J signalling pathway in Drosophila through interacting with
SMRT/NCOR-HDAC3 histone deacetylase complex, a defined transcriptional repressor
(Oswald et al. 2002). This co-repressive interaction is direct via the SPEN SPOC domain
and has been well characterised biochemically and structurally (Ariyoshi and Schwabe
2003; Mikami et al. 2014; Oswald et al. 2016), thus providing a straightforward mechanism
linking SPEN to transcriptional silencing in XCI.
Following from this initial identification, multiple independent groups have found that dis-
ruption of SPEN via RNAi knockdown, genetic Spen knockout, or abolition of Xist bind-
ing via deletion of RRM2-4, almost entirely abrogates Xist-mediated silencing in mESCs
(McHugh et al. 2015; Monfort et al. 2015; Nesterova et al. 2019; Dossin et al. 2020).
Recently, Dossin et al. validated the importance of SPEN in vivo by demonstrating that
it is strictly required for gene silencing during imprinted XCI in preimplantation mouse
embryos (Dossin et al. 2020). In this study, the authors also show that SPEN enrichment
over Xi occurs rapidly, and principally at the chromatin of actively silenced genes, within
the first four hours of inducible Xist expression in mESCs, confirming an immediate role
in gene silencing.
As was predicted, SPEN functions downstream of Xist at least in part via HDAC3-
mediated histone deacetylation, evidenced by findings that specific inhibition or knockout
of HDAC3 also causes a defect in Xist-mediated gene silencing (McHugh et al. 2015; Zylicz
et al. 2019). However, this deficiency is significantly less than what is observed upon full
ablation of SPEN, suggesting additional roles or pathways linked to SPEN independent of
HDAC3. As such, interactions that have been found between SPEN and other chromatin-
modifying complexes offer intriguing candidates for further study (Oswald et al. 2016;
Dossin et al. 2020) (see 5.10).
50
1.3.4 Xist recruits the Polycomb system to assist silencing
The known role for Polycomb downstream of Xist in XCI significantly pre-dates that of
SPEN. At the time when both PRC1 and PRC2 complexes and their associated histone
modifications were discovered to be enriched over Xi, the intricacies of mammalian Poly-
comb complex formation and recruitment genome-wide were not well established, and
accordingly there is a wealth of somewhat-contradictory historical literature. PRC2 was
originally the more studied in relation to XCI as female-specific phenotypes were first
observed in the extraembryonic lineages of Eed mutant mice (Wang et al. 2001), but
enrichment of both complexes was found to be tightly Xist-dependent in a variety of con-
texts (Plath et al. 2003; Silva et al. 2003; Napoles et al. 2004; Fang et al. 2004). These
observations, indicative of direct Polycomb recruitment by Xist, were of great interest in
the XCI field but also more widely as a potential paradigm for RNA-direct Polycomb
recruitment. It was initially proposed that the A-repeat recruits Polycomb via a direct
interaction with the core PRC2 component EZH2 (Zhao et al. 2008), but this model was
contradicted by numerous findings such as the observation that A-repeat deletion abolishes
gene silencing but not Polycomb recruitment (Kohlmaier et al. 2004; Rocha et al. 2014),
and that Xist-mediated PRC1 enrichment can occur independently of PRC2 (Schoeftner
et al. 2006). Furthermore, PRC1 but not PRC2 subunits were found in RNA-pulldown
proteomics of direct Xist interactors (Chu et al. 2015; McHugh et al. 2015), and super-
resolution microscopy argued against close associations between PRC2 complexes and Xist
RNA (Cerase et al. 2014). However, before the discovery of non-canonical modes of PRC1-
dependent PRC2 recruitment (see 1.1.4) it was unclear how these observations could be
resolved into a PRC1-centric model of Xist-mediated Polycomb recruitment.
A series of landmark studies have recently comprehensively overturned the PRC2-interaction
model and elucidated key molecular details of the Polycomb recruitment pathway by Xist.
51
The Polycomb system is bridged to Xist by hnRNPK, which directly binds to a region
of Xist RNA spanning the B- and C-repeats (Cirillo et al. 2016) that is both necessary
and sufficient for recruitment of all Polycomb complexes to Xist domains (Chu et al. 2015;
Pintacuda et al. 2017b). Multiple hnRNPK molecules are thought to interact with Xist
via three RNA-binding KH domains (Paziewska et al. 2004) to tandem triplicate cytosine
motifs in the B/C-repeat sequence (Nakamoto et al. 2020). Disruption of hnRNPK phe-
nocopies B/C-repeat deletion by strongly abrogating Polycomb recruitment (Chu et al.
2015; Pintacuda et al. 2017b), while tethering of hnRNPK to Xist∆B/C can rescue re-
cruitment of Polycomb (Pintacuda et al. 2017b). Crucially, hnRNPK bridges specifically
to the PCGF3/5-PRC1 complex (Pintacuda et al. 2017b). Accordingly, PCGF3/5-PRC1-
mediated H2AK119ub1 is strictly required upstream of a positive feedback cascade result-
ing in the enrichment of other variant PRC1 complexes, PRC2, and ultimately, canonical
PRC1 via binding to PRC2-mediated H3K27me3 (Almeida et al. 2017; Cooper et al.
2016).
This newly defined mechanism is approaching scientific consensus as a number of groups
have confirmed the central functions of either the B/C-repeat (Bousard et al. 2019; Colog-
nori et al. 2019), hnRNPK (Chu et al. 2015; Schertzer et al. 2019; Colognori et al. 2019) or
PCGF3/5-PRC1 (Nesterova et al. 2019) for Xist-dependent Polycomb recruitment (see 6.8
and Almeida et al. 2020). However, there is some discrepancy regarding the contribution
of the Polycomb system towards gene silencing. Experiments that have ablated Polycomb
recruitment and/or function in mESC models have variably reported minor (Bousard et
al. 2019), intermediate (Nesterova et al. 2019; Pintacuda et al. 2017b) or strong (Colog-
nori et al. 2019, 2020) defects in gene silencing, which could either reflect experimental
differences in silencing assays or that the importance of Polycomb for gene silencing in
XCI is contextually variable. Furthermore, the molecular mechanisms underpinning ex-
actly how Polycomb complexes and/or modifications cause gene repression are yet to be
52
elucidated, and the question of which specific Polycomb subtypes make the largest direct
contributions towards gene silencing is largely unresolved and worthy of further study.
Nevertheless, a strong piece of evidence substantiating the in vivo significance of Poly-
comb in XCI was found through phenotypic analysis of Pcgf3 Pcgf5 null embryos, which
demonstrate female-specific lethality at an earlier stage (E7.5-E9.5) than male embryos
(E9.5-E12.5) (Almeida et al. 2017).
1.3.5 Other putative Xist silencing pathways
In addition to SPEN and Polycomb components, other molecular pathways have been re-
lated to Xist-mediated silencing in XCI. One of these is the pathway of post-transcriptional
RNA modification by N6-methyladenosine (m6A), which has recently emerged as a new
layer of regulation controlling a variety of processes in RNA metabolism and gene reg-
ulation (reviewed in Roundtree et al. 2017). Xist demonstrates multiple peaks of m6A
modification (Linder et al. 2015; Patil et al. 2016), with the strongest lying just down-
stream of the A-repeat in exon 1 (see Figure 1.7). Additionally, components of the m6A
machinery were identified in the 2015 studies of Xist interactors (Chu et al. 2015; Moindrot
et al. 2015), including the SPOC-domain containing RBP RBM15, an accessory protein of
the METTL3/14 m6A methyltransferase complex. RBM15 was subsequently shown to in-
teract directly with the Xist A-repeat by CLIP (Patil et al. 2016), implicating a mechanism
of targeting m6A to Xist RNA. Multiple studies have since investigated the role of RBM15
and the m6A machinery in Xist-mediated silencing, with one report finding significantly
impaired silencing upon mutation of the core m6A writer METTL3 (Patil et al. 2016).
However, other studies disrupting other m6A proteins such as WTAP (Chu et al. 2015;
Moindrot et al. 2015), RBM15 or METTL3/14 (Nesterova et al. 2019), or deleting Xist
m6A sites (Coker et al. 2020) have found little or no deficiency in Xist-mediated silencing.
As the m6A machinery has known functions in RNA export and decay (reviewed in Lee
53
et al. 2020), it is thus more likely to affect Xist RNA stability (or other behaviours) rather
than play a direct role in recruiting downstream pathways of chromatin silencing.
Proteomic screens also identified the nuclear laminar protein LBR (Lamin B Receptor) as
interacting with Xist (McHugh et al. 2015; Minajigi et al. 2015; Chu et al. 2015). LBR
was subsequently shown to bind Xist across the whole transcript but mostly concentrated
in specific areas such as the ‘LBS’ region downstream of the A-repeat and spanning the
F-repeats (Chen et al. 2016a; Cirillo et al. 2016). This interaction was reported to play a
vital role in silencing by tethering of Xist to the nuclear lamina, facilitating the spread of
Xist RNPs over active chromatin, and accounting for the well-known observation that the
Xi territory associates with the heterochromatic regions of the nuclear periphery (Barton
et al. 1964; Eils et al. 1996; Chen et al. 2016a). However, a subsequent study found little
effect of Lbr deletion in mESCs models with inducible Xist (Nesterova et al. 2019), and
Lbr gene mutations in mice present no obvious female-specific phenotypes (Schultz et al.
2003; Young et al. 2021), implying that the role of LBR for downstream silencing functions
of Xist is very minor.
A recent publication has reported that other than CIZ1, several other proteins interact
with the E-repeat of Xist and contribute to gene silencing; PTBP1, MATR3, TDP-43
and CELF1 (Pandya-Jones et al. 2020). The authors report that these proteins form a
condensate in the Xi via self-aggregation and heterotypic protein-protein interactions that
has a pronounced role in maintaining gene silencing after the developmental transition
from Xist-dependent to Xist-independent XCI. However, in another study deletion of
the Xist E-repeat did not compromise efficient X-linked gene silencing after 12 days of
mESC differentiation, indicating that the contribution of this condensate to the initial
establishment of XCI may be minimal (Yue et al. 2017).
54
1.3.6 Later pathways related to XCI maintenance and Xi chromosomal
superstructure
As discussed in 1.2.5, a number of the changes that Xist orchestrates to Xi are only vis-
ible at later stages of XCI in models that involve cellular differentiation alongside Xist
expression. A priori these delays could be caused either by a reliance on the progression
of earlier stages of the inactivation process (e.g. gene silencing), or by interplay between
XCI and differentiation/pluripotency, or some combination of both these reasons. One
such ‘late’ feature of XCI is the recruitment of the non-canonical SMC complex SMCHD1,
which occurs several days after the onset of Xist expression in differentiating in vitro mod-
els and, due to the fact it is required for DNA methylation of the majority of Xi CpG
island promoters, has been implicated the heritable maintenance of inactivation (Blewitt
et al. 2008; Gendrel et al. 2012). SMCHD1 recruitment to Xi is dependent on PRC1
activity (Jansz et al. 2018b), although this cannot explain its slower dynamics as Poly-
comb recruitment is an early event of XCI. Likewise, a subset of genes are derepressed in
mouse embryonic fibroblasts (MEFs) derived from female-lethal Smchd1 knockout mouse
embryos, but not after de novo Smchd1 deletion in somatic cells with an established Xi
(Sakakibara et al. 2018; Gdula et al. 2019), which is difficult to reconcile with a function
purely in maintenance.
The role of SMCHD1 in XCI has recently become clearer in the context of advances
characterising the 3D chromosome architecture of Xi. As measured by the chromosome
conformation capture method HiC, the Xa is similar to autosomes in that it is organised
into so-called A/B-compartments, guided by active and repressive chromatin states, and
TADs formed by CTCF and Cohesin (see 1.1.5). In contrast, the Xi adopts a unique
bipartite structure characterised by two large ‘megadomains’ divided by a boundary at
the repetitive non-coding locus Dxz4 (Splinter et al. 2011; Rao et al. 2014; Deng et al.
55
2015; Giorgetti et al. 2016), which is heavily bound by CTCF (Chadwick 2008) and can
form ‘superloop’ interactions over megabase distances with another CTCF-rich non-coding
locus Firre (Darrow et al. 2016). Within these megadomains of the silent Xi there is min-
imal TAD structure or chromatin accessibility of CREs, except at notable exceptions such
as loci of constitutive escapee genes (Giorgetti et al. 2016). Notably, this superstructure
is only fully formed late in XCI, whereupon its key conformational features can be dis-
rupted without gene reactivation (Darrow et al. 2016; Giorgetti et al. 2016; Froberg et al.
2018; Bonora et al. 2018), so it does not seem to be necessary for maintaining transcrip-
tional silencing of most genes. However, several groups recently defined a key function
for SMCHD1 in the later stages of this reorganisation of the chromosomal architecture,
finding that derepressed ‘SMCHD1-dependent’ genes are located within chromatin regions
of residual TAD-like structure in the Xi of Smchd1 null cells (Wang et al. 2018a; Jansz
et al. 2018a; Gdula et al. 2019). Therefore, ‘late pathways’ of chromosome conformation
reorganisation have an important role in the final stages of full XCI establishment, al-
though the specific mechanisms of SMCHD1 function and its timely recruitment are yet
to be determined.

56
1.4 Summary and aims
In summary, X chromosome inactivation is an important paradigm for lncRNA-mediated
regulation of gene expression in mammalian development and its study can inform our
understanding of the molecular mechanisms of gene regulation more widely. A wealth of
research in recent years has characterised many of the important chromatin changes that
occur during XCI and elucidated molecular pathways downstream of Xist. Broadly, this
implicates two main pathways, centred on SPEN and the Polycomb system, as making
predominant contributions to the initial establishment of gene silencing, and various other
pathways as affecting different aspects of Xist function or necessary only for the later
stages of inactivation. However, studies have been conducted in a variety of disparate ex-
perimental models of XCI and have largely analysed features or pathways of gene silencing
on an individual basis.
Therefore, the basis of my project was to use high-resolution genomics methods in a unified
model system to investigate the molecular mechanisms and interplay of key silencing path-
ways, and thus strive towards a full understanding of how Xist establishes gene silencing
in XCI.
More specifically, I hoped to achieve the following aims, addressed throughout this the-
sis:
• Characterise the relative dynamics and gene-by-gene variation of important Xist-
mediated changes to chromatin of Xi with unprecedented resolution
• Investigate which genomic features determine the kinetics of silencing for individ-
ual genes with a particular focus on the role of CREs and transcription factors,
which have been relatively understudied in the XCI field considering their central
importance in developmental gene regulation

57
• Unveil candidate factors mediating late silencing or escape of particular genes
• Assess cellular heterogeneity of Xist-mediated silencing
• Further dissect the molecular mechanisms of how the key SPEN and Polycomb
pathways bring about gene silencing
• Investigate modes of interplay between SPEN and Polycomb downstream of Xist
and determine their relative contributions to gene silencing

Chapter 2
Materials and methods
2.1 Molecular cloning
2.1.1 Cloning of homology vectors for CRISPR-Cas9 targeting
The homology vectors used to engineer the cell lines derived for this study are listed
in Table 2.1, with contributions from colleagues towards the cloning of these plasmids
credited.
The plasmids I generated were cloned by Gibson Assembly using the oligos listed in Ta-
ble 2.2 (synthesised from Invitrogen). Most of these were designed so that the Gibson
primers inherently introduced mutations to the PAM recognition sequence of the relevant
sgRNAs co-transfected with homology vectors for genome targeting. Briefly, 300-500bp
homology fragments were amplified by PCR from iXist-ChrX genomic DNA using Fast-
Start High Fidelity enzyme (Sigma Aldrich). N-terminal FKBP12F36V fragments were
amplified originally from pLEX 305-N-dTAG (Addgene #91797) (Nabet et al. 2018), then
subsequently from previously-generated FKBP12F36V vectors, using Velocity DNA Poly-
merase PCR mix (Bioline). Gibson assembly ligation into a restriction-enzyme digested
pCAG backbone plasmid was then performed using Gibson Assembly Master Mix (NEB)
according to manufacturer’s guidance. 5-10µl of ligated product was transformed into
DH5α competent (made in-house) or XL10-Gold ultracompetent bacteria (Agilent). DNA
was isolated from bacterial colonies using the Miniprep or Midiprep kits (Qiagen) and
58
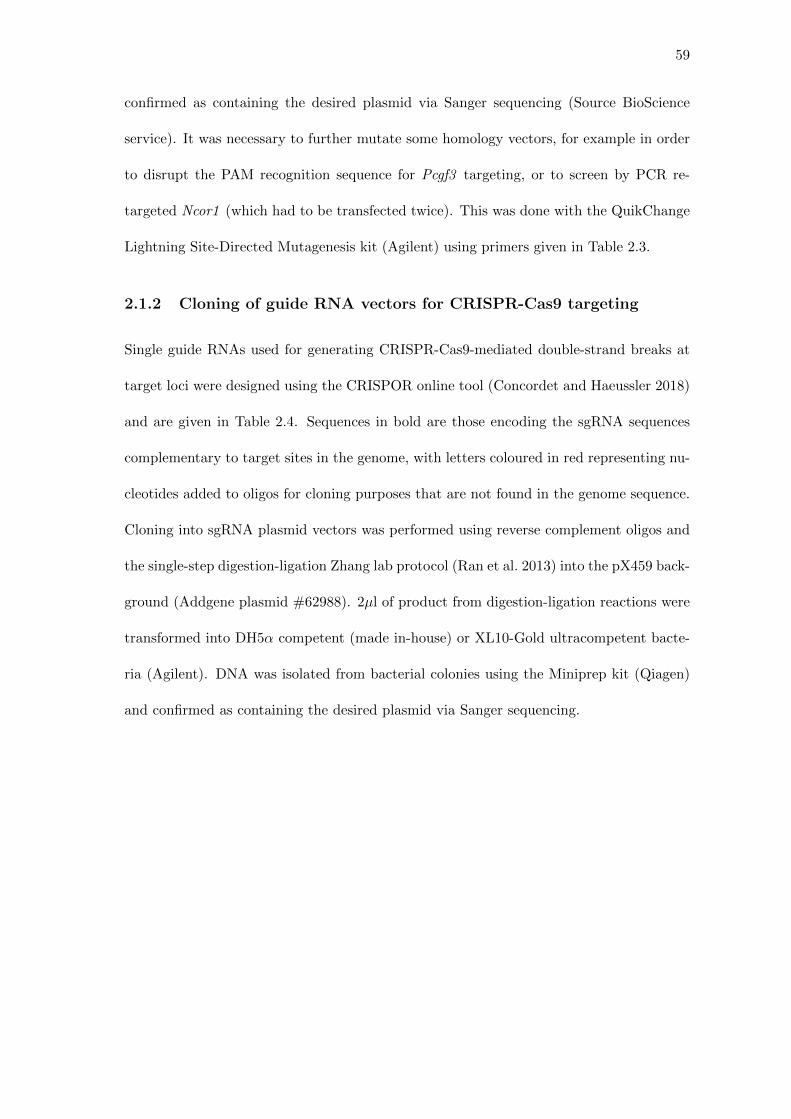
59
confirmed as containing the desired plasmid via Sanger sequencing (Source BioScience
service). It was necessary to further mutate some homology vectors, for example in order
to disrupt the PAM recognition sequence for Pcgf3 targeting, or to screen by PCR re-
targeted Ncor1 (which had to be transfected twice). This was done with the QuikChange
Lightning Site-Directed Mutagenesis kit (Agilent) using primers given in Table 2.3.
2.1.2 Cloning of guide RNA vectors for CRISPR-Cas9 targeting
Single guide RNAs used for generating CRISPR-Cas9-mediated double-strand breaks at
target loci were designed using the CRISPOR online tool (Concordet and Haeussler 2018)
and are given in Table 2.4. Sequences in bold are those encoding the sgRNA sequences
complementary to target sites in the genome, with letters coloured in red representing nu-
cleotides added to oligos for cloning purposes that are not found in the genome sequence.
Cloning into sgRNA plasmid vectors was performed using reverse complement oligos and
the single-step digestion-ligation Zhang lab protocol (Ran et al. 2013) into the pX459 back-
ground (Addgene plasmid #62988). 2µl of product from digestion-ligation reactions were
transformed into DH5α competent (made in-house) or XL10-Gold ultracompetent bacte-
ria (Agilent). DNA was isolated from bacterial colonies using the Miniprep kit (Qiagen)
and confirmed as containing the desired plasmid via Sanger sequencing.
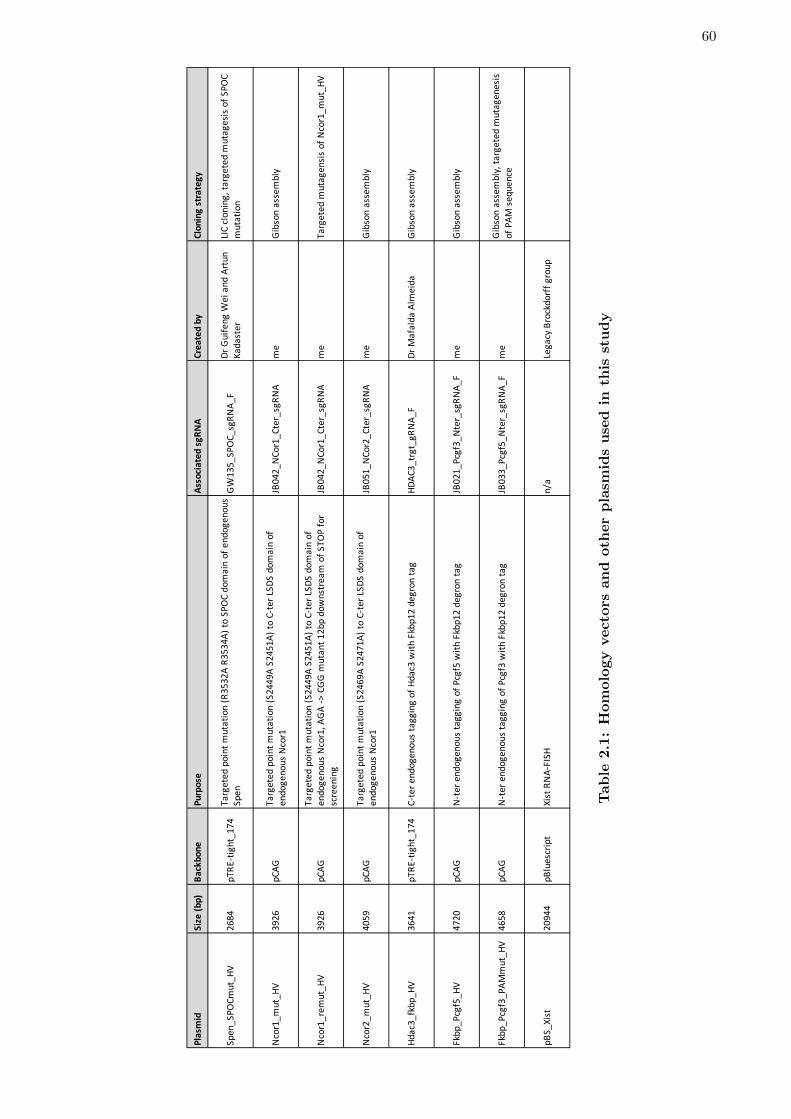
60
Plas
mid
Size
(bp)
Back
bone
Purp
ose
Asso
ciat
ed s
gRN
ACr
eate
d by
Clon
ing
stra
tegy
Spen
_SPO
Cmut
_HV
2684
pTRE
-tig
ht_1
74Ta
rget
ed p
oint
mut
atio
n (R
3532
A R3
534A
) to
SPO
C do
mai
n of
end
ogen
ous
Spen
GW
135_
SPO
C_sg
RNA_
FDr
Gui
feng
Wei
and
Art
un
Kada
ster
LIC
clon
ing,
targ
eted
mut
ages
is o
f SPO
C m
utat
ion
Nco
r1_m
ut_H
V39
26pC
AGTa
rget
ed p
oint
mut
atio
n (S
2449
A S2
451A
) to
C-te
r LSD
S do
mai
n of
en
doge
nous
Nco
r1JB
042_
NCo
r1_C
ter_
sgRN
Am
eG
ibso
n as
sem
bly
Nco
r1_r
emut
_HV
3926
pCAG
Targ
eted
poi
nt m
utat
ion
(S24
49A
S245
1A) t
o C-
ter L
SDS
dom
ain
of
endo
geno
us N
cor1
, AG
A ->
CG
G m
utan
t 12b
p do
wns
trea
m o
f STO
P fo
r sc
reen
ing
JB04
2_N
Cor1
_Cte
r_sg
RNA
me
Targ
eted
mut
agen
sis
of N
cor1
_mut
_HV
Nco
r2_m
ut_H
V40
59pC
AGTa
rget
ed p
oint
mut
atio
n (S
2469
A S2
471A
) to
C-te
r LSD
S do
mai
n of
en
doge
nous
Nco
r1JB
051_
NCo
r2_C
ter_
sgRN
Am
eG
ibso
n as
sem
bly
Hdac
3_fk
bp_H
V36
41pT
RE-t
ight
_174
C-te
r end
ogen
ous
tagg
ing
of H
dac3
with
Fkb
p12
degr
on ta
gHD
AC3_
trgt
_gRN
A_F
Dr M
afal
da A
lmei
daG
ibso
n as
sem
bly
Fkbp
_Pcg
f5_H
V47
20pC
AGN
-ter
end
ogen
ous
tagg
ing
of P
cgf5
with
Fkb
p12
degr
on ta
gJB
021_
Pcgf
3_N
ter_
sgRN
A_F
me
Gib
son
asse
mbl
y
Fkbp
_Pcg
f3_P
AMm
ut_H
V46
58pC
AGN
-ter
end
ogen
ous
tagg
ing
of P
cgf3
with
Fkb
p12
degr
on ta
gJB
033_
Pcgf
5_N
ter_
sgRN
A_F
me
Gib
son
asse
mbl
y, ta
rget
ed m
utag
enes
is
of P
AM s
eque
nce
pBS_
Xist
2094
4pB
lues
crip
tXi
st R
NA-
FISH
n/a
Lega
cy B
rock
dorf
f gro
up
Tab
le2.1
:H
om
olo
gy
vecto
rsan
doth
er
pla
smid
su
sed
inth
isst
ud
y
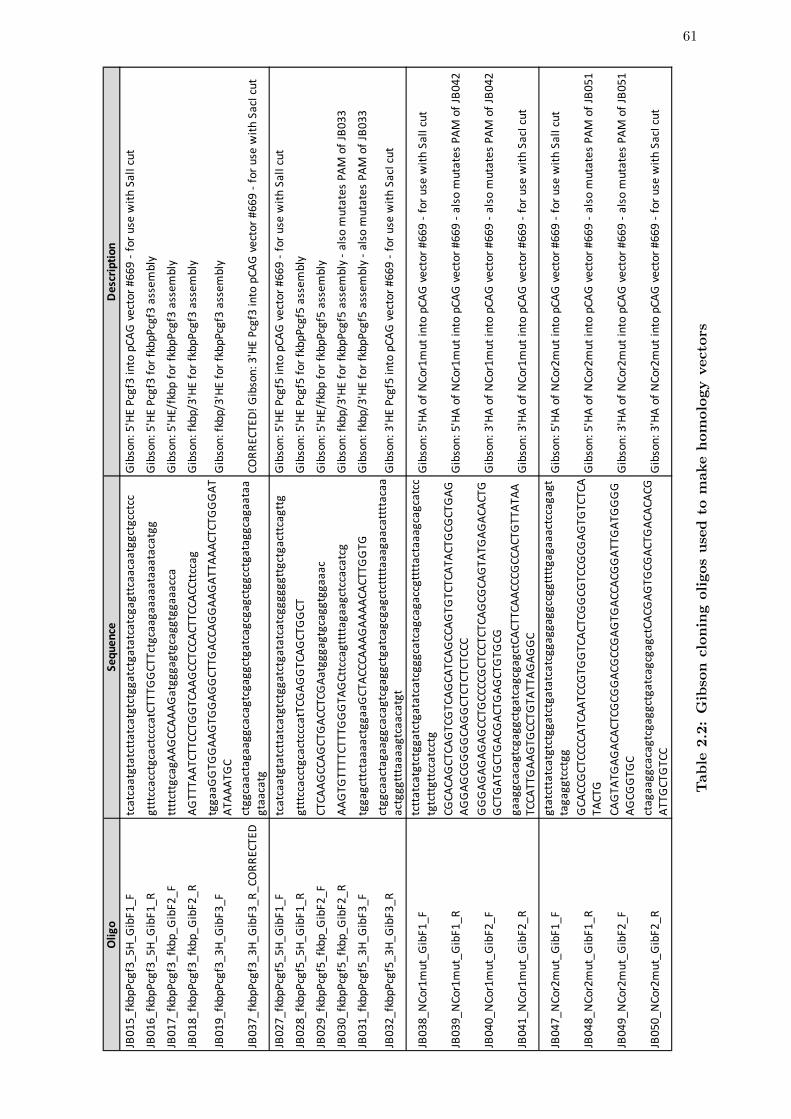
61
Oligo
Sequence
Descriptio
nJB
015_
fkbp
Pcgf
3_5H
_Gib
F1_F
tcat
caat
gtat
ctta
tcat
gtct
ggat
ctga
tatc
atcg
agtt
caac
aatg
gctg
cctc
cG
ibso
n: 5
'HE
Pcgf
3 in
to p
CAG
vec
tor #
669
- for
use
with
Sal
I cut
JB01
6_fk
bpPc
gf3_
5H_G
ibF1
_Rgt
ttcc
acct
gcac
tccc
atCT
TTG
GCT
Tctg
caag
aaaa
ataa
atac
atgg
Gib
son:
5'H
E Pc
gf3
for f
kbpP
cgf3
ass
embl
y
JB01
7_fk
bpPc
gf3_
fkbp
_Gib
F2_F
tttt
cttg
cagA
AGCC
AAAG
atgg
gagt
gcag
gtgg
aaac
caG
ibso
n: 5
'HE/
fkbp
for f
kbpP
cgf3
ass
embl
y
JB01
8_fk
bpPc
gf3_
fkbp
_Gib
F2_R
AGTT
TAAT
CTTC
CTG
GTC
AAG
CCTC
CACT
TCCA
CCtt
ccag
Gib
son:
fkbp
/3'H
E fo
r fkb
pPcg
f3 a
ssem
bly
JB01
9_fk
bpPc
gf3_
3H_G
ibF3
_Ftg
gaaG
GTG
GAA
GTG
GAG
GCT
TGAC
CAG
GAA
GAT
TAAA
CTCT
GG
GAT
ATAA
ATG
CG
ibso
n: fk
bp/3
'HE
for f
kbpP
cgf3
ass
embl
y
JB03
7_fk
bpPc
gf3_
3H_G
ibF3
_R_C
ORR
ECTE
Dct
ggca
acta
gaag
gcac
agtc
gagg
ctga
tcag
cgag
ctgg
cctg
atag
gcag
aata
agt
aaca
tgCO
RREC
TED!
Gib
son:
3'H
E Pc
gf3
into
pCA
G v
ecto
r #66
9 - f
or u
se w
ith S
acI c
ut
JB02
7_fk
bpPc
gf5_
5H_G
ibF1
_Ftc
atca
atgt
atct
tatc
atgt
ctgg
atct
gata
tcat
cggg
gggt
tgct
gact
tcag
ttg
Gib
son:
5'H
E Pc
gf5
into
pCA
G v
ecto
r #66
9 - f
or u
se w
ith S
alI c
ut
JB02
8_fk
bpPc
gf5_
5H_G
ibF1
_Rgt
ttcc
acct
gcac
tccc
atTC
GAG
GTC
AGCT
GG
CTG
ibso
n: 5
'HE
Pcgf
5 fo
r fkb
pPcg
f5 a
ssem
bly
JB02
9_fk
bpPc
gf5_
fkbp
_Gib
F2_F
CTCA
AGCC
AGCT
GAC
CTCG
Aatg
ggag
tgca
ggtg
gaaa
cG
ibso
n: 5
'HE/
fkbp
for f
kbpP
cgf5
ass
embl
y
JB03
0_fk
bpPc
gf5_
fkbp
_Gib
F2_R
AAG
TGTT
TTCT
TTG
GG
TAG
Cttc
cagt
ttta
gaag
ctcc
acat
cgG
ibso
n: fk
bp/3
'HE
for f
kbpP
cgf5
ass
embl
y - a
lso
mut
ates
PAM
of J
B033
JB03
1_fk
bpPc
gf5_
3H_G
ibF3
_Ftg
gagc
ttct
aaaa
ctgg
aaG
CTAC
CCAA
AGAA
AACA
CTTG
GTG
Gib
son:
fkbp
/3'H
E fo
r fkb
pPcg
f5 a
ssem
bly
- als
o m
utat
es P
AM o
f JB0
33
JB03
2_fk
bpPc
gf5_
3H_G
ibF3
_Rct
ggca
acta
gaag
gcac
agtc
gagg
ctga
tcag
cgag
ctct
ttta
aaga
acat
ttta
caa
actg
ggtt
taaa
agtc
aaca
tgt
Gib
son:
3'H
E Pc
gf5
into
pCA
G v
ecto
r #66
9 - f
or u
se w
ith S
acI c
ut
JB03
8_N
Cor1
mut
_Gib
F1_F
tctt
atca
tgtc
tgga
tctg
atat
catc
gggc
atca
gcag
accg
tttt
acta
aagc
agca
tcc
tgtc
ttgt
tcca
tcct
gG
ibso
n: 5
'HA
of N
Cor1
mut
into
pCA
G v
ecto
r #66
9 - f
or u
se w
ith S
alI c
ut
JB03
9_N
Cor1
mut
_Gib
F1_R
CGCA
CAG
CTCA
GTC
GTC
AGCA
TCAG
CCAG
TGTC
TCAT
ACTG
CGCT
GAG
AGG
AGCG
GG
GCA
GG
CTCT
CTCT
CCC
Gib
son:
5'H
A of
NCo
r1m
ut in
to p
CAG
vec
tor #
669
- als
o m
utat
es P
AM o
f JB0
42
JB04
0_N
Cor1
mut
_Gib
F2_F
GG
GAG
AGAG
AGCC
TGCC
CCG
CTCC
TCTC
AGCG
CAG
TATG
AGAC
ACTG
GCT
GAT
GCT
GAC
GAC
TGAG
CTG
TGCG
Gib
son:
3'H
A of
NCo
r1m
ut in
to p
CAG
vec
tor #
669
- als
o m
utat
es P
AM o
f JB0
42
JB04
1_N
Cor1
mut
_Gib
F2_R
gaag
gcac
agtc
gagg
ctga
tcag
cgag
ctCA
CTTC
AACC
CGCC
ACTG
TTAT
AATC
CATT
GAA
GTG
CCTG
TATT
AGAG
GC
Gib
son:
3'H
A of
NCo
r1m
ut in
to p
CAG
vec
tor #
669
- for
use
with
Sac
I cut
JB04
7_N
Cor2
mut
_Gib
F1_F
gtat
ctta
tcat
gtct
ggat
ctga
tatc
atcg
gagg
aggc
cggt
tttg
agaa
actc
caga
gtta
gagg
tcct
ggG
ibso
n: 5
'HA
of N
Cor2
mut
into
pCA
G v
ecto
r #66
9 - f
or u
se w
ith S
alI c
ut
JB04
8_N
Cor2
mut
_Gib
F1_R
GCA
CCG
CTCC
CCAT
CAAT
CCG
TGG
TCAC
TCG
GCG
TCCG
CGAG
TGTC
TCA
TACT
GG
ibso
n: 5
'HA
of N
Cor2
mut
into
pCA
G v
ecto
r #66
9 - a
lso
mut
ates
PAM
of J
B051
JB04
9_N
Cor2
mut
_Gib
F2_F
CAG
TATG
AGAC
ACTC
GCG
GAC
GCC
GAG
TGAC
CACG
GAT
TGAT
GG
GG
AGCG
GTG
CG
ibso
n: 3
'HA
of N
Cor2
mut
into
pCA
G v
ecto
r #66
9 - a
lso
mut
ates
PAM
of J
B051
JB05
0_N
Cor2
mut
_Gib
F2_R
ctag
aagg
caca
gtcg
aggc
tgat
cagc
gagc
tCAC
GAG
TGCG
ACTG
ACAC
ACG
ATTG
CTG
TCC
Gib
son:
3'H
A of
NCo
r2m
ut in
to p
CAG
vec
tor #
669
- for
use
with
Sac
I cut
Tab
le2.2
:G
ibso
nclo
nin
goligos
use
dto
make
hom
olo
gy
vecto
rs
62
Primer Sequence PurposeJB056_NCor1mut_ReMutF GACTGAGCTGTGCGTGGGCGGGCGCTCTGGCTTTG Mutageneisis of Ncor1_mut_HV for final targeting
JB057_NCor1mut_ReMutR CAAAGCCAGAGCGCCCGCCCACGCACAGCTCAGTC Mutageneisis of Ncor1_mut_HV for final targeting
JB023_Pcgf3_JB021_mutF catcacctgccgtctgtgcagcggc Mutagensis of PAM (of JB021 gRNA) in Fkbp_Pcgf3_HV
JB024_Pcgf3_JB021_mutR gccgctgcacagacggcaggtgatg Mutagensis of PAM (of JB021 gRNA) in Fkbp_Pcgf3_HV
Table 2.3: Primers for targeted mutagenesis of vectors
Oligo Sequence Designed byGW135_SPOC_sgRNA_F CACCGCCCCACTGCGGATCGCCCAG Dr Guifeng Wei
GW136_SPOC_sgRNA_R AAACCTGGGCGATCCGCAGTGGGGC Dr Guifeng Wei
JB042_NCor1_Cter_sgRNA_F CACCGCATCAACAGAACCGCATCTGGGAGAGG me
JB043_NCor1_Cter_sgRNA_R AAACCCTCTCCCAGATGCGGTTCTGTTGATGC me
JB051_NCor2_Cter_sgRNA_F CACCGGACAGCGAGTGACCACGGATTGG me
JB052_NCor2_Cter_sgRNA_RC AAACCCAATCCGTGGTCACTCGCTGTCC me
HDAC3_trgt_gRNA_F CACCGGGCGACCATGACAACGACA Dr Mafalda Almeida
HDAC3_trgt_gRNA_R AAACTGTCGTTGTCATGGTCGCCC Dr Mafalda Almeida
JB021_Pcgf3_Nter_sgRNA_F CACCGAATGAGGTAGCCGCTGCAC me
JB022_Pcgf3_Nter_sgRNA_R AAACGTGCAGCGGCTACCTCATTC me
JB033_Pcgf5_Nter_sgRNA_F CACCGACCTCGAATGGCTACCCAA me
JB036_Pcgf5_Nter_sgRNA_R AAACTTGGGTAGCCATTCGAGGTC me
Table 2.4: CRISPR-Cas9 sgRNAs and reverse complement oligos

63
2.2 Cell culture
iXist-ChrX (Nesterova et al. 2019) and derivative cell lines were routinely maintained with
Dulbecco’s Modified Eagle Medium (DMEM; Life Technologies) supplemented with 10%
foetal calf serum (FCS; ThermoFisher), 2mM L-glutamine, 0.1mM non-essential amino
acids, 50µM β-mercaptoethanol, 100U/ml penicillin/100µg/ml streptomycin (all from Life
Technologies) and 1000U/ml LIF (made in-house by Dr Tatyana Nesterova). mESCs were
grown on gelatin-coated plates under standard mESC culture conditions (37oC, 5% CO2,
humid) atop a ‘feeder’ layer of MitomycinC-inactivated (Sigma Aldrich) SNLP mouse fi-
broblasts and passaged upon ∼80% confluency every 2-3 days using Trypsin-EDTA (Ther-
moFisher) +2% Calf Serum at 37oC, or latterly TrypLE Express (ThermoFisher) at room
temperature. Cell lines were frozen for liquid nitrogen stocks as 1ml cryovials of 0.5-1x10⁷
cells in FCS + 10% DMSO, and thawed by pelleting cells to remove DMSO then re-plating
in standard mESC conditions.
Prior to experiments, iXist-ChrX lines were pre-plated for 30-40 minutes on gelatinised
dishes to allow feeder cells to preferentially attach, with slower-attaching mESCs then
taken from suspension and plated on feederless gelatinised dishes to be harvested for
further protocols when confluent (i.e. 2-3 days later). For all experiments presented in this
thesis, Xist expression was induced by addition of 1µg/ml doxycycline to the growth media,
and in the case of FKBP12F36V lines dTAG-13 treatment was typically applied 12 hours
prior to Xist induction. Induced and uninduced mESCs were harvested by one in-plate
PBS wash (to remove ES media and floating dead cells), trypsinisation for ∼5 minutes,
quenching with ES media, then cell collection, counting and pelleting by centrifugation
at 194g for 3 minutes. Cell pellets were typically washed at least once with PBS before
used in experimental protocols or snap-frozen for storage at -80oC. Cell counting was
performed with a LUNA-II automated counter (Logos Biosystems). For calibrated ChIP-
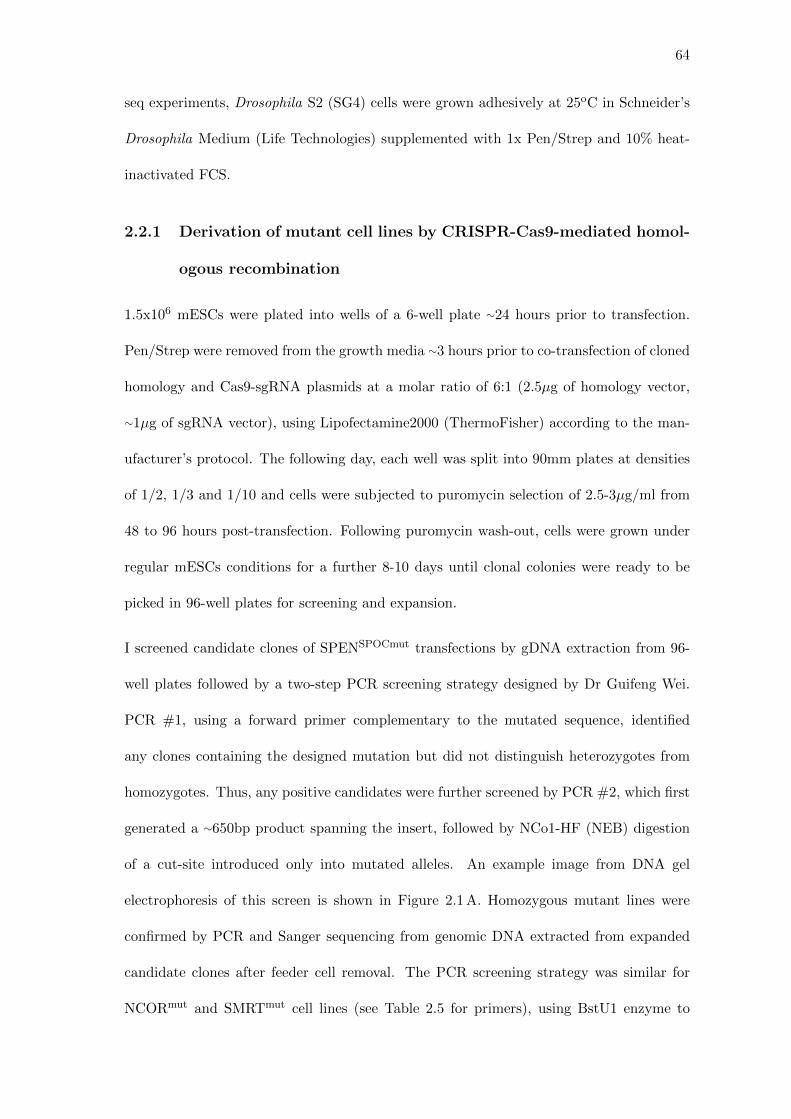
64
seq experiments, Drosophila S2 (SG4) cells were grown adhesively at 25oC in Schneider’s
Drosophila Medium (Life Technologies) supplemented with 1x Pen/Strep and 10% heat-
inactivated FCS.
2.2.1 Derivation of mutant cell lines by CRISPR-Cas9-mediated homol-
ogous recombination
1.5x10⁶ mESCs were plated into wells of a 6-well plate ∼24 hours prior to transfection.
Pen/Strep were removed from the growth media ∼3 hours prior to co-transfection of cloned
homology and Cas9-sgRNA plasmids at a molar ratio of 6:1 (2.5µg of homology vector,
∼1µg of sgRNA vector), using Lipofectamine2000 (ThermoFisher) according to the man-
ufacturer’s protocol. The following day, each well was split into 90mm plates at densities
of 1/2, 1/3 and 1/10 and cells were subjected to puromycin selection of 2.5-3µg/ml from
48 to 96 hours post-transfection. Following puromycin wash-out, cells were grown under
regular mESCs conditions for a further 8-10 days until clonal colonies were ready to be
picked in 96-well plates for screening and expansion.
I screened candidate clones of SPENSPOCmut transfections by gDNA extraction from 96-
well plates followed by a two-step PCR screening strategy designed by Dr Guifeng Wei.
PCR #1, using a forward primer complementary to the mutated sequence, identified
any clones containing the designed mutation but did not distinguish heterozygotes from
homozygotes. Thus, any positive candidates were further screened by PCR #2, which first
generated a ∼650bp product spanning the insert, followed by NCo1-HF (NEB) digestion
of a cut-site introduced only into mutated alleles. An example image from DNA gel
electrophoresis of this screen is shown in Figure 2.1 A. Homozygous mutant lines were
confirmed by PCR and Sanger sequencing from genomic DNA extracted from expanded
candidate clones after feeder cell removal. The PCR screening strategy was similar for
NCORmut and SMRTmut cell lines (see Table 2.5 for primers), using BstU1 enzyme to
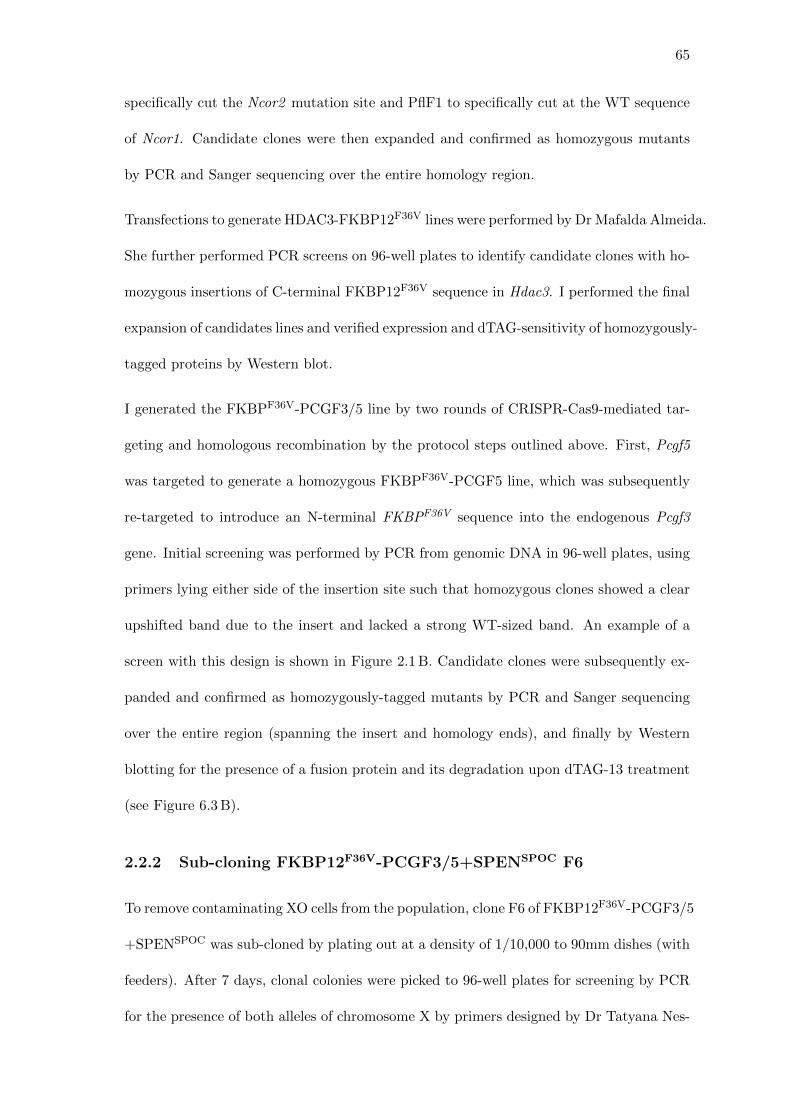
65
specifically cut the Ncor2 mutation site and PflF1 to specifically cut at the WT sequence
of Ncor1. Candidate clones were then expanded and confirmed as homozygous mutants
by PCR and Sanger sequencing over the entire homology region.
Transfections to generate HDAC3-FKBP12F36V lines were performed by Dr Mafalda Almeida.
She further performed PCR screens on 96-well plates to identify candidate clones with ho-
mozygous insertions of C-terminal FKBP12F36V sequence in Hdac3. I performed the final
expansion of candidates lines and verified expression and dTAG-sensitivity of homozygously-
tagged proteins by Western blot.
I generated the FKBPF36V-PCGF3/5 line by two rounds of CRISPR-Cas9-mediated tar-
geting and homologous recombination by the protocol steps outlined above. First, Pcgf5
was targeted to generate a homozygous FKBPF36V-PCGF5 line, which was subsequently
re-targeted to introduce an N-terminal FKBPF36V sequence into the endogenous Pcgf3
gene. Initial screening was performed by PCR from genomic DNA in 96-well plates, using
primers lying either side of the insertion site such that homozygous clones showed a clear
upshifted band due to the insert and lacked a strong WT-sized band. An example of a
screen with this design is shown in Figure 2.1 B. Candidate clones were subsequently ex-
panded and confirmed as homozygously-tagged mutants by PCR and Sanger sequencing
over the entire region (spanning the insert and homology ends), and finally by Western
blotting for the presence of a fusion protein and its degradation upon dTAG-13 treatment
(see Figure 6.3 B).
2.2.2 Sub-cloning FKBP12F36V-PCGF3/5+SPENSPOC F6
To remove contaminating XO cells from the population, clone F6 of FKBP12F36V-PCGF3/5
+SPENSPOC was sub-cloned by plating out at a density of 1/10,000 to 90mm dishes (with
feeders). After 7 days, clonal colonies were picked to 96-well plates for screening by PCR
for the presence of both alleles of chromosome X by primers designed by Dr Tatyana Nes-

66
terova (Table 2.5). This screen is shown in Figure 2.1 C and was routinely used to check the
XX status of cell lines generated in this work. XX clones F6G1 and F6G2 were expanded
and re-genotyped by PCR as both SPENSPOC and FKBP12F36V-PCGF3/5.
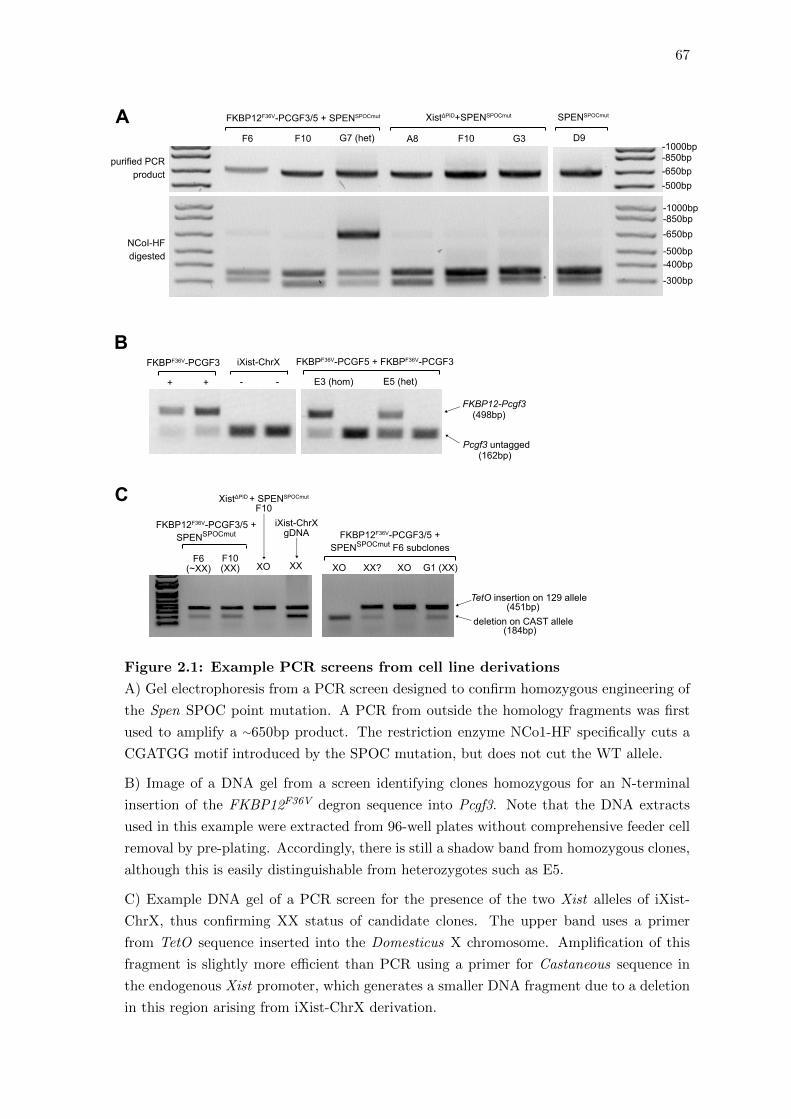
67
FKBP12F36V-PCGF3/5 + SPENSPOCmut
F6
-650bp-500bp
-850bp-1000bp
-650bp
-500bp-400bp
(184bp)
(451bp)
-300bp
-850bp-1000bp
A8 F10 G3 D9F10 G7 (het)
XistΔPID+SPENSPOCmut
XistΔPID+ SPENSPOCmut
F10
SPENSPOCmut
FKBPF36V-PCGF3 FKBPF36V-PCGF5 + FKBPF36V-PCGF3
+ +
iXist-ChrX
- -
iXist-ChrXgDNA FKBP12F36V-PCGF3/5 +
SPENSPOCmut F6 subclones
FKBP12F36V-PCGF3/5 +SPENSPOCmut
F6(~XX)
F10(XX) XO XX XO XO G1 (XX)XX?
E3 (hom) E5 (het)
TetO insertion on 129 allele
deletion on CAST allele
purified PCRproduct
NCoI-HFdigested
(498bp)FKBP12-Pcgf3
(162bp)Pcgf3 untagged
A
B
C
Figure 2.1: Example PCR screens from cell line derivations
A) Gel electrophoresis from a PCR screen designed to confirm homozygous engineering of
the Spen SPOC point mutation. A PCR from outside the homology fragments was first
used to amplify a ∼650bp product. The restriction enzyme NCo1-HF specifically cuts a
CGATGG motif introduced by the SPOC mutation, but does not cut the WT allele.
B) Image of a DNA gel from a screen identifying clones homozygous for an N-terminal
insertion of the FKBP12F36V degron sequence into Pcgf3. Note that the DNA extracts
used in this example were extracted from 96-well plates without comprehensive feeder cell
removal by pre-plating. Accordingly, there is still a shadow band from homozygous clones,
although this is easily distinguishable from heterozygotes such as E5.
C) Example DNA gel of a PCR screen for the presence of the two Xist alleles of iXist-
ChrX, thus confirming XX status of candidate clones. The upper band uses a primer
from TetO sequence inserted into the Domesticus X chromosome. Amplification of this
fragment is slightly more efficient than PCR using a primer for Castaneous sequence in
the endogenous Xist promoter, which generates a smaller DNA fragment due to a deletion
in this region arising from iXist-ChrX derivation.

68
Olig
oSe
quen
cePu
rpos
eD
esig
ned
by
GW
141_
SPO
Cmut
_Scr
een2
_FGGGAC
ACCA
CAAC
GGCC
TGTG
Forw
ard
prim
er fo
r SPO
Cmut
PCR
scr
een
#2 -
frag
men
t for
dig
estio
n an
d se
quen
cing
Dr G
uife
ng W
ei
GW
142_
SPO
Cmut
_Scr
een1
2_R
CAGCA
GCA
GGCA
GTAGTCGG
Reve
rse
prim
er fo
r SPO
Cmut
scr
eens
#1
and
#2Dr
Gui
feng
Wei
GW
143_
SPO
Cmut
_Scr
een1
_FGGATCG
CCCA
GGCC
ATGGCA
Forw
ard
prim
er fo
r SPO
Cmut
PCR
Sce
en #
1 -
anne
als
mut
ant b
ut n
ot W
T, u
se
with
GW
142
Dr G
uife
ng W
ei
JB04
4_N
Cor1
mut
_Scr
een1
_FG
TATG
AGAC
ACTG
GCT
GAT
GCT
Forw
ard
prim
er fo
r NCo
r1m
ut P
CR S
cree
n #1
- an
neal
s m
utat
ed s
eque
nce
but n
ot
WT,
use
with
JB04
6m
e
JB04
5_N
Cor1
mut
_Scr
een2
_FTA
GCA
TGG
CTAA
GCT
TCTC
TGAT
TFo
rwar
d pr
imer
for N
Cor1
mut
PCR
Scr
een
#2 -
frag
men
t for
dig
estio
n an
d se
quen
cing
me
JB04
6_N
Cor1
mut
_Scr
een1
2_R
ACTA
CAG
CAAG
GG
GAT
ACAC
TGRe
vers
e pr
imer
for N
Cor1
mut
scr
eens
#1
and
#2m
e
JB05
8_N
Cor1
mut
_ReM
utSc
reen
1G
ACTG
AGCT
GTG
CGTG
GG
CGG
Forw
ard
prim
er fo
r NCo
r1re
mut
PCR
Scr
een
#1 -
anne
als
re-m
utat
ed s
eque
nce
but n
ot W
T, u
se w
ith JB
046
me
JB05
3_N
Cor2
mut
_Scr
een1
_FG
AGAC
ACTC
GCG
GAC
GC
Forw
ard
prim
er fo
r NCo
r2m
ut P
CR S
cree
n #1
- an
neal
s m
utat
ed s
eque
nce
not W
Tm
e
JB05
4_N
Cor2
mut
_Scr
een2
_FTG
GCT
CGTC
ATAC
AGG
GG
AGFo
rwar
d pr
imer
for N
Cor2
mut
PCR
Scr
een
#2 -
frag
men
t for
dig
estio
n an
d se
quen
cing
me
JB05
5_N
Cor2
mut
_Scr
een1
2_R
TGTC
TGTC
CAG
AGCG
CAAG
Reve
rse
prim
er fo
r NCo
r2m
ut s
cree
ns #
1 an
d #2
me
TN80
5_Xi
stEx
on1_
RACCATACACACACAAGTATCAACC
Reve
rse
prim
er fo
r Xis
t ex
on 1
- us
ed fo
r XX
scre
enin
g in
iXis
t-Ch
rXDr
Tat
yana
Nes
tero
va
TNK6
3_Te
tO_F
TGACCTCCATAGAAGACACCG
Forw
ard
prim
er in
Tet
O s
eque
nce
- use
d fo
r XX
scre
enin
g in
iXis
t-Ch
rXDr
Tat
yana
Nes
tero
va
CS11
2_Xi
stU
p_F
AGCT
TACG
TACC
TCCA
TCTT
TAT
Forw
ard
prim
er u
pstr
eam
of e
ndog
enou
s Xi
st g
ene
MA0
65_P
cgf3
_Int
ron3
_FCCCAGATCAGTCATCACAG
Forw
ard
prim
er s
pann
ing
N-t
er P
cgf3
cut
-site
, for
FKB
P12-
PCG
F3/5
scr
eeni
ngDr
Maf
alda
Alm
eida
MA0
66_P
cgf3
_Exo
n4_R
GTGCAAACACTCAGTCACTG
Reve
rse
prim
er s
pann
ing
N-t
er P
cgf3
cut
-site
, for
FKB
P12-
PCG
F3/5
scr
eeni
ngDr
Maf
alda
Alm
eida
JB02
5_Pc
gf3_
Intr
on3_
FAT
CTG
TGG
GTG
GAG
TAAA
GG
CPr
imer
out
side
N-t
er P
cgf3
hom
olog
y re
gion
, for
FKB
P12-
PCG
F3 s
eque
ncin
gm
e
JB02
6_Pc
gf3_
Intr
on4_
RTGCAAGCACTGCAAGTACGA
Prim
er o
utsi
de N
-ter
Pcg
f3 h
omol
ogy
regi
on, f
or F
KBP1
2-PC
GF3
seq
uenc
ing
me
MA0
89_P
cgf5
_Int
ron1
_FTGTTTACAGAGAGGAAGCGCC
Prim
er o
utsi
de N
-ter
Pcg
f5 h
omol
ogy
regi
on, f
or F
KBP1
2-PC
GF5
seq
uenc
ing
Dr M
afal
da A
lmei
da
JB03
5_Pc
gf5_
Intr
on2_
RAAGGAATCAGTCAGAGGCACG
Prim
er o
utsi
de N
-ter
Pcg
f5 h
omol
ogy
regi
on, f
or F
KBP1
2-PC
GF5
seq
uenc
ing
me
Tab
le2.5
:P
rim
ers
for
PC
Rsc
reen
ing
du
rin
gcell
lin
ed
eri
vati
on
69
2.2.3 Neural progenitor cell (NPC) differentiation protocol
I used a protocol for ES to NPC differentiation adapted from (Conti et al. 2005; Splin-
ter et al. 2011) and optimised for iXist-ChrX lines by Dr Tatyana Nesterova and Dr
Mafalda Almeida. Briefly, the protocol was performed as follows: First, cells were ex-
tensively separated from feeder cells by pre-plating four times, each for 35-40 minutes.
Then, 0.5x10⁶ cells were plated to gelatin-coated T25 flasks and grown in N2B27 media
(50:50 DMEM/F-12:Neurobasal (Gibco) supplemented with 1X N2 and 1X B27 (Ther-
moFisher)) and 1µg/ml doxycycline for continuous Xist induction. On day 7, cells were
detached from the base of the flask with Accutase (Millipore), and 3x10⁶ cells were plated
to grow in suspension within 90mm bacterial petri dishes containing N2B27+Dox media
supplemented with 10ng/ml EGF and FGF (Peprotech). At day 10, embryoid-body-like
cellular aggregates were collected by mild centrifugation (100g for 2 minutes) and plated
back onto gelatine-coated 90mm dishes in N2B27+Dox+FGF/EGF media. At ∼80% con-
fluency of the outgrowing neural cells, samples were split once 1 in 3 (WT lines) or 1 in 1
(mutant lines) by Accutase treatment followed by centrifugation (437g, 5 minutes) in PBS
and re-plating in N2B27+Dox+FGF/EGF. This was in order to remove attached EB-like
aggregates and leave a homogenous NPC monolayer. NPC samples were collected when
cells next became synchronously confluent. All samples were collected (both NPCs and
earlier days of the protocol) by 5 minutes Accutase treatment to detach cells, followed by
a single PBS wash, cell counting, then centrifugation (437g for 5 minutes) to make cell
pellets. For dTAG-treated FKBP12F36V-PCGF3/5 and combined FKBP12F36V-PCGF3/5
+SPENSPOC mutants, 100nM dTAG-13 was added 12 hours prior to initial pre-plating
and maintained in the growth media throughout the protocol.
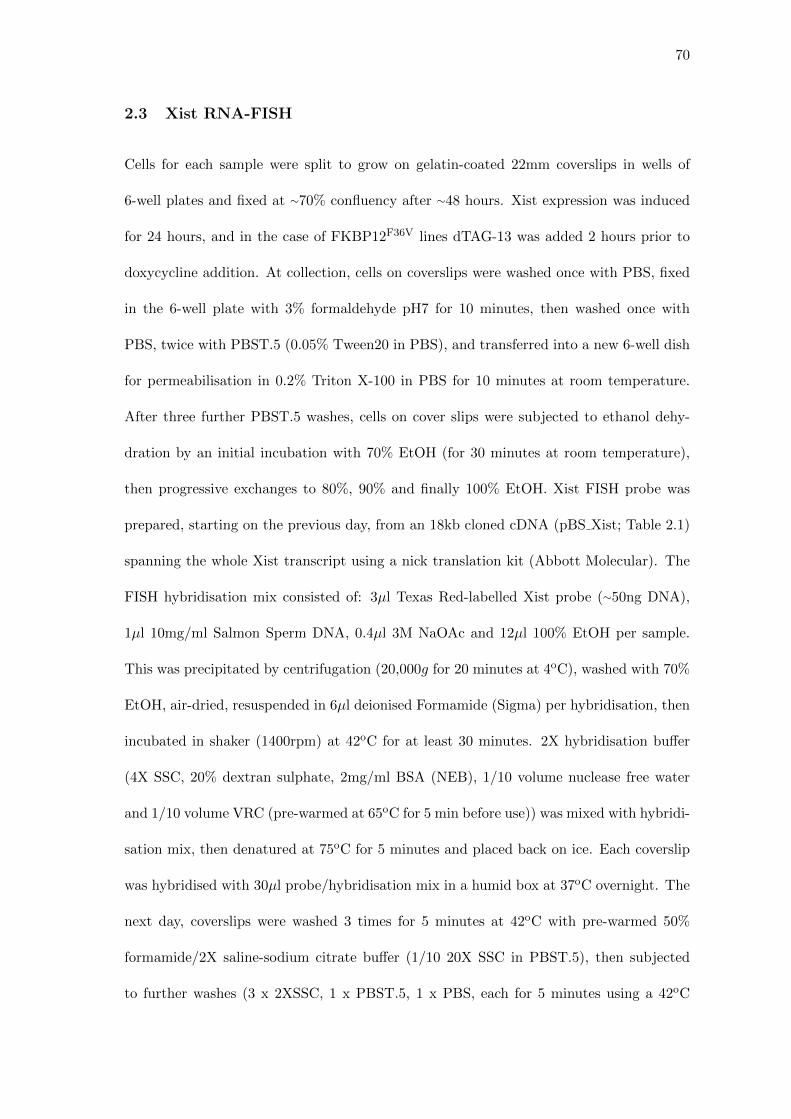
70
2.3 Xist RNA-FISH
Cells for each sample were split to grow on gelatin-coated 22mm coverslips in wells of
6-well plates and fixed at ∼70% confluency after ∼48 hours. Xist expression was induced
for 24 hours, and in the case of FKBP12F36V lines dTAG-13 was added 2 hours prior to
doxycycline addition. At collection, cells on coverslips were washed once with PBS, fixed
in the 6-well plate with 3% formaldehyde pH7 for 10 minutes, then washed once with
PBS, twice with PBST.5 (0.05% Tween20 in PBS), and transferred into a new 6-well dish
for permeabilisation in 0.2% Triton X-100 in PBS for 10 minutes at room temperature.
After three further PBST.5 washes, cells on cover slips were subjected to ethanol dehy-
dration by an initial incubation with 70% EtOH (for 30 minutes at room temperature),
then progressive exchanges to 80%, 90% and finally 100% EtOH. Xist FISH probe was
prepared, starting on the previous day, from an 18kb cloned cDNA (pBS Xist; Table 2.1)
spanning the whole Xist transcript using a nick translation kit (Abbott Molecular). The
FISH hybridisation mix consisted of: 3µl Texas Red-labelled Xist probe (∼50ng DNA),
1µl 10mg/ml Salmon Sperm DNA, 0.4µl 3M NaOAc and 12µl 100% EtOH per sample.
This was precipitated by centrifugation (20,000g for 20 minutes at 4oC), washed with 70%
EtOH, air-dried, resuspended in 6µl deionised Formamide (Sigma) per hybridisation, then
incubated in shaker (1400rpm) at 42oC for at least 30 minutes. 2X hybridisation buffer
(4X SSC, 20% dextran sulphate, 2mg/ml BSA (NEB), 1/10 volume nuclease free water
and 1/10 volume VRC (pre-warmed at 65oC for 5 min before use)) was mixed with hybridi-
sation mix, then denatured at 75oC for 5 minutes and placed back on ice. Each coverslip
was hybridised with 30µl probe/hybridisation mix in a humid box at 37oC overnight. The
next day, coverslips were washed 3 times for 5 minutes at 42oC with pre-warmed 50%
formamide/2X saline-sodium citrate buffer (1/10 20X SSC in PBST.5), then subjected
to further washes (3 x 2XSSC, 1 x PBST.5, 1 x PBS, each for 5 minutes using a 42oC
71
hot plate) before being mounted with VECTASHIELD with DAPI (Vector Labs) onto
Superfrost Plus microscopy slides (VWR). Slides were dried, sealed using clear nail polish
and cleaned prior to imaging.
I acquired 5-10 images (20-40 cells per image) with AxioVision software on an inverted fluo-
rescence Axio Observer Z.1 microscope (Zeiss) using a PlanApo ×63/1.4 NA oil-immersion
objective. I then gave the images, blinded, to Dr Emma Carter to score for the presence
or absence of a noticeable Xist RNA domain. These quantifications are provided next to
the representative images in figure panels.
2.4 Western blot on nuclear extracts
Nuclear extracts were made from cell pellets of confluent 90mm dishes (∼3x10⁷ cells).
Briefly, cell pellets were washed with PBS then resuspended in 10 volumes buffer A
(10mM HEPES-KOH pH7.9, 1.5mM MgCl2, 10mM KCl, with 0.5mM DTT, with freshly
added 0.5mM phenylmethylsulfonyl fluoride (PMSF) and complete protease inhibitors
(PIC; Roche)). After 10 minutes on ice to allow cell swelling, cells were centrifuged (1500g
for 5 minutes at 4oC) and resuspended in 3 volumes buffer A + 0.1% NP40 (Sigma).
After 10 further minutes on ice, nuclei were collected by centrifugation (400g for 5 min-
utes at 4oC) then resuspended in 1 volume buffer C (250mM NaCl, 5mM HEPES-KOH
pH7.9, 26% glycerol, 1.5mM MgCl2, 0.2mM EDTA-NaOH pH8, with fresh 0.5mM DTT
and PIC). NaCl was then added dropwise up to a concentration of 350mM, and the extract
was incubated 1 hour on ice with occasional agitation. After centrifugation (16,000g for
20 minutes at 4oC) the supernatant was taken as soluble nuclear extraction. This was
quantified by Bradford’s assay (Bio-Rad) and stored at -80oC until use.
Nuclear extracts were used for all protein gels shown in this thesis. For small proteins
(<120kDa), samples were loaded onto home-made polyacrylamide gels and transferred to
PVDF membranes using Trans-blot Turbo (Bio-Rad) “Mixed Mw” setting. For large pro-
72
teins (>200kDa) NuPAGE 3-8% BisTris (ThermoFisher) gels were used and wet transfer
to nitrocellulose membranes was performed with 1X transfer buffer (25mM Tris, 200mM
glycine, 0.1X MetOH, 0.1% SDS) at 4oC for 90 minutes at 90V. Membranes were then
blocked for 1 hour at room temperature in 10ml blocking buffer: 100mM Tris pH7.5, 0.9%
NaCl, 0.1% Tween (TBST) and 5% Marvel milk powder. Blots were incubated overnight
at 4oC with primary antibody (see Table 2.6, washed four times with blocking buffer, then
incubated on rollers at room temperature for 1 hour in secondary antibody of the rele-
vant species conjugated to horseradish peroxidase. After washing twice more in blocking
buffer, once in TBST and once in PBS (10 minutes each), membranes were developed and
visualised using Clarity Western ECL substrate (Bio-Rad).
2.5 Chromatin-associated RNA extraction and sequencing (chrRNA-
seq)
Between 3x10⁶ (NPC) and 3x10⁷ (mESC) cells were collected from confluent 90mm dishes,
washed once with PBS, then snap-frozen and stored at -80oC. Chromatin extraction was
performed as follows: Cell pellets were first resuspended in RLB (10mM Tris pH7.5,
10mM KCl, 1.5mM MgCl2, and 0.1% NP40) and incubated on ice for 5 minutes. Nuclei
were then purified by centrifugation through 24% sucrose/RLB (2800g for 10 minutes at
4oC), resuspended in NUN1 (20mM Tris pH7.5, 75mM NaCl, 0.5mM EDTA, 50% glyc-
erol, 0.1mM DTT), and then lysed by gradual addition of an equal volume NUN2 (20mM
HEPES pH 7.9, 300mM, 7.5mM MgCl2, 0.2mM EDTA, 1M Urea, 0.1mM DTT). After
15 minutes incubation on ice with occasional vortexing, the chromatin fraction was iso-
lated as the insoluble pellet after centrifugation (2800g for 10 min at 4oC). Chromatin
pellets were resuspended in 1ml TRIzol (Invitrogen) and fully homogenenised/solubilised
by eventually being passed through a 23-gauge needle 10 times. This was followed by iso-
lation of chromatin-associated RNA through standard TRIzol/chloroform extraction with
73
isopropanol precipitation and washing of RNA pellets with 70% EtOH. Final chrRNA
samples were then resuspended in H2O, treated with TurboDNAse and measured by Nan-
oDrop (both ThermoFisher). 500ng–1µg of RNA was used for library preparation using
the Illumina TruSeq stranded total RNA kit (RS-122-2301).
2.6 Assay for transpose-accessible chromatin with sequencing (ATAC-
seq)
Chromatin accessibility was assayed using a ATAC-seq protocol adapted from (Buenrostro
et al. 2013; King and Klose 2017; Corces et al. 2017). Briefly, 1-5x10⁶ cells were harvested
as pellets, washed with PBS, and nuclei were isolated by incubation for 1 minute at room
temperature in 600µl HS Lysis buffer (50mM KCl, 10mM MgSO4.7H20, 5mM HEPES,
0.05% NP40 (IGEPAL CA630), 1mM PMSF, 3mM DTT). Nuclei were then centrifuged
at 1200g for 5 minutes at 4oC, followed by three washes with ice-cold RSB buffer (10mM
NaCl, 10mM Tris pH7.4, 3mM MgCl2). After nuclei counting, 5x10⁵ were centrifuged
(1500g for 5min at 4oC) and resuspended in 50µl H2O. 5x10⁴ nuclei (5µl) were taken
for each transposition assay, performed in technical duplicate for each sample in a 50µl
transposition mix of: 1X Tn5 reaction buffer (10mM TAPS, 5mM MgCl2, 10% dimethyl-
formamide), 0.1% Tween-20 (Sigma), 0.01% Digitonin (Promega), Tagment DNA TDE1
enzyme (Illumina), 16.5µl PBS and 5µl H2O. As a control for transposition and map-
ping bias, a tn5-digested ‘input’ control was made by performing tagmentation for 50ng
iXist-ChrX genomic DNA by a basic 50µl transposition mix of 1X TDE buffer and 2.5µl
TDE1 Enzyme (Illumina) in H2O. Both sample and input mixes were incubated at 37oC
for 35 minutes in a thermomixer at 1000rpm, then cleaned-up with ChIP DNA Clean and
Concentrator kit (Zymo) and eluted in 14µl elution buffer for storage at -20oC. ATAC-
seq libraries were prepared by ∼8 cycles of PCR using custom Illumina barcode primers
described in (Buenrostro et al. 2013) and with NEBNext High Fidelity 2X PCR Master
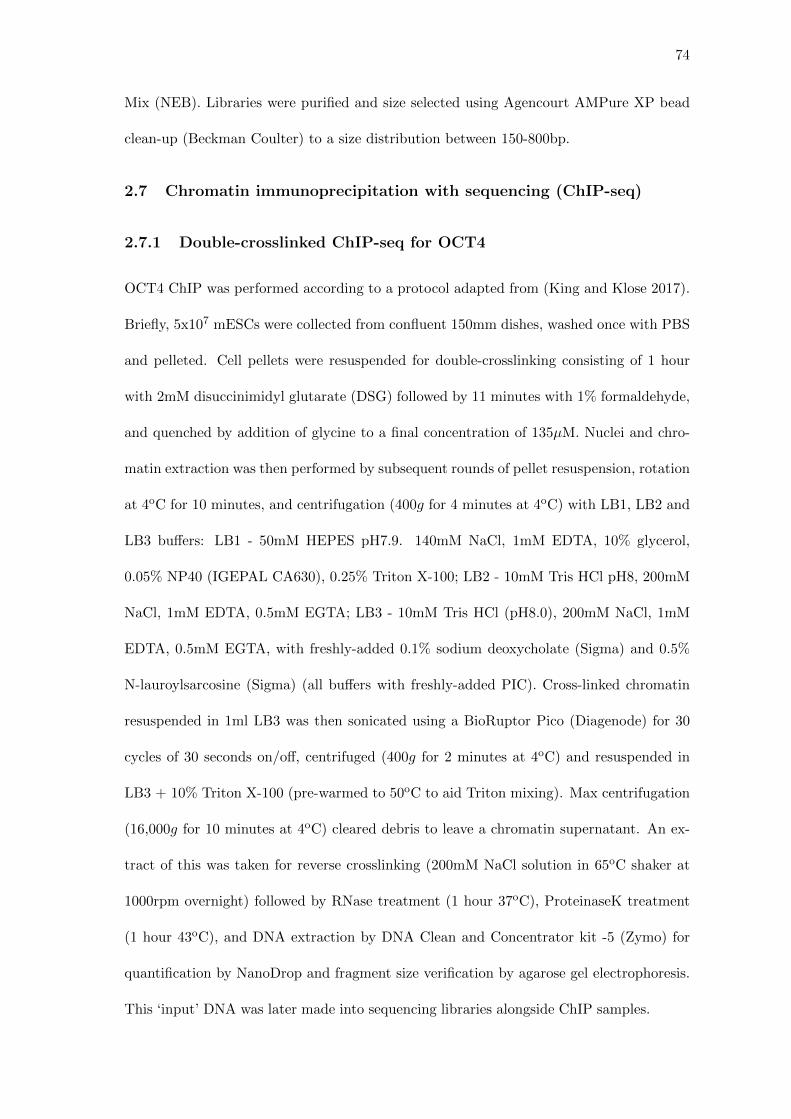
74
Mix (NEB). Libraries were purified and size selected using Agencourt AMPure XP bead
clean-up (Beckman Coulter) to a size distribution between 150-800bp.
2.7 Chromatin immunoprecipitation with sequencing (ChIP-seq)
2.7.1 Double-crosslinked ChIP-seq for OCT4
OCT4 ChIP was performed according to a protocol adapted from (King and Klose 2017).
Briefly, 5x10⁷ mESCs were collected from confluent 150mm dishes, washed once with PBS
and pelleted. Cell pellets were resuspended for double-crosslinking consisting of 1 hour
with 2mM disuccinimidyl glutarate (DSG) followed by 11 minutes with 1% formaldehyde,
and quenched by addition of glycine to a final concentration of 135µM. Nuclei and chro-
matin extraction was then performed by subsequent rounds of pellet resuspension, rotation
at 4oC for 10 minutes, and centrifugation (400g for 4 minutes at 4oC) with LB1, LB2 and
LB3 buffers: LB1 - 50mM HEPES pH7.9. 140mM NaCl, 1mM EDTA, 10% glycerol,
0.05% NP40 (IGEPAL CA630), 0.25% Triton X-100; LB2 - 10mM Tris HCl pH8, 200mM
NaCl, 1mM EDTA, 0.5mM EGTA; LB3 - 10mM Tris HCl (pH8.0), 200mM NaCl, 1mM
EDTA, 0.5mM EGTA, with freshly-added 0.1% sodium deoxycholate (Sigma) and 0.5%
N-lauroylsarcosine (Sigma) (all buffers with freshly-added PIC). Cross-linked chromatin
resuspended in 1ml LB3 was then sonicated using a BioRuptor Pico (Diagenode) for 30
cycles of 30 seconds on/off, centrifuged (400g for 2 minutes at 4oC) and resuspended in
LB3 + 10% Triton X-100 (pre-warmed to 50oC to aid Triton mixing). Max centrifugation
(16,000g for 10 minutes at 4oC) cleared debris to leave a chromatin supernatant. An ex-
tract of this was taken for reverse crosslinking (200mM NaCl solution in 65oC shaker at
1000rpm overnight) followed by RNase treatment (1 hour 37oC), ProteinaseK treatment
(1 hour 43oC), and DNA extraction by DNA Clean and Concentrator kit -5 (Zymo) for
quantification by NanoDrop and fragment size verification by agarose gel electrophoresis.
This ‘input’ DNA was later made into sequencing libraries alongside ChIP samples.
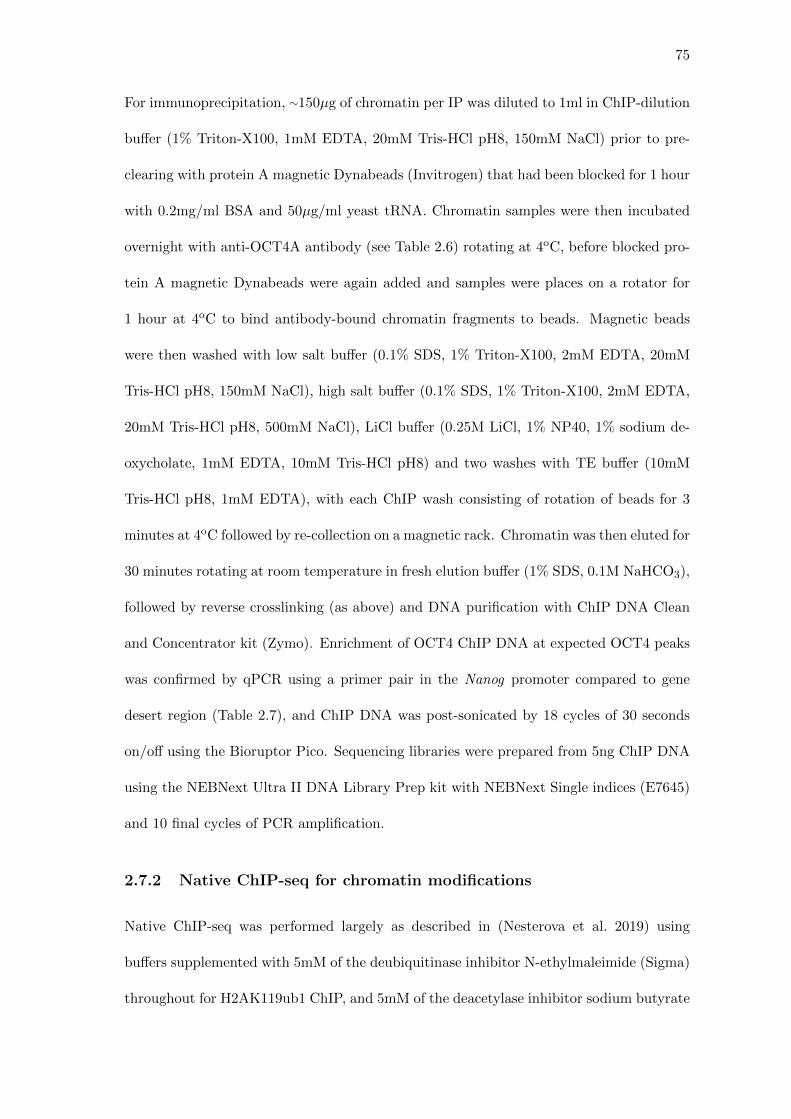
75
For immunoprecipitation, ∼150µg of chromatin per IP was diluted to 1ml in ChIP-dilution
buffer (1% Triton-X100, 1mM EDTA, 20mM Tris-HCl pH8, 150mM NaCl) prior to pre-
clearing with protein A magnetic Dynabeads (Invitrogen) that had been blocked for 1 hour
with 0.2mg/ml BSA and 50µg/ml yeast tRNA. Chromatin samples were then incubated
overnight with anti-OCT4A antibody (see Table 2.6) rotating at 4oC, before blocked pro-
tein A magnetic Dynabeads were again added and samples were places on a rotator for
1 hour at 4oC to bind antibody-bound chromatin fragments to beads. Magnetic beads
were then washed with low salt buffer (0.1% SDS, 1% Triton-X100, 2mM EDTA, 20mM
Tris-HCl pH8, 150mM NaCl), high salt buffer (0.1% SDS, 1% Triton-X100, 2mM EDTA,
20mM Tris-HCl pH8, 500mM NaCl), LiCl buffer (0.25M LiCl, 1% NP40, 1% sodium de-
oxycholate, 1mM EDTA, 10mM Tris-HCl pH8) and two washes with TE buffer (10mM
Tris-HCl pH8, 1mM EDTA), with each ChIP wash consisting of rotation of beads for 3
minutes at 4oC followed by re-collection on a magnetic rack. Chromatin was then eluted for
30 minutes rotating at room temperature in fresh elution buffer (1% SDS, 0.1M NaHCO3),
followed by reverse crosslinking (as above) and DNA purification with ChIP DNA Clean
and Concentrator kit (Zymo). Enrichment of OCT4 ChIP DNA at expected OCT4 peaks
was confirmed by qPCR using a primer pair in the Nanog promoter compared to gene
desert region (Table 2.7), and ChIP DNA was post-sonicated by 18 cycles of 30 seconds
on/off using the Bioruptor Pico. Sequencing libraries were prepared from 5ng ChIP DNA
using the NEBNext Ultra II DNA Library Prep kit with NEBNext Single indices (E7645)
and 10 final cycles of PCR amplification.
2.7.2 Native ChIP-seq for chromatin modifications
Native ChIP-seq was performed largely as described in (Nesterova et al. 2019) using
buffers supplemented with 5mM of the deubiquitinase inhibitor N-ethylmaleimide (Sigma)
throughout for H2AK119ub1 ChIP, and 5mM of the deacetylase inhibitor sodium butyrate
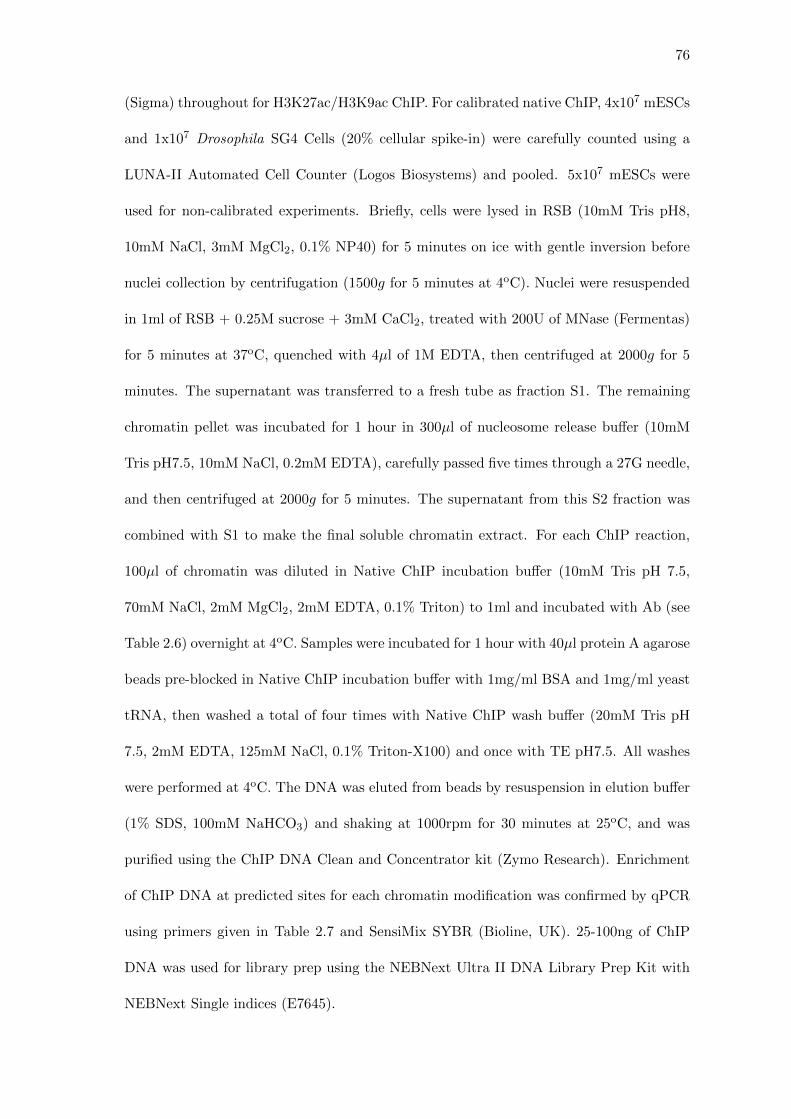
76
(Sigma) throughout for H3K27ac/H3K9ac ChIP. For calibrated native ChIP, 4x10⁷ mESCs
and 1x10⁷ Drosophila SG4 Cells (20% cellular spike-in) were carefully counted using a
LUNA-II Automated Cell Counter (Logos Biosystems) and pooled. 5x10⁷ mESCs were
used for non-calibrated experiments. Briefly, cells were lysed in RSB (10mM Tris pH8,
10mM NaCl, 3mM MgCl2, 0.1% NP40) for 5 minutes on ice with gentle inversion before
nuclei collection by centrifugation (1500g for 5 minutes at 4oC). Nuclei were resuspended
in 1ml of RSB + 0.25M sucrose + 3mM CaCl2, treated with 200U of MNase (Fermentas)
for 5 minutes at 37oC, quenched with 4µl of 1M EDTA, then centrifuged at 2000g for 5
minutes. The supernatant was transferred to a fresh tube as fraction S1. The remaining
chromatin pellet was incubated for 1 hour in 300µl of nucleosome release buffer (10mM
Tris pH7.5, 10mM NaCl, 0.2mM EDTA), carefully passed five times through a 27G needle,
and then centrifuged at 2000g for 5 minutes. The supernatant from this S2 fraction was
combined with S1 to make the final soluble chromatin extract. For each ChIP reaction,
100µl of chromatin was diluted in Native ChIP incubation buffer (10mM Tris pH 7.5,
70mM NaCl, 2mM MgCl2, 2mM EDTA, 0.1% Triton) to 1ml and incubated with Ab (see
Table 2.6) overnight at 4oC. Samples were incubated for 1 hour with 40µl protein A agarose
beads pre-blocked in Native ChIP incubation buffer with 1mg/ml BSA and 1mg/ml yeast
tRNA, then washed a total of four times with Native ChIP wash buffer (20mM Tris pH
7.5, 2mM EDTA, 125mM NaCl, 0.1% Triton-X100) and once with TE pH7.5. All washes
were performed at 4oC. The DNA was eluted from beads by resuspension in elution buffer
(1% SDS, 100mM NaHCO3) and shaking at 1000rpm for 30 minutes at 25oC, and was
purified using the ChIP DNA Clean and Concentrator kit (Zymo Research). Enrichment
of ChIP DNA at predicted sites for each chromatin modification was confirmed by qPCR
using primers given in Table 2.7 and SensiMix SYBR (Bioline, UK). 25-100ng of ChIP
DNA was used for library prep using the NEBNext Ultra II DNA Library Prep Kit with
NEBNext Single indices (E7645).
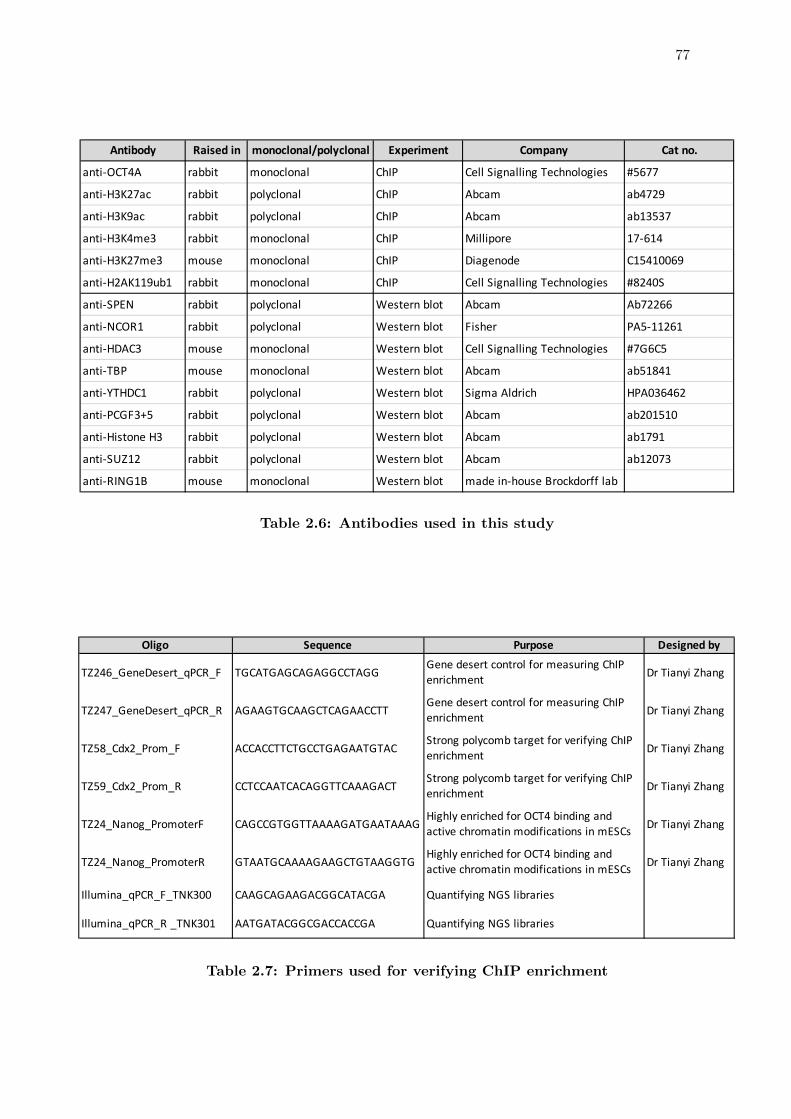
77
Antibody Raised in monoclonal/polyclonal Experiment Company Cat no.
anti-OCT4A rabbit monoclonal ChIP Cell Signalling Technologies #5677
anti-H3K27ac rabbit polyclonal ChIP Abcam ab4729
anti-H3K9ac rabbit polyclonal ChIP Abcam ab13537
anti-H3K4me3 rabbit monoclonal ChIP Millipore 17-614
anti-H3K27me3 mouse monoclonal ChIP Diagenode C15410069
anti-H2AK119ub1 rabbit monoclonal ChIP Cell Signalling Technologies #8240S
anti-SPEN rabbit polyclonal Western blot Abcam Ab72266
anti-NCOR1 rabbit polyclonal Western blot Fisher PA5-11261
anti-HDAC3 mouse monoclonal Western blot Cell Signalling Technologies #7G6C5
anti-TBP mouse monoclonal Western blot Abcam ab51841
anti-YTHDC1 rabbit polyclonal Western blot Sigma Aldrich HPA036462
anti-PCGF3+5 rabbit polyclonal Western blot Abcam ab201510
anti-Histone H3 rabbit polyclonal Western blot Abcam ab1791
anti-SUZ12 rabbit polyclonal Western blot Abcam ab12073
anti-RING1B mouse monoclonal Western blot made in-house Brockdorff lab
Table 2.6: Antibodies used in this study
Oligo Sequence Purpose Designed by
TZ246_GeneDesert_qPCR_F TGCATGAGCAGAGGCCTAGGGene desert control for measuring ChIP enrichment Dr Tianyi Zhang
TZ247_GeneDesert_qPCR_R AGAAGTGCAAGCTCAGAACCTTGene desert control for measuring ChIP enrichment Dr Tianyi Zhang
TZ58_Cdx2_Prom_F ACCACCTTCTGCCTGAGAATGTACStrong polycomb target for verifying ChIP enrichment Dr Tianyi Zhang
TZ59_Cdx2_Prom_R CCTCCAATCACAGGTTCAAAGACT Strong polycomb target for verifying ChIP enrichment Dr Tianyi Zhang
TZ24_Nanog_PromoterF CAGCCGTGGTTAAAAGATGAATAAAGHighly enriched for OCT4 binding and active chromatin modifications in mESCs Dr Tianyi Zhang
TZ24_Nanog_PromoterR GTAATGCAAAAGAAGCTGTAAGGTGHighly enriched for OCT4 binding and active chromatin modifications in mESCs Dr Tianyi Zhang
Illumina_qPCR_F_TNK300 CAAGCAGAAGACGGCATACGA Quantifying NGS libraries
Illumina_qPCR_R _TNK301 AATGATACGGCGACCACCGA Quantifying NGS libraries
Table 2.7: Primers used for verifying ChIP enrichment
78
2.8 NGS library verification, quantification and sequencing
NGS DNA libraries of chrRNA-seq, ATAC-seq, and ChIP-seq samples were loaded on
a Bioanalyzer 2100 (Agilent) with High Sensitivity DNA chips to verify fragment size
distribution between ∼200-800bp. Additional rounds of clean-up and/or size selection
were performed if necessary using Agencourt AMPure XP beads (Beckman Coulter) to
remove residual adaptors or large (>1000bp) fragments. Sample libraries were quantified
using a Qubit fluorometer (Invitrogen) and, optionally, by qPCR with KAPA Library
Quantification DNA standards (Roche) and SensiMix SYBR (Bioline) before being pooled
together. After pooling, final libraries were quantified by qPCR relative to previously-
sequenced NGS libraries using the Illumina qPCR primers (see Table 2.7) and 2x81 paired-
end sequencing was performed using an Illumina NextSeq500 (FC-404-2002) managed by
Amanda Williams at the Zoology NGS facility.
2.9 Single cell sorting for Smart-seq2 scRNA-seq
iXist-ChrX cells were plated for the NPC differentiation protocol on 90mm dishes (two
per sample) at 1 and 3 days prior to cell sorting. On the day of the sort, these samples
were collected along with pre-plated uninduced mESCs by accutase treatment and two
PBS washes, then passed through a 40µm strainer (Falcon) and left on ice as 500µl of
cells in suspension. 1µg/µl DAPI was added prior to sorting of alive cells into single
wells of semi-skirted 96-well plates (ThermoFisher) using a BD Aria III machine (Becton
Dickinson) operated by Paul Sopp at the WIMM Flow Cytometry Facility. Sorting was
performed according to the schematic in Figure 4.8 with 10- and 0-cell controls included
for the first and last wells of each sorted sample respectively (i.e. A1 and A7 = 10 cells,
H6 and H12 = cells). Plates were snap-frozen and stored at -80oC. Whereas day 0, 1, and
3 samples were prepared directly from the same parental cells and sorted together on the
79
same day, the NPC plates were sorted on a separate occasion some weeks later.
An improved version of the Smart-seq2 protocol (Picelli et al. 2014) using robot automation
was performed by Dr Neil Ashley and technicians at the WIMM Single Cell Facility.
Notably, after initial Smart-Seq2 reactions, four 96-well plates were interwoven into 384-
well plates for Nextera XT Library prep and Dual Indexing (Illumina) of scRNA libraries.
Next-generation sequencing was performed as two runs with 75bp single-end reads using
an Illumina NextSeq500 at the WIMM Sequencing Facility.
2.10 Data analysis software and packages
The following software were used routinely for NGS analysis from the UNIX command
line:
• samtools (Li et al. 2009)
• bedtools (v2.30.0) (Quinlan and Hall 2010)
• deeptools (v3.5.0) (Ramırez et al. 2014)
• R; Bioconductor (Gentleman et al. 2004; Huber et al. 2015)
• python3 scripts by Dr Guifeng Wei (https://github.com/guifengwei)
• Integrative Genome Browser (IGV) (Robinson et al. 2011)
Other packages used for specific purposes are referenced where relevant. Plots were gen-
erated almost entirely using ggplot2 and associated packages in R, and all statistical tests
used are reported in figure legends.

80
2.11 RNA-seq data analysis
2.11.1 Mapping of paired-end fastq files
The standard chrRNA-seq data mapping pipeline is reported in (Nesterova et al. 2019).
Briefly, raw fastq files of read pairs were first mapped to rRNA by bowtie2 (v2.3.2; Lang-
mead and Salzberg 2012) and rRNA-mapping reads discarded (typically <2%). The re-
maining unmapped reads were aligned to an N-masked mm10 genome with STAR (v2.4.2a;
Dobin et al. 2013) using parameters: “-outFilterMultimapNmax 1 -outFilterMismatchNmax
4 -alignEndsType EndToEnd”. Aligned reads were assigned to separate files for either the
CAST or 129S genomes by SNPsplit (v0.2.0; Krueger and Andrews 2016) using the “-
paired” parameter and a SNPfile containing the 23,005,850 SNPs between CAST and
129S genomes (UCSC). Read fragments overlapping genes, for both the ‘unsplit’ and ‘al-
lelic’ files of each sample, were counted by the program featureCounts (Liao et al. 2014)
using an annotation file of all transcripts and lncRNAs from RefSeq (NCBI; Pruitt et al.
2005) and the parameters “-t transcript -g gene id -s 2”. Alignment (bam) files were
then sorted and indexed by samtools. BigWig files of pileup tracks were generating us-
ing bamCoverage from the deeptools suite using a normalisation scale factor calculated
from the total library size. Files were visualised using the Integrative Genome Browser
(IGV).
2.11.2 Allelic analysis of chrRNA-seq data
Further allelic analysis of each chrRNA-seq data set was performed using R and RStudio
on the count matrix output files from featureCounts. X-linked genes with at least 10
allelically-assigned fragments (i.e. containing reads that overlap SNPs) in >80% of sam-
ples were retained for gene silencing analysis. Gene silencing was assessed by calculating
the allelic ratio of read counts, given by Xi/(Xi + Xa) where Xi and Xa indicate frag-
81
ments mapping to M. Musculus Domesticus (129/SvlmJ) and M. Musculus Castaneous
(CAST/EiJ) alleles respectively in iXist-ChrX. An additional filter on the allelic ratio in
uninduced mESCs (0.15 < allelic ratio < 0.85) was also applied, as strongly monoallelic
genes are likely to be technical artifacts of singular mis-annotated SNPs. Allelic ratio
(AR) values were used to generate plots in R and for downstream analysis, such as for
calculating the silencing ‘defect’ in a particular mutant line, given by:
(ARDox/ARNoDox)mutant − (ARDox/ARNoDox)WT
(Here, mutant and WT could alternatively represent dTAG-treated and untreated samples
of the FKBP12F36V fusion lines.)
Kinetic modelling of gene silencing dynamics
For the WT iXist-ChrX time course data presented in Chapter 5, exponential model
curve fitting was performed using the “nlsLM” function from the “minpack.lm” R pack-
age (Elzhov et al. 2016) to a model of the form y = yf + y0e−tk, with yf = 0 fixed for
non-escapee genes that silence to completion. Fitting was done first to the entire data set
in order generate initial parameter estimates. These were then used as inputs for linear re-
gression to fit the model to the silencing trajectory of each gene individually. Model fitting
was possible for all 256 allelic chrX genes analysed, with minor customisation necessary
for Mbnl and Stk26 (aka 2610018G03Rik)1. Silencing halftimes were calculated by the
formula: t1/2 = − 1k ln(
F (y0+yf )−yfy0
) where k, y0 and yf are parameters of the exponential
model and F=0.5 (to calculate half of y0). Halftimes were produced for 254/2562 genes
and used to categorise genes as fast (t1/2 < 60h), medium (60h < t1/2 < 120h) or slow
(t1/2 > 120h) silencing.
1Mbnl3 is strongly upregulated in early stages of NPC differentiation, so its allelic ratio is much lowerin 24 hour mESCs than in later NPC time course samples. 2610018G03Rik is strongly upregulated fromXi only in NPCs. These two abnormal time points were removed from modelling. Interestingly, both thesegenes are within 500kb of the Firre locus, which could influence NPC-specific derepression.
2Slc25a5 is a particularly strong escapee whose allelic ratio does not fall below ∼0.5 (Figure 4.2 G).Likewise, the allelic ratio of Dynlt3 remains skewed >0.7 throughout the time course.
82
2.11.3 RPM/TPM comparisons and subcategorisation of genes
For instances where genes are directly categorised or compared by their ‘Initial Expression
Level’, this was done using iXist-ChrX mRNA-seq data (two replicates averaged together)
collected by Dr Tatyana Nesterova. This data set, which contained very few intronic reads,
facilitated the calculation of a ‘Transcripts per kilobase Million’ (TPM) value for each gene
in the counts matrix, a transformation which allows for between-gene and between-sample
comparison of expression levels (Conesa et al. 2016). X-linked genes were categorised as
low, medium or high expressed based on TPM thresholds of 10 and 100 (see Figure 4.4 D).
For instances where the relative expression of the same gene (or in the case of Xist, the
number of chromatin-associated transcripts) was compared across chrRNA-seq samples, a
simpler RPM (aka CPM; Reads/Counts per Million) transformation of the counts matrix
was used3. Genes were also classified by the distance of their TSS to the Xist locus
by thresholds of 15Mb and 75Mb shown in Figure 4.4 E. Subsets of genes by SMCHD1-
dependence in MEFs were downloaded from (Gdula et al. 2019). Genes were defined as
’SPOC-dependent’ if the allelic ratio in day 6 SPENSPOCmut samples was >75% of the
allelic ratio in uninduced samples.
An annotated table classifying all genes on chrX1 analysed in this study is provided in
Appendix Table A1.
2.11.4 Relaxation of mismatch mapping parameters to verify targeted
point mutations
For verification of engineered point mutants in SPENSPOCmut, NCORmut and SMRTmut
lines from chrRNA-seq data, the “-outFilterMismatchNmax” parameter of STAR align-
ment was relaxed to allow up to 10 mismatches per read. Reads mapping specifically to
3With between-sample RPM comparisons there is the minor caveat that values are not independentfrom genome-wide changes to transcript abundance, and there is potentially reduced transcription globallyin NPCs compared to mESCs (Efroni et al. 2008).
83
the targeted genes were then separated, sorted and indexed by samtools, and visualised
with IGV as standard.
2.11.5 Approximate karyotyping using chrRNA-seq data sets
Using the allelic alignment files (i.e. separate CAST and 129S bam files) of each sample,
the numbers of reads mapping to each chromosome were counted using samtools. When
the percentages of allelic reads mapping to each chromosome are overlaid as bar plots, the
relative heights of bars indicates if any chromosomal duplication or replacement events
have occurred in that cell line. ’Karyotype’ plots for all cell lines discussed in this work
are provided in Appendix Figures A1, A2, A3. y axes are the percentages of allelic
reads mapping to that chromosome. Bars for chromosome 1 are truncated, whereas for
chromosome X, only reads mapping to chrX1 are shown.
2.12 Single cell RNA-seq (Smart-Seq2) data analysis
The pipeline used for mapping of single-end scRNA-seq libraries was much the same as
for chrRNA, with rRNA removal, STAR mapping, read filtering, and allelic assignment
by SNPsplit was performed as above. Separate gene count matrices were then generated
for unsplit, 129S and CAST alleles using “featureCounts”.
Downstream analysis of single-cell count matrices was performed using the “SingleCell-
Experiment” data structure of the R “Bioconductor” and “scran” packages (Lun et al.
2016), with the online instruction book an invaluable reference (Amezquita et al. 2020).
Quality control was performed according to the key metrics of scRNA-seq libraries, which
are presented in Figure 4.8 B. As it has been shown that distinct cellular subpopulations
can be reliably identified at a sequencing depth of 50,000 reads per cell (Streets and Huang
2014), this was used alongside 5,000 detectable (RPKM>1) genes per cell as thresholds
above which cells were retained for downstream analysis. Batch correction between plates
84
was performed for each sample time point by the mutual nearest neighbours correction
method using the “mnnCorrect” function from the “batchelor” R package (Haghverdi et al.
2018). Dimensionality reduction was performed on the top 500 variable genes (generated
by the “getTopHVGs” function) by various methods, with plots from principle compo-
nent analysis (PCA) and t-distributed stochastic neighbour embedding (tSNE) (Van Der
Maaten and Hinton 2008) shown in Figure 4.9 B. The vector tracing the trajectory of NPC
differentiation in the PCA plot was generated by the “slingshot” package (Street et al.
2018).
Further allelic analysis was performed similarly to bulk chrRNA-seq data but with more
relaxed filters. X-linked genes were retained if at least one allelic read was present in
most cells (median > 1) and if the gene demonstrated biallelic expression in mESCs (0.15
< mean allelic ratio < 0.85). A small number of ‘non-allelic’ cells (<2 allelic reads per
gene) were also discarded. This produced 520 ‘allelic’ scRNA libraries (out of a theoretical
total of 736 sorted single cells), and 54 and 96 genes amenable to allelic analysis in iXist-
ChrXDom and iXist-ChrXCast respectively (Figure 4.10 D). Allelic ratios for each gene in
each cell were calculated and are presented as either 129/(CAST + 129), which skews
the two reciprocal iXist-ChrX cell lines in opposite directions upon gene silencing, or
transformed to Xi/(Xi + Xa). All cells for each sample were averaged together (mean
values of genes) for ’pseudo-bulked’ analysis in Figure 4.10 D, whereas Figure 4.11 A shows
the average allelic ratio of each cell (mean of all genes per cell). The “ggcells” function
of the “scater” package was used to generate plots with individual cells as data points
(McCarthy et al. 2017).
Systematic correlation analysis between allelic ratios and expression of individual genes
was performed using the “correlatePairs” function of the “scran” package on the day 3
scRNA-seq libraries. Full lists of candidate genes significantly positively and negatively
85
correlating with allelic ratio in single cells are provided in Appendix Table A2 and A3.
Gene Ontology (GO) term annotations were downloaded from the Gene Ontology resource
(Carbon et al. 2021).
2.13 ATAC-seq and ChIP-seq data analysis
2.13.1 Mapping of paired-end fastq files
The fastq files of DNA fragment libraries from ATAC-seq and ChIP-seq were mapped
to the N-masked mm10 genome using bowtie2 (v2.3.2) (Langmead and Salzberg 2012)
with parameters “–very-sensitive –no-discordant –no-mixed -X 2000” and unmapped read
pairs were removed. Alignment files were then sorted by samtools and PCR duplicates
were marked and discarded by the picard-tools ”MarkDuplicates” programme (http://
broadinstitute.github.io/picard/index.html). As for chrRNA-seq, SNPsplit was
used for allelic assignment. Alignment (bam) files were sorted and indexed by samtools.
BigWig files of pileup tracks were generated by bamCoverage from deeptools using a
normalisation scale factor of calculated library size and visualised with IGV.
2.13.2 ATAC-seq data quality assessment
The gold-standard Transcription Start Site Enrichment (TSSE) score (https://www.
encodeproject.org/data-standards/terms/#enrichment) was used to assess quality
of ATAC-seq data sets. TSSE scores for each sample were calculated using the “Biocon-
ductor” “ATACseqQC” package (https://rdrr.io/bioc/ATACseqQC/) embedded within
a custom R script and are given in Table 2.8.
2.13.3 Calibration of ChIP-seq with Drosophila spike-in
For ChIP-seq experiments quantitatively calibrated with Drosophila SG4 cells, raw fastq
reads were mapped with bowtie2 (same parameters as above) to the mm10 genome con-
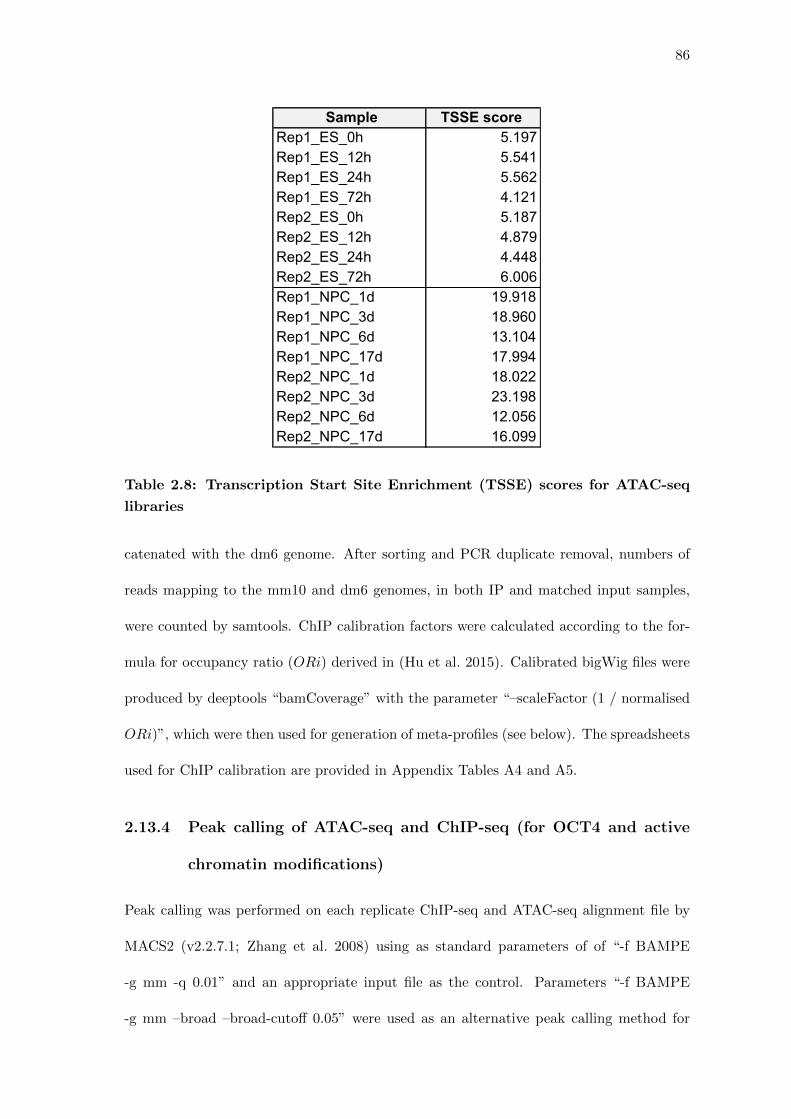
86
Sample TSSE scoreRep1_ES_0h 5.197Rep1_ES_12h 5.541Rep1_ES_24h 5.562Rep1_ES_72h 4.121Rep2_ES_0h 5.187Rep2_ES_12h 4.879Rep2_ES_24h 4.448Rep2_ES_72h 6.006Rep1_NPC_1d 19.918Rep1_NPC_3d 18.960Rep1_NPC_6d 13.104Rep1_NPC_17d 17.994Rep2_NPC_1d 18.022Rep2_NPC_3d 23.198Rep2_NPC_6d 12.056Rep2_NPC_17d 16.099
Table 2.8: Transcription Start Site Enrichment (TSSE) scores for ATAC-seq
libraries
catenated with the dm6 genome. After sorting and PCR duplicate removal, numbers of
reads mapping to the mm10 and dm6 genomes, in both IP and matched input samples,
were counted by samtools. ChIP calibration factors were calculated according to the for-
mula for occupancy ratio (ORi) derived in (Hu et al. 2015). Calibrated bigWig files were
produced by deeptools “bamCoverage” with the parameter “–scaleFactor (1 / normalised
ORi)”, which were then used for generation of meta-profiles (see below). The spreadsheets
used for ChIP calibration are provided in Appendix Tables A4 and A5.
2.13.4 Peak calling of ATAC-seq and ChIP-seq (for OCT4 and active
chromatin modifications)
Peak calling was performed on each replicate ChIP-seq and ATAC-seq alignment file by
MACS2 (v2.2.7.1; Zhang et al. 2008) using as standard parameters of of “-f BAMPE
-g mm -q 0.01” and an appropriate input file as the control. Parameters “-f BAMPE
-g mm –broad –broad-cutoff 0.05” were used as an alternative peak calling method for
87
H3K27ac peaks (referred to in 3.7 and presented in 5.9). A custom R script using the
“GenomicRanges” R package (Lawrence et al. 2013) was used to mark ‘consensus’ peaks as
regions covered by peaks in at least 1 (for four-sample chromatin ChIP-seq time courses)
or 2 (for experiments with 8+ samples) replicates. This script also filtered consensus peaks
by lower and upper thresholds of 50bp and 10,000bp respectively. Peaks were also called
on input files using the same methodology, and these were subtracted from consensus peak
sets as they are likely to be mapping artifacts (see Figure 3.3 A). Bedtools “intersect” was
used for classification of consensus peaks by genomic location. Peaks were assigned as
‘promoters’ if they overlapped within 500bp of an NCBI RefSeq gene TSS, ‘intragenic’ if
they fell within the genomic coordinates bounding an annotated RefSeq transcript, and
otherwise ‘intergenic’. Counting of intersections between individual replicate peaks (e.g. in
Figure 3.3 B), and annotation of consensus peaks according to overlaps with other data sets
(e.g. between OCT4 ChIP-seq and ATAC-seq), was performed using bedtools “intersect”
and “multiIntersectBed’ commands and visualised with the “UpSetR” R package (Conway
et al. 2017). Peaks were assigned to their closest gene TSS by bedtools “closest”.
2.13.5 Allelic analysis of ATAC-seq and ChIP-seq (for OCT4 and active
chromatin modifications)
Consensus sets of labelled peaks called for each experiment were parsed into peak annota-
tion (gtf) files by “awk” commands. Sequencing fragments overlapping peaks in both total
and allele-specific alignment files were counted using featureCounts (Liao et al. 2014), with
parameters of “-p -fracOverlap 0.001”. These counts matrices were loaded into RStudio
for further analysis using a pipeline similar to allelic analysis of chrRNA-seq. Only peaks
containing at least 10 allelically-assigned fragments in >80% of samples and showing bial-
lelic signal in uninduced mESCs (0.15 < allelic ratio < 0.85) were retained. Allelic ratios
(Xi/(Xi+Xa)) were then calculated for plots and further analysis.
88
2.13.6 Kinetic modelling of dynamic CRE accessibility loss
Trajectories of decreasing allelic CRE accessibility in the ATAC-seq time course were fitted
to curves of an exponential model using the same methodology as for chrRNA-seq data,
with the exception that y0 was not fixed at 0 for any peaks. Some CREs demonstrate
behaviours other than a progressive decrease upon Xist induction (e.g. CTCF sites at the
Firre locus that increase in AR upon XCI) and thus could not be fitted with an exponential
curve and a halftime value. Overall, halftimes were calculated for 612/793 allelic ATAC
peaks and were used to categorise CREs as having either fast (t1/2 < 60h), medium (60h
< t1/2 < 120h) or slow (t1/2 > 120) dynamics of accessibility loss. Persistent CREs were
defined independently by an allelic ratio above 0.25 in at least one of the NPC ATAC-seq
replicates and account for 140/181 of peaks that could not be assigned a halftime.
2.13.7 Motif enrichment analysis
Motif analysis was performed by the HOMER software (Heinz et al. 2010) using the com-
mand “findMotifsGenome.pl”. This was performed for the genome-wide set of all 18,127
OCT4 ChIP-seq peaks with the parameters “-size given -mask -len 8,10,12,15”, thus search-
ing for sequence enrichment compared to size-matched randomly generated background
regions. The most significantly enriched motif from the ‘De Novo Motif Finding’ output is
shown in Figure 3.5 B. For analysis presented in 4.6, ‘slow’ and ‘persistent’ CRE categories
were aggregated (n=421) and compared to ‘medium’ and ‘fast’ groups (n=328) and results
of the ‘known motif enrichment’ output are shown in Figure 4.7 A.
2.13.8 Modelling the effect of binomial sampling noise on allelic ratio
calculations
The same methodology was applied to both chrRNA-seq and ATAC-seq data. Briefly,
from the ‘real’ libraries counts matrices were produced of allelic-mapping reads (Xi+Xa)
89
mapping to each feature (gene or peak). These counts were then assigned to either Xi or
Xa in a ‘fake’ data set by binomial sampling using the overall average allelic ratio of that
sample. For example, a region with 20 allelic reads in a sample with an average allelic
ratio of 0.3, ∼6 reads might be expected to be assigned to Xi and ∼14 to Xa, although this
would vary in sampling simulations. ‘Fake’ data sets from modelling were then processed
according to the standard pipeline of allelic filtering, allelic ratio calculation and averaging
over replicates, to produce density plots of modelled allelic ratio values which could be
compared to the ‘real’ original data.
2.14 Analysis of Polycomb ChIP-seq data
Total and allele-specific alignment (bam) ChIP and input files were processed into bed-
Graph format by bedtools “genomeCoverageBed” and normalised to the total library size
of the sample. The custom Python script ExtractInfoFrombedGraph AtBed.py (https:
//github.com/guifengwei) was used on normalised bedGraph files to extract values of
signal for 250kb windows spanning either the whole X chromosome or the 103.5Mb chrX1
region that can be analysed allelically. These files were loaded into RStudio for further
data processing and generation of plots after the transformations exemplified by Figure 3.8
and Figure 3.9. Briefly, ChIP files were first normalised to appropriate input files to cal-
culate enrichment (IP/input) for each window across the chromosome. For non-allelic
analysis, Xist-specific gain of the modification was calculated by subtraction of uninduced
from (24h or 3h) induced samples (Dox – NoDox). Line graphs of allelic enrichment were
calculated for each sample by subtraction of Xa enrichment from Xi enrichment (Xi–Xa)
and are thus ‘internally’ normalised to be more robust to technical variability (e.g. in ChIP
efficiency) between samples. Data points in boxplots represent allelic enrichment for each
window calculated as the ratio of Xi enrichment compared to Xa enrichment (Xi/Xa).
Poor mappability regions were defined as windows with outlier signal in non-allelic input
90
(±2.5 median absolute deviation). Low allelic regions were defined as windows ranking in
the bottom 5% of signal in allelic input files. These regions were excluded from associated
boxplots and calculations of correlation coefficients.
2.14.1 Comparison between Polycomb ChIP-seq and Xist RAP-seq
Processed and input-normalised data from Xist RNA Antisense Purification (RAP-seq)
after 3 and 24 hours of Xist expression by retinoic acid (RA)-induced differentiation of
XX mESCs was downloaded from (Engreitz et al. 2013). RAP-seq data was converted
from the mm9 to mm10 genome builds using bedtools commands and UCSC utilities such
as “liftOver” (Hinrichs et al. 2006), and binned into 250kb windows to be comparable
to the Polycomb ChIP-seq data sets generated in this study. y axes indicating Xist-
specific enrichment in each data set were mean-normalised for comparisons of line graphs
in Figure 3.10. Gene categories shown in the rug below were generated by performing
kinetic modelling of gene silencing dynamics on time course data collected by Dr Tatyana
Nesterova in the iXist-ChrXCast cell line (in which the whole X chromosome is amenable
to allelic analysis), with fast/medium/slow groups defined based on thresholds of silencing
halftime.
2.14.2 Meta-profiles
Meta-profiles of various ChIP-seq data sets were generated using deeptools on normalised
bigWig files. For gene meta-profiles the command “computeMatrix scale-regions –skipZeros
–metagene” was first used, followed by the “plotProfile” command. Annotation files of
‘active’ and ‘silent’ genes (Figure 3.6) were generated from the RefSeq mm10 gene an-
notation with thresholds of TPM<0.01 (silent) and TPM>1 (active) from mRNA-seq
data in iXist-ChrX collected by Dr Tatyana Nesterova. The “reference-point” mode of
“computeMatrix” was used for meta-profiles centred on TSSs or protein binding sites, re-
91
spectively using either annotation files restricted to genes analysed on chrX1 or published
data sets of peak locations in mESCs. SUZ12 and RING1B peaks were downloaded from
(Fursova et al. 2019). YY1 peaks were called de novo with MACS2 “-q 0.01” on data
downloaded and reanalysed from (Weintraub et al. 2017).
2.15 Publicly available data sets
Tracks of ChIP-seq data shown in Figure 4.13 were downloaded from the various sources
referenced in the figure legend. GEO accession numbers are also given in the main figure.
For the most part, data was downloaded in the wig file format and had to be converted
from mm9 to mm10 genome coordinates using UCSC utilities such as “wigToBigWig”,
“bigWigToBedGraph” and “liftOver” (Hinrichs et al. 2006), before being converted by
“bedGraphToBigWig” for visualisation in IGV.
Chapter 3
Characterisation of changes to the regulatory land-
scape of chromatin during the establishment of XCI
3.1 Introduction
As discussed in the 1.2.5, Xist orchestrates a multitude of changes to chromatin as it
transforms an active X chromosome to an inactive state during XCI. However, studies
have been conducted in different experimental models, and many did not investigate dy-
namics of changes over the course of the silencing process. Moreover, some important
players in the control of gene regulation, most notable the role of transcription factors in
activating/repressing transcription, have been relatively understudied as subjects in the
X inactivation field. This has meant that despite much progress, we do not have a full
understanding of which processes drive gene silencing compared to secondary effects, and
which features account for gene-by-gene variation in silencing dynamics.
Thus, as a key goal of my project, I set out to characterise these changes to chromatin in
a unified model system, allowing for direct comparison of many different features as they
dynamically change during the early stages of X chromosome inactivation. By using next-
generation sequencing technologies, I aimed to generate concordant high-resolution data
sets capable of capturing the variability between individual cis-regulatory elements and
genes across the X chromosome as it silences. This comprehensive genomic characterisation
of the establishment phases of XCI would then act as an essential baseline against which
92
93
to compare cells lines engineered with mutations affecting key molecular pathways acting
downstream of Xist in silencing, discussed in Chapter 5 and Chapter 6.
Initial experiments discussed in this chapter were conducted in a limited four- time point
course using cells kept entirely in non-differentiating conditions for mESC culture (i.e.
continual LIF). This was to minimise potentially confounding effects of cellular differenti-
ation, for example on expression levels of trans-factors, cell cycle length, or differentiation-
coupled inhibition or recruitment of pathways that interplay upstream or downstream of
the central processes of XCI establishment. However, in order to fully trace the dynamics
of XCI to completion and gain insight into late pathways, it was necessary to introduce dif-
ferentiation into subsequent experiments. These are presented as part of a more in-depth
analysis of gene silencing dynamics and heterogeneity in Chapter 4.
3.2 iXist-ChrX model cell line
I decided to use as a model system an engineered mouse embryonic stem cell line generated
by a colleague, Dr Tatyana Nesterova, namely iXist-ChrX (Figure 3.1 A). This line was
edited by CRISPR-Cas9 facilitated homologous recombination to replace the endogenous
promoter of Xist on one X chromosome with the promoter sequence from the TetOn sys-
tem for inducible transcription (Gossen et al. 1995). A sequence encoding constitutive
expression of the transactivator protein, rtTA, was also inserted into the Tigre locus of
chromosome 9 (Zeng et al. 2008). Together these two modifications allow highly efficient
(>90 of cells) and synchronised inducible control of Xist expression through addition of
doxycyline to the growth media (Nesterova et al. 2019). Importantly, the parental line was
derived from progeny of an F1 cross between two genetically divergent mouse strains Mus
Musculus Domesticus (129/SvlmJ) and Mus Musculus Castaneous (CAST/EiJ). SNPs
can be used to assign a significant proportion of sequencing reads (35-55% depending on
the assay) to their strain of origin. This enables allele-specific analysis of changes to the
94
Domesticus/129 chromosome harbouring inducible Xist (Xi) compared to the ‘internal
control’ of the Castaneous/CAST chromosome (Xa). During the course of further char-
acterisation of this line, the lab discovered that targeting had caused a small deletion in
the Xist promoter of the Castaneous (Xa) chromosome and a chromosomal recombination
event leading to the replacement of the ∼67Mb distal arm of the Domesticus chromosome
with Castaneous sequence. As such, only the ∼103Mb region proximal to Xist, henceforth
referred to as ‘chromosome X1’ (chrX1), was amenable to allele-specific analysis. Other-
wise iXist-ChrX cells are broadly karyotypically stable1 in standard mESC culture and are
highly amenable to both large-scale expansion for genomic techniques and further genetic
engineering (see 1.1.6 and 2.5-2.7)
Figure 3.1 B shows a schematic of the experimental time course for data sets discussed in
this chapter. iXist-ChrX cells were passaged off feeder cells and split into four parallel
dishes for Xist induction at 72, 24, 12 and 0 hours prior to simultaneous harvesting. A
concentration of 1µg/ml doxycycline was used as standard for all experiments.
3.3 Precise measurement of gene silencing progression by chromatin
RNA-seq
In order to establish a baseline of gene silencing dynamics, I performed chromatin RNA-seq
(chrRNA-seq) over this time course, a technique which enriches for nascent, unprocessed
transcripts associated with the chromatin fraction of the nucleus, and so generates many
NGS read fragments that map to intronic sequences in their gene of origin. This enables
both better representation of lowly-expressed genes in the nuclear transcriptome compared
to total RNA-seq and superior allele-specific assignment of read fragments due to the
higher prevalence of SNPs in non-coding regions. One example gene, Tbl1x, is presented
in Figure 3.2 A. Induction of Xist expression rapidly reaches levels of ∼5000 counts/reads-
1iXist-ChrX cells are prone to occasional chromosomal duplication or replacement events during genomeengineering (see Appendix Figures A1,A2,A3).
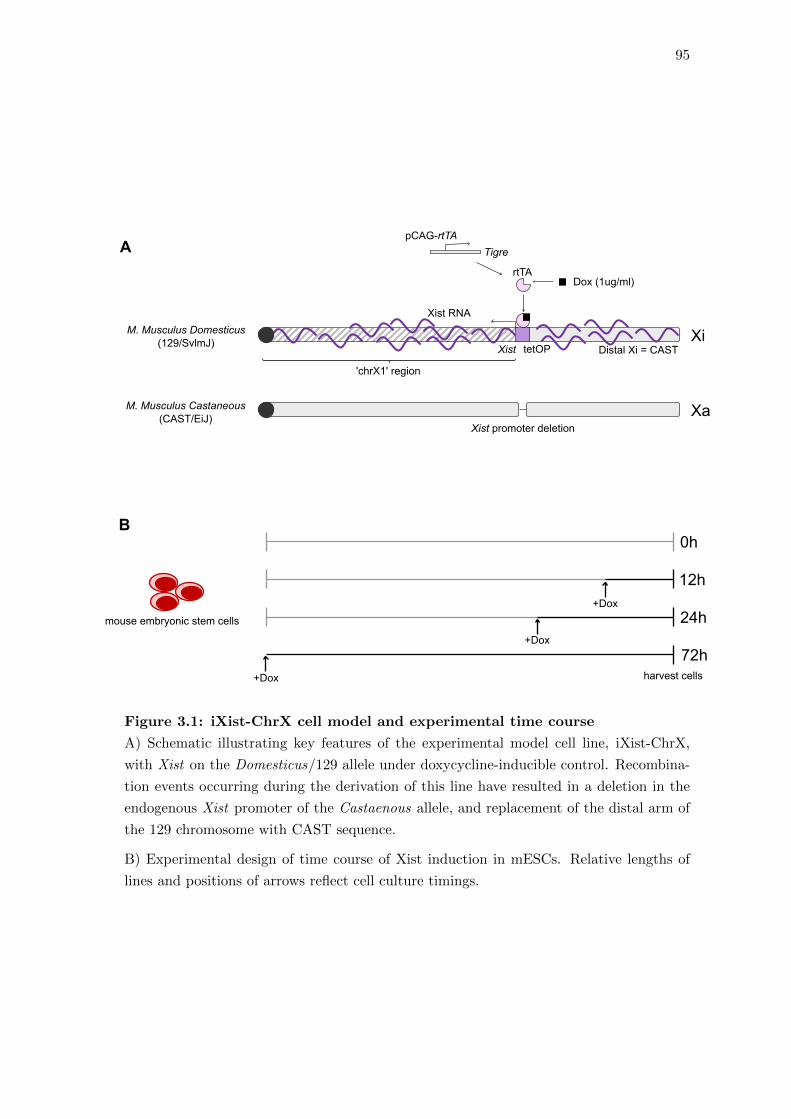
95
Xist promoter deletion
'chrX1' region
Xist
Xist RNA
Dox (1ug/ml)rtTA
tetOP
pCAG-rtTATigre
M. Musculus Domesticus(129/SvlmJ)
M. Musculus Castaneous(CAST/EiJ)
Distal Xi = CASTXi
Xa
A
mouse embryonic stem cells
harvest cells
+Dox
+Dox
+Dox
0h
12h
24h
72h
B
Figure 3.1: iXist-ChrX cell model and experimental time course
A) Schematic illustrating key features of the experimental model cell line, iXist-ChrX,
with Xist on the Domesticus/129 allele under doxycycline-inducible control. Recombina-
tion events occurring during the derivation of this line have resulted in a deletion in the
endogenous Xist promoter of the Castaenous allele, and replacement of the distal arm of
the 129 chromosome with CAST sequence.
B) Experimental design of time course of Xist induction in mESCs. Relative lengths of
lines and positions of arrows reflect cell culture timings.
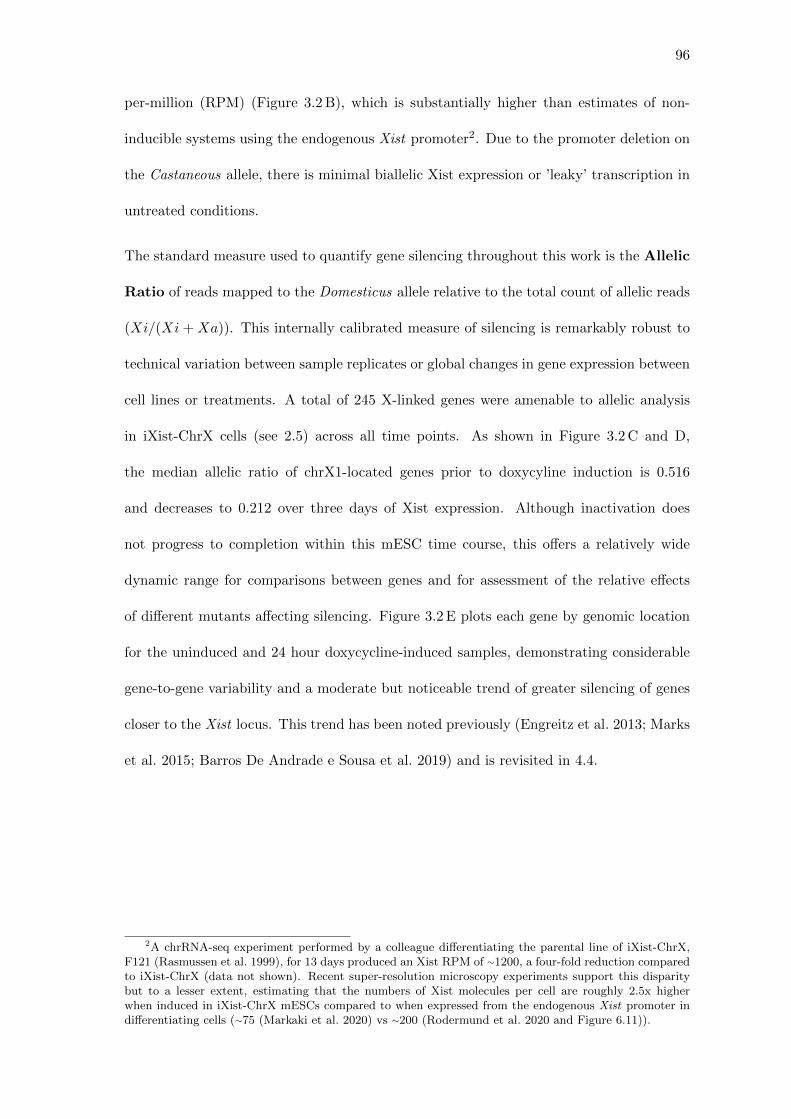
96
per-million (RPM) (Figure 3.2 B), which is substantially higher than estimates of non-
inducible systems using the endogenous Xist promoter2. Due to the promoter deletion on
the Castaneous allele, there is minimal biallelic Xist expression or ’leaky’ transcription in
untreated conditions.
The standard measure used to quantify gene silencing throughout this work is the Allelic
Ratio of reads mapped to the Domesticus allele relative to the total count of allelic reads
(Xi/(Xi + Xa)). This internally calibrated measure of silencing is remarkably robust to
technical variation between sample replicates or global changes in gene expression between
cell lines or treatments. A total of 245 X-linked genes were amenable to allelic analysis
in iXist-ChrX cells (see 2.5) across all time points. As shown in Figure 3.2 C and D,
the median allelic ratio of chrX1-located genes prior to doxycyline induction is 0.516
and decreases to 0.212 over three days of Xist expression. Although inactivation does
not progress to completion within this mESC time course, this offers a relatively wide
dynamic range for comparisons between genes and for assessment of the relative effects
of different mutants affecting silencing. Figure 3.2 E plots each gene by genomic location
for the uninduced and 24 hour doxycycline-induced samples, demonstrating considerable
gene-to-gene variability and a moderate but noticeable trend of greater silencing of genes
closer to the Xist locus. This trend has been noted previously (Engreitz et al. 2013; Marks
et al. 2015; Barros De Andrade e Sousa et al. 2019) and is revisited in 4.4.
2A chrRNA-seq experiment performed by a colleague differentiating the parental line of iXist-ChrX,F121 (Rasmussen et al. 1999), for 13 days produced an Xist RPM of ∼1200, a four-fold reduction comparedto iXist-ChrX (data not shown). Recent super-resolution microscopy experiments support this disparitybut to a lesser extent, estimating that the numbers of Xist molecules per cell are roughly 2.5x higherwhen induced in iXist-ChrX mESCs compared to when expressed from the endogenous Xist promoter indifferentiating cells (∼75 (Markaki et al. 2020) vs ∼200 (Rodermund et al. 2020 and Figure 6.11)).
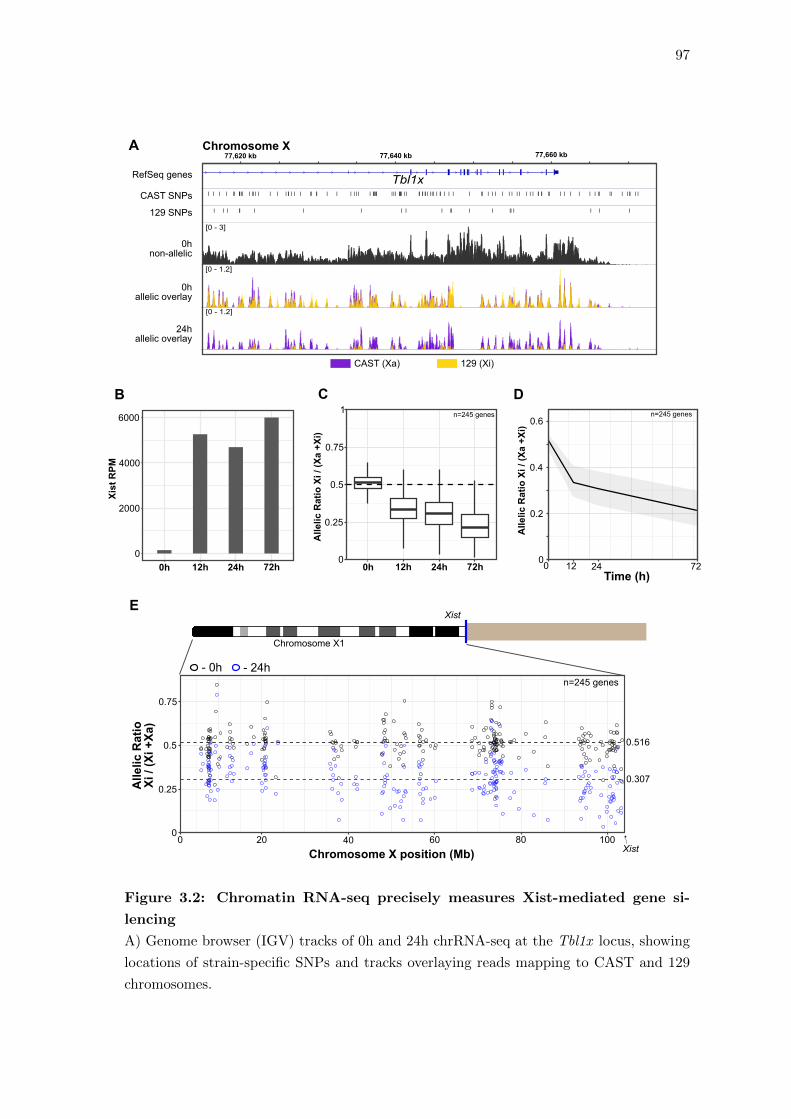
97
80
0.516
0.307
100
n=245 genes- 0h - 24h
0.25
0.5
0.75
00 20 40 60
Allelic
Ratio
Xi/(Xi
+Xa)
Chromosome X1
Xist
Xist
E
0 12 24 7200
2000
4000
6000
0.2
0.4
0.6
Time (h)
Allelic
RatioXi
/(Xa
+Xi)
XistRPM
Allelic
RatioXi
/(Xa
+Xi)
n=245 genes
DB
0h
0.25
0.5
0
0.75
1
12h 24h 72h0h 12h 24h 72h
n=245 genes
Chromosome X position (Mb)
C
[0 - 3]
[0 - 1.2]
[0 - 1.2]
Tbl1x
24hallelic overlay
0hallelic overlay
0hnon-allelic
CAST SNPs
RefSeq genes
CAST (Xa) 129 (Xi)
129 SNPs
77,640 kb77,620 kb 77,660 kbChromosome XA
Figure 3.2: Chromatin RNA-seq precisely measures Xist-mediated gene si-
lencing
A) Genome browser (IGV) tracks of 0h and 24h chrRNA-seq at the Tbl1x locus, showing
locations of strain-specific SNPs and tracks overlaying reads mapping to CAST and 129
chromosomes.
98
Figure 3.2 (previous page): Chromatin RNA-seq precisely measures Xist-
mediated gene silencing
B) Relative levels of chromatin associated Xist for each time point of induction.
C) Boxpots of allelic ratios of chrX1 genes at each time point. 0h and 24h time points
were merged from three replicate samples, 12h and 72h time points were merged from two
replicates.
D) Ribbon plot of allelic ratios from (C) with exact x-axis scaling. The solid line traces
the median allelic ratio and shaded regions represent interquartile ranges.
E) Plots of the allelic ratio of each gene at 0 and 24 hours of Xist induction with an x-axis
of chromosome X location. The upper icon shows the region of the X chromosome that
is amenable to allelic analysis (chrX1). Dashed horizontal lines trace the median allelic
ratios at each time point.
3.4 ATAC-seq reveals dynamic loss of chromatin accessibility from cis-
regulatory elements on Xi
Cis-regulatory elements (CREs) are major determinants of gene expression levels and
context-specific transcription. Previous reports have shown that CREs on the Xi of differ-
entiated cells are mostly suppressed, as measured by the proxy of accessibility in the ATAC
assay, with some exceptions such as elements in close proximity to escape genes (Giorgetti
et al. 2016; Jegu et al. 2019). Likewise, loss of chromatin accessibility is a relatively early
change upon Xist expression (Giorgetti et al. 2016). However, a full consideration of the
relative dynamics of accessibility loss from different CREs and how this relates to silencing
of putative target genes has not been reported.
Thus, I set out to characterise the dynamics of accessibility loss in iXist-ChrX cells by two
replicate experiments of ATAC-seq over the aforementioned time course (Figure 3.3 A).
Each sample produced ∼60,000 peaks of high accessibility, of which ∼40,000 were shared
between all samples of a given replicate (Figure 3.3 B). I intersected all samples to gener-
ate a consensus set of 79,935 CREs across the whole genome, a number consistent with
previously published reports in mESCs (Corces et al. 2017; King and Klose 2017), with
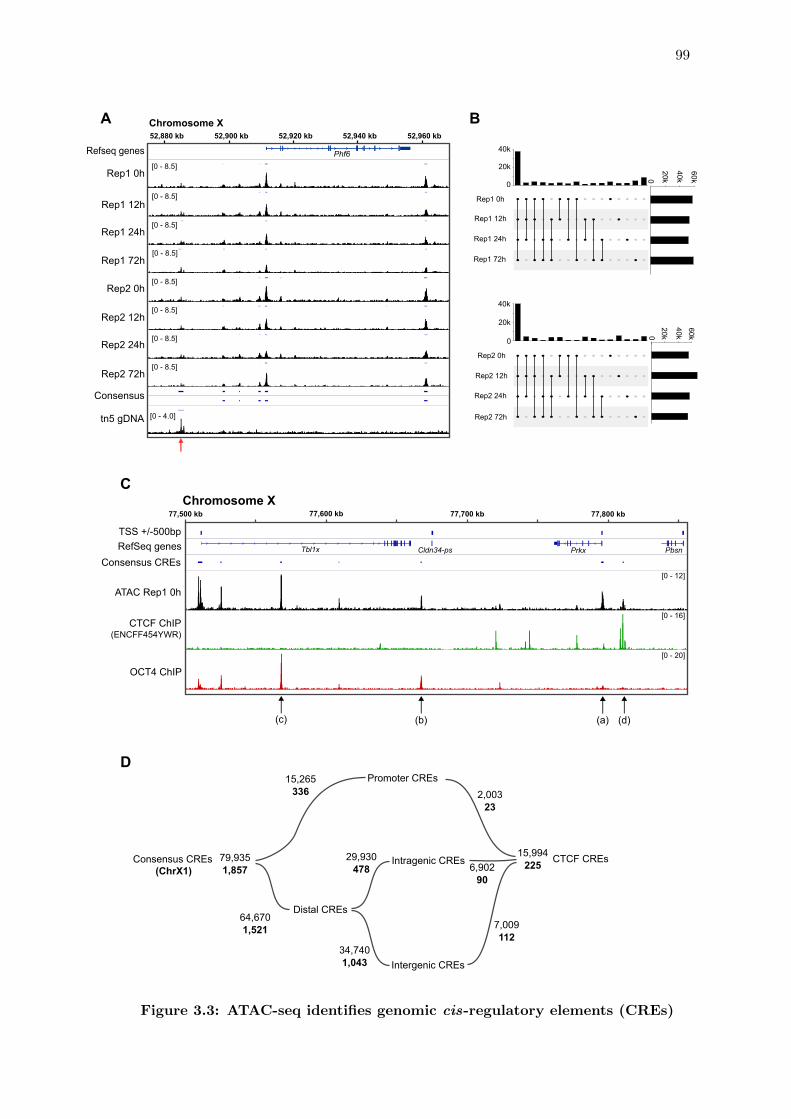
99
Phf6[0 - 8.5]
[0 - 8.5]
[0 - 8.5]
[0 - 8.5]
[0 - 8.5]
[0 - 8.5]
[0 - 8.5]
[0 - 8.5]
[0 - 4.0]
Refseq genes
Rep1 0h
Rep1 12h
Rep1 24h
Rep1 72h
Rep2 0h
Rep2 12h
Rep2 24h
Rep2 72h
Consensus
tn5 gDNA
52,880 kb 52,900 kb 52,920 kb 52,940 kb 52,960 kbChromosome XA
Tbl1x Cldn34-ps Prkx PbsnRefSeq genesTSS +/-500bp
Consensus CREs
ATAC Rep1 0h
CTCF ChIP(ENCFF454YWR)
OCT4 ChIP
(a)(b)(c) (d)
77,600 kb 77,700 kb 77,800 kb77,500 kbChromosome X
[0 - 12]
[0 - 16]
[0 - 20]
(ChrX1)Consensus CREs 79,935
1,857
Promoter CREs15,265336
Distal CREs64,6701,521
Intergenic CREs34,7401,043
29,930478
Intragenic CREs CTCF CREs15,994225
2,00323
6,90290
7,009112
C
D
Rep1 72h
Rep1 24h
Rep1 12h
Rep1 0h
Rep2 72h
Rep2 24h
Rep2 12h
Rep2 0h
0
0
20k
40k
60k
20k
40k60k0
20k
20k
40k
40k
0
B
Figure 3.3: ATAC-seq identifies genomic cis-regulatory elements (CREs)
100
Figure 3.3 (previous page): ATAC-seq identifies genomic cis-regulatory ele-
ments (CREs)
A) Genome browser (IGV) tracks of two replicates of ATAC-seq for the time course of
Xist induction in iXist-ChrX mESCs. Peaks called by MACS2 on individual samples are
indicated above each track, and the consensus CRE annotation is shown below. Peaks
also called in an input track of naked genomic DNA treated with tn5-adaptors, such as in
the region indicated by the red arrow, were removed from the consensus CRE annotation
(see 2.13.4).
B) Plots comparing total numbers of ATAC peaks called across the genome in each sample
(right), and how many peaks intersect between each sample. Two replicate experiments
are shown separately.
C) Genome browser (IGV) tracks of ATAC-seq, CTCF ChIP-seq and OCT4 ChIP-seq,
demonstrating how CREs mark sites where factors bind DNA target sequences. Arrows
indicate types of CRE: (a) promoter (b) intergenic enhancer (c) intragenic enhancer (d)
CTCF site. CTCF ChIP-seq data was downloaded from ENCODE (Dunham et al. 2012).
D) Classification of consensus CREs based on genomic location (left) or overlap with
CTCF peaks (right). Numbers of elements in each category are recorded, with those
located to chrX1 in bold.
1,857 residing in the chrX1 region of chromosome X. ATAC-seq successfully marked as
peaks of accessibility both active gene promoters and putative enhancer elements typified
by binding of transcription factors (Figure 3.3 C). Binding sites of CTCF, known to have
functionally distinct roles in genome organisation via loop extrusion involving cohesin,
also appear as relatively smaller peaks in ATAC-seq. As such, these were recorded as
a separate annotation class in addition to classification of CREs as ’Promoter’, ’Distal
Intergenic’ or ’Distal Intragenic’ based on their genomic location (Figure 3.3 D).
ATAC CREs are typically sequences of 0-2kb (Figure 3.4 C), and consequently many
shorter elements on chrX1 were not in proximity to sufficient SNPs for reliable allelic
mapping. Nevertheless, the 831 CREs amenable to allelic analysis form a valuable data
set to interrogate the dynamics of decreasing chromatin accessibility during XCI. Some
elements, such as the putative enhancer spanning intron 4 of Hmbg3, undergo rapid deple-
tion of accessibility, whereas others demonstrate slower dynamics of accessibility loss or
101
appear to retain accessibility throughout the time course of Xist induction, for example the
promoter of escapee gene Kdm6a (Figure 3.4 A). The allelic ratio of chromatin accessibility
across all CREs progressively decreases from median values of 0.496 to 0.325 over three
days (Figure 3.4 B), but there is considerable variability in allelic ratios among individual
peaks. This can partially be accounted for by an inherent effect of binomial sampling from
the sequencing libraries, which is greater for ATAC-seq data than chrRNA-seq because
of the relatively small numbers of allelic counts within each CRE (Figure 3.4 D). This
may hide some biological differences between individual peaks but should not alter overall
characteristics of the data. Furthermore, time course data can be aggregated to assess
dynamic trends, mitigating some of the variability at particular time points. Therefore,
this data set can be used to examine which features of CREs affect the kinetics of their
decreasing accessibility on the Xi.
One general result is that chromatin accessibility loss from Xi demonstrates both a lesser
magnitude of change and slower dynamics compared to silencing of gene transcription
(Figure 3.4 E). To investigate if this can be accounted for by a particular subset of CREs,
I compared the respective dynamics of different CRE classifications. As shown in Fig-
ure 3.4 F, classes behave similarly overall. At 12 and 24 hours of induction distal elements
are slightly more skewed than promoters and there is a non-significant tendency for CREs
overlapping CTCF sites to retain accessibility. However, neither of these differences per-
sist as silencing progresses to 3 days. It was perhaps surprising that these differences
were not stronger given that previous evidence suggests that HDAC3 activity is particu-
larly pronounced at enhancers (Zylicz et al. 2019), and CTCF eviction has been linked to
pathways only recruited late in XCI under differentiation conditions (Gdula et al. 2019).
Taken together, this data suggests that loss of accessibility occurs broadly for most CREs
across the chromosome and is more likely to be secondary consequence of gene silencing
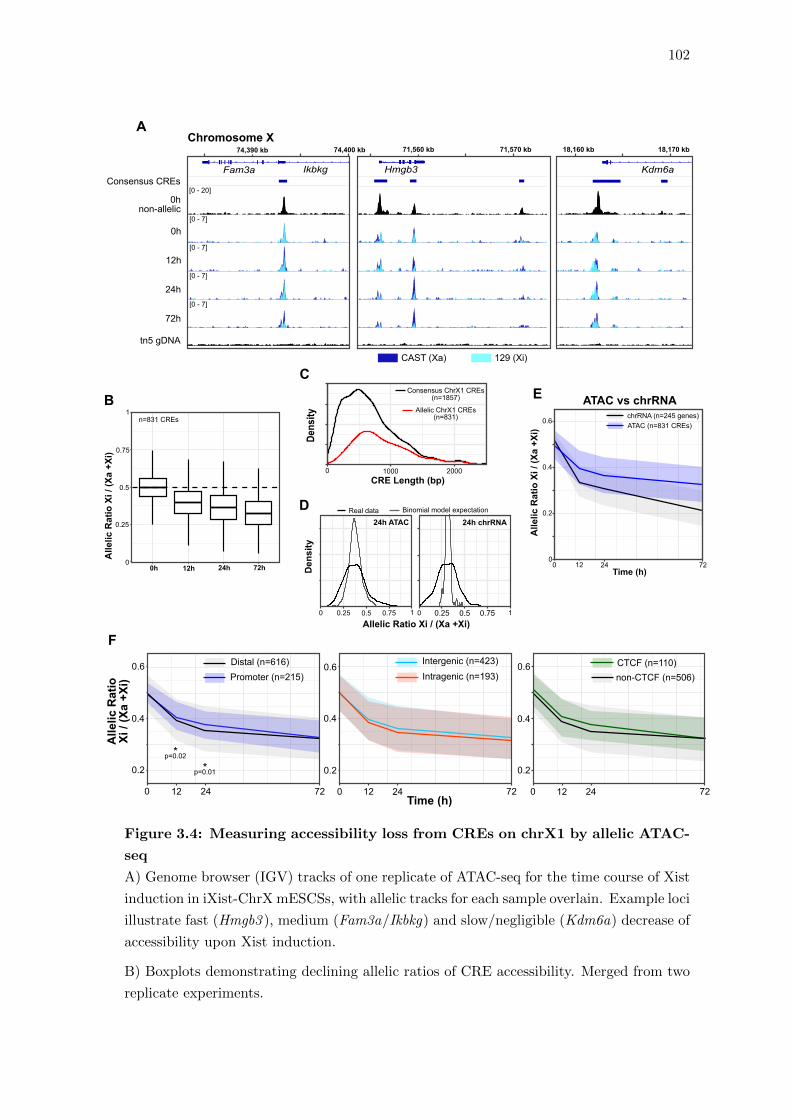
102
0 12 24 72
CTCF (n=110)non-CTCF (n=506)
0 12 24 72
0.6
0.4
0.2
Time (h)
Intergenic (n=423)Intragenic (n=193)
0 12 24 72
0.6
0.4
0.2
0.6
0.4
0.2
Allelic
Ratio
Xi/(Xa
+Xi)
Distal (n=616)Promoter (n=215)
0
0.2
0.4
0.6
Time (h)0 12 24 72
Allelic
RatioXi
/(Xa
+Xi)
chrRNA (n=245 genes)ATAC (n=831 CREs)
ATAC vs chrRNA
*p=0.02*p=0.01
0h
0.25
0.5
0
0.75
1
12h 24h 72h
Allelic
RatioXi
/(Xa
+Xi)
Allelic Ratio Xi / (Xa +Xi)
Density
n=831 CREs
0 1000 2000
Density
CConsensus ChrX1 CREs
(n=1857)
Allelic ChrX1 CREs(n=831)
CRE Length (bp)
Ikbkg G6pdx
18,160 kb 18,170 kb71,560 kb 71,570 kb74,390 kb 74,400 kb
[0 - 7]
[0 - 7]
[0 - 7]
[0 - 7]
[0 - 20]
Kdm6aHmgb3Fam3a Ikbkg
24h
72h
tn5 gDNA
12h
0h
0hnon-allelic
Chromosome X
CAST (Xa) 129 (Xi)
Consensus CREs
F
B E
A
0.25 0.5 0.75
D24h ATAC 24h chrRNA
0.250 01 10.5 0.75
Real data Binomial model expectation
Figure 3.4: Measuring accessibility loss from CREs on chrX1 by allelic ATAC-
seq
A) Genome browser (IGV) tracks of one replicate of ATAC-seq for the time course of Xist
induction in iXist-ChrX mESCSs, with allelic tracks for each sample overlain. Example loci
illustrate fast (Hmgb3 ), medium (Fam3a/Ikbkg) and slow/negligible (Kdm6a) decrease of
accessibility upon Xist induction.
B) Boxplots demonstrating declining allelic ratios of CRE accessibility. Merged from two
replicate experiments.
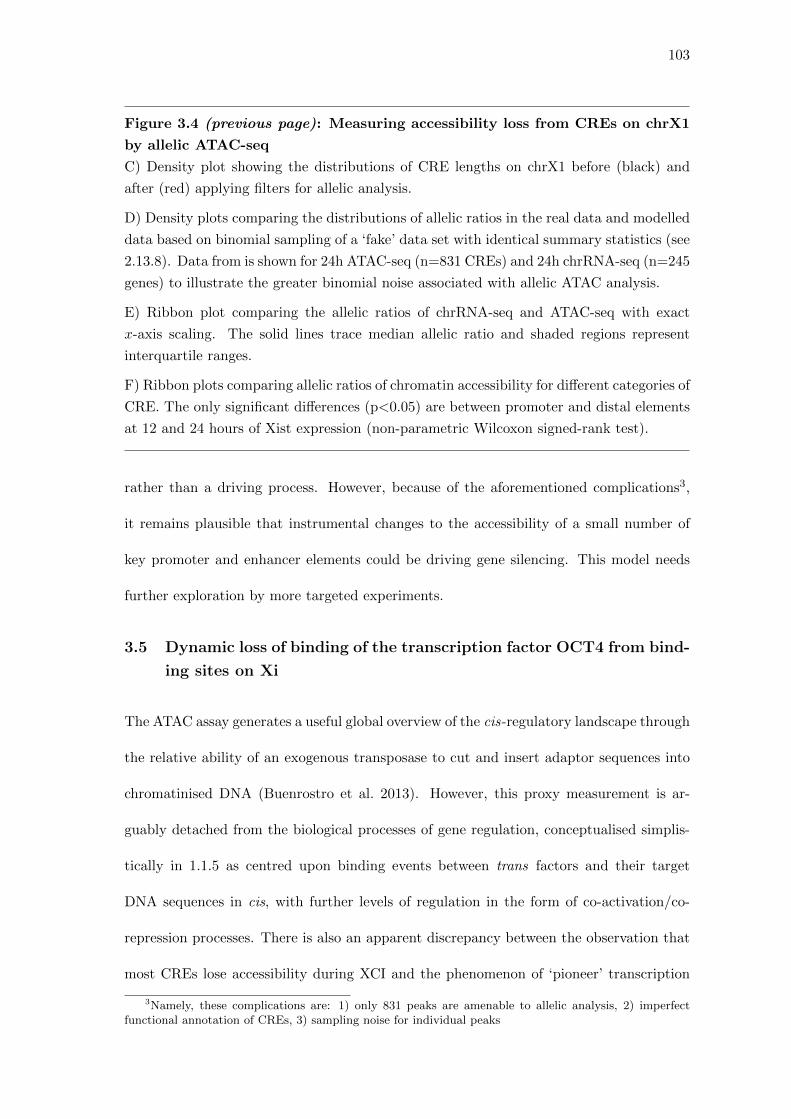
103
Figure 3.4 (previous page): Measuring accessibility loss from CREs on chrX1
by allelic ATAC-seq
C) Density plot showing the distributions of CRE lengths on chrX1 before (black) and
after (red) applying filters for allelic analysis.
D) Density plots comparing the distributions of allelic ratios in the real data and modelled
data based on binomial sampling of a ‘fake’ data set with identical summary statistics (see
2.13.8). Data from is shown for 24h ATAC-seq (n=831 CREs) and 24h chrRNA-seq (n=245
genes) to illustrate the greater binomial noise associated with allelic ATAC analysis.
E) Ribbon plot comparing the allelic ratios of chrRNA-seq and ATAC-seq with exact
x-axis scaling. The solid lines trace median allelic ratio and shaded regions represent
interquartile ranges.
F) Ribbon plots comparing allelic ratios of chromatin accessibility for different categories of
CRE. The only significant differences (p<0.05) are between promoter and distal elements
at 12 and 24 hours of Xist expression (non-parametric Wilcoxon signed-rank test).
rather than a driving process. However, because of the aforementioned complications3,
it remains plausible that instrumental changes to the accessibility of a small number of
key promoter and enhancer elements could be driving gene silencing. This model needs
further exploration by more targeted experiments.
3.5 Dynamic loss of binding of the transcription factor OCT4 from bind-
ing sites on Xi
The ATAC assay generates a useful global overview of the cis-regulatory landscape through
the relative ability of an exogenous transposase to cut and insert adaptor sequences into
chromatinised DNA (Buenrostro et al. 2013). However, this proxy measurement is ar-
guably detached from the biological processes of gene regulation, conceptualised simplis-
tically in 1.1.5 as centred upon binding events between trans factors and their target
DNA sequences in cis, with further levels of regulation in the form of co-activation/co-
repression processes. There is also an apparent discrepancy between the observation that
most CREs lose accessibility during XCI and the phenomenon of ‘pioneer’ transcription
3Namely, these complications are: 1) only 831 peaks are amenable to allelic analysis, 2) imperfectfunctional annotation of CREs, 3) sampling noise for individual peaks
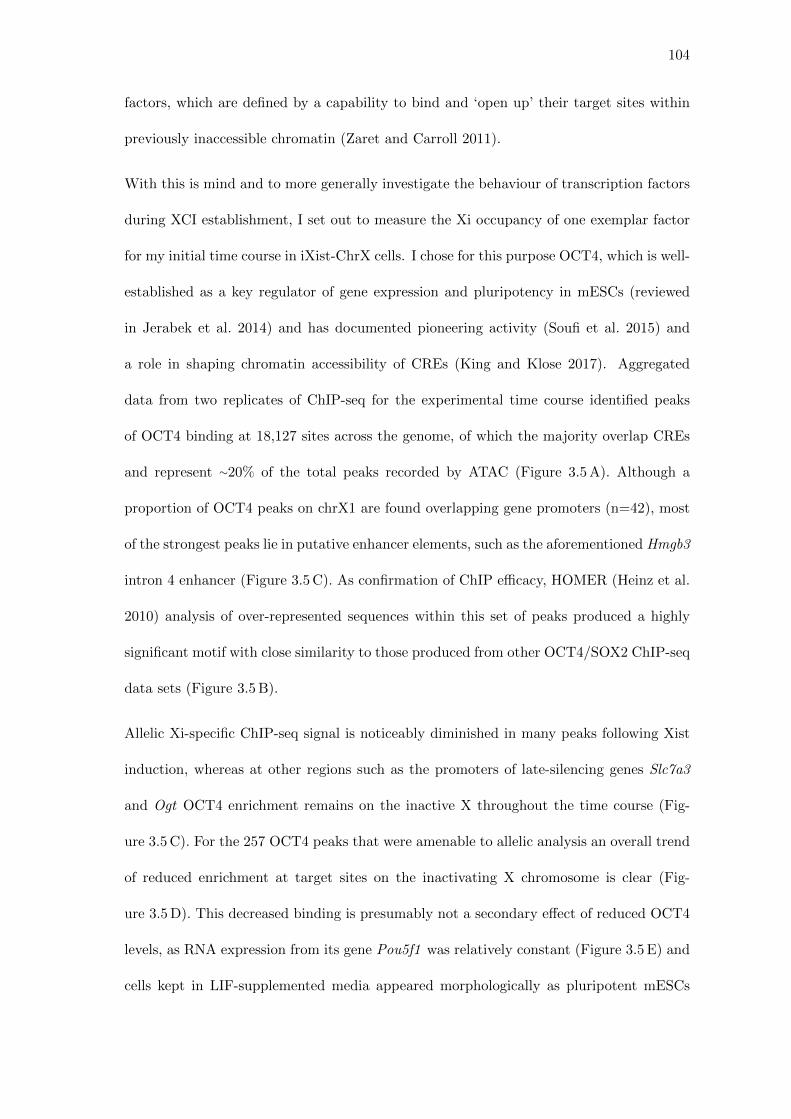
104
factors, which are defined by a capability to bind and ‘open up’ their target sites within
previously inaccessible chromatin (Zaret and Carroll 2011).
With this is mind and to more generally investigate the behaviour of transcription factors
during XCI establishment, I set out to measure the Xi occupancy of one exemplar factor
for my initial time course in iXist-ChrX cells. I chose for this purpose OCT4, which is well-
established as a key regulator of gene expression and pluripotency in mESCs (reviewed
in Jerabek et al. 2014) and has documented pioneering activity (Soufi et al. 2015) and
a role in shaping chromatin accessibility of CREs (King and Klose 2017). Aggregated
data from two replicates of ChIP-seq for the experimental time course identified peaks
of OCT4 binding at 18,127 sites across the genome, of which the majority overlap CREs
and represent ∼20% of the total peaks recorded by ATAC (Figure 3.5 A). Although a
proportion of OCT4 peaks on chrX1 are found overlapping gene promoters (n=42), most
of the strongest peaks lie in putative enhancer elements, such as the aforementioned Hmgb3
intron 4 enhancer (Figure 3.5 C). As confirmation of ChIP efficacy, HOMER (Heinz et al.
2010) analysis of over-represented sequences within this set of peaks produced a highly
significant motif with close similarity to those produced from other OCT4/SOX2 ChIP-seq
data sets (Figure 3.5 B).
Allelic Xi-specific ChIP-seq signal is noticeably diminished in many peaks following Xist
induction, whereas at other regions such as the promoters of late-silencing genes Slc7a3
and Ogt OCT4 enrichment remains on the inactive X throughout the time course (Fig-
ure 3.5 C). For the 257 OCT4 peaks that were amenable to allelic analysis an overall trend
of reduced enrichment at target sites on the inactivating X chromosome is clear (Fig-
ure 3.5 D). This decreased binding is presumably not a secondary effect of reduced OCT4
levels, as RNA expression from its gene Pou5f1 was relatively constant (Figure 3.5 E) and
cells kept in LIF-supplemented media appeared morphologically as pluripotent mESCs
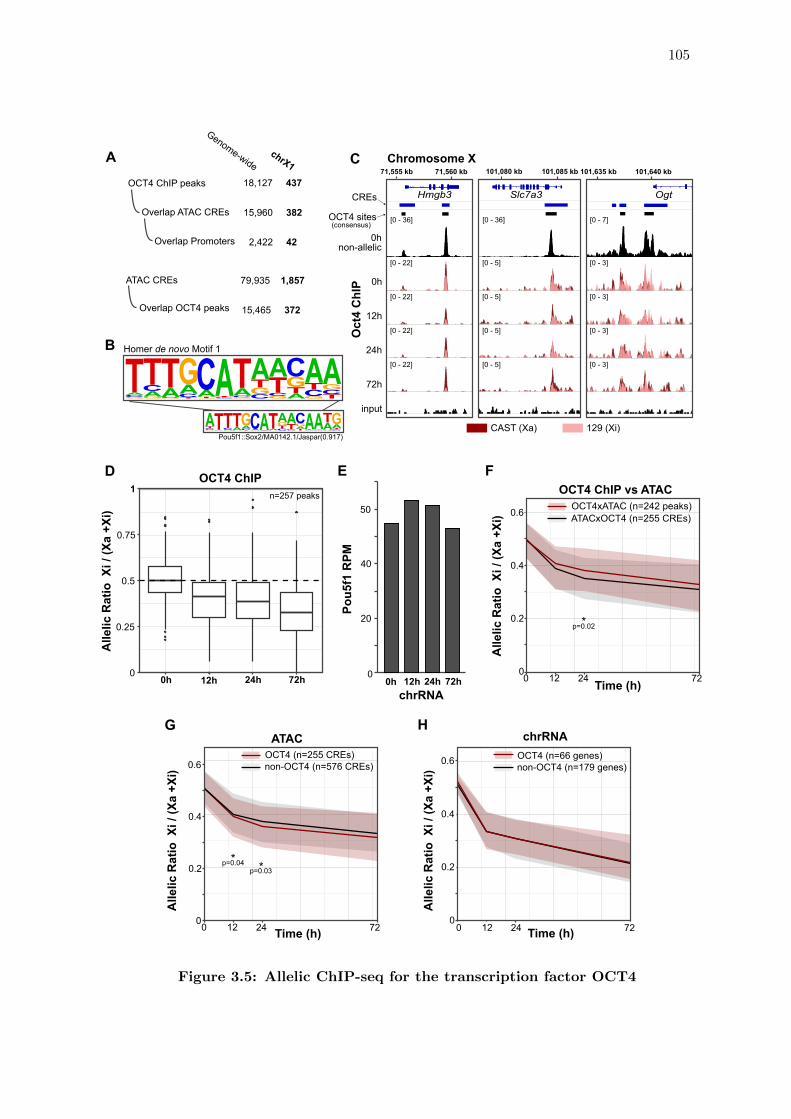
105
0
0.2
0.4
0.6
Time (h)0 12 24 72
non-OCT4 (n=179 genes)OCT4 (n=66 genes)
chrRNA
Alle
licRatio
Xi/(Xa
+Xi)
H
0
0.2
0.4
0.6
Time (h)0 12 24 72
non-OCT4 (n=576 CREs)
p=0.03p=0.04
OCT4 (n=255 CREs)ATAC
Alle
licRatio
Xi/(Xa
+Xi)
G
**
0
0.2
0.4
0.6
Time (h)0 12 24 72
ATACxOCT4 (n=255 CREs)
*
OCT4xATAC (n=242 peaks)OCT4 ChIP vs ATAC
p=0.02
Alle
licRatio
Xi/(Xa
+Xi)
F
chrRNA0h 12h 24h 72h
Pou5
f1RPM
0
20
40
50
E
0.25
0.5
0
0.75
1
0h 12h 24h 72h
Alle
licRatio
Xi/(Xa
+Xi)
n=257 peaks
OCT4 ChIPD
101,640 kb101,635 kb71,560 kb71,555 kb 101,080 kb 101,085 kb
[0 - 7]
[0 - 3]
[0 - 3]
[0 - 3]
[0 - 3]
[0 - 36]
[0 - 5]
[0 - 5]
[0 - 5]
[0 - 5]
[0 - 36]
[0 - 22]
[0 - 22]
[0 - 22]
[0 - 22]
Hmgb3 Slc7a3 Ogt
24h
72h
input
12h
0h
0hnon-allelic
Chromosome X
CAST (Xa) 129 (Xi)
CREs
OCT4 sites(consensus)
Oct4ChIP
C
GCTAGCATGACTGCATTCAGGTACGCTAGCATCTGAGCTATAGCGCTACTGACGATCTAG
GCATGACTGCATTCAGGTACGCTAGCATCGTAGCTAATGCGCTATCGA
Pou5f1::Sox2/MA0142.1/Jaspar(0.917)
Homer de novo Motif 1B
18,127 437
15,960 382
2,422 42
OCT4 ChIP peaks
Genome-widechrX1
Overlap ATAC CREs
79,935 1,857
15,465 372
ATAC CREs
Overlap OCT4 peaks
Overlap Promoters
A
Figure 3.5: Allelic ChIP-seq for the transcription factor OCT4
106
Figure 3.5 (previous page): Allelic ChIP-seq for the transcription factor OCT4
A) Counts of overlaps between consensus OCT4 ChIP-seq peaks and CREs identified by
ATAC-seq. Peaks/CREs located on chrX1 are in bold.
B) Top result from HOMER motif enrichment using default ‘De Novo’ motif finding set-
tings on the 18,127 peaks identified by OCT4 ChIP-seq. Lower box illustrates the very
close similarly (91.7%) of this motif to a previously characterised OCT4/SOX2 motif in
the JASPAR database (Fornes et al. 2020).
C) Genome browser (IGV) tracks of one replicate of OCT4 ChIP-seq for the time course of
Xist induction in iXist-ChrX mESCs, with allelic tracks for each sample overlain. Example
loci illustrate fast (Hmgb3 ), medium (Slc7a3 ) and slow/negligible (Ogt) decrease of OCT4
binding from promoters and distal CREs upon Xist induction.
D) Boxplots demonstrating declining allelic ratios of OCT4 binding for 257 peaks that
pass filters for allelic analysis. Merged from two replicate experiments.
E) Expression levels of the gene encoding OCT4, Pou5f1, in chrRNA-seq data from the
same experimental time points.
F) Ribbon plot comparing the allelic ratios of ATAC-seq and OCT4 ChIP-seq. Only
peaks/CREs that are found in common between the two assays are included. The solid
lines trace median allelic ratio and shaded regions represent interquartile ranges. Signifi-
cance at 24 hours by non-parametric Wilcoxon signed-rank test.
G) Ribbon plots comparing allelic ratios of chromatin accessibility for CREs overlapping
or non-overlapping with OCT4 peaks. The solid lines trace median allelic ratio and shaded
regions represent interquartile ranges. Significance at 12 and 24 hours calculated by non-
parametric Wilcoxon signed-rank test.
H) Ribbon plots comparing allelic ratios of gene silencing in putative OCT4 targets (bind-
ing site <5kb of TSS) compared to other genes. The solid lines trace median allelic ratio
and shaded regions represent interquartile ranges.
throughout the experiment. Furthermore, OCT4-binding and chromatin accessibility seem
to be somewhat uncoupled, as a comparison of allelic ratios at elements shared between
the two datasets shows decreased accessibility slightly precedes reductions in ChIP en-
richment (Figure 3.5 F). One interpretation of this result is that the direct effects of Xist
on chromatin, thought to include active deacetylation (McHugh et al. 2015; Zylicz et al.
2019) and coactivator displacement (Jegu et al. 2019), result in measurable reductions
in accessibility but do not immediately prevent transcription factors such as OCT4 from
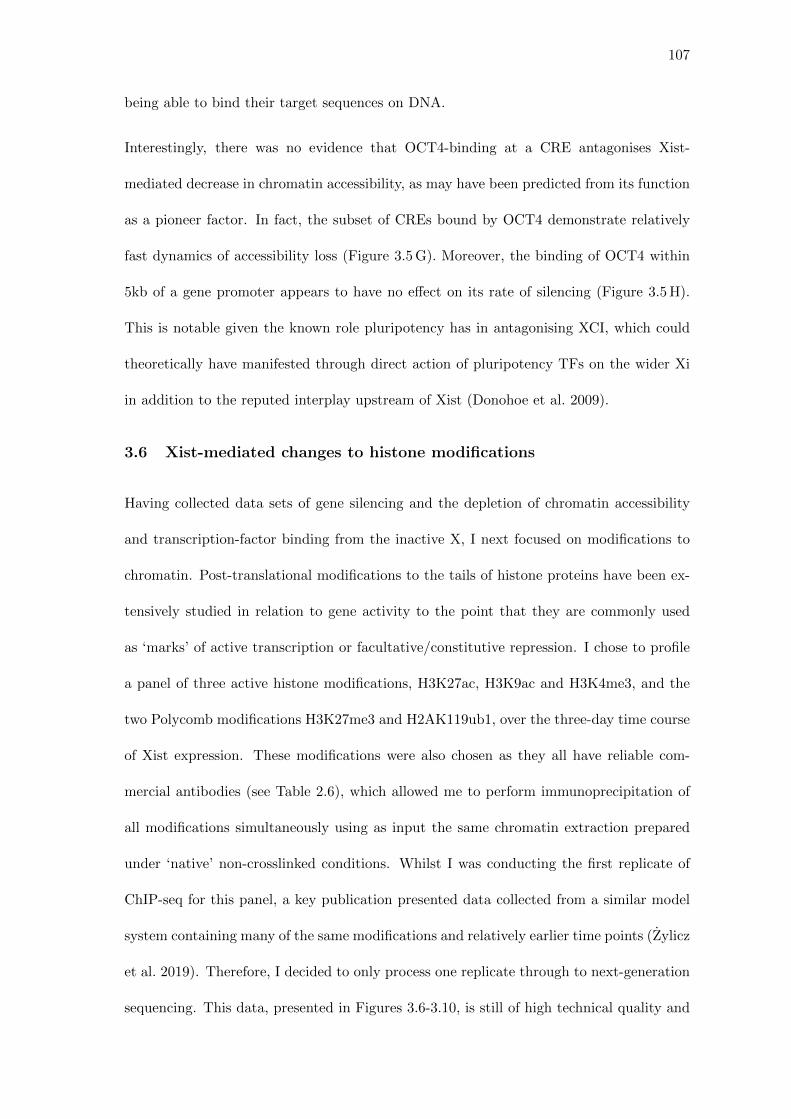
107
being able to bind their target sequences on DNA.
Interestingly, there was no evidence that OCT4-binding at a CRE antagonises Xist-
mediated decrease in chromatin accessibility, as may have been predicted from its function
as a pioneer factor. In fact, the subset of CREs bound by OCT4 demonstrate relatively
fast dynamics of accessibility loss (Figure 3.5 G). Moreover, the binding of OCT4 within
5kb of a gene promoter appears to have no effect on its rate of silencing (Figure 3.5 H).
This is notable given the known role pluripotency has in antagonising XCI, which could
theoretically have manifested through direct action of pluripotency TFs on the wider Xi
in addition to the reputed interplay upstream of Xist (Donohoe et al. 2009).
3.6 Xist-mediated changes to histone modifications
Having collected data sets of gene silencing and the depletion of chromatin accessibility
and transcription-factor binding from the inactive X, I next focused on modifications to
chromatin. Post-translational modifications to the tails of histone proteins have been ex-
tensively studied in relation to gene activity to the point that they are commonly used
as ‘marks’ of active transcription or facultative/constitutive repression. I chose to profile
a panel of three active histone modifications, H3K27ac, H3K9ac and H3K4me3, and the
two Polycomb modifications H3K27me3 and H2AK119ub1, over the three-day time course
of Xist expression. These modifications were also chosen as they all have reliable com-
mercial antibodies (see Table 2.6), which allowed me to perform immunoprecipitation of
all modifications simultaneously using as input the same chromatin extraction prepared
under ‘native’ non-crosslinked conditions. Whilst I was conducting the first replicate of
ChIP-seq for this panel, a key publication presented data collected from a similar model
system containing many of the same modifications and relatively earlier time points (Zylicz
et al. 2019). Therefore, I decided to only process one replicate through to next-generation
sequencing. This data, presented in Figures 3.6-3.10, is still of high technical quality and
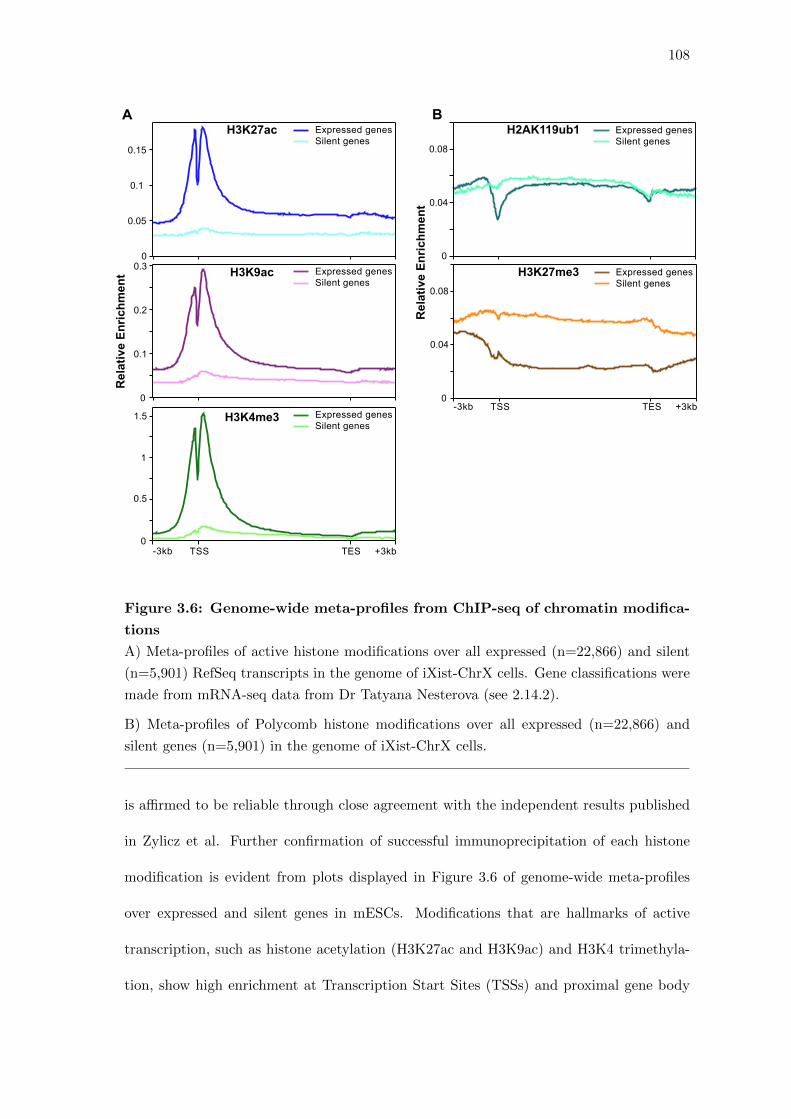
108
0
0.04
0.08
Expressed genesSilent genes
-3kb TSS TES +3kb
0
0.04
0.08
Expressed genesSilent genes
A B
H3K27me3
H2AK119ub1H3K27ac
H3K9ac
H3K4me3
RelativeEnrichm
ent
RelativeEnrichm
ent
-3kb TSS TES +3kb0
0.5
1
1.5 Expressed genesSilent genes
0
0.1
0.2
0.3 Expressed genesSilent genes
0
0.05
0.1
0.15
Expressed genesSilent genes
Figure 3.6: Genome-wide meta-profiles from ChIP-seq of chromatin modifica-
tions
A) Meta-profiles of active histone modifications over all expressed (n=22,866) and silent
(n=5,901) RefSeq transcripts in the genome of iXist-ChrX cells. Gene classifications were
made from mRNA-seq data from Dr Tatyana Nesterova (see 2.14.2).
B) Meta-profiles of Polycomb histone modifications over all expressed (n=22,866) and
silent genes (n=5,901) in the genome of iXist-ChrX cells.
is affirmed to be reliable through close agreement with the independent results published
in Zylicz et al. Further confirmation of successful immunoprecipitation of each histone
modification is evident from plots displayed in Figure 3.6 of genome-wide meta-profiles
over expressed and silent genes in mESCs. Modifications that are hallmarks of active
transcription, such as histone acetylation (H3K27ac and H3K9ac) and H3K4 trimethyla-
tion, show high enrichment at Transcription Start Sites (TSSs) and proximal gene body
109
regions of expressed genes (Figure 3.6 A) but minimal signal over silent genes. By con-
trast, H2AK119ub1 is reduced at active TSSs, and H3K27me3 is low across expressed gene
bodies (Figure 3.6 B). These patterns are in agreement with expectations from previous
literature (Barski et al. 2007; Dunham et al. 2012).
3.7 Xist induction causes rapid depletion of active histone modifica-
tions
Allelic analysis of the three active chromatin modifications (H3K27ac, H3K9ac and H3K4me3)
revealed clear depletion from most peaks of enrichment across chrX1, but also notice-
able heterogeneity in the dynamics at different sites. The example loci in Figure 3.7 A
illustrate three regions showing rapid allelic depletion, slow allelic depletion, and appar-
ent complete resistance, the promoters of Slc7a3, Fam3a/Ikbkg and Kdm6a respectively.
Comparison of the allelic ratios within peak regions offers an overview of the dynamics of
Xist-mediated depletion for each modification (Figure 3.7 B). Although all three modifi-
cations show broadly similar patterns, the allelic ratio for H3K27ac is significantly lower
at all three recorded time points, demonstrating deacetylation of this particular residue is
the most rapid consequence of Xist induction (Figure 3.7 C). To rule out the possibility
that this result is an artifact of reduced enrichment at peak regions in H3K27ac ChIP, I
relaxed parameters of peakcalling by MACS2 (from q<0.01 to q<0.05) and allelic filtering
to increase the number of sampled peaks (from n=284 to n=324), with no change to the
overall trend (data not shown). Moreover, rapid deacetylation was not limited to enriched
peaks but was evident across the whole profile of genes (Figure 3.7 D). In fact, the overall
dynamics of H3K27ac deactelyation were a close fit to gene silencing dynamics as mea-
sured by chrRNA-seq (Figure 3.7 E), plausibly indicative of the causal relationship that
has been previously proposed (McHugh et al. 2015; Zylicz et al. 2019).
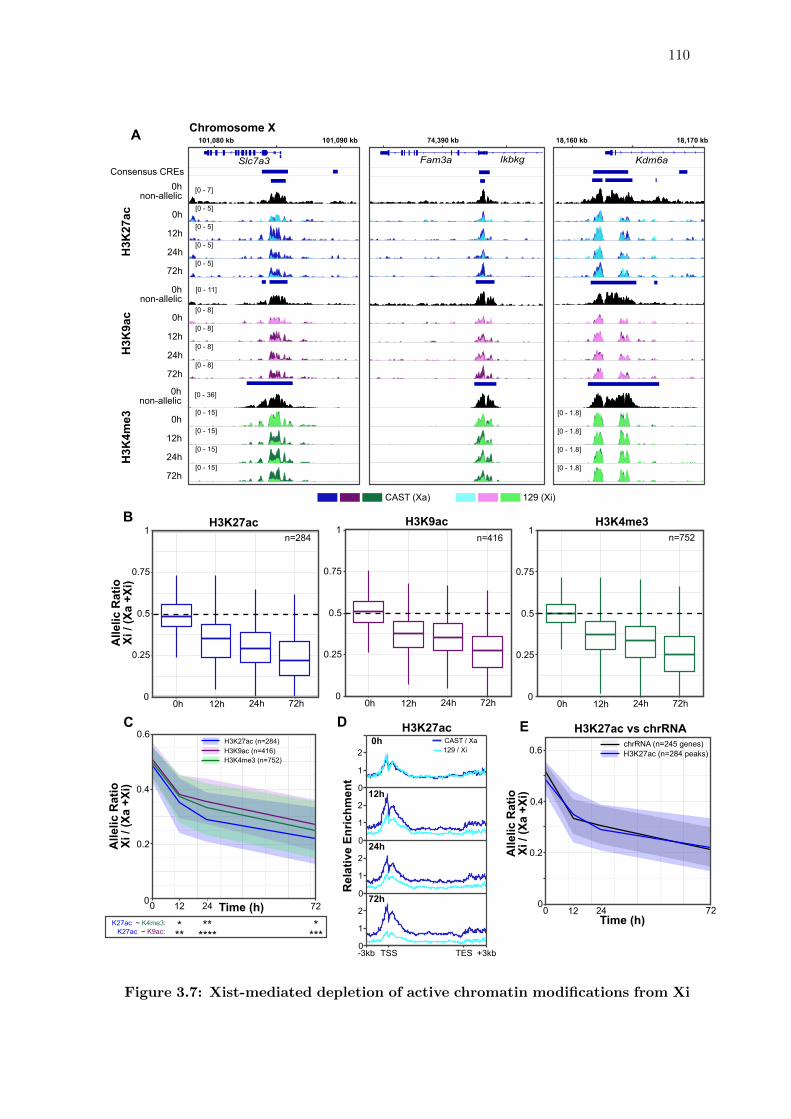
110
0h
0.25
0.5
0
0.75
1
12h 24h 72h
H3K4me3n=752
0h
0.25
0.5
0
0.75
1
12h 24h 72h
H3K9acn=416n=284
0h
0.25
0.5
0
0.75
1
12h 24h 72h
H3K27ac
Alle
licRat
ioXi
/(Xa
+Xi)
[0 - 5]
[0 - 5]
[0 - 5]
[0 - 5]
[0 - 8]
[0 - 8]
[0 - 8]
[0 - 8]
[0 - 15]
[0 - 15]
[0 - 15]
[0 - 15]
[0 - 1.8]
[0 - 1.8]
[0 - 1.8]
[0 - 1.8]
[0 - 36]
[0 - 11]
[0 - 7]
Kdm6aSlc7a3 Fam3a Ikbkg
24h
72h
12h
0h
0hnon-allelic
24h
72h
12h
0h
0hnon-allelic
24h
72h
12h
0h
0hnon-allelic
Consensus CREs
H3K
27ac
H3K
9ac
H3K
4me3
74,390 kb101,080 kb 101,090 kb 18,160 kb 18,170 kbChromosome X
CAST (Xa) 129 (Xi)
0
0.2
0.4
0.6
Time (h)0 12 24 72
Alle
licRat
ioXi
/(Xa
+Xi)
H3K4me3 (n=752)
H3K27ac (n=284)H3K9ac (n=416)
**K27ac ~ K4me3:K27ac ~ K9ac:
** ********
*
0
0.2
0.4
0.6
Time (h)0 12 24 72
Alle
licRat
ioXi
/(Xa
+Xi)
chrRNA (n=245 genes)H3K27ac (n=284 peaks)
H3K27ac vs chrRNAEDC
B
A
H3K27ac
2
1
0
2
1
0
2
1
0Rel
ativ
eEn
richm
ent
2
1
0-3kb TSS TES +3kb
CAST / Xa129 / Xi
0h
12h
24h
72h
Figure 3.7: Xist-mediated depletion of active chromatin modifications from Xi
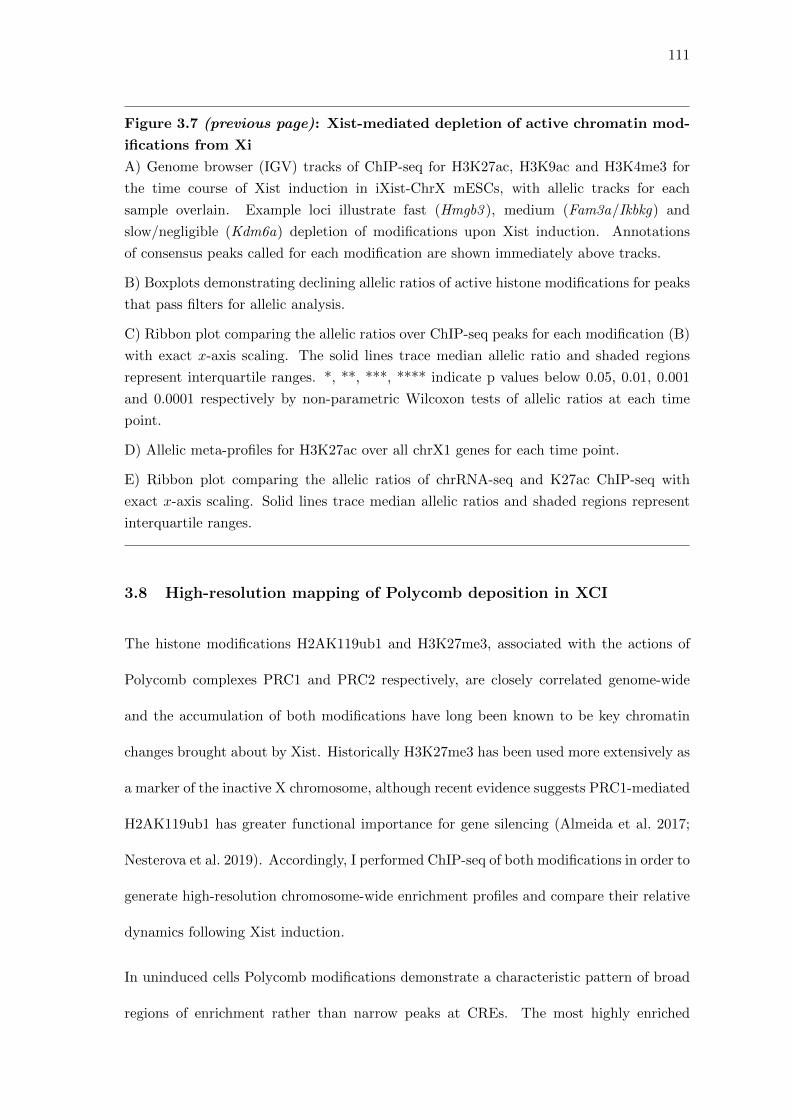
111
Figure 3.7 (previous page): Xist-mediated depletion of active chromatin mod-
ifications from Xi
A) Genome browser (IGV) tracks of ChIP-seq for H3K27ac, H3K9ac and H3K4me3 for
the time course of Xist induction in iXist-ChrX mESCs, with allelic tracks for each
sample overlain. Example loci illustrate fast (Hmgb3 ), medium (Fam3a/Ikbkg) and
slow/negligible (Kdm6a) depletion of modifications upon Xist induction. Annotations
of consensus peaks called for each modification are shown immediately above tracks.
B) Boxplots demonstrating declining allelic ratios of active histone modifications for peaks
that pass filters for allelic analysis.
C) Ribbon plot comparing the allelic ratios over ChIP-seq peaks for each modification (B)
with exact x-axis scaling. The solid lines trace median allelic ratio and shaded regions
represent interquartile ranges. *, **, ***, **** indicate p values below 0.05, 0.01, 0.001
and 0.0001 respectively by non-parametric Wilcoxon tests of allelic ratios at each time
point.
D) Allelic meta-profiles for H3K27ac over all chrX1 genes for each time point.
E) Ribbon plot comparing the allelic ratios of chrRNA-seq and K27ac ChIP-seq with
exact x-axis scaling. Solid lines trace median allelic ratios and shaded regions represent
interquartile ranges.
3.8 High-resolution mapping of Polycomb deposition in XCI
The histone modifications H2AK119ub1 and H3K27me3, associated with the actions of
Polycomb complexes PRC1 and PRC2 respectively, are closely correlated genome-wide
and the accumulation of both modifications have long been known to be key chromatin
changes brought about by Xist. Historically H3K27me3 has been used more extensively as
a marker of the inactive X chromosome, although recent evidence suggests PRC1-mediated
H2AK119ub1 has greater functional importance for gene silencing (Almeida et al. 2017;
Nesterova et al. 2019). Accordingly, I performed ChIP-seq of both modifications in order to
generate high-resolution chromosome-wide enrichment profiles and compare their relative
dynamics following Xist induction.
In uninduced cells Polycomb modifications demonstrate a characteristic pattern of broad
regions of enrichment rather than narrow peaks at CREs. The most highly enriched
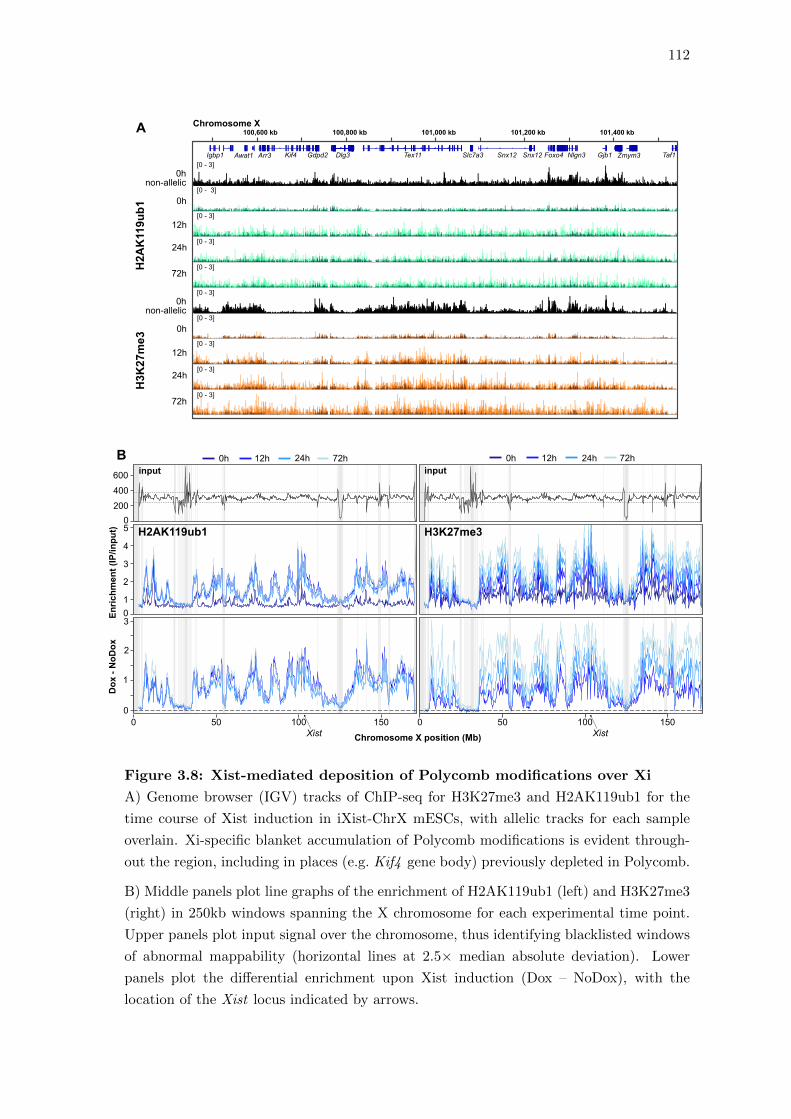
112
Igbp1 Awat1 Arr3 Kif4 Gdpd2 Dlg3 Tex11 Slc7a3 Snx12 Snx12 Foxo4 Nlgn3 Gjb1 Zmym3 Taf1
100,600 kb 100,800 kb 101,000 kb 101,200 kb 101,400 kb
24h
72h
12h
0h
0hnon-allelic
[0 - 3]
[0 - 3]
[0 - 3]
[0 - 3]
[0 - 3]
24h
72h
12h
0h
0hnon-allelic
[0 - 3]
[0 - 3]
[0 - 3]
[0 - 3]
[0 - 3]
H2A
K11
9ub1
H3K
27m
e3Chromosome XA
0h 12h 24h 72h 0h 12h 24h 72h
H2AK119ub1
input input
Enric
hmen
t(IP
/inpu
t)D
ox-N
oDox
Chromosome X position (Mb)Xist Xist
H3K27me3
0 50 100 150 0 50 100 150
01
2
3
0
1
2
3
4
50
200
400
600
B
Figure 3.8: Xist-mediated deposition of Polycomb modifications over Xi
A) Genome browser (IGV) tracks of ChIP-seq for H3K27me3 and H2AK119ub1 for the
time course of Xist induction in iXist-ChrX mESCs, with allelic tracks for each sample
overlain. Xi-specific blanket accumulation of Polycomb modifications is evident through-
out the region, including in places (e.g. Kif4 gene body) previously depleted in Polycomb.
B) Middle panels plot line graphs of the enrichment of H2AK119ub1 (left) and H3K27me3
(right) in 250kb windows spanning the X chromosome for each experimental time point.
Upper panels plot input signal over the chromosome, thus identifying blacklisted windows
of abnormal mappability (horizontal lines at 2.5× median absolute deviation). Lower
panels plot the differential enrichment upon Xist induction (Dox – NoDox), with the
location of the Xist locus indicated by arrows.
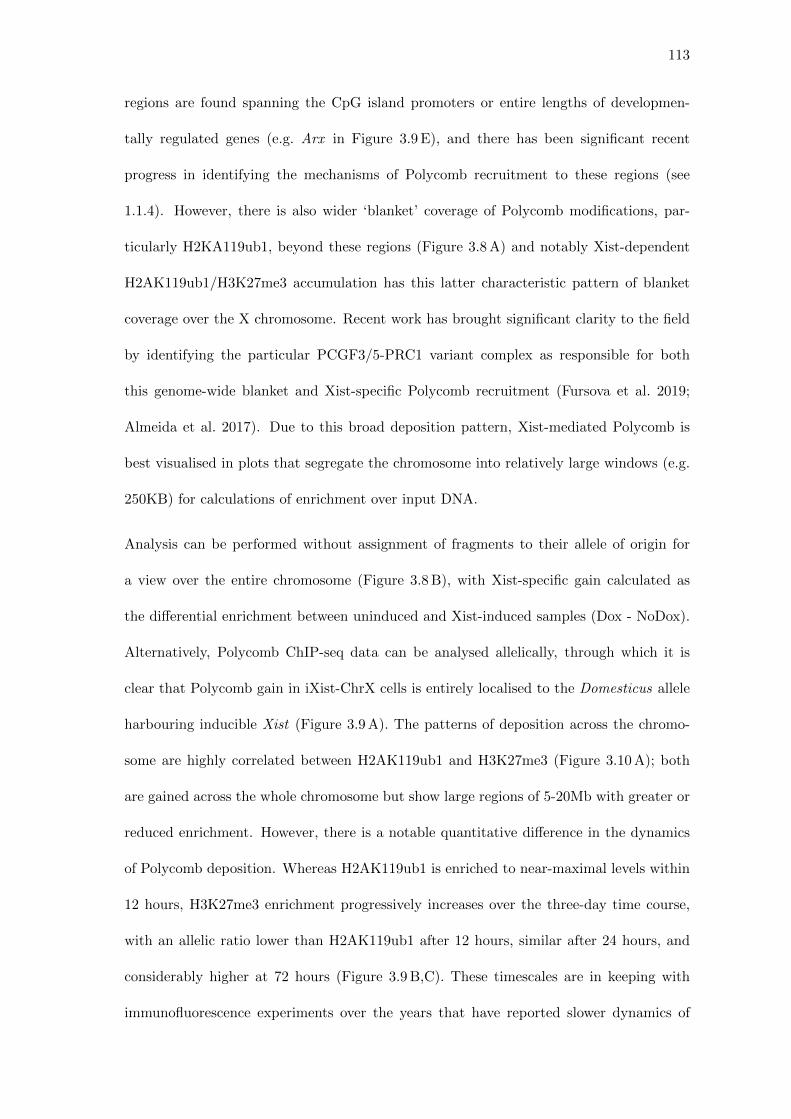
113
regions are found spanning the CpG island promoters or entire lengths of developmen-
tally regulated genes (e.g. Arx in Figure 3.9 E), and there has been significant recent
progress in identifying the mechanisms of Polycomb recruitment to these regions (see
1.1.4). However, there is also wider ‘blanket’ coverage of Polycomb modifications, par-
ticularly H2KA119ub1, beyond these regions (Figure 3.8 A) and notably Xist-dependent
H2AK119ub1/H3K27me3 accumulation has this latter characteristic pattern of blanket
coverage over the X chromosome. Recent work has brought significant clarity to the field
by identifying the particular PCGF3/5-PRC1 variant complex as responsible for both
this genome-wide blanket and Xist-specific Polycomb recruitment (Fursova et al. 2019;
Almeida et al. 2017). Due to this broad deposition pattern, Xist-mediated Polycomb is
best visualised in plots that segregate the chromosome into relatively large windows (e.g.
250KB) for calculations of enrichment over input DNA.
Analysis can be performed without assignment of fragments to their allele of origin for
a view over the entire chromosome (Figure 3.8 B), with Xist-specific gain calculated as
the differential enrichment between uninduced and Xist-induced samples (Dox - NoDox).
Alternatively, Polycomb ChIP-seq data can be analysed allelically, through which it is
clear that Polycomb gain in iXist-ChrX cells is entirely localised to the Domesticus allele
harbouring inducible Xist (Figure 3.9 A). The patterns of deposition across the chromo-
some are highly correlated between H2AK119ub1 and H3K27me3 (Figure 3.10 A); both
are gained across the whole chromosome but show large regions of 5-20Mb with greater or
reduced enrichment. However, there is a notable quantitative difference in the dynamics
of Polycomb deposition. Whereas H2AK119ub1 is enriched to near-maximal levels within
12 hours, H3K27me3 enrichment progressively increases over the three-day time course,
with an allelic ratio lower than H2AK119ub1 after 12 hours, similar after 24 hours, and
considerably higher at 72 hours (Figure 3.9 B,C). These timescales are in keeping with
immunofluorescence experiments over the years that have reported slower dynamics of
114
-3kb TSS TES +3kb
H3K27me3CAST / Xa129 / Xi0.4
0.2
0
0.4
0.2
0
0.4
0.2
0
0.4
0.2
0-3kb TSS TES +3kb
D H2AK119ub1CAST / Xa129 / Xi
0h
2
1
4
0
6
8
12h 24h 72h
H2AK119ub1
AlellicRatio(Xi/Xa
)
AlellicRatio(Xi/Xa
)
B
Enric
hment(IP/input)
0
2
4
0
2
4
6
0
2
4
6
8
0
100
0
100
Allelic
ΔEn
richm
ent
Ainput CAST (Xa)
input 129 (Xi)
input CAST (Xa)
ChIP CAST (Xa)
input 129 (Xi)
ChIP 129 (Xi)
129 - CAST (Xi - Xa)
ChIP CAST (Xa)
ChIP 129 (Xi)
129 - CAST (Xi - Xa)
20 40 60 80 100Chromosome X position (Mb) Xist
20 40 60 80 100Chromosome X position (Mb)
H2AK119ub1 H3K27me3
Xist
24h 72h12h0h 24h 72h12h0h
0h
2
1
4
0
6
8
12h 24h 72h
H3K27me3
Time (h)0 12 24 72
H2AK119ub1H3K27me3
2
1
3
0
4
5
6C
[0 - 0.80]
[0 - 0.40][0 - 0.40]
[0 - 0.40][0 - 0.40]
[0 - 0.40][0 - 0.40]
[0 - 0.40][0 - 0.40]
[0 - 0.80]
[0 - 0.40][0 - 0.40]
[0 - 0.40][0 - 0.40]
[0 - 0.40][0 - 0.40]
[0 - 0.40][0 - 0.40]
Refseq genes
uH2A_0h.chrX1.sort.bw
H2AK119ub1_0h
H2AK119ub1_12h
H2AK119ub1_24h
H2AK119ub1_72h
K27me3_0h.chrX1.sort.bw
K27me3_0h
K27me3_12h
K27me3_24h
K27me3_72h
93,220 kb 93,240 kb 93,260 kb 93,280 kb 93,300 kb 93,320 kb
135 kb
chrX
qA1.1 qA1.2 qA2 qA3.1 qA3.3 qA4 qA5 qA6 qA7.1 qA7.3 qB qC1 qC2 qC3 qD qE1 qE2
AUTO
SCALE
GROUP
[0 - 8]
[0 - 4]
[0 - 4]
CAST (Xa) 129 (Xi)
[0 - 4]
[0 - 4]
[0 - 8]
[0 - 4]
[0 - 4]
[0 - 4]
[0 - 4]
Arx Pola1
24h
72h
12h
0h
0hnon-allelic
H2A
K119ub1
RelativeEn
richm
ent
24h
72h
12h
0h
0hnon-allelic
H3K
27me3
93,300 kb 93,320 kb93,280 kb93,260 kb
EChromosome X
Figure 3.9: Allelic analysis of Xist-dependent gain of Polycomb modifications
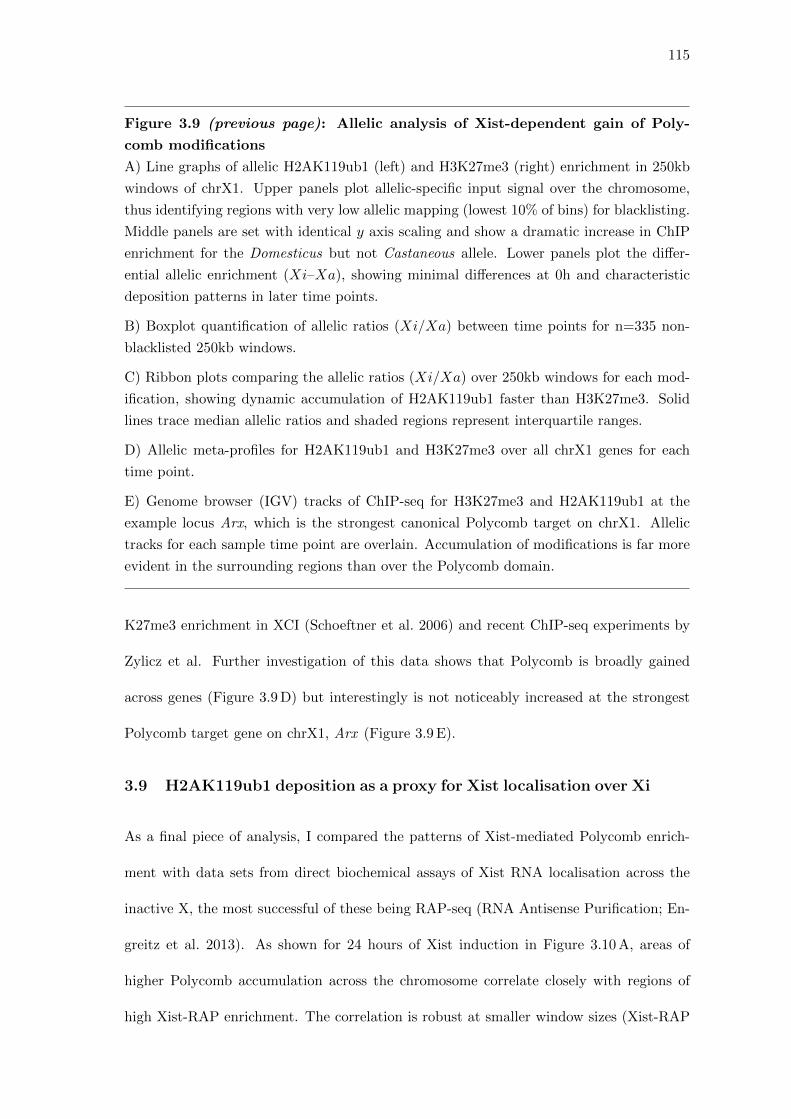
115
Figure 3.9 (previous page): Allelic analysis of Xist-dependent gain of Poly-
comb modifications
A) Line graphs of allelic H2AK119ub1 (left) and H3K27me3 (right) enrichment in 250kb
windows of chrX1. Upper panels plot allelic-specific input signal over the chromosome,
thus identifying regions with very low allelic mapping (lowest 10% of bins) for blacklisting.
Middle panels are set with identical y axis scaling and show a dramatic increase in ChIP
enrichment for the Domesticus but not Castaneous allele. Lower panels plot the differ-
ential allelic enrichment (Xi–Xa), showing minimal differences at 0h and characteristic
deposition patterns in later time points.
B) Boxplot quantification of allelic ratios (Xi/Xa) between time points for n=335 non-
blacklisted 250kb windows.
C) Ribbon plots comparing the allelic ratios (Xi/Xa) over 250kb windows for each mod-
ification, showing dynamic accumulation of H2AK119ub1 faster than H3K27me3. Solid
lines trace median allelic ratios and shaded regions represent interquartile ranges.
D) Allelic meta-profiles for H2AK119ub1 and H3K27me3 over all chrX1 genes for each
time point.
E) Genome browser (IGV) tracks of ChIP-seq for H3K27me3 and H2AK119ub1 at the
example locus Arx, which is the strongest canonical Polycomb target on chrX1. Allelic
tracks for each sample time point are overlain. Accumulation of modifications is far more
evident in the surrounding regions than over the Polycomb domain.
K27me3 enrichment in XCI (Schoeftner et al. 2006) and recent ChIP-seq experiments by
Zylicz et al. Further investigation of this data shows that Polycomb is broadly gained
across genes (Figure 3.9 D) but interestingly is not noticeably increased at the strongest
Polycomb target gene on chrX1, Arx (Figure 3.9 E).
3.9 H2AK119ub1 deposition as a proxy for Xist localisation over Xi
As a final piece of analysis, I compared the patterns of Xist-mediated Polycomb enrich-
ment with data sets from direct biochemical assays of Xist RNA localisation across the
inactive X, the most successful of these being RAP-seq (RNA Antisense Purification; En-
greitz et al. 2013). As shown for 24 hours of Xist induction in Figure 3.10 A, areas of
higher Polycomb accumulation across the chromosome correlate closely with regions of
high Xist-RAP enrichment. The correlation is robust at smaller window sizes (Xist-RAP
116
∼ H2AK119ub1 R=0.69 for 25kb windows, data not shown) suggesting a direct associa-
tion beyond the fact that both techniques broadly mark gene-rich regions. Broad regions
(∼1-10Mb) of enrichment have been labelled as the ‘entry sites’ of Xist RNA, and it has
been proposed that positions of genes relative to these sites determines their silencing
dynamics (Engreitz et al. 2013; Borensztein et al. 2017). Whilst fast-silencing genes do
tend to be found in enriched ‘peaks’, particularly those close to Xist, medium and slow-
silencing genes are also interspersed within these regions, indicating that gene silencing
dynamics are more complex than a distance-dependent relationship with Xist RNA entry
sites.
Given that H2AK119ub1 ChIP shows rapid dynamics of gain over Xi and closely correlates
with the more technically challenging RAP-seq, it can be used as a surrogate for tracking
Xist localisation over the chromosome in this early phase of XCI. As evidence of this,
Figure 3.10 B-D present results from an experiment showing that only 3 hours of Xist in-
duction in iXist-ChrX cells is sufficient for substantial H2AK119ub1 deposition. However,
its pattern differs from later time points, with considerably higher enrichment visible in
regions near to the clear spike of RAP-seq enrichment around the Xist locus compared
to the distant arms of the chromosome (e.g. 5-20Mb). This is presumably reflective of
the processes of Xist spreading away from its transcription site in the Xic, which can be
visualised in microscopy experiments to occur within this timescale of 1-6 hours (Ng et al.
2011; Rodermund et al. 2020), or chromosome-wide compaction of the Xi that occurs over
a couple of days of Xist expression (Smeets et al. 2014; Markaki et al. 2020).
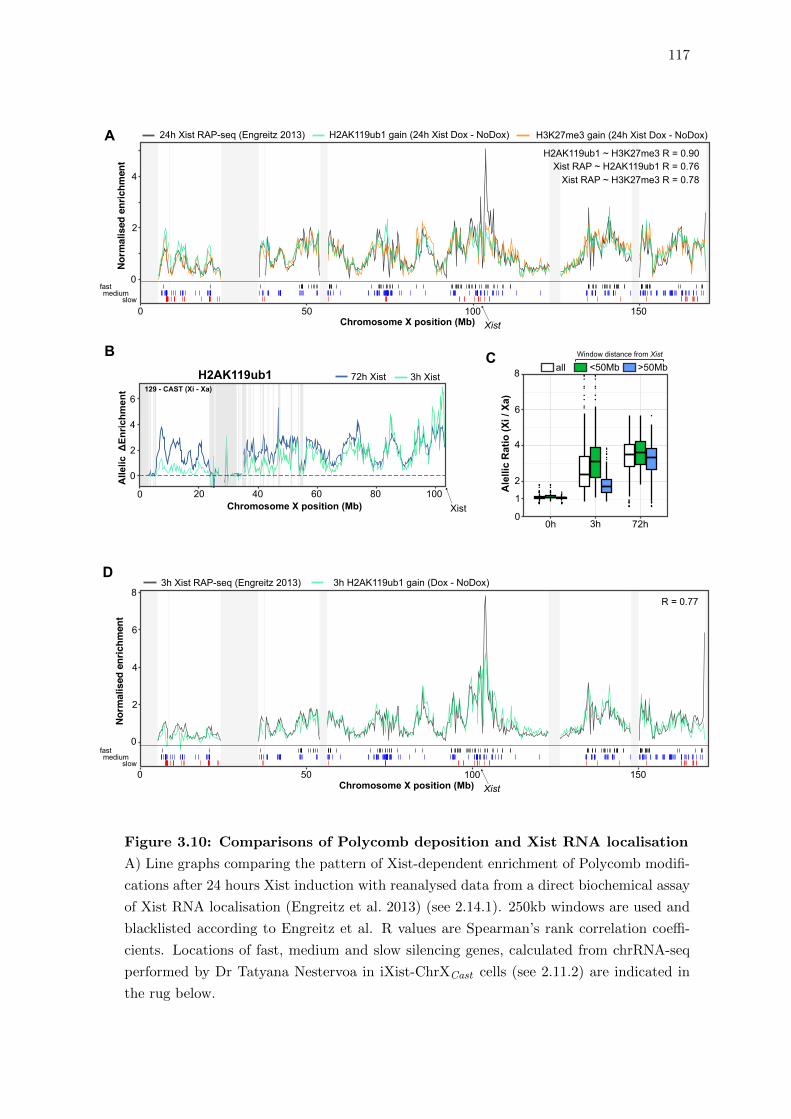
117
fastmedium
slow
0
2
4
6
8
Normalised
enrichm
ent
D
Xist0 50 100 150
3h Xist RAP-seq (Engreitz 2013)
R = 0.77
3h H2AK119ub1 gain (Dox - NoDox)
72h Xist 3h Xist
Chromosome X position (Mb)
0fastmedium
slow
2
4
Normalised
enrichm
ent
A
Xist0 50 100 150
24h Xist RAP-seq (Engreitz 2013) H2AK119ub1 gain (24h Xist Dox - NoDox) H3K27me3 gain (24h Xist Dox - NoDox)
H2AK119ub1 ~ H3K27me3 R = 0.90Xist RAP ~ H2AK119ub1 R = 0.76
Xist RAP ~ H3K27me3 R = 0.78
Chromosome X position (Mb)
0
2
4
6129 - CAST (Xi - Xa)
200 40 60 80 100Chromosome X position (Mb)
H2AK119ub1
Xist
Allelic
ΔEnrichm
ent
2
1
4
00h 3h 72h
6
8
AlellicRatio(Xi/Xa)
CB<50Mb >50Mball
Window distance from Xist
Figure 3.10: Comparisons of Polycomb deposition and Xist RNA localisation
A) Line graphs comparing the pattern of Xist-dependent enrichment of Polycomb modifi-
cations after 24 hours Xist induction with reanalysed data from a direct biochemical assay
of Xist RNA localisation (Engreitz et al. 2013) (see 2.14.1). 250kb windows are used and
blacklisted according to Engreitz et al. R values are Spearman’s rank correlation coeffi-
cients. Locations of fast, medium and slow silencing genes, calculated from chrRNA-seq
performed by Dr Tatyana Nestervoa in iXist-ChrXCast cells (see 2.11.2) are indicated in
the rug below.
118
Figure 3.10 (previous page): Comparisons of Polycomb deposition and Xist
RNA localisation
B) Line graph comparing the pattern of differential allelic enrichment (Xi–Xa) over 250kb
windows of chrX1 for samples of H2AK19ub1 ChIP-seq collected 3 and 72 hours post Xist
induction.
C) Boxplot quantification of H2AK119ub1 allelic ratios (Xi/Xa) at 0, 3 and 72 hours of
Xist induction. White boxes are comprised of all non-blacklisted 250kb windows (n=335).
Green and blue boxes represent windows nearer to (<50Mb, n=195) and further from Xist
(>50Mb, n=140) respectively to illustrate incomplete spreading of Xist RNA away from
the Xic after 3 hours.
D) Line graphs comparing the pattern of Xist-dependent enrichment of H2AK119ub1
after 3 hours induction with reanalysed RAP-seq data from the same time point. 250kb
windows are used and blacklisted according to Engreitz et al. R values are Spearman’s
rank correlation coefficients. Locations of fast, medium and slow silencing genes in iXist-
ChrXCast cells (see 2.11.2) are indicated in the rug below.
3.10 Discussion
This chapter characterises many of the important changes to cis-regulatory elements
(CREs) and chromatin as chromosome-wide gene silencing is established following Xist in-
duction. Using the highly sensitive chrRNA-seq method I set a baseline for gene silencing
upon Xist induction in mESCs against which the effects of various genetic perturbations
can be compared in order to precisely assess the relative contributions of different molec-
ular pathways involved in XCI (Chapter 5 and Chapter 6). I then investigated how the
dynamics of silencing relate to changes to the cis-regulatory landscape surrounding genes,
as measured by the ATAC assay for accessible chromatin. Loss of chromatin accessibil-
ity from most CREs on Xi is an early event of XCI, but demonstrates slower dynamics
than transcriptional silencing, suggesting it may be secondary to the processes driving
chromosome inactivation.
To delve further into this decrease in accessibility of CREs on the inactive X, I turned my
attention to the role of transcription factors as TF-DNA binding is a key characteristic
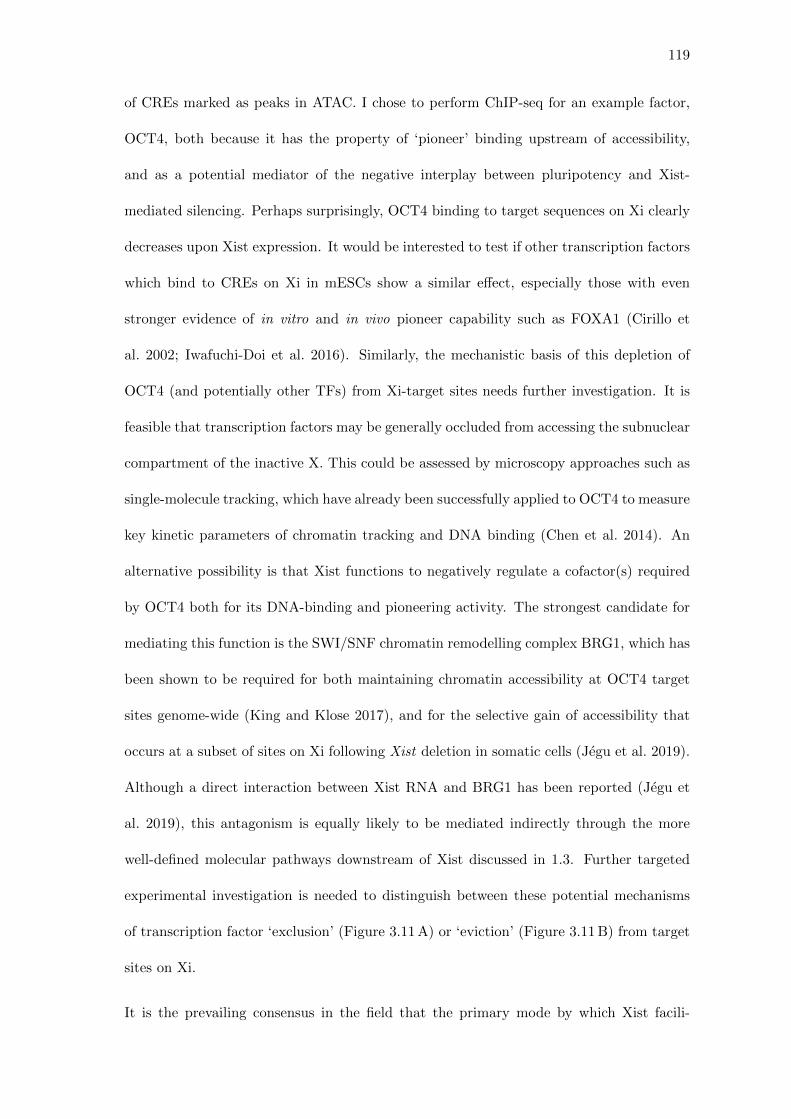
119
of CREs marked as peaks in ATAC. I chose to perform ChIP-seq for an example factor,
OCT4, both because it has the property of ‘pioneer’ binding upstream of accessibility,
and as a potential mediator of the negative interplay between pluripotency and Xist-
mediated silencing. Perhaps surprisingly, OCT4 binding to target sequences on Xi clearly
decreases upon Xist expression. It would be interested to test if other transcription factors
which bind to CREs on Xi in mESCs show a similar effect, especially those with even
stronger evidence of in vitro and in vivo pioneer capability such as FOXA1 (Cirillo et
al. 2002; Iwafuchi-Doi et al. 2016). Similarly, the mechanistic basis of this depletion of
OCT4 (and potentially other TFs) from Xi-target sites needs further investigation. It is
feasible that transcription factors may be generally occluded from accessing the subnuclear
compartment of the inactive X. This could be assessed by microscopy approaches such as
single-molecule tracking, which have already been successfully applied to OCT4 to measure
key kinetic parameters of chromatin tracking and DNA binding (Chen et al. 2014). An
alternative possibility is that Xist functions to negatively regulate a cofactor(s) required
by OCT4 both for its DNA-binding and pioneering activity. The strongest candidate for
mediating this function is the SWI/SNF chromatin remodelling complex BRG1, which has
been shown to be required for both maintaining chromatin accessibility at OCT4 target
sites genome-wide (King and Klose 2017), and for the selective gain of accessibility that
occurs at a subset of sites on Xi following Xist deletion in somatic cells (Jegu et al. 2019).
Although a direct interaction between Xist RNA and BRG1 has been reported (Jegu et
al. 2019), this antagonism is equally likely to be mediated indirectly through the more
well-defined molecular pathways downstream of Xist discussed in 1.3. Further targeted
experimental investigation is needed to distinguish between these potential mechanisms
of transcription factor ‘exclusion’ (Figure 3.11 A) or ‘eviction’ (Figure 3.11 B) from target
sites on Xi.
It is the prevailing consensus in the field that the primary mode by which Xist facili-
120
OCT4 OCT4 BRG1
(a)
(b)
Xist RNA
Xist corepressor
Xa
XiXist
A B
Figure 3.11: Models of Xist action on transcription factors
A) Exclusion model: impaired diffusion of transcription factors into or through the Xi
subnuclear territory leads to reduced binding at target sites.
B) Eviction model: Xist may directly (a), or indirectly through chromatin-based mecha-
nisms (b) antagonise the functions of coactivator complexes such as the remodeler BRG1,
which is necessary for OCT4 pioneer activity.
tates inactivation is through pathways modifying the chromatin of the X chromosome,
rather than by disruption to transcription factors or direct inhibition of RNA PolII tran-
scription. Therefore, in characterising Xist-mediated changes during XCI establishment I
profiled a number of post-translational histone modifications typical of both active chro-
matin and facultative repression. Many of my findings are in close agreement with those
published by Zylicz et al., such as the observation that out of all scrutinised modifications
only H3K27ac is depleted from Xi with the same dynamics as gene silencing. This can
be taken as evidence supporting the direct functional importance of active deacetylation
downstream of Xist, which has been widely proposed as key to the SPEN-NCOR-HDAC3
axis (McHugh et al. 2015; Zylicz et al. 2019). However, this evidence is essentially descrip-
tive, and therefore unable to properly distinguish which changes to chromatin are causally
important for gene silencing from modifications that merely correlate with transcription
or other processes affected by Xist function. Similar questions of causality or consequence
have permeated throughout the chromatin field since its origins amid the excitement sur-
rounding a potential ‘histone code’ analogous to genetic information (1.1.3). In actuality,
121
this experimental model has many advantageous properties for disentangling these sorts of
issues, as it is a tightly controllable inducible system where significant changes occur to a
very well-defined region and set of target genes (i.e. the X chromosome). However, experi-
mental manipulation of chromatin-modifying pathways of the kind discussed in Chapter 5
and Chapter 6 are needed to address these questions.
In a similar vein, it may also be possible to use this model system to investigate to extent
to which different chromatin modifications influence CRE accessibility (as measured by
ATAC-seq) or the binding of transcription factors to their target sites, and consequently
transcriptional activity. Whilst a full analysis of this interplay exceeds the scope this thesis,
it may have wide-reaching ramifications for our understanding of respective functions of
each of these players in gene regulation.
The final experiments discussed in this chapter mapped in high resolution the chromosomal
pattern of Polycomb modification deposition following Xist induction. These experiments
clearly reveal that Xi-specific Polycomb gain takes the form of ‘blanket’ coverage over large
chromatin regions, and that PRC1 and PRC2 show distinct dynamics, as H2AK119ub1
is quantitatively enriched over Xi faster than H3K27me3. These observations provide
supplementary evidence of the mechanistic separation between Xist-dependent Polycomb
recruitment mediated by PCGF3/5-PRC1 and other pathways that recruit Polycomb com-
plexes to sites elsewhere in the genome. This is important in the context of the historical
debate regarding the order and mechanism of Polycomb recruitment by Xist, which is
covered in more detail in 1.3.4 and 5.10.
Finally, this quantitative and high-resolution mapping of Polycomb modifications on Xi
has additional advantages. First, it resulted in the key observation that Xi-specific
H2AK119ub1 ChIP-seq enrichment closely correlates with biochemical methods used to
directly measure Xist localisation, both temporarily and by its spatial pattern over the

122
chromosome. Secondly, it enables precise comparisons with mutants that have subtle
effects on Xist-mediated Polycomb deposition that could not previously be seen by im-
munofluorescence. As discussed in Chapters 5 and 6, these two points combined enable
the discovery of novel roles for Xist-silencing factors in Xist RNA localisation, and fur-
thermore lead to mechanistic insights into how Polycomb modifications function to affect
gene repression.
Chapter 4
Determinants of gene silencing kinetics and hetero-
geneity during XCI
4.1 Introduction
It is well established that Xist-mediated silencing is highly variable across X-linked genes;
some genes silence rapidly upon Xist expression, others more slowly, and a subset of 3-
7% of genes ‘escape’ from complete inactivation to remain expressed from Xi in somatic
mouse cells (Yang et al. 2010). RNA sequencing experiments performed in a variety
of experimental systems have been used to classify genes according to the efficiency by
which they are silenced by Xist. These have included models such as mESCs with Xist
inducible from various locations on either chrX and autosomes (Barros De Andrade e
Sousa et al. 2019; Loda et al. 2017; Nesterova et al. 2019), non-random Xist expression
during mESC differentiation to embryoid bodies (Lin et al. 2007; Marks et al. 2015),
and imprinted XCI during pre-implantation mouse development (Borensztein et al. 2017).
Broadly, these studies agree on general trends, for example that more rapid silencing occurs
for relatively low-expressed genes or genes closer to the Xist locus, and that escape genes
tend to cluster in particular gene-dense chromosomal compartments. Other studies have
previously suggested that LINE-1 elements may act as ‘booster elements’ for Xist activity
and contribute to the greater efficiency of gene silencing on chrX compared to autosomes
(Lyon 2000; Chow et al. 2010; Tang et al. 2010). However, each study is associated with
caveats either in terms of sequencing depth (and thus how many genes could be analysed)
123
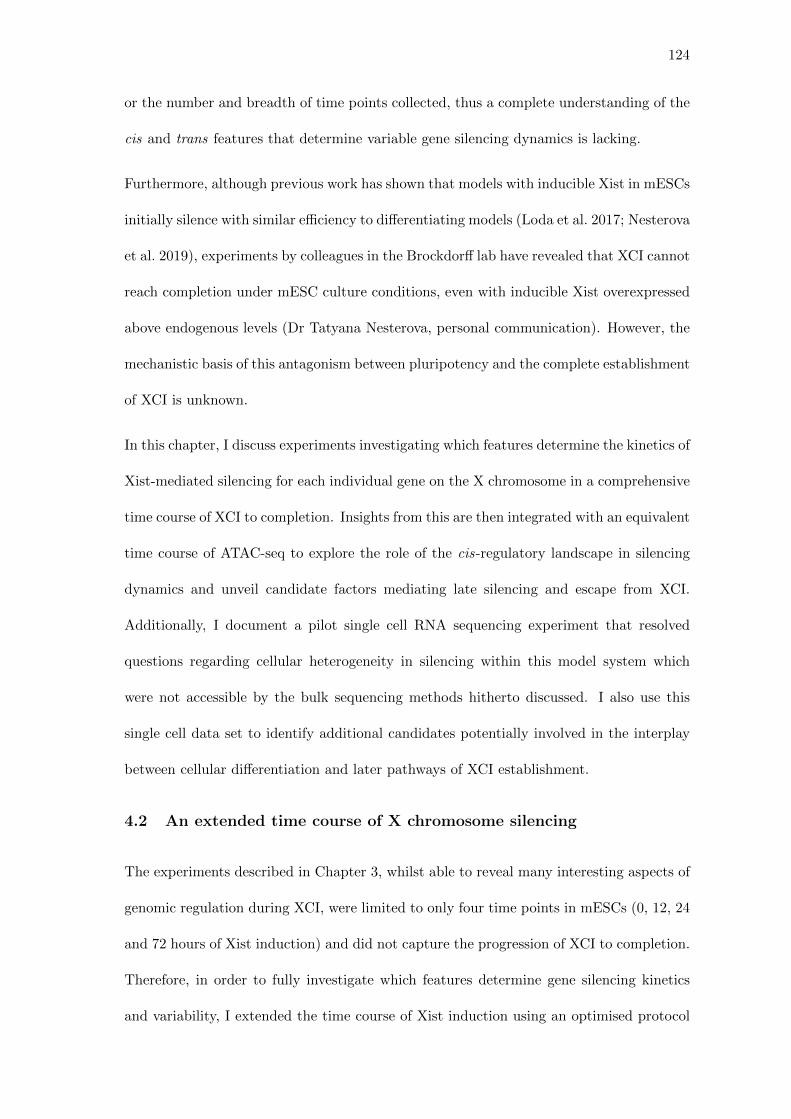
124
or the number and breadth of time points collected, thus a complete understanding of the
cis and trans features that determine variable gene silencing dynamics is lacking.
Furthermore, although previous work has shown that models with inducible Xist in mESCs
initially silence with similar efficiency to differentiating models (Loda et al. 2017; Nesterova
et al. 2019), experiments by colleagues in the Brockdorff lab have revealed that XCI cannot
reach completion under mESC culture conditions, even with inducible Xist overexpressed
above endogenous levels (Dr Tatyana Nesterova, personal communication). However, the
mechanistic basis of this antagonism between pluripotency and the complete establishment
of XCI is unknown.
In this chapter, I discuss experiments investigating which features determine the kinetics of
Xist-mediated silencing for each individual gene on the X chromosome in a comprehensive
time course of XCI to completion. Insights from this are then integrated with an equivalent
time course of ATAC-seq to explore the role of the cis-regulatory landscape in silencing
dynamics and unveil candidate factors mediating late silencing and escape from XCI.
Additionally, I document a pilot single cell RNA sequencing experiment that resolved
questions regarding cellular heterogeneity in silencing within this model system which
were not accessible by the bulk sequencing methods hitherto discussed. I also use this
single cell data set to identify additional candidates potentially involved in the interplay
between cellular differentiation and later pathways of XCI establishment.
4.2 An extended time course of X chromosome silencing
The experiments described in Chapter 3, whilst able to reveal many interesting aspects of
genomic regulation during XCI, were limited to only four time points in mESCs (0, 12, 24
and 72 hours of Xist induction) and did not capture the progression of XCI to completion.
Therefore, in order to fully investigate which features determine gene silencing kinetics
and variability, I extended the time course of Xist induction using an optimised protocol
125
Re-attach Neural ProgenitorCells (NPCs)
Release to formEB-like Aggregates
15-21d
6d
3d
2d
1d
Dox
Dox
Dox
Dox
Dox
N2B27 media(no LIF) FGF/EGF
(day 7) (day 10)
1.5h
3h
6hMouse Embryonic
Stem Cells(mESCs)
0h
12h
24h
72h
Dox
Dox
Dox
Dox
Dox
Dox
A
Figure 4.1: Schematic of the extended experimental time course in iXist-ChrX
cells
The time course was extended in both directions to include samples from ’immediate’
time points of Xist induction in mESCs (upper box) and experiments performed using an
optimised protocol for ES to NPC differentiation (lower box). Relative lengths of lines
and positions of arrows reflect the experimental design and cell culture timings.
for the derivation of a homogeneous population of neuronal precursor cells (NPCs) over
approximately 2 weeks (Figure 4.1, lower panel). On day 0 of the protocol iXist-ChrX
mESCs are thoroughly separated from feeder cells and plated at low density in serum-free
N2B27 media supplemented with doxycycline (added to induce Xist). After 7 days of
126
growth as a monolayer, cells are released into suspension to form Embryoid Body (EB)-
like aggregates, and epidermal and fibroblast growth factors (EGF and FGF) are added
to the media in order to bias cellular differentiation towards neural progenitor lineages.
After three further days, these spherical aggregates are allowed to reattach to plates and
seed the outgrowth of a homogeneous layer of NPCs. Non-neuronal cells detach as they
arrest and die which allows for their clearance from the population upon media changes.
Due to the specifics of this protocol, sample collection is most practical and reliable when
cells are growing as homogeneous monolayers, namely between days 2 and 6 and after day
15.
In addition to my own chrRNA-seq data sets from this NPC protocol, I incorporated a
number of samples collected by other members of the lab using the same cells (iXist-ChrX)
and induction concentration (1µg/ml doxycyline). These took the form of two replicates
of an ‘immediate’ time course of Xist induction in ES cells (1.5, 3 and 6 hours) performed
by Dr Tianyi Zhang (Figure 4.1, upper panel), and additional samples from the ES-to-
NPC protocol collected by Dr Tatyana Nesterova. In total, 24 samples of chrRNA-seq
spanning 10 time points of Xist induction form a data set for the analysis of the kinetics
of Xist-mediated gene silencing more comprehensive than any previously published.
4.3 The overall trajectory of silencing in iXist-ChrX cells
Figure 4.2 A presents boxplots of merged replicates from all time points in the extended
time course. There is already a minor skew in allelic ratio after just 90 minutes of Xist
induction, indicating that the absolute delay before gene silencing initiates (for example
while Xist RNA is transcribed and released from the Xic) is very short. Silencing pro-
gresses over each subsequent time point, and under NPC differentiation conditions the
median allelic ratio falls to 0.07 after 6 days. There is no further decrease in NPCs beyond
day 15 (data from >21 days not shown) and so this can be considered an ‘end-point’
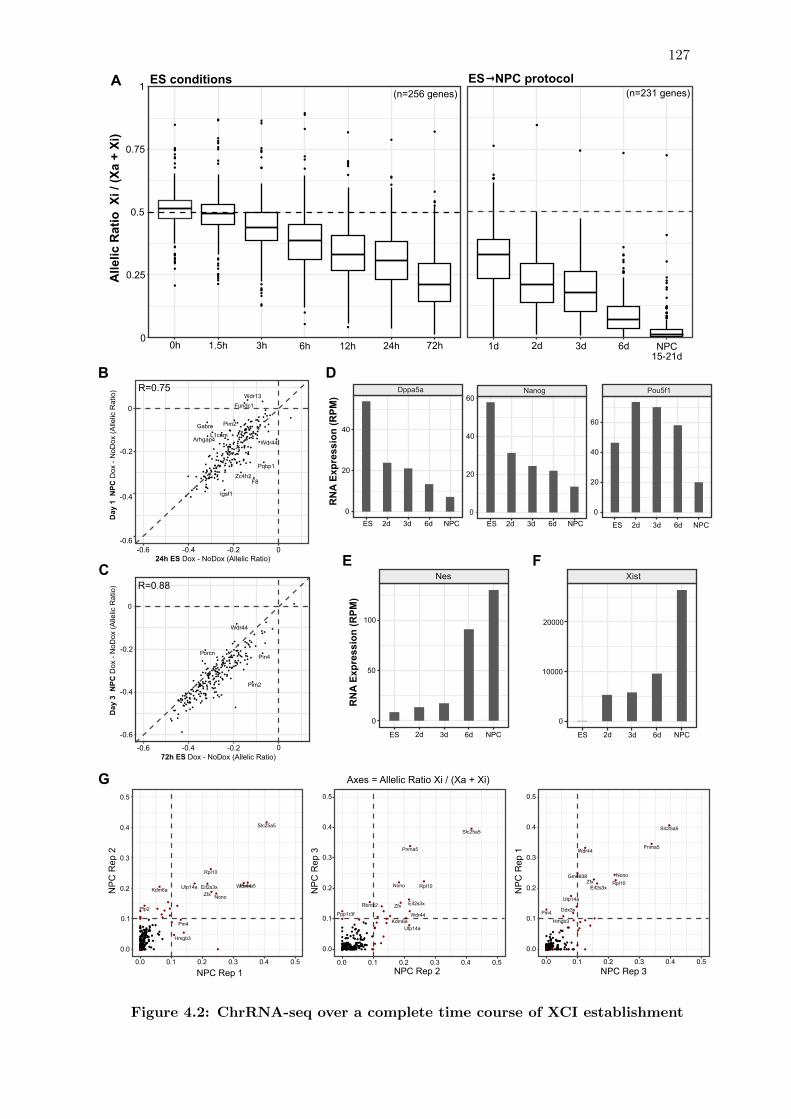
127
Ddx3x
Gm6938
Wdr44
Slc25a5
Utp14a
Hmgb3
Pnma5
Rpl10ZfxEif2s3x
Nono
Pin4
0.0
0.1
0.2
0.3
0.4
0.5
0.0 0.1 0.2 0.3 0.4 0.5NPC Rep 3
NPC
Rep
1
Ppp1r3fKdm6a
Wdr44
Slc25a5
Utp14a
Rbmx2
Pnma5
Rpl10
Zfx Eif2s3x
Nono
0.0
0.1
0.2
0.3
0.4
0.5
0.0 0.1 0.2 0.3 0.4 0.5NPC Rep 2
NP
CR
ep3
Axes = Allelic Ratio Xi / (Xa + Xi)
RNAExpression
(RPM
)
RNAExpression
(RPM
)
NP
CR
ep2
0.0
0.1
0.2
0.3
0.4
0.5
0.0 0.1 0.2 0.3 0.4 0.5
NPC Rep 1
Plp2
Kdm6aWdr44
Slc25a5
Utp14a
Hmgb3
Pnma5
Rpl10
ZfxEif2s3x
Nono
Pin4
G
Pou5f1
Xist
Dppa5a Nanog
Nes
0
50
100
ES 2d 3d 6d NPC ES 2d 3d 6d NPC
20000
10000
0
0
20
40
60
0
20
40
0
20
40
60
ES 2d 3d 6d NPCES 2d 3d 6d NPC ES 2d 3d 6d NPC
Arhgap4
F8
Fundc1
Gabre
Igsf1
L1cam
Pim2
Pqbp1
Wdr13
Wdr44
Zc4h2
-0.6
-0.4
-0.2
0
-0.6 -0.4 -0.2 024h ES Dox - NoDox (Allelic Ratio)
72h ES Dox - NoDox (Allelic Ratio)
ES NPC protocol
-0.6 -0.4 -0.2 0
Day1NPC
Dox
-NoD
ox(A
llelic
Rat
io)
Day3NPC
Dox
-NoD
ox(A
llelic
Rat
io)
-0.6
-0.4
-0.2
0
Pim2
Pin4Porcn
Wdr44
B
C
D
FER=0.88
R=0.75
0.25
0.5
0
0.75
1
AllelicRatio
Xi/(Xa
+Xi)
0h 1.5h 3h 6h 12h 24h 72h
(n=256 genes)
1d 2d 3d 6d NPC15-21d
(n=231 genes)A ES conditions
Figure 4.2: ChrRNA-seq over a complete time course of XCI establishment
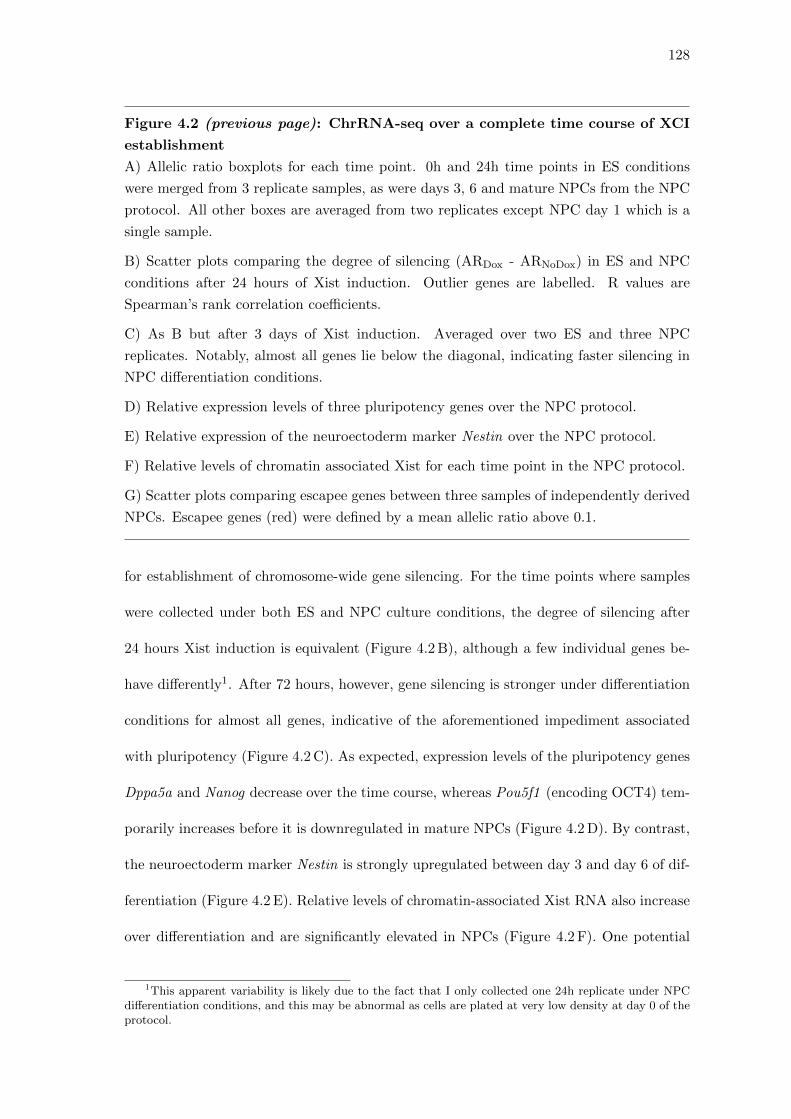
128
Figure 4.2 (previous page): ChrRNA-seq over a complete time course of XCI
establishment
A) Allelic ratio boxplots for each time point. 0h and 24h time points in ES conditions
were merged from 3 replicate samples, as were days 3, 6 and mature NPCs from the NPC
protocol. All other boxes are averaged from two replicates except NPC day 1 which is a
single sample.
B) Scatter plots comparing the degree of silencing (ARDox - ARNoDox) in ES and NPC
conditions after 24 hours of Xist induction. Outlier genes are labelled. R values are
Spearman’s rank correlation coefficients.
C) As B but after 3 days of Xist induction. Averaged over two ES and three NPC
replicates. Notably, almost all genes lie below the diagonal, indicating faster silencing in
NPC differentiation conditions.
D) Relative expression levels of three pluripotency genes over the NPC protocol.
E) Relative expression of the neuroectoderm marker Nestin over the NPC protocol.
F) Relative levels of chromatin associated Xist for each time point in the NPC protocol.
G) Scatter plots comparing escapee genes between three samples of independently derived
NPCs. Escapee genes (red) were defined by a mean allelic ratio above 0.1.
for establishment of chromosome-wide gene silencing. For the time points where samples
were collected under both ES and NPC culture conditions, the degree of silencing after
24 hours Xist induction is equivalent (Figure 4.2 B), although a few individual genes be-
have differently1. After 72 hours, however, gene silencing is stronger under differentiation
conditions for almost all genes, indicative of the aforementioned impediment associated
with pluripotency (Figure 4.2 C). As expected, expression levels of the pluripotency genes
Dppa5a and Nanog decrease over the time course, whereas Pou5f1 (encoding OCT4) tem-
porarily increases before it is downregulated in mature NPCs (Figure 4.2 D). By contrast,
the neuroectoderm marker Nestin is strongly upregulated between day 3 and day 6 of dif-
ferentiation (Figure 4.2 E). Relative levels of chromatin-associated Xist RNA also increase
over differentiation and are significantly elevated in NPCs (Figure 4.2 F). One potential
1This apparent variability is likely due to the fact that I only collected one 24h replicate under NPCdifferentiation conditions, and this may be abnormal as cells are plated at very low density at day 0 of theprotocol.
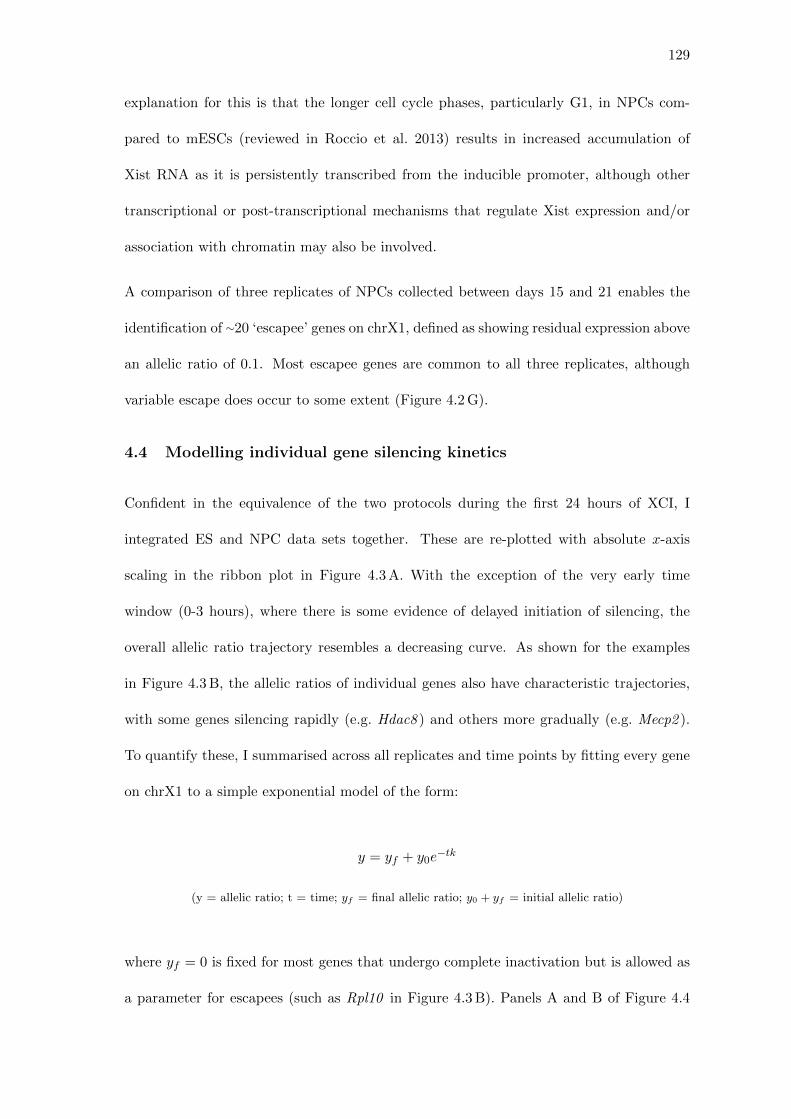
129
explanation for this is that the longer cell cycle phases, particularly G1, in NPCs com-
pared to mESCs (reviewed in Roccio et al. 2013) results in increased accumulation of
Xist RNA as it is persistently transcribed from the inducible promoter, although other
transcriptional or post-transcriptional mechanisms that regulate Xist expression and/or
association with chromatin may also be involved.
A comparison of three replicates of NPCs collected between days 15 and 21 enables the
identification of ∼20 ‘escapee’ genes on chrX1, defined as showing residual expression above
an allelic ratio of 0.1. Most escapee genes are common to all three replicates, although
variable escape does occur to some extent (Figure 4.2 G).
4.4 Modelling individual gene silencing kinetics
Confident in the equivalence of the two protocols during the first 24 hours of XCI, I
integrated ES and NPC data sets together. These are re-plotted with absolute x-axis
scaling in the ribbon plot in Figure 4.3 A. With the exception of the very early time
window (0-3 hours), where there is some evidence of delayed initiation of silencing, the
overall allelic ratio trajectory resembles a decreasing curve. As shown for the examples
in Figure 4.3 B, the allelic ratios of individual genes also have characteristic trajectories,
with some genes silencing rapidly (e.g. Hdac8 ) and others more gradually (e.g. Mecp2 ).
To quantify these, I summarised across all replicates and time points by fitting every gene
on chrX1 to a simple exponential model of the form:
y = yf + y0e−tk
(y = allelic ratio; t = time; yf = final allelic ratio; y0 + yf = initial allelic ratio)
where yf = 0 is fixed for most genes that undergo complete inactivation but is allowed as
a parameter for escapees (such as Rpl10 in Figure 4.3 B). Panels A and B of Figure 4.4
130
0
0.1
0.2
0.3
0.4
0.5
0
0.6
100 20050 400Xist Induction (h)
AllelicRatioXi/(Xa
+Xi)
A
0.3
0.4
0.5
0 3 61.5 12
0 100Xist Induction (h)
Xist Induction (h)
AllelicRatioXi/(Xa
+Xi)
AllelicRatioXi/(Xa
+Xi)
200 300 400 500 0 100 200 300 400 500
0
0
0.2
0.4
0.6
0.8
100 200 300 400 5000 100 200 300 400 500 0 100 200 300 400 500
Mecp2Med12
Hmgb3
Hdac8
Rpl10
0
0.2
0.4
0.6
0.8B
Figure 4.3: Overall and single-gene trajectories of gene silencing
131
Figure 4.3 (previous page): Overall and single-gene trajectories of gene silenc-
ing
A) Ribbon plot of data from Figure 4.2 A with exact x-axis scaling. The shaded regions
represent interquartile ranges. The inset amplifies the first 12 hours of the time course.
B) Trajectories of allelic ratio decreases for individual example genes. Hdac3, Med12
and Mecp2 are fast, medium, and slow silencing respectively. Rpl10 and Hmgb3 are two
examples of escapees with different early silencing dynamics. Red curves illustrate the fit
of an exponential decay curve to each gene. Horizontal lines represent parameters of y0,
y0/2 and yf respectively, and the vertical line is placed at the computed halftime for each
gene.
summarise the quality of fit of the model to the real chrRNA-seq data. Residuals between
real and fitted values were relatively low overall – with 93% less than 0.1 – but were not
completely random and the model consistently under-fitted early time points between 0
and 3 hours, presumably due to the aforementioned initiation delay.
A major utility of this model it that it is possible to extract a ‘Silencing Halftime’ (t1/2)
for almost all chrX genes2, which can be used to summarise the silencing rate of each
individual gene. This is defined as the time taken for the allelic ratio of a gene to decrease
to half its initial value and is given by the solution to the above expression for the condition
where y = 12(y0 + yf ):
yf + y0e−t1/2k =
1
2(y0 + yf )
e−t1/2k =12(y0 + yf ) − yf
y0
t1/2 = −1
kln(
12(y0 + yf ) − yf
y0)
Importantly, there is minimal bias in the residuals in the vicinity of 12(y0 + yf ) so half-
times are typically good fits to the empirical data (Figure 4.4 A). Figure 4.4 C shows the
extent of gene-gene variability in silencing dynamics by a density plot of halftimes. This
2The exceptions to this were the particularly strong escapee Slc25a5, and Dynlt3, which had a skewedallelic ratio >0.7 throughout the time course
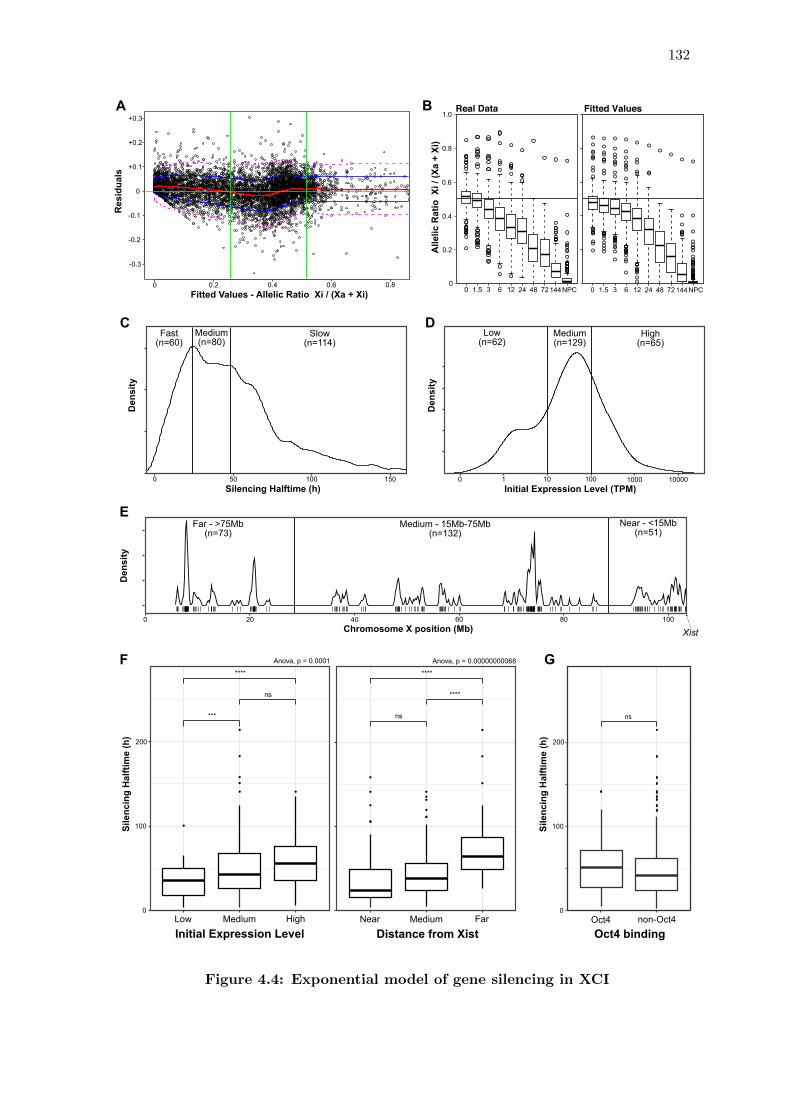
132
0.2 0.4 0.6 0.80
0
+0.1
-0.1
-0.2
-0.3
+0.2
+0.3
Fitted Values - Allelic Ratio Xi / (Xa + Xi)
Silencing Halftime (h)
Silenc
ingHalftime(h)
Den
sity
Den
sity
Den
sity
Initial Expression Level (TPM)
Res
idua
ls
0
0.2
0.4
0.6
0.8
1.0
Alle
licRatio
Xi/(Xa
+Xi)
0 1.5 3 6 12 24 48 72144NPC 0 1.5 3 6 12 24 48 72144NPC
0
0 20 40 60 80 100
50 100 150
100
200
0
Silenc
ingHalftime(h)
100
200
0
0 1 10010 1000 10000
Low(n=62)
Medium(n=129)
High(n=65)
Fast(n=60)
Medium(n=80)
Slow(n=114)
Chromosome X position (Mb)
****
***
ns
Anova, p = 0.0001
Initial Expression LevelLow Medium High
ns
Oct4 non-Oct4
****
****
ns
Anova, p = 0.00000000068
Distance from Xist Oct4 bindingNear Medium Far
Near - <15Mb(n=51)
Medium - 15Mb-75Mb(n=132)
Far - >75Mb(n=73)
Xist
Real Data Fitted ValuesA B
C D
E
F G
Figure 4.4: Exponential model of gene silencing in XCI
133
Figure 4.4 (previous page): Exponential model of gene silencing in XCI
A) Scatter plot of residuals from exponential model fitting of chrRNA-seq data. The red,
blue, and dashed purple lines represent the rolling average of the median, interquartile
ranges and 90th percentiles of residuals respectively. Vertical green dashed lines are placed
at 0.5 and 0.25 to allow for estimation of residuals in the expected range for t1/2 values.
B) Boxplots comparing the real input data with the fitted output values of the exponential
model.
C) Density plot of gene silencing halftimes generated by the exponential model, allowing
for categorisation of fast, medium and slow-silencing genes by thresholds set at 24 and 48
hours.
D) Density plot of initial expression levels of the 256 X-linked genes on chrX1 that pass
allelic filters for inclusion in the model. Low, medium and high-expressed genes are defined
by thresholds of 10 and 100 transcripts per million (TPM). Data taken from two replicates
of mRNA-seq in iXist-ChrX cells performed by Dr Tatyana Nesterova.
E) Density plot illustrating the locations of genes in clusters along the chrX1 region and
categorisation as near, medium or far from Xist.
F) Boxplots comparing silencing halftimes between subsets of genes based on expression
level or distance from Xist. Significance of individual comparisons is determined by Welch’s
unequal variances T-test. *, **, ***, **** indicate p values below 0.05, 0.01, 0.001 and
0.0001 respectively. Overall significance of trend is calculated by a one-way ANOVA test.
G) Boxplots comparing silencing halftimes of OCT4 target genes (binding site <5kb from
TSS, n=66) and non-targets (n=179).
ranking enabled classification of genes as ‘fast silencing’ (t1/2 < 24 hours, n=60), ‘medium
silencing’ (24 < t1/2 < 48 hours, n=80) or ‘slow silencing’ (t1/2 > 48 hours, n=114).
I then investigated how some key properties of genes may determine fast or slow silenc-
ing dynamics. Genes were subdivided by their initial expression level (Figure 4.4 D) and
distance from the Xist locus on chrX1 (Figure 4.4 E). Indeed, there are significant dif-
ferences in halftimes between subsets based on these features (Figure 4.4 F). Low and
medium expressed genes are typically faster to silence, whereas genes furthest from Xist
(median t1/2 = 63.8) silence on average almost three times slower than those in clusters
closest to the Xist locus (median t1/2 = 23.1). Both of these features are known to be
associated with silencing (Marks et al. 2015) and rank highly in recent machine learning
134
approaches weighting the importance of different candidate features (Barros De Andrade
e Sousa et al. 2019; Nesterova et al. 2019). However, these two features alone cannot
fully explain gene-by-gene differences in silencing as there are numerous examples of slow
silencing genes positioned close to Xist (e.g. Ogt, Pin4 ) or highly expressed genes silencing
relatively quickly (e.g. Slc7a3 ). Given the known importance of cis-regulatory elements
in context-specific regulation of gene expression, I hypothesised that hitherto-overlooked
features of the cis-regulatory landscape may affect variable gene silencing dynamics in X
chromosome inactivation. As pluripotency is associated with impeded silencing, OCT4 was
one plausible candidate factor mediating this resistance to silencing. However, putative
OCT4-target genes do not silence significantly slower than other genes (Figure 4.4 G). This
is in keeping with the results presented in 3.5 showing efficient eviction of OCT4-binding
from target sequences on the Xi following Xist expression.
4.5 Heterogeneous dynamics of CRE accessibility loss
In order to produce a comprehensive view of Xist-mediated changes to the cis-regulatory
landscape and search for features mediating late silencing or escape of particular genes, I
turned again to the ATAC assay. I performed two replicates of ATAC-seq for each of four
time points in the NPC differentiation protocol (days 1, 3, 6 and 17) and generated data of
higher quality than experiments in mESCs (mean TSSE score = 17.0 compared to 5.1, see
Table 2.8). As shown in some of the examples in Figure 4.5 A, chromatin accessibility is
lost almost entirely from Xi for many CREs during this extended time course. Differences
in dynamics of accessibility loss between individual peaks also become more apparent, as
do the few peaks that gain accessibility on Xi. Many of these, such as the tandem CTCF
sites in the Firre and Dxz4 loci, have defined functions related to the unique ‘megadomain’
conformation of the inactive X which forms during later stages of XCI (see 1.3.6).
Reasonably strong correlations between ATAC-seq replicates (Figure 4.5 B) demonstrate
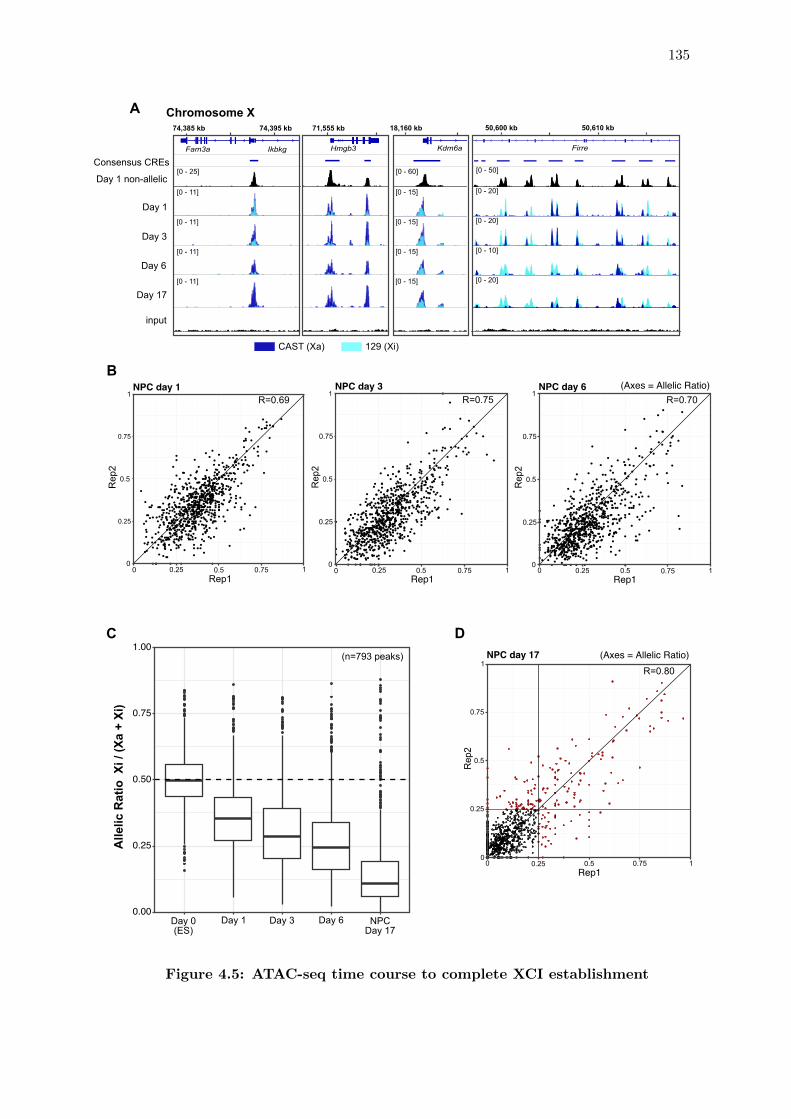
135
0.00
0.25
0.50
0.75
1.00
0
0.25
0.5
0.75
1
0
0.25
0.5
0.75
1
0
0.25
0.5
0.75
1
0 0.25 0.5 0.75 1 0 0.25 0.5 0.75 1 0 0.25 0.5 0.75 1Rep1
R=0.69
Rep2
Rep1
NPC day 1 NPC day 3 NPC day 6 (Axes = Allelic Ratio)
Rep2
Rep2
Rep1
R=0.75 R=0.70
B
0
0.25
0.5
0.75
1
Rep2
0 0.25 0.5 0.75 1Rep1
NPC day 17 (Axes = Allelic Ratio)R=0.80
(n=793 peaks)
Ikbkg G6pdx Kdm6a
[0 - 15]
[0 - 15]
[0 - 15]
[0 - 15]
[0 - 60]
[0 - 20]
[0 - 20]
[0 - 10]
[0 - 20]
[0 - 50]
CAST (Xa) 129 (Xi)
Kdm6a FirreHmgb3Fam3a Ikbkg
Day 6
Day 17
input
Day 3
Day 1
Day 1 non-allelic
Consensus CREs
[0 - 11]
[0 - 11]
[0 - 11]
[0 - 11]
[0 - 25]
74,385 kb 74,395 kb 71,555 kb 18,160 kb 50,600 kb 50,610 kb
Chromosome XA
Day 0(ES)
Day 1 Day 3 Day 6 NPCDay 17
Alle
licR
atio
Xi/(
Xa+
Xi)
C D
Figure 4.5: ATAC-seq time course to complete XCI establishment
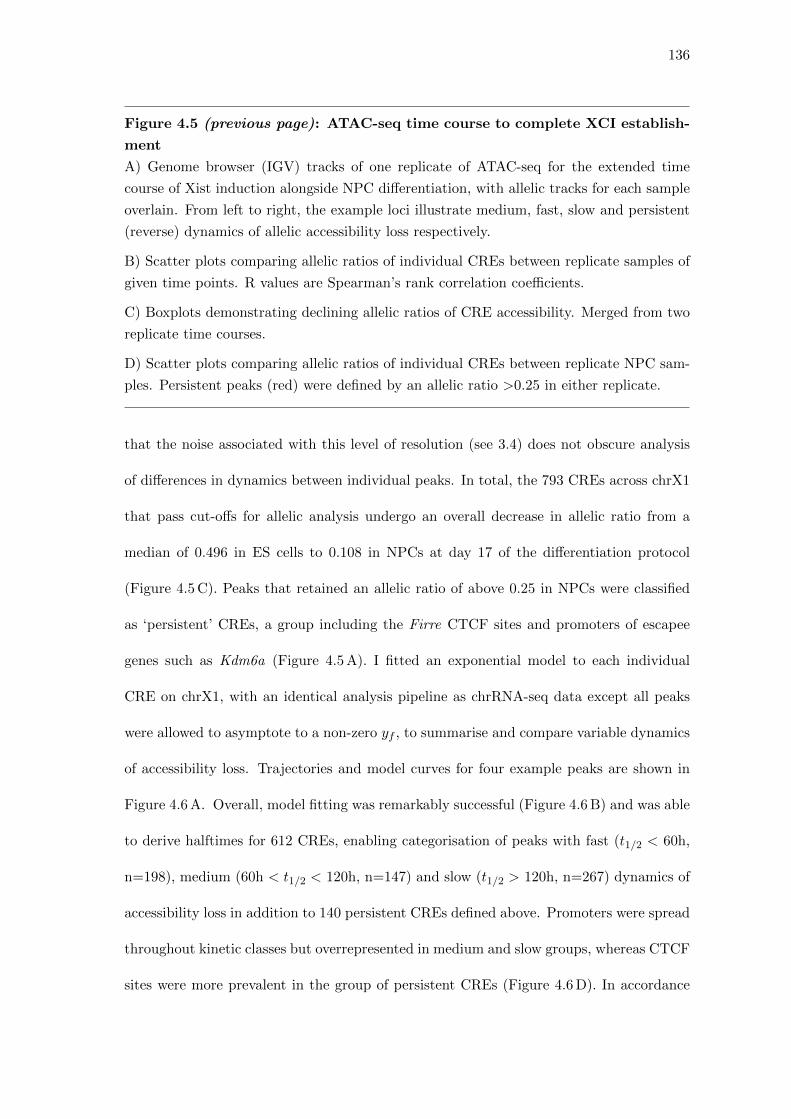
136
Figure 4.5 (previous page): ATAC-seq time course to complete XCI establish-
ment
A) Genome browser (IGV) tracks of one replicate of ATAC-seq for the extended time
course of Xist induction alongside NPC differentiation, with allelic tracks for each sample
overlain. From left to right, the example loci illustrate medium, fast, slow and persistent
(reverse) dynamics of allelic accessibility loss respectively.
B) Scatter plots comparing allelic ratios of individual CREs between replicate samples of
given time points. R values are Spearman’s rank correlation coefficients.
C) Boxplots demonstrating declining allelic ratios of CRE accessibility. Merged from two
replicate time courses.
D) Scatter plots comparing allelic ratios of individual CREs between replicate NPC sam-
ples. Persistent peaks (red) were defined by an allelic ratio >0.25 in either replicate.
that the noise associated with this level of resolution (see 3.4) does not obscure analysis
of differences in dynamics between individual peaks. In total, the 793 CREs across chrX1
that pass cut-offs for allelic analysis undergo an overall decrease in allelic ratio from a
median of 0.496 in ES cells to 0.108 in NPCs at day 17 of the differentiation protocol
(Figure 4.5 C). Peaks that retained an allelic ratio of above 0.25 in NPCs were classified
as ‘persistent’ CREs, a group including the Firre CTCF sites and promoters of escapee
genes such as Kdm6a (Figure 4.5 A). I fitted an exponential model to each individual
CRE on chrX1, with an identical analysis pipeline as chrRNA-seq data except all peaks
were allowed to asymptote to a non-zero yf , to summarise and compare variable dynamics
of accessibility loss. Trajectories and model curves for four example peaks are shown in
Figure 4.6 A. Overall, model fitting was remarkably successful (Figure 4.6 B) and was able
to derive halftimes for 612 CREs, enabling categorisation of peaks with fast (t1/2 < 60h,
n=198), medium (60h < t1/2 < 120h, n=147) and slow (t1/2 > 120h, n=267) dynamics of
accessibility loss in addition to 140 persistent CREs defined above. Promoters were spread
throughout kinetic classes but overrepresented in medium and slow groups, whereas CTCF
sites were more prevalent in the group of persistent CREs (Figure 4.6 D). In accordance
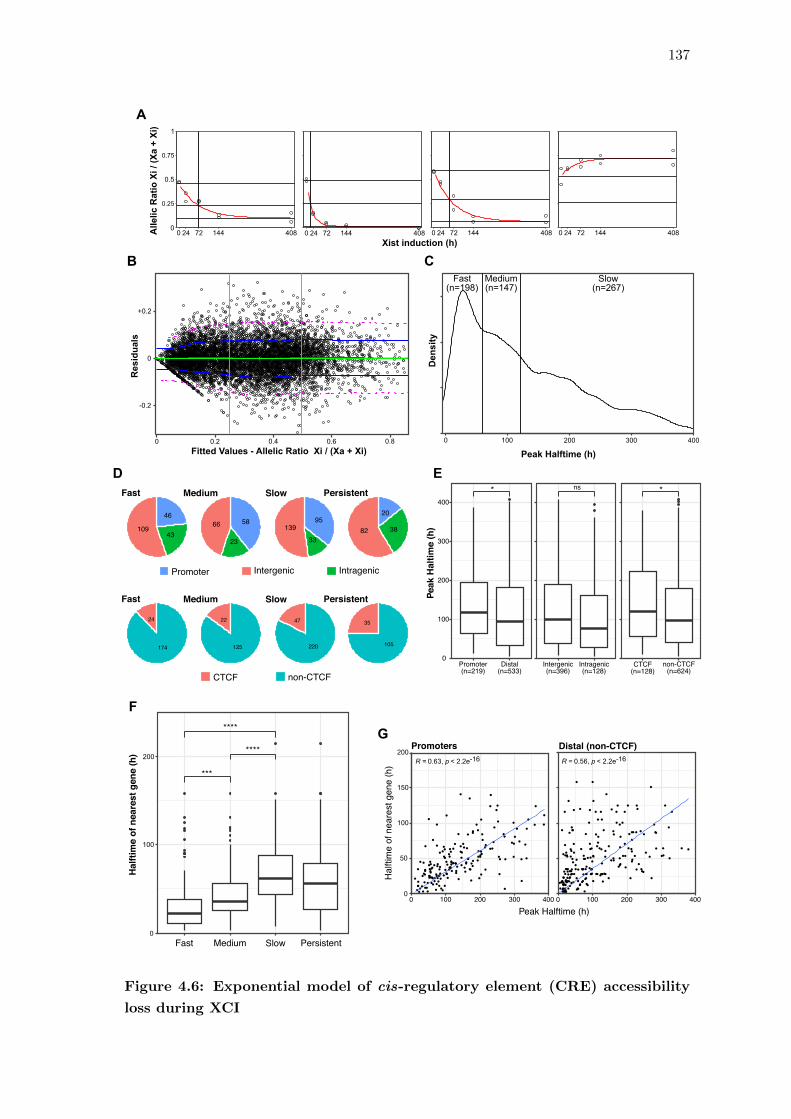
137
0
-0.2
+0.2
0.2 0.4 0.6 0.80Fitted Values - Allelic Ratio Xi / (Xa + Xi)
Res
idua
ls
A
D E
F
G
B C
00 24 72 144 408 0 24 72 144 408 0 24 72 144 408 0 24 72 144 408
0.25
0.5
0.75
1
Alle
licR
atio
Xi/(
Xa+
Xi)
Xist induction (h)
Den
sity
Peak Halftime (h)0 100 200 300 400
Fast(n=198)
Medium(n=147)
Slow(n=267)
46
10943
Intergenic IntragenicPromoter
Fast Medium Slow Persistent
5866
23
95139
33
20
82 38
24
174
CTCF
Fast Medium Slow Persistent
non-CTCF
22
125
47
220
35
105
Fast Medium
Promoters Distal (non-CTCF)
Slow Persistent
*
0
100
200
300
400
Promoter(n=219)
Distal(n=533)
PeakHaltim
e(h)
ns
Intergenic(n=396)
Intragenic(n=128)
*
CTCF(n=128)
non-CTCF(n=624)
***
****
****R = 0.63, p < 2.2e-16
0
50
100
150
200
100
0
200
0 100 200 300 400 0 100 200 300 400
Peak Halftime (h)
Halftimeofnearestgene(h)
Halftimeofnearestgene(h)
R = 0.56, p < 2.2e-16
Figure 4.6: Exponential model of cis-regulatory element (CRE) accessibility
loss during XCI
138
Figure 4.6 (previous page): Exponential model of cis-regulatory element
(CRE) accessibility loss during XCI
A) Trajectories of allelic ratio decreases for four individual example CREs. Red curves
illustrate the fit of an exponential decay curve to each CRE. Horizontal lines represent
parameters of (y0 +yf ), 12(y0 +yf ) and yf respectively, and the vertical line is placed at the
computed halftime (t1/2) for each CRE. As demonstrated by the right-most example, it is
not possible to calculate halftimes for idiosyncratic CREs where the allelic ratio increases
over time.
B) Scatter plot of residuals from exponential model fitting of ATAC-seq data. The red,
blue, and dashed purple lines represent the rolling average of the median, interquartile
ranges and 90th percentiles of residuals respectively. Vertical green dashed lines are placed
at 0.5 and 0.25 to allow for estimation of residuals in the expected range for t1/2 values
by thresholds set at 60 and 120 hours.
C) Density plot of accessibility loss halftimes generated by the exponential model, allowing
for categorisation of fast, medium and slow-CREs.
D) Pie charts illustrating the distribution of different types of CRE by genomic position
(promoter, intergenic or intragenic) or CTCF binding (as defined in 3.4) between kinetic
silencing classes.
E) Boxplots comparing accessibility loss halftimes between different types of CRE. * in-
dicates a p value below 0.05.
F) Boxplots comparing the silencing halftimes of the nearest genes to each CRE grouped
by kinetic class. ***, **** indicate p values below 0.001 and 0.0001 respectively by Welch’s
unequal variance T-test.
E) Scatter plots comparing accessibility loss halftimes with silencing halftimes of nearest
genes for both promoters and enhancer categories of CRE. R and p values are results from
a Spearman’s rank correlation test.
with this, the halftimes of accessibility loss for promoters and CTCF sites are significantly
longer than distal or non-CTCF CREs respectively (Figure 4.6 E).
To explore the relationship between the silencing dynamics of CREs and their target
genes, I matched CREs to their closest genes (<50kb) by linear genomic distance. This
is arguably too simplistic as there are numerous paradigms of long-distance enhancer-
promoter regulation (see 1.1.4), and methods have been proposed to more accurately
associate CREs to the genes they regulate (Fulco et al. 2019). However, most CREs lie
139
in close proximity to their target genes (Fishilevich et al. 2017), and indeed there is a
clear trend for genes adjacent to CREs that lose accessibility rapidly or slowly to have
short or long halftimes respectively (Figure 4.5 F). This positive correlation between the
halftimes of CREs and proximal genes is evident for both promoters and distal elements
(Figure 4.5 G), many of which are putative enhancers. Taken together, these results are
suggestive of a role for the cis-regulatory landscape in determining silencing dynamics of
target genes, but more specific insights are obscured by the fact that ATAC-seq produces
peaks of accessibility at a wide variety of different types of CRE.
4.6 YY1 is a candidate factor mediating late silencing and escape
As previously discussed, a key feature of ATAC-seq is that it marks regions of DNA/chromatin
bound by transcription factors, with peak height somewhat corresponding to relative
amounts of TF binding over target sequences. With this in mind I hypothesised that
a specific transcription factor(s) may be preferentially bound at CREs with slow or per-
sistent dynamics of accessibility loss from Xi. It follows that this factor would make a
strong candidate for mediating late silencing and/or escape from XCI of its particular
target genes, thus resolving some of the unexplained gene-gene heterogeneity in silencing
dynamics.
Accordingly, I used the HOMER software to search for sequence motifs enriched within
slow or persistent CREs (n=421), comparing against fast or medium-silencing CREs
(n=328) on chrX1. The top results of the ’Known Motif Enrichment’ settings are pre-
sented in Figure 4.7 A. The second-most enriched motif, CTCF, was an expected result of
this analysis on account of its persistent binding sites at the Firre and Dxz4 loci involved
in shaping the chromosomal superstructure of Xi. However, the most significant motif by
far was that of YY1, a transcription factor with myriad reported functions in gene regula-
tion (reviewed in Verheul et al. 2020), chromatin remodelling (Wang et al. 2018a), and 3D
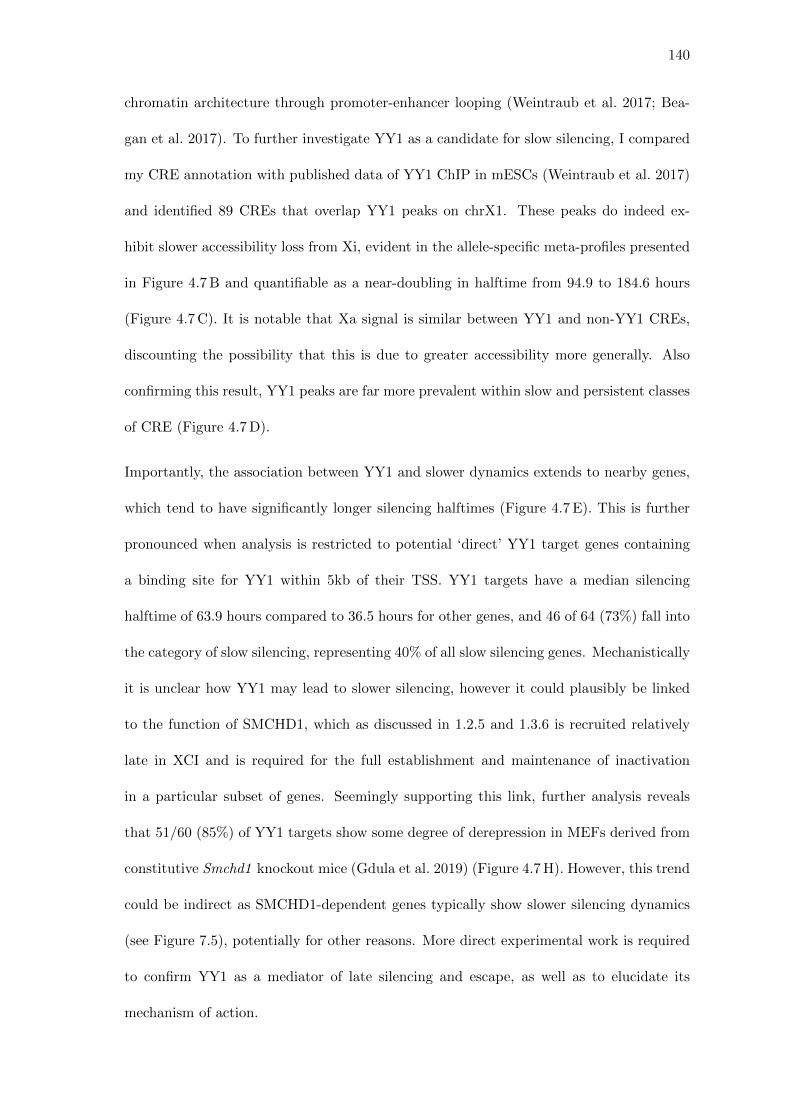
140
chromatin architecture through promoter-enhancer looping (Weintraub et al. 2017; Bea-
gan et al. 2017). To further investigate YY1 as a candidate for slow silencing, I compared
my CRE annotation with published data of YY1 ChIP in mESCs (Weintraub et al. 2017)
and identified 89 CREs that overlap YY1 peaks on chrX1. These peaks do indeed ex-
hibit slower accessibility loss from Xi, evident in the allele-specific meta-profiles presented
in Figure 4.7 B and quantifiable as a near-doubling in halftime from 94.9 to 184.6 hours
(Figure 4.7 C). It is notable that Xa signal is similar between YY1 and non-YY1 CREs,
discounting the possibility that this is due to greater accessibility more generally. Also
confirming this result, YY1 peaks are far more prevalent within slow and persistent classes
of CRE (Figure 4.7 D).
Importantly, the association between YY1 and slower dynamics extends to nearby genes,
which tend to have significantly longer silencing halftimes (Figure 4.7 E). This is further
pronounced when analysis is restricted to potential ‘direct’ YY1 target genes containing
a binding site for YY1 within 5kb of their TSS. YY1 targets have a median silencing
halftime of 63.9 hours compared to 36.5 hours for other genes, and 46 of 64 (73%) fall into
the category of slow silencing, representing 40% of all slow silencing genes. Mechanistically
it is unclear how YY1 may lead to slower silencing, however it could plausibly be linked
to the function of SMCHD1, which as discussed in 1.2.5 and 1.3.6 is recruited relatively
late in XCI and is required for the full establishment and maintenance of inactivation
in a particular subset of genes. Seemingly supporting this link, further analysis reveals
that 51/60 (85%) of YY1 targets show some degree of derepression in MEFs derived from
constitutive Smchd1 knockout mice (Gdula et al. 2019) (Figure 4.7 H). However, this trend
could be indirect as SMCHD1-dependent genes typically show slower silencing dynamics
(see Figure 7.5), potentially for other reasons. More direct experimental work is required
to confirm YY1 as a mediator of late silencing and escape, as well as to elucidate its
mechanism of action.
141
56
66
68
Silencing Rate:fast medium slow
414
46
GYY1 targets non-YY1 targets
7
14 30
9
22253
58
SMCHD1 dependence:MEF escapee dependentnot dependent partially dependent
HYY1 targets non-YY1 targets
GneeHalftime(h)
non-YY1target
YY1 target(<5kb)
****
100
200
150
50
0
F
PeakHaltim
e(h)
Haltim
eofnearestgene(h)
****
0
100
200
300
400
0
100
200
150
50
non-YY1 YY1 non-YY1 YY1
**C E
FastDay 1
Day 3
Day 6
Day 17
Medium Slow Persistent
35
105
6
192
13
134
52
215
non-YY1YY1
D
0Centre
XaXi
XaXi
+2kb-2kb Centre +2kb-2kb
1
2
0
1
2
0
1
2
0
1
2
non-YY1 peaksYY1 peaks
RelativeSign
al
B
A
Figure 4.7: Identification of YY1 as a candidate factor mediating late silencing
and escape
142
Figure 4.7 (previous page): Identification of YY1 as a candidate factor medi-
ating late silencing and escape
A) Results of the ‘Known Motif’ settings of HOMER enrichment using target sequences
from slow and persistent CREs (n=421) compared against background sequences from fast
and medium peaks (n=328).
B) Allelic meta-profiles centred on CREs classified either as bound (n=106) or non-bound
by YY1 (n=646) in ChIP-seq data from mESCs (GSE99518; Weintraub et al. 2017).
C) Boxplots comparing accessibility loss halftimes between CREs bound (n=106) or non-
bound (n=646) by YY1. **** indicates a p value below 0.0001 by Welch’s unequal variance
T-test.
D) Pie charts illustrating the proportions of YY1-binding or non-YY1-binding CREs be-
tween kinetic silencing classes.
E) Boxplots comparing the silencing halftimes of the nearest genes to YY1-binding or
non-YY1-binding CREs. ** indicates a p value below 0.01 by Welch’s unequal variance
T-test.
F) Boxplots comparing the silencing halftimes of putative YY1 targets (binding site <5kb
of TSS, n=64) to other chrX1 genes (n=190). **** indicates a p value below 0.0001 by
Welch’s unequal variance T-test.
G) Pie charts illustrating the proportions of kinetic silencing classes for YY1 target genes
compared to other genes.
H) Pie charts illustrating the proportions of SMCHD1-dependence classes (from Gdula
et al. 2019) for YY1 target genes compared to other genes.
4.7 Resolving cellular heterogeneity of silencing dynamics by single-cell
RNA-seq
All of the experiments discussed to this point are bulk methodologies using as starting
material extracts made from between 5x10⁴ (ATAC-seq) and 5x10⁷ (ChIP-seq) cultured
cells. Therefore, the results from these experiments reflect the behaviour of a large popu-
lation of cells and hide cell-to-cell heterogeneity. In the X inactivation field, resolution at
a single-cell level was historically only possible through the use of microscopy experiments
such as RNA-FISH, which typically come with caveats of binary or subjective readouts
and are limited in the number of genes that can be analysed. However, this has changed in
143
recent years with technological and chemical advances that have enabled next-generation
sequencing techniques to be applied in individual cells. Single cell technologies are most
effective at sequencing RNA, where multiple copies of each transcript increase chances of
detection and enable quantitative comparison between transcriptomes of individual cells.
Therefore, the application of single-cell RNA sequencing (scRNA-seq) to the paradigm of
gene silencing in XCI posed a unique opportunity to resolve questions unanswerable in
analysis of silencing dynamics in bulk chrRNA-seq. These questions include addressing the
overall extent of cellular heterogeneity in silencing, and whether ‘slow’ or ‘fast’ silencing
genes demonstrate these characteristic dynamics in each individual cell.
4.8 Smart-seq2 for iXist-ChrX cells over the ES-to-NPC differentiation
protocol
A number of scRNA-seq methods are available and each come with associated advantages
and drawbacks (reviewed in Ding et al. 2020). I decided for this experiment to use Smart-
seq2 (Picelli et al. 2014), which has been optimised and is available as a service by the
Single Cell Facility at the Weatherall Institute of Molecular Medicine (WIMM). Smart-seq2
involves sorting single cells into individual wells of PCR plates by a FACS machine and
is therefore lower throughput compared to alternative droplet-based methods. However,
it has the advantage of producing relatively high numbers of genes detected per cell, and
crucially involves priming across the full length of transcripts so offers greater coverage
of SNPs for allelic analysis than other techniques only sampling 3’ or 5’ ends. Four
time points spanning XCI establishment were chosen for single cell sorting: uninduced
mESCs, days 1 and 3 of Xist induction under NPC differentiation conditions, and fully
differentiated NPCs. In addition to the previously discussed iXist-ChrX cell line that
carries inducible Xist on the Domesticus X chromosome, cells from a separate clonal line
with the inducible promoter on the reciprocal Castaneous allele, iXist-ChrXCast , were also
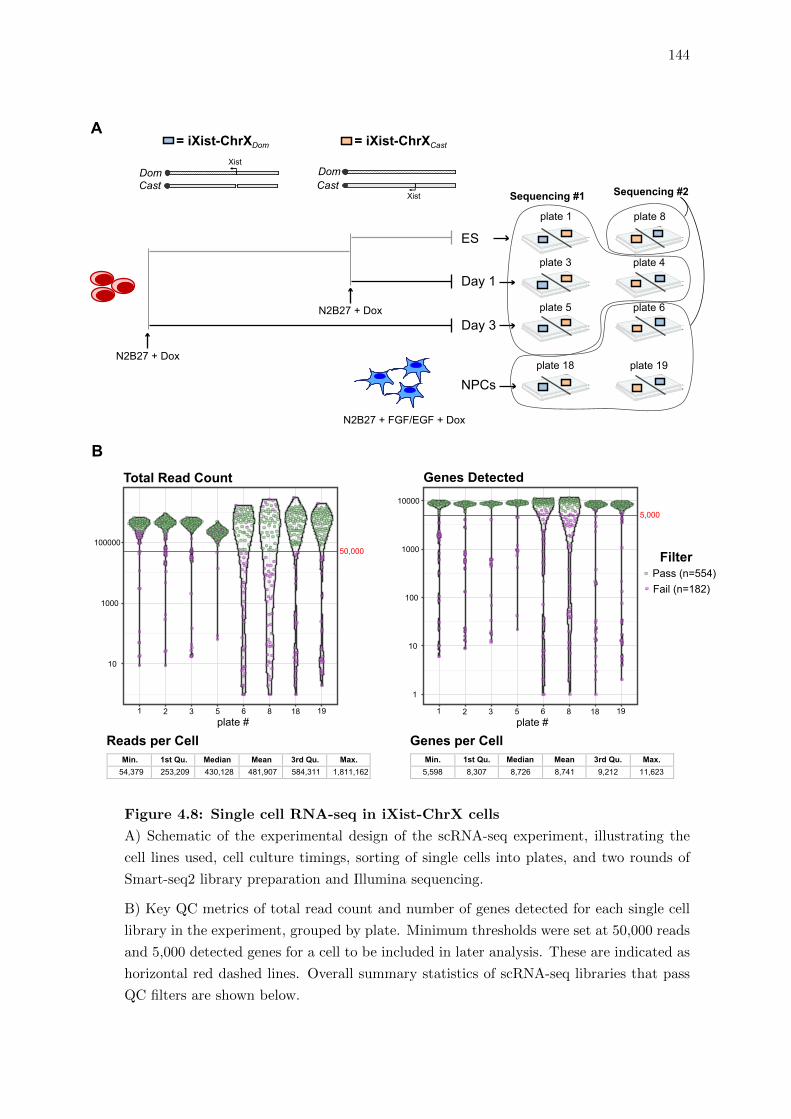
144
DomCast
Dom
plate 1
plate 3
plate 5
plate 18
plate 8
plate 4
plate 6
plate 19
Cast
= iXist-ChrXDom = iXist-ChrXCastXist
Xist
ES
Day 1
Day 3
NPCs
N2B27 + Dox
N2B27 + Dox
N2B27 + FGF/EGF + Dox
Sequencing #1 Sequencing #2
10
1 2 3 5 6 18 198
1000
100000
plate #1 2 3 5 6 18 198
plate #
Total Read Count
Reads per Cell
1
10
100
1000
10000
5,000
50,000 FilterPass (n=554)Fail (n=182)
Genes Detected
54,379 253,209 430,128 481,907 584,311 1,811,162
Genes per CellMin. 1st Qu. Median Mean 3rd Qu. Max.Min. 1st Qu. Median Mean 3rd Qu. Max.5,598 8,307 8,726 8,741 9,212 11,623
A
B
Figure 4.8: Single cell RNA-seq in iXist-ChrX cells
A) Schematic of the experimental design of the scRNA-seq experiment, illustrating the
cell lines used, cell culture timings, sorting of single cells into plates, and two rounds of
Smart-seq2 library preparation and Illumina sequencing.
B) Key QC metrics of total read count and number of genes detected for each single cell
library in the experiment, grouped by plate. Minimum thresholds were set at 50,000 reads
and 5,000 detected genes for a cell to be included in later analysis. These are indicated as
horizontal red dashed lines. Overall summary statistics of scRNA-seq libraries that pass
QC filters are shown below.
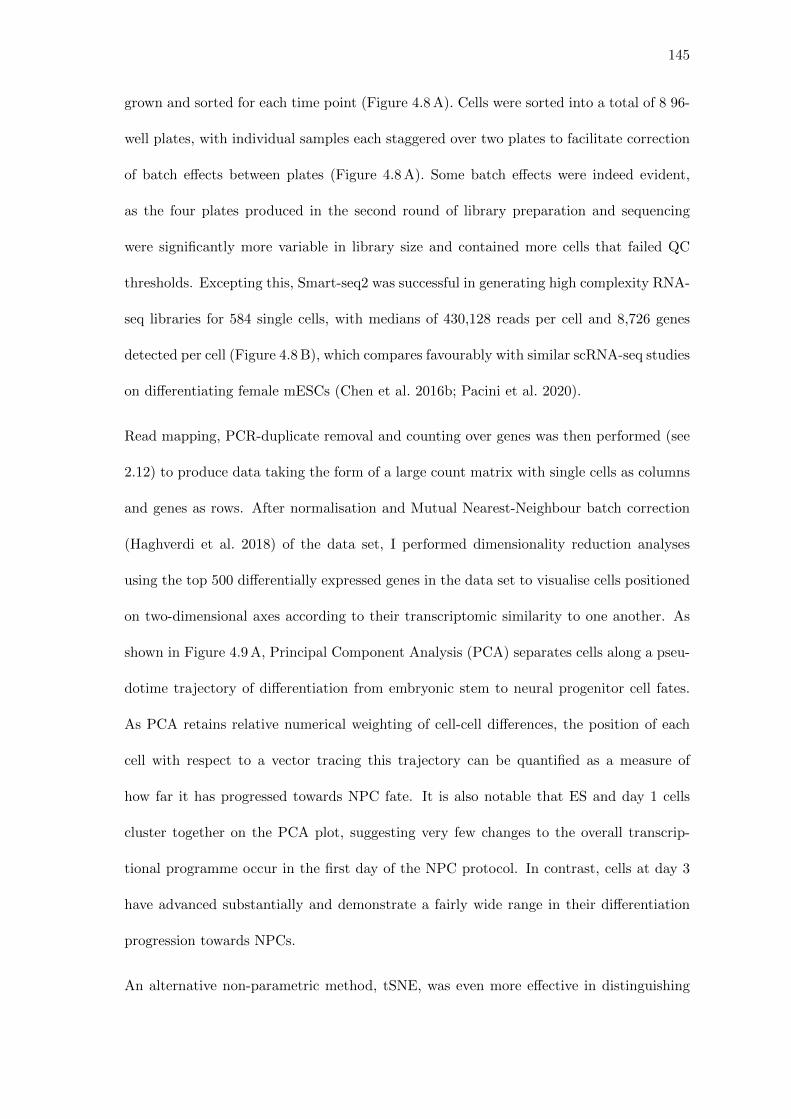
145
grown and sorted for each time point (Figure 4.8 A). Cells were sorted into a total of 8 96-
well plates, with individual samples each staggered over two plates to facilitate correction
of batch effects between plates (Figure 4.8 A). Some batch effects were indeed evident,
as the four plates produced in the second round of library preparation and sequencing
were significantly more variable in library size and contained more cells that failed QC
thresholds. Excepting this, Smart-seq2 was successful in generating high complexity RNA-
seq libraries for 584 single cells, with medians of 430,128 reads per cell and 8,726 genes
detected per cell (Figure 4.8 B), which compares favourably with similar scRNA-seq studies
on differentiating female mESCs (Chen et al. 2016b; Pacini et al. 2020).
Read mapping, PCR-duplicate removal and counting over genes was then performed (see
2.12) to produce data taking the form of a large count matrix with single cells as columns
and genes as rows. After normalisation and Mutual Nearest-Neighbour batch correction
(Haghverdi et al. 2018) of the data set, I performed dimensionality reduction analyses
using the top 500 differentially expressed genes in the data set to visualise cells positioned
on two-dimensional axes according to their transcriptomic similarity to one another. As
shown in Figure 4.9 A, Principal Component Analysis (PCA) separates cells along a pseu-
dotime trajectory of differentiation from embryonic stem to neural progenitor cell fates.
As PCA retains relative numerical weighting of cell-cell differences, the position of each
cell with respect to a vector tracing this trajectory can be quantified as a measure of
how far it has progressed towards NPC fate. It is also notable that ES and day 1 cells
cluster together on the PCA plot, suggesting very few changes to the overall transcrip-
tional programme occur in the first day of the NPC protocol. In contrast, cells at day 3
have advanced substantially and demonstrate a fairly wide range in their differentiation
progression towards NPCs.
An alternative non-parametric method, tSNE, was even more effective in distinguishing
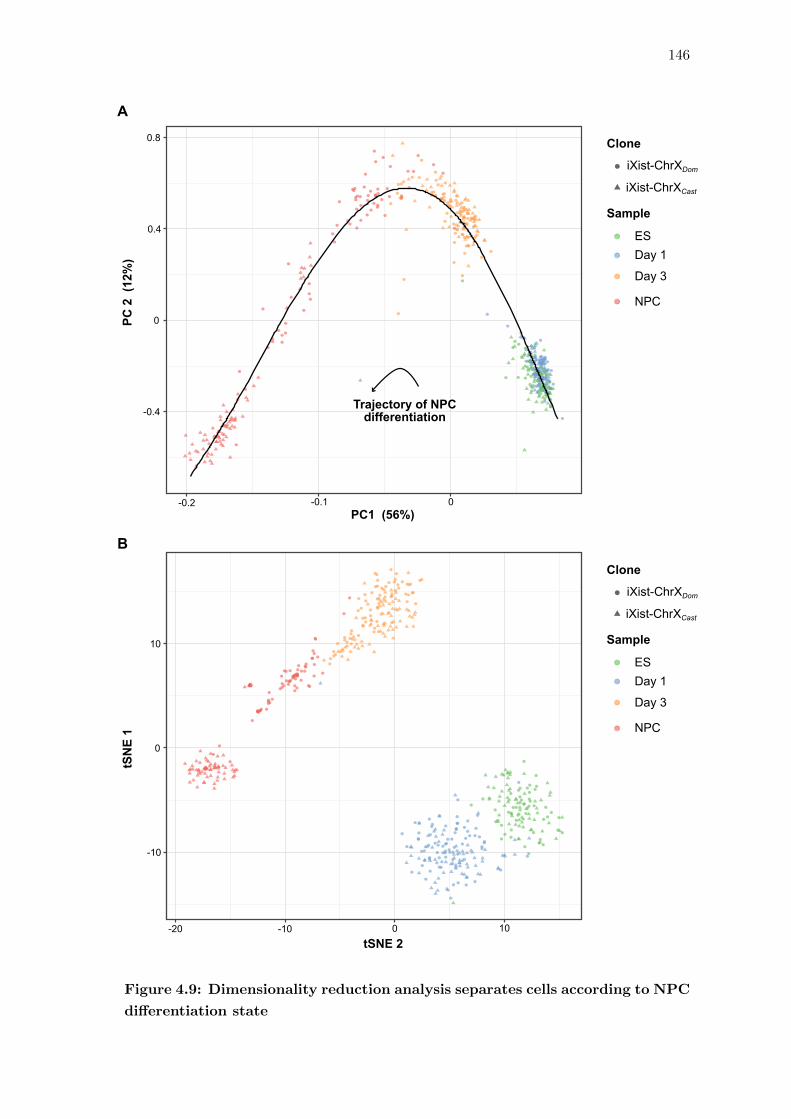
146
Clone
iXist-ChrXDomiXist-ChrXCast
Sample
0
0
0 10
-10
-10-20
10
0-0.1-0.2
-0.4
0.4
0.8
Day 3
Day 1ES
NPC
Clone
iXist-ChrXDomiXist-ChrXCast
Sample
Day 3
Day 1ES
NPC
PC2(12%)
tSNE1
tSNE 2
PC1 (56%)
A
B
Trajectory of NPCdifferentiation
Figure 4.9: Dimensionality reduction analysis separates cells according to NPC
differentiation state
147
Figure 4.9 (previous page): Dimensionality reduction analysis separates cells
according to NPC differentiation state
A) PCA plot of the position of each cell according to two leading principal components.
Colours indicate sample time points and shapes the parental clonal cell line. The dashed
line traces a vector of the pseudotime trajectory of NPC differentiation in the experiment
(see 2.12).
B) t-distributed stochastic neighbour embedding (t-SNE) plot of each cell in the experi-
ment. Colours indicate sample time points and shapes the parental clone.
different subpopulations corresponding to time points of the experiment (Figure 4.9 B). By
both dimensionality reduction methods cells from the two lines are intermingled for ES,
day 1, and day 3 samples, suggesting minimal clonal differences in their transcriptional
programmes or response to the NPC protocol. However, it is clear that whereas the iXist-
ChrXCast NPC sample was formed predominantly from homogenous, well-differentiated
cells, the iXist-ChrXDom sample represented a far more heterogeneous population of cell
types. This may be because the cells used for the iXist-ChrXDom sample were grown up
from frozen, facilitating strong selection for any actively dividing or pluripotent cells in
the frozen NPC stock, a suggestion that is agreement with my visual inspection of cellular
morphology within the plates prior to sample collection.
It is standard practice in scRNA-seq analysis to investigate and rank genes that show the
most variability between all cells in the experiment. Reassuringly, known markers of ES to
NPC differentiation dominated rankings of the most variably expressed genes. Expression
levels of Dppa5a, Pou5f1 and Nanog decrease in individual cells over NPC differentiation,
whereas Nes was largely undetectable in cells of early time point but high in most NPCs
(Figure 4.10 A). Pluripotency gene expression was also found in many iXist-ChrXDom - but
not iXist-ChrXCast - NPCs, providing further evidence of a significant sub-population of
incompletely differentiated cells. Surprisingly, although Xist is upregulated only in induced
cells, it was only the 68th-most variably expressed gene between cells in the experiment.
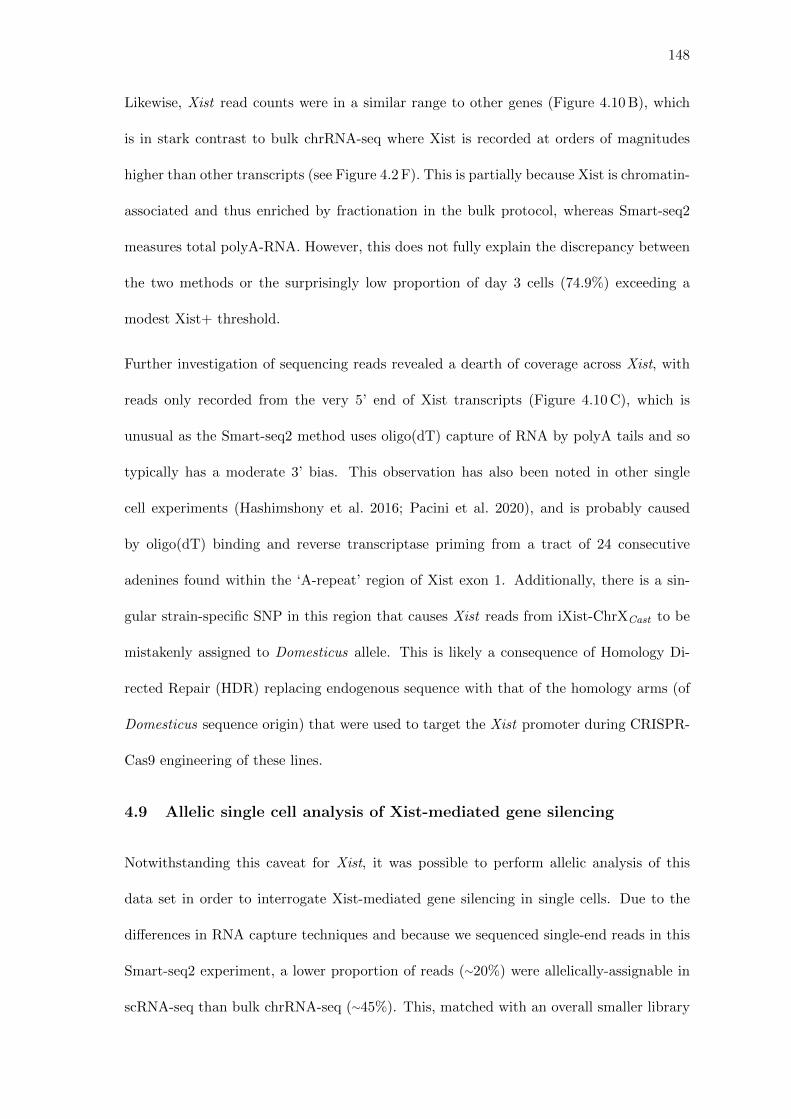
148
Likewise, Xist read counts were in a similar range to other genes (Figure 4.10 B), which
is in stark contrast to bulk chrRNA-seq where Xist is recorded at orders of magnitudes
higher than other transcripts (see Figure 4.2 F). This is partially because Xist is chromatin-
associated and thus enriched by fractionation in the bulk protocol, whereas Smart-seq2
measures total polyA-RNA. However, this does not fully explain the discrepancy between
the two methods or the surprisingly low proportion of day 3 cells (74.9%) exceeding a
modest Xist+ threshold.
Further investigation of sequencing reads revealed a dearth of coverage across Xist, with
reads only recorded from the very 5’ end of Xist transcripts (Figure 4.10 C), which is
unusual as the Smart-seq2 method uses oligo(dT) capture of RNA by polyA tails and so
typically has a moderate 3’ bias. This observation has also been noted in other single
cell experiments (Hashimshony et al. 2016; Pacini et al. 2020), and is probably caused
by oligo(dT) binding and reverse transcriptase priming from a tract of 24 consecutive
adenines found within the ‘A-repeat’ region of Xist exon 1. Additionally, there is a sin-
gular strain-specific SNP in this region that causes Xist reads from iXist-ChrXCast to be
mistakenly assigned to Domesticus allele. This is likely a consequence of Homology Di-
rected Repair (HDR) replacing endogenous sequence with that of the homology arms (of
Domesticus sequence origin) that were used to target the Xist promoter during CRISPR-
Cas9 engineering of these lines.
4.9 Allelic single cell analysis of Xist-mediated gene silencing
Notwithstanding this caveat for Xist, it was possible to perform allelic analysis of this
data set in order to interrogate Xist-mediated gene silencing in single cells. Due to the
differences in RNA capture techniques and because we sequenced single-end reads in this
Smart-seq2 experiment, a lower proportion of reads (∼20%) were allelically-assignable in
scRNA-seq than bulk chrRNA-seq (∼45%). This, matched with an overall smaller library
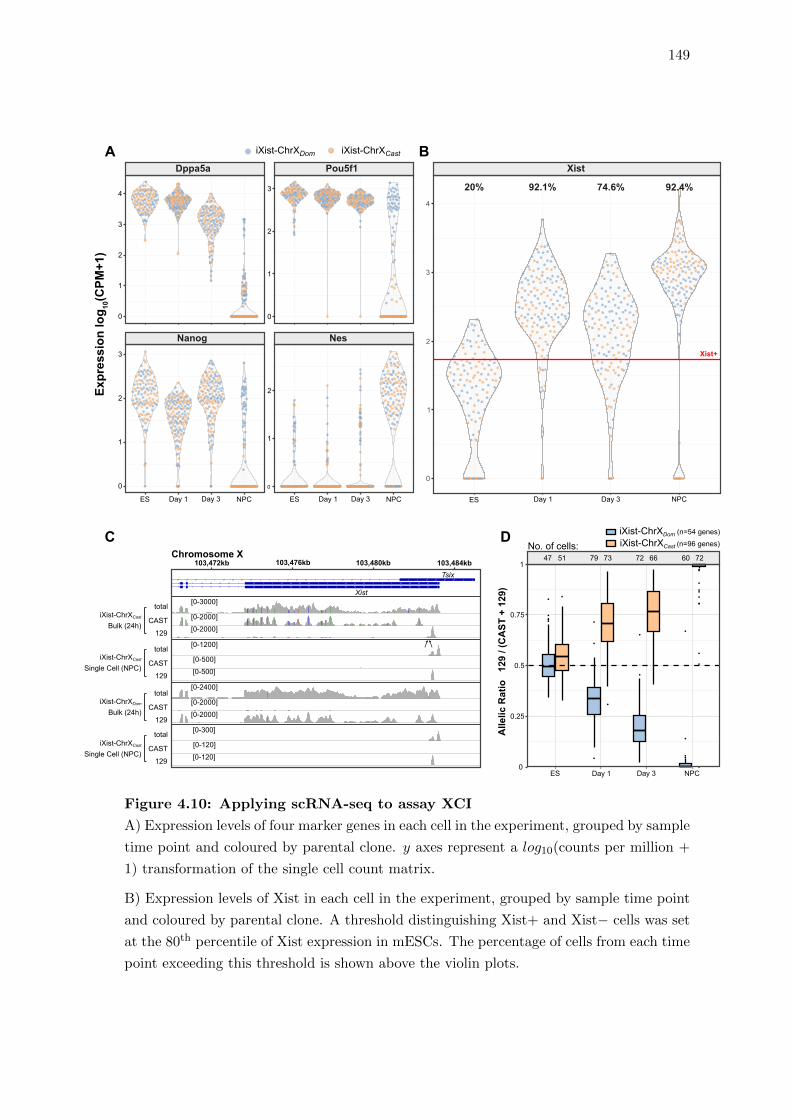
149
Nanog Nes
Dppa5a Pou5f1
0
1
2
3
0
1
2
0
1
2
3
4
0
1
2
3
Expres
sion
log 1
0(CPM
+1)
iXist-ChrXDom iXist-ChrXCast
ES Day 1 Day 3 NPC ES Day 1 Day 3 NPC
Xist
Xist+
ES Day 1
No. of cells:
Day 3 NPC
0
1
2
3
4
20% 92.1% 74.6% 92.4%
Alle
licRatio
129/ (CAST
+12
9)
0
0.25
0.5
0.75
147 51 79 73 72 66 60 72
iXist-ChrXDom (n=54 genes)iXist-ChrXCast (n=96 genes)
ES Day 1 Day 3 NPC
[0 - 3000]
[0 - 2000]
[0 - 2000]
[0 - 1200]
[0 - 500]
[0 - 500]
[0 - 2335]
[0 - 2000]
[0 - 2000]
[0 - 300]
[0 - 120]
[0 - 120]
Tsix
Xist
total
CAST
129
total
CAST
129
total
CAST
129
total
CAST
129
iXist-ChrXCast
Bulk (24h)
iXist-ChrXCast
Single Cell (NPC)
iXist-ChrXDom
Bulk (24h)
iXist-ChrXCast
Single Cell (NPC)
103,472kb 103,476kb 103,480kb 103,484kbChromosome X
[0-3000]
[0-2000]
[0-2000]
[0-1200]
[0-500]
[0-500]
[0-2400]
[0-2000]
[0-2000]
[0-300]
[0-120]
[0-120]
C D
A B
Figure 4.10: Applying scRNA-seq to assay XCI
A) Expression levels of four marker genes in each cell in the experiment, grouped by sample
time point and coloured by parental clone. y axes represent a log10(counts per million +
1) transformation of the single cell count matrix.
B) Expression levels of Xist in each cell in the experiment, grouped by sample time point
and coloured by parental clone. A threshold distinguishing Xist+ and Xist− cells was set
at the 80th percentile of Xist expression in mESCs. The percentage of cells from each time
point exceeding this threshold is shown above the violin plots.

150
Figure 4.10 (previous page): Applying scRNA-seq to assay XCI
C) Genome browser (IGV) views of reads in bam files mapping to exon 1 of Xist in repre-
sentative bulk chrRNA-seq and scRNA-seq libraries. Strain-specific SNPs are indicated by
coloured bars. The two arrows point to the locations of a 24bp adenine tract and a SNP
that leads to allelic mis-annotation of reads mapping to the 5’ end of Xist in iXist-ChrXCast
cells.
D) Allelic ratio boxplots from ‘pseudobulking’ the scRNA-seq data. Data points here are
genes, with values according to the mean allelic ratio over all cells in each sample. The
numbers of cells merged together for each sample is displayed in the panel above the boxes.
The number of genes that can be analysed for each cell line is indicated beside the labels.
size each single cell RNA library, necessitates the relaxation of allelic thresholds to minimal
values. Nevertheless, a considerable number of genes (54 for iXist-ChrXDom , 96 for iXist-
ChrXCast) were still amenable to allelic analysis. When all cells for each sample are
merged together (‘pseudobulking’), allelic ratio boxplots of these genes at each time point
closely recapitulate bulk chrRNA-seq analysis (Figure 4.10 D, cf. Figure 4.2 A). However,
the main purpose of this single cell experiment was to investigate cellular heterogeneity
of gene silencing within our model system of XCI. Hence, in Figure 4.11 A the mean
allelic ratio of each single cell in the experiment is plotted as a separate data point.
Whereas mESCs are clustered quite closely around ∼0.5, there is significant variability in
the degree of silencing within the cellular populations of the day 1 and 3 samples. At day
3 in particular, cells range from showing little to no silencing (AR ∼0.5) to possessing a
near-completely inactive X chromosome (AR ∼0). As an aside, it is notable that there is
no evidence of a subpopulation of incompletely silenced iXist-ChrXDom NPCs, indicating
that pluripotency gene expression in this sample does not result in Xi derepression.
I next examined if genes determined by bulk chrRNA-seq to have fast, medium or slow
kinetics of silencing show these same characteristics within single cells. To this end Fig-
ure 4.11 B plots the allelic ratios of four example genes for all the cells in the experiment.
By and large it is clear that genes do indeed retain their characteristic dynamics at single
151
163
26
91
52
91
39
2122
7
10
30
27
3
20
27
0
0.25
0.50
0.75
1
ES Day 1 Day 3
Pdk3 (fast) Hprt (medium) Ndufb11 (slow)
ES Day 1 Day 3
0
0.25
0.5
0.75
1
0
0.25
0.5
0.75
1
ES Day 1 Day 3 NPC ES Day 1 Day 3 NPC
ES Day 1 Day 3 NPC ES Day 1 Day 3 NPC
Pdk3 Hprt
Ndufb11 Nono
0
0.25
0.5
0.75
1
Allelic
Ratio- M
eanper C
ell
129/ (CAST
+129)
Allelic
Ratio
129/ (CAST
+129)
Allelic
Ratio
129/ (CAST
+129)
Least-s
ilenced
Gene
ES Day 1 Day 3 NPC
iXist-ChrXDom
iXist-ChrXDom
iXist-ChrXCast
iXist-ChrXCast
A B
C
Figure 4.11: Dynamics of gene silencing at single cell resolution
A) Jitter plot of allelic ratios of single cells. Each data point represents an individual cell,
with values according to the mean allelic ratio over all genes amenable to allelic analysis
in that cell. Cells are grouped by sample time point and coloured by parental clone.
B) Jitter plots with each data point representing the allelic ratio of the given gene in an
individual cell. Examples are provided of fast, medium, slow and escapee genes as defined
by bulk chrRNA-seq. Cells are grouped by sample time point and coloured by parental
clone.
C) Upper panels plot the allelic ratios of 3 example genes in each of 6 individual cells
chosen at random from each sample. Pie charts are arranged below, counting for all cells
in the sample the number of times each gene occurs as the ‘least-silenced’ of the three
examples.

152
cell resolution, evidenced by the fact that most day 1 cells show complete silencing of the
fast gene Pdk3 whilst very few day 3 cells fully silence the slow gene, Ndufb11. Interest-
ingly, Nono appears to escape in a strain-specific manner from the Domesticus allele in all
iXist-ChrXDom cells but not from the Castaneous allele in iXist-ChrXCast NPCs. The last
figure, Figure 4.11 C, compares the allelic ratios of these three example genes relative to
each other within specific individual cells. Six random cells are shown as examples in the
upper panel and pie charts quantifying for how many cells of each time point each gene is
the ‘least silenced’ (i.e. has the highest/lowest allelic ratio) are arranged below. Although
this method is not perfect because both Hprt and Ndufb11 show slight allelic skews in
uninduced mESCs, it does demonstrate a clear trend that the order by which genes silence
is maintained within each individual cell. Taken together, this evidence implies that gene
silencing during XCI is not a binary switch but rather happens progressively over time for
each single gene in each cell. Whilst binary silencing was not the expectation, it could not
be discounted by analysis of bulk data sets alone.
4.10 Genetic correlates of X chromosome silencing in single cells
As a final exploration of this data set, I analysed which genes correlate with the degree of
silencing in individual cells. At both days 1 and 3 expression of Xist is generally higher in
individual cells with more silencing (Figure 4.12 A). Although this trend is unsurprising,
it was also plausible that the 5’ fragments captured by Smart-seq2 do not exactly reflect
behaviour of the full-length transcript, or that Xist is overexpressed to saturation in this
inducible model system. Both of these may be contributory reasons as to why the Spear-
man correlation between Xist expression and mean allelic ratio is not stronger than -0.48
in day 3 cells (Figure 4.12 B). At this same time point, I also investigated if cells further
along the trajectory of differentiation demonstrate greater silencing. Indeed, allelic ratio
negatively correlates with a cell’s position relative to the vector of NPC differentiation as
153
defined by PCA in Figure 4.9 A (Figure 4.12 C).
The reassuring finding of this strong negative correlation between Xist and allelic ratio led
me to hypothesise that other players involved in the establishment of XCI may appear as
correlates in this single cell data set. In particular, as day 3 cells are sampled across a wide
range of differentiation (Figure 4.9 A) and silencing (Figure 4.12 A), I focused on this time
point to try and unveil candidates mediating the nebulous interplay between Xist-mediated
gene silencing and differentiation out of pluripotency. The results from performing the
Spearman’s rank correlation test between allelic ratio and every detectable gene in this
data set are shown in Figure 4.12 D. Xist is by far the strongest negative correlate, whereas
33/72 genes that significantly positively correlate with allelic ratio are X-linked. Further
analysis shows these to be predominantly slow-silencing genes that show more variability
in allelic ratio at day 3 than fast genes (Figure 4.12 D cf. Figure 4.11 B). They are there-
fore assumed to be consequences of XCI rather than potential factors directly involved in
molecular pathways of silencing, although the latter is also possible. Similarly, many of
the other correlating genes that exceed the False Discovery Rate (FDR) threshold of 0.05
may be downstream targets of X-linked genes with wider roles in gene regulation, such as
Mecp2 (reviewed in Tillotson and Bird 2020). Nevertheless, a number of autosomal genes
identified as correlates make intriguing candidates for further study as regulators of the
XCI process. Genes which positively correlate with allelic ratio include Morc1, Dnmt3l,
and Mov10, which have been identified as repressors of RNA transposons in the genome
(Pastor et al. 2014; Goodier et al. 2012; Li et al. 2013), and Esrrb and Klf2, encoding
nuclear factors important for the maintenance of ground state pluripotency in embryonic
stem cells (Adachi et al. 2018; Yeo et al. 2014). There are fewer genes of obvious interest
in the list of negative correlates with allelic ratio, with the exception of Yaf2, the second
strongest candidate with either one of the general ‘nuclear’ or ‘gene expression regula-
tion’ GO terms. YAF2 is doubly intriguing as it has both a well-defined function in the
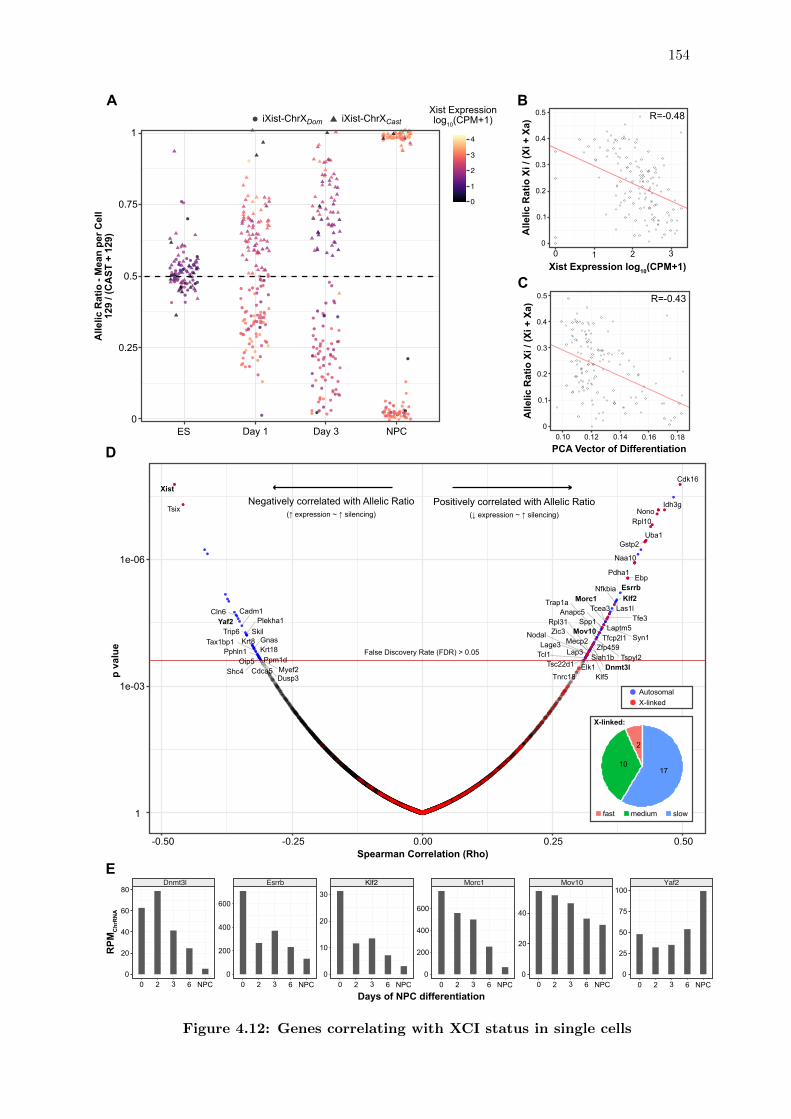
154
0.5
0.4
0.3
0.2
0.1
00.10 0.12 0.14 0.16 0.18
Xist Expression log10(CPM+1)
PCA Vector of Differentiation
AllelicRatioXi/ (Xi+Xa)
0.5
0.4
0.3
0.2
0.1
0
AllelicRatioXi/ (Xi+Xa)
B
C
0 1 2 3
R=-0.43
R=-0.48
Cdk16
Idh3gNono
Rpl10
Uba1Gstp2
Naa10
EbpPdha1
EsrrbKlf2
Nfkbia
Las1lTfe3
Tcea3Morc1
Laptm5Syn1
Anapc5Spp1
Tfcp2l1
Trap1a
Mov10
Tspyl2False Discovery Rate (FDR) > 0.05
X-linkedAutosomal
Negatively correlated with Allelic Ratio(↑ expression ~ ↑ silencing)
Positively correlated with Allelic Ratio(↓ expression ~ ↑ silencing)
Zfp459
Dnmt3lSiah1b
Klf5
Rpl31
Mecp2Zic3Nodal
Lage3Lap3Tcl1
Tsc22d1 Elk1Tnrc18Dusp3
Cdca5 Myef2Ppm1d
Shc4Oip5
Pphln1 Krt18Tax1bp1 GnasKrt8
SkilPlekha1
Trip6
Cadm1Yaf2
Cln6
Tsix
Xist
1e-06
1e-03
1
-0.50 -0.25 0.00 0.25 0.50Spearman Correlation (Rho)
pvalue
D
E
2
1017
fast medium slow
X-linked:
Morc1 Mov10 Yaf2Dnmt3l Esrrb Klf2
0
10
20
30
0
25
50
75
100
0
200
400
600
0
20
40
00 2 3 6 NPC 0 2 3 6 NPC 0 2 3 6 NPC 0 2 3 6 NPC 0 2 3 6 NPC 0 2 3 6 NPC
20
40
60
80
0
200
400
600
RPM
ChrRNA
Days of NPC differentiation
0
1
2
3
4
0
0.25
0.5
0.75
1
NPC
Xist Expressionlog10(CPM+1)iXist-ChrXDom iXist-ChrXCast
AllelicRatio- M
eanper Cell
129/ (CAST
+129)
ES Day 1 Day 3
A
Figure 4.12: Genes correlating with XCI status in single cells
155
Figure 4.12 (previous page): Genes correlating with XCI status in single cells
A) Jitter plot of allelic ratio in single cells. Each data point represents an individual cell,
with values according to the mean allelic ratio over all genes amenable to allelic analysis in
that cell. Cells are grouped by sample time point, shaped by parental clone, and coloured
by levels of Xist expression.
B) Scatter plot correlating Xist expression and allelic ratio, with each data point a single
day 3 cell. iXist-ChrXCast cells are transformed to the same y axis as iXist-ChrXDom
(Xi/(Xi+Xa)). The red line indicates the fit of a linear model, and R is the Spearman’s
rank correlation coefficient.
C) Scatter plot correlating allelic ratio with the PCA vector of differentiation as defined in
Figure 4.9 A, with each data point a single day 3 cell. iXist-ChrXCast cells are transformed
to the same y axis as iXist-ChrXDom (Xi/(Xi+Xa)). The red line indicates the fit of a
linear model, and R is the Spearman’s rank correlation coefficient.
D) Volcano plot of the results of performing Spearman’s rank correlation test between
allelic ratio and every detectable gene in the scRNA-seq data set. Only genes that exceed
an FDR threshold of 0.05 and have assigned GO terms of ‘nuclear’ or ‘regulation of gene
expression’ are labelled. X-linked and significant autosomal genes are indicated by red
and blue dots respectively. The pie chart inset illustrates the proportions of correlated
X-linked genes that fall into each kinetic class of silencing.
E) Bulk chromatin RNA-seq data (cf. Figure 4.2 D) demonstrating the relative expression
levels of 6 correlating genes over the time course of NPC differentiation.
Polycomb system, as a RYBP homologue incorporated into non-canonical PRC1 complexes
(Gao et al. 2012), and is also implicated as a genetic negative regulator of YY1 (Basu et al.
2014). In support of these genes as potential candidates involved in the ‘missing link’ be-
tween XCI and exit from pluripotency, expression levels of all positive correlators decrease
during NPC differentiation, whereas Yaf2 is upregulated over the course of the protocol
(Figure 4.12 E). However, it must be noted that correlating expression levels is only one
avenue for investigating this question, and post-transcriptional or post-translational layers
of regulation are likely to be of equal or greater importance.
156
4.11 Discussion
This chapter extends the original time course of Xist induction discussed in Chapter 3,
with the addition of cellular differentiation, to allow for a comprehensive analysis of the
dynamics of gene silencing from 1.5 hours through to complete X chromosome inactivation.
I was able to successfully fit exponential curves to the allelic ratio trajectories of individual
genes and thus derive kinetic parameters that can be used to summarise across the time
course and compare sets of genes. The exponential model I used is the analytical solution
to the simple differential equation:
dydt = k −Ay
which is formulated from the minimal inference that the rate of decrease of a given quantity
(y) depends on the quantity itself being limiting in a process. When conceptualised in
terms of XCI, this could take the form of chromatin substrates (e.g. acetylated histones)
that pathways downstream of Xist act upon being converted and thus becoming more
sparse as gene silencing progresses. In reality, the mechanisms that constitute XCI are
more complex than can be explained by this simple kinetic model and the introduction
of additional parameters may lead to improvements in fit to the experimental data. A
context where this seems to be the case is the ‘S-shaped’ trajectory characteristic of the
earliest timepoints of silencing. Indeed, in the study by Zylicz et al. which focuses more
closely on this window, the authors opted to fit their data to a four-parameter ‘log-logistic’
model that takes this sigmoidal shape (Zylicz et al. 2019). In the course of my analysis,
I tried both the log-logistic model and alternative approaches to account for this initial
discordance, such as explicitly modelling a ‘time delay’ into each gene. Eventually I decided
that the advantages of the exponential model, namely easy parameterisation and excellent
fit to timepoints beyond six hours, outweigh potential inaccuracies. In particular, the
157
halftime (t1/2) is an intuitive measure facilitating the categorisation of genes into kinetic
classes and thus examination of potential features that mediate gene-gene differences in
silencing dynamics. These are both useful tools for the analysis of mutants discussed in
Chapter 5 and Chapter 6.
An additional benefit of extending the time course of Xist induction to NPC differentiation
is that it enables the identification of genes that fail to fully inactivate. These ‘escapee’
genes are of interest as many are linked to genetic diseases that can have abnormal pat-
terns of inheritance or penetrance in humans. For example, KDM6A is associated with
a rare X-linked dominant form of the Kabuki syndrome (Van Laarhoven et al. 2015) and
mutations in KDM5C can result in X-linked intellectual disability syndromes in heterozy-
gous females (Carmignac et al. 2020). Greater understanding of the molecular mechanisms
underpinning escape could lead to more effective treatment of these escapee-gene associ-
ated conditions, or indeed situations of haploinsufficiency where promoting escape could
lead to favourable outcomes (Najm et al. 2008; Patel et al. 2020). To this end, further
studies focusing on cell type-specific or strain-specific escape (e.g. Nono) may reveal subtle
cis or trans features underlying different silencing fates of genes. Whilst the examples of
apparent stochastic escape between replicates of NPC derivations (Figure 4.2 F) are more
inexplicable, they could be a result of cellular heterogeneity within mixed cell populations.
A wider analysis of single cell data sets such as the one presented here may reveal more
instances of facultative escape and identify properties of individual cells that are asso-
ciated with the escape of specific genes. Finally, it is important to note that there are
significantly more escapee genes in human than mice (Yang et al. 2010; Carrel and Willard
2005), so the two species may not necessarily have equivalent mechanisms of escape from
XCI.
A novel approach I took in the experiments discussed in this chapter was to focus on a
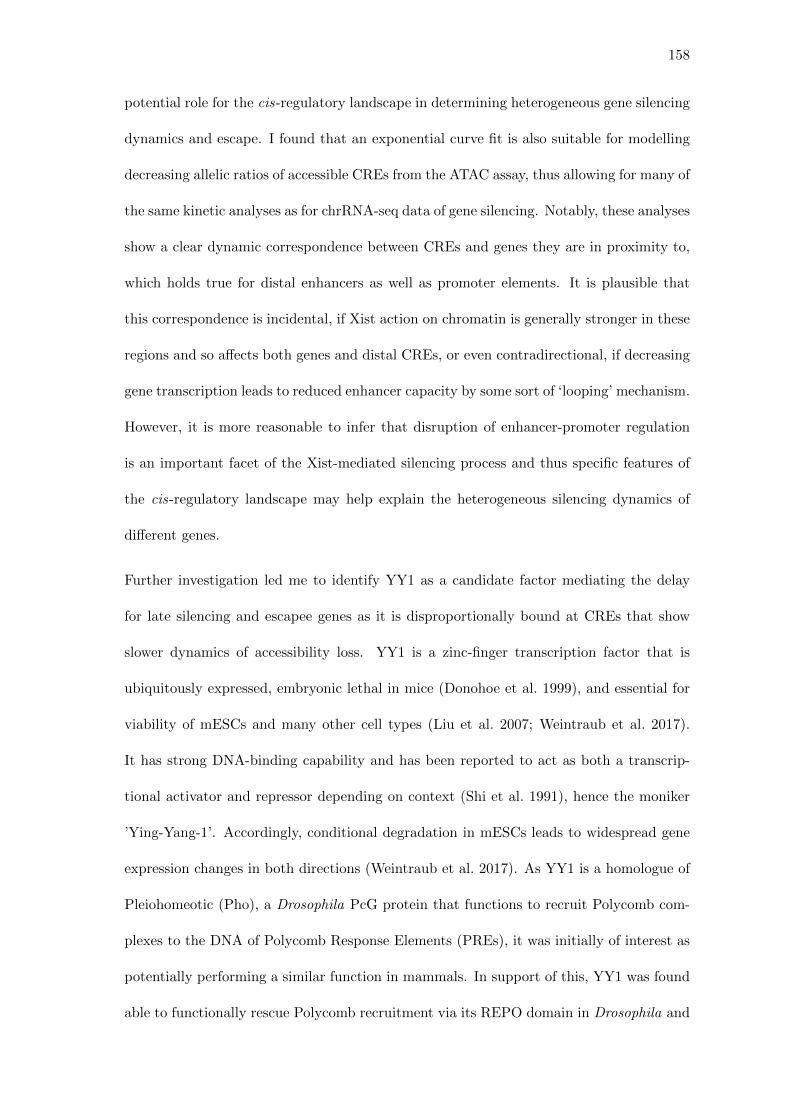
158
potential role for the cis-regulatory landscape in determining heterogeneous gene silencing
dynamics and escape. I found that an exponential curve fit is also suitable for modelling
decreasing allelic ratios of accessible CREs from the ATAC assay, thus allowing for many of
the same kinetic analyses as for chrRNA-seq data of gene silencing. Notably, these analyses
show a clear dynamic correspondence between CREs and genes they are in proximity to,
which holds true for distal enhancers as well as promoter elements. It is plausible that
this correspondence is incidental, if Xist action on chromatin is generally stronger in these
regions and so affects both genes and distal CREs, or even contradirectional, if decreasing
gene transcription leads to reduced enhancer capacity by some sort of ‘looping’ mechanism.
However, it is more reasonable to infer that disruption of enhancer-promoter regulation
is an important facet of the Xist-mediated silencing process and thus specific features of
the cis-regulatory landscape may help explain the heterogeneous silencing dynamics of
different genes.
Further investigation led me to identify YY1 as a candidate factor mediating the delay
for late silencing and escapee genes as it is disproportionally bound at CREs that show
slower dynamics of accessibility loss. YY1 is a zinc-finger transcription factor that is
ubiquitously expressed, embryonic lethal in mice (Donohoe et al. 1999), and essential for
viability of mESCs and many other cell types (Liu et al. 2007; Weintraub et al. 2017).
It has strong DNA-binding capability and has been reported to act as both a transcrip-
tional activator and repressor depending on context (Shi et al. 1991), hence the moniker
’Ying-Yang-1’. Accordingly, conditional degradation in mESCs leads to widespread gene
expression changes in both directions (Weintraub et al. 2017). As YY1 is a homologue of
Pleiohomeotic (Pho), a Drosophila PcG protein that functions to recruit Polycomb com-
plexes to the DNA of Polycomb Response Elements (PREs), it was initially of interest as
potentially performing a similar function in mammals. In support of this, YY1 was found
able to functionally rescue Polycomb recruitment via its REPO domain in Drosophila and
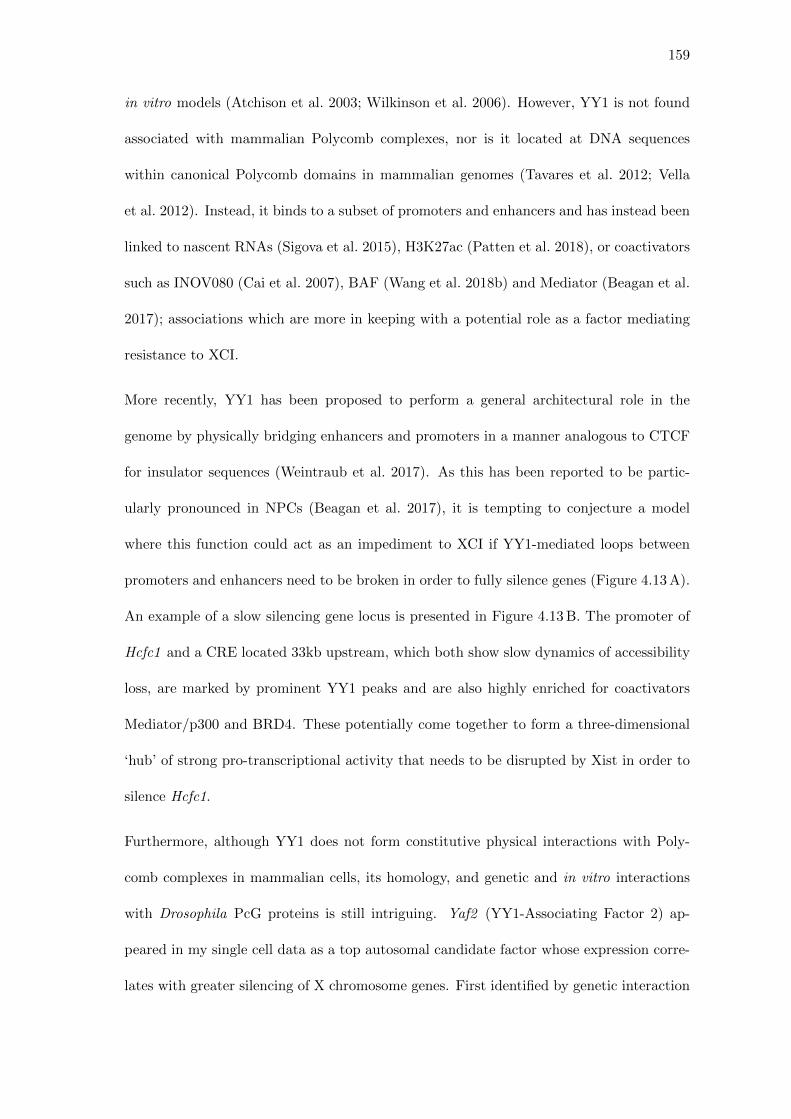
159
in vitro models (Atchison et al. 2003; Wilkinson et al. 2006). However, YY1 is not found
associated with mammalian Polycomb complexes, nor is it located at DNA sequences
within canonical Polycomb domains in mammalian genomes (Tavares et al. 2012; Vella
et al. 2012). Instead, it binds to a subset of promoters and enhancers and has instead been
linked to nascent RNAs (Sigova et al. 2015), H3K27ac (Patten et al. 2018), or coactivators
such as INOV080 (Cai et al. 2007), BAF (Wang et al. 2018b) and Mediator (Beagan et al.
2017); associations which are more in keeping with a potential role as a factor mediating
resistance to XCI.
More recently, YY1 has been proposed to perform a general architectural role in the
genome by physically bridging enhancers and promoters in a manner analogous to CTCF
for insulator sequences (Weintraub et al. 2017). As this has been reported to be partic-
ularly pronounced in NPCs (Beagan et al. 2017), it is tempting to conjecture a model
where this function could act as an impediment to XCI if YY1-mediated loops between
promoters and enhancers need to be broken in order to fully silence genes (Figure 4.13 A).
An example of a slow silencing gene locus is presented in Figure 4.13 B. The promoter of
Hcfc1 and a CRE located 33kb upstream, which both show slow dynamics of accessibility
loss, are marked by prominent YY1 peaks and are also highly enriched for coactivators
Mediator/p300 and BRD4. These potentially come together to form a three-dimensional
‘hub’ of strong pro-transcriptional activity that needs to be disrupted by Xist in order to
silence Hcfc1.
Furthermore, although YY1 does not form constitutive physical interactions with Poly-
comb complexes in mammalian cells, its homology, and genetic and in vitro interactions
with Drosophila PcG proteins is still intriguing. Yaf2 (YY1-Associating Factor 2) ap-
peared in my single cell data as a top autosomal candidate factor whose expression corre-
lates with greater silencing of X chromosome genes. First identified by genetic interaction
160
YY1
Xist
YY1
via YAF2-PRC1?
via SMCHD1?
enhancer
promoter
TF
coactivator
p300 (GSM918750)
MED12 (GSM2099807)
MED1 (GSM2928425)
BRD4 (GSM3318693)
YY1 (GSM2645432)
Initial RNA expression(chrRNA day 0 unsplit)
CTCF (ENCFF353YWR)
ATAC NPC Day 3
CREsfastmediumslow
CAST (Xa) 129 (Xi)
RNA Pol IItranscription
A
73,950 kb 73,975 kb 74,000 kbChromosome X
[0 - 15]
Hcfc1
B
Figure 4.13: Model of YY1 function as a late-silencing factor
A) YY1 may act as a structural factor forming chromatin loops between promoters
and enhancers, thus indirectly maintaining transcription of target genes. Severance of
‘YY1 bridges’ may require a molecular pathway only recruited by Xist at a late stage of
XCI/differentiation.
B) Genome browser (IGV) screenshot of the Hcfc1 locus, a slow-silencing gene. CREs
with slow dynamics of accessible are present at both the promoter and two upstream
putative enhancers of Hcfc1. In published ChIP-seq data sets performed in mESCs, the
promoter and one enhancer in particular are strongly enriched for YY1 and other pro-
transcriptional cofactor complexes (e.g. Mediator, BRD4). GEO accession numbers are
given for each track, downloaded from the following publications: CTCF (Dunham et al.
2012), YY1 (Weintraub et al. 2017), BRD4 (Gatchalian et al. 2018), MED1 (Quevedo
et al. 2019), MED12 (Yan et al. 2018), p300 (Shen et al. 2012)
with YY1 in Yeast-2-Hybrid assays (Kalenik et al. 1997), YAF2 and its close homologue
RYBP were later recognised as components of non-canonical PRC1 complexes (Gao et
al. 2012; Tavares et al. 2012), the key players in Xist-mediated Polycomb recruitment
(see 1.3.4), and thus largely unrelated to YY1 in mammalian cells. Although YAF2 and
161
RYBP seem to show functional redundancy, they are mutually exclusive components of
non-canonical PRC1 complexes with only 54% amino acid conservation in mouse (Sawa
et al. 2002; Rose et al. 2016; Almeida et al. 2017), thus differential functions are conceiv-
able. As Yaf2 is upregulated over NPC differentiation whereas Rybp expression declines,
transitions in ncPRC1 complex composition during differentiation could be linked to later
pathways of XCI. Finally, PRC1 has also been implicated in loop formation in the genome
(Schoenfelder et al. 2015; Kundu et al. 2017) and 3D-compaction of the inactive X (Wang
et al. 2019; Markaki et al. 2020) so a negative interplay with YY1-anchored enhancer-
promoter loops is not beyond the realms of possibility.
Considerably more experimental work is required to determine if YY1 is a bona fide factor
mediating late silencing and/or escape. The first step will be to confirm by ChIP-seq
whether YY1 - unlike OCT4 – remains bound to target sequences on Xi late on in the
silencing process. If this is the case, further investigation could involve various genetic ma-
nipulations, such as conditional YY1 degradation (Weintraub et al. 2017) or Yaf2 and/or
Rybp knockout (Rose et al. 2016; Almeida et al. 2017), matched with experimental tech-
niques capable of assaying chromatin looping on chrX in high resolution, such as HiChIP
(Mumbach et al. 2016) or Capture-C (Davies et al. 2015).
This chapter also presents a pilot single cell RNA-seq experiment aimed at addressing the
extent of cellular heterogeneity in gene silencing within the model system of iXist-ChrX
cells. Although it was largely successful for this purpose, there are many ways in which
the Smart-seq2 assay could be improved for allelic analysis. To start, paired-end rather
than single-end sequencing would slightly increase the ∼20% allelic assignment of reads
in single cell libraries. Similarly, although extraction of just the chromatin fraction of
individual cells may not be technically possible, single nuclei sorting by FACS is feasi-
ble and would both improve representation of SNP-containing intronic reads and reflect
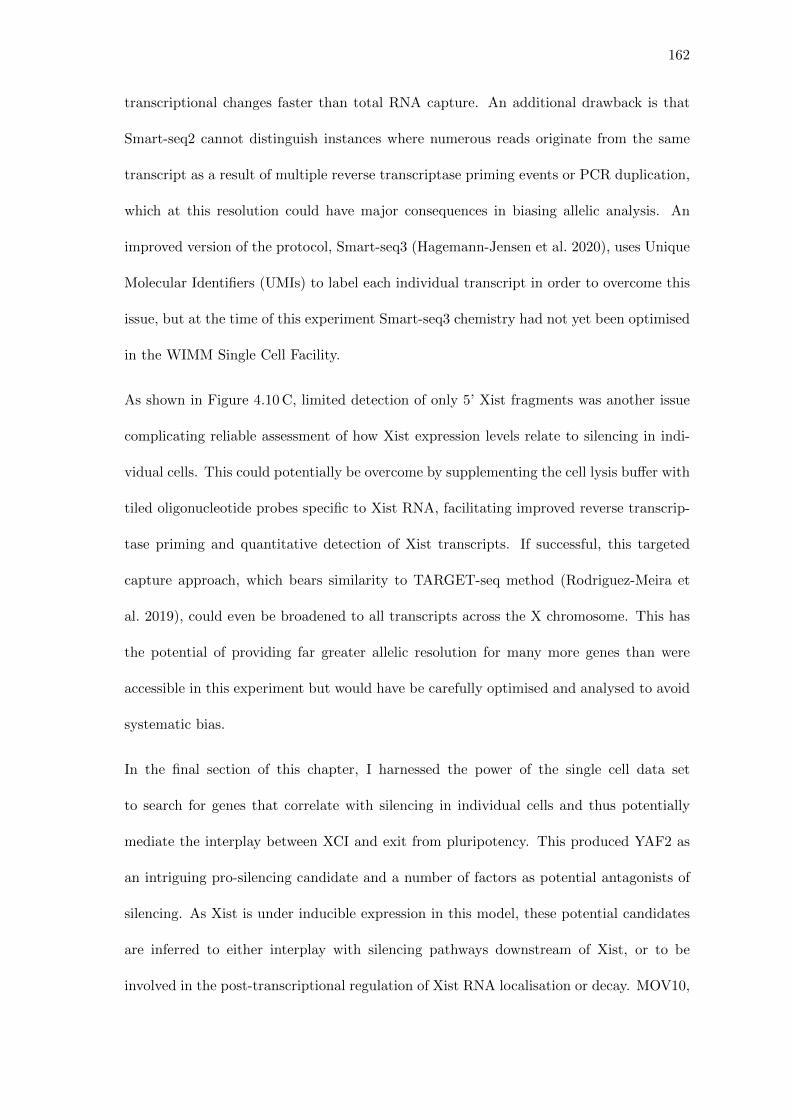
162
transcriptional changes faster than total RNA capture. An additional drawback is that
Smart-seq2 cannot distinguish instances where numerous reads originate from the same
transcript as a result of multiple reverse transcriptase priming events or PCR duplication,
which at this resolution could have major consequences in biasing allelic analysis. An
improved version of the protocol, Smart-seq3 (Hagemann-Jensen et al. 2020), uses Unique
Molecular Identifiers (UMIs) to label each individual transcript in order to overcome this
issue, but at the time of this experiment Smart-seq3 chemistry had not yet been optimised
in the WIMM Single Cell Facility.
As shown in Figure 4.10 C, limited detection of only 5’ Xist fragments was another issue
complicating reliable assessment of how Xist expression levels relate to silencing in indi-
vidual cells. This could potentially be overcome by supplementing the cell lysis buffer with
tiled oligonucleotide probes specific to Xist RNA, facilitating improved reverse transcrip-
tase priming and quantitative detection of Xist transcripts. If successful, this targeted
capture approach, which bears similarity to TARGET-seq method (Rodriguez-Meira et
al. 2019), could even be broadened to all transcripts across the X chromosome. This has
the potential of providing far greater allelic resolution for many more genes than were
accessible in this experiment but would have be carefully optimised and analysed to avoid
systematic bias.
In the final section of this chapter, I harnessed the power of the single cell data set
to search for genes that correlate with silencing in individual cells and thus potentially
mediate the interplay between XCI and exit from pluripotency. This produced YAF2 as
an intriguing pro-silencing candidate and a number of factors as potential antagonists of
silencing. As Xist is under inducible expression in this model, these potential candidates
are inferred to either interplay with silencing pathways downstream of Xist, or to be
involved in the post-transcriptional regulation of Xist RNA localisation or decay. MOV10,
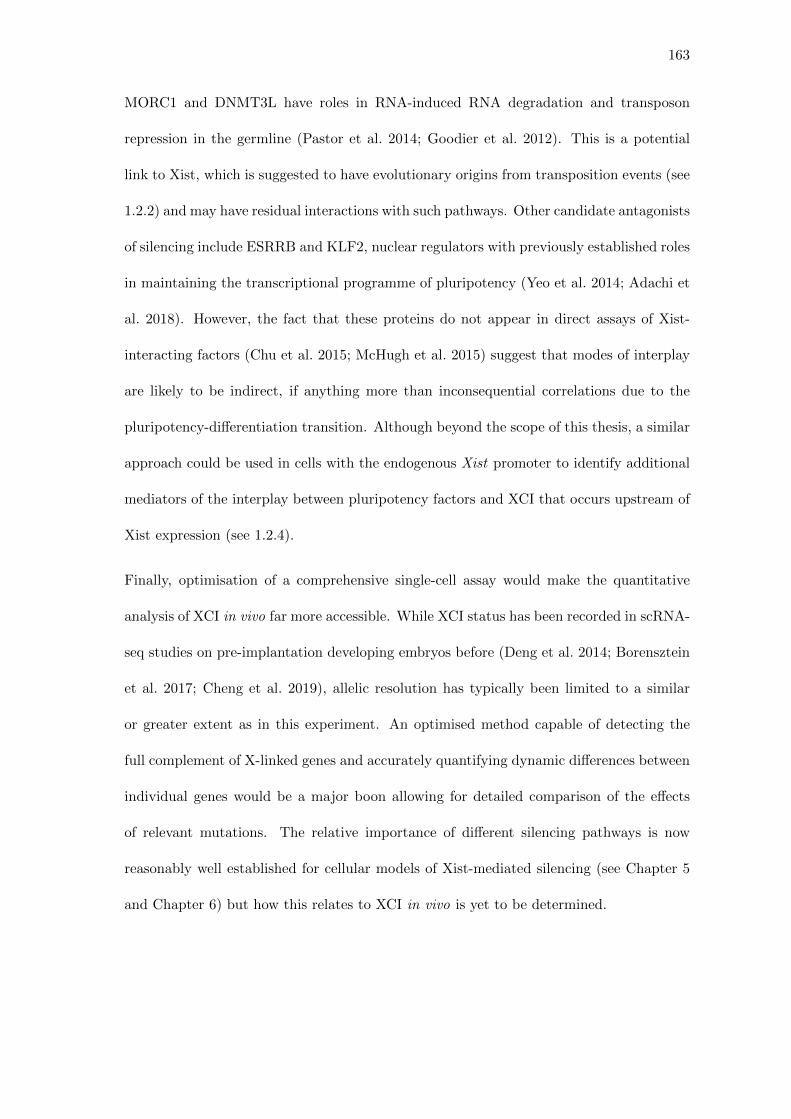
163
MORC1 and DNMT3L have roles in RNA-induced RNA degradation and transposon
repression in the germline (Pastor et al. 2014; Goodier et al. 2012). This is a potential
link to Xist, which is suggested to have evolutionary origins from transposition events (see
1.2.2) and may have residual interactions with such pathways. Other candidate antagonists
of silencing include ESRRB and KLF2, nuclear regulators with previously established roles
in maintaining the transcriptional programme of pluripotency (Yeo et al. 2014; Adachi et
al. 2018). However, the fact that these proteins do not appear in direct assays of Xist-
interacting factors (Chu et al. 2015; McHugh et al. 2015) suggest that modes of interplay
are likely to be indirect, if anything more than inconsequential correlations due to the
pluripotency-differentiation transition. Although beyond the scope of this thesis, a similar
approach could be used in cells with the endogenous Xist promoter to identify additional
mediators of the interplay between pluripotency factors and XCI that occurs upstream of
Xist expression (see 1.2.4).
Finally, optimisation of a comprehensive single-cell assay would make the quantitative
analysis of XCI in vivo far more accessible. While XCI status has been recorded in scRNA-
seq studies on pre-implantation developing embryos before (Deng et al. 2014; Borensztein
et al. 2017; Cheng et al. 2019), allelic resolution has typically been limited to a similar
or greater extent as in this experiment. An optimised method capable of detecting the
full complement of X-linked genes and accurately quantifying dynamic differences between
individual genes would be a major boon allowing for detailed comparison of the effects
of relevant mutations. The relative importance of different silencing pathways is now
reasonably well established for cellular models of Xist-mediated silencing (see Chapter 5
and Chapter 6) but how this relates to XCI in vivo is yet to be determined.
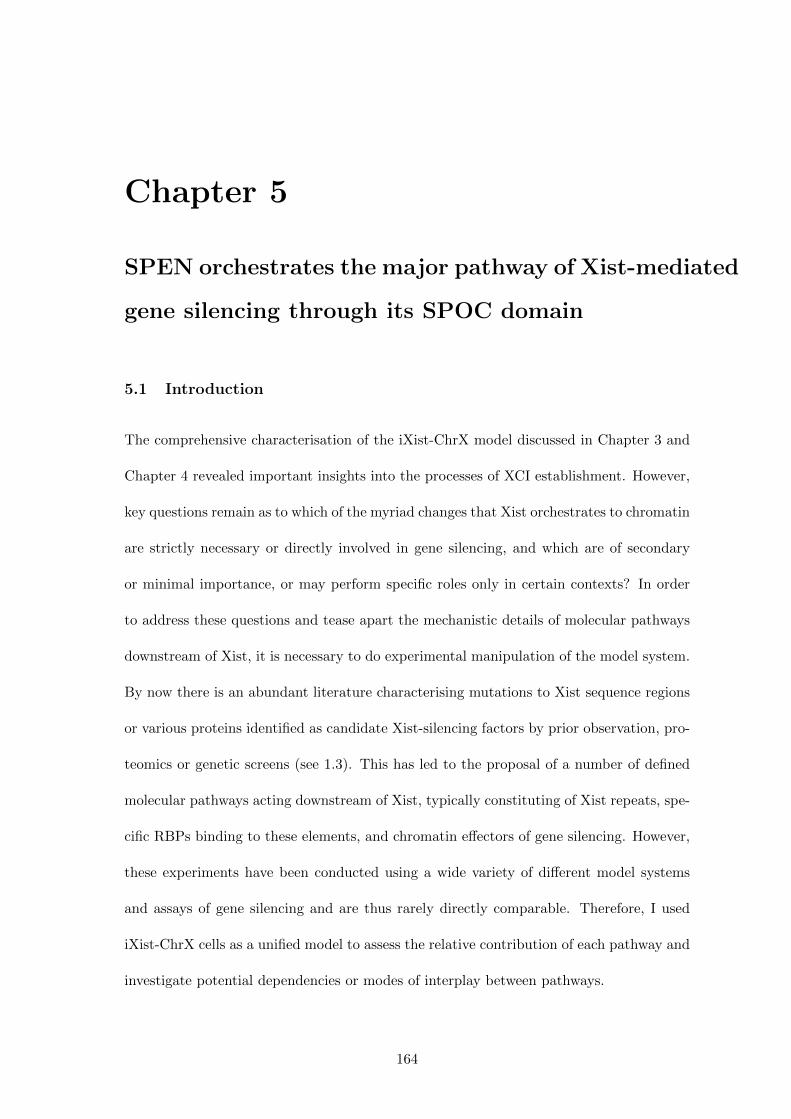
Chapter 5
SPEN orchestrates the major pathway of Xist-mediated
gene silencing through its SPOC domain
5.1 Introduction
The comprehensive characterisation of the iXist-ChrX model discussed in Chapter 3 and
Chapter 4 revealed important insights into the processes of XCI establishment. However,
key questions remain as to which of the myriad changes that Xist orchestrates to chromatin
are strictly necessary or directly involved in gene silencing, and which are of secondary
or minimal importance, or may perform specific roles only in certain contexts? In order
to address these questions and tease apart the mechanistic details of molecular pathways
downstream of Xist, it is necessary to do experimental manipulation of the model system.
By now there is an abundant literature characterising mutations to Xist sequence regions
or various proteins identified as candidate Xist-silencing factors by prior observation, pro-
teomics or genetic screens (see 1.3). This has led to the proposal of a number of defined
molecular pathways acting downstream of Xist, typically constituting of Xist repeats, spe-
cific RBPs binding to these elements, and chromatin effectors of gene silencing. However,
these experiments have been conducted using a wide variety of different model systems
and assays of gene silencing and are thus rarely directly comparable. Therefore, I used
iXist-ChrX cells as a unified model to assess the relative contribution of each pathway and
investigate potential dependencies or modes of interplay between pathways.
164
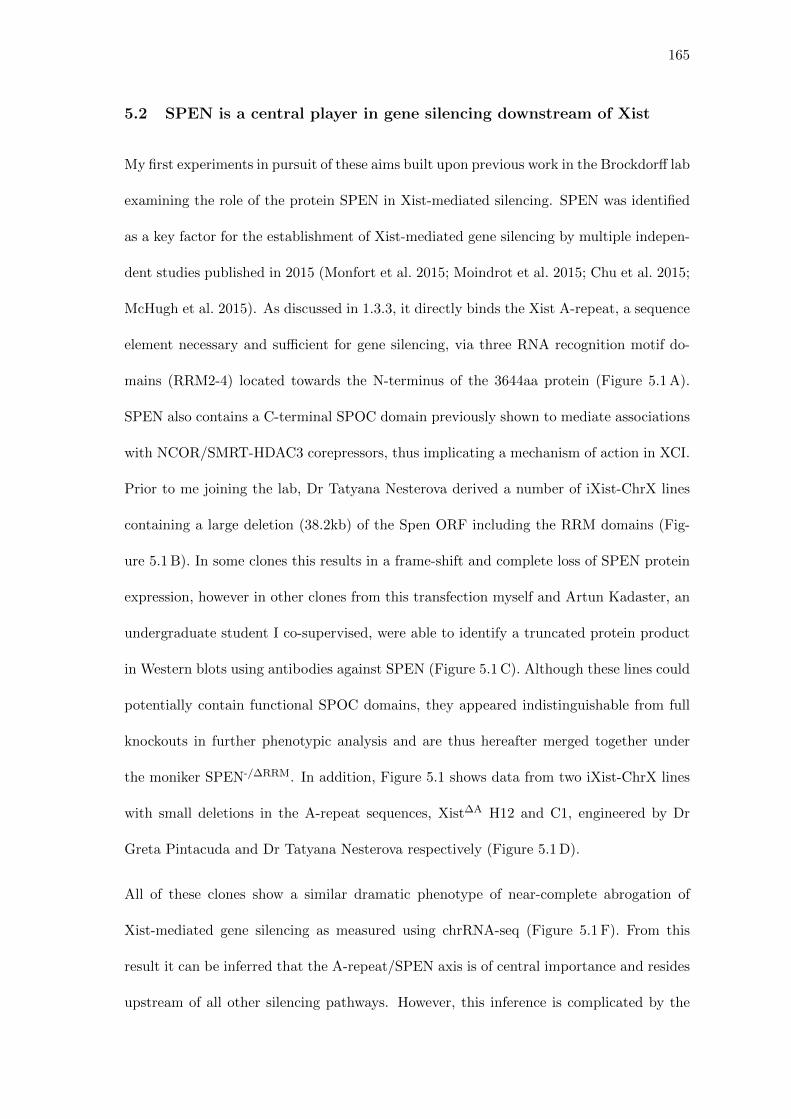
165
5.2 SPEN is a central player in gene silencing downstream of Xist
My first experiments in pursuit of these aims built upon previous work in the Brockdorff lab
examining the role of the protein SPEN in Xist-mediated silencing. SPEN was identified
as a key factor for the establishment of Xist-mediated gene silencing by multiple indepen-
dent studies published in 2015 (Monfort et al. 2015; Moindrot et al. 2015; Chu et al. 2015;
McHugh et al. 2015). As discussed in 1.3.3, it directly binds the Xist A-repeat, a sequence
element necessary and sufficient for gene silencing, via three RNA recognition motif do-
mains (RRM2-4) located towards the N-terminus of the 3644aa protein (Figure 5.1 A).
SPEN also contains a C-terminal SPOC domain previously shown to mediate associations
with NCOR/SMRT-HDAC3 corepressors, thus implicating a mechanism of action in XCI.
Prior to me joining the lab, Dr Tatyana Nesterova derived a number of iXist-ChrX lines
containing a large deletion (38.2kb) of the Spen ORF including the RRM domains (Fig-
ure 5.1 B). In some clones this results in a frame-shift and complete loss of SPEN protein
expression, however in other clones from this transfection myself and Artun Kadaster, an
undergraduate student I co-supervised, were able to identify a truncated protein product
in Western blots using antibodies against SPEN (Figure 5.1 C). Although these lines could
potentially contain functional SPOC domains, they appeared indistinguishable from full
knockouts in further phenotypic analysis and are thus hereafter merged together under
the moniker SPEN-/∆RRM. In addition, Figure 5.1 shows data from two iXist-ChrX lines
with small deletions in the A-repeat sequences, Xist∆A H12 and C1, engineered by Dr
Greta Pintacuda and Dr Tatyana Nesterova respectively (Figure 5.1 D).
All of these clones show a similar dramatic phenotype of near-complete abrogation of
Xist-mediated gene silencing as measured using chrRNA-seq (Figure 5.1 F). From this
result it can be inferred that the A-repeat/SPEN axis is of central importance and resides
upstream of all other silencing pathways. However, this inference is complicated by the
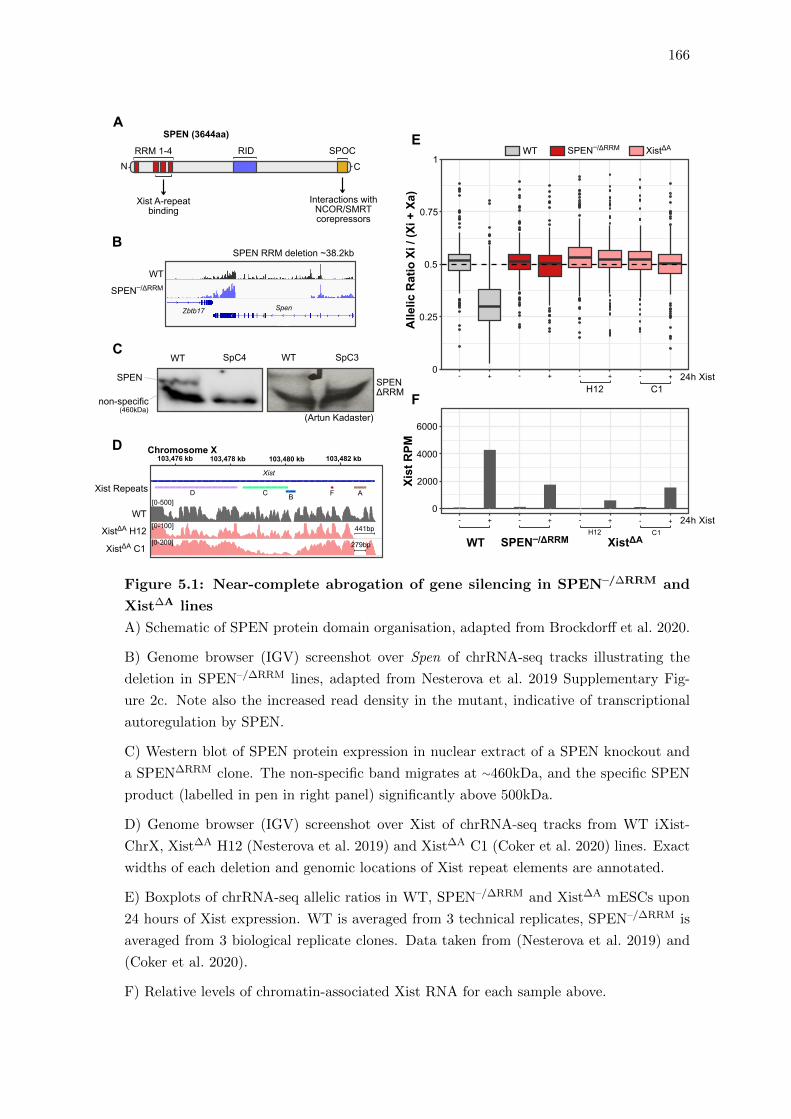
166
+-
H12 C1+- +- +-
0
0.25
0.5
0.75
1
24h Xist
E
B
A
WT SPEN–/ΔRRM
SPEN–/ΔRRM
XistΔA
AllelicRatioXi/ (Xi+Xa)
SPEN RRM deletion ~38.2kb
Spen
WT
(Artun Kadaster)
Zbtb17
103,480 kb103,478 kb103,476 kb 103,482 kbD Chromosome X
Xist Repeats
Xist
D F AC B
XistΔA H12
WT
XistΔA C1
[0-100]
[0-500]
279bp
441bp
(460kDa)
[0-200]
WT WTSpC4 SpC3
SPEN SPENΔRRM
non-specific
C
WT SPEN–/ΔRRM XistΔA+-
H12 C1
+- +- +-0
2000
4000
6000
24h Xist
FXistRPM
NRRM 1-4 RID SPOC
SPEN (3644aa)
C
Xist A-repeatbinding
Interactions withNCOR/SMRTcorepressors
Figure 5.1: Near-complete abrogation of gene silencing in SPEN–/∆RRM and
Xist∆A lines
A) Schematic of SPEN protein domain organisation, adapted from Brockdorff et al. 2020.
B) Genome browser (IGV) screenshot over Spen of chrRNA-seq tracks illustrating the
deletion in SPEN–/∆RRM lines, adapted from Nesterova et al. 2019 Supplementary Fig-
ure 2c. Note also the increased read density in the mutant, indicative of transcriptional
autoregulation by SPEN.
C) Western blot of SPEN protein expression in nuclear extract of a SPEN knockout and
a SPEN∆RRM clone. The non-specific band migrates at ∼460kDa, and the specific SPEN
product (labelled in pen in right panel) significantly above 500kDa.
D) Genome browser (IGV) screenshot over Xist of chrRNA-seq tracks from WT iXist-
ChrX, Xist∆A H12 (Nesterova et al. 2019) and Xist∆A C1 (Coker et al. 2020) lines. Exact
widths of each deletion and genomic locations of Xist repeat elements are annotated.
E) Boxplots of chrRNA-seq allelic ratios in WT, SPEN–/∆RRM and Xist∆A mESCs upon
24 hours of Xist expression. WT is averaged from 3 technical replicates, SPEN–/∆RRM is
averaged from 3 biological replicate clones. Data taken from (Nesterova et al. 2019) and
(Coker et al. 2020).
F) Relative levels of chromatin-associated Xist RNA for each sample above.
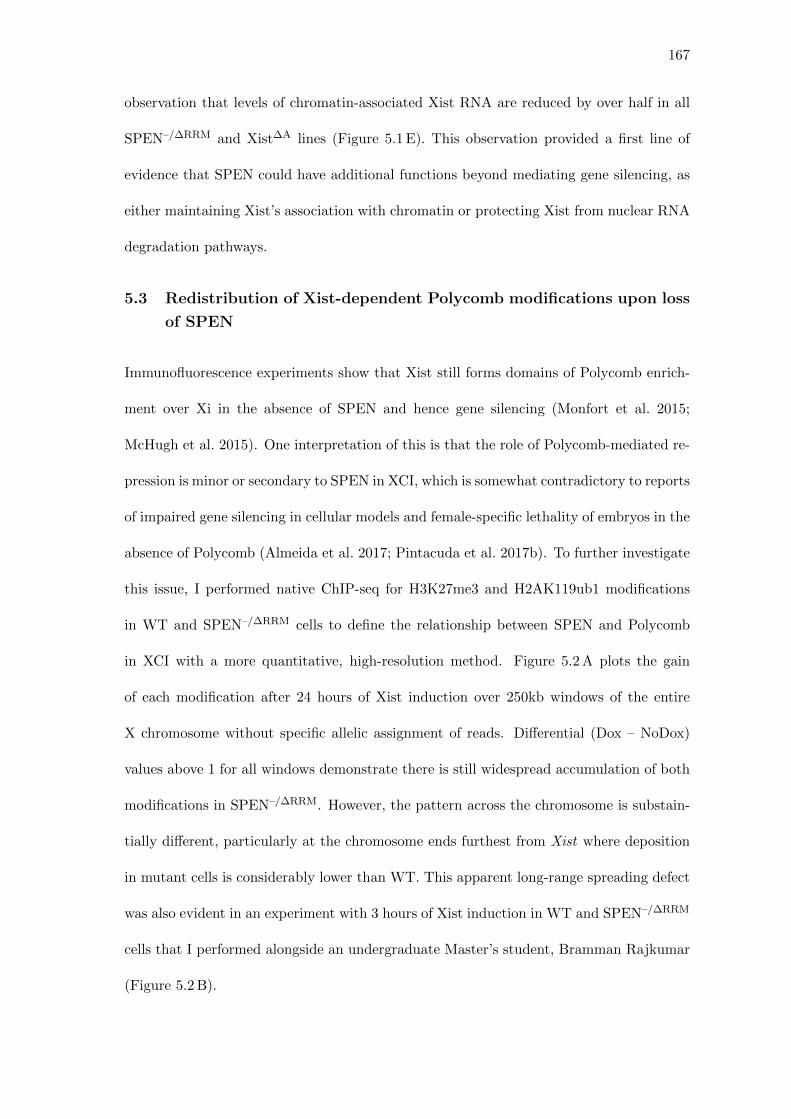
167
observation that levels of chromatin-associated Xist RNA are reduced by over half in all
SPEN–/∆RRM and Xist∆A lines (Figure 5.1 E). This observation provided a first line of
evidence that SPEN could have additional functions beyond mediating gene silencing, as
either maintaining Xist’s association with chromatin or protecting Xist from nuclear RNA
degradation pathways.
5.3 Redistribution of Xist-dependent Polycomb modifications upon loss
of SPEN
Immunofluorescence experiments show that Xist still forms domains of Polycomb enrich-
ment over Xi in the absence of SPEN and hence gene silencing (Monfort et al. 2015;
McHugh et al. 2015). One interpretation of this is that the role of Polycomb-mediated re-
pression is minor or secondary to SPEN in XCI, which is somewhat contradictory to reports
of impaired gene silencing in cellular models and female-specific lethality of embryos in the
absence of Polycomb (Almeida et al. 2017; Pintacuda et al. 2017b). To further investigate
this issue, I performed native ChIP-seq for H3K27me3 and H2AK119ub1 modifications
in WT and SPEN–/∆RRM cells to define the relationship between SPEN and Polycomb
in XCI with a more quantitative, high-resolution method. Figure 5.2 A plots the gain
of each modification after 24 hours of Xist induction over 250kb windows of the entire
X chromosome without specific allelic assignment of reads. Differential (Dox – NoDox)
values above 1 for all windows demonstrate there is still widespread accumulation of both
modifications in SPEN–/∆RRM. However, the pattern across the chromosome is substain-
tially different, particularly at the chromosome ends furthest from Xist where deposition
in mutant cells is considerably lower than WT. This apparent long-range spreading defect
was also evident in an experiment with 3 hours of Xist induction in WT and SPEN–/∆RRM
cells that I performed alongside an undergraduate Master’s student, Bramman Rajkumar
(Figure 5.2 B).
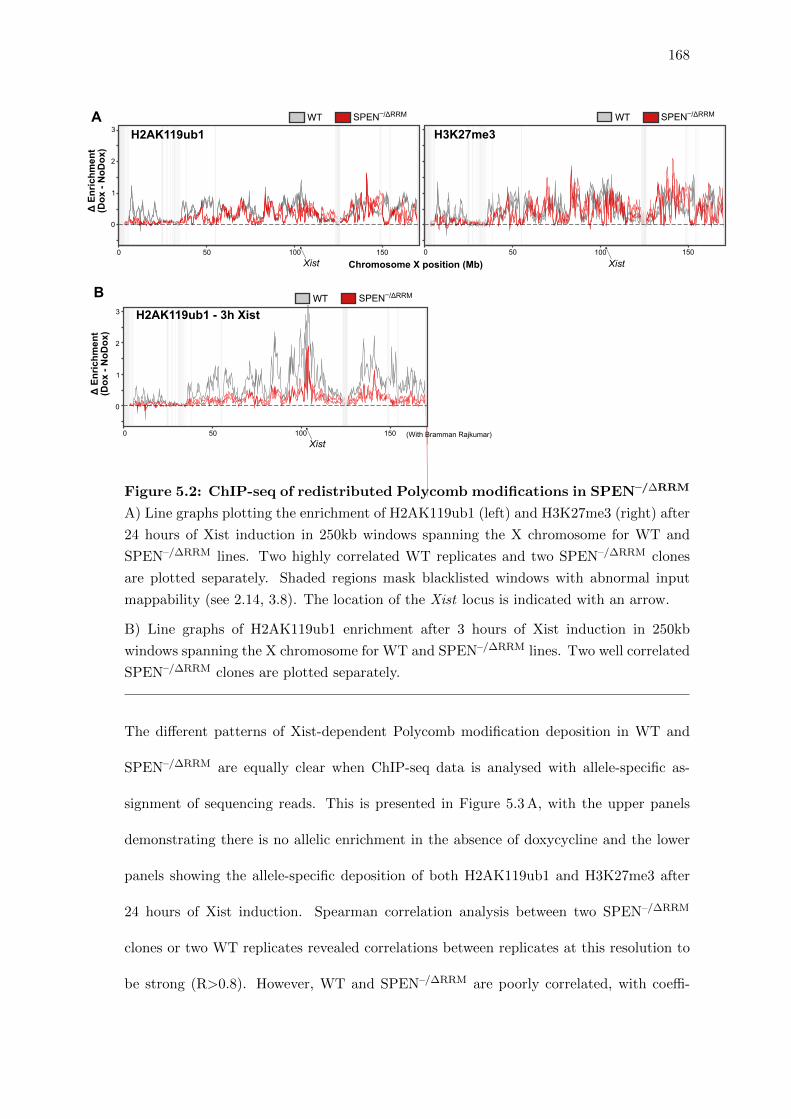
168
ΔEn
richm
ent
(Dox
-NoD
ox)
0
1
2
3
Xist0 50 100 150
H2AK119ub1 - 3h XistWT SPEN–/ΔRRM
(With Bramman Rajkumar)
ΔEn
richm
ent
(Dox
-NoD
ox)
0
1
2
3
Xist0 50 100 150
Xist0 50 100 150
Chromosome X position (Mb)
H2AK119ub1 H3K27me3WT SPEN–/ΔRRM WT SPEN–/ΔRRMA
B
Figure 5.2: ChIP-seq of redistributed Polycomb modifications in SPEN–/∆RRM
A) Line graphs plotting the enrichment of H2AK119ub1 (left) and H3K27me3 (right) after
24 hours of Xist induction in 250kb windows spanning the X chromosome for WT and
SPEN–/∆RRM lines. Two highly correlated WT replicates and two SPEN–/∆RRM clones
are plotted separately. Shaded regions mask blacklisted windows with abnormal input
mappability (see 2.14, 3.8). The location of the Xist locus is indicated with an arrow.
B) Line graphs of H2AK119ub1 enrichment after 3 hours of Xist induction in 250kb
windows spanning the X chromosome for WT and SPEN–/∆RRM lines. Two well correlated
SPEN–/∆RRM clones are plotted separately.
The different patterns of Xist-dependent Polycomb modification deposition in WT and
SPEN–/∆RRM are equally clear when ChIP-seq data is analysed with allele-specific as-
signment of sequencing reads. This is presented in Figure 5.3 A, with the upper panels
demonstrating there is no allelic enrichment in the absence of doxycycline and the lower
panels showing the allele-specific deposition of both H2AK119ub1 and H3K27me3 after
24 hours of Xist induction. Spearman correlation analysis between two SPEN–/∆RRM
clones or two WT replicates revealed correlations between replicates at this resolution to
be strong (R>0.8). However, WT and SPEN–/∆RRM are poorly correlated, with coeffi-
169
cients of R=0.11 and R=0.36 for H2AK119ub1 and H3K27me3 respectively. This stark
redistribution phenotype was not visible in previous immunofluorescence experiments as
the overall quantitative reductions in Xi-specific Polycomb enrichment in SPEN–/∆RRM
are relatively minor (Figure 5.3 C).
To further analyse this redistribution of Xist-dependent Polycomb in SPEN–/∆RRM, I sub-
tracted the allelic enrichment in WT from the mutant for each window across the chromo-
some (Figure 5.3 B). Strikingly, ‘valleys’ of differential enrichment correspond closely to the
genomic locations of expressed genes, whereas large regions lacking genes (e.g. 60-70Mb,
87-94Mb) are more enriched in the mutant. Meta-gene analysis confirmed that there is
little to no TSS-associated gain of either modification in SPEN–/∆RRM cells, in contrast
to WT where there is clear enrichment in these regions (Figure 5.3 D). One interpretation
of this result is that active genes cannot acquire Polycomb modifications without SPEN-
mediated silencing pathways first erasing active chromatin states at these loci. This must
be at least a contributory factor as H3K27me3 deposition by PRC2 is known to be antago-
nised by active chromatin modifications (Pasini et al. 2010; Schmitges et al. 2011; Yuan et
al. 2011). However, as shown in Figure 3.10, H2AK119ub1 is significantly enriched on Xi
after 3 hours of Xist induction before there is appreciable gene silencing, and furthermore
closely tracks with the spreading and localisation of Xist RNA across the chromosome.
Accordingly, this observation suggests that SPEN binding to Xist has an additional role
in localising Xist RNA to its normal target regions of gene-rich Xi chromatin, independent
from the downstream pathway of gene silencing. In this case, mislocalisation of Xist RNA
could result in redistribution of Polycomb modifications away from active genes, and thus
account for part of the severe gene silencing defect in SPEN–/∆RRM cells.
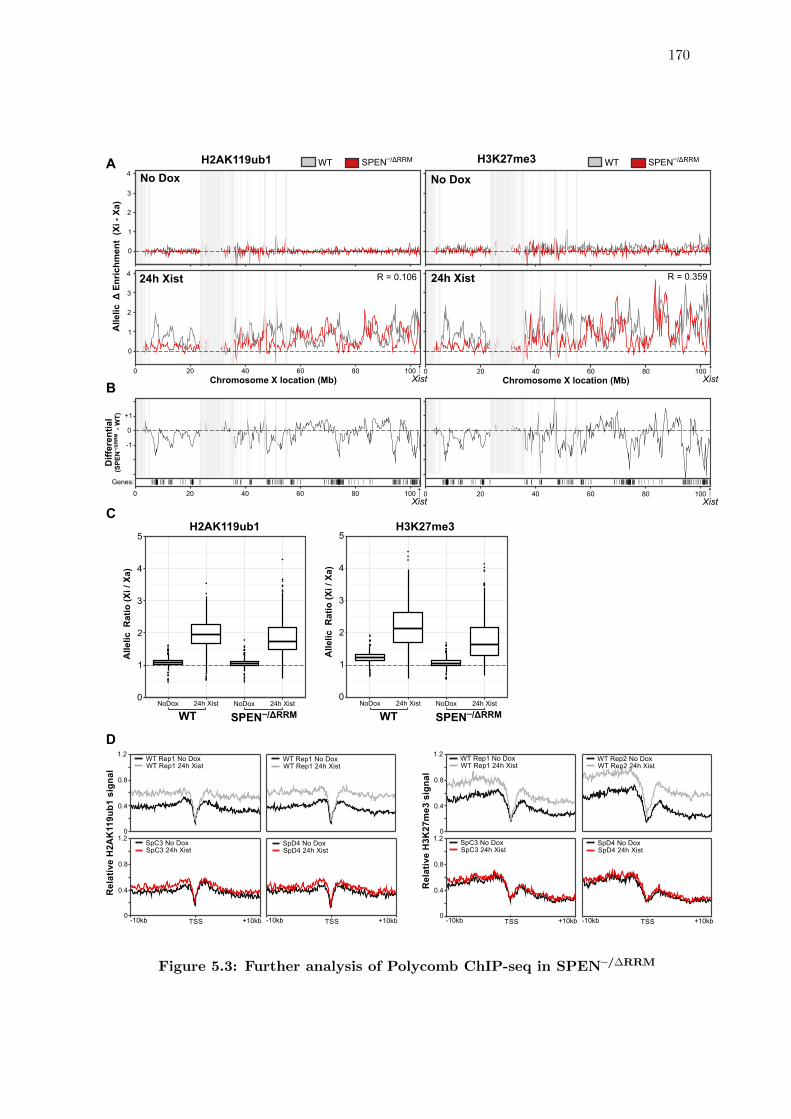
170
B
C
DWT Rep1 No DoxWT Rep1 24h Xist
SpC3 No DoxSpC3 24h Xist
WT Rep2 No DoxWT Rep2 24h Xist
SpD4 No DoxSpD4 24h Xist
-10kb TSS +10kb -10kb TSS +10kb
0
0.4
0.8
1.2
0
0.4
0.8
1.2
RelativeH3K
27me3
sign
al
WT Rep1 No DoxWT Rep1 24h Xist
SpC3 No DoxSpC3 24h Xist
WT Rep1 No DoxWT Rep1 24h Xist
SpD4 No DoxSpD4 24h Xist
-10kb TSS +10kb-10kb TSS +10kb
0
0.4
0.8
1.2
0
0.4
0.8
1.2
RelativeH2A
K119ub1
sign
al
2
1
4
5
0
3
NoDox 24h Xist NoDox 24h Xist
Allelic
Ratio(Xi /Xa
)
H3K27me3
WT SPEN–/ΔRRM
2
1
4
5
0
3
NoDox 24h Xist NoDox 24h Xist
Allelic
Ratio(Xi /Xa
)
H2AK119ub1
WT SPEN–/ΔRRM
R = 0.106 R = 0.359
Xist0 20 40 60 80 100 0 20 40 60 80 100
Xist
Xist
Genes:
0 20 40 60 80 100 0 20 40 60 80 100Xist
No Dox
24h Xist
No Dox
24h Xist
0
1
2
3
4
0
1
2
3
4
Allelic
ΔEn
richm
ent(Xi -Xa
)
0
+1
-1
Differential
(SPE
N– /ΔRRM- W
T)
Chromosome X location (Mb) Chromosome X location (Mb)
WT SPEN–/ΔRRM WT SPEN–/ΔRRMA H3K27me3H2AK119ub1
Figure 5.3: Further analysis of Polycomb ChIP-seq in SPEN–/∆RRM
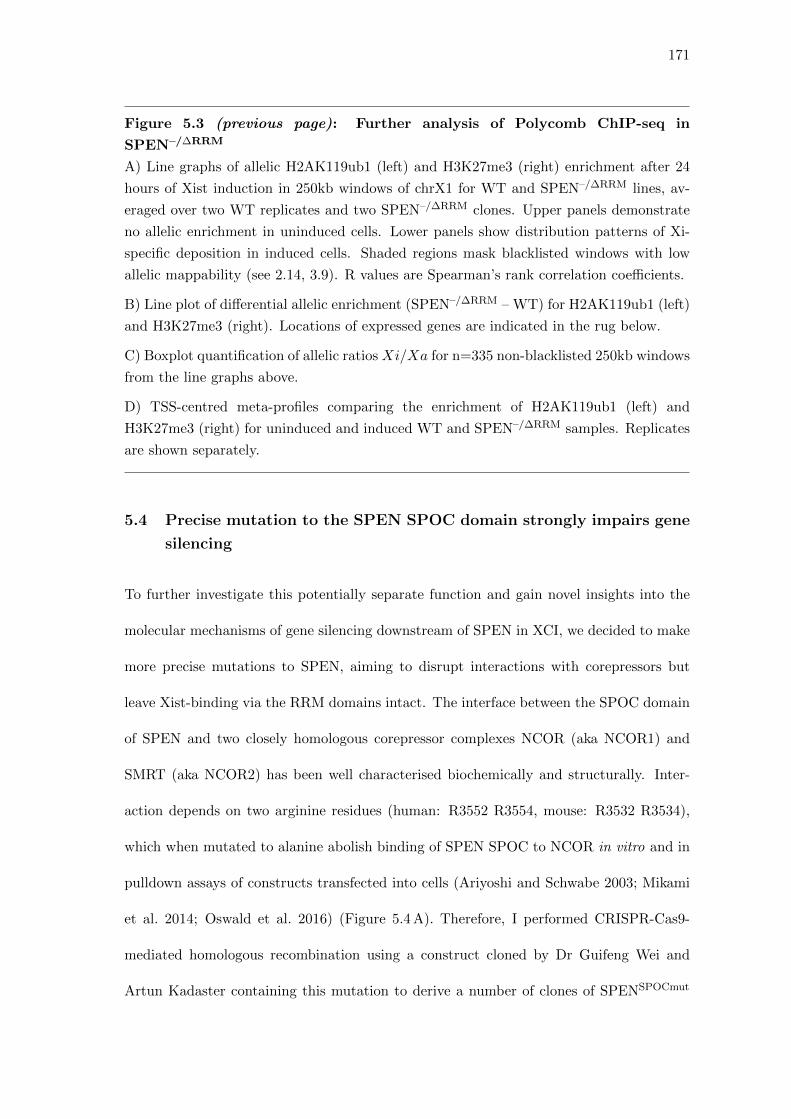
171
Figure 5.3 (previous page): Further analysis of Polycomb ChIP-seq in
SPEN–/∆RRM
A) Line graphs of allelic H2AK119ub1 (left) and H3K27me3 (right) enrichment after 24
hours of Xist induction in 250kb windows of chrX1 for WT and SPEN–/∆RRM lines, av-
eraged over two WT replicates and two SPEN–/∆RRM clones. Upper panels demonstrate
no allelic enrichment in uninduced cells. Lower panels show distribution patterns of Xi-
specific deposition in induced cells. Shaded regions mask blacklisted windows with low
allelic mappability (see 2.14, 3.9). R values are Spearman’s rank correlation coefficients.
B) Line plot of differential allelic enrichment (SPEN–/∆RRM – WT) for H2AK119ub1 (left)
and H3K27me3 (right). Locations of expressed genes are indicated in the rug below.
C) Boxplot quantification of allelic ratios Xi/Xa for n=335 non-blacklisted 250kb windows
from the line graphs above.
D) TSS-centred meta-profiles comparing the enrichment of H2AK119ub1 (left) and
H3K27me3 (right) for uninduced and induced WT and SPEN–/∆RRM samples. Replicates
are shown separately.
5.4 Precise mutation to the SPEN SPOC domain strongly impairs gene
silencing
To further investigate this potentially separate function and gain novel insights into the
molecular mechanisms of gene silencing downstream of SPEN in XCI, we decided to make
more precise mutations to SPEN, aiming to disrupt interactions with corepressors but
leave Xist-binding via the RRM domains intact. The interface between the SPOC domain
of SPEN and two closely homologous corepressor complexes NCOR (aka NCOR1) and
SMRT (aka NCOR2) has been well characterised biochemically and structurally. Inter-
action depends on two arginine residues (human: R3552 R3554, mouse: R3532 R3534),
which when mutated to alanine abolish binding of SPEN SPOC to NCOR in vitro and in
pulldown assays of constructs transfected into cells (Ariyoshi and Schwabe 2003; Mikami
et al. 2014; Oswald et al. 2016) (Figure 5.4 A). Therefore, I performed CRISPR-Cas9-
mediated homologous recombination using a construct cloned by Dr Guifeng Wei and
Artun Kadaster containing this mutation to derive a number of clones of SPENSPOCmut
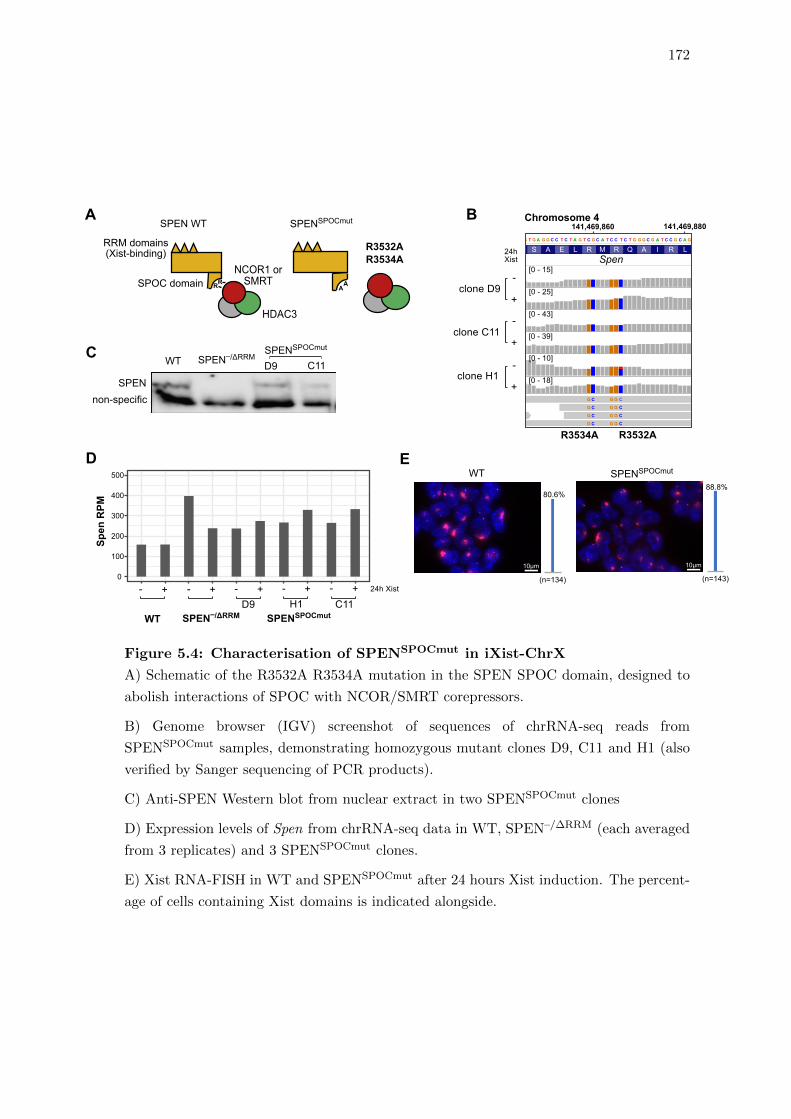
172
R3532AR3534A
SPEN WT
RRM domains(Xist-binding)
SPOC domainNCOR1 orSMRT
HDAC3
SPENSPOCmut
RRA
A
AT G T G A G G C C T C T A G T C G C A T C C T C T G G G C G A T C C G C A G T G G G G G A C C
Q S A E L R M R Q A I R L P P GQ S A E L R M R Q A I R L P P GQ S A E L R M R Q A I R L P P GQ S A E L R M R Q A I R L P P GQ S A E L R M R Q A I R L P P GQ S A E L R M R Q A I R L P P G
[0 - 15]
[0 - 25]
[0 - 43]
[0 - 39]
[0 - 10]
[0 - 18]
B
Spen
141,469,860
G C G G C
G C G G C
G C G G C
G C G G C
clone D9+
-
-
-
+
+
clone C11
clone H1
24hXist
R3532AR3534A
141,469,880Chromosome 4
WT
80.6%88.8%
SPENSPOCmut
(n=134) (n=143)
E
10μm 10μm
WT SPEN–/ΔRRM D9 C11SPENSPOCmut
SPENnon-specific
C
0
100
200
300
400
500
Spen
RPM
WT SPEN–/ΔRRM SPENSPOCmut
24h Xist
D
D9 C11--+-
H1++ --++
Figure 5.4: Characterisation of SPENSPOCmut in iXist-ChrX
A) Schematic of the R3532A R3534A mutation in the SPEN SPOC domain, designed to
abolish interactions of SPOC with NCOR/SMRT corepressors.
B) Genome browser (IGV) screenshot of sequences of chrRNA-seq reads from
SPENSPOCmut samples, demonstrating homozygous mutant clones D9, C11 and H1 (also
verified by Sanger sequencing of PCR products).
C) Anti-SPEN Western blot from nuclear extract in two SPENSPOCmut clones
D) Expression levels of Spen from chrRNA-seq data in WT, SPEN–/∆RRM (each averaged
from 3 replicates) and 3 SPENSPOCmut clones.
E) Xist RNA-FISH in WT and SPENSPOCmut after 24 hours Xist induction. The percent-
age of cells containing Xist domains is indicated alongside.
173
in iXist-ChrX cells. These lines were confirmed by PCR analysis and later through map-
ping of RNA sequencing reads (Figure 5.4 B) to be homozygous mutant for the designed
two-amino acid substitution. SPEN is still detectable via Western blot (Figure 5.4 C),
although it is possible protein levels are reduced as quantification is unreliable due to the
fact SPEN migrates at a very high approximate molecular weight in polyacrylamide gels.
Interestingly, relative Spen transcript levels were increased in all SPENSPOCmut clones
(Figure 5.4 D). We and others had noted this increase in SPEN–/∆RRM previously with
the suggestion of an autoregulatory role of the SPEN-NCOR complex in silencing its own
RNA production (Carter et al. 2020). Xist induction and cloud formation as measured by
RNA-FISH appear to be unaffected in SPENSPOCmut cells (Figure 5.4 E).
When assayed by chrRNA-seq at 24 hours of Xist induction, gene silencing is strongly
impaired in three replicate SPENSPOCmut clones (Figure 5.5 A). I was unable to establish
a reliable biochemical assay of the physical interactions of endogenous SPEN with puta-
tive partners in cellular extracts, but this dramatic effect on Xist-mediated silencing from
substitution of just two amino acids provides strong evidence that the mutation behaves as
predicted and disrupts interactions of the SPOC domain. Notably, however, the silencing
deficiency is not as strong as for complete SPEN–/∆RRM. Furthermore, Xist levels are
not reduced to the same extent as SPEN–/∆RRM (Figure 5.5 B)1. As the RRM domains
of SPEN are unaltered by the SPOC domain mutation, this supports the hypothesis of
separable functions for SPEN in Xist RNA stability/spreading and downstream silenc-
ing.
1ChrRNA-seq samples from D9 clone was processed separately and are slightly abnormal, as evidencedby the skew in allelic ratio in the uninduced sample
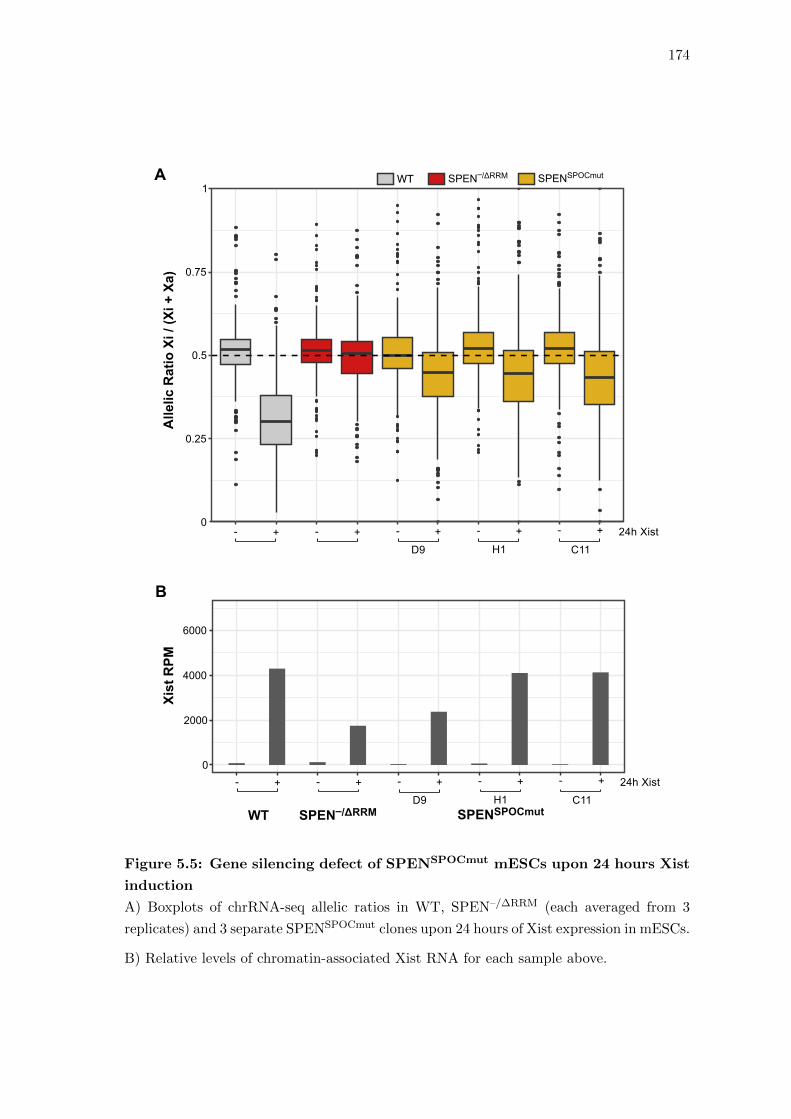
174
0
0.25
0.5
0.75
1
AllelicRatioXi/ (Xi+Xa)
++ --++ --+-
H1D9 C11
24h Xist
WT SPENSPOCmutSPEN–/ΔRRMAXistRPM
WT SPEN–/ΔRRM SPENSPOCmut
++ --++ --+-
H1D9 C11
24h Xist0
2000
4000
6000
B
Figure 5.5: Gene silencing defect of SPENSPOCmut mESCs upon 24 hours Xist
induction
A) Boxplots of chrRNA-seq allelic ratios in WT, SPEN–/∆RRM (each averaged from 3
replicates) and 3 separate SPENSPOCmut clones upon 24 hours of Xist expression in mESCs.
B) Relative levels of chromatin-associated Xist RNA for each sample above.
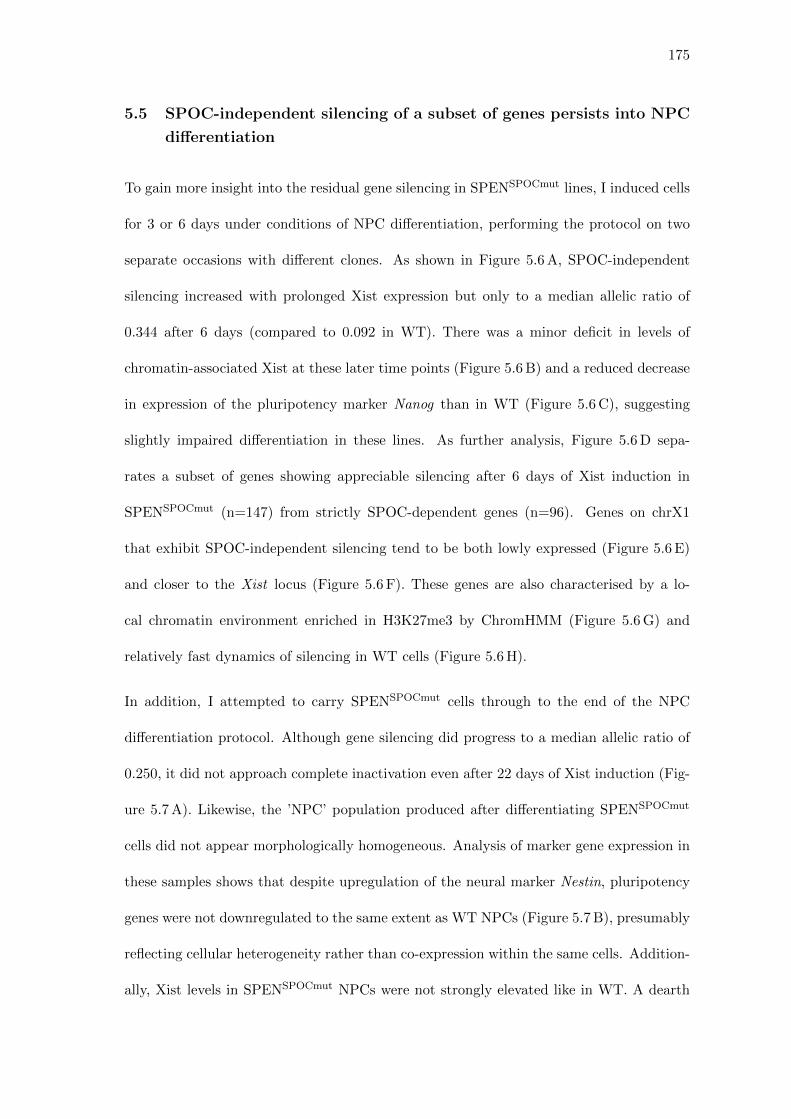
175
5.5 SPOC-independent silencing of a subset of genes persists into NPC
differentiation
To gain more insight into the residual gene silencing in SPENSPOCmut lines, I induced cells
for 3 or 6 days under conditions of NPC differentiation, performing the protocol on two
separate occasions with different clones. As shown in Figure 5.6 A, SPOC-independent
silencing increased with prolonged Xist expression but only to a median allelic ratio of
0.344 after 6 days (compared to 0.092 in WT). There was a minor deficit in levels of
chromatin-associated Xist at these later time points (Figure 5.6 B) and a reduced decrease
in expression of the pluripotency marker Nanog than in WT (Figure 5.6 C), suggesting
slightly impaired differentiation in these lines. As further analysis, Figure 5.6 D sepa-
rates a subset of genes showing appreciable silencing after 6 days of Xist induction in
SPENSPOCmut (n=147) from strictly SPOC-dependent genes (n=96). Genes on chrX1
that exhibit SPOC-independent silencing tend to be both lowly expressed (Figure 5.6 E)
and closer to the Xist locus (Figure 5.6 F). These genes are also characterised by a lo-
cal chromatin environment enriched in H3K27me3 by ChromHMM (Figure 5.6 G) and
relatively fast dynamics of silencing in WT cells (Figure 5.6 H).
In addition, I attempted to carry SPENSPOCmut cells through to the end of the NPC
differentiation protocol. Although gene silencing did progress to a median allelic ratio of
0.250, it did not approach complete inactivation even after 22 days of Xist induction (Fig-
ure 5.7 A). Likewise, the ’NPC’ population produced after differentiating SPENSPOCmut
cells did not appear morphologically homogeneous. Analysis of marker gene expression in
these samples shows that despite upregulation of the neural marker Nestin, pluripotency
genes were not downregulated to the same extent as WT NPCs (Figure 5.7 B), presumably
reflecting cellular heterogeneity rather than co-expression within the same cells. Addition-
ally, Xist levels in SPENSPOCmut NPCs were not strongly elevated like in WT. A dearth
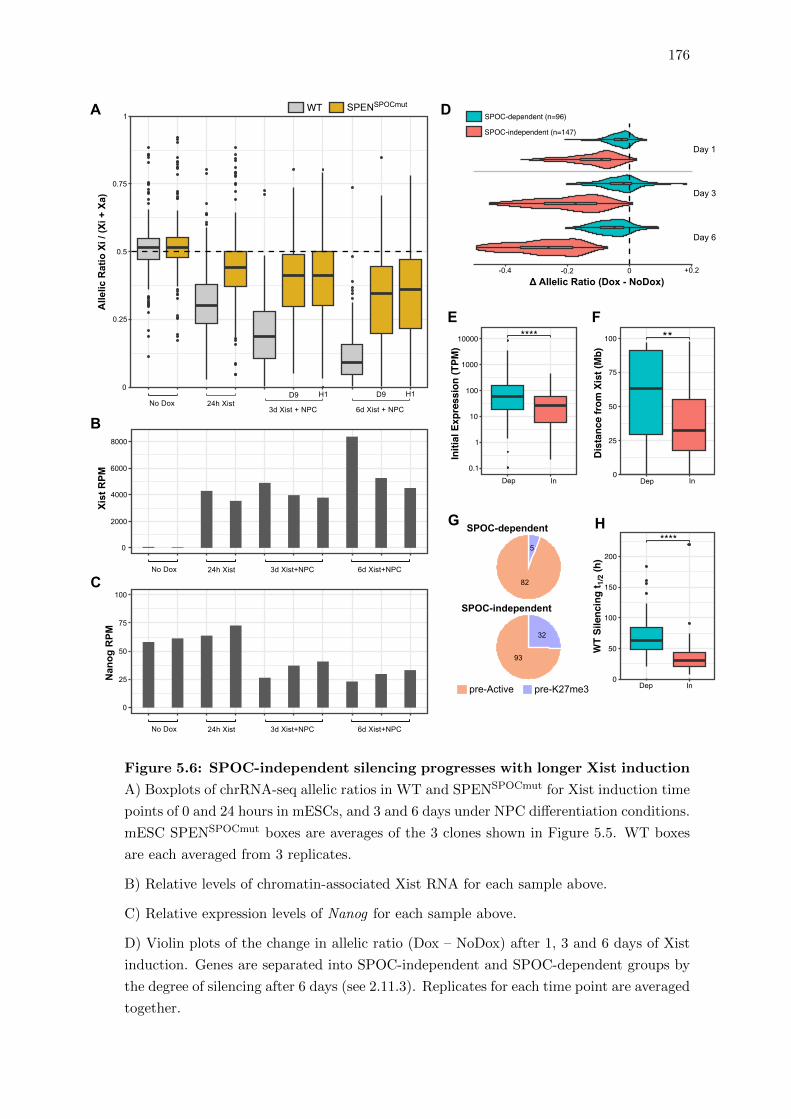
176
Allelic
RatioXi/ (Xi+Xa)
A
0
0.25
0.5
0.75
1WT SPENSPOCmut
No Dox 24h Xist3d Xist + NPC
D9 D9 H1H1
6d Xist + NPC
XistRPM
Nanog
RPM
0
2000
4000
6000
8000
0
25
50
75
100
No Dox 24h Xist 3d Xist+NPC 6d Xist+NPC
No Dox 24h Xist 3d Xist+NPC 6d Xist+NPC
B
C
32
93
SPOC-independent
5
82
pre-Active pre-K27me3
SPOC-dependentG
D
Δ Allelic Ratio (Dox - NoDox)
Day 1
Day 3
Day 6
SPOC-independent (n=147)
SPOC-dependent (n=96)
-0.2-0.4 0 +0.2
E F
InitialExpression
(TPM
)
0
25
50
75
100
Distancefrom
Xist(Mb)
0.1
1
10
1000
100
10000 **** **
Dep In Dep In
H
WTSilencingt 1/2(h)
0
50
100
150
200
****
Dep In
Figure 5.6: SPOC-independent silencing progresses with longer Xist induction
A) Boxplots of chrRNA-seq allelic ratios in WT and SPENSPOCmut for Xist induction time
points of 0 and 24 hours in mESCs, and 3 and 6 days under NPC differentiation conditions.
mESC SPENSPOCmut boxes are averages of the 3 clones shown in Figure 5.5. WT boxes
are each averaged from 3 replicates.
B) Relative levels of chromatin-associated Xist RNA for each sample above.
C) Relative expression levels of Nanog for each sample above.
D) Violin plots of the change in allelic ratio (Dox – NoDox) after 1, 3 and 6 days of Xist
induction. Genes are separated into SPOC-independent and SPOC-dependent groups by
the degree of silencing after 6 days (see 2.11.3). Replicates for each time point are averaged
together.
177
Figure 5.6 (previous page): SPOC-independent silencing progresses with
longer Xist induction
E) Boxplot comparing the initial expression levels in iXist-ChrX cells of SPOC-
independent and SPOC-dependent genes.
F) Boxplot comparing the genomic distance from the Xist locus of SPOC-independent
and SPOC-dependent genes.
G) Pie charts illustrating the proportions of SPOC-independent and SPOC-dependent
genes from ‘pre-active’ and ‘pre-K27me3’ categories of pre-existing chromatin state by
chromHMM (Ernst and Kellis 2017; Nesterova et al. 2019).
H) Boxplots comparing the silencing halftimes of SPOC-independent and SPOC-
dependent genes in WT iXist-ChrX cells.
of ‘true’ NPCs with prolonged G1 phases for Xist accumulation could be one contributory
reason for this. Alternatively, selection for cells only containing one X chromosome may
have begun to occur in these samples. This has historically been an issue with XX mESCs
lines analysed in previous studies (Zvetkova et al. 2005) and is exacerbated if cells are
differentiated in the abnormal situation of two active X chromosomes (Schulz et al. 2014;
Yang et al. 2016; Colognori et al. 2020). A subpopulation of XO cells with no Xist ex-
pression could account for decreased Xist RPM, as well as the abnormally large whiskers
for clone D9 (see Figure 6.9 for a more extreme example of this phenomenon). The ap-
plication of a single cell assay to these samples, such as the experiment described in 4.8,
would be able to shed more light on these observations.
5.6 SPENSPOCmut does not result in Polycomb redistribution
If the phenotype of Polycomb redistribution in SPEN–/∆RRM is solely a consequence of im-
paired gene silencing pathways, it would be expected to also be present in SPENSPOCmut.
However, ChIP-seq for H2AK119ub1 and H3K27me3 in these cells shows that this is not
the case. In fact, the patterns of Xist-dependent Polycomb enrichment in SPENSPOCmut
are remarkably similar to WT at both 24 and 3 hours of Xist induction (Figure 5.8).
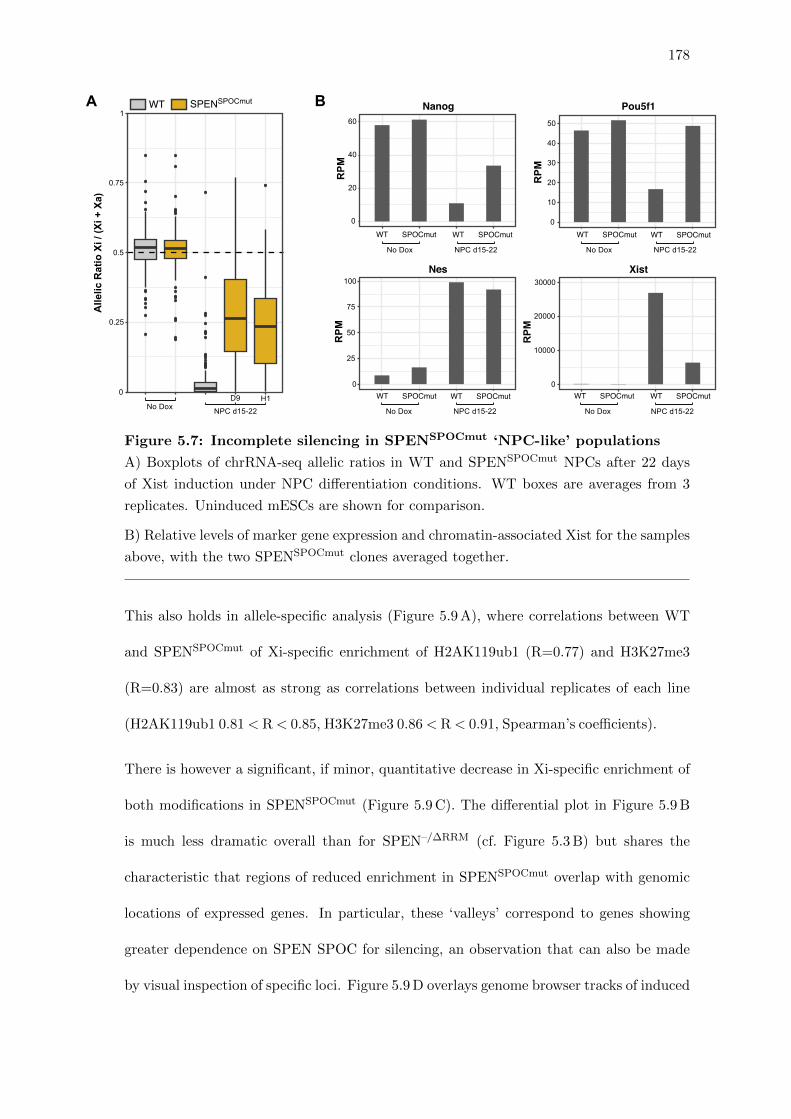
178
AllelicRatioXi/ (Xi+Xa)
A
0
0.25
0.5
0.75
1WT SPENSPOCmut
No Dox NPC d15-22
H1D9
0
10000
20000
30000
RPM
RPM
RPM
RPM
0
25
50
75
100
0
20
40
60
0
10
20
30
40
50
B
WT SPOCmut WT SPOCmut WT SPOCmut WT SPOCmut
Xist
Nanog Pou5f1
Nes
No Dox NPC d15-22 No Dox NPC d15-22
WT SPOCmut WT SPOCmutWT SPOCmut WT SPOCmut
No DoxNo Dox NPC d15-22 NPC d15-22
Figure 5.7: Incomplete silencing in SPENSPOCmut ‘NPC-like’ populations
A) Boxplots of chrRNA-seq allelic ratios in WT and SPENSPOCmut NPCs after 22 days
of Xist induction under NPC differentiation conditions. WT boxes are averages from 3
replicates. Uninduced mESCs are shown for comparison.
B) Relative levels of marker gene expression and chromatin-associated Xist for the samples
above, with the two SPENSPOCmut clones averaged together.
This also holds in allele-specific analysis (Figure 5.9 A), where correlations between WT
and SPENSPOCmut of Xi-specific enrichment of H2AK119ub1 (R=0.77) and H3K27me3
(R=0.83) are almost as strong as correlations between individual replicates of each line
(H2AK119ub1 0.81< R< 0.85, H3K27me3 0.86< R< 0.91, Spearman’s coefficients).
There is however a significant, if minor, quantitative decrease in Xi-specific enrichment of
both modifications in SPENSPOCmut (Figure 5.9 C). The differential plot in Figure 5.9 B
is much less dramatic overall than for SPEN–/∆RRM (cf. Figure 5.3 B) but shares the
characteristic that regions of reduced enrichment in SPENSPOCmut overlap with genomic
locations of expressed genes. In particular, these ‘valleys’ correspond to genes showing
greater dependence on SPEN SPOC for silencing, an observation that can also be made
by visual inspection of specific loci. Figure 5.9 D overlays genome browser tracks of induced
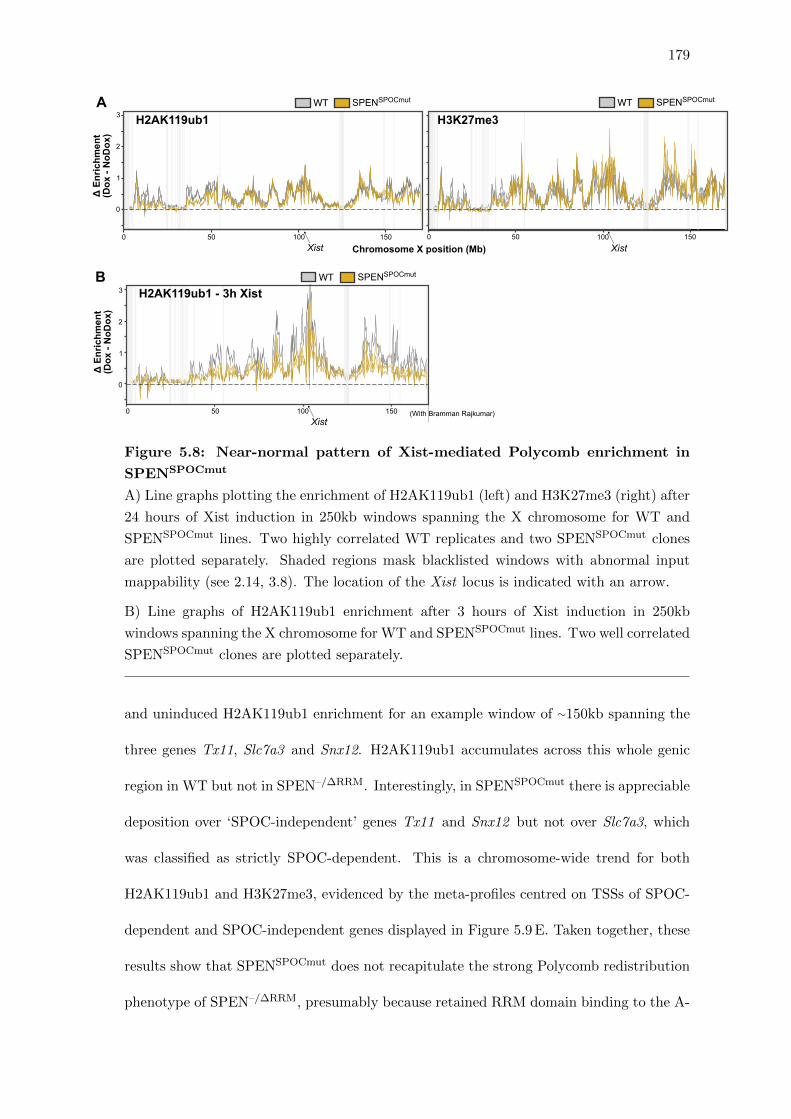
179
ΔEnrichment
(Dox-NoDox)
0
1
2
3
Xist0 50 100 150
H2AK119ub1 - 3h XistWT SPENSPOCmut
Xist0 50 100 150
H3K27me3WT SPENSPOCmut
ΔEnrichment
(Dox-NoDox)
0
1
2
3
Xist0 50 100 150
Chromosome X position (Mb)
H2AK119ub1WT SPENSPOCmutA
B
(With Bramman Rajkumar)
Figure 5.8: Near-normal pattern of Xist-mediated Polycomb enrichment in
SPENSPOCmut
A) Line graphs plotting the enrichment of H2AK119ub1 (left) and H3K27me3 (right) after
24 hours of Xist induction in 250kb windows spanning the X chromosome for WT and
SPENSPOCmut lines. Two highly correlated WT replicates and two SPENSPOCmut clones
are plotted separately. Shaded regions mask blacklisted windows with abnormal input
mappability (see 2.14, 3.8). The location of the Xist locus is indicated with an arrow.
B) Line graphs of H2AK119ub1 enrichment after 3 hours of Xist induction in 250kb
windows spanning the X chromosome for WT and SPENSPOCmut lines. Two well correlated
SPENSPOCmut clones are plotted separately.
and uninduced H2AK119ub1 enrichment for an example window of ∼150kb spanning the
three genes Tx11, Slc7a3 and Snx12. H2AK119ub1 accumulates across this whole genic
region in WT but not in SPEN–/∆RRM. Interestingly, in SPENSPOCmut there is appreciable
deposition over ‘SPOC-independent’ genes Tx11 and Snx12 but not over Slc7a3, which
was classified as strictly SPOC-dependent. This is a chromosome-wide trend for both
H2AK119ub1 and H3K27me3, evidenced by the meta-profiles centred on TSSs of SPOC-
dependent and SPOC-independent genes displayed in Figure 5.9 E. Taken together, these
results show that SPENSPOCmut does not recapitulate the strong Polycomb redistribution
phenotype of SPEN–/∆RRM, presumably because retained RRM domain binding to the A-
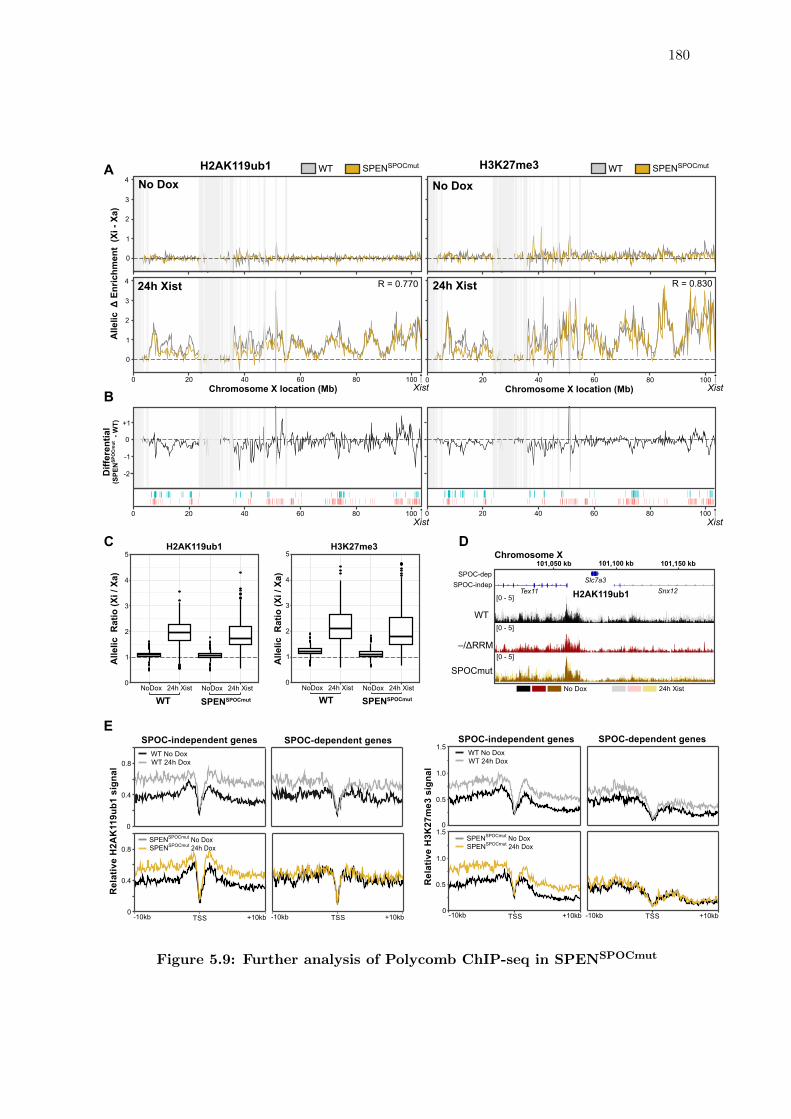
180
A
BXist
0 20 40 60 80 100 0 20 40 60 80 100Xist
Xist0 20 40 60 80 100
No Dox
24h Xist
No Dox
24h Xist
0
1
2
3
4
0
1
2
3
4
AllelicΔEnrichment(Xi -Xa)
0
+1
-1
-2Differential
(SPENSPOCmut- WT)
Chromosome X location (Mb) Chromosome X location (Mb)
WT SPENSPOCmut WT SPENSPOCmut
Xist0 20 40 60 80 100
R = 0.770 R = 0.830
2
1
4
5
0
3
NoDox 24h Xist NoDox 24h Xist
AllelicRatio(Xi /Xa)
H3K27me3
WT SPENSPOCmut
2
1
4
5
0
3
NoDox 24h Xist NoDox 24h Xist
AllelicRatio(Xi /Xa)
H2AK119ub1
WT SPENSPOCmut
C D
E
0.4
0
0.8No DoxSPENSPOCmut
24h DoxSPENSPOCmutNo DoxSPENSPOCmut
24h DoxSPENSPOCmut
0
0.4
0.8WT No Dox
SPOC-dependent genes
RelativeH2AK119ub1signal
SPOC-independent genes
WT 24h DoxWT No DoxWT 24h Dox
TSS +10kb-10kb -10kbTSS +10kb
0
0.5
1.0
1.5
0
0.5
1.0
1.5
SPOC-dependent genesSPOC-independent genes
TSS +10kb-10kb -10kbTSS +10kb
RelativeH3K27me3signal
H3K27me3H2AK119ub1
101,050 kb 101,100 kb 101,150 kbChromosome X
WT
H2AK119ub1
SPOC-depSPOC-indep
–/ΔRRM
Slc7a3Tex11 Snx12
[0 - 5]
[0 - 5]
[0 - 5]
No Dox 24h Xist
SPOCmut
Figure 5.9: Further analysis of Polycomb ChIP-seq in SPENSPOCmut
181
Figure 5.9 (previous page): Further analysis of Polycomb ChIP-seq in
SPENSPOCmut
A) Line graphs of allelic H2AK119ub1 (left) and H3K27me3 (right) enrichment after 24
hours of Xist induction in 250kb windows of chrX1 for WT and SPENSPOCmut lines, av-
eraged over two WT replicates and two SPENSPOCmut clones. Upper panels demonstrate
no allelic enrichment in uninduced cells. Lower panels show distribution patterns of Xi-
specific enrichment in induced cells. Shaded regions mask blacklisted windows with low
allelic mappability (see 2.14, 3.9). R values are Spearman’s rank correlation coefficients.
B) Line plot of differential allelic enrichment (SPENSPOCmut – WT) for H2AK119ub1
(left) and H3K27me3 (right). Locations of SPOC-independent (red) and SPOC-dependent
(blue) genes are indicated in the rug below.
C) Boxplot quantification of allelic ratios (Xi/Xa) for n=335 non-blacklisted 250kb win-
dows from line graphs above.
D) Genome-browser (IGV) tracks of H2AK119ub1 ChIP-seq for WT, SPEN–/∆RRM and
SPENSPOCmut for an example region including two SPOC-independent genes and one
SPOC-independent gene. Uninduced and induced samples for one replicate are overlain.
E) TSS-centred meta-profiles comparing enrichment of H2AK119ub1 (left) and H3K27me3
(right) for uninduced and induced WT and SPENSPOCmut samples. Replicates are shown
separately.
repeat still enables SPEN to perform its function localising Xist to the appropriate regions
of gene-rich chromatin. However, Polycomb deposition over a subset of genes is dependent
on the SPEN SPOC domain, which may be required to erase active histone modifications
from these chromatin regions before H2AK119ub1 and H3K27me3 can be placed.
5.7 Investigating the role of NCOR/SMRT downstream of SPEN
As discussed, the SPEN SPOC domain has a well-defined interaction with NCOR and
SMRT corepressors, which have been shown to form complexes with HDAC3 (Wen et al.
2000; Guenther et al. 2001). This has led authors of previous studies to invoke deacetyla-
tion by HDAC3 as the central mechanism of gene silencing downstream of SPEN (McHugh
et al. 2015; Zylicz et al. 2019), although evidence for this being the whole pathway is lack-
ing. Therefore, having shown that most of SPEN’s silencing function is abrogated by the
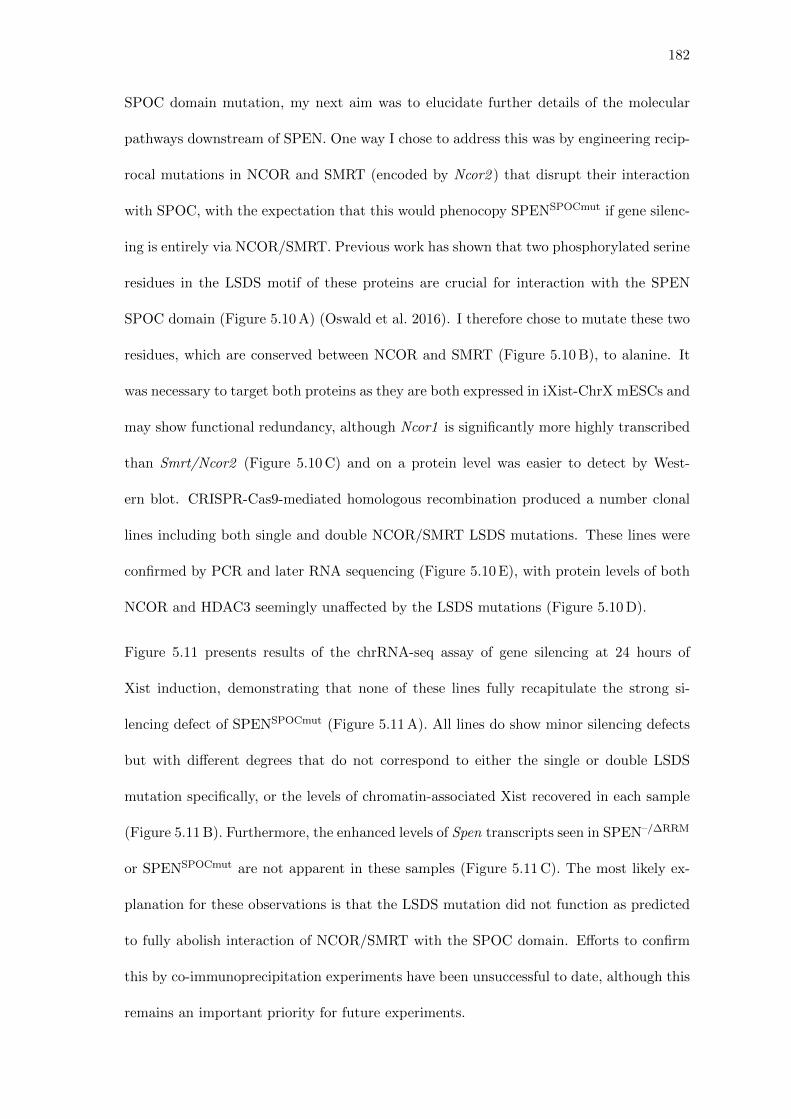
182
SPOC domain mutation, my next aim was to elucidate further details of the molecular
pathways downstream of SPEN. One way I chose to address this was by engineering recip-
rocal mutations in NCOR and SMRT (encoded by Ncor2 ) that disrupt their interaction
with SPOC, with the expectation that this would phenocopy SPENSPOCmut if gene silenc-
ing is entirely via NCOR/SMRT. Previous work has shown that two phosphorylated serine
residues in the LSDS motif of these proteins are crucial for interaction with the SPEN
SPOC domain (Figure 5.10 A) (Oswald et al. 2016). I therefore chose to mutate these two
residues, which are conserved between NCOR and SMRT (Figure 5.10 B), to alanine. It
was necessary to target both proteins as they are both expressed in iXist-ChrX mESCs and
may show functional redundancy, although Ncor1 is significantly more highly transcribed
than Smrt/Ncor2 (Figure 5.10 C) and on a protein level was easier to detect by West-
ern blot. CRISPR-Cas9-mediated homologous recombination produced a number clonal
lines including both single and double NCOR/SMRT LSDS mutations. These lines were
confirmed by PCR and later RNA sequencing (Figure 5.10 E), with protein levels of both
NCOR and HDAC3 seemingly unaffected by the LSDS mutations (Figure 5.10 D).
Figure 5.11 presents results of the chrRNA-seq assay of gene silencing at 24 hours of
Xist induction, demonstrating that none of these lines fully recapitulate the strong si-
lencing defect of SPENSPOCmut (Figure 5.11 A). All lines do show minor silencing defects
but with different degrees that do not correspond to either the single or double LSDS
mutation specifically, or the levels of chromatin-associated Xist recovered in each sample
(Figure 5.11 B). Furthermore, the enhanced levels of Spen transcripts seen in SPEN–/∆RRM
or SPENSPOCmut are not apparent in these samples (Figure 5.11 C). The most likely ex-
planation for these observations is that the LSDS mutation did not function as predicted
to fully abolish interaction of NCOR/SMRT with the SPOC domain. Efforts to confirm
this by co-immunoprecipitation experiments have been unsuccessful to date, although this
remains an important priority for future experiments.
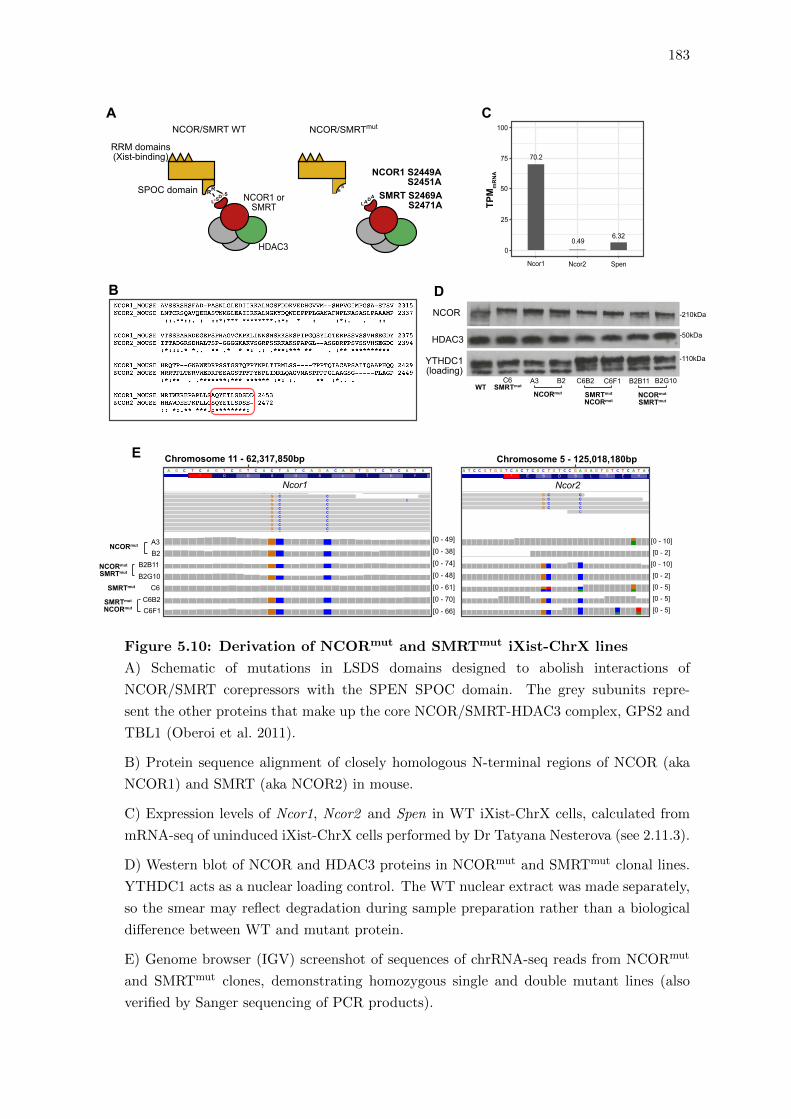
183
NCOR1 S2449AS2451A
SMRT S2469AS2471A
NCOR/SMRTmutNCOR/SMRT WT
RRM domains(Xist-binding)
SPOC domain RR
LDpS
LADANCOR1 or
SMRT
HDAC3
RR
pS
A3
A3C6
B2
B2
B2B11
B2B11
B2G10
B2G10
-110kDa
-50kDa
-210kDa
C6
C6B2
C6B2
C6F1
C6F1
NCORmut
NCORmut
SMRTmut
SMRTmutWT
SMRTmut
NCORmut
NCORmut
SMRTmut
NCORmut
SMRTmutSMRTmut
NCORmut
Ncor1
TPM
mRNA
Ncor2 Spen
0.496.32
70.2
100
75
50
25
0
C G CG C CG C C CG C C A CG C CG C CG C CG C CG C CG C CG C C
C A C A G C T C A G T C G T C A C T A T C A G A C A G T G T C T C A T A C T G C G C T G A G A G G* D D S D S L T E Y Q A S L* D D S D S L T E Y Q A S L* D D S D S L T E Y Q A S L* D D S D S L T E Y Q A S L* D D S D S L T E Y Q A S L* D D S D S L T E Y Q A S L* D D S D S L T E Y Q A S L* D D S D S L T E Y Q A S L* D D S D S L T E Y Q A S L* D D S D S L T E Y Q A S L* D D S D S L T E Y Q A S L* D D S D S L T E Y Q A S L* D D S D S L T E Y Q A S L* D D S D S L T E Y Q A S L* D D S D S L T E Y Q A S L* D D S D S L T E Y Q A S L* D D S D S L T E Y Q A S L* D D S D S L T E Y Q A S L* D D S D S L T E Y Q A S L* D D S D S L T E Y Q A S L* D D S D S L T E Y Q A S L* D D S D S L T E Y Q A S L* D D S D S L T E Y Q A S L* D D S D S L T E Y Q A S L* D D S D S L T E Y Q A S L* D D S D S L T E Y Q A S L* D D S D S L T E Y Q A S L* D D S D S L T E Y Q A S L* D D S D S L T E Y Q A S L* D D S D S L T E Y Q A S L* D D S D S L T E Y Q A S L* D D S D S L T E Y Q A S L* D D S D S L T E Y Q A S L* D D S D S L T E Y Q A S L* D D S D S L T E Y Q A S L* D D S D S L T E Y Q A S L* D D S D S L T E Y Q A S L* D D S D S L T E Y Q A S L* D D S D S L T E Y Q A S L* D D S D S L T E Y Q A S L* D D S D S L T E Y Q A S L* D D S D S L T E Y Q A S L* D D S D S L T E Y Q A S L* D D S D S L T E Y Q A S L* D D S D S L T E Y Q A S L* D D S D S L T E Y Q A S L* D D S D S L T E Y Q A S L* D D S D S L T E Y Q A S L* D D S D S L T E Y Q A S L* D D S D S L T E Y Q A S L* D D S D S L T E Y Q A S L* D D S D S L T E Y Q A S L
LLLLLLLLLLLLLLLLLLLLLLLLLLLLLLLLLLLLLLLLLLLLLLLLLLLL
Ncor1
[0 - 49]
[0 - 38]
[0 - 74]
[0 - 48]
[0 - 61]
[0 - 70]
[0 - 66]
Chromosome 11 - 62,317,850bp
G C CG C CG C CG C C
C
A T C C G T G G T C A C T C G C T G T C C G A G A G T G T C T C A T A C T G T G A A C A C A G C A* E S D S L T E Y Q S C L L* E S D S L T E Y Q S C L L* E S D S L T E Y Q S C L L* E S D S L T E Y Q S C L L* E S D S L T E Y Q S C L L* E S D S L T E Y Q S C L L* E S D S L T E Y Q S C L L* E S D S L T E Y Q S C L L* E S D S L T E Y Q S C L L* E S D S L T E Y Q S C L L* E S D S L T E Y Q S C L L* E S D S L T E Y Q S C L L* E S D S L T E Y Q S C L L* E S D S L T E Y Q S C L L* E S D S L T E Y Q S C L L* E S D S L T E Y Q S C L L* E S D S L T E Y Q S C L L* E S D S L T E Y Q S C L L* E S D S L T E Y Q S C L L* E S D S L T E Y Q S C L L* E S D S L T E Y Q S C L L* E S D S L T E Y Q S C L L* E S D S L T E Y Q S C L L* E S D S L T E Y Q S C L L* E S D S L T E Y Q S C L L* E S D S L T E Y Q S C L L* E S D S L T E Y Q S C L L* E S D S L T E Y Q S C L L* E S D S L T E Y Q S C L L* E S D S L T E Y Q S C L L
[0 - 10][0 - 2][0 - 10][0 - 2][0 - 5][0 - 5][0 - 5]
Ncor2
Chromosome 5 - 125,018,180bp
NCOR
HDAC3
YTHDC1(loading)
C
B D
E
A
Figure 5.10: Derivation of NCORmut and SMRTmut iXist-ChrX lines
A) Schematic of mutations in LSDS domains designed to abolish interactions of
NCOR/SMRT corepressors with the SPEN SPOC domain. The grey subunits repre-
sent the other proteins that make up the core NCOR/SMRT-HDAC3 complex, GPS2 and
TBL1 (Oberoi et al. 2011).
B) Protein sequence alignment of closely homologous N-terminal regions of NCOR (aka
NCOR1) and SMRT (aka NCOR2) in mouse.
C) Expression levels of Ncor1, Ncor2 and Spen in WT iXist-ChrX cells, calculated from
mRNA-seq of uninduced iXist-ChrX cells performed by Dr Tatyana Nesterova (see 2.11.3).
D) Western blot of NCOR and HDAC3 proteins in NCORmut and SMRTmut clonal lines.
YTHDC1 acts as a nuclear loading control. The WT nuclear extract was made separately,
so the smear may reflect degradation during sample preparation rather than a biological
difference between WT and mutant protein.
E) Genome browser (IGV) screenshot of sequences of chrRNA-seq reads from NCORmut
and SMRTmut clones, demonstrating homozygous single and double mutant lines (also
verified by Sanger sequencing of PCR products).
184
XistRPM
0
2000
4000
6000
Spen
RPM
0
100
200
300
B
C
WT SPENSPOCmut NCORmut NCORmutSMRTmut SMRTmut SMRTmutNCORmut
+- +- +- +- +- +- +- +-+- 24h Xist
A3 C6B2 B2B11 B2G10 C6B2 C6F1WT SPENSPOCmutNCORmut NCORmutSMRTmut SMRTmut SMRTmutNCORmut
0
0.25
0.5
0.75
1
AllelicRatioXi/ (Xi+Xa)
+- +- +- +- +- +- +- +-+- 24h Xist
A
A3 C6B2 B2B11 B2G10 C6B2 C6F1
Figure 5.11: Minor and variable silencing deficiency of NCORmut and
SMRTmut lines
A) Boxplots of chrRNA-seq allelic ratios in WT, SPENSPOCmut (each averaged from 3 repli-
cates) and individual single and double NCORmut and SMRTmut clones after 24 hours of
Xist induction in mESCs.
B) Relative levels of chromatin-associated Xist RNA for each sample above.
C) Relative levels of Spen expression for each sample above.
185
5.8 HDAC3 only partially accounts for SPOC-dependent silencing
As a final avenue of investigation, I focused on the putative chromatin effector of the
pathway of silencing downstream of SPEN, HDAC3. A colleague, Dr Mafalda Almeida,
initiated experiments to insert an C-terminal FKBP12F36V degron tag into the endoge-
nous Hdac3 locus in iXist-ChrX cells (Figure 5.12 A) (Nabet et al. 2018), and together
we derived multiple clonal cell lines homozygously expressing the HDAC3-FKBP12F36V
fusion protein, albeit at levels only ∼60% of wild type (Figure 5.12 B,C). Treatment of
HDAC3-FKBP12F36V cells with 100nM of the cell-permeable molecule dTAG-13 causes
complete protein degradation within 15-30 minutes (Figure 5.12 B). Genome-wide levels
of acetylation, as determined by calibrated ChIP-seq for H3K27ac, may be marginally
elevated but are not drastically different after 36 hours of HDAC3 degradation by dTAG
treatment (Figure 5.12 D).
I took two clones from this transfection, A5 and C2, for the chrRNA-seq assay after 24
hours of doxycycline induction with or without 12 hours of prior treatment with dTAG-13.
As shown in Figure 5.13 A, degradation of HDAC3 does cause a substantial defect in Xist-
mediated gene silencing in both lines, although not to the same extent as SPENSPOCmut.
Levels of chromatin-associated Xist are within or even slightly above the normal range,
whilst Spen expression is very low seemingly without a severe negative effect on silencing
in non-dTAG-treated samples (Figure 5.13 A,B).
Figure 5.13 C presents a density plot from all genes in control and dTAG-treated samples
transformed on a scale of between 0 (complete silencing) and 1 (no silencing). Notably, the
effect of HDAC3 degradation is relatively uniform across all genes, shown by the tight dis-
tribution of the differential plot around a median silencing defect of 0.141 (Figure 5.13 D).
Further analysis of various factors that may affect gene silencing dependency on HDAC3
reveals a similar trend. As presented in Figure 5.13 E, there were no significant differences

186
HDAC3
+dTAG-13
FKBP12F36V
HDAC3
FKBP12F36V
A
HDAC3
HDAC3-FKBP12F36V
HDAC3-FKBP12F36V
WT
TBP
-50kDa
-65kDa
-37kDa
+dTAG-13A5 C2
0 015' 30' 1h 2h 36h12h 12h
B
C
D
0
25
5
10
15
20
HDAC3-FKBP12F36V
RPM
chrRNA
WT A5 C2
Hdac3
H3K27ac
0
0.6
0.4
0.2
1.0
1.2
0.8
CalibratedLevels
(ORi Norm)
NoDox 24h Dox24h Dox36h dTAG-13
Figure 5.12: Conditional HDAC3 degradation by the dTAG system
A) Schematic of HDAC3-FKBP12F36V. Addition of the small molecule dTAG-13 to media
causes rapid protein degradation of endogenous HDAC3 with an C-terminal degron tag.
B) Western blot showing expression levels of the HDAC3-FKBP12F36V proteins in two
clones, and rapid and complete degradation within 15-30 minutes of dTAG-13 treatment.
TBP acts a nuclear loading control.
C) Relative levels of Hdac3 expression from chrRNA-seq experiments (uninduced samples),
comparing WT and two HDAC3-FKBP12F36V clones.
D) Calibrated global levels of H3K27ac from ChIP-seq experiments performed in HDAC3-
FKBP12F36V with exogenous spike-in of Drosophila cells. Calibration factors were cal-
culated as per (Hu et al. 2015), normalised to NoDox samples, and averaged over two
replicate clones (see Appendix Table A4).
in subsets of genes categorised by initial expression level or distance from the Xist locus,
with a moderate trend for SPOC-independent genes to show a greater defect in silencing
after loss of HDAC3. Taken together, these results suggest that HDAC3 is not the sole
downstream effector of the SPEN SPOC domain but does have a broad role facilitating
silencing of all genes on Xi.
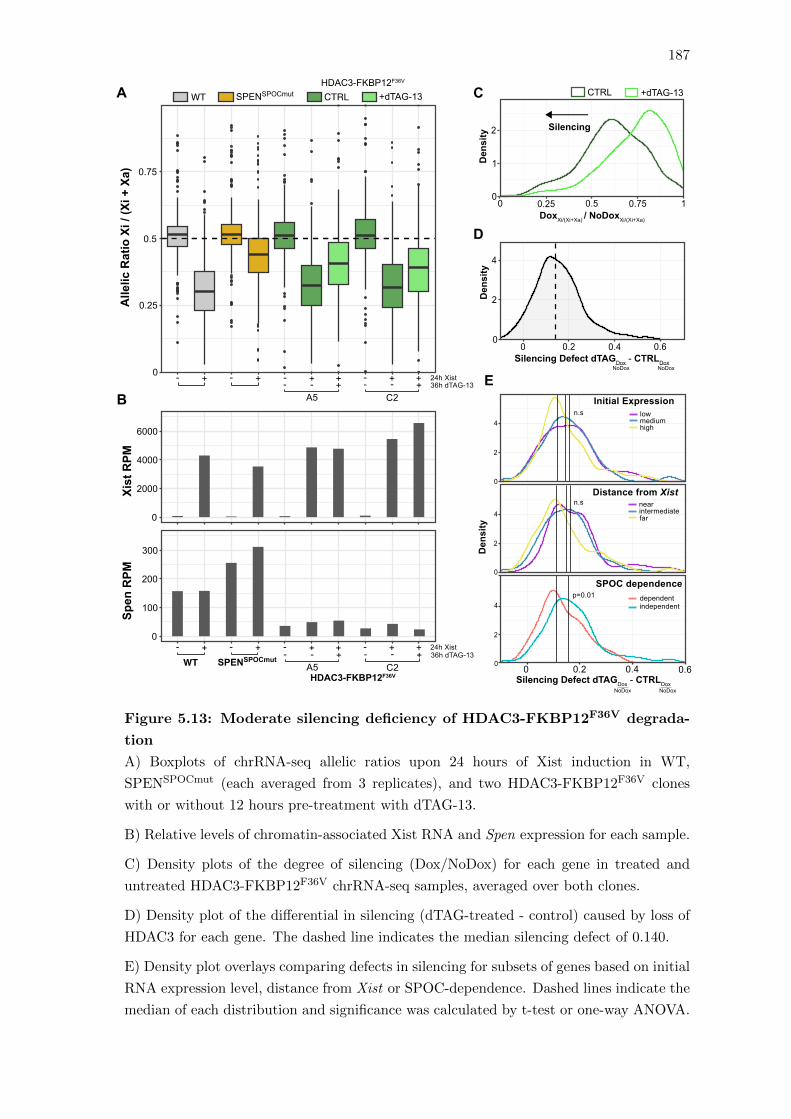
187
WT SPENSPOCmut CTRL +dTAG-13
0
0.25
0.5
0.75
Alle
licRatio
Xi/ (Xi
+Xa
)
+- +- + +
A5 C2
+-+- 24h Xist
+- +- + +
A5 C236h dTAG-13- +- - +- +-+- 24h Xist
HDAC3-FKBP12F36V
36h dTAG-13- +- - +-
B
C
D
E
A
Xist
RPM
0
2000
4000
6000
Spen
RPM
0
100
200
300
HDAC3-FKBP12F36V
WT SPENSPOCmut
2
4
0
2
4
0
2
4
00 0.2 0.4 0.6
Den
sity
Silencing Defect dTAGDox - CTRLDoxNoDox NoDox
n.s
n.s
p=0.01
nearintermediatefar
dependentindependent
lowmediumhigh
Distance from Xist
SPOC dependence
Initial Expression
2
4
1
0
00 0.2 0.4 0.6
2
Silencing Defect dTAGDox - CTRLDoxNoDox NoDox
DoxXi/(Xi+Xa) / NoDoxXi/(Xi+Xa)10.750.50.250
CTRL +dTAG-13
Den
sity
Den
sity
Silencing
Figure 5.13: Moderate silencing deficiency of HDAC3-FKBP12F36V degrada-
tion
A) Boxplots of chrRNA-seq allelic ratios upon 24 hours of Xist induction in WT,
SPENSPOCmut (each averaged from 3 replicates), and two HDAC3-FKBP12F36V clones
with or without 12 hours pre-treatment with dTAG-13.
B) Relative levels of chromatin-associated Xist RNA and Spen expression for each sample.
C) Density plots of the degree of silencing (Dox/NoDox) for each gene in treated and
untreated HDAC3-FKBP12F36V chrRNA-seq samples, averaged over both clones.
D) Density plot of the differential in silencing (dTAG-treated - control) caused by loss of
HDAC3 for each gene. The dashed line indicates the median silencing defect of 0.140.
E) Density plot overlays comparing defects in silencing for subsets of genes based on initial
RNA expression level, distance from Xist or SPOC-dependence. Dashed lines indicate the
median of each distribution and significance was calculated by t-test or one-way ANOVA.
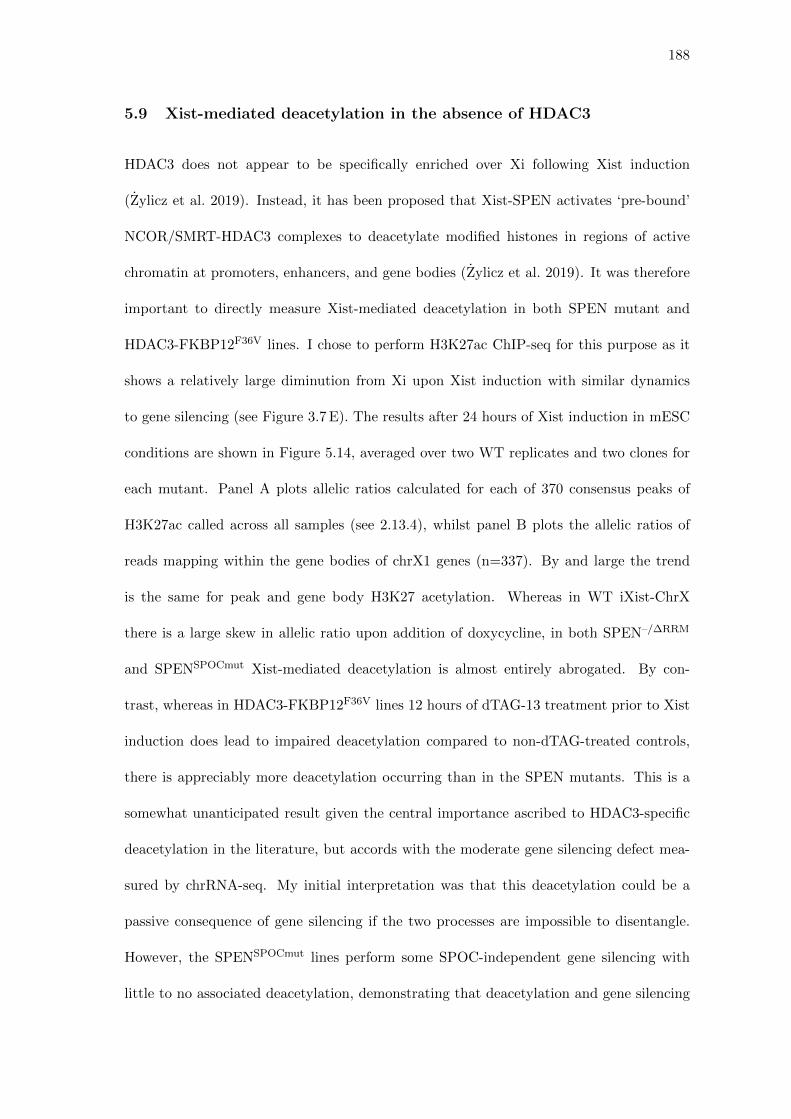
188
5.9 Xist-mediated deacetylation in the absence of HDAC3
HDAC3 does not appear to be specifically enriched over Xi following Xist induction
(Zylicz et al. 2019). Instead, it has been proposed that Xist-SPEN activates ‘pre-bound’
NCOR/SMRT-HDAC3 complexes to deacetylate modified histones in regions of active
chromatin at promoters, enhancers, and gene bodies (Zylicz et al. 2019). It was therefore
important to directly measure Xist-mediated deacetylation in both SPEN mutant and
HDAC3-FKBP12F36V lines. I chose to perform H3K27ac ChIP-seq for this purpose as it
shows a relatively large diminution from Xi upon Xist induction with similar dynamics
to gene silencing (see Figure 3.7 E). The results after 24 hours of Xist induction in mESC
conditions are shown in Figure 5.14, averaged over two WT replicates and two clones for
each mutant. Panel A plots allelic ratios calculated for each of 370 consensus peaks of
H3K27ac called across all samples (see 2.13.4), whilst panel B plots the allelic ratios of
reads mapping within the gene bodies of chrX1 genes (n=337). By and large the trend
is the same for peak and gene body H3K27 acetylation. Whereas in WT iXist-ChrX
there is a large skew in allelic ratio upon addition of doxycycline, in both SPEN–/∆RRM
and SPENSPOCmut Xist-mediated deacetylation is almost entirely abrogated. By con-
trast, whereas in HDAC3-FKBP12F36V lines 12 hours of dTAG-13 treatment prior to Xist
induction does lead to impaired deacetylation compared to non-dTAG-treated controls,
there is appreciably more deacetylation occurring than in the SPEN mutants. This is a
somewhat unanticipated result given the central importance ascribed to HDAC3-specific
deacetylation in the literature, but accords with the moderate gene silencing defect mea-
sured by chrRNA-seq. My initial interpretation was that this deacetylation could be a
passive consequence of gene silencing if the two processes are impossible to disentangle.
However, the SPENSPOCmut lines perform some SPOC-independent gene silencing with
little to no associated deacetylation, demonstrating that deacetylation and gene silencing
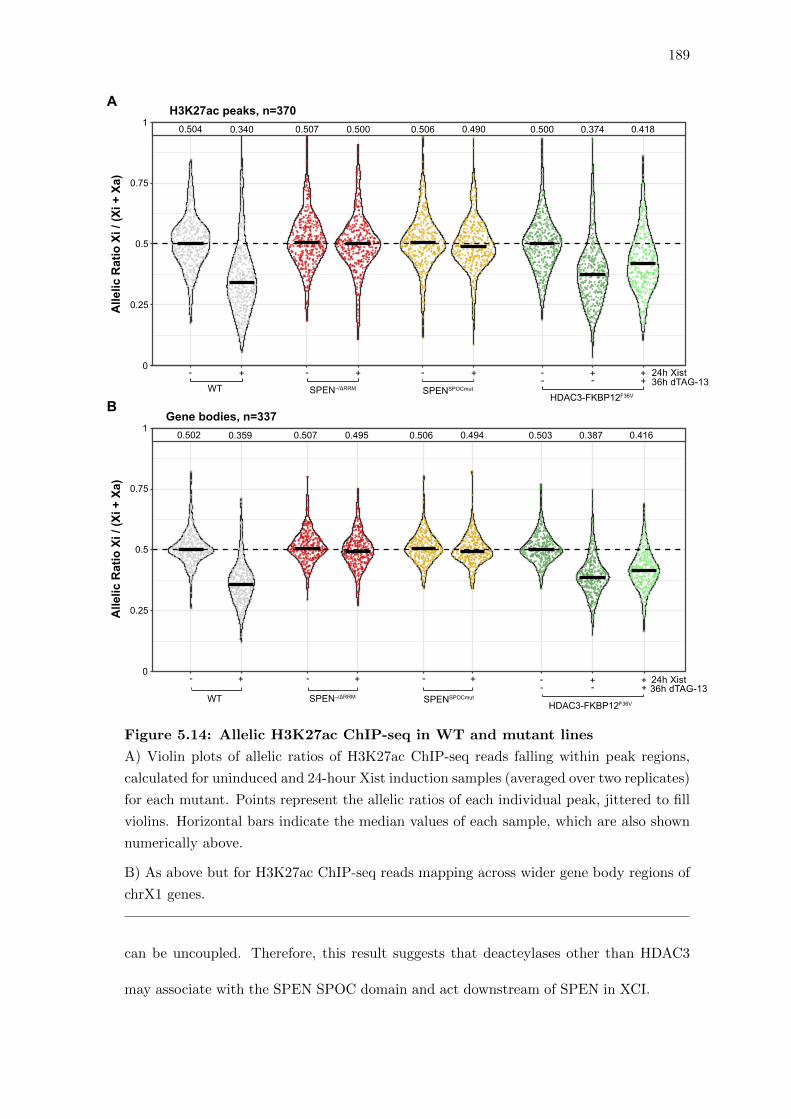
189
0
0.25
0.5
0.75
1
HDAC3-FKBP12F36VSPENSPOCmut
0.504 0.340 0.507 0.500 0.506 0.490 0.500 0.374 0.418
WT SPEN–/ΔRRM
+- +- +- + +-- +-
AllelicRatioXi/ (Xi+Xa)
H3K27ac peaks, n=370
24h Xist36h dTAG-13
A
0.502 0.359 0.507 0.495 0.506 0.494 0.503 0.387 0.416
B
HDAC3-FKBP12F36VSPENSPOCmutWT SPEN–/ΔRRM
+- +- +- + +-- +-
24h Xist36h dTAG-13
0
0.25
0.5
0.75
1
AllelicRatioXi/ (Xi+Xa)
Gene bodies, n=337
Figure 5.14: Allelic H3K27ac ChIP-seq in WT and mutant lines
A) Violin plots of allelic ratios of H3K27ac ChIP-seq reads falling within peak regions,
calculated for uninduced and 24-hour Xist induction samples (averaged over two replicates)
for each mutant. Points represent the allelic ratios of each individual peak, jittered to fill
violins. Horizontal bars indicate the median values of each sample, which are also shown
numerically above.
B) As above but for H3K27ac ChIP-seq reads mapping across wider gene body regions of
chrX1 genes.
can be uncoupled. Therefore, this result suggests that deacteylases other than HDAC3
may associate with the SPEN SPOC domain and act downstream of SPEN in XCI.
190
5.10 Discussion
The experiments presented in this chapter investigate the preeminent molecular pathway of
gene silencing downstream of Xist during the establishment of XCI. The central component
of this pathway is the large RNA binding protein SPEN. Disruption of the SPEN-Xist axis
either by full Spen knockout, RRM-domain deletion, or deletion of Xist A-repeats causes
a near-complete abrogation of gene silencing in iXist-ChrX cells, which is in agreement
with reports published elsewhere (Wutz et al. 2002; Monfort et al. 2015; Dossin et al.
2020). However, these mutations also result in reduced levels of chromatin-associated Xist
and a dramatic phenotype of Polycomb redistribution over Xi, suggestive of additional
roles for SPEN in Xist RNA stability and localisation. Thus, we made targeted point
mutations to the SPOC domain designed to abolish interactions of SPEN with downstream
NCOR/SMRT-HDAC3 corepressors but leave other functions such as Xist-binding intact.
Accordingly, SPENSPOCmut lacks these additional phenotypes but recapitulates most of
the defect in gene silencing of SPEN–/∆RRM. The degree of silencing deficiency is very
similar to deletion of the full SPOC domain reported in an independent study (Dossin
et al. 2020), suggesting that this two amino-acid point mutation abrogate all interactions
attributable to the SPOC domain, although auxiliary interfaces for silencing factor binding
elsewhere on the SPEN protein cannot be fully ruled out.
A colleague in the Brockdorff lab, Dr Lisa Rodermund, characterised these same SPEN
mutations in an iXist-ChrX line carrying Xist fused with Bgl stem loops to allow for RNA
imaging with the HaloTag technology (Rodermund et al. 2020). Using super-resolution
microscopy, she found that SPEN–/∆RRM (but not SPENSPOCmut) causes diffuse delocal-
isation of single molecules of Xist within the nucleus and a significant decrease in Xist
RNA stability. This latter observation is in agreement with an independent report of
reduced half-life of inducible Xist RNA in Spen -/- cells (Robert-Finestra et al. 2020). It

191
may be linked to an interplay with pathways of RNA decay via RBM15, which in CLIP
experiments shows a similar binding pattern over Xist RNA to SPEN (Cirillo et al. 2016;
Patil et al. 2016), or via reader proteins of the strong peak of N6-Methyladenosine (m6A)
modification just downstream of the A-repeats (Patil et al. 2016).
Other recent publications also support this novel role for SPEN in shaping Xist’s localisa-
tion over Xi chromatin. Fluorescence Recovery After Photobleaching (FRAP) experiments
by Markaki et al. show that whereas most SPEN molecules are highly dynamic in both
the Xi and the nucleus as whole, there is an immobilised fraction specific to Xi that po-
tentially represents SPEN bound to Xist (Markaki et al. 2020). Additionally, Dossin et al.
report that SPEN is recruited to Xi and enriched specifically at the chromatin of active
gene promoters within 4 hours of Xist induction (Dossin et al. 2020). Taken together, this
suggests a model in which SPEN binding helps localise Xist RNA to its correct target
sites, or alternatively, reshapes the chromatin of Xi in order to bring active genes into
closer association with anchored Xist ribonucleoprotein (RNP) complexes. It has been
proposed that interactions with corepressors pre-bound at target regions may facilitate
the association of Xist/SPEN with correct chromatin regions (Zylicz et al. 2019; Dossin
et al. 2020), although near-normal Polycomb deposition (and by proxy Xist localisation) in
SPENSPOCmut argues against this being the primary mechanism. The unstructured IDR
region of SPEN have also been reported as necessary for Xi-specific SPEN accumulation
and as a mechanism for how Xist extends its influence to chromatin beyond initial ‘entry
sites’ (Markaki et al. 2020), although deletion of much of this region has little effect on
initial gene silencing (Dossin et al. 2020). These apparently contradictory observations in-
dicate that further work is needed to distinguish between alternative models and to clarify
the mechanisms underpinning the role of SPEN in Xist RNA localisation.
The specific ablation of corepressor binding by the SPOC mutation allows for novel in-
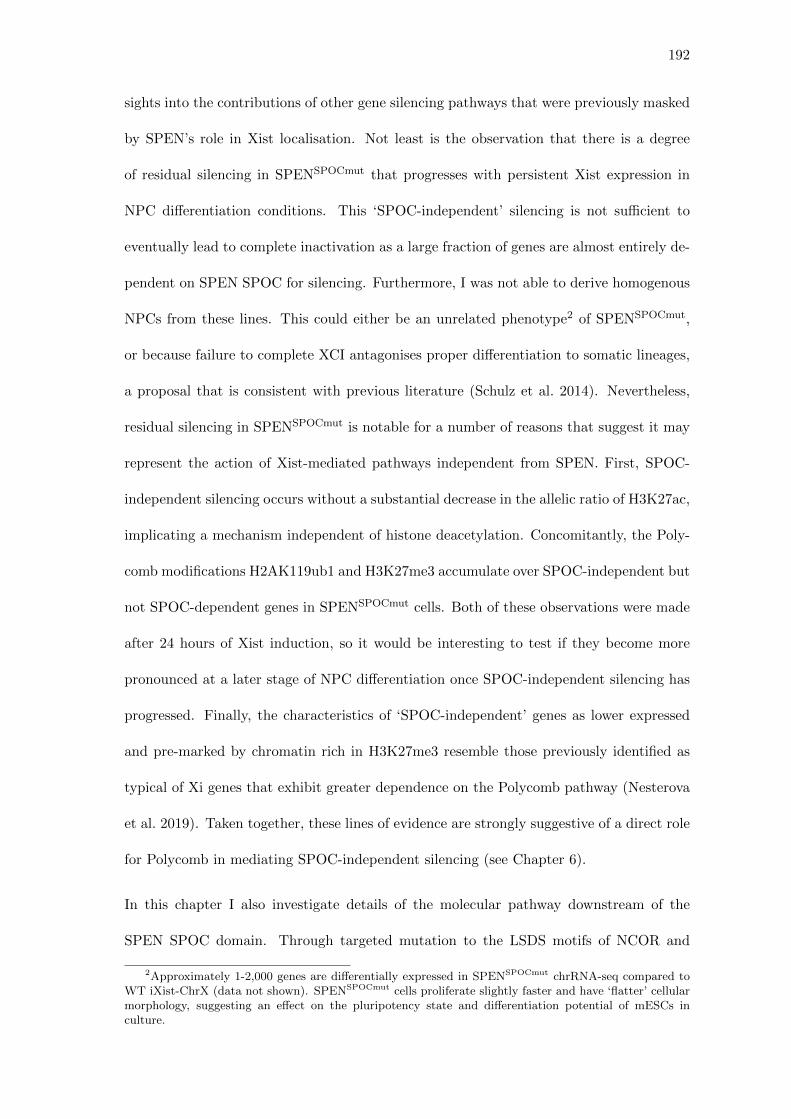
192
sights into the contributions of other gene silencing pathways that were previously masked
by SPEN’s role in Xist localisation. Not least is the observation that there is a degree
of residual silencing in SPENSPOCmut that progresses with persistent Xist expression in
NPC differentiation conditions. This ‘SPOC-independent’ silencing is not sufficient to
eventually lead to complete inactivation as a large fraction of genes are almost entirely de-
pendent on SPEN SPOC for silencing. Furthermore, I was not able to derive homogenous
NPCs from these lines. This could either be an unrelated phenotype2 of SPENSPOCmut,
or because failure to complete XCI antagonises proper differentiation to somatic lineages,
a proposal that is consistent with previous literature (Schulz et al. 2014). Nevertheless,
residual silencing in SPENSPOCmut is notable for a number of reasons that suggest it may
represent the action of Xist-mediated pathways independent from SPEN. First, SPOC-
independent silencing occurs without a substantial decrease in the allelic ratio of H3K27ac,
implicating a mechanism independent of histone deacetylation. Concomitantly, the Poly-
comb modifications H2AK119ub1 and H3K27me3 accumulate over SPOC-independent but
not SPOC-dependent genes in SPENSPOCmut cells. Both of these observations were made
after 24 hours of Xist induction, so it would be interesting to test if they become more
pronounced at a later stage of NPC differentiation once SPOC-independent silencing has
progressed. Finally, the characteristics of ‘SPOC-independent’ genes as lower expressed
and pre-marked by chromatin rich in H3K27me3 resemble those previously identified as
typical of Xi genes that exhibit greater dependence on the Polycomb pathway (Nesterova
et al. 2019). Taken together, these lines of evidence are strongly suggestive of a direct role
for Polycomb in mediating SPOC-independent silencing (see Chapter 6).
In this chapter I also investigate details of the molecular pathway downstream of the
SPEN SPOC domain. Through targeted mutation to the LSDS motifs of NCOR and
2Approximately 1-2,000 genes are differentially expressed in SPENSPOCmut chrRNA-seq compared toWT iXist-ChrX (data not shown). SPENSPOCmut cells proliferate slightly faster and have ‘flatter’ cellularmorphology, suggesting an effect on the pluripotency state and differentiation potential of mESCs inculture.
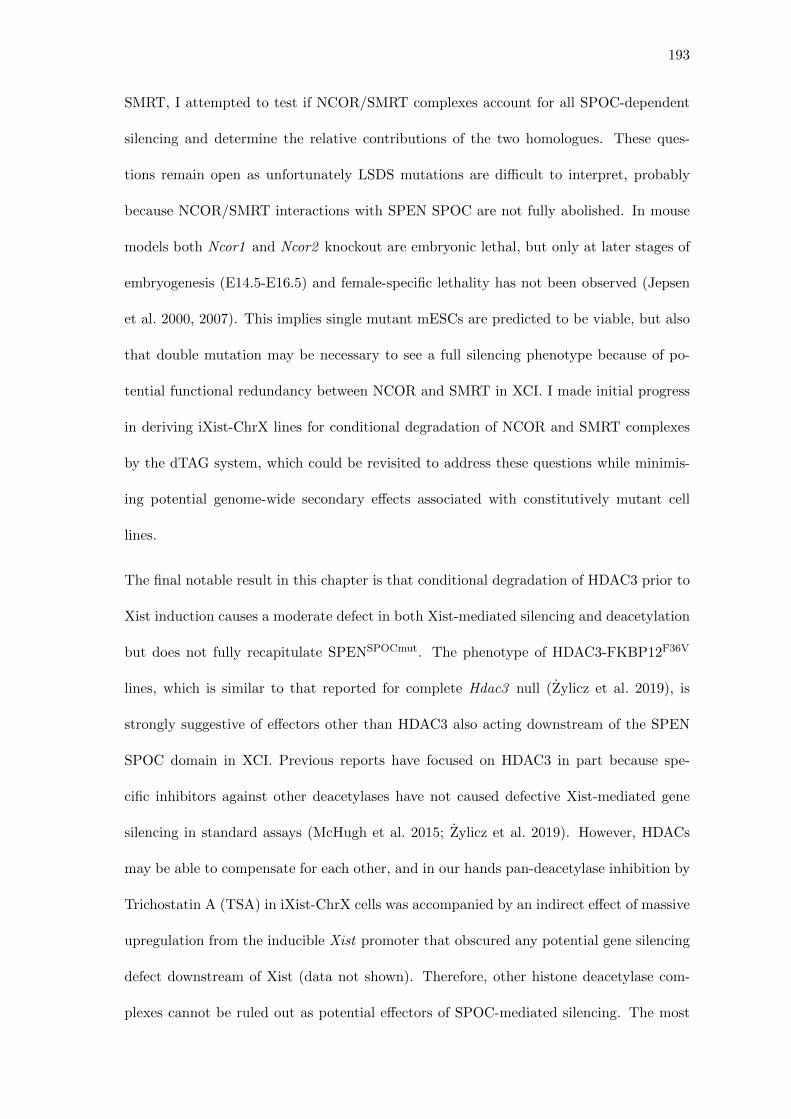
193
SMRT, I attempted to test if NCOR/SMRT complexes account for all SPOC-dependent
silencing and determine the relative contributions of the two homologues. These ques-
tions remain open as unfortunately LSDS mutations are difficult to interpret, probably
because NCOR/SMRT interactions with SPEN SPOC are not fully abolished. In mouse
models both Ncor1 and Ncor2 knockout are embryonic lethal, but only at later stages of
embryogenesis (E14.5-E16.5) and female-specific lethality has not been observed (Jepsen
et al. 2000, 2007). This implies single mutant mESCs are predicted to be viable, but also
that double mutation may be necessary to see a full silencing phenotype because of po-
tential functional redundancy between NCOR and SMRT in XCI. I made initial progress
in deriving iXist-ChrX lines for conditional degradation of NCOR and SMRT complexes
by the dTAG system, which could be revisited to address these questions while minimis-
ing potential genome-wide secondary effects associated with constitutively mutant cell
lines.
The final notable result in this chapter is that conditional degradation of HDAC3 prior to
Xist induction causes a moderate defect in both Xist-mediated silencing and deacetylation
but does not fully recapitulate SPENSPOCmut. The phenotype of HDAC3-FKBP12F36V
lines, which is similar to that reported for complete Hdac3 null (Zylicz et al. 2019), is
strongly suggestive of effectors other than HDAC3 also acting downstream of the SPEN
SPOC domain in XCI. Previous reports have focused on HDAC3 in part because spe-
cific inhibitors against other deacetylases have not caused defective Xist-mediated gene
silencing in standard assays (McHugh et al. 2015; Zylicz et al. 2019). However, HDACs
may be able to compensate for each other, and in our hands pan-deacetylase inhibition by
Trichostatin A (TSA) in iXist-ChrX cells was accompanied by an indirect effect of massive
upregulation from the inducible Xist promoter that obscured any potential gene silencing
defect downstream of Xist (data not shown). Therefore, other histone deacetylase com-
plexes cannot be ruled out as potential effectors of SPOC-mediated silencing. The most
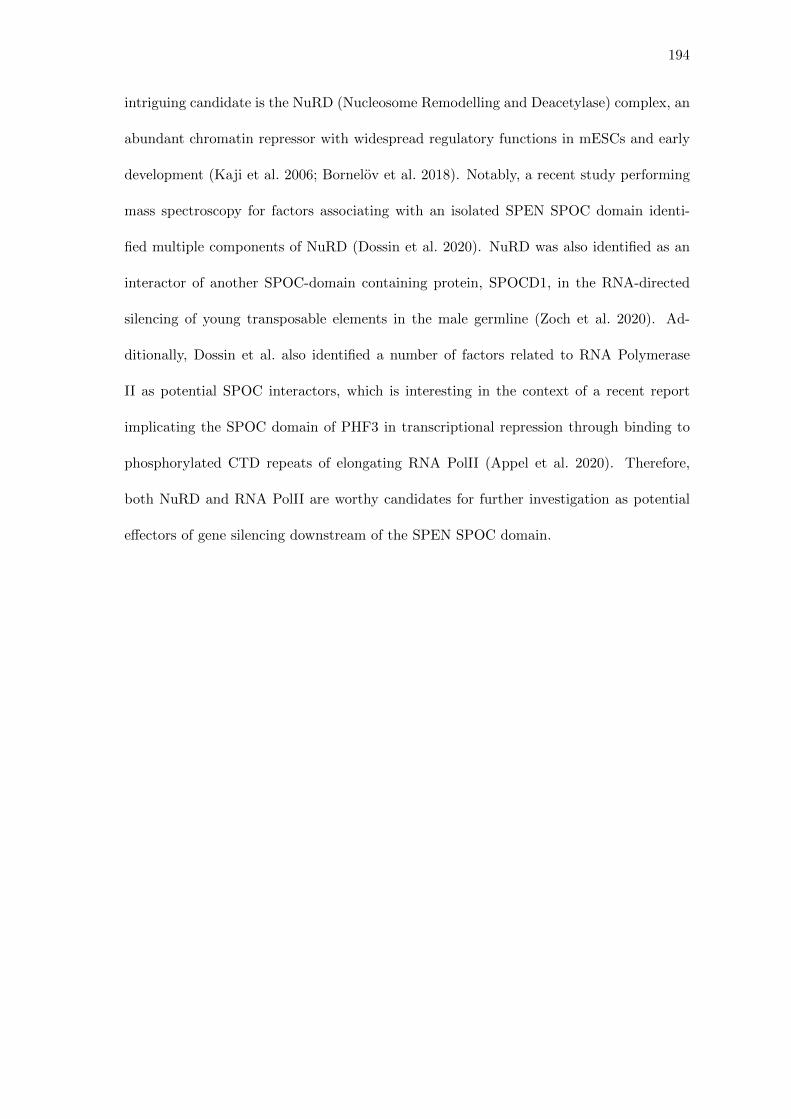
194
intriguing candidate is the NuRD (Nucleosome Remodelling and Deacetylase) complex, an
abundant chromatin repressor with widespread regulatory functions in mESCs and early
development (Kaji et al. 2006; Bornelov et al. 2018). Notably, a recent study performing
mass spectroscopy for factors associating with an isolated SPEN SPOC domain identi-
fied multiple components of NuRD (Dossin et al. 2020). NuRD was also identified as an
interactor of another SPOC-domain containing protein, SPOCD1, in the RNA-directed
silencing of young transposable elements in the male germline (Zoch et al. 2020). Ad-
ditionally, Dossin et al. also identified a number of factors related to RNA Polymerase
II as potential SPOC interactors, which is interesting in the context of a recent report
implicating the SPOC domain of PHF3 in transcriptional repression through binding to
phosphorylated CTD repeats of elongating RNA PolII (Appel et al. 2020). Therefore,
both NuRD and RNA PolII are worthy candidates for further investigation as potential
effectors of gene silencing downstream of the SPEN SPOC domain.
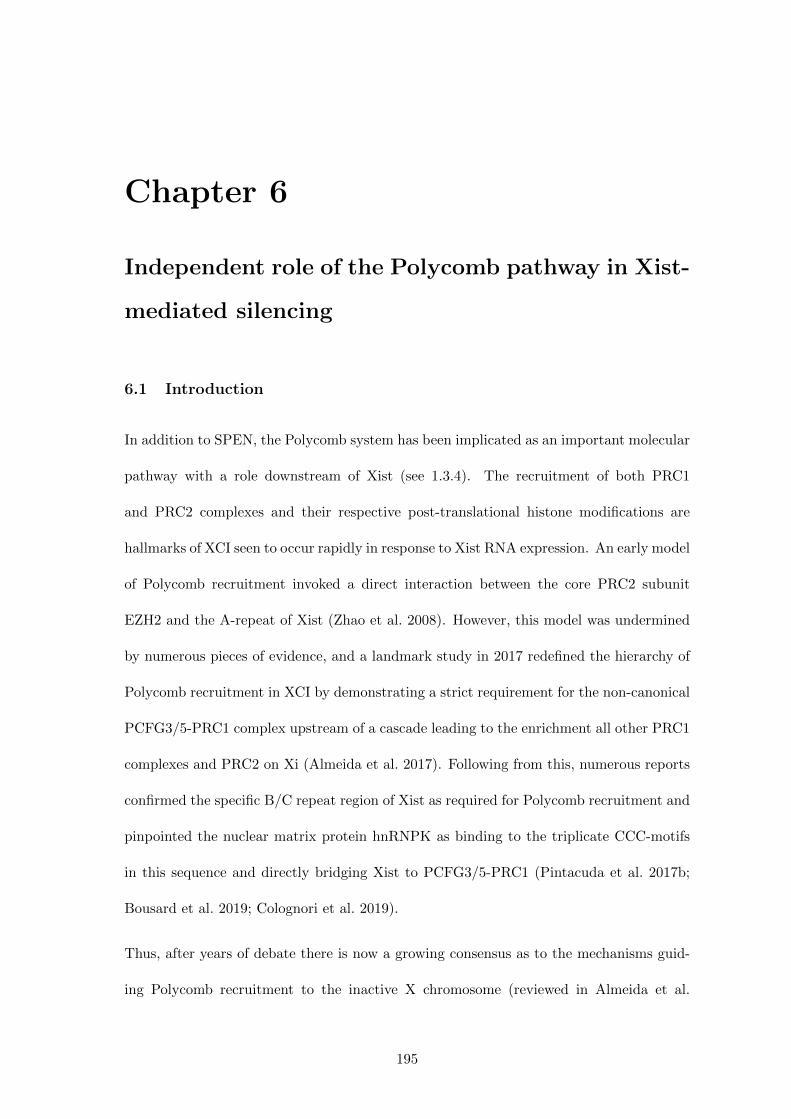
Chapter 6
Independent role of the Polycomb pathway in Xist-
mediated silencing
6.1 Introduction
In addition to SPEN, the Polycomb system has been implicated as an important molecular
pathway with a role downstream of Xist (see 1.3.4). The recruitment of both PRC1
and PRC2 complexes and their respective post-translational histone modifications are
hallmarks of XCI seen to occur rapidly in response to Xist RNA expression. An early model
of Polycomb recruitment invoked a direct interaction between the core PRC2 subunit
EZH2 and the A-repeat of Xist (Zhao et al. 2008). However, this model was undermined
by numerous pieces of evidence, and a landmark study in 2017 redefined the hierarchy of
Polycomb recruitment in XCI by demonstrating a strict requirement for the non-canonical
PCFG3/5-PRC1 complex upstream of a cascade leading to the enrichment all other PRC1
complexes and PRC2 on Xi (Almeida et al. 2017). Following from this, numerous reports
confirmed the specific B/C repeat region of Xist as required for Polycomb recruitment and
pinpointed the nuclear matrix protein hnRNPK as binding to the triplicate CCC-motifs
in this sequence and directly bridging Xist to PCFG3/5-PRC1 (Pintacuda et al. 2017b;
Bousard et al. 2019; Colognori et al. 2019).
Thus, after years of debate there is now a growing consensus as to the mechanisms guid-
ing Polycomb recruitment to the inactive X chromosome (reviewed in Almeida et al.
195
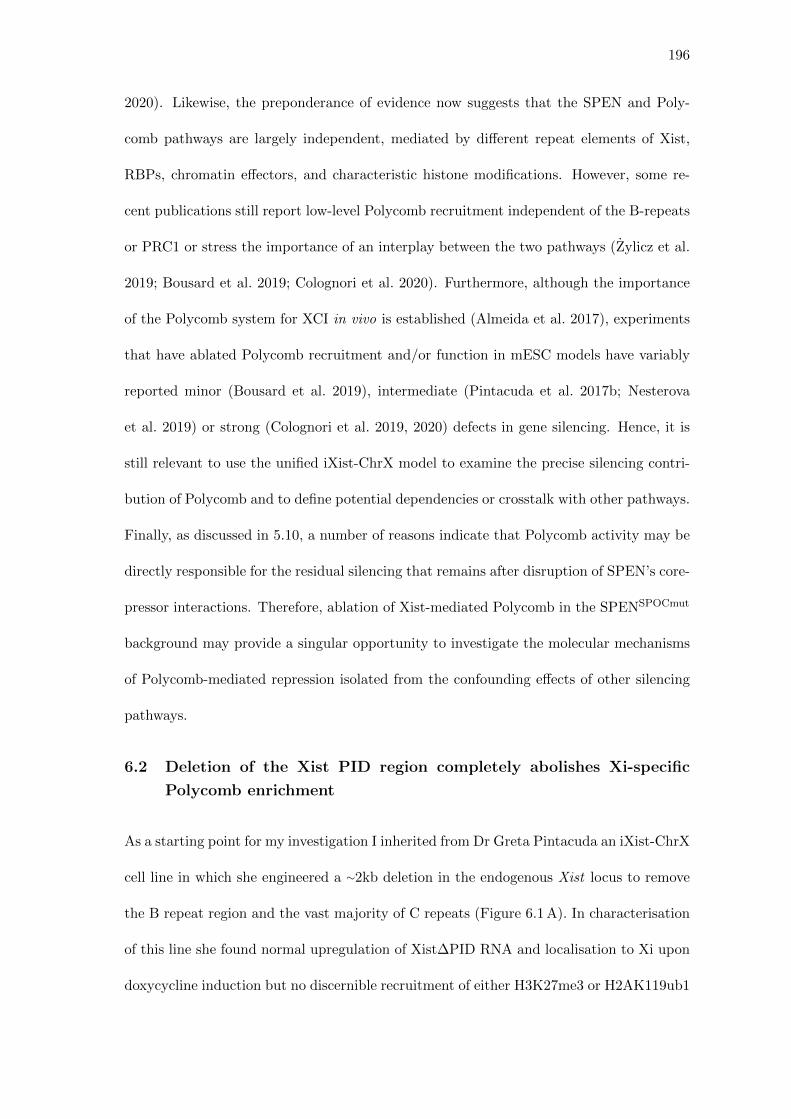
196
2020). Likewise, the preponderance of evidence now suggests that the SPEN and Poly-
comb pathways are largely independent, mediated by different repeat elements of Xist,
RBPs, chromatin effectors, and characteristic histone modifications. However, some re-
cent publications still report low-level Polycomb recruitment independent of the B-repeats
or PRC1 or stress the importance of an interplay between the two pathways (Zylicz et al.
2019; Bousard et al. 2019; Colognori et al. 2020). Furthermore, although the importance
of the Polycomb system for XCI in vivo is established (Almeida et al. 2017), experiments
that have ablated Polycomb recruitment and/or function in mESC models have variably
reported minor (Bousard et al. 2019), intermediate (Pintacuda et al. 2017b; Nesterova
et al. 2019) or strong (Colognori et al. 2019, 2020) defects in gene silencing. Hence, it is
still relevant to use the unified iXist-ChrX model to examine the precise silencing contri-
bution of Polycomb and to define potential dependencies or crosstalk with other pathways.
Finally, as discussed in 5.10, a number of reasons indicate that Polycomb activity may be
directly responsible for the residual silencing that remains after disruption of SPEN’s core-
pressor interactions. Therefore, ablation of Xist-mediated Polycomb in the SPENSPOCmut
background may provide a singular opportunity to investigate the molecular mechanisms
of Polycomb-mediated repression isolated from the confounding effects of other silencing
pathways.
6.2 Deletion of the Xist PID region completely abolishes Xi-specific
Polycomb enrichment
As a starting point for my investigation I inherited from Dr Greta Pintacuda an iXist-ChrX
cell line in which she engineered a ∼2kb deletion in the endogenous Xist locus to remove
the B repeat region and the vast majority of C repeats (Figure 6.1 A). In characterisation
of this line she found normal upregulation of Xist∆PID RNA and localisation to Xi upon
doxycycline induction but no discernible recruitment of either H3K27me3 or H2AK119ub1
197
DAPI H3K27me3 CIZ1
DAPI H2AK119ub1 Xist
Data from Dr Greta Pintacuda
0
0.25
0.5
0.75
1
Allelic
RatioXi
/ (Xi
+Xa
)
0
2000
4000
6000
XistRPM
WT XistΔPID+- +-
+- +- 24h Xist
WT XistΔPIDA C
D
B
103,480 kb103,478 kb103,476 kb 103,482 kbChromosome X
Xist Repeats
WT
Xist
D F AC B
XistΔA H12
XistΔA C2
XistΔPID
279bp
441bp
1921bp
Figure 6.1: Characterisation of Xist∆PID
A) Genome browser (IGV) screenshot over Xist of chrRNA-seq from WT iXist-ChrX,
Xist∆A and Xist∆PID lines. Exact widths of each deletion and the genome locations of
Xist repeat elements are annotated.
B) Representative images in Xist∆PID from immunofluorescence for H3K27me3 and CIZ1
(upper panels) and immunoFISH co-staining for H2AK119ub1 and Xist RNA (lower pan-
els). Scale bars of 5µm. Experiments performed by Dr Greta Pintacuda.
C) Boxplots of chrRNA-seq allelic ratios in WT and Xist∆PID mESCs upon 24 hours of
Xist expression. WT is averaged from 3 technical replicates, Xist∆PID is averaged from 2
replicates performed by Dr Greta Pinactuda and published in (Nesterova et al. 2019).
D) Relative levels of chromatin-associated Xist RNA for each sample above.
to Xi (Figure 6.1 B). Notably, the Xist∆PID line presents an intermediate defect in gene
silencing by chrRNA-seq (Figure 6.1 C), less severe than SPENSPOCmut but in a similar
range to loss of HDAC3 (cf. 5.13). This defect occurs despite similar or even slightly
elevated levels of chromatin-associated Xist RNA compared to WT (Figure 6.1 D).
Considering recent reports of low-level Polycomb recruitment in the absence of the B-
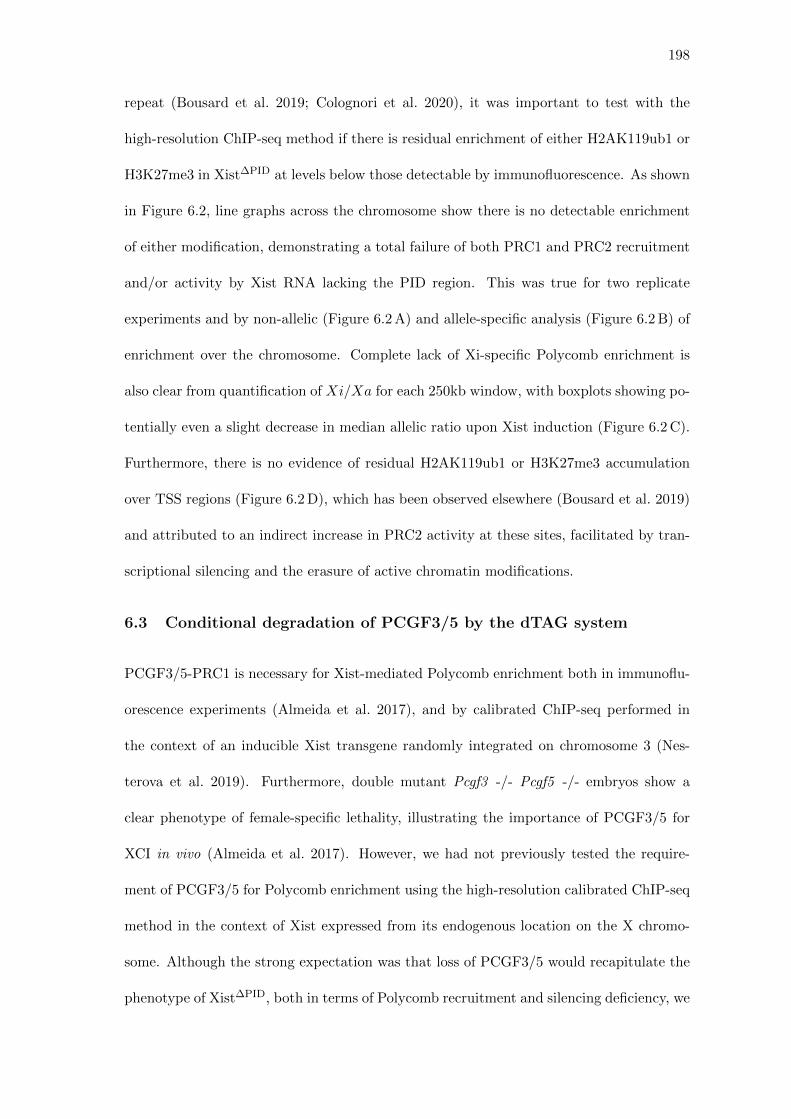
198
repeat (Bousard et al. 2019; Colognori et al. 2020), it was important to test with the
high-resolution ChIP-seq method if there is residual enrichment of either H2AK119ub1 or
H3K27me3 in Xist∆PID at levels below those detectable by immunofluorescence. As shown
in Figure 6.2, line graphs across the chromosome show there is no detectable enrichment
of either modification, demonstrating a total failure of both PRC1 and PRC2 recruitment
and/or activity by Xist RNA lacking the PID region. This was true for two replicate
experiments and by non-allelic (Figure 6.2 A) and allele-specific analysis (Figure 6.2 B) of
enrichment over the chromosome. Complete lack of Xi-specific Polycomb enrichment is
also clear from quantification of Xi/Xa for each 250kb window, with boxplots showing po-
tentially even a slight decrease in median allelic ratio upon Xist induction (Figure 6.2 C).
Furthermore, there is no evidence of residual H2AK119ub1 or H3K27me3 accumulation
over TSS regions (Figure 6.2 D), which has been observed elsewhere (Bousard et al. 2019)
and attributed to an indirect increase in PRC2 activity at these sites, facilitated by tran-
scriptional silencing and the erasure of active chromatin modifications.
6.3 Conditional degradation of PCGF3/5 by the dTAG system
PCGF3/5-PRC1 is necessary for Xist-mediated Polycomb enrichment both in immunoflu-
orescence experiments (Almeida et al. 2017), and by calibrated ChIP-seq performed in
the context of an inducible Xist transgene randomly integrated on chromosome 3 (Nes-
terova et al. 2019). Furthermore, double mutant Pcgf3 -/- Pcgf5 -/- embryos show a
clear phenotype of female-specific lethality, illustrating the importance of PCGF3/5 for
XCI in vivo (Almeida et al. 2017). However, we had not previously tested the require-
ment of PCGF3/5 for Polycomb enrichment using the high-resolution calibrated ChIP-seq
method in the context of Xist expressed from its endogenous location on the X chromo-
some. Although the strong expectation was that loss of PCGF3/5 would recapitulate the
phenotype of Xist∆PID, both in terms of Polycomb recruitment and silencing deficiency, we
199
B
Xist0 20 40 60 80 100 0 20 40 60 80 100
Xist
No Dox
24h Xist
No Dox
24h Xist
0
1
2
3
4
0
1
2
3
4
Alle
licΔEn
richm
ent(Xi -
Xa)
Chromosome X location (Mb) Chromosome X location (Mb)
WT XistΔPID WT XistΔPID
Xist0 50 100 150
H3K27me3WT XistΔPID
ΔEn
richm
ent
(Dox
-NoD
ox)
0
1
2
3
Xist0 50 100 150
Chromosome X location (Mb)
H2AK119ub1
H3K27me3H2AK119ub1
WT XistΔPIDA
2
1
4
5
0
3
NoDox 24h Xist NoDox 24h Xist
Alle
licRatio
(Xi /
Xa)
H3K27me3
WT XistΔPID
2
1
4
5
0
3
NoDox 24h Xist NoDox 24h Xist
Alle
licRatio
(Xi /
Xa)
H2AK119ub1
WT XistΔPID
C
DWT Rep1 No DoxWT Rep1 24h Xist
ΔPID Rep1 No DoxΔPID Rep1 24h Xist
WT Rep2 No DoxWT Rep2 24h Xist
ΔPID Rep2 No DoxΔPID Rep2 24h Xist
-10kb TSS +10kb -10kb TSS +10kb
0
0.4
0.8
1.2
0
0.4
0.8
1.2
RelativeH3K
27me3
sign
al
WT Rep1 No DoxWT Rep1 24h Xist
ΔPID Rep1 No DoxΔPID Rep1 24h Xist
WT Rep2 No DoxWT Rep2 24h Xist
ΔPID Rep2 No DoxΔPID Rep2 24h Xist
-10kb TSS +10kb-10kb TSS +10kb
0
0.4
0.8
1.2
0
0.4
0.8
1.2
RelativeH2A
K119u
b1sign
al
Figure 6.2: Abolition of Xist-mediated Polycomb enrichment in Xist∆PID
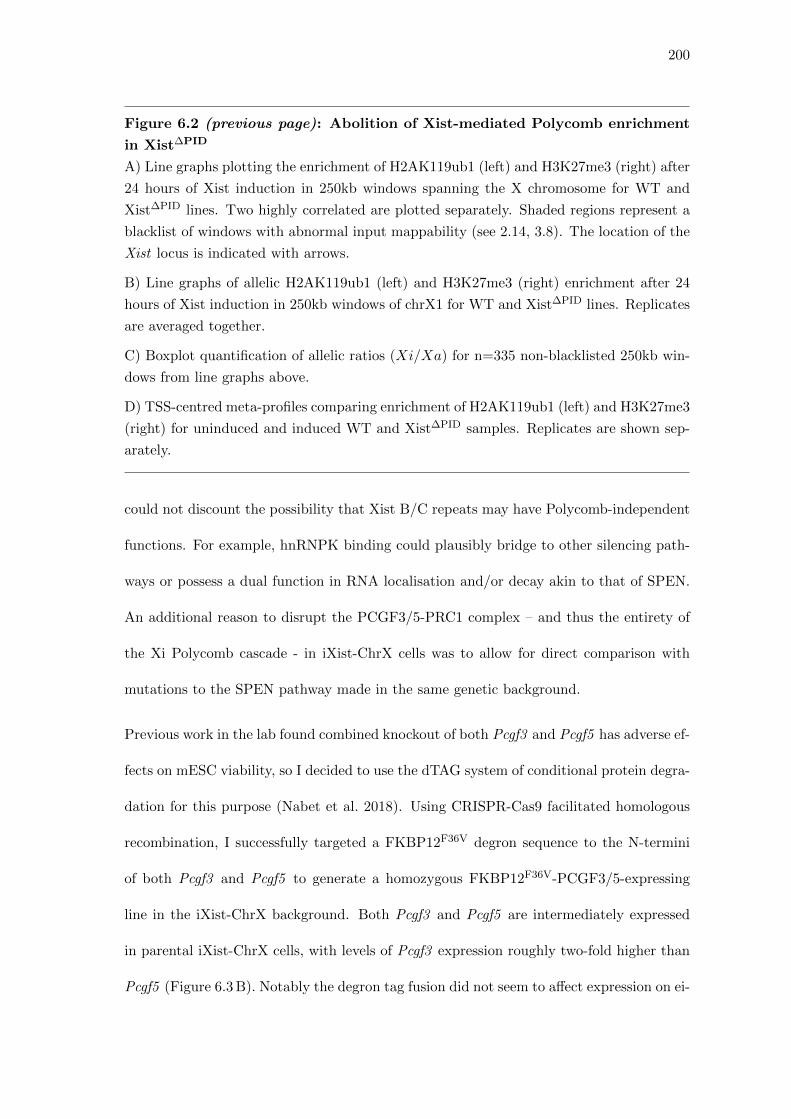
200
Figure 6.2 (previous page): Abolition of Xist-mediated Polycomb enrichment
in Xist∆PID
A) Line graphs plotting the enrichment of H2AK119ub1 (left) and H3K27me3 (right) after
24 hours of Xist induction in 250kb windows spanning the X chromosome for WT and
Xist∆PID lines. Two highly correlated are plotted separately. Shaded regions represent a
blacklist of windows with abnormal input mappability (see 2.14, 3.8). The location of the
Xist locus is indicated with arrows.
B) Line graphs of allelic H2AK119ub1 (left) and H3K27me3 (right) enrichment after 24
hours of Xist induction in 250kb windows of chrX1 for WT and Xist∆PID lines. Replicates
are averaged together.
C) Boxplot quantification of allelic ratios (Xi/Xa) for n=335 non-blacklisted 250kb win-
dows from line graphs above.
D) TSS-centred meta-profiles comparing enrichment of H2AK119ub1 (left) and H3K27me3
(right) for uninduced and induced WT and Xist∆PID samples. Replicates are shown sep-
arately.
could not discount the possibility that Xist B/C repeats may have Polycomb-independent
functions. For example, hnRNPK binding could plausibly bridge to other silencing path-
ways or possess a dual function in RNA localisation and/or decay akin to that of SPEN.
An additional reason to disrupt the PCGF3/5-PRC1 complex – and thus the entirety of
the Xi Polycomb cascade - in iXist-ChrX cells was to allow for direct comparison with
mutations to the SPEN pathway made in the same genetic background.
Previous work in the lab found combined knockout of both Pcgf3 and Pcgf5 has adverse ef-
fects on mESC viability, so I decided to use the dTAG system of conditional protein degra-
dation for this purpose (Nabet et al. 2018). Using CRISPR-Cas9 facilitated homologous
recombination, I successfully targeted a FKBP12F36V degron sequence to the N-termini
of both Pcgf3 and Pcgf5 to generate a homozygous FKBP12F36V-PCGF3/5-expressing
line in the iXist-ChrX background. Both Pcgf3 and Pcgf5 are intermediately expressed
in parental iXist-ChrX cells, with levels of Pcgf3 expression roughly two-fold higher than
Pcgf5 (Figure 6.3 B). Notably the degron tag fusion did not seem to affect expression on ei-
201
ther the protein or RNA level (Figure 6.3 B,C). Treatment of the FKBP12F36V-PCGF3/5
line with 100nM dTAG-13 leads to rapid degradation of both proteins to levels unde-
tectable by Western blot of nuclear extract in under 15 minutes, and cells could be kept
under dTAG-13 treatment for several passages without noticeable effects on cell viability
or proliferation.
Further characterisation showed that degradation of PCGF3/5 does not lead to desta-
bilisation and reduced protein levels of the core PRC1 and PRC2 subunits, RING1B
and SUZ12 respectively (Figure 6.3 B). However, by calibration of ChIP-seq experiments
performed in this line with an exogenous spike-in of Drosophila cells it was possible to
observe a global reduction in genome-wide H2AK119ub1 by approximately ∼30% after
dTAG treatment for 36 hours. This is within a similar range to that previously reported
for Pcgf3/5 conditional KO (Fursova et al. 2019) and can be traced to reduced ‘blanket’
coverage over intergenic or gene body regions rather than at known sites of PRC1 com-
plex enrichment in the genome (Figure 6.3 D). Levels of H3K27me3 genome-wide were less
affected (Figure 6.3 E).
Finally, I verified monoallelic Xist induction upon doxycycline treatment of FKBP12F36V-
PCGF3/5 cells, with a similar proportion of cells showing Xist domains by RNA-FISH in
cells pre-treated with 12 hours dTAG as in untreated control cells (Figure 6.3 F). However,
I did observe slightly larger, diffuse clouds of Xist RNA in treated cells. This resembles
the Xist delocalisation phenotype reported upon Ring1a/b knockout in MEFs (Colognori
et al. 2019) and may also be linked to the putative role of Polycomb in facilitating global
condensation of the inactive X chromosome within its nuclear territory (Wang et al. 2019;
Markaki et al. 2020).
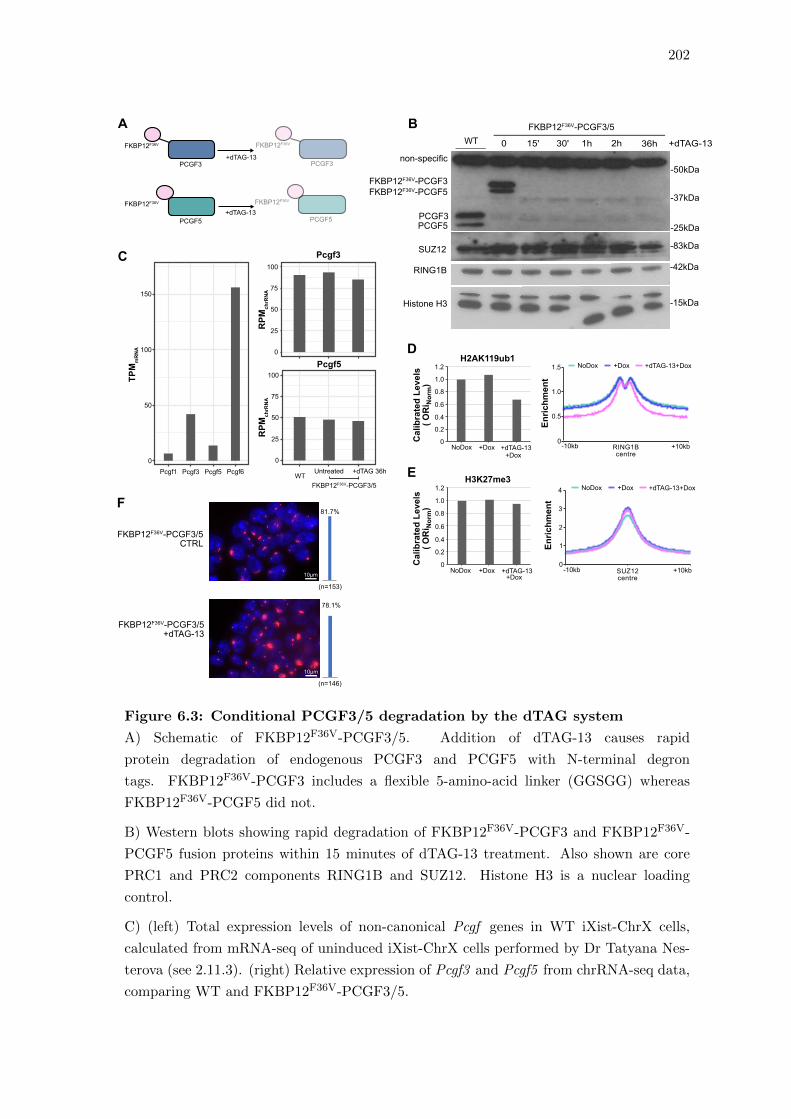
202
0
50
100
150
TPMmRNA
Pcgf5
Pcgf3
0
25
50
75
100
0
25
50
75
100
FKBP12F36V-PCGF3/5
RPM
chrRNA
RPM
chrRNA
Pcgf1 Pcgf3 Pcgf5 Pcgf6 WTUntreated +dTAG 36h
NoDox +Dox+Dox+dTAG-13
0.2
1.0
1.2
0.8
0
0.6
0.4
H3K27me3E
CalibratedLevels
(ORi Norm)
H2AK119ub1
0
0.6
0.4
0.2
1.0
1.2
0.8
D
CalibratedLevels
(ORi Norm)
NoDox +Dox+Dox+dTAG-13
0
0.5
1.0
1.5
Enrichment
NoDox +Dox +dTAG-13+Dox
-10kb RING1Bcentre
+10kb
-10kb SUZ12centre
+10kb0
1
4
3
2
Enrichment
NoDox +Dox +dTAG-13+Dox
FKBP12F36V-PCGF3/5+dTAG-13
FKBP12F36V-PCGF3/5CTRL
(n=153)
(n=146)
78.1%
81.7%F
10μm
10μm
B
C SUZ12
WT
-50kDa
-37kDa
-25kDa
-83kDa
-42kDa
-15kDa
FKBP12F36V-PCGF3FKBP12F36V-PCGF5
+dTAG-130 15' 30' 1h 2h 36h
PCGF3PCGF5
non-specific
FKBP12F36V-PCGF3/5
RING1B
Histone H3
PCGF3+dTAG-13
FKBP12F36V
PCGF3
FKBP12F36V
+dTAG-13PCGF5
FKBP12F36V
PCGF5
FKBP12F36V
A
Figure 6.3: Conditional PCGF3/5 degradation by the dTAG system
A) Schematic of FKBP12F36V-PCGF3/5. Addition of dTAG-13 causes rapid
protein degradation of endogenous PCGF3 and PCGF5 with N-terminal degron
tags. FKBP12F36V-PCGF3 includes a flexible 5-amino-acid linker (GGSGG) whereas
FKBP12F36V-PCGF5 did not.
B) Western blots showing rapid degradation of FKBP12F36V-PCGF3 and FKBP12F36V-
PCGF5 fusion proteins within 15 minutes of dTAG-13 treatment. Also shown are core
PRC1 and PRC2 components RING1B and SUZ12. Histone H3 is a nuclear loading
control.
C) (left) Total expression levels of non-canonical Pcgf genes in WT iXist-ChrX cells,
calculated from mRNA-seq of uninduced iXist-ChrX cells performed by Dr Tatyana Nes-
terova (see 2.11.3). (right) Relative expression of Pcgf3 and Pcgf5 from chrRNA-seq data,
comparing WT and FKBP12F36V-PCGF3/5.

203
Figure 6.3 (previous page): Conditional PCGF3/5 degradation by the dTAG
system
D) (left) Calibrated global levels of H2AK119ub1 from ChIP-seq experiments performed
in FKBP12F36V-PCGF3/5 with exogenous spike-in of Drosophila cells. Calibration factors
calculated as per (Hu et al. 2015) (see Appendix Table A5) and averaged over two replicate
clones. (right) Meta-profiles of H2AK119ub1 enrichment centred on the classical PRC1
target regions of RING1B peaks, as defined in (Fursova et al. 2019).
E) As above but for H3K27me3 and PRC2 regions defined by SUZ12 peak centres.
F) Xist RNA-FISH in FKBP12F36V-PCGF3/5 cells after 24 hours of Xist induction in
untreated cells and cells pre-treated with 12 hours of dTAG-13. The percentage of cells
containing Xist domains is indicated alongside.
6.4 PCGF3/5 is required for Xist-mediated Polycomb enrichment in
iXist-ChrX mESCs
The primary purpose of performing calibrated ChIP-seq for H2AK119ub1 and H3K27me3
in the FKBP12F36V-PCGF3/5 line was to assay the effect of PCGF3/5 depletion on Poly-
comb enrichment by Xist. Although my standard non-allelic analysis pipeline was con-
founded by the genome-wide decrease in H2AK119ub1, allele-specific analysis comparing
Xi − Xa enrichment in each sample demonstrates a clear requirement for PCGF3/5 in
Xi-specific Polycomb deposition in FKBP12F36V-PCGF3/5 mESCs. As shown in Fig-
ure 6.4 A, cells pre-treated with dTAG-13 for 12 hours prior to 24 hours of Xist induction
accumulate very little H2AK119ub1 and H3K27me3 over Xi compared to non-dTAG-
treated (doxycyline only) controls. Unexpectedly, there is a modest skew in the allelic
ratio of H2AK119ub1 upon doxycycline induction in PCGF3/5-degraded cells, from a me-
dian of 1.036 to 1.222 (Figure 6.4 B). Notably, this is not seen to the same extent for
H3K27me3 (1.117 vs 1.147), nor is it present in the Xist∆PID line (cf. Figure 6.4 C), which
rules out prior models of Polycomb recruitment via associations between PRC2 and the
Xist A-repeat. However, it does raise the possibility that Xist-hnRNPK may be able to
recruit other PRC1 complexes independent of PCGF3/5, albeit to a limited extent.
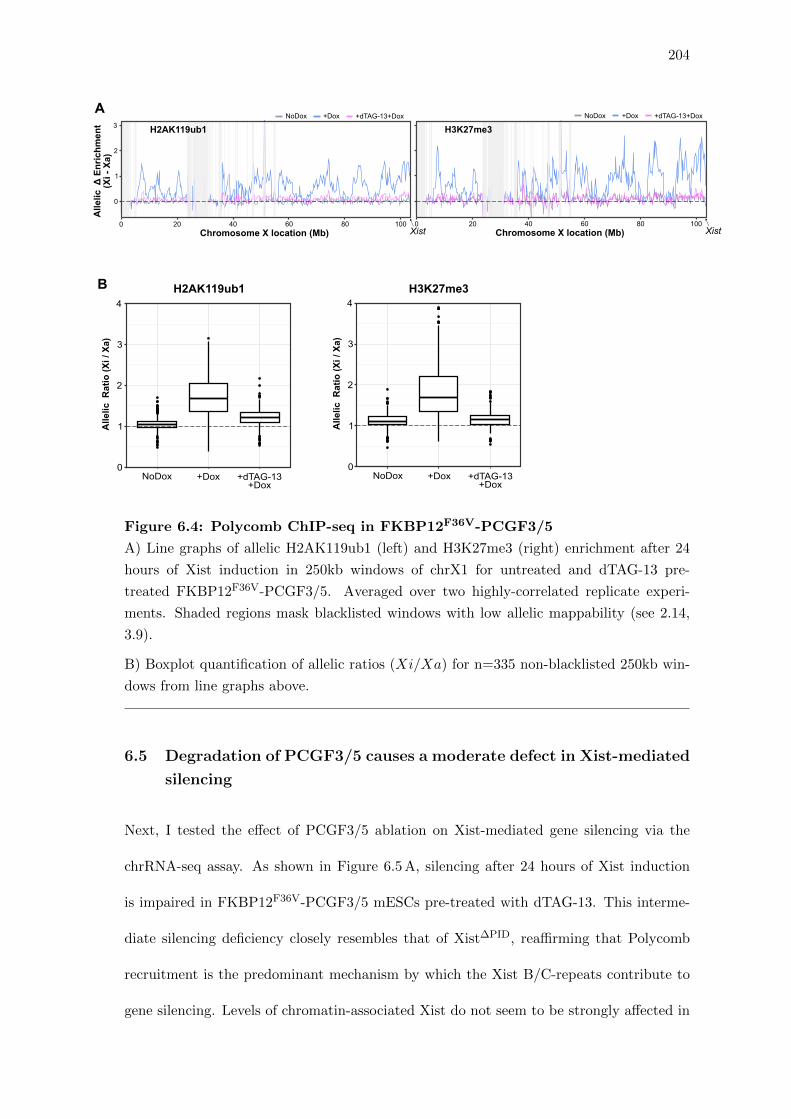
204
A
B
0
1
2
3
Allelic
ΔEnrichm
ent
(Xi -Xa)
Chromosome X location (Mb) Xist
H2AK119ub1
0 40 60 100
NoDox +Dox +dTAG-13+Dox
8020Chromosome X location (Mb) Xist
0 40 60 1008020
H3K27me3
Allelic
Ratio(Xi /Xa)
0
1
2
3
4
NoDox +Dox +dTAG-13+Dox
Allelic
Ratio(Xi /Xa)
0
1
2
3
4H2AK119ub1 H3K27me3
NoDox +Dox +dTAG-13+Dox NoDox +Dox +dTAG-13+Dox
Figure 6.4: Polycomb ChIP-seq in FKBP12F36V-PCGF3/5
A) Line graphs of allelic H2AK119ub1 (left) and H3K27me3 (right) enrichment after 24
hours of Xist induction in 250kb windows of chrX1 for untreated and dTAG-13 pre-
treated FKBP12F36V-PCGF3/5. Averaged over two highly-correlated replicate experi-
ments. Shaded regions mask blacklisted windows with low allelic mappability (see 2.14,
3.9).
B) Boxplot quantification of allelic ratios (Xi/Xa) for n=335 non-blacklisted 250kb win-
dows from line graphs above.
6.5 Degradation of PCGF3/5 causes a moderate defect in Xist-mediated
silencing
Next, I tested the effect of PCGF3/5 ablation on Xist-mediated gene silencing via the
chrRNA-seq assay. As shown in Figure 6.5 A, silencing after 24 hours of Xist induction
is impaired in FKBP12F36V-PCGF3/5 mESCs pre-treated with dTAG-13. This interme-
diate silencing deficiency closely resembles that of Xist∆PID, reaffirming that Polycomb
recruitment is the predominant mechanism by which the Xist B/C-repeats contribute to
gene silencing. Levels of chromatin-associated Xist do not seem to be strongly affected in
205
either direction by dTAG-13 treatment but are slightly lower in FKBP12F36V-PCGF3/5
than in the parental cell line (Figure 6.5 B). Perhaps related to this, silencing in untreated
FKBP12F36V-PCGF3/5 is marginally reduced compared to WT cells, as is the allelic en-
richment of H2AK119ub1 (median allelic ratio of 1.675 vs 1.952). This may just be a clonal
effect of the single FKBP12F36V-PCGF3/5 clone I was able to derive, or alternatively it
could be due to hypomorphic functions of tagged PCGF51 or PCGF3.
To further investigate the gene silencing deficiency upon PCGF3/5 degradation, I per-
formed two replicate chrRNA-seq experiments inducing untreated and dTAG-pre-treated
FKBP12F36V-PCGF3/5 cells for 3 and 6 days of the NPC differentiation protocol. Repli-
cates were highly similar and so are merged together in the results presented in Figure 6.6.
As shown in panel A, the defect seen after 24 hours in mESCs persists after 3 and 6 days
of Xist expression under NPC differentiation conditions. Levels of chromatin-associated
Xist are slightly reduced in dTAG-treated cells at these later timepoints (Figure 6.6 B),
whereas downregulation of Nanog, although subtly impaired (Figure 6.6 C), does not sug-
gest a major failure of exit from pluripotency.
Figure 6.6 D presents the chrRNA-seq data after 6 days Xist induction as a density plot,
demonstrating a clear difference between the control, in which most genes have silenced
near to completion, and the wide distribution of intermediately-silenced genes in the
dTAG-treated sample. I calculated the silencing differential for each gene (Figure 6.6 E)
and used this to separate equal sized groups of genes more or less affected by loss of
PCGF3/5. More affected genes were not significantly different in terms of initial expres-
sion levels (Figure 6.6 F), but had a strong tendency to be located further away from the
Xist locus on chrX1 compared to genes that were able to silence efficiently in the absence
of PCGF3/5 (Figure 6.6 G).
1The construct used for targeting Fkbp12F36V-Pcgf5 did not include a flexible amino acid linker betweenthe degron sequence and Pcgf5, so PCGF5 is more likely to be the hypomorphic fusion protein.
206
24h Xist36h dTAG-13
+-+- +-+- +-
++- -+- +-
++- -
WT SPENSPOCmut CTRL +dTAG-13
0
0.25
0.5
0.75
1
AllelicRatioXi/ (Xi+Xa)
A XistΔPIDFKBP12F36V-PCGF3/5
Rep1 Rep2
24h Xist36h dTAG-13
+-+- +-+- +-
++- -+- +-
++- -
XistRPM
0
2000
4000
6000
B
WT SPENSPOCmut XistΔPID
FKBP12F36V-PCGF3/5Rep1 Rep2
Figure 6.5: Intermediate silencing deficiency of FKBP12F36V-PCGF3/5 degra-
dation
A) Boxplots of chrRNA-seq allelic ratios upon 24 hours of Xist induction in FKBP12F36V-
PCGF3/5 with or without 12 hours pre-treatment with dTAG-13. Two replicate exper-
iments are shown separately. WT, SPENSPOCmut (each averaged from 3 replicates), and
Xist∆PID (averaged over two replicates) are shown for comparison.
B) Relative levels of chromatin-associated Xist RNA for each sample above.
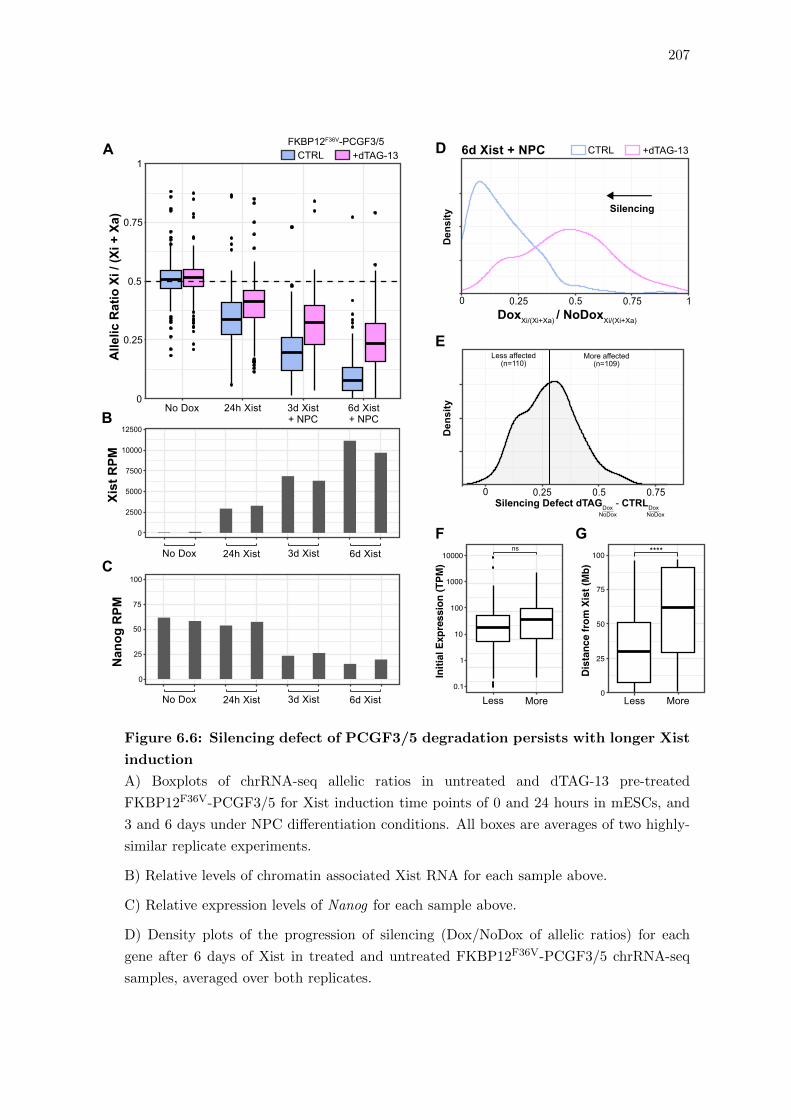
207
Nanog
RPM
0
25
50
75
100
0
2500
5000
7500
10000
12500
XistRPM
No Dox 24h Xist 3d Xist 6d Xist
No Dox 24h Xist 3d Xist 6d Xist
DoxXi/(Xi+Xa) / NoDoxXi/(Xi+Xa)
10.750.50.250
CTRL +dTAG-13
Silencing
Density
Silencing Defect dTAGDox - CTRLDoxNoDox NoDox
0.750.50.250
Density
Less affected(n=110)
More affected(n=109)
E
F
D
G
InitialExpression
(TPM
)
0
25
50
75
100
Distancefrom
Xist(Mb)
0.1
1
10
1000
100
10000ns ****
Less More Less More
A
B
C
0
0.25
0.5
0.75
1
Allelic
RatioXi
/ (Xi
+Xa
)
No Dox 24h Xist 3d Xist+ NPC
6d Xist+ NPC
6d Xist + NPCFKBP12F36V-PCGF3/5CTRL +dTAG-13
Figure 6.6: Silencing defect of PCGF3/5 degradation persists with longer Xist
induction
A) Boxplots of chrRNA-seq allelic ratios in untreated and dTAG-13 pre-treated
FKBP12F36V-PCGF3/5 for Xist induction time points of 0 and 24 hours in mESCs, and
3 and 6 days under NPC differentiation conditions. All boxes are averages of two highly-
similar replicate experiments.
B) Relative levels of chromatin associated Xist RNA for each sample above.
C) Relative expression levels of Nanog for each sample above.
D) Density plots of the progression of silencing (Dox/NoDox of allelic ratios) for each
gene after 6 days of Xist in treated and untreated FKBP12F36V-PCGF3/5 chrRNA-seq
samples, averaged over both replicates.
208
Figure 6.6 (previous page): Silencing defect of PCGF3/5 degradation persists
with longer Xist induction
E) Density plot of the differential in silencing (treated - control) caused by loss of PCGF3/5
for each gene. Genes are separated by a threshold at 0.281 into two equally sized groups
more or less-affected after 6 days of Xist expression.
F) Boxplot comparing the initial expression levels in iXist-ChrX cells of genes more- and
less-affected by loss of PCGF3/5.
G) Boxplot comparing the genomic distance from the Xist locus of genes more- and less-
affected by loss of PCGF3/5.
6.6 Defective NPC differentiation in FKBP12F36V-PCGF3/5
I attempted to complete the NPC differentiation protocol for FKBP12F36V-PCGF3/5
cells. However, by days 10-15 there were very high levels of cell death in dTAG-treated
samples. This was unsurprising given the predicted viability issues of PCGF3/5 -/- mESCs
and because failure of neuronal differentiation is a phenotype that has been previously
reported for single Pcgf5 mutant cells (Yao et al. 2018). Nevertheless, it was possible to
isolate enough cells after 22 days of the protocol to assay gene silencing in these ‘NPC-
like’ populations. The results of two highly similar chrRNA-seq replicate experiments are
merged together and presented in Figure 6.7. Gene silencing in PCGF3/5-depleted cells is
only able to progress to an allelic ratio of 0.229 (Figure 6.7 A). This is accompanied by a
failure to upregulate the neuronal marker Nestin and increased expression of pluripotency
genes compared to day 3 or 6 samples (Figure 6.7 B), likely reflecting strong selection in
these populations for proliferating undifferentiated cells.
More unexpectedly, in two replicate experiments I was not able to derive a homogeneous
NPC population of the untreated control FKBP12F36V-PCGF3/5 cells. This is reflected
in the chrRNA data of both gene silencing and marker gene expression in Figure 6.7, and
hints again that the engineered PCGF3 or PCGF5 fusion proteins may be hypomorphic,
including in functions related to proper cellular differentiation to neuronal lineages.
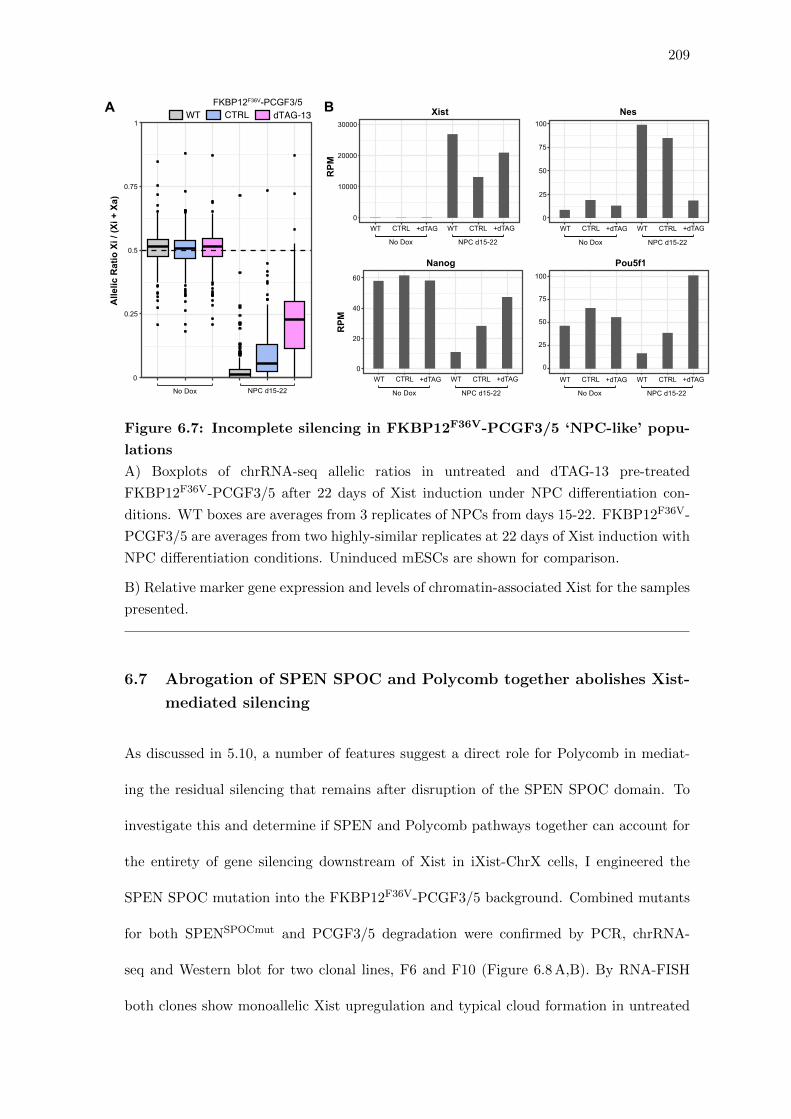
209
BAllelicRatioXi/ (Xi+Xa)
A
0
0.25
0.5
0.75
1WT CTRL dTAG-13
FKBP12F36V-PCGF3/5
No Dox NPC d15-22 No Dox NPC d15-22
No Dox NPC d15-22 No Dox NPC d15-22
No Dox NPC d15-22
CTRLWT +dTAGCTRLWT +dTAG
CTRLWT +dTAGCTRLWT +dTAG CTRLWT +dTAGCTRLWT +dTAG
CTRLWT +dTAGCTRLWT +dTAG
0
10000
20000
30000
0
25
50
75
100
0
20
40
60
0
25
50
75
100
Xist
Nanog Pou5f1
Nes
RPM
RPM
Figure 6.7: Incomplete silencing in FKBP12F36V-PCGF3/5 ‘NPC-like’ popu-
lations
A) Boxplots of chrRNA-seq allelic ratios in untreated and dTAG-13 pre-treated
FKBP12F36V-PCGF3/5 after 22 days of Xist induction under NPC differentiation con-
ditions. WT boxes are averages from 3 replicates of NPCs from days 15-22. FKBP12F36V-
PCGF3/5 are averages from two highly-similar replicates at 22 days of Xist induction with
NPC differentiation conditions. Uninduced mESCs are shown for comparison.
B) Relative marker gene expression and levels of chromatin-associated Xist for the samples
presented.
6.7 Abrogation of SPEN SPOC and Polycomb together abolishes Xist-
mediated silencing
As discussed in 5.10, a number of features suggest a direct role for Polycomb in mediat-
ing the residual silencing that remains after disruption of the SPEN SPOC domain. To
investigate this and determine if SPEN and Polycomb pathways together can account for
the entirety of gene silencing downstream of Xist in iXist-ChrX cells, I engineered the
SPEN SPOC mutation into the FKBP12F36V-PCGF3/5 background. Combined mutants
for both SPENSPOCmut and PCGF3/5 degradation were confirmed by PCR, chrRNA-
seq and Western blot for two clonal lines, F6 and F10 (Figure 6.8 A,B). By RNA-FISH
both clones show monoallelic Xist upregulation and typical cloud formation in untreated
210
cells (Figure 6.8 C), although it was necessary to subclone F6 (to F6G1) to eliminate a
population of XO cells before further experiments. Xist clouds are also visible in most
cells pre-treated with dTAG-13, however some cells seem to be defective in proper Xist
upregulation, whereas others demonstrate the contrasting phenotype of expanded RNA
territories which sometimes spread to cover the majority of the nucleus.
I then performed chrRNA-seq to assess gene silencing in combined mutant FKBP12F36V-
PCGF3/5+SPENSPOCmut cells, first after 24 hours of doxycyline induction in ES cells
and subsequently after 3 or 6 days of Xist induction under NPC differentiation conditions.
As shown in Figure 6.8 D, silencing in non dTAG-treated cells closely resembles that of
SPENSPOCmut clones in that there is a moderate amount of SPOC-independent silenc-
ing which increases with prolonged Xist expression. Strikingly, combined mutant lines
pre-treated with dTAG completely failed in Xist-mediated silencing throughout NPC dif-
ferentiation, substantiating the importance of Polycomb for SPOC-independent silencing.
Levels of chromatin-associated Xist in chrRNA-seq libraries were slightly variable between
clones but generally equivalent to SPENSPOCmut (Figure 6.8 E, cf. Figure 5.6 C).
Notably, rather than showing any customary silencing-mediated decrease, the allelic ra-
tios of dTAG-treated F10 samples induced for 3 or 6 days were above uninduced controls.
X chromosome elimination is a sporadic event that occurs in female mESC culture, and
unlike F6G1, F10 had not been subcloned immediately prior to plating cells out for the
NPC differentiation experiment. Therefore, this upward skew in allelic ratio can plausibly
be explained by strong selection against cells with two fully active X chromosomes, allow-
ing XO cells lacking the Castaneous chromosome to begin to take over the population.
This trend is exemplified in samples I collected after attempting to derive mature NPCs
from FKBP12F36V-PCGF3/5+SPENSPOCmut cells after 22 days of the differentiation pro-
tocol. Whereas untreated combined mutants bore a similar phenotype to SPENSPOCmut
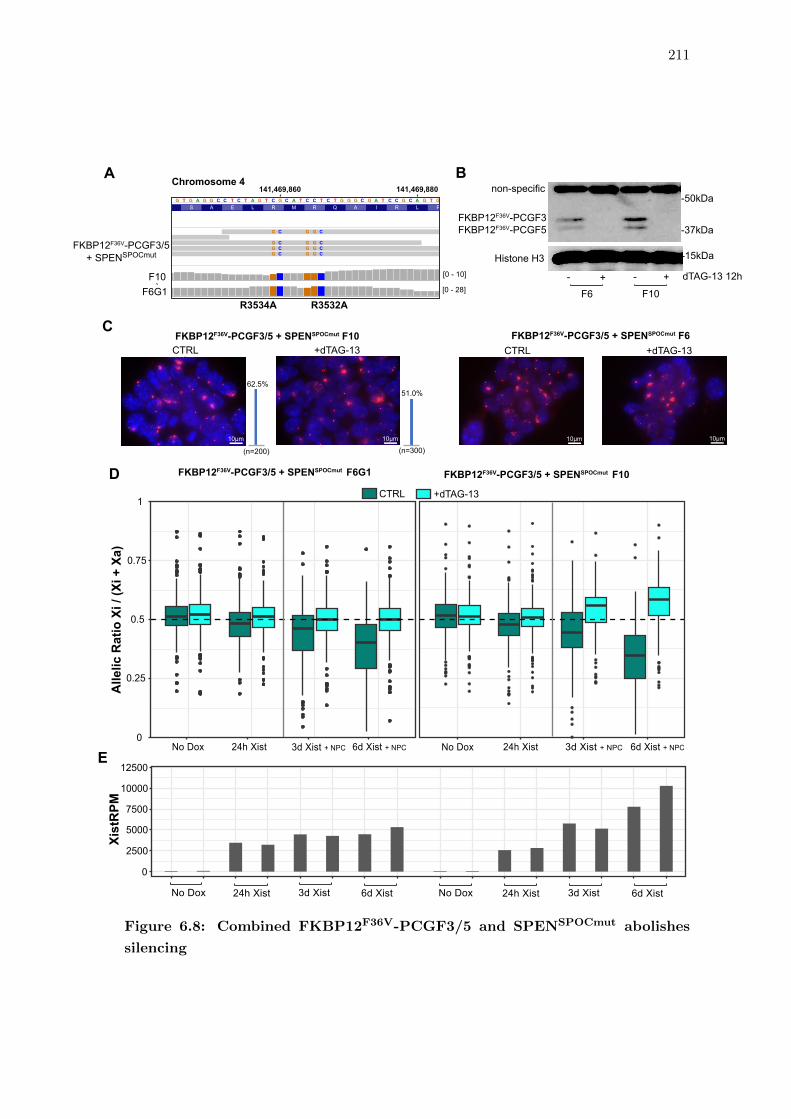
211
-50kDa
-37kDa
-15kDa
FKBP12F36V-PCGF3FKBP12F36V-PCGF5
Histone H3
F6
- -+ +
F10
dTAG-13 12h
non-specific
0
2500
5000
7500
10000
12500
Xist
RPM
No Dox 24h Xist 3d Xist 6d Xist No Dox 24h Xist 3d Xist 6d Xist
E
C T T C C A G C T G T G A G G C C T C T A G T C G C A T C C T C T G G G C G A T C C G C A G T G G G G G A C C A C C T T C A G A G A G A G G C A GE L Q S A E L R M R Q A I R L P P G G E S L P LE L Q S A E L R M R Q A I R L P P G G E S L P LE L Q S A E L R M R Q A I R L P P G G E S L P LE L Q S A E L R M R Q A I R L P P G G E S L P LE L Q S A E L R M R Q A I R L P P G G E S L P LE L Q S A E L R M R Q A I R L P P G G E S L P L
G C G G C
G C G G CG C G G CG C G G C
[0 - 28]
[0 - 10]
R3532AR3534A
Chromosome 4141,469,880141,469,860
D
0
0.25
0.5
0.75
1
Alle
licR
atio
Xi/ (
Xi+
Xa)
No Dox 24h Xist 3d Xist + NPC 6d Xist + NPC
FKBP12F36V-PCGF3/5 + SPENSPOCmut F6G1
CTRL +dTAG-13
No Dox 24h Xist 3d Xist + NPC 6d Xist + NPC
FKBP12F36V-PCGF3/5 + SPENSPOCmut F10
C
A B
(n=200) (n=300)
62.5%51.0%
FKBP12F36V-PCGF3/5 + SPENSPOCmut F10 FKBP12F36V-PCGF3/5 + SPENSPOCmut F6
10μm 10μm 10μm 10μm
FKBP12F36V-PCGF3/5+ SPENSPOCmut
F10`
CTRL`
+dTAG-13 CTRL`
+dTAG-13
F6G1
Figure 6.8: Combined FKBP12F36V-PCGF3/5 and SPENSPOCmut abolishes
silencing
212
Figure 6.8 (previous page): Combined FKBP12F36V-PCGF3/5 and
SPENSPOCmut abolishes silencing
A) Genome browser (IGV) screenshot of sequences of chrRNA-seq reads from
FKBP12F36V-PCGF3/5+SPENSPOCmut, demonstrating homozygous mutant clones F6G1
and F10 (also verified by Sanger sequencing of PCR products).
B) Western blot confirming FKBP12F36V-PCGF3/5 degradation upon dTAG-13 treatment
in combined mutant lines. Histone H3 acts as a nuclear loading control.
C) Xist RNA-FISH in combined FKBP12F36V-PCGF3/5+SPENSPOCmut clones after 24
hours of Xist induction in untreated cells and cells pre-treated with 12 hours of dTAG-13.
The percentage of F10 cells containing Xist domains is indicated alongside. F6 was later
subcloned to remove XO cells and so is not quantified.
D) Boxplots of chrRNA-seq allelic ratios in untreated and dTAG-13 pre-treated
FKBP12F36V-PCGF3/5+SPENSPOCmut clones for Xist induction time points of 0 and
24 hours in mESCs, and 3 and 6 days under NPC differentiation conditions.
E) Relative levels of marker gene expression and chromatin-associated Xist for the samples
above.
clones, both in terms of cell morphology and gene silencing, treated samples skewed in the
opposite direction presumably due to XO selection (Figure 6.9 A). As further evidence of
this, dTAG-treated FKBP12F36V-PCGF3/5+SPENSPOCmut samples anecdotally appeared
more morphologically similar to WT NPCs than other mutants, and this was also reflected
by increased Nestin expression (Figure 6.9 B).
The PCGF3/5-PRC1 complex functions globally in genome regulation and it is conceiv-
able that indirect effects contribute to the complete silencing deficit of combined mutant
lines. Therefore, to confirm this finding I also mutagenised the SPEN SPOC domain in
the Xist∆PID background to derive two Xist∆PID+SPENSPOCmut clones, A8 and G3 (Fig-
ure 6.10 A). Xist RNA-FISH characterisation upon induction in these lines confirmed Xist
cloud formation with a seemingly less severe RNA delocalisation phenotype than combined
SPOC mutation and PCGF3/5 loss (Figure 6.10 B), but also revealed tetraploid G3 cells
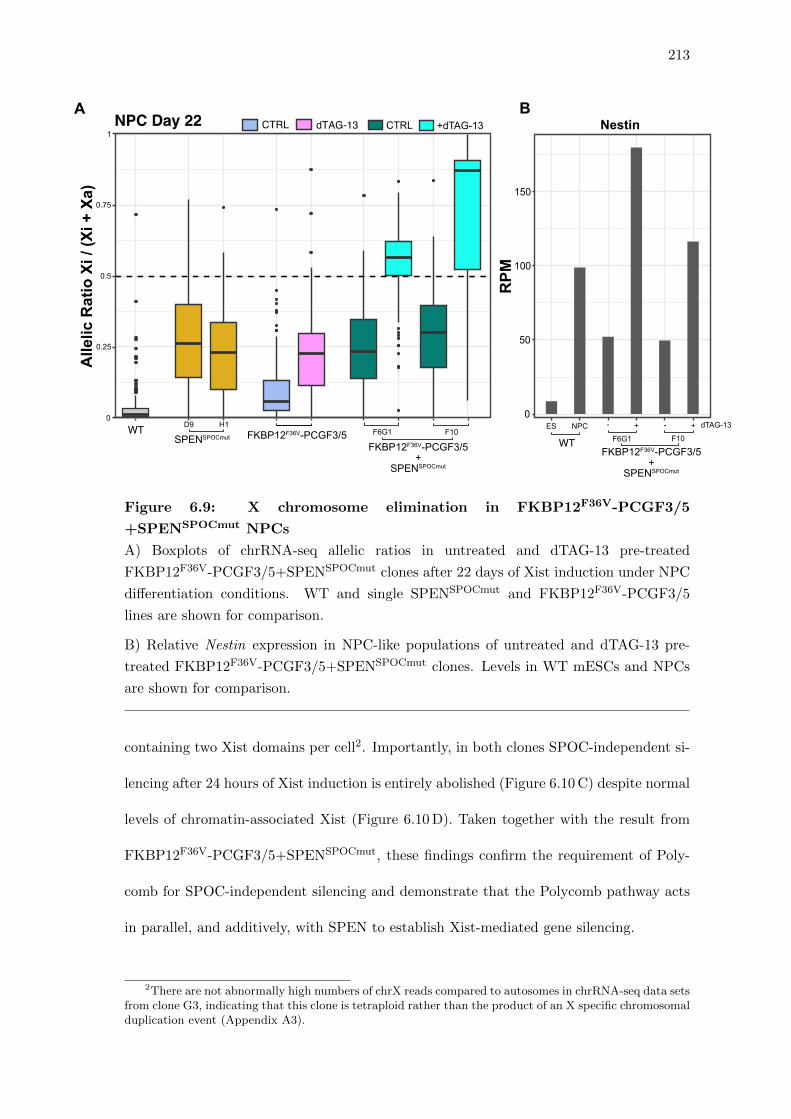
213
AllelicRatioXi/ (Xi+Xa)
0
0.25
0.5
0.75
1
WT
NPC Day 22 CTRL dTAG-13
FKBP12F36V-PCGF3/5
CTRL
F6G1D9 H1
F10ES NPC - + - + dTAG-13
+dTAG-13
SPENSPOCmut
FKBP12F36V-PCGF3/5+
SPENSPOCmut
WT
Nestin
RPM
A
0
50
100
150
F6G1 F10
FKBP12F36V-PCGF3/5+
SPENSPOCmut
B
Figure 6.9: X chromosome elimination in FKBP12F36V-PCGF3/5
+SPENSPOCmut NPCs
A) Boxplots of chrRNA-seq allelic ratios in untreated and dTAG-13 pre-treated
FKBP12F36V-PCGF3/5+SPENSPOCmut clones after 22 days of Xist induction under NPC
differentiation conditions. WT and single SPENSPOCmut and FKBP12F36V-PCGF3/5
lines are shown for comparison.
B) Relative Nestin expression in NPC-like populations of untreated and dTAG-13 pre-
treated FKBP12F36V-PCGF3/5+SPENSPOCmut clones. Levels in WT mESCs and NPCs
are shown for comparison.
containing two Xist domains per cell2. Importantly, in both clones SPOC-independent si-
lencing after 24 hours of Xist induction is entirely abolished (Figure 6.10 C) despite normal
levels of chromatin-associated Xist (Figure 6.10 D). Taken together with the result from
FKBP12F36V-PCGF3/5+SPENSPOCmut, these findings confirm the requirement of Poly-
comb for SPOC-independent silencing and demonstrate that the Polycomb pathway acts
in parallel, and additively, with SPEN to establish Xist-mediated gene silencing.
2There are not abnormally high numbers of chrX reads compared to autosomes in chrRNA-seq data setsfrom clone G3, indicating that this clone is tetraploid rather than the product of an X specific chromosomalduplication event (Appendix A3).
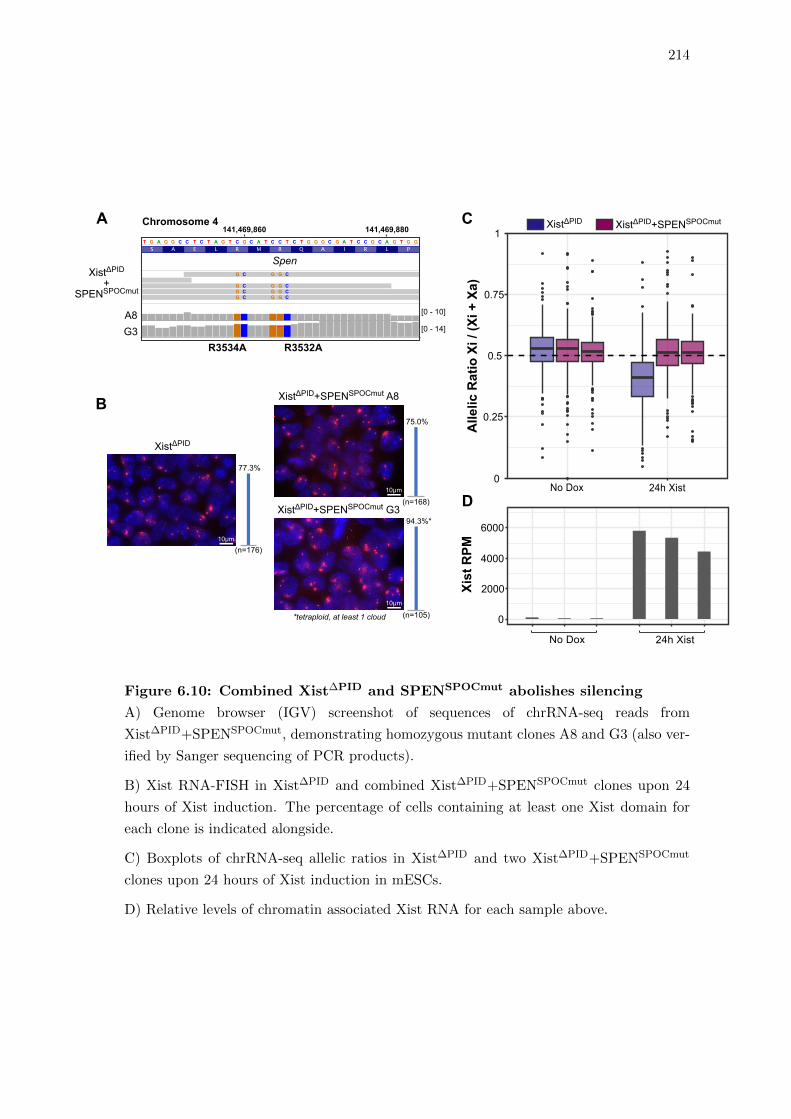
214
No Dox 24h Xist
0
2000
4000
6000
Xist
RPM
D0
0.25
0.5
0.75
1
Alle
licRatio
Xi/ (Xi
+Xa
)No Dox 24h Xist
C XistΔPID+SPENSPOCmutXistΔPID
XistΔPID+SPENSPOCmut A8
XistΔPID+SPENSPOCmut G3
*tetraploid, at least 1 cloud
XistΔPID
(n=176)
(n=168)
(n=105)
77.3%
75.0%
94.3%*
B
10μm
10μm
10μm
XistΔPID
+SPENSPOCmut
Chromosome 4AC T T C C A G C T G T G A G G C C T C T A G T C G C A T C C T C T G G G C G A T C C G C A G T G G G G G A C C A C C T T C A G A G A G A G G C A G
E L Q S A E L R M R Q A I R L P P G G E S L P LE L Q S A E L R M R Q A I R L P P G G E S L P LE L Q S A E L R M R Q A I R L P P G G E S L P LE L Q S A E L R M R Q A I R L P P G G E S L P LE L Q S A E L R M R Q A I R L P P G G E S L P LE L Q S A E L R M R Q A I R L P P G G E S L P L
G C G G C
G C G G CG C G G CG C G G C
R3532AR3534A
A8G3
[0 - 10]
[0 - 14]
Spen
141,469,880141,469,860
Figure 6.10: Combined Xist∆PID and SPENSPOCmut abolishes silencing
A) Genome browser (IGV) screenshot of sequences of chrRNA-seq reads from
Xist∆PID+SPENSPOCmut, demonstrating homozygous mutant clones A8 and G3 (also ver-
ified by Sanger sequencing of PCR products).
B) Xist RNA-FISH in Xist∆PID and combined Xist∆PID+SPENSPOCmut clones upon 24
hours of Xist induction. The percentage of cells containing at least one Xist domain for
each clone is indicated alongside.
C) Boxplots of chrRNA-seq allelic ratios in Xist∆PID and two Xist∆PID+SPENSPOCmut
clones upon 24 hours of Xist induction in mESCs.
D) Relative levels of chromatin associated Xist RNA for each sample above.
215
6.8 Discussion
The first experiments presented in this chapter revisit, and should resolve, a historical de-
bate surrounding the pathway of Polycomb recruitment by Xist RNA (reviewed in Brock-
dorff 2017; Almeida et al. 2020). Whereas it was initially proposed that the Xist A-repeat
directly recruits PRC2, this was comprehensively overturned in favour of a model in which
the B/C repeats of Xist, via hnRNPK, recruit PCGF3/5-PRC1 upstream of a cascade of
synergistic enrichment of all other Polycomb complexes (Almeida et al. 2017; Pintacuda
et al. 2017b). Here I present high-resolution allelic ChIP-seq analysis of the Xist∆PID line,
which contains a deletion in the Xist locus that spans the B-repeat and the majority of the
C-repeats. In this line, there is complete abolition of both H2AK119ub1 and H3K27me3
enrichment on Xi despite high levels of Xist with intact A-repeats, definitively discounting
the model of direct Polycomb recruitment by the A-repeat.
However, in a recent publication, Colognori et al. reported low-level H2AK119ub1 and
H3K27me3 ChIP-seq enrichment after deletion of the B-repeat region in an equivalent
model to iXist-ChrX (female mESCs with inducible Xist), which disappears in a combined
B- and A-repeat deletion line (Colognori et al. 2020). The authors subsequently infer
a function for the A-repeat in directly assisting initiation of the Polycomb recruitment
cascade, whereupon the B-repeat later has the primary role. Crucially, however, the C-
repeat region of Xist also contains hnRNPK binding motifs (Cirillo et al. 2016) and must be
deleted alongside the B-repeat for full abolition of Polycomb recruitment by Xist (Bousard
et al. 2019). The deletion in Colognori et al. (2020) leaves the C-repeats of Xist intact,
thus accounting for the low-level Polycomb enrichment that is not seen in the Xist∆PID
line presented here. Similarly, the complete lack of Polycomb enrichment in Xist∆A+B is
not indicative of A-repeat-mediated recruitment, but likely due to the severe impairment
of Xist localisation and stability caused by A-repeat deletion and consequential loss of
216
SPEN binding (see 5.2 and Ha et al. 2018).
Through derivation of a cell line for conditional degradation of PCGF3 and PCGF5, I also
confirm that the PCGF3/5-PRC1 complex is the central player in Polycomb enrichment by
Xist, lying upstream of the blanket deposition of both PRC1 and PRC2 modifications over
Xi. This result is significant in a wider context beyond the X inactivation field, as lncRNAs
other than Xist have been reported to directly recruit PRC2 to repress target genes, such
as Kcnq1ot1 which acts in cis at imprinted loci on chromosome 7 (Pandey et al. 2008),
and HOTAIR acting in trans to repress HOX cluster genes (Rinn et al. 2007). However,
it has now been shown that PRC2 is dispensable for HOTAIR to enact transcriptional
silencing (Portoso et al. 2017), and that Polycomb enrichment by Kncq1ot1 is ablated
by knockdown of hnRNPK (Schertzer et al. 2019), suggesting a similar PRC1-dependent
mechanism of recruitment as Xist. Taken alongside evidence that PRC2 subunits interact
promiscuously with nuclear RNAs (Davidovich et al. 2013; Beltran et al. 2016), this argues
that models based on direct recruitment of PRC2 to chromatin by specific lncRNAs may
need to be reevaluated with greater consideration of PRC1 (see Almeida et al. 2020).
It was however interesting to discover modest Xi-specific enrichment of H2AK119ub1
upon Xist induction in dTAG-treated FKBP12F36V-PCGF3/5 cells. This was not true for
H3K27me3 so does not support a PRC2-Xist interaction, but it does suggest that limited
PRC1 recruitment by Xist is possible independent of PCGF3/5-PRC1. As the molecular
basis behind the specificity of the interaction between PCGF3/5-PRC1 and hnRNPK is
not fully established, it is most conceivable that a different non-canonical PRC1 complex
such as PCGF1-PRC1 or PCGF6-PRC1 may be able to interact with hnRNPK by the
same mechanism, albeit to a lesser extent. Further structural and biochemical studies in
this area may be very revealing.
The moderate silencing defect incurred by PCGF3/5 degradation phenocopies Xist∆PID,
217
implying that there are not Polycomb-independent functions of the B/C-repeats relevant
for gene silencing. Collectively, these findings also argue that Polycomb enrichment is an
essential component of Xist function that acts in parallel alongside the predominant SPEN-
mediated pathway to fully establish gene silencing. A recent study published a conflicting
observation of minimal silencing deficiency upon Xist B+C-repeat deletion (Bousard et al.
2019). However, Bousard et al. used a model of XY mESCs, thus had to assay silencing by
differential gene expression between induced and uninduced samples, and furthermore had
to compare between WT and Xist∆B+C cell lines with variable proportions of cells induc-
ing Xist. By contrast, chrRNA-seq in iXist-ChrX-derived cells allows for allelic analysis
precisely comparing gene expression on the Xi versus the Xa. Additionally, XX cells can
be placed under prolonged Xist induction in differentiating conditions without the con-
founding effect of cell death associated with silencing of genes on a single X chromosome.
Accordingly, the study by Colognori et al., which also has these advantages, found an
intermediate silencing deficiency of Xist∆B that closely agrees with the results presented
here (Colognori et al. 2020).
The phenotype of larger, more diffuse Xist clouds seen by RNA-FISH upon PCGF3/5
degradation implicates a role for Polycomb in Xist RNA localisation to the inactive X
chromosome. This is not an isolated observation, as a study in MEFs by Colognori et al.
found Xist RNA to spread beyond the Xi territory upon B-repeat deletion or knockout of
either PRC1 or PRC2 (Colognori et al. 2019). To investigate this further in FKBP12F36V-
PCGF3/5 cells, Dr Heather Coker and Dr Lisa Rodermund prepared and imaged slides of
Xist RNA-FISH with super-resolution 3D-structured illumination microscopy (3D-SIM).
As illustrated by the representative images and quantification in Figure 6.11, dTAG-
treated cells show expanded Xist RNA territories both in terms of cloud volume and
molecule number. It would be interesting to test by a high-resolution sequencing-based
approach whether this phenotype also manifests as a different pattern of Xist’s association
218
LocalisedDAPIXist RNA FISH
Slightly dispersed Fully dispersed
0
600
800
1000
200500
0
1000
100
75
50
25
0
1500
2000
400
Xistm
oleculecoun
t
Cloud
volume(cub
icmicron)
*** *** ***
Localised Slightly dispersed Fully dispersed
FKBP12F36V-PCGF3/5 FKBP12F36V-PCGF3/5+ SPENSPOCmut
+- +-FKBP12F36V-PCGF3/5 FKBP12F36V-PCGF3/5
+ SPENSPOCmut
+- +-
Xistterritoriesscored
(%)
FKBP12F36V-PCGF3/5 FKBP12F36V-PCGF3/5+ SPENSPOCmut
+- +-36h dTAG-13:
5μm 5μm 5μm
Figure 6.11: PCGF3/5 degradation causes Xist RNA dispersal by super-
resolution RNA-FISH (Data courtesy of Dr Lisa Rodermund)
Upper left panels quantify expansion of Xist RNA territories upon degradation
of PCGF3/5 by dTAG-13 treatment in FKBP12F36V-PCGF3/5 and FKBP12F36V-
PCGF3/5+SPENSPOCmut lines. Molecule counts and Xist cloud volumes were generated
by analysis pipelines described in (Rodermund et al. 2020).
Lower panels show example 3D-SIM images of Xist clouds classified by eye as ‘localised’,
‘slightly dispersed’ or ‘fully dispersed’, which are quantified for each sample in the upper
right panel.
with Xi chromatin. In Chapter 5, I was able to show through the proxy of Xi-specific
H2AK119ub1 that Xist targeting to correct chromatin regions is strongly disrupted in
SPEN–/∆RRM but mostly normal in SPENSPOCmut, however testing this for FKBP12F36V-
PCGF3/5 line would require a different biochemical assay for Xist distribution as using
H2AK119ub1 as a proxy is not possible. In Xist∆B MEFs, Colognori et al. used the
CHART-seq method to demonstrate decreased Xist association with the chromosome ends
219
of Xi (Colognori et al. 2019), and the fact that genes most affected by PCGF3/5 loss are
further from Xist (Figure 6.6 G) suggests this ‘spreading’ defect is also likely to be the
case for de novo Xist induction in FKBP12F36V-PCGF3/5.
Unlike with the SPEN pathway, it may be impossible to fully disentangle the role of Poly-
comb in Xist RNA localisation from direct effects of Polycomb on gene repression. Of
the many mechanisms that contribute to the synergistic enrichment of all non-canonical
PRC1, canonical PRC1 and PRC2 complexes over Xi (see 1.1.4, Almeida et al. 2017),
most involve recognition of the histone modifications H2AK119ub1 and H3K27me3 that
may also be necessary for gene repression (Lavarone et al. 2019; Blackledge et al. 2020).
Likewise, because of these positive feedback loops, the strong expectation is that disrup-
tion of PRC2, which binds to H2AK119ub1 via JARID2 (Cooper et al. 2016; Kasinath
et al. 2021), or the H2AK119ub1-binding components of non-canonical PRC1 components
RYBP/YAF2 (Tavares et al. 2012; Almeida et al. 2017), would cause quantitative reduc-
tions in Polycomb enrichment and gene silencing deficiencies, but to a lesser extent than
the mutants described here or full PRC1 knockout. Nonetheless, these further experi-
ments may indicate that a particular Polycomb complex is more relevant than others for
Xist localisation or resolve an open question about how important PRC2/H3K27me3 is
for gene repression. In a previous experiment, we found that Suz12 knockout iXist-Chr3
cells, which completely lack H3K27me3, can perform Xist-dependent H2AK119ub1 enrich-
ment to a similar extent as WT cells and demonstrate only a minor silencing defect after
3 days of Xist induction (Nesterova et al. 2019). It would be interesting to test this in
iXist-ChrX cells that carry endogenously-located Xist and thus can be assayed into later
stages of XCI establishment and maintenance, whereupon PRC2/H3K27me3 may have a
stronger contribution.
Although it is unclear how much of the early silencing defect in Xist∆PID and FKBP12F36V-
220
PCGF3/5 lines is caused by mislocalised Xist, these results undeniably show that silencing
cannot reach completion in the absence of the Polycomb pathway, thus strongly support-
ing a role for Polycomb repression in XCI beyond Xist localisation. This could be due to a
direct requirement for Polycomb modifications to be acquired over genes and assist silenc-
ing through mechanisms such as chromatin remodeling (Grau et al. 2011), direct/indirect
antagonism of pro-transcriptional machinery (Stock et al. 2007; Zhou et al. 2008; Lehmann
et al. 2012), or epigenetic memory over cell divisions (Steffen and Ringrose 2014; Moussa
et al. 2019; Zhao et al. 2020) (Figure 6.12 A). Alternatively, it has been shown that the
Polycomb pathway, specifically Xist-dependent H2AK119ub1, is necessary for recruitment
of SMCHD1 to Xi at a later stage of silencing progression under differentiating condi-
tions3 (Jansz et al. 2018b). SMCHD1 is required for proper formation of the unique
megadomain architecture of a fully-inactivated X chromosome and the maintenance of
repression for a subset on genes (Wang et al. 2018a; Gdula et al. 2019). As this sub-
set of SMCHD1-dependent genes broadly corresponds with those that fail to silence in
dTAG-treated FKBP12F36V-PCGF3/5 NPCs (Figure 6.12 B), this is another potential
mechanism that could account for the requirement of Polycomb for complete XCI. A final
possibility is that PCGF3/5 loss may indirectly antagonise silencing completion through
the failure of proper NPC differentiation. The mechanisms underlying the interplay be-
tween differentiation and complete silencing are unknown, but if they are independent of
Xist-specific Polycomb recruitment then Xist∆PID would be expected to silence further in
the NPC protocol than dTAG-treated FKBP12F36V-PCGF3/5. This will be important to
test.
The final notable result presented in this chapter is that combined disruption of both the
Polycomb pathway (via either Xist PID deletion or PCGF3/5 degradation) and the SPEN
SPOC domain completely abolishes gene silencing downstream of Xist RNA. Similar to
3SMCHD1 is recruited to Xi approximately 3-5 days after initial Xist induction in iXist-ChrX cellsunder NPC differentiation conditions (Dr Tatyana Nesterova, personal communication)
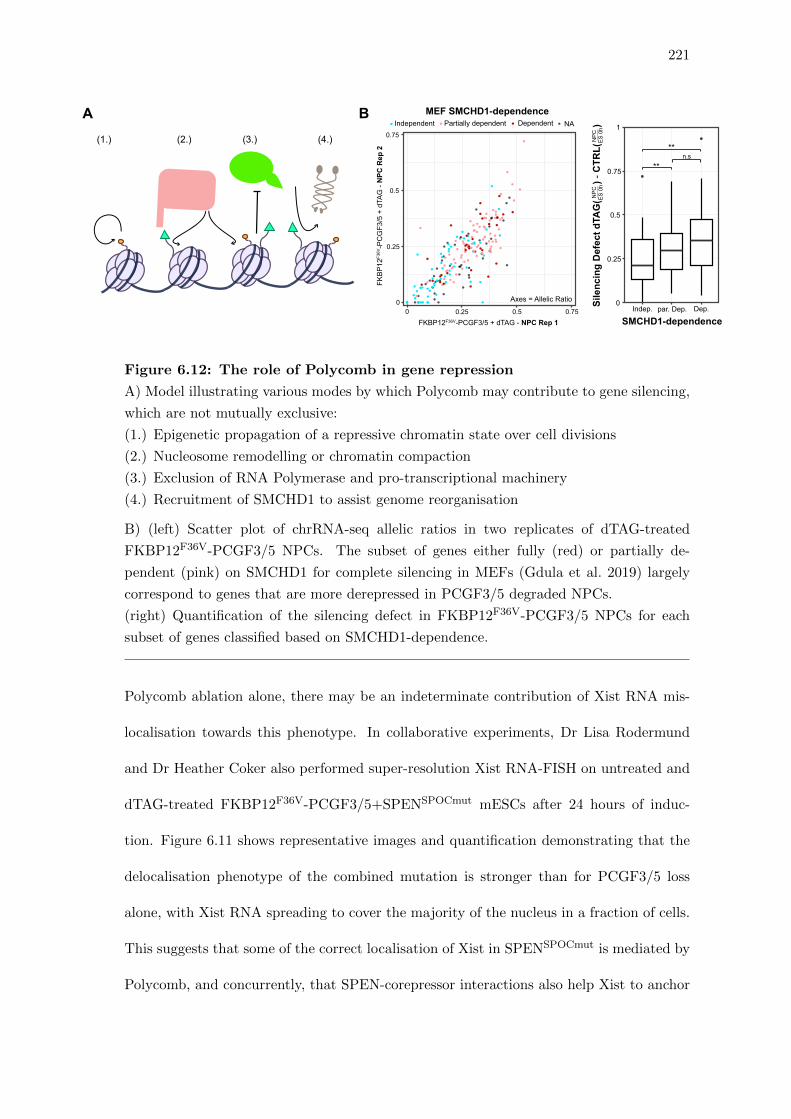
221
00
0.5
0.5
0.75
0.75
0.25
0.25
0
0.5
1
SMCHD1-dependence
MEF SMCHD1-dependence
(1.) (2.) (3.) (4.)
Independent Partially dependent Dependent NA
0.25
Dep.Indep. par. Dep.
**
**n.s
0.75
SilencingDefectdTAG(
)-CTRL(
)ES0h
NPC
ES0h
NPC
FKBP12F36V-PCGF3/5 + dTAG - NPC Rep 1
Axes = Allelic Ratio
FKBP12
F36V-PCGF3/5+dTAG-NPC
Rep2
A B
Figure 6.12: The role of Polycomb in gene repression
A) Model illustrating various modes by which Polycomb may contribute to gene silencing,
which are not mutually exclusive:
(1.) Epigenetic propagation of a repressive chromatin state over cell divisions
(2.) Nucleosome remodelling or chromatin compaction
(3.) Exclusion of RNA Polymerase and pro-transcriptional machinery
(4.) Recruitment of SMCHD1 to assist genome reorganisation
B) (left) Scatter plot of chrRNA-seq allelic ratios in two replicates of dTAG-treated
FKBP12F36V-PCGF3/5 NPCs. The subset of genes either fully (red) or partially de-
pendent (pink) on SMCHD1 for complete silencing in MEFs (Gdula et al. 2019) largely
correspond to genes that are more derepressed in PCGF3/5 degraded NPCs.
(right) Quantification of the silencing defect in FKBP12F36V-PCGF3/5 NPCs for each
subset of genes classified based on SMCHD1-dependence.
Polycomb ablation alone, there may be an indeterminate contribution of Xist RNA mis-
localisation towards this phenotype. In collaborative experiments, Dr Lisa Rodermund
and Dr Heather Coker also performed super-resolution Xist RNA-FISH on untreated and
dTAG-treated FKBP12F36V-PCGF3/5+SPENSPOCmut mESCs after 24 hours of induc-
tion. Figure 6.11 shows representative images and quantification demonstrating that the
delocalisation phenotype of the combined mutation is stronger than for PCGF3/5 loss
alone, with Xist RNA spreading to cover the majority of the nucleus in a fraction of cells.
This suggests that some of the correct localisation of Xist in SPENSPOCmut is mediated by
Polycomb, and concurrently, that SPEN-corepressor interactions also help Xist to anchor
222
to Xi chromatin in the absence of Polycomb enrichment. On the other hand, Xist domain
formation appears relatively normal in a fraction of combined mutant cells4, and despite
this there is a complete lack of detectable SPOC-independent silencing. This is further ev-
idence strongly arguing for a direct role for the Polycomb system in mediating the residual
silencing in SPENSPOCmut, and additionally suggests that there are no other independent
molecular pathways downstream of Xist able to perform silencing in the absence of both
SPOC and Polycomb.
4As a further avenue of investigation, there may be an interesting biological basis for this variability.For example it may be related to the cell cycle given the relative proportions of cells with each phenotype.
Chapter 7
Conclusions and discussion
7.1 SPEN and PCGF3/5-PRC1 pathways function in parallel to estab-
lish gene silencing in X inactivation
This thesis presents an extensive experimental investigation of iXist-ChrX, a cellular model
that recapitulates the establishment of XCI during early mammalian development. In
Chapter 3, I document a broad genomic characterisation of the epigenetic changes that
occur over a time course of Xist induction in mESCs. Crucially, by using allele-specific
NGS analysis pipelines, I was able to directly compare dynamic changes to the chromatin
of the elective Xi quantitatively and at high resolution. Two of the earliest hallmarks of
XCI are histone deacetylation, predominantly at active CREs and gene bodies, and blanket
H2AK119ub1 deposition over large chromosomal regions of greater Xist RNA enrichment.
In subsequent experiments discussed in Chapter 5 and Chapter 6, I specifically ablated
both of these processes by CRISPR-Cas9 genome editing of molecular silencing pathways
acting downstream of Xist. Mutation to the SPEN SPOC domain prevents Xist from
performing histone deacetylation but does not dramatically alter Polycomb deposition,
whereas PCGF3/5 degradation or Xist∆PID impedes Xist-dependent Polycomb recruit-
ment to Xi but leaves SPEN function intact. Notably, disruption of the two pathways
individually causes substantial gene silencing defects, whereas removing both in combina-
tion leads to complete abolition of Xist-mediated silencing. From this it can be inferred
that these pathways act in parallel during the establishment of XCI, and that both are
223
224
vital to full Xist functioning. Furthermore, considering that colleagues in the Brockdorff
lab did not detect silencing defects after knockout of other candidate Xist-interacting fac-
tors in iXist-ChrX (Nesterova et al. 2019), these findings also argue that Polycomb and
SPEN principally account for all initial gene silencing during XCI establishment, with con-
tributions from other pathways only acting downstream or affecting other aspects of Xist
RNA behaviour. Although this remains to be rigorously proven, recent methodological
advances, for example in combinatorial CRISPR-Cas9 screening (Shen et al. 2017; Najm
et al. 2018), have made the comprehensive analysis of Xist silencing pathways and genetic
interactions between them an attainable goal.
7.2 Silencing pathways contribute towards correct Xist localisation
Another important finding presented in Chapters 5 and 6 is that both SPEN and Poly-
comb pathways have supporting roles in ensuring correct localisation of Xist RNA to Xi,
complicating the prevailing dogma that mechanisms of Xist localisation and downstream
silencing are genetically separable (Wutz et al. 2002; Cerase et al. 2015; Wutz and Monfort
2020). In particular, SPEN binding to the A-repeat seems to be necessary to bring Xist
to the chromatin of active genes (see 5.3). It is possible that Polycomb could function
in an equivalent way to specifically target Xist to lowly-expressed genes pre-marked by
Polycomb modifications, which have been shown to be more affected by deletion of the
Xist B/C-repeat (Barros De Andrade e Sousa et al. 2019; Nesterova et al. 2019). In-
deed, bilateral RNA-Polycomb nucleation at CpG islands has been proposed for Xist and
imprinted lncRNAs Airn and Kcnq1ot1 in trophoblast stem cells (Schertzer et al. 2019).
However, unlike other PcG variants, the PCGF3/5-PRC1 complex directly recruited by
Xist RNA is not typically enriched at classical Polycomb domains (Fursova et al. 2019),
and Xist-mediated Polycomb modification deposition occurs as a ‘blanket’ over Xi rather
than being concentrated at CpG islands (see 3.8). Therefore, instead of targeting Xist to
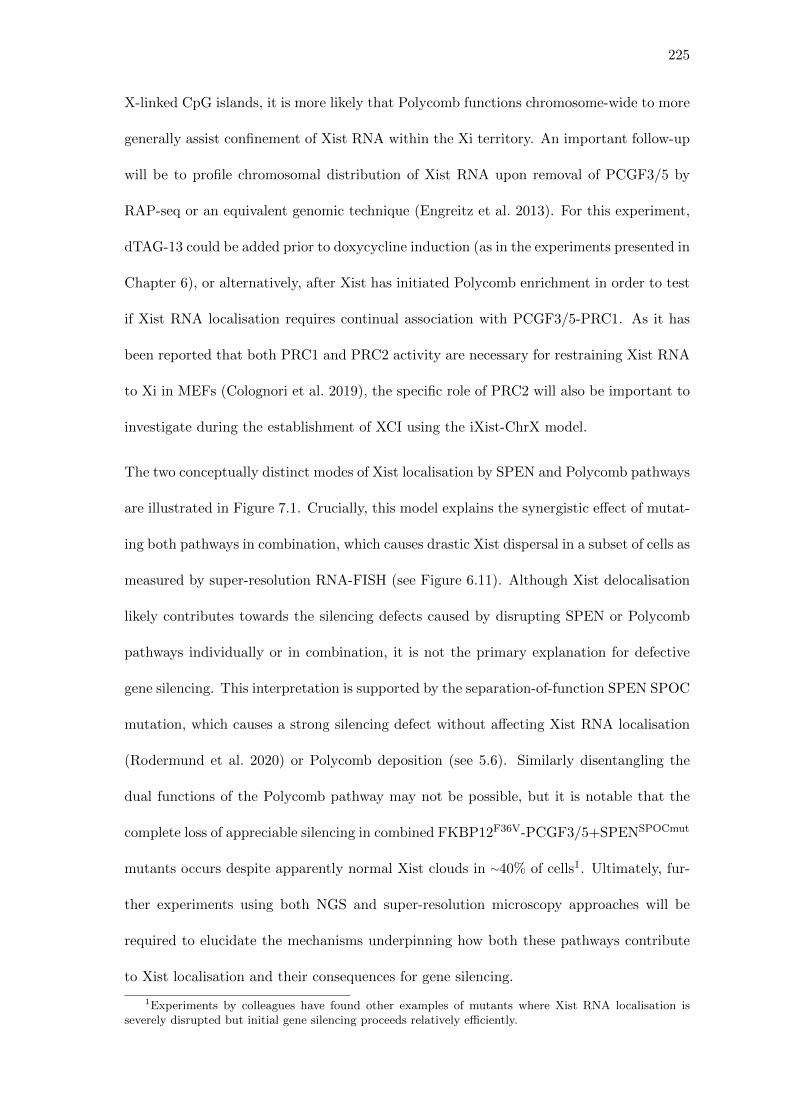
225
X-linked CpG islands, it is more likely that Polycomb functions chromosome-wide to more
generally assist confinement of Xist RNA within the Xi territory. An important follow-up
will be to profile chromosomal distribution of Xist RNA upon removal of PCGF3/5 by
RAP-seq or an equivalent genomic technique (Engreitz et al. 2013). For this experiment,
dTAG-13 could be added prior to doxycycline induction (as in the experiments presented in
Chapter 6), or alternatively, after Xist has initiated Polycomb enrichment in order to test
if Xist RNA localisation requires continual association with PCGF3/5-PRC1. As it has
been reported that both PRC1 and PRC2 activity are necessary for restraining Xist RNA
to Xi in MEFs (Colognori et al. 2019), the specific role of PRC2 will also be important to
investigate during the establishment of XCI using the iXist-ChrX model.
The two conceptually distinct modes of Xist localisation by SPEN and Polycomb pathways
are illustrated in Figure 7.1. Crucially, this model explains the synergistic effect of mutat-
ing both pathways in combination, which causes drastic Xist dispersal in a subset of cells as
measured by super-resolution RNA-FISH (see Figure 6.11). Although Xist delocalisation
likely contributes towards the silencing defects caused by disrupting SPEN or Polycomb
pathways individually or in combination, it is not the primary explanation for defective
gene silencing. This interpretation is supported by the separation-of-function SPEN SPOC
mutation, which causes a strong silencing defect without affecting Xist RNA localisation
(Rodermund et al. 2020) or Polycomb deposition (see 5.6). Similarly disentangling the
dual functions of the Polycomb pathway may not be possible, but it is notable that the
complete loss of appreciable silencing in combined FKBP12F36V-PCGF3/5+SPENSPOCmut
mutants occurs despite apparently normal Xist clouds in ∼40% of cells1. Ultimately, fur-
ther experiments using both NGS and super-resolution microscopy approaches will be
required to elucidate the mechanisms underpinning how both these pathways contribute
to Xist localisation and their consequences for gene silencing.
1Experiments by colleagues have found other examples of mutants where Xist RNA localisation isseverely disrupted but initial gene silencing proceeds relatively efficiently.
226
Xi
H2AK119ub1SPEN HNRNPK-PCGF3/5-PRC1Corepressor (eg. NCOR/SMRT)Xist H3K27me3X-linked gene
Xi
Xi
Xi
SPEN–/ΔRRM
FKBP12F36V-PCGF3/5 FKBP12F36V-PCGF3/5 + SPENSPOCmut
WT
Figure 7.1: Model of how SPEN and Polycomb pathways contribute to Xist
RNA localisation
SPEN binding to the A-repeat assists targeting of Xist RNA to genic regions independently
of SPOC-mediated corepressor function, whereas the Polycomb system has a chromosome-
wide function in restraining Xist RNA within the Xi territory. This model explains the
additive effects of combined SPEN and Polycomb disruption. Notably, it does not preclude
other molecular pathways acting in parallel from contributing towards Xist localisation
during the establishment stages of XCI.
7.3 Mechanisms of silencing downstream of Xist
Excepting this potential contribution from Xist mislocalisation, loss of gene silencing in
double mutants is a result of combinatorial disruption of chromatin-modifying complexes
that act downstream of Xist. I demonstrate in Chapter 5 that SPEN-Xist mediates the
majority of gene silencing, in part through deacetylation of active euchromatic regions by
227
HDAC3, the catalytic component of the NCOR/SMRT repressor complex (5.8). However,
degradation of HDAC3 does not fully recapitulate the silencing defect of SPENSPOCmut,
so an important aim of future work will be to define other mechanisms acting downstream
of the SPEN SPOC domain (see 5.10). Collectively the results presented in Chapters 5
and 6 also provide compelling evidence that the Polycomb system has a direct contri-
bution to silencing alongside the SPEN pathway, and can independently account for the
SPOC-independent silencing that occurs at a subset of genes in SPENSPOCmut (cf. 5.5,
6.7). Dissecting the mechanistic contributions from PRC1 and PRC2 complexes and their
respective histone modifications is not straightforward on account of the interwoven layers
of feedback involved in the Polycomb system (see 6.8). However, recent studies that have
used conditional catalytic RING1B mutants to show that PRC1-deposited H2AK119ub1
is essential for transcriptional repression genome-wide (Tamburri et al. 2020; Blackledge
et al. 2020) provide one potential strategy for further experiments.
A model summarising the mechanisms of chromatin modification by both the SPEN and
Polycomb pathways downstream of Xist is presented in Figure 7.2. Whereas some preferen-
tial effects are apparent, notably in the subset of genes that are almost entirely dependent
on SPOC for gene silencing (see 5.5), the general trend is that all X-linked genes are af-
fected by disruption of either pathway (see 5.8, 6.6). Importantly, this suggests that for
the establishment of Xist-mediated silencing there is not a clear division of labour between
SPEN and Polycomb silencing acting at different subsets of genes, and that most genes
require the cooperative effects of both pathways in order to fully silence.
Recently, several groups have put forwards models of XCI which invoke sub-nuclear com-
partmentalisation by Xist-interacting factors self-associating via intrinsically disordered
domains (Cerase et al. 2019; Pandya-Jones et al. 2020; Strehle and Guttman 2020). These
phase-separated condensates have been proposed either to form around either individual
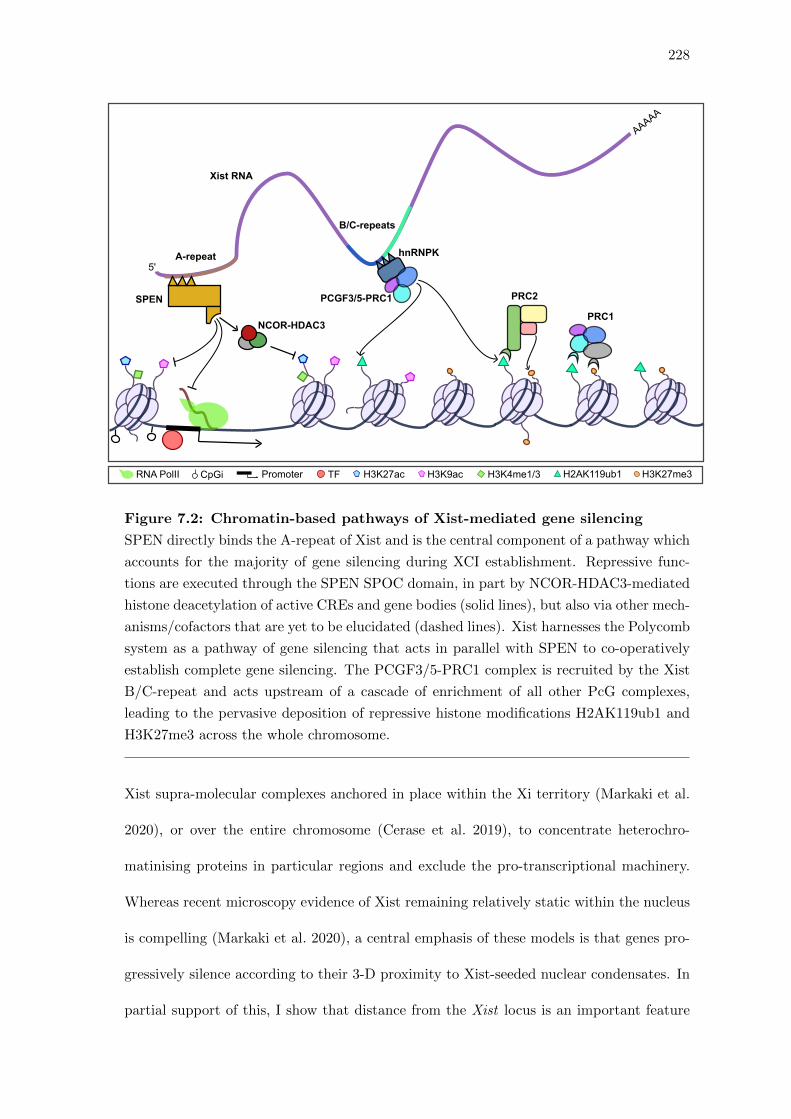
228
PCGF3/5-PRC1 PRC2
PRC1
hnRNPK
SPEN
A-repeat
B/C-repeats
Xist RNA
NCOR-HDAC3
AAAAA
5'
RNA PolII Promoter H3K27ac H2AK119ub1 H3K27me3H3K9ac H3K4me1/3CpGi TF
Figure 7.2: Chromatin-based pathways of Xist-mediated gene silencing
SPEN directly binds the A-repeat of Xist and is the central component of a pathway which
accounts for the majority of gene silencing during XCI establishment. Repressive func-
tions are executed through the SPEN SPOC domain, in part by NCOR-HDAC3-mediated
histone deacetylation of active CREs and gene bodies (solid lines), but also via other mech-
anisms/cofactors that are yet to be elucidated (dashed lines). Xist harnesses the Polycomb
system as a pathway of gene silencing that acts in parallel with SPEN to co-operatively
establish complete gene silencing. The PCGF3/5-PRC1 complex is recruited by the Xist
B/C-repeat and acts upstream of a cascade of enrichment of all other PcG complexes,
leading to the pervasive deposition of repressive histone modifications H2AK119ub1 and
H3K27me3 across the whole chromosome.
Xist supra-molecular complexes anchored in place within the Xi territory (Markaki et al.
2020), or over the entire chromosome (Cerase et al. 2019), to concentrate heterochro-
matinising proteins in particular regions and exclude the pro-transcriptional machinery.
Whereas recent microscopy evidence of Xist remaining relatively static within the nucleus
is compelling (Markaki et al. 2020), a central emphasis of these models is that genes pro-
gressively silence according to their 3-D proximity to Xist-seeded nuclear condensates. In
partial support of this, I show that distance from the Xist locus is an important feature
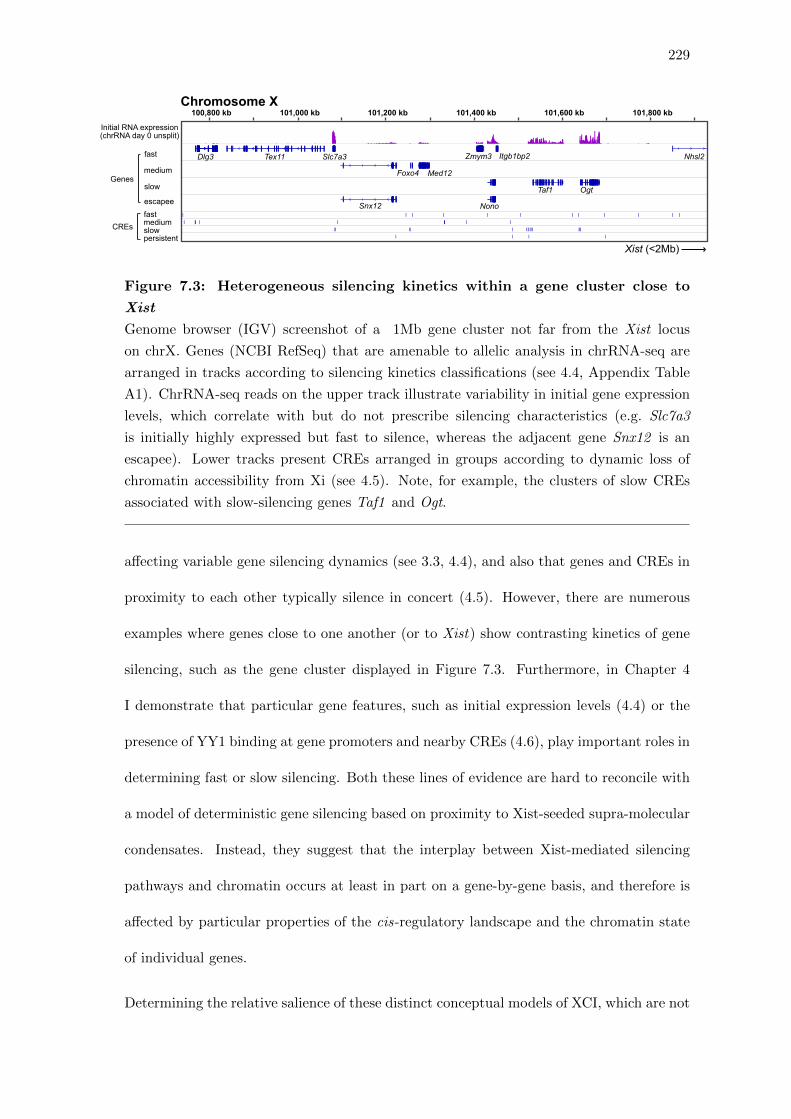
229
Dlg3 Tex11 Slc7a3 Zmym3 Nhsl2
Foxo4 Med12
Itgb1bp2
Taf1 Ogt
Snx12 Nono
100,800 kb 101,000 kb 101,200 kb 101,400 kb 101,600 kb 101,800 kbChromosome X
Xist (<2Mb)
CREsfastmediumslowpersistent
Genes
Initial RNA expression(chrRNA day 0 unsplit)
fast
medium
slow
escapee
Figure 7.3: Heterogeneous silencing kinetics within a gene cluster close to
Xist
Genome browser (IGV) screenshot of a 1Mb gene cluster not far from the Xist locus
on chrX. Genes (NCBI RefSeq) that are amenable to allelic analysis in chrRNA-seq are
arranged in tracks according to silencing kinetics classifications (see 4.4, Appendix Table
A1). ChrRNA-seq reads on the upper track illustrate variability in initial gene expression
levels, which correlate with but do not prescribe silencing characteristics (e.g. Slc7a3
is initially highly expressed but fast to silence, whereas the adjacent gene Snx12 is an
escapee). Lower tracks present CREs arranged in groups according to dynamic loss of
chromatin accessibility from Xi (see 4.5). Note, for example, the clusters of slow CREs
associated with slow-silencing genes Taf1 and Ogt.
affecting variable gene silencing dynamics (see 3.3, 4.4), and also that genes and CREs in
proximity to each other typically silence in concert (4.5). However, there are numerous
examples where genes close to one another (or to Xist) show contrasting kinetics of gene
silencing, such as the gene cluster displayed in Figure 7.3. Furthermore, in Chapter 4
I demonstrate that particular gene features, such as initial expression levels (4.4) or the
presence of YY1 binding at gene promoters and nearby CREs (4.6), play important roles in
determining fast or slow silencing. Both these lines of evidence are hard to reconcile with
a model of deterministic gene silencing based on proximity to Xist-seeded supra-molecular
condensates. Instead, they suggest that the interplay between Xist-mediated silencing
pathways and chromatin occurs at least in part on a gene-by-gene basis, and therefore is
affected by particular properties of the cis-regulatory landscape and the chromatin state
of individual genes.
Determining the relative salience of these distinct conceptual models of XCI, which are not
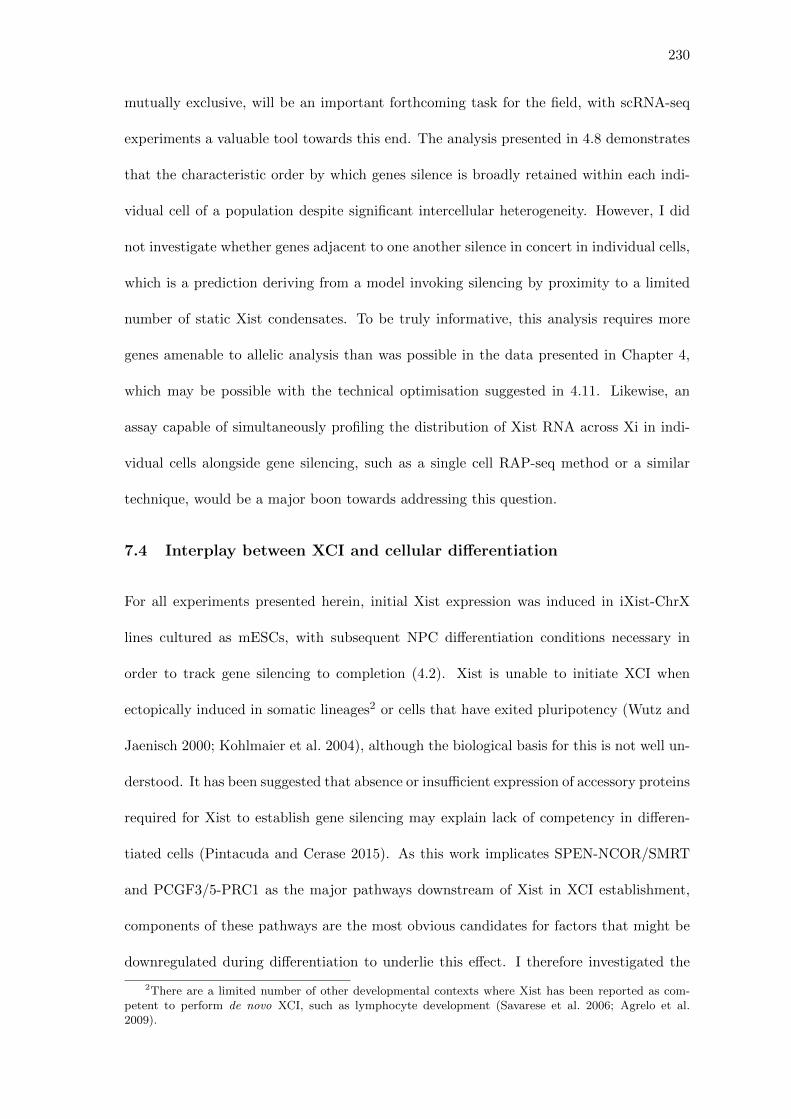
230
mutually exclusive, will be an important forthcoming task for the field, with scRNA-seq
experiments a valuable tool towards this end. The analysis presented in 4.8 demonstrates
that the characteristic order by which genes silence is broadly retained within each indi-
vidual cell of a population despite significant intercellular heterogeneity. However, I did
not investigate whether genes adjacent to one another silence in concert in individual cells,
which is a prediction deriving from a model invoking silencing by proximity to a limited
number of static Xist condensates. To be truly informative, this analysis requires more
genes amenable to allelic analysis than was possible in the data presented in Chapter 4,
which may be possible with the technical optimisation suggested in 4.11. Likewise, an
assay capable of simultaneously profiling the distribution of Xist RNA across Xi in indi-
vidual cells alongside gene silencing, such as a single cell RAP-seq method or a similar
technique, would be a major boon towards addressing this question.
7.4 Interplay between XCI and cellular differentiation
For all experiments presented herein, initial Xist expression was induced in iXist-ChrX
lines cultured as mESCs, with subsequent NPC differentiation conditions necessary in
order to track gene silencing to completion (4.2). Xist is unable to initiate XCI when
ectopically induced in somatic lineages2 or cells that have exited pluripotency (Wutz and
Jaenisch 2000; Kohlmaier et al. 2004), although the biological basis for this is not well un-
derstood. It has been suggested that absence or insufficient expression of accessory proteins
required for Xist to establish gene silencing may explain lack of competency in differen-
tiated cells (Pintacuda and Cerase 2015). As this work implicates SPEN-NCOR/SMRT
and PCGF3/5-PRC1 as the major pathways downstream of Xist in XCI establishment,
components of these pathways are the most obvious candidates for factors that might be
downregulated during differentiation to underlie this effect. I therefore investigated the
2There are a limited number of other developmental contexts where Xist has been reported as com-petent to perform de novo XCI, such as lymphocyte development (Savarese et al. 2006; Agrelo et al.2009).
231
Rnf2 Rybp
Pcgf3 Pcgf5
0d 2d 3d 6d NPC 0d 2d 3d 6d NPC
0
10
20
30
40
50
0
100
200
300
400
0
25
50
75
100
0
30
60
90
120Ncor2
Spen
Hdac3
Ncor1
0d 2d 3d 6d NPC 0d 2d 3d 6d NPC
0
300
600
900
0
50
100
150
0
10
20
30
0
30
60
90
RelativechrRNAexpression
(RPM
)SPEN pathway genes PCGF3/5-PRC1 pathway genes
Figure 7.4: Expression levels of SPEN and PCGF3/5-PRC1 genes over ES-to-
NPC differentiation
ChrRNA-seq data showing the relative RNA expression levels of components of SPEN
(left) and PCGF3/5-PRC1 (right) pathways over the time course of NPC differentiation
in WT iXist-ChrX cells as described in 4.2. Although chrRNA-seq cannot reveal post-
transcriptional or post-translational (e.g. RNA or protein stability) levels of regulation,
these genes are clearly not transcriptionally downregulated to the same extent as other
pluripotency markers (cf. Figure 4.2 D, Figure 4.12 E). Note that Rnf2, which encodes
RING1B, predominates in expression over Ring1 (encoding RING1A) in mESCs, although
the two homologues have partially compensatory functions.
expression levels of many potential candidates within chrRNA-seq data sets collected over
the ES to NPC differentiation protocol (4.2). As shown in Figure 7.4, whereas some com-
ponents, such as Spen and Rybp, are indeed downregulated as cells differentiate towards
NPCs, none are transcriptionally silenced to a degree compatible with loss of silencing
pathway function3. Therefore, either downregulation occurs on a post-transcriptional or
post-translational level, or there is an alternative explanation for why Xist is incompetent
for silencing in differentiated cells which remains to be elucidated.
3Levels of Spen expression are significantly lower in FKBP12F36V-HDAC3 lines than NPCs of theparental iXist-ChrX line, with little consequence for Xist-mediated silencing in cells not treated withdTAG-13. Similarly, the Rybp-homolog Yaf2 is upregulated coincident with declining Rybp expression(Figure 4.12 E), with YAF2 reportedly able to functionally compensate for RYBP in PRC1 complexes.
232
Another familiar concept in the field is that there is a transition over the course of XCI
from an ‘initiation’ phase to a ‘maintenance’ phase, after which genes on Xi are stably
repressed independent of Xist (Csankovszki et al. 1999b; Wutz and Jaenisch 2000). Com-
pletion of Xist-mediated silencing also appears to be coupled with cellular differentiation,
as work by colleagues in the Brockdorff lab has shown long-term Xist induction in undif-
ferentiated mESCs fails to fully silence a subset of X-linked genes (Dr Tatayana Nesterova,
personal communication). Two events that only occur late in XCI are the formation of the
unique chromosomal conformation of the Xi and de novo methylation of X-linked CpG
island promoters (1.3.6). These processes, mediated by SMCHD1 (Wang et al. 2018a;
Gdula et al. 2019; Jansz et al. 2018a) and DNMT3B (Gendrel et al. 2012) respectively,
have an important role in ensuring stable silencing of a subset of X-linked genes that are
particularly slow to silence by initial pathways of XCI (Figure 7.5 A), and both also require
differentiating conditions to be recruited to Xi (Dr Tatyana Nesterova, personal communi-
cation). In Chapter 4 I present evidence that binding of the transcription factor YY1 is a
feature of late-silencing and escapee genes (4.6), and later speculate a mechanism for how
it may antagonise Xist-mediated silencing at target genes by anchoring pro-transcriptional
promoter-enhancer interactions (see 4.11). The fact that SMCHD1 has been implicated
as opposing a DNA-binding factor with similar properties (CTCF) in XCI (Gdula et al.
2019), and that YY1 binding at target motifs in DNA is highly methylation sensitive (Kim
et al. 2003; Makhlouf et al. 2014; Fang et al. 2019), raises the interesting possibility that
these two late pathways may collaborate to evict YY1 from Xi (Figure 7.5 B). This poten-
tial mechanism requires considerable further experimental examination, but if it transpires
both to be true and to rely on interplay with cellular differentiation, will go some way
towards elucidating the final stages of the establishment of gene silencing in XCI.
A final recurring feature of the results presented in Chapters 5 and 6 is that mutants
deficient in Xist-mediated silencing are inhibited in their ability to differentiate into ho-
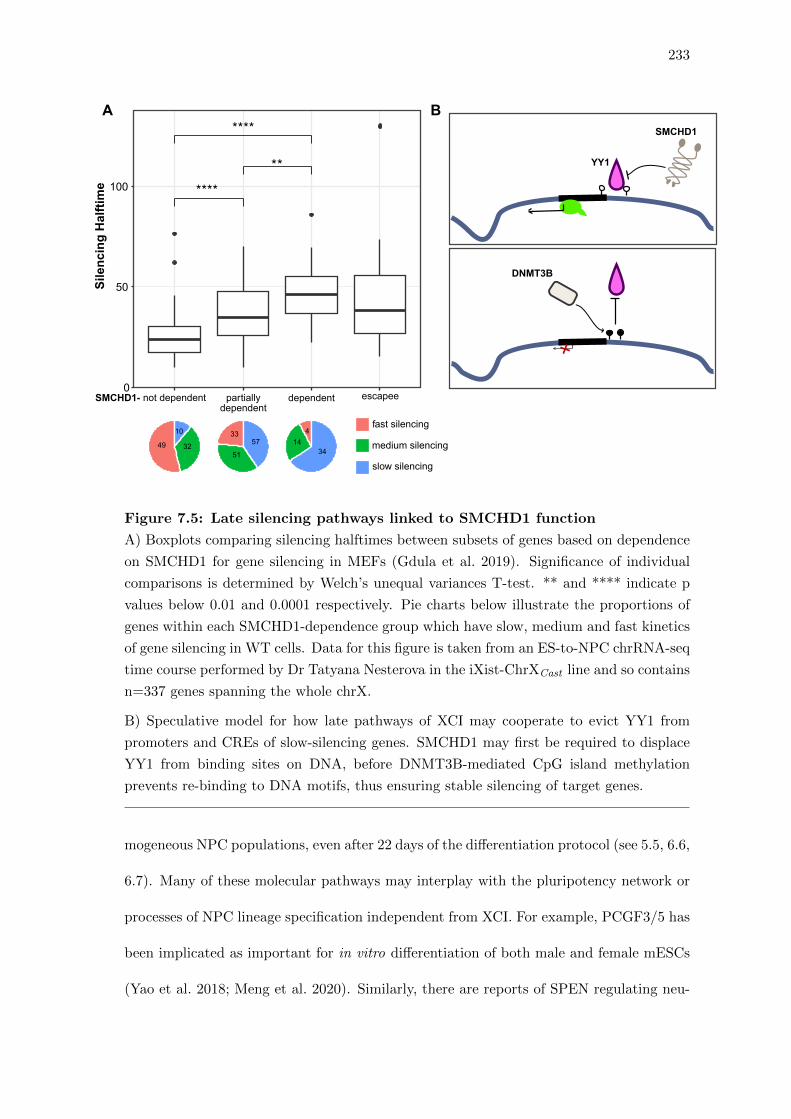
233
0
100
50SilencingHalftime
49 32
10fast silencing
medium silencing
slow silencing
not dependent escapee
414
34
dependent
33
51
57
partiallydependent
YY1
SMCHD1
DNMT3B
A B
SMCHD1-
****
******
Figure 7.5: Late silencing pathways linked to SMCHD1 function
A) Boxplots comparing silencing halftimes between subsets of genes based on dependence
on SMCHD1 for gene silencing in MEFs (Gdula et al. 2019). Significance of individual
comparisons is determined by Welch’s unequal variances T-test. ** and **** indicate p
values below 0.01 and 0.0001 respectively. Pie charts below illustrate the proportions of
genes within each SMCHD1-dependence group which have slow, medium and fast kinetics
of gene silencing in WT cells. Data for this figure is taken from an ES-to-NPC chrRNA-seq
time course performed by Dr Tatyana Nesterova in the iXist-ChrXCast line and so contains
n=337 genes spanning the whole chrX.
B) Speculative model for how late pathways of XCI may cooperate to evict YY1 from
promoters and CREs of slow-silencing genes. SMCHD1 may first be required to displace
YY1 from binding sites on DNA, before DNMT3B-mediated CpG island methylation
prevents re-binding to DNA motifs, thus ensuring stable silencing of target genes.
mogeneous NPC populations, even after 22 days of the differentiation protocol (see 5.5, 6.6,
6.7). Many of these molecular pathways may interplay with the pluripotency network or
processes of NPC lineage specification independent from XCI. For example, PCGF3/5 has
been implicated as important for in vitro differentiation of both male and female mESCs
(Yao et al. 2018; Meng et al. 2020). Similarly, there are reports of SPEN regulating neu-
234
ronal cell survival in mice (Yabe et al. 2007) and point mutants in SPEN have recently
been linked to neurodevelopmental disorders in humans (He and Wang 2020; Radio et al.
2021). This complicates interpretation of NPC data sets collected from these mutant lines
as silencing defects could partially be due to the indirect effects of pluripotency antago-
nising Xist-mediated silencing (see Figure 4.2 C). Conversely, ‘blocked differentiation’ of
mutant lines may be a direct consequence of their inability to perform efficient XCI, as
double X dosage has been shown to inhibit the MAPK signalling pathway required for
mESCs to exit pluripotency (Schulz et al. 2014). Indeed, X chromosome elimination oc-
curs at a high rate in the FKBP12F36V-PCGF3/5+SPENSPOCmut cell lines that perform
no gene silencing (6.7), a dramatic phenotype that has been also been reported by other
groups attempting to differentiate Xist knockout or Xist∆A cell lines (Yang et al. 2016;
Colognori et al. 2020). This signifies very strong negative selection against XaXa cells,
consistent with a block in exit from pluripotency. Taken together, these findings accen-
tuate how Xist function is tightly entwined with cellular networks of pluripotency and
differentiation, and reaffirm the importance of XCI as a dosage compensation mechanism
in female mammalian development.
Bibliography
Adachi, Kenjiro et al. (2018). “Esrrb Unlocks Silenced Enhancers for Reprogramming to
Naive Pluripotency”. Cell Stem Cell 23.2, 266–275.e6. doi: 10.1016/j.stem.2018.05.
020.
Adli, Mazhar (2018). “The CRISPR tool kit for genome editing and beyond”. Nature
Communications 9.1, pp. 1–13. doi: 10.1038/s41467-018-04252-2.
Agrelo, Ruben and Anton Wutz (2010). “Context of change - X inactivation and disease”.
EMBO Molecular Medicine 2.1, pp. 6–15. doi: 10.1002/emmm.200900053.
Agrelo, Ruben et al. (2009). “SATB1 Defines the Developmental Context for Gene Silenc-
ing by Xist in Lymphoma and Embryonic Cells”. Developmental Cell 16.4, pp. 507–516.
doi: 10.1016/j.devcel.2009.03.006.
Albritton, Sarah Elizabeth and Sevinc Ercan (2018). “Caenorhabditis elegans Dosage
Compensation: Insights into Condensin-Mediated Gene Regulation”. Trends in Genetics
34.1, pp. 41–53. doi: 10.1016/j.tig.2017.09.010.
Allshire, Robin C. and Hiten D. Madhani (2018). “Ten principles of heterochromatin
formation and function”. Nature Reviews Molecular Cell Biology 19.4, pp. 229–244.
doi: 10.1038/nrm.2017.119.
Almeida, Mafalda, Joseph S. Bowness, and Neil Brockdorff (2020). “The many faces of
Polycomb regulation by RNA”. Current Opinion in Genetics and Development 61,
pp. 53–61. doi: 10.1016/j.gde.2020.02.023.
Almeida, Mafalda et al. (2017). “PCGF3/5–PRC1 initiates Polycomb recruitment in X
chromosome inactivation”. Science 1084.June, pp. 1081–1084. doi: 10.1126/science.
aal2512.
Amezquita, Robert A. et al. (2020). “Orchestrating single-cell analysis with Bioconductor”.
Nature Methods 17.2, pp. 137–145. doi: 10.1038/s41592-019-0654-x.
Amir, Ruthie E., Ignatia B. Van Den Veyver, Mimi Wan, Charles Q. Tran, Uta Francke,
and Huda Y. Zoghbi (1999). “Rett syndrome is caused by mutations in X-linked MECP2,
encoding methyl- CpG-binding protein 2”. Nature Genetics 23.2, pp. 185–188. doi:
10.1038/13810.
Appel, Lisa-Marie et al. (2020). “PHF3 regulates neuronal gene expression through the
new Pol II CTD reader domain SPOC”. bioRxiv.
235
236
Aranda, Sergi, Gloria Mas, and Luciano Di Croce (2015). “Regulation of gene transcrip-
tion by Polycomb proteins”. Science Advances 1.11, e1500737. doi: 10.1126/sciadv.
1500737.
Arieti, Fabiana, Caroline Gabus, Margherita Tambalo, Tiphaine Huet, Adam Round, and
Stephane Thore (2014). “The crystal structure of the split end protein SHARP adds a
new layer of complexity to proteins containing RNA recognition motifs”. Nucleic Acids
Research 42.10, pp. 6742–6752. doi: 10.1093/nar/gku277.
Ariyoshi, Mariko and John W.R. Schwabe (2003). “A conserved structural motif reveals
the essential transcriptional repression function of spen proteins and their role in de-
velopmental signaling”. Genes and Development 17.15, pp. 1909–1920. doi: 10.1101/
gad.266203.
Arnold, Cosmas D., Daniel Gerlach, Christoph Stelzer, Lukasz M. Boryn, Martina Rath,
and Alexander Stark (2013). “Genome-wide quantitative enhancer activity maps iden-
tified by STARR-seq”. Science 339.6123, pp. 1074–1077. doi: 10 . 1126 / science .
1232542.
Arrigoni, Rachele, Steven L. Alam, Joseph A. Wamstad, Vivian J. Bardwell, Wesley I.
Sundquist, and Nicole Schreiber-Agus (2006). “The Polycomb-associated protein Rybp
is a ubiquitin binding protein”. FEBS Letters 580.26, pp. 6233–6241. doi: 10.1016/j.
febslet.2006.10.027.
Atchison, Lakshmi, Ayesha Ghias, Frank Wilkinson, Nancy Bonini, and Michael L. Atchi-
son (2003). “Transcription factor YY1 functions as a PcG protein in vivo”. EMBO
Journal 22.6, pp. 1347–1358. doi: 10.1093/emboj/cdg124.
Aughey, Gabriel N., Seth W. Cheetham, and Tony D. Southall (2019). “DamID as a
versatile tool for understanding gene regulation”. Development 146.6. doi: 10.1242/
dev.173666.
Barr, Murray L. and Ewart G. Bertram (1949). “A morphological distinction between
neurones of the male and female, and the behaviour of the nucleolar satellite during
accelerated nucleoprotein synthesis”. Nature 163.4148, pp. 676–677. doi: 10.1038/
163676a0.
Barros De Andrade e Sousa, Lisa et al. (2019). “Kinetics of Xist-induced gene silencing can
be predicted from combinations of epigenetic and genomic features”. Genome Research
29.7, pp. 1087–1099. doi: 10.1101/gr.245027.118.
Barski, Artem, Suresh Cuddapah, Kairong Cui, Tae Young Roh, Dustin E. Schones, Zhibin
Wang, Gang Wei, Iouri Chepelev, and Keji Zhao (2007). “High-Resolution Profiling of
Histone Methylations in the Human Genome”. Cell 129.4, pp. 823–837. doi: 10.1016/
j.cell.2007.05.009.
Barton, D. E., F. N. David, and M. Merrington (1964). “The positions of the sex chromo-
somes in the human cell in mitosis”. Annals of Human Genetics 28.1-3, pp. 123–128.
doi: 10.1111/j.1469-1809.1964.tb00467.x.

237
Basu, Arindam, Frank H. Wilkinson, Kristen Colavita, Colin Fennelly, and Michael L.
Atchison (2014). “YY1 DNA binding and interaction with YAF2 is essential for Poly-
comb recruitment”. Nucleic Acids Research 42.4, pp. 2208–2223. doi: 10.1093/nar/
gkt1187.
Bauer, Moritz, Johanna Trupke, and Leonie Ringrose (2016). “The quest for mammalian
Polycomb response elements: are we there yet?” Chromosoma 125.3, pp. 471–496. doi:
10.1007/s00412-015-0539-4.
Baylin, Stephen B. and Peter A. Jones (2016). “Epigenetic determinants of cancer”. Cold
Spring Harbor Perspectives in Biology 8.9. doi: 10.1101/cshperspect.a019505.
Beagan, Jonathan A., Michael T. Duong, Katelyn R. Titus, Linda Zhou, Zhendong Cao,
Jingjing Ma, Caroline V. Lachanski, Daniel R. Gillis, and Jennifer E. Phillips-Cremins
(2017). “YY1 and CTCF orchestrate a 3D chromatin looping switch during early neu-
ral lineage commitment”. Genome Research 27.7, pp. 1139–1152. doi: 10.1101/gr.
215160.116.
Bell, Adam C., Adam G. West, and Gary Felsenfeld (1999). “The protein CTCF is required
for the enhancer blocking activity of vertebrate insulators”. Cell 98.3, pp. 387–396. doi:
10.1016/S0092-8674(00)81967-4.
Beltran, Manuel et al. (2016). “The interaction of PRC2 with RNA or chromatin s mutually
antagonistic”. Genome Research 26.7, pp. 896–907. doi: 10.1101/gr.197632.115.
Bernstein, Emily, Elizabeth M. Duncan, Osamu Masui, Jesus Gil, Edith Heard, and
C. David Allis (2006). “Mouse Polycomb Proteins Bind Differentially to Methylated
Histone H3 and RNA and Are Enriched in Facultative Heterochromatin”. Molecular
and Cellular Biology 26.7, pp. 2560–2569. doi: 10.1128/mcb.26.7.2560-2569.2006.
Bird, Adrian P. (1986). “CpG-Rich islands and the function of DNA methylation”. Nature
321.6067, pp. 209–213. doi: 10.1038/321209a0.
Blackledge, Neil P., Nadezda A. Fursova, Jessica R. Kelley, Miles K. Huseyin, Angelika
Feldmann, and Robert J. Klose (2020). “PRC1 Catalytic Activity Is Central to Poly-
comb System Function”. Molecular Cell 77.4, 857–874.e9. doi: 10.1016/j.molcel.
2019.12.001.
Blackledge, Neil P. et al. (2014). “Variant PRC1 complex-dependent H2A ubiquitylation
drives PRC2 recruitment and polycomb domain formation”. Cell 157.6, pp. 1445–1459.
doi: 10.1016/j.cell.2014.05.004.
Blewitt, Marnie E. et al. (2008). “SmcHD1, containing a structural-maintenance-of-chromosomes
hinge domain, has a critical role in X inactivation”. Nature Genetics 40.5, pp. 663–669.
doi: 10.1038/ng.142.
Boeke, Jef D., David J. Garfinkel, Cora A. Styles, and Gerald R. Fink (1985). “Ty elements
transpose through an RNA intermediate”. Cell 40.3, pp. 491–500. doi: 10.1016/0092-
8674(85)90197-7.
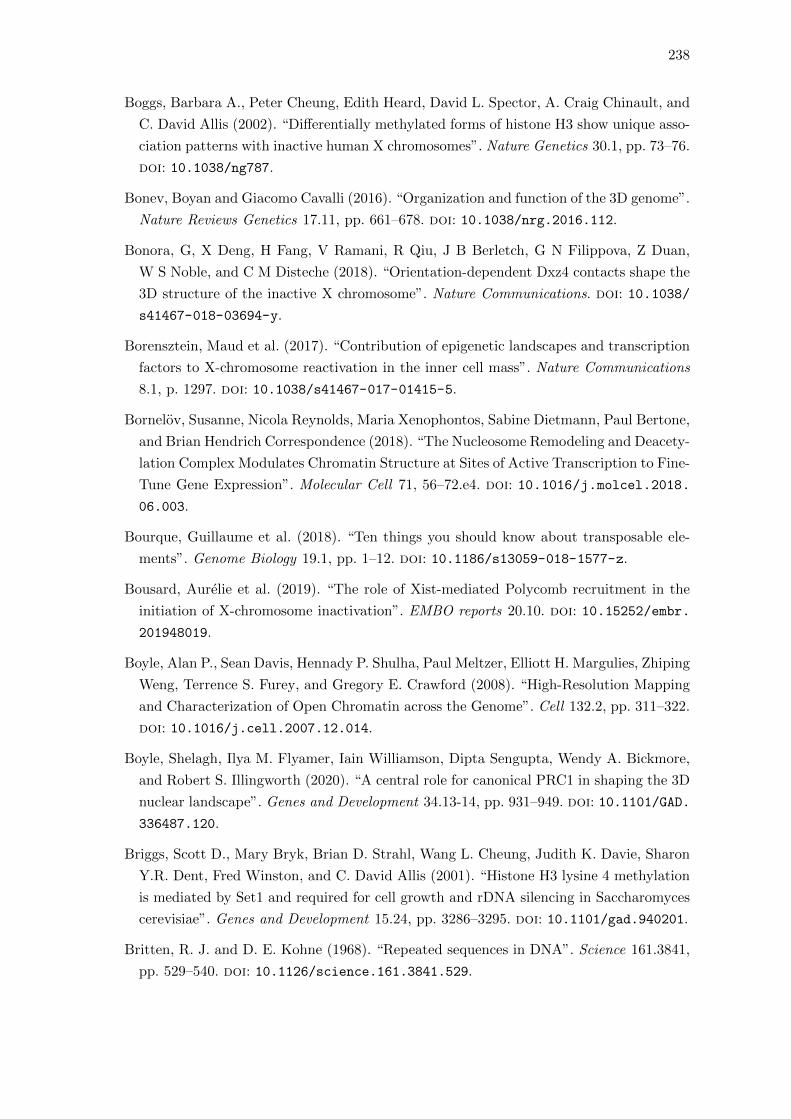
238
Boggs, Barbara A., Peter Cheung, Edith Heard, David L. Spector, A. Craig Chinault, and
C. David Allis (2002). “Differentially methylated forms of histone H3 show unique asso-
ciation patterns with inactive human X chromosomes”. Nature Genetics 30.1, pp. 73–76.
doi: 10.1038/ng787.
Bonev, Boyan and Giacomo Cavalli (2016). “Organization and function of the 3D genome”.
Nature Reviews Genetics 17.11, pp. 661–678. doi: 10.1038/nrg.2016.112.
Bonora, G, X Deng, H Fang, V Ramani, R Qiu, J B Berletch, G N Filippova, Z Duan,
W S Noble, and C M Disteche (2018). “Orientation-dependent Dxz4 contacts shape the
3D structure of the inactive X chromosome”. Nature Communications. doi: 10.1038/
s41467-018-03694-y.
Borensztein, Maud et al. (2017). “Contribution of epigenetic landscapes and transcription
factors to X-chromosome reactivation in the inner cell mass”. Nature Communications
8.1, p. 1297. doi: 10.1038/s41467-017-01415-5.
Bornelov, Susanne, Nicola Reynolds, Maria Xenophontos, Sabine Dietmann, Paul Bertone,
and Brian Hendrich Correspondence (2018). “The Nucleosome Remodeling and Deacety-
lation Complex Modulates Chromatin Structure at Sites of Active Transcription to Fine-
Tune Gene Expression”. Molecular Cell 71, 56–72.e4. doi: 10.1016/j.molcel.2018.
06.003.
Bourque, Guillaume et al. (2018). “Ten things you should know about transposable ele-
ments”. Genome Biology 19.1, pp. 1–12. doi: 10.1186/s13059-018-1577-z.
Bousard, Aurelie et al. (2019). “The role of Xist-mediated Polycomb recruitment in the
initiation of X-chromosome inactivation”. EMBO reports 20.10. doi: 10.15252/embr.
201948019.
Boyle, Alan P., Sean Davis, Hennady P. Shulha, Paul Meltzer, Elliott H. Margulies, Zhiping
Weng, Terrence S. Furey, and Gregory E. Crawford (2008). “High-Resolution Mapping
and Characterization of Open Chromatin across the Genome”. Cell 132.2, pp. 311–322.
doi: 10.1016/j.cell.2007.12.014.
Boyle, Shelagh, Ilya M. Flyamer, Iain Williamson, Dipta Sengupta, Wendy A. Bickmore,
and Robert S. Illingworth (2020). “A central role for canonical PRC1 in shaping the 3D
nuclear landscape”. Genes and Development 34.13-14, pp. 931–949. doi: 10.1101/GAD.
336487.120.
Briggs, Scott D., Mary Bryk, Brian D. Strahl, Wang L. Cheung, Judith K. Davie, Sharon
Y.R. Dent, Fred Winston, and C. David Allis (2001). “Histone H3 lysine 4 methylation
is mediated by Set1 and required for cell growth and rDNA silencing in Saccharomyces
cerevisiae”. Genes and Development 15.24, pp. 3286–3295. doi: 10.1101/gad.940201.
Britten, R. J. and D. E. Kohne (1968). “Repeated sequences in DNA”. Science 161.3841,
pp. 529–540. doi: 10.1126/science.161.3841.529.
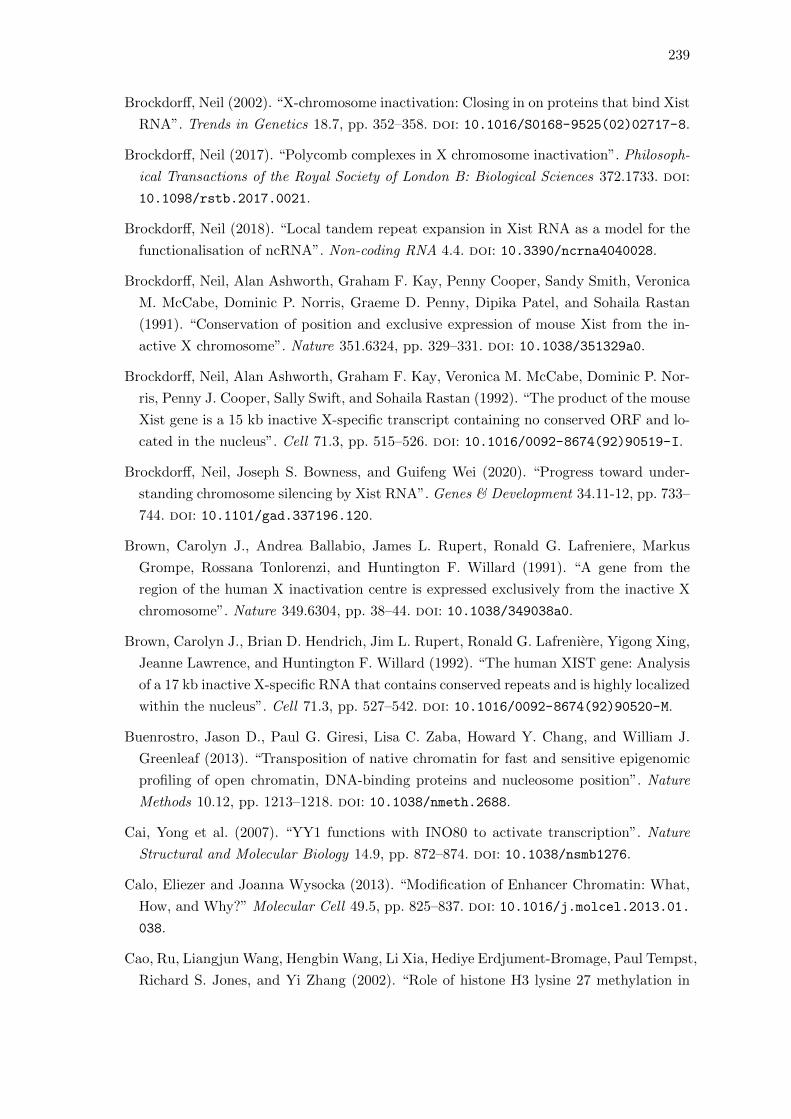
239
Brockdorff, Neil (2002). “X-chromosome inactivation: Closing in on proteins that bind Xist
RNA”. Trends in Genetics 18.7, pp. 352–358. doi: 10.1016/S0168-9525(02)02717-8.
Brockdorff, Neil (2017). “Polycomb complexes in X chromosome inactivation”. Philosoph-
ical Transactions of the Royal Society of London B: Biological Sciences 372.1733. doi:
10.1098/rstb.2017.0021.
Brockdorff, Neil (2018). “Local tandem repeat expansion in Xist RNA as a model for the
functionalisation of ncRNA”. Non-coding RNA 4.4. doi: 10.3390/ncrna4040028.
Brockdorff, Neil, Alan Ashworth, Graham F. Kay, Penny Cooper, Sandy Smith, Veronica
M. McCabe, Dominic P. Norris, Graeme D. Penny, Dipika Patel, and Sohaila Rastan
(1991). “Conservation of position and exclusive expression of mouse Xist from the in-
active X chromosome”. Nature 351.6324, pp. 329–331. doi: 10.1038/351329a0.
Brockdorff, Neil, Alan Ashworth, Graham F. Kay, Veronica M. McCabe, Dominic P. Nor-
ris, Penny J. Cooper, Sally Swift, and Sohaila Rastan (1992). “The product of the mouse
Xist gene is a 15 kb inactive X-specific transcript containing no conserved ORF and lo-
cated in the nucleus”. Cell 71.3, pp. 515–526. doi: 10.1016/0092-8674(92)90519-I.
Brockdorff, Neil, Joseph S. Bowness, and Guifeng Wei (2020). “Progress toward under-
standing chromosome silencing by Xist RNA”. Genes & Development 34.11-12, pp. 733–
744. doi: 10.1101/gad.337196.120.
Brown, Carolyn J., Andrea Ballabio, James L. Rupert, Ronald G. Lafreniere, Markus
Grompe, Rossana Tonlorenzi, and Huntington F. Willard (1991). “A gene from the
region of the human X inactivation centre is expressed exclusively from the inactive X
chromosome”. Nature 349.6304, pp. 38–44. doi: 10.1038/349038a0.
Brown, Carolyn J., Brian D. Hendrich, Jim L. Rupert, Ronald G. Lafreniere, Yigong Xing,
Jeanne Lawrence, and Huntington F. Willard (1992). “The human XIST gene: Analysis
of a 17 kb inactive X-specific RNA that contains conserved repeats and is highly localized
within the nucleus”. Cell 71.3, pp. 527–542. doi: 10.1016/0092-8674(92)90520-M.
Buenrostro, Jason D., Paul G. Giresi, Lisa C. Zaba, Howard Y. Chang, and William J.
Greenleaf (2013). “Transposition of native chromatin for fast and sensitive epigenomic
profiling of open chromatin, DNA-binding proteins and nucleosome position”. Nature
Methods 10.12, pp. 1213–1218. doi: 10.1038/nmeth.2688.
Cai, Yong et al. (2007). “YY1 functions with INO80 to activate transcription”. Nature
Structural and Molecular Biology 14.9, pp. 872–874. doi: 10.1038/nsmb1276.
Calo, Eliezer and Joanna Wysocka (2013). “Modification of Enhancer Chromatin: What,
How, and Why?” Molecular Cell 49.5, pp. 825–837. doi: 10.1016/j.molcel.2013.01.
038.
Cao, Ru, Liangjun Wang, Hengbin Wang, Li Xia, Hediye Erdjument-Bromage, Paul Tempst,
Richard S. Jones, and Yi Zhang (2002). “Role of histone H3 lysine 27 methylation in
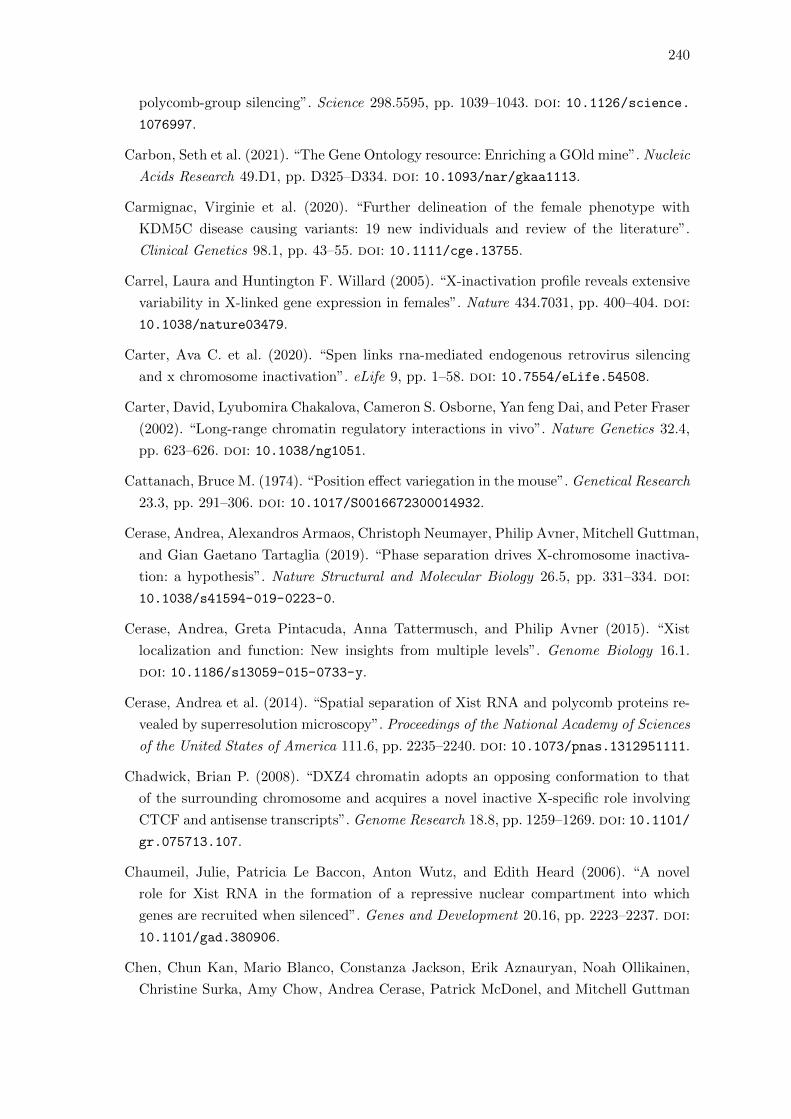
240
polycomb-group silencing”. Science 298.5595, pp. 1039–1043. doi: 10.1126/science.
1076997.
Carbon, Seth et al. (2021). “The Gene Ontology resource: Enriching a GOld mine”. Nucleic
Acids Research 49.D1, pp. D325–D334. doi: 10.1093/nar/gkaa1113.
Carmignac, Virginie et al. (2020). “Further delineation of the female phenotype with
KDM5C disease causing variants: 19 new individuals and review of the literature”.
Clinical Genetics 98.1, pp. 43–55. doi: 10.1111/cge.13755.
Carrel, Laura and Huntington F. Willard (2005). “X-inactivation profile reveals extensive
variability in X-linked gene expression in females”. Nature 434.7031, pp. 400–404. doi:
10.1038/nature03479.
Carter, Ava C. et al. (2020). “Spen links rna-mediated endogenous retrovirus silencing
and x chromosome inactivation”. eLife 9, pp. 1–58. doi: 10.7554/eLife.54508.
Carter, David, Lyubomira Chakalova, Cameron S. Osborne, Yan feng Dai, and Peter Fraser
(2002). “Long-range chromatin regulatory interactions in vivo”. Nature Genetics 32.4,
pp. 623–626. doi: 10.1038/ng1051.
Cattanach, Bruce M. (1974). “Position effect variegation in the mouse”. Genetical Research
23.3, pp. 291–306. doi: 10.1017/S0016672300014932.
Cerase, Andrea, Alexandros Armaos, Christoph Neumayer, Philip Avner, Mitchell Guttman,
and Gian Gaetano Tartaglia (2019). “Phase separation drives X-chromosome inactiva-
tion: a hypothesis”. Nature Structural and Molecular Biology 26.5, pp. 331–334. doi:
10.1038/s41594-019-0223-0.
Cerase, Andrea, Greta Pintacuda, Anna Tattermusch, and Philip Avner (2015). “Xist
localization and function: New insights from multiple levels”. Genome Biology 16.1.
doi: 10.1186/s13059-015-0733-y.
Cerase, Andrea et al. (2014). “Spatial separation of Xist RNA and polycomb proteins re-
vealed by superresolution microscopy”. Proceedings of the National Academy of Sciences
of the United States of America 111.6, pp. 2235–2240. doi: 10.1073/pnas.1312951111.
Chadwick, Brian P. (2008). “DXZ4 chromatin adopts an opposing conformation to that
of the surrounding chromosome and acquires a novel inactive X-specific role involving
CTCF and antisense transcripts”. Genome Research 18.8, pp. 1259–1269. doi: 10.1101/
gr.075713.107.
Chaumeil, Julie, Patricia Le Baccon, Anton Wutz, and Edith Heard (2006). “A novel
role for Xist RNA in the formation of a repressive nuclear compartment into which
genes are recruited when silenced”. Genes and Development 20.16, pp. 2223–2237. doi:
10.1101/gad.380906.
Chen, Chun Kan, Mario Blanco, Constanza Jackson, Erik Aznauryan, Noah Ollikainen,
Christine Surka, Amy Chow, Andrea Cerase, Patrick McDonel, and Mitchell Guttman
241
(2016a). “Xist recruits the X chromosome to the nuclear lamina to enable chromosome-
wide silencing”. Science 354.6311, pp. 468–472. doi: 10.1126/science.aae0047.
Chen, Geng et al. (2016b). “Single-cell analyses of X Chromosome inactivation dynamics
and pluripotency during differentiation”. Genome Research 26.10, pp. 1342–1354. doi:
10.1101/gr.201954.115.
Chen, Jiji et al. (2014). “Single-molecule dynamics of enhanceosome assembly in embryonic
stem cells”. Cell 156.6, pp. 1274–1285. doi: 10.1016/j.cell.2014.01.062.
Cheng, Shangli, Yu Pei, Liqun He, Guangdun Peng, Bjorn Reinius, Patrick P.L. Tam,
Naihe Jing, and Qiaolin Deng (2019). “Single-Cell RNA-Seq Reveals Cellular Hetero-
geneity of Pluripotency Transition and X Chromosome Dynamics during Early Mouse
Development”. Cell Reports 26.10, 2593–2607.e3. doi: 10.1016/j.celrep.2019.02.
031.
Cheung, Aaron Y.L., Lindsay M. Horvath, Laura Carrel, and James Ellis (2012). X-
chromosome inactivation in Rett syndrome human induced pluripotent stem cells. doi:
10.3389/fpsyt.2012.00024.
Chittock, Emily C., Sebastian Latwiel, Thomas C.R. Miller, and Christoph W. Muller
(2017). “Molecular architecture of polycomb repressive complexes”. Biochemical Society
Transactions 45.1, pp. 193–205. doi: 10.1042/BST20160173.
Chow, Jennifer C. et al. (2010). “LINE-1 activity in facultative heterochromatin formation
during X chromosome inactivation”. Cell 141.6, pp. 956–969. doi: 10.1016/j.cell.
2010.04.042.
Chu, Ci, Qiangfeng Cliff Zhang, Simao Teixeira da Rocha, Ryan A. Flynn, Maheetha
Bharadwaj, J. Mauro Calabrese, Terry Magnuson, Edith Heard, and Howard Y. Chang
(2015). “Systematic Discovery of Xist RNA Binding Proteins”. Cell 161.2, pp. 404–416.
doi: 10.1016/j.cell.2015.03.025.
Churchman, L. Stirling and Jonathan S. Weissman (2011). “Nascent transcript sequencing
visualizes transcription at nucleotide resolution”. Nature 469.7330, pp. 368–373. doi:
10.1038/nature09652.
Chureau, Corinne, Sophie Chantalat, Antonio Romito, Angelique Galvani, Laurent Duret,
Philip Avner, and Claire Rougeulle (2011). “Ftx is a non-coding RNA which affects Xist
expression and chromatin structure within the X-inactivation center region”. Human
Molecular Genetics 20.4, pp. 705–718. doi: 10.1093/hmg/ddq516.
Cirillo, Davide, Mario Blanco, Alexandros Armaos, Andreas Buness, Philip Avner, Mitchell
Guttman, Andrea Cerase, and Gian Gaetano Tartaglia (2016). “Quantitative predictions
of protein interactions with long noncoding RNAs”. Nature Methods 14.1, pp. 5–6. doi:
10.1038/nmeth.4100.
Cirillo, Lisa Ann, Frank Robert Lin, Isabel Cuesta, Dara Friedman, Michal Jarnik, and
Kenneth S. Zaret (2002). “Opening of compacted chromatin by early developmental
242
transcription factors HNF3 (FoxA) and GATA-4”. Molecular Cell 9.2, pp. 279–289.
doi: 10.1016/S1097-2765(02)00459-8.
Clemson, Christine Moulton, John A. McNeil, Huntington F. Willard, and Jeanne Bentley
Lawrence (1996). “XIST RNA paints the inactive X chromosome at interphase: Evidence
for a novel RNA involved in nuclear/chromosome structure”. Journal of Cell Biology
132.3, pp. 259–275. doi: 10.1083/jcb.132.3.259.
Coker, Heather, Guifeng Wei, Benoit Moindrot, Shabaz Mohammed, Tatyana Nesterova,
and Neil Brockdorff (2020). “The role of the Xist 5’ m6A region and RBM15 in X chro-
mosome inactivation”. Wellcome Open Research 5. doi: 10.12688/wellcomeopenres.
15711.1.
Colognori, David, Hongjae Sunwoo, Andrea J. Kriz, Chen Yu Wang, and Jeannie T. Lee
(2019). “Xist Deletional Analysis Reveals an Interdependency between Xist RNA and
Polycomb Complexes for Spreading along the Inactive X”. Molecular Cell 74.1, 101–
117.e10. doi: 10.1016/j.molcel.2019.01.015.
Colognori, David, Hongjae Sunwoo, Danni Wang, Chen Yu Wang, and Jeannie T. Lee
(2020). “Xist Repeats A and B Account for Two Distinct Phases of X Inactivation
Establishment”. Developmental Cell 54.1, 21–32.e5. doi: 10.1016/j.devcel.2020.05.
021.
Concordet, Jean Paul and Maximilian Haeussler (2018). “CRISPOR: Intuitive guide se-
lection for CRISPR/Cas9 genome editing experiments and screens”. Nucleic Acids Re-
search 46.W1, W242–W245. doi: 10.1093/nar/gky354.
Conesa, Ana et al. (2016). A survey of best practices for RNA-seq data analysis. doi:
10.1186/s13059-016-0881-8.
Conrad, Thomas and Asifa Akhtar (2012). “Dosage compensation in Drosophila melanogaster:
Epigenetic fine-tuning of chromosome-wide transcription”. Nature Reviews Genetics
13.2, pp. 123–134. doi: 10.1038/nrg3124.
Conti, Luciano et al. (2005). “Niche-Independent Symmetrical Self-Renewal of a Mam-
malian Tissue Stem Cell”. PLoS Biology 3.9, e283. doi: 10.1371/journal.pbio.
0030283.
Conway, Jake R, Alexander Lex, and Nils Gehlenborg (2017). “UpSetR: an R package
for the visualization of intersecting sets and their properties”. Bioinformatics 33.18,
pp. 2938–2940. doi: 10.1093/bioinformatics/btx364.
Cooper, Sarah et al. (2014). “Targeting Polycomb to Pericentric Heterochromatin in Em-
bryonic Stem Cells Reveals a Role for H2AK119u1 in PRC2 Recruitment”. Cell Reports
7.5, pp. 1456–1470. doi: 10.1016/j.celrep.2014.04.012.
Cooper, Sarah et al. (2016). “Jarid2 binds mono-ubiquitylated H2A lysine 119 to mediate
crosstalk between Polycomb complexes PRC1 and PRC2”. Nature Communications 7.1,
pp. 1–8. doi: 10.1038/ncomms13661.
243
Corces, M. Ryan et al. (2017). “An improved ATAC-seq protocol reduces background
and enables interrogation of frozen tissues”. Nature Methods 14.10, pp. 959–962. doi:
10.1038/nmeth.4396.
Core, Leighton J., Joshua J. Waterfall, and John T. Lis (2008). “Nascent RNA sequenc-
ing reveals widespread pausing and divergent initiation at human promoters”. Science
322.5909, pp. 1845–1848. doi: 10.1126/science.1162228.
Costanzi, C. and J. R. Pehrson (1998). “Histone macroH2A1 is concentrated in the inactive
X chromosome of female mammals”. Nature 393.6685, pp. 599–601. doi: 10.1038/
31275.
Cremer, Thomas and Marion Cremer (2010). “Chromosome territories.” Cold Spring Har-
bor perspectives in biology 2.3. doi: 10.1101/cshperspect.a003889.
Crick, Francis (1970). “Central dogma of molecular biology”. Nature 227.5258, pp. 561–
563. doi: 10.1038/227561a0.
Csankovszki, G., B. Panning, B. Bates, J. R. Pehrson, and R. Jaenisch (1999a). “Condi-
tional deletion of Xist disrupts histone macroH2A localization but not maintenance of
X inactivation”. Nature Genetics 22.4, pp. 323–324. doi: 10.1038/11887.
Csankovszki, G., B. Panning, B. Bates, J. R. Pehrson, and R. Jaenisch (1999b). “Condi-
tional deletion of Xist disrupts histone macroH2A localization but not maintenance of
X inactivation”. Nature Genetics 22.4, pp. 323–324. doi: 10.1038/11887.
Darrow, Emily M. et al. (2016). “Deletion of DXZ4 on the human inactive X chromo-
some alters higher-order genome architecture”. Proceedings of the National Academy of
Sciences of the United States of America 113.31, E4504–E4512. doi: 10.1073/pnas.
1609643113.
Davidovich, Chen, Leon Zheng, Karen J. Goodrich, and Thomas R. Cech (2013). “Promis-
cuous RNA binding by Polycomb repressive complex 2”. Nature Structural and Molec-
ular Biology 20.11, pp. 1250–1257. doi: 10.1038/nsmb.2679.
Davies, James O.J., Jelena M. Telenius, Simon J. McGowan, Nigel A. Roberts, Stephen
Taylor, Douglas R. Higgs, and Jim R. Hughes (2015). “Multiplexed analysis of chro-
mosome conformation at vastly improved sensitivity”. Nature Methods 13.1, pp. 74–80.
doi: 10.1038/nmeth.3664.
Deans, Carrie and Keith A. Maggert (2015). “What do you mean, “Epigenetic”?” Genetics
199.4, pp. 887–896. doi: 10.1534/genetics.114.173492.
Deng, Qiaolin, Daniel Ramskold, Bjorn Reinius, and Rickard Sandberg (2014). “Single-
cell RNA-seq reveals dynamic, random monoallelic gene expression in mammalian cells”.
Science 343.6167, pp. 193–196. doi: 10.1126/science.1245316.
Deng, Xinxian et al. (2015). “Bipartite structure of the inactive mouse X chromosome”.
Genome Biology 16.1, p. 152. doi: 10.1186/s13059-015-0728-8.
244
Deniz, Ozgen, Jennifer M. Frost, and Miguel R. Branco (2019). “Regulation of transposable
elements by DNA modifications”. Nature Reviews Genetics 20.7, pp. 417–431. doi:
10.1038/s41576-019-0106-6.
Ding, Jiarui et al. (2020). “Systematic comparison of single-cell and single-nucleus RNA-
sequencing methods”. Nature Biotechnology 38.6, pp. 737–746. doi: 10.1038/s41587-
020-0465-8.
Disteche, Christine M. and Joel B. Berletch (2015). “X-chromosome inactivation and es-
cape”. Journal of Genetics 94.4, pp. 591–599. doi: 10.1007/s12041-015-0574-1.
Dixon, Jesse R., Siddarth Selvaraj, Feng Yue, Audrey Kim, Yan Li, Yin Shen, Ming
Hu, Jun S. Liu, and Bing Ren (2012). “Topological domains in mammalian genomes
identified by analysis of chromatin interactions”. Nature 485.7398, pp. 376–380. doi:
10.1038/nature11082.
Dixon, Jesse R. et al. (2015). “Chromatin architecture reorganization during stem cell
differentiation”. Nature 518.7539, pp. 331–336. doi: 10.1038/nature14222.
Dobin, Alexander, Carrie A. Davis, Felix Schlesinger, Jorg Drenkow, Chris Zaleski, Sonali
Jha, Philippe Batut, Mark Chaisson, and Thomas R. Gingeras (2013). “STAR: ul-
trafast universal RNA-seq aligner”. Bioinformatics 29.1, pp. 15–21. doi: 10.1093/
bioinformatics/bts635.
Dominissini, Dan et al. (2012). “Topology of the human and mouse m6A RNA methylomes
revealed by m6A-seq”. Nature 485.7397, pp. 201–206. doi: 10.1038/nature11112.
Donohoe, Mary E., Susana S. Silva, Stefan F. Pinter, Na Xu, and Jeannie T. Lee (2009).
“The pluripotency factor Oct4 interacts with Ctcf and also controls X-chromosome
pairing and counting”. Nature 460.7251, pp. 128–132. doi: 10.1038/nature08098.
Donohoe, Mary E., Xiaolin Zhang, Lynda McGinnis, John Biggers, En Li, and Yang Shi
(1999). “Targeted Disruption of Mouse Yin Yang 1 Transcription Factor Results in
Peri-Implantation Lethality”. Molecular and Cellular Biology 19.10, pp. 7237–7244. doi:
10.1128/mcb.19.10.7237.
Dossin, Francois et al. (2020). “SPEN integrates transcriptional and epigenetic control of
X-inactivation”. Nature 578.7795, pp. 455–460. doi: 10.1038/s41586-020-1974-9.
Doudna, Jennifer A. and Emmanuelle Charpentier (2014). “The new frontier of genome
engineering with CRISPR-Cas9”. Science 346.6213. doi: 10.1126/science.1258096.
Dunham, Ian et al. (2012). “An integrated encyclopedia of DNA elements in the human
genome”. Nature 489.7414, pp. 57–74. doi: 10.1038/nature11247.
Efroni, Sol et al. (2008). “Global Transcription in Pluripotent Embryonic Stem Cells”.
Cell Stem Cell 2.5, pp. 437–447. doi: 10.1016/j.stem.2008.03.021.
Eils, Roland, Steffen Dietzel, Etienne Bertin, Evelin Schrock, Michael R. Speicher, Thomas
Ried, Michel Robert-Nicoud, Christoph Cremer, and Thomas Cremer (1996). “Three-
245
dimensional reconstruction of painted human interphase chromosomes: Active and inac-
tive X chromosome territories have similar volumes but differ in shape and surface struc-
ture”. Journal of Cell Biology 135.6, pp. 1427–1440. doi: 10.1083/jcb.135.6.1427.
Ekwall, Karl, Tim Olsson, Bryan M. Turner, Gwen Cranston, and Robin C. Allshire (1997).
“Transient inhibition of histone deacetylation alters the structural and functional im-
print at fission yeast centromeres”. Cell 91.7, pp. 1021–1032. doi: 10.1016/S0092-
8674(00)80492-4.
Elisaphenko, Eugeny A., Nikolay N. Kolesnikov, Alexander I. Shevchenko, Igor B. Rogozin,
Tatyana B. Nesterova, Neil Brockdorff, and Suren M. Zakian (2008). “A Dual Origin of
the Xist Gene from a Protein-Coding Gene and a Set of Transposable Elements”. PLoS
ONE 3.6, e2521. doi: 10.1371/journal.pone.0002521.
Elzhov, V, Katharine M Mullen, Andrej-Nikolai Spiess, and Ben Bolker Maintainer (2016).
’minpack.lm’: R Interface to the Levenberg-Marquardt Nonlinear Least-Squares Algo-
rithm. Tech. rep.
Endoh, Mitsuhiro et al. (2017). “PCGF6-PRC1 suppresses premature differentiation of
mouse embryonic stem cells by regulating germ cell-related genes”. eLife 6. doi: 10.
7554/eLife.21064.
Engreitz, J. M. et al. (2013). “The Xist lncRNA Exploits Three-Dimensional Genome
Architecture to Spread Across the X Chromosome”. Science 341.6147, pp. 1237973–
1237973. doi: 10.1126/science.1237973.
Ernst, Jason and Manolis Kellis (2017). “Chromatin-state discovery and genome annota-
tion with ChromHMM”. Nature Protocols 12.12, pp. 2478–2492. doi: 10.1038/nprot.
2017.124.
Fang, Jia, Taiping Chen, Brian Chadwick, En Li, and Yi Zhang (2004). “Ring1b-mediated
H2A ubiquitination associates with inactive X chromosomes and is involved in initiation
of X inactivation.” The Journal of Biological Chemistry 279.51, pp. 52812–5. doi: 10.
1074/jbc.C400493200.
Fang, Shaohai et al. (2019). “Tet inactivation disrupts YY1 binding and long-range chro-
matin interactions during embryonic heart development”. Nature Communications 10.1,
pp. 1–18. doi: 10.1038/s41467-019-12325-z.
Ferguson-Smith, Anne C. (2011). “Genomic imprinting: The emergence of an epigenetic
paradigm”. Nature Reviews Genetics 12.8, pp. 565–575. doi: 10.1038/nrg3032.
Fishilevich, Simon et al. (2017). “GeneHancer: genome-wide integration of enhancers and
target genes in GeneCards”. Database 2017, pp. 1–17. doi: 10.1093/database/bax028.
Fornes, Oriol et al. (2020). “JASPAR 2020: Update of the open-Access database of tran-
scription factor binding profiles”. Nucleic Acids Research 48.D1, pp. D87–D92. doi:
10.1093/nar/gkz1001.
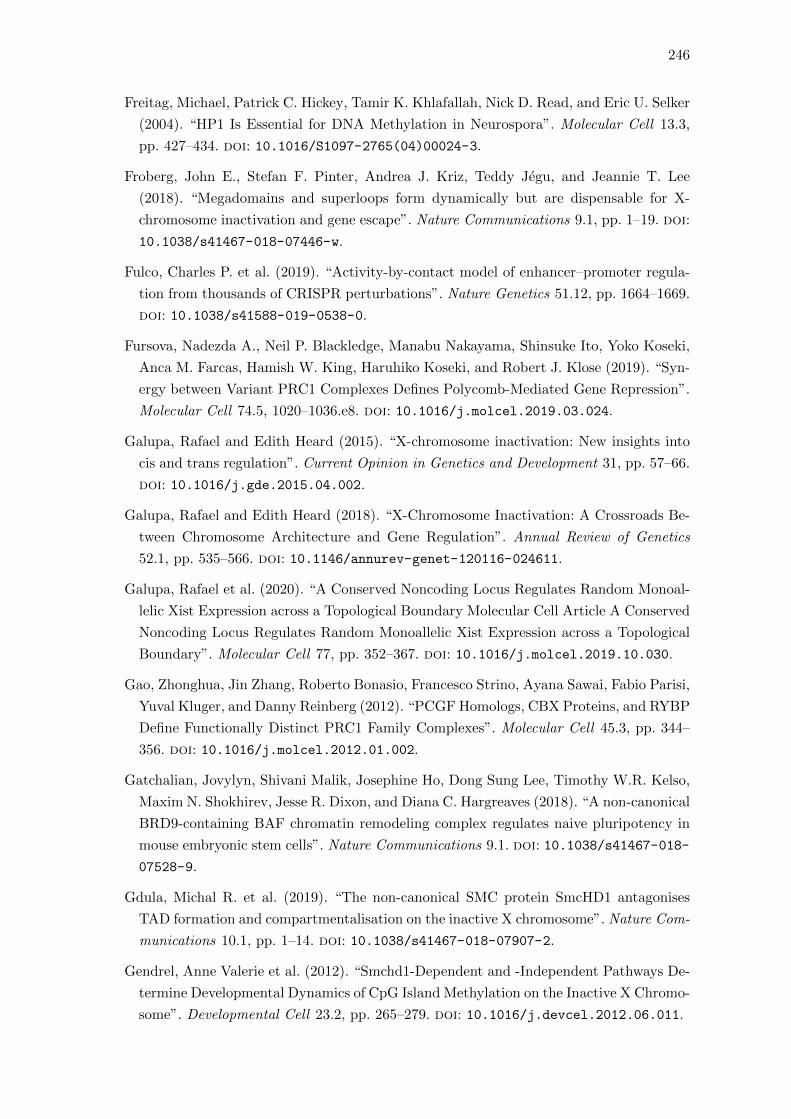
246
Freitag, Michael, Patrick C. Hickey, Tamir K. Khlafallah, Nick D. Read, and Eric U. Selker
(2004). “HP1 Is Essential for DNA Methylation in Neurospora”. Molecular Cell 13.3,
pp. 427–434. doi: 10.1016/S1097-2765(04)00024-3.
Froberg, John E., Stefan F. Pinter, Andrea J. Kriz, Teddy Jegu, and Jeannie T. Lee
(2018). “Megadomains and superloops form dynamically but are dispensable for X-
chromosome inactivation and gene escape”. Nature Communications 9.1, pp. 1–19. doi:
10.1038/s41467-018-07446-w.
Fulco, Charles P. et al. (2019). “Activity-by-contact model of enhancer–promoter regula-
tion from thousands of CRISPR perturbations”. Nature Genetics 51.12, pp. 1664–1669.
doi: 10.1038/s41588-019-0538-0.
Fursova, Nadezda A., Neil P. Blackledge, Manabu Nakayama, Shinsuke Ito, Yoko Koseki,
Anca M. Farcas, Hamish W. King, Haruhiko Koseki, and Robert J. Klose (2019). “Syn-
ergy between Variant PRC1 Complexes Defines Polycomb-Mediated Gene Repression”.
Molecular Cell 74.5, 1020–1036.e8. doi: 10.1016/j.molcel.2019.03.024.
Galupa, Rafael and Edith Heard (2015). “X-chromosome inactivation: New insights into
cis and trans regulation”. Current Opinion in Genetics and Development 31, pp. 57–66.
doi: 10.1016/j.gde.2015.04.002.
Galupa, Rafael and Edith Heard (2018). “X-Chromosome Inactivation: A Crossroads Be-
tween Chromosome Architecture and Gene Regulation”. Annual Review of Genetics
52.1, pp. 535–566. doi: 10.1146/annurev-genet-120116-024611.
Galupa, Rafael et al. (2020). “A Conserved Noncoding Locus Regulates Random Monoal-
lelic Xist Expression across a Topological Boundary Molecular Cell Article A Conserved
Noncoding Locus Regulates Random Monoallelic Xist Expression across a Topological
Boundary”. Molecular Cell 77, pp. 352–367. doi: 10.1016/j.molcel.2019.10.030.
Gao, Zhonghua, Jin Zhang, Roberto Bonasio, Francesco Strino, Ayana Sawai, Fabio Parisi,
Yuval Kluger, and Danny Reinberg (2012). “PCGF Homologs, CBX Proteins, and RYBP
Define Functionally Distinct PRC1 Family Complexes”. Molecular Cell 45.3, pp. 344–
356. doi: 10.1016/j.molcel.2012.01.002.
Gatchalian, Jovylyn, Shivani Malik, Josephine Ho, Dong Sung Lee, Timothy W.R. Kelso,
Maxim N. Shokhirev, Jesse R. Dixon, and Diana C. Hargreaves (2018). “A non-canonical
BRD9-containing BAF chromatin remodeling complex regulates naive pluripotency in
mouse embryonic stem cells”. Nature Communications 9.1. doi: 10.1038/s41467-018-
07528-9.
Gdula, Michal R. et al. (2019). “The non-canonical SMC protein SmcHD1 antagonises
TAD formation and compartmentalisation on the inactive X chromosome”. Nature Com-
munications 10.1, pp. 1–14. doi: 10.1038/s41467-018-07907-2.
Gendrel, Anne Valerie et al. (2012). “Smchd1-Dependent and -Independent Pathways De-
termine Developmental Dynamics of CpG Island Methylation on the Inactive X Chromo-
some”. Developmental Cell 23.2, pp. 265–279. doi: 10.1016/j.devcel.2012.06.011.
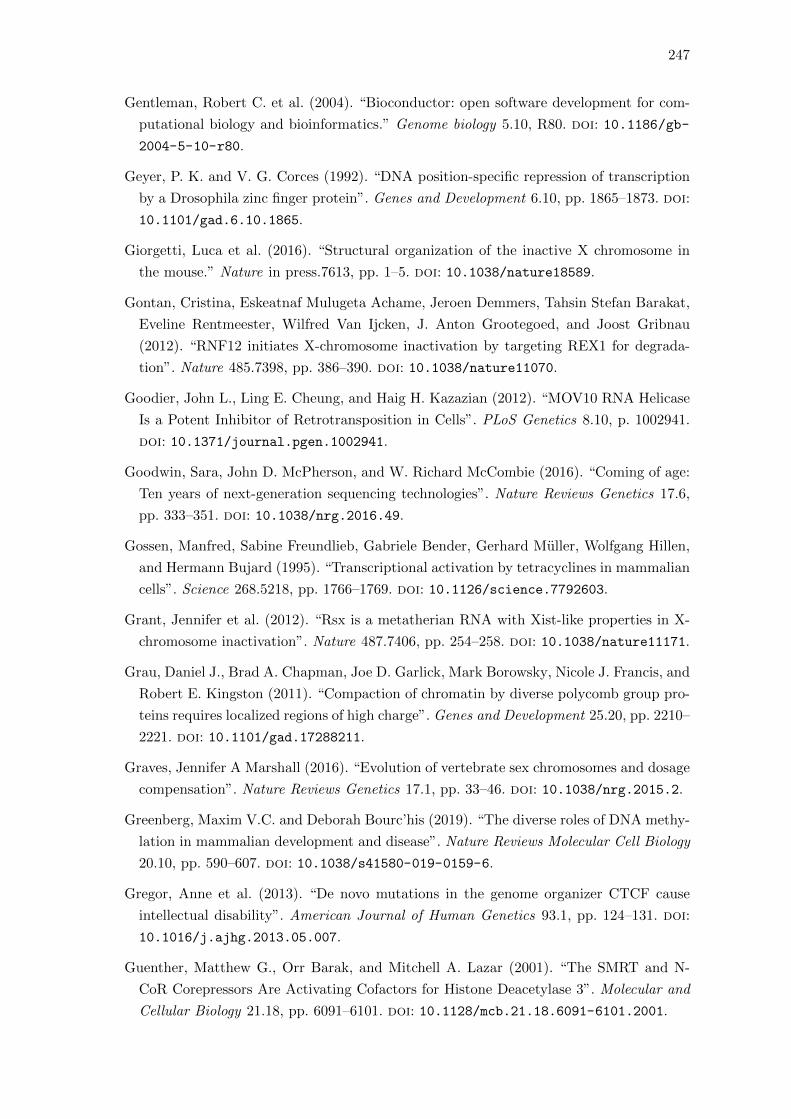
247
Gentleman, Robert C. et al. (2004). “Bioconductor: open software development for com-
putational biology and bioinformatics.” Genome biology 5.10, R80. doi: 10.1186/gb-
2004-5-10-r80.
Geyer, P. K. and V. G. Corces (1992). “DNA position-specific repression of transcription
by a Drosophila zinc finger protein”. Genes and Development 6.10, pp. 1865–1873. doi:
10.1101/gad.6.10.1865.
Giorgetti, Luca et al. (2016). “Structural organization of the inactive X chromosome in
the mouse.” Nature in press.7613, pp. 1–5. doi: 10.1038/nature18589.
Gontan, Cristina, Eskeatnaf Mulugeta Achame, Jeroen Demmers, Tahsin Stefan Barakat,
Eveline Rentmeester, Wilfred Van Ijcken, J. Anton Grootegoed, and Joost Gribnau
(2012). “RNF12 initiates X-chromosome inactivation by targeting REX1 for degrada-
tion”. Nature 485.7398, pp. 386–390. doi: 10.1038/nature11070.
Goodier, John L., Ling E. Cheung, and Haig H. Kazazian (2012). “MOV10 RNA Helicase
Is a Potent Inhibitor of Retrotransposition in Cells”. PLoS Genetics 8.10, p. 1002941.
doi: 10.1371/journal.pgen.1002941.
Goodwin, Sara, John D. McPherson, and W. Richard McCombie (2016). “Coming of age:
Ten years of next-generation sequencing technologies”. Nature Reviews Genetics 17.6,
pp. 333–351. doi: 10.1038/nrg.2016.49.
Gossen, Manfred, Sabine Freundlieb, Gabriele Bender, Gerhard Muller, Wolfgang Hillen,
and Hermann Bujard (1995). “Transcriptional activation by tetracyclines in mammalian
cells”. Science 268.5218, pp. 1766–1769. doi: 10.1126/science.7792603.
Grant, Jennifer et al. (2012). “Rsx is a metatherian RNA with Xist-like properties in X-
chromosome inactivation”. Nature 487.7406, pp. 254–258. doi: 10.1038/nature11171.
Grau, Daniel J., Brad A. Chapman, Joe D. Garlick, Mark Borowsky, Nicole J. Francis, and
Robert E. Kingston (2011). “Compaction of chromatin by diverse polycomb group pro-
teins requires localized regions of high charge”. Genes and Development 25.20, pp. 2210–
2221. doi: 10.1101/gad.17288211.
Graves, Jennifer A Marshall (2016). “Evolution of vertebrate sex chromosomes and dosage
compensation”. Nature Reviews Genetics 17.1, pp. 33–46. doi: 10.1038/nrg.2015.2.
Greenberg, Maxim V.C. and Deborah Bourc’his (2019). “The diverse roles of DNA methy-
lation in mammalian development and disease”. Nature Reviews Molecular Cell Biology
20.10, pp. 590–607. doi: 10.1038/s41580-019-0159-6.
Gregor, Anne et al. (2013). “De novo mutations in the genome organizer CTCF cause
intellectual disability”. American Journal of Human Genetics 93.1, pp. 124–131. doi:
10.1016/j.ajhg.2013.05.007.
Guenther, Matthew G., Orr Barak, and Mitchell A. Lazar (2001). “The SMRT and N-
CoR Corepressors Are Activating Cofactors for Histone Deacetylase 3”. Molecular and
Cellular Biology 21.18, pp. 6091–6101. doi: 10.1128/mcb.21.18.6091-6101.2001.
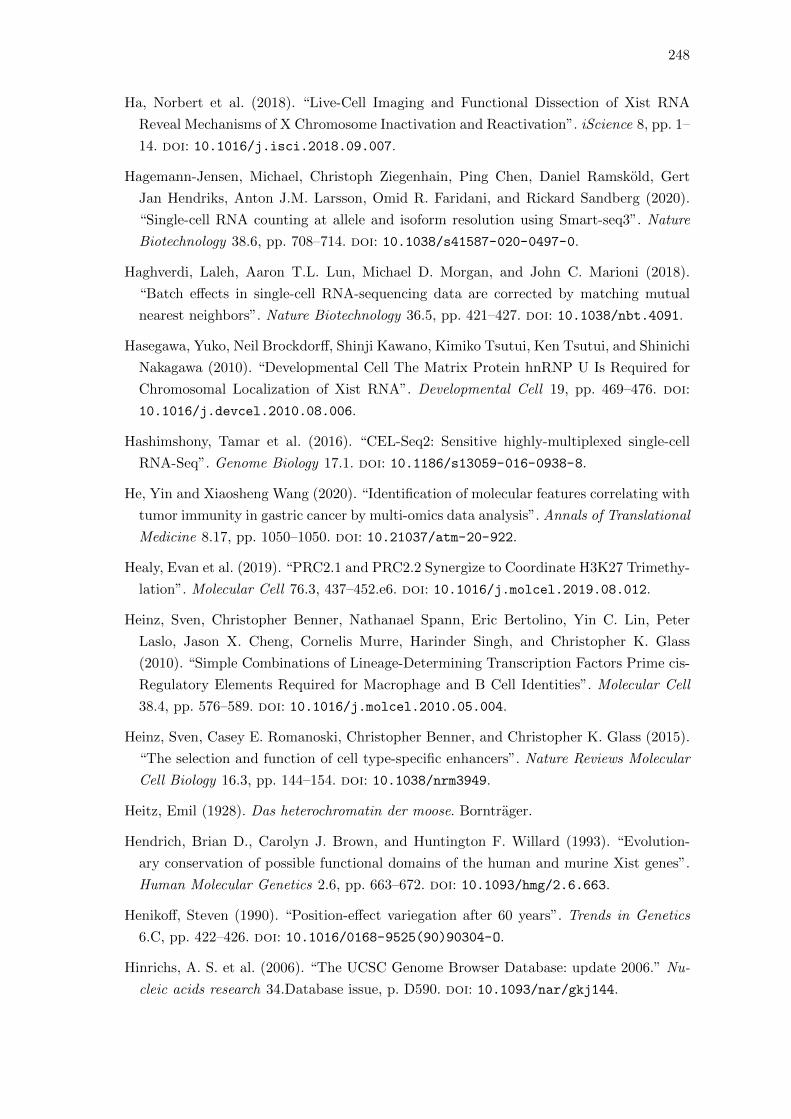
248
Ha, Norbert et al. (2018). “Live-Cell Imaging and Functional Dissection of Xist RNA
Reveal Mechanisms of X Chromosome Inactivation and Reactivation”. iScience 8, pp. 1–
14. doi: 10.1016/j.isci.2018.09.007.
Hagemann-Jensen, Michael, Christoph Ziegenhain, Ping Chen, Daniel Ramskold, Gert
Jan Hendriks, Anton J.M. Larsson, Omid R. Faridani, and Rickard Sandberg (2020).
“Single-cell RNA counting at allele and isoform resolution using Smart-seq3”. Nature
Biotechnology 38.6, pp. 708–714. doi: 10.1038/s41587-020-0497-0.
Haghverdi, Laleh, Aaron T.L. Lun, Michael D. Morgan, and John C. Marioni (2018).
“Batch effects in single-cell RNA-sequencing data are corrected by matching mutual
nearest neighbors”. Nature Biotechnology 36.5, pp. 421–427. doi: 10.1038/nbt.4091.
Hasegawa, Yuko, Neil Brockdorff, Shinji Kawano, Kimiko Tsutui, Ken Tsutui, and Shinichi
Nakagawa (2010). “Developmental Cell The Matrix Protein hnRNP U Is Required for
Chromosomal Localization of Xist RNA”. Developmental Cell 19, pp. 469–476. doi:
10.1016/j.devcel.2010.08.006.
Hashimshony, Tamar et al. (2016). “CEL-Seq2: Sensitive highly-multiplexed single-cell
RNA-Seq”. Genome Biology 17.1. doi: 10.1186/s13059-016-0938-8.
He, Yin and Xiaosheng Wang (2020). “Identification of molecular features correlating with
tumor immunity in gastric cancer by multi-omics data analysis”. Annals of Translational
Medicine 8.17, pp. 1050–1050. doi: 10.21037/atm-20-922.
Healy, Evan et al. (2019). “PRC2.1 and PRC2.2 Synergize to Coordinate H3K27 Trimethy-
lation”. Molecular Cell 76.3, 437–452.e6. doi: 10.1016/j.molcel.2019.08.012.
Heinz, Sven, Christopher Benner, Nathanael Spann, Eric Bertolino, Yin C. Lin, Peter
Laslo, Jason X. Cheng, Cornelis Murre, Harinder Singh, and Christopher K. Glass
(2010). “Simple Combinations of Lineage-Determining Transcription Factors Prime cis-
Regulatory Elements Required for Macrophage and B Cell Identities”. Molecular Cell
38.4, pp. 576–589. doi: 10.1016/j.molcel.2010.05.004.
Heinz, Sven, Casey E. Romanoski, Christopher Benner, and Christopher K. Glass (2015).
“The selection and function of cell type-specific enhancers”. Nature Reviews Molecular
Cell Biology 16.3, pp. 144–154. doi: 10.1038/nrm3949.
Heitz, Emil (1928). Das heterochromatin der moose. Borntrager.
Hendrich, Brian D., Carolyn J. Brown, and Huntington F. Willard (1993). “Evolution-
ary conservation of possible functional domains of the human and murine Xist genes”.
Human Molecular Genetics 2.6, pp. 663–672. doi: 10.1093/hmg/2.6.663.
Henikoff, Steven (1990). “Position-effect variegation after 60 years”. Trends in Genetics
6.C, pp. 422–426. doi: 10.1016/0168-9525(90)90304-O.
Hinrichs, A. S. et al. (2006). “The UCSC Genome Browser Database: update 2006.” Nu-
cleic acids research 34.Database issue, p. D590. doi: 10.1093/nar/gkj144.
249
Hirsh, Jay and Robert Schleif (1973). “In vivo experiments on the mechanism of action of
l-arabinose C gene activator and lactose repressor”. Journal of Molecular Biology 80.3,
pp. 433–444. doi: 10.1016/0022-2836(73)90414-2.
Højfeldt, Jonas Westergaard, Lin Hedehus, Anne Laugesen, Tulin Tatar, Laura Wiehle,
and Kristian Helin (2019). “Non-core Subunits of the PRC2 Complex Are Collectively
Required for Its Target-Site Specificity”. Molecular Cell 76.3, 423–436.e3. doi: 10.1016/
j.molcel.2019.07.031.
Howe, Francoise S., Harry Fischl, Struan C. Murray, and Jane Mellor (2017). “Is H3K4me3
instructive for transcription activation?” BioEssays 39.1, e201600095. doi: 10.1002/
bies.201600095.
Hu, Bin, Naomi Petela, Alexander Kurze, Kok Lung Chan, Christophe Chapard, and Kim
Nasmyth (2015). “Biological chromodynamics: A general method for measuring protein
occupancy across the genome by calibrating ChIP-seq”. Nucleic Acids Research 43.20,
p. 132. doi: 10.1093/nar/gkv670.
Huber, Wolfgang et al. (2015). “Orchestrating high-throughput genomic analysis with
Bioconductor”. Nature Methods 12.2, pp. 115–121. doi: 10.1038/nmeth.3252.
Illumina (2019). NextSeq 500 System Guide (15046563). Tech. rep.
Inoue, Azusa, Lan Jiang, Falong Lu, and Yi Zhang (2017). “Genomic imprinting of Xist
by maternal H3K27me3”. Genes and Development 31.19, pp. 1927–1932. doi: 10.1101/
gad.304113.117.
Iwafuchi-Doi, Makiko, Greg Donahue, Akshay Kakumanu, Jason A. Watts, Shaun Ma-
hony, B. Franklin Pugh, Dolim Lee, Klaus H. Kaestner, and Kenneth S. Zaret (2016).
“The Pioneer Transcription Factor FoxA Maintains an Accessible Nucleosome Configu-
ration at Enhancers for Tissue-Specific Gene Activation”. Molecular Cell 62.1, pp. 79–
91. doi: 10.1016/j.molcel.2016.03.001.
Jackson, James P., Anders M. Lindroth, Xiaofeng Cao, and Steven E. Jacobsen (2002).
“Control of CpNpG DNA methylation by the KRYPTONITE histone H3 methyltrans-
ferase”. Nature 416.6880, pp. 556–560. doi: 10.1038/nature731.
Jacob, Francois and Jacques Monod (1961). “Genetic regulatory mechanisms in the syn-
thesis of proteins”. Journal of Molecular Biology 3.3, pp. 318–356. doi: 10.1016/S0022-
2836(61)80072-7.
Jansz, Natasha et al. (2018a). “Smchd1 regulates long-range chromatin interactions on the
inactive X chromosome and at Hox clusters”. Nature Structural and Molecular Biology
25.9, pp. 766–777. doi: 10.1038/s41594-018-0111-z.
Jansz, Natasha et al. (2018b). “Smchd1 Targeting to the Inactive X Is Dependent on
the Xist-HnrnpK-PRC1 Pathway”. Cell Reports 25.7, 1912–1923.e9. doi: 10.1016/j.
celrep.2018.10.044.
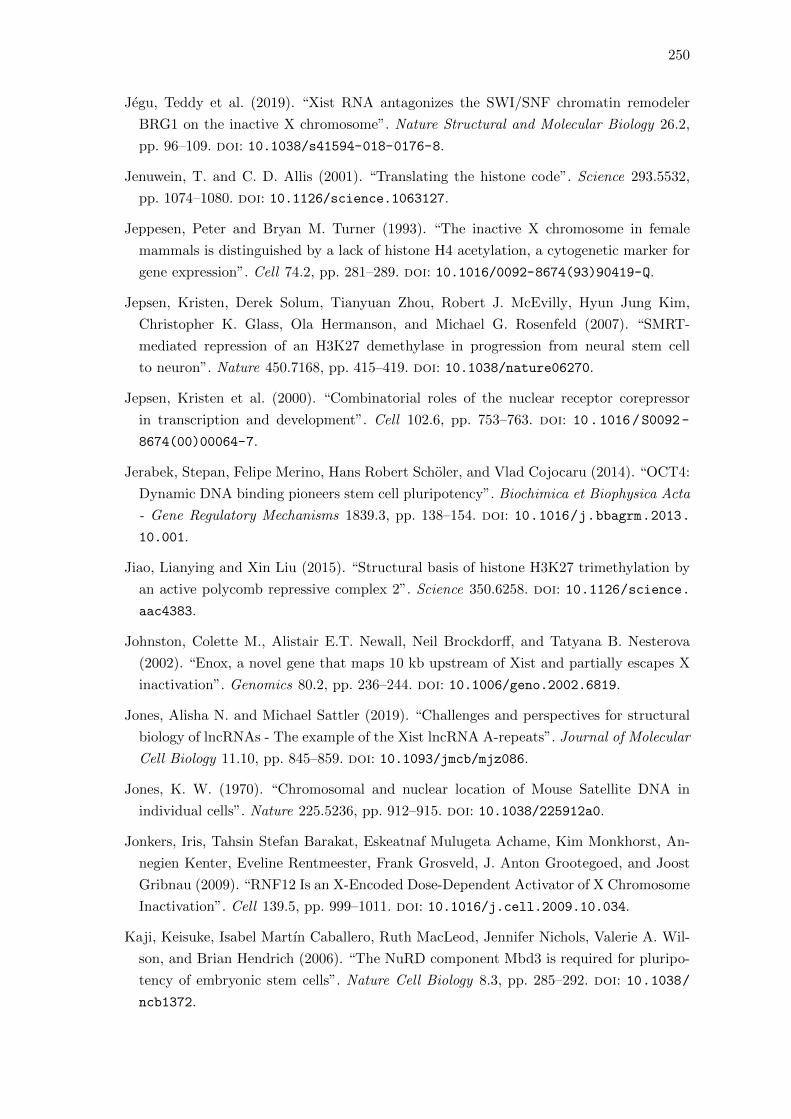
250
Jegu, Teddy et al. (2019). “Xist RNA antagonizes the SWI/SNF chromatin remodeler
BRG1 on the inactive X chromosome”. Nature Structural and Molecular Biology 26.2,
pp. 96–109. doi: 10.1038/s41594-018-0176-8.
Jenuwein, T. and C. D. Allis (2001). “Translating the histone code”. Science 293.5532,
pp. 1074–1080. doi: 10.1126/science.1063127.
Jeppesen, Peter and Bryan M. Turner (1993). “The inactive X chromosome in female
mammals is distinguished by a lack of histone H4 acetylation, a cytogenetic marker for
gene expression”. Cell 74.2, pp. 281–289. doi: 10.1016/0092-8674(93)90419-Q.
Jepsen, Kristen, Derek Solum, Tianyuan Zhou, Robert J. McEvilly, Hyun Jung Kim,
Christopher K. Glass, Ola Hermanson, and Michael G. Rosenfeld (2007). “SMRT-
mediated repression of an H3K27 demethylase in progression from neural stem cell
to neuron”. Nature 450.7168, pp. 415–419. doi: 10.1038/nature06270.
Jepsen, Kristen et al. (2000). “Combinatorial roles of the nuclear receptor corepressor
in transcription and development”. Cell 102.6, pp. 753–763. doi: 10.1016/S0092-
8674(00)00064-7.
Jerabek, Stepan, Felipe Merino, Hans Robert Scholer, and Vlad Cojocaru (2014). “OCT4:
Dynamic DNA binding pioneers stem cell pluripotency”. Biochimica et Biophysica Acta
- Gene Regulatory Mechanisms 1839.3, pp. 138–154. doi: 10.1016/j.bbagrm.2013.
10.001.
Jiao, Lianying and Xin Liu (2015). “Structural basis of histone H3K27 trimethylation by
an active polycomb repressive complex 2”. Science 350.6258. doi: 10.1126/science.
aac4383.
Johnston, Colette M., Alistair E.T. Newall, Neil Brockdorff, and Tatyana B. Nesterova
(2002). “Enox, a novel gene that maps 10 kb upstream of Xist and partially escapes X
inactivation”. Genomics 80.2, pp. 236–244. doi: 10.1006/geno.2002.6819.
Jones, Alisha N. and Michael Sattler (2019). “Challenges and perspectives for structural
biology of lncRNAs - The example of the Xist lncRNA A-repeats”. Journal of Molecular
Cell Biology 11.10, pp. 845–859. doi: 10.1093/jmcb/mjz086.
Jones, K. W. (1970). “Chromosomal and nuclear location of Mouse Satellite DNA in
individual cells”. Nature 225.5236, pp. 912–915. doi: 10.1038/225912a0.
Jonkers, Iris, Tahsin Stefan Barakat, Eskeatnaf Mulugeta Achame, Kim Monkhorst, An-
negien Kenter, Eveline Rentmeester, Frank Grosveld, J. Anton Grootegoed, and Joost
Gribnau (2009). “RNF12 Is an X-Encoded Dose-Dependent Activator of X Chromosome
Inactivation”. Cell 139.5, pp. 999–1011. doi: 10.1016/j.cell.2009.10.034.
Kaji, Keisuke, Isabel Martın Caballero, Ruth MacLeod, Jennifer Nichols, Valerie A. Wil-
son, and Brian Hendrich (2006). “The NuRD component Mbd3 is required for pluripo-
tency of embryonic stem cells”. Nature Cell Biology 8.3, pp. 285–292. doi: 10.1038/
ncb1372.
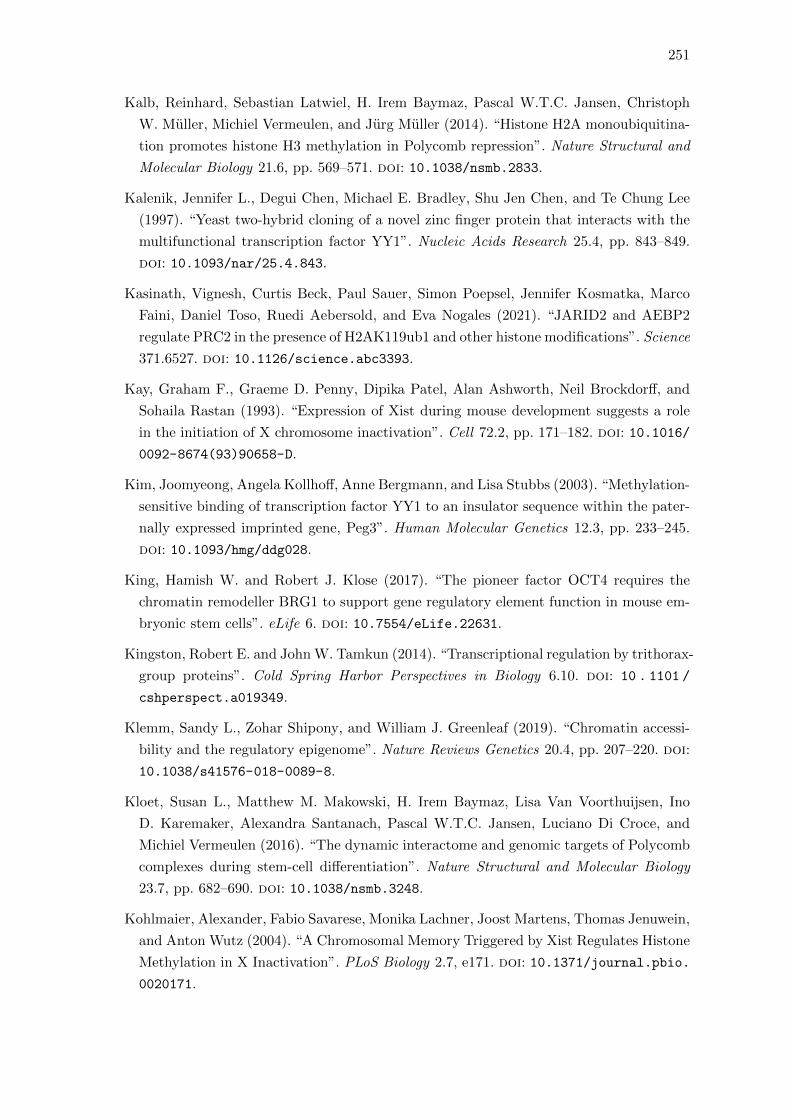
251
Kalb, Reinhard, Sebastian Latwiel, H. Irem Baymaz, Pascal W.T.C. Jansen, Christoph
W. Muller, Michiel Vermeulen, and Jurg Muller (2014). “Histone H2A monoubiquitina-
tion promotes histone H3 methylation in Polycomb repression”. Nature Structural and
Molecular Biology 21.6, pp. 569–571. doi: 10.1038/nsmb.2833.
Kalenik, Jennifer L., Degui Chen, Michael E. Bradley, Shu Jen Chen, and Te Chung Lee
(1997). “Yeast two-hybrid cloning of a novel zinc finger protein that interacts with the
multifunctional transcription factor YY1”. Nucleic Acids Research 25.4, pp. 843–849.
doi: 10.1093/nar/25.4.843.
Kasinath, Vignesh, Curtis Beck, Paul Sauer, Simon Poepsel, Jennifer Kosmatka, Marco
Faini, Daniel Toso, Ruedi Aebersold, and Eva Nogales (2021). “JARID2 and AEBP2
regulate PRC2 in the presence of H2AK119ub1 and other histone modifications”. Science
371.6527. doi: 10.1126/science.abc3393.
Kay, Graham F., Graeme D. Penny, Dipika Patel, Alan Ashworth, Neil Brockdorff, and
Sohaila Rastan (1993). “Expression of Xist during mouse development suggests a role
in the initiation of X chromosome inactivation”. Cell 72.2, pp. 171–182. doi: 10.1016/
0092-8674(93)90658-D.
Kim, Joomyeong, Angela Kollhoff, Anne Bergmann, and Lisa Stubbs (2003). “Methylation-
sensitive binding of transcription factor YY1 to an insulator sequence within the pater-
nally expressed imprinted gene, Peg3”. Human Molecular Genetics 12.3, pp. 233–245.
doi: 10.1093/hmg/ddg028.
King, Hamish W. and Robert J. Klose (2017). “The pioneer factor OCT4 requires the
chromatin remodeller BRG1 to support gene regulatory element function in mouse em-
bryonic stem cells”. eLife 6. doi: 10.7554/eLife.22631.
Kingston, Robert E. and John W. Tamkun (2014). “Transcriptional regulation by trithorax-
group proteins”. Cold Spring Harbor Perspectives in Biology 6.10. doi: 10 . 1101 /
cshperspect.a019349.
Klemm, Sandy L., Zohar Shipony, and William J. Greenleaf (2019). “Chromatin accessi-
bility and the regulatory epigenome”. Nature Reviews Genetics 20.4, pp. 207–220. doi:
10.1038/s41576-018-0089-8.
Kloet, Susan L., Matthew M. Makowski, H. Irem Baymaz, Lisa Van Voorthuijsen, Ino
D. Karemaker, Alexandra Santanach, Pascal W.T.C. Jansen, Luciano Di Croce, and
Michiel Vermeulen (2016). “The dynamic interactome and genomic targets of Polycomb
complexes during stem-cell differentiation”. Nature Structural and Molecular Biology
23.7, pp. 682–690. doi: 10.1038/nsmb.3248.
Kohlmaier, Alexander, Fabio Savarese, Monika Lachner, Joost Martens, Thomas Jenuwein,
and Anton Wutz (2004). “A Chromosomal Memory Triggered by Xist Regulates Histone
Methylation in X Inactivation”. PLoS Biology 2.7, e171. doi: 10.1371/journal.pbio.
0020171.
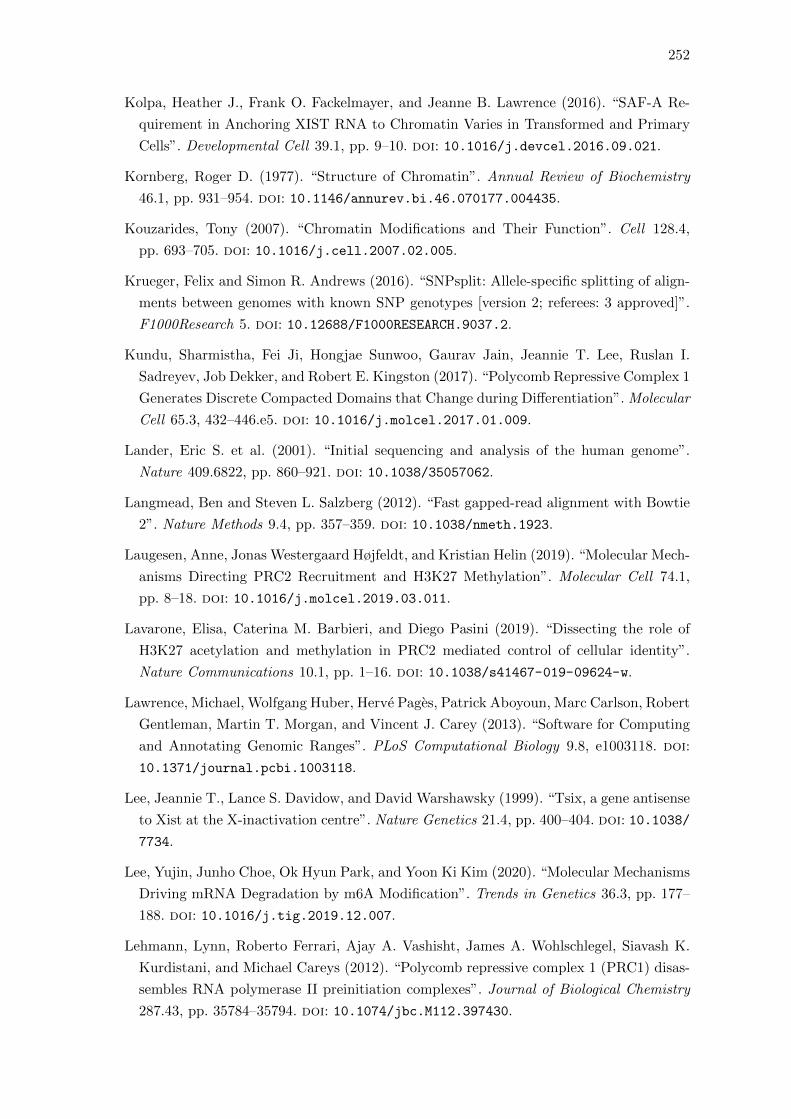
252
Kolpa, Heather J., Frank O. Fackelmayer, and Jeanne B. Lawrence (2016). “SAF-A Re-
quirement in Anchoring XIST RNA to Chromatin Varies in Transformed and Primary
Cells”. Developmental Cell 39.1, pp. 9–10. doi: 10.1016/j.devcel.2016.09.021.
Kornberg, Roger D. (1977). “Structure of Chromatin”. Annual Review of Biochemistry
46.1, pp. 931–954. doi: 10.1146/annurev.bi.46.070177.004435.
Kouzarides, Tony (2007). “Chromatin Modifications and Their Function”. Cell 128.4,
pp. 693–705. doi: 10.1016/j.cell.2007.02.005.
Krueger, Felix and Simon R. Andrews (2016). “SNPsplit: Allele-specific splitting of align-
ments between genomes with known SNP genotypes [version 2; referees: 3 approved]”.
F1000Research 5. doi: 10.12688/F1000RESEARCH.9037.2.
Kundu, Sharmistha, Fei Ji, Hongjae Sunwoo, Gaurav Jain, Jeannie T. Lee, Ruslan I.
Sadreyev, Job Dekker, and Robert E. Kingston (2017). “Polycomb Repressive Complex 1
Generates Discrete Compacted Domains that Change during Differentiation”. Molecular
Cell 65.3, 432–446.e5. doi: 10.1016/j.molcel.2017.01.009.
Lander, Eric S. et al. (2001). “Initial sequencing and analysis of the human genome”.
Nature 409.6822, pp. 860–921. doi: 10.1038/35057062.
Langmead, Ben and Steven L. Salzberg (2012). “Fast gapped-read alignment with Bowtie
2”. Nature Methods 9.4, pp. 357–359. doi: 10.1038/nmeth.1923.
Laugesen, Anne, Jonas Westergaard Højfeldt, and Kristian Helin (2019). “Molecular Mech-
anisms Directing PRC2 Recruitment and H3K27 Methylation”. Molecular Cell 74.1,
pp. 8–18. doi: 10.1016/j.molcel.2019.03.011.
Lavarone, Elisa, Caterina M. Barbieri, and Diego Pasini (2019). “Dissecting the role of
H3K27 acetylation and methylation in PRC2 mediated control of cellular identity”.
Nature Communications 10.1, pp. 1–16. doi: 10.1038/s41467-019-09624-w.
Lawrence, Michael, Wolfgang Huber, Herve Pages, Patrick Aboyoun, Marc Carlson, Robert
Gentleman, Martin T. Morgan, and Vincent J. Carey (2013). “Software for Computing
and Annotating Genomic Ranges”. PLoS Computational Biology 9.8, e1003118. doi:
10.1371/journal.pcbi.1003118.
Lee, Jeannie T., Lance S. Davidow, and David Warshawsky (1999). “Tsix, a gene antisense
to Xist at the X-inactivation centre”. Nature Genetics 21.4, pp. 400–404. doi: 10.1038/
7734.
Lee, Yujin, Junho Choe, Ok Hyun Park, and Yoon Ki Kim (2020). “Molecular Mechanisms
Driving mRNA Degradation by m6A Modification”. Trends in Genetics 36.3, pp. 177–
188. doi: 10.1016/j.tig.2019.12.007.
Lehmann, Lynn, Roberto Ferrari, Ajay A. Vashisht, James A. Wohlschlegel, Siavash K.
Kurdistani, and Michael Careys (2012). “Polycomb repressive complex 1 (PRC1) disas-
sembles RNA polymerase II preinitiation complexes”. Journal of Biological Chemistry
287.43, pp. 35784–35794. doi: 10.1074/jbc.M112.397430.
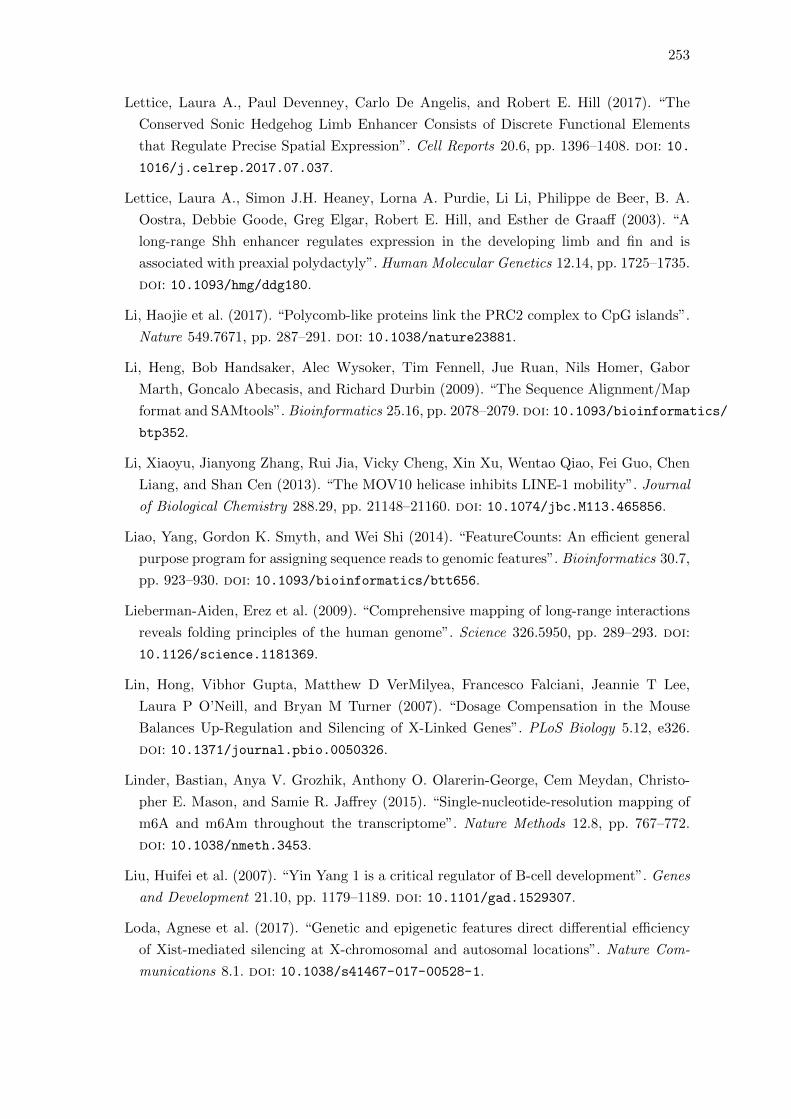
253
Lettice, Laura A., Paul Devenney, Carlo De Angelis, and Robert E. Hill (2017). “The
Conserved Sonic Hedgehog Limb Enhancer Consists of Discrete Functional Elements
that Regulate Precise Spatial Expression”. Cell Reports 20.6, pp. 1396–1408. doi: 10.
1016/j.celrep.2017.07.037.
Lettice, Laura A., Simon J.H. Heaney, Lorna A. Purdie, Li Li, Philippe de Beer, B. A.
Oostra, Debbie Goode, Greg Elgar, Robert E. Hill, and Esther de Graaff (2003). “A
long-range Shh enhancer regulates expression in the developing limb and fin and is
associated with preaxial polydactyly”. Human Molecular Genetics 12.14, pp. 1725–1735.
doi: 10.1093/hmg/ddg180.
Li, Haojie et al. (2017). “Polycomb-like proteins link the PRC2 complex to CpG islands”.
Nature 549.7671, pp. 287–291. doi: 10.1038/nature23881.
Li, Heng, Bob Handsaker, Alec Wysoker, Tim Fennell, Jue Ruan, Nils Homer, Gabor
Marth, Goncalo Abecasis, and Richard Durbin (2009). “The Sequence Alignment/Map
format and SAMtools”. Bioinformatics 25.16, pp. 2078–2079. doi: 10.1093/bioinformatics/
btp352.
Li, Xiaoyu, Jianyong Zhang, Rui Jia, Vicky Cheng, Xin Xu, Wentao Qiao, Fei Guo, Chen
Liang, and Shan Cen (2013). “The MOV10 helicase inhibits LINE-1 mobility”. Journal
of Biological Chemistry 288.29, pp. 21148–21160. doi: 10.1074/jbc.M113.465856.
Liao, Yang, Gordon K. Smyth, and Wei Shi (2014). “FeatureCounts: An efficient general
purpose program for assigning sequence reads to genomic features”. Bioinformatics 30.7,
pp. 923–930. doi: 10.1093/bioinformatics/btt656.
Lieberman-Aiden, Erez et al. (2009). “Comprehensive mapping of long-range interactions
reveals folding principles of the human genome”. Science 326.5950, pp. 289–293. doi:
10.1126/science.1181369.
Lin, Hong, Vibhor Gupta, Matthew D VerMilyea, Francesco Falciani, Jeannie T Lee,
Laura P O’Neill, and Bryan M Turner (2007). “Dosage Compensation in the Mouse
Balances Up-Regulation and Silencing of X-Linked Genes”. PLoS Biology 5.12, e326.
doi: 10.1371/journal.pbio.0050326.
Linder, Bastian, Anya V. Grozhik, Anthony O. Olarerin-George, Cem Meydan, Christo-
pher E. Mason, and Samie R. Jaffrey (2015). “Single-nucleotide-resolution mapping of
m6A and m6Am throughout the transcriptome”. Nature Methods 12.8, pp. 767–772.
doi: 10.1038/nmeth.3453.
Liu, Huifei et al. (2007). “Yin Yang 1 is a critical regulator of B-cell development”. Genes
and Development 21.10, pp. 1179–1189. doi: 10.1101/gad.1529307.
Loda, Agnese et al. (2017). “Genetic and epigenetic features direct differential efficiency
of Xist-mediated silencing at X-chromosomal and autosomal locations”. Nature Com-
munications 8.1. doi: 10.1038/s41467-017-00528-1.
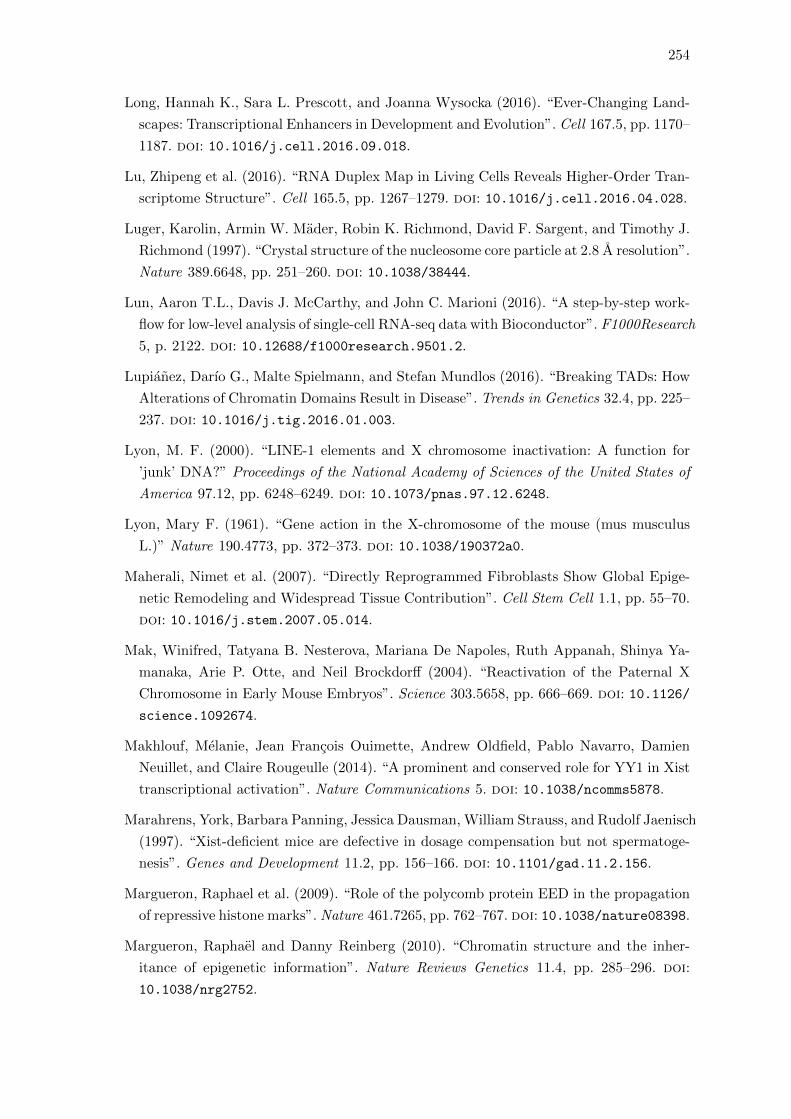
254
Long, Hannah K., Sara L. Prescott, and Joanna Wysocka (2016). “Ever-Changing Land-
scapes: Transcriptional Enhancers in Development and Evolution”. Cell 167.5, pp. 1170–
1187. doi: 10.1016/j.cell.2016.09.018.
Lu, Zhipeng et al. (2016). “RNA Duplex Map in Living Cells Reveals Higher-Order Tran-
scriptome Structure”. Cell 165.5, pp. 1267–1279. doi: 10.1016/j.cell.2016.04.028.
Luger, Karolin, Armin W. Mader, Robin K. Richmond, David F. Sargent, and Timothy J.
Richmond (1997). “Crystal structure of the nucleosome core particle at 2.8 A resolution”.
Nature 389.6648, pp. 251–260. doi: 10.1038/38444.
Lun, Aaron T.L., Davis J. McCarthy, and John C. Marioni (2016). “A step-by-step work-
flow for low-level analysis of single-cell RNA-seq data with Bioconductor”. F1000Research
5, p. 2122. doi: 10.12688/f1000research.9501.2.
Lupianez, Darıo G., Malte Spielmann, and Stefan Mundlos (2016). “Breaking TADs: How
Alterations of Chromatin Domains Result in Disease”. Trends in Genetics 32.4, pp. 225–
237. doi: 10.1016/j.tig.2016.01.003.
Lyon, M. F. (2000). “LINE-1 elements and X chromosome inactivation: A function for
’junk’ DNA?” Proceedings of the National Academy of Sciences of the United States of
America 97.12, pp. 6248–6249. doi: 10.1073/pnas.97.12.6248.
Lyon, Mary F. (1961). “Gene action in the X-chromosome of the mouse (mus musculus
L.)” Nature 190.4773, pp. 372–373. doi: 10.1038/190372a0.
Maherali, Nimet et al. (2007). “Directly Reprogrammed Fibroblasts Show Global Epige-
netic Remodeling and Widespread Tissue Contribution”. Cell Stem Cell 1.1, pp. 55–70.
doi: 10.1016/j.stem.2007.05.014.
Mak, Winifred, Tatyana B. Nesterova, Mariana De Napoles, Ruth Appanah, Shinya Ya-
manaka, Arie P. Otte, and Neil Brockdorff (2004). “Reactivation of the Paternal X
Chromosome in Early Mouse Embryos”. Science 303.5658, pp. 666–669. doi: 10.1126/
science.1092674.
Makhlouf, Melanie, Jean Francois Ouimette, Andrew Oldfield, Pablo Navarro, Damien
Neuillet, and Claire Rougeulle (2014). “A prominent and conserved role for YY1 in Xist
transcriptional activation”. Nature Communications 5. doi: 10.1038/ncomms5878.
Marahrens, York, Barbara Panning, Jessica Dausman, William Strauss, and Rudolf Jaenisch
(1997). “Xist-deficient mice are defective in dosage compensation but not spermatoge-
nesis”. Genes and Development 11.2, pp. 156–166. doi: 10.1101/gad.11.2.156.
Margueron, Raphael et al. (2009). “Role of the polycomb protein EED in the propagation
of repressive histone marks”. Nature 461.7265, pp. 762–767. doi: 10.1038/nature08398.
Margueron, Raphael and Danny Reinberg (2010). “Chromatin structure and the inher-
itance of epigenetic information”. Nature Reviews Genetics 11.4, pp. 285–296. doi:
10.1038/nrg2752.
255
Markaki, Yolanda et al. (2020). “Xist-seeded nucleation sites form local concentration gra-
dients of silencing proteins to inactivate the X-chromosome”. bioRxiv, p. 2020.11.22.393546.
doi: 10.1101/2020.11.22.393546.
Marks, Hendrik et al. (2015). “Dynamics of gene silencing during X inactivation using
allele-specific RNA-seq”. Genome Biology 16.1, p. 149. doi: 10.1186/s13059-015-
0698-x.
Martin, Cyrus and Yi Zhang (2005). “The diverse functions of histone lysine methylation”.
Nature Reviews Molecular Cell Biology 6.11, pp. 838–849. doi: 10.1038/nrm1761.
McCarthy, Davis J., Kieran R. Campbell, Aaron T. L. Lun, and Quin F. Wills (2017).
“Scater: pre-processing, quality control, normalization and visualization of single-cell
RNA-seq data in R”. Bioinformatics 33.8, btw777. doi: 10.1093/bioinformatics/
btw777.
McClintock, Barbara (1956). “Controlling elements and the gene.” Cold Spring Harbor
symposia on quantitative biology 21, pp. 197–216. doi: 10.1101/SQB.1956.021.01.017.
McHugh, Colleen A. et al. (2015). “The Xist lncRNA interacts directly with SHARP to
silence transcription through HDAC3”. Nature 521.7551, pp. 232–236. doi: 10.1038/
nature14443.
Melnikov, Alexandre et al. (2012). “Systematic dissection and optimization of inducible en-
hancers in human cells using a massively parallel reporter assay”. Nature Biotechnology
30.3, pp. 271–277. doi: 10.1038/nbt.2137.
Meng, Ying, Yang Liu, Eleni Dakou, Gustavo J. Gutierrez, and Luc Leyns (2020). “Poly-
comb group RING finger protein 5 influences several developmental signaling pathways
during the in vitro differentiation of mouse embryonic stem cells”. Development, Growth
& Differentiation 62.4, pp. 232–242. doi: 10.1111/dgd.12659.
Meyer, Kate D., Yogesh Saletore, Paul Zumbo, Olivier Elemento, Christopher E. Mason,
and Samie R. Jaffrey (2012). “Comprehensive analysis of mRNA methylation reveals
enrichment in 3 UTRs and near stop codons”. Cell 149.7, pp. 1635–1646. doi: 10.1016/
j.cell.2012.05.003.
Mikami, Suzuka, Teppei Kanaba, Naoki Takizawa, Ayaho Kobayashi, Ryoko Maesaki,
Toshinobu Fujiwara, Yutaka Ito, and Masaki Mishima (2014). “Structural insights into
the recruitment of SMRT by the corepressor SHARP under phosphorylative regulation”.
Structure 22.1, pp. 35–46. doi: 10.1016/j.str.2013.10.007.
Miller, Trissa, Nevan J. Krogan, Jim Dover, H. Erdjument-Bromage, Paul Tempst, Mark
Johnston, Jack F. Greenblatt, and Ali Shilatifard (2001). “COMPASS: A complex of
proteins associated with a trithorax-related SET domain protein”. Proceedings of the
National Academy of Sciences of the United States of America 98.23, pp. 12902–12907.
doi: 10.1073/pnas.231473398.
256
Minajigi, A. et al. (2015). “A comprehensive Xist interactome reveals cohesin repulsion
and an RNA-directed chromosome conformation”. Science 349.6245, aab2276–aab2276.
doi: 10.1126/science.aab2276.
Minkovsky, Alissa, Tahsin Stefan Barakat, Nadia Sellami, Mark Henry Chin, Nilhan Gun-
hanlar, Joost Gribnau, and Kathrin Plath (2013). “The pluripotency factor-bound in-
tron 1 of xist is dispensable for X chromosome inactivation and reactivation In Vitro
and In Vivo”. Cell Reports 3.3, pp. 905–918. doi: 10.1016/j.celrep.2013.02.018.
Minkovsky, Alissa, Sanjeet Patel, and Kathrin Plath (2012). “Concise Review: Pluripo-
tency and the Transcriptional Inactivation of the Female Mammalian X Chromosome”.
STEM CELLS 30.1, pp. 48–54. doi: 10.1002/stem.755.
Moindrot, Benoit, Andrea Cerase, Heather Coker, Osamu Masui, Anne Grijzenhout, Greta
Pintacuda, Lothar Schermelleh, Tatyana B. Nesterova, and Neil Brockdorff (2015). “A
Pooled shRNA Screen Identifies Rbm15, Spen, and Wtap as Factors Required for Xist
RNA-Mediated Silencing”. Cell Reports 12.4, pp. 562–572. doi: 10.1016/j.celrep.
2015.06.053.
Monfort, Asun, Giulio Di Minin, Andreas Postlmayr, Remo Freimann, Fabiana Arieti,
Stephane Thore, and Anton Wutz (2015). “Identification of Spen as a crucial factor for
Xist function through forward genetic screening in haploid embryonic stem cells”. Cell
Reports 12.4, pp. 554–561. doi: 10.1016/j.celrep.2015.06.067.
Morgan, Marc A.J. and Ali Shilatifard (2020). “Reevaluating the roles of histone-modifying
enzymes and their associated chromatin modifications in transcriptional regulation”.
Nature Genetics 52.12, pp. 1271–1281. doi: 10.1038/s41588-020-00736-4.
Moussa, Hagar F. et al. (2019). “Canonical PRC1 controls sequence-independent propa-
gation of Polycomb-mediated gene silencing”. Nature Communications 10.1. doi: 10.
1038/s41467-019-09628-6.
Muller, Hermann J. (1914). “A gene for the fourth chromosome of Drosophila”. Journal
of Experimental Zoology 17.3, pp. 325–336. doi: 10.1002/jez.1400170303.
Muller, Hermann J. (1930). “Types of visible variations induced by X-rays in Drosophila”.
Journal of Genetics 22.3, pp. 299–334. doi: 10.1007/BF02984195.
Mumbach, Maxwell R., Adam J. Rubin, Ryan A. Flynn, Chao Dai, Paul A. Khavari,
William J. Greenleaf, and Howard Y. Chang (2016). “HiChIP: Efficient and sensitive
analysis of protein-directed genome architecture”. Nature Methods 13.11, pp. 919–922.
doi: 10.1038/nmeth.3999.
Mutzel, Verena, Ikuhiro Okamoto, Ilona Dunkel, Mitinori Saitou, Luca Giorgetti, Edith
Heard, and Edda G. Schulz (2019). “A symmetric toggle switch explains the onset of
random X inactivation in different mammals”. Nature Structural and Molecular Biology
26.5, pp. 350–360. doi: 10.1038/s41594-019-0214-1.
257
Nabet, Behnam et al. (2018). “The dTAG system for immediate and target-specific protein
degradation”. Nature Chemical Biology 14.5, pp. 431–441. doi: 10.1038/s41589-018-
0021-8.
Najm, Fadi J. et al. (2018). “Orthologous CRISPR-Cas9 enzymes for combinatorial genetic
screens”. Nature Biotechnology 36.2, pp. 179–189. doi: 10.1038/nbt.4048.
Najm, Juliane et al. (2008). “Mutations of CASK cause an X-linked brain malformation
phenotype with microcephaly and hypoplasia of the brainstem and cerebellum”. Nature
Genetics 40.9, pp. 1065–1067. doi: 10.1038/ng.194.
Nakabachi, Atsushi, Atsushi Yamashita, Hidehiro Toh, Hajime Ishikawa, Helen E. Dun-
bar, Nancy A. Moran, and Masahira Hattori (2006). “The 160-kilobase genome of the
bacterial endosymbiont Carsonella”. Science 314.5797, p. 267. doi: 10.1126/science.
1134196.
Nakamoto, Meagan Y., Nickolaus C. Lammer, Robert T. Batey, and Deborah S. Wut-
tke (2020). “HnRNPK recognition of the B motif of Xist and other biological RNAs”.
Nucleic Acids Research 48.16, pp. 9320–9335. doi: 10.1093/nar/gkaa677.
Napoles, Mariana de et al. (2004). “Polycomb Group Proteins Ring1A/B Link Ubiquity-
lation of Histone H2A to Heritable Gene Silencing and X Inactivation”. Developmental
Cell 7.5, pp. 663–676. doi: 10.1016/j.devcel.2004.10.005.
Navarro, Pablo, Ian Chambers, Violetta Karwacki-Neisius, Corinne Chureau, Celine Morey,
Claire Rougeulle, and Philip Avner (2008). “Molecular coupling of Xist regulation and
pluripotency”. Science 321.5896, pp. 1693–1695. doi: 10.1126/science.1160952.
Navarro, Pablo, Andrew Oldfield, Julie Legoupi, Nicola Festuccia, Agnes Dubois, Mikael
Attia, Jon Schoorlemmer, Claire Rougeulle, Ian Chambers, and Philip Avner (2010).
“Molecular coupling of Tsix regulation and pluripotency”. Nature 468.7322, pp. 457–
460. doi: 10.1038/nature09496.
Nesterova, Tatyana B., Sergey Ya Slobodyanyuk, Eugene A. Elisaphenko, Alexander I.
Shevchenko, Colette Johnston, Marina E. Pavlova, Igor B. Rogozin, Nikolay N. Kolesnikov,
Neil Brockdorff, and Suren M. Zakian (2001). “Characterization of the genomic Xist
locus in rodents reveals conservation of overall gene structure and tandem repeats
but rapid evolution of unique sequence”. Genome Research 11.5, pp. 833–849. doi:
10.1101/gr.174901.
Nesterova, Tatyana B. et al. (2019). “Systematic allelic analysis defines the interplay of
key pathways in X chromosome inactivation”. Nature Communications 10.1, pp. 1–15.
doi: 10.1038/s41467-019-11171-3.
Ng, Karen, Nathalie Daigle, Aurelien Bancaud, Tatsuya Ohhata, Peter Humphreys, Rachael
Walker, Jan Ellenberg, and Anton Wutz (2011). “A system for imaging the regulatory
noncoding Xist RNA in living mouse embryonic stem cells”. Molecular Biology of the
Cell 22.14, pp. 2634–2645. doi: 10.1091/mbc.E11-02-0146.
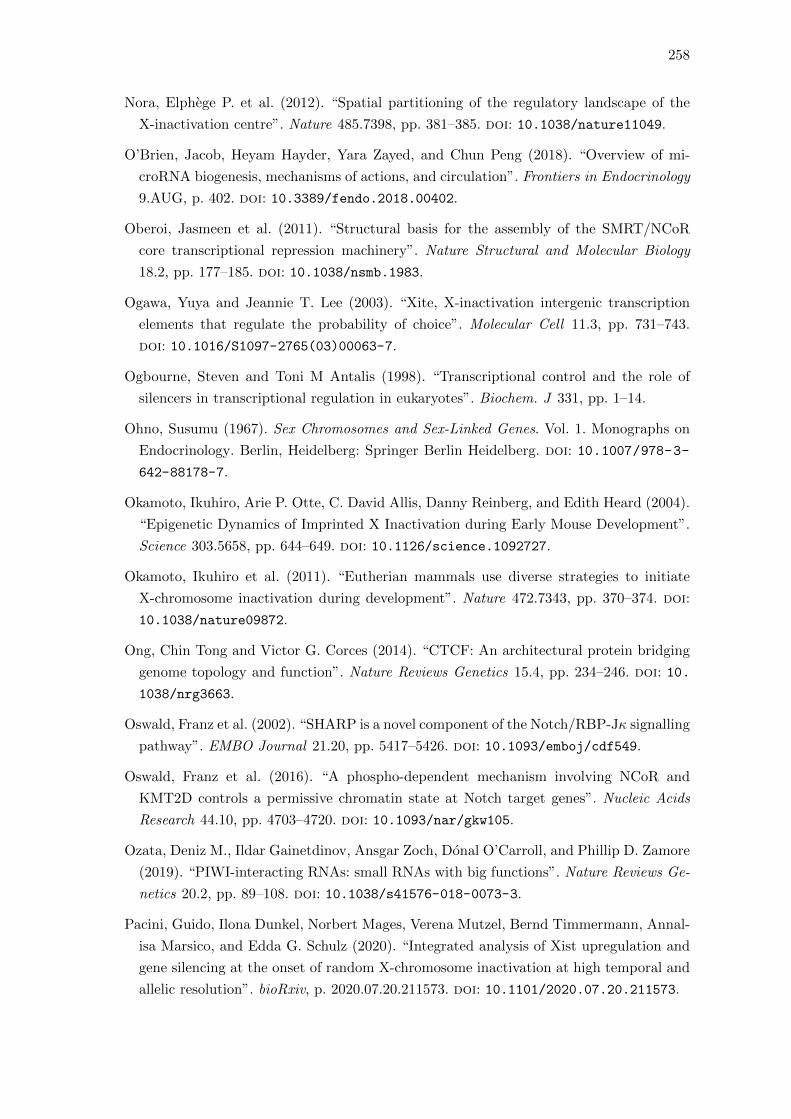
258
Nora, Elphege P. et al. (2012). “Spatial partitioning of the regulatory landscape of the
X-inactivation centre”. Nature 485.7398, pp. 381–385. doi: 10.1038/nature11049.
O’Brien, Jacob, Heyam Hayder, Yara Zayed, and Chun Peng (2018). “Overview of mi-
croRNA biogenesis, mechanisms of actions, and circulation”. Frontiers in Endocrinology
9.AUG, p. 402. doi: 10.3389/fendo.2018.00402.
Oberoi, Jasmeen et al. (2011). “Structural basis for the assembly of the SMRT/NCoR
core transcriptional repression machinery”. Nature Structural and Molecular Biology
18.2, pp. 177–185. doi: 10.1038/nsmb.1983.
Ogawa, Yuya and Jeannie T. Lee (2003). “Xite, X-inactivation intergenic transcription
elements that regulate the probability of choice”. Molecular Cell 11.3, pp. 731–743.
doi: 10.1016/S1097-2765(03)00063-7.
Ogbourne, Steven and Toni M Antalis (1998). “Transcriptional control and the role of
silencers in transcriptional regulation in eukaryotes”. Biochem. J 331, pp. 1–14.
Ohno, Susumu (1967). Sex Chromosomes and Sex-Linked Genes. Vol. 1. Monographs on
Endocrinology. Berlin, Heidelberg: Springer Berlin Heidelberg. doi: 10.1007/978-3-
642-88178-7.
Okamoto, Ikuhiro, Arie P. Otte, C. David Allis, Danny Reinberg, and Edith Heard (2004).
“Epigenetic Dynamics of Imprinted X Inactivation during Early Mouse Development”.
Science 303.5658, pp. 644–649. doi: 10.1126/science.1092727.
Okamoto, Ikuhiro et al. (2011). “Eutherian mammals use diverse strategies to initiate
X-chromosome inactivation during development”. Nature 472.7343, pp. 370–374. doi:
10.1038/nature09872.
Ong, Chin Tong and Victor G. Corces (2014). “CTCF: An architectural protein bridging
genome topology and function”. Nature Reviews Genetics 15.4, pp. 234–246. doi: 10.
1038/nrg3663.
Oswald, Franz et al. (2002). “SHARP is a novel component of the Notch/RBP-Jκ signalling
pathway”. EMBO Journal 21.20, pp. 5417–5426. doi: 10.1093/emboj/cdf549.
Oswald, Franz et al. (2016). “A phospho-dependent mechanism involving NCoR and
KMT2D controls a permissive chromatin state at Notch target genes”. Nucleic Acids
Research 44.10, pp. 4703–4720. doi: 10.1093/nar/gkw105.
Ozata, Deniz M., Ildar Gainetdinov, Ansgar Zoch, Donal O’Carroll, and Phillip D. Zamore
(2019). “PIWI-interacting RNAs: small RNAs with big functions”. Nature Reviews Ge-
netics 20.2, pp. 89–108. doi: 10.1038/s41576-018-0073-3.
Pacini, Guido, Ilona Dunkel, Norbert Mages, Verena Mutzel, Bernd Timmermann, Annal-
isa Marsico, and Edda G. Schulz (2020). “Integrated analysis of Xist upregulation and
gene silencing at the onset of random X-chromosome inactivation at high temporal and
allelic resolution”. bioRxiv, p. 2020.07.20.211573. doi: 10.1101/2020.07.20.211573.
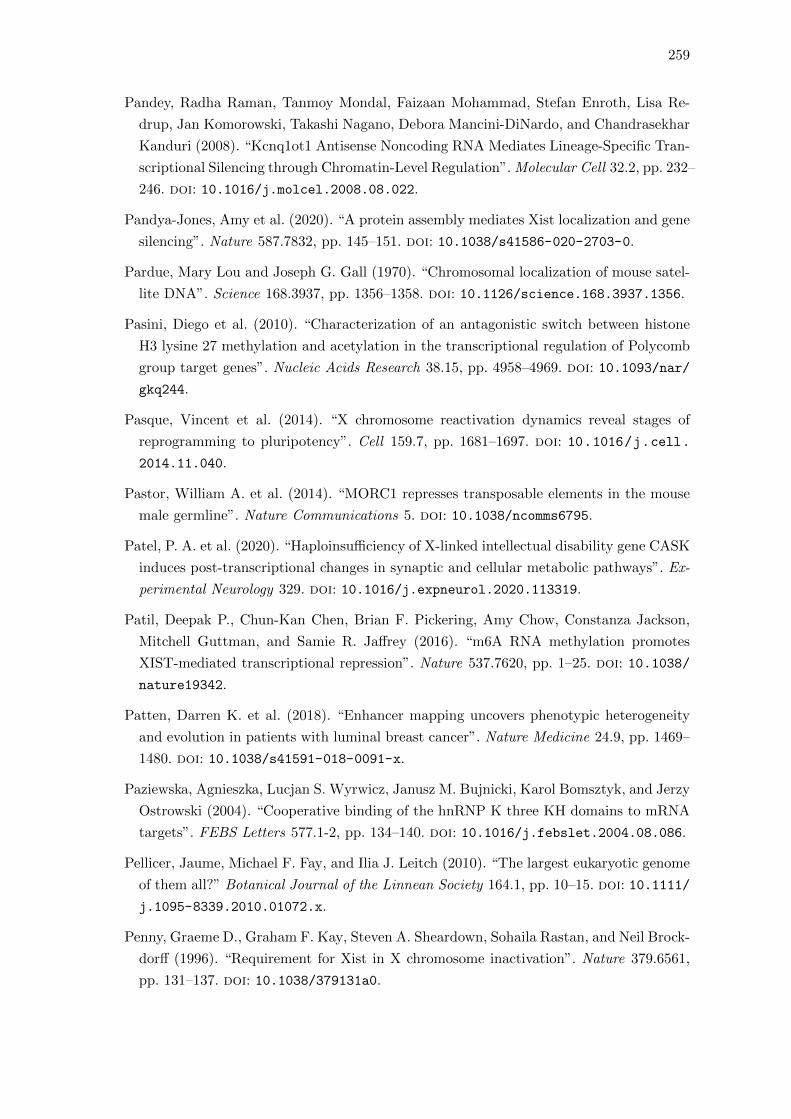
259
Pandey, Radha Raman, Tanmoy Mondal, Faizaan Mohammad, Stefan Enroth, Lisa Re-
drup, Jan Komorowski, Takashi Nagano, Debora Mancini-DiNardo, and Chandrasekhar
Kanduri (2008). “Kcnq1ot1 Antisense Noncoding RNA Mediates Lineage-Specific Tran-
scriptional Silencing through Chromatin-Level Regulation”. Molecular Cell 32.2, pp. 232–
246. doi: 10.1016/j.molcel.2008.08.022.
Pandya-Jones, Amy et al. (2020). “A protein assembly mediates Xist localization and gene
silencing”. Nature 587.7832, pp. 145–151. doi: 10.1038/s41586-020-2703-0.
Pardue, Mary Lou and Joseph G. Gall (1970). “Chromosomal localization of mouse satel-
lite DNA”. Science 168.3937, pp. 1356–1358. doi: 10.1126/science.168.3937.1356.
Pasini, Diego et al. (2010). “Characterization of an antagonistic switch between histone
H3 lysine 27 methylation and acetylation in the transcriptional regulation of Polycomb
group target genes”. Nucleic Acids Research 38.15, pp. 4958–4969. doi: 10.1093/nar/
gkq244.
Pasque, Vincent et al. (2014). “X chromosome reactivation dynamics reveal stages of
reprogramming to pluripotency”. Cell 159.7, pp. 1681–1697. doi: 10.1016/j.cell.
2014.11.040.
Pastor, William A. et al. (2014). “MORC1 represses transposable elements in the mouse
male germline”. Nature Communications 5. doi: 10.1038/ncomms6795.
Patel, P. A. et al. (2020). “Haploinsufficiency of X-linked intellectual disability gene CASK
induces post-transcriptional changes in synaptic and cellular metabolic pathways”. Ex-
perimental Neurology 329. doi: 10.1016/j.expneurol.2020.113319.
Patil, Deepak P., Chun-Kan Chen, Brian F. Pickering, Amy Chow, Constanza Jackson,
Mitchell Guttman, and Samie R. Jaffrey (2016). “m6A RNA methylation promotes
XIST-mediated transcriptional repression”. Nature 537.7620, pp. 1–25. doi: 10.1038/
nature19342.
Patten, Darren K. et al. (2018). “Enhancer mapping uncovers phenotypic heterogeneity
and evolution in patients with luminal breast cancer”. Nature Medicine 24.9, pp. 1469–
1480. doi: 10.1038/s41591-018-0091-x.
Paziewska, Agnieszka, Lucjan S. Wyrwicz, Janusz M. Bujnicki, Karol Bomsztyk, and Jerzy
Ostrowski (2004). “Cooperative binding of the hnRNP K three KH domains to mRNA
targets”. FEBS Letters 577.1-2, pp. 134–140. doi: 10.1016/j.febslet.2004.08.086.
Pellicer, Jaume, Michael F. Fay, and Ilia J. Leitch (2010). “The largest eukaryotic genome
of them all?” Botanical Journal of the Linnean Society 164.1, pp. 10–15. doi: 10.1111/
j.1095-8339.2010.01072.x.
Penny, Graeme D., Graham F. Kay, Steven A. Sheardown, Sohaila Rastan, and Neil Brock-
dorff (1996). “Requirement for Xist in X chromosome inactivation”. Nature 379.6561,
pp. 131–137. doi: 10.1038/379131a0.
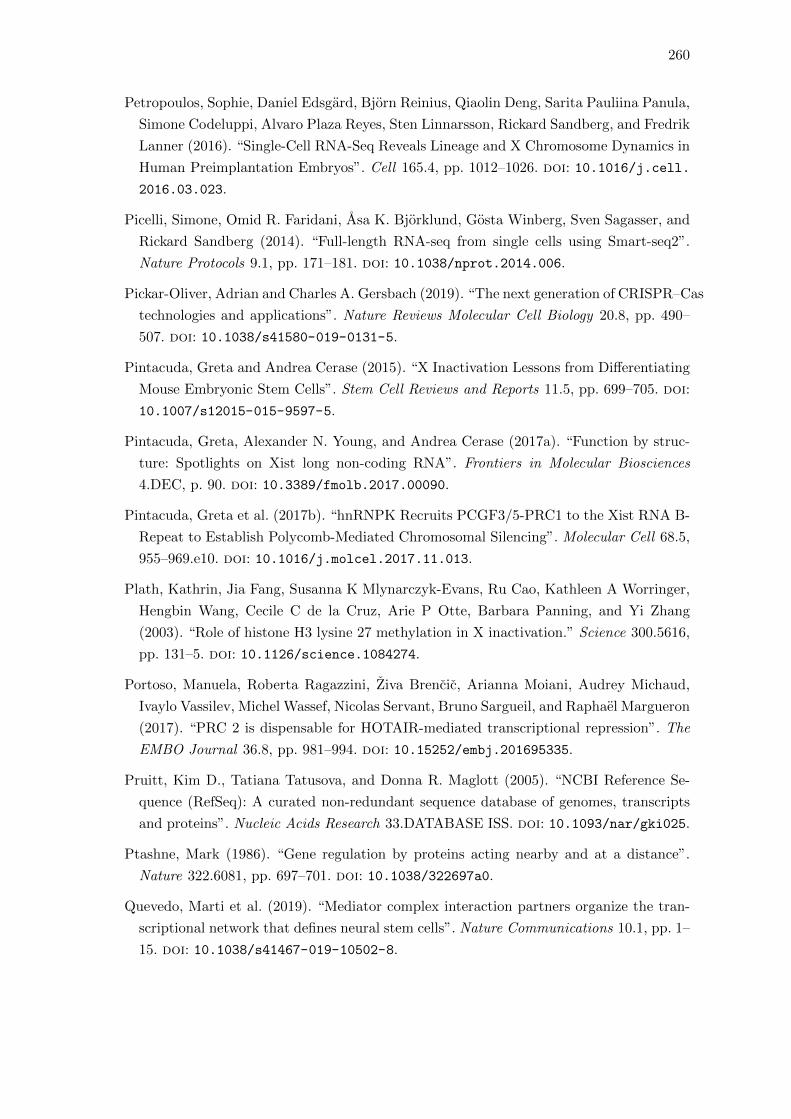
260
Petropoulos, Sophie, Daniel Edsgard, Bjorn Reinius, Qiaolin Deng, Sarita Pauliina Panula,
Simone Codeluppi, Alvaro Plaza Reyes, Sten Linnarsson, Rickard Sandberg, and Fredrik
Lanner (2016). “Single-Cell RNA-Seq Reveals Lineage and X Chromosome Dynamics in
Human Preimplantation Embryos”. Cell 165.4, pp. 1012–1026. doi: 10.1016/j.cell.
2016.03.023.
Picelli, Simone, Omid R. Faridani, Asa K. Bjorklund, Gosta Winberg, Sven Sagasser, and
Rickard Sandberg (2014). “Full-length RNA-seq from single cells using Smart-seq2”.
Nature Protocols 9.1, pp. 171–181. doi: 10.1038/nprot.2014.006.
Pickar-Oliver, Adrian and Charles A. Gersbach (2019). “The next generation of CRISPR–Cas
technologies and applications”. Nature Reviews Molecular Cell Biology 20.8, pp. 490–
507. doi: 10.1038/s41580-019-0131-5.
Pintacuda, Greta and Andrea Cerase (2015). “X Inactivation Lessons from Differentiating
Mouse Embryonic Stem Cells”. Stem Cell Reviews and Reports 11.5, pp. 699–705. doi:
10.1007/s12015-015-9597-5.
Pintacuda, Greta, Alexander N. Young, and Andrea Cerase (2017a). “Function by struc-
ture: Spotlights on Xist long non-coding RNA”. Frontiers in Molecular Biosciences
4.DEC, p. 90. doi: 10.3389/fmolb.2017.00090.
Pintacuda, Greta et al. (2017b). “hnRNPK Recruits PCGF3/5-PRC1 to the Xist RNA B-
Repeat to Establish Polycomb-Mediated Chromosomal Silencing”. Molecular Cell 68.5,
955–969.e10. doi: 10.1016/j.molcel.2017.11.013.
Plath, Kathrin, Jia Fang, Susanna K Mlynarczyk-Evans, Ru Cao, Kathleen A Worringer,
Hengbin Wang, Cecile C de la Cruz, Arie P Otte, Barbara Panning, and Yi Zhang
(2003). “Role of histone H3 lysine 27 methylation in X inactivation.” Science 300.5616,
pp. 131–5. doi: 10.1126/science.1084274.
Portoso, Manuela, Roberta Ragazzini, Ziva Brencic, Arianna Moiani, Audrey Michaud,
Ivaylo Vassilev, Michel Wassef, Nicolas Servant, Bruno Sargueil, and Raphael Margueron
(2017). “PRC 2 is dispensable for HOTAIR-mediated transcriptional repression”. The
EMBO Journal 36.8, pp. 981–994. doi: 10.15252/embj.201695335.
Pruitt, Kim D., Tatiana Tatusova, and Donna R. Maglott (2005). “NCBI Reference Se-
quence (RefSeq): A curated non-redundant sequence database of genomes, transcripts
and proteins”. Nucleic Acids Research 33.DATABASE ISS. doi: 10.1093/nar/gki025.
Ptashne, Mark (1986). “Gene regulation by proteins acting nearby and at a distance”.
Nature 322.6081, pp. 697–701. doi: 10.1038/322697a0.
Quevedo, Marti et al. (2019). “Mediator complex interaction partners organize the tran-
scriptional network that defines neural stem cells”. Nature Communications 10.1, pp. 1–
15. doi: 10.1038/s41467-019-10502-8.
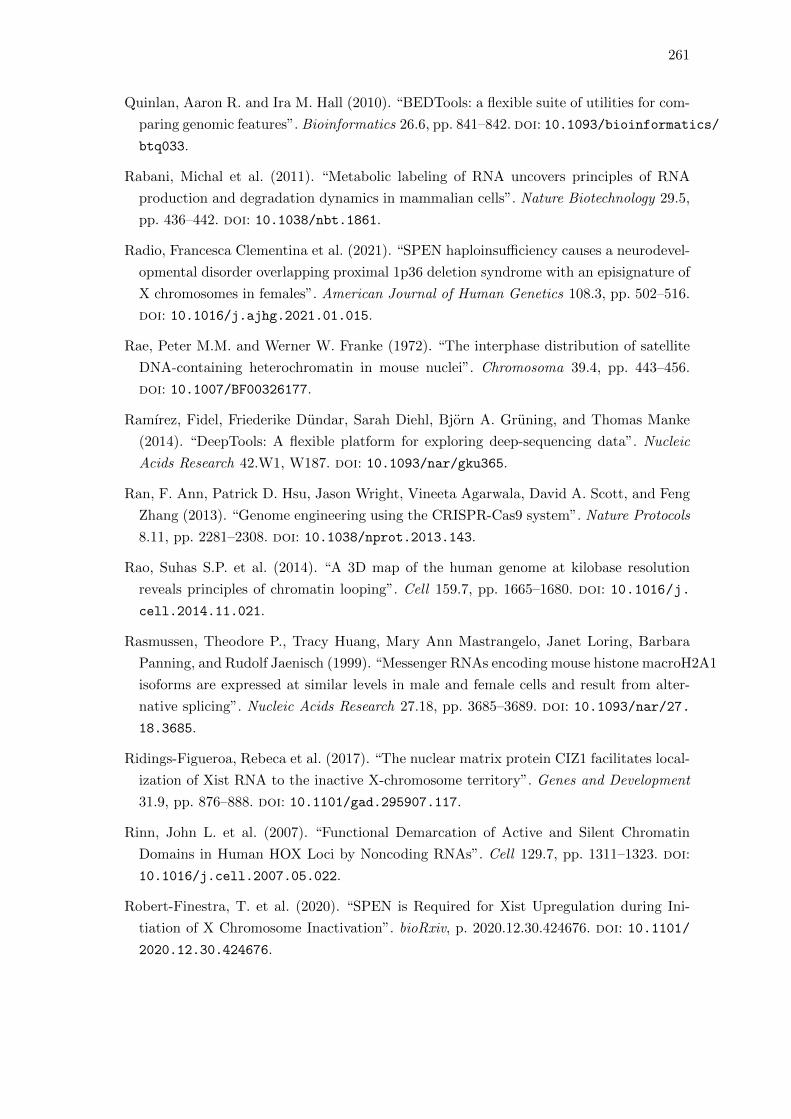
261
Quinlan, Aaron R. and Ira M. Hall (2010). “BEDTools: a flexible suite of utilities for com-
paring genomic features”. Bioinformatics 26.6, pp. 841–842. doi: 10.1093/bioinformatics/
btq033.
Rabani, Michal et al. (2011). “Metabolic labeling of RNA uncovers principles of RNA
production and degradation dynamics in mammalian cells”. Nature Biotechnology 29.5,
pp. 436–442. doi: 10.1038/nbt.1861.
Radio, Francesca Clementina et al. (2021). “SPEN haploinsufficiency causes a neurodevel-
opmental disorder overlapping proximal 1p36 deletion syndrome with an episignature of
X chromosomes in females”. American Journal of Human Genetics 108.3, pp. 502–516.
doi: 10.1016/j.ajhg.2021.01.015.
Rae, Peter M.M. and Werner W. Franke (1972). “The interphase distribution of satellite
DNA-containing heterochromatin in mouse nuclei”. Chromosoma 39.4, pp. 443–456.
doi: 10.1007/BF00326177.
Ramırez, Fidel, Friederike Dundar, Sarah Diehl, Bjorn A. Gruning, and Thomas Manke
(2014). “DeepTools: A flexible platform for exploring deep-sequencing data”. Nucleic
Acids Research 42.W1, W187. doi: 10.1093/nar/gku365.
Ran, F. Ann, Patrick D. Hsu, Jason Wright, Vineeta Agarwala, David A. Scott, and Feng
Zhang (2013). “Genome engineering using the CRISPR-Cas9 system”. Nature Protocols
8.11, pp. 2281–2308. doi: 10.1038/nprot.2013.143.
Rao, Suhas S.P. et al. (2014). “A 3D map of the human genome at kilobase resolution
reveals principles of chromatin looping”. Cell 159.7, pp. 1665–1680. doi: 10.1016/j.
cell.2014.11.021.
Rasmussen, Theodore P., Tracy Huang, Mary Ann Mastrangelo, Janet Loring, Barbara
Panning, and Rudolf Jaenisch (1999). “Messenger RNAs encoding mouse histone macroH2A1
isoforms are expressed at similar levels in male and female cells and result from alter-
native splicing”. Nucleic Acids Research 27.18, pp. 3685–3689. doi: 10.1093/nar/27.
18.3685.
Ridings-Figueroa, Rebeca et al. (2017). “The nuclear matrix protein CIZ1 facilitates local-
ization of Xist RNA to the inactive X-chromosome territory”. Genes and Development
31.9, pp. 876–888. doi: 10.1101/gad.295907.117.
Rinn, John L. et al. (2007). “Functional Demarcation of Active and Silent Chromatin
Domains in Human HOX Loci by Noncoding RNAs”. Cell 129.7, pp. 1311–1323. doi:
10.1016/j.cell.2007.05.022.
Robert-Finestra, T. et al. (2020). “SPEN is Required for Xist Upregulation during Ini-
tiation of X Chromosome Inactivation”. bioRxiv, p. 2020.12.30.424676. doi: 10.1101/
2020.12.30.424676.
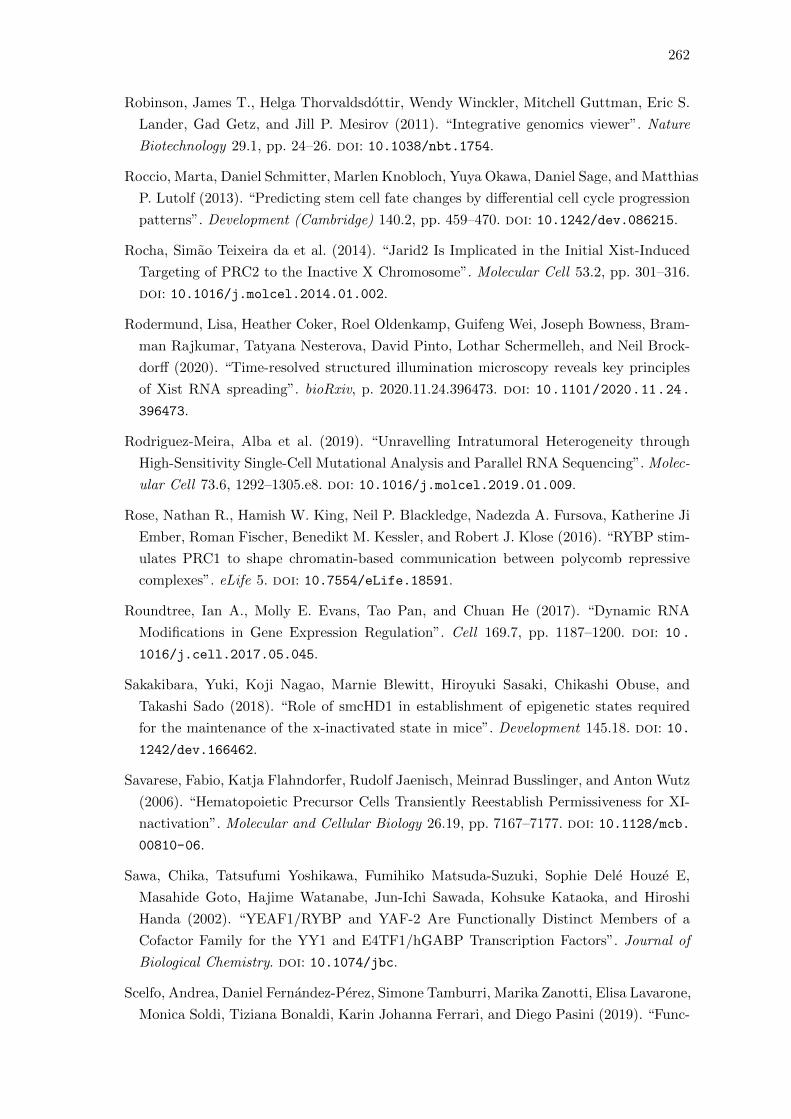
262
Robinson, James T., Helga Thorvaldsdottir, Wendy Winckler, Mitchell Guttman, Eric S.
Lander, Gad Getz, and Jill P. Mesirov (2011). “Integrative genomics viewer”. Nature
Biotechnology 29.1, pp. 24–26. doi: 10.1038/nbt.1754.
Roccio, Marta, Daniel Schmitter, Marlen Knobloch, Yuya Okawa, Daniel Sage, and Matthias
P. Lutolf (2013). “Predicting stem cell fate changes by differential cell cycle progression
patterns”. Development (Cambridge) 140.2, pp. 459–470. doi: 10.1242/dev.086215.
Rocha, Simao Teixeira da et al. (2014). “Jarid2 Is Implicated in the Initial Xist-Induced
Targeting of PRC2 to the Inactive X Chromosome”. Molecular Cell 53.2, pp. 301–316.
doi: 10.1016/j.molcel.2014.01.002.
Rodermund, Lisa, Heather Coker, Roel Oldenkamp, Guifeng Wei, Joseph Bowness, Bram-
man Rajkumar, Tatyana Nesterova, David Pinto, Lothar Schermelleh, and Neil Brock-
dorff (2020). “Time-resolved structured illumination microscopy reveals key principles
of Xist RNA spreading”. bioRxiv, p. 2020.11.24.396473. doi: 10.1101/2020.11.24.
396473.
Rodriguez-Meira, Alba et al. (2019). “Unravelling Intratumoral Heterogeneity through
High-Sensitivity Single-Cell Mutational Analysis and Parallel RNA Sequencing”. Molec-
ular Cell 73.6, 1292–1305.e8. doi: 10.1016/j.molcel.2019.01.009.
Rose, Nathan R., Hamish W. King, Neil P. Blackledge, Nadezda A. Fursova, Katherine Ji
Ember, Roman Fischer, Benedikt M. Kessler, and Robert J. Klose (2016). “RYBP stim-
ulates PRC1 to shape chromatin-based communication between polycomb repressive
complexes”. eLife 5. doi: 10.7554/eLife.18591.
Roundtree, Ian A., Molly E. Evans, Tao Pan, and Chuan He (2017). “Dynamic RNA
Modifications in Gene Expression Regulation”. Cell 169.7, pp. 1187–1200. doi: 10.
1016/j.cell.2017.05.045.
Sakakibara, Yuki, Koji Nagao, Marnie Blewitt, Hiroyuki Sasaki, Chikashi Obuse, and
Takashi Sado (2018). “Role of smcHD1 in establishment of epigenetic states required
for the maintenance of the x-inactivated state in mice”. Development 145.18. doi: 10.
1242/dev.166462.
Savarese, Fabio, Katja Flahndorfer, Rudolf Jaenisch, Meinrad Busslinger, and Anton Wutz
(2006). “Hematopoietic Precursor Cells Transiently Reestablish Permissiveness for XI-
nactivation”. Molecular and Cellular Biology 26.19, pp. 7167–7177. doi: 10.1128/mcb.
00810-06.
Sawa, Chika, Tatsufumi Yoshikawa, Fumihiko Matsuda-Suzuki, Sophie Dele Houze E,
Masahide Goto, Hajime Watanabe, Jun-Ichi Sawada, Kohsuke Kataoka, and Hiroshi
Handa (2002). “YEAF1/RYBP and YAF-2 Are Functionally Distinct Members of a
Cofactor Family for the YY1 and E4TF1/hGABP Transcription Factors”. Journal of
Biological Chemistry. doi: 10.1074/jbc.
Scelfo, Andrea, Daniel Fernandez-Perez, Simone Tamburri, Marika Zanotti, Elisa Lavarone,
Monica Soldi, Tiziana Bonaldi, Karin Johanna Ferrari, and Diego Pasini (2019). “Func-
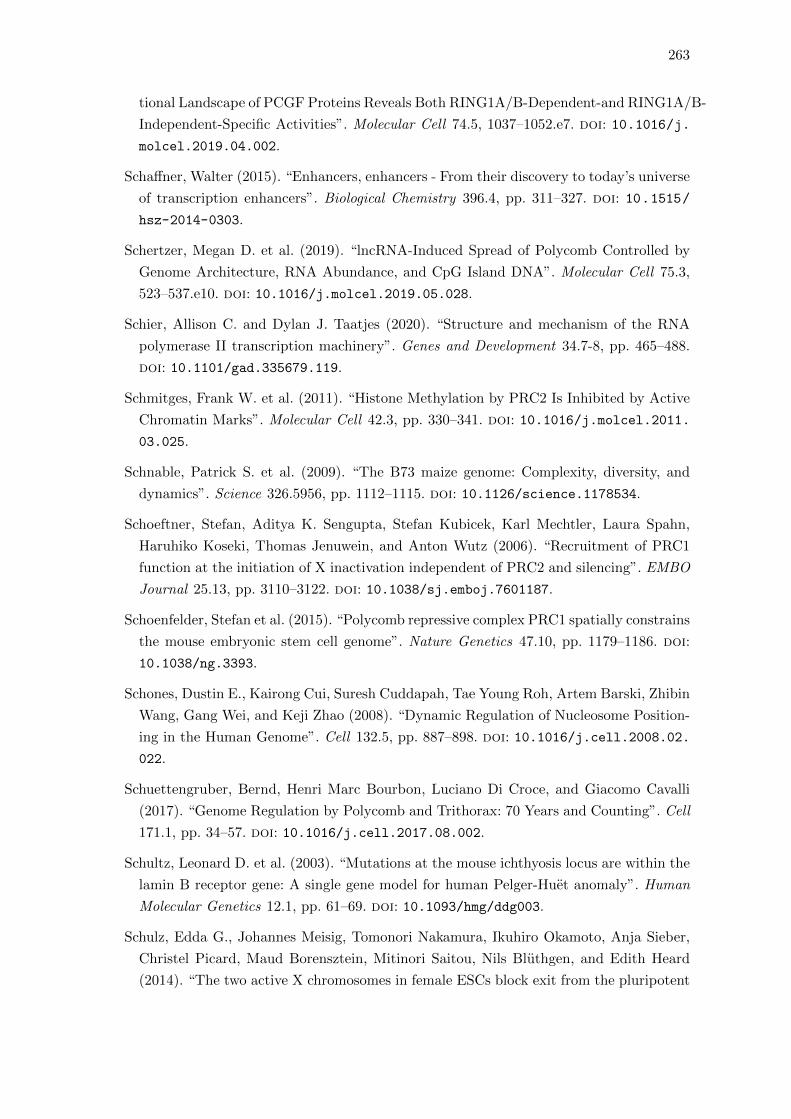
263
tional Landscape of PCGF Proteins Reveals Both RING1A/B-Dependent-and RING1A/B-
Independent-Specific Activities”. Molecular Cell 74.5, 1037–1052.e7. doi: 10.1016/j.
molcel.2019.04.002.
Schaffner, Walter (2015). “Enhancers, enhancers - From their discovery to today’s universe
of transcription enhancers”. Biological Chemistry 396.4, pp. 311–327. doi: 10.1515/
hsz-2014-0303.
Schertzer, Megan D. et al. (2019). “lncRNA-Induced Spread of Polycomb Controlled by
Genome Architecture, RNA Abundance, and CpG Island DNA”. Molecular Cell 75.3,
523–537.e10. doi: 10.1016/j.molcel.2019.05.028.
Schier, Allison C. and Dylan J. Taatjes (2020). “Structure and mechanism of the RNA
polymerase II transcription machinery”. Genes and Development 34.7-8, pp. 465–488.
doi: 10.1101/gad.335679.119.
Schmitges, Frank W. et al. (2011). “Histone Methylation by PRC2 Is Inhibited by Active
Chromatin Marks”. Molecular Cell 42.3, pp. 330–341. doi: 10.1016/j.molcel.2011.
03.025.
Schnable, Patrick S. et al. (2009). “The B73 maize genome: Complexity, diversity, and
dynamics”. Science 326.5956, pp. 1112–1115. doi: 10.1126/science.1178534.
Schoeftner, Stefan, Aditya K. Sengupta, Stefan Kubicek, Karl Mechtler, Laura Spahn,
Haruhiko Koseki, Thomas Jenuwein, and Anton Wutz (2006). “Recruitment of PRC1
function at the initiation of X inactivation independent of PRC2 and silencing”. EMBO
Journal 25.13, pp. 3110–3122. doi: 10.1038/sj.emboj.7601187.
Schoenfelder, Stefan et al. (2015). “Polycomb repressive complex PRC1 spatially constrains
the mouse embryonic stem cell genome”. Nature Genetics 47.10, pp. 1179–1186. doi:
10.1038/ng.3393.
Schones, Dustin E., Kairong Cui, Suresh Cuddapah, Tae Young Roh, Artem Barski, Zhibin
Wang, Gang Wei, and Keji Zhao (2008). “Dynamic Regulation of Nucleosome Position-
ing in the Human Genome”. Cell 132.5, pp. 887–898. doi: 10.1016/j.cell.2008.02.
022.
Schuettengruber, Bernd, Henri Marc Bourbon, Luciano Di Croce, and Giacomo Cavalli
(2017). “Genome Regulation by Polycomb and Trithorax: 70 Years and Counting”. Cell
171.1, pp. 34–57. doi: 10.1016/j.cell.2017.08.002.
Schultz, Leonard D. et al. (2003). “Mutations at the mouse ichthyosis locus are within the
lamin B receptor gene: A single gene model for human Pelger-Huet anomaly”. Human
Molecular Genetics 12.1, pp. 61–69. doi: 10.1093/hmg/ddg003.
Schulz, Edda G., Johannes Meisig, Tomonori Nakamura, Ikuhiro Okamoto, Anja Sieber,
Christel Picard, Maud Borensztein, Mitinori Saitou, Nils Bluthgen, and Edith Heard
(2014). “The two active X chromosomes in female ESCs block exit from the pluripotent
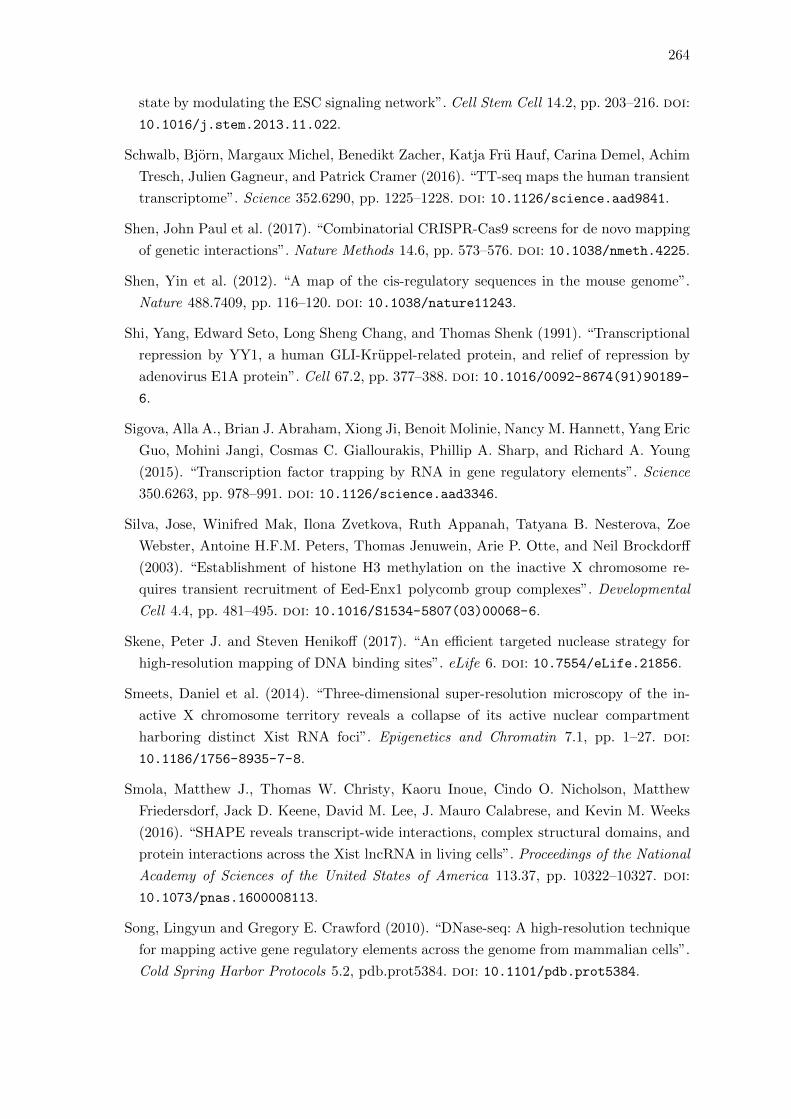
264
state by modulating the ESC signaling network”. Cell Stem Cell 14.2, pp. 203–216. doi:
10.1016/j.stem.2013.11.022.
Schwalb, Bjorn, Margaux Michel, Benedikt Zacher, Katja Fru Hauf, Carina Demel, Achim
Tresch, Julien Gagneur, and Patrick Cramer (2016). “TT-seq maps the human transient
transcriptome”. Science 352.6290, pp. 1225–1228. doi: 10.1126/science.aad9841.
Shen, John Paul et al. (2017). “Combinatorial CRISPR-Cas9 screens for de novo mapping
of genetic interactions”. Nature Methods 14.6, pp. 573–576. doi: 10.1038/nmeth.4225.
Shen, Yin et al. (2012). “A map of the cis-regulatory sequences in the mouse genome”.
Nature 488.7409, pp. 116–120. doi: 10.1038/nature11243.
Shi, Yang, Edward Seto, Long Sheng Chang, and Thomas Shenk (1991). “Transcriptional
repression by YY1, a human GLI-Kruppel-related protein, and relief of repression by
adenovirus E1A protein”. Cell 67.2, pp. 377–388. doi: 10.1016/0092-8674(91)90189-
6.
Sigova, Alla A., Brian J. Abraham, Xiong Ji, Benoit Molinie, Nancy M. Hannett, Yang Eric
Guo, Mohini Jangi, Cosmas C. Giallourakis, Phillip A. Sharp, and Richard A. Young
(2015). “Transcription factor trapping by RNA in gene regulatory elements”. Science
350.6263, pp. 978–991. doi: 10.1126/science.aad3346.
Silva, Jose, Winifred Mak, Ilona Zvetkova, Ruth Appanah, Tatyana B. Nesterova, Zoe
Webster, Antoine H.F.M. Peters, Thomas Jenuwein, Arie P. Otte, and Neil Brockdorff
(2003). “Establishment of histone H3 methylation on the inactive X chromosome re-
quires transient recruitment of Eed-Enx1 polycomb group complexes”. Developmental
Cell 4.4, pp. 481–495. doi: 10.1016/S1534-5807(03)00068-6.
Skene, Peter J. and Steven Henikoff (2017). “An efficient targeted nuclease strategy for
high-resolution mapping of DNA binding sites”. eLife 6. doi: 10.7554/eLife.21856.
Smeets, Daniel et al. (2014). “Three-dimensional super-resolution microscopy of the in-
active X chromosome territory reveals a collapse of its active nuclear compartment
harboring distinct Xist RNA foci”. Epigenetics and Chromatin 7.1, pp. 1–27. doi:
10.1186/1756-8935-7-8.
Smola, Matthew J., Thomas W. Christy, Kaoru Inoue, Cindo O. Nicholson, Matthew
Friedersdorf, Jack D. Keene, David M. Lee, J. Mauro Calabrese, and Kevin M. Weeks
(2016). “SHAPE reveals transcript-wide interactions, complex structural domains, and
protein interactions across the Xist lncRNA in living cells”. Proceedings of the National
Academy of Sciences of the United States of America 113.37, pp. 10322–10327. doi:
10.1073/pnas.1600008113.
Song, Lingyun and Gregory E. Crawford (2010). “DNase-seq: A high-resolution technique
for mapping active gene regulatory elements across the genome from mammalian cells”.
Cold Spring Harbor Protocols 5.2, pdb.prot5384. doi: 10.1101/pdb.prot5384.
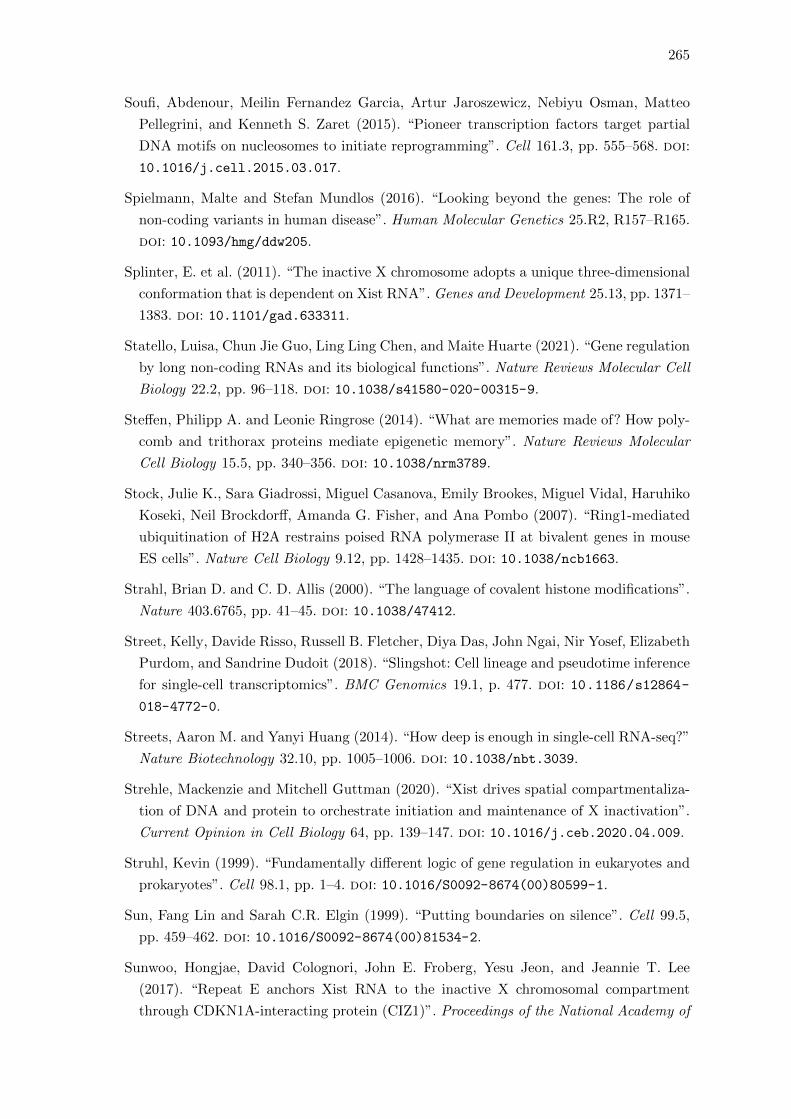
265
Soufi, Abdenour, Meilin Fernandez Garcia, Artur Jaroszewicz, Nebiyu Osman, Matteo
Pellegrini, and Kenneth S. Zaret (2015). “Pioneer transcription factors target partial
DNA motifs on nucleosomes to initiate reprogramming”. Cell 161.3, pp. 555–568. doi:
10.1016/j.cell.2015.03.017.
Spielmann, Malte and Stefan Mundlos (2016). “Looking beyond the genes: The role of
non-coding variants in human disease”. Human Molecular Genetics 25.R2, R157–R165.
doi: 10.1093/hmg/ddw205.
Splinter, E. et al. (2011). “The inactive X chromosome adopts a unique three-dimensional
conformation that is dependent on Xist RNA”. Genes and Development 25.13, pp. 1371–
1383. doi: 10.1101/gad.633311.
Statello, Luisa, Chun Jie Guo, Ling Ling Chen, and Maite Huarte (2021). “Gene regulation
by long non-coding RNAs and its biological functions”. Nature Reviews Molecular Cell
Biology 22.2, pp. 96–118. doi: 10.1038/s41580-020-00315-9.
Steffen, Philipp A. and Leonie Ringrose (2014). “What are memories made of? How poly-
comb and trithorax proteins mediate epigenetic memory”. Nature Reviews Molecular
Cell Biology 15.5, pp. 340–356. doi: 10.1038/nrm3789.
Stock, Julie K., Sara Giadrossi, Miguel Casanova, Emily Brookes, Miguel Vidal, Haruhiko
Koseki, Neil Brockdorff, Amanda G. Fisher, and Ana Pombo (2007). “Ring1-mediated
ubiquitination of H2A restrains poised RNA polymerase II at bivalent genes in mouse
ES cells”. Nature Cell Biology 9.12, pp. 1428–1435. doi: 10.1038/ncb1663.
Strahl, Brian D. and C. D. Allis (2000). “The language of covalent histone modifications”.
Nature 403.6765, pp. 41–45. doi: 10.1038/47412.
Street, Kelly, Davide Risso, Russell B. Fletcher, Diya Das, John Ngai, Nir Yosef, Elizabeth
Purdom, and Sandrine Dudoit (2018). “Slingshot: Cell lineage and pseudotime inference
for single-cell transcriptomics”. BMC Genomics 19.1, p. 477. doi: 10.1186/s12864-
018-4772-0.
Streets, Aaron M. and Yanyi Huang (2014). “How deep is enough in single-cell RNA-seq?”
Nature Biotechnology 32.10, pp. 1005–1006. doi: 10.1038/nbt.3039.
Strehle, Mackenzie and Mitchell Guttman (2020). “Xist drives spatial compartmentaliza-
tion of DNA and protein to orchestrate initiation and maintenance of X inactivation”.
Current Opinion in Cell Biology 64, pp. 139–147. doi: 10.1016/j.ceb.2020.04.009.
Struhl, Kevin (1999). “Fundamentally different logic of gene regulation in eukaryotes and
prokaryotes”. Cell 98.1, pp. 1–4. doi: 10.1016/S0092-8674(00)80599-1.
Sun, Fang Lin and Sarah C.R. Elgin (1999). “Putting boundaries on silence”. Cell 99.5,
pp. 459–462. doi: 10.1016/S0092-8674(00)81534-2.
Sunwoo, Hongjae, David Colognori, John E. Froberg, Yesu Jeon, and Jeannie T. Lee
(2017). “Repeat E anchors Xist RNA to the inactive X chromosomal compartment
through CDKN1A-interacting protein (CIZ1)”. Proceedings of the National Academy of
266
Sciences of the United States of America 114.40, pp. 10654–10659. doi: 10.1073/pnas.
1711206114.
Takagi, Nobuo and Motomichi Sasaki (1975). “Preferential inactivation of the pater-
nally derived X chromosome in the extraembryonic membranes of the mouse”. Nature
256.5519, pp. 640–642. doi: 10.1038/256640a0.
Takahashi, Hazuki, Timo Lassmann, Mitsuyoshi Murata, and Piero Carninci (2012). “5
end-centered expression profiling using cap-analysis gene expression and next-generation
sequencing”. Nature Protocols 7.3, pp. 542–561. doi: 10.1038/nprot.2012.005.
Tamaru, H. and E. U. Selker (2001). “A histone H3 methyltransferase controls DNA methy-
lation in Neurospora crassa”. Nature 414.6861, pp. 277–283. doi: 10.1038/35104508.
Tamburri, Simone, Elisa Lavarone, Daniel Fernandez-Perez, Eric Conway, Marika Zanotti,
Daria Manganaro, and Diego Pasini (2020). “Histone H2AK119 Mono-Ubiquitination
Is Essential for Polycomb-Mediated Transcriptional Repression”. Molecular Cell 77.4,
840–856.e5. doi: 10.1016/j.molcel.2019.11.021.
Tang, Y. Amy, Derek Huntley, Giovanni Montana, Andrea Cerase, Tatyana B. Nesterova,
and Neil Brockdorff (2010). “Efficiency of Xist-mediated silencing on autosomes is linked
to chromosomal domain organisation”. Epigenetics and Chromatin 3.1, p. 10. doi: 10.
1186/1756-8935-3-10.
Tavares, Lıgia et al. (2012). “RYBP-PRC1 complexes mediate H2A ubiquitylation at poly-
comb target sites independently of PRC2 and H3K27me3”. Cell 148.4, pp. 664–678. doi:
10.1016/j.cell.2011.12.029.
Tian, Di, Sha Sun, and Jeannie T. Lee (2010). “The long noncoding RNA, Jpx, Is a
molecular switch for X chromosome inactivation”. Cell 143.3, pp. 390–403. doi: 10.
1016/j.cell.2010.09.049.
Tillotson, Rebekah and Adrian Bird (2020). “The Molecular Basis of MeCP2 Function in
the Brain”. Journal of Molecular Biology 432.6, pp. 1602–1623. doi: 10.1016/j.jmb.
2019.10.004.
Tolhuis, Bas, Robert Jan Palstra, Erik Splinter, Frank Grosveld, and Wouter De Laat
(2002). “Looping and interaction between hypersensitive sites in the active β-globin
locus”. Molecular Cell 10.6, pp. 1453–1465. doi: 10.1016/S1097-2765(02)00781-5.
Tukiainen, Taru et al. (2017). “Landscape of X chromosome inactivation across human
tissues”. Nature 550.7675, pp. 244–248. doi: 10.1038/nature24265.
Udvardy, Andor, Eleanor Maine, and Paul Schedl (1985). “The 87A7 chromomere. Identi-
fication of novel chromatin structures flanking the heat shock locus that may define the
boundaries of higher order domains”. Journal of Molecular Biology 185.2, pp. 341–358.
doi: 10.1016/0022-2836(85)90408-5.
267
Van Bemmel, Joke G. et al. (2019). “The bipartite TAD organization of the X-inactivation
center ensures opposing developmental regulation of Tsix and Xist”. Nature Genetics
51.6, pp. 1024–1034. doi: 10.1038/s41588-019-0412-0.
Van De Werken, Harmen J.G. et al. (2012). “Robust 4C-seq data analysis to screen for
regulatory DNA interactions”. Nature Methods 9.10, pp. 969–972. doi: 10.1038/nmeth.
2173.
Van Der Maaten, Laurens and Geoffrey Hinton (2008). “Visualizing Data using t-SNE”.
Journal of Machine Learning Research 9, pp. 2579–2605.
Van Laarhoven, Peter M., Leif R. Neitzel, Anita M. Quintana, Elizabeth A. Geiger, Elaine
H. Zackai, David E. Clouthier, Kristin B. Artinger, Jeffrey E. Ming, and Tamim H.
Shaikh (2015). “Kabuki syndrome genes KMT2D and KDM6A: functional analyses
demonstrate critical roles in craniofacial, heart and brain development”. Human molec-
ular genetics 24.15, pp. 4443–4453. doi: 10.1093/hmg/ddv180.
Vella, Pietro, Iros Barozzi, Alessandro Cuomo, Tiziana Bonaldi, and Diego Pasini (2012).
“Yin Yang 1 extends the Myc-related transcription factors network in embryonic stem
cells”. Nucleic Acids Research 40.8, pp. 3403–3418. doi: 10.1093/nar/gkr1290.
Verheul, Thijs C.J., Levi van Hijfte, Elena Perenthaler, and Tahsin Stefan Barakat (2020).
“The Why of YY1: Mechanisms of Transcriptional Regulation by Yin Yang 1”. Frontiers
in Cell and Developmental Biology 8. doi: 10.3389/fcell.2020.592164.
Visa, Neus and Antonio Jordan-Pla (2018). “ChIP and ChIP-related techniques: Expand-
ing the fields of application and improving ChIP performance”. Methods in Molecular
Biology. Vol. 1689. Humana Press Inc., pp. 1–7. doi: 10.1007/978-1-4939-7380-4_1.
Wang, Chen Yu, David Colognori, Hongjae Sunwoo, Danni Wang, and Jeannie T. Lee
(2019). “PRC1 collaborates with SMCHD1 to fold the X-chromosome and spread Xist
RNA between chromosome compartments”. Nature Communications 10.1, pp. 1–18.
doi: 10.1038/s41467-019-10755-3.
Wang, Chen-Yu, Teddy Jegu, Hsueh-Ping Chu, Hyun Jung Oh, and Jeannie T Lee (2018a).
“SMCHD1 Merges Chromosome Compartments and Assists Formation of Super-Structures
on the Inactive X.” Cell 0.0. doi: 10.1016/j.cell.2018.05.007.
Wang, J, J Mager, Y Chen, E Schneider, J C Cross, A Nagy, and T Magnuson (2001). “Im-
printed X inactivation maintained by a mouse Polycomb group gene.” Nature Genetics
28.4, pp. 371–375. doi: 10.1038/ng574.
Wang, Jia et al. (2018b). “YY1 Positively Regulates Transcription by Targeting Promoters
and Super-Enhancers through the BAF Complex in Embryonic Stem Cells”. Stem Cell
Reports 10.4, pp. 1324–1339. doi: 10.1016/j.stemcr.2018.02.004.
Weintraub, Abraham S, Charles H Li, Alicia V Zamudio, James E Bradner, Nathanael S
Gray, and Richard A Young Correspondence (2017). “YY1 Is a Structural Regulator of
Enhancer-Promoter Loops”. Cell. doi: 10.1016/j.cell.2017.11.008.
268
Wen, Yu Der, Valentina Perissi, Lena M. Staszewski, Wen Ming Yang, Anna Krones,
Christopher K. Glass, Michael G. Rosenfeld, and Edward Seto (2000). “The histone
deacetylase-3 complex contains nuclear receptor corepressors”. Proceedings of the Na-
tional Academy of Sciences of the United States of America 97.13, pp. 7202–7207. doi:
10.1073/pnas.97.13.7202.
Wilkinson, Frank H., Kyoungsook Park, and Michael L. Atchison (2006). “Polycomb re-
cruitment to DNA in vivo by the YY1 REPO domain”. Proceedings of the National
Academy of Sciences of the United States of America 103.51, pp. 19296–19301. doi:
10.1073/pnas.0603564103.
Wutz, Anton and Rudolf Jaenisch (2000). “A shift from reversible to irreversible X inacti-
vation is triggered during ES cell differentiation”. Molecular Cell 5.4, pp. 695–705. doi:
10.1016/S1097-2765(00)80248-8.
Wutz, Anton and Asun Monfort (2020). “The B-side of Xist”. F1000Research 9. doi:
10.12688/f1000research.21362.1.
Wutz, Anton, Theodore P Rasmussen, and Rudolf Jaenisch (2002). “Chromosomal silenc-
ing and localization are mediated by different domains of Xist RNA”. Nature Genetics
30.2, p. 167.
Yabe, Daisuke, Hitoshi Fukuda, Misayo Aoki, Shuichi Yamada, Shinji Takebayashi, Reiko
Shinkura, Norio Yamamoto, and Tasuku Honjo (2007). “Generation of a conditional
knockout allele for mammalian spen protein Mint/SHARP”. Genesis 45.5, pp. 300–306.
doi: 10.1002/dvg.20296.
Yan, Jian et al. (2018). “Histone H3 lysine 4 monomethylation modulates long-range
chromatin interactions at enhancers”. Cell Research 28.2, pp. 204–220. doi: 10.1038/
cr.2018.1.
Yang, Fan, Tomas Babak, Jay Shendure, and Christine M. Disteche (2010). “Global survey
of escape from X inactivation by RNA-sequencing in mouse”. Genome Research 20.5,
pp. 614–622. doi: 10.1101/gr.103200.109.
Yang, Lin, James E. Kirby, Hongja Sunwoo, and Jeannie T. Lee (2016). “Female mice
lacking Xist RNA show partial dosage compensation and survive to term”. Genes and
Development 30.15, pp. 1747–1760. doi: 10.1101/gad.281162.116.
Yao, Mingze et al. (2018). “PCGF5 is required for neural differentiation of embryonic stem
cells”. Nature Communications 9.1. doi: 10.1038/s41467-018-03781-0.
Yasmineh, Walid G. and Jorge J. Yunis (1969). “Satellite DNA in mouse autosomal hetero
chromatin”. Biochemical and Biophysical Research Communications 35.6, pp. 779–782.
doi: 10.1016/0006-291X(69)90690-1.
Yeo, Jia Chi et al. (2014). “Klf2 is an essential factor that sustains ground state pluripo-
tency”. Cell Stem Cell 14.6, pp. 864–872. doi: 10.1016/j.stem.2014.04.015.
269
Young, Alexander Neil, Emerald Perlas, Nerea Ruiz-Blanes, Andreas Hierholzer, Nicola
Pomella, Belen Martin-Martin, Alessandra Liverziani, Joanna W. Jachowicz, Thomas
Giannakouros, and Andrea Cerase (2021). “Deletion of LBR N-terminal domains reca-
pitulates Pelger-Huet anomaly phenotypes in mouse without disrupting X chromosome
inactivation”. Communications Biology 4.1, p. 478. doi: 10.1038/s42003-021-01944-
2.
Yuan, Wen, Mo Xu, Chang Huang, Nan Liu, She Chen, and Bing Zhu (2011). “H3K36
methylation antagonizes PRC2-mediated H3K27 methylation”. Journal of Biological
Chemistry 286.10, pp. 7983–7989. doi: 10.1074/jbc.M110.194027.
Yue, Minghui, Akiyo Ogawa, Norishige Yamada, John Lalith Charles Richard, Artem
Barski, and Yuya Ogawa (2017). “Xist RNA repeat E is essential for ASH2L recruitment
to the inactive X and regulates histone modifications and escape gene expression”. PLoS
Genetics 13.7. doi: 10.1371/journal.pgen.1006890.
Zaret, Kenneth S and Jason S Carroll (2011). “Pioneer transcription factors: establishing
competence for gene expression”. Genes and Development 25.21, pp. 2227–2241.
Zemach, Assaf, Ivy E. McDaniel, Pedro Silva, and Daniel Zilberman (2010). “Genome-wide
evolutionary analysis of eukaryotic DNA methylation”. Science 328.5980, pp. 916–919.
doi: 10.1126/science.1186366.
Zeng, Hongkui et al. (2008). “An Inducible and Reversible Mouse Genetic Rescue System”.
PLoS Genetics 4.5, e1000069. doi: 10.1371/journal.pgen.1000069.
Zhang, Tianyi, Sarah Cooper, and Neil Brockdorff (2015). “The interplay of histone mod-
ifications – writers that read”. EMBO reports 16.11, pp. 1467–1481. doi: 10.15252/
embr.201540945.
Zhang, Yong et al. (2008). “Model-based analysis of ChIP-Seq (MACS)”. Genome Biology
9.9, R137. doi: 10.1186/gb-2008-9-9-r137.
Zhao, Jicheng et al. (2020). “RYBP/YAF2-PRC1 complexes and histone H1-dependent
chromatin compaction mediate propagation of H2AK119ub1 during cell division”. Na-
ture Cell Biology 22.4, pp. 439–452. doi: 10.1038/s41556-020-0484-1.
Zhao, Jing, Bryan K. Sun, Jennifer A. Erwin, Ji Joon Song, and Jeannie T. Lee (2008).
“Polycomb proteins targeted by a short repeat RNA to the mouse X chromosome”.
Science 322.5902, pp. 750–756. doi: 10.1126/science.1163045.
Zhou, Wenlai, Ping Zhu, Jianxun Wang, Gabriel Pascual, Kenneth A. Ohgi, Jean Lozach,
Christopher K. Glass, and Michael G. Rosenfeld (2008). “Histone H2A Monoubiquiti-
nation Represses Transcription by Inhibiting RNA Polymerase II Transcriptional Elon-
gation”. Molecular Cell 29.1, pp. 69–80. doi: 10.1016/j.molcel.2007.11.002.
Zoch, Ansgar et al. (2020). “SPOCD1 is an essential executor of piRNA-directed de novo
DNA methylation”. Nature 584.7822, pp. 635–639. doi: 10.1038/s41586-020-2557-5.

270
Zvetkova, Ilona, Anwyn Apedaile, Bernard Ramsahoye, Jacqueline E. Mermoud, Lucy A.
Crompton, Rosalind John, Robert Feil, and Neil Brockdorff (2005). “Global hypomethy-
lation of the genome in XX embryonic stem cells”. Nature Genetics 37.11, pp. 1274–
1279. doi: 10.1038/ng1663.
Zylicz, Jan Jakub et al. (2019). “The Implication of Early Chromatin Changes in X Chro-
mosome Inactivation”. Cell 176.1-2, 182–197.e23. doi: 10.1016/j.cell.2018.11.041.

Appendix
271
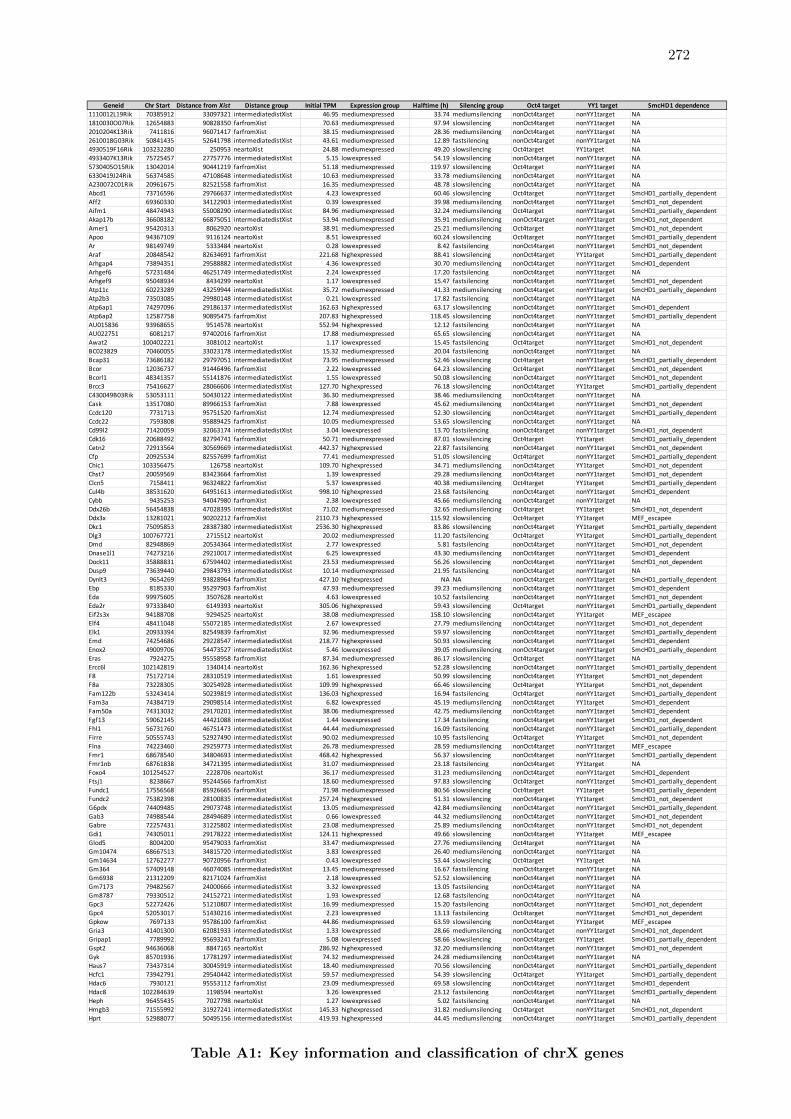
272
Geneid Chr Start Distance from Xist Distance group Initial TPM Expression group Halftime (h) Silencing group Oct4 target YY1 target SmcHD1 dependence1110012L19Rik 70385912 33097321 intermediatedistXist 46.95 mediumexpressed 33.74 mediumsilencing nonOct4target nonYY1target NA
1810030O07Rik 12654883 90828350 farfromXist 70.63 mediumexpressed 97.94 slowsilencing nonOct4target nonYY1target NA
2010204K13Rik 7411816 96071417 farfromXist 38.15 mediumexpressed 28.36 mediumsilencing nonOct4target nonYY1target NA
2610018G03Rik 50841435 52641798 intermediatedistXist 43.61 mediumexpressed 12.89 fastsilencing nonOct4target nonYY1target NA
4930519F16Rik 103232280 250953 neartoXist 24.88 mediumexpressed 49.20 slowsilencing Oct4target YY1target NA
4933407K13Rik 75725457 27757776 intermediatedistXist 5.15 lowexpressed 54.19 slowsilencing nonOct4target nonYY1target NA
5730405O15Rik 13042014 90441219 farfromXist 51.18 mediumexpressed 119.97 slowsilencing Oct4target nonYY1target NA
6330419J24Rik 56374585 47108648 intermediatedistXist 10.63 mediumexpressed 33.78 mediumsilencing nonOct4target nonYY1target NA
A230072C01Rik 20961675 82521558 farfromXist 16.35 mediumexpressed 48.78 slowsilencing nonOct4target nonYY1target NA
Abcd1 73716596 29766637 intermediatedistXist 4.23 lowexpressed 60.46 slowsilencing Oct4target nonYY1target SmcHD1_partially_dependent
Aff2 69360330 34122903 intermediatedistXist 0.39 lowexpressed 39.98 mediumsilencing nonOct4target nonYY1target SmcHD1_not_dependent
Aifm1 48474943 55008290 intermediatedistXist 84.96 mediumexpressed 32.24 mediumsilencing Oct4target nonYY1target SmcHD1_partially_dependent
Akap17b 36608182 66875051 intermediatedistXist 53.94 mediumexpressed 35.91 mediumsilencing nonOct4target nonYY1target SmcHD1_not_dependent
Amer1 95420313 8062920 neartoXist 38.91 mediumexpressed 25.21 mediumsilencing Oct4target nonYY1target SmcHD1_not_dependent
Apoo 94367109 9116124 neartoXist 8.51 lowexpressed 60.24 slowsilencing Oct4target nonYY1target SmcHD1_partially_dependent
Ar 98149749 5333484 neartoXist 0.28 lowexpressed 8.42 fastsilencing nonOct4target nonYY1target SmcHD1_not_dependent
Araf 20848542 82634691 farfromXist 221.68 highexpressed 88.41 slowsilencing nonOct4target YY1target SmcHD1_partially_dependent
Arhgap4 73894351 29588882 intermediatedistXist 4.36 lowexpressed 30.70 mediumsilencing nonOct4target nonYY1target SmcHD1_dependent
Arhgef6 57231484 46251749 intermediatedistXist 2.24 lowexpressed 17.20 fastsilencing nonOct4target nonYY1target NA
Arhgef9 95048934 8434299 neartoXist 1.17 lowexpressed 15.47 fastsilencing nonOct4target nonYY1target SmcHD1_not_dependent
Atp11c 60223289 43259944 intermediatedistXist 35.72 mediumexpressed 41.33 mediumsilencing nonOct4target nonYY1target SmcHD1_partially_dependent
Atp2b3 73503085 29980148 intermediatedistXist 0.21 lowexpressed 17.82 fastsilencing nonOct4target nonYY1target NA
Atp6ap1 74297096 29186137 intermediatedistXist 162.63 highexpressed 63.17 slowsilencing nonOct4target nonYY1target SmcHD1_dependent
Atp6ap2 12587758 90895475 farfromXist 207.83 highexpressed 118.45 slowsilencing nonOct4target nonYY1target SmcHD1_partially_dependent
AU015836 93968655 9514578 neartoXist 552.94 highexpressed 12.12 fastsilencing nonOct4target nonYY1target NA
AU022751 6081217 97402016 farfromXist 17.88 mediumexpressed 65.65 slowsilencing nonOct4target nonYY1target NA
Awat2 100402221 3081012 neartoXist 1.17 lowexpressed 15.45 fastsilencing Oct4target nonYY1target SmcHD1_not_dependent
BC023829 70460055 33023178 intermediatedistXist 15.32 mediumexpressed 20.04 fastsilencing nonOct4target nonYY1target NA
Bcap31 73686182 29797051 intermediatedistXist 73.95 mediumexpressed 52.46 slowsilencing Oct4target nonYY1target SmcHD1_partially_dependent
Bcor 12036737 91446496 farfromXist 2.22 lowexpressed 64.23 slowsilencing Oct4target nonYY1target SmcHD1_not_dependent
Bcorl1 48341357 55141876 intermediatedistXist 1.55 lowexpressed 50.08 slowsilencing nonOct4target nonYY1target SmcHD1_not_dependent
Brcc3 75416627 28066606 intermediatedistXist 127.70 highexpressed 76.18 slowsilencing nonOct4target YY1target SmcHD1_partially_dependent
C430049B03Rik 53053111 50430122 intermediatedistXist 36.30 mediumexpressed 38.46 mediumsilencing nonOct4target nonYY1target NA
Cask 13517080 89966153 farfromXist 7.88 lowexpressed 45.62 mediumsilencing nonOct4target nonYY1target SmcHD1_not_dependent
Ccdc120 7731713 95751520 farfromXist 12.74 mediumexpressed 52.30 slowsilencing nonOct4target nonYY1target SmcHD1_partially_dependent
Ccdc22 7593808 95889425 farfromXist 10.05 mediumexpressed 53.65 slowsilencing nonOct4target nonYY1target NA
Cd99l2 71420059 32063174 intermediatedistXist 3.04 lowexpressed 13.70 fastsilencing nonOct4target nonYY1target SmcHD1_not_dependent
Cdk16 20688492 82794741 farfromXist 50.71 mediumexpressed 87.01 slowsilencing Oct4target YY1target SmcHD1_partially_dependent
Cetn2 72913564 30569669 intermediatedistXist 442.37 highexpressed 22.87 fastsilencing nonOct4target nonYY1target SmcHD1_not_dependent
Cfp 20925534 82557699 farfromXist 77.41 mediumexpressed 51.05 slowsilencing Oct4target nonYY1target SmcHD1_partially_dependent
Chic1 103356475 126758 neartoXist 109.70 highexpressed 34.71 mediumsilencing nonOct4target YY1target SmcHD1_not_dependent
Chst7 20059569 83423664 farfromXist 1.39 lowexpressed 29.28 mediumsilencing nonOct4target nonYY1target SmcHD1_not_dependent
Clcn5 7158411 96324822 farfromXist 5.37 lowexpressed 40.38 mediumsilencing Oct4target YY1target SmcHD1_partially_dependent
Cul4b 38531620 64951613 intermediatedistXist 998.10 highexpressed 23.68 fastsilencing nonOct4target nonYY1target SmcHD1_dependent
Cybb 9435253 94047980 farfromXist 2.38 lowexpressed 45.66 mediumsilencing nonOct4target nonYY1target NA
Ddx26b 56454838 47028395 intermediatedistXist 71.02 mediumexpressed 32.65 mediumsilencing Oct4target YY1target SmcHD1_not_dependent
Ddx3x 13281021 90202212 farfromXist 2110.73 highexpressed 115.92 slowsilencing Oct4target YY1target MEF_escapee
Dkc1 75095853 28387380 intermediatedistXist 2536.30 highexpressed 83.86 slowsilencing nonOct4target YY1target SmcHD1_partially_dependent
Dlg3 100767721 2715512 neartoXist 20.02 mediumexpressed 11.20 fastsilencing Oct4target YY1target SmcHD1_partially_dependent
Dmd 82948869 20534364 intermediatedistXist 2.77 lowexpressed 5.81 fastsilencing nonOct4target nonYY1target SmcHD1_not_dependent
Dnase1l1 74273216 29210017 intermediatedistXist 6.25 lowexpressed 43.30 mediumsilencing nonOct4target nonYY1target SmcHD1_dependent
Dock11 35888831 67594402 intermediatedistXist 23.53 mediumexpressed 56.26 slowsilencing nonOct4target nonYY1target SmcHD1_not_dependent
Dusp9 73639440 29843793 intermediatedistXist 10.14 mediumexpressed 21.95 fastsilencing nonOct4target nonYY1target NA
Dynlt3 9654269 93828964 farfromXist 427.10 highexpressed NA NA nonOct4target nonYY1target SmcHD1_partially_dependent
Ebp 8185330 95297903 farfromXist 47.93 mediumexpressed 39.23 mediumsilencing nonOct4target nonYY1target SmcHD1_dependent
Eda 99975605 3507628 neartoXist 4.63 lowexpressed 10.52 fastsilencing nonOct4target nonYY1target SmcHD1_not_dependent
Eda2r 97333840 6149393 neartoXist 305.06 highexpressed 59.43 slowsilencing Oct4target nonYY1target SmcHD1_partially_dependent
Eif2s3x 94188708 9294525 neartoXist 38.08 mediumexpressed 158.10 slowsilencing nonOct4target YY1target MEF_escapee
Elf4 48411048 55072185 intermediatedistXist 2.67 lowexpressed 27.79 mediumsilencing nonOct4target nonYY1target SmcHD1_not_dependent
Elk1 20933394 82549839 farfromXist 32.96 mediumexpressed 59.97 slowsilencing nonOct4target nonYY1target SmcHD1_partially_dependent
Emd 74254686 29228547 intermediatedistXist 218.77 highexpressed 50.93 slowsilencing nonOct4target nonYY1target SmcHD1_dependent
Enox2 49009706 54473527 intermediatedistXist 5.46 lowexpressed 39.05 mediumsilencing nonOct4target nonYY1target SmcHD1_partially_dependent
Eras 7924275 95558958 farfromXist 87.34 mediumexpressed 86.17 slowsilencing Oct4target nonYY1target NA
Ercc6l 102142819 1340414 neartoXist 162.36 highexpressed 52.28 slowsilencing nonOct4target nonYY1target SmcHD1_partially_dependent
F8 75172714 28310519 intermediatedistXist 1.61 lowexpressed 50.99 slowsilencing nonOct4target YY1target SmcHD1_not_dependent
F8a 73228305 30254928 intermediatedistXist 109.99 highexpressed 66.46 slowsilencing Oct4target YY1target SmcHD1_not_dependent
Fam122b 53243414 50239819 intermediatedistXist 136.03 highexpressed 16.94 fastsilencing Oct4target nonYY1target SmcHD1_partially_dependent
Fam3a 74384719 29098514 intermediatedistXist 6.82 lowexpressed 45.19 mediumsilencing nonOct4target YY1target SmcHD1_dependent
Fam50a 74313032 29170201 intermediatedistXist 38.06 mediumexpressed 42.75 mediumsilencing nonOct4target nonYY1target SmcHD1_dependent
Fgf13 59062145 44421088 intermediatedistXist 1.44 lowexpressed 17.34 fastsilencing nonOct4target nonYY1target SmcHD1_not_dependent
Fhl1 56731760 46751473 intermediatedistXist 44.44 mediumexpressed 16.09 fastsilencing nonOct4target nonYY1target SmcHD1_partially_dependent
Firre 50555743 52927490 intermediatedistXist 90.02 mediumexpressed 10.95 fastsilencing Oct4target YY1target SmcHD1_not_dependent
Flna 74223460 29259773 intermediatedistXist 26.78 mediumexpressed 28.59 mediumsilencing nonOct4target nonYY1target MEF_escapee
Fmr1 68678540 34804693 intermediatedistXist 468.42 highexpressed 56.37 slowsilencing nonOct4target nonYY1target SmcHD1_partially_dependent
Fmr1nb 68761838 34721395 intermediatedistXist 31.07 mediumexpressed 23.18 fastsilencing nonOct4target YY1target NA
Foxo4 101254527 2228706 neartoXist 36.17 mediumexpressed 31.23 mediumsilencing nonOct4target nonYY1target SmcHD1_dependent
Ftsj1 8238667 95244566 farfromXist 18.60 mediumexpressed 97.83 slowsilencing Oct4target nonYY1target SmcHD1_partially_dependent
Fundc1 17556568 85926665 farfromXist 71.98 mediumexpressed 80.56 slowsilencing Oct4target YY1target SmcHD1_partially_dependent
Fundc2 75382398 28100835 intermediatedistXist 257.24 highexpressed 51.31 slowsilencing nonOct4target YY1target SmcHD1_not_dependent
G6pdx 74409485 29073748 intermediatedistXist 13.05 mediumexpressed 42.84 mediumsilencing nonOct4target nonYY1target SmcHD1_partially_dependent
Gab3 74988544 28494689 intermediatedistXist 0.66 lowexpressed 44.32 mediumsilencing nonOct4target nonYY1target SmcHD1_not_dependent
Gabre 72257431 31225802 intermediatedistXist 23.08 mediumexpressed 25.89 mediumsilencing nonOct4target nonYY1target SmcHD1_not_dependent
Gdi1 74305011 29178222 intermediatedistXist 124.11 highexpressed 49.66 slowsilencing nonOct4target YY1target MEF_escapee
Glod5 8004200 95479033 farfromXist 33.47 mediumexpressed 27.76 mediumsilencing Oct4target nonYY1target NA
Gm10474 68667513 34815720 intermediatedistXist 3.83 lowexpressed 26.40 mediumsilencing nonOct4target nonYY1target NA
Gm14634 12762277 90720956 farfromXist 0.43 lowexpressed 53.44 slowsilencing Oct4target YY1target NA
Gm364 57409148 46074085 intermediatedistXist 13.45 mediumexpressed 16.67 fastsilencing nonOct4target nonYY1target NA
Gm6938 21312209 82171024 farfromXist 2.18 lowexpressed 52.52 slowsilencing nonOct4target nonYY1target NA
Gm7173 79482567 24000666 intermediatedistXist 3.32 lowexpressed 13.05 fastsilencing nonOct4target nonYY1target NA
Gm8787 79330512 24152721 intermediatedistXist 1.93 lowexpressed 12.68 fastsilencing nonOct4target nonYY1target NA
Gpc3 52272426 51210807 intermediatedistXist 16.99 mediumexpressed 15.20 fastsilencing nonOct4target nonYY1target SmcHD1_not_dependent
Gpc4 52053017 51430216 intermediatedistXist 2.23 lowexpressed 13.13 fastsilencing Oct4target nonYY1target SmcHD1_not_dependent
Gpkow 7697133 95786100 farfromXist 44.86 mediumexpressed 63.59 slowsilencing nonOct4target YY1target MEF_escapee
Gria3 41401300 62081933 intermediatedistXist 1.33 lowexpressed 28.66 mediumsilencing nonOct4target nonYY1target SmcHD1_not_dependent
Gripap1 7789992 95693241 farfromXist 5.08 lowexpressed 58.66 slowsilencing nonOct4target YY1target SmcHD1_partially_dependent
Gspt2 94636068 8847165 neartoXist 286.92 highexpressed 32.20 mediumsilencing nonOct4target nonYY1target SmcHD1_not_dependent
Gyk 85701936 17781297 intermediatedistXist 74.32 mediumexpressed 24.28 mediumsilencing nonOct4target nonYY1target NA
Haus7 73437314 30045919 intermediatedistXist 18.40 mediumexpressed 70.56 slowsilencing nonOct4target nonYY1target SmcHD1_partially_dependent
Hcfc1 73942791 29540442 intermediatedistXist 59.57 mediumexpressed 54.39 slowsilencing Oct4target YY1target SmcHD1_partially_dependent
Hdac6 7930121 95553112 farfromXist 23.09 mediumexpressed 69.58 slowsilencing nonOct4target nonYY1target SmcHD1_dependent
Hdac8 102284639 1198594 neartoXist 3.26 lowexpressed 23.12 fastsilencing nonOct4target nonYY1target SmcHD1_partially_dependent
Heph 96455435 7027798 neartoXist 1.27 lowexpressed 5.02 fastsilencing nonOct4target nonYY1target NA
Hmgb3 71555992 31927241 intermediatedistXist 145.33 highexpressed 31.82 mediumsilencing Oct4target nonYY1target SmcHD1_not_dependent
Hprt 52988077 50495156 intermediatedistXist 419.93 highexpressed 44.45 mediumsilencing nonOct4target nonYY1target SmcHD1_partially_dependent
Table A1: Key information and classification of chrX genes
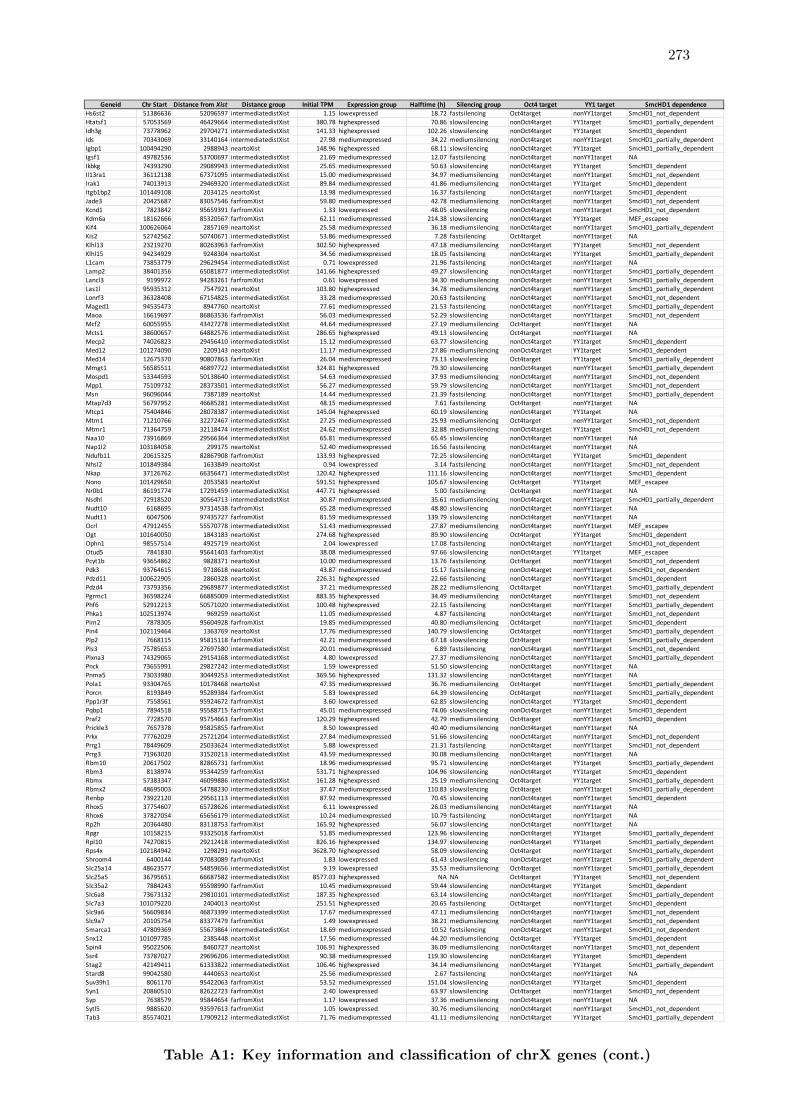
273
Geneid Chr Start Distance from Xist Distance group Initial TPM Expression group Halftime (h) Silencing group Oct4 target YY1 target SmcHD1 dependenceHs6st2 51386636 52096597 intermediatedistXist 1.15 lowexpressed 18.72 fastsilencing Oct4target nonYY1target SmcHD1_not_dependent
Htatsf1 57053569 46429664 intermediatedistXist 380.78 highexpressed 70.86 slowsilencing nonOct4target YY1target SmcHD1_partially_dependent
Idh3g 73778962 29704271 intermediatedistXist 141.33 highexpressed 102.26 slowsilencing nonOct4target YY1target SmcHD1_dependent
Ids 70343069 33140164 intermediatedistXist 27.98 mediumexpressed 34.22 mediumsilencing nonOct4target nonYY1target SmcHD1_partially_dependent
Igbp1 100494290 2988943 neartoXist 148.96 highexpressed 68.11 slowsilencing nonOct4target YY1target SmcHD1_partially_dependent
Igsf1 49782536 53700697 intermediatedistXist 21.69 mediumexpressed 12.07 fastsilencing nonOct4target nonYY1target NA
Ikbkg 74393290 29089943 intermediatedistXist 25.65 mediumexpressed 50.63 slowsilencing nonOct4target YY1target SmcHD1_dependent
Il13ra1 36112138 67371095 intermediatedistXist 15.00 mediumexpressed 34.97 mediumsilencing nonOct4target nonYY1target SmcHD1_not_dependent
Irak1 74013913 29469320 intermediatedistXist 89.84 mediumexpressed 41.86 mediumsilencing nonOct4target YY1target SmcHD1_dependent
Itgb1bp2 101449108 2034125 neartoXist 13.98 mediumexpressed 16.37 fastsilencing nonOct4target nonYY1target SmcHD1_dependent
Jade3 20425687 83057546 farfromXist 59.80 mediumexpressed 42.78 mediumsilencing nonOct4target nonYY1target SmcHD1_not_dependent
Kcnd1 7823842 95659391 farfromXist 1.33 lowexpressed 48.05 slowsilencing nonOct4target nonYY1target SmcHD1_not_dependent
Kdm6a 18162666 85320567 farfromXist 62.11 mediumexpressed 214.38 slowsilencing nonOct4target YY1target MEF_escapee
Kif4 100626064 2857169 neartoXist 25.58 mediumexpressed 36.18 mediumsilencing nonOct4target nonYY1target SmcHD1_partially_dependent
Kis2 52742562 50740671 intermediatedistXist 53.86 mediumexpressed 7.28 fastsilencing Oct4target nonYY1target NA
Klhl13 23219270 80263963 farfromXist 302.50 highexpressed 47.18 mediumsilencing nonOct4target YY1target SmcHD1_not_dependent
Klhl15 94234929 9248304 neartoXist 34.56 mediumexpressed 18.05 fastsilencing nonOct4target YY1target SmcHD1_partially_dependent
L1cam 73853779 29629454 intermediatedistXist 0.71 lowexpressed 21.96 fastsilencing nonOct4target nonYY1target NA
Lamp2 38401356 65081877 intermediatedistXist 141.66 highexpressed 49.27 slowsilencing nonOct4target nonYY1target SmcHD1_partially_dependent
Lancl3 9199972 94283261 farfromXist 0.61 lowexpressed 34.30 mediumsilencing nonOct4target nonYY1target SmcHD1_partially_dependent
Las1l 95935312 7547921 neartoXist 103.80 highexpressed 34.78 mediumsilencing nonOct4target nonYY1target SmcHD1_partially_dependent
Lonrf3 36328408 67154825 intermediatedistXist 33.28 mediumexpressed 20.63 fastsilencing nonOct4target nonYY1target SmcHD1_not_dependent
Maged1 94535473 8947760 neartoXist 77.61 mediumexpressed 21.53 fastsilencing nonOct4target nonYY1target SmcHD1_partially_dependent
Maoa 16619697 86863536 farfromXist 56.03 mediumexpressed 52.29 slowsilencing nonOct4target nonYY1target SmcHD1_not_dependent
Mcf2 60055955 43427278 intermediatedistXist 44.64 mediumexpressed 27.19 mediumsilencing Oct4target nonYY1target NA
Mcts1 38600657 64882576 intermediatedistXist 286.65 highexpressed 49.13 slowsilencing Oct4target nonYY1target NA
Mecp2 74026823 29456410 intermediatedistXist 15.12 mediumexpressed 63.77 slowsilencing nonOct4target YY1target SmcHD1_dependent
Med12 101274090 2209143 neartoXist 11.17 mediumexpressed 27.86 mediumsilencing nonOct4target YY1target SmcHD1_dependent
Med14 12675370 90807863 farfromXist 26.04 mediumexpressed 73.13 slowsilencing Oct4target YY1target SmcHD1_partially_dependent
Mmgt1 56585511 46897722 intermediatedistXist 324.81 highexpressed 79.30 slowsilencing nonOct4target nonYY1target SmcHD1_partially_dependent
Mospd1 53344593 50138640 intermediatedistXist 54.63 mediumexpressed 37.93 mediumsilencing nonOct4target nonYY1target SmcHD1_not_dependent
Mpp1 75109732 28373501 intermediatedistXist 56.27 mediumexpressed 59.79 slowsilencing nonOct4target nonYY1target SmcHD1_not_dependent
Msn 96096044 7387189 neartoXist 14.44 mediumexpressed 21.39 fastsilencing nonOct4target nonYY1target SmcHD1_partially_dependent
Mtap7d3 56797952 46685281 intermediatedistXist 48.15 mediumexpressed 7.61 fastsilencing Oct4target nonYY1target NA
Mtcp1 75404846 28078387 intermediatedistXist 145.04 highexpressed 60.19 slowsilencing nonOct4target YY1target NA
Mtm1 71210766 32272467 intermediatedistXist 27.25 mediumexpressed 25.93 mediumsilencing Oct4target nonYY1target SmcHD1_not_dependent
Mtmr1 71364759 32118474 intermediatedistXist 24.62 mediumexpressed 32.88 mediumsilencing nonOct4target YY1target SmcHD1_not_dependent
Naa10 73916869 29566364 intermediatedistXist 65.81 mediumexpressed 65.45 slowsilencing nonOct4target nonYY1target NA
Nap1l2 103184058 299175 neartoXist 52.40 mediumexpressed 16.56 fastsilencing nonOct4target nonYY1target NA
Ndufb11 20615325 82867908 farfromXist 133.93 highexpressed 72.25 slowsilencing nonOct4target YY1target SmcHD1_dependent
Nhsl2 101849384 1633849 neartoXist 0.94 lowexpressed 3.14 fastsilencing nonOct4target nonYY1target SmcHD1_not_dependent
Nkap 37126762 66356471 intermediatedistXist 120.42 highexpressed 111.16 slowsilencing nonOct4target nonYY1target SmcHD1_dependent
Nono 101429650 2053583 neartoXist 591.51 highexpressed 105.67 slowsilencing Oct4target YY1target MEF_escapee
Nr0b1 86191774 17291459 intermediatedistXist 447.71 highexpressed 5.00 fastsilencing Oct4target nonYY1target NA
Nsdhl 72918520 30564713 intermediatedistXist 30.87 mediumexpressed 35.61 mediumsilencing nonOct4target nonYY1target SmcHD1_partially_dependent
Nudt10 6168695 97314538 farfromXist 65.28 mediumexpressed 48.80 slowsilencing nonOct4target nonYY1target NA
Nudt11 6047506 97435727 farfromXist 81.59 mediumexpressed 139.79 slowsilencing nonOct4target nonYY1target NA
Ocrl 47912455 55570778 intermediatedistXist 51.43 mediumexpressed 27.87 mediumsilencing nonOct4target nonYY1target MEF_escapee
Ogt 101640050 1843183 neartoXist 274.68 highexpressed 89.90 slowsilencing Oct4target YY1target SmcHD1_dependent
Ophn1 98557514 4925719 neartoXist 2.04 lowexpressed 17.08 fastsilencing nonOct4target nonYY1target SmcHD1_not_dependent
Otud5 7841830 95641403 farfromXist 38.08 mediumexpressed 97.66 slowsilencing nonOct4target YY1target MEF_escapee
Pcyt1b 93654862 9828371 neartoXist 10.00 mediumexpressed 13.76 fastsilencing Oct4target nonYY1target SmcHD1_not_dependent
Pdk3 93764615 9718618 neartoXist 43.87 mediumexpressed 15.17 fastsilencing nonOct4target nonYY1target SmcHD1_not_dependent
Pdzd11 100622905 2860328 neartoXist 226.31 highexpressed 22.66 fastsilencing nonOct4target nonYY1target SmcHD1_dependent
Pdzd4 73793356 29689877 intermediatedistXist 37.21 mediumexpressed 28.22 mediumsilencing Oct4target nonYY1target SmcHD1_partially_dependent
Pgrmc1 36598224 66885009 intermediatedistXist 883.35 highexpressed 34.49 mediumsilencing nonOct4target nonYY1target SmcHD1_not_dependent
Phf6 52912213 50571020 intermediatedistXist 100.48 highexpressed 22.15 fastsilencing nonOct4target nonYY1target SmcHD1_partially_dependent
Phka1 102513974 969259 neartoXist 11.05 mediumexpressed 4.87 fastsilencing nonOct4target nonYY1target SmcHD1_not_dependent
Pim2 7878305 95604928 farfromXist 19.85 mediumexpressed 40.80 mediumsilencing Oct4target nonYY1target SmcHD1_dependent
Pin4 102119464 1363769 neartoXist 17.76 mediumexpressed 140.79 slowsilencing Oct4target nonYY1target SmcHD1_partially_dependent
Plp2 7668115 95815118 farfromXist 42.21 mediumexpressed 67.18 slowsilencing Oct4target nonYY1target SmcHD1_partially_dependent
Pls3 75785653 27697580 intermediatedistXist 20.01 mediumexpressed 6.89 fastsilencing nonOct4target nonYY1target SmcHD1_not_dependent
Plxna3 74329065 29154168 intermediatedistXist 4.80 lowexpressed 27.37 mediumsilencing nonOct4target nonYY1target SmcHD1_partially_dependent
Pnck 73655991 29827242 intermediatedistXist 1.59 lowexpressed 51.50 slowsilencing nonOct4target nonYY1target NA
Pnma5 73033980 30449253 intermediatedistXist 369.56 highexpressed 131.32 slowsilencing nonOct4target nonYY1target NA
Pola1 93304765 10178468 neartoXist 47.35 mediumexpressed 36.76 mediumsilencing Oct4target nonYY1target SmcHD1_partially_dependent
Porcn 8193849 95289384 farfromXist 5.83 lowexpressed 64.39 slowsilencing Oct4target nonYY1target SmcHD1_partially_dependent
Ppp1r3f 7558561 95924672 farfromXist 3.60 lowexpressed 62.85 slowsilencing nonOct4target YY1target SmcHD1_dependent
Pqbp1 7894518 95588715 farfromXist 45.01 mediumexpressed 74.06 slowsilencing nonOct4target nonYY1target SmcHD1_dependent
Praf2 7728570 95754663 farfromXist 120.29 highexpressed 42.79 mediumsilencing Oct4target nonYY1target SmcHD1_dependent
Prickle3 7657378 95825855 farfromXist 8.50 lowexpressed 40.40 mediumsilencing nonOct4target nonYY1target NA
Prkx 77762029 25721204 intermediatedistXist 27.84 mediumexpressed 51.66 slowsilencing nonOct4target nonYY1target SmcHD1_not_dependent
Prrg1 78449609 25033624 intermediatedistXist 5.88 lowexpressed 21.31 fastsilencing nonOct4target nonYY1target SmcHD1_not_dependent
Prrg3 71963020 31520213 intermediatedistXist 43.59 mediumexpressed 30.08 mediumsilencing nonOct4target nonYY1target NA
Rbm10 20617502 82865731 farfromXist 18.96 mediumexpressed 95.71 slowsilencing nonOct4target YY1target SmcHD1_partially_dependent
Rbm3 8138974 95344259 farfromXist 531.71 highexpressed 104.96 slowsilencing nonOct4target YY1target SmcHD1_dependent
Rbmx 57383347 46099886 intermediatedistXist 161.28 highexpressed 25.19 mediumsilencing Oct4target YY1target SmcHD1_partially_dependent
Rbmx2 48695003 54788230 intermediatedistXist 37.47 mediumexpressed 110.83 slowsilencing Oct4target nonYY1target SmcHD1_partially_dependent
Renbp 73922120 29561113 intermediatedistXist 87.92 mediumexpressed 70.45 slowsilencing nonOct4target nonYY1target SmcHD1_dependent
Rhox5 37754607 65728626 intermediatedistXist 6.11 lowexpressed 26.03 mediumsilencing nonOct4target nonYY1target NA
Rhox6 37827054 65656179 intermediatedistXist 10.24 mediumexpressed 10.79 fastsilencing nonOct4target nonYY1target NA
Rp2h 20364480 83118753 farfromXist 165.92 highexpressed 56.07 slowsilencing nonOct4target nonYY1target NA
Rpgr 10158215 93325018 farfromXist 51.85 mediumexpressed 123.96 slowsilencing nonOct4target YY1target SmcHD1_partially_dependent
Rpl10 74270815 29212418 intermediatedistXist 826.16 highexpressed 134.97 slowsilencing nonOct4target YY1target SmcHD1_partially_dependent
Rps4x 102184942 1298291 neartoXist 3628.70 highexpressed 58.09 slowsilencing Oct4target nonYY1target SmcHD1_partially_dependent
Shroom4 6400144 97083089 farfromXist 1.83 lowexpressed 61.43 slowsilencing nonOct4target nonYY1target SmcHD1_partially_dependent
Slc25a14 48623577 54859656 intermediatedistXist 9.19 lowexpressed 35.53 mediumsilencing Oct4target nonYY1target SmcHD1_partially_dependent
Slc25a5 36795651 66687582 intermediatedistXist 8577.03 highexpressed NA NA Oct4target YY1target SmcHD1_not_dependent
Slc35a2 7884243 95598990 farfromXist 10.45 mediumexpressed 59.44 slowsilencing nonOct4target YY1target SmcHD1_dependent
Slc6a8 73673132 29810101 intermediatedistXist 187.35 highexpressed 63.14 slowsilencing nonOct4target nonYY1target SmcHD1_partially_dependent
Slc7a3 101079220 2404013 neartoXist 251.51 highexpressed 20.65 fastsilencing Oct4target nonYY1target SmcHD1_dependent
Slc9a6 56609834 46873399 intermediatedistXist 17.67 mediumexpressed 47.11 mediumsilencing nonOct4target nonYY1target SmcHD1_not_dependent
Slc9a7 20105754 83377479 farfromXist 1.49 lowexpressed 38.21 mediumsilencing nonOct4target nonYY1target SmcHD1_not_dependent
Smarca1 47809369 55673864 intermediatedistXist 18.69 mediumexpressed 10.52 fastsilencing nonOct4target nonYY1target SmcHD1_not_dependent
Snx12 101097785 2385448 neartoXist 17.56 mediumexpressed 44.20 mediumsilencing Oct4target YY1target SmcHD1_dependent
Spin4 95022506 8460727 neartoXist 106.91 highexpressed 36.09 mediumsilencing nonOct4target nonYY1target SmcHD1_not_dependent
Ssr4 73787027 29696206 intermediatedistXist 90.38 mediumexpressed 119.30 slowsilencing nonOct4target YY1target SmcHD1_dependent
Stag2 42149411 61333822 intermediatedistXist 106.46 highexpressed 34.14 mediumsilencing nonOct4target YY1target SmcHD1_partially_dependent
Stard8 99042580 4440653 neartoXist 25.56 mediumexpressed 2.67 fastsilencing nonOct4target nonYY1target NA
Suv39h1 8061170 95422063 farfromXist 53.52 mediumexpressed 151.04 slowsilencing nonOct4target YY1target SmcHD1_dependent
Syn1 20860510 82622723 farfromXist 2.40 lowexpressed 63.97 slowsilencing Oct4target nonYY1target SmcHD1_not_dependent
Syp 7638579 95844654 farfromXist 1.17 lowexpressed 37.36 mediumsilencing nonOct4target nonYY1target NA
Sytl5 9885620 93597613 farfromXist 1.05 lowexpressed 30.76 mediumsilencing nonOct4target nonYY1target SmcHD1_not_dependent
Tab3 85574021 17909212 intermediatedistXist 71.76 mediumexpressed 41.11 mediumsilencing nonOct4target YY1target SmcHD1_partially_dependent
Table A1: Key information and classification of chrX genes (cont.)
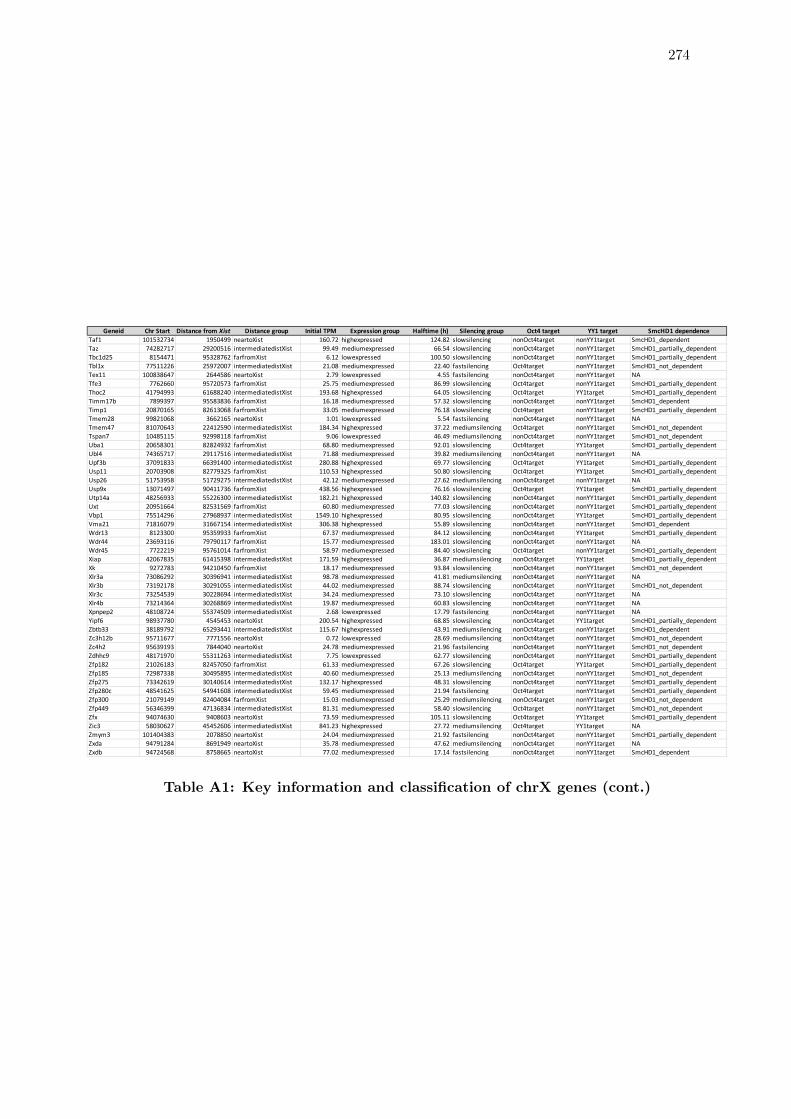
274
Geneid Chr Start Distance from Xist Distance group Initial TPM Expression group Halftime (h) Silencing group Oct4 target YY1 target SmcHD1 dependenceTaf1 101532734 1950499 neartoXist 160.72 highexpressed 124.82 slowsilencing nonOct4target nonYY1target SmcHD1_dependent
Taz 74282717 29200516 intermediatedistXist 99.49 mediumexpressed 66.54 slowsilencing nonOct4target nonYY1target SmcHD1_partially_dependent
Tbc1d25 8154471 95328762 farfromXist 6.12 lowexpressed 100.50 slowsilencing nonOct4target nonYY1target SmcHD1_partially_dependent
Tbl1x 77511226 25972007 intermediatedistXist 21.08 mediumexpressed 22.40 fastsilencing Oct4target nonYY1target SmcHD1_not_dependent
Tex11 100838647 2644586 neartoXist 2.79 lowexpressed 4.55 fastsilencing nonOct4target nonYY1target NA
Tfe3 7762660 95720573 farfromXist 25.75 mediumexpressed 86.99 slowsilencing Oct4target nonYY1target SmcHD1_partially_dependent
Thoc2 41794993 61688240 intermediatedistXist 193.68 highexpressed 64.05 slowsilencing Oct4target YY1target SmcHD1_partially_dependent
Timm17b 7899397 95583836 farfromXist 16.18 mediumexpressed 57.32 slowsilencing nonOct4target nonYY1target SmcHD1_dependent
Timp1 20870165 82613068 farfromXist 33.05 mediumexpressed 76.18 slowsilencing Oct4target nonYY1target SmcHD1_partially_dependent
Tmem28 99821068 3662165 neartoXist 1.01 lowexpressed 5.54 fastsilencing nonOct4target nonYY1target NA
Tmem47 81070643 22412590 intermediatedistXist 184.34 highexpressed 37.22 mediumsilencing Oct4target nonYY1target SmcHD1_not_dependent
Tspan7 10485115 92998118 farfromXist 9.06 lowexpressed 46.49 mediumsilencing nonOct4target nonYY1target SmcHD1_not_dependent
Uba1 20658301 82824932 farfromXist 68.80 mediumexpressed 92.01 slowsilencing Oct4target YY1target SmcHD1_partially_dependent
Ubl4 74365717 29117516 intermediatedistXist 71.88 mediumexpressed 39.82 mediumsilencing nonOct4target nonYY1target NA
Upf3b 37091833 66391400 intermediatedistXist 280.88 highexpressed 69.77 slowsilencing Oct4target YY1target SmcHD1_partially_dependent
Usp11 20703908 82779325 farfromXist 110.53 highexpressed 50.80 slowsilencing Oct4target YY1target SmcHD1_partially_dependent
Usp26 51753958 51729275 intermediatedistXist 42.12 mediumexpressed 27.62 mediumsilencing nonOct4target nonYY1target NA
Usp9x 13071497 90411736 farfromXist 438.56 highexpressed 76.16 slowsilencing Oct4target YY1target SmcHD1_partially_dependent
Utp14a 48256933 55226300 intermediatedistXist 182.21 highexpressed 140.82 slowsilencing nonOct4target nonYY1target SmcHD1_partially_dependent
Uxt 20951664 82531569 farfromXist 60.80 mediumexpressed 77.03 slowsilencing nonOct4target nonYY1target SmcHD1_partially_dependent
Vbp1 75514296 27968937 intermediatedistXist 1549.10 highexpressed 80.95 slowsilencing nonOct4target YY1target SmcHD1_partially_dependent
Vma21 71816079 31667154 intermediatedistXist 306.38 highexpressed 55.89 slowsilencing nonOct4target nonYY1target SmcHD1_dependent
Wdr13 8123300 95359933 farfromXist 67.37 mediumexpressed 84.12 slowsilencing nonOct4target YY1target SmcHD1_partially_dependent
Wdr44 23693116 79790117 farfromXist 15.77 mediumexpressed 183.01 slowsilencing nonOct4target nonYY1target NA
Wdr45 7722219 95761014 farfromXist 58.97 mediumexpressed 84.40 slowsilencing Oct4target nonYY1target SmcHD1_partially_dependent
Xiap 42067835 61415398 intermediatedistXist 171.59 highexpressed 36.87 mediumsilencing nonOct4target YY1target SmcHD1_partially_dependent
Xk 9272783 94210450 farfromXist 18.17 mediumexpressed 93.84 slowsilencing nonOct4target nonYY1target SmcHD1_not_dependent
Xlr3a 73086292 30396941 intermediatedistXist 98.78 mediumexpressed 41.81 mediumsilencing nonOct4target nonYY1target NA
Xlr3b 73192178 30291055 intermediatedistXist 44.02 mediumexpressed 88.74 slowsilencing nonOct4target nonYY1target SmcHD1_not_dependent
Xlr3c 73254539 30228694 intermediatedistXist 34.24 mediumexpressed 73.10 slowsilencing nonOct4target nonYY1target NA
Xlr4b 73214364 30268869 intermediatedistXist 19.87 mediumexpressed 60.83 slowsilencing nonOct4target nonYY1target NA
Xpnpep2 48108724 55374509 intermediatedistXist 2.68 lowexpressed 17.79 fastsilencing nonOct4target nonYY1target NA
Yipf6 98937780 4545453 neartoXist 200.54 highexpressed 68.85 slowsilencing nonOct4target YY1target SmcHD1_partially_dependent
Zbtb33 38189792 65293441 intermediatedistXist 115.67 highexpressed 43.91 mediumsilencing nonOct4target nonYY1target SmcHD1_dependent
Zc3h12b 95711677 7771556 neartoXist 0.72 lowexpressed 28.69 mediumsilencing nonOct4target nonYY1target SmcHD1_not_dependent
Zc4h2 95639193 7844040 neartoXist 24.78 mediumexpressed 21.96 fastsilencing nonOct4target nonYY1target SmcHD1_not_dependent
Zdhhc9 48171970 55311263 intermediatedistXist 7.75 lowexpressed 62.77 slowsilencing nonOct4target nonYY1target SmcHD1_partially_dependent
Zfp182 21026183 82457050 farfromXist 61.33 mediumexpressed 67.26 slowsilencing Oct4target YY1target SmcHD1_partially_dependent
Zfp185 72987338 30495895 intermediatedistXist 40.60 mediumexpressed 25.13 mediumsilencing nonOct4target nonYY1target SmcHD1_not_dependent
Zfp275 73342619 30140614 intermediatedistXist 132.17 highexpressed 48.31 slowsilencing nonOct4target nonYY1target SmcHD1_partially_dependent
Zfp280c 48541625 54941608 intermediatedistXist 59.45 mediumexpressed 21.94 fastsilencing Oct4target nonYY1target SmcHD1_partially_dependent
Zfp300 21079149 82404084 farfromXist 15.03 mediumexpressed 25.29 mediumsilencing nonOct4target nonYY1target SmcHD1_not_dependent
Zfp449 56346399 47136834 intermediatedistXist 81.31 mediumexpressed 58.40 slowsilencing Oct4target nonYY1target SmcHD1_not_dependent
Zfx 94074630 9408603 neartoXist 73.59 mediumexpressed 105.11 slowsilencing Oct4target YY1target SmcHD1_partially_dependent
Zic3 58030627 45452606 intermediatedistXist 841.23 highexpressed 27.72 mediumsilencing Oct4target YY1target NA
Zmym3 101404383 2078850 neartoXist 24.04 mediumexpressed 21.92 fastsilencing nonOct4target nonYY1target SmcHD1_partially_dependent
Zxda 94791284 8691949 neartoXist 35.78 mediumexpressed 47.62 mediumsilencing nonOct4target nonYY1target NA
Zxdb 94724568 8758665 neartoXist 77.02 mediumexpressed 17.14 fastsilencing nonOct4target nonYY1target SmcHD1_dependent
Table A1: Key information and classification of chrX genes (cont.)
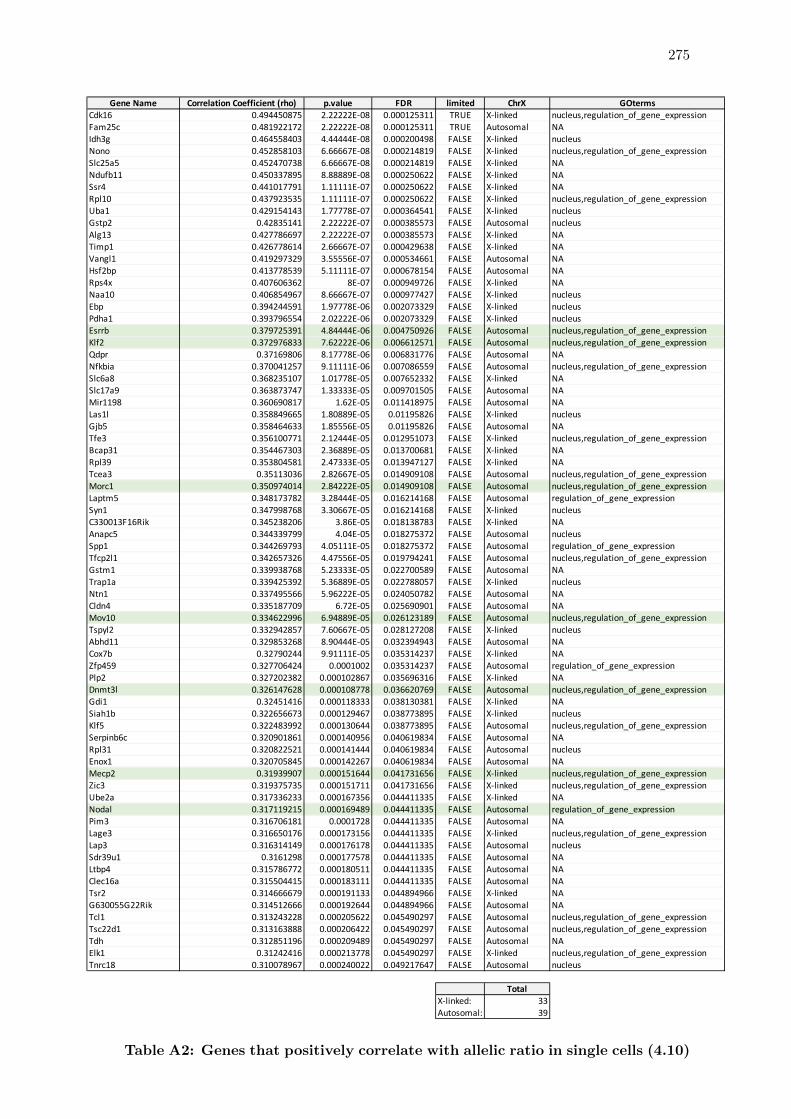
275
Gene Name Correlation Coefficient (rho) p.value FDR limited ChrX GOtermsCdk16 0.494450875 2.22222E-08 0.000125311 TRUE X-linked nucleus,regulation_of_gene_expressionFam25c 0.481922172 2.22222E-08 0.000125311 TRUE Autosomal NAIdh3g 0.464558403 4.44444E-08 0.000200498 FALSE X-linked nucleusNono 0.452858103 6.66667E-08 0.000214819 FALSE X-linked nucleus,regulation_of_gene_expressionSlc25a5 0.452470738 6.66667E-08 0.000214819 FALSE X-linked NANdufb11 0.450337895 8.88889E-08 0.000250622 FALSE X-linked NASsr4 0.441017791 1.11111E-07 0.000250622 FALSE X-linked NARpl10 0.437923535 1.11111E-07 0.000250622 FALSE X-linked nucleus,regulation_of_gene_expressionUba1 0.429154143 1.77778E-07 0.000364541 FALSE X-linked nucleusGstp2 0.42835141 2.22222E-07 0.000385573 FALSE Autosomal nucleusAlg13 0.427786697 2.22222E-07 0.000385573 FALSE X-linked NATimp1 0.426778614 2.66667E-07 0.000429638 FALSE X-linked NAVangl1 0.419297329 3.55556E-07 0.000534661 FALSE Autosomal NAHsf2bp 0.413778539 5.11111E-07 0.000678154 FALSE Autosomal NARps4x 0.407606362 8E-07 0.000949726 FALSE X-linked NANaa10 0.406854967 8.66667E-07 0.000977427 FALSE X-linked nucleusEbp 0.394244591 1.97778E-06 0.002073329 FALSE X-linked nucleusPdha1 0.393796554 2.02222E-06 0.002073329 FALSE X-linked nucleusEsrrb 0.379725391 4.84444E-06 0.004750926 FALSE Autosomal nucleus,regulation_of_gene_expressionKlf2 0.372976833 7.62222E-06 0.006612571 FALSE Autosomal nucleus,regulation_of_gene_expressionQdpr 0.37169806 8.17778E-06 0.006831776 FALSE Autosomal NANfkbia 0.370041257 9.11111E-06 0.007086559 FALSE Autosomal nucleus,regulation_of_gene_expressionSlc6a8 0.368235107 1.01778E-05 0.007652332 FALSE X-linked NASlc17a9 0.363873747 1.33333E-05 0.009701505 FALSE Autosomal NAMir1198 0.360690817 1.62E-05 0.011418975 FALSE Autosomal NALas1l 0.358849665 1.80889E-05 0.01195826 FALSE X-linked nucleusGjb5 0.358464633 1.85556E-05 0.01195826 FALSE Autosomal NATfe3 0.356100771 2.12444E-05 0.012951073 FALSE X-linked nucleus,regulation_of_gene_expressionBcap31 0.354467303 2.36889E-05 0.013700681 FALSE X-linked NARpl39 0.353804581 2.47333E-05 0.013947127 FALSE X-linked NATcea3 0.35113036 2.82667E-05 0.014909108 FALSE Autosomal nucleus,regulation_of_gene_expressionMorc1 0.350974014 2.84222E-05 0.014909108 FALSE Autosomal nucleus,regulation_of_gene_expressionLaptm5 0.348173782 3.28444E-05 0.016214168 FALSE Autosomal regulation_of_gene_expressionSyn1 0.347998768 3.30667E-05 0.016214168 FALSE X-linked nucleusC330013F16Rik 0.345238206 3.86E-05 0.018138783 FALSE X-linked NAAnapc5 0.344339799 4.04E-05 0.018275372 FALSE Autosomal nucleusSpp1 0.344269793 4.05111E-05 0.018275372 FALSE Autosomal regulation_of_gene_expressionTfcp2l1 0.342657326 4.47556E-05 0.019794241 FALSE Autosomal nucleus,regulation_of_gene_expressionGstm1 0.339938768 5.23333E-05 0.022700589 FALSE Autosomal NATrap1a 0.339425392 5.36889E-05 0.022788057 FALSE X-linked nucleusNtn1 0.337495566 5.96222E-05 0.024050782 FALSE Autosomal NACldn4 0.335187709 6.72E-05 0.025690901 FALSE Autosomal NAMov10 0.334622996 6.94889E-05 0.026123189 FALSE Autosomal nucleus,regulation_of_gene_expressionTspyl2 0.332942857 7.60667E-05 0.028127208 FALSE X-linked nucleusAbhd11 0.329853268 8.90444E-05 0.032394943 FALSE Autosomal NACox7b 0.32790244 9.91111E-05 0.035314237 FALSE X-linked NAZfp459 0.327706424 0.0001002 0.035314237 FALSE Autosomal regulation_of_gene_expressionPlp2 0.327202382 0.000102867 0.035696316 FALSE X-linked NADnmt3l 0.326147628 0.000108778 0.036620769 FALSE Autosomal nucleus,regulation_of_gene_expressionGdi1 0.32451416 0.000118333 0.038130381 FALSE X-linked NASiah1b 0.322656673 0.000129467 0.038773895 FALSE X-linked nucleusKlf5 0.322483992 0.000130644 0.038773895 FALSE Autosomal nucleus,regulation_of_gene_expressionSerpinb6c 0.320901861 0.000140956 0.040619834 FALSE Autosomal NARpl31 0.320822521 0.000141444 0.040619834 FALSE Autosomal nucleusEnox1 0.320705845 0.000142267 0.040619834 FALSE Autosomal NAMecp2 0.31939907 0.000151644 0.041731656 FALSE X-linked nucleus,regulation_of_gene_expressionZic3 0.319375735 0.000151711 0.041731656 FALSE X-linked nucleus,regulation_of_gene_expressionUbe2a 0.317336233 0.000167356 0.044411335 FALSE X-linked NANodal 0.317119215 0.000169489 0.044411335 FALSE Autosomal regulation_of_gene_expressionPim3 0.316706181 0.0001728 0.044411335 FALSE Autosomal NALage3 0.316650176 0.000173156 0.044411335 FALSE X-linked nucleus,regulation_of_gene_expressionLap3 0.316314149 0.000176178 0.044411335 FALSE Autosomal nucleusSdr39u1 0.3161298 0.000177578 0.044411335 FALSE Autosomal NALtbp4 0.315786772 0.000180511 0.044411335 FALSE Autosomal NAClec16a 0.315504415 0.000183111 0.044411335 FALSE Autosomal NATsr2 0.314666679 0.000191133 0.044894966 FALSE X-linked NAG630055G22Rik 0.314512666 0.000192644 0.044894966 FALSE Autosomal NATcl1 0.313243228 0.000205622 0.045490297 FALSE Autosomal nucleus,regulation_of_gene_expressionTsc22d1 0.313163888 0.000206422 0.045490297 FALSE Autosomal nucleus,regulation_of_gene_expressionTdh 0.312851196 0.000209489 0.045490297 FALSE Autosomal NAElk1 0.31242416 0.000213778 0.045490297 FALSE X-linked nucleus,regulation_of_gene_expressionTnrc18 0.310078967 0.000240022 0.049217647 FALSE Autosomal nucleus
TotalX-linked: 33Autosomal: 39
Table A2: Genes that positively correlate with allelic ratio in single cells (4.10)
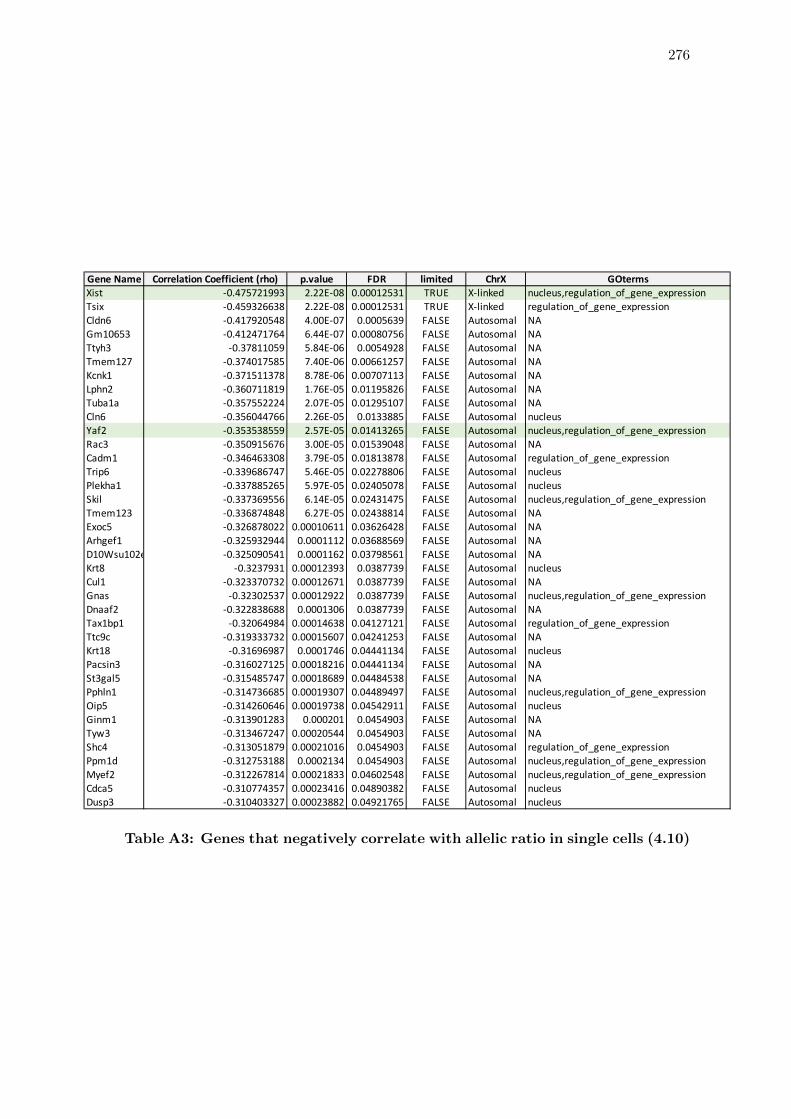
276
Gene Name Correlation Coefficient (rho) p.value FDR limited ChrX GOtermsXist -0.475721993 2.22E-08 0.00012531 TRUE X-linked nucleus,regulation_of_gene_expressionTsix -0.459326638 2.22E-08 0.00012531 TRUE X-linked regulation_of_gene_expressionCldn6 -0.417920548 4.00E-07 0.0005639 FALSE Autosomal NAGm10653 -0.412471764 6.44E-07 0.00080756 FALSE Autosomal NATtyh3 -0.37811059 5.84E-06 0.0054928 FALSE Autosomal NATmem127 -0.374017585 7.40E-06 0.00661257 FALSE Autosomal NAKcnk1 -0.371511378 8.78E-06 0.00707113 FALSE Autosomal NALphn2 -0.360711819 1.76E-05 0.01195826 FALSE Autosomal NATuba1a -0.357552224 2.07E-05 0.01295107 FALSE Autosomal NACln6 -0.356044766 2.26E-05 0.0133885 FALSE Autosomal nucleusYaf2 -0.353538559 2.57E-05 0.01413265 FALSE Autosomal nucleus,regulation_of_gene_expressionRac3 -0.350915676 3.00E-05 0.01539048 FALSE Autosomal NACadm1 -0.346463308 3.79E-05 0.01813878 FALSE Autosomal regulation_of_gene_expressionTrip6 -0.339686747 5.46E-05 0.02278806 FALSE Autosomal nucleusPlekha1 -0.337885265 5.97E-05 0.02405078 FALSE Autosomal nucleusSkil -0.337369556 6.14E-05 0.02431475 FALSE Autosomal nucleus,regulation_of_gene_expressionTmem123 -0.336874848 6.27E-05 0.02438814 FALSE Autosomal NAExoc5 -0.326878022 0.00010611 0.03626428 FALSE Autosomal NAArhgef1 -0.325932944 0.0001112 0.03688569 FALSE Autosomal NAD10Wsu102e -0.325090541 0.0001162 0.03798561 FALSE Autosomal NAKrt8 -0.3237931 0.00012393 0.0387739 FALSE Autosomal nucleusCul1 -0.323370732 0.00012671 0.0387739 FALSE Autosomal NAGnas -0.32302537 0.00012922 0.0387739 FALSE Autosomal nucleus,regulation_of_gene_expressionDnaaf2 -0.322838688 0.0001306 0.0387739 FALSE Autosomal NATax1bp1 -0.32064984 0.00014638 0.04127121 FALSE Autosomal regulation_of_gene_expressionTtc9c -0.319333732 0.00015607 0.04241253 FALSE Autosomal NAKrt18 -0.31696987 0.0001746 0.04441134 FALSE Autosomal nucleusPacsin3 -0.316027125 0.00018216 0.04441134 FALSE Autosomal NASt3gal5 -0.315485747 0.00018689 0.04484538 FALSE Autosomal NAPphln1 -0.314736685 0.00019307 0.04489497 FALSE Autosomal nucleus,regulation_of_gene_expressionOip5 -0.314260646 0.00019738 0.04542911 FALSE Autosomal nucleusGinm1 -0.313901283 0.000201 0.0454903 FALSE Autosomal NATyw3 -0.313467247 0.00020544 0.0454903 FALSE Autosomal NAShc4 -0.313051879 0.00021016 0.0454903 FALSE Autosomal regulation_of_gene_expressionPpm1d -0.312753188 0.0002134 0.0454903 FALSE Autosomal nucleus,regulation_of_gene_expressionMyef2 -0.312267814 0.00021833 0.04602548 FALSE Autosomal nucleus,regulation_of_gene_expressionCdca5 -0.310774357 0.00023416 0.04890382 FALSE Autosomal nucleusDusp3 -0.310403327 0.00023882 0.04921765 FALSE Autosomal nucleus
Table A3: Genes that negatively correlate with allelic ratio in single cells (4.10)
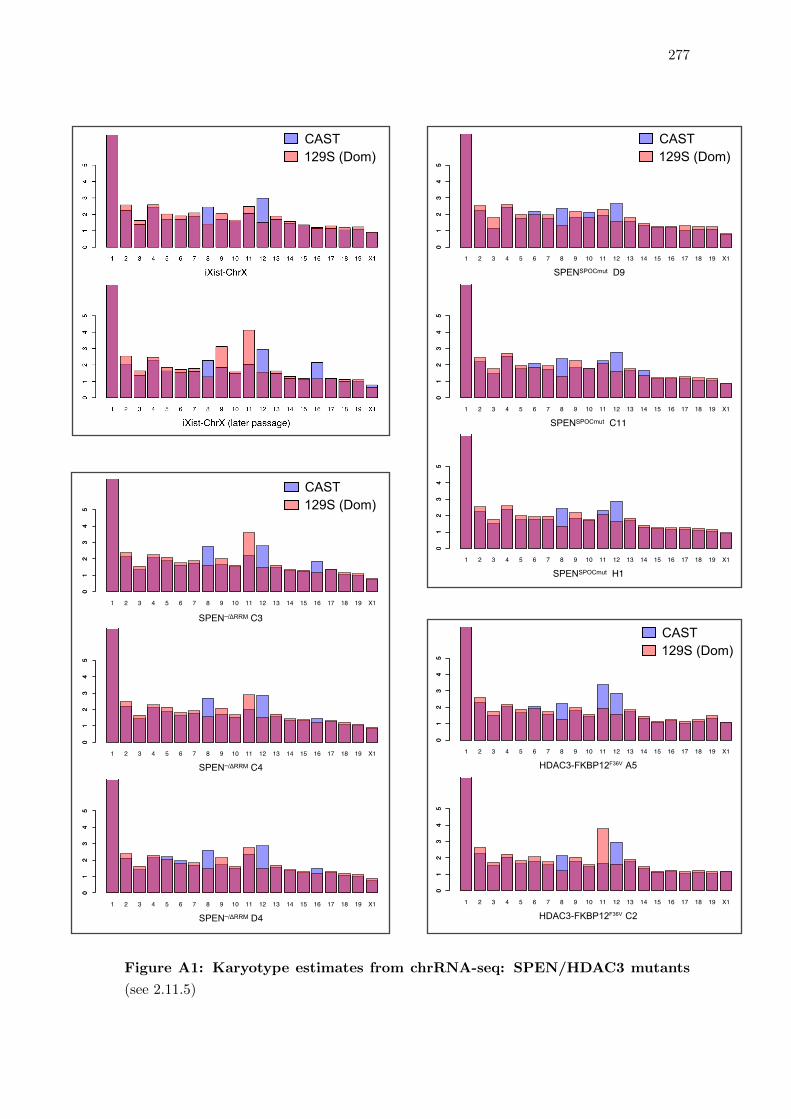
277
1 2 3 4 5 6 7 8 9 10 11 12 13 14 15 16 17 18 19 X1
HDAC3-FKBP12F36V A5
01
23
45
01
23
45
1 2 3 4 5 6 7 8 9 10 11 12 13 14 15 16 17 18 19 X1
HDAC3-FKBP12F36V C2
01
23
45
01
23
45
1 2 3 4 5 6 7 8 9 10 11 12 13 14 15 16 17 18 19 X1
SPENSPOCmut D9
01
23
45
01
23
45
1 2 3 4 5 6 7 8 9 10 11 12 13 14 15 16 17 18 19 X1
SPENSPOCmut C110
12
34
50
12
34
5
1 2 3 4 5 6 7 8 9 10 11 12 13 14 15 16 17 18 19 X1
SPENSPOCmut H1
01
23
45
01
23
45
1 2 3 4 5 6 7 8 9 10 11 12 13 14 15 16 17 18 19 X1
SPEN–/ΔRRM C3
01
23
45
01
23
45
1 2 3 4 5 6 7 8 9 10 11 12 13 14 15 16 17 18 19 X1
SPEN–/ΔRRM C4
01
23
45
01
23
45
1 2 3 4 5 6 7 8 9 10 11 12 13 14 15 16 17 18 19 X1
SPEN–/ΔRRM D4
01
23
45
01
23
45
CAST129S (Dom)
CAST129S (Dom)
CAST129S (Dom)
CAST129S (Dom)
Figure A1: Karyotype estimates from chrRNA-seq: SPEN/HDAC3 mutants
(see 2.11.5)
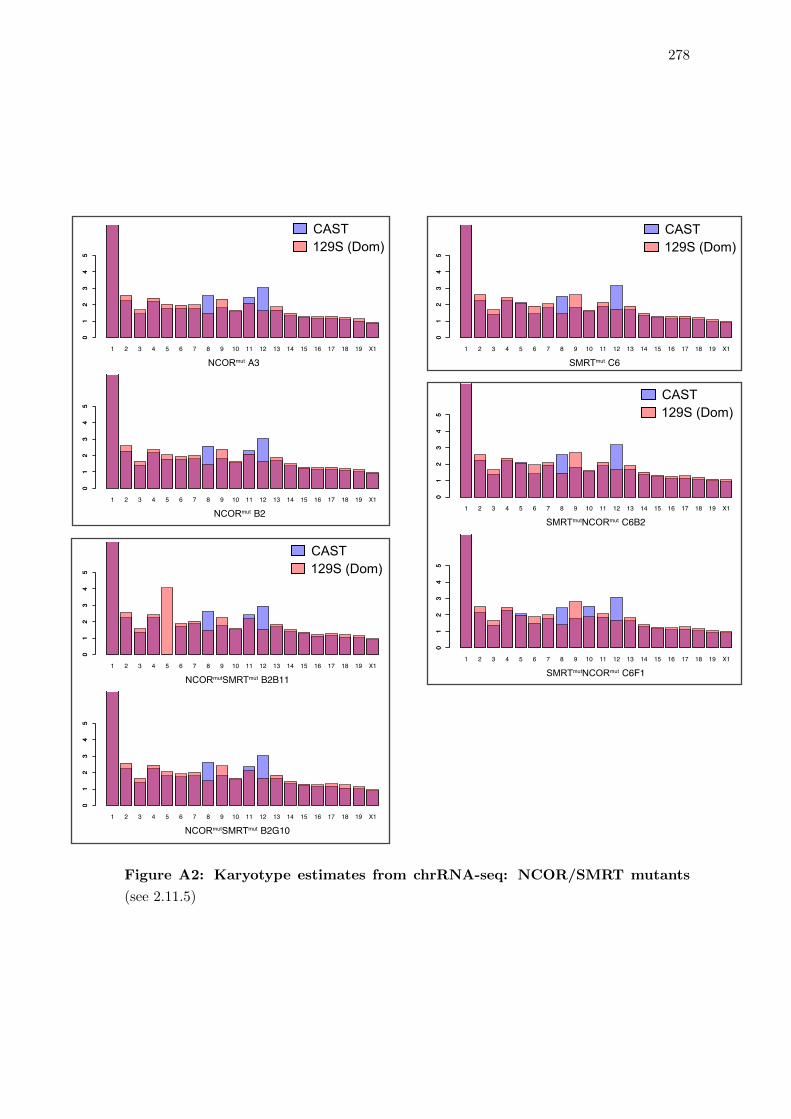
278
1 2 3 4 5 6 7 8 9 10 11 12 13 14 15 16 17 18 19 X1
NCORmut A3
01
23
45
01
23
45
1 2 3 4 5 6 7 8 9 10 11 12 13 14 15 16 17 18 19 X1
NCORmut B2
01
23
45
01
23
45
1 2 3 4 5 6 7 8 9 10 11 12 13 14 15 16 17 18 19 X1
NCORmutSMRTmut B2B11
01
23
45
01
23
45
1 2 3 4 5 6 7 8 9 10 11 12 13 14 15 16 17 18 19 X1
NCORmutSMRTmut B2G10
01
23
45
01
23
45
1 2 3 4 5 6 7 8 9 10 11 12 13 14 15 16 17 18 19 X1
SMRTmut C6
01
23
45
01
23
45
1 2 3 4 5 6 7 8 9 10 11 12 13 14 15 16 17 18 19 X1
SMRTmutNCORmut C6B2
01
23
45
01
23
45
1 2 3 4 5 6 7 8 9 10 11 12 13 14 15 16 17 18 19 X1
SMRTmutNCORmut C6F1
01
23
45
01
23
45
CAST129S (Dom)
CAST129S (Dom)
CAST129S (Dom)
CAST129S (Dom)
Figure A2: Karyotype estimates from chrRNA-seq: NCOR/SMRT mutants
(see 2.11.5)
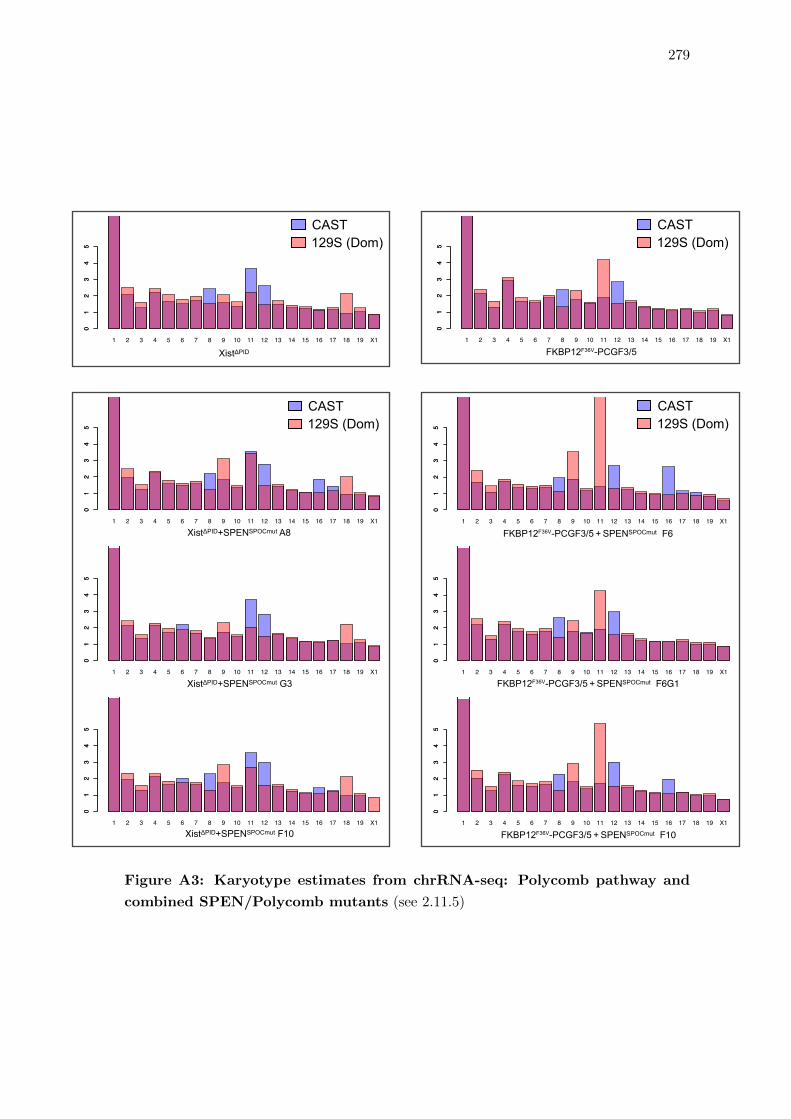
279
1 2 3 4 5 6 7 8 9 10 11 12 13 14 15 16 17 18 19 X1
XistΔPID
01
23
45
01
23
45
1 2 3 4 5 6 7 8 9 10 11 12 13 14 15 16 17 18 19 X1
XistΔPID+SPENSPOCmut A8
01
23
45
01
23
45
1 2 3 4 5 6 7 8 9 10 11 12 13 14 15 16 17 18 19 X1
XistΔPID+SPENSPOCmut G3
01
23
45
01
23
45
1 2 3 4 5 6 7 8 9 10 11 12 13 14 15 16 17 18 19 X1
XistΔPID+SPENSPOCmut F10
01
23
45
01
23
45
1 2 3 4 5 6 7 8 9 10 11 12 13 14 15 16 17 18 19 X1
FKBP12F36V-PCGF3/5
01
23
45
01
23
45
1 2 3 4 5 6 7 8 9 10 11 12 13 14 15 16 17 18 19 X1
E4E3_Rep2
01
23
45
01
23
45
1 2 3 4 5 6 7 8 9 10 11 12 13 14 15 16 17 18 19 X1
FKBP12F36V-PCGF3/5 + SPENSPOCmut F6
01
23
45
01
23
45
1 2 3 4 5 6 7 8 9 10 11 12 13 14 15 16 17 18 19 X1
FKBP12F36V-PCGF3/5 + SPENSPOCmut F6G1
01
23
45
01
23
45
1 2 3 4 5 6 7 8 9 10 11 12 13 14 15 16 17 18 19 X1
FKBP12F36V-PCGF3/5 + SPENSPOCmut F10
01
23
45
01
23
45
CAST129S (Dom)
CAST129S (Dom)
CAST129S (Dom)
CAST129S (Dom)
Figure A3: Karyotype estimates from chrRNA-seq: Polycomb pathway and
combined SPEN/Polycomb mutants (see 2.11.5)
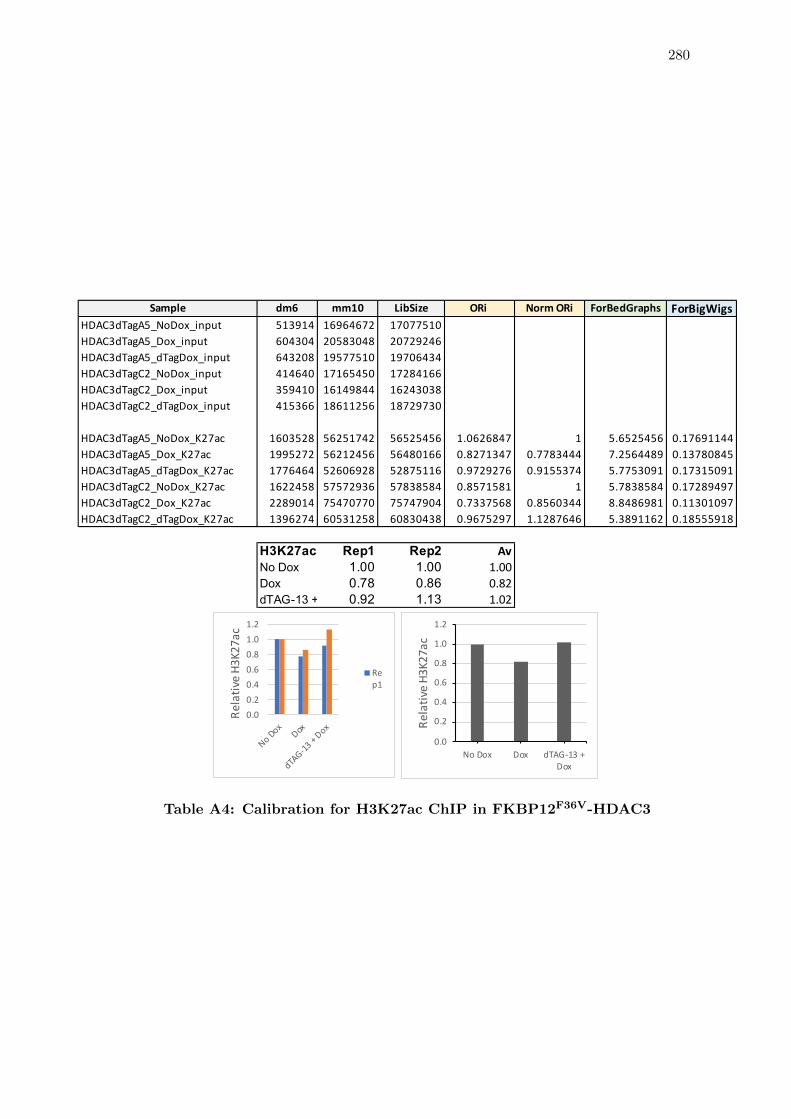
280
Sample dm6 mm10 LibSize ORi Norm ORi ForBedGraphs ForBigWigsHDAC3dTagA5_NoDox_input 513914 16964672 17077510HDAC3dTagA5_Dox_input 604304 20583048 20729246HDAC3dTagA5_dTagDox_input 643208 19577510 19706434HDAC3dTagC2_NoDox_input 414640 17165450 17284166HDAC3dTagC2_Dox_input 359410 16149844 16243038HDAC3dTagC2_dTagDox_input 415366 18611256 18729730
HDAC3dTagA5_NoDox_K27ac 1603528 56251742 56525456 1.0626847 1 5.6525456 0.17691144HDAC3dTagA5_Dox_K27ac 1995272 56212456 56480166 0.8271347 0.7783444 7.2564489 0.13780845HDAC3dTagA5_dTagDox_K27ac 1776464 52606928 52875116 0.9729276 0.9155374 5.7753091 0.17315091HDAC3dTagC2_NoDox_K27ac 1622458 57572936 57838584 0.8571581 1 5.7838584 0.17289497HDAC3dTagC2_Dox_K27ac 2289014 75470770 75747904 0.7337568 0.8560344 8.8486981 0.11301097HDAC3dTagC2_dTagDox_K27ac 1396274 60531258 60830438 0.9675297 1.1287646 5.3891162 0.18555918
H3K27ac Rep1 Rep2 AvNo Dox 1.00 1.00 1.00Dox 0.78 0.86 0.82dTAG-13 + Dox 0.92 1.13 1.02
0.00.20.40.60.81.01.2
No DoxDox
dTAG-13
+ Dox
Rela
tive
H3K2
7ac
Rep1
0.0
0.2
0.4
0.6
0.8
1.0
1.2
No Dox Dox dTAG-13 +Dox
Rela
tive
H3K2
7ac
Table A4: Calibration for H3K27ac ChIP in FKBP12F36V-HDAC3
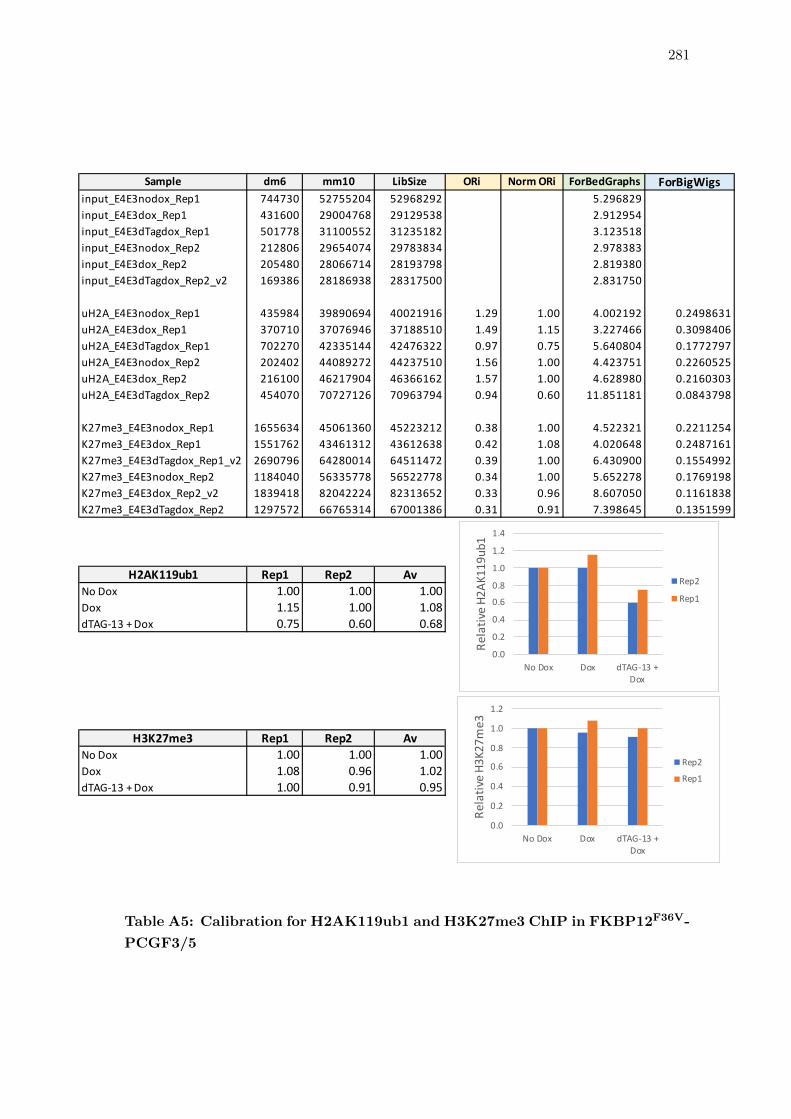
281
Sample dm6 mm10 LibSize ORi Norm ORi ForBedGraphs ForBigWigsinput_E4E3nodox_Rep1 744730 52755204 52968292 5.296829input_E4E3dox_Rep1 431600 29004768 29129538 2.912954input_E4E3dTagdox_Rep1 501778 31100552 31235182 3.123518input_E4E3nodox_Rep2 212806 29654074 29783834 2.978383input_E4E3dox_Rep2 205480 28066714 28193798 2.819380input_E4E3dTagdox_Rep2_v2 169386 28186938 28317500 2.831750
uH2A_E4E3nodox_Rep1 435984 39890694 40021916 1.29 1.00 4.002192 0.2498631uH2A_E4E3dox_Rep1 370710 37076946 37188510 1.49 1.15 3.227466 0.3098406uH2A_E4E3dTagdox_Rep1 702270 42335144 42476322 0.97 0.75 5.640804 0.1772797uH2A_E4E3nodox_Rep2 202402 44089272 44237510 1.56 1.00 4.423751 0.2260525uH2A_E4E3dox_Rep2 216100 46217904 46366162 1.57 1.00 4.628980 0.2160303uH2A_E4E3dTagdox_Rep2 454070 70727126 70963794 0.94 0.60 11.851181 0.0843798
K27me3_E4E3nodox_Rep1 1655634 45061360 45223212 0.38 1.00 4.522321 0.2211254K27me3_E4E3dox_Rep1 1551762 43461312 43612638 0.42 1.08 4.020648 0.2487161K27me3_E4E3dTagdox_Rep1_v2 2690796 64280014 64511472 0.39 1.00 6.430900 0.1554992K27me3_E4E3nodox_Rep2 1184040 56335778 56522778 0.34 1.00 5.652278 0.1769198K27me3_E4E3dox_Rep2_v2 1839418 82042224 82313652 0.33 0.96 8.607050 0.1161838K27me3_E4E3dTagdox_Rep2 1297572 66765314 67001386 0.31 0.91 7.398645 0.1351599
H2AK119ub1 Rep1 Rep2 AvNo Dox 1.00 1.00 1.00Dox 1.15 1.00 1.08dTAG-13 + Dox 0.75 0.60 0.68
H3K27me3 Rep1 Rep2 AvNo Dox 1.00 1.00 1.00Dox 1.08 0.96 1.02dTAG-13 + Dox 1.00 0.91 0.95
0.0
0.2
0.4
0.6
0.8
1.0
1.2
1.4
No Dox Dox dTAG-13 +Dox
Rela
tive
H2AK
119u
b1
Rep2
Rep1
0.0
0.2
0.4
0.6
0.8
1.0
1.2
No Dox Dox dTAG-13 +Dox
Rela
tive
H3K2
7me3
Rep2
Rep1
Table A5: Calibration for H2AK119ub1 and H3K27me3 ChIP in FKBP12F36V-
PCGF3/5