Genomic islands of divergence and their consequences for the resolution of spatial structure in an...
12
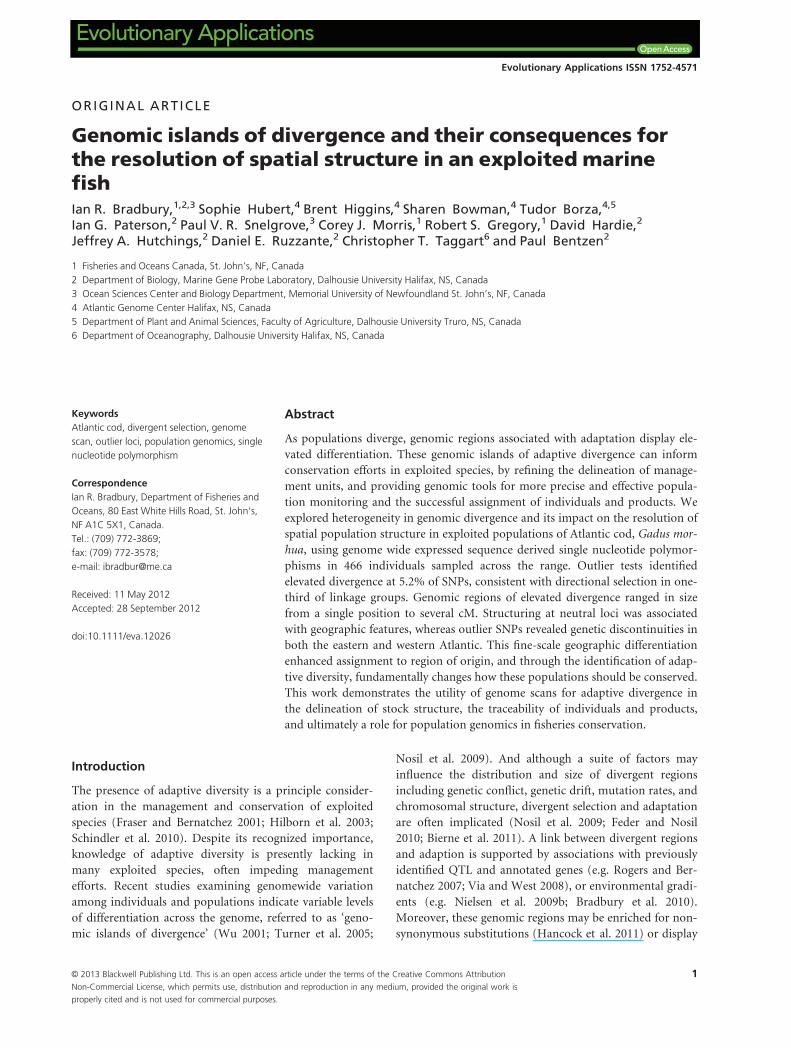
ORIGINAL ARTICLE Genomic islands of divergence and their consequences for the resolution of spatial structure in an exploited marine fish Ian R. Bradbury, 1,2,3 Sophie Hubert, 4 Brent Higgins, 4 Sharen Bowman, 4 Tudor Borza, 4,5 Ian G. Paterson, 2 Paul V. R. Snelgrove, 3 Corey J. Morris, 1 Robert S. Gregory, 1 David Hardie, 2 Jeffrey A. Hutchings, 2 Daniel E. Ruzzante, 2 Christopher T. Taggart 6 and Paul Bentzen 2 1 Fisheries and Oceans Canada, St. John’s, NF, Canada 2 Department of Biology, Marine Gene Probe Laboratory, Dalhousie University Halifax, NS, Canada 3 Ocean Sciences Center and Biology Department, Memorial University of Newfoundland St. John’s, NF, Canada 4 Atlantic Genome Center Halifax, NS, Canada 5 Department of Plant and Animal Sciences, Faculty of Agriculture, Dalhousie University Truro, NS, Canada 6 Department of Oceanography, Dalhousie University Halifax, NS, Canada Keywords Atlantic cod, divergent selection, genome scan, outlier loci, population genomics, single nucleotide polymorphism Correspondence Ian R. Bradbury, Department of Fisheries and Oceans, 80 East White Hills Road, St. John’s, NF A1C 5X1, Canada. Tel.: (709) 772-3869; fax: (709) 772-3578; e-mail: [email protected] Received: 11 May 2012 Accepted: 28 September 2012 doi:10.1111/eva.12026 Abstract As populations diverge, genomic regions associated with adaptation display ele- vated differentiation. These genomic islands of adaptive divergence can inform conservation efforts in exploited species, by refining the delineation of manage- ment units, and providing genomic tools for more precise and effective popula- tion monitoring and the successful assignment of individuals and products. We explored heterogeneity in genomic divergence and its impact on the resolution of spatial population structure in exploited populations of Atlantic cod, Gadus mor- hua, using genome wide expressed sequence derived single nucleotide polymor- phisms in 466 individuals sampled across the range. Outlier tests identified elevated divergence at 5.2% of SNPs, consistent with directional selection in one- third of linkage groups. Genomic regions of elevated divergence ranged in size from a single position to several cM. Structuring at neutral loci was associated with geographic features, whereas outlier SNPs revealed genetic discontinuities in both the eastern and western Atlantic. This fine-scale geographic differentiation enhanced assignment to region of origin, and through the identification of adap- tive diversity, fundamentally changes how these populations should be conserved. This work demonstrates the utility of genome scans for adaptive divergence in the delineation of stock structure, the traceability of individuals and products, and ultimately a role for population genomics in fisheries conservation. Introduction The presence of adaptive diversity is a principle consider- ation in the management and conservation of exploited species (Fraser and Bernatchez 2001; Hilborn et al. 2003; Schindler et al. 2010). Despite its recognized importance, knowledge of adaptive diversity is presently lacking in many exploited species, often impeding management efforts. Recent studies examining genomewide variation among individuals and populations indicate variable levels of differentiation across the genome, referred to as ‘geno- mic islands of divergence’ (Wu 2001; Turner et al. 2005; Nosil et al. 2009). And although a suite of factors may influence the distribution and size of divergent regions including genetic conflict, genetic drift, mutation rates, and chromosomal structure, divergent selection and adaptation are often implicated (Nosil et al. 2009; Feder and Nosil 2010; Bierne et al. 2011). A link between divergent regions and adaption is supported by associations with previously identified QTL and annotated genes (e.g. Rogers and Ber- natchez 2007; Via and West 2008), or environmental gradi- ents (e.g. Nielsen et al. 2009b; Bradbury et al. 2010). Moreover, these genomic regions may be enriched for non- synonymous substitutions (Hancock et al. 2011) or display © 2013 Blackwell Publishing Ltd. This is an open access article under the terms of the Creative Commons Attribution Non-Commercial License, which permits use, distribution and reproduction in any medium, provided the original work is properly cited and is not used for commercial purposes. 1 Evolutionary Applications ISSN 1752-4571 Evolutionary Applications
-
Upload
independent -
Category
Documents
-
view
1 -
download
0
Transcript of Genomic islands of divergence and their consequences for the resolution of spatial structure in an...
ORIGINAL ARTICLE
Genomic islands of divergence and their consequences forthe resolution of spatial structure in an exploited marinefishIan R. Bradbury,1,2,3 Sophie Hubert,4 Brent Higgins,4 Sharen Bowman,4 Tudor Borza,4,5
Ian G. Paterson,2 Paul V. R. Snelgrove,3 Corey J. Morris,1 Robert S. Gregory,1 David Hardie,2
Jeffrey A. Hutchings,2 Daniel E. Ruzzante,2 Christopher T. Taggart6 and Paul Bentzen2
1 Fisheries and Oceans Canada, St. John’s, NF, Canada
2 Department of Biology, Marine Gene Probe Laboratory, Dalhousie University Halifax, NS, Canada
3 Ocean Sciences Center and Biology Department, Memorial University of Newfoundland St. John’s, NF, Canada
4 Atlantic Genome Center Halifax, NS, Canada
5 Department of Plant and Animal Sciences, Faculty of Agriculture, Dalhousie University Truro, NS, Canada
6 Department of Oceanography, Dalhousie University Halifax, NS, Canada
Keywords
Atlantic cod, divergent selection, genome
scan, outlier loci, population genomics, single
nucleotide polymorphism
Correspondence
Ian R. Bradbury, Department of Fisheries and
Oceans, 80 East White Hills Road, St. John’s,
NF A1C 5X1, Canada.
Tel.: (709) 772-3869;
fax: (709) 772-3578;
e-mail: [email protected]
Received: 11 May 2012
Accepted: 28 September 2012
doi:10.1111/eva.12026
Abstract
As populations diverge, genomic regions associated with adaptation display ele-
vated differentiation. These genomic islands of adaptive divergence can inform
conservation efforts in exploited species, by refining the delineation of manage-
ment units, and providing genomic tools for more precise and effective popula-
tion monitoring and the successful assignment of individuals and products. We
explored heterogeneity in genomic divergence and its impact on the resolution of
spatial population structure in exploited populations of Atlantic cod, Gadus mor-
hua, using genome wide expressed sequence derived single nucleotide polymor-
phisms in 466 individuals sampled across the range. Outlier tests identified
elevated divergence at 5.2% of SNPs, consistent with directional selection in one-
third of linkage groups. Genomic regions of elevated divergence ranged in size
from a single position to several cM. Structuring at neutral loci was associated
with geographic features, whereas outlier SNPs revealed genetic discontinuities in
both the eastern and western Atlantic. This fine-scale geographic differentiation
enhanced assignment to region of origin, and through the identification of adap-
tive diversity, fundamentally changes how these populations should be conserved.
This work demonstrates the utility of genome scans for adaptive divergence in
the delineation of stock structure, the traceability of individuals and products,
and ultimately a role for population genomics in fisheries conservation.
Introduction
The presence of adaptive diversity is a principle consider-
ation in the management and conservation of exploited
species (Fraser and Bernatchez 2001; Hilborn et al. 2003;
Schindler et al. 2010). Despite its recognized importance,
knowledge of adaptive diversity is presently lacking in
many exploited species, often impeding management
efforts. Recent studies examining genomewide variation
among individuals and populations indicate variable levels
of differentiation across the genome, referred to as ‘geno-
mic islands of divergence’ (Wu 2001; Turner et al. 2005;
Nosil et al. 2009). And although a suite of factors may
influence the distribution and size of divergent regions
including genetic conflict, genetic drift, mutation rates, and
chromosomal structure, divergent selection and adaptation
are often implicated (Nosil et al. 2009; Feder and Nosil
2010; Bierne et al. 2011). A link between divergent regions
and adaption is supported by associations with previously
identified QTL and annotated genes (e.g. Rogers and Ber-
natchez 2007; Via and West 2008), or environmental gradi-
ents (e.g. Nielsen et al. 2009b; Bradbury et al. 2010).
Moreover, these genomic regions may be enriched for non-
synonymous substitutions (Hancock et al. 2011) or display
© 2013 Blackwell Publishing Ltd. This is an open access article under the terms of the Creative Commons Attribution
Non-Commercial License, which permits use, distribution and reproduction in any medium, provided the original work is
properly cited and is not used for commercial purposes.
1
Evolutionary Applications ISSN 1752-4571
Evolutionary Applications
parallel associations with independent habitats (Bradbury
et al. 2010; Deagle et al. 2011). Genome scans for signa-
tures of directional selection may thus provide direct
insight into the presence of adaptive divergence often
unobtainable with other methods and central to the suc-
cessful management of wild populations.
The ability to resolve genomic regions associated with
adaptation (e.g. Fournier-Level et al. 2011; Hancock et al.
2011) provides multiple opportunities for insight into the
scales of ecological and evolutionary population dynamics,
both directly applicable to management and conservation
efforts (e.g. Schindler et al. 2010; Nielsen et al. 2012). First,
as conservation units such as evolutionarily significant
units (ESUs) are often defined as a population or group of
populations possessing both demographic isolation and
adaptive or ecological significance (Waples 1995; Fraser
and Bernatchez 2001), examinations of genomic regions
associated with adaptation can directly inform ESU desig-
nation (Funk et al. 2012). In conjunction with improved
resolution of population structure, loci associated with sig-
natures of adaptive divergence and increased population
differentiation can enhance individual assignment success
(e.g. Nielsen et al. 2012). For instance, gene-associated
markers displaying signatures of directional selection pro-
vided unprecedented power to assign individuals and prod-
ucts to the population of origin in several commercially
important European fish species (Nielsen et al. 2012).
Finally, the identification of genomic regions associated
with functional variation provides the opportunity to mon-
itor the population responses to factors such as climate or
harvest pressure (e.g. Schwartz et al. 2007). However, the
tools to achieve these goals for many groups of commer-
cially exploited marine fishes have thus far remained elu-
sive, limited by apparent widespread genetic homogeneity
(Hauser and Carvalho 2008).
Our study integrates SNP-based genome scans for ele-
vated divergence in a marine fish, Atlantic cod (Gadus mor-
hua), with linkage mapping information to demonstrate
the utility of genome scans to resolve adaptive divergence
and to inform management and conservation of exploited
marine species. First, we use tests for selection and linkage
information to explore the genomic distribution of outliers
identified as potentially experiencing directional selection.
Second, we examine the subsequent impact of adaptive var-
iation on the resolution of spatial population structure and
assignment success in Atlantic cod. We build on a previous
study (Bradbury et al. 2010) that examined loci displaying
evidence of environmentally associated selection in parallel
with either side of the Atlantic in a subset of these loci
(n = 40) and populations (n = 14). Here, we examine the
distribution of divergence and its consequences for the res-
olution of spatial structure, providing critical insight into
the geographic scale of population dynamics in exploited
populations of Atlantic cod.
Materials and methods
Sample collection and location characteristics
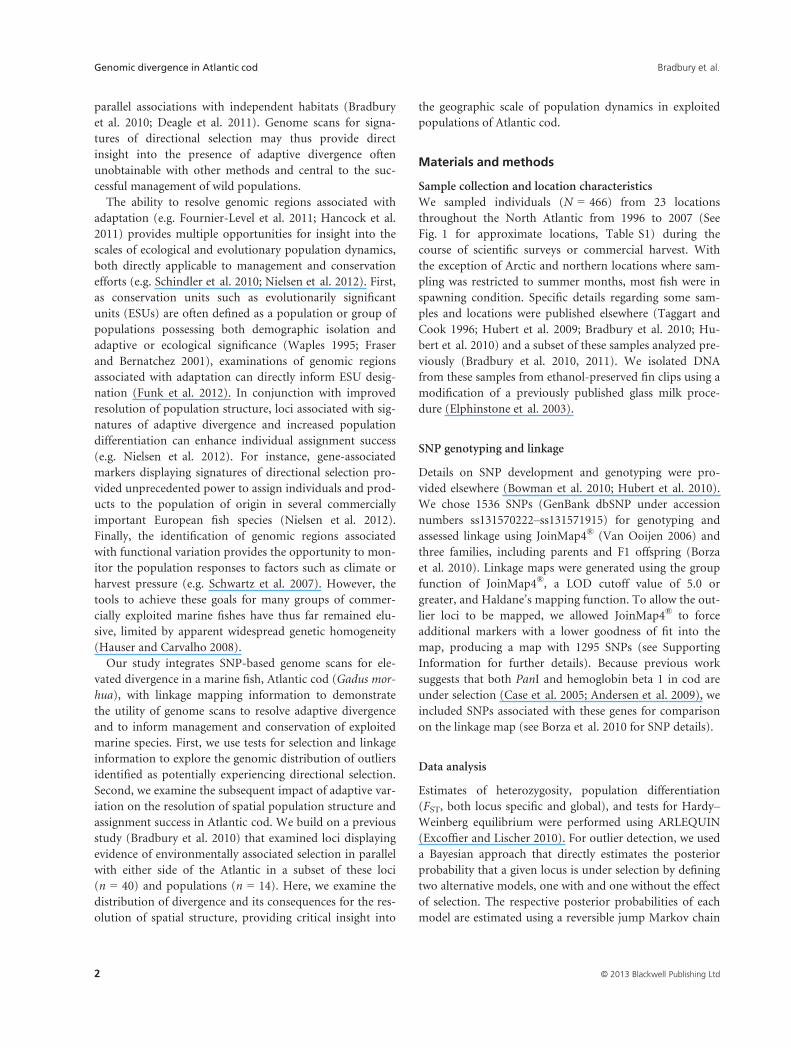
We sampled individuals (N = 466) from 23 locations
throughout the North Atlantic from 1996 to 2007 (See
Fig. 1 for approximate locations, Table S1) during the
course of scientific surveys or commercial harvest. With
the exception of Arctic and northern locations where sam-
pling was restricted to summer months, most fish were in
spawning condition. Specific details regarding some sam-
ples and locations were published elsewhere (Taggart and
Cook 1996; Hubert et al. 2009; Bradbury et al. 2010; Hu-
bert et al. 2010) and a subset of these samples analyzed pre-
viously (Bradbury et al. 2010, 2011). We isolated DNA
from these samples from ethanol-preserved fin clips using a
modification of a previously published glass milk proce-
dure (Elphinstone et al. 2003).
SNP genotyping and linkage
Details on SNP development and genotyping were pro-
vided elsewhere (Bowman et al. 2010; Hubert et al. 2010).
We chose 1536 SNPs (GenBank dbSNP under accession
numbers ss131570222–ss131571915) for genotyping and
assessed linkage using JoinMap4® (Van Ooijen 2006) and
three families, including parents and F1 offspring (Borza
et al. 2010). Linkage maps were generated using the group
function of JoinMap4®, a LOD cutoff value of 5.0 or
greater, and Haldane’s mapping function. To allow the out-
lier loci to be mapped, we allowed JoinMap4® to force
additional markers with a lower goodness of fit into the
map, producing a map with 1295 SNPs (see Supporting
Information for further details). Because previous work
suggests that both PanI and hemoglobin beta 1 in cod are
under selection (Case et al. 2005; Andersen et al. 2009), we
included SNPs associated with these genes for comparison
on the linkage map (see Borza et al. 2010 for SNP details).
Data analysis
Estimates of heterozygosity, population differentiation
(FST, both locus specific and global), and tests for Hardy–Weinberg equilibrium were performed using ARLEQUIN
(Excoffier and Lischer 2010). For outlier detection, we used
a Bayesian approach that directly estimates the posterior
probability that a given locus is under selection by defining
two alternative models, one with and one without the effect
of selection. The respective posterior probabilities of each
model are estimated using a reversible jump Markov chain
© 2013 Blackwell Publishing Ltd2
Genomic divergence in Atlantic cod Bradbury et al.
Monte Carlo (MCMC) approach as implemented in the
software BAYESCAN v2.01 (Foll and Gaggiotti 2008).
Because geographic isolation or demographic structure
may contribute to false positives (Foll and Gaggiotti 2008),
we ran the analysis for the entire dataset (See Supporting
Information) and then assessed population structure using
principal coordinate analysis (PCoA) with initial significant
outliers removed. The BAYESCAN analysis was then
repeated on the large dominant cluster representing the
western Atlantic using all loci. We compared the BAYE-
SCAN results to an alternative method for outlier identifi-
cation using a hierarchical island model (number of
groups = 10) to generate the distribution of genetic varia-
tion within and among populations as implemented in AR-
LEQUIN (Excoffier and Lischer 2010).
Principle coordinate analysis was carried out using Gen-
AlEx (vers.6.1; Peakall and Smouse 2006). Because each
SNP likely represents a single gene and linkage disequilib-
rium may result from selection associated with adaptive
divergence, we did not exclude loci that displayed correla-
tions in allele frequency. We previously showed that linkage
disequilibrium among outliers occurs even among chromo-
somes in this SNP panel (Bradbury et al. 2010). Distance
among samples on the PCoA was calculated as the Euclid-
ean distance among sample average values. We took geo-
graphic distance among samples as the shortest distance
among sample locations along the continental shelves. We
then used Bayesian clustering in BAPS (Corander and
Marttinen 2006) to examine the number of groups (K)
consistent with multilocus genetic data. This approach uses
a stochastic optimization procedure rather than MCMC to
identify the number of groups. We ran BAPS with the pre-
defined number of clusters = 2–25 and replicated five
times to ensure the stability of results. Assignment power
of the SNP panel was evaluated using the proportion of
successful identifications to the population of origin identi-
fied using GeneClass2.0 (Piry et al. 2004) and a subset of
individuals (Anderson 2010). We used a Bayesian approach
for assignment (Rannala and Mountain 1997) with resam-
pling (Paetkau et al. 2004), and assignment success was
evaluated for the western Atlantic using populations or
groups identified in clustering analyses above and sepa-
rately for all SNPs and only the neutral SNPs.
Results
Although we attempted genotyping of the 23 population
samples (466 individuals) for 1536 previously identified
informative loci, the failure of some assays reduced success-
ful loci to 1405. Observed (expected) heterozygosity overall
was 0.307 (0.301) and ranged from 0.222 (0.220) in the Bal-
tic Sea sample to 0.385 (0.360) for the Gulf of St. Lawrence
and Georges Bank (See Table S1). The percentage of poly-
morphic loci in each sample varied from 69.0% in the Bal-
tic to 99.3% in the Cape Sable sample (Table S1). Tests for
departures from Hardy–Weinberg equilibrium indicated
that approximately 1% of population/locus combinations
(n = 33 720) were significant at a = 0.01. Locus-specific
Figure 1 Map of sampling locations of Atlantic cod from across its geographic range. See Table S1 for further sample details.
© 2013 Blackwell Publishing Ltd 3
Bradbury et al. Genomic divergence in Atlantic cod
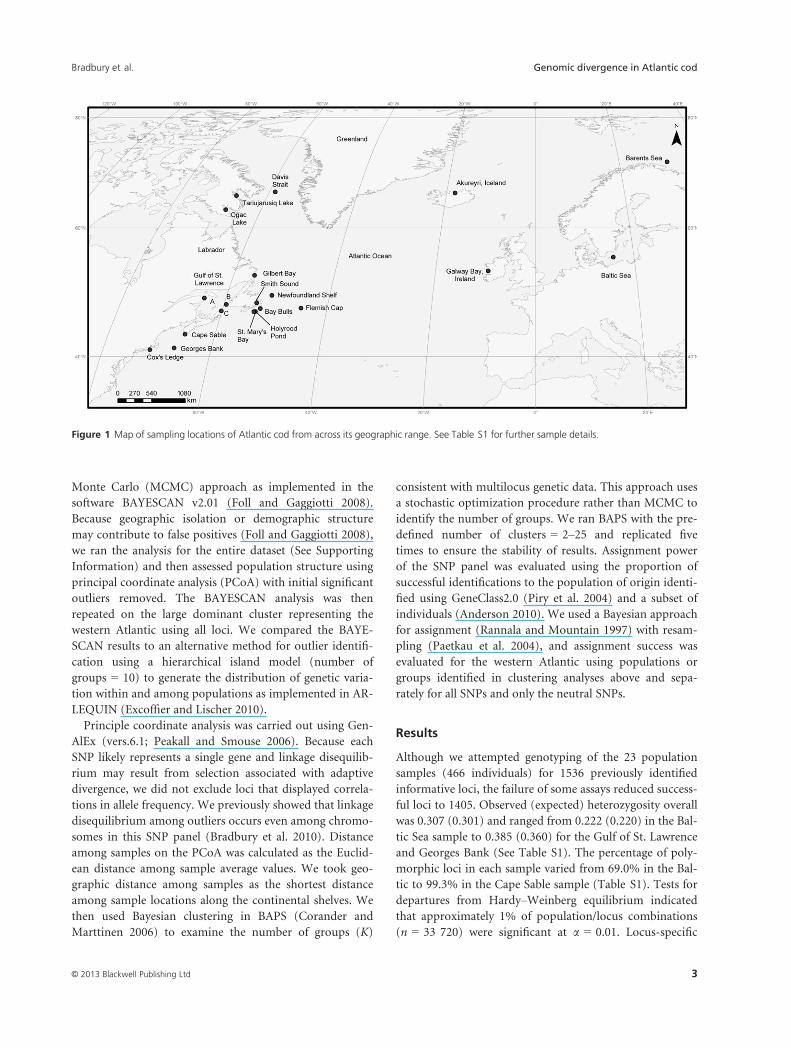
FST values were as high as 0.60 for some loci; the median
and maximum pairwise population FST values were 0.13
and 0.50, respectively.
Tests for the signatures of selection identified multiple
loci putatively experiencing directional selection. Using
BAYESCAN and focusing on the western Atlantic, and
excluding isolated populations (i.e. Arctic lakes and Gilbert
Bay; see Materials and methods), we identified 73 loci
potentially experiencing directional selection at a false dis-
covery rate of 1% (Fig. 2A). In comparison, the hierarchi-
cal island model-based test implemented in ARLEQUIN
(Excoffier et al. 2009) using all samples identified selection
in 89 loci at a = 0.01 (Fig. 2B). Only six of the loci identi-
fied by BAYESCAN were not significant in ARLEQUIN.
Given the similarity among the test results and lower types
I and II errors in BAYESCAN (Narum and Hess 2011), we
chose the loci identified using BAYESCAN for subsequent
analysis.
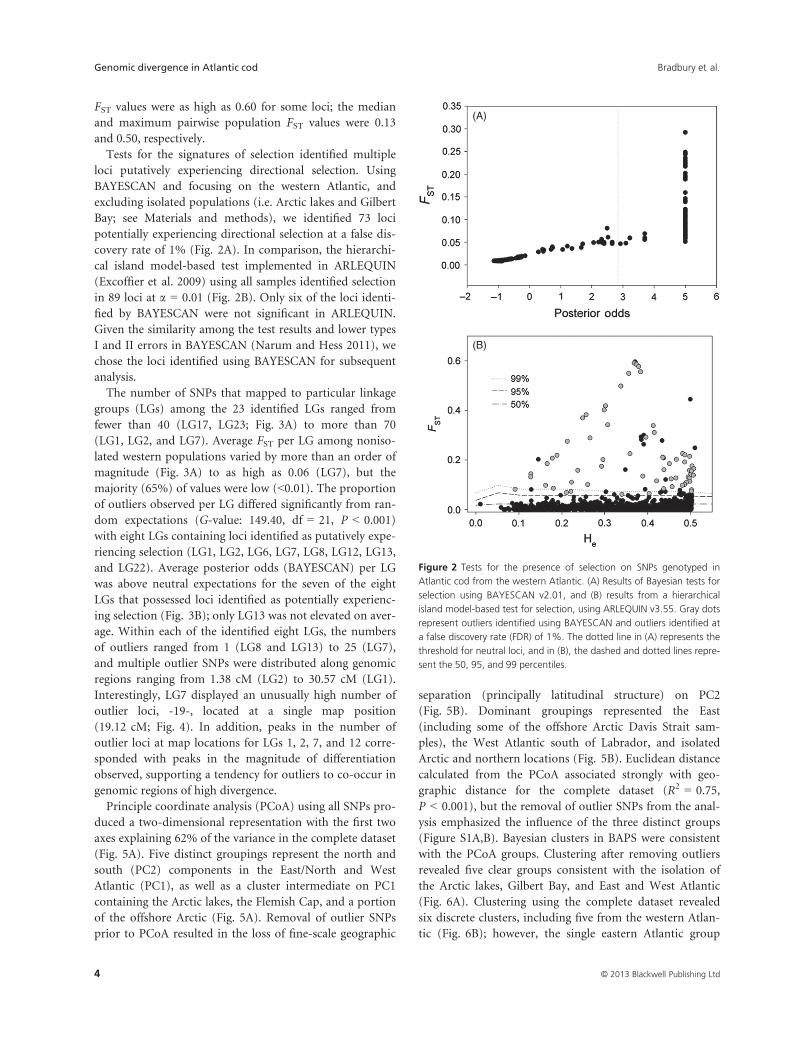
The number of SNPs that mapped to particular linkage
groups (LGs) among the 23 identified LGs ranged from
fewer than 40 (LG17, LG23; Fig. 3A) to more than 70
(LG1, LG2, and LG7). Average FST per LG among noniso-
lated western populations varied by more than an order of
magnitude (Fig. 3A) to as high as 0.06 (LG7), but the
majority (65%) of values were low (<0.01). The proportionof outliers observed per LG differed significantly from ran-
dom expectations (G-value: 149.40, df = 21, P < 0.001)
with eight LGs containing loci identified as putatively expe-
riencing selection (LG1, LG2, LG6, LG7, LG8, LG12, LG13,
and LG22). Average posterior odds (BAYESCAN) per LG
was above neutral expectations for the seven of the eight
LGs that possessed loci identified as potentially experienc-
ing selection (Fig. 3B); only LG13 was not elevated on aver-
age. Within each of the identified eight LGs, the numbers
of outliers ranged from 1 (LG8 and LG13) to 25 (LG7),
and multiple outlier SNPs were distributed along genomic
regions ranging from 1.38 cM (LG2) to 30.57 cM (LG1).
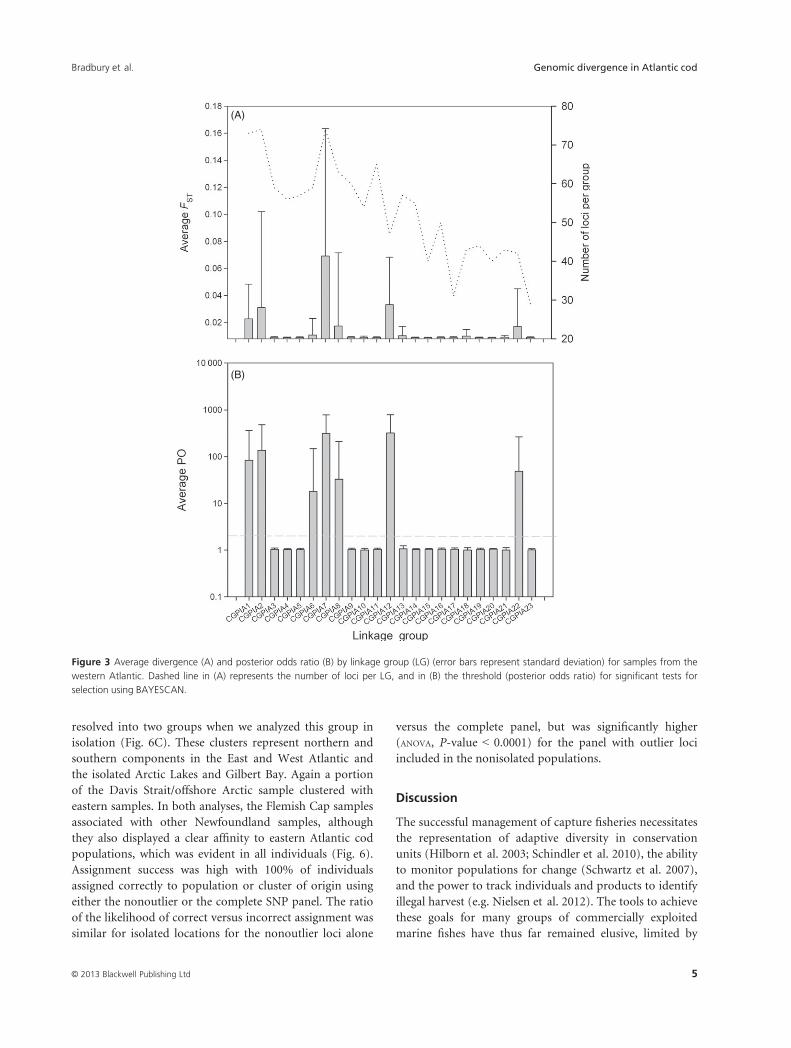
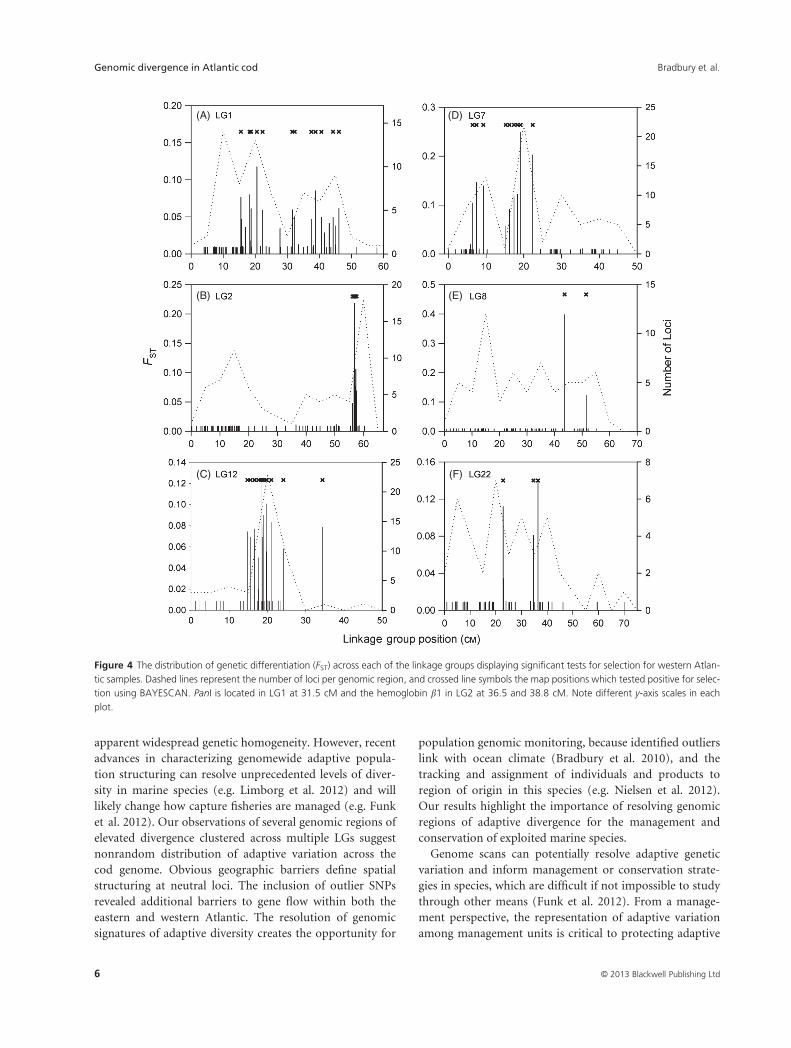
Interestingly, LG7 displayed an unusually high number of
outlier loci, -19-, located at a single map position
(19.12 cM; Fig. 4). In addition, peaks in the number of
outlier loci at map locations for LGs 1, 2, 7, and 12 corre-
sponded with peaks in the magnitude of differentiation
observed, supporting a tendency for outliers to co-occur in
genomic regions of high divergence.
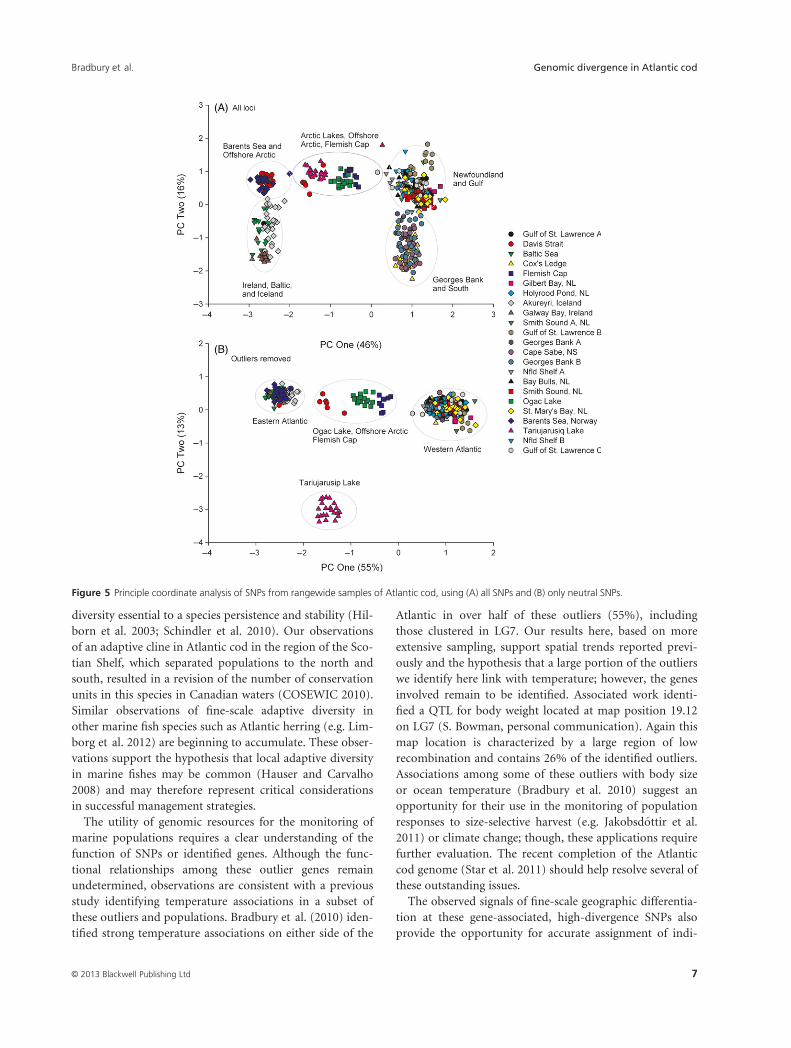
Principle coordinate analysis (PCoA) using all SNPs pro-
duced a two-dimensional representation with the first two
axes explaining 62% of the variance in the complete dataset
(Fig. 5A). Five distinct groupings represent the north and
south (PC2) components in the East/North and West
Atlantic (PC1), as well as a cluster intermediate on PC1
containing the Arctic lakes, the Flemish Cap, and a portion
of the offshore Arctic (Fig. 5A). Removal of outlier SNPs
prior to PCoA resulted in the loss of fine-scale geographic
separation (principally latitudinal structure) on PC2
(Fig. 5B). Dominant groupings represented the East
(including some of the offshore Arctic Davis Strait sam-
ples), the West Atlantic south of Labrador, and isolated
Arctic and northern locations (Fig. 5B). Euclidean distance
calculated from the PCoA associated strongly with geo-
graphic distance for the complete dataset (R2 = 0.75,
P < 0.001), but the removal of outlier SNPs from the anal-
ysis emphasized the influence of the three distinct groups
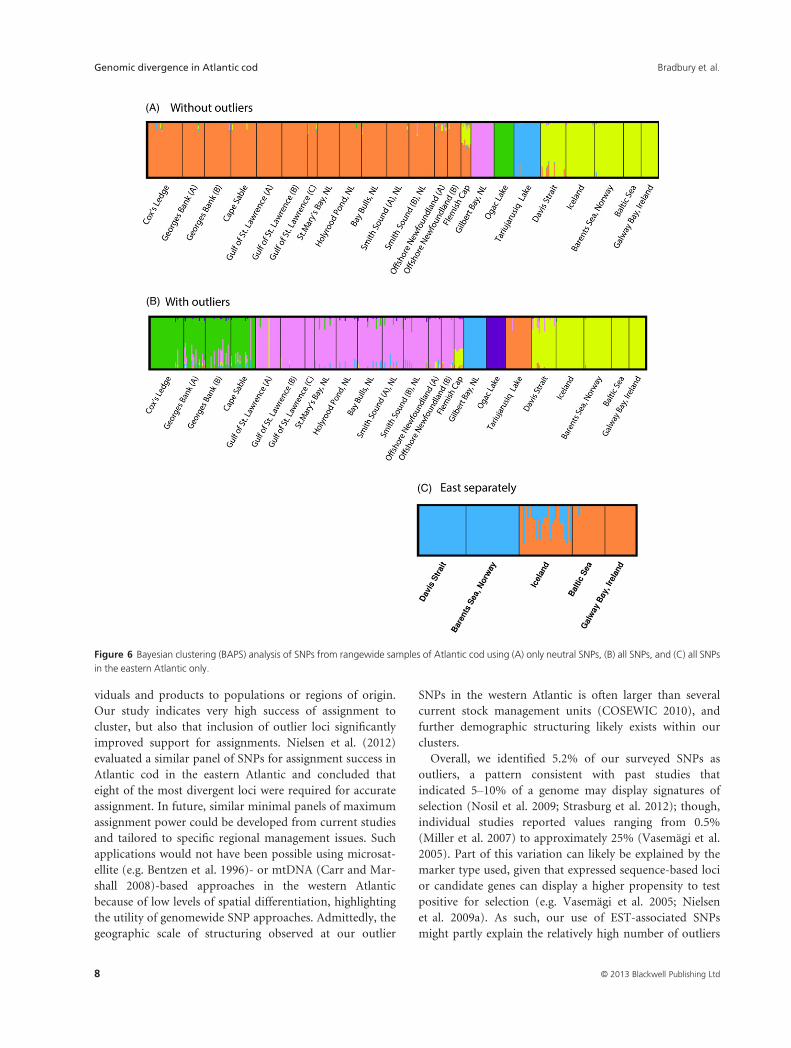
(Figure S1A,B). Bayesian clusters in BAPS were consistent
with the PCoA groups. Clustering after removing outliers
revealed five clear groups consistent with the isolation of
the Arctic lakes, Gilbert Bay, and East and West Atlantic
(Fig. 6A). Clustering using the complete dataset revealed
six discrete clusters, including five from the western Atlan-
tic (Fig. 6B); however, the single eastern Atlantic group
(A)
(B)
Figure 2 Tests for the presence of selection on SNPs genotyped in
Atlantic cod from the western Atlantic. (A) Results of Bayesian tests for
selection using BAYESCAN v2.01, and (B) results from a hierarchical
island model-based test for selection, using ARLEQUIN v3.55. Gray dots
represent outliers identified using BAYESCAN and outliers identified at
a false discovery rate (FDR) of 1%. The dotted line in (A) represents the
threshold for neutral loci, and in (B), the dashed and dotted lines repre-
sent the 50, 95, and 99 percentiles.
© 2013 Blackwell Publishing Ltd4
Genomic divergence in Atlantic cod Bradbury et al.
resolved into two groups when we analyzed this group in
isolation (Fig. 6C). These clusters represent northern and
southern components in the East and West Atlantic and
the isolated Arctic Lakes and Gilbert Bay. Again a portion
of the Davis Strait/offshore Arctic sample clustered with
eastern samples. In both analyses, the Flemish Cap samples
associated with other Newfoundland samples, although
they also displayed a clear affinity to eastern Atlantic cod
populations, which was evident in all individuals (Fig. 6).
Assignment success was high with 100% of individuals
assigned correctly to population or cluster of origin using
either the nonoutlier or the complete SNP panel. The ratio
of the likelihood of correct versus incorrect assignment was
similar for isolated locations for the nonoutlier loci alone
versus the complete panel, but was significantly higher
(ANOVA, P-value < 0.0001) for the panel with outlier loci
included in the nonisolated populations.
Discussion
The successful management of capture fisheries necessitates
the representation of adaptive diversity in conservation
units (Hilborn et al. 2003; Schindler et al. 2010), the ability
to monitor populations for change (Schwartz et al. 2007),
and the power to track individuals and products to identify
illegal harvest (e.g. Nielsen et al. 2012). The tools to achieve
these goals for many groups of commercially exploited
marine fishes have thus far remained elusive, limited by
(A)
(B)
Figure 3 Average divergence (A) and posterior odds ratio (B) by linkage group (LG) (error bars represent standard deviation) for samples from the
western Atlantic. Dashed line in (A) represents the number of loci per LG, and in (B) the threshold (posterior odds ratio) for significant tests for
selection using BAYESCAN.
© 2013 Blackwell Publishing Ltd 5
Bradbury et al. Genomic divergence in Atlantic cod
apparent widespread genetic homogeneity. However, recent
advances in characterizing genomewide adaptive popula-
tion structuring can resolve unprecedented levels of diver-
sity in marine species (e.g. Limborg et al. 2012) and will
likely change how capture fisheries are managed (e.g. Funk
et al. 2012). Our observations of several genomic regions of
elevated divergence clustered across multiple LGs suggest
nonrandom distribution of adaptive variation across the
cod genome. Obvious geographic barriers define spatial
structuring at neutral loci. The inclusion of outlier SNPs
revealed additional barriers to gene flow within both the
eastern and western Atlantic. The resolution of genomic
signatures of adaptive diversity creates the opportunity for
population genomic monitoring, because identified outliers
link with ocean climate (Bradbury et al. 2010), and the
tracking and assignment of individuals and products to
region of origin in this species (e.g. Nielsen et al. 2012).
Our results highlight the importance of resolving genomic
regions of adaptive divergence for the management and
conservation of exploited marine species.
Genome scans can potentially resolve adaptive genetic
variation and inform management or conservation strate-
gies in species, which are difficult if not impossible to study
through other means (Funk et al. 2012). From a manage-
ment perspective, the representation of adaptive variation
among management units is critical to protecting adaptive
(A)
(B)
(C)
(D)
(E)
(F)
Figure 4 The distribution of genetic differentiation (FST) across each of the linkage groups displaying significant tests for selection for western Atlan-
tic samples. Dashed lines represent the number of loci per genomic region, and crossed line symbols the map positions which tested positive for selec-
tion using BAYESCAN. PanI is located in LG1 at 31.5 cM and the hemoglobin b1 in LG2 at 36.5 and 38.8 cM. Note different y-axis scales in each
plot.
© 2013 Blackwell Publishing Ltd6
Genomic divergence in Atlantic cod Bradbury et al.
diversity essential to a species persistence and stability (Hil-
born et al. 2003; Schindler et al. 2010). Our observations
of an adaptive cline in Atlantic cod in the region of the Sco-
tian Shelf, which separated populations to the north and
south, resulted in a revision of the number of conservation
units in this species in Canadian waters (COSEWIC 2010).
Similar observations of fine-scale adaptive diversity in
other marine fish species such as Atlantic herring (e.g. Lim-
borg et al. 2012) are beginning to accumulate. These obser-
vations support the hypothesis that local adaptive diversity
in marine fishes may be common (Hauser and Carvalho
2008) and may therefore represent critical considerations
in successful management strategies.
The utility of genomic resources for the monitoring of
marine populations requires a clear understanding of the
function of SNPs or identified genes. Although the func-
tional relationships among these outlier genes remain
undetermined, observations are consistent with a previous
study identifying temperature associations in a subset of
these outliers and populations. Bradbury et al. (2010) iden-
tified strong temperature associations on either side of the
Atlantic in over half of these outliers (55%), including
those clustered in LG7. Our results here, based on more
extensive sampling, support spatial trends reported previ-
ously and the hypothesis that a large portion of the outliers
we identify here link with temperature; however, the genes
involved remain to be identified. Associated work identi-
fied a QTL for body weight located at map position 19.12
on LG7 (S. Bowman, personal communication). Again this
map location is characterized by a large region of low
recombination and contains 26% of the identified outliers.
Associations among some of these outliers with body size
or ocean temperature (Bradbury et al. 2010) suggest an
opportunity for their use in the monitoring of population
responses to size-selective harvest (e.g. Jakobsdottir et al.
2011) or climate change; though, these applications require
further evaluation. The recent completion of the Atlantic
cod genome (Star et al. 2011) should help resolve several of
these outstanding issues.
The observed signals of fine-scale geographic differentia-
tion at these gene-associated, high-divergence SNPs also
provide the opportunity for accurate assignment of indi-
(A)
(B)
Figure 5 Principle coordinate analysis of SNPs from rangewide samples of Atlantic cod, using (A) all SNPs and (B) only neutral SNPs.
© 2013 Blackwell Publishing Ltd 7
Bradbury et al. Genomic divergence in Atlantic cod
viduals and products to populations or regions of origin.
Our study indicates very high success of assignment to
cluster, but also that inclusion of outlier loci significantly
improved support for assignments. Nielsen et al. (2012)
evaluated a similar panel of SNPs for assignment success in
Atlantic cod in the eastern Atlantic and concluded that
eight of the most divergent loci were required for accurate
assignment. In future, similar minimal panels of maximum
assignment power could be developed from current studies
and tailored to specific regional management issues. Such
applications would not have been possible using microsat-
ellite (e.g. Bentzen et al. 1996)- or mtDNA (Carr and Mar-
shall 2008)-based approaches in the western Atlantic
because of low levels of spatial differentiation, highlighting
the utility of genomewide SNP approaches. Admittedly, the
geographic scale of structuring observed at our outlier
SNPs in the western Atlantic is often larger than several
current stock management units (COSEWIC 2010), and
further demographic structuring likely exists within our
clusters.
Overall, we identified 5.2% of our surveyed SNPs as
outliers, a pattern consistent with past studies that
indicated 5–10% of a genome may display signatures of
selection (Nosil et al. 2009; Strasburg et al. 2012); though,
individual studies reported values ranging from 0.5%
(Miller et al. 2007) to approximately 25% (Vasemagi et al.
2005). Part of this variation can likely be explained by the
marker type used, given that expressed sequence-based loci
or candidate genes can display a higher propensity to test
positive for selection (e.g. Vasemagi et al. 2005; Nielsen
et al. 2009a). As such, our use of EST-associated SNPs
might partly explain the relatively high number of outliers
(B)
(C)
(A)
Figure 6 Bayesian clustering (BAPS) analysis of SNPs from rangewide samples of Atlantic cod using (A) only neutral SNPs, (B) all SNPs, and (C) all SNPs
in the eastern Atlantic only.
© 2013 Blackwell Publishing Ltd8
Genomic divergence in Atlantic cod Bradbury et al.
we detected. Despite our success in identifying regions
associated with divergence, we likely missed genomic
regions experiencing weak selection. The frequency and
nature of outlier SNPs observed here might well be influ-
enced by the fact that we obtained these SNPs from a
region in the western Atlantic that fortuitously has both
previously identified cod temperature haplotypes (Brad-
bury et al. 2010), but is otherwise limited in its representa-
tion of cod habitat and diversity. Had we developed the
SNPs using a rangewide ascertainment panel, and we might
well have discovered many SNPs associated with other
types of selective forces. In addition, direct experimental
tests of selection and finer-scale sequencing commonly
identify widespread genomic divergence resulting from
selection and speciation, often contrasting earlier works
that identify only a few such regions (e.g. Michel et al.
2010; Hahn et al. 2012). Further examination will likely
build on the regions of divergence identified here.
The roles ascertainment bias or temporal variation
among samples may play in the observed spatial patterns,
or potential assignment success remains unclear. Ascertain-
ment bias is evident in the present dataset as a decline in
diversity from west to east associated with distance from
the location of the ascertainment panel (Bradbury et al.
2011). We evaluated the impact of ascertainment bias on
the accuracy of individual assignment, and although signif-
icant declines in assignment power were visible with some
subsets of SNPs, overall there are no reductions in power
for the complete panel (Bradbury et al. 2011). Sampling in
the eastern Atlantic was limited, however, and in conjunc-
tion with lower observed diversity of the SNPs in the east,
suggests that we may have missed significant population
structure. In addition, because the samples used in our
study span a 14-year period, temporal variation in allele
frequency may contribute to the patterns observed. How-
ever, recent work based on a subset of these SNPs observed
temporal stability over 10-year period (Nielsen et al. 2012)
in European samples. Although the contribution of tempo-
ral variation to the observed spatial trends cannot be dis-
counted, given the length of the period (2–3 generations),
and evidence of stability elsewhere, we infer minimal bias
in relation to the spatial trends observed.
Clustering of divergent loci within genomic regions may
be common (McGaugh and Noor 2012; Via 2012) and par-
ticularly prevalent in the regions of low recombination
(Nosil and Feder 2012). Across the Atlantic cod genome,
the distribution of genetic divergence was not random but
clustered in several LGs and map locations within LGs.
This clustering was most apparent in LG7 where multiple
outlier SNPs clustered to a single map location. Undoubt-
edly, some of this clustering could be associated with
genetic hitchhiking (Maynard-Smith and Haigh 1974).
Similar outlier clustering was reported in the house mouse
(Mus musculus) where divergent regions accounted for
7–8% of the genome and associated with eight genomic
regions (Harr 2006). Among forms of the mosquito,
Anopheles gambiae, divergence was associated with 1.2% of
the genome and distributed among three genomic regions
(Turner et al. 2005). Our observation of clustering among
outliers is consistent with the hypothesis that mutations
contributing to divergence should accumulate in the
regions of genome already experiencing divergent selection
(Navarro and Barton 2003; Kirkpatrick and Barton 2006;
Nosil et al. 2009) or experiencing low recombination rates
(McGaugh and Noor 2012; Nachman and Payseur 2012).
Significant linkage disequilibrium among outliers may
inflate spatial trends if compared SNPs are not indepen-
dent. Although we cannot fully discount inflated trends
here, we believe it unlikely given that several outliers
mapped to different LGs or locations within a LG. None-
theless, until a physical map is available or the SNPs suc-
cessfully annotated we cannot rule out potential for bias.
Our spatial analysis revealed several patterns that extend
beyond that of increased spatial isolation with outlier loci.
First, several locations in the Arctic and the Flemish Cap
sample appear genetically intermediate between the eastern
and western Atlantic on the first axis of the principle coor-
dinate analysis. Moreover, some of the offshore Arctic
Davis Strait samples cluster with the eastern Atlantic. Both
observations contradict a hypothesis of long standing vicar-
iance and support a hypothesis of eastern Atlantic coloniza-
tion in the Arctic or historic trans-Atlantic gene flow.
However, formally testing this hypothesis remains challeng-
ing in light of the potential confounding influence of ascer-
tainment bias. Nonetheless, individuals from the Flemish
Cap display eastern Atlantic affinities in the BAPS analysis
mirroring observations based on whole mtDNA genome
analysis of Flemish Cap cod which share ancestral clades
with Barents Sea cod (S.M. Carr and H.D. Marshall, per-
sonal communication). Previous studies report similar
trans-Atlantic trends in genetic structure and the presence
of eastern Atlantic genotypes in the northwest Atlantic for
both marine and anadromous fishes. In Atlantic wolffish
(Anarhichas lupus), which is widely distributed across the
Atlantic, a dominant genetic break separates populations to
the southwest and east of western Greenland with some
eastern affiliations of populations along the northern
Grand Banks off Newfoundland (McCusker and Bentzen
2010). Similarly in Atlantic salmon (Salmo salar), long-
standing genetic isolation occurs in the south on either
sides of the Atlantic, but again Newfoundland and Labra-
dor consistently contain populations characterized by
eastern Atlantic genotypes (King et al. 2007). Together,
these observations support a hypothesis of past trans-
Atlantic gene flow perhaps associated with warm intergla-
cial periods allowing the colonization of Canadian Arctic
© 2013 Blackwell Publishing Ltd 9
Bradbury et al. Genomic divergence in Atlantic cod
marine and lake habitats from the eastern Atlantic. In
conjunction with the observations of fine-scale adaptive
divergence, our observations of potential trans-Atlantic
gene flow provide novel insight into the past and future
spatial dynamics of cod in the North Atlantic.
Summary
Genomic regions associated with adaptation may directly
inform conservation efforts in exploited marine species, by
delineating management units, and providing genomic
tools for population monitoring and individual assign-
ment. We observed significant variation in the genomic
and geographic scale of differentiation in Atlantic cod,
using a panel of EST-associated SNPs. Genomic islands of
divergence were associated with several LGs and in several
instances clustered significantly, supporting the hypothesis
that divergent regions co-occur in response to strong selec-
tion or low recombination. Outlier SNPs, likely associated
with adaptive divergence, resolved fine-scale structure not
evident at neutral loci and provide ample power for
successful individual assignment to the region of origin.
Geographic population differentiation in Atlantic cod
appears to be distinguished by a few discrete islands of
genomic divergence, although finer-scale sequence analysis
and selection experiments are needed to further resolve the
genomic scale of divergence. This work demonstrates
the utility of genomic regions of adaptive divergence in the
delineation of stock structure, traceability of individuals
and products, and ultimately a role for population genom-
ics in the conservation of marine fisheries.
Acknowledgements
The authors thank all who assisted tissue collection. L. Bar-
rett and M. Foll assisted and advised on data analysis and
interpretation. Research was supported in part by Genome
Canada, Genome Atlantic and the Atlantic Canada Oppor-
tunities Agency through the Atlantic Cod Genomics and
Broodstock Development Project. A complete list of sup-
porting partners can be found at http://genomeatlantic.ca/
projects/view/8-The_Atlantic_Cod_Genomics_and_Brood
stock_Development_Project_CGP.php. Research funding
and support was also provided by a NSERC Strategic Grant
on Connectivity in Marine Fish and an NSERC Discovery
Grant.
Data archiving statement
Details on SNP development and genotyping are available
in the studies by Bowman et al. (2010) and Hubert et al.
(2010). The SNPs analyzed in this study are available in
GenBank dbSNP (accession numbers: ss131570222–ss131571915). Additional methods and results can be found
as Supporting Information.
Literature cited
Andersen, O., O. F. Wetten, M. C. De Rosa, C. Andre, C. Carelli Alinovi,
M. Colafranceschi, O. Brix et al. 2009. Haemoglobin polymorphisms
affect the oxygen-binding properties in Atlantic cod populations.
Proceedings of the Royal Society of London B: Biological Sciences
276:833–841.
Anderson, E. C. 2010. Assessing the power of informative subsets of loci
for population assignment: standard methods are upwardly biased.
Molecular Ecology Resources 10:701–710.
Bentzen, P., C. T. Taggart, D. E. Ruzzante, and D. Cook 1996. Microsat-
ellite polymorphism and the population structure of Atlantic cod (Ga-
dus morhua) in the Northwest Atlantic. Canadian Journal of Fisheries
and Aquatic Sciences 53:2706–2721.
Bierne, N., J. Welch, E. Loire, F. Bonhomme, and P. David 2011. The
coupling hypothesis: why genome scans may fail to map local adapta-
tion genes. Molecular Ecology 20:2044–2072.
Borza, T., B. Higgins, G. Simpson, and S. Bowman 2010. Integrating the
markers Pan I and haemoglobin with the genetic linkage map of
Atlantic cod (Gadus morhua). BMC Research Notes 3:261.
Bowman, S., S. Hubert, B. Higgins, C. Stone, J. Kimball, T. Borza, J.
Tarrant Bussey et al. 2010. An integrated approach to gene discovery
and marker development in Atlantic cod (Gadus morhua). Marine
Biotechnology 13:242–255.
Bradbury, I. R., S. Hubert, B. Higgins, S. Bowman, I. Paterson, P. V. R.
Snelgrove, C. Morris et al. 2010. Parallel adaptive evolution of Atlan-
tic cod in the eastern and western Atlantic Ocean in response to ocean
temperature. Proceedings of the Royal Society of London B: Biological
Sciences 277:3725–3734.
Bradbury, I. R., S. Hubert, B. Higgins, S. Bowman, I. G. Paterson, P. V.
R. Snelgrove, C. J. Morris et al. 2011. Evaluating SNP ascertainment
bias and its impact on population assignment in Atlantic cod, Gadus
morhua. Molecular Ecology Resources 11:218–225.
Carr, S. M., and H. D. Marshall 2008. Intraspecific phylogeographic ge-
nomics from multiple complete mtDNA genomes in Atlantic Cod
(Gadus morhua): origins of the “Codmother,” trans-Atlantic vicari-
ance, and mid-glacial population expansion. Genetics 108:381–389.
Case, R. A. J., W. F. Hutchinson, L. Hauser, C. Van Oosterhout, and G.
R. Carvalho 2005. Macro- and micro-geographic variation in panto-
physin (Pan I) allele frequencies in NE Atlantic cod Gadus morhua.
Marine Ecology Progress Series 301:267–278.
Corander, J., and P. Marttinen 2006. Bayesian identification of admix-
ture events using multi-locus molecular markers. Molecular Ecology
15:2833–2843.
COSEWIC 2010. COSEWIC Assessment and Update Status Report on
the North Atlantic Cod, Gadus moruha, in Canada. Committee on the
Status of Endangered Wildlife in Canada, Ottawa, ON.
Deagle, B. E., F. C. Jones, Y. F. Chan, D. M. Absher, D. M. Kingsley, and
T. E. Reimchen 2011. Population genomics of parallel phenotypic
evolution in stickleback across stream–lake ecological transitions.
Proceedings of the Royal Society of London B: Biological Sciences
279:1277–1286.
Elphinstone, M. S., G. N. Hinten, M. J. Anderson, and C. J. Nock 2003.
An inexpensive and high-throughput procedure to extract and purify
© 2013 Blackwell Publishing Ltd10
Genomic divergence in Atlantic cod Bradbury et al.
total genomic DNA for population studies. Molecular Ecology 3:317–
320.
Excoffier, L., and H. E. Lischer 2010. Arlequin suite ver 3.5: a new series
of programs to perform population genetics analyses under Linux and
Windows. Molecular Ecology Resources 10:546–567
Excoffier, L., T. Hofer, and M. Foll 2009. Detecting loci under selection
in a hierarchically structured population. Heredity 103:285–298.
Feder, J. L., and P. Nosil 2010. The efficacy of divergence hitchhiking in
generating genomic islands during ecological speciation. Evolution
64:1729–1747.
Foll, M., and O. Gaggiotti 2008. A Genome-scan method to identify
selected loci appropriate for both dominant and codominant markers:
a Bayesian perspective. Genetics 180:977–993.
Fournier-Level, A., A. Korte, M. D. Cooper, M. Nordborg, J. Schmitt,
and A. M. Wilczek 2011. A map of local adaptation in Arabidopsis
thaliana. Science 334:86–89.
Fraser, D. J., and L. Bernatchez 2001. Adaptive evolutionary conserva-
tion: towards a unified concept for defining conservation units.
Molecular Ecology 10:2741–2752.
Funk, W. C., J. K. McKay, P. A. Hohenlohe, and F. W. Allendorf 2012.
Harnessing genomics for delineating conservation units. Trends in
Ecology & Evolution 27(9):489–496.
Hahn, M. W., B. J. White, C. D. Muir, and N. J. Besansky 2012. No evi-
dence for biased co-transmission of speciation islands in Anopheles
gambiae. Philosophical Transactions of the Royal Society of London
B: Biological Sciences 367:374–384.
Hancock, A. M., B. Brachi, N. Faure, M. W. Horton, L. B. Jarymowycz,
F. G. Sperone, C. Toomajian et al. 2011. Adaptation to climate across
the Arabidopsis thaliana genome. Science 334:83–86.
Harr, B. 2006. Genomic islands of differentiation between house mouse
subspecies. Genome Research 16:730–737.
Hauser, L., and G. R. Carvalho 2008. Paradigm shifts in marine fisheries
genetics: ugly hypotheses slain by beautiful facts. Fish and Fisheries
9:333–362.
Hilborn, R., T. P. Quinn, D. E. Schindler, and D. E. Rogers 2003. Bio-
complexity and fisheries sustainability. Proceedings of the National
Academy of Sciences 100:6564–6568.
Hubert, S., J. Tarrant Bussey, B. Higgins, B. A. Curtis, and S. Bowman
2009. Development of single nucleotide polymorphism markers for
Atlantic cod (Gadus morhua) using expressed sequences. Aquaculture
296:7–14.
Hubert, S., B. Higgins, T. Borza, and S. Bowman 2010. Development of a
SNP resource and a genetic linkage map for Atlantic cod (Gadus mor-
hua). BMC Genomics 11:191.
Jakobsdottir, K. B., H. Pardoe, A. Magnusson, H. Bjornsson, C. Pam-
poulie, D. E. Ruzzante, and G. Marteinsdottir 2011. Historical changes
in genotypic frequencies at the Pantophysin locus in Atlantic cod
(Gadus morhua) in Icelandic waters: evidence of fisheries-induced
selection? Evolutionary Applications 4:562–573.
King, T. L., E. Verspoor, A. P. Spidle, R. Gross, R. B. Phillips, M. L. Kol-
jonen, J. A. Sanchez et al. 2007. Biodiversity and population structure.
The Atlantic Salmon. Blackwell Publishing Ltd, Oxford, UK.
Kirkpatrick, M., and N. H. Barton 2006. Chromosome inversions, local
adaptation and speciation. Genetics 173:419–434.
Limborg, M. T., S. J. Helyar, M. De Bruyn, M. I. Taylor, E. E. Nielsen, R.
Ogden, G. R. Carvalho et al. 2012. Environmental selection on tran-
scriptome-derived SNPs in a high gene flow marine fish, the Atlantic
herring (Clupea harengus). Molecular Ecology 21:3686–3703.
Maynard-Smith, J., and J. Haigh 1974. The hitch-hiking effect of a favor-
able gene. Genetical Research 23:23–35.
McCusker, M. R., and P. Bentzen 2010. Phylogeography of 3 North
Atlantic wolffish species (Anarhichas spp.) with phylogenetic relation-
ships within the family Anarhichadidae. Journal of Heredity 101:594–
601.
McGaugh, S. E., and M. A. F. Noor 2012. Genomic impacts of chromo-
somal inversions in parapatric Drosophila species. Philosophical
Transactions of the Royal Society of London B: Biological Sciences
367:422–429.
Michel, A. P., S. Sim, T. H. Q. Powell, M. S. Taylor, P. Nosil, and J. L.
Feder 2010. Widespread genomic divergence during sympatric specia-
tion. Proceedings of the National Academy of Sciences 107:9724–
9729.
Miller, N. J., M. Ciosi, T. W. Sappington, S. T. Ratcliffe, J. L. Spencer,
and T. Guillemaud 2007. Genome scan of Diabrotica virgifera virgifera
for genetic variation associated with crop rotation tolerance. Journal
of Applied Entomology 131:378–385.
Nachman, M. W., and B. A. Payseur 2012. Recombination rate variation
and speciation: theoretical predictions and empirical results from
rabbits and mice. Philosophical Transactions of the Royal Society of
London B: Biological Sciences 367:409–421.
Narum, R., and J. E. Hess 2011. Comparison of FST outlier tests for SNP
loci under selection. Molecular Ecology Resources 11:184–194.
Navarro, A., and N. H. Barton 2003. Chromosomal speciation and
molecular divergence-accelerated evolution in rearranged chromo-
somes. Science 300:321–324.
Nielsen, E. E., J. Hemmer-Hansen, P. F. Larsen, and D. Bekkevold 2009a.
Population genomics of marine fishes: identifying adaptive variation
in space and time. Molecular Ecology 18:3128–3150.
Nielsen, E. E., J. Hemmer-Hansen, N. Poulsen, V. Loeschcke, T. Moen,
T. Johansen, C. Mittelholzer et al. 2009b. Genomic signatures of local
directional selection in a high gene flow marine organism; the Atlantic
cod (Gadus morhua). BMC Evolutionary Biology 9:276.
Nielsen, E. E., A. Cariani, E. Aoidh, G. E. Maes, I. Milano, R. Ogden, M.
Taylor et al. 2012. Gene-associated markers provide tools for tackling
illegal fishing and false eco-certification. Nature Communications
3:851.
Nosil, P., and J. L. Feder 2012. Genomic divergence during speciation:
causes and consequences. Philosophical Transactions of the Royal
Society of London B: Biological Sciences 367:332–342.
Nosil, P., D. J. Funk, and D. Ortiz-Barrientos 2009. Divergent selection
and heterogeneous genomic divergence. Molecular Ecology 18:375–
402.
Paetkau, D., R. Slade, M. Burden, and A. Estoup 2004. Genetic assign-
ment methods for the direct, real-time estimation of migration rate: a
simulation-based exploration of accuracy and power. Molecular Ecol-
ogy 13:55–65.
Peakall, R., and P. E. Smouse 2006. Genalex 6: genetic analysis in Excel.
Population genetic software for teaching and research. Molecular
Ecology Notes 6:288–295.
Piry, S., A. Alapetite, J. M. Cornuet, D. Paetkau, L. Baudouin, and
A. Estoup 2004. GeneClass2: a software for genetic assignment
and first-generation migrant detection. Journal of Heredity 95:
536–539.
Rannala, B., and J. L. Mountain 1997. Detecting immigration by using
multilocus genotypes. Proceedings of the National Academy of Sci-
ences 94:9197–9201.
Rogers, S. M., and L. Bernatchez 2007. The genetic architecture of eco-
logical speciation and the association with signatures of selection in
natural lake whitefish (Coregonas sp. Salmonidae) species pairs.
Molecular Biology and Evolution 24:1423–1438.
© 2013 Blackwell Publishing Ltd 11
Bradbury et al. Genomic divergence in Atlantic cod
Schindler, D. E., R. Hilborn, B. Chasco, C. P. Boatright, T. P. Quinn, L.
A. Rogers, and M. S. Webster 2010. Population diversity and the port-
folio effect in an exploited species. Nature 465:609–612.
Schwartz, M. K., G. Luikart, and R. S. Waples 2007. Genetic monitoring
as a promising tool for conservation and management. Trends in
Ecology & Evolution (Personal edition) 22:25–33.
Star, B., A. J. Nederbragt, S. Jentoft, U. Grimholt, M. Malmstrom,
T. F. Gregers, T. B. Rounge et al. 2011. The genome sequence of
Atlantic cod reveals a unique immune system. Nature 477:
207–210.
Strasburg, J. L., N. A. Sherman, K. M. Wright, L. C. Moyle, J. H. Willis,
and L. H. Rieseberg 2012. What can patterns of differentiation across
plant genomes tell us about adaptation and speciation? Philosophical
Transactions of the Royal Society of London B: Biological Sciences
367:364–373.
Taggart, C. T., and D. Cook 1996. Microsatellite genetic analysis of Baltic
cod: a preliminary report. Manuscript Report, Marine Gene Probe
Laboratory. Dalhousie University, Halifax, NS.
Turner, T. L., M. W. Hahn, and S. V. Nuzhdin 2005. Genomic islands of
speciation in Anopheles gambiae. PLoS Biology 3:e285.
Van Ooijen, J. W. 2006. JoinMap 4. Software for the Calculation of
Genetic Linkage Maps in Experimental Populations. Kyazma BV,
Wageningen, Netherlands.
Vasemagi, A., J. Nilsson, and C. R. Primmer 2005. Expressed sequence
tag (EST) linked microsatellites as a source of gene associated poly-
morphisms for detecting signatures of divergent selection in Atlantic
salmon (Salmo salar L.). Molecular Biology and Evolution 22:1067–
1076.
Via, S. 2012. Divergence hitchhiking and the spread of genomic isolation
during ecological speciation-with-gene-flow. Philosophical Transac-
tions of the Royal Society of London B: Biological Sciences 367:451–
460.
Via, S., and J. West 2008. The genetic mosaic suggests a new role for
hitchhiking in ecological speciation. Molecular Ecology 17:4334–4345.
Waples, R. S. 1995. Evolutionarily significant units and the conservation
of biological diversity under the Endangered Species Act. American
Fisheries Society Symposium 17:8–27.
Wu, C. 2001. The genic view of the process of speciation. Journal of
Evolutionary Biology 14:851–865.
Supporting Information
Additional Supporting Information may be found in the online version
of this article:
Figure S1. Euclidean distance among population average PCoA values
of SNPs from range-wide samples of Atlantic cod using (A) all SNPs and
(B) only neutral SNPs.
Table S1. Details on sample locations and SNP summary statistics.
Table S2. Pairwise FST values for all samples and all SNPs.
Table S3. Pairwise FST values for all samples and all non-outlier SNPs.
Table S4. Results of BAYESCAN analysis with all samples included.
Data S1. Methods.
Data S2. LGMAP1.
Data S3. LGMAP2.
Data S4. Linkage maps 1 and 2.
© 2013 Blackwell Publishing Ltd12
Genomic divergence in Atlantic cod Bradbury et al.