Fully Exploited Oxygen Redox Reaction by the Inter-Diffused ...
11
HAL Id: hal-02992183 https://hal.archives-ouvertes.fr/hal-02992183 Submitted on 6 Nov 2020 HAL is a multi-disciplinary open access archive for the deposit and dissemination of sci- entific research documents, whether they are pub- lished or not. The documents may come from teaching and research institutions in France or abroad, or from public or private research centers. L’archive ouverte pluridisciplinaire HAL, est destinée au dépôt et à la diffusion de documents scientifiques de niveau recherche, publiés ou non, émanant des établissements d’enseignement et de recherche français ou étrangers, des laboratoires publics ou privés. Fully Exploited Oxygen Redox Reaction by the Inter-Diffused Cations in Co-Free Li-Rich Materials for High Performance Li-Ion Batteries Junghwa Lee, Nicolas Dupre, Mihee Jeong, Shinyoung Kang, Maxim Avdeev, Yue Gong, Lin Gu, Won-sub Yoon, Byoungwoo Kang To cite this version: Junghwa Lee, Nicolas Dupre, Mihee Jeong, Shinyoung Kang, Maxim Avdeev, et al.. Fully Ex- ploited Oxygen Redox Reaction by the Inter-Diffused Cations in Co-Free Li-Rich Materials for High Performance Li-Ion Batteries. Advanced Science, Wiley Open Access, 2020, 7 (17), pp.2001658. 10.1002/advs.202001658. hal-02992183
-
Upload
khangminh22 -
Category
Documents
-
view
4 -
download
0
Transcript of Fully Exploited Oxygen Redox Reaction by the Inter-Diffused ...

HAL Id: hal-02992183https://hal.archives-ouvertes.fr/hal-02992183
Submitted on 6 Nov 2020
HAL is a multi-disciplinary open accessarchive for the deposit and dissemination of sci-entific research documents, whether they are pub-lished or not. The documents may come fromteaching and research institutions in France orabroad, or from public or private research centers.
L’archive ouverte pluridisciplinaire HAL, estdestinée au dépôt et à la diffusion de documentsscientifiques de niveau recherche, publiés ou non,émanant des établissements d’enseignement et derecherche français ou étrangers, des laboratoirespublics ou privés.
Fully Exploited Oxygen Redox Reaction by theInter-Diffused Cations in Co-Free Li-Rich Materials for
High Performance Li-Ion BatteriesJunghwa Lee, Nicolas Dupre, Mihee Jeong, Shinyoung Kang, Maxim Avdeev,
Yue Gong, Lin Gu, Won-sub Yoon, Byoungwoo Kang
To cite this version:Junghwa Lee, Nicolas Dupre, Mihee Jeong, Shinyoung Kang, Maxim Avdeev, et al.. Fully Ex-ploited Oxygen Redox Reaction by the Inter-Diffused Cations in Co-Free Li-Rich Materials for HighPerformance Li-Ion Batteries. Advanced Science, Wiley Open Access, 2020, 7 (17), pp.2001658.�10.1002/advs.202001658�. �hal-02992183�

FULL PAPERwww.advancedscience.com
Fully Exploited Oxygen Redox Reaction by the Inter-DiffusedCations in Co-Free Li-Rich Materials for High PerformanceLi-Ion Batteries
Junghwa Lee, Nicolas Dupre, Mihee Jeong, ShinYoung Kang, Maxim Avdeev, Yue Gong,Lin Gu, Won-Sub Yoon,* and Byoungwoo Kang*
To meet the growing demand for global electrical energy storage,high-energy-density electrode materials are required for Li-ion batteries. Toovercome the limit of the theoretical energy density in conventional electrodematerials based solely on the transition metal redox reaction, the oxygenredox reaction in electrode materials has become an essential componentbecause it can further increase the energy density by providing additionalavailable electrons. However, the increase in the contribution of the oxygenredox reaction in a material is still limited due to the lack of understanding itscontrolled parameters. Here, it is first proposed that Li-transition metals(TMs) inter-diffusion between the phases in Li-rich materials can be a keyparameter for controlling the oxygen redox reaction in Li-rich materials. Theresulting Li-rich materials can achieve fully exploited oxygen redox reactionand thereby can deliver the highest reversible capacity leading to the highestenergy density, ≈1100 Wh kg−1 among Co-free Li-rich materials. The strategyof controlling Li/transition metals (TMs) inter-diffusion between the phases inLi-rich materials will provide feasible way for further achievinghigh-energy-density electrode materials via enhancing the oxygen redoxreaction for high-performance Li-ion batteries.
J. Lee, Prof. B. KangDepartment of Materials Science and EngineeringPohang University of Science and Technology (POSTECH)Pohang 37673, Republic of KoreaE-mail: [email protected]. N. DupreInstitut des Materiaux Jean Rouxel (IMN)Université de NantesCNRS UMR 6502, 2 rue de la Houssiniere, BP 32229 Nantes Cedex 344322, FranceM. Jeong, Prof. W.-S. YoonDepartment of Energy ScienceSungkyunkwan UniversitySuwon 16419, Republic of KoreaE-mail: [email protected]
The ORCID identification number(s) for the author(s) of this articlecan be found under https://doi.org/10.1002/advs.202001658
© 2020 The Authors. Published by WILEY-VCH Verlag GmbH & Co.KGaA, Weinheim. This is an open access article under the terms of theCreative Commons Attribution License, which permits use, distributionand reproduction in any medium, provided the original work is properlycited.
DOI: 10.1002/advs.202001658
1. Introduction
Rechargeable Li-ion batteries have becomea key enabler for transformational changesin our society by powering advancedportable electronics and deploying electricvehicles and grid-scale applications.[1] Tomeet the soaring demand in high-energy-density Li-ion batteries, an oxygen redoxreaction in electrode material has beenconsidered as an essential componentbecause it can provide additional availableelectrons to overcome the limit of theoreti-cal energy density in conventional electrodematerials based only on cationic redoxreactions. To realize this transformation,Li-rich layered materials (Li1+xTM1−xO2)have recently become one of the mostattractive electrode materials because theycan exploit the oxygen redox reaction inaddition to the transition metal (TM) redoxreaction and thereby can deliver muchhigher capacities (>250 mAh g−1) than con-ventional layered materials (e.g., LiCoO2).[2]
Dr. S. Y. KangLawrence Livermore National Laboratory7000 East Avenue, L-413 Livermore, CA 94550, USDr. M. AvdeevAustralian Nuclear Science and Technology OrganizationLocked Bag 2001, Kirrawee DC, NSW 2232, AustraliaDr. M. AvdeevSchool of ChemistryThe University of SydneySydney, NSW 2006, AustraliaY. Gong, Prof. L. GuBeijing National Laboratory for Condensed Matter PhysicsInstitute of PhysicsChinese Academy of SciencesBeijing 100190, ChinaY. Gong, Prof. L. GuCollaborative Innovation Center of Quantum MatterBeijing 100190, ChinaY. Gong, Prof. L. GuSchool of Physical SciencesUniversity of Chinese Academy of SciencesBeijing 100190, China
Adv. Sci. 2020, 2001658 2001658 (1 of 10) © 2020 The Authors. Published by WILEY-VCH Verlag GmbH & Co. KGaA, Weinheim

www.advancedsciencenews.com www.advancedscience.com
To further exploit the potential of the oxygen redox reaction,typical approach in Li-rich materials based on 3d-TMs is the dop-ing with the cobalt, which can improve and stabilize the oxygenredox reaction.[3] Several approaches also have been suggestedincluding applying surface structural modification or coatings,[4]
which can achieve good capacity retention and mitigated voltagefade because surface treatments can suppress surface changescaused by the oxygen gas release on the surface due to irreversibleoxygen redox reaction.[5] And the other approaches have been fo-cused on replacing 3d-TMs with 4d or 5d-TMs[2c,f,h,6] in Li-richmaterials, which can stabilize the reversibility of the oxygen re-dox reaction by using relatively strong covalent character of 4d- or5d- TMs with oxygen compared to 3d-TMs or by forming a dimer-like oxygen rather than a unbonded oxygen.[7] To achieve highenergy density in Li-rich materials, several different approachesbased on disordered-rocksalt structure have been also proposedrecently.[6a,8] Disordered-rocksalt Li-excess materials can have sta-ble framework, which can increase usable Li amount, and achievereasonable electrochemical activity because of reasonable Li dif-fusion activated by excess Li. The replacement of oxygen withfluorine in the disordered-rocksalt Li-excess materials have beendeveloped to improve electrochemical performance of the mate-rials by suppressing oxygen gas loss[5b] or by increasing the con-tribution of the transition metal redox reaction.[8] Most of theseprevious approaches have focused on stabilizing the oxygen re-dox reaction and its reversibility or understanding the oxygenredox reaction with 4d/5d-TMs, rather than the increase in thecontribution of the oxygen redox reaction. In order to further in-crease the energy density, the oxygen redox reaction should befully exploited by understanding a key parameter that can con-trol/enhance the oxygen redox reaction in Li-rich materials.
Here, we first report on a novel way of controlling the oxygenredox reaction in Li-rich materials by using the inter-diffusionof Li/TMs between the two phases such as rhombohedral andmonoclinic phase. As a result, the inter-diffusion in the Li-richmaterials will increase the cation disordering in both phases andat the same time achieve excess Li in both phases. These struc-tural/chemical changes can fully exploit the oxygen redox reac-tion in the bulk, enabling full extraction of Li with high reversiblecapacity, because the excess Li in both phases can provide ad-ditional available electrons leading to the increase in the oxy-gen redox reaction, and significantly improve intrinsic layeredstructure stability due to the increased cation disordering in bothphases in a pristine material, which can improve reversibility ofelectrochemical reactions simultaneously. The resulting materi-als achieve reversible capacity of ≈300 mA h g−1 even in nar-row cut-off voltage window from 2.5 to 4.7 V with a high op-erating voltage ≈3.6 V providing the highest energy density of≈1100 Wh kg−1 among reported Co-free Li-rich layered materials.Moreover, the inter-diffused Li-rich materials can achieve miti-gated voltage fade and improved capacity retention for 100 cycles,and can deliver substantially enhanced power capability amongother reported Co-free 3d-TMs Li-rich materials. Controlling theoxygen redox reaction via the Li/TMs distribution between thephases in Li-rich materials can provide a promising opportunityto design high-energy-density Li-ion electrode materials that canachieve highly exploited oxygen redox reaction.
Figure 1. a) Synchrotron X-ray diffraction (SXRD) of IC and NIC sample(green line: the peaks of the M phase, red line: the peaks of the R phase). b)Phase fraction (wt%) ratio (R phase/M phase) from Rietveld refinementsof neutron diffraction (Table S2, Supporting Information) (closed square:phase fraction of R phase, open square: phase fraction of in M phase). c,d)SEM image of NIC sample (c) and IC sample (d).
2. Results
2.1. Composite Structure Characterizations of the Samples
To understand the oxygen redox reaction, we chose a well-knownLi1.2Ni0.2Mn0.6O2 layered material as a model system because itis free of cobalt and has a certain contribution to the obtainedcapacity by the oxygen redox reaction.[9] The samples were pre-pared by using intimate mixing with a high energy ball-millingfollowed by different cooling rates at high temperature (detailedprocedures in Figure S1, Supporting Information). SynchrotronX-ray diffraction (SXRD) (Figure 1a; Figure S2c,d, Supporting In-formation) and neutron powder diffraction (NPD) (Figure S2a,b,Supporting Information) clearly show that the samples are com-posed of the two phases, a rhombohedral phase (R-3m symme-try, “R phase”) such as LiNi0.5Mn0.5O2 (LNMO) and a monoclinicphase (C2/m symmetry, “M phase”) such as Li2MnO3, which isindicated by the broad superstructure peaks at 20–23° in the 2𝜃range[10] (Figure 1a), which is consistent result with STEM imagein Figure S3, Supporting Information. Even though both sam-ples form a composite and have the same nominal composition(Table S1, Supporting Information), the samples show differentcomposite structure indicated by different degree of the mergeof the peaks between the (20–2) peak of the M phase (red ar-row in Figure 1a)[10a,b] and the combined peaks of both M andR phase (black arrow in Figure 1a).[10a,b] This indicates that thesamples can have different interaction between the two phases ina composite. Based on this different interaction in the compositestructure, the samples were labelled as an inter-diffused cation(IC) sample that has a certain degree of interaction between thetwo phases and Not-IC (NIC) sample that does not have any inter-action. The IC sample shows that the (20–2) peak of the M phase
Adv. Sci. 2020, 2001658 2001658 (2 of 10) © 2020 The Authors. Published by WILEY-VCH Verlag GmbH & Co. KGaA, Weinheim

www.advancedsciencenews.com www.advancedscience.com
Figure 2. a) The amount of Li in the two layered environments based on deconvoluted lines obtained from 6Li MAS NMR at spinning speeds of 30 kHz(Figure S4 and Table S4, Supporting Information) (closed: R phase environment, open: M phase environment). Site occupancies of the amount of Niatoms in each phase, as determined by Rietveld refinements of Neutron diffraction. b) The amount of total Ni atoms in each phase (related with theamount of diffused Ni atoms from R phase to M phase. c) The amount of Ni atoms in Li layer (the degree of cation disordering) of each phase (closed:R phase environment, open: the M phase environment). d) DFT calculations of net formation energies of the materials as a function of the amount ofdiffused Ni into Li2MnO3 phase or the 1/2 amount of diffused Li into LNMO phase for Li-Ni inter-diffusion of each layered phase at T = 0 K. HAADF-STEM image of the M phase in the e) NIC sample projected along the [100]M direction, f) IC sample projected along the [1–10]M and [110]M direction(Figure S5, Supporting Information) (inset: atomic configuration in a unit cell of M phase [such as Li2MnO3], green: Li and purple: Mn).
are merged with the combined peaks of the both M and R phase,whereas the NIC sample shows the separation of these peaks inFigure 1a.
To figure out the interaction between the two phases, NPDand SXRD measurements were carried out in the samples (Fig-ure S2 and Tables S2 and S3, Supporting Information). Refine-ment results of NPD in Figure 1b show that the two sampleshave quite different phase fraction of the R phase (such as LNMOphase) and the M phase (such as Li2MnO3 phase) in the com-posite even though they have the same nominal compositionof Li1.2Ni0.2Mn0.6O2 (Table S1, Supporting Information). The ICsample has higher R phase than the NIC sample but lower Mphase than the NIC sample. As a result, the phase fraction ratio(R phase/M phase) increases from 0.562 in the NIC sample to0.666 in the IC sample. This indicates that the IC sample has theinteraction between the two phases, such as cation inter-diffusionbetween the two phases, and thereby can have different chemi-cal composition compared to the NIC sample considering thatthe two samples have the same nominal composition. It shouldbe noted that the R phase in the samples can be easily decom-posed to the M phase with Ni-based layered material at hightemperature leading to slightly higher fraction of the M phasein the samples compared to the nominal composition.[11] Giventhe merge of peaks between the two phases in the IC sample inFigure 1a, the IC sample can possibly have higher cations inter-diffusion between the two phases. It should be noted that thetwo samples have similar particle size, >200 nm and morphol-ogy (Figure 1c,d) indicating that the interaction between the twophases can happen in a particle (detailed in Figure S3, SupportingInformation).
2.2. Chemical and Local Structure Characterizations of theSamples
To understand how the inter-diffused cations between the twophases affects local Li environments, 6Li magic-angle-spinning(MAS) nuclear magnetic resonance (NMR) measurements werecarried out in the samples (detailed in Figure S4 and TableS4, Supporting Information). Four main different local environ-ments of Li were distinguished:[12] Li in Li layers or TM layersin each R phase and M phase. The amount of Li (mol) in the Rphase environment (Figure 2a) increased from 0.30 mol in theNIC sample to 0.50 mol in the IC while the amount of Li inthe M phase environment decreased from 0.90 mol in the NICsample to 0.70 mol in the IC sample. Given that the phase frac-tion of R/M phase in the IC sample in Figure 1b is similar tothat of the nominal composition (Li2MnO3–LiNi0.5Mn0.5O2), Liamount (≈0.5 mol) of the R phase (Figure 2a) in the IC sam-ple is higher than that (≈0.4 mol) of the R phase in the nominalcomposition while Li amount (≈0.9 mol) of the M phase is lowerthan that (≈0.8 mol) in the nominal composition. This indicatesthat some of Li can be inter-diffused into the R phase from theM phase leading to the formation of the LNMO-like phase andLi2MnO3-like phase. It should be noted that the NIC sample hasdifferent amount of Li in the R/M phase compared to the nomi-nal composition due to different phase fraction rather than otherinteractions.
As a result, the IC sample has higher amount of Li in LNMOphase but lower amount of Li in Li2MnO3 phase compared tothe nominal composition. The inter-diffused Li between the twophases can lead to excess Li in LNMO phase in addition to excess
Adv. Sci. 2020, 2001658 2001658 (3 of 10) © 2020 The Authors. Published by WILEY-VCH Verlag GmbH & Co. KGaA, Weinheim
www.advancedsciencenews.com www.advancedscience.com
Li in Li2MnO3 phase but the NIC sample does not have this (Fig-ure 2a). Considering that each phase in a composite should obeya charge neutrality, the inter-diffused Li between the two phasesin the IC sample should be compensated. One of possible com-pensation mechanism can be the diffusion of transition metalsfrom the R phase to the M phase, the opposite direction of the Lidiffusion.
NPD measurements on the samples in Figure 2b (Table S2,Supporting Information) clearly show that the IC sample hasa certain amount of diffused TM from the R phase into theM phase. Especially, Ni2+ ions from the LNMO phase into theLi2MnO3 phase (Figure 2b) can be possible rather than Mn4+
ions by considering the electrostatic interaction. This Ni inter-diffusion can lead to the incorporation of Ni in Li2MnO3 phasein addition to the excess Li in LNMO phase in the IC sample.The total amount of diffused Ni obtained from refinements ofthe neutron data is ≈0.14 mol between the two phases in the ICsample. Some of diffused Ni (≈0.10 mol) into the M phase in theIC sample can be incorporated into Li layers (Figure 2c) leading tothe increase in the cation disordering (Ni in Li layers) whereas theNIC sample does not have any Ni incorporation in the M phase,even though the amount of Ni in Li layers of the R phase is simi-lar for both samples. These NMR and neutron results clearly in-dicate that the two phases in the IC sample have different degreeof cation disordering and different compositions with respect toLi and Ni compared to those phases in the NIC sample and inthe nominal composition. In other words, the IC sample is com-posed of the composite of Ni incorporated Li2MnO3 (Li2MnO3-like) phase with the increased cation disordering and excess LiLNMO (LNMO-like) phase but the NIC sample does not havethese features of the two phases.
Furthermore, density functional theory (DFT) calculationsclearly demonstrate our observations in the IC sample (de-tails about DFT calculation in Supporting Information). Wemodeled the two phases after Li/Ni inter-diffusion, which areinitially predicted based on the electrostatic interaction ener-gies; Li2−2yNiyMnO3 and the Li1+2xNi0.5−xMn0.5O2. To model theLi1+2xNi0.5−xMn0.5O2 phase, the layered and flower structureswere used as a starting structure. The flower structure of theLi1+2xNi0.5−xMn0.5O2 phase is from one of honeycomb Ni/Mnarrangements with Li disordering in TM layer in the layeredstructure.[13] The net formation energies of the composite thathas certain amount of Li-Ni inter-diffusion between LNMO andLi2MnO3 increase linearly but are slightly positive as the amountof inter-diffused Li/Ni (x) increases in Figure 2d. Since high ther-mal energy can be provided by experimental conditions and con-figurational entropies can be increased by inter-diffused cationsbetween the two phases, this slightly positive net formation en-ergies can be easily overcome at high temperature leading tothe formation of the composite, which have the two layeredphases with LNMO-like phase, which has excess Li in inter-stitial sites and less Ni compared to LiNi0.5Mn0.5O2 (Figure S4and Table S2, Supporting Information), and Li2MnO3-like phase,which has Ni incorporation and less Li compared to Li2MnO3phase.
Further evidence of the Ni incorporation into the Li2MnO3-like phase in the IC sample is provided by high-angle annulardark-field scanning transmission electron microscopy (HAADF-STEM) images (Figure 2e,f). It should be noted that HAADF
mode can only detect heavy elements such as Ni or Mn. HAADFimage of the Li2MnO3 phase in Figure 2e clearly no additionalatoms in Li layers in Li2MnO3 phase projected along [100]M di-rection, which is general feature of Li2MnO3 phase.[14] However,HAADF image of the Li2MnO3-like phase projected along [1–10]M, [110]M direction in Figure 2f clearly shows lots of Ni atomsin Li layers (yellow arrow). This is consistent with the Ni occu-pancy in the Li2MnO3-like phase (Table S2, Supporting Informa-tion). This indicates that the IC sample has the Ni incorporationinto the Li2MnO3-like phase and can have the increased cationdisordering in Li2MnO3 phase.
In order to further confirm the change of the transition metalsin the local structure of the samples, the temperature-dependentmagnetic susceptibility measurements (Figure S6, SupportingInformation) were carried out. It clearly demonstrates that theIC sample has lower the magnetic ordering from LiMn6-like re-gion (LiMn6 ordering) of the M phase[15] than the NIC sample.Given that the magnetic ordering in the M phase is from Mnarrangements, lowering magnetic ordering indicates that the Mphase in the IC sample can have a changed local structure byLi-Ni inter-diffusion with the increased cation disordering (de-tailed explanation in Supporting Information). In addition, ex-tended X-ray absorption fine structure (EXAFS) spectra (FigureS7, Supporting Information) also clearly show that a higher de-gree of local structural disorder in the IC sample than NIC sam-ple was obtained by comparing structural parameter such as theDebye–Waller factor[14b,16] (detailed explained it in SupportingInformation).
Neutron, NMR, STEM data, and DFT calculations in Figures 1and 2 suggest that the IC sample has the Li-Ni inter-diffusionbetween the two phases, whereas the NIC sample does not havethis interaction. The most possible way of the inter-diffusion be-tween the two layered phases in the IC sample is as follows; 2Li+
ions from the Li2MnO3 phase can diffuse to the LNMO phaseand simultaneously Ni2+ ions from the LNMO phase can diffuseto the Li2MnO3 phase for satisfying a charge balance without anychanges in the Ni/Mn oxidation states (Figure S8, Supporting In-formation). Therefore, the Li-Ni inter-diffusion in the IC sampleleads to the excess Li in the R phase and Ni incorporation in theM phase with the increased cation disordering and thereby cancause different compositions of the two phases from those in theNIC sample even though overall composition of the IC sample isthe same as the NIC sample.
2.3. Electrochemical Properties and Oxygen Redox Reaction inthe Samples during Charge/Discharge at RT
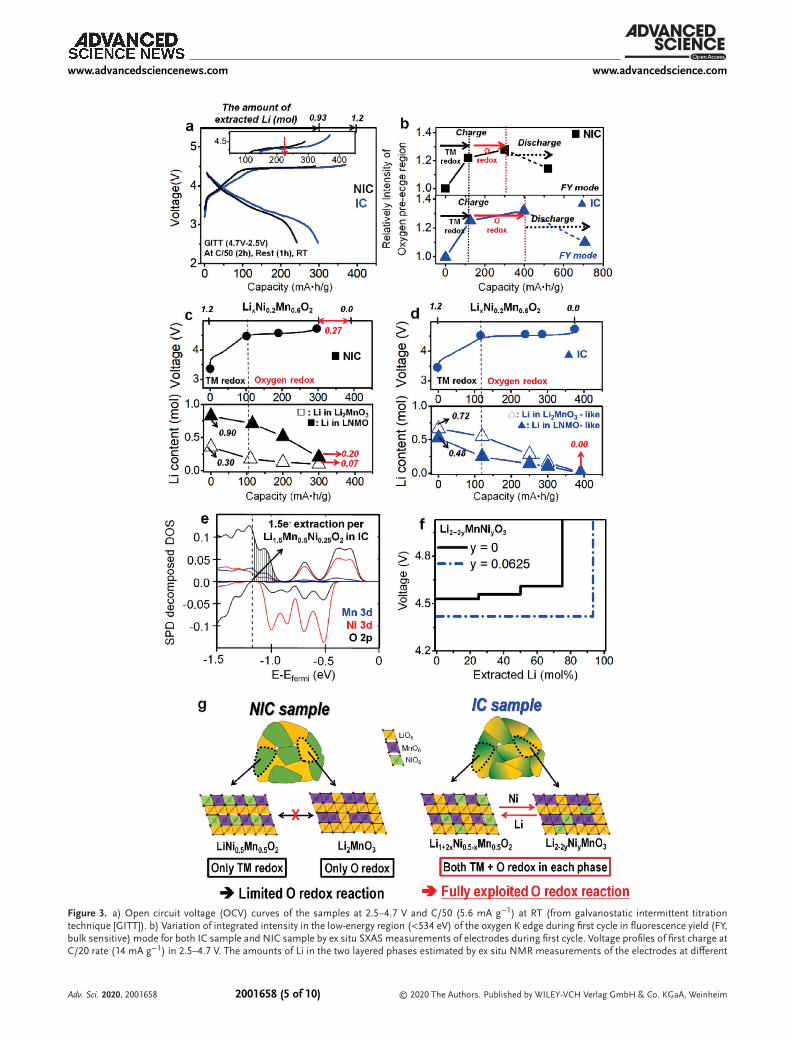
The Li-Ni inter-diffusion between the two phases in the ICsample significantly improves electrochemical activities in Fig-ure 3a. The IC sample achieves almost full charge capacity,≈390 mAh g−1 indicating full extraction of Li, which is furtherconfirmed by the negligible (≈0.002 mol) residual Li in a fullycharged electrode with ICP (inductive-coupled plasma) method,whereas the NIC sample can achieve only ≈300 mAh g−1, that isonly ≈0.93 mol Li extraction. Even though almost all Li ions areextracted from the layered structure in first charge process in theIC sample, the IC sample delivers remarkably higher dischargecapacity, ≈300 mAh g−1 and higher discharge voltage of ≈3.6 V
Adv. Sci. 2020, 2001658 2001658 (4 of 10) © 2020 The Authors. Published by WILEY-VCH Verlag GmbH & Co. KGaA, Weinheim
www.advancedsciencenews.com www.advancedscience.com
Figure 3. a) Open circuit voltage (OCV) curves of the samples at 2.5–4.7 V and C/50 (5.6 mA g−1) at RT (from galvanostatic intermittent titrationtechnique [GITT]). b) Variation of integrated intensity in the low-energy region (<534 eV) of the oxygen K edge during first cycle in fluorescence yield (FY,bulk sensitive) mode for both IC sample and NIC sample by ex situ SXAS measurements of electrodes during first cycle. Voltage profiles of first charge atC/20 rate (14 mA g−1) in 2.5–4.7 V. The amounts of Li in the two layered phases estimated by ex situ NMR measurements of the electrodes at different
Adv. Sci. 2020, 2001658 2001658 (5 of 10) © 2020 The Authors. Published by WILEY-VCH Verlag GmbH & Co. KGaA, Weinheim
www.advancedsciencenews.com www.advancedscience.com
than the NIC sample in Figure 3a. The initial columbic efficiencyof the two samples is similar with each other; 83% for the NICsample and 81% for the IC sample. Even though the IC samplehas much longer voltage plateau at ≈4.5 V than the NIC sample,similar initial coulombic efficiency of the IC sample with the NICsample means that the IC sample has substantially improved oxy-gen redox reversibility rather than large irreversible oxygen redoxreaction such as the oxygen loss at initial cycle.[2b,g] This indicatesthat the Li-Ni inter-diffusion in the IC sample can improve thelayered structure stability leading to a robust structure. The fullLi extraction (≈1.2 mol) with long plateau at ≈4.5 V and high re-versible discharge capacity in the IC sample (Figure 3a) has beenfirst reported in this kind of Co-free Li-rich materials. This indi-cates that Li-TMs inter-diffusion between the two layered phasesin Li-rich materials can enable full Li extraction in Li-rich mate-rials with high reversible capacity at RT.
To understand the oxygen redox reaction in the samples, X-rayabsorption spectroscopy (XAS) measurements were carried out.The Ni K-edge XANES data during first cycle (Figure S9, Sup-porting Information) shows that the Ni redox reaction from 2+to 4+ in the samples can contribute up to ≈125 mAh g−1 to theobtained capacity. This is consistent with previous results in theliterature.[2b,g] As a result, the oxygen redox reaction in the ICsample can contribute the additional capacity, ≈175 mAh g−1 tothe obtained discharge capacity indicating substantial improve-ment of reversible oxygen redox contribution compared to theNIC sample, ≈125mAh g−1 from the oxygen redox reaction (Fig-ure 3a). Improved oxygen redox reaction in the IC sample isclearly supported by the integrated intensity of the pre-edge re-gion below ≈534 eV in the O K-edge SXAS (soft X-ray absorptionspectroscopy) spectra (Figure S10 and Table S6, Supporting In-formation). This region can be attributed to transitions from theO 1s to the unoccupied state in O 2p orbital, and to transitionsfrom the O 1s to the empty hybridized TM d—O 2p orbitals.[2b,17]
Given that the changes in the oxidation state of the Ni and Mnis negligible above 125 mAh g−1 (Figure S9, Supporting Infor-mation), the changes in the integrated intensity of the pre-edgeregion at<534 eV in the O K-edge in the samples indicate that theoxygen redox reaction can be contribute for achieving additionalcapacity.[9,18] Concomitantly, the IC sample shows much higherincrease in the integrated intensities of the O K-edge in both bulk(FY mode, in Figure 3b) and surface regions (TEY mode, in Fig-ure S10, Supporting Information) during first cycle than the NICsample. These results support that the IC sample has the increasein the oxygen redox contribution and reversibility compared tothe NIC sample.
To understand the extraction of Li and the activated oxygen re-dox reaction in the samples, NMR measurements on the ex situelectrodes during first charge process were carried out. Figure 3c(Figure S11, Supporting Information) shows that the NIC samplecannot achieve full Li extraction indicated by the obtained chargecapacity (≈300 mAh g−1); the LNMO phase and Li2MnO3 phase
in the NIC sample is not highly activated, leaving ≈0.07 mol Liand ≈0.20 mol Li in the structure at the end of charge, respec-tively (Figure 3c; Figure S11, Supporting Information). This lim-ited electrochemical reaction in the NIC sample can be relatedto much shorter voltage plateau at ≈4.5 V, where the oxygen re-dox reaction mainly occurs[2d,e] in Figure 3c. NMR data in the NICsample clearly shows that during the voltage plateau at ≈4.5 V, theLNMO phase shows a negligible additional delithiation and at thesame time the Li2MnO3 phase shows a limited delithiation. Thisindicates that the NIC sample has a limited oxygen redox reac-tion. In contrast, Figure 3d (Figure S12, Supporting Information)shows that the charge capacity of ≈390 mAh g−1 in the IC samplewas mainly from the full extraction of Li caused by the redox reac-tions rather than the electrolyte decomposition or other side reac-tions at high voltage. The full charge capacity in the IC sample isdue to the long voltage plateau at ≈4.5 V, where the oxygen redoxreaction mainly occurs.[2d,e] NMR data in Figure 3d clearly showsthat the long voltage plateau at ≈4.5 V in the IC sample is ascribedto an unexpectedly large amount of Li extracted from the LNMO-like environments (≈0.25 mol Li extraction during 4.5 V plateauin Figure 3d) in addition to full Li extraction from the Li2MnO3-like environments (≈0.55 mol Li extraction during 4.5 V plateauin Figure 3d) without leaving any residual Li. Considering thatfurther oxidation of Ni4+/Mn4+ ions is not available (Figures S9and S10, Supporting Information) above ≈4.5 V, this unexpectedfull Li extraction from both the LNMO-like and Li2MnO3-like en-vironment in the IC sample means that the oxygen redox reactionis almost fully exploited. Considering that the IC sample has fullcharge capacity in both the LNMO-like phase and Li2MnO3-likephase but the NIC sample does not, fully exploited oxygen redoxreaction in the IC sample can be ascribed to different compositestructure caused by the inter-diffused cations between the twophases in Li-rich materials.
The Li-Ni inter-diffusion between the two phases in the ICsample can fully exploited oxygen redox reaction in Li-rich mate-rials allowing full extraction of Li with high reversible dischargecapacity of ≈300 mAh g−1 and a high discharge potential, ≈3.6 V.Thus, the IC sample can achieve ≈1100 Wh kg−1, which is thehighest energy density compared to reported Co-free Li-rich ma-terials (in Figure S14, Supporting Information). To understandthe effects of fully exploited oxygen redox reaction on the electro-chemical properties of the IC sample, DFT calculations were car-ried out in both LNMO-like phase and Li2MnO3-like phase. Pre-dicted electronic density of states (DOS) (Figure 3e; Figure S13,Supporting Information) show that the excess Li in the LNMO-like phase can increase additional electronic states nearby the O2p orbital. These additional states can provide additional avail-able electrons for the oxygen redox reaction (Figure 3e) whensufficient Li ions are extracted. This indicates that the LNMO-likephase in the IC sample can have the activated oxygen redox re-action leading to the increased achievable capacity. This result isconsistent with the ex situ NMR results (Figure 3d), which shows
states of charge (SOCs) for c) NIC sample (closed square: LNMO phase, open square: Li2MnO3 phase) and d) IC sample (closed triangle: LNMO-likephase, open triangle: Li2MnO3-like phase). e) Projected density of states of Li1.5Ni0.25Mn0.5O2 (i.e., Li-excess LNMO phase in the IC sample via 25% Nidiffused to Li2MnO3 phase and 50% Li excess in LNMO phase). f) Calculated redox potential during Li extraction of the Li2−2yMnNiyO3 (Li2MnO3-likephase) as the amount of Li-Ni inter-diffusion (y = 0 and 0.0625) between the two layered phases. g) Schematic diagrams of possible atomic structure atlocal scales and redox reactions in the samples.
Adv. Sci. 2020, 2001658 2001658 (6 of 10) © 2020 The Authors. Published by WILEY-VCH Verlag GmbH & Co. KGaA, Weinheim
www.advancedsciencenews.com www.advancedscience.com
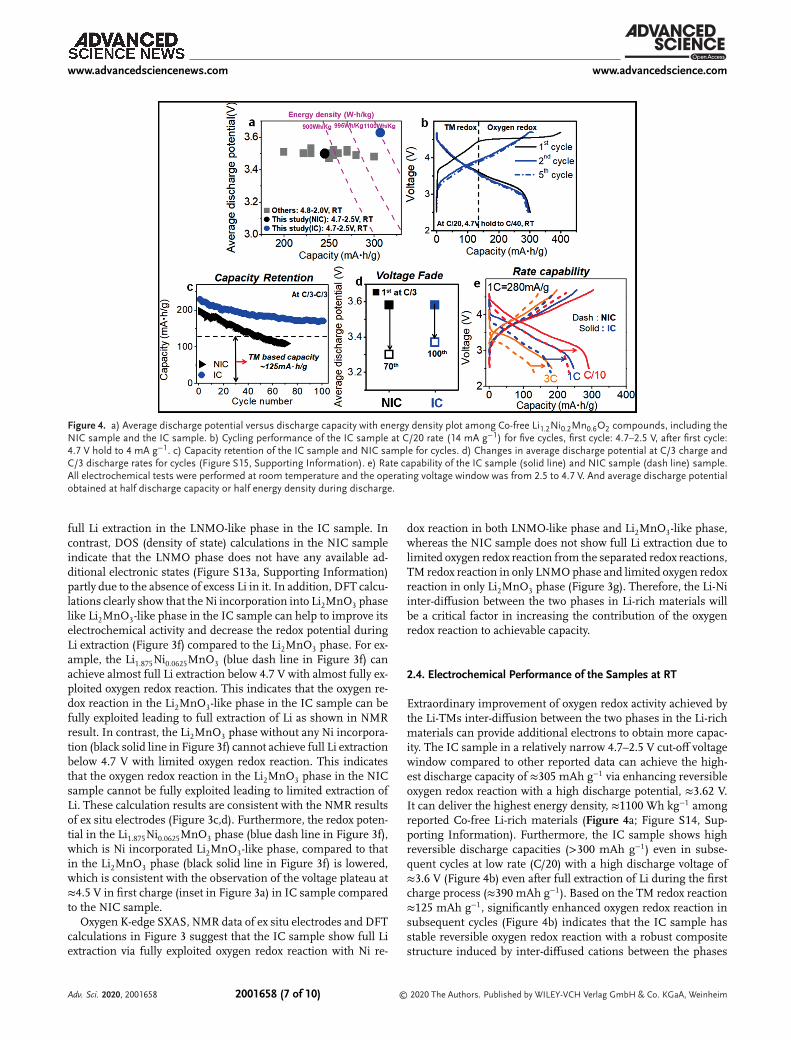
Figure 4. a) Average discharge potential versus discharge capacity with energy density plot among Co-free Li1.2Ni0.2Mn0.6O2 compounds, including theNIC sample and the IC sample. b) Cycling performance of the IC sample at C/20 rate (14 mA g−1) for five cycles, first cycle: 4.7–2.5 V, after first cycle:4.7 V hold to 4 mA g−1. c) Capacity retention of the IC sample and NIC sample for cycles. d) Changes in average discharge potential at C/3 charge andC/3 discharge rates for cycles (Figure S15, Supporting Information). e) Rate capability of the IC sample (solid line) and NIC sample (dash line) sample.All electrochemical tests were performed at room temperature and the operating voltage window was from 2.5 to 4.7 V. And average discharge potentialobtained at half discharge capacity or half energy density during discharge.
full Li extraction in the LNMO-like phase in the IC sample. Incontrast, DOS (density of state) calculations in the NIC sampleindicate that the LNMO phase does not have any available ad-ditional electronic states (Figure S13a, Supporting Information)partly due to the absence of excess Li in it. In addition, DFT calcu-lations clearly show that the Ni incorporation into Li2MnO3 phaselike Li2MnO3-like phase in the IC sample can help to improve itselectrochemical activity and decrease the redox potential duringLi extraction (Figure 3f) compared to the Li2MnO3 phase. For ex-ample, the Li1.875Ni0.0625MnO3 (blue dash line in Figure 3f) canachieve almost full Li extraction below 4.7 V with almost fully ex-ploited oxygen redox reaction. This indicates that the oxygen re-dox reaction in the Li2MnO3-like phase in the IC sample can befully exploited leading to full extraction of Li as shown in NMRresult. In contrast, the Li2MnO3 phase without any Ni incorpora-tion (black solid line in Figure 3f) cannot achieve full Li extractionbelow 4.7 V with limited oxygen redox reaction. This indicatesthat the oxygen redox reaction in the Li2MnO3 phase in the NICsample cannot be fully exploited leading to limited extraction ofLi. These calculation results are consistent with the NMR resultsof ex situ electrodes (Figure 3c,d). Furthermore, the redox poten-tial in the Li1.875Ni0.0625MnO3 phase (blue dash line in Figure 3f),which is Ni incorporated Li2MnO3-like phase, compared to thatin the Li2MnO3 phase (black solid line in Figure 3f) is lowered,which is consistent with the observation of the voltage plateau at≈4.5 V in first charge (inset in Figure 3a) in IC sample comparedto the NIC sample.
Oxygen K-edge SXAS, NMR data of ex situ electrodes and DFTcalculations in Figure 3 suggest that the IC sample show full Liextraction via fully exploited oxygen redox reaction with Ni re-
dox reaction in both LNMO-like phase and Li2MnO3-like phase,whereas the NIC sample does not show full Li extraction due tolimited oxygen redox reaction from the separated redox reactions,TM redox reaction in only LNMO phase and limited oxygen redoxreaction in only Li2MnO3 phase (Figure 3g). Therefore, the Li-Niinter-diffusion between the two phases in Li-rich materials willbe a critical factor in increasing the contribution of the oxygenredox reaction to achievable capacity.
2.4. Electrochemical Performance of the Samples at RT
Extraordinary improvement of oxygen redox activity achieved bythe Li-TMs inter-diffusion between the two phases in the Li-richmaterials can provide additional electrons to obtain more capac-ity. The IC sample in a relatively narrow 4.7–2.5 V cut-off voltagewindow compared to other reported data can achieve the high-est discharge capacity of ≈305 mAh g−1 via enhancing reversibleoxygen redox reaction with a high discharge potential, ≈3.62 V.It can deliver the highest energy density, ≈1100 Wh kg−1 amongreported Co-free Li-rich materials (Figure 4a; Figure S14, Sup-porting Information). Furthermore, the IC sample shows highreversible discharge capacities (>300 mAh g−1) even in subse-quent cycles at low rate (C/20) with a high discharge voltage of≈3.6 V (Figure 4b) even after full extraction of Li during the firstcharge process (≈390 mAh g−1). Based on the TM redox reaction≈125 mAh g−1, significantly enhanced oxygen redox reaction insubsequent cycles (Figure 4b) indicates that the IC sample hasstable reversible oxygen redox reaction with a robust compositestructure induced by inter-diffused cations between the phases
Adv. Sci. 2020, 2001658 2001658 (7 of 10) © 2020 The Authors. Published by WILEY-VCH Verlag GmbH & Co. KGaA, Weinheim

www.advancedsciencenews.com www.advancedscience.com
allowing to reversibly extract/insert large amount of Li. There-fore, excess Li with the increased cation disordering in each phaseinduced by inter-diffused Li-TMs between the two layered phasessignificantly enhances the oxygen redox activity and improves itsreversibility, and thereby yields high reversible capacity for cycles.
The IC sample also shows remarkably improved capacity re-tention and mitigated voltage fade with cycling (Figure 4c,d).However, the NIC sample showed rapid capacity fade from ≈200to ≈100 mAh g−1, and poor voltage retention with ≈4.3 mV percycle fading rate during 70 cycles. The IC sample achieved partic-ularly superior (≈85%) capacity retention with only ≈0.6 mV percycle fading rate during 100 cycles along with improved voltageretention (Figure S15, Supporting Information). This extendedcycle stability indicates that the redox reactions such as the oxy-gen redox and TM-based redox reaction[2a,b] in Li-rich layered ma-terials can be reversible and sustainable by controlling compos-ite structure via Li-TMs inter-diffusion between the two phases.The degree of cation disordering (Ni ions in Li layers) in eachphase in the pristine material (Figure 2c; Table S2, SupportingInformation) can affect the capacity retention and mitigated volt-age fade in the Li-rich materials. Considering that the IC sam-ple has higher the degree of the cation disordering, especially inthe Li2MnO3 phase than the NIC sample, this improved capac-ity retention and mitigated voltage fade in the IC sample indi-cates that the cation disordering can critically affect electrochem-ical properties in the Li-rich layered materials. This can be partlybecause the cation disordering can improve layered structure sta-bility even with large extraction of Li and prevent the migrationof Mn in the structure due to strong electrostatic repulsion of Niions in Li layers.[19] Therefore, controlling the inter-diffusion ofLi-TM between the phases in the Li-rich materials can be one ofeffective ways to improve the capacity retention and mitigate thevoltage fade. Furthermore, the IC sample had much higher ratecapability than the NIC sample in Figure 4e. A rate of nC cor-responds to a full discharge in 1/n h. The IC sample can achieve≈250 mAh g−1 of capacity at 1C discharge rate (280 mA g−1), ≈200mAh g−1 at 3C discharge rate, whereas the NIC sample showsonly ≈170 mAh g−1 at 1C discharge rate. Improved rate capabil-ity with high discharge capacity in the IC sample indicates thatthe oxygen redox reactions can be kinetically comparable to TM-only redox reactions, contrary to previous observation in Li-rich4d/5d TM oxides.[20] The robust layered structure caused by Li-Ni inter-diffusion in the IC sample can help to stabilize the fullydelithiated phase leading to less polarization at high rates. Thiscan enable high rate capability of the IC sample.
3. Conclusion
Controlled structural/chemical changes induced by the Li-TMinter-diffusion between the two phases in the Li-rich materialscan help to fully exploit oxygen redox reaction in addition to TMredox reaction, resulting in very high energy density. Given theLi-rich layered materials that are composed of the two layeredphases,[3b,10a,14b,21] the Li-TM inter-diffusion between both phasescan lead to different composite structure such as the excess Li andNi incorporation in both layered phases that can remarkably im-prove reversible oxygen redox activity and layered structure stabil-ity. The excess Li in the both layered phases can increase local Li-
rich environments such as Li–O–Li structures leading to the for-mation of available additional electronic states nearby the oxygenorbital that can activate and increase the oxygen redox reaction.[2a]
Also, Ni incorporation in both layered phases can increase ac-cessible capacity via tailoring electronic structure for easy chargetransfer between oxide ions and TM ions[22] or via improving lay-ered structure stability caused by the increase in the cation dis-ordering. Thus, both electronic structure and structural stabilityshould be satisfied to achieve high exploiting oxygen redox reac-tion, especially 3d-TM based Li-rich layered materials without anydoping or surface coating. As a result, the strategy of controllingLi-TMs inter-diffusion between the phases in a Li-rich materialcan allow to fully exploit the reversible oxygen redox reaction re-sulting in increase in the achievable energy density.
In summary, we provide clear demonstration that the con-trolled structural/chemical changes induced by the Li-TM inter-diffusion between the two phases in Li-rich composites can becritical factor for highly activating the oxygen redox reaction lead-ing to the increase in reversible energy density. This strategy ofcontrolling Li-TMs inter-diffusion between the phases in Li-richmaterials will open new avenues for developing the electrodematerials that can exceed the capacity of the conventional TM-only redox materials by using a highly reversible oxygen redoxreaction for high performance Li-ion batteries. We further sug-gest that our strategy of fully exploited oxygen redox reaction viaLi/TM inter-diffusion between phases in Li-rich layered materialscan be widely applicable to various energy-related electrochemi-cal systems such as fuel cells and electrochemical catalysts to con-trol electrochemical oxygen redox reaction via controlled struc-tural/chemical changes induced by cations distribution betweenthe components in a composite.
4. Experimental SectionPreparation of Materials: Li1.2Ni0.2Mn0.6O2 were synthesized by solid-
state reaction in four steps or two steps. 1) Appropriate ratios of Li2CO3,MnO2, and NiCO3 were ball-milled in acetone for 12 h. These sampleshad the molar ratio of Li:Ni:Mn = 1.2:0.2:0.6. 2) A mix of precursors waspelletized, then calcined at 900 °C for 10 h in air with ramping temper-ature 5 °C min−1. 3) The calcined pellets were grounded and pulverizedby planetary wet ball-milling (PBM, Fritsch Pulverisette planetary ball-mill)for 3 h with 500 rpm. It should be noted that the samples prepared with-out undergoing the PBM process could exhibit poor oxygen redox activitydue to insufficient interaction between Li2MnO3 and LiNi0.5Mn0.5O2 athigh temperatures despite the quenching process (Details in SupportingInformation). The pulverized powder was re-pelletized. 4) The pellets werereannealed for 5 h in air at 800 °C with ramping temperature 5 °C min−1
(sample name: inter-diffused cation, IC) then quenched to room temper-ature (RT). Alternatively, the pellet was reannealed at 800 °C for 5 h in air,then cooled naturally to RT (sample name: not inter-diffused cation, NIC).Detailed synthesis processes are explained in Supporting Information.
Material Characterizations: The neutron diffraction measurementswere performed at the Australian Centre for Neutron Scattering. Thewavelength was 1.5340 Å and the scan range was 10–150° in incrementsof 0.05. All data were collected at RT. The synchrotron X-ray diffractionmeasurements were performed on beamline 9B-HRPD at Pohang Accel-erator Laboratory (PAL), Pohang, Korea. The incident X-rays were verti-cally collimated by a mirror, and then monochromated to the wavelengthof 1.4970 Å by a double-crystal Si (111) monochromator. The datasetswere collected in the range of 10° ≤ 2𝜃 ≤ 130° with a step size of0.02° (2𝜃 range). Rietveld refinements for the lattice parameters of each
Adv. Sci. 2020, 2001658 2001658 (8 of 10) © 2020 The Authors. Published by WILEY-VCH Verlag GmbH & Co. KGaA, Weinheim
www.advancedsciencenews.com www.advancedscience.com
sample and the quantity of impurities were determined using Full Proofsoftware. High-resolution transmission electron microscopy (TEM) anal-ysis was conducted on a JOEL JEM-2200FS microscope fitted with a LaB6filament at an acceleration voltage of 200 kV.
Nuclear Magnetic Resonance Measurements: 6Li and 7Li MAS NMRmeasurements were performed at RT on a Bruker Avance-200 spectrome-ter (B0 = 4.7 T, Larmor frequency 𝜇0 = 29.45 and 77.78 MHz for 6Li and7Li, respectively). The 6Li isotope was a spin-1 nucleus and had the small-est quadrupole moment for any nucleus and it could be considered asa spin-1/2 nucleus. Therefore, sharp linewidths were achieved with com-pared to the 7Li isotope. In addition, 6Li had a much lower gyromagneticratio (𝛾7Li/𝛾6Li = 2.6) resulting in a much narrower spinning sidebandmanifolds and NMR spectra easier to interpret. Thus, despite its lowestsensitivity 6Li could be preferred instead of 7Li detection. However, in thepresent study 7Li MAS NMR was preferred to analysis cycled samples,because of the small amount of sample recovered from cycled electrodes.MAS spectra were obtained by using a Bruker MAS probe with a cylindrical2.5 mm (o.d.) zirconia rotor. Spinning speed was varied between 25 and30 kHz in order to determine the position of the isotropic resonances. 6Liand 7Li MAS NMR spectra were acquired using an echo (𝜋∕2−𝜏−𝜋−𝜏)pulse sequence with a 𝜋/2 pulse of 4.1 µs and 2.3 µs for 6Li and 7Li, re-spectively. Recycle time was typically 0.5s. The isotropic shifts, reported inparts per million (ppm), were relative to an external liquid 1 m solution indeionized water of LiCl and 6Li enriched LiCl set at 0 ppm.
X-Ray Absorption Spectroscopy Measurements: Hard X-ray absorptionspectra of Mn and Ni K-edges were collected at the facility installed atbeamline 7D at PLS (Pohang Light Source)-II in transmission mode withthe N2 gas-ionization detectors and a Si(111) double-crystal monochro-mator detuned to ≈70% of its original intensity to eliminate higher-orderharmonics. The storage ring was operated at 2.5 GeV with an injection cur-rent of ≈350 mA. The spectral energies were calibrated by using the firstinflection points in the Mn and Ni metal foil spectra as references (i.e.,Mn K-edge = 6539 eV, and Ni K-edge = 8333 eV). Data pre-processing op-erations such as deglitching, energy calibration, normalization, and leastsquare fitting with theory were performed by using IFEFFIT which used theFEFF code. Soft XAS spectra of O K-edge were recorded at beamline 8A1—SPEM and 10D—XAS KIST of PLS-II in total electron yield (TEY) modeand fluorescence yield (FY) mode under high vacuum condition with abase pressure of 3 × 10⁻¹⁰ Torr. The spectral energy resolution was 0.1 eVand the monochromator absorption features were normalized by dividingthe detected signals (I1) by the photoemission current, I0 of a gold meshplaced in the incident beam. All the absorption spectroscopy data weremeasured at RT. Data pre-processing operations such as deglitching, en-ergy calibration, normalization, and least square fitting with theory wereperformed by using WINXAS program with two or three Gaussian func-tions and one Arc tangent function.
Electrochemical Measurements: For electrochemical tests, compositeelectrodes for IC and NIC sample were made by mixing active material(80 wt%), super-P carbon (Timcal, 15 wt%), and binder (poly(vinylidenefluoride) (PVDF), 5 wt%) by using a solution of 8% (wt) PVDF in N-methylpyrolidinone. A slurry mixture was tape-cast on Al foil (HohsenCorp.) by the doctor blade method. The loading density of the electrodewas 2–3 mg cm−2. The cells were assembled with Li metal (Hohsen Corp.)in an argon-filled glove box and tested them on a Maccor 2200 operatingin galvanostatic mode using lithium metal as an anode, non-aqueous elec-trolyte (1 m LiPF6 in ethylene carbonate (EC):diethyl carbonate (DEC) (1:1by volume, PANAX ETEC Co. Ltd., battery grade), and Celgard 2400 as aseparator in a 2032-coin cell. All cells were tested at room temperature. Forex situ experiments, the device in glovebox was disassembled, taking carenot to short-circuit it. And then the electrodes were rinsed with dimethyl-carbonate to remove residual electrolyte salt and allowed them to dry. Theelectrodes were covered for ex situ study with teflon tape or scotch tapeand stored in the glovebox until the experiment was carried out.
Density Functional Theory Calculations: Phase stability and voltage pro-files of Li1+2xMn0.5Ni0.5−xO2 and Li2−2yMnNiyO3 (x, y < 1) were predictedbased on total energies computed using the Vienna Ab initio Simula-tion Package (VASP) and the Perdew–Burke–Ernzerhof (PBE) functional inthe generalized gradient approximation (GGA) and projector-augmented
wave method. The on-site interaction was corrected by the Hubbard U pa-rameters of 6.0 and 3.9 eV for the Ni and Mn 3d orbitals, respectively.Spin-polarized calculations were performed with a plane-wave energy cut-off = 520 eV and a k-points grid density with more than 0.01 k-points perÅ3. Lattice parameters and atomic positions were optimized until the en-ergies and forces converged to within 10−5 eV per atom and 10−3 eV Å−1,respectively. The delithiation voltage profiles of the Li2−2yMnNiyO3 phaseswere computed for x = 0 and 0.0625 using 4 and 16 formula units ina computational cell, respectively, and Li/vacancy ordering was tested bysampling 30 configurations with the lowest electrostatic energy at each Licontent. For reliable energy band positions in density of states, the Heyd–Scuseria–Ernzerhof (HSE) screened hybrid functional was used instead ofthe GGA functional. Atomic positions and lattice parameters of the moststable structures predicted from GGA were re-optimized within HSE, andthe pseudopotential, plane-wave energy cutoff, k-points grid, and energyand force convergence criteria were set to the same used in the GGA cal-culations. Details are in Supporting Information.
Supporting InformationSupporting Information is available from the Wiley Online Library or fromthe author.
AcknowledgementsThis research was supported by the Basic Science Research Programthrough the National Research Foundation of Korea (NRF) funded by theMinistry of Science, ICT and Future Planning (NRF-2017M3A7B8065394and NRF-2019R1A2C2007933). This research was supported by theBrain Korea 21 PLUS Project for Center for Creative Industrial Materi-als (F14SN02D1707) and a POSTECH Basic Science Research InstituteGrant. Part of the work was performed under the auspices of the DOEby the Lawrence Livermore National Laboratory under Contract DE-AC52-07NA27344. The authors gratefully thank Prof. Hong Li for his insightfuldiscussions.
Conflict of InterestThe authors declare no conflict of interest.
Keywordscathode materials, composite materials, layered materials, Li/TMs inter-diffusion, oxygen redox reaction
Received: May 4, 2020Published online:
[1] S. Chu, Y. Cui, N. Liu, Nat. Mater. 2017, 16, 16.[2] a) D.-H. Seo, J. Lee, A. Urban, R. Malik, S. Kang, G. Ceder, Nat. Chem.
2016, 8, 692; b) K. Luo, M. R. Roberts, R. Hao, N. Guerrini, D. M.Pickup, Y.-S. Liu, K. Edström, J. Guo, A. V. Chadwick, L. C. Duda, Nat.Chem. 2016, 8, 684; c) N. Yabuuchi, M. Nakayama, M. Takeuchi, S.Komaba, Y. Hashimoto, T. Mukai, H. Shiiba, K. Sato, Y. Kobayashi,A. Nakao, Nat. Commun. 2016, 7, 13814; d) H. Liu, Y. Chen, S. Hy,K. An, S. Venkatachalam, D. Qian, M. Zhang, Y. S. Meng, Adv. En-ergy Mater. 2016, 6, 1502143; e) A. Grimaud, W. Hong, Y. Shao-Horn,
Adv. Sci. 2020, 2001658 2001658 (9 of 10) © 2020 The Authors. Published by WILEY-VCH Verlag GmbH & Co. KGaA, Weinheim

www.advancedsciencenews.com www.advancedscience.com
J.-M. Tarascon, Nat. Mater. 2016, 15, 121; f) M. Saubanère, E. Mc-Calla, J.-M. Tarascon, M.-L. Doublet, Energy Environ. Sci. 2016, 9, 984;g) H. Koga, L. Croguennec, M. Ménétrier, P. Mannessiez, F. Weill, C.Delmas, S. Belin, J. Phys. Chem. C 2014, 118, 5700; h) G. Assat, J.-M.Tarascon, Nat. Energy 2018, 3, 373.
[3] a) Y. Wu, L. Xie, X. He, L. Zhuo, L. Wang, J. Ming, Electrochim. Acta2018, 265, 115; b) Y. Zuo, B. Li, N. Jiang, W. Chu, H. Zhang, R. Zou,D. Xia, Adv. Mater. 2018, 30, 1707255.
[4] a) B. Qiu, M. Zhang, L. Wu, J. Wang, Y. Xia, D. Qian, H. Liu, S. Hy,Y. Chen, K. An, Nat. Commun. 2016, 7, 12108; b) J. Zheng, M. Gu, J.Xiao, B. J. Polzin, P. Yan, X. Chen, C. Wang, J.-G. Zhang, Chem. Mater.2014, 26, 6320.
[5] a) A. R. Armstrong, M. Holzapfel, P. Novák, C. S. Johnson, S.-H.Kang, M. M. Thackeray, P. G. Bruce, J. Am. Chem. Soc. 2006, 128,8694; b) J. Lee, J. K. Papp, R. J. Clément, S. Sallis, D.-H. Kwon, T.Shi, W. Yang, B. D. McCloskey, G. Ceder, Nat. Commun. 2017, 8,981.
[6] a) N. Yabuuchi, M. Takeuchi, M. Nakayama, H. Shiiba, M. Ogawa, K.Nakayama, T. Ohta, D. Endo, T. Ozaki, T. Inamasu, Proc. Natl. Acad.Sci. U. S. A. 2015, 112, 7650; b) M. Sathiya, G. Rousse, K. Ramesha, C.Laisa, H. Vezin, M. T. Sougrati, M.-L. Doublet, D. Foix, D. Gonbeau,W. Walker, Nat. Mater. 2013, 12, 827.
[7] P. E. Pearce, A. J. Perez, G. Rousse, M. Saubanère, D. Batuk, D. Foix,E. McCalla, A. M. Abakumov, G. van Tendeloo, M.-L. Doublet, Nat.Mater. 2017, 16, 580.
[8] J. Lee, D. A. Kitchaev, D.-H. Kwon, C.-W. Lee, J. K. Papp, Y.-S. Liu,Z. Lun, R. J. Clément, T. Shi, B. D. McCloskey, Nature 2018, 556,185.
[9] K. Luo, M. R. Roberts, N. Guerrini, N. Tapia-Ruiz, R. Hao, F. Massel,D. M. Pickup, S. Ramos, Y.-S. Liu, J. Guo, J. Am. Chem. Soc. 2016, 138,11211.
[10] a) J. Bréger, M. Jiang, N. Dupré, Y. S. Meng, Y. Shao-Horn, G. Ceder, C.P. Grey, J. Solid State Chem. 2005, 178, 2575; b) C. Yu, G. Li, X. Guan,J. Zheng, D. Luo, L. Li, Phys. Chem. Chem. Phys. 2012, 14, 12368;c) H. Yu, H. Kim, Y. Wang, P. He, D. Asakura, Y. Nakamura, H. Zhou,Phys. Chem. Chem. Phys. 2012, 14, 6584.
[11] a) N. Yabuuchi, Y.-C. Lu, A. N. Mansour, T. Kawaguchi, Y. Shao-Horn,Electrochem. Solid-State Lett. 2010, 13, A158; b) C. Hu, J. Guo, J. Wen,Y. Peng, Y. Chen, J. Alloys Compd. 2013, 581, 121.
[12] a) C. P. Grey, N. Dupré, Chem. Rev. 2004, 104, 4493; b) W.-S. Yoon,S. Iannopollo, C. P. Grey, D. Carlier, J. Gorman, J. Reed, G. Ceder,Electrochem. Solid-State Lett. 2004, 7, A167.
[13] Y. Hinuma, Y. S. Meng, K. Kang, G. Ceder, Chem. Mater. 2007, 19,1790.
[14] a) J. Zheng, M. Gu, A. Genc, J. Xiao, P. Xu, X. Chen, Z. Zhu, W. Zhao,L. Pullan, C. Wang, Nano Lett. 2014, 14, 2628; b) X. Yu, Y. Lyu, L. Gu,H. Wu, S. M. Bak, Y. Zhou, K. Amine, S. N. Ehrlich, H. Li, K. W. Nam,Adv. Energy Mater. 2014, 4, 1300950.
[15] a) J. B. Goodenough, Phys. Rev. 1960, 117, 1442; b) D. Mohanty, A.S. Sefat, J. Li, R. A. Meisner, A. J. Rondinone, E. A. Payzant, D. P.Abraham, D. L. Wood III, C. Daniel, Phys. Chem. Chem. Phys. 2013,15, 19496.
[16] Y. Tsai, B. Hwang, G. Ceder, H. Sheu, D. Liu, J. Lee, Chem. Mater.2005, 17, 3191.
[17] W.-S. Yoon, M. Balasubramanian, K. Y. Chung, X.-Q. Yang, J. McBreen,C. P. Grey, D. A. Fischer, J. Am. Chem. Soc. 2005, 127, 17479.
[18] K. Shimoda, T. Minato, K. Nakanishi, H. Komatsu, T. Matsunaga, H.Tanida, H. Arai, Y. Ukyo, Y. Uchimoto, Z. Ogumi, J. Mater. Chem. A2016, 4, 5909.
[19] S. Myeong, W. Cho, W. Jin, J. Hwang, M. Yoon, Y. Yoo, G. Nam, H.Jang, J.-G. Han, N.-S. Choi, Nat. Commun. 2018, 9, 3285.
[20] a) G. Assat, C. Delacourt, D. A. D. Corte, J.-M. Tarascon, J. Elec-trochem. Soc. 2016, 163, A2965; b) J. Lee, D.-H. Seo, M. Balasubra-manian, N. Twu, X. Li, G. Ceder, Energy Environ. Sci. 2015, 8, 3255; c)J. Lee, A. Urban, X. Li, D. Su, G. Hautier, G. Ceder, Science 2014, 343,519.
[21] S. Kaewmala, W. Limphirat, V. Yordsri, H. Kim, S. Muhammad, W.-S.Yoon, S. Srilomsak, P. Limthongkul, N. Meethong, Sci. Rep. 2019, 9,427.
[22] a) K. Hoang, Phys. Rev. Mater. 2017, 1, 075404; b) S. Hy, J.-H. Cheng,J.-Y. Liu, C.-J. Pan, J. Rick, J.-F. Lee, J.-M. Chen, B. J. Hwang, Chem.Mater. 2014, 26, 6919.
Adv. Sci. 2020, 2001658 2001658 (10 of 10) © 2020 The Authors. Published by WILEY-VCH Verlag GmbH & Co. KGaA, Weinheim