A generalized divergence for statistical inference - Project Euclid
Upload
khangminh22Category
view
0download
0
RESEARCH ARTICLE Open Access
Contemporary divergence in early life history ingrayling (Thymallus thymallus)Gaute Thomassen1,2, Nicola J Barson1, Thrond O Haugen1,3,4 and L Asbjørn Vøllestad1*
Abstract
Background: Following colonization of new habitats and subsequent selection, adaptation to environmentalconditions might be expected to be rapid. In a mountain lake in Norway, Lesjaskogsvatnet, more than 20 distinctspawning demes of grayling have been established since the lake was colonized, some 20-25 generations ago. Thedemes spawn in tributaries consistently exhibiting either colder or warmer temperature conditions duringspawning in spring and subsequent early development during early summer. In order to explore the degree oftemperature-related divergence in early development, a multi-temperature common-garden experiment wasperformed on embryos from four different demes experiencing different spring temperatures.
Results: Early developmental characters were measured to test if individuals from the four demes responddifferently to the treatment temperatures. There was clear evidence of among-deme differences (genotype -environment interactions) in larval growth and yolk-to-body-size conversion efficiency. Under the cold treatmentregime, larval growth rates were highest for individuals belonging to cold streams. Individuals from warm streamshad the highest yolk-consumption rate under cold conditions. As a consequence, yolk-to-body-mass conversionefficiency was highest for cold-deme individuals under cold conditions. As we observed response parallelismbetween individuals from demes belonging to similar thermal groups for these traits, some of the differentiationseems likely to result from local adaptation
Conclusion: The observed differences in length at age during early larval development most likely have a geneticcomponent, even though both directional and random processes are likely to have influenced evolutionary changein the demes under study.
BackgroundLarge changes in environmental conditions put popula-tions at risk of becoming maladapted, thereby leading tonegative population growth and potential extinction [1].Such large changes in environmental conditions may bedue to anthropogenic activity [2], but may also be experi-enced as individuals invade a novel environment. Forectotherms in general, temperature is considered to be byfar the most important external factor, controlling muchof the variation seen in embryonic ontogenetic rates[3-5]. Following an environmental perturbation a popula-tion may be maladapted to the new conditions. If popula-tions cannot rapidly move towards the new evolutionaryoptimum they may risk extinction [6].
Modification of traits may happen through purely plasticprocesses or through evolutionary change [7-9]. Phenoty-pic plasticity is defined as the ability of a single genotypeto develop different phenotypes under different environ-mental conditions [7]. Norms of reaction (i.e., the variationin trait value across environmental gradients) are com-monly used to illustrate the phenotypic plasticity of geno-types (reviewed in [10]). When a perturbation to theenvironment is outside of the normal range of environ-mental fluctuations, it is expected that evolutionary changewill be required to reach the new fitness optimum [6]. Inmany situations, for example where there is substantialspatial habitat heterogeneity, the norms of reaction maybe the target of selection [11]. Divergence in the slopeand/or elevation of reaction norms may develop amongpopulations occupying habitats that differ in their environ-mental characteristics. Since many traits depend on condi-tions experienced earlier in life, the reaction norm concept
* Correspondence: [email protected] for Ecological and Evolutionary Synthesis, Department of Biology,University of Oslo, P. O. Box 1066 Blindern, NO-0316 Oslo, NorwayFull list of author information is available at the end of the article
Thomassen et al. BMC Evolutionary Biology 2011, 11:360http://www.biomedcentral.com/1471-2148/11/360
© 2011 Thomassen et al; licensee BioMed Central Ltd. This is an Open Access article distributed under the terms of the CreativeCommons Attribution License (http://creativecommons.org/licenses/by/2.0), which permits unrestricted use, distribution, andreproduction in any medium, provided the original work is properly cited.

has been extended to include developmental processes[12]. These developmental reaction norms may be the tar-get of selection, where individuals that most optimallymodify their developmental trajectories under varyingenvironmental conditions are selected.A change in the population reaction norm requires
genetic change, either through stochastic processes likegenetic drift, or through adaptive evolution. Today it isrealized that ecological and evolutionary dynamics do notnecessarily operate on vastly different timescales [13-15].A mounting number of studies provide evidence of evo-lutionary change over contemporary time scales [16,17].In salmonid fishes, thermal adaptation is thought to be
important, especially during the egg-stage and subse-quent phases following hatching. For fish larvae in gen-eral, size appears to be positively correlated with early-life survival [18-20]. This rule has been termed the “big-ger-is-better"-hypothesis; for fish larvae, performance issize-dependent to a stronger degree than it is age-depen-dent, or dependent on any other measure of biologicaltime [21,22]. The size effect is particularly stronglyexpressed under conditions of high competition, sincethere tends to be strong dominance hierarchies in juve-nile salmonids [23,24]. Strong directional, size-dependentselection should thus lead to increased individual devel-opment rates in a population. We here investigate if thatis the case in several demes of grayling Thymallus thy-mallus in an alpine Norwegian lake (Figure 1).
Grayling, a spring spawning salmonid fish, colonizedthe lake Lesjaskogsvatnet through a man-made connec-tion in the upper reaches of the river Gudbrandsdalslågenthat was opened in the late 1880s (20-25 generationsago). Subsequent closing of the connection made furtherimmigration of grayling difficult [25]. Genetic evidencesuggests that Lesjaskogsvatnet was colonized by a lownumber of individuals from Gudbrandsdalslågen [26].Since the colonization event, the grayling have estab-lished more than 20 demes spawning in separate tribu-taries to the lake [27]. It is likely that grayling return totheir natal tributary to spawn. Lacustrine populations ofgrayling prefer to move to running water to spawnand are known to return to their natal stream with highfidelity [28].During spring, the south-facing slopes of Lesjaskogsvat-
net receive considerably more sunlight and are less steepthan the shaded north-facing slope resulting in morerapid spring warming. In addition, small tributaries tendto warm more rapidly than large ones. As a result ofthese differences in aspect coupled with size differencesamong tributaries, tributaries can generally be classifiedas either large-and-cold (LC) or small-and-warm (SW)[27]. Generally, spring ice-melt commences earlier in SWtributaries than in LC tributaries, and SW tributarieshave a higher temperature than LC tributaries throughspring and early summer [29]. Typically, mean dailyJune- July water temperatures differ by 1-1.5 °C among
Figure 1 Map of the Norwegian lake Lesjaskogsvatnet. Tributaries colored blue are defined as large-and-cold (LC) tributaries while thetributaries colored red are defined as small-and-warm (SW) tributaries. 1 = Steinbekken (SW), 2 = Sandbekken (SW), 3 = Valåe (LC), 4 = Hyrjon(LC), R = Rauma outlet and G = Gudbrandsdalslågen outlet. For further details see text.
Thomassen et al. BMC Evolutionary Biology 2011, 11:360http://www.biomedcentral.com/1471-2148/11/360
Page 2 of 10

LC and SW streams, which add up to substantial differ-ences in accumulated temperature sums over the streamphase.Haugen and Vøllestad [30] conducted a common-gar-
den study of several early growth and developmental traitsof grayling in the same area, but on an inter-lake scale.They investigated differences between the Lesjaskogsvat-net population and two other populations recently derivedfrom Lesjaskogsvatnet grayling. In their study, they discov-ered apparent adaptations in many of the traits. Based onthe same data, evidence for divergence in time to hatchingwas found between two of the populations [31]. Theseresults demonstrate that in the absence of gene flow localadaptation may progress significantly over less than a 20-generation time span. Here, we use a common environ-ment approach at three different temperature conditionsto investigate how temperature reaction norms for earlylife history traits vary for grayling from two cold and twowarm streams where gene flow among streams is possible.In high latitude mountain lakes like Lesjaskogsvatnet the
growth season is short. For north-temperate fishes the firstwinter is usually a period of energy deficit [32], potentiallyselecting for faster growth. The selection intensity isexpected to be strongest for the demes with the shortestgrowth season (i.e. LC demes). Individuals from thesedemes are expected to compensate for the shorter growthseason with a higher general capacity for growth [33].As grayling occupy divergent habitats during develop-
ment it is possible that evolutionary divergence couldresult. However, one should bear in mind that this diver-gence is observed under conditions of continuing geneflow and potential meta-population dynamics [34,35]. Thegrayling could have responded to the differing environ-mental conditions by evolutionary changes; alternatively,the grayling could have a plastic response common toindividuals of all demes [9]. If the latter is the case, reac-tion norms for all demes should appear more or less iden-tical. If reaction norms differ this would be indicative ofgenetic effects.In this study, we test if there is evidence for evolution in
early life-history traits in larval grayling from four differentspawning demes that are experiencing different environ-mental selection pressures. To contrast the developmentof larval grayling from different demes a common-envir-onment experiment was conducted. In the experiment,individuals from four tributaries (two LC, two SW) weresubjected to three experimental temperatures and studiedfrom fertilization to swim up, the stage when the juvenilesemerge from the gravel and become free-living [36].
ResultsInitial egg sizeMean initial egg size (measured as egg diameter, mm)differed significantly among demes (one-way ANOVA:
F3, 116 = 7.13, P = 0.0002, R2= 0.123). The largest andthe smallest eggs were found in the warm stream demes(mean ± 2se; Hyrjon: 3.88 ± 0.06; Valåe: 3.94 ± 0.07;Steinbekken: 4.03 ± 0.09; Sandbekken: 3.79 ± 0.09).
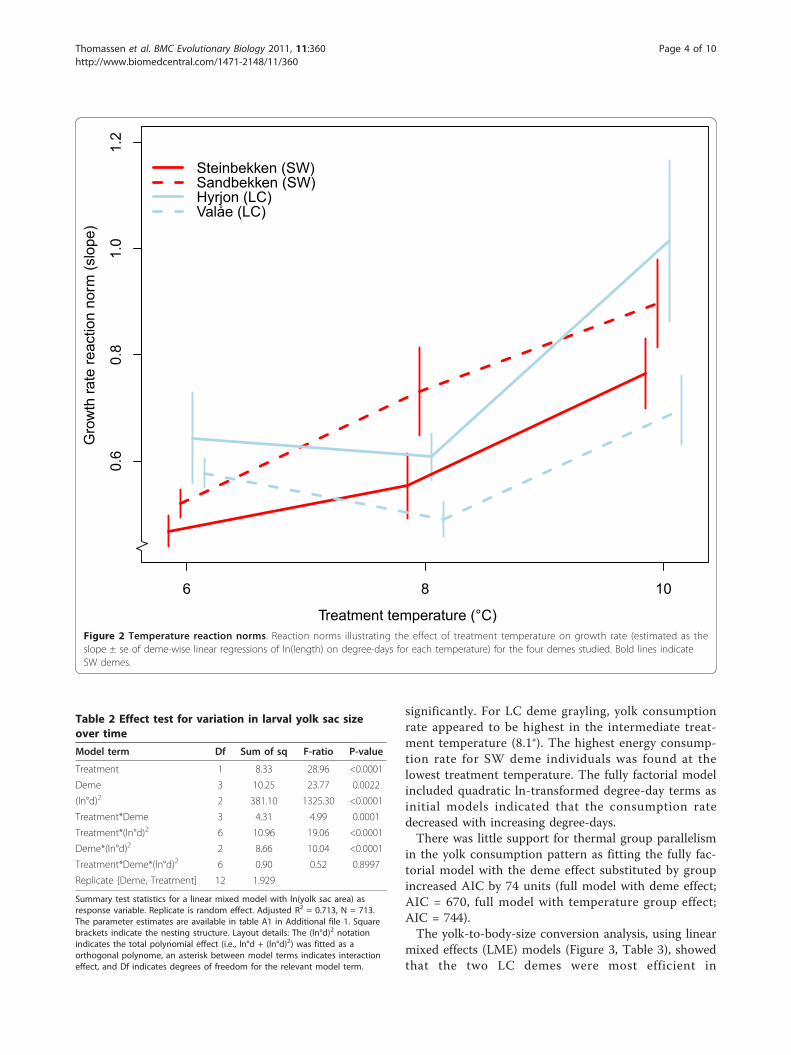
Larval length through timeVariation in larval length from hatching to swim-up clearlydiffered among demes and treatments, and there was a sig-nificant three-way interaction among treatment, deme anddegree-days (Table 1, Additional file 1; details on resultsfrom each deme-treatment combination are presented inAdditional file 2). All model terms, except for the treat-ment*deme interaction, significantly influenced larvallength. For the two SW demes growth rate (estimated asthe slope of linear regression of length (ln-transformed)and time measured as degree-days) increased with increas-ing treatment temperature (visualized in Figure 2). For theLC demes, growth rates tended to be lower at the mediumtreatment temperature. At the coldest treatment tempera-ture (5.8°C), growth rates for LC deme individuals (Hyrjon:0.643 ± 0.086; Valåe: 0.577 ± 0.027) were higher thanthose for SW deme individuals (Sandbekken: 0.520 ±0.026; Steinbekken: 0.468 ± 0.029, Figure 2); the non-over-lapping standard errors between cold and warm demessuggest significant differences in growth rate at this tem-perature. At the remaining temperatures there was noapparent deme-type related pattern in the rank order ofgrowth rates. Grayling from all demes attained their high-est growth rate in the warmest treatment temperature(10.0°C).
Yolk sac size, consumption and conversion efficiencyThe rate of change in yolk sac size over time clearly dif-fered among demes and treatments (Table 2, Additionalfile 1; details on results from each deme-treatment com-bination are presented in Additional file 3). The signifi-cant two-way interactions among treatment, deme anddegree-days indicated that the reaction norms differed
Table 1 Effect test for variation in larval length over time
Model term Df Sum of squares F-ratio P-value
ln°d 1 2.571 1190.14 <0.001
Deme 3 0.160 24.62 <0.001
Treatment 2 0.982 227.27 <0.001
Deme*ln°d 3 0.034 5.21 0.002
Treatment*Deme 6 0.028 2.15 0.122
ln°d*Treatment 2 0.086 19.95 <0.001
Treatment*Deme*ln°d 6 0.031 2.42 0.026
Replicate [Deme, Treatment] 12 0.004
Summary test statistics for a linear mixed model with ln(larval length) asresponse variable and replicate as a random effect. Adjusted R2: 0.712. N =709. The parameter estimates are available in table A1 in Additional file 1.Square brackets indicate the nesting structure. Layout details: °d is the degreedays-covariate, an asterisk between model term indicates interaction effect,and Df indicates degrees of freedom for the relevant model term.
Thomassen et al. BMC Evolutionary Biology 2011, 11:360http://www.biomedcentral.com/1471-2148/11/360
Page 3 of 10
significantly. For LC deme grayling, yolk consumptionrate appeared to be highest in the intermediate treat-ment temperature (8.1°). The highest energy consump-tion rate for SW deme individuals was found at thelowest treatment temperature. The fully factorial modelincluded quadratic ln-transformed degree-day terms asinitial models indicated that the consumption ratedecreased with increasing degree-days.There was little support for thermal group parallelism
in the yolk consumption pattern as fitting the fully fac-torial model with the deme effect substituted by groupincreased AIC by 74 units (full model with deme effect;AIC = 670, full model with temperature group effect;AIC = 744).The yolk-to-body-size conversion analysis, using linear
mixed effects (LME) models (Figure 3, Table 3), showedthat the two LC demes were most efficient in
0.6
0.8
1.0
1.2
6 8 10
Steinbekken (SW)Sandbekken (SW)Hyrjon (LC)Valåe (LC)
Gro
wth
rate
reac
tion
norm
(slo
pe)
Treatment temperature (°C)Figure 2 Temperature reaction norms. Reaction norms illustrating the effect of treatment temperature on growth rate (estimated as theslope ± se of deme-wise linear regressions of ln(length) on degree-days for each temperature) for the four demes studied. Bold lines indicateSW demes.
Table 2 Effect test for variation in larval yolk sac sizeover time
Model term Df Sum of sq F-ratio P-value
Treatment 1 8.33 28.96 <0.0001
Deme 3 10.25 23.77 0.0022
(ln°d)2 2 381.10 1325.30 <0.0001
Treatment*Deme 3 4.31 4.99 0.0001
Treatment*(ln°d)2 6 10.96 19.06 <0.0001
Deme*(ln°d)2 2 8.66 10.04 <0.0001
Treatment*Deme*(ln°d)2 6 0.90 0.52 0.8997
Replicate [Deme, Treatment] 12 1.929
Summary test statistics for a linear mixed model with ln(yolk sac area) asresponse variable. Replicate is random effect. Adjusted R2 = 0.713, N = 713.The parameter estimates are available in table A1 in Additional file 1. Squarebrackets indicate the nesting structure. Layout details: The (ln°d)2 notationindicates the total polynomial effect (i.e., ln°d + (ln°d)2) was fitted as aorthogonal polynome, an asterisk between model terms indicates interactioneffect, and Df indicates degrees of freedom for the relevant model term.
Thomassen et al. BMC Evolutionary Biology 2011, 11:360http://www.biomedcentral.com/1471-2148/11/360
Page 4 of 10

transferring yolk to body size under the cold and med-ium treatment regimes, whereas there was little differen-tiation in efficiencies under the warm regime. Using thisrather complex model, we can predict larval length at agiven yolk sac area (here 1 mm2) under the variousexperimental conditions. For instance, assuming analmost reabsorbed yolk sac with an area of 1 mm2, acold treatment and at 270 degree-days, the estimatedlarvae lengths would be 14.9, 13.1, 12.7, and 12.6 mmfor Hyrjon, Valåe, Steinbekken and Sandbekken, respec-tively. Under the warm treatment, still assuming a yolk-sac area of 1 mm2, but now under the more warm-
regime relevant 230 degree-days, larval lengths wereestimated to be 14.2, 13.8, 14.6, and 14.2 mm. The gen-eral variance inflation factor (GVIF; see Methods) forthe interaction effect between yolk-sac area and degree-days (GVIF°d*ys area = 9.52) was slightly lower than therecommended cut-off value of 10 [37]. However, therewas evidence of non-trivial collinearity for this interac-tion effect within temperature regimes (GVIF°d*ys area*-
treatment*deme = 28.9). When substituting the deme effectwith a thermal group effect, the AIC decreased by 113units, indicating that demes belonging to the same ther-mal group displayed parallelism in their temperature
●
● ● ● ●●●● ●● ●●●● ●● ●●● ●● ● ●● ●●●●●●●● ●●●● ●●●●
●● ●●●
● ●●●●● ●●● ● ●●
● ●● ●●●●●● ●●●● ● ●●● ●●●● ●● ●●● ●● ●●●●●● ●● ●● ●●●●●● ●●● ●● ●●● ●● ●●● ●●●●●● ●●●●●●●●● ●●● ●
● ●● ●●●●●● ●●●● ●●●●●●●●●
●●●●● ●●●●●●
●
●●●● ●● ●●● ●● ●●●● ●●●●●●●●●●●●●● ●●●●●●●●● ●● ●●●●●●● ●●
●●●●●●●●● ●●●●●●●●●●● ●●●● ●●●●● ●●●●●●●●●●●●●●●●●●●●●●●●●●
●●● ●●● ●●●●● ●● ●●● ●●●●● ●●●●●●●● ●●●●●● ●●●●●●●●● ●●●●● ●●●
●● ●● ●● ●●●●●●●●●●●● ●●●●●●● ●●●● ●● ●●● ●●● ●●●●●●●● ●●● ●●●●●
●
●● ●●●●●●●
●● ●●●● ●● ●●● ●●●● ●
●●●●●● ●●●●
●●● ●●●●● ●●
●● ●● ●●●●● ●
●
●●●●●●●●● ●
● ● ●● ●●● ●●●
●●● ●● ●● ●●● ●●●● ●
●●●●●●●●● ●
●●●●●●●●●●●●●●
●●●●●●●●●●
●● ● ●●●●● ●●
●●●●●● ●●●● ●
●● ●●●●●●●●●
●●●●●●●●●●
●●
●●●● ●●●●●● ●●
●● ●●●●● ●●●
●●●● ●● ●●●●
●● ●●●
●●●● ●●
● ●● ●●●●
●●●●●●● ●●●
●●●● ●● ●●● ●
●●●●●●● ●
●●●●●● ●●● ●●● ●●●
●● ●● ●●●●●●
● ●●● ●●●●
● ●● ● ●●●● ●●
●● ●●●●●●● ●
● ●
●●●●● ●●● ●●● ●●●●●●●●●●●
●●●●●●●●●●●
Figure 3 Yolk conversion efficiency. Estimated deme-wise body length (isoclines, value = mm) as function of yolk-sac area and degree-dayssince fertilization at different treatment temperatures. The estimates are retrieved from a linear mixed effects model where replicate variationwas modeled as a random effect, nested under deme. Dots represent measured yolk sac values at given degree-days.
Thomassen et al. BMC Evolutionary Biology 2011, 11:360http://www.biomedcentral.com/1471-2148/11/360
Page 5 of 10
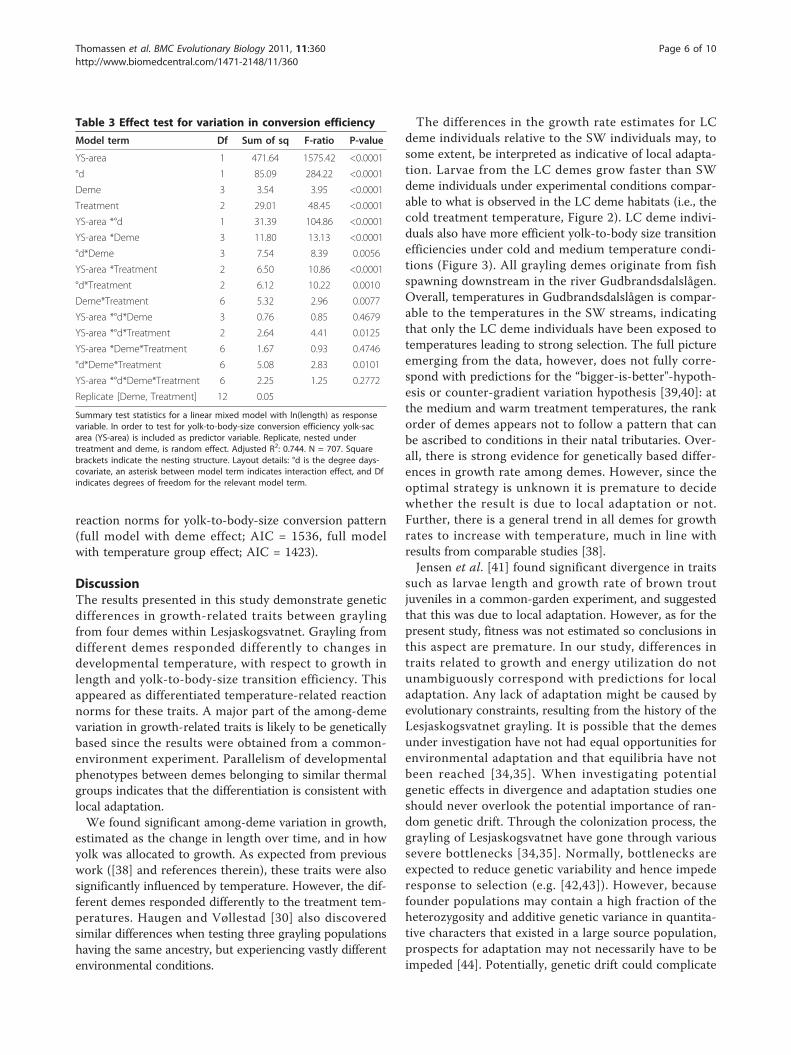
reaction norms for yolk-to-body-size conversion pattern(full model with deme effect; AIC = 1536, full modelwith temperature group effect; AIC = 1423).
DiscussionThe results presented in this study demonstrate geneticdifferences in growth-related traits between graylingfrom four demes within Lesjaskogsvatnet. Grayling fromdifferent demes responded differently to changes indevelopmental temperature, with respect to growth inlength and yolk-to-body-size transition efficiency. Thisappeared as differentiated temperature-related reactionnorms for these traits. A major part of the among-demevariation in growth-related traits is likely to be geneticallybased since the results were obtained from a common-environment experiment. Parallelism of developmentalphenotypes between demes belonging to similar thermalgroups indicates that the differentiation is consistent withlocal adaptation.We found significant among-deme variation in growth,
estimated as the change in length over time, and in howyolk was allocated to growth. As expected from previouswork ([38] and references therein), these traits were alsosignificantly influenced by temperature. However, the dif-ferent demes responded differently to the treatment tem-peratures. Haugen and Vøllestad [30] also discoveredsimilar differences when testing three grayling populationshaving the same ancestry, but experiencing vastly differentenvironmental conditions.
The differences in the growth rate estimates for LCdeme individuals relative to the SW individuals may, tosome extent, be interpreted as indicative of local adapta-tion. Larvae from the LC demes grow faster than SWdeme individuals under experimental conditions compar-able to what is observed in the LC deme habitats (i.e., thecold treatment temperature, Figure 2). LC deme indivi-duals also have more efficient yolk-to-body size transitionefficiencies under cold and medium temperature condi-tions (Figure 3). All grayling demes originate from fishspawning downstream in the river Gudbrandsdalslågen.Overall, temperatures in Gudbrandsdalslågen is compar-able to the temperatures in the SW streams, indicatingthat only the LC deme individuals have been exposed totemperatures leading to strong selection. The full pictureemerging from the data, however, does not fully corre-spond with predictions for the “bigger-is-better"-hypoth-esis or counter-gradient variation hypothesis [39,40]: atthe medium and warm treatment temperatures, the rankorder of demes appears not to follow a pattern that canbe ascribed to conditions in their natal tributaries. Over-all, there is strong evidence for genetically based differ-ences in growth rate among demes. However, since theoptimal strategy is unknown it is premature to decidewhether the result is due to local adaptation or not.Further, there is a general trend in all demes for growthrates to increase with temperature, much in line withresults from comparable studies [38].Jensen et al. [41] found significant divergence in traits
such as larvae length and growth rate of brown troutjuveniles in a common-garden experiment, and suggestedthat this was due to local adaptation. However, as for thepresent study, fitness was not estimated so conclusions inthis aspect are premature. In our study, differences intraits related to growth and energy utilization do notunambiguously correspond with predictions for localadaptation. Any lack of adaptation might be caused byevolutionary constraints, resulting from the history of theLesjaskogsvatnet grayling. It is possible that the demesunder investigation have not had equal opportunities forenvironmental adaptation and that equilibria have notbeen reached [34,35]. When investigating potentialgenetic effects in divergence and adaptation studies oneshould never overlook the potential importance of ran-dom genetic drift. Through the colonization process, thegrayling of Lesjaskogsvatnet have gone through varioussevere bottlenecks [34,35]. Normally, bottlenecks areexpected to reduce genetic variability and hence impederesponse to selection (e.g. [42,43]). However, becausefounder populations may contain a high fraction of theheterozygosity and additive genetic variance in quantita-tive characters that existed in a large source population,prospects for adaptation may not necessarily have to beimpeded [44]. Potentially, genetic drift could complicate
Table 3 Effect test for variation in conversion efficiency
Model term Df Sum of sq F-ratio P-value
YS-area 1 471.64 1575.42 <0.0001
°d 1 85.09 284.22 <0.0001
Deme 3 3.54 3.95 <0.0001
Treatment 2 29.01 48.45 <0.0001
YS-area *°d 1 31.39 104.86 <0.0001
YS-area *Deme 3 11.80 13.13 <0.0001
°d*Deme 3 7.54 8.39 0.0056
YS-area *Treatment 2 6.50 10.86 <0.0001
°d*Treatment 2 6.12 10.22 0.0010
Deme*Treatment 6 5.32 2.96 0.0077
YS-area *°d*Deme 3 0.76 0.85 0.4679
YS-area *°d*Treatment 2 2.64 4.41 0.0125
YS-area *Deme*Treatment 6 1.67 0.93 0.4746
°d*Deme*Treatment 6 5.08 2.83 0.0101
YS-area *°d*Deme*Treatment 6 2.25 1.25 0.2772
Replicate [Deme, Treatment] 12 0.05
Summary test statistics for a linear mixed model with ln(length) as responsevariable. In order to test for yolk-to-body-size conversion efficiency yolk-sacarea (YS-area) is included as predictor variable. Replicate, nested undertreatment and deme, is random effect. Adjusted R2: 0.744. N = 707. Squarebrackets indicate the nesting structure. Layout details: °d is the degree days-covariate, an asterisk between model term indicates interaction effect, and Dfindicates degrees of freedom for the relevant model term.
Thomassen et al. BMC Evolutionary Biology 2011, 11:360http://www.biomedcentral.com/1471-2148/11/360
Page 6 of 10

the interpretation of results since the outcome of evolu-tion by genetic drift cannot be predicted (e.g. [45]).Further, in young systems such as in the Lesjaskogsvatnetgrayling system gene flow and drift may vary in strength,leading to large among year variation in strength of selec-tion [34]. Gene flow most often is considered to hinderlocal adaptation [46,47], however, this is not necessarilyalways the case [48,49]. Gene flow among inbred demesmay counteract the effect of drift and increase the evolva-bility of these demes by introducing genetic variation,and as such enhance short-term adaptation [43]. How-ever, in most situations where you have heterogeneoushabitats and genotype-environment interaction effects,gene flow is predicted to constrain local adaptation[49,50].The different traits studied here may be influenced by
maternal effects. If such effects are present, and if they arephysiological side effects and not consequences of adaptiveevolution, they have the potential to confound our results.Potential maternal effects might be egg provisioning ofenergy and other important nutrients [51]. This cannot bedirectly accounted for in a study like ours, where thematernal environment is not controlled. One complicatingfactor is the time delay between maturation of gonads forLC and SW demes, potentially leading to quality differ-ences in the eggs. In Haugen and Vøllestad’s [30] study ongrayling from the same area, egg size was found to have asignificant contribution to the total female effect for threeout of four early-life size traits and also on early survivalrate. Our study design did not allow for family-level reso-lution. Egg size - a main determinant of maternal effects -did differ among the four demes. However, these differ-ences cannot explain the parallelism in growth rates andenergy use as both the largest and the smallest eggs wereobserved in the SW demes.We have shown that several early life history traits have
diverged among the four grayling demes studied here,and some of the divergence is consistent with adaptivepredictions. Taken together with several related studiesfrom the same area [29,30] this indicates that these traitscan evolve rapidly and in spite of conditions that are gen-erally assumed to constrain adaptation. We have shownthat most of the demes studied have low genetic variabil-ity and have experienced bottlenecks and founder effects[34,35]. Gene flow among demes is strong and highlyvariable [34]. Additionally, some demes are small indicat-ing that genetic drift may be strong. These conditionscan potentially lead to strong genetic drift, a process thatcan constrain adaptive evolution [43,46,47]. A recent the-oretical study does, however, show that dispersal, muta-tion and sexual reproduction may accelerate localadaptation in growing populations [49], especially whenpopulations are small. However, these same processesmay reduce local adaptation in the long run.
ConclusionsIn summary, we find evidence for significant among-deme variation in important early life-history traits ingrayling from the Lesjaskogsvatnet. These differenceshave evolved during 20-25 generations in the face ofgene flow, recent bottlenecks, and the fact that the gray-ling live in sympatry during most of their life. Some ofthese results are consistent with adaptation expectationsas inferred from signs of parallelism, but we cannot ruleout that other evolutionary or non-evolutionary pro-cesses have influenced the results.
MethodsField sampling and experimental designAdult spawning grayling were intercepted during theirmigration and captured using fyke nets. The traps werechecked three times daily and captured fish were trans-ferred to a holding pen upstream. Once capturing wascomplete, adult fish were anaesthetised with benzocaineand their weight and fork length were measured (seeTable 4) before the fish were stripped of gametes. Afterrecovery all fish were released upstream of the capturesite. Gametes were transported on ice and under oxygenby car to the fish holding facility at the Veterinary Insti-tute of Norway, Oslo (5 hours drive). Gametes werestripped from the SW stream populations on 12th June2007, and on 23rd June the same year from the two LCstream populations.The eggs were pooled by deme using an equal volume
(100 ml) of eggs from each female. The pooled batch ofeggs from each deme was then split into a number ofbatches equal to the number of males from that deme.To avoid sperm competition and so maximise the num-ber of families, each batch of pooled eggs was subse-quently fertilized with sperm from one male. Followingfertilization, the batches of eggs from each deme weremixed together again before they were partitioned intothree treatment groups. Each treatment group was splitinto two replicates. Three separate experimental tanks
Table 4 Information on parental fish
Deme Sex (N) Weight (g) Length (mm)
Steinbekken (SW) ♀ (20) 226.8 ± 130.3 287.6 ± 56.4
♂ (16) 337.6 ± 89.3 333.25 ± 28.2
Sandbekken (SW) ♀ (17) 187.2 ± 85.6 268.6 ± 11.5
♂ (11) 263.9 ± 100.7 305.6 ± 35.2
Hyrjon (LC) ♀ (4) 158.8 ± 90.4 254.8 ± 30.6
♂ (3) 244.0 ± 61.2 299.3 ± 22.1
Valåe (LC) ♀ (20) 236.4 ± 106.8 284.4 ± 51.7
♂ (24) 298.7 ± 82.2 327.0 ± 41.9
Descriptive data (number per tributary and sex; mean weight ± sd, meanlength ± sd) for the mature grayling captured and stripped for gametes fromthe four different tributaries. SW are small and warm streams, whereas are LCare large and cold streams.
Thomassen et al. BMC Evolutionary Biology 2011, 11:360http://www.biomedcentral.com/1471-2148/11/360
Page 7 of 10

containing water of three different temperatures (5.83 ±0.43°C, 8.14 ± 0.29 °C, 10.02 ± 0.28 °C) were used. Thesetemperatures were chosen to represent lower, mediumand upper temperatures experienced by developing gray-ling larvae in nature [52], and thus we would be able toinvestigate norms of reaction covering the range of tem-peratures that grayling may be expected to tolerate.Mean summer (June - July) temperatures in the fourstreams investigated here differ strongly, with the twosmall and warm streams being approximately 1-1.5 ºChigher than the large and cold streams (Sandbekken8.44 ± 0.52 (n = 5); Steinbekken 8.81 ± 0.60 (n = 4); Hyr-jon 7.40 ± 0.94 (n = 8); Valåe 7.28 ± 0.69 (n = 0.69)).This adds to a large temperature-sum difference amongstreams during egg and larvae development.Inflowing water was comprised of activated-charcoal
filtered tap water. Temperatures were registered usingtemperature loggers (HOBO). Fertilized eggs wereplaced in porous containers suspended in the largetreatment tanks as described in detail previously [30].Each of the three tanks contained two replicate contain-ers from each deme.Animal sampling and experimentation were performed
in compliance with the recommendations of NationalAnimal Research Authority (permission ID 2008/7368.5)and under the supervision of authorized investigators.
Data acquisition and analysisEach day post fertilization approximately five individuals(eggs or larvae) were sampled from each deme in eachtreatment, alternating between the two replicates (Table 5).Sampling was done by randomly picking individuals out ofthe containers. The sampled eggs/larvae were carefullyfreed from water prior to fixation in buffered formalin inorder to optimally retain physical characters [53]. Samplingwas carried out every day over the 65 day experimental
period with the exception of one day on which samplingwas impossible due to technical problems.All samples were visually inspected to check for hatched
individuals. Numbers of hatched individuals per samplewas recorded. However, precise estimates of time at hatch-ing could not be obtained because of large among-samplevariation. Photographs of eggs and larvae were obtainedusing a Leica DC300 digital camera mounted on a LeicaMZ8 stereo microscope connected to a computer and cap-tured using IrfanView (version 3.99) http://www.irfanview.com/. One hundred and twenty eggs (5 eggs from eachdeme in each treatment for the first two days after fertili-zation) were photographed and initial egg size was esti-mated as the mean egg diameter measured in UTHSCSAImage Tool (version 3.0; http://ddsdx.uthscsa.edu/dig/itdesc.html). Out of the 2142 individuals sampled (seeTable 5), 717 had hatched and these where measured forlength and yolk sac area. All larvae were photographedtwice; usually once with the left side facing the camera,and once with the right side facing the camera to allowrepeated estimates of traits to be made. The mean of thetwo measurements was used in the analysis. Based on arandom subsample of 100 individuals there was a meandeviation of 1.06% between the two length measurementsdone on each individual. The corresponding number foryolk sac area estimates was 7.77%. On certain occasionslarvae were fixed in awkward positions and were too brit-tle to straighten out. If so, photographs in three positions(i.e. side facing up, back facing up and/or yolk sac facingup) were obtained in order to get the measurementsneeded. Length was measured from the tip of the craniumto the visible end of the notochord. ImageJ version 1.38http://rsbweb.nih.gov/ij/download.html was used to obtaina measurement of the yolk sac area. Yolk sac area was esti-mated by fitting an ellipse to a polygon drawn along theedge of the yolk sac in order to estimate the longest andshortest possible axis of the fitted ellipse. Axis lengthsobtained from the two photographs of each individualwere averaged. The resulting estimates were used to esti-mate each individual’s yolk sac area using the formula forthe area of an ellipse (πab; a and b being one-half of theellipse’s major and minor axes, respectively).Six individuals were completely excluded from the sta-
tistical analysis due to obvious disfigurement or severedamage during handling making any measurementsuncertain. In four individuals the yolk sac was damagedor completely removed due to handling, making mea-surements only on length possible. One individual hadan intact yolk sac, but a damaged body, making onlymeasurement of the yolk sac area possible.A one-way ANOVA on egg diameter with deme as
effect was carried out, and a Tukey-Kramer HSD (hon-estly significant difference) test was used to comparedeme means.
Table 5 Sample sizes
Deme Replicate Warm Medium Cold
Steinbekken (SW) Rep 1 44 - 12 59 - 22 89 - 57
Rep 2 34 - 16 51 - 20 82 - 48
Sandbekken (SW) Rep 1 39 - 19 60 - 21 86 - 55
Rep 2 35 - 16 52 - 18 81 - 51
Hyrjon (LC) Rep 1 42 - 18 61 - 32 85 - 16
Rep 2 36 - 15 52 - 24 62 - 29
Valåe (LC) Rep 1 50 - 17 62 - 43 89 - 63
Rep 2 40 - 16 60 - 27 80 - 56
Sum Rep 1 175 - 66 242 - 118 349 - 191
Rep 2 145 - 63 215 - 89 305 - 184
Number of eggs or larvae sampled during the common-garden experiment.Numbers given are total number of eggs and larvae sampled per deme, splitby treatment (warm, medium, cold) and replicate (Rep 1, Rep 2) as well astotals pr treatment and replicate. SW are small and warm streams, whereasare LC are large and cold streams.
Thomassen et al. BMC Evolutionary Biology 2011, 11:360http://www.biomedcentral.com/1471-2148/11/360
Page 8 of 10

Continuous response variables were analyzed using lin-ear mixed effect models (LME, [54]), fitted by means ofthe restricted maximum likelihood (REML) method. Inthe LME models fitted, the random effect of replicatewas nested under deme and treatment. Both the responsevariables in question (larval length or yolk sac area) andthe continuous covariate (degree-days (°d); a measure oftime estimated as accumulated mean daily temperature)were logarithmically transformed to reduce heteroscedas-ticity. Individual linear regressions of length/yolk sac areaon degree-days were fitted for each deme in every tem-perature (see Additional files 2 and 3). Full factorial mod-els were used when analyzing the data (see equation 1).
Yijk = ß1ij + ß2dijk + ß3ji ∗ dijk + b(ij)k + εijk (1)
Here, “Y“ is the response variable, ßs correspond tofixed parameters under estimation and b(ij)k correspondsto the random effect of replicate (k) nested under treat-ment level i and deme j. Variables are provided in italicswhere “°d“ indicates degree-days (ln-transformed), εijkrepresent the between individual variance (i.e., the resi-dual variance) which is assumed to be normally distribu-ted within replicates, and for a given link function. Anasterisk indicates an interaction term. If non-lineartrends were found in LME residual plots, new modelsincluding a squared term for the degree-days effect werefitted. In order to check for possible first-order temporalautocorrelation violations, Durbin-Watson tests wereconducted for the fitted LME models.In order to explore differentiation in the yolk-to-body-
size conversion efficiency (see [29]), we fitted LME mod-els where body length was predicted from yolk sac areaand degree-days and with rearing temperature and demeas fixed effects. Replicates were nested under deme andtemperature regime and were modelled as randomeffects. The full model structure was then comparedwith a comparable model where the deme structure wasexchanged with a temperature-group (SW vs LC) struc-ture, using Akaike Information Criterion (AIC)-valuesfor comparison [55]. Due to collinearity between thepredictor variables yolk-sac area and degree-days, infor-mation about variance inflation (assessed from the gen-eral variance inflation factor, GVIF) and thecorresponding tolerance is presented together with thechosen model [56].The statistical analyses of the data were carried out
using the statistical software JMP 5.0 (SAS Institute Inc.,Cary, NC, USA) and R version 2.10.1 [57]. LME modelswere fitted in R using the lmer-procedure in the LME4library. Information about variance inflation due to colli-nearity (assessed from the general variance inflation fac-tor, GVIF) was retrieved using the CAR library.
Additional material
Additional file 1: Parameter estimates (± se) for the factors includedin linear mixes models (see equation 1 in main text).
Additional file 2: Summary table for deme-wise linear regressionsof ln(length) on degree days in the three treatment temperatures.In Table A2 the intercept, slope (with SE), adjusted r2 and N are given.The results are also visualised in Figure A2.
Additional file 3: Summary table for deme-wise linear regressionsof ln(yolk sac area) on degree days in the three treatmenttemperatures. In Table A3 the intercept, slope (with SE), adjusted r2
and N are given. The results are also visualised in Figure A3.
AcknowledgementsThe study was financed by the Norwegian Research Council. We thank EricaLeder, Kai Rune Båtstad and Håvard Kauserud for important help duringfieldwork.
Author details1Centre for Ecological and Evolutionary Synthesis, Department of Biology,University of Oslo, P. O. Box 1066 Blindern, NO-0316 Oslo, Norway. 2OpplandCounty Governor, P.O. Box 987, NO-2626 Lillehammer, Norway. 3NorwegianInstitute for Water Research, Gaustadalléen 21, NO-0349 Oslo, Norway.4Norwegian University of Life Sciences, Department of Ecology and NaturalResource Management, P. O. Box 5003, NO-1432 Ås, Norway.
Authors’ contributionsTOH and LAV designed the study, all authors took part in field andlaboratory work, but all measurements have been collected by GT. Analysesof the results were conducted by GT and TOH. All have taken part in thewriting of the paper. All authors have read through and approved the lastversion.
Received: 19 August 2011 Accepted: 13 December 2011Published: 13 December 2011
References1. Chevin L-M, Lande R, Mace GM: Adaptation, plasticity, and extinction i a
changing environment: Towards a predictive theory. PLoS Biology 2010, 8:e1000357.
2. Hendry AP, Farrugia TJ, Kinnison MT: Human influences on rates ofphenotypic change in wild animal populations. Mol Ecol 2008, 17:20-29.
3. Kamler E: Ontogeny of yolk-feeding fish. Rev Fish Biol Fish 2002, 12:79-103.4. Arendt JD: Adaptive intrinsic growth rates: an integration across taxa.
Quart R Biol 1997, 72:149-177.5. Cano JM, Nicieza AG: Temperature, metabolic rate, and constraints on
locomotor performance in ectotherm vertebrates. Funct Ecol 2006,20:464-470.
6. Chevin L-M, Lande R: When do adaptive plasticity and genetic evolutionprevent extinction of a density-regulated population? J evol Biol 2010,64:1146-1150.
7. Stearns SC: The evolution of life histories. Oxford: Oxford University Press;1992.
8. Roff DA: Life history evolution. Sunderland, Massachusetts, USA: SinauerAssociates, Inc; 2002.
9. Hoffmann AA, Sgrò CM: Climate change and evolutionary adaptation.Nature 2011, 470:479-485.
10. Hutchings JA: Old wine in new bottles: reaction norms in salmonidfishes. Heredity 2011, 106:421-437.
11. Wade MJ: Selection in metapopulations. In Ecology, Genetics, and Evolutionof Metapopulations. Edited by: Hanski I, Gaggiotti OE. Academic Press;2004:259-273.
12. Schlichting CD, Pigliucci M: Phenotypic evolution: a reaction normperspective. Sunderland, Massachusetts, USA: Sinauer Associates, Inc; 1998.
13. Pelletier F, Garant D, Hendry AP: Eco-evolutionary dynamics. Phil Trans RSoc Lond B 2009, 364:1483-1489.
Thomassen et al. BMC Evolutionary Biology 2011, 11:360http://www.biomedcentral.com/1471-2148/11/360
Page 9 of 10

14. Hariston NG jr, Elner SP, Geber Me, Yoshida T, Fox JA: Rapid evolution andthe convergence of ecological and evolutionary time. Ecol Lett 2005,8:1114-1127.
15. Fraser DJ, Weir LK, Bernatchez L, Hansen MM, Taylor EB: Extent and scaleof local adaptation in samonid fishes: a review and meta-analysis.Heredity 2011, 106:404-420.
16. Hendry AP, Kinnison MT: The pace of modern life: measuring rates ofcontemporary microevolution. Evolution 1999, 53:1637-1653.
17. Hendry AP, Nosil P, Reisenberg LH: The speed of ecological speciation.Funct Ecol 2007, 21:455-464.
18. Billerbeck JM, Lankford TE, Conover DO: Evolution of intrinsic growth andenergy acquisition rates. 1. Trade-offs with swimming performance inMenidia menidia. Evolution 2001, 55:1863-1872.
19. Miller TJ, Crowder LB, Rice JA, Marshall EA: Larval size and recruitmentmechanisms in fishes: toward a conceptual framework. Can J Fish AquatSci 1988, 45:1657-1670.
20. Perez KO, Munch SB: Extreme selection on size in the early lives of fish.Evolution 2010, 64:2450-2457.
21. Hare JA, Cowen RK: Size, growth, development and surival of theplanktonic larvae of Pomatomus saltatrix (Pisces: PomatomidaeI. Ecology1997, 78:2415-2431.
22. Sogard SM: Size-selective mortality in the juvenile stage of teleost fishes:a review. Bull Mar Sci 1997, 60:1129-1157.
23. Einum S, Fleming IA: Highly fecund mothers sacrifice offspring survival tomaximize fitness. Nature 2000, 405:565-567.
24. Einum S, Fleming IA: Selection against late emergence and smalloffspring in Atlantic salmon (Salmo salar). Evolution 2000, 54:628-639.
25. Haugen TO, Vøllestad LA: A century of life-history evolution in grayling.Genetica 2001, 112/113:475-491.
26. Koskinen MT, Ranta E, Piironen J, Veselov A, Titov S, Haugen TO, Nilsson J,Carlstein M, Primmer CR: Genetic lineages and postglacial colonization ofgrayliing (Thymallus thymallus, Salmonidae) in Europe, as revealed bymitochondrial DNA analysis. Mol Ecol 2000, 9:1609-1624.
27. Gregersen F, Haugen TO, Vøllestad LA: Contemporary egg size divergenceamong sympatric grayling demes with common ancestors. Ecol FreshwFish 2008, 17:110-118.
28. Kristiansen H, Døving KB: The migration of spawning stocks of grayling,Thymallus thymallus, in Lake Mjøsa, Norway. Environm Biol Fish 1996,47:43-50.
29. Kavanagh KD, Haugen TO, Gregersen F, Jernvall J, Vøllestad LA:Contemporary temperature-driven divergence in a Nordic freshwaterfish under conditions commonly thought to hinder adaptation. BMCEvolutionary Biology 2010, 10:350.
30. Haugen TO, Vøllestad LA: Population differences in early life-history traitsin grayling. J evol Biol 2000, 13:897-905.
31. Koskinen MT, Haugen TO, Primmer CR: Contemporary fisherian life-historyevolution in small salmonid populations. Nature 2002, 419:826-830.
32. Post JR, Parkinson EA: Energy allocation strategy in young fish: allometryand survival. Ecology 2001, 82:1040-4051.
33. Yamahira K, Conover DO: Intra- vs. interspecific latitudinal variation ingrowth: adaptation to temperature or seasonality? Ecology 2002,83:1252-1262.
34. Junge C, Vøllestad LA, Barson NJ, Haugen TO, Otero J, Sætre G-P, Leder EH,Primmer CR: Strong gene flow and lack of stable population structure inthe face of rapid adaptation to local temperature in a spring spawningsalmonid, the European grayling (Thymallus thymallus). Heredity 2011,106:460-471.
35. Barson NJ, Haugen TO, Vøllestad LA, Primmer CR: Contemporary isolation-by-distance, but not isolation-by-time, among demes of Europeangrayling (Thymallus thymallus, Linnaeus) with recent common ancestors.Evolution 2009, 63:549-556.
36. Crisp DT: Prediction, from temperature, of eyeing, hatching and “swim-up” times for salmonid embryos. Freshw Biol 1988, 19:41-48.
37. Ryan TP: Modern regression methods. New York: John Wiley & Sons, Inc;1997.
38. Kamler E: Resource allocation in yolk-feeding fish. Rev Fish Biol Fish 2008,18:143-200.
39. Conover DO, Schultz ET: Phenotypic similarity and the evolutionarysignificance of countergradient variation. Trends Ecol Evol 1995,10:248-252.
40. Conover DO, Present TMC: Countergradient variation in growth rate:compensation for length of the growing season among Atlanticsilversides from different latitudes. Oecologia 1990, 83:316-324.
41. Jensen LF, Hansen MM, Pertoldi C, Holdensgaard G, Mensberg K-LD,Loeschcke V: Local adaptation in brown trout early life-history traits:implications for climate change adaptability. Proc R Soc Lond B 2008,275:2859-2868.
42. Lande R: Genetics and demography in biological conservatin. Science1988, 241:1455-1460.
43. Willi Y, Buskirk JV, Hoffmann AA: Limits to the adaptive potential of smallpopulations. Annual Review of Ecology, Evolution and Systematics 2006,37:433-458.
44. Lande R: Adaptation to an extraordinary environment by evolution ofphenotypic plasticity and genetic assimilation. J evol Biol 2009,22:1435-1446.
45. Lande R: Natural selection and random genetic drift in phenotypicevolution. Evolution 1976, 30:214-334.
46. Kawecki T, Ebert D: Conceptual issues in local adaptation. Ecol Lett 2004,7:1225-1241.
47. Räsänen K, Hendry AP: Disentangling interactions between adaptivedivergence and gene flow when ecology drives diversification. Ecol Lett2008, 11:624-636.
48. Nielsen EE, Hemmer-Hansen J, Poulsen NA, Loeschcke V, Moen T,Johansen T, Mittelholzer C, Taranger G-L, Ogden R, Carvalho GR: Genomicsignatures of local directional selection in a high gene flow marineorganism; the Atlantic cod (Gadus morhua). BMC Evolutionary Biology2009, 9:276.
49. North A, Pennanen J, Ovaskainen O, Laine A-L: Local adaptation in achangeing world: the roles of gene-flow, mutation, and sexualreproduction. Evolution 2010, 65:79-89.
50. Holt RD, Gaines MS: Analysis of adaptation in heterogeneous landscapes:Implications for the evolution of fundamental niches. Evol Ecol 1992,6:433-447.
51. Kamler E: Parent-egg-progeny relationships in teleost fishes: anenergetics perspective. Rev Fish Biol Fish 2005, 15:399-421.
52. Jungwirth M, Winkler H: The temperature dependence of embryonicdevelopment of grayling (Thymallus thymallus) danube salmon (Huchohucho), arctic char (Salvelinus alpinus) and brown trout (Salmo trutta).Aquaculture 1984, 38:315-327.
53. Kruse GH, Dalley EL: Length changes in capelin, Mallotus villosus (Müller),larvae due to preservation in formalin and anhydrous alcohol. J Fish Biol1990, 36:619-621.
54. Pineiro JC, Bates DM: Mixed-effects models in S and S-PLUS. New York:Springer Verlag; 2000.
55. Burnham KP, Anderson DR: Model selection and inference: a practicalinformation-theoretic approach. New York: Springer Verlag; 1998.
56. Fox J, Monette G: Generalized collinearity diagnostics. Journal of theAmerican Statistical Association 1992, 87:178-183.
57. R Development Core Team: R: a language and environment for statisticalcomputing. Vienna, Austria: R Foundation for Statistical Computing; 2010.
doi:10.1186/1471-2148-11-360Cite this article as: Thomassen et al.: Contemporary divergence in earlylife history in grayling (Thymallus thymallus). BMC Evolutionary Biology2011 11:360.
Submit your next manuscript to BioMed Centraland take full advantage of:
• Convenient online submission
• Thorough peer review
• No space constraints or color figure charges
• Immediate publication on acceptance
• Inclusion in PubMed, CAS, Scopus and Google Scholar
• Research which is freely available for redistribution
Submit your manuscript at www.biomedcentral.com/submit
Thomassen et al. BMC Evolutionary Biology 2011, 11:360http://www.biomedcentral.com/1471-2148/11/360
Page 10 of 10
Copyright © 2022 FDOKUMEN