
The secretory activity of the proventriculus of Drosophila melanogaster

RESEARCH ARTICLE Open Access
Genome-wide examination of the transcriptionalresponse to ecdysteroids 20-hydroxyecdysoneand ponasterone A in Drosophila melanogasterSarah E Gonsalves1, Scott J Neal2, Amy S Kehoe3 and J Timothy Westwood1*
Abstract
Background: The 20-hydroxyecdysone (20E) hierarchy of gene activation serves as an attractive model system forstudying the mode of steroid hormone regulated gene expression and development. Many structural analogs of20E exist in nature and among them the plant-derived ponasterone A (PoA) is the most potent. PoA has a higheraffinity for the 20E nuclear receptor, composed of the ecysone receptor (EcR) and Ultraspiracle proteins, than 20Eand a comparison of the genes regulated by these hormones has not been performed. Furthermore, in Drosophiladifferent cell types elicit different morphological responses to 20E yet the cell type specificity of the 20Etranscriptional response has not been examined on a genome-wide scale. We aim to characterize thetranscriptional response to 20E and PoA in Drosophila Kc cells and to 20E in salivary glands and provide a robustcomparison of genes involved in each response.
Results: Our genome-wide microarray analysis of Kc167 cells treated with 20E or PoA revealed that far more genesare regulated by PoA than by 20E (256 vs 148 respectively) and that there is very little overlap between thetranscriptional responses to each hormone. Interestingly, genes induced by 20E relative to PoA are enriched infunctions related to development. We also find that many genes regulated by 20E in Kc167 cells are not regulatedby 20E in salivary glands of wandering 3rd instar larvae and we show that 20E-induced levels of EcR isoforms EcR-RA, ER-RC, and EcR-RD/E differ between Kc cells and salivary glands suggesting a possible cause for the observeddifferences in 20E-regulated gene transcription between the two cell types.
Conclusions: We report significant differences in the transcriptional responses of 20E and PoA, two steroidhormones that differ by only a single hydroxyl group. We also provide evidence that suggests that PoA induceddeath of non-adapted insects may be related to PoA regulating different set of genes when compared to 20E. Inaddition, we reveal large differences between Kc cells and salivary glands with regard to their genome-widetranscriptional response to 20E and show that the level of induction of certain EcR isoforms differ between Kc cellsand salivary glands. We hypothesize that the differences in the transcriptional response may in part be due todifferences in the EcR isoforms present in different cell types.
BackgroundIn Drosophila and other arthropods, pulses of the ster-oid hormone 20-hydroxyecdysone (20E) are responsiblefor the temporal coordination of larval molts and meta-morphosis. Physiological responses during these eventscan be diverse; for example during metamorphosis obso-lete larval tissues are destroyed and adult structures
arise from imaginal disc cells. Remarkably, these actionsare carried out in a coordinated, tissue specific manner.At the site of target tissues, 20E binds to its cognatenuclear receptor triggering a cascade of gene activation.Primary 20E-inducible genes, which are directly inducedby the steroid-receptor complex, are the earliest genesin the cascade to be transcribed and are insensitive toprotein synthesis inhibitors. In contrast, secondary 20E-inducible genes are expressed later and are dependenton the synthesis of primary-response genes. Early stu-dies of the 20E cascade looking at the puffing patterns
* Correspondence: [email protected] of Cell & Systems Biology, University of Toronto, Mississauga,Ontario, CanadaFull list of author information is available at the end of the article
Gonsalves et al. BMC Genomics 2011, 12:475http://www.biomedcentral.com/1471-2164/12/475
© 2011 Gonsalves et al; licensee BioMed Central Ltd. This is an Open Access article distributed under the terms of the CreativeCommons Attribution License (http://creativecommons.org/licenses/by/2.0), which permits unrestricted use, distribution, andreproduction in any medium, provided the original work is properly cited.

of polytene chromosomes of late 3rd instar larvae inresponse to 20E, predicted that primary-response geneswould code for proteins that are responsible both forthe induction of secondary response genes as well as forthe inhibition of their own transcription [1]. Three ofthe most well characterized 20E-primary response genes,Eip74EF, Eip75B, and br fit this description perfectly.Furthermore, these three genes reside at chromosomecytolocations 74EF, 75B, and 2B5 respectively, which,along with approximately three other loci, exhibit rapidand dramatic puffing after exposure to 20E either natu-rally or artificially [2-4]. Likewise, the earliest character-ized secondary response genes are found in a region(71E) that forms a distinct yet delayed puff upon 20Eexposure [5,6]. Although the precise function of thesegenes has yet to be determined, based on their genomicsequence they are thought to encode effector proteinswhich is consistent with early predictions of secondary-response gene function [5]. Since the original characteri-zation of these 20E-response genes, however, manyexamples of primary and secondary response genes withdiverse functions have emerged, and many of these 20E-inducible genes do not appear to be associated with anyidentifiable 20E-induced puffs [7-13] underling theimportance identifying individual components of thecascade for a clearer picture of 20E action.The transcription factor complex coordinating the
entire 20E-hierarchy, the 20E nuclear receptor heterodi-mer is composed of the vertebrate retinoid X receptorhomolog, Ultraspiracle (USP) and the ecdysone receptor(EcR). EcR isoform distribution differs between tissuesand typically those tissues expressing different isoformsshow different responses to ecdysone at metamorphosis[14-17]. For example, immunolocalization experimentsexamining EcR isoform expression pattern at the onsetof metamorphosis show that larval tissues destined todie during metamorphosis, such as the salivary gland,stain strongly for isoform B1 and weakly for isoform Awhereas proliferating tissues, such as imaginal discs,show a reciprocal pattern staining strongly for isoformA and weakly for isoform B1 [16]. The most recentannotation of the Drosophila genome documents fiveEcR isoforms that differ in sequence at the amino termi-nus but share common DNA- and ligand- bindingdomains. The ligand-binding pocket of the 20E receptorshows remarkable flexibility enabling its activation by avariety of steroidal and non-steroidal 20E analogs/ago-nists [18]. For example, the ligand-binding domain ofthe Drosophila EcR homolog in Heliothis virescensadopts different structures in the presence of different20E analogs [18].Of the insect and plant derived analogs characterized,
ponsterone A (PoA) is the most potent agonist of theEcR receptor [19] with an affinity approximately eight
times greater than 20E [20]. As such, PoA, which differsfrom 20E by the abscence of a single hydroxyl group,has been used to work out numerous kinetic and physi-cal parameters of the EcR [21]. Interestingly, the naturalrole of this and other phytoecdysteroids is still underdebate, although most evidence disfavors a hormonalrole in plants [22]. Instead, it is predicted that phytoec-dysteroids induce precocious molting and subsequentlydeath in insects providing an effective defense againstinsect feeding [22]. Given the increased binding affinityof PoA over 20E as well as its potential use in insectcontrol, it is of importance to understand how this phy-toecdysteroid affects transcription on a global scale.The Drosophila Kc cell line is one of the most well
documented 20E-responsive cell lines currently availableand has been used in numerous studies examining theeffects of 20E. In this study we use cDNA-based micro-arrays representing approximately 80% of the Drosophilagenome to identify 20E-responsive genes in Kc167 cells.By exploiting the sensitivity of secondary-response genetranscription to protein synthesis, we are able to deter-mine which of these genes are primary and which aresecondary 20E-inducible genes. Furthermore, the tran-scriptional response to physiological levels of 20E iscompared to that elicited under two other conditions: a20-fold higher concentration of 20E or its plant derivedstructural analog, PoA. These analyses lead to the iden-tification of 35 genes that reacted similarly to all threetreatments. In addition to examining the transcriptionalresponse to 20E in Kc cells, we were also interested inexamining the response in a natural target tissue of 20Esignaling, salivary glands. Salivary glands have been criti-cal in the elucidation of the 20E signaling hierarchythrough the examination of puff patterns on polytenechromosomes. By focusing on the response of the sali-vary gland in the isolation from other larval tissues wewere able to identify many 20E-responsive genes thatwere not detected when whole larvae were examined[13]. Taken together, this work provides a detailed pic-ture of the genes involved in the ecdysone hierarchy ofgene transcription in Kc167 cells and salivary glands.
Results and DiscussionIdentification of 20-hydroxyecdysone (20E)-responsivegenes in Kc167 cellsThe 20E-hierarchy of gene transcription serves as agood model for examining hormonal control of develop-ment. To gain insight into those genes that are part ofthe hierarchy, we assayed for 20E-induced changes ingene transcription across the genome. In the first partof this study, the transcriptional response to 0.5 μM 20Ewas examined in the Drosophila cell line, Kc167.Because 0.5 μM 20E causes the polytene chromosomepuffs at the 74EF and 75B early 20E-inducible loci to
Gonsalves et al. BMC Genomics 2011, 12:475http://www.biomedcentral.com/1471-2164/12/475
Page 2 of 16

reach their maximum size after 4 hours of organ culture[2] and in situ hybridization using labeled RNA pro-duced after 20E treatment shows puff specific RNAsalso increase along with puff size [23,24] the transcrip-tional response was examined after a 4 hour treatmentwith 0.5 μM 20E. The transcriptional profile of cellsexposed to 0.5 μM 20E for 2 hours was also examinedto identify any genes that may be induced early on butturned off after 4 hours. To allow identification of 20E-responsive genes in a controlled extracellular environ-ment, in the absence of endogenous hormones, theseexperiments were conducted in vitro. Kc167 cells wereused because the Kc cell line is responsive to 20E bothmorphologically [25-27] and transcriptionally [28] and iscommonly used for the study of 20E. To examine thetranscriptional response to 20E on genome-wide scale,RNA was isolated from both 20E-treated cells anduntreated control cells, reverse-transcribed and labelledwith Cy5 or Cy3 dye-coupled nucleotides respectively,and co-hybridized to cDNA microarrays. Following dataacquisition and analysis (described in the Methods sec-tion), transcripts with at least a 1.5 fold change in abun-dance in response to 20E were identified. After a 2 hourtreatment with 20E, 27 genes were induced (i.e. hadincreased transcript levels) (see Additional file 1: 20E-responsive genes in Kc167 cells after 2 and 4 hours ofexposure to 0.5 μM 20E). Two-thirds of these genes(18) including the known 20E-inducible genes Eip75, Br,Eip28/29, and Eip55, remained significantly up-regulatedafter 4 hours in the presence of 20E while 51 additionalgenes were induced and 77 genes were repressed (i.e.had decreased transcript levels) (see Additional file 1:20E-responsive genes in Kc167 cells after 2 and 4 hoursof exposure to 0.5 μM 20E). Among the 20E-inducedgenes indentified here in Kc cells, the most stronglyinduced after 4 hours, Eip28/29, was originally identifiedowing to its quick reaction to 20E in Kc cells [29,30]and has since been used to study aspects of the 20Eresponse such as its tissue specificity [31]. Takentogether, the response observed here after a 2 and 4hour 20E-treatment are consistent with two prior obser-vations on the 20E-induced puffing patterns of larvalsalivary glands: first, that primary 20E-response genesare likely to still be detectable after a four-hour 20E-treatment and second, that the 20E-response of Kc167is more robust after 4 hours of 20E exposure [4] (seeAdditional file 1: 20E-responsive genes in Kc167 cellsafter 2 and 4 hours of exposure to 0.5 μM 20E).Of the 20E-inducible genes identified here, 30% were
also identified in a recent study by Gauhar and collea-gues that examined the transcriptional response of Kccells following either a 1, 3, or 6 hr 20E treatment [32].However, if we apply more stringent fold-change criteriato the list of 20E indentified here the degree of overlap
increases such that at a 2-fold cut-off, there is 50% over-lap, and there is 100% overlap between ours and theGauhar et al. lists if we select a 3-fold change in expres-sion. Remaining differences in the identification of 20Eresponsive genes indentified is likely due in part to theuse of different culturing medium as we have previouslyfound that media composition affects the transcriptionalresponse of Kc cells to 20E (unpublished results). Theuse of a different microarray platform in the measure-ment of the transcriptional profile could also be a con-tributing factor.
Identification of primary 20E-response genesHaving identified genes involved in the 20E-response,we were interested in determining where these genes fitinto the 20E-hierarchy of gene activation. In particular,we wanted to identify those genes comprising the pri-mary response to the hormone and are thus likely to bedirectly induced by 20E. Maximum induction of pri-mary-response genes by 20E is expected to occur after 4hours of exposure to the hormone, however, some sec-ondary-response gene transcription may have alreadybegun at this point [1,4]. One distinguishing characteris-tic of primary and secondary-response genes is theirdependence on protein synthesis for transcription; onlyprimary response genes are transcribed in the absenceof protein synthesis [1,33]. Thus, to identify primaryresponse genes, cells were treated with 20E in conjunc-tion with an inhibitor of protein synthesis, cyclohexi-mide (Table 1). RNA isolated from treated cells waslabelled and co-hybridized to cDNA arrays along with adifferentially labelled untreated control. From this analy-sis we identified 149 genes that were induced and 119genes that were repressed by the 20E-cycloheximidecombination (data not shown). To determine which ofthese genes were induced/repressed in response to 20E,and were not responding to exposure to cycloheximidealone, additional microarrays were run using RNA fromKc167 cells treated only with cycloheximide. From thisexperiment, 214 genes were indentified whose transcrip-tion is altered due solely to the inhibition of proteinsynthesis (data not shown). A two-class SAM analysisidentified 35 genes whose transcripts levels in the pre-sence of cycloheximide differs significantly when 20E ispresent including the well characterized 20E-primary-response genes, Eip75B and br (Table 1 and Additionalfile 2: Extended version of Table 1). Although Eip74EFwas not among the genes on this list, we confirmed itsinduction by 20E by qRT-PCR (see Additional file 3:qRT-PCR confirmation of microarray data) suggestingthat the cDNA probe on the batch of arrays used forthis study was likely of poor quality and unable to detecttranscripts of this gene. Of the 35 primary-responsegenes identified, 15 were not induced by 20E alone. The
Gonsalves et al. BMC Genomics 2011, 12:475http://www.biomedcentral.com/1471-2164/12/475
Page 3 of 16

Table 1 Primary and secondary response 20E-regulated genes identified in Kc167 cells
Group Gene Symbol 20E FoldDifference
q value(%)
Primary folddifference
q value(%)
Select Functional Annotation Terms Enriched inGroup
br 3.58 0.00 4.75 0.00
CG5346 3.10 0.00 2.91 0.00 induction of
Rrp46 2.45 0.00 2.68 0.00 programmed cell
Pect 2.89 0.00 2.49 0.00 death by hormones;
CG14523 1.83 0.40 2.37 0.00
Cyp9c1 1.87 1.13 2.35 0.00 catalytic activity;
granny-smith 1.79 0.00 2.21 0.00
CG4825 2.10 0.00 2.14 0.00 cytochrome P450,
CG17760 2.51 0.00 2.13 0.00 E-class, group I;
E Eip55E 1.92 0.00 2.03 0.00
CG15482 2.75 0.00 1.83 0.00 hydrolase activity;
Eip75B 1.82 0.00 1.83 0.00
Nc 1.40 0.00 1.80 0.00
eater 1.97 0.00 1.76 0.00
Idgf2 -1.06 1.74 0.00
CG11586 1.00 1.74 1.89
PRL-1 2.10 0.00 1.70 0.00
l(2)09851 -1.08 1.70 0.00
vri 1.52 0.84 1.68 0.00
ImpL2 1.42 1.68 0.00
Eip71CD 4.06 0.00
CG11893 2.28 0.62 mitochondrial
CG15711 2.20 0.00 respiratory chain;
CG30104 2.03 0.00
F CG5059 2.00 0.34 glutathione
CG17819 2.00 0.72 S-transferase;
CG5104 1.99 0.00
CG31633 1.89 2.76 cellular metabolic
CG5694 1.87 4.45 process;
Obp8a 1.83 3.56
G Aldh -1.32 3.56 -2.05 2.10
CG8801 -1.84 0.62
ncd -1.92 0.38 nucleotie-binding;
Hsp70Aa -2.01 0.49
Hsp68 -2.13 1.13 kinase activity;
H Scp2 -2.13 4.45
gammaTub23C -2.17 1.13 glycolysis;
Hsp60 -2.43 0.00
Acon -2.51 1.76 cytoskeleton
Vago -2.57 0.00 organization and
Hsp70Ab -2.91 1.13 biogenesis
A two- class SAM analysis of triplicate data identified primary-response genes that responded to 20E in the presence of cycloheximide. The top 20 up-regulatedprimary-response genes and single down-regulated primary-response gene are listed (group E and G respectively). Secondary-response genes regulated by 20Eonly in the absence of cycloheximide were also identified. The top 10 up- and down-regulated secondary-response genes are listed (groups F and H
Gonsalves et al. BMC Genomics 2011, 12:475http://www.biomedcentral.com/1471-2164/12/475
Page 4 of 16

induction of these 15 genes by 20E is likely masked inthe absence of cycloheximide due to a negatively regu-lated auto-feedback loop where primary-response genetranscription is repressed by primary-response gene pro-tein products [1]. Interestingly, the only gene transcriptrepressed as part of the primary response to 20E,CG3752, also evades detection unless protein synthesisis blocked (Table 1). The majority of 20E-responsivegenes identified after a 4 hour treatment with 0.5 μM20E behaved as secondary-response genes as theirresponse to 20E was blocked in the presence of cyclo-heximide; 48 genes were induced and 77 were repressedas part of the secondary response (Table 1 and Addi-tional file 2: Extended version of Table 1).In addition to differences in transcriptional response
in the absence of protein synthesis, it is also expectedthat most primary-response genes encode regulatorswhile secondary-response genes encode effectors[1,5,7,10]. To determine if this is the case for the genesidentified here as part of the primary and secondaryresponse, we examined each group of genes for enrich-ment in functional annotation terms/keywords using theonline resource DAVID. The results of this analysis aresummarized in Table 1. Several of the primary-responsegene transcripts include those that code for the wellknown DNA binding transcription factors Eip75B andbr as well as vrille which is consistent with the modelthat primary-response proteins are required for the tran-scriptional induction of the secondary-response genes.“Induction of programmed cell death by hormones” isamong the most highly enriched terms associated withprimary-response genes and comes as no surprise dueto the well established involvement of 20E-regualtedgenes such as br and Nc in cell death pathways duringDrosophila development [34-37]. However, we shouldpoint out that that Kc cells do not undergo apoptoticcell death in response to ecdysone treatment and there-fore other factors and/or conditions must need to bepresent in order to carry out this particular process.“Catalytic activity” and “hydrolase activity” were bothalso among the most significantly enriched terms sup-porting the idea that primary-response genes areinvolved in a broad range of regulatory roles [7-13]. Forexample, one of the genes belonging to the hydrolaseclass includes imaginal disk growth factor 2, a proteinthat when bound to its receptor initiates signal trans-duction cascades important to imaginal disk
development. Some primary- and secondary-responsegenes include genes that code for proteins involved incell movement and organization and/or are associatedwith the cytoskeleton. These include up-regulated tran-scripts for Roadblock, a gene coding for a dynein-asso-ciated protein and down-regulated transcripts forSpastin, and a gene coding for a microtubule severingprotein. Transcript changes in genes of this sort areconsistent with the cell movement and morphogeneticchanges that occur during 20E-dependent developmen-tal changes. Also of interest is that several of the sec-ondary-response genes include genes that are involvedin metabolic processes. More specifically, there seems tobe an increase in transcripts for genes involved in mito-chondrial respiration and a decrease in transcripts forgenes involved in glycolysis perhaps suggesting that inaddition to the cellular organization and tissue changesthat are induced by 20E, there is also a shift in howenergy is being produced.
Transcriptional response of Kc167 cells to an increasedconcentration of 20E and to its structural analog,ponasterone A (PoA)To examine the specificity of the 20E-response of Kc167cells to both hormone concentration and ligand struc-ture, two other conditions were tested: a 20-fold higherconcentration of 20E, 10 μM, and the replacement of20E with its structural analog, PoA. 20E concentrationis known to affect at least three aspects of the 20E-response: the size of both early and late puffs [2], therate of early puff regression [2], and the transcription ofsome early gene isoforms [38]. PoA, often used as sub-stitute for 20E, is a more potent activator of the 20E-response. At least four different measures indicate thatPoA activity is approximately eight fold higher than 20Eactivity: affinity for the ecdysone receptor [20], morpho-logical changes associated with the 20E-response [25],the level of induction of known 20E-inducible proteins[29], and the level of transcription from an ecdysoneresponse element (EcRE) [19]. Thus, to minimize effectscaused by the difference in receptor affinity and makethe comparison between analogs as similar as possible,our working concentration of PoA was eight fold lessthan that of 20E (ie. 0.0625 μM PoA versus 0.5 μM20E).Genes that responded to either of the two treatments
were identified by microarray analysis as described
respectively). The fold change of each gene following a 4 hour treatment with 0.5 μM 20E (20E fold difference) and, for primary-response genes, the fold changefollowing a 4 hour treatment with 0.5 μM 20E and 100 μM cycloheximide (primary fold difference) is given. q-values determined by SAM represent the lowestfalse discovery rate at which that gene is considered significant. For a gene to be included as differentially expressed, it must have a q-value < 5% in thatexperimental condition. q-values > 5% are not shown. DAVID (http://david.abcc.ncifcrf.gov/) was used to identify enriched annotation categories among groupsof genes that respond similarly to 20E. Some of the most enriched functional terms associated with each group (i.e. terms with modified Fisher Exact p-values ≤0.05; where the p-value gives the probability of that term being randomly associated with the genes in the group) are given in the right most column. Acomplete list of all genes in these groups and their functional annotation is in Additional file 2.
Gonsalves et al. BMC Genomics 2011, 12:475http://www.biomedcentral.com/1471-2164/12/475
Page 5 of 16
above. Compared to the number of genes induced by a4 hour treatment with 0.5 μM 20E, both 10 μM 20Eand 0.0625 μM PoA stimulated the transcription of agreater number of genes: 85 and 115 respectively versus69 induced by 0.5 μM 20E (see Additional file 4: Genesidentified as part of the transcriptional response toeither 20E or PoA). Furthermore, PoA down-regulatedsubstantially more genes than either 20E treatment.One-hundred and fifty genes were repressed after a 4hour treatment with PoA - almost double the numberrepressed by 0.5 μM 20E (79) and nearly six fold morethan the number repressed by 10 μM 20E (26) (seeAdditional file 4: Genes identified as part of the tran-scriptional response to either 20E or PoA). It is possiblethat the differences in the response to PoA may be dueto the activation of additional nuclear receptors; it isonly assumed to be the 20E receptor heterodimerbecause it has been shown to be the case in vitro [22].Overall, 379 genes were identified that responded to at
least one of the three hormone treatments examined(0.5 μM and 10 μM 20E and 0.0625 μM PoA; see Addi-tional file 4: Genes identified as part of the transcrip-tional response to either 20E or PoA). To determinewhich of these 379 hormone-responsive genes were sen-sitive to all three conditions tested and which are differ-entially regulated by either 10 μM 20E or PoA relativeto 0.5 μM 20E, a multi-class SAM analysis was per-formed where the transcriptional response to 10 μM20E and PoA was compared to the transcriptionalresponse 0.5 μM 20E for each gene. This analysisrevealed two things about the transcriptional responseto each of the hormone conditions tested. First, of the379 genes that responded to at least one of the threetreatments, 35 showed no significant difference in theirtranscriptional response to all three treatments andeight of these are primary 20E-inducible genes (Table2). Second, PoA produced a more distinct transcrip-tional profile than did an elevated concentration of 20Ewith respect to the 0.5 μM 20E treatment (Figure 1),suggesting that PoA may not be acting solely throughthe ecdysone hierarchy. We confirmed the transcrip-tional response of three key 20E-inducible genes, theecdysone-receptor complex, and a novel 20E-incudiblegene by qRT-PCR. In all cases, the transcriptionalresponse for these genes measured by qRT-PCR,although differing in magnitude when compared to themicroarray analysis (i.e. showing on average a 5.58 foldmore induction than the microarray data), had the samedirection of change (see Additional file 3: qRT-PCR con-firmation of microarray results).Given the observed similarities and differences in the
ecdysteroid-response to both an increased 20E-concen-tration and the use of a structural analog, we wanted toidentify functions associated with genes that responded
similarly to all treatments tested. Using DAVID wefound two categories enriched in similarly respondinggenes that were also enriched among primary-responsegenes: “catalytic activity” and “hydrolase activity” (Table3). Conversely, genes that reacted significantly differentto either 10 μM 20E, PoA or 0.5 μM 20E were enrichedin many unique categories; the most strongly enrichedfunctional terms are associated with genes down-regu-lated by PoA relative to 0.5 μM 20E (Table 3). Further-more, other categories related to development are alsostrongly enriched in the list of genes that are down-regulated by PoA relative to 0.5 μM 20E such as “anato-mical structure development”, “induction of pro-grammed cell death”, and “instar larval or pupaldevelopment” (Table 3 and Figure 1). The apparent lackof activation of developmental genes by PoA, as indi-cated by this analysis, is suggestive of an alternate modeof action of PoA induced death in non-adapted insectsmore so than the simple induction of premature moltingvia the canonical ecdysone hierarchy. In fact, the resultspotentially suggest that PoA might interfere with normal20E induced transcriptional changes and prevent theinduction of some of the genes that are required for 20Edependent developmental processes.
Transcriptional response of salivary glands to 20EWe wanted to extend our analysis to a 20E-responsivelarval tissue to see how it compares to the 20E tran-scriptional response of Kc167 cells. Salivary glands werechosen in this respect due to the relative ease of dissec-tion and because the foundations of our understandingof the 20E response comes from the study of salivaryglands. Cultured glands from 20 late third instar larvaestaged by the blue gut method (see Methods section)were treated with 0.5 μM 20E for four hours. We choseto treat salivary glands prior to the natural 20E pulserather than assay glands after the natural pulse to ruleout potential confounding effects caused by other endo-genous hormones and/or the presence of protein pro-ducts of secondary-response genes within the 20Ehierarchy. RNA was isolated from 20E treated glandsand untreated control glands, amplified, and analyzed bymicroarray experiments as described in the Methodssection. We identified 98 up-regulated genes includingseveral known 20E-inducible genes such as, Eip75B,Eip74EF, EcR, Nc, and ImpL2, and 8 down-regulatedgenes (see Additional file 4: Genes identified as part ofthe transcriptional response to either 20E or PoA). In astudy by Beckstead and colleagues looking at 20Eresponsive genes in cultured larval organs 743 geneswere identified as 20E responsive [13]. Their treatments,however, utilized twice the concentration of 20E andlasted for an additional two hours. Nevertheless, wewere still able to identify 52 genes in common, the
Gonsalves et al. BMC Genomics 2011, 12:475http://www.biomedcentral.com/1471-2164/12/475
Page 6 of 16

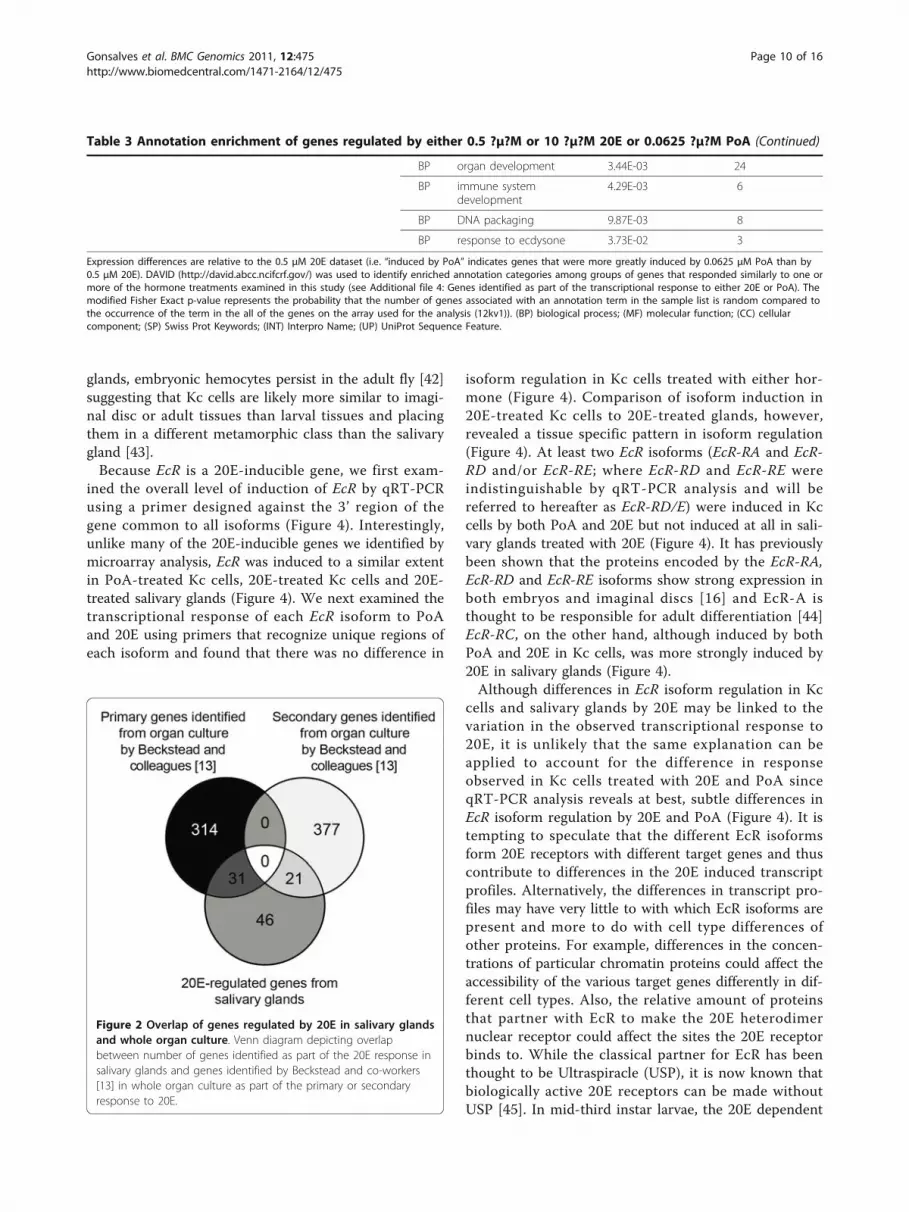
majority of which showed similar changes in expressionlevel (Figure 2 and Additional file 5: Genes that respondto 20E in salivary glands and in Drosophila organ cul-ture). By focusing only on salivary glands in this studywe were able to identify 46 salivary gland specific 20E-inducible genes that were not identified in total organpreparations [13] (Figure 2 and Additional file 6:
Salivary gland-specific 20E responsive genes). A DAVIDanalysis reveals that these salivary gland specific genesare enriched for protein binding (data not shown).Genes induced by 20E in salivary glands but not in
Kc167 cells were enriched in GO biological processessuch as “salivary gland histolysis”, “programmed celldeath” and various “developmental” processes as might
Table 2 Genes that respond similarly to 0.5 μM 20E, 10 μM 20E, or 0.0625 μM PoA
Gene Symbol orClone ID
0.5 μM 20E FoldDifference
q value(%)
10 μM 20E FoldDifference
q value(%)
0.0625 μM PoA FoldDifference
q value(%)
GO Molecular Function
Eip71CD 4.07 0.00 3.58 0.00 3.51 0.00 oxidoreductase activity
CG5346 3.10 0.00 2.88 0.00 3.49 0.00 cation binding
Pect 2.88 0.00 2.91 0.00 2.49 0.00 transferase activity
PRL-1 2.10 0.00 2.12 0.00 1.58 0.00 hydrolase activity
CG4825 2.10 0.00 2.17 0.00 2.56 0.00 transferase activity
CG30104 2.03 0.00 2.40 0.00 2.39 hydrolase activity
eater 1.97 0.00 2.52 0.00 2.20 0.00 receptor binding
Cyp4e2 1.83 0.00 2.05 0.00 2.02 0.00 monooxygenase activity
CG14523 1.83 0.40 2.04 0.00 1.81 0.00 peptidase activity
granny-smith 1.79 0.00 1.79 0.00 1.94 0.00 cation binding
CG5958 1.53 0.40 1.65 0.00 1.82 0.00 retinal binding
RE28720 1.52 3.56 1.67 0.00 1.54 0.00 N/A
RH68619 1.49 0.00 1.75 0.00 1.68 0.00 N/A
mTerf3 1.46 4.45 1.69 0.00 1.70 0.00 protein binding
CG33969 1.40 0.84 1.50 0.00 1.19 0.73 N/A
Ggamma1 1.39 1.27 0.47 1.58 0.11 hydrolase activity
CG8507 1.38 1.18 4.43 1.57 0.00 low-density lipoproteinreceptor binding
CG18591 1.35 1.26 0.47 1.62 0.16 RNA binding
HL03650 1.33 1.50 1.54 0.00 1.74 0.00 N/A
GstE1 1.05 -1.01 -1.52 0.00 transferase activity
RE45701 -1.22 2.76 -1.65 0.47 -1.56 0.00 N/A
CG7706 -1.22 -1.62 0.63 anion transporter activity
vas -1.27 -1.52 0.00 ATP-dependent helicaseactivity
CG14739 -1.28 0.62 -1.53 0.63 ubiquitin conjugatingenzyme activity
Pde8 -1.30 -1.49 0.00 -1.58 0.00 hydrolase activity
LD33681 -1.35 -1.31 0.00 -1.67 0.00 N/A
CG13868 -1.36 0.49 -1.35 0.30 -1.58 0.00 protein binding
Gs1 -1.39 2.17 -1.58 0.00 -1.07 ligase activity
arm -1.39 3.56 -1.59 0.00 -1.30 0.14 alpha-catenin binding
Rpn1 -1.41 -1.15 -1.54 0.49 peptidase activity
CG10641 -1.47 0.00 -1.34 1.60 -1.58 0.00 cation binding
eIF3-S10 -1.55 0.00 -1.36 0.00 -1.75 0.28 translation factor activity
RhoGAP16F -1.65 0.00 -1.34 0.00 -1.59 0.00 GTPase activator activity
RH07164 -1.86 4.45 -1.59 0.30 -1.86 0.14 N/A
A multi-class SAM analysis revealed genes with similar transcriptional responses to the hormones and hormone concentrations studied. Genes identified asprimary 20E-response genes (see Table 1) are indicated in bold. As with Table 1, the fold change and q-value of each gene following the treatment indicated isgiven. A missing fold change value means that gene was either not represented by at least 2/3 spots and/or did not exhibit a coefficient of variation of at least 1for that treatment across replicate arrays.
Gonsalves et al. BMC Genomics 2011, 12:475http://www.biomedcentral.com/1471-2164/12/475
Page 7 of 16

be expected. “Cellularization” and “transporter activity”were also among the highest scoring hits. Conversely,genes that were up regulated only in Kc cells showedenrichment for “metabolic process” and “oxidoreductaseactivity"- categories that were also enriched among sec-ondary response genes in Kc cells suggesting that thesecondary response genes differ between Kc cells andsalivary glands (Table 4). Comparison of 20E responsivegenes from both systems allowed the identification of 10genes whose response is conserved across both systemssuggesting that they might occupy key positions withinthe hierarchy (Figure 3). Among the most highlyinduced of these genes are two genes that have not beentraditionally associated with the 20E response in Droso-phila, CG6579 and Rrp46 (see Additional file 4: Genesidentified as part of the transcriptional response toeither 20E or PoA). CG6579 is currently un-annotatedand Rrp46 is a component of the exosome that hasbeen shown to relocate to developmental loci duringperiods of active transcription and is involved in mRNAprocessing [39]. Rrp46 showed the greatest correlationin expression profile to Eip75B highlighting the impor-tance of gene transcription in the ecdysone response.
Tissue specific differences in ecdysone receptor (EcR)isoform induction by 20ESome of the differences in the transcriptional responseof Kc cells and salivary glands may be explained by dif-ferential chromatin states of inactive genes in the twosystems. For example, salivary gland secretion protein(sgs) genes known be under the control of the hierarchywere expressed in glands but not in cells most likelybecause of the difference in the two cell types. Differen-tial gene regulation by 20E may also result from theexpression of different EcR isoforms or combinationsthereof [14-16,40]. Typically, tissues with dissimilardevelopmental fates express different EcR isoforms[14-16]. Our microarray results agree with previousfindings that Kc cells express hemocyte and plasmato-cyte marker genes Pxn, ush, and Hml [41] (data notshown) and that 20E treatment of Kc cells causes theinduction of Eip28/29 and Eip55 (Eip40), both of whichare 20E-regulated in the hematopoietic lymph gland [31]providing further support for an embryonic hemocyteorigin of Kc cells [31,41]. In contrast to larval salivary
Figure 1 Effect of PoA and increased 20E concentration ongene regulation. A multi- class SAM analysis identified groups ofgenes that are differentially regulated by either 10 μM 20E and/or
0.0625 μM PoA relative to 0.5 μM 20E from a list of genes exhibitinga +/- 1.5 fold change in response to at least one of the twotreatments. Genes showing a transcriptional response to either 10μM 20E or 0.0625 μM PoA that significantly differed from itsresponse to 0.5 μM 20E were clustered based on fold difference inexpression relative to its response to 0.5 μM 20E. Grey representsmissing data.
Gonsalves et al. BMC Genomics 2011, 12:475http://www.biomedcentral.com/1471-2164/12/475
Page 8 of 16

Table 3 Annotation enrichment of genes regulated by either 0.5 μM or 10 μM 20E or 0.0625 μM PoA
Group Response # Genes in Group with ValidIdentifier/Total # in Group
Category Term p-value Number of Genes from GroupAnnotated with Term
MF catalytic activity 9.35E-03 18
BP positive regulation oftranslation
2.84E-02 2
1 Common to allthree
conditionstested
30/35 BP protein metabolic process 2.84E-02 12
BP primary metabolic process 2.96E-02 19
MF hydrolase activity 3.81E-02 10
BP response to temperaturestimulus
4.16E-03 4
2 Induced byboth PoA
&10 μM 20E
54/58 SP DNA binding 1.40E-02 7
BP lipid transport 2.87E-02 3
CC intracellular part 1.34E-02 21
3 Repressedby both PoA &10 μM 20E
46/54 BP protein folding 1.99E-02 4
BP generation of precursormetabolites and energy
2.94E-02 6
CC mitochondrial respiatorychain
3.63E-02 3
CC organelle part 6.17E-04 21
CC organelle membrane 3.47E-03 9
4 Induced byPoA
87/89 CC cytoplasm 4.16E-03 22
BP intracellular proteintransport
1.08E-02 8
SP ribonucleoprotein 1.17E-02 5
BP cytoplasmic sequestering oftranscription factor
2.55E-02 2
BP developmental process 2.39E-06 48
MF nucleoside-triphosphataseactivity
1.84E-05 20
BP cell differentiation 1.86E-05 31
MF hydrolase activity, acting onacid anhydrides
2.84E-05 20
BP gamete generation 3.68E-05 20
BP sexual reproduction 5.17E-05 20
BP anatomical structuredevelopment
6.51E-05 36
5 Repressed byPoA
133/145 BP organelle organization andbiogenesis
1.98E-04 27
BP neuron development 2.00E-04 13
BP system development 2.08E-04 31
MF helicase activity 9.13E-04 8
BP induction of programmedcell death
1.16E-03 6
MF ATPase activity 1.47E-03 13
BP instar larval or pupaldevelopment
2.10E-03 16
Gonsalves et al. BMC Genomics 2011, 12:475http://www.biomedcentral.com/1471-2164/12/475
Page 9 of 16
glands, embryonic hemocytes persist in the adult fly [42]suggesting that Kc cells are likely more similar to imagi-nal disc or adult tissues than larval tissues and placingthem in a different metamorphic class than the salivarygland [43].Because EcR is a 20E-inducible gene, we first exam-
ined the overall level of induction of EcR by qRT-PCRusing a primer designed against the 3’ region of thegene common to all isoforms (Figure 4). Interestingly,unlike many of the 20E-inducible genes we identified bymicroarray analysis, EcR was induced to a similar extentin PoA-treated Kc cells, 20E-treated Kc cells and 20E-treated salivary glands (Figure 4). We next examined thetranscriptional response of each EcR isoform to PoAand 20E using primers that recognize unique regions ofeach isoform and found that there was no difference in
isoform regulation in Kc cells treated with either hor-mone (Figure 4). Comparison of isoform induction in20E-treated Kc cells to 20E-treated glands, however,revealed a tissue specific pattern in isoform regulation(Figure 4). At least two EcR isoforms (EcR-RA and EcR-RD and/or EcR-RE; where EcR-RD and EcR-RE wereindistinguishable by qRT-PCR analysis and will bereferred to hereafter as EcR-RD/E) were induced in Kccells by both PoA and 20E but not induced at all in sali-vary glands treated with 20E (Figure 4). It has previouslybeen shown that the proteins encoded by the EcR-RA,EcR-RD and EcR-RE isoforms show strong expression inboth embryos and imaginal discs [16] and EcR-A isthought to be responsible for adult differentiation [44]EcR-RC, on the other hand, although induced by bothPoA and 20E in Kc cells, was more strongly induced by20E in salivary glands (Figure 4).Although differences in EcR isoform regulation in Kc
cells and salivary glands by 20E may be linked to thevariation in the observed transcriptional response to20E, it is unlikely that the same explanation can beapplied to account for the difference in responseobserved in Kc cells treated with 20E and PoA sinceqRT-PCR analysis reveals at best, subtle differences inEcR isoform regulation by 20E and PoA (Figure 4). It istempting to speculate that the different EcR isoformsform 20E receptors with different target genes and thuscontribute to differences in the 20E induced transcriptprofiles. Alternatively, the differences in transcript pro-files may have very little to with which EcR isoforms arepresent and more to do with cell type differences ofother proteins. For example, differences in the concen-trations of particular chromatin proteins could affect theaccessibility of the various target genes differently in dif-ferent cell types. Also, the relative amount of proteinsthat partner with EcR to make the 20E heterodimernuclear receptor could affect the sites the 20E receptorbinds to. While the classical partner for EcR has beenthought to be Ultraspiracle (USP), it is now known thatbiologically active 20E receptors can be made withoutUSP [45]. In mid-third instar larvae, the 20E dependent
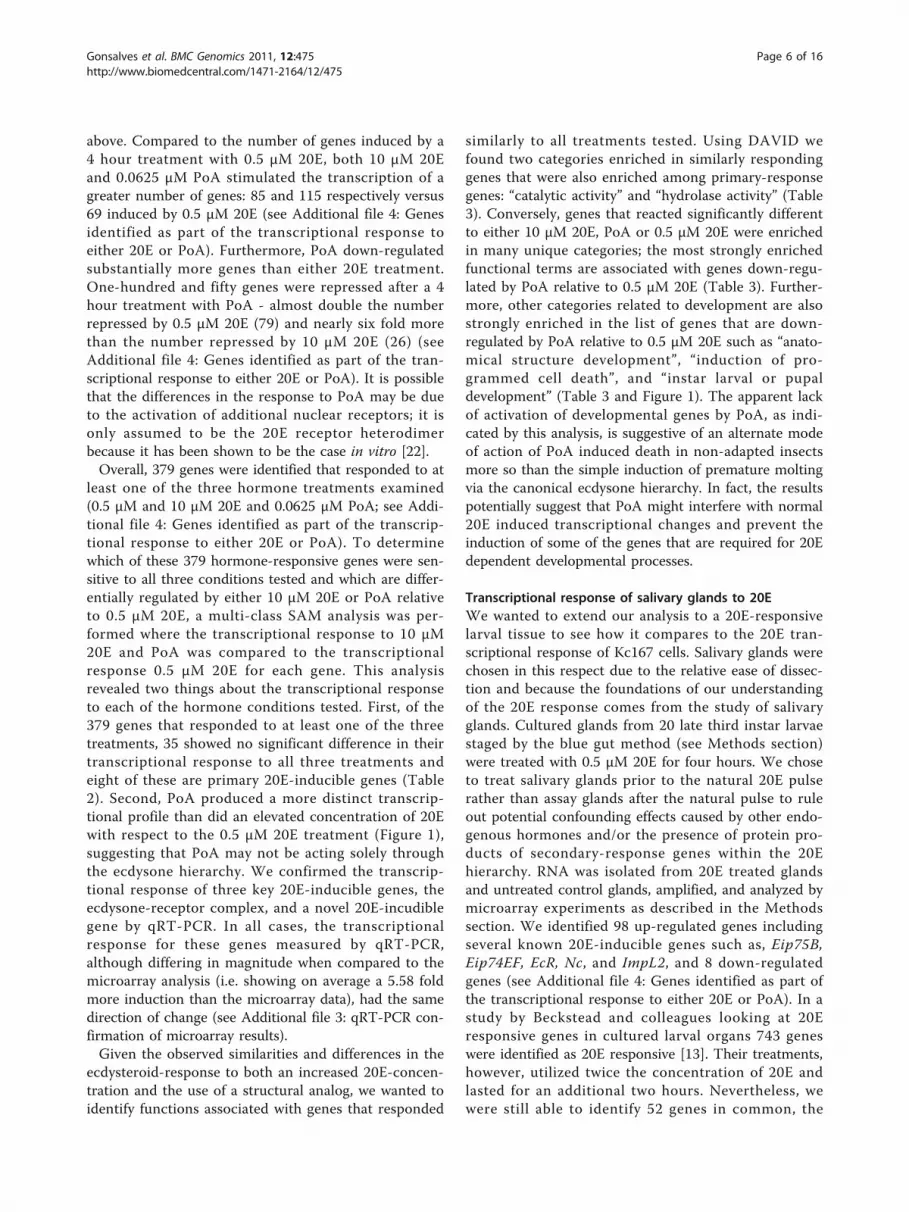
Table 3 Annotation enrichment of genes regulated by either 0.5 ?μ?M or 10 ?μ?M 20E or 0.0625 ?μ?M PoA (Continued)
BP organ development 3.44E-03 24
BP immune systemdevelopment
4.29E-03 6
BP DNA packaging 9.87E-03 8
BP response to ecdysone 3.73E-02 3
Expression differences are relative to the 0.5 μM 20E dataset (i.e. “induced by PoA” indicates genes that were more greatly induced by 0.0625 μM PoA than by0.5 μM 20E). DAVID (http://david.abcc.ncifcrf.gov/) was used to identify enriched annotation categories among groups of genes that responded similarly to one ormore of the hormone treatments examined in this study (see Additional file 4: Genes identified as part of the transcriptional response to either 20E or PoA). Themodified Fisher Exact p-value represents the probability that the number of genes associated with an annotation term in the sample list is random compared tothe occurrence of the term in the all of the genes on the array used for the analysis (12kv1)). (BP) biological process; (MF) molecular function; (CC) cellularcomponent; (SP) Swiss Prot Keywords; (INT) Interpro Name; (UP) UniProt Sequence Feature.
Figure 2 Overlap of genes regulated by 20E in salivary glandsand whole organ culture. Venn diagram depicting overlapbetween number of genes identified as part of the 20E response insalivary glands and genes identified by Beckstead and co-workers[13] in whole organ culture as part of the primary or secondaryresponse to 20E.
Gonsalves et al. BMC Genomics 2011, 12:475http://www.biomedcentral.com/1471-2164/12/475
Page 10 of 16

Table 4 Annotation enrichment of genes that respond to 20E in either Kc167 cells or salivary glands
Response to 20E # Genes in Group with Valid Identifier/Total # in Group
Category Term p-value
Number inCategory
% ofTotal
SP chromoprotein 3.3E-03 3 5
INT peptidase M13 4.3E-03 3 5
BP electron transport 4.5E-03 7 13
Induced in Kc cells 56/69 BP metabolic process 5.5E-03 31 55
MF oxidoreductase activity 1.0E-02 10 18
INT glutathione S-transferase 1.0E-02 3 5
BP generation of precursormetabolites and energy
1.6E-02 7 13
MF iron ion binding 3.1E-02 5 9
BP cellularization 2.4E-04 6 11
BP salivary gland histolysis 4.9E-04 6 11
BP programmed cell death 2.8E-03 9 16
BP cellular developmental process 3.4E-03 18 32
BP exocrine system development 3.4E-03 6 11
BP germ-band shortening 5.7E-03 3 5
BP gland development 6.6E-03 6 11
BP sperm individualization 1.5E-02 3 5
Induced in salivaryglands
87/98 UP compositionally biased region:Poly-Ala
1.4E-02 5 9
MF kinase activity 1.4E-02 9 16
BP regulation of metabolic process 1.5E-02 15 27
MF ligand-dependent nuclear receptoractivity
2.8E-02 3 5
BP cell differentiation 1.7E-02 16 29
BP female meiosis chromosomesegregation
3.2E-02 3 5
MF cytoskeletal protein binding 3.0E-02 7 13
BP embryonic development viasyncytial blastoderm
4.3E-02 5 9
BP regulation of cellular metabolicprocess
4.8E-02 13 23
INT cell division/GTP binding protein 5.2E-02 2 4
SP nucleotide-binding 3.2E-08 20 28
MF kinase activity 6.2E-04 11 15
Repressed in Kccells
71/77 INT chaperonin Cpn60 5.7E-03 3 4
MF unfolded protein binding 1.2E-02 4 6
SP glycolysis 1.5E-02 3 4
BP cytoskeleton organization andbiogenesis
2.5E-02 9 13
Repressed insalivary glands
9 N/A N/A N/A N/A N/A
DAVID (http://david.abcc.ncifcrf.gov/) was used to identify enriched annotation categories among groups of genes that respond similarly to 20E. The modifiedFisher Exact p-value represents the probability that the number of genes associated with an annotation term in the sample list is random compared to theoccurrence of the term in the all of the genes on the array used for the analysis (12kv1)). (BP) biological process; (MF) molecular function; (CC) cellularcomponent; (SP) Swiss Prot Keywords; (INT) Interpro Name; (UP) UniProt Sequence Feature.
Gonsalves et al. BMC Genomics 2011, 12:475http://www.biomedcentral.com/1471-2164/12/475
Page 11 of 16

induction of the glue proteins requires EcR but not USPsuggesting that EcR makes 20E receptors that consist ofEcR and yet to be characterized partner protein [45].One approach to assess the relative contributions ofeach of the EcR isoforms would be to employ RNAiknockdown strategies of the different EcR isoforms inboth Kc cells and larval tissues and examine what affectthis has on the 20E induced transcript profiles.
ConclusionsWe have identified 35 primary 20E-response genes thatare induced by 20E in the absence of protein synthesisin Drosophila Kc167 cells, one of the most widely usedcell lines employed to study the ecdysone response. Theprimary 20E responsive genes were enriched for GeneOntology (GO) terms such as induction of programmedcell death by hormones, catalytic activity, hydrolaseactivity, and cytochrome P450. We have also identified125 secondary 20E-response genes (48 induced and 77repressed). GO terms that are enriched in the second-ary-response genes include an increase in transcripts forgenes involved in mitochondrial respiration and adecrease in transcripts for genes involved in glycolysissuggesting that 20E induces shifts in cellular metabo-lism. Some primary- and secondary-response genesinclude genes that code for proteins involved in cellmovement and organization and/or are cytoskeletalassociated which is consistent with the cell movementand morphogenetic changes that occur during 20E-dependent developmental changes.Comparison of the genome-wide transcriptional
response to 20E to its plant derived structural analogponasterone A (PoA) revealed a large difference in thetranscriptional targets of these molecules. While thesetwo compounds are structurally very similar, manymore genes related to various aspects of developmentappear to be significantly induced by 20E than by PoA.More specifically, the most strongly enriched functionalterms are associated with genes down-regulated (i.e. notinduced) by PoA relative to 0.5 μM 20E. The genes notinduced by PoA include GO terms such as developmen-tal process, cell differentiation, gamete generation, ana-tomical structure development, organelle organizationand biogenesis, neuron development, and induction ofprogrammed cell death. The apparent lack of activationof developmental genes by PoA suggests that PoAinduced death in non-adapted insects may be due tomore than the just the simple induction of prematuremolting via the canonical ecdysone hierarchy.We also compared the 20E response in Kc cells to
that of a natural 20E target tissue where the function of20E has been well described, the salivary glands of wan-dering 3rd instar larvae, and found little overlap in 20E-responsive genes. Genes induced by 20E in salivary
glands but not in Kc167 cells were enriched in GO bio-logical processes such as “salivary gland histolysis”, “pro-grammed cell death” and various “developmental”processes as well as “cellularization” and “transporteractivity”.To help identify a potential mechanism to explain the
difference in the transcriptional responses in Kc cellsand salivary glands, we analyzed the 20E-induced tran-scription of the various EcR isoforms, a known 20E-inducible gene and a component of the nuclear receptorcomplex that binds 20E. We did find differences in theinduction of EcR isoforms EcR-RA, ER-RC, and EcR-RD/E between Kc cells and salivary glands in response to20E. This suggests that the relative amount of variousEcR isoforms present in a cell is different in differentcell types and possibly contributes to the transcriptionalresponse a given tissue has to 20E.
MethodsHormone treatmentsDrosophila Kc167 cells were obtained from DrosophilaGenomic Resource Centre (Bloomington, IN) and weregrown to confluence in Schneider’s medium (Invitrogen)supplemented with 5% heat-inactivated FBS (Sigma) and20 ug/ml gentamicin (Sigma). Cells were passaged into aseries of new flasks that were divided into two groups,experimental and control, and were allowed to recoverfor one hour. Experimental cells were treated with 0.5μM 20-hydroxyecdysone (20E) (Sigma) for two hours orwith one of the following for four hours: 0.0625 μMponasterone A (Sigma), 0.5 μM 20E, 10 μM 20E, 0.5 μM20E plus 100 μM cycloheximide (Sigma), 100 μM cyclo-heximide alone, or with 0.05% or 0.5% ethanol (solventused to dissolve hormones). All treatments were per-formed at 22°C and three independent biological repli-cates were assessed.Late third instar larvae (dp cn bw cl) were selected by
the blue gut method as previously described [46]. Salivaryglands were dissected from 10 larvae in physiological sal-ine solution and cultured in a 10-well dish with no morethan five glands per well in 120 μl of modified TB1 buffer(15 mM HEPES, pH 6.8, 80 mM KCl, 16 mM NaCl, 5mM MgCl2, 1% polyethylene glycol 6000) [47,48] for 1hour to minimize the effects of any endogenous hormonesthat might mask the effects of 20E addition. One lobefrom each pair of glands was then transferred to fresh TB1containing 0.5 μM 20E (Sigma) while the sister lobe wastransferred to fresh TB1 containing solvent (ethanol). Aswith the cells, all incubations were carried out for two orfour hours and were performed at 22°C in triplicate.
RNA isolation and hybridization to cDNA arraysTRIzol reagent (Invitrogen) was used to isolate totalRNA from both cells and glands according to the
Gonsalves et al. BMC Genomics 2011, 12:475http://www.biomedcentral.com/1471-2164/12/475
Page 12 of 16

manufacturer’s protocol. For each hormone treatmentperformed, RNA was isolated independently from threebiological replicates. Quality and quantity of RNA wasverified by spectrophotometry and the A260/A280 ratioswere greater than 1.8. RNA extracted from glands wassubjected to linear amplification using MessageAmp™II aRNA Amplification Kit (Ambion). Labeling andhybridization to microarrays was carried out asdescribed on the CDMC website (http://www.flyarrays.com and Neal et al. 2003 [49]). Briefly, 2 μg of amplifiedRNA from glands or 80 μg of total RNA from cells wasreverse-transcribed with SuperScriptII (Invitrogen) inthe presence of cyanine (Cy) dye coupled nucleotides.After isopropanol precipitation of the labeled cDNA,Cy5 labeled cDNA generated from experimental samples
was mixed with Cy3 labeled cDNA from the respectiveuntreated control sample and hybridized to the 12k_v1cDNA microarray from the Canadian Drosophila Micro-array Centre (CDMC). All downstream processing andhybridization steps were performed exactly as previouslydescribed [49,50].
Microarray data acquisition, normalization and analysisA ScanArray 4000 laser scanner (Perkin Elmer) wasused to acquire 16-bit TIFF images of the hybridizedarrays that were subsequently analyzed with QuantArrayv3.0 software (Perkin Elmer). Quantification data filesand their associated images were loaded into GeneTraf-fic (GT) DUO (Iobion Informatics/Stratagene) wherespots with raw intensities less than twice the averagebackground or less than 128 fluorescence units wereexcluded from further analysis. Normalization and otheranalysis was performed following the guidelines outlinedin Neal et al., 2003 and Neal and Westwood 2006[49,50]. Briefly, normalization of the data was performedin GT using the subgrid Lowess algorithm with a 20%smoothing factor for all experiments to correct for sys-tematic differences in data collection. Normalized datafrom 3 replicate arrays was complied and imported intoExcel (Mircosoft) for significance analysis. At this point,genes represented by less than 2/3 valid spots wereremoved. The Significance Analysis of Microarrays(SAM) package was used to identify genes whoseexpression significantly differs between samples with afalse discovery rate (FDR) of less than 5% [51]. Lists ofgenes found significant by SAM that also showed achange of at least 1.5 fold a coefficient of variation ≤1were generated in GT DUO for each of the treatmentsunder investigation. Hierarchical clusters were generatedusing the Pearson uncentered distance metric in MeV[52]. The List Functions tool available on the CDMCweb site (http://www.flyarrays.com) was used to com-pare lists of 20E-responsive genes identified in our studywith those previously identified. Data for this study canbe found in Gene Expression Omnibus (GEO; http://www.ncbi.nlm.nih.gov/geo) under the accessionGSE23928.
Quantitative RT-PCROne microgram of total RNA isolated from hormone-treated cells or salivary glands was treated with DNase I(Fermentas) to remove contaminating genomic DNAand then reverse-transcribed with SuperScript IIreverse-transcriptase (Invitrogen) from anchor oligo dTprimers (Invitrogen). The resulting cDNA was treatedwith RNase H to remove the RNA component of thecDNA-RNA hybrids prior to PCR. The following pri-mers were used for amplification: Act5Cf: GTG CCCATC TAC GAG GGT TA, Act5Cr: GCC ATC TCC
Figure 3 The transcriptional responses of Kc167 cells andsalivary glands to 20E exhibit very little overlap. Roughly equalnumbers of genes are induced (black bars) and repressed (greybars) in cells by 20E. In salivary glands, the response to 20E is largelystimulatory with nearly 10 times more genes being induced asrepressed. Only a small number of genes are regulated by 20E inboth cells and glands (common).
Figure 4 The transcription of EcR isoforms are differentiallyregulated in Kc cells and salivary glands. Relative induction ofUSP, EcR and five EcR isoforms in Kc cells and salivary glands byeither 0.5 μM 20E or 0.0625 μM PoA as determined by qRT-PCRrelative to untreated Kc cells or salivary glands, respectively.
Gonsalves et al. BMC Genomics 2011, 12:475http://www.biomedcentral.com/1471-2164/12/475
Page 13 of 16

TGC TCA AAG TC, E75f: CTG CCA GTA TTT CCAGTC, E75r: GGA CAA TGT GGG ATA CCT, E74f:CTA TTC ATG GGC GTT AGT, E74r: GAC AGTTGA AAG GTC ATT AG, Brf: ACA ACA ACA GCCCCG ACT T, Brr: GCT TGT CGC TGA TGG AGATT, CG5346f: CGC TAG TTC AGG TGT ATC T,CG5346r: ACT TGT GCT CGC TAT ATC T, EcR-RAf:CAT AGG AGT CTT CAG TCT ACA, EcR-RAr: AGATGG GGA TAG GGA TAC, EcR-RBf: CAT GGA TACTTG TGG ATT AG, EcR-RBr: CTG GCA GTT GGTCTA TGT, EcR-RCf: TTG TGG ATT AGT AGC AGAAC, EcR-RCr: ACA CTT TCG CCT CAT GTA, EcR-RD/Ef: GCT ATA AAG ACA GGG AGA AC, EcR-RD/Er: GCA AAA TAT GGC TAG GTA AG, EcRf: GGAGAT TCT TGA CCT TAT GA, EcRr: TTT GTA AACGCT GGT AGA C, USPf: GCG ATG AAA CTG GAGTAG, USPr: TGT AGG GTA TAA GGG ATA GAG.Triplicate qPCR reactions were performed with SYBRqPCR universal kit (KAPA) in a MX4000 qPCR instru-ment (Stratagene) under the following cycling para-meters: 95°C for 10min followed by 40 cycles of 95° for15s, 55°C for 25s and 72°C for 40s. A dissociation curvewas plotted at the end of each run as a quality controlfor non-specific amplification products. For each genethe fold change ratio (relative to an untreated control)was normalized to Act5C mRNA level and calculatedusing the Pfaffl (ΔΔ Ct) method [53]. The results pre-sented are calculated from the mean fold change of twoindependent biological replicates.
Analysis of functional classesFollowing the hierarchical cluster analysis, genes withsimilar expression profiles were examined to see if theirproducts shared any functional annotations. The CDMCLookup tool available at http://www.flyarrays.com wasused to obtain their corresponding LocusLink ID (nowcalled EntrezGene ID) for use in DAVID [54,55].DAVID assesses functional annotation associated withgroups of genes for enrichment over the backgroundrepresented by all genes on the 12k array. Annotationterms/keywords with EASE scores of ≤0.05 were takenas significantly enriched in a group of related genes andused to assign functional annotation to the group.
Additional material
Additional file 1: 20E-responsive genes in Kc167 cells after 2 and 4hours of exposure to 0.5 μM 20E. Of the 27 genes induced by 0.5 μM20E after 2 hours, one third are no longer up-regulated after 4 hours(group A) while the rest show similar levels of induction at both timepoints (group B). Many genes (51) are only significantly up-regulatedafter 4 hours of exposure to the hormone (group C). Likewise, genes thatare repressed by 0.5 μM 20E are only detectable after 4 hours oftreatment (group D). q-values determined by SAM represent the lowestfalse discover rate at which that gene is considered significant (see theTable 1 legend for details of q-values). A missing fold change value
means that gene was either not represented by at least 2/3 spots and/ordid not exhibit a coefficient of variation of at least 1 for that treatmentacross replicate arrays.
Additional file 2: Extended version of Table 1. See Table 1 legend fordetails.
Additional file 3: qRT-PCR confirmation of microarray data. Relativeinduction of selected genes identified by microarray analysis in Kc cellsand salivary glands by either 0.5 μM 20E or 0.0625 μM PoA wasconfirmed by qRT-PCR relative to untreated Kc cells or salivary glands,respectively.
Additional file 4: Genes identified as part of the transcriptionalresponse to either 20E or PoA. Genes that exhibit a 1.5 fold change orgreater to 0.0625 μM PoA in Kc167 cells or to either 10 μM 20E (20Ehigh) or 0.5 μM 20E (20E) in Kc cells or to 0.5 μM 20E in salivary glands(glands) are listed. q-values determined by SAM represent thesignificance of fold change reported (see the Table 1 legend for detailsof q-values).
Additional file 5: Genes that respond to 20E in salivary glands andin Drosophila organ culture. Genes identified as primary 20E-responsegenes by Beckstead and colleagues [13] are highlighted in grey.
Additional file 6: Salivary gland-specific 20E responsive genes. Thesegenes were identified as part of the response to 20E in salivary glandsbut not in whole organ culture [13].
AcknowledgementsThe authors would like to thank Zak Razak for advice on the data analysis.Some of the procedures were performed at the Canadian DrosophilaMicroarray Centre which was supported by an NSERC Canada (http://www.nserc-crsng.gc.ca/) multi-user facility grant. JTW is supported by an NSERCCanada Discovery Grant. SEG is a recipient of an NSERC PostgraduateDoctoral scholarship.
Author details1Department of Cell & Systems Biology, University of Toronto, Mississauga,Ontario, Canada. 2Department of Biology, Brandeis University, Waltham,Massachusetts, USA. 3Nematology Unit, Canadian Food Inspection Agency,Ottawa, Ontario, Canada.
Authors’ contributionsSEG participated in the design of the study, carried out the hormonetreatments, RNA isolations, microarray experiments, data analysis includinganalysis of functional classes, and qRTPCR experiments, and drafted themanuscript. SJN and ASK participated in the design of the study andparticipated in pilot experiments. JTW conceived of the study, participated inits design and helped to draft the manuscript. All authors read andapproved the final manuscript.
Received: 6 June 2011 Accepted: 29 September 2011Published: 29 September 2011
References1. Ashburner M: Sequential gene activation by ecdysone in polytene
chromosomes of Drosophila melanogaster. II. The effects of inhibitors ofprotein synthesis. Developmental Biology 1974, 39(1):141-157.
2. Ashburner M: Sequential gene activation by ecdysone in polytenechromosomes of Drosophila melanogaster. I. Dependence uponecdysone concentration. Developmental Biology 1973, 35(1):47-61.
3. Ashburner M: Induction of puffs in polytene chromosomes of in vitrocultured salivary glands of Drosophila melanogaster by ecdysone andechysone analogues. Nature New Biology 1971, 230(15):222-224.
4. Ashburner M: Patterns of puffing activity in the salivary glandchromosomes of Drosophila. VI. Induction by ecdysone in salivaryglands of D. melanogaster cultured in vitro. Chromosoma 1972,38(3):255-281.
Gonsalves et al. BMC Genomics 2011, 12:475http://www.biomedcentral.com/1471-2164/12/475
Page 14 of 16
5. Wright LG, Chen T, Thummel CS, Guild GM: Molecular characterization ofthe 71E late puff in Drosophila melanogaster reveals a family of novelgenes. J Mol Biol 1996, 255(3):387-400.
6. Restifo LL, Guild GM: An ecdysterone-responsive puff site in Drosophilacontains a cluster of seven differentially regulated genes. Journal ofMolecular Biology 1986, 188(4):517-528.
7. Guay PS, Guild GM: The ecdysone-induced puffing cascade in Drosophilasalivary glands: a Broad-Complex early gene regulates intermolt and lategene transcription. Genetics 1991, 129(1):169-175.
8. Andres AJ, Thummel CS: Hormones, puffs and flies: the molecular controlof metamorphosis by ecdysone. Trends Genet 1992, 8(4):132-138.
9. Hurban P, Thummel CS: Isolation and characterization of fifteenecdysone-inducible Drosophila genes reveal unexpected complexities inecdysone regulation. Molecular and Cellular Biology 1993, 13(11):7101-7111.
10. Fletcher JC, Thummel CS: The ecdysone-inducible Broad-complex andE74 early genes interact to regulate target gene transcription andDrosophila metamorphosis. Genetics 1995, 141(3):1025-1035.
11. Andres AJ, Thummel CS: The Drosophila 63F early puff contains E63-1, anecdysone-inducible gene that encodes a novel Ca(2+)-binding protein.Development 1995, 121(8):2667-2679.
12. Hock T, Cottrill T, Keegan J, Garza D: The E23 early gene of Drosophilaencodes an ecdysone-inducible ATP-binding cassette transportercapable of repressing ecdysone-mediated gene activation. Proceedings ofthe National Academy of Sciences USA 2000, 97(17):9519-9524.
13. Beckstead RB, Lam G, Thummel CS: The genomic response to 20-hydroxyecdysone at the onset of Drosophila metamorphosis. GenomeBiol 2005, 6(12):R99.
14. Robinow S, Talbot WS, Hogness DS, Truman JW: Programmed cell death inthe Drosophila CNS is ecdysone-regulated and coupled with a specificecdysone receptor isoform. Development 1993, 119(4):1251-1259.
15. Schubiger M, Wade AA, Carney GE, Truman JW, Bender M: Drosophila EcR-B ecdysone receptor isoforms are required for larval molting and forneuron remodeling during metamorphosis. Development 1998,125(11):2053-2062.
16. Talbot WS, Swyryd EA, Hogness DS: Drosophila tissues with differentmetamorphic responses to ecdysone express different ecdysonereceptor isoforms. Cell 1993, 73(7):1323-1337.
17. Cherbas L, Hu X, Zhimulev I, Belyaeva E, Cherbas P: EcR isoforms inDrosophila: testing tissue-specific requirements by targeted blockadeand rescue. Development 2003, 130(2):271-284.
18. Billas IML, Iwema T, Garnier JM, Mitschler A, Rochel N, Moras D: Structuraladaptability in the ligand-binding pocket of the ecdysone hormonereceptor. Nature 2003, 426(6962):91-96.
19. Baker KD, Warren JT, Thummel CS, Gilbert LI, Mangelsdorf DJ:Transcriptional activation of the Drosophila ecdysone receptor by insectand plant ecdysteroids. Insect Biochemistry and Molecular Biology 2000,30(11):1037-1043.
20. Maroy P, Dennis R, Beckers C, Sage BA, O’Connor JD: Demonstration of anecdysteroid receptor in a cultured cell line of Drosophila melanogaster.Proceedings of the National Academy of Sciences USA 1978,75(12):6035-6038.
21. Sage BA, Tanis MA, O’Connor JD: Characterization of ecdysteroidreceptors in cytosol and naive nuclear preparations of Drosophila Kccells. J Biol Chem 1982, 257(11):6373-6379.
22. Dinan L: Phytoecdysteroids: biological aspects. Phytochemistry 2001,57(3):325-339.
23. Bonner JJ, Pardue ML: Polytene chromosome puffing and in situhybridization measure different aspects of RNA metabolism. Cell 1977,12(1):227-234.
24. Bonner J, Pardue M: Ecdysone-Stimulated RNA Synthesis in SalivaryGlands of Drosophila melanogaster: Assay by in Situ Hybridization. Cell1977, 12:219-225.
25. Cherbas L, Yonge C, Cherbas P, Williams C: The morphological response ofKc-H cells to ecdysteroids: Hormonal specificity. Dev Genes Evol 1980,189(1):1-15.
26. Courgeon AM: Action of insect hormones at the cellular level.Morphological changes of a diploid cell line of Drosophila melanogaster,treated with ecdysone and several analogues in vitro. Exp Cell Res 1972,74(2):327-336.
27. Courgeon AM: Effects of - and -ecdysone on in vitro diploid cellmultiplication in Drosophila melanogaster. Nature New Biology 1972,238(86):250-251.
28. Cherbas P, Cherbas L, Savakis C, Koehler M: Ecdysteroid-Responsive Genesin a Drosophila Cell Line 1. Integrative and Comparative Biology 1981.
29. Savakis C, Demetri G, Cherbas P: Ecdysteroid-inducible polypeptides in aDrosophila cell line. Cell 1980, 22(3):665-674.
30. Savakis C, Koehler M, Cherbas P: cDNA clones for the ecdysone-induciblepolypeptide (EIP) mRNAs of Drosophila Kc cells. EMBO J 1984,3(1):235-243.
31. Andres AJ, Cherbas P: Tissue-specific ecdysone responses: regulation ofthe Drosophila genes Eip28/29 and Eip40 during larval development.Development 1992, 116(4):865-876.
32. Gauhar Z, Sun LV, Hua S, Mason CE, Fuchs F, Li TR, Boutros M, White KP:Genomic mapping of binding regions for the Ecdysone receptor proteincomplex. Genome Research 2009, 19(6):1006-1013.
33. Clever U: Actinomycin and Puromycin: Effects on Sequential GeneActivation by Ecdysone. Science 1964, 146:794-795.
34. Cakouros D, Daish TJ, Kumar S: Ecdysone receptor directly binds thepromoter of the Drosophila caspase dronc, regulating its expression inspecific tissues. J Cell Biol 2004, 165(5):631-640.
35. Jiang C, Lamblin AF, Steller H, Thummel CS: A steroid-triggeredtranscriptional hierarchy controls salivary gland cell death duringDrosophila metamorphosis. Molecular Cell 2000, 5(3):445-455.
36. Dorstyn L, Colussi PA, Quinn LM, Richardson H, Kumar S: DRONC, anecdysone-inducible Drosophila caspase. Proceedings of the NationalAcademy of Sciences USA 1999, 96(8):4307-4312.
37. Cakouros D, Daish T, Martin D, Baehrecke EH, Kumar S: Ecdysone-inducedexpression of the caspase DRONC during hormone-dependentprogrammed cell death in Drosophila is regulated by Broad-Complex. JCell Biol 2002, 157(6):985-995.
38. Karim FD, Thummel CS: Temporal coordination of regulatory geneexpression by the steroid hormone ecdysone. EMBO J 1992,11(11):4083-4093.
39. Andrulis ED, Werner J, Nazarian A, Erdjument-Bromage H, Tempst P, Lis JT:The RNA processing exosome is linked to elongating RNA polymerase IIin Drosophila. Nature 2002, 420(6917):837-841.
40. Mouillet JF, Henrich VC, Lezzi M, Vögtli M: Differential control of geneactivity by isoforms A, B1 and B2 of the Drosophila ecdysone receptor.Eur J Biochem 2001, 268(6):1811-1819.
41. Cherbas L, Willingham A, Zhang D, Yang L, Zou Y, Eads BD, Carlson JW,Landolin JM, Kapranov P, Dumais J, et al: The transcriptional diversity of25 Drosophila cell lines. Genome Research 2011, 21(2):301-314.
42. Holz A, Bossinger B, Strasser T, Janning W, Klapper R: The two origins ofhemocytes in Drosophila. Development 2003, 130(20):4955-4962.
43. Berger EM, Morganelli CM: Drosophila cells and ecdysterone: a modelsystem for gene regulation. In vitro 1984, 20(12):959-974.
44. Schubiger M, Tomita S, Sung C, Robinow S, Truman JW: Isoform specificcontrol of gene activity in vivo by the Drosophila ecdysone receptor.Mechanisms of Development 2003, 120(8):909-918.
45. Costantino BFB, Bricker DK, Alexandre K, Shen K, Merriam JR, Antoniewski C,Callender JL, Henrich VC, Presente A, Andres AJ: A novel ecdysonereceptor mediates steroid-regulated developmental events during themid-third instar of Drosophila. PLoS Genetics 2008, 4(6):e1000102.
46. Andres AJ, Thummel CS: Methods for quantitative analysis oftranscription in larvae and prepupae. Methods in Cell Biology 1994,44:565-573.
47. Bonner JJ: Induction of Drosophila heat-shock puffs in isolated polytenenuclei. Developmental Biology 1981, 86(2):409-418.
48. Myohara M, Okada M: Induction of ecdysterone-stimulated chromosomalpuffs in permeabilized Drosophila salivary glands: A new method forassaying the gene-regulating activity of cytoplasm. Developmental Biology1987, 122(2):396-406.
49. Neal SJ, Gibson ML, So AK-C, Westwood JT: Construction of a cDNA-basedmicroarray for Drosophila melanogaster: a comparison of genetranscription profiles from SL2 and Kc167 cells. Génome 2003,46(5):879-892.
50. Neal SJ, Westwood JT: Optimizing experiment and analysis parametersfor spotted microarrays. Methods in Enzymology 2006, 410:203-221.
Gonsalves et al. BMC Genomics 2011, 12:475http://www.biomedcentral.com/1471-2164/12/475
Page 15 of 16

51. Tusher VG, Tibshirani R, Chu G: Significance analysis of microarraysapplied to the ionizing radiation response. Proceedings of the NationalAcademy of Sciences USA 2001, 98(9):5116-5121.
52. Saeed AI, Sharov V, White J, Li J, Liang W, Bhagabati N, Braisted J, Klapa M,Currier T, Thiagarajan M, et al: TM4: a free, open-source system formicroarray data management and analysis. BioTechniques 2003,34(2):374-378.
53. Pfaffl MW: A new mathematical model for relative quantification in real-time RT-PCR. Nucleic Acids Research 2001, 29(9):e45.
54. Dennis G, Sherman BT, Hosack DA, Yang J, Gao W, Lane HC, Lempicki RA:DAVID: Database for Annotation, Visualization, and Integrated Discovery.Genome Biology 2003, 4(5):P3.
55. Huang DW, Sherman BT, Lempicki RA: Systematic and integrative analysisof large gene lists using DAVID bioinformatics resources. Nature Protocols2009, 4(1):44-57.
doi:10.1186/1471-2164-12-475Cite this article as: Gonsalves et al.: Genome-wide examination of thetranscriptional response to ecdysteroids 20-hydroxyecdysone andponasterone A in Drosophila melanogaster. BMC Genomics 2011 12:475.
Submit your next manuscript to BioMed Centraland take full advantage of:
• Convenient online submission
• Thorough peer review
• No space constraints or color figure charges
• Immediate publication on acceptance
• Inclusion in PubMed, CAS, Scopus and Google Scholar
• Research which is freely available for redistribution
Submit your manuscript at www.biomedcentral.com/submit
Gonsalves et al. BMC Genomics 2011, 12:475http://www.biomedcentral.com/1471-2164/12/475
Page 16 of 16
Copyright © 2022 FDOKUMEN