Odour avoidance learning in the larva of Drosophila melanogaster
Upload
independentCategory
view
0download
0
doi: 10.1098/rspb.2004.2880, 2267-2273271 2004 Proc. R. Soc. Lond. B
J. M. Drnevich, M. M. Reedy, E. A. Ruedi, S. Rodriguez-Zas and K. A. Hughes melanogaster
Drosophilaexpression and male reproductive success in Quantitative evolutionary genomics: differential gene
Referenceshttp://rspb.royalsocietypublishing.org/content/271/1554/2267#related-urls
Article cited in:
Email alerting service hereright-hand corner of the article or click Receive free email alerts when new articles cite this article - sign up in the box at the top
http://rspb.royalsocietypublishing.org/subscriptions go to: Proc. R. Soc. Lond. BTo subscribe to
This journal is © 2004 The Royal Society
on May 23, 2011rspb.royalsocietypublishing.orgDownloaded from
on May 23, 2011rspb.royalsocietypublishing.orgDownloaded from
�Author for correspondence ([email protected]).
Proc. R. Soc. Lond.B (2004) 271, 2267–2273 2267doi:10.1098/rspb.2004.2880
Received 9 July 2004
Accepted 26 July 2004
Published online 20October 2004
Quantitative evolutionary genomics: differential geneexpression andmale reproductive success inDrosophilamelanogaster
JennyM.Drnevich1�,MelissaM. Reedy1, Elizabeth A. Ruedi3,Sandra Rodriguez-Zas2 andKimberly A.Hughes1,3
1School of Integrative Biology, 2Department of Statistics and Department of Animal Science, and 3Program in Ecology and
Evolutionary Biology, University of Illinois, Urbana, IL 61801, USA
We combined traditional quantitative genetics and oligonucleotide microarrays to examine within-
population genetic variation in a trait closely related to fitness. The trait, male reproductive success under
competitive conditions (MCRS), is of central importance to both life-history and sexual-selection theory.
We identified 27 candidate genes whose expression levels were associated with within-population variation
in MCRS. ‘High’ MCRS was associated with low expression of a cytochrome P450 that causes pesticide
resistance, suggesting a fitness cost to resistance. Two groups of metabolic proteins (glutathione transferases
and phosphatases) were significantly over-represented, and a large portion of the candidates are genes
involved in oxidative stress resistance, energy acquisition or energy storage. Genes expressed in accessory
glands and testes were not over-represented among differentially expressed genes, but testis-expressed genes
were significantly more likely to be upregulated in highMCRS genotypes. Finally, nine candidate genes that
we identified had no previous functional annotation, and this experiment suggests that they play a role in
male reproductive success.
Keywords:microarrays; gene expression; male mating success; quantitative genetics;Cyp6g1; antioxidants
1. INTRODUCTIONTwo of the central questions in evolutionary genetics are:
how much genetic variation exists within populations and
how is that variation maintained (Lewontin 1974; Charles-
worth 1987; Barton & Turelli 1989; Lynch et al. 1998;
Charlesworth & Hughes 2000)? These questions are
especially difficult to answer for polygenic (quantitative)
traits, because the genes contributing to the variation are
not usually known. The traditional approach to the ques-
tion has been to use breeding experiments (artificial selec-
tion or analysis of individuals of known relatedness) to
measure additive, non-additive and non-genetic compo-
nents of phenotypic variation. Parameters derived from
these experiments can be used to test some models of the
maintenance of genetic variation (cf. Houle et al. 1996;
Lynch et al. 1998; Charlesworth & Hughes 2000; Hughes
et al. 2002). However, the traditional tools of quantitative
genetics are not very useful for measuring the numbers of
genes that contribute to trait variation, for identifying
candidate genes or for elucidating the molecular mechan-
isms that underlie the variation (Toma et al. 2002).
Integration of molecular approaches and quantitative
genetics has enormous power to address these funda-
mental questions (Jansen 2003). Microarray experiments
measure the level of messenger RNA (mRNA) abun-
dance (gene expression) of thousands of genes at once
by using either the entire transcribed sequence of each
gene (complementary DNA arrays) or unique 25–70 bp
regions (oligonucleotide arrays) as probes. Microarray
experiments can be used to discover ‘candidate’ genes,
those that have transcriptional differences associated
with trait variation, and to assess molecular mechanisms
that underlie variation. This genomic molecular tech-
nique has been advocated as a tool for identifying candi-
date genes for quantitative variation; it can be especially
useful for identifying (and simultaneously suggesting
functions for) genes with no previous functional anno-
tation (Gibson 2002).
Although microarrays have many advantages, they also
have limitations that should be kept in mind. Microarrays
indicate which genes are differentially expressed, but those
genes may or may not contain DNA sequence variation
(polymorphism) that causes genetic variation. Expression
variation can be caused by sequence variation in a different
gene, and tracing regulatory pathway connections can be
difficult (Montooth et al. 2003). However, sequence vari-
ation in the regulatory region of a gene can lead to differen-
tial expression of that gene, and such regulatory
polymorphism may play an important role in evolution
(Townsend et al. 2003). A recent analysis of both mice and
maize indicates that transcriptional variation can often be a
result of polymorphism in the gene itself (Schadt et al.
2003).
That microarrays can be used to directly identify candi-
date genes for complex phenotypes was recently illustrated
by a study of behavioural variation in Drosophila melanoga-
ster. Toma et al. (2002) identified candidate genes for loco-
motor behaviour in strains of flies selected for
positive and negative geotaxis. The causal relationship
between expression of the candidates and geotaxis was
cconfirmed using mutant and transgenic lines. Thus, can-
#2004The Royal Society
2268 J.M. Drnevich and others Gene expression and male fitness
on May 23, 2011rspb.royalsocietypublishing.orgDownloaded from
didate genes were identified directly, without complex
crosses and mapping experiments. Microarrays have also
been used to detect candidate genes within chromosomal
regions identified by linkage analysis (Wayne & McIntyre
2002; Tabakoff et al. 2003).
The above studies used microarrays to identify candi-
dates for differences between selection lines or inbred lines.
So far, only a few studies have used this technique to study
within-population variation on a genomic scale. Townsend
et al. (2003) found widespread differences in gene
expression among natural isolates of Saccharomyces cerevi-
siae, and reported that much of the variation was poten-
tially important to fitness. Bochdanovits et al. (2003)
measured expression differences in D. melanogaster that
correlated with geographical variation and developmental
plasticity in body size. They found 19 genes that varied
significantly with latitudinal and temperature-induced
variation in adult size. The studies of Townsend et al.
(2003) and Bochdanovits et al. (2003) demonstrate that
microarray experiments are sensitive enough to detect
meaningful within-population variation. A critical question
remaining is whether the technique can be used to identify
genes associated with segregating genetic variation within
populations.
Here, we describe quantitative genetic and microarray
experiments that examine within-population genetic vari-
ation in a trait closely related to fitness. We evaluated geno-
types of D. melanogaster that were derived from a single
population and were known to differ in male reproductive
success under competitive conditions (MCRS). Because
MCRS is a major component of male fitness, identifying
and understanding genes causing variation is of central
importance to both life-history theory (Hughes 1995;
Cordts & Partridge 1996; Prowse & Partridge 1997) and
sexual-selection theory (Rowe & Houle 1996; Wyckoff et
al. 2000; Agrawal 2001; Kotiaho et al. 2001; Houle &
Kondrashov 2002).We found that microarray analysis pro-
vided an efficient means of identifying candidate genes for
MCRS. One candidate gene is known to cause pesticide
resistance and other forms of stress resistance, and our
results suggest that increased resistance leads to decreased
male fitness in the absence of pesticides. Functional classi-
fication of the other candidate genes indicated that two
groups of metabolic proteins were over-represented and
that variation in oxidative stress resistance, energy acqui-
sition and energy storage are correlated with MCRS.
Finally, nine candidates were predicted genes without pre-
vious functional annotation, and our results suggest that
they are involved in a male’s ability to reproduce under
competitive conditions.
2. METHODS(a) Experimental organisms
We created 14 lines that were isogenic for the II and III chromo-
somes from a large, randomly mating, laboratory adapted popu-
lation ofD. melanogaster (the Ives population). Additionally, the X
chromosomes in the lines were isogenic for (on average) 50% of
the loci, and were segregating for at most two alleles at the remain-
der of the loci; any residual X-linked variation would contribute to
within-line variance and would increase the error variance in
ANOVAmodels (see Hughes et al. (2002) for detailed description
of the crosses). To examine the genetic variation from the Ives
Proc. R. Soc. Lond.B (2004)
population represented among these lines, we made full diallel
crosses among subsets of them. Diallel 1 consisted of all possible
crosses among 10 different lines, yielding 90 different wild-type
non-inbred genotypes and 10 inbred genotypes. Diallel 2 was
made using four of the lines used in diallel 1 and four additional
isogenic lines (these lines were not chosen on the basis of their
effects on male fitness), producing 56 different non-inbred geno-
types and eight inbred genotypes. Four (diallel 1) or nine (diallel
2) replicate crosses were made per genotype from two (diallel 1) or
three (diallel 2) different sets of parents. To minimize any
maternal and/or density effects on fitness we conducted two gen-
erations of controlled-density rearing. First, within each isogenic
line, we set up eight-dram vials with seven males and seven
females; we then collected virgin offspring to be the parents for the
diallel crosses. Second, the F1 offspring from the diallel crosses
were raised at a constant larval density of 25 per vial and collected
as virgins to be used as the experimental males in the MCRS
assay.
For each replicate cross of each genotype, we measured MCRS
by placing three virgin experimental males (wild-type) together in
a vial with three virgin ebony (e/e) males and three virgin e/e
females. Ebony flies were all 3 days old and had been reared at con-
stant adult density from an outbred stock derived from the Ives
population, in which the ebony mutation arose spontaneously.
Because the ebony females were genetically diverse, MCRS mea-
sured the average success of each male genotype over many differ-
ent female genotypes. Wild-type and e/e flies were left together in
the vial for 7 days, after which the adult flies were discarded. Ten
days later, all progeny emerging from the vials were counted and
scored for phenotype. Any wild-type offspring were the progeny of
the wild-type males; ebony offspring were the progeny of e/emales.
Offspring were counted 17 days after the experimental flies were
introduced into the vials to maximize the number of F1 offspring
counted, while avoiding inclusion of any F2 offspring (9 days is the
minimum egg-adult development time in this population at
25 �C).
MCRS values for each genotype were calculated as the least-
square means from a linear mixed model that included genotype,
block and replicate within block. To assess differences in gene
expression associated with MCRS, we chose three genotypes with
consistently high MCRS (H genotypes) and three genotypes with
consistently low MCRS (L genotypes) from the non-inbred geno-
types. Thus the H and L genotypes differed in total male repro-
ductive output over a 7 day period. The potential for differences in
offspring larval viability to bias MCRS values was independently
assessed by mating additional experimental males from each H
and L genotype to virgin e=e females and raising 60þ=e larvae with
60 e/e larvae per vial, eight vials per genotype, which approximated
the larval density in the MCRS assay. No significant variation in
larval viability was detected (F5, 42 ¼ 1:73; p ¼ 0:15); any true
larval viability differences undetectable by our assay (i.e. power of
less than 80%) could only account for, at most, 12% of the differ-
ences in MCRS values between the H and L genotypes. Thus,
variation in MCRS reflected variation in adult male reproductive
success, and not variation in offspring viability.
The H and L genotypes also met the following requirements: (i)
low standard error among replicates; and (ii) no significant differ-
ence between MCRS in reciprocal genotypes; the genotype pro-
duced by crossing line X females to line Y males is the reciprocal
of the genotype produced by crossing line Y females by line X
males. Only two of the genotypes shared an isogenic parental line;
however, one was an H genotype, and one was an L genotype.

Gene expression and male fitness J. M. Drnevich and others 2269
on May 23, 2011rspb.royalsocietypublishing.orgDownloaded from
Therefore, sharing of a parent would not have contributed to an
association betweenMCRS category and gene expression.
Subsequent to the experiment, we discovered that our Ives
population carries the Wolbachia endosymbiont, which can cause
weak cytoplasmic incompatibility (i.e. reduced hatching success)
in D. melanogaster when infected males mate with uninfected
females (Hoffmann 1988; Hoffmann et al. 1994). Although three
parental isogenic lines from diallel 2 were later found to lack the
endosymbiont, none of the genotypes created from these lines was
used in the microarray study because they did not rank among the
highest or lowest for MCRS. Thus, all experimental and ebony
flies in the microarray analysis had Wolbachia and therefore
incompatibility should not have contributed to among-genotype
variation.
(b) Messenger RNA expression assays
Tissue for mRNA extraction was collected from flies that had
experienced exactly the same protocol used for measuring the
MCRS phenotype. Three sets of three males were pooled per
replicate, and two independent replicates were made per geno-
type. Flies were anaesthetized under light CO2 and snap-frozen in
liquid nitrogen. Total RNA was extracted using the standard
TRIzol protocol (TRIzol Reagent, Life Technologies), and absor-
bance of RNA was checked at 260 and 280nm for determination
of sample concentration and purity; A260/A280 was between 1.9
and 2.1 for each sample. We checked for integrity of the total
RNA by visualizing the bands on a 0.8% agarose gel stained with
SYBR Gold (Molecular Probes). mRNA was labelled using the
MessageAmp aRNA kit (Ambion) and biotintylated ribonucleo-
tides (Enzo Biochemicals); we followed the standard protocol
(MessageAmp2 manual, v. 0201), except we precipitated the
double-stranded cDNA by adding 0.5 vol of 5M NH4OAc and
2.5 vol of 100% ethanol. We checked the quality of the labelled
mRNA both before and after fragmentation by gel electrophoresis
as above.
Drosophila melanogaster GeneChip Arrays contain 14 probe
pairs per gene for most genes, with a perfect match (PM) and a
mismatch (MM) probe in each pair. Labelled complementary
RNA was hybridized to Affymetrix GeneChip arrays using the
University of Illinois Keck Center Affymetrix System. In pilot stu-
dies, we estimated the variance in expression levels from labelling
and hybridizing using three sets of replicate aliquots from three
independent pools of RNA; two aliquots of the same total RNA
were independently labelled and hybridized to two different arrays
(two sets of two aliquots), and a single aliquot of labelled RNA
was hybridized to two different arrays. Basic statistical analysis of
replicated chips using quantile-normalized PM values (Irizarry
et al. 2002; Bolstad et al. 2003) indicated that our methods of
labelling and hybridization generate little between-sample error
(Pearson correlation coefficients: 0.994, 0.998 and 0.996,
respectively; paired t-tests for differential gene expression: 99.4%,
99.9% and 99.7% of genes not significantly different). Addition-
ally, all positive controls on the arrays were ‘present’ (PM > MM,
paired t-test, one-sided p < 0:05) whereas none of the negative
controls was present.
(c) Microarray data analysis
Each independent replicate was hybridized to a chip, and two
replicates were made per genotype. To account for sources of
non-biological variation between arrays, we normalized the PM
and MM probes for all arrays using the quantile method (Irizarry
et al. 2002; Bolstad et al. 2003). Not all of the 13 966 genes on the
GeneChip will be expressed in adult males, therefore we tested
Proc. R. Soc. Lond.B (2004)
each gene for presence of mRNA comparing every PM value to its
complementary MM value in a paired t-test (one-tailed) that
included all the probe pairs from either the H or the L genotype
arrays; genes with p < 0:05 were considered significantly present.
We excluded a gene if it was not significantly present on either the
H arrays or L arrays; 9870 genes were present on at least one set of
arrays and were analysed for differential expression.
To determine if mRNA expression differed significantly
between H and L genotypes, we fitted a linear mixed-model to
log2-transformed, normalized PM values (Chu et al. 2002) using
SAS (release 8.02) PROCMIXED (Littell et al. 2002). The model
was:
log2(PM) ¼ C þG(C)þ P þ C�P þG(C)�P þ Aþ e,
where C is the category (H or L MCRS); G is genotype nested
within category; P is the PM probe (14 per gene); A is the
(random) array effect; and e is the residual error. We calculated
external Studentized residuals from the fitted model and removed
outliers where this value was greater than 4.0; 12 182 of 1 655 928
(0.7%) probe intensity values were removed as outliers. We then
fitted the model to the remaining data. Significant association of
mRNA expression with phenotype was given by the p-value of the
category contrast (H versus L) calculated from the model. We
controlled for multiple hypothesis testing by adjusting the expec-
ted number of false positives (the per-family error rate so that only
one false positive was expected in a list of candidate genes (Ge et
al. 2003)). At a nominal p-value of 0.0001, about one false posi-
tive was expected when conducting 9870 statistical tests: false
positive discovery rate¼ 9870�(0:0001) ¼ 0:99. Genes that met
this criterion were also subjected to permutation tests to confirm
the level of significance. For each gene, the probe level data were
randomly permuted across the line and category effects, while
retaining the appropriate ‘probe’ value (50 000 iterations). All
genes with parametric p-values of less than 0.0001 also had per-
mutation p-values of less than 0.0001. We also analysed gene
expression in the H and L genotypes from each diallel separately
to determine the robustness of candidate gene identification.
3. RESULTSThe difference in MCRS values between H and L geno-
types was highly significant (F1, 22 ¼ 33:6, p < 0:0001;table 1). Figure 1 shows the mean difference in gene
expression between H and L genotypes on the log2 scale
(‘effect size’) plotted against the statistical significance of
the test for differential expression; effect size is equivalent
to log2(fold-change). Such plots have been called ‘volcano
plots’ (Gibson 2002). The figure illustrates that significant
differences were found across a wide range of effect sizes
rather than being restricted to only the largest effect sizes.
Twenty-seven genes were differentially expressed
( p < 0:0001), with only one false positive expected (table
2). The largest significant effect size was ca. 1 (twofold
difference) in expression between H and L genotypes.
Most of the significant differences in expression were less
than 50%. Overall, more genes had higher expression (18)
in H genotypes than lower expression (9), but this trend
was not significant (two-tailed binomial test for deviation
from equal occurrence, p ¼ 0:122). When the two diallels
were analysed separately, 14 out of the 27 genes were sig-
nificant in both diallels ( p < 0:05). These genes are indi-
cated in bold in table 2.
The gene with the highest level of significance and
second-largest effect size was a cytochrome P450 (Cyp6g1).

2270 J.M. Drnevich and others Gene expression and male fitness
on May 23, 2011rspb.royalsocietypublishing.orgDownloaded from
Over-expression of Cyp6g1 confers broad resistance to a
variety of insecticides (Le Goff et al. 2003). In our popu-
lation, males with greater expression of Cyp6g1 had low
MCRS, suggesting a fitness cost to over-expression.
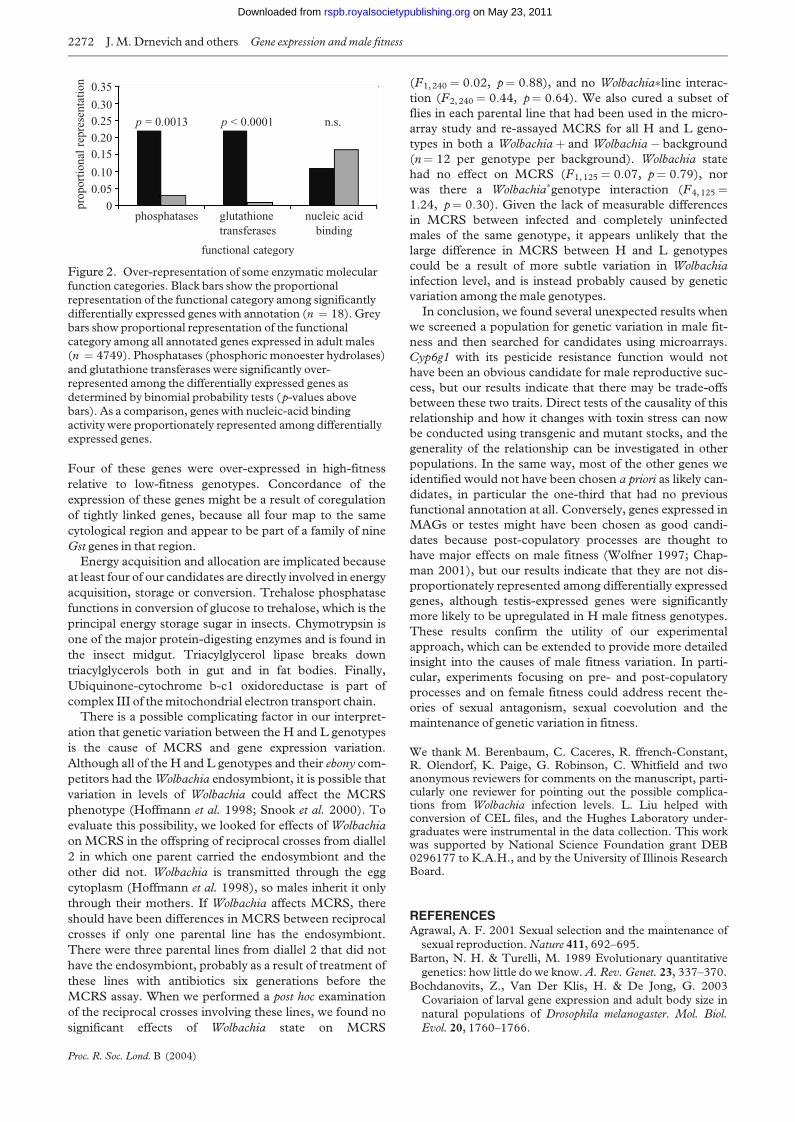
Phosphoric monoester hydrolases (phosphatases) and
glutathione transferases (Gst) were significantly over-
represented compared with their frequency among genes
expressed in adult males (figure 2). Both classes of genes
showed complete concordance of their effects, with all four
Gst genes being expressed more in H MCRS genotypes,
and all four phosphatases being expressed less in the H
genotypes.
Genes expressed in male reproductive tissues are
thought to strongly affect male fitness (Wolfner 1997;
Chapman 2001), and therefore might be expected to be
over-represented among our candidates. To test this
assumption, we first compared our genes with a list of
testes-expressed genes from a comprehensive expressed
sequence tag database search reported by Boutanaev et al.
(2002). Twelve out of the 27 candidate genes are expressed
in testes (table 2, right-most column). The relative pro-
portion of testes-expressed genes was not significantly dif-
ferent from their proportional representation in adult males
(proportion in adults ¼ 3270=9870 ¼ 0:331; proportion
among significant genes ¼ 12=27 ¼ 0:444, two-tailed
binomial test p ¼ 0:61). However, all but one of the genes
expressed in testes were upregulated in the H genotypes.
This was a significant deviation from the overall proportion
of upregulated versus downregulated genes (hypergeo-
metric probability, p¼ 0:018). We then compared our can-
didate genes with a list of genes expressed in male accessory
glands (MAG), which produce seminal fluid. This list was
derived from a single-chip experiment in which we hybri-
dized mRNA from 10 pairs of MAGs dissected from Ives
males. Comparison of log-transformed PM and MM
values showed that of the 9870 genes expressed in adult
males, 4060 genes were significantly expressed in MAGs
(one-tailed paired t-tests; p < 0:05). Among our differen-
tially expressed genes, seven were expressed in MAGs
(table 2, right-most column). The relative proportion of
MAG-expressed genes was not significantly different from
their proportional representation in adult males (pro-
portion in adult males ¼ 4060=9870 ¼ 0:41; proportion
among significant genes ¼ 7=27 ¼ 0:26, two-tailed
binomial probability of seven or fewer ¼ 0:078); five out of
seven genes expressed in MAGs were upregulated in H
genotypes (hypergeometric p¼ 0:59).
Proc. R. Soc. Lond.B (2004)
4. DISCUSSIONWe have shown that quantitative-genetic microarray
experiments can provide a powerful and straightforward
way to identify candidate genes contributing to heritable
fitness variation. Working with genotypes representing
natural variation from a single population, we identified a
moderate number of genes with transcriptional variation
significantly associated with male fitness variation. The
approach was very sensitive, detecting expression-level
differences of less than 15%. Such sensitivity is necessary,
because heritable transcriptional variation maintained
within a randomly mating population is likely to be subtle.
The gene with the most significant effect on MCRS was
a cytochrome P450 (Cyp6g1) that confers insecticide resist-
ance when upregulated (Daborn et al. 2001, 2002;
Le Goff et al. 2003). Our results indicate that modest
(twofold) upregulation of this gene is associated with
L MCRS in the absence of insecticides, suggesting a trade-
off between insecticide resistance and male fitness.
More generally, there might be a trade-off between stress
resistance and male fitness, which could explain the
maintenance of genetic variation in the Ives population.
Daborn et al. (2002) reported that a transposable
element insertion in the promoter region of Cyp6g1 was
completely associated with upregulation of the gene and
dichlorodiphenyltrichloroethane (DDT) resistance in a
worldwide collection of D. melanogaster. This pattern indi-
cates that the DNA sequence variation within the regulat-
ory region of the gene itself (cis regulation) is probably
responsible for transcriptional variation and DDT resist-
ance. We are currently investigating whether there is a
causal link between Cyp6g1 allelic variation and MCRS in
the Ives population.
Our results also implicate oxidative stress resistance and
energy acquisition and allocation as important factors in
male reproductive success. Gst-E genes are thought to be
involved in resistance to oxidative stress (Sawicki et al.
2003), specifically in the metabolism of lipid peroxidation.
Table 1. H and LMCRS genotypes.
category
dam sire estimatea s.e.m. nbH
7d 12b 1.3571 0.1411 4 H 14a 5e 1.3102 0.1411 4 H 3b 10c 1.1551 0.09410 9 L 10c 8b 0.6924 0.1411 4 L 4e 9a 0.6700 0.09410 9 L 15c 11f 0.4252 0.1996 4a
Least-square means ofMCRS values standardized to a mean of 1.b
Number of replicate crosses.
10–16
10–12
10–8
10–4
100
prob
abil
ity
–1.5 –1.0 –0.5 0 0.5 1.0 1.5effect size
Figure 1. ‘Volcano plot’ of microarray results. The p-value ofthe ‘category’ contrast is plotted against the effect size of thecontrast (average expression in H genotypes minus averageexpression in L genotypes). Negative values on the x-axisrepresent genes for which L genotypes had higher mRNAexpression than did H genotypes, and vice versa. The y-axisshows the p-value on a logarithmic scale. The dashed line at
p¼ 10�4 shows the cut-off for genes considered significantlydifferently expressed in this study.

Table
2.Listofcandidate
gen
eswhose
expressiondifferedbetweenH
andLM
CRSgen
otypes.M
olecu
larfunctionsweretaken
from
thegen
eontologyterm
sforthegen
eslisted
onthe
Affymetrix(w
ww.affymetrix.com)andFlybase
(flybase.bio.indiana.edu)databases.
gen
ename/ID
aeffect
size
bs.e.m.
d.f.
tp<
locationc
molecu
larfunction
(knownorinferred
)M
/Td
Cyp6g1
�1.03
0.089
128
11.5
1�10�15
2R,48E7
cytoch
romeP450
M
GstE
50.34
0.035
130
9.5
1�10�15
2R,55C7
glutathionetransferase
M
CG18030
�1.06
0.140
128
7.6
1�10�11
3R,99F6
chymotrypsin
CG6271
0.51
0.082
126
6.2
1�10�8
3R,97D14
triacylglycerollipase
T
CG9449
�0.21
0.035
128
6.0
1�10�7
3L,76B5
acidphosphatase
CG4375
0.24
0.042
128
5.9
1�10�7
2L,21E2
T
Tkr
0.22
0.038
130
5.8
1�10�7
2R,60F3-5
DNAbinding
Pcd
0.19
0.036
128
5.2
1�10�6
3R,99B9
4a-hydroxytetrahydrobiopterindeh
ydratase
CG11699
�0.21
0.042
130
5.1
1�10�5
X,10C7
M
CG11334
�0.15
0.034
128
4.5
2�10�5
3R,100B8
translationinitiationfactor;
protein
biosynthesis
T
CG1561
0.17
0.038
130
4.4
2�10�5
X,10C9
rab3-GAP
0.32
0.073
128
4.4
3�10�5
2L,33C-2
RABGTPase
activator
M,T
CG14391
0.24
0.056
128
4.3
3�10�5
3R,87C5
T
CG3875
0.28
0.066
108
4.3
4�10�5
2R,58F4
nucleicacidbinding;ubiquinonebiosynthesis
T
GstE8
0.20
0.046
128
4.3
4�10�5
2R,55C7-8
glutathionetransferase
CG2680
�0.17
0.041
130
4.2
5�10�5
3L,78F2-3
4-nitrophen
ylphosphatase
CG13309
�0.50
0.119
128
4.2
5�10�5
3L,66E1
CG5693
0.15
0.036
128
4.2
6�10�5
2L,36D2
T
CG2113
0.20
0.049
128
4.2
6�10�5
3L,63A2
T
CG2241
0.25
0.060
130
4.2
6�10�5
3R,99F9-10
ATPase
activity
T
CG3290
�0.50
0.122
128
4.1
7�10�5
2R,58D1
alkalinephosphatase
GstE
60.30
0.075
128
4.0
1�10�4
2R,55C7
glutathionetransferase
M
GstE1
0.71
0.175
128
4.0
1�10�4
2R,55C6
glutathionetransferase
M,T
CG15200
0.20
0.050
128
4.0
1�10�4
X,10A10
T
CG16741
0.19
0.047
130
4.0
1�10�4
2R,56F17
M,T
CG5171
�0.14
0.036
130
4.0
1�10�4
2L,27F5
treh
alose
phosphatase
activity
CG17856
0.15
0.038
128
3.9
1�10�4
3R,98C3
ubiquinol-cytoch
romecreductase
a
Bold
type,significantin
both
diallelswhen
analysedseparately.
b
Meandifference
inmRNAabundance
betweenH
andLgen
otypes
onthelog2scale(equivalentto
log2[fold-change]).
c
Chromosomearm
andcytologicalposition.
d
Tissue-specificexpression:M
,M
AG;T,testis(see
textforexplanation).
Gene expression and male fitness J. M. Drnevich and others 2271
Proc. R. Soc. Lond.B (2004)
on May 23, 2011rspb.royalsocietypublishing.orgDownloaded from
2272 J.M. Drnevich and others Gene expression and male fitness
on May 23, 2011rspb.royalsocietypublishing.orgDownloaded from
Four of these genes were over-expressed in high-fitness
relative to low-fitness genotypes. Concordance of the
expression of these genes might be a result of coregulation
of tightly linked genes, because all four map to the same
cytological region and appear to be part of a family of nine
Gst genes in that region.
Energy acquisition and allocation are implicated because
at least four of our candidates are directly involved in energy
acquisition, storage or conversion. Trehalose phosphatase
functions in conversion of glucose to trehalose, which is the
principal energy storage sugar in insects. Chymotrypsin is
one of the major protein-digesting enzymes and is found in
the insect midgut. Triacylglycerol lipase breaks down
triacylglycerols both in gut and in fat bodies. Finally,
Ubiquinone-cytochrome b-c1 oxidoreductase is part of
complex III of themitochondrial electron transport chain.
There is a possible complicating factor in our interpret-
ation that genetic variation between the H and L genotypes
is the cause of MCRS and gene expression variation.
Although all of the H and L genotypes and their ebony com-
petitors had theWolbachia endosymbiont, it is possible that
variation in levels of Wolbachia could affect the MCRS
phenotype (Hoffmann et al. 1998; Snook et al. 2000). To
evaluate this possibility, we looked for effects of Wolbachia
on MCRS in the offspring of reciprocal crosses from diallel
2 in which one parent carried the endosymbiont and the
other did not. Wolbachia is transmitted through the egg
cytoplasm (Hoffmann et al. 1998), so males inherit it only
through their mothers. If Wolbachia affects MCRS, there
should have been differences in MCRS between reciprocal
crosses if only one parental line has the endosymbiont.
There were three parental lines from diallel 2 that did not
have the endosymbiont, probably as a result of treatment of
these lines with antibiotics six generations before the
MCRS assay. When we performed a post hoc examination
of the reciprocal crosses involving these lines, we found no
significant effects of Wolbachia state on MCRS
Proc. R. Soc. Lond.B (2004)
(F1, 240 ¼ 0:02, p¼ 0:88), and no Wolbachia�line interac-
tion (F2, 240 ¼ 0:44, p¼ 0:64). We also cured a subset of
flies in each parental line that had been used in the micro-
array study and re-assayed MCRS for all H and L geno-
types in both a Wolbachiaþ and Wolbachia� background
(n¼ 12 per genotype per background). Wolbachia state
had no effect on MCRS (F1, 125 ¼ 0:07, p¼ 0:79), nor
was there a Wolbachia�genotype interaction (F4, 125 ¼1:24, p¼ 0:30). Given the lack of measurable differences
in MCRS between infected and completely uninfected
males of the same genotype, it appears unlikely that the
large difference in MCRS between H and L genotypes
could be a result of more subtle variation in Wolbachia
infection level, and is instead probably caused by genetic
variation among themale genotypes.
In conclusion, we found several unexpected results when
we screened a population for genetic variation in male fit-
ness and then searched for candidates using microarrays.
Cyp6g1 with its pesticide resistance function would not
have been an obvious candidate for male reproductive suc-
cess, but our results indicate that there may be trade-offs
between these two traits. Direct tests of the causality of this
relationship and how it changes with toxin stress can now
be conducted using transgenic and mutant stocks, and the
generality of the relationship can be investigated in other
populations. In the same way, most of the other genes we
identified would not have been chosen a priori as likely can-
didates, in particular the one-third that had no previous
functional annotation at all. Conversely, genes expressed in
MAGs or testes might have been chosen as good candi-
dates because post-copulatory processes are thought to
have major effects on male fitness (Wolfner 1997; Chap-
man 2001), but our results indicate that they are not dis-
proportionately represented among differentially expressed
genes, although testis-expressed genes were significantly
more likely to be upregulated in H male fitness genotypes.
These results confirm the utility of our experimental
approach, which can be extended to provide more detailed
insight into the causes of male fitness variation. In parti-
cular, experiments focusing on pre- and post-copulatory
processes and on female fitness could address recent the-
ories of sexual antagonism, sexual coevolution and the
maintenance of genetic variation in fitness.
We thank M. Berenbaum, C. Caceres, R. ffrench-Constant,R. Olendorf, K. Paige, G. Robinson, C. Whitfield and twoanonymous reviewers for comments on the manuscript, parti-cularly one reviewer for pointing out the possible complica-tions from Wolbachia infection levels. L. Liu helped withconversion of CEL files, and the Hughes Laboratory under-graduates were instrumental in the data collection. This workwas supported by National Science Foundation grant DEB0296177 to K.A.H., and by the University of Illinois ResearchBoard.
REFERENCESAgrawal, A. F. 2001 Sexual selection and the maintenance ofsexual reproduction.Nature 411, 692–695.
Barton, N. H. & Turelli, M. 1989 Evolutionary quantitativegenetics: how little do we know.A. Rev. Genet. 23, 337–370.
Bochdanovits, Z., Van Der Klis, H. & De Jong, G. 2003Covariaion of larval gene expression and adult body size innatural populations of Drosophila melanogaster. Mol. Biol.Evol. 20, 1760–1766.
0.35
0.300.25
0.200.15
0.10
0.05
0phosphatases glutathione
transferasesnucleic acid
binding
functional category
p = 0.0013 p < 0.0001 n.s.
prop
orti
onal
rep
rese
ntat
ion
Figure 2. Over-representation of some enzymatic molecularfunction categories. Black bars show the proportionalrepresentation of the functional category among significantlydifferentially expressed genes with annotation (n ¼ 18). Greybars show proportional representation of the functionalcategory among all annotated genes expressed in adult males(n ¼ 4749). Phosphatases (phosphoric monoester hydrolases)and glutathione transferases were significantly over-represented among the differentially expressed genes asdetermined by binomial probability tests (p-values abovebars). As a comparison, genes with nucleic-acid bindingactivity were proportionately represented among differentiallyexpressed genes.

Gene expression and male fitness J. M. Drnevich and others 2273
on May 23, 2011rspb.royalsocietypublishing.orgDownloaded from
Bolstad, B. M., Irizarry, R. A., Astrand, M. & Speed, T. P.2003 A comparison of normalization methods for highdensity oligonucleotide array data based on variance andbias.Bioinform. Oxf. 19, 185–193.
Boutanaev, A. M., Kalmykova, A. I., Shevelyov, Y. Y. &Nurminsky, D. I. 2002 Large clusters of co-expressed genesin theDrosophila genome.Nature 420, 666–669.
Chapman, T. 2001 Seminal fluid-mediated fitness traits inDrosophila.Heredity 87, 511–521.
Charlesworth, B. 1987 The heritability of fitness. In Sexualselection: testing the alternatives (ed. J. W. Bradbury & M. B.Andersson), pp. 21–40. Chichester, UK:Wiley.
Charlesworth, B. & Hughes, K. A. 2000 The maintenance ofgenetic variation in life-history traits. In Evolutionary geneticsfrom molecules to morphology (ed. R. S. Singh & C. B.Krimbas), pp. 369–391. Cambridge University Press.
Chu, T. M., Weir, B. & Wolfinger, R. 2002 A systematic stat-istical linear modeling approach to oligonucleotide arrayexperiments.Math. Biosci. 176, 35–51.
Cordts, R. & Partridge, L. 1996 Courtship reduces longevityof maleDrosophila melanogaster.Anim. Behav. 52, 269–278.
Daborn, P., Boundy, S., Yen, J., Pittendrigh, B. & ffrenchConstant, R. 2001 DDT resistance in Drosophila correlateswith Cyp6g1 over-expression and confers cross-resistanceto the neonicotinoid imidacloprid. Mol. Genet. Genomics266, 556–563.
Daborn, P. J. (and 12 others) 2002 A single P450 allele asso-ciated with insecticide resistance in Drosophila. Science 297,2253–2256.
Ge, Y., Dudoit, S. & Speed, T. P. 2003 Resampling-basedmultiple testing for microarray data analysis. Test 12, 1–44.
Gibson, G. 2002 Microarrays in ecology and evolution: a pre-view.Mol. Ecol. 11, 17–24.
Hoffmann, A. A. 1988 Partial cytoplasmic incompatibilitybetween twoAustralian populations ofDrosophilamelanogaster.EntomologiaExperimentalis Applicata 48, 61–68.
Hoffmann, A. A., Clancy, D. J. & Merton, E. 1994 Cytoplas-mic incompatibility in Australian populations of Drosophilamelanogaster.Genetics 136, 993–999.
Hoffmann, A. A., Hercus, M. & Dagher, H. 1998 Populationdynamics of the Wolbachia infection causing cytoplasmicincompatibility in Drosophila melanogaster. Genetics 148,221–231.
Houle, D. & Kondrashov, A. S. 2002 Coevolution of costlymate choice and condition-dependent display of goodgenes. Proc. R. Soc. Lond. B 269, 97–104. (doi:10.1098/rspb.2001.1823)
Houle, D., Morikawa, B. & Lynch, M. 1996 Comparingmutational variabilities.Genetics 143, 1467–1483.
Hughes, K. A. 1995 The evolutionary genetics of male life-his-tory characters in Drosophila melanogaster. Evolution 49,521–537.
Hughes, K. A., Alipaz, J. A., Drnevich, J. M. & Reynolds, R.M. 2002 A test of evolutionary theories of senescence. Proc.Natl Acad. Sci. USA 99, 14 286–14 291.
Irizarry, R., Hobbs, B., Collin, F., Beazer-Barclay, Y.,Antonellis, K., Scherf, U. & Speed, T. 2002 Exploration,normalization, and summaries of high density oligonucleo-tide array probe level data.Biostatistics 4, 249–264.
Jansen, R. C. 2003 Studying complex biological systems usingmultifactorial perturbation.Nature Rev. Genet. 4, 145–151.
Proc. R. Soc. Lond.B (2004)
Kotiaho, J. S., Simmons, L. W. & Tomkins, J. L. 2001 Towardsa resolution of the lek paradox.Nature 410, 684–686.
Le Goff, G., Boundy, S., Daborn, P. J., Yen, J. L., Sofer, L.,Lind, R., Sabourault, C., Madi-Ravazzi, L. & ffrench-Constant, R. H. 2003 Microarray analysis of cytochromeP450 mediated insecticide resistance in Drosophila. InsectBiochem.Mol. Biol. 33, 701–708.
Lewontin, R. C. 1974 The genetic basis of evolutionary change.New York: Columbia University Press.
Littell, R. C., Stroup, W. W. & Freund, R. J. 2002 SAS forlinear models. Cary, NC: SAS Institute Inc.
Lynch, M., Latta, L., Hicks, J. & Giorgianni, M. 1998Mutation, selection, and the maintenance of life-historyvariation in a natural population. Evolution 52, 727–733.
Montooth, K. L., Marden, J. H. &Clark, A. G. 2003Mappingdeterminants of variation in energy metabolism, respirationand flight inDrosophila.Genetics 165, 623–635.
Prowse, N. & Partridge, L. 1997 The effects of reproductionon longevity and fertility in male Drosophila melanogaster. J.Insect Physiol. 43, 501–512.
Rowe, L. & Houle, D. 1996 The lek paradox and the captureof genetic variance by condition dependent traits. Proc. R.Soc. Lond.B 263, 1415–1421.
Sawicki, R., Singh, S. P., Mondal, A. K., Benes, H. &Zimniak, P. 2003 Cloning, expression and biochemicalcharacterization of one Epsilon-class (GST-3) and tenDelta-class (GST-1) glutathione S-transferases fromDrosophila melanogaster, and identification of additional ninemembers of the Epsilon class.Biochem. J. 370, 661–669.
Schadt, E. E. (and 13 others) 2003 Genetics of geneexpression surveyed in maize, mouse and man. Nature 422,297–302.
Snook, R. R., Cleland, S. Y., Wolfner, M. F. & Karr, T. L.2000 Offsetting effects of Wolbachia infection and heatshock on sperm production in Drosophila simulans: analysesof fecundity, fertility and accessory gland proteins. Genetics155, 167–178.
Tabakoff, B., Bhave, S. V. & Hoffman, P. L. 2003 Selectivebreeding, quantitative trait locus analysis, and gene arraysidentify candidate genes for complex drug-related beha-viors. J. Neurosci. 23, 4491–4498.
Toma, D. P., White, K. P., Hirsch, J. & Greenspan, R. J. 2002Identification of genes involved in Drosophila melanogastergeotaxis, a complex behavioral trait. Nature Genet. 31, 349–353.
Townsend, J. P., Cavalieri, D. & Hartl, D. L. 2003 Populationgenetic variation in genome-wide gene expression. Mol.Biol. Evol. 20, 955–963.
Wayne, M. L. & McIntyre, L. M. 2002 Combining mappingand arraying: an approach to candidate gene identification.Proc. Natl Acad. Sci. USA 99, 14 903–14 906.
Wolfner, M. F. 1997 Tokens of love: functions and regulationof Drosophilamale accessory gland products. Insect Biochem.Mol. Biol. 27, 179–192.
Wyckoff, G. J., Wang,W. &Wu, C. I. 2000 Rapid evolution ofmale reproductive genes in the descent of man. Nature 403,304–309.
As this paper exceeds the maximum length normally permitted, the
authors have agreed to contribute to production costs.
Copyright © 2022 FDOKUMEN