Cellular responses in the cyprinid Leuciscus cephalus from a contaminated freshwater ecosystem
Upload
independentCategory
view
0download
0
Original article
Genome size variation and evolutionin North American cyprinid fishes
JR Gold CJ Ragland, LJ Schliesing
Department of Wildlife and Fisheries Sciences, Texas A & M University,College Station, TX 77843, USA
(Received 4 January 1989; accepted 11 October 1989)
Summary - Genome sizes (nuclear DNA contents) were documented spectrophotomet-rically for 29 species of North American cyprinid fishes. The data were then mergedwith comparable genome size data (published previously) from an additional 20 NorthAmerican cyprinid species. The distributions of DNA values within populations of the 49cyprinid species were essentially continuous and normal. The proportion of DNA whichapparently is free to vary quantitatively within cyprinid populations appears to be be-tween 4 and 5 % of the genome. The distribution of DNA values among cyprinid specieswas more-or-less continuous, with considerable overlap among species with intermediateDNA values. Analysis of the average genome size difference (distance) between individualsdrawn from successive levels of evolutionary divergence indicated that: (i) the majority ofgenome size divergence in North American c prinids has occurred above the level of indi-viduals within populations of species, and (ii) the degree of genome size divergence in theextremely speciose cyprinid genus Notropis is greater than that between species in other,less speciose cyprinid genera. The hypothesis that genome size change might be concen-trated in speciation episodes was tested by comparing the means and variances of genomesize difference (distance) between species in the cyprinid genus Notropis (a species-richphylad) and the centrarchid (sunfish) genus Lepomis (a species-poor phylad). The ratiosof mean distances and variances in the Notropis versus Lepomis comparisons were greaterthan unity, suggesting that changes in genome size in cyprinids may be correlated withspeciation episodes. Whether or not genome size change in cyprinids occurs at speciationsensu strictu is problematic. The data suggest that separate facets or levels of the cyprinidgenome may follow independent evolutionary paths.genome size (DNA content) / cyprinid fish / natural selection / speciation
Résumé - Variation et évolution de la taille du génome chez les cyprinidés d’Amériquedu Nord - La taille du génome (estimée par la quantité d’ADN nucléaire) de 29 espècesNord-Américaines de cyprinidés a été mesurée par spectrophométrie; les résultats ontensuite été jumelés à des données comparables publiées antérieurement, obtenues sur 20autres espèces de cyprinidés de la même aire géographique, et les analyses ont été conduitessur l’ensemble de ces données. Au sein des populations, la quantité d’ADN nucléaire suitune distribution continue et normale, et varie dans une proportion qui représente 4 à5% du génome. Etudiée sur l’ensemble des espèces, la quantité d’ADN nucléaire présenteune distribution quasiment continue, avec des chevauchements considérables entre espèces.
* Correspondence and reprints

L’analyse de la variation observée parmi des individus tirés dans des niveaux taxonomiquesvariés indique que:- la variation est essentiellement due aux variations entre espèces et non aux variationsentre individus d’une même espèces, et que,- la variation entre espèces est plus étendue dans le genre Notropis que dans d’autregenres moins diversifiés. L’hypothèse selon laquelle les modifications de taille génomiqueseraient concentrées à l’occasion d’épisodes de spécification a été testée en, comparant,dans groupes différant par leur degré de différentiation, les moyennes et les variancesdes écarts constatés entre les différentes espèces au sein de chaque groupe: le genre Notropis(cyprinidés), phylum riche en espèces, et le genre Lepomis (centrarchidés, poissons-lunes),phylum pauvre en espèces. Les rapports des moyennes et des variances de Notropiscomparées à Lepomis sont tous 2 supérieurs à l’unité, ce qui suggère une corrélationentre les variations de taille génomique et les épisodes de spéciation chez les cyprinidés; larelation exacte entre de tels changements et la spéciation sensu stricto demande cependantà être précisée. Les résultats suggèrent enfin que les processus évolutifs sont susceptiblesde différer en fonction des facettes envisagées du génome des cyprinidés.taille du génome (quantité d’ADN) / cyprinidés / sélection naturelle / spéciation
INTRODUCTION
It has been known for several years that sizeable differences in genome size or DNAcontent often occur, even between closely related species (Mirsky and Ris, 1951;Bachmann et al, 1972; Sparrow et al, 1972. Kauffman (1971) initially hypothesizedthat the extensive genome size variation was related directly to organismal and/orgenetic complexity. It is now clear, however, that no significant correlations existbetween genome size and organismal (or genetic) complexity or phylogeneticadvancement (Cavalier-Smith, 1985a; Price, 1988a). This has been termed the C-value paradox and represents a general biological problem among eukaryotes whichto date remains unresolved (Price, 1988a,b,c).
Efforts towards explaining or understanding the C-value paradox have beenfocused primarily on the search for significant correlations between genome sizeand a variety of biological, biophysical or genetic parameters. What has emergedfrom these studies are several hypotheses which relate genome size in an inverseway to rates of organismal growth, metabolism or differentiation, and which invokeselection as the primary force responsible for the observed variation in genome size(Bennett, 1971, 1972; Cavalier-Smith, 1978, 1980, 1985a, b; Szarski, 1983; Sessionsand Larson, 1987; Price 1988a).
These hypotheses are confounded for several reasons. First, much of the datawhich document relationships between genome size and cell cycle patterns or certainlife history parameters are from unicellular eukaryotes (eg, Cavalier-Smith, 1980;Shuter et al, 1983). The problem lies in the extrapolation to multicellular eukaryoteswhere it is often dif6cult to obtain direct, unbiased or standardized estimates oforganismal growth and/or developmental rates. A second reason is that most,if not all, of the evidence is correlative and does not necessarily demonstratecause and effect. A third reason is that nearly all of the genome size data arefrom distinct species or higher level taxa. Studies of genome size variation atlower hierarchical levels are few, and differences in genome size within speciesgenerally have been regarded as insignificant or unimportant (Bennett and Smith,1976). Several recent studies, however, have shown that intraspecific variation in

genome size may be substantial, and in some cases approximate the average genomesize differences observed between species (Price et al, 1981, 1986; Sherwood andPatton, 1982; Gold and Price, 1985; Gold and Amemiya, 1987; Johnson et al,1987; Ragland and Gold, 1989). A final reason is that little attention has beenpaid to the mechanisms by which DNA might be gained or lost from a genome.The observations that species within cohesive groupings (eg, genera) often differsubstantially in genome size and that interspecies genome sizes are frequentlydiscontinuously distributed have led to the suggestion that genome size evolutionmay occur in a &dquo;quantized&dquo; fashion; ie, by a succession of large-scale changes(Narayan, 1982; Cavalier-Smith, 1985b). Subsumed within this problem is the
question of whether genome size changes might be occurring disproportionallyduring speciation episodes. Several authors (Hinegardner, 1976; Morescalchi, 1977;Cavalier-Smith, 1978) have suggested that genome size change might be associatedwith speciation, although a direct correlation between genome size change andspeciation has not been tested critically.
In the following, data on intra- and interspecific genome size variation among49 species of North American cyprinid fishes are presented. The genome size datafrom 29 of the species are given for the first time. The subjects of primary interestin the paper are: (i) the pattern and magnitude of genome size variation withinpopulations and among species, and (ii) the question of whether genome sizechanges are concentrated in speciation episodes.
MATERIAL AND METHODS
The collection localities of samples representing the 29 North American cyprinidspecies, whose genome sizes are reported here, are given in the Appendix, Table A1.All fish were collected by seine from natural populations. Fish sampled from Texas(TX) and Louisiana (LA) were returned live to our laboratory in College Station forprocessing; fish sampled from Oklahoma (OK) and Alabama (AL) were processedin facilities at the Oklahoma University Biological Station on Lake Texoma and atSamford University in Birmingham, AL, respectively. Except for Notropis lepidus,the samples of each species comprised 5 individuals taken from the same locality.The N. lepidus sample comprised 10 individuals from the same locality. Collectionlocalities for the 20 other North American cyprinid species included in the dataanalyses in this paper, may be found in Gold and Amemiya (1987). In that study,the samples of each species comprised 10 individuals taken from the same locality.
Genome sizes were measured via scanning microdensitometry of Feulgen-stainederythrocyte nuclei using chicken blood as an internal control. The latter wasobtained from a highly inbred, pathogen-free strain available from the TexasA & M College of Veterinary Medicine. Full details of slide preparation, staining andmicrodensitometry may be found in Gold and Price (1985) and Gold and Amemiya(1987). Fifteen erythrocyte nuclei were measured from each of 2 slides per fish(=30 nuclei/individual) and standardized as a percent of the mean absorbancy of10 chicken erythrocyte nuclei on the same slide. Standardized absorbancy values offish nuclei were coded (for convenience) by multiplying the percent chicken standard(for each fish nucleus) by 20. Statistical analyses of the data were carried out usingeither SAS (1982) or our own programs on the Texas A & M mainframe computer.

Means, standard errors and ranges for the 29 species were taken from the dis-tribution of DNA values of individuals within each species. Distribution normalityindices (gl and g2) were taken from the distribution of measurements (nuclei) withineach species. Descriptive statistics of genome size variation within and among the20 cyprinid species not reported here may be found in Gold and Amemiya (1987).The methodologies used to determine genome sizes of individuals in all 49 specieswere identical. The current classification of the 49 species is shown in the Appendix,Table All. Note that 31 of the 49 species are from the extremely speciose genusNotropis which includes over 125 species (Lee et al, 1980).
RESULTS
Descriptive statistics (means + standard errors, ranges and the gi and g2 indices ofdistribution normality) for the 29 species are given in Table I. Genome sizes rangedfrom 2.06 pg of DNA in Notropis callistius to 3.26 pg of DNA in Phenacobius
catostomus, a difference of approximately 58%. The ranges of genome sizes withineach of the 29 species varied in percent from 1.15 in Notropis beldus to 8.74in Dionda episcopa, and averaged 4.11. Five of the 29 sampling distributions ofmeasurements (nuclei) within each species were significantly non-normal. Of the5, 3 were significantly platykurtic or flat, and 2 were significantly skewed towardshigher DNA values.
Patterns and magnitude of genome size variation within populationsof species
The coded absorbancy data from the 49 cyprinid species examined to date wereorganized into a number of different sampling distributions and each was testedfor distribution normality using the gl and 92 indices. The distributions testedincluded: (i) all measurements (nuclei) within each population (species) or sample(49 sampling distributions; N = 300 for populations where 10 individuals wereexamined and N = 150 for populations where 5 individuals were sampled); and(ii) a rankit distribution (Sokal and Rohlf, 1969) reflecting the distribution of DNAvalues of individuals within populations summed over all 49 populations. The latterwas generated following eqn[l] in Gold and Amemiya (1987) in order to removescaling effects due to individuals being drawn from different species. The results ofthe distribution normality tests are summarized in Table II. The majority of thedistributions of measurements (nuclei) within populations were normal, althoughthe incidence of non-normal distributions was higher than expected by chance ata = 0.05. The rankit distribution reflecting the distribution of DNA values ofindividuals within populations was significantly platykurtic, although the deviationappears slight (Fig 1).
Separate single classification analyses of variance (ANOVA) were used to testfor significant heterogeneity of DNA values of individuals within each of the49 populations (species) using the distribution of measurements (nuclei) of thatspecies. All F-tests were significant at a = 0.05. A synopsis of the results ofDuncan’s multiple range test on each population is shown in Table III. The resultsdemonstrate that significant differences in genome size occur among individuals

within cyprinid populations and that, on average, approximately half of theindividuals from any given population differ in DNA content.

The magnitude of genome size variation within cyprinid populations was esti-mated as the average of the percent maximum variation between individuals withinpopulations. These values ranged from 1.15% in Notropis bellus (Table I) to 13.49%in Notemigonus crysoleucus (Table 3 in Gold and Amemiya, 1987), and averaged4.86 f 0.31% (Table II). Assuming an average North American cyprinid genomesize of 2.47 pg of DNA, this represents approximately 0.12 pg or about 1.1 x lollbase pairs of DNA.

Patterns and magnitude of genome size variation among species
A plot of the distribution of DNA values of individuals examined from all 49 speciesis shown in Fig 2. With the exception of the 2 species of Phenacobius (cf Table I), theinterspecies distribution of genome sizes appears continuous and overlapping. Singleclassification ANOVA was used to test for significant heterogeneity in genome sizevariation among species using this sampling distribution. Significant heterogeneityof mean DNA values at a = 0.05 was found and the results of a Duncan’smultiple range test are shown in Table III. Again, with exception of the 2 species ofPhenacobius, interspecies genome sizes appear more-or-less continuously distributedwith considerable overlap among species with intermediate DNA values.

Two approaches were used to examine the magnitude of genome size variationamong the 49 species. The first was to carry out a nested analysis of variance(Table IV) which revealed that, although significant heterogeneity in genome sizeexisted at each experimental level from between slides within individuals to amongspecies, the majority (>88%) of the variation occurs among species. The secondapproach was to estimate the magnitude of genome size differences at ascendingtaxonomic levels. This was accomplished using eqns [2] and [3] of Gold and Amemiya(1987). Briefly, eqn[2] generates a genome size difference or distance (GSDmin) valuebetween 2 species or taxa which represents the average of all pairwise differences ingenome size between all individuals sampled from each taxon or species (eg, withN = 10 individuals for each of 2 species, there are 100 possible comparisons). The48 x 49 GSDmin distance matrix (which includes 1176 GSDmin values) generatedfrom these calculations is not shown but may be obtained, from the first author.Equation [3] generates a GSDmin value which represents the average of all possiblepairwise comparisons between all individuals of any one population of a species(eg, for N = 10 individuals, there are 45 possible comparisons). The GSDmin valuesfor all 49 populations (species) were then averaged to obtain an estimate of theaverage genome size difference or distance between individuals within populationsof species. It should be noted that both GSDmin values are minimum linear distancemetrics which underestimate the true distance if reversed or reticulated patterns of
change occur (Sneath and Sokal, 1973).The average genome size difference (distance) between individuals drawn from
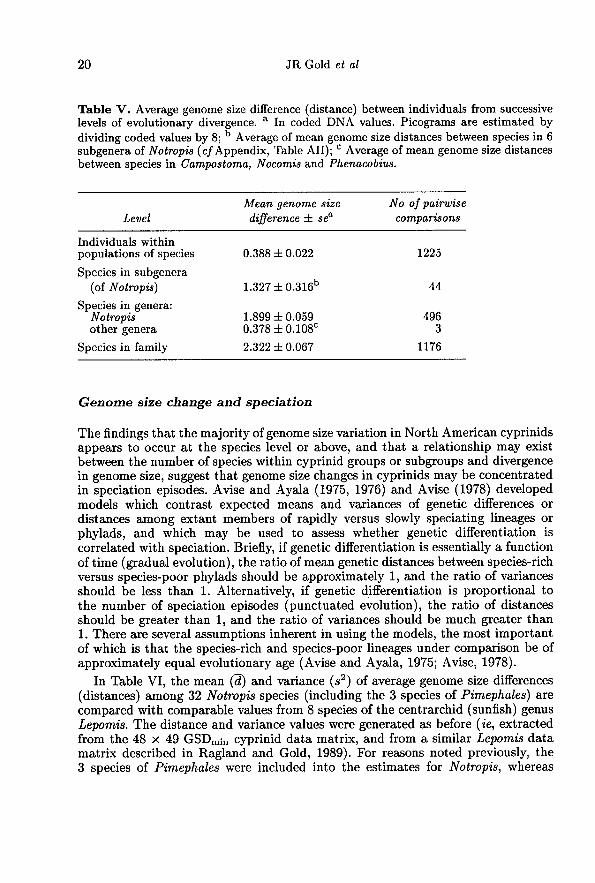
successive levels of evolutionary divergence are shown in Table V. Estimates ofaverage genome size distances between species in subgenera of Notropis and betweenspecies in Notropis and in other genera were obtained from subsets of GSDminvalues extracted from the 48 x 49 GSDmin distance matrix. The average genomesize distance between species in subgenera of Notropis, for example, involved first

computing the average genome size distance value for each subgenus based on allpairwise comparisons between species in that subgenus, and then averaging thesevalues over all subgenera. The same method was used to estimate the averagegenome size distance between species in genera other than Notropis. The estimatefor species in Notropis is simply the average of all pairwise comparisons among 29 ofthe 31 nominal Notropis species examined. Both N atrocaudalis and N stramineuswere not included in the latter estimate since the phylogenetic af6nities of these 2species may lie outside of Notropis (Mayden, 1989). For similar reasons, N rubeldusand N baileyi were not included in the genome size distance estimate for theNotropis subgenus Hydrophlox (Mayden and Matson, 1988). The genus Pimephadeswas included in the genome size distance estimate for species within the genusNotropis since Pimephales is now believed to be closely related phylogenetically tocertain lineages within Notropis (Cavender and Coburn, 1986). The estimate forspecies in the family is the average of all pairwise comparisons among all 49 speciesexamined.
As shown in Table V, individuals drawn at random from a population ofthe same cyprinid species will differ, on average, by 0.388 genome size distanceunits (approximately 0.048 pg of DNA); whereas, any 2 individuals drawn atrandom from 2 different North American cyprinid species will differ, on average,by 2.322 genome size distance units (approximately 0.290 pg of DNA). Thisrepresents a 6-fold difference and strongly suggests that the majority of genome sizedivergence in North American cyprinids has occurred above the level of individualswithin populations of species. Particularly noteworthy are the observations that(i) the degree of genome size divergence between species in the genus Notropisis approximately 5 times that between species in other cyprinid genera, and (ii)much of the divergence in Notropis has apparently occurred at the subgenericrather than generic level. The most actively evolving Notropis subgenera in termsof genome size appears to be Cyprinella and Notropis, where the average genomesize distance between species was estimated as 2.152 and 2.340 units, respectively.Since these are the 2 largest Notropis subgenera in terms of number of species,and since Notropis itself contains considerably more species than Campostoma,Nocomis or Phenacobius, the tentative implication of these data is that there maybe a positive relationship between the number of species within a group or subgroupand divergence in genome size.
Genome size change and speciation
The findings that the majority of genome size variation in North American cyprinidsappears to occur at the species level or above, and that a relationship may existbetween the number of species within cyprinid groups or subgroups and divergencein genome size, suggest that genome size changes in cyprinids may be concentratedin speciation episodes. Avise and Ayala (1975, 1976) and Avise (1978) developedmodels which contrast expected means and variances of genetic differences ordistances among extant members of rapidly versus slowly speciating lineages orphylads, and which may be used to assess whether genetic differentiation is
correlated with speciation. Briefly, if genetic differentiation is essentially a functionof time (gradual evolution), the ratio of mean genetic distances between species-richversus species-poor phylads should be approximately 1, and the ratio of variancesshould be less than 1. Alternatively, if genetic differentiation is proportional tothe number of speciation episodes (punctuated evolution), the ratio of distancesshould be greater than 1, and the ratio of variances should be much greater than1. There are several assumptions inherent in using the models, the most importantof which is that the species-rich and species-poor lineages under comparison be ofapproximately equal evolutionary age (Avise and Ayala, 1975; Avise, 1978).
In Table VI, the mean (d) and variance (s2) of average genome size differences(distances) among 32 Notropis species (including the 3 species of Pimephales) arecompared with comparable values from 8 species of the centrarchid (sunfish) genusLepomis. The distance and variance values were generated as before (ie, extractedfrom the 48 x 49 GSDmil1 cyprinid data matrix, and from a similar Lepomis datamatrix described in Ragland and Gold, 1989). For reasons noted previously, the3 species of Pimephales were included into the estimates for Notropis, whereas

N atrocaudalis and N stramineus were not. For similar reasons (GV Lauder, personalcommunication), Lepomis gulosus was not included in the calculations of d and s2values for the genus Lepomis. As shown in Table VI, the ratio of mean distances isgreater than 1, and the ratio of variances is very much greater than 1. Accordingto the models, these results indicate that changes in genome size in cyprinids arecorrelated with speciation episodes. In Table VII, observed ratios of mean distancesand variances for the comparison Notropis versus Lepomis and data from proteinelectrophoresis and morphological measurements are compared to those based ongenome size. Taken at face value, the observed ratios suggest that differentiation instructural genes and morphology occurs primarily as a function of elapsed time.
DISCUSSION
The normality (or near normality) of genome size distributions within populationsof cyprinids strongly suggests that DNA quantity changes at this level are small,involve both gains and losses of DNA, and are cumulative and independent ineffect. This hypothesis is based on the assumption that the variation follows thepremises of the normal probability density function (Sokal and Rohlf, 1969). An

identical pattern of variation also occurs among populations of 9 species of the NorthAmerican centrarchid genus Leporrcis (Ragland and Gold, 1989). Of importance isthat no instance of a quantum or &dquo;quantized&dquo; (Cavalier-Smith, 1985b) differencein genome size among individuals has been found in the nearly 60 populations ofcyprinids or centrarchids thus far studied. Comparable data from other organismson genome size variation among several individuals within populations are few, andare limited primarily to the extensive researches by Price and colleagues on theplant Microseris douglasii (Price et al, 1981, 1986). In M douglasii, genome sizevariation is also continuous with no evident, large-scale differences in genome sizeoccurring among individuals within populations.
There was an apparent tendency towards platykurtosis in a few of the cyprinidpopulations genome size distributions, including the rankit distribution, which re-flects the normalized variation of DNA values of individuals. Most of the deviationsfrom normality, however, were slight and, in the case of the rankit values, the distri-bution only became platykurtic upon the addition of the 28 populations (species)reported in this paper, where sample sizes were restricted to only 5 individualsper population. This suggests that the observed platykurtosis may be a function ofnon-random sampling since typically most individuals were collected in only 1 or 2seine-hauls and could represent close relatives (eg, full-sibs) rather than individualsdrawn at random from population.
The proportion of DNA, which apparently is free to vary quantitatively withincyprinid populations, appears to be between 4 and 5% of the genome, as estimatedfrom the average maximum genome size variation among all 49 populations sur-veyed. This quantity is approximately the same as that theoretically needed for thecyprinid structural gene component if one assumes the latter contains 50 000 cod-ing nuclear genes per genome and there are 1500 coding DNA base pairs per gene.It seems unlikely, however, that coding structural genes would be regularly gainedor lost from a genome without eventually resulting in a phenotypic disturbance ordevelopmental irregularity. This suggests that up to 90% of the cyprinid genomeis maintained quantitatively even though no specific functions are known for thisDNA. As noted previously (Gold and Price, 1985), both the normality of distri-butions within cyprinid populations and the apparent constraints on the quantityof DNA which can vary strongly imply the action of stabilizing or normalizing se-lection operating through the truncation of deleterious extremes (Stebbins, 1966;Mettler and Gregg, 1969). However, while natural selection may be influencinggenome size variation within cyprinid populations, there is no evidence at presentto indicate that selection favours a particular cyprinid species DNA value relativeto some organismal parameter (Gold and Amemiya, 1987).Two suggestions to account for interspecies genome size differences are the
selfish DNA hypothesis (Doolittle and Sapienza, 1980; Orgel and Crick, 1980) andthe hypothesis that genome size changes might occur primarily during speciationepisodes (Hinegardner, 1976; Morescalchi, 1977; Cavalier-Smith, 1978). The basisfor the former is that most eukaryotic genomes contain DNA sequences thatcan increase in copy number through differential replication. Presumably, thesesequences are phenotypically inconsequential, at least to the point where the energyexpended in replicating such DNA begins to infringe on the energy needs of theorganism (Doolittle and Sapienza, 1980). In a very general way, the cyprinid genome

size data are not inconsistent with the selfish DNA hypothesis in that: (i) there issignificant variation in genome size within cyprinid populations which presumablyis phenotypically inconsequential; (ii) species DNA values appear to be more or lessrandomly distributed within the variation which occurs; and (iii) individuals at thehigh end of the genome size distribution appear to be removed by negative selection.Alternatively, one might predict that if selfish DNAs contribute significantly togenome size variation, the underlying distributions of DNA values should not benormal. Species or populations where selfish DNAs are proliferating should showdistributions skewed towards higher values; whereas, species or populations whereselfish DNAs have accumulated to the point of impairing energy needs should showdistributions skewed towards lower values. The genome size distributions in mostcyprinid populations, however, are normal, and there appears to be no generaltendency towards skewness in either direction.
The comparison of the means and variances of genome size distance between thecyprinid genus Notropis (species-rich phylad) versus the centrarchid genus Lepomis(species-poor phylad), suggests that considerable genome size change may occurduring or be associated with cyprinid speciation episodes. Such a hypothesis isnot contradicted by the findings that: (i) genome size variation within cyprinidpopulations is generally less than that among cyprinid species; (ii) cyprinid speciesgenome sizes appear to be continuously and more or less randomly distributedwithin the variation which occurs; and (iii) there are no apparent associationsbetween species genome sizes and various life-history characteristics (Gold andPrice, 1985; Gold and Amemyia, 1987; this paper). A point to note, however, isthat the evidence is essentially correlative and it would be difficult to determineexperimentally whether the correlation was one of cause and effect or one ofassociation. Moreover, intraspecific variation in genome size in both cyprinids andcentrarchids can often be as great as the differences among species (Gold andAmemyia, 1987; Ragland and Gold, 1989; this paper). This raises some doubtas to the strengh or validity of the apparent correlation between genome sizedifferentiation and speciation since, as noted by Ragland and Gold (1989), thegenerally lower intraspecific variation observed could stem from the homogenizingeffects of gene flow within species.On the other hand, the finding that ratios of mean genome size distance and
variance in the Notropis versus Lepomis comparison differ markedly from thosereported for structural genes and morphology suggests that different levels of thegenome may follow independent evolutionary paths. The simplest explanation forthe difference in distance and variance ratios is that genome size evolution is de-pendent, in part, on speciation episodes, whereas structural gene and morphologicalevolution are dependent primarily on elapsed time. This explanation is unquestion-ably oversimplified and is based on the assumptions that: (i) the models of Aviseand Ayala (1975, 1976) and Avise (1978) are appropriate and sufficiently robust,and (ii) Notropis and Lepomis are appropriate taxa for comparison. Neither as-sumption is without caveats (Avise, 1977; Mayden 1986), nor have the models beentested or used in any other organismal group outside of cyprinid and centrarchidfishes. Moreover, exactly how or why the difference might occur is somewhat prob-lematic given the difficulty in studying speciation in situ nascent, as well as thewide variety of speciation modes (White, 1978; Templeton, 1980) theoretically pos-

sible for any given speciation event. At this point, the conservative thesis is thatgenome size evolution may be decoupled from other levels of genome organization,and that genome size may, in fact, evolve in a &dquo;quantized&dquo; fashion as suggested byCavalier-Smith (1985b).
ACKNOWLEDGMENTS
We thank Chris Amemiya, Tony Echelle, Gary Garrett, Bill Karel, Mike Howell,Bill Matthews and Bob Stiles for assistance in collecting the specimens used inthis study, and we gratefully acknowledge the use of facilities at the Department ofBiology at Samford University in Birmingham during our field work in Alabama,and the University of Oklahoma Biological Station on Lake Texoma during ourfield work in Oklahoma. We also thank Jim Price, John Bickham and the editorsof the journal for constructive comments on the manuscript, and Laura Vilanderfor assistance in scanning a few of the microscope slides. The scanning microden-sitometer, used in the research, was made available by Dr Jim Price of the Soiland Crop Sciences Department at Texas A & M University. The chicken blood,used as an internal standard, was provided by Dr Syed Naqi of the Texas A & MCollege of Veterinary Medicine. The work was supported by project H-6703 of theTexas Agricultural Experiment Station and by National Science Foundation grantBSR-8415428. This paper represents part III in the series &dquo;Genome size variationin North American minnows (Cyprinidae).&dquo;
REFERENCES
Avise JC (1977) Is evolution gradual or rectangular? Evidence from living fishes.Proc Natl Acad Sci USA 74, 5083-5087Avise JC (1978) Variances and frequency distributions of genetic distance inevolutionary phylads. Heredity 40, 225-237Avise JC, Ayala FJ (1975) Genetic change and rates of cladogenesis. Genetics 81,757-773
Avise JC, Ayala FJ (1976) Genetic differentiation in speciose versus depauperatephylads: evidence from the California minnows. Evolution 30, 46-58Bachmann K, Goin OB, Goin CJ (1972) Nuclear DNA amounts in vertebrates.Brookhaven Symp Biol 23, 419-450Bennett MD (1971) The duration of meiosis. Proc R Soc London, Ser B, 178, 277-299
Bennett MD (1972) Nuclear DNA content and minimum mitotic time in herbaceousplants. Proc R Soc London, Ser B, 181, 109-135Bennett MD, Smith JB (1976) Nuclear DNA amounts in angiosperms. Phil TransR Soc London Ser B 274, 227-274Cavalier-Smith T (1978) Nuclear volume control by nucleoskeletal DNA, selectionfor cell volume and growth rate, and the solution of the DNA C-value paradox. JCell Sci 34, 247-278

Cavalier-Smith T (1980) r- and K-tactics in the evolution of protist developmentalsystems: cell and genome size, phenotype diversifying selection and cell cyclepatterns. Biosystems 12, 43-59Cavalier-Smith T (1985a) Introduction: the evolutionary significance of genomesize. In: The Evolution of Genome Size. (Cavalier-Smith T, ed) Wiley, New York,1-36
Cavalier-Smith T (1985b) Cell volume and the evolution of eukaryotic genome size.In: The Evolution of Genome Size. (Cavalier-Smith T, ed) Wiley, New York, 105-184
Cavender TM, Coburn MM (1986) Cladistic analysis of eastern North AmericanCyprinidae. Ohio J Sci 86, 1Coburn MM (1982) Anatomy and Relationships of Notropis atherinoides. Ph.D.dissertation, Ohio State University, Columbus, OHDoolittle WF, Sapienza F (1980) Selfish genes, the phenotype paradigm and genomeevolution. Nature 284, 617-618
Douglas ME, Avise JC (1982) Speciation rates and morphological divergence infishes: tests of gradual versus rectangular modes of evolutionary change. Evolution36, 224-232Gibbs RH Jr (1957) Cyprinid fishes of the subgenus Cyprinedda of Notropis. I.Systematic status of the subgenus Cyprinelda, with a key to the species exclusiveof the lutrensis-ornatus complex. Copeia 1957, 185-195Gilbert CR (1964) The American cyprinid fishes of the subgenus Luxilus (genusNotropis). Bull Fla State Mus Biol Ser 8, 95-194Gold JR, Price HJ (1985) Genome size variation among North American minnows(Cyprinidae). 1. Distribution of the variation in five species. Heredity 54, 297-305Gold JR, Amemiya CT (1987) Genome size variation in North American minnows( Cyprinidae). II. Variation among 20 species. Genome 29, 481-489Hinegardner R (1976) Evolution of genome size. In: Molecular Evolution (AyalaFJ, ed) Sinauer Press, Sunderland, MA, 179-199Hubbs CL (1955) Hybridization between fish species in nature. Syst Zool 4, 1-20Johnson OW, Utter FM, Rabinovitch PS (1987) Interspecies differences in salmonidcellular DNA identified by flow cytometry. Copeia 1987, 1001-1009Kauffman S (1971) Gene regulation networks: a theory for their global structureand behaviors. In: Current Topics in Developmental Biology (Moscona AA, MonroyA eds) Academic Press, New York, 145-182Lee DS, Gilbert CR, Hocutt CH, Jenkins RE, McAllister DE, Stauffer JR Jr (1980)Atlas of North American Freshwater Fishes. North Carolina Biological SurveyPublication No. 1980-12
Mayden RL (1986) Speciose and depauperate phylads and tests of punctuated andgradual evolution: fact or artifact? Syst Zool 35, 591-602Mayden RL (1989) Phylogenetic studies of North American minnows, with emphasison the genus Cyprinella (Teleostei: Cypriniformes). Miscellaneous Publication No.80, University of Kansas Museum of Natural History, Lawrence, KS

Mayden RL, Matson RH (1988) Evolutionary relationships of eastern North Amer-ican cyprinids: an allozyme perspective. 68th Annual Meeting of the AmericanSociety of Ichthyologists and Herpetologists, Ann Arbor MI, 23-29 JuneMettler LE, Gregg TG (1969) Population Genetics and Evolution, Prentice-Hall,Englewood Cliffs, NJ JMiller RR (1959) Origin and affinities of the freshwater fish fauna of western NorthAmerica. Zoogeography. Arrc Assoc Adv Sci Publ 51, 187-222Mirsky AE, Ris H (1951) The deoxyribonucleic acid content of animal cells and itsevolutionary significance. J Gen Physiol 34, 451-462Morescalchi A (1977) Phylogenetic aspects of karyological evidence. In: MajorPatterns in Vertebrate Evolution (Hecht MK, Goody PC, Hecht BM, eds) PlenumPress, New York, 149-167
Narayan RKJ (1982) Discontinuous DNA variation in the evolution of plant species.The genus Lathyrus. Evolution 36, 877-891Orgel LE, Crick FHC (1980) Selfish DNA: the ultimate parasite. Nature 284, 645-646
Price HJ (1988a) DNA content variation among higher plants. Annals Missouri BotGarden 75, 1248-1257Price HJ (1988b) Plant genome size and the DNA C-value paradox. Plant GenetNewsl 4, 18-24 .
Price HJ (1988c) Nuclear DNA content variation within angiosperm species. EvolTrereds Plants 2, 53-60Price HJ, Chambers KL, Bachmann K (1981) Geographic and ecological distribu-tion of genomic DNA content variation in Microseris douglasii (Asteraceae). BotGaz 142, 415-426Price HJ, Chambers KL, Bachmann K, Riggs J (1986) Patterns of mean nuclearDNA content in Microseris douglasii (Asteraceae) populations. Bot Gaz 147, 496-507
Ragland CJ, Gold JR (1989) Genome size variation in the North American sunfishgenus Lepomis (Pisces: Centrarchidae). Genet Res 53, 173-182SAS Institute Inc (1982) User’s Guide: Statistics. SAS Institute Inc, Cary NCSessions SK, Larson A (1987) Developmental correlates of genome size in pletho-dontid salamanders and their implications for genome evolution. Evolution 41, 1239-1251
Sherwood SW, Patton JL (1982) Genome evolution in pocket gophers (genusThomomys). II. Variation in cellular DNA content. Chromosoma 85, 163-179Shuter BJ, Thomas JE, Taylor WD, Zimmerman M (1983) Phenotypic correlatesof genomic DNA contents in unicellular eukaryotes and other cells. Arn, Nat 122,26-44
Sneath PHA, Sokal RR (1973) Numerical Taxonomy. WH Freeman, San Francisco,CA

Snelson FF Jr (1968) Systematics of the cyprinid fish Notropis amoenus, withcomments on the subgenus Notropis. Copeia 1968, 776-802Snelson FF Jr (1972) Systematics of the subgenus Lythrurus, genus Notropis (Pisces:Cyprinidae). Bull Fla State Mus Biol Ser 17, 1-92Sokal RR, Rohlf FJ (1969) Biometry: WJ Freeman, San Fransisco, CASparrow AH, Price HJ, Underbrink AG (1972) A survey of DNA content per celland per chromosome of prokaryotic and eukaryotic organisms: some evolutionaryconsiderations. Brookhaven Symp Biol 23, 451-494Stebbins GL (1966) Processes of Organic Evolution. Prentice-Hall, EnglewoodCliffs, NJ JSwift CC (1970) A review of the eastern North American cyprinid fishes of theNotropis texanus species ’group (subgenus Alburnops), with a definition of thesubgenus Hydrophiox, and materials for a revision of the subgenus Alburnops. Ph.D.dissertation, Florida State University, Tallahassee, FLSzarski H (1983) Cell size and the concept of wasteful and frugal evolutionarystrategies. J Theor Biol 105, 201-209Templeton AR (1980) Modes of speciation and inferences based on genetic dis-tances. Evolution 34, 719-729White MJD (1978) Modes of Speciation. WH Freeman, San Francisco, CA

APPENDIX

Copyright © 2022 FDOKUMEN