Achilles in the Alleyway: Bob Dylan and Classical Poetry and Myth, Arion 17.1 (2009): 119-135.

Genital and allozyme similarity between Arion urbiae and A. anguloi (Mollusca: Pulmonata)
'I'HIERRY BACKELJAU
k"onzriklqk Belgisch Instztuut uaor -1 atuurwetenrchappen, Afdelzng LZ!lalacologzP, T'aiitzerJlraal 29. B- I040 Rrursels, Belgium
( / o .$'atzonnal ,CaluurhistoriJch Museum, P.O. Box 9517, .2%-2300 RA Lezden, thr "Yetherlands
RAMON MARTIP;
Laboratorio de <oologi,i, Departamento de Biologia Animal y Gene'tica, C'niurrJidud del Pais Ihsco. Apdo. 644 E-48080 Rilbao, Sflain
TERESA RODRIGUEZ
Facultade de Bioloxia, Universidade de Santiago de Compostela, E-15706, Santiago de Composlela, Spain
AND
LCC DE BRUYN
C'nioersiteit Antwerpen (RUCA) , Departement Riologie, Croeneribor~~erlnnn 171. B-2020 A4ntwerppn, Belgium
CONTES'I'S 2 Introduction . . . . . . . . . . . . . . . . . . .
Material and methods . . . . . . . . . . . . . . . . 1
I OO'L44O82/94~001001 + 18 S08.0010 :c\ 1994 'I'ht. Linncnn Society of London

Kcsulr5 . . . . . . . .
Population grrirtics . . . . . S\-stematica . . . . . . .
Disc uss im . . . . . . . . . (~~1nc1usioiie . . . . . . . . . Acki iou lrdgernmts . . . . . . . Kcfrrrn( c\ . . . . . .
.Inatoiiiicdl comparison . . . . . . . . . . . . . . 6 . . . . . . . . . 6 . . . . . . . . . . <3 . . . . . . . . . . 10 . . . . . . . . . 12 . . . . . . . . . . 16 . . . . . . . . . . 16 . . . . . . . . . . 16
INTRODUCTION
*.Irion whine De ?Vinter, 1986, and -4. angulni Martin & Gomez, 1988, are two species of terrestrial slugs, which were recently described from the Basque Country. northern Spain (Fig. I ) . The type localities of both species are respectively the Sanctuary c,f Urbia in the Sierra de Aitzgorri, about 10 km SE of Onate 8, province Guipuzcoa) for A . urbiae and a Quercus ratundzfoliii woodland in Osnia :pro\.ince Alava) for A . anguloi (Fig. I ) .
Detailcd descriptions of the two taxa are given by De Winter 11986) and l fa r t in Pr Gornez (1988). According to these latter authors, A . anguloi differs from A . urbiae b!: j; 1 ) i ts olivaceous colour, (2 ) its yellowish mucus, ( 3 ) its larger and more prominent epipkallic papillae, (4) its larger and more conspicuous ligula and ; 5 : its habitat. I n all other aspects the taxa are very similar if riot identical. However, since the genital differences between A. urbiae and A . nngziloi are extreme1)- subtle (compare Figs 2, 3 ) , and since in arionids colour characteristics are unreliable species markers (Backeljau & De BI-uyn, 1990. 1992; Backeljau et al . , 1992), i t was questioned whether the two1 species really reprrsent two independent 5ene pools (biological species).
In order to investigate this problem we conducted a comparative genitalic and allozyme study of A . urbiae and A . anguloi. As reference species vvc included .4. w b / u m ~ . \ {Draparnaud, 1805), for this species is supposed to he related to A.
X
€i,yui-e I . L'IXi Grid 110 x 10 ltmi showing thr distribution of A . urbzau {squares: iind .-I. nnguloi circles in iiorrhrrn Spain. T h e respective type localities are indicated by a white 'T' in tlir s)mhol.
SIMILARITY BETWEEN ARIOH URBIAE AND A . ANGULOI 3
Figure 2. Anterior genital parts of A . urbiae from Urbia, Northern Spain (KBIN collection numbers below). Scale lines = I mm. Abbreviations ~ a: atrium; b: bursa of the spermatheca; e: epiphallus; I: ligula (only visible after opening the oviduct); o: oviduct; p: pedunculus of the spermatheca; vd: vas deferens.
urbiae and A . anguloi. This has been inferred from: (1) the general organization of the genitalia (particularly of the oviduct and ligula) (Figs 4, 5), (2) the structure of the spermatophore and (3) the external similarity between A . urbiae and dark forms of A . subfuscus (De Winter, 1986). A . subfuscus differs, however, from A . urbiae by: (1) the more slender pedunculus of the spermatheca and (2) the

4 T. BACKELJAU E T A L
4262 - 1 Ij
4262 - 5 Figure 3. Antcrior genital parts of i l . anguloi from Osma, Northern Spain (KBIN rollrction numhcrs hclow:. Sralr lines = 1 mm. Abhrrviarions as in Fig. 2.
absence of pigmentation on epiphallus and oviduct (De Winter, 1986). From '4. anguloi it differs by: ( I ) its larger size, (2) its thicker upper atrium, free oviduct and ligula, (3 ) its epiphallus being shorter than the vas deferens and (4) its less prominent annular thickening of the epiphallus outlet (Martin & Gbmez, 1988).
'The systematics of A . subfuscus are still very confused and several authors have suggested that this name actually refers to a species complex (Walden, 1976; De \+'inter, 1986; Backeljau, 19894. Subsequent electrophoretic analyses by Foltz

SIMILARITY BETWEEN ARIOX URBIAE AND A. ANGULOI
TABLE I . Locality data of the samples studied. N: number of specimens; No: reference number of the sample in the collections of the KBIN.
5
Species locality ~
Date No N
A. A. A .
urbiae a n p l o i subfuscus-S
Type locality (see text) Type lorality (see text) Champlon, pasture, Belgium Renkum, old factory, the Netherlands Sierra de Aitzgorri, Spain Antwerp, Middelheim, Belgium La Roche-en-Ardenne, Belgium La Roche-en-Ardenne, Belgium Rochefort, roadside, Belgium
A . subfuscus-F Tischamend, Austria Crissolo, Italy Lago Fiorenza, Italy Oranje Nassau Oord, the Netherlands Ermelo, Leuvenemse Bos, the Netherlands
09-12-1989
27-07- 1985 3 1-07-1985 xx-04- 1985 07-08- 1985 03-10-1989
06-06- 1989
03- 10- 1989 03- 10- 1989 06-06-1985
15-09- 1989 xx-09-1989 xx-09- 1989
15-09-1989
4261 4262 4077 4079 4082 4083 427 1 4272 4274 4073 4277 4278 4279 4280
8 8 5 3 1 1 1 1 1
18 1 2 1 1 -
etal., (1982) and Backeljau & De Winter (unpublished data) confirmed this opinion. In anticipation of the publication of these latter results, Backeljau ( 1989a) used the relative electrophoretic mobilities of the phosphoglucomutase (PGM) electromorphs to distinguish two genetic types in A. subfuscus, viz. a slow (S) and a fast (F) one (Fig. 6A). We will maintain this notation in the present contribution and refer to a forthcoming paper for a more detailed account of A. subfuscus.
MATERIAL AND METHODS
Digestive gland homogenates of A. urbiae and A. anguloi, and of the two PGM types of A. subfuscus, were assayed for 18 enzymes using vertical polyacrylamide gel electrophoresis (PAGE). In a limited number of specimens we also employed isoelectric focusing (IEF) to resolve non-specific esterases. Locality data of the samples are listed in Table 1. Data on the enzymes surveyed are provided in Table 2.
Upon arrival in the laboratory all slugs were frozen and kept at -80°C until electrophoresis. Sample preparation and electrophoretic procedures for discontinuous (disc) and continuous (cont) PAGE were described by Backeljau (1987, 1989b). Staining recipes for the enzymes listed in Table 2 were adapted from Harris & Hopkinson (1976) and Richardson, Baverstock & Adams (1986).
Electromorphs (alleles) were designated alphabetically according to decreasing electrophoretic mobilities (A = fastest allele = the band with the most anodal position). The BIOSYS-I computer program of Swofford & Selander (1981) was used to analyse the data. Samples of A. subfuscus were pooled into two ‘populations’ corresponding to PGM genotypes. Allele frequencies were calculated and employed to derive Nei’s (1978) unbiased genetic identity and distance, as well as Wright’s (1978) Prevosti distance. The statistical significance of the difference between genetic distances was estimated using the jackknife procedure implemented by the computer program of Lessios ( 1990). The jackknifed means of genetic distances were also tested independently
6 T. BACKELJAU E T A L
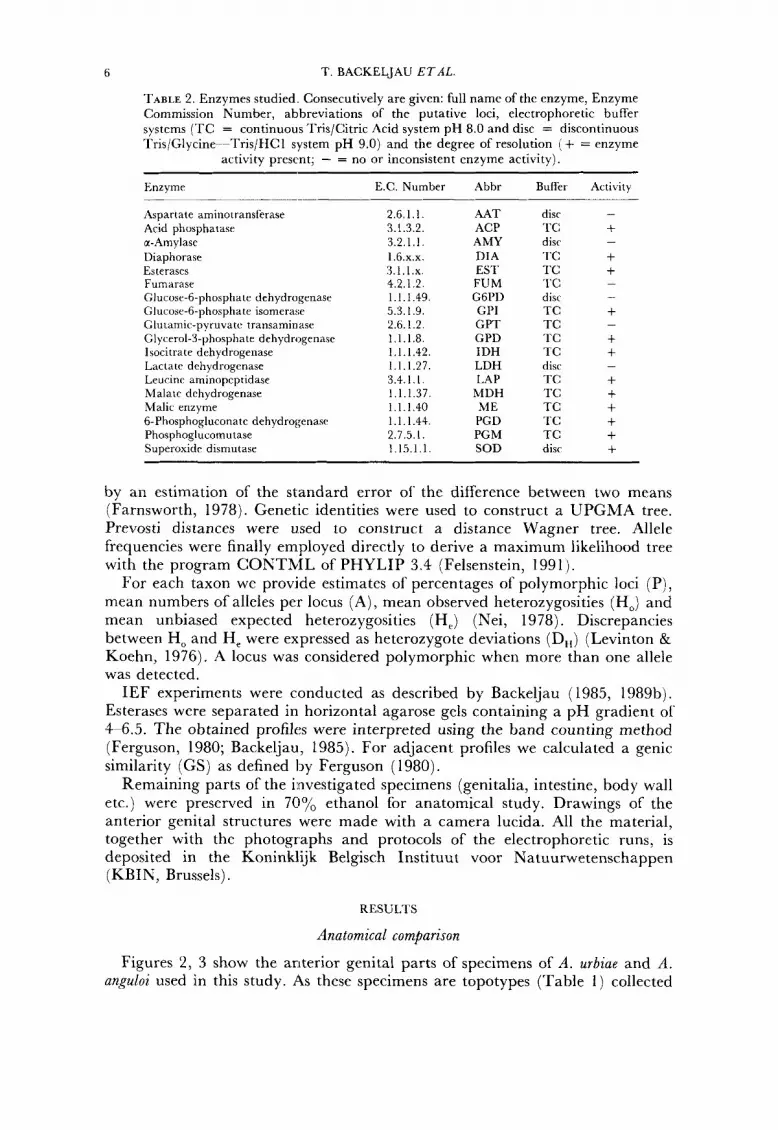
TABLE 2. Enzymes studied. Consecutively are given: full name of the enzyme, Enzyme Commission Number, abbreviations of the putative loci, electrophoretic buffer systems (TC = continuous Tris/Citric Acid system pH 8.0 and disc = discontinuous Tris/Glycine---Tris/HCl system p H 9.0) and the degree of resolution (+ = enzyme
activity present; - = no or inconsistent enzyme activity).
Enzyme E.C. Number Abbr Buffer Activity
Aspartate aminotransferase Acid phosphatase a-Amylase Diaphorase Esterases Fumarase Glucose-6-phosphate dehydrogenase Glucose-6-phosphate isomerase Glutamic-pyruvate transaminase Glycerol-3-phosphate dehydrogenase lsocitrate dehydrogenase Lactate dehydrogenase Leucine aminopeptidase Malate dehydrogenase Malic enzymr 6-Phosphogluconate dehydrogenase Phosphoglucomutase Superoxide dismutase
2.6.1.1. 3.1.3.2. 3.2.1.1. I .6.x.x. 3.1.1.x. 4.2.1.2. 1.1.1.49. 5.3. I .9. 2.6.1.2. 1.1.1.8. 1.1.1.42. 1.1.1.27. 3.4.1.1. 1.1.1.37. 1.1.1.40 1.1.1.44. 2.7.5.1. 1.15.1.1.
AAT ACP AMY DIA EST FUM G6PD GPI GPT GPD IDH LDH LAP
MDH ME PGD PGM SOD
disc - T C + disc -
T C + T C + T C - disc -
T C + T C -
T C + T C + disc -
T C + T C + T C + T C + T C + disc +
by an estimation of the standard error of the difference between two means (Farnsworth, 1978). Genetic identities were used to construct a UPGMA tree. Prevosti distances were used to construct a distance Wagner tree. Allele frequencies were finally employed directly to derive a maximum fikelihood tree with the program CONTML of PHYLIP 3.4 (Felsenstein, 1991).
For each taxon we provide estimates of percentages of polymorphic loci (P), mean numbers of alleles per locus ( A ) , mean observed heterozygosities (H,) and mean unbiased expected heterozygosities (He) (Nei, 1978). Discrepancies between H, and H, were expressed as heterozygote deviations (DH) (Levinton & Koehn, 1976). A locus was considered polymorphic when more than one allele was detected.
IEF experiments were conducted as described by Backeljau (1985, 198913). Esterases were separated in horizontal agarose gels containing a pH gradient of 4-6.5. The obtained profiles were interpreted using the band counting method (Ferguson, 1980; Backeljau, 1985). For adjacent profiles we calculated a genic similarity (GS) as defined by Ferguson ( 1980).
Remaining parts of the investigated specimens (genitalia, intestine, body wall etc.) were preserved in 70% ethanol for anatomical study. Drawings of the anterior genital structures were made with a camera lucida. All the material, together with the photographs and protocols of the electrophoretic runs, is deposited in the Koninklijk Belgisch Instituut voor Natuurwetenschappen (KBIN, Brussels).
RESULTS
Anatomical comparison
Figures 2 , 3 show the anterior genital parts of specimens of A . urbiae and A . anguloi used in this study. As these specimens are topotypes (Table 1 ) collected

SIMILARITY BETWEEN ARZON URBIAE AND A . ANGULOl 7
0
I
-
4083 - 1 4077 - 4 Figure 4. Anterior genital parts of A . subfuscus-S (4077-4: Champlon, Belgum; 4083-1. Antwerp, Belgium). Scale lines = 1 mm. Abbreviations as in Fig. 2
and identified by the authors who originally described the two species (AJDW & RM), there can be little doubt of their identification. The drawings were made by a third, ‘unbiased’ student of arionids (TR) . They reveal that there is no quantifiable size difference between the ligula of the two species. Similarly, no substantial size difference could be observed between the epiphallic papillae.
The anterior genital parts of the two A . subfuscus PGM types are presented in Figs. 4, 5. They are very similar to those of A . urbiae and A . anguloi. Surprisingly,
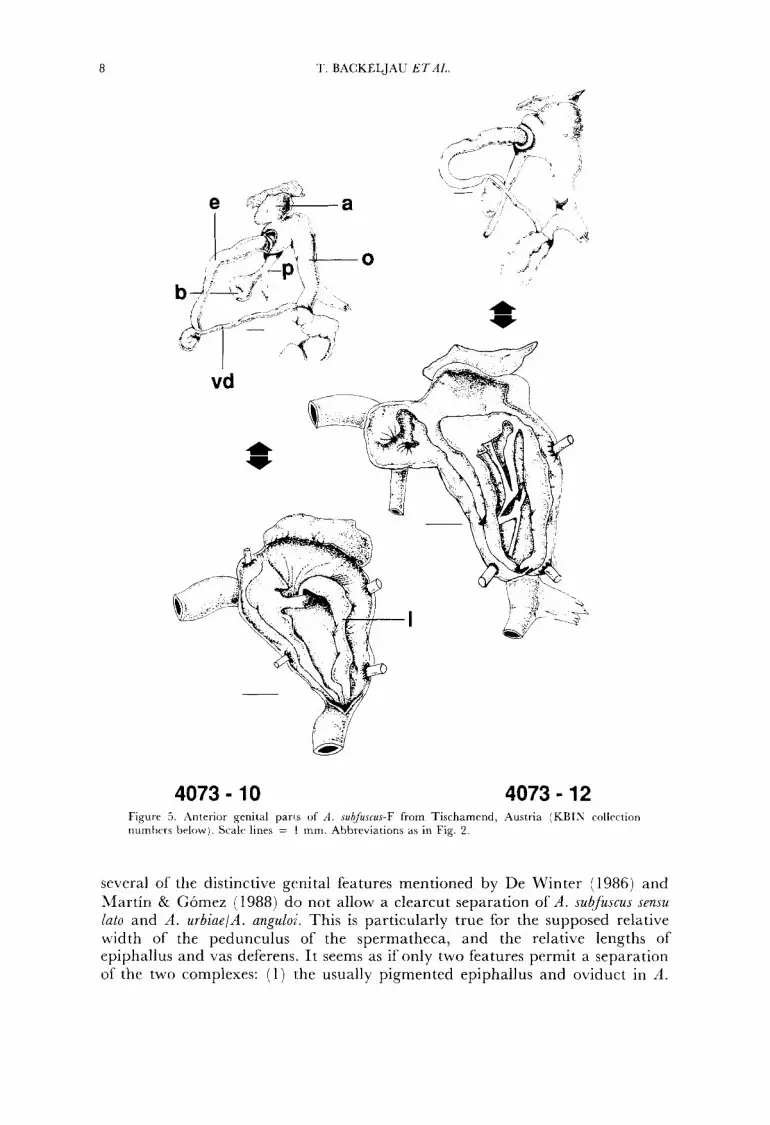
8 '1.. BACKELJAU ETAI,.
4073 - 10 4073 - 12 Figure 5 . Anterior genital pans of 11. subfuscus-F from Tischamrnd, Austria (KBIN collection nurntxrs bclowj. Scalr lines = I mm. Abbrrviations as in Fig. 2.
several of the distinctive genital features mentioned by De Winter (1986) and Martin & Gomez (1988) do not allow a clearcut separation of A . subfuscus sensu lato and il. urbiae/A. anguli . This is particularly true for the supposed relative width of the pedunculus of the spermatheca, and the relative lengths of epiphallus and vas deferens. I t seems as if only two features permit a separation of the two complexes: (1 ) 1.he usually pigmented epiphallus and oviduct in A.

SIMILARITY BETWEEN ARI0.W URBIAE AND A. AXGL'LOI 9
TABLE 3. Allele frequencies at 12 polymorphic loci in the four species surveyed. PGD was monomorphic for the same allele in all populations. A: A . anguloi; U: A . urbiae; S: A . subfuscus-S; F:
A. sub fuscu5-F.
Locus A u S F Locus A U S F
AMY-1 (N) 7 8 3 4 FUM-1 (N) 6 8 3 4 1.000 A 1.000 1.000 1.000 ~
~ - A 0.500 B
C 1.000 1.000 ~ C 0.500
A - ~ 1.000 A 0.083 ~ - B 0.143 0.063 ~ ~
C 0.071 0.563 ~ C 0.917 1.000 - 1.000 D 0.786 0.374 0.500 ~ GPT-I (N) 5 7 3 4
A ~ 0.687 ~ GDH-1 (N) 7 7 2 4
~ - ~ 1.000 B -
~ ~ ~
PGM-1 (N) 7 8 3 4 IDH-1 (N) 6 7 3 3 ~
~ 1.000 ~~
~~ B ~
0.500 ~ A 1.000 1.000 0.833 1.000 - E SOD-1 (N) 7 8 3 4 B ~ 0.167 ~~
~
~ ~ B 1.000 0.313 1.000 1.000 A - 0.250 SOD-2 (N) 7 8 3 4 B - 0.250
A B 1.000 1.000 ~~ D 1.000 1.000 1.000 0.375
I .ooo 1.000 A A B 0.286 0.250 ~ B C 0.714 0.750 1.000 --- C 1.000 0.857 0.167 ~
A B C 1.000 1.000 ~ 0.501) C ~ 1.000 0.333 D
~
~ ~ 1.000 1.000 C - 0.125 -
~
GPD-1 (N) 7 8 3 4 LAP-I ( N ) 6 7 3 4 ~ ~ ~ ~ - -
~
~ 0.143 0.833 ~~
DIA-1 ( N ) 8 8 2 4 ME-1 ( N ) 6 7 3 3 ~
~ 0.500 A 1.000 1.000 - -. ~
~ ~ 0.500 ~ B - 0.667
0.500
.~ -
~
~ -
urbiae/A. anguloi and ( 2 ) the more robust and prominent ligula and atrium of A. subfuscus sensu lato.
Population genetics
Twelve out of 18 enzymes assayed yielded profiles suitable for further analysis. They were assumed to represent 13 putative loci, whose allele frequencies are given in Table 3. The zymograms of AAT and EST were not considered, as they were either too complex (EST) or too incompletely resolved (AAT). GPI, MDH, LDH and ACP were not used because their resolution was too poor. For SOD, two zones of activity were distinguished (Fig. 6B), one of which (SOD-1) was interpreted in terms of presence or absence of bands, possibly involving a null allele.
A summary of the obtained population genetic data is provided in Table 4, which shows that the four taxa are comparable with respect to the degree of polymorphism and the number of alleles per locus. The differences between Ha and H, in A. anguloi, A . subfuscus-S and A. subfuscus-F appear to be relatively small, particularly if one considers the pooling procedure employed in case of A. subfuscus sensu lato populations. In A. urbiae, on the contrary, there is a marked discrepancy between Ha and He, resulting in a strong heterozygote deficiency (Table 4).
Although the four separate 'populations' have comparable population genetic features, this is no longer the case when the taxa are pooled two by two. The

10 T. BACKELJAU ETAL.
TABLE 4. Summary of genetic variability measures before and after pooling species. N: mean number of specimens studied; A: mean number of alleles per locus; P: percentage of polymorphic loci; H,: mean observed heterozygosity; He: mean unbiased expected heterozygosity (Nei, 1978);
D,: mean heterozygote deviation. Standard errors in parentheses.
Population N A P H, H, DE
A. anguloi 6.16 1.3 23.1 0.046 0.076 -0.068
A. urbiae 7.16 1.4 30.8 0.038 0.131 -0.236 (0.2) (0.2) (0.034) (0.043)
(0.1) (0.2) (0.030) (0.059)
(0.3) (0.2) (0.031) (0.059)
(0.1) (0.1) (0.080) (0.069)
(0.1) (0.2) (0.074) (0.085)
(0.1) (0.3) (0.051) (0.080)
Pooled 14 2 1.5 38.5 0.042 0.130 -0.244
A. SubjiicUs-S 2.8 1.3 30.8 0.128 0.149 -0.026
A. subfuscus-F 3.8 1.5 30.8 0.109 0.192 -0.141
Pooled 6.7 2.3 76.9 0.1 19 0.429 -0.509
values for A, H,, H, and D,, in the mixed population of A . urbiae and A . anguloi are similar to the values of these taxa separately (Table 4). In addition, a 1 polymorphic loci in the mixed population are also polymorphic in at least one of the segregates. The P value in the mixed population is therefore only moderately larger than in the separate taxa (Table 4).
The P value of the mixed A . subfuscus population, on the contrary, is more than twice as large as the corresponding values in the F and S populations respectively (Table 4). This is due to the fact that three originally monomorphic loci (AMY, GPD and IDH) become polymorphic after mixing up the two types. Table 4 shows that He in the mixed population is also more than twice as large as He in either of the PGM genotypes. H,, on the other hand, remains nearly unaffected after pooling. The discrepancy between He and H, becomes thus much larger in the mixed population, yielding a strong heterozygote deficiency.
Systematics
None of the loci studied were fixed for alternative alleles in A . urbiae and A . anguloi. Nonetheless, both taxa could be easily distinguished from A . subfuscus sensu lato using AMY-1 (Fig. 6D), SOD-2 (Fig. 6B) and ME-1. Nei’s (1978) unbiased genetic identity between A. urbiae and A . anguloi is consequently very high (I = 0.947), while it drops dramatically to I < 0.550 in all other pairwise comparisons (Table 5). Nei’s (1978) unbiased genetic distance between A . urbiae and A . angutoi is therefore more than 10 times smaller than the distances observed for other combinations (Table 5). This picture does not change when the two PGM genotypes of A . subfuscus are mixed in a single population, for then the D values become D = 0.581 for A . subfuscus-S + F/A. anguloi and D = 0.689 for A . subfuscus-S + F/A. urbiae (D between A . anguloi and A . urbiae remains of course unaltered at D = 0.054).
The two PGM types of A . subfuscus, on the contrary, are genetically very different. They can be distinguished at seven of the loci surveyed (Table 3) . Nei’s (1978) unbiased genetic identity between the two genotypes is therefore very low

SIMILARITY BETWEEN ARIOX URBIAE AND A. ANGULOI 11
1 2 3 4 5 6 7 8 9 1011121314 15
A A A A A A A A U U U U U U S F
B A A U U F F S A A U U F F S
C Figure 6. PAGE profiles of four enzymes surveyed in A . urbiae (U), A. anguloi (A), A . subfuscus-S (S) and A. subfuscus-F (F). A: PGM variation in A . subfuscus scnsu lato, type F (1-4, 8-10 and 12-13, all from Tischamend, Austria), type S (5-6: Renkum, the Netherlands; 7: Sierra de Aitzgorri, Spain; 11: Antwerp, Belgium; 14-15: Champlon, Belgium). B: variation in SOD-I and SOD-2. C: IDH variation. D: AMY variation.
(I = 0.421) and even smaller than the I values between both genotypes and A . anguloi (Table 5).
Table 6 presents the jackknifed means and standard errors of the D values from Table 5. In Table 7 we used the standard error of the difference in means to estimate the statistical significance of the differences between the jackknifed distances. Apparently, the D value between A . urbiae and A . anguloi is
TABLE 5. Nei’s (1978) unbiased genetic identi- ties (below diagonal), distances (above diagonal) and Wright’s (1978) Prevosti dis- tances (above diagonal, in parentheses) between A. anguloi (A), A. urbiae (U) , A. subfus-
cus-S (S) and A. subfuscus-F (F).
Population A U S F
A: A . anguloi ~ 0.054 0.635 0.852 (0.111) (0.522) (0.631)
U: A . urbiac 0.947 - - 0.738 0.956 (0.571) (0.678)
S: A. SubfuscUs-S 0.530 0.478 - 0.864 (0.651)
F: A. Subfuscus-F 0.427 0.384 0.421 -

12 ‘r. BACKELJAU ETAL.
TABLE 6. Jackknifed means of Nei’s genetic distanceis (above diagonal) and their standard errors (below diagonal) as calculated with the
program of Lessios ( 1990).
Population A U S F
A: A. anguloi ~ 0.052 0.601 0.794 U: A . urbiae 0.043 - 0.697 0.890 S: A . Stiq/usCus-S 0.266 0.292 ~ 0.804 E‘: A . J U ~ ~ U J C U J - F 0.338 0.364 0.346 ~
significantly smaller than the corresponding values for other comparisons. The same significance levels were obtained with the program of Lessios (1990), except for the difference between the D values of A. urbiae/A. anguloi and A. anguloild. subfuscus-S, which was just not sufficient to be significant at the a = 0.05 level.
Fig. 7 shows the UPGMA, dendrogram based on Nei’s (1978) genetic identities of Table 5. The Wagner tree derived from the Prevosti distances (Table 5) yields exactly the same topology. The maximum likelihood tree obtained with CONTML, however, suggests that A. subfuscus-S and A. subfuscus-F are clustered together before joining the A. urbiaelil. anguloi cluster.
The results of the IEF analysis (Fig. 8) were highly congruent with those of the locus-by-locus survey. ‘Table 8 shows that the genic similarity between A. urbiae and A . anguloi is much larger than the remaining interspecific GS values. ’4ctually it is even larger than the intraspecific similarities of A . anguloi and A.
Once again both PGM genotypes of A. subjiuscus appear to be very different. This is reflected by the very low interspecific GS value opposed to the much larger intraspecific GS values.
rub f k c u s - S .
UISCUSSIO~
The high genetic identity between A. urbiae and A. anguloi ( I = 0.947) clearly falls within the range of values usually observed among conspecific animal populations (Thorpe, 1982). The genetic identity between the two PGM genotypes of A . subjiuscus (I = 0.421 j , on the other hand, is of the magnitude of interspecific comparisons (Thorpe, 1982). Indeed, Dolan & Fleming (1988) and Backeljau & De Bruyn (1990) reported 1 values of 1 < 0.554 for interspecific
0.40 0.50 0.60 0.70 0.80 0.90 1.00 - I I I I I I I 1
- U S F
Figure 7. Ll’GM.4 dendrogram 3f-l . urbiae (Lj, A. anguloz (A), A . whfuscus-S ( S I and A. subfuscuc-F F;. bascd on Nri’s (1978) unbiased grnrtic idmtities.

SIMILARITY BETWEEN ARION URBIAE AND A. ANGULOI
A A A U U U A U S F A F S A S
13
Figure 8. IEF profiles of esterases in A. urbiae (U) , A. anguloi (A), A. subfuscus-S (S) and A. subfiscus-F (F). The arrow indicates the sample application site.
comparisons among five Arion species, while McCracken & Selander ( 1980), Backeljau & De Bruyn (199 1) and Backeljau et al. (1992) found genetic identities of I 2 0.870 for comparisons between conspecific strains of A . intermedius Normand, 1852. Examples of other intra- and interspecific I values in pulmonates supporting these tendencies are provided by Backeljau et al. (1992).
Important in this discussion is that the genetic distance between A . urbiae and A . anguloi is statistically significantly smaller than the other ‘interspecific’ D values we observed (Tables 5-7). This too suggests that i t actually may refer to an ‘intraspecific’ distance.
Of course there are pulmonate genera (e.g. Partula and Samoana) showing very high interspecific genetic identities (I 2 0.890) (Johnson, Clarke & Murray, 1977; Johnson, Murray & Clarke, 1986a, b, c). However, these cases represent recent and remarkably diversified species flocks, in which uniparental
TABLE 7. Statistical significance (at a level indicated) of the differences between the jackknifed means of Nei’s genetic distances in Table 6. N: not significant; *: only significant when tested with an estimation of the standard error of the difference between two means (Farnsworth, 1978), but not with the program of Lessios (1990). Abbreviations of species
names as in Tables 5 and 6.
Compared distances A-U A-S A-F U-S U-F
A- S 0.05* ~
A- F 0.05 N ~
u-s 0.05 N N ~
U-F 0.05 N N N ~
S-F 0.05 N N N N

14 T BACKELJAU E T A L .
reproduction is not exceptional and which live in very particular island situations. In A. urbiae and anguloi, uniparental reproduction seems not predominant, since (1 ) both species produce spermatophores (De Winter, 1986; Martin & Gomez, 1988; 13ackeljau, pers. obs.), and (2) both reveal unfixed heterozygous genotypes (see Fig. 6C). It is clear that this evidence is far from solid, for automictic uniparental reproduction (contrary to autogamy and apomixis) can still provoke a certain amount of crossing over and segregation (resulting in unfixed heterozygous genotypes) (e.g. White, 1973; Mogie, 1986), whereas the transfer of spermatophores does not necessarily mean that fertilization is performed by allosperm. In certain Arion species, uniparental and allogamic reproduction may even occur simultaneously in single egg clutches (Williamson, 1959). Anyhow, in the present case there are no data suggesting that A . urbiae and A . anguloi would not be allogamic, and thus until compelling evidence indicates otherwise it is reasonable to consider these slugs as outcrossers.
Despite this, and even if we accept the regular occurrence of uniparental reproduction in these species, there still is no reason to assign them the status of different species, for we already indicated above that their genetic identity is comparable to that of conspecific strains in uniparental species such as A. intermedius. Moreover, genetic identities between conspecific strains of other uniparental species (including arionids) are often much lower (Backeljau & De Bruyn, 1991; Backeljau, unpublished data). Hence, if A. urbiae and A . anguloi are selfers or parthenogens, their high genetic identity only reinforces the idea that they are conspecific strains. Note that the biological species concept by definition cannot be applied in uniparental organisms and it is customary in such cases to refer the different strains to a single ‘species’ (e.g. agamospecies) (Hebert & Loaring, 1986; Scudder, 1987).
The conspecificity of A. urbiae and A . anguloi is also supported by the fact that mixing the species has little effect on population genetic measures such as A, H, and H, (Table 4). This indicates that the two populations have highly compatible, homogeneous and similarly structured gene pools.
A further argument to unite A. urbiae and A . anguloi into a single species is provided by the genic similarities (GS). These show that the intraspecific GS values in both species (resp. GS = 0.80 and GS = 0.62; see Table 8) are highly similar to the corresponding values in A. hortensis (GS = 0.76) and A . distinctus (GS = 0.68) (Backeljau, 1985). However, the interspecific GS value for A . hortensisld. distinctus drops to GS = 0.3 1, whereas that for A. urbiae/A. anguloi does not decrease at all (GS = 0.66) (Table 8). Nevertheless, with respect to their respective con (sub) generic reference species, both complexes show similar steep declines of GS values, viz. (JS 5 0.14 in case of comparisons between A . hortensis sensu lato and A . intermedius (Backeljau, 1985) and GS 5 0 . 1 8 for comparisons between A. urbiae or A. anguloi and A. subfuscus sensu lato (Table 8 ) .
Consequently, our electrophoretic analyses indicate that at the allozyme level there are no grounds to clonsider A . urbiae and A. anguloi as different species, irrespective of the breeding system involved. In the same way our anatomical comparison suggests that there are no clear-cut diagnostic differences between the two species.
Martin & Gomez (1988) differentiated A. urbiae and A. anguloi by colour characteristics. However, in terrestrial slugs colour features often depend on food, age and (micro)environmental conditions (see references listed by

SIMILARITY BETWEEN A R I O N U R B I A E AND A . A N G U L O I
TABLE 8. Mean genic similarities between A. anguloi (A), A. urbiae (U), A. subfuscus-S (S) and A. subfuscus-F (F). Numbers of comparisons
involved in parentheses.
15
Population A U S F
A. A . anguloi 0.62 0.66 0.12 0.14 ( N = 2 ) ( N = 4 ) ( N = 2 ) ( N = 2 )
U: A . urbiae 0.80 0.18 -
( N = 2) ( N = 1) (-) S: A . subfuscus-S 0.57 0.28
F: A . subfurcus-F 0.80 ( N = 6) ( N = 7)
( N = 4)
Backeljau & De Bruyn, 1990). For instance, Backeljau et al. (1992) demonstrated that A. pascalianus Mabille, 1868, in the island of Flores is merely a darkly mottled colour morph of A. intermedius, while Backeljau & De Bruyn (1991) found no correlation between colour variation and particular genotypes in this species. Other arionid species also show extreme colour poiymorphisms, which do not necessarily indicate species boundaries, e.g. A. rufus (Linnaeus, 1758) and A. subfuscus sensu lato (e.g. Scharff, 1891; Taylor, 1907; Chichester & Getz, 1969, 1973). I t is therefore reasonable to assume that the colour differences between A. urbiae and A. anguloi represent an intraspecific polymorphism, possibly reflecting effects of environmental factors such as temperature, humidity and photoperiod.
Such environmental factors also affect the development of pulmonate reproductive organs and gametes (e.g. Lusis, 1966; Smith, 1966; Nicklas & Hoffmann, 198 1 ; Emberton, 1985; Gomot & Griffond, 1987; Medina, Griffond & Gomot, 1988). Hence, the subtle genital differences between A. urbiae and A. anguloi, as originally reported by Martin & G6mez (1988), may involve intra- specific variations too. Moreover, several Arion species show more extensive genital polymorphisms than implied by the differences between A. urbiae and A. anguloi, e.g. the variation of the penial papilla in A. owenii (Backeljau & Van Beeck, 1986) or the structure of the oviduct in A. distinctus (Davies, 1977, 1979; De Winter, 1984; Backeljau, 1985).
In contrast to A. urbiae and A. anguloi, it appears that the PGM genotypes of A. subfuscus are genetically very distinct. This follows from their very low ‘intraspecific’ genetic identity (I = 0.421). This figure is very similar to the I value between two forms of A. subfuscus ( I = 0.467), which were regarded as distinct species by Foltz et al. (1982). Genetic identities among other forms of A. subfuscus range between I = 0.816 and I = 0.940 (McCracken & Selander, 1980; Foltz etal., 1982).
Furthermore, the fact that mixing the two genotypes results in a strong alteration of several population genetic measures, particularly of P and H, (Table 4), indicates that A . subfuscus sensu lato represents a heterogenous gene pool. As a consequence most polymorphic loci in the mixed population become strongly heterozygote deficient.
Finally, the genic similarities of the two PGM genotypes of A. subfuscus sensu lato also show a clear difference between ‘intra’- and ‘interspecific’ values (Table 8). These data too suggest that the two genotypes might represent different
16 T. BACKELJAU E T A L .
species. However, the rela1.ionships between these two species and A. urbiae/A. anguloi remain controversial since the distance matrix trees (UPGMA and Wagner; Fig. 7) yielded another topology than the maximum likelihood tree.
Whether the evidence presented above is sufficient to support the conspecificity of A . urbiae and A . anguloi and/or the specific status of the PGM genotypes of A . subfuscus .rensu lato is in part a matter of personal opinion, depending on how the term 'species' is interpreted. Related to this is the weight one is willing to give to the different types of evidence provided (morphological vs electrophoretic data). Basically, we have no preferences at this point, although as we relied on the biological species concept we must emphasize that electrophoretic evidence enabling the direct estimation of reproductive isolation and genetic divergence should be considered as a very powerful, if not decisive, argument. Anyhow, the present case shows that it is easier to create new (biological) species based on supposed morphological differences than it is to demonstrate afterwards that these differences actually do not warrant such conclusions.
C:ONCLUSIONS
Our analysis indicates that the morphological and anatomical differences between A. urbiae and A. anguloi, if they are real, do not warrant a specific distinction. Therefore, we tentatively conclude that A. urbiae and A. anguloi refer to a single, polymorphic species, which according to the priority rule must be referred to as A . urbiae De 'Winter, 1986.
With respect to the PGM genotypes of A . subfuscus, our data suggest that two distinct species are involved. However, a detailed account of this species complex and its nomenclature will be published elsewhere.
ACKNOWLEDGEMENTS
We are indebted to W. Verheyen and J. Hulselmans (both of the University of Antwerp) for providing us with the necessary working facilities. H. Lessios j Miami, U.S.A.) helped with the application of his computer program. J. Van Goethem (KBIN, Brussels) and two anonymous referees gave valuable comments on the manuscript. Specimens of A . subfuscus were kindly provided by M. Bodon (Genoa, Italy:i, C. Frank (Vienna, Austria) and T. Warmoes (Antwerp, Belgium). H . Van Paesschen (KBIN, Brussels) and R. Schaerlaeken (University of Antwerp), helped with the preparation of the illustrations. This work was supported by FJBR Grant 2.0004.91.
REFERENCES
Backeljau T. 1985. Lstirnation of genic similarity within and between Arion horf~nsts s.1. and 4 . inlermedins by mrans of isoelectric forused esterase patterns in hepatopancreas homogenates (Mollusca, Pulrnonata: Arionida?. i 'ez/schri f l Jur zoologische Sq'stematzk und Euolulionsforschung 23: 38-49.
Backeljau T. 1987. Electrophoretic distinction between Arion hortensu, A . distinctus and rl. orrtenzi /Molluscs: I'ulmonata 8 . <oZou/ugi,cher Anzeiger 5!19 33-39.
Backeljau T. 1989a. A review of the genus Arton in Belgium (Mollusca, Pulmonata). I.'erlznndeiingen ['an he/ . Svmposium "Invertebrakn van Belgie", RiussrlJ: 95599.

SIMILARITY BETWEEN A R I O N U R B I A E AND A . ANGULOI 1 7
Backeljau T. 1989b. Electrophoresis of albumen gland proteins as a tool to elucidate taxonomic problems in the genus Arion (Gastropoda, Pulmonata). Journal of Medical and Applied Malacology 1: 2 9 4 1 .
Backeljau T, De Bruyn L. 1990. O n the infrageneric systematics of the genus Arion Fkussac, 1819 (Mollusca, Pulmonata). Bulletin de I‘lnstitut Royal des Sciences Naturelles de Belgique, Biologie 60: 35-68.
Backeljau T, De B r u p L. 1991. Preliminary report on the genetic variability of Arion intermedius in Europe (Pulmonata). Journal of Medical and Applied Malacolou 3: 19-29.
Backeljau T, De Van Beeck M. 1986. Epiphallus anatomy in the Arion hortensis species aggregate (Mollusca, Pulmonata). zoologica Scripta 15: 61-68.
Backeljau T, De Brito CP, Tristao Da Cunha RM, Frias Martins AM, De Bruyn L. 1992. Colour polymorphism and genetic strains in Arion intermedius from Flores, Azores (Mollusca: Pulmonata). Biological Journal of the Linnean Society 46: 131-143.
Chichester LF, Cetz LL. 1969. The zoogeography and ecology of arionid and limacid slugs introduced into northeastern North America. Malacologia, 7: 3 13-346.
Chichester LF, Getz LL. 1973. The terrestrial slugs of northeastern North America. Sterkiana 51: 1 1 4 2 . Davies SM. 1977. The Arion hortensis complex with notes on A . intermedius Normand (Pulmonata: Arionidae).
Journal of Conchology 29: 173-187. Davies SM. 1979. Segregates of the Arion hortensis complex (Pulmonata: Arionidae), with the description of a
new species, Arion owenii. Journal of Conchology 30: 123-127. De Winter AJ. 1984. The Arion hortensis complex (Pulmonata: Arionidae): designation of types, descriptions,
and distributional patterns, with special reference to the Netherlands. zoologische Mededelingen, Leiden 59:
De Winter AJ. 1986. Little known and new south-west European slugs (Pulmonata: Agriolomacidae,
Dolan S, Fleming CC. 1988. Isoenzymes in the identification and systematics of terrestrial slugs of the Arzon
Emberton KC. 1985. Seasonal changes in the reproductive gross anatomy of the land snail Triodopsis tridentata
Farnsworth MW. 1978. Genetics. New York: Harper & Row. Felsenstein J. 1991. Phylip (Phylogeny Inference Package) version 3.4. (unpublished manual). University of
Ferguson A. 1980. Biochemical systematics and evolution. Glasgow/London: Blackie. Foltz DW, Ochman H, Jones JS, Evangelisti SM, Selander RK. 1982. Genetic structure and breeding
systems in arionid slugs (Mollusca: Pulmonata). Biological Journal of the Linnean Society 17: 225-241. Gomot P, CrilTond B. 1987. Repercussion de la durCe d’tclairement journalier sur I’tvolution des cellules
nourricitres et de la lignee m2le dans I’ovotestis d’Helix aspersa. Reproduction, Nutrition, Development 27:
Harris H, Hopkinson DA. 1976. Handbook of enzyme electrophoresis in human genetics. Amsterdam/Oxford: North
Hebert PDN, Loaring JM. 1986. Systematics of the Daphnia pulex group: variation in an agamic complex and
Johnson MS, Clarke B, Murray J. 1977. Genetic variation and reproductive isolation in Partula. Evolution
Johnson MS, Murray J, Clarke B. 1986a. Allozymic similarities among species of Partula on Moorea.
Johnson MS, Murray J, Clarke B. 1986b. An electrophoretic analysis of phylogeny and evolutionary rates
Johnson M, Murray J, Clarke B. 1986c. High genetic similarities and low heterozygosities in land snails of
Lessios HA. 1990. A program for calculating Nei’s genetic distances and their jackknifed confidence intervals.
Levinton JS, Koehn RK. 1976. Population genetics of mussels. In: B.L. Bayne ed. Marine mussels: their ecology
Lusis 0. 1966. Changes induced in the reproductive system of Arion ater rufus L. by varying environmental
Martin R, a m e z BJ. 1988. A new slug from the Iberian peninsula: Arion anguloi n. sp. (Pulmonata:
McCracken CF, Selander RK. 1980. Self-fertilization and monogenic strains in natural populations of
Medina A, GrilTond By h o t P. 1988. Influence of photoperiod on differentiation of male cells in Helix
Mogie M. 1986. Automixis: its distribution and status. Biological Journal of the Linnean Society 28: 321-329. Nei M. 1978. Estimation of average heterozygosity and genetic distance from a small number of individuals.
Nicklas NL, Hoffmann RJ. 1981. Apomictic parthenogenesis in a hermaphroditic terrestrial slug, Deroceras
1-17.
Arionidae) , Zoologische Mededelingen, Leiden 60: 135-1 58.
hortcnsis complex. Biochemical Systematics and Ecology 1 6 195-1 98.
tridentata (Pulmonata: Polygyridae). Malacologia 26: 225-239.
Washington: Seattle.
95-108.
Holland Publishing Company.
description of a species new to North America. Biochemical Systematics and Ecology 14: 333-340.
31: 116-126.
Heredig 56: 319-327.
in the genus Partula from the Society Islands. Proceedings of the Royal Society of London B227: 161-177.
the genus Samoana from the Society Islands. Malacologia 27: 97-106.
Journal of Heredity 81: 490.
and physiology London: Cambridge University Press, 357-384.
conditions. Proceedings of the malacological Society of London 37: 19-26.
Arionidae). Archiu f u r Molluskenkunde 118: 167-1 74.
terrestrial slugs. Proceedings of the National Academy of Sciences of the U S A , 77: 684-688.
aspersa. An autoradiographic study. Reproduction, Nutrition, Development 28: 6 17-623.
Genetics 89: 583-590.
laeve (Miiller). Biological Bulletin 160: 123-135.

18 T. BACKELJAU ETAL.
Richardson BJ, Baverstock PRY Adams A. 1986. Allozyme electrophoresis. A handbook f o r animal systematics and
S c h a d R F . 1891. The slugs of Ireland. Transactions o f t h e Royal Dublin Society, N e w Series 4: 513-563. Scudder GGE. 1987. The next 25 yrars: invertebrate systematics. Canadian Journal of <oology 65: 786-793. Smith BJ. 1966. Maturation of the reproductive tract of Arion ater (Pulmonata: Arionidae). Malacologia 4:
Swofford DL, Selander RB. 1981. BIOSYS-I: a FORTRAN program for the comprehensive analysis of
Taylor JW. 1907. Monograph of the land- @freshwater Mollusca of the British Isles. Leeds: Taylor Brothers. Thorpe JP. 1982. The molecular clock hypothesis: biochemical evolution, genetic differentiation and
Wald6n HW. 1976. A nomenclatura.1 list of the land Mollusca of the British Isles. ~ o u r n d of Conchology 29:
White MJD. 1973. Animal cytology and evolution (3rd edition). Cambridge University Press: Cambridge. Williamson PG. 1959. Studies on the colour and genetics of the black slug. Proceeding5 o f the Royal Physical
Wright S. 1978. Eaolution and the genetics of populations, Volume 4. VariabiliQ within and among natural populations.
population structure. Sydney: Academic Press.
325-349.
electrophoretic data in population genetics and systematics. Journal of Heredity 72: 281-283.
systematics. Annual Reuiew o f Ecolo:y and Systematics 13: 139-168.
21-25.
Society of Edinburgh 27: 87-93.
Chicago: University of Chicago.
Copyright © 2022 FDOKUMEN