Genetic variance for body size in a natural population of Drosophila buzzatii
12
Copyright 0 199 1 by the Genetics Society of America Genetic Variance for Body Size in a Natural Population of Drosophila buzzatii Alfredo Ruiz,* Mauro Santos,* Antonio Barbadilla,” Jorge E. Quezada-Diaz,* Esteban Hasson? and Antonio Fontdevila* *Departament de Genitica i de Microbiologia, Universitat Autonoma de Barcelona, 08193 Bellaterra (Barcelona), Spain, and ?G.I.B.E. Departamento deCiencias Bioldgicas, F.C.E. y N., Ciudad Universitaria Nuriez, 1428 Buenos Aires, Argentina Manuscript received June 8, 1990 Accepted for publication April 11, 199 1 ABSTRACT Previous work has shown thorax length to be under directional selection in the Drosophila buzzatii population of Carboneras. In order to predict the genetic consequences of natural selection, genetic variation for this trait was investigated in two ways. First, narrow sense heritability was estimated in the laboratory Fn generation of a sample of wild flies by means of the offspring-parent regression. A relatively high value, 0.59, was obtained. Because the phenotypic variance of wild flies was 7-9 times that of the flies raised in the laboratory, “natural” heritability may be estimated as one-seventh to one- ninth that value, Second, the contribution of the second and fourth chromosomes, which are polymorphic for paracentric inversions, to the genetic variance of thorax length was estimated in the field and in the laboratory. This was done with the assistance of a simple genetic model which shows that the variance among chromosome arrangements and the variance among karyotypes provide minimum estimates of the chromosome’s contribution to the additive and genetic variances of the trait, respectively. In males raised under optimal conditions in the laboratory, the variance among second-chromosome karyotypes accounted for 11.43% of the total phenotypic variance and most of this variance was additive; by contrast, the contribution of the fourth chromosome was nonsignificant. The variance among second-chromosome karyotypes accounted for 1.56-1.78% of the total pheno- typic variance inwildmales and was nonsignificant in wild females. The variance among fourth chromosome karyotypes accounted for 0.14-3.48% of the total phenotypic variance in wild flies. At both chromosomes, the proportion of additive variance was higher in mating flies than in nonmating flies. B ODY size is the most obvious and easily observa- ble phenotypic trait in most animals and there is compelling evidence indicating that it is directly re- lated to fitness. In Drosophila, evidence on the adap- tive nature of body size comes from the observation of latitudinal and altitudinal clines and cyclic seasonal changes in several species (PREVOSTI 1955; DAVID and BOCQUET 1975; PARSONS 1983, pp. 43-46; LEMEU- NIER et al. 1986; COYNE and BEECHAM 1987) and from laboratory experiments withpopulationcages (ANDERSON 1966,1973; POWELL 1974; LANDE 1977). Selection is apparently directional since body size is positively correlated with mating success (MONCL~~S and PREVOSTI 197 1 ; PARTRIDGE and FARQUHAR 1983; PARTRIDGE, HOFFMAN and JONES 1987; TAY- LOR and KEKI~ 1988), ovariole number and daily fecundity (ROBERTSON 1957; HEED and MANGAN 1986), longevity (PARTRIDGE and FARQUHAR 1983) and dispersal ability (ROFF 1977). In addition, larger flies withstand better a number of ecologically rele- vant environmental stresses such as desiccation or anoxia (PARSONS 1973). Whether body size is nega- This paper is No. XVIII of the series “The Evolutionary History of Drosophila buzzatii.” Genetics 128: 739-750 (August, 1991) tively correlated with other components of fitness (e.g., development speed) is not known with certainty at the moment. ROBERTSON (1963) observed a corre- lation between body size and development time in the laboratory but it was dependent on the diet. Thus, it is not clear how this observation applies to natural populations. Recent work carried out in the cactophilic fly Dro- sophila buzzatii (SANTOS et al. 1988; RUIZ and SANTOS 1989; M. SANTOS, A. RUIZ, J. E. QUEZADA-D~Az, A. BARBADILLA and A. FONTDEVILA, unpublished) has provided evidence for a positive correlation between thorax length and the three major adult fitness com- ponents, namely longevity, mating success and fecund- ity, in the natural population of Carboneras (S.E. Spain). Because selection is directional, it is of consid- erable interest to assess the proportion of genetic variance and the heritability of this trait in the same population in order to ascertain the genetic conse- quences of the observed phenotypic selection. In par- ticular, knowledge of the heritability of thorax length would allow a prediction of the response to selection that we would expect, if selection were not acting on other correlated characters (FALCONER 198 1 ; LANDE
-
Upload
independent -
Category
Documents
-
view
0 -
download
0
Transcript of Genetic variance for body size in a natural population of Drosophila buzzatii
Copyright 0 199 1 by the Genetics Society of America
Genetic Variance for Body Size in a Natural Population of Drosophila buzzatii
Alfredo Ruiz,* Mauro Santos,* Antonio Barbadilla,” Jorge E. Quezada-Diaz,* Esteban Hasson? and Antonio Fontdevila*
*Departament de Genitica i de Microbiologia, Universitat Autonoma de Barcelona, 08193 Bellaterra (Barcelona), Spain, and ?G.I.B.E. Departamento de Ciencias Bioldgicas, F.C.E. y N. , Ciudad Universitaria Nuriez, 1428 Buenos Aires, Argentina
Manuscript received June 8, 1990 Accepted for publication April 1 1, 199 1
ABSTRACT Previous work has shown thorax length to be under directional selection in the Drosophila buzzatii
population of Carboneras. In order to predict the genetic consequences of natural selection, genetic variation for this trait was investigated in two ways. First, narrow sense heritability was estimated in the laboratory Fn generation of a sample of wild flies by means of the offspring-parent regression. A relatively high value, 0.59, was obtained. Because the phenotypic variance of wild flies was 7-9 times that of the flies raised in the laboratory, “natural” heritability may be estimated as one-seventh to one- ninth that value, Second, the contribution of the second and fourth chromosomes, which are polymorphic for paracentric inversions, to the genetic variance of thorax length was estimated in the field and in the laboratory. This was done with the assistance of a simple genetic model which shows that the variance among chromosome arrangements and the variance among karyotypes provide minimum estimates of the chromosome’s contribution to the additive and genetic variances of the trait, respectively. In males raised under optimal conditions in the laboratory, the variance among second-chromosome karyotypes accounted for 11.43% of the total phenotypic variance and most of this variance was additive; by contrast, the contribution of the fourth chromosome was nonsignificant. The variance among second-chromosome karyotypes accounted for 1.56-1.78% of the total pheno- typic variance in wild males and was nonsignificant in wild females. The variance among fourth chromosome karyotypes accounted for 0.14-3.48% of the total phenotypic variance in wild flies. At both chromosomes, the proportion of additive variance was higher in mating flies than in nonmating flies.
B ODY size is the most obvious and easily observa- ble phenotypic trait in most animals and there is
compelling evidence indicating that it is directly re- lated to fitness. In Drosophila, evidence on the adap- tive nature of body size comes from the observation of latitudinal and altitudinal clines and cyclic seasonal changes in several species (PREVOSTI 1955; DAVID and BOCQUET 1975; PARSONS 1983, pp. 43-46; LEMEU- NIER et al. 1986; COYNE and BEECHAM 1987) and from laboratory experiments with population cages (ANDERSON 1966,1973; POWELL 1974; LANDE 1977). Selection is apparently directional since body size is positively correlated with mating success ( M O N C L ~ ~ S and PREVOSTI 197 1 ; PARTRIDGE and FARQUHAR 1983; PARTRIDGE, HOFFMAN and JONES 1987; TAY- LOR and K E K I ~ 1988), ovariole number and daily fecundity (ROBERTSON 1957; HEED and MANGAN 1986), longevity (PARTRIDGE and FARQUHAR 1983) and dispersal ability (ROFF 1977). In addition, larger flies withstand better a number of ecologically rele- vant environmental stresses such as desiccation or anoxia (PARSONS 1973). Whether body size is nega-
This paper is No. XVIII of the series “The Evolutionary History of Drosophila buzzatii.”
Genetics 128: 739-750 (August, 1991)
tively correlated with other components of fitness (e.g., development speed) is not known with certainty at the moment. ROBERTSON (1963) observed a corre- lation between body size and development time in the laboratory but it was dependent on the diet. Thus, it is not clear how this observation applies to natural populations.
Recent work carried out in the cactophilic fly Dro- sophila buzzatii (SANTOS et al. 1988; RUIZ and SANTOS 1989; M. SANTOS, A. RUIZ, J. E. QUEZADA-D~Az, A. BARBADILLA and A. FONTDEVILA, unpublished) has provided evidence for a positive correlation between thorax length and the three major adult fitness com- ponents, namely longevity, mating success and fecund- ity, in the natural population of Carboneras (S.E. Spain). Because selection is directional, it is of consid- erable interest to assess the proportion of genetic variance and the heritability of this trait in the same population in order to ascertain the genetic conse- quences of the observed phenotypic selection. In par- ticular, knowledge of the heritability of thorax length would allow a prediction of the response to selection that we would expect, if selection were not acting on other correlated characters (FALCONER 198 1 ; LANDE
740 A. Ruiz et al.
1979, 1982). A nonzero heritability in the field would imply either conclusion: (1) the population is not at equilibrium or (2) if it is at equilibrium, thorax length must be negatively correlated with other selected traits.
The estimation of heritability entails no special problems in the laboratory (FALCONER 198 1) but is a difficult task in natural populations of Drosophila because relatives cannot be identified in the field. Several indirect methods are now available, although all of them require various assumptions, sometimes impossible to verify (COYNE and BEECHAM 1987; RISKA, PROUT and TURELLI, 1989). Using these meth- ods, PROUT and BARKER (1989) have estimated the heritability of thorax length in a natural population of D. buzzatii from Australia. In this work, we provide comparable information for the population of Car- boneras obtained using two different approaches. First, we have estimated the narrow sense heritability of thorax length by means of the offspring-parent regression in the laboratory F2 of a moderately large sample of wild females collected in Carboneras. This provides, under certain assumptions (see DISCUSSION), an estimate of the heritability in the natural popula- tion. Second, we have obtained a minimum estimate of the portion of genetic variance contributed by the second and fourth chromosomes, both in the field and in the laboratory. This was done by relating body size to the karyotype of the flies at these two chromosomes, which are known to be polymorphic for paracentric inversions in D. buzzatii (RUIZ, NAVEIRA and FONT- DEVILA 1984; RUIZ et al. 1986).
A GENETIC MODEL FOR THE BIOMETRICAL EFFECT O F INVERSIONS
In species polymorphic for chromosomal arrange- ments, different karyotypes from natural populations have been sometimes found to differ in their mean value for one or more metrical characters (WHITE and ANDREW 1960, 1962; WHITE, LEWONTIN and AN- DREW 1963; PREVOSTI 1966; KRIMBAS 1967; KRIMBAS and LOUKAS 1980; STALKER 1976; BUTLIN, READ and DAY 1982) and, in some cases, this correlation be- tween karyotype and metrical characters has been shown to have a genetic basis (PREVOSTI 1960, 1967; see also RUIZ and SANTOS 1989). The biometrical effect of inversions is thought to be caused by the association of different arrangements with particular -1leles at loci which influence the trait under consid- eration. Thus, it may be possible to relate the variation observed among karyotypes with the genetic variance of the trait itself.
Consider a very large and panmictic population polymorphic for two chromosome arrangements, ST and IN, in a given pair of autosomes. Let u and v stand for the relative frequencies of the two arrange- ments. The three karyotypes STIST, STIIN and
IN/IN will occur in the population in Hardy-Weinberg proportions, u2, 2uv and v2, respectively. An arbitrary number of loci (n) affecting the phenotypic trait will be considered. They may be located inside the in- verted chromosome segment or close to it. The pop- ulation frequencies of the two alleles at the i locus, Ai and ai, are represented by pi and qi, respectively. This locus is associated with the inversion-polymorphic chromosome and the corresponding gametic associa- tion measured by the determinant of the gamete frequency matrix Di (LEWONTIN and KOJIMA 1960) or by the correlation of gene frequencies pi (HILL and ROBERTSON 1968). Thus, the frequencies of alleles Ai and ai are, respectively, pi + (D , /u ) and q, - (D, /u) within arrangement ST, and p , - (Di/v) and qz + (Di/v) within arrangement I N . In addition, any pair of loci ij may be associated within each of the two chro- mosome arrangements, the association being meas- ured by DV(m and DV([N for chromosomes ST and IN, respectively. The gametic association between the two loci in the total population ( 0 9 ) can be derived using NEI and LI (1973, p. 214) as equal to:
If the n loci act additively on the measured pheno- typic trait ( i .e . , no epistasis) and there are neither genotype-environment interaction nor genotype-en- vironment covariance, the contributions of the n loci to the mean (P), genetic additive variance ( V A ) and dominance variance (VD) of the phenotypic trait in the population, are given by known expressions (AVERY and HILL 1978; EWENS 1979; WEIR, COCKERHAM and REYNOLDS 1980). Also, the mean value of each n-locus genotype is the sum of the contributions of the n one- locus genotypes. Using this principle and the appro- priate gene frequencies given above, the mean phe- notypic value of each karyotype can be derived as:
where ai is the average effect of a gene substitution at the i locus (FALCONER 198 1). From these expressions, the variance among karyotypes (u i ) can be readily calculated:
This variance can be partitioned into two compo- nents, the variance explained by the linear regression on the chromosome dose (uz) and the unexplained or deviation variance (a;), which are analogous to the familiar additive and dominance components of the
Genetic Variance for Body Size 74 1
genetic variance (KEMPTHORNE 1957; FALCONER 1981). From standard statistical theory (SOKAL and ROHLF 1981), the slope of the regression on the chromosome (ST) dose will be:
and the average effects of the two chromosome ar- rangements:
a S T = Dj a i / u ; (YIN = Di ai/v. (7) 1 i
The portion of the variance among karyotypes ex- plained by the linear regression on the chromosome dose is:
a: = p2& = 2(C Di (Y,)*/uv, (8)
which is equivalent to twice the variance of the ar- rangement average effects. Expression (8) is the first term on the right side of expression (5). It follows that the second term must correspond to the variance unexplained by the linear regression, i.e. the deviation variance:
1
a; = 4(C D?d1)2/U2V*. (9) i
The regression variance u: given by (8) can be written as a function of the correlations of gene fre- quencies as follows:
a: = c 2 f i q i a ? p ? + 4 cc a : a j j ~ i p j - (10) i i<j
It can be clearly seen from this expression that in order to get a statistically significant contribution of the regression variance (u:) two conditions have to be fulfilled. First, at least one of the n loci must have a non zero contribution to the additive variance of the population. Second, there must be a gametic associa- tion between those loci contributing to the additive variance and the inversion, which means a differential accumulation of alleles plus and minus in the two chromosome arrangements. When both conditions are met and since p i always lies between -1 and +1, a: provides a minimum estimate of the contribution of the n loci to the additive variance of the population
A simple and explicit relationship between u: and V, can be derived under some simplifying assump- tions. If the n loci (i) are not associated within the two chromosome arrangements; (ii) have the same degree of association with the inversion (p); and (iii) contrib- ute equally to the additive variance; then:
(VAL
2 " Qa n'p2 VA 1 + (n' - l)p2 '
-
where n' = (m - rn')'/n and m(m') stands for the number of loci showing a positive (negative) gametic
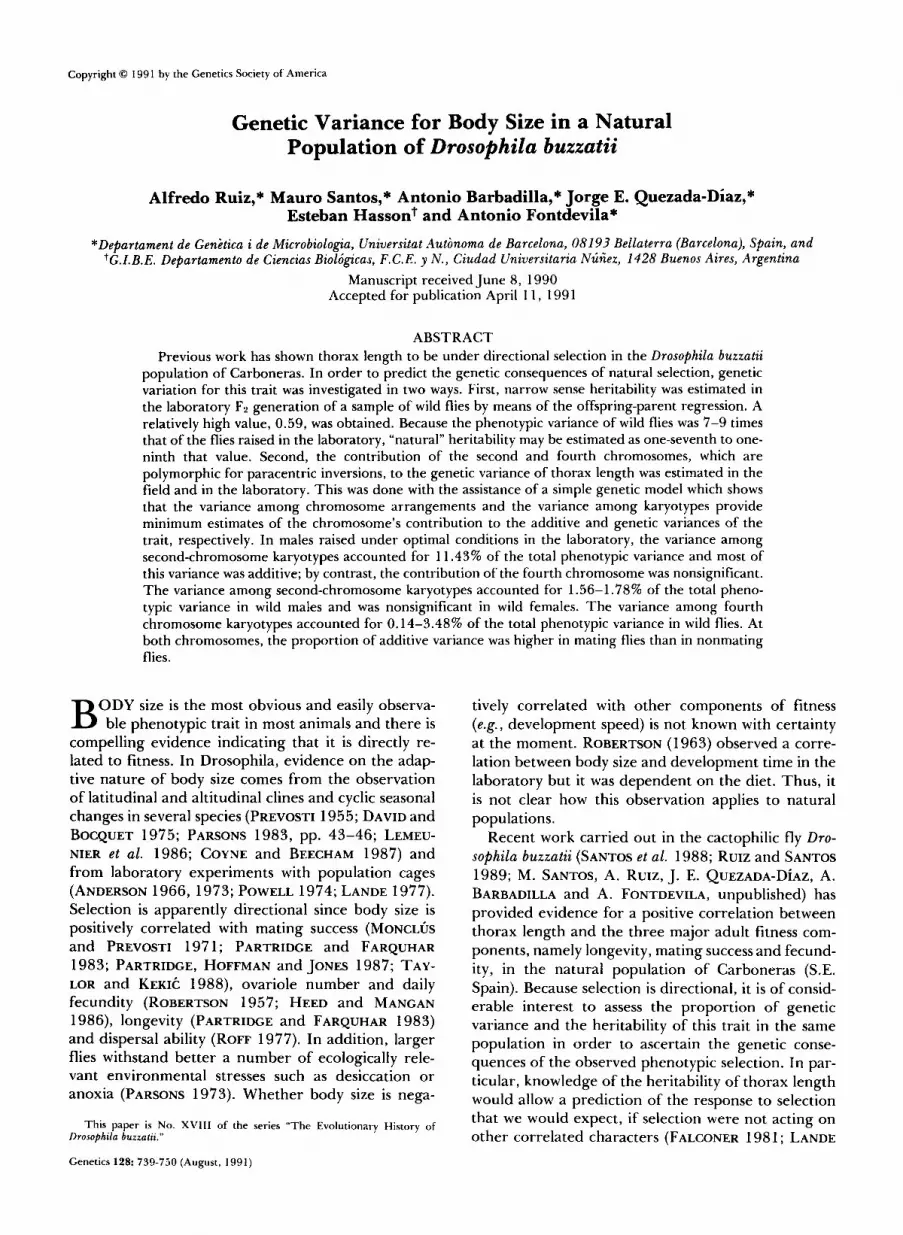
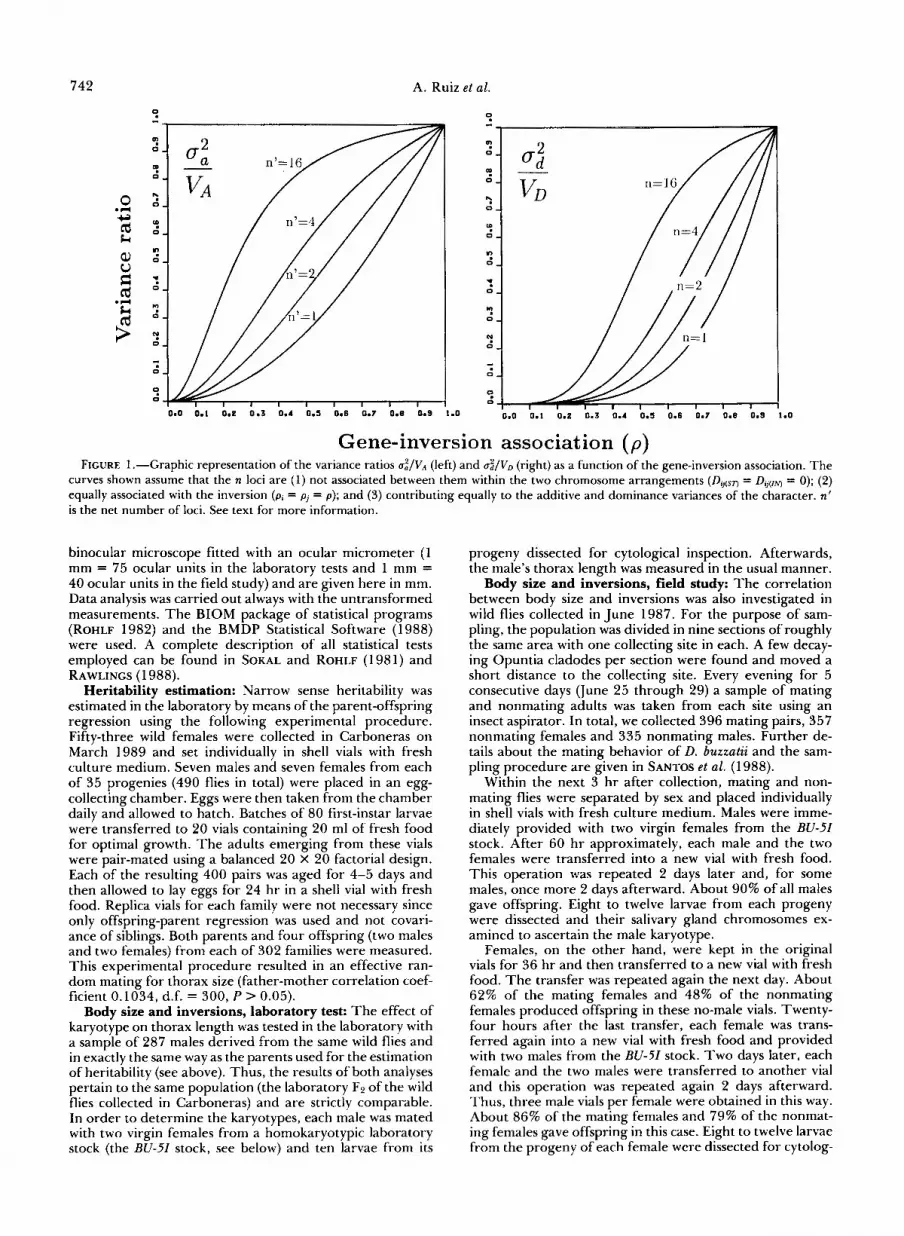
association with the inversion; thus, n' may be termed the net number of loci. Figure 1 shows some numerical examples. It is worth noting that if n' is large, the variance ratio d / V A is close to unity even for moderate values of p.
Similarly, the deviation variance u; given by expres- sion (9) can be put in terms of the correlation between gene frequencies as follows:
The structure of this expression is very similar to that of the regression variance ( 1 0) and the conditions for a significant contribution of the deviation variance (u:) are also analogous, namely, that the loci must contribute to the dominance variance of the trait and there must be gametic associations between the loci and the inversion. Once again, r; provides a minimum estimate of the dominance variance in the population ( V D ) . It should be noted, though, that in expression (1 2 ) the correlation parameters are raised to a higher power than in (1 0).
A simple and explicit relationship between a; and VD can be found if conditions (i) and (ii) above hold, and (iii) the n loci contribute equally to the dominance variance:
Figure 1 shows some numerical examples. In this case, the variance ratio U;/VD increases with the actual number of loci, i.e. the sign of their association with the inversion does not make any difference.
Since a: d VA and a; d VD, it follows that ai = uf + u; d Vc = V A + VD. Therefore, the variance among karyotypes provides a minimum estimate of the ge- netic variance due to the underlying n loci.
MATERIALS AND METHODS
Natural population: All Drosophila buzzetii adults used in this study were collected in, or derived from, the population of Carboneras (Almeria, SE Spain). This population is a semiabandoned Opuntiaficus-indica (prickly pear) plantation which was described in detail by RUIZ et al. (1 986). D. buzzatii is polymorphic there for four arrangements on the second chromosome, namely 2 standard (2st), Zj, 2jz' and 2jq7, and two arrangements on the fourth chromosome, namely 4st and 4s. A description of these inversions and their popula- tion frequencies can be found in FONTDEVILA et al. (1 98 1 ) and RUIZ, NAVEIRA and FONTDEVILA (1 984) and RUIZ et al. ( 1 986).
Flies were handled using carbon dioxide as an anesthetic through the experiments. Crosses involving wild flies were carried out at room temperature for the first 5 days and in a walk-in incubator at 23 O thereafter. Laboratory flies were always kept at 23". A modified formula of David's killed- yeast Drosophila medium (DAVID 1962) was used as food.
Phenotypic character: Thorax length, from the anterior margin of thorax to posterior tip of scutellum as viewed laterally, was used as an indication of adult body size. All measurements were carried out on live individuals using a
742
?
A. Ruiz et al.
c:
.O I SO
Gene-inversion association ( p ) FIGURE 1 .-Graphic representation of the variance ratios U:/VA (left) and u&/VD (right) as a function of the gene-inversion association. The
curves shown assume that the n loci are (1) not associated between them within the two chromosome arrangements (DB(sT) = D,,(IN) = 0); (2) equally associated with the inversion (pa = = p ) ; and (3) contributing equally to the additive and dominance variances of the character. n’ is the net number of loci. See text for more information.
binocular microscope fitted with an ocular micrometer (1 mm = 75 ocular units in the laboratory tests and 1 mm = 40 ocular units in the field study) and are given here in mm. Data analysis was carried out always with the untransformed measurements. The BIOM package of statistical programs (ROHLF 1982) and the BMDP Statistical Software (1988) were used. A complete description of all statistical tests employed can be found in SOKAL and ROHLF (1981) and RAWLINGS (1 988).
Heritability estimation: Narrow sense heritability was estimated in the laboratory by means of the parent-offspring regression using the following experimental procedure. Fifty-three wild females were collected in Carboneras on March 1989 and set individually in shell vials with fresh culture medium. Seven males and seven females from each of 35 progenies (490 flies in total) were placed in an egg- collecting chamber. Eggs were then taken from the chamber daily and allowed to hatch. Batches of 80 first-instar larvae were transferred to 20 vials containing 20 ml of fresh food for optimal growth. The adults emerging from these vials were pair-mated using a balanced 20 X 20 factorial design. Each of the resulting 400 pairs was aged for 4-5 days and then allowed to lay eggs for 24 hr in a shell vial with fresh food. Replica vials for each family were not necessary since only offspring-parent regression was used and not covari- ance of siblings. Both parents and four offspring (two males and two females) from each of 302 families were measured. This experimental procedure resulted in an effective ran- dom mating for thorax size (father-mother correlation coef- ficient 0.1034, d.f. = 300, P > 0.05).
Body size and inversions, laboratory test: The effect of karyotype on thorax length was tested in the laboratory with a sample of 287 males derived from the same wild flies and in exactly the same way as the parents used for the estimation of heritability (see above). Thus, the results of both analyses pertain to the same population (the laboratory F2 of the wild flies collected in Carboneras) and are strictly comparable. In order to determine the karyotypes, each male was mated with two virgin females from a homokaryotypic laboratory stock (the BU-51 stock, see below) and ten larvae from its
progeny dissected for cytological inspection. Afterwards, the male’s thorax length was measured in the usual manner.
Body size and inversions, field study: The correlation between body size and inversions was also investigated in wild flies collected in June 1987. For the purpose of sam- pling, the population was divided in nine sections of roughly the same area with one collecting site in each. A few decay- ing Opuntia cladodes per section were found and moved a short distance to the collecting site. Every evening for 5 consecutive days (June 25 through 29) a sample of mating and nonmating adults was taken from each site using an insect aspirator. In total, we collected 396 mating pairs, 357 nonmating females and 335 nonmating males. Further de- tails about the mating behavior of D. buzzatzi and the sam- pling procedure are given in SANTOS et al. (1 988).
Within the next 3 hr after collection, mating and non- mating flies were separated by sex and placed individually in shell vials with fresh culture medium. Males were imme- diately provided with two virgin females from the BU-SI stock. After 60 hr approximately, each male and the two females were transferred into a new vial with fresh food. This operation was repeated 2 days later and, for some males, once more 2 days afterward. About 90% of all males gave offspring. Eight to twelve larvae from each progeny were dissected and their salivary gland chromosomes ex- amined to ascertain the male karyotype.
Females, on the other hand, were kept in the original vials for 36 hr and then transferred to a new vial with fresh food. The transfer was repeated again the next day. About 62% of the mating females and 48% of the nonmating females produced offspring in these no-male vials. Twenty- four hours after the last transfer, each female was trans- ferred again into a new vial with fresh food and provided with two males from the BU-51 stock. Two days later, each female and the two males were transferred to another vial and this operation was repeated again 2 days afterward. Thus, three male vials per female were obtained in this way. About 86% of the mating females and 79% of the nonmat- ing females gave offspring in this case. Eight to twelve larvae from the progeny of each female were dissected for cytolog-
Genetic Variance for Body Size 743
ical analysis. All sampled larvae were taken from the second and third male vials of each female to increase the probabil- ity of them being fathered by the laboratory stock males. The first vial which might contain larvae of mixed paternity was discarded at once. We have previously shown that sperm predominance occurs in D. buzzatii and that in the laboratory the proportion of progeny fathered by the second male mating a female, increases almost to nearly 100% in 2 days (BARBADILLA et al. 1991). The results of the present study further corroborated this point.
Cytological analysis: Males and females were crossed with adults from the BU-51 stock in order to ascertain their karyotype. The BU-51 stock is homokaryotypic for arrange- ments Zj, #st and 5Z. Thus, the cytological analysis of a number of larvae from the progeny of these crosses allowed to infer the karyotype at the second and fourth chromo- somes of their parent. Salivary gland chromosomes were prepared as in FONTDEVILA et al. (1981). Although 8-1 2 larvae per progeny were dissected, not all the slides could be read under the microscope. The finding of two different karyotypes among the sibs of a progeny is sufficient to correctly classify their parent as heterozygous. On the other hand, when all the examined larvae have the same karyotype there exist the possibility of mistakenly classifying their heterozygous parent as homozygous. Consequently, in this second case, we read a minimum of 5 and usually 6-8 larvae per progeny (7 larvae on the average). With 7 larvae, the probability of misclassifying a heterozygous individual is I .56%. Therefore, since the maximum frequency of heter- ozygotes observed was about 65% (for the second chromo- some), our experimental error in assigning the karyotypes was about 1% on the average in the worst case.
The 51 inversion is not a naturally occurring one. It appeared in a genetically unstable line produced by intro- gressive hybridization and its complete denomination in Zn(5)FZb; F2e (NAVEIRA and FONTDEVILA 1985). Hence, inversion 51 is not present at the Carboneras population and was used here as a marker to distinguish, among the progeny of the wild females, the larvae fathered by the BU-51 stock males from those fathered by wild males. As we expected, sperm displacement was almost complete and 98% of the progenies we analyzed cytologically had the correct paren- tage. The remaining progenies, which contained larvae of mixed paternity, were omitted from the analysis.
Biometrical effect of inversions; statistical analysis: The five population samples (laboratory males, nonmating males, mating males, nonmating females and mating fe- males) were analyzed separately for each polymorphic chro- mosome. In order to test for an effect of the karyotype on thorax length, the individuals in each sample were arranged according to a single classification criterion and a one-way ANOVA was carried out. According to the underlying model, each observation can be written as:
X, = ~t + etj,
where /.ti represents the mean thorax length of individuals with the i karyotype (see above) and e,, is a random deviation of the j individual from its expectation p,. The error term e, is assumed to be an independent, normally distributed variable with expectation E(e,,) = 0 and variance E(& = 2 . The variance among karyotypes (u;) was estimated from the formulae for the expected mean squares shown in Table 1. The method is formally identical to that devised by BOER- WINKLE and SING (1 986) to estimate the contribution of a single locus to the phenotypic variance of a quantitative trait.
Prior to the ANOVAs, each sample was tested for hom- oscedasticity by means of the F,,,, and Bartlett’s tests (SOKAL and ROHLF 198 1, p. 403). Only one case out of ten showed
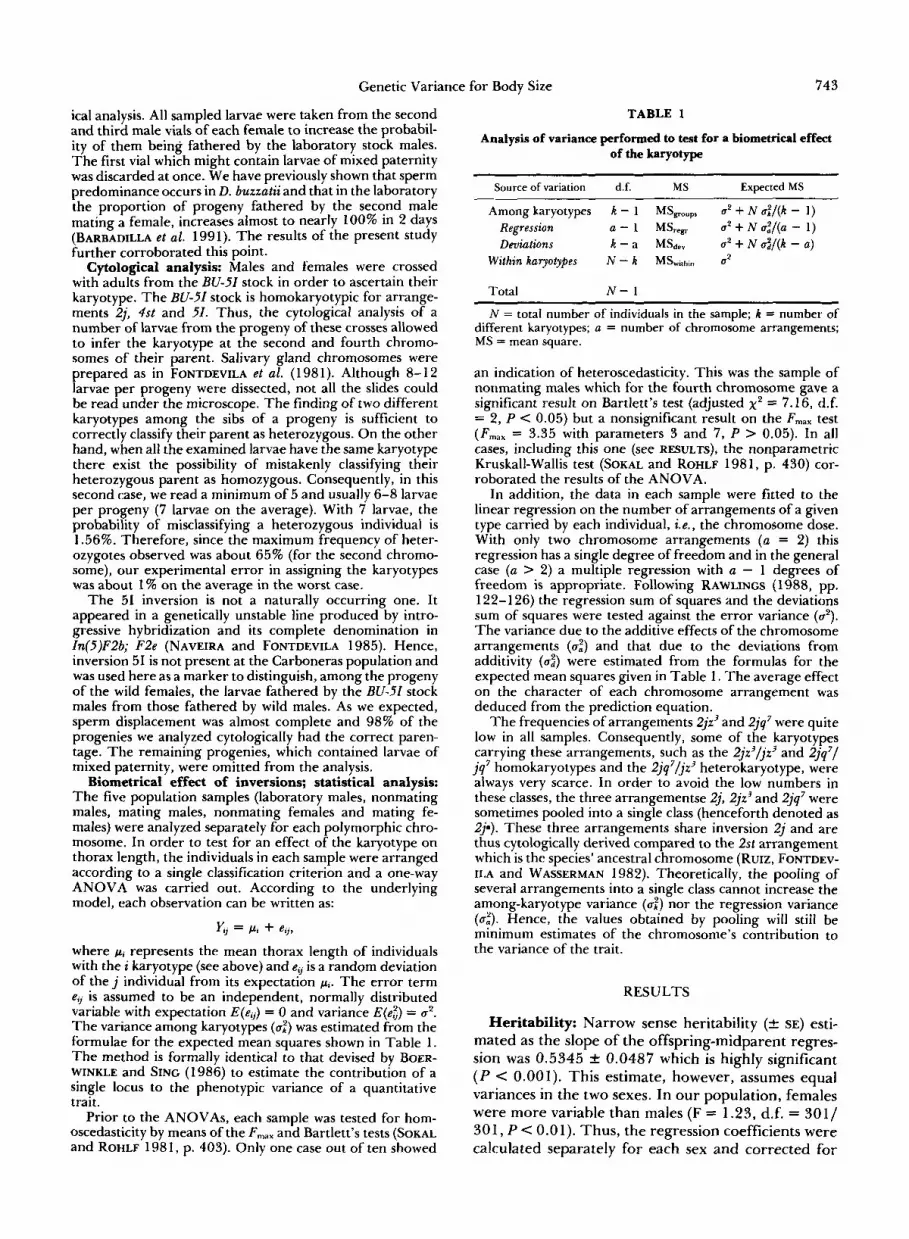
TABLE 1
Analysis of variance performed to test for a biometrical effect of the karyotype
Source of variation d.f. MS Expected MS
Among karyotypes k - 1 MSPoupa 6’ + N d / ( k - 1)
Regression a - 1 MS,., 6‘ + N u!/(a - 1 ) Deviations k - a MSd,, u2 + N&(k - a)
Within karyotypes N - k ML,, , , u2
Total N - 1
N = total number of individuals in the sample; k = number of different karyotypes; a = number of chromosome arrangements; MS = mean square.
an indication of heteroscedasticity. This was the sample of nonmating males which for the fourth chromosome gave a significant result on Bartlett’s test (adjusted x’ 7.16, d.f. = 2, P < 0.05) but a nonsignificant result on the F,,, test (F,,, = 3.35 with parameters 3 and 7, P > 0.05). In all cases, including this one (see RESULTS), the nonparametric Kruskall-Wallis test (SOKAL and ROHLF 1981, p. 430) cor- roborated the results of the ANOVA.
In addition, the data in each sample were fitted to the linear regression on the number of arrangements of a given type carried by each individual, i .e. , the chromosome dose. With only two chromosome arrangements ( a = 2) this regression has a single degree of freedom and in the general case (a > 2) a multiple regression with a - 1 degrees of freedom is appropriate. Following RAWLINGS (1988, pp. 122-1 26) the regression sum of squares and the deviations sum of squares were tested against the error variance (2). The variance due to the additive effects of the chromosome arrangements (u:) and that due to the deviations from additivity (ui) were estimated from the formulas for the expected mean squares given in Table 1. The average effect on the character of each chromosome arrangement was deduced from the prediction equation.
The frequencies of arrangements Zjz’ and Zjq7 were quite low in all samples. Consequently, some of the karyotypes carrying these arrangements, such as the Zjz’ljz’ and Zjq7/ jq’ homokaryotypes and the 2jq7/jr3 heterokaryotype, were always very scarce. In order to avoid the low numbers in these classes, the three arrangementse Zj, 2jz3 and Zjq7 were sometimes pooled into a single class (henceforth denoted as 2j). These three arrangements share inversion Zj and are thus cytologically derived compared to the 2st arrangement which is the species’ ancestral chromosome (Rurz, FONTDEV- ILA and WASSERMAN 1982). Theoretically, the pooling of several arrangements into a single class cannot increase the among-karyotype variance (u;) nor the regression variance (u.’). Hence, the values obtained by pooling will still be minimum estimates of the chromosome’s contribution to the variance of the trait.
RESULTS
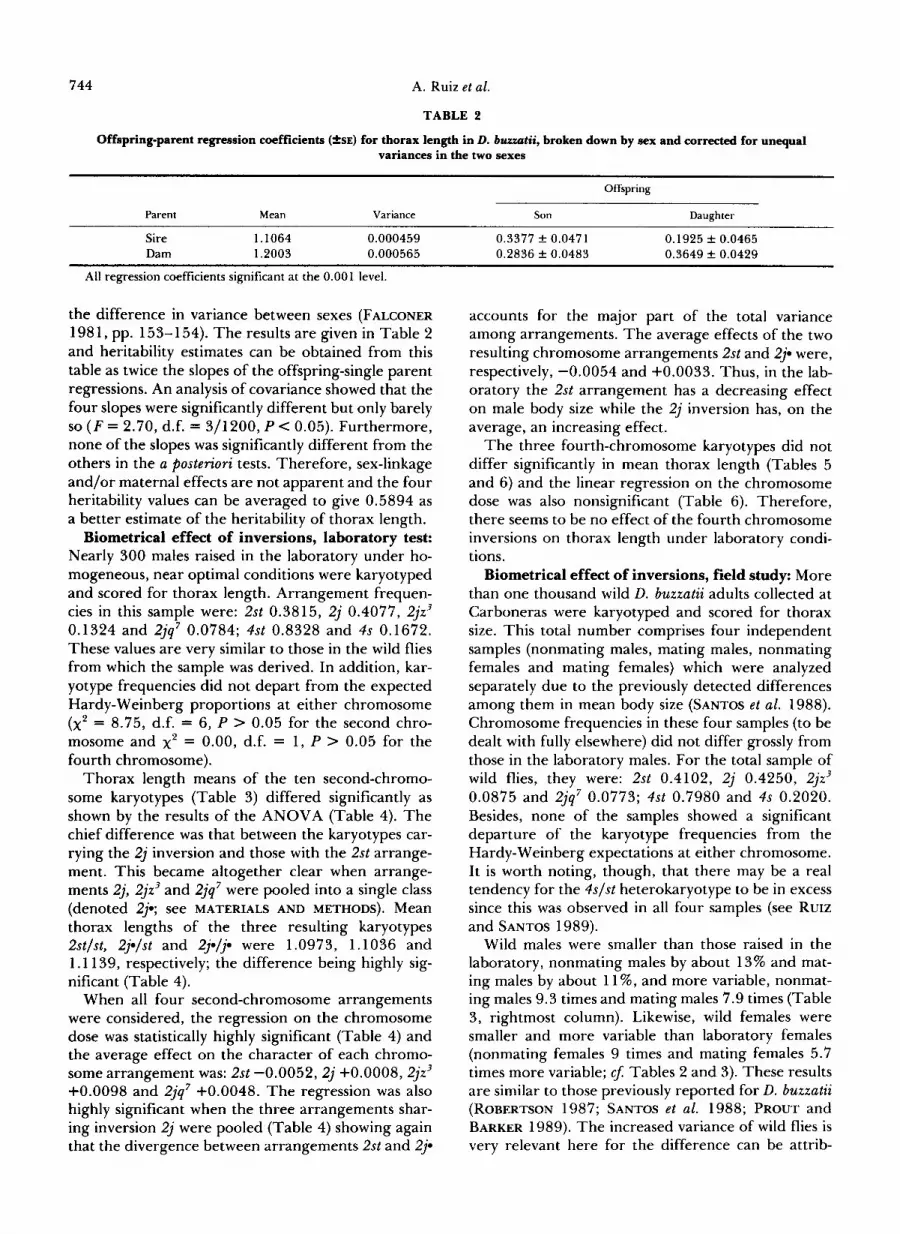
Heritability: Narrow sense heritability (f SE) esti- mated as the slope of the offspring-midparent regres- sion was 0.5345 _+ 0.0487 which is highly significant ( P < 0.001). This estimate, however, assumes equal variances in the two sexes. In our population, females were more variable than males (F = 1.23, d.f. = 301/ 301, P < 0.01). Thus, the regression coefficients were calculated separately for each sex and corrected for
744 A. Ruiz et al.
TABLE 2
Offspring-parent regression coefficients ( ~ s E ) for thorax length in D. buuatii, broken down by sex and corrected for unequal variances in the two sexes
Offspring
Parent Mean Variance Son Daughter
Sire 1.1064 0.000459 0.3377 f 0.0471 0.1925 f 0.0465 Dam 1.2003 0.000565 0.2836 f 0.0483 0.3649 f 0.0429
~~
All regression coefficients significant at the 0.001 level.
the difference in variance between sexes (FALCONER 198 1, pp. 153- 154). The results are given in Table 2 and heritability estimates can be obtained from this table as twice the slopes of the offspring-single parent regressions. An analysis of covariance showed that the four slopes were significantly different but only barely SO ( F = 2.70, d.f. = 311 200, P < 0.05). Furthermore, none of the slopes was significantly different from the others in the a posteriori tests. Therefore, sex-linkage and/or maternal effects are not apparent and the four heritability values can be averaged to give 0.5894 as a better estimate of the heritability of thorax length.
Biometrical effect of inversions, laboratory test: Nearly 300 males raised in the laboratory under ho- mogeneous, near optimal conditions were karyotyped and scored for thorax length. Arrangement frequen- cies in this sample were: 2st 0.3815, 2j 0.4077, 2jz3 0.1324 and 2jq7 0.0784; 4st 0.8328 and 4s 0.1672. These values are very similar to those in the wild flies from which the sample was derived. In addition, kar- yotype frequencies did not depart from the expected Hardy-Weinberg proportions at either chromosome (x2 = 8.75, d.f. = 6, P > 0.05 for the second chro- mosome and x' = 0.00, d.f. = 1, P > 0.05 for the fourth chromosome).
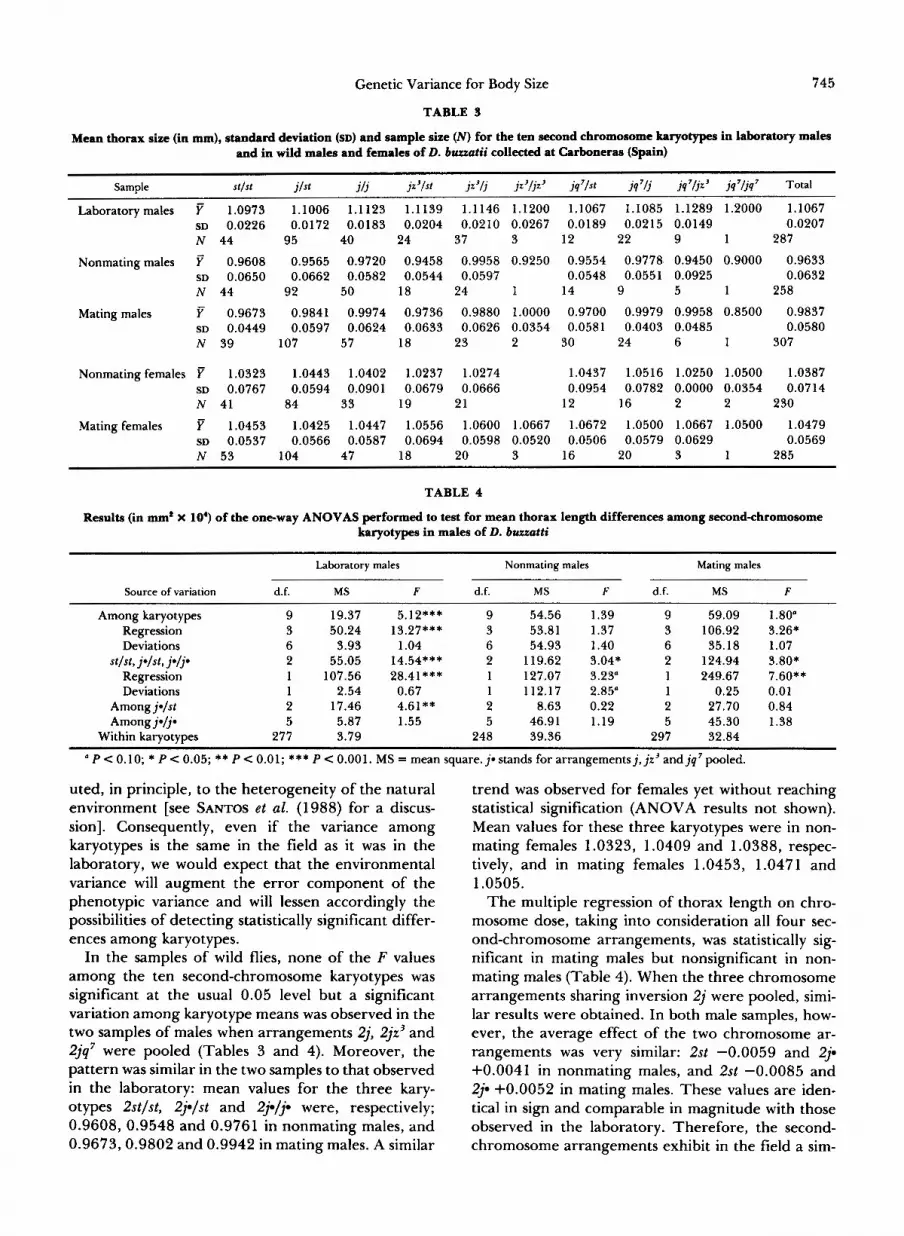
Thorax length means of the ten second-chromo- some karyotypes (Table 3) differed significantly as shown by the results of the ANOVA (Table 4). The chief difference was that between the karyotypes car- rying the 2j inversion and those with the 2st arrange- ment. This became altogether clear when arrange- ments 2j, 2jz3 and 2jq7 were pooled into a single class (denoted 2j.; see MATERIALS AND METHODS). Mean thorax lengths of the three resulting karyotypes Bstlst, 2j.lst and 2j./j. were 1.0973, 1 .IO36 and 1.1 139, respectively; the difference being highly sig- nificant (Table 4).
When all four second-chromosome arrangements were considered, the regression on the chromosome dose was statistically highly significant (Table 4) and the average effect on the character of each chromo- some arrangement was: 2st -O.O052,2j +0.0008, 2jz3 +0.0098 and 2jq' +0.0048. The regression was also highly significant when the three arrangements shar- ing inversion 2j were pooled (Table 4) showing again that the divergence between arrangements 2st and 2j.
accounts for the major part of the total variance among arrangements. The average effects of the two resulting chromosome arrangements 2st and 2j. were, respectively, -0.0054 and +0.0033. Thus, in the lab- oratory the 2st arrangement has a decreasing effect on male body size while the 2j inversion has, on the average, an increasing effect.
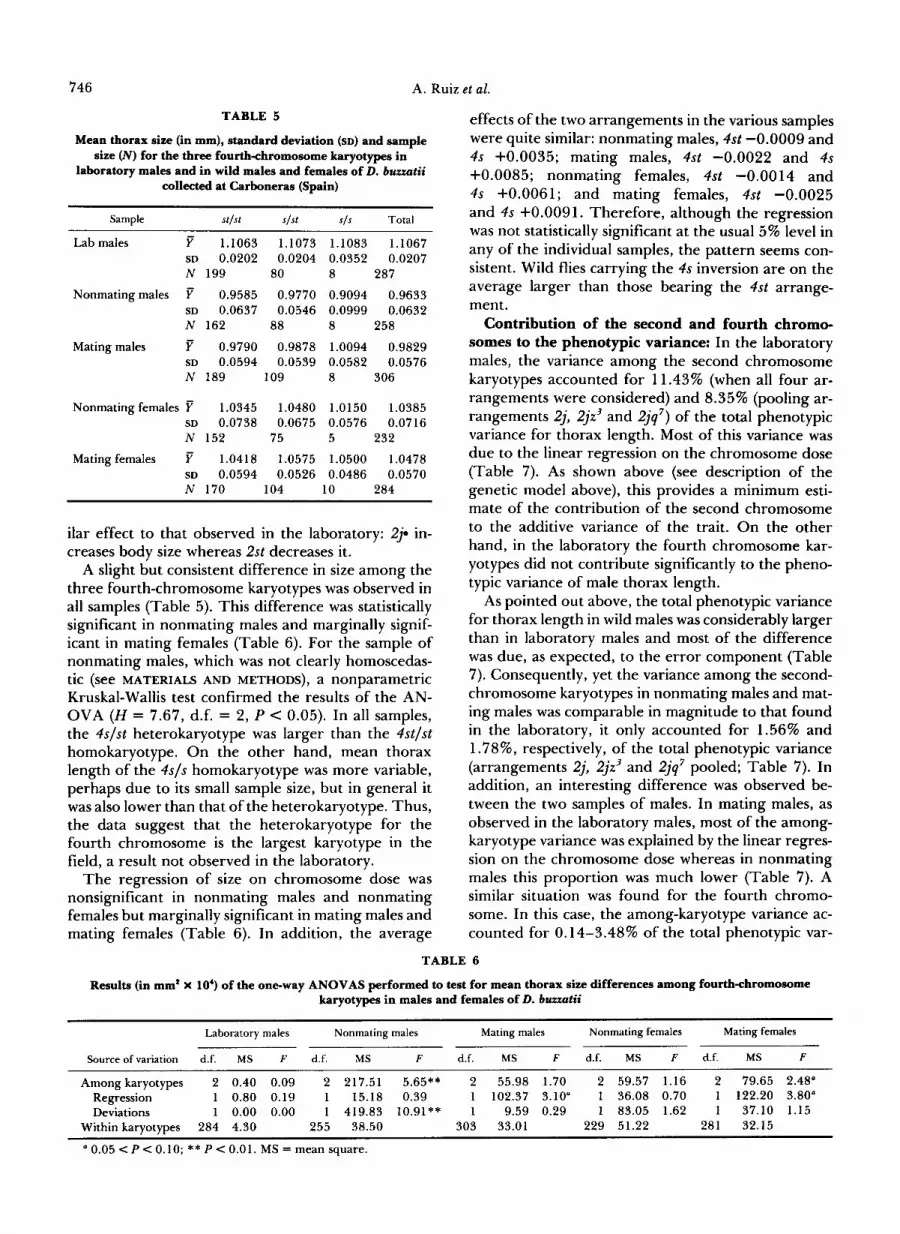
The three fourth-chromosome karyotypes did not differ significantly in mean thorax length (Tables 5 and 6) and the linear regression on the chromosome dose was also nonsignificant (Table 6). Therefore, there seems to be no effect of the fourth chromosome inversions on thorax length under laboratory condi- tions.
Biometrical effect of inversions, field study: More than one thousand wild D. buzzatii adults collected at Carboneras were karyotyped and scored for thorax size. This total number comprises four independent samples (nonmating males, mating males, nonmating females and mating females) which were analyzed separately due to the previously detected differences among them in mean body size (SANTOS et al. 1988). Chromosome frequencies in these four samples (to be dealt with fully elsewhere) did not differ grossly from those in the laboratory males. For the total sample of wild flies, they were: 2st 0.4102, 2j 0.4250, 2jz3 0.0875 and 2jq7 0.0773; 4st 0.7980 and 4 s 0.2020. Besides, none of the samples showed a significant departure of the karyotype frequencies from the Hardy-Weinberg expectations at either chromosome. It is worth noting, though, that there may be a real tendency for the 4slst heterokaryotype to be in excess since this was observed in all four samples (see RUIZ and SANTOS 1989).
Wild males were smaller than those raised in the laboratory, nonmating males by about 13% and mat- ing males by about 11%, and more variable, nonmat- ing males 9.3 times and mating males 7.9 times (Table 3, rightmost column). Likewise, wild females were smaller and more variable than laboratory females (nonmating females 9 times and mating females 5.7 times more variable; cf: Tables 2 and 3). These results are similar to those previously reported for D. buzzatii (ROBERTSON 1987; SANTOS et al. 1988; PROUT and BARKER 1989). The increased variance of wild flies is very relevant here for the difference can be attrib-
Genetic Variance for Body Size 745
TABLE 3
Mean thorax size (in mm), standard deviation (SD) and sample size (A’) for the ten second chromosome karyotypes in laboratory males and in wild males and females of D. buuatii collected at Carboneras (Spain)
Sample ~~~~ ~~ ~
SI /S l jlst j / j jz3/st jz3/j jz3/jz3 jq7/st jq7/j jq’ljz’ jq7/jq7 Total
Laboratorymales F 1.0973 1.1006 1.1123 1.1139 1.1146 1.1200 1.1067 1.1085 1.1289 1.2000 1.1067 SD 0.0226 0.0172 0.0183 0.0204 0.0210 0.0267 0.0189 0.0215 0.0149 0.0207 N 44 95 40 24 37 3 12 22 9 1 287
~~~~ ~~
Nonmatingmales y 0.9608 0.9565 0.9720 0.9458 0.9958 0.9250 0.9554 0.9778 0.9450 0.9000 0.9633 SD 0.0650 0.0662 0.0582 0.0544 0.0597 0.0548 0.0551 0.0925 0.0632 N 44 92 50 18 24 1 14 9 5 1 258
Mating males 0.9673 0.9841 0.9974 0.9736 0.9880 1.0000 0.9700 0.9979 0.9958 0.8500 0.9837 SD 0.0449 0.0597 0.0624 0.0633 0.0626 0.0354 0.0581 0.0403 0.0485 0.0580 N 39 107 57 18 23 2 30 24 6 1 307
Nonmating females F 1.0323 1.0443 1.0402 1.0237 1.0274 1.0437 1.0516 1.0250 1.0500 1.0387 SD 0.0767 0.0594 0.0901 0.0679 0.0666 0.0954 0.0782 0.0000 0.0354 0.0714 N 41 84 33 19 21 12 16 2 2 230
Matingfemales 1.0453 1.0425 1.0447 1.0556 1.0600 1.0667 1.0672 1.0500 1.0667 1.0500 1.0479 SD 0.0537 0.0566 0.0587 0.0694 0.0598 0.0520 0.0506 0.0579 0.0629 0.0569 N 53 104 47 18 20 3 16 20 3 1 285
TABLE 4
Results (in mm* X lo‘) of the one-way ANOVAS performed to test for mean thorax length differences among second-chromosome karyotypes in males of D. buuatti
Laboratory males Nonmating males Mating males
Source of variation d.f. MS F d.f. MS F d.f. MS F
Among karyotypes 9 19.37 5.12*** 9 54.56 1.39 9 59.09 1.80” Regression 3 50.24 13.27*** 3 53.81 1.37 3 106.92 3.26* Deviations 6 3.93 1.04 6 54.93 1.40 6 35.18 1.07
Regression 1 107.56 28.41*** 1 127.07 3.23” 1 249.67 7.60** Deviations 1 2.54 0.67 1 112.17 2.85” 1 0.25 0.01
Amongj-1st 2 17.46 4.61** 2 8.63 0.22 2 27.70 0.84 Amongj-ljn 5 5.87 1.55 5 46.91 1.19 5 45.30 1.38
st lst , j q s t , jqp 2 55.05 14.54*** 2 119.62 3.04* 2 124.94 3.80*
Within karyotypes 277 3.79 248 39.36 297 32.84
a P < 0.10; * P < 0.05; ** P < 0.01; *** P < 0.001. MS = mean square. j * stands for arrangementsj, jr’ and jq’ pooled.
uted, in principle, to the heterogeneity of the natural environment [see SANTOS et al. (1988) for a discus- sion]. Consequently, even if the variance among karyotypes is the same in the field as it was in the laboratory, we would expect that the environmental variance will augment the error component of the phenotypic variance and will lessen accordingly the possibilities of detecting statistically significant differ- ences among karyotypes.
In the samples of wild flies, none of the F values among the ten second-chromosome karyotypes was significant at the usual 0.05 level but a significant variation among karyotype means was observed in the two samples of males when arrangements 2j, 2jr3 and 2jq’ were pooled (Tables 3 and 4). Moreover, the pattern was similar in the two samples to that observed in the laboratory: mean values for the three kary- otypes 2st/st, 29lst and 23-19 were, respectively; 0.9608, 0.9548 and 0.9761 in nonmating males, and 0.9673,0.9802 and 0.9942 in mating males. A similar
trend was observed for females yet without reaching statistical signification (ANOVA results not shown). Mean values for these three karyotypes were in non- mating females 1.0323, 1.0409 and 1.0388, respec- tively, and in mating females 1.0453, 1.0471 and 1.0505.
The multiple regression of thorax length on chro- mosome dose, taking into consideration all four sec- ond-chromosome arrangements, was statistically sig- nificant in mating males but nonsignificant in non- mating males (Table 4). When the three chromosome arrangements sharing inversion 2j were pooled, simi- lar results were obtained. In both male samples, how- ever, the average effect of the two chromosome ar- rangements was very similar: 2st -0.0059 and 29 +0.0041 in nonmating males, and 2st -0.0085 and 29 +0.0052 in mating males. These values are iden- tical in sign and comparable in magnitude with those observed in the laboratory. Therefore, the second- chromosome arrangements exhibit in the field a sim-
746 A. Ruiz et al.
TABLE 5
Mean thorax size (in mm), standard deviation (SD) and sample size (A') for the three fourth-chromosome karyotypes in
laboratory males and in wild males and females of D. buzratii collected at Carboneras (Spain)
Sample st ls t sfst SIS Total
Lab males F 1.1063 1.1073 1.1083 1.1067 SD 0.0202 0.0204 0.0352 0.0207 N 199 80 8 287
Nonmating males F 0.9585 0.9770 0.9094 0.9633 SD 0.0637 0.0546 0.0999 0.0632 N 162 88 8 258
Mating males 0.9790 0.9878 1.0094 0.9829 SD 0.0594 0.0539 0.0582 0.0576 N 189 109 8 306
Nonmating females 1.0345 1.0480 1.0150 1.0385 SD 0.0738 0.0675 0.0576 0.0716 N 152 75 5 232
Matingfemales F 1.0418 1.0575 1.0500 1.0478 SD 0.0594 0.0526 0.0486 0.0570 N 170 104 10 284
ilar effect to that observed in the laboratory: 29 in- creases body size whereas 2st decreases it.
A slight but consistent difference in size among the three fourth-chromosome karyotypes was observed in all samples (Table 5). This difference was statistically significant in nonmating males and marginally signif- icant in mating females (Table 6). For the sample of nonmating males, which was not clearly homoscedas- tic (see MATERIALS AND METHODS), a nonparametric Kruskal-Wallis test confirmed the results of the AN- OVA (H = 7.67, d.f. = 2, P < 0.05). In all samples, the 4s /s t heterokaryotype was larger than the 4st/st homokaryotype. On the other hand, mean thorax length of the 4 s / s homokaryotype was more variable, perhaps due to its small sample size, but in general it was also lower than that of the heterokaryotype. Thus, the data suggest that the heterokaryotype for the fourth chromosome is the largest karyotype in the field, a result not observed in the laboratory.
The regression of size on chromosome dose was nonsignificant in nonmating males and nonmating females but marginally significant in mating males and mating females (Table 6). In addition, the average
effects of the two arrangements in the various samples were quite similar: nonmating males, 4st -0.0009 and 4 s +0.0035; mating males, 4st -0.0022 and 4 s +0.0085; nonmating females, 4st -0.0014 and 4s +0.0061; and mating females, 4st -0.0025 and 4s +0.0091. Therefore, although the regression was not statistically significant at the usual 5% level in any of the individual samples, the pattern seems con- sistent. Wild flies carrying the 4s inversion are on the average larger than those bearing the 4st arrange- ment.
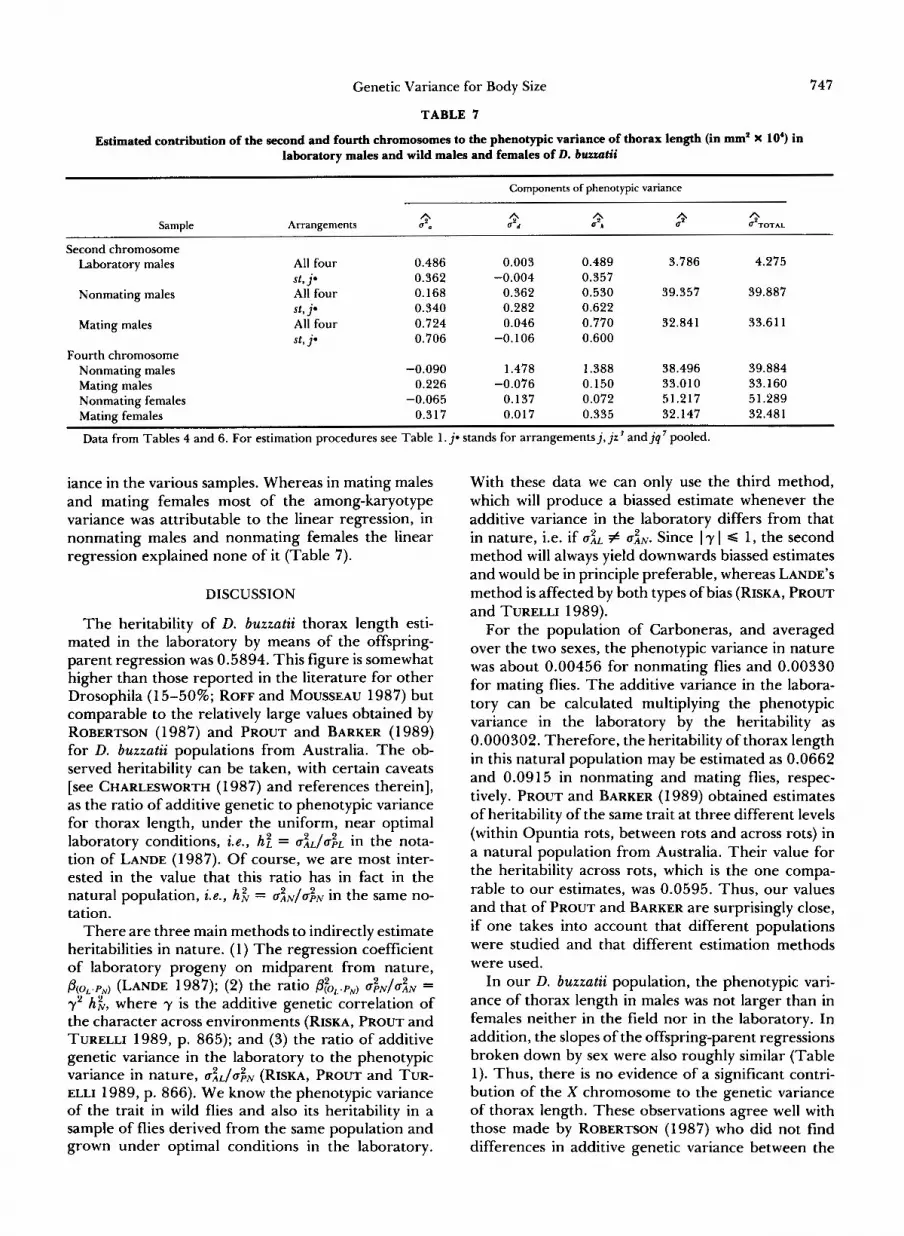
Contribution of the second and fourth chromo- somes to the phenotypic variance: In the laboratory males, the variance among the second chromosome karyotypes accounted for 11.43% (when all four ar- rangements were considered) and 8.35% (pooling ar- rangements 2j, 2jr3 and Zjq') of the total phenotypic variance for thorax length. Most of this variance was due to the linear regression on the chromosome dose (Table 7). As shown above (see description of the genetic model above), this provides a minimum esti- mate of the contribution of the second chromosome to the additive variance of the trait. On the other hand, in the laboratory the fourth chromosome kar- yotypes did not contribute significantly to the pheno- typic variance of male thorax length.
As pointed out above, the total phenotypic variance for thorax length in wild males was considerably larger than in laboratory males and most of the difference was due, as expected, to the error component (Table 7). Consequently, yet the variance among the second- chromosome karyotypes in nonmating males and mat- ing males was comparable in magnitude to that found in the laboratory, it only accounted for 1.56% and 1.78%, respectively, of the total phenotypic variance (arrangements 2j, 2jr3 and 2jq7 pooled; Table 7). In addition, an interesting difference was observed be- tween the two samples of males. In mating males, as observed in the laboratory males, most of the among- karyotype variance was explained by the linear regres- sion on the chromosome dose whereas in nonmating males this proportion was much lower (Table 7). A similar situation was found for the fourth chromo- some. In this case, the among-karyotype variance ac- counted for 0.14-3.48% of the total phenotypic var-
TABLE 6
Results (in mm' X lo') of the one-way ANOVAS performed to test for mean thorax size differences among fourthchromosome karyotypes in males and females of D. buuatii
Laboratory males Nonmating males Mating males Nonmating females Mating females
Source ofvariation d.f. MS F d.f. MS F d.f. MS F d.f. MS F d.f. MS F
Amongkaryotypes 2 0.40 0.09 2 217.51 5.65** 2 55.98 1.70 2 59.57 1.16 2 79.65 2.48" Regression 1 0.80 0.19 1 15.18 0.39 1 102.37 3.10" 1 36.08 0.70 1 122.20 3.80" Deviations 1 0.00 0.00 1 419.83 10.91** 1 9.59 0.29 1 83.05 1.62 1 37.10 1.15
Within karyotypes 284 4.30 255 38.50 303 33.01 229 51.22 281 32.15
a 0.05 < P < 0.10; ** P < 0.01. MS = mean square.
Genetic Variance for Body Size 747
TABLE 7
Estimated contribution of the second and fourth chromosomes to the phenotypic variance of thorax length (in mm' X lo') in laboratory males and wild males and females of D. buuatii
Components of phenotypic variance
Sample A
Arrangements A
aZa UZd up* 2 &OTAL A A A
Second chromosome Laboratory males All four 0.486 0.003 0.489 3.786 4.275
Nonmating males All four 0.168 0.362 0.530 39.357 39.887
Mating males All four 0.724 0.046 0.770 32.841 33.61 1
st, j- 0.362 -0.004 0.357
st, j- 0.340 0.282 0.622
st, j- 0.706 -0.106 0.600 Fourth chromosome
Nonmating males -0.090 1.478 1.388 38.496 39.884 Mating males 0.226 -0.076 0.150 33.010 33.160 Nonmating females -0.065 0.137 0.072 51.217 51.289 Mating females 0.317 0.017 0.335 32.147 32.481
Data from Tables 4 and 6. For estimation procedures see Table 1 . j * stands for arrangementsj,jr3 and jq' pooled.
iance in the various samples. Whereas in mating males and mating females most of the among-karyotype variance was attributable to the linear regression, in nonmating males and nonmating females the linear regression explained none of it (Table 7).
DISCUSSION
The heritability of D. buzzatii thorax length esti- mated in the laboratory by means of the offspring- parent regression was 0.5894. This figure is somewhat higher than those reported in the literature for other Drosophila (1 5-50%; ROFF and MOUSSEAU 1987) but comparable to the relatively large values obtained by ROBERTSON (1987) and PROUT and BARKER (1989) for D. buzzatii populations from Australia. The ob- served heritability can be taken, with certain caveats [see CHARLESWORTH (1 987) and references therein], as the ratio of additive genetic to phenotypic variance for thorax length, under the uniform, near optimal laboratory conditions, i.e., h2 = &/& in the nota- tion of LANDE (1987). Of course, we are most inter- ested in the value that this ratio has in fact in the natural population, i e . , h$ = &/u?N in the same no- tation.
There are three main methods to indirectly estimate heritabilities in nature. (1) The regression coefficient of laboratory progeny on midparent from nature, /3(oL.pN) (LANDE 1987); (2) the ratio ,8toL.pN) = y2 h i , where is the additive genetic correlation of the character across environments (RISKA, PROUT and TURELLI 1989, p. 865); and (3) the ratio of additive genetic variance in the laboratory to the phenotypic variance in nature, & / u N (RISKA, PROUT and TUR- ELLI 1989, p. 866). We know the phenotypic variance of the trait in wild flies and also its heritability in a sample of flies derived from the same population and grown under optimal conditions in the laboratory.
With these data we can only use the third method, which will produce a biassed estimate whenever the additive variance in the laboratory differs from that in nature, i.e. if & # uiN. Since I y I d 1, the second method will always yield downwards biassed estimates and would be in principle preferable, whereas LANDE'S method is affected by both types of bias (RISKA, PROUT and TURELLI 1989).
For the population of Carboneras, and averaged over the two sexes, the phenotypic variance in nature was about 0.00456 for nonmating flies and 0.00330 for mating flies. The additive variance in the labora- tory can be calculated multiplying the phenotypic variance in the laboratory by the heritability as 0.000302. Therefore, the heritability of thorax length in this natural population may be estimated as 0.0662 and 0.091 5 in nonmating and mating flies, respec- tively. PROUT and BARKER (1 989) obtained estimates of heritability of the same trait at three different levels (within Opuntia rots, between rots and across rots) in a natural population from Australia. Their value for the heritability across rots, which is the one compa- rable to our estimates, was 0.0595. Thus, our values and that of PROUT and BARKER are surprisingly close, if one takes into account that different populations were studied and that different estimation methods were used.
In our D. buzzatii population, the phenotypic vari- ance of thorax length in males was not larger than in females neither in the field nor in the laboratory. In addition, the slopes of the offspring-parent regressions broken down by sex were also roughly similar (Table 1). Thus, there is no evidence of a significant contri- bution of the X chromosome to the genetic variance of thorax length. These observations agree well with those made by ROBERTSON (1987) who did not find differences in additive genetic variance between the
748 A. Ruiz et al.
sexes in the Australian populations studied by him. A note of caution should be made however. KEARSEY and KOJIMA (1967) found a significant contribution of the X chromosome to the additive variance of body weight in D. melanogaster, and COWLEY and ATCHLEY (1988) also detected significant additive X-linked var- iance in many morphometric traits (yet not in scutel- lum length) in the same species. Thus, a more thor- ough study might reveal eventually a contribution of the X chromosome also in D. buzzatii. What our pres- ent data imply, however, is that this contribution is not very large in comparison with that of the auto- somes in the population of Carboneras.
Since the interpretation of our results on the bio- metrical effect of inversions is based in the proposed genetic model, we will discuss briefly the assumptions on which the model rests. The D. buzzatii population at Carboneras is most likely a very large and panmictic one [see SANTOS, RUIZ and FONTDEVILA (1989) for a discussion of this point based on previous data]. In the laboratory study, matings were arranged so as to produce an effectively panmictic population. In addi- tion, since near-optimal growth conditions were used to raise the experimental males, no frequency changes probably occurred between the zygote and the adult phases. As expected, Hardy-Weinberg proportions were observed at the two polymorphic chromosomes in the laboratory male sample. In the field study, no significant correlation between the body sizes of the mating partners was detected (SANTOS et al. 1988) and the karyotype frequencies of the mating pairs did not depart significantly from the random combinations of the marginal karyotype frequencies in any of the two chromosomes (unpublished results). Thus, mating seems to occur approximately at random in the natu- ral population also. In addition, none of the samples of wild flies showed a significant departure of the karyotype frequencies from the Hardy-Weinberg ex- pectations.
Our genetic model is based on the supposition, advanced by other authors (WHITE and ANDREW 1960; PREVOSTI 1967), that chromosomal arrange- ments exert their biometricai effect because they are predominantly associated with particular alleles at loci influencing the quantitative trait under consideration. From the genetic point of view, however, this is not the only way to explain such an effect. The different character means of the various karyotypes might be the result of a position effect of the inversions (SPER- LICH and PFRIEM 1986). But while the evidence favor- ing this possibility is quite meagre, that showing ga- metic associations between inversions and the loci included within, or closely adjacent to them, is over- whelming (see reviews by HEDRICK, JAIN and HOLDEN 1978; BARKER 1979; ZAPATA and ALVAREZ 1987). Although most of the reported associations involve loci with alleles which may be nearly neutral, there
are instances of associations with genes affecting quan- titative traits (WATANABE and YAMAZAKI 1976; Wu and BECKENBACH 1983). In fact, this is exactly what the widespread concept of coadaptation and the re- sults of many laboratory experiments on the adaptive value of inversions imply (DOBZHANSKY 1970). It should be pointed out, on the other hand, that whereas the examples of allozyme loci-inversion asso- ciations are very abundant, the evidence of significant gametic associations between allozyme loci within chromosome arrangements is rather sparse. Thus, although the failure to detect such associations may be in part due to the usually small samples and low power of the statistical tests used (ZAPATA and AL- VAREZ 1987), the conclusion to be drawn from the available evidence in Drosophila is that their magni- tude, if any, is usually rather small. This means, in terms of our genetic model, that DG(sv and DV(,N are probably negligible in comparison with D, and Dj, as Figure 1 assumes.
Most of the genetic variance for body size, as indi- cated by such morphological traits as thorax length, wing length and body weight, seems to be additive and interactions and dominance are apparently weak or absent (KELLER and MITCHELL 1962; KEARSEY and KOJIMA 1967; ROBERTSON 1987). Although additivity of gene effects across loci is a convenient assumption to make the model mathematically tractable, it seems also admissible on empirical grounds. Nevertheless, the derived expressions (see GENETIC MODEL) should be taken only as an approximation to the true rela- tionships.
In the field study, a significant effect of the second chromosome karyotype was found for males but not for females. The cause for this difference cannot be fully elucidated at the moment, for we do not have, as yet, data on females raised under laboratory con- ditions to compare with. A priori, however, there is no reason to expect a sex-dependent effect of the autosomal polygenes located on the second chromo- some. In general, the pattern of chromosomal effects in wild males was quite similar to that observed in the laboratory: the 2st arrangement decreased thorax length whereas those arrangements bearing the 2j inversion had, on the average, the opposite effect. Furthermore, the variance among karyotypes (d) was comparable in the three samples of males (laboratory males, nonmating males and mating males; Table 7). Thus, it would seem that the genotype-environmental interaction and covariance are unimportant for this chromosome. It is remarkable, though, that the pro- portion of regression variance was higher in mating males than in nonmating males. This result may be explained with the aid of observations made in Car- boneras in June 1988. That summer we collected again samples of mating and nonmating flies and determined their age in addition to their thorax
Genetic Variance for Body Size 749
length. As might be expected, mating males were, on the average, older and less variable than nonmating males. In addition, there was a very significant corre- lation between body size and age in nonmating males (r2 = 6.2%) whereas the correlation was nonsignificant in mating males (M. SANTOS, A. RUE, J. E. QUEZADA- D~Az , A. BARBADILLA AND A. FONTDEVILA, unpub- lished). Thus, the lower proportion of regression var- iance in nonmating males might be due to the fact that this sample is a mixture of several cohorts and that there are environmental differences among co- horts and differential longevity related to body size. Mating females were also older, on the average, and less variable than nonmating females but both female samples showed a significant correlation between thorax length and age (r2 = 2.7% in mating females and r2 = 19.7% in nonmating females). Thus, a similar hypothesis could also help to explain the lack of ad- ditive variance in wild females. An easy way to test this hypothesis would be to study the effect of the karyotype on the thorax length of newly emerged wild flies, which is feasible in D. buzzatii, and this is obviously the next step of our work.
In the laboratory, no significant variance among the three fourth-chromosome karyotypes was found, whereas in nature the heterokaryotype seems to be larger than both homokaryotypes. Is there any way to reconcile these two apparently contradictory obser- vations? At least two different explanations can be invoked. First, it might be that the correlation be- tween thorax length and fourth chromosome kary- otype observed in the field is purely environmental in origin. If both body size and karyotype were corre- lated with longevity, due to separate causes, they would show also an association in the adult population, which is a mixture of variously aged individuals. Sec- ond, it could be that the among-karyotype variance in the field is in fact larger than that measured in the laboratory. It might be argued that there is genetic variation whose expression depends on the stressful nutritional conditions existent in the field. Once again, further discussion must await the analysis of thorax length and karyotype in samples of newly emerged wild adults. Future work in this direction should allow the discrimination among these alterna- tives.
We wish to thank Dr. Francesc Peris and Esther Betran for helping us in the collection and handling of flies, and Carlos L6pez- Fanjul, Horacio Naveira and an anonymous reviewer for their comments on the manuscript. Work supported by grants PB85- 0071 and PB89-0325 from the Direcci6n General de Investigacih Cientifica y Ticnica (DGICYT), Spain, to A.F. Additional support from the Instituto de Cooperaci6n Iberoamericana (ICI) in the form of a predoctoral fellowship to J.E.Q., and from the Comissi6 Interdepartamental de Recerca i Innovaci6 Technolbgica (CIRIT), Generalitat de Catalunya, to A.B. is also acknowledged.
LITERATURE CITED ANDERSON, W. W., 1966 Genetic divergence in M. Vetukhiv’s
experimental populations of Drosophila pseudoobscura. 3. Di- vergence in body size. Genet. Res. 7: 255-266.
ANDERSON, W. W., 1973 Genetic divergence in body size among experimental populations of Drosophila pseudoobscura kept at different temperatures. Evolution 27: 278-284.
AVERY, P. J., and W. G. HILL, 1978 The effect of linkage dise- quilibrium on the genetic variance of a quantitative trait. Adv. App. Probab. 10 4-6.
FONTDEVILA, 1991 The evolutionary history of Drosophila buzzatii. XVII. Double mating and sperm predominance. Ge- net. Sel. Evol. 23 (in press).
BARKER, J. S. F., 1979 Inter-locus interactions: a review of exper- imental evidence. Theor. Popul. Biol. 16: 323-346.
BMDP STATISTICAL SOFTWARE (1988). University of California Press, Berkeley.
BOERWINKLE, E., and C. F. SING, 1986 Bias of the contribution of single-locus effects to the variance of a quantitative trait. Am. J. Hum. Genet. 3 9 137-144.
BUTLIN, R. K., I. L. READ and T. H. DAY, 1982 The effects of a chromosomal inversion on adult size and male mating success in the seaweed fly, Coelopa frigida. Heredity 49: 51-62.
CHARLESWORTH, B., 1987 The heritability of fitness, pp. 21-40 in Sexual Selection: Testing the Alternatives, edited by J. W. BRADBURY and M. B. ANDERSON. John Wiley and Sons Ltd, New York.
COWLEY, D. E., and W. R. ATCHLEY, 1988 Quantitative genetics of Drosophila melanogaster. 11. Heritabilities and genetic corre- lations between sexes for head and thorax traits. Genetics 119:
COYNE, J. A., and E. BEECHAM, 1987 Heritability of two morpho- logical characters within and among natural populations of Drosophila melanogaster. Genetics 117: 727-737.
DAVID, J., 1962 A new medium for rearing Drosophila in axenic conditions. Drosophila Inform. Serv. 3 6 128.
DAVID, J. R., AND C. BOCQUET, 1975 Similarities and differences in latitudinal adaptation of two Drosophila sibling species. Na- ture 257: 588-590.
DOBZHANSKY, TH., 1970 Genetics of the Evolutionary Process. Co- lumbia University Press, New York.
EWENS, W. J., 1979 Mathematical Population Genetics. Springer- Verlag, Berlin.
FALCONER, D. S., 1981 Introduction to Quantitative Genetics, Ed. 2. Longman, London.
FONTDEVILA, A., A. RUIZ, G. ALONSO and J. OCAGA, 1981 The evolutionary history of Drosophila buzzatii. I. Natural chromo- somal polymorphism in colonized populations of the Old World. Evolution 35: 148-157.
HEDRICK, P., S. JAIN and L. HOLDEN, 1978 Multilocus systems in evolution. Evol. Biol. 11: 101-184.
HEED, W. B., and R. L. MANGAN, 1986 Community ecology of Sonoran Desert Drosophila, pp. 65-80, in The Genetics and Biology of Drosophila, Vol. 3e, edited by M. ASHBURNER, H. L. CARSON and J. N. THOMPSON, JR. Academic Press, London.
HILL, W. C., and A. ROBERTSON, 1968 Linkage disequilibrium in finite populations. Theor. Appl. Genet. 3 8 226-231.
KEARSEY, M. J., and K. KOJIMA, 1967 The genetic architecture of body weight and egg hatchability in Drosophila melanogaster. Genetics 5 6 23-37.
KELLER, E. C., and D. F. MITCHELL, 1962 Interchromosomal genotypic interactions. I . An analysis of morphological char- acters. Genetics 47: 1557-1 57 1.
KEMPTHORNE, O., 1957 An Introduction to Genetic Statistics, Wiley, New York.
KRIMBAS, C. B., 1967 The genetics of Drosophila subobscura pop- ulations. 111. Inversion polymorphism and climatic factors. Mol. Gen. Genet. 9 9 133-1 50.
KRIMBAS, C. B., and M. LOUKAS, 1980 The inversion polymor- phism of Drosophila subobscura. Evol. Biol. 12: 163-234.
BARBADILLA, A., J. E. QUEZADA-DiAZ, A. RUIZ, M. SANTOS and A.
421-433.
750 A. Ruiz et al.
LANDE, R., 1977 Statistical tests for natural selection on quanti- tative characters. Evolution 31: 442-444.
LANDE, R., 1979 Quantitative genetic analysis of multivariate evolution applied to brain: body allometry. Evolution 33: 402- 416.
LANDE, R., 1982 A quantitative genetic theory of life history evolution. Ecology 63: 607-615.
LANDE, R., 1987 Appendix to the paper by J. Coyne and E. Beecham. Genetics 117: 737.
LEMEUNIER, F., J. R. DAVID, L. TSACAS and M. ASHBURNER, 1986 The melanogaster species group, pp. 147-256, in The Genetics and Biology o j Drosophila, Vol. 3ed, edited by M. ASHBURNER, H. L. CARSON and J. N. THOMPSON JR. Academic Press, London.
LEWONTIN, R. C., and K. KOJIMA, 1960 The evolutionary dynam- ics of complex polymorphisms. Evolution 1 4 458-472.
MONCL~JS, M., and A. PREVOSTI, 1971 The relationship between mating speed and wing length in Drosophila subobscura. Evolu- tion 25: 2 14-2 17.
NAVEIRA, H., and A. FONTDEVILA, 1985 The evolutionary history of Drosophila buzzatii. IX. High frequencies of new chromo- some rearrangements induced by introgressive hybridization. Chromosoma 91: 87-94.
NEI, M., and W. H. LI, 1973 Linkage disequilibrium in subdivided populations. Genetics 7 5 2 13-2 19.
PARSONS, P. A,, 1973 Genetics of resistance to environmental stresses in Drosophila populations. Annu. Rev. Genet. 7: 239- 265.
PARSONS, P. A., 1983 The Evolutionary Biology of ColonizingSpecies. Cambridge University Press, Cambridge.
PARTRIDGE, L., and M. FARQUHAR, 1983 Lifetime mating success of male fruitflies (Drosophila melanogaster) is related to their size. Anim. Behav. 31: 871-877.
PARTRIDGE, L., A. HOFFMANN and J. S. JONES, 1987 Male size and mating success in Drosophila melanogaster and D. pseudoob- scura under field conditions. Anim. Behav. 35: 468-476.
POWELL, J. R., 1974 Temperature related genetic divergence in Drosophila body size. J. Hered. 65: 257-258.
PREVOSTI, A., 1955 Geographic variability in quantitative traits in populations of D. subobscura. Cold Spring Harbor Symp. Quant. Biol. 20: 294-299.
PREVOSTI, A., 1960 Cambios en la heterocigosis por inversi6n cromos6mica al variar por seleccibn la longitud del ala en Drosophila subobscura. Genet. Iber. 12 27-41.
PREVOSTI, A., 1966 Inversion heterozygosity and size in a natural population of Drosophila subobscura, pp. 49-53, in Mutation in Population, Proceedings of the Symposium on the Mutational Proc- ess. Publishing House of the Czechoslovak Academy of Sci- ences, Praha.
PREVOSTI, A., 1967 Inversion heterocigosity and selection for wing length in Drosophila subobscura. Genet. Res. 10: 81-93.
PROUT, T., and J. S. F. BARKER, 1989 Ecological aspects of the heritability of body size in Drosophila buzzatii. Genetics 123:
RAWLINGS, J. 0. 1988 Applied Regression Analysis. A Research Tool. Wadsworth and Brooks, Pacific Grove, California.
RISKA, B., T. PROUT and M. TURELLI, 1989 Laboratory estimates of heritabilities and genetic correlations in nature. Genetics 123: 865-871.
ROBERTSON, F. W., 1957 Studies in quantitative inheritance. XI. Genetic and environmental correlation between body size and egg production in Drosophila melanogaster. J. Genet. 55: 428- 443.
ROBERTSON, F. W., 1963 The ecological genetics of growth in Drosophila. 6. The genetic correlation between the duration of larval period and body size in relation to larval diet. Genet. Res. 4: 74-92.
ROBERTSON, F. W., 1987 Variation of body size within and be- tween wild populations of Drosophila buzzatii. Genetica 72:
803-813.
1 1 1-125.
ROFF, D., 1977 Dispersal in Dipterans: its costs and consequences. J. Anim. Ecol. 4 6 443-456.
ROFF, D. A., and T. A. MOUSSEAU, 1987 Quantitative genetics and fitness: lessons from Drosophila. Heredity 58: 103-1 18.
ROHLF, F. J., 1982 BIOM, a package of statistical programs. State University of New York, Stony Brook.
RUIZ, A., A. FONTDEVILA and M. WASSERMAN, 1982 The evolu- tionary history of Drosophila buzzatii. 111. Cytogenetic relation- ships between two sibling species of the buzzatii cluster. Ge- netics 101: 503-5 18.
RUIZ, A., H. NAVEIRA and A. FONTDEVILA, 1984 La historia evolutiva de Drosophila buzzatii. IV. Aspectos citogeniticos de su polimorfismo cromodmico. Genit. 1bi.r. 3 6 13-35.
RUIZ, A., and M. SANTOS, 1989 Mating probability, body size and inversion polymorphism in a colonizing population of Drosoph- ila buzzatii, pp. 96-1 13, in Evolutionary Biology of Transient Unstable Populations, edited by A. FONTDEVILA. Springer-Ver- lag, Berlin.
RUIZ, A., A. FONTDEVILA, M. SANTOS, M. SEOANE and E. TORROJA, 1986 The evolutionary history of Drosophila buzzatii. VIII. Evidence for endocyclic selection acting on the inversion poly- morphism in a natural population. Evolution 40: 740-755.
SANTOS, M., A. RUIZ and A. FONTDEVILA, 1989 The evolutionary history of Drosophila buzzatii. XIII. Random differentiation as a partial explanation of the observed chromosomal variation in a structured natural population. Am. Nat. 133: 183-187.
SANTOS, M., A. RUIZ, A. BARBADILLA, J. E. QUEZADA-D~Az, E. HASSON and A. FONTDEVILA, 1988 The evolutionary history of Drosophila buzzatii. XlV. Larger flies mate more often in nature. Heredity 61: 255-262.
SOKAL, R. R., and F. J. ROHLF, 1981 Biometry, Ed. 2. W. H. Freeman, New York.
SPERLICH, D., and P. PFRIEM, 1986 Chromosomal polymorphism in natural and experimental populations, pp. 257-309, in The Genetics and Biology of Drosophila, Vol. 3e, edited by M. ASH- BURNER, H. L. CARSON and J. N. THOMPSON, JR. Academic Press, London.
STALKER, H. D., 1976 Chromosome studies in wild populations of Drosophila melanogaster. 11. Relationship of inversion fre- quencies to latitude, season, wing-loading and flight activity. Genetics 9 5 21 1-223.
TAYLOR, C. E., and V. KEKI~, 1988 Sexual selection in a natural population of Drosophila melanogaster. Evolution 42: 197-1 99.
WATANABE, T . K., and T. YAMAZAKI, 1976 Evidence for coad- aptation: negative correlation between lethal genes and poly- morphic inversions in Drosophila melanogaster. Genetics 82:
WEIR, B. S., C. C. COCKERHAM and J. REYNOLDS, 1980 The effects of linkage and linkage disequilibrium on the covariances of noninbred relatives. Heredity 45: 351-359.
WHITE, M. J. D., and L. E. ANDREW, 1960 Cytogenetics of the grasshopper Moraba scurra. V. Biometric effect of chromo- somal inversions. Evolution 14: 284-292.
WHITE, M. J. D., and L. E. ANDREW, 1962 Effectsofchromosomal inversions on size and relative viability in the grasshopper Moraba scurra, pp. 94-1 0 1 , in The Evolution of Living Organisms, edited by G . W. LEEPER. Melbourne University Press, Mel- bourne.
WHITE, M. J. D., R. C. LEWONTIN and L. E. ANDREW, 1963 Cytogenetics of the grasshopper Moraba scurra. VII. Geograph- ical variation of adaptive properties of inversions. Evolution
Wu, C.-I., and A. T. BECKENBACH, 1983 Evidence for extensive genetic differentiation between the sex-ratio and the standard arrangements of Drosophila pseudoobscura and D. persimilis and identification of hybrid sterility factors. Genetics 105: 71-86.
ZAPATA, C., and G . ALVAREZ, 1987 Gametic disequilibrium in populations of Drosophila subobscura: a review of experimental evidence. Genet. Iber. 39: 593-616.
697-702.
17: 147-162.
Communicating editor: J. R. POWELL