CHAPTER 9: VARIANCE REPORTING - GPUG
16
Chapter 9: Variance Reporting 9-1 CHAPTER 9: VARIANCE REPORTING Objectives The objectives are: • Create an over/(under) variance column definition • Define a report that displays favorable/(unfavorable) variances • Review sample report design concepts Introduction Reporting on variances—either actual versus budget, or this year versus last year—is a common financial reporting format. Two methods are generally used when you are reporting on variances. In the simpler method, one of the two amounts being compared is deducted from the other. No allowance is made for the type of accounts being reported. For example, if actual minus budget results in a positive number, then regardless of the account type (revenue or expense) the variance is said to be positive. This type of variance is known as over/(under) variances in the upcoming exercises. In the second method of variance reporting, known as favorable/(unfavorable), the type of account is also taken into consideration. For example, in revenue accounts, if actual results are higher than those budgeted, the variance is displayed as favorable. However, if actual expenses are higher than budget, then that variance is displayed as unfavorable. The key to the second method is the XCR print control used exclusively in calculated variance columns. When XCR matches up with a C in the normal balance of a row, it reverses the sign of the variance calculation result. Therefore, Cs are also placed on total rows that relate to accounts displaying a C such as Net Sales or Net Income. Microsoft Official Training Materials for Microsoft Dynamics ® Your use of this content is subject to your current services agreement
-
Upload
khangminh22 -
Category
Documents
-
view
1 -
download
0
Transcript of CHAPTER 9: VARIANCE REPORTING - GPUG

Chapter 9: Variance Reporting
9-1
CHAPTER 9: VARIANCE REPORTING Objectives
The objectives are:
• Create an over/(under) variance column definition • Define a report that displays favorable/(unfavorable) variances • Review sample report design concepts
Introduction Reporting on variances—either actual versus budget, or this year versus last year—is a common financial reporting format. Two methods are generally used when you are reporting on variances.
In the simpler method, one of the two amounts being compared is deducted from the other. No allowance is made for the type of accounts being reported. For example, if actual minus budget results in a positive number, then regardless of the account type (revenue or expense) the variance is said to be positive. This type of variance is known as over/(under) variances in the upcoming exercises.
In the second method of variance reporting, known as favorable/(unfavorable), the type of account is also taken into consideration. For example, in revenue accounts, if actual results are higher than those budgeted, the variance is displayed as favorable. However, if actual expenses are higher than budget, then that variance is displayed as unfavorable.
The key to the second method is the XCR print control used exclusively in calculated variance columns. When XCR matches up with a C in the normal balance of a row, it reverses the sign of the variance calculation result. Therefore, Cs are also placed on total rows that relate to accounts displaying a C such as Net Sales or Net Income.
Microsoft Official Training Materials for Microsoft Dynamics®
Your use of this content is subject to your current services agreement

Report Design in Management Reporter 2.0 for Microsoft Dynamics® ERP
9-2
Over/(Under) Variances Although not as common a variance display as favorable/(unfavorable), the over/(under) method is a straightforward method for comparing the difference in two amounts.
Over/(Under) Column Definition
The following steps define the process for creating a current period, actual versus budget report.
1. On the File menu, point to New, and then click Column Definition. 2. In column A, Column Type, double-click and select DESC (Row
descriptions). The default column width of 30 characters can be updated as you want, however, the changes only display in the generated report.
3. Repeat step 2 in columns B and C, selecting the FD column type. 4. In column C, double-click the Book Code/Attribute Category, and
select Budget_Original. The categories listed are defined in the source system.
5. In column D, select the CALC column type. 6. In the Formula field, type "B-C".
Microsoft Official Training Materials for Microsoft Dynamics®
Your use of this content is subject to your current services agreement

Chapter 9: Variance Reporting
9-3
7. Type the following descriptions into the Header 2 row: a. Column B - "Actual " b. Column C - "Budget " c. Column D - "Over/(Under)"
8. Save the column definition with the name "ABV_Cur_OU" and
description "Actual Budget Variance - Current period Over/(Under)".
FIGURE 9.1 ABV_CUR_OU COLUMN DEFINITION
Open a Report Definition
The over/under column design is associated with the detailed income statement row definition in the following steps.
1. Click the Report Definitions button on the navigation pane. 2. Double-click IS_CBR. 3. On the File menu, click the Save As menu item. 4. Type the name "IS_ABV_OU" and description "Detailed Income
Statement with Over/(Under) variances". 5. Click OK.
Microsoft Official Training Materials for Microsoft Dynamics®
Your use of this content is subject to your current services agreement

Report Design in Management Reporter 2.0 for Microsoft Dynamics® ERP
9-4
Generate Report
To generate the report, follow these steps:
1. Click the Column drop-down arrow and select ABV_Cur_OU. 2. Update the Default base period to 4. The report date adjusts to
4/30/2011. 3. Click the Output and Distribution tab and verify that the Output
name is IS_ABV_OU. 4. Click the Report tab. Notice that the updated output name displays
in the output and distribution summary information. 5. Click the Settings tab and select the Other Formatting option,
Display negative numbers in red. Clear the Display rows with no amounts option.
6. Update the Spaces between columns to 1. 7. Save the report definition and then click Generate Report.
Completed Report
Open the report in the Report Viewer.
1. Double-click the Income Statements folder. 2. Double-click IS_ABV_OU.
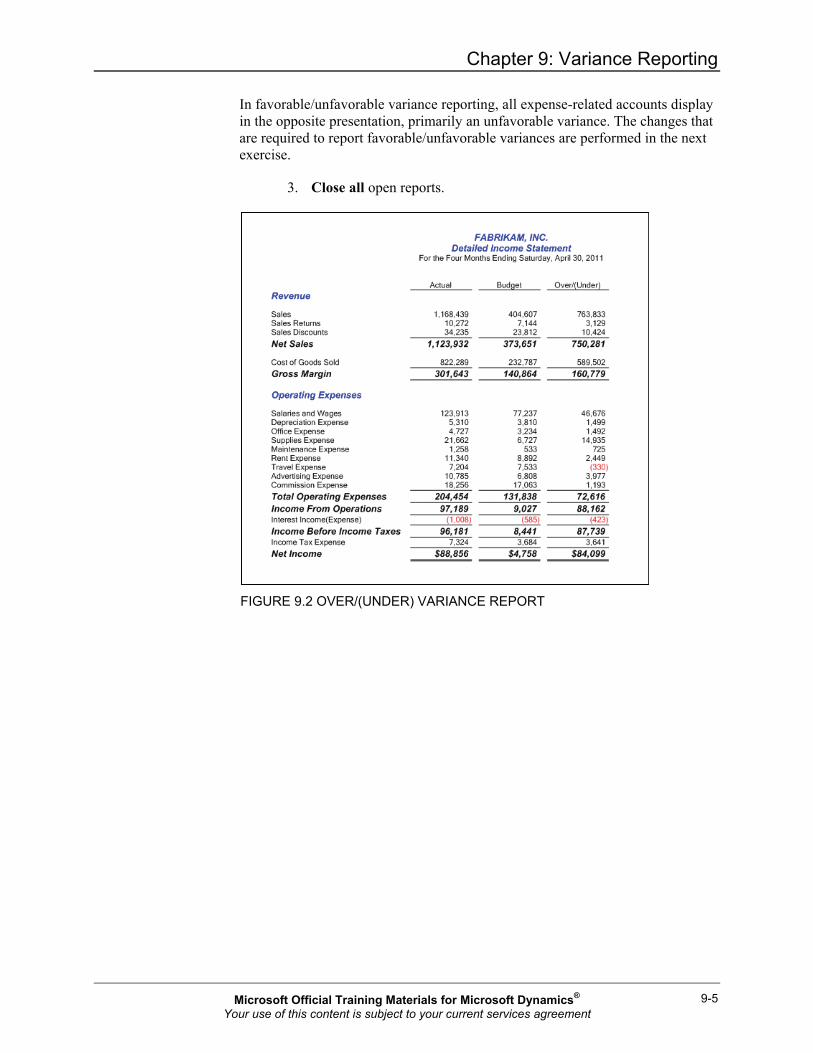
Notice that the completed report displays all negative values in red, while the over/under column reports the difference of actual results, minus budget expectations. All actual results are greater than the budget, except travel expense.
Microsoft Official Training Materials for Microsoft Dynamics®
Your use of this content is subject to your current services agreement
Chapter 9: Variance Reporting
9-5
In favorable/unfavorable variance reporting, all expense-related accounts display in the opposite presentation, primarily an unfavorable variance. The changes that are required to report favorable/unfavorable variances are performed in the next exercise.
3. Close all open reports.
FIGURE 9.2 OVER/(UNDER) VARIANCE REPORT
Microsoft Official Training Materials for Microsoft Dynamics®
Your use of this content is subject to your current services agreement

Report Design in Management Reporter 2.0 for Microsoft Dynamics® ERP
9-6
Favorable/(Unfavorable) Variances The column design for favorable/unfavorable reporting is similar to the over/under design, with two primary differences: the calculation formula is reversed and the XCR print control is activated.
FIGURE 9.3 FAVORABLE/(UNFAVORABLE) VARIANCE REPORT
Favorable/(Unfavorable) Column
The over/under column design is used as a starting template for the favorable/unfavorable design that is created in the following steps.
1. Click the Column Definitions button on the navigation pane. 2. Double-click ABV_Cur_OU. 3. On the File menu, click the Save As menu item. 4. Type the name "ABV_Cur_Fav" and update the description to read
"Actual Budget Variance - Current period Fav/(Unfav)". 5. Click OK. 6. Double-click column D, Header 1, and in the Column header text,
type "Favorable/". Click the Format options drop-down arrow and select None. Click OK.
7. Click in Header 2 and update the text to read "(Unfavorable)". 8. In the Formula, field type "C-B". In this method of variance
reporting, the basis for comparison comes first in the formula.
Microsoft Official Training Materials for Microsoft Dynamics®
Your use of this content is subject to your current services agreement
Chapter 9: Variance Reporting
9-7
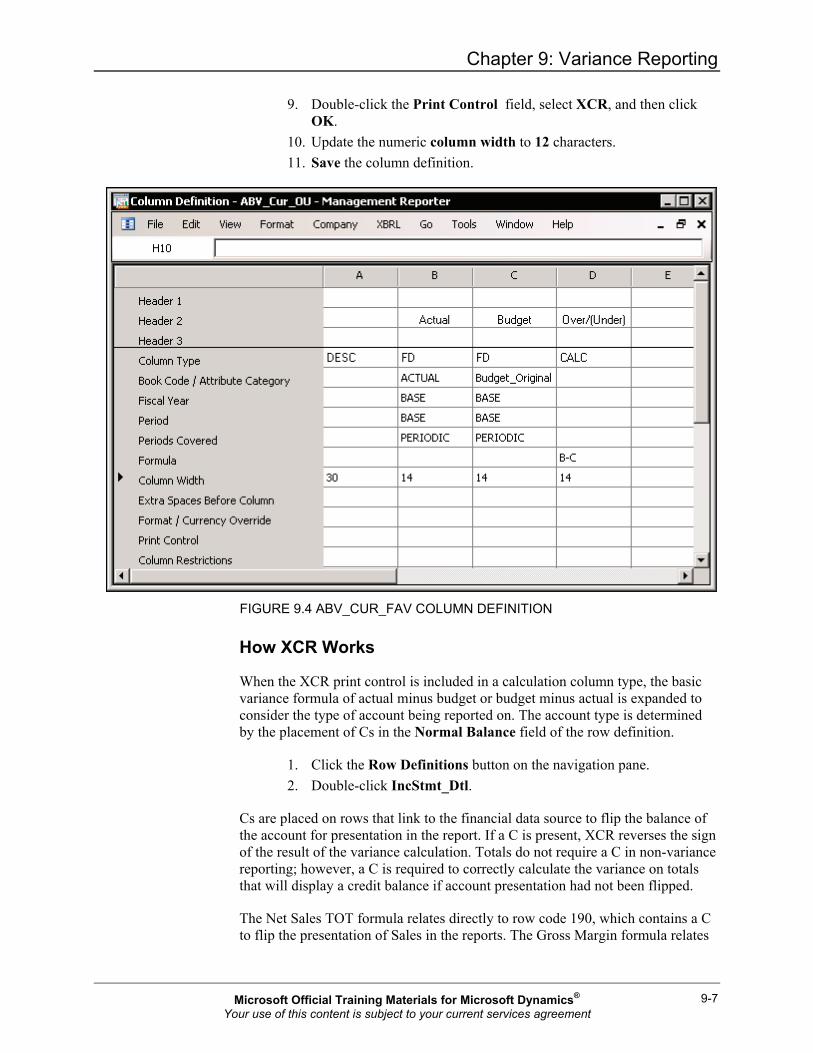
9. Double-click the Print Control field, select XCR, and then click OK.
10. Update the numeric column width to 12 characters. 11. Save the column definition.
FIGURE 9.4 ABV_CUR_FAV COLUMN DEFINITION
How XCR Works
When the XCR print control is included in a calculation column type, the basic variance formula of actual minus budget or budget minus actual is expanded to consider the type of account being reported on. The account type is determined by the placement of Cs in the Normal Balance field of the row definition.
1. Click the Row Definitions button on the navigation pane. 2. Double-click IncStmt_Dtl.
Cs are placed on rows that link to the financial data source to flip the balance of the account for presentation in the report. If a C is present, XCR reverses the sign of the result of the variance calculation. Totals do not require a C in non-variance reporting; however, a C is required to correctly calculate the variance on totals that will display a credit balance if account presentation had not been flipped.
The Net Sales TOT formula relates directly to row code 190, which contains a C to flip the presentation of Sales in the reports. The Gross Margin formula relates
Microsoft Official Training Materials for Microsoft Dynamics®
Your use of this content is subject to your current services agreement

Report Design in Management Reporter 2.0 for Microsoft Dynamics® ERP
9-8
to row code 310, Net Sales, so an indirect relationship exists to the Sales row. Total Expenses does not display a C, because it carries a debit balance and does not relate to rows with a C.
View the Report
A new report definition is created based on the over/under report design.
1. Click the Report Definitions button on the navigation pane. 2. Double-click IS_ABV_OU. 3. On the File menu, click the Save As menu item. 4. Update the name to read "IS_ABV_Fav". Update the description
accordingly and then click OK. 5. Click the Column drop-down arrow and select ABV_Cur_Fav. 6. Click the Output and Distribution tab and if needed, update the
output name to "IS_ABV_Fav". 7. Save the report definition and then click Generate Report. 8. Double-click the Income Statements folder. 9. Double-click IS_ABV_Fav; the completed report is displayed.
Demonstration: Variance Percentages
In addition to dollar variances, you can add a percentage variance column to the favorable/unfavorable design.
1. Return to Report Designer and then click the Open Column Definition icon.
2. In column E, select the CALC column type. 3. Type the formula "D/C". 4. Update the column width to 12. 5. Select the Percentage Format Override with negative numbers
presented in parenthesis ( ). Click OK. 6. Double-click column D, Header 1. Update the column header text to
read "Favorable/(Unfavorable)". 7. Select the Box format option and Spread the header from D to E.
Click OK.
Microsoft Official Training Materials for Microsoft Dynamics®
Your use of this content is subject to your current services agreement

Chapter 9: Variance Reporting
9-9
8. Click column D, Header 2 and press the Delete key. Type a currency symbol "$". Click column E, Header 2 and type a percent sign "%".
9. Save the changes to the column definition.
FIGURE 9.5 PERCENTAGE VARIANCE COLUMN
Re-generate a Report
Return to the report definition to generate the revised design.
1. Click the Open Report Definition icon. 2. Click Generate Report.
Microsoft Official Training Materials for Microsoft Dynamics®
Your use of this content is subject to your current services agreement

Report Design in Management Reporter 2.0 for Microsoft Dynamics® ERP
9-10
3. Open the Income Statements folder to review the revised IS_ABV_Fav design.
4. Close all open windows.
FIGURE 9.6 IS_ABV_FAV INCOME STATEMENT
Design Review The sample building block definitions included with Management Reporter contain a variance column definition that displays budget and prior year variances, in addition to a dynamic actual or budget full year trend. Students can return to the Demo Reports building block group to review the sample designs.
NOTE: Users can also export the sample designs and then import them into their own building block group to use the sample designs as templates. Refer to the "Review Plus" lesson of this training for more information about how to export and import.
Current and YTD Variances
Review the current and YTD actual versus budget and last year column definition in the following steps.
1. On the Company menu, click the Companies menu item. 2. Click the Modify button. 3. Click the Building block group drop-down arrow and select Demo
Reports. 4. Click OK.
Microsoft Official Training Materials for Microsoft Dynamics®
Your use of this content is subject to your current services agreement

Chapter 9: Variance Reporting
9-11
5. Click Close. 6. Click the Column Definitions button in the navigation pane. 7. Double-click CY_Act_Bud_LYr to open the variance design.
The design includes the following concepts:
• Current and year-to-date columns for actual, budget, and last year actual results
• Budget variance for both current and year-to-date in the favorable/(unfavorable) design
• Last year variance for both current and year-to-date in the favorable/(unfavorable) design
FIGURE 9.7 CY_ACT_BUD_LYR COLUMN DEFINITION
Dynamic Actual or Budget Columns
Another column design included with the sample reports displays a twelve month trend of actual or budget columns. The report dynamically displays actual results up to the reporting month, and then budget columns are shown for the rest of the year. Based on the report date, the Conditional Print options control whether actual or budget results are shown.
1. Verify that the column definitions are active in the navigation pane and open Dynamic_GL.
2. Click the Print Control to review the Conditional Print options.
Microsoft Official Training Materials for Microsoft Dynamics®
Your use of this content is subject to your current services agreement

Report Design in Management Reporter 2.0 for Microsoft Dynamics® ERP
9-12
Two design concepts are stressed in this column definition: the conditional print control and the range formula.
• Conditional Print options compare P, the Period as defined in the column definition, to B, the Base period as defined in the report definition. When the condition is true, the column prints. If the condition is false, the column is nonprinting. In the design, actual columns print when the period is less than or equal to the report date, while budget columns only print if the period is greater than the report date.
• Columns that are nonprinting, either because of a Conditional Print option or the NP print control, are ignored in column calculations that contain a range. For example, column Z of the design displays the formula B:Y. Only columns that print are included in the Full Year Forecast column.
FIGURE 9.8 DYNAMIC_GL COLUMN DEFINITION
Reset the Training Building Blocks
The Fabrikam, Inc. company is reset to the "Training" building block group.
1. On the File menu, click Close All. 2. On the Company menu, click the Companies menu item. 3. Click the Modify button. 4. Click the Building block group drop-down arrow and select
Training.
Microsoft Official Training Materials for Microsoft Dynamics®
Your use of this content is subject to your current services agreement

Chapter 9: Variance Reporting
9-13
5. Click OK. 6. Click Close.
FIGURE 9.9 FW COMPANY
Summary Variance reports are designed when users want to display the difference between two columns of results. The two methods of designing variance reports are: over/(under) and favorable/(unfavorable). When using the favorable/(unfavorable) method, the print control XCR is applied to the variance column in addition to the calculation formula. XCR works in combination with the C normal balance code in the row definition to present the correct sign on the variance. Variances can be presented in dollar or percentage formats.
Students benefit from this part of training by learning the subtle design differences in the two variance reporting formats.
Microsoft Official Training Materials for Microsoft Dynamics®
Your use of this content is subject to your current services agreement

Report Design in Management Reporter 2.0 for Microsoft Dynamics® ERP
9-14
Test Your Knowledge Test your knowledge with the following questions.
1. Which of the following are true statements about XCR? (Select all that apply)
( ) XCR is required on all variance columns ( ) XCR looks for C in the normal balance of the row definition ( ) XCR is typically used in favorable/(unfavorable) variance reports ( ) XCR is defined in both the row and column definition
2. Actual sales (A) are 650 and budget sales (B) are 575. What is the correct column design for favorable/(unfavorable) variance reporting when budget is used as the comparative basis?
( ) B-A with XCR ( ) A-B with XCR ( ) B-A ( ) A-B
3. Which of the following are true statements about Conditional Print options in the column definition? (Select all that apply)
( ) A single column can return actual or budget results based on the print control
( ) P=B is a Print Control option that only prints the column if the period (P) is the same as the base period (B) in the report definition
( ) P>=B is a Print Control option that prints any column with a period (P) that is greater than or the same as the base period (B) in the report definition
( ) P<B is a Print Control option that prints any column with a period (P) that is less than or the same as the base period (B) in the report definition
Microsoft Official Training Materials for Microsoft Dynamics®
Your use of this content is subject to your current services agreement

Chapter 9: Variance Reporting
9-15
Quick Interaction: Lessons Learned Take a moment and write down three key points you have learned from this chapter
1.
2.
3.
Microsoft Official Training Materials for Microsoft Dynamics®
Your use of this content is subject to your current services agreement

Report Design in Management Reporter 2.0 for Microsoft Dynamics® ERP
9-16
Solutions Test Your Knowledge
1. Which of the following are true statements about XCR? (Select all that apply)
( ) XCR is required on all variance columns (√) XCR looks for C in the normal balance of the row definition (√) XCR is typically used in favorable/(unfavorable) variance reports ( ) XCR is defined in both the row and column definition
2. Actual sales (A) are 650 and budget sales (B) are 575. What is the correct column design for favorable/(unfavorable) variance reporting when budget is used as the comparative basis?
(•) B-A with XCR ( ) A-B with XCR ( ) B-A ( ) A-B
3. Which of the following are true statements about Conditional Print options in the column definition? (Select all that apply)
( ) A single column can return actual or budget results based on the print control
(√) P=B is a Print Control option that only prints the column if the period (P) is the same as the base period (B) in the report definition
(√) P>=B is a Print Control option that prints any column with a period (P) that is greater than or the same as the base period (B) in the report definition
( ) P<B is a Print Control option that prints any column with a period (P) that is less than or the same as the base period (B) in the report definition
Microsoft Official Training Materials for Microsoft Dynamics®
Your use of this content is subject to your current services agreement