genetic signatures of the Hellenic colonization in southern ...
21
Title: The Greeks in the West: genetic signatures of the Hellenic colonization in southern Italy and Sicily Tofanelli Sergio 1* , Brisighelli Francesca 2,3* , Anagnostou Paolo 4,5 , Busby George BJ 2,6 , Ferri Gianmarco 7 , Thomas Mark G 8 , Taglioli Luca 1 , Rudan Igor 9 , Zemunik Tatijana 10 , Hayward Caroline 11 , Bolnick Deborah 11 , Romano Valentino 12,13 , Cali Francesco 12 , Luiselli Donata 14 , Shepherd Gillian B 15 , Tusa Sebastiano 16 , Facella Antonino 17 , Capelli Cristian 2 Affiliations: 1 Dipartimento di Biologia, Università di Pisa, Via Ghini 13, 56126 Pisa, Italy. 2 Department of Zoology, University of Oxford, South Parks Road, OX1 3PS Oxford, UK. 3 Sezione di Medicina Legale-Istituto di Sanità Pubblica, Università Cattolica del Sacro Cuore, Roma, Italia 4 Dipartimento di Biologia Ambientale, Università “La Sapienza”, Piazzale Aldo Moro 5, 00185 Roma, Italy. 5 Istituto Italiano di Antropologia, Piazzale Aldo Moro 5, 00185, Roma, Italy 6 Wellcome Trust Centre for Human Genetics, Roosevelt Drive, Oxford 7 Dipartimento ad Attività Integrata di Laboratori, Anatomia Patologica, Medicina legale; U.O. - Struttura complessa di Medicina legale, Via del Pozzo, 71 – Policlinico, 41124 Modena, Italy. 8 Department of Genetics, Evolution and Environment, University College London, London, UK 9 Centre for Population Health Sciences, The University of Edinburgh Medical School, Teviot Place, Edinburgh EH8 9AG, Scotland, UK 10 Department of Medical Biology, University of Split, School of Medicine, Soltanska 2, 21000 Split Croatia 11 MRC Human Genetics Unit, Institute of Genetics and Molecular Medicine (IGMM), University of Edinburgh, Western General Hospital, Crewe Road, Edinburgh EH4 2XU United Kingdom. 12 Dipartimento di Fisica e Chimica, Università di Palermo, Palermo, Italy 13 Laboratorio di Genetica Molecolare, I.R.C.C.S. Associazione Oasi Maria SS., Troina (EN), Italy 14 Laboratorio di Antropologia Molecolare, Dipartimento di Scienze Biologiche, Geologiche e Ambientali, Università di Bologna, Via Selmi 3, 40126 Bologna, Italy. 15 A.D. Trendall Research Centre for Ancient Mediterranean Studies, La Trobe University, Australia 16 Sopraintendenza del mare. Regione Siciliana, Via Lungarini, 9 90133 Palermo, Italy. 17 Soprintendenza per i Beni Archeologici della Calabria, Piazza de Nava 26, 89100 Reggio Calabria, Italy. * contributed equally to the paper Corresponding author: Cristian Capelli Department of Zoology, South Parks Road, OX1 3PS, University of Oxford, Oxford, UK [email protected] CORE Metadata, citation and similar papers at core.ac.uk Provided by UCL Discovery
-
Upload
khangminh22 -
Category
Documents
-
view
4 -
download
0
Transcript of genetic signatures of the Hellenic colonization in southern ...

Title: The Greeks in the West: genetic signatures of the Hellenic colonization in southern Italy and Sicily Tofanelli Sergio1*, Brisighelli Francesca2,3*, Anagnostou Paolo4,5, Busby George BJ2,6, Ferri Gianmarco7, Thomas Mark G8, Taglioli Luca1, Rudan Igor9, Zemunik Tatijana10, Hayward Caroline11, Bolnick Deborah11, Romano Valentino12,13, Cali Francesco12, Luiselli Donata14, Shepherd Gillian B15, Tusa Sebastiano16, Facella Antonino17, Capelli Cristian2 Affiliations: 1 Dipartimento di Biologia, Università di Pisa, Via Ghini 13, 56126 Pisa, Italy. 2 Department of Zoology, University of Oxford, South Parks Road, OX1 3PS Oxford, UK. 3 Sezione di Medicina Legale-Istituto di Sanità Pubblica, Università Cattolica del Sacro Cuore, Roma, Italia 4 Dipartimento di Biologia Ambientale, Università “La Sapienza”, Piazzale Aldo Moro 5, 00185 Roma, Italy. 5 Istituto Italiano di Antropologia, Piazzale Aldo Moro 5, 00185, Roma, Italy 6 Wellcome Trust Centre for Human Genetics, Roosevelt Drive, Oxford 7 Dipartimento ad Attività Integrata di Laboratori, Anatomia Patologica, Medicina legale; U.O. - Struttura complessa di Medicina legale, Via del Pozzo, 71 – Policlinico, 41124 Modena, Italy. 8 Department of Genetics, Evolution and Environment, University College London, London, UK 9 Centre for Population Health Sciences, The University of Edinburgh Medical School, Teviot Place, Edinburgh EH8 9AG, Scotland, UK 10 Department of Medical Biology, University of Split, School of Medicine, Soltanska 2, 21000 Split Croatia 11 MRC Human Genetics Unit, Institute of Genetics and Molecular Medicine (IGMM), University of Edinburgh, Western General Hospital, Crewe Road, Edinburgh EH4 2XU United Kingdom. 12 Dipartimento di Fisica e Chimica, Università di Palermo, Palermo, Italy 13 Laboratorio di Genetica Molecolare, I.R.C.C.S. Associazione Oasi Maria SS., Troina (EN), Italy 14 Laboratorio di Antropologia Molecolare, Dipartimento di Scienze Biologiche, Geologiche e Ambientali, Università di Bologna, Via Selmi 3, 40126 Bologna, Italy. 15 A.D. Trendall Research Centre for Ancient Mediterranean Studies, La Trobe University, Australia 16 Sopraintendenza del mare. Regione Siciliana, Via Lungarini, 9 90133 Palermo, Italy. 17 Soprintendenza per i Beni Archeologici della Calabria, Piazza de Nava 26, 89100 Reggio Calabria, Italy. * contributed equally to the paper Corresponding author: Cristian Capelli Department of Zoology, South Parks Road, OX1 3PS, University of Oxford, Oxford, UK [email protected]
CORE Metadata, citation and similar papers at core.ac.uk
Provided by UCL Discovery

ABSTRACT Greek colonization of South Italy and Sicily (Magna Graecia) was a defining event in European
cultural history, although the demographic processes and genetic impacts involved have not been
systematically investigated. Here, we combine high-resolution surveys of the variability at the
uni-parentally inherited Y chromosome and mitochondrial DNA in selected samples of putative
source and recipient populations with forward-in-time simulations of alternative demographic
models to detect signatures of that impact. Using a subset of haplotypes chosen to represent
historical sources, we recover a clear signature of Greek ancestry in East Sicily compatible with
the settlement from Euboea during the Archaic Period (8th-5th century BCE). We inferred
moderate sex-biases in the numbers of individuals involved in the colonization: a few thousand
breeding males and a few hundred breeding females were the estimated number of migrants.
Lastly, we demonstrate that studies aimed at quantifying Hellenic genetic flow by the proportion
of specific lineages surviving in present-day populations may lead to misleading conclusions.
Running title: Genetic legacy of Magna Graecia Key words: Hellenic colonization; Y chromosome; mtDNA; Sicily; Italy

INTRODUCTION
“…board a fast ship to Sicily, where you could sell them for a profit." (Homer, Odyssey XX 382-
383)
From the 8th century BCE, the Western Mediterranean witnessed a settlement process which
originated in the Aegean and had its center of gravity in Eastern Sicily and Southern Italy, an area
later known as Magna Graecia. Records of its magnitude, which paved the way for the Classical
era and its long-lasting influence in Western civilization, include the archeological sites such as
Syracuse, Agrigento, Paestum and Selinous. There is substantial agreement on the drivers of this
colonization and the geo-historical dynamics of the settlements (e.g. Graham 1982, Pugliese
Carratelli 1996, Guzzo 2011). However, the nature of early settlements, the scale of demographic
impact of the settlers and their genetic legacy are still debated. Archaeologists, historians and
demographers have proposed different degrees of Greek contribution, with scenarios ranging
from a colonization process based on small groups of males moderately admixing with
autochthonous groups (Boardman 1980 p.163, Yntema 2011), “like ants or frogs about a pond”
(Plato, Phaedo 109a-b), to substantial migrations from Greece and a Hellenic origin for a
significant part of the pre-Roman Italian population (Dunbabin 1948, Faure 1978, Scheidel 2003).
To date, genetic investigations have not specifically focused on the legacy of the population
displacements that contributed to the establishment of Magna Graecia. Instead, they have been
general surveys of southern Italian and Greek populations, which omitted both the main source
areas (above all Euboea Island, and some regions in the Peloponnese) and the areas settled directly
from Greece (the Sicilian and Ionic coasts). A substantial Greek contribution to the current
Sicilian and southern Italian gene pool has previously been inferred on the basis of classical
polymorphisms (Piazza et al. 1988, Cavalli-Sforza et al. 1994), while the main clinal differences
along the Italian peninsula at uni-parentally transmitted systems have been interpreted as the result
of other demographic processes occurred during the Neolithic and the Metal Ages (Capelli et al.
2007, Brisighelli et al. 2012, Boattini et al. 2013).

When the genetic impact of the Greek Colonization (hereafter GC) has been specifically
investigated (Di Gaetano et al. 2009, King et al. 2011) a lineage-based interpretative
phylogeographic approach was used. Etimates of the GC contribution have relied upon the
frequency of the more frequent haplogroups in present-day Greeks and the presence/absence of
specific Y lineages (E-V13) or STR motifs (Balkan Modal Haplotype). The presence of E-V13
in Sicily and Provence was interpreted as the result of a massive movement of Greek colonists
into the western Mediterranean, ranging from 17% to 37% of the current gene pool. However,
these approaches can be strongly misleading because of stochasticity in the genealogical process,
poor temporal resolution in dating the origin of specific lineages, the difficulty of assigning a
geographic origin to those lineages, and equifinality. For example, population patterns might not
hold when SNPs defining finer haplogroup assignments are genotyped. Moreover, it is
problematic to treat specific lineages or haplotypes as markers of GC, as these studies have done,
because (1) the region where a haplotype is most common today is not necessarily the region
where it originated (Edmonds et al. 2004, Klopfstein et al. 2006), (2) modern population samples
from the hypothesized source region may not be a good proxy for ancestral source populations,
and (3) present-day patterns might be related to other events that triggered migration along the
same route, most notably the Neolithic agricultural revolution or migratory flows during the
Bronze Age, the Classical Era, and the Christian Era. Examples of the latter are the formation of
Greek-speaking enclaves during the Byzantine period and the arrival of refugees escaping to the
Ottoman conquest of the Balkans in the 16th and 17th century. In addition, previous work has not
formally tested alternative demographic models to clarify the scale of migration associated with
the GC, an issue that has been puzzling demographers for a very long time (Beloch 1886, Mc
Evedy & Jones 1978; Hansen 2006; Turchin & Scheidel 2009).
An investigation of the Greek genetic legacy capable of discerning these different historical layers
as well as exploring the echoes of the demographic impact consequent to the colonization process
has yet to be conducted. Tackling such questions requires the combination of a sampling plan
covering the relevant representative areas with a targeted genotyping strategy. In order to meet

this goal we applied a hypothesis-testing approach consisting of a deep molecular characterization
at male specific Y chromosome regions coupled with extensive simulations aimed at comparing
alternative models for the origin and fate of Greek genetic contributions to southern Italy and
Sicily. In doing so, we: (a) tested for the presence of specific and robust signatures of Greek
contribution to Italy and Sicily; (b) tested alternative models to estimate the most likely scale of
the colonization process, with a focus on the relative contribution of males versus females; and
(c) evaluated the implications of lineage-based approaches in the characterization of past
demographic events.
MATERIALS AND METHODS
Sampling
A total of 811 unrelated individuals native to Greek districts (Euboea island and Corinthia)
thought to be at the origin of the GC migrations as well as of cities placed in close proximity to
primary and secondary Greek colonies in southern Italy were recruited through informed consent
(Figure 1). The project received ethical approval by the institutions involved in the collection of
the samples. Other putative recipient population samples from northern and central Italy were
made available (N=201; Brisighelli et al. 2012). In addition, DNA samples from Albania (Ferri
et al. 2010), Croatia (Rudan et al. 2009) and West Anatolia (Richards et al. 2000) were obtained
as reference populations. To analyse samples of source, recipient and reference populations of
comparable size, Italian populations were clustered into six main groups following geographical
and historical criteria (Table S1).
DNA was extracted from whole blood or oral samples (buccal swabs or saliva) through a modified
salting out procedure (Walsh et al, 1991) or commercially available extraction kits (Master Pure™
Purification kit, Epicentre, Nucleon BACC, GE Healthcare Life Sciences).
Genotyping
A total of 59 previously published SNPs was analysed following a hierarchical genotyping
strategy. Samples were amplified in a standard PCR reaction and the SNaPshot Multiplex System

(Life Technologies Corp., Carlsbad, CA, USA) primer extension protocol was used. All samples
were first genotyped for markers M9, M17, M35, M45, M89, M170, M172, M173, M201, M267,
M269, M282, M304 in order to classify them to major European branches. Samples resolved
belonging to haplogroups E-M35, E-M78, J2-M172, I-M170 and R1b-M269 were further
analysed by means of haplogroup specific multiplexes (E-M35: M81, M107, M123, M165, M281,
P72, V6; E-M78: M78, M148, M224, M521, V12, V13, V19, V22, V27, V32, V65; I-M170:
M26, M223, M253, M423, M438, P37.2; J2-M172: M47, M67, M92, M102, M241, M280, M319,
M410; R1b-M269 see Busby et al., 2011: M153, M222, M412, S21, S28, S29, S116, S127, S139,
S144, S145, SRY2627). Furthermore, samples assigned to haplogroup G-M201 were analysed
for markers M406 and P15 through direct sequencing. The multiplex reactions are described in
supplementary material (Tables S2, S3). Nomenclature used for haplogroup labelling follows
YCC conventions (The Y Chromosome Consortium 2002) and recent updating (ISOGG Y-Tree
2014 http://www.isogg.org/tree/).
The entire dataset was also analysed at a total of 26 YSTRs: those included in the AmpFlSTR®
Yfiler® PCR Amplification kit (Applied Biosystems, Foster City, CA), which were typed
according to manufacturer instructions, and additional 9 YSTRs (DYS460, DYS388, YCA-II a/b,
DYS461, DYS445, YGATA-A.10, DYS413 a/b) by suitably designed multiplexed-PCR reactions
(Table S4). We finally assembled a haplotype dataset based on 20 of the 26 analysed STR markers
by excluding those STRs that in the PCR analysis co-amplify two loci whose allele assignation
to a defined locus was not possible (DYS385 a/b, YCA-II a/b and DYS413 a/b). A subset of
samples (N=304) has been analysed for the Hypervariable Region I (HVR-I) of mitochondrial
DNA using primers 15997L and 017H.
Statistical Analyses
An FST genetic distance matrix (Slatkin 1995) was computed on Y haplogroup frequencies using
the Arlequin package (version 3.5.1.2, Excoffier et al. 2010) and graphically represented by a
non-metric multidimensional scaling (NM-MDS) (Kruskal 1964). The analysis involved 15
population samples: the six Italian recipient groups, the two source samples from Greece (Euboea,
Korinth), the three reference samples (Turkey, Albania, Croatia) and additional samples from
Crete (Martinez et al. 2007, King et al. 2008), mainland Greece (King et al. 2008) and Lebanon
(Zalloua et al. 2008). To make possible comparison across datasets genotyped with different SNP
panels, haplogroups were pooled to the least basal common node on the ISOGG 2015 Y tree
(http://www.isogg.org/tree/) for a total of 17 groups. Stress value suggests a non-random
distribution of population samples in the bi-dimensional plot (0.0758, p<0.05, Sturrock & Rocha
2000).
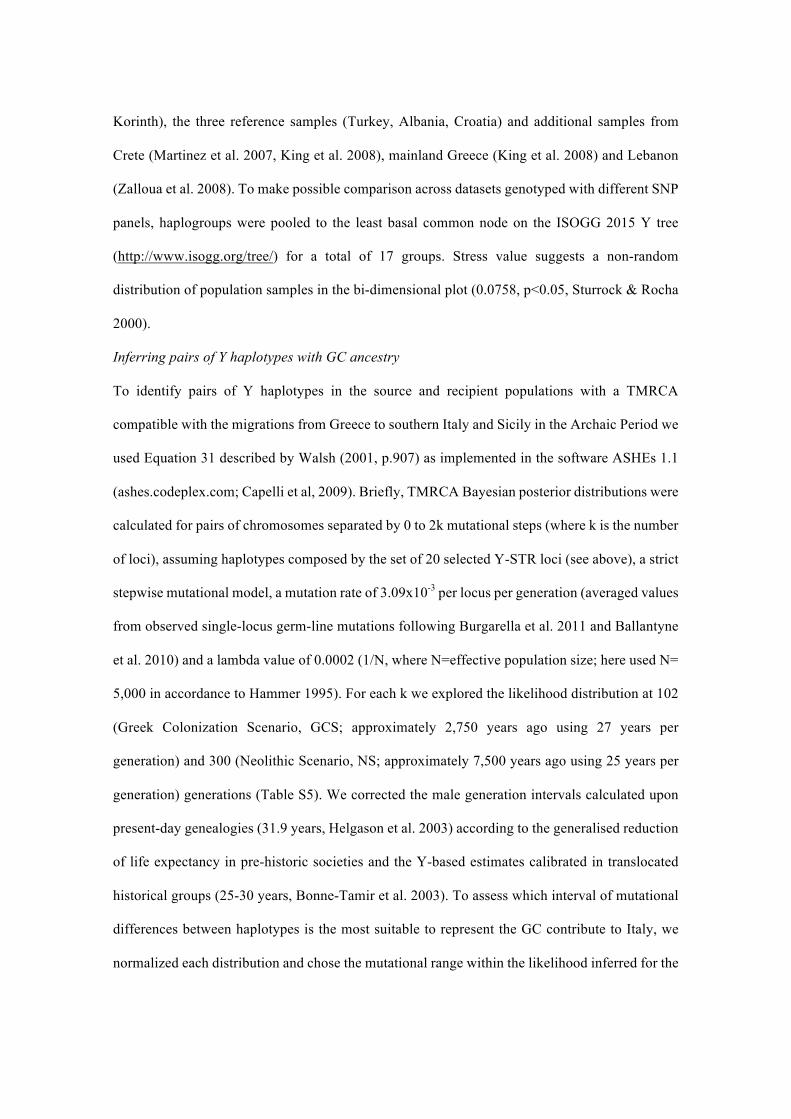
Inferring pairs of Y haplotypes with GC ancestry
To identify pairs of Y haplotypes in the source and recipient populations with a TMRCA
compatible with the migrations from Greece to southern Italy and Sicily in the Archaic Period we
used Equation 31 described by Walsh (2001, p.907) as implemented in the software ASHEs 1.1
(ashes.codeplex.com; Capelli et al, 2009). Briefly, TMRCA Bayesian posterior distributions were
calculated for pairs of chromosomes separated by 0 to 2k mutational steps (where k is the number
of loci), assuming haplotypes composed by the set of 20 selected Y-STR loci (see above), a strict
stepwise mutational model, a mutation rate of 3.09x10⁻³ per locus per generation (averaged values
from observed single-locus germ-line mutations following Burgarella et al. 2011 and Ballantyne
et al. 2010) and a lambda value of 0.0002 (1/N, where N=effective population size; here used N=
5,000 in accordance to Hammer 1995). For each k we explored the likelihood distribution at 102
(Greek Colonization Scenario, GCS; approximately 2,750 years ago using 27 years per
generation) and 300 (Neolithic Scenario, NS; approximately 7,500 years ago using 25 years per
generation) generations (Table S5). We corrected the male generation intervals calculated upon
present-day genealogies (31.9 years, Helgason et al. 2003) according to the generalised reduction
of life expectancy in pre-historic societies and the Y-based estimates calibrated in translocated
historical groups (25-30 years, Bonne-Tamir et al. 2003). To assess which interval of mutational
differences between haplotypes is the most suitable to represent the GC contribute to Italy, we
normalized each distribution and chose the mutational range within the likelihood inferred for the

GCS which minimized the overlapping (<0.4%) with the distribution inferred for the NS. Such a
range was 8-12.
To estimate the 95% confidence boundaries, we approximated each distribution to a normal one,
centred on the most likely TMRCA value. We then calculated the area below the posterior
distribution comprised between the most likely value and the origin of the curve, and equated this
value to 50% of the total likelihood curve. The 2.5% lower bound of the distribution was identified
as the TMRCA value comprising the 95% of the right hand side likelihood of the curve. The value
for the upper bound was similarly estimated by symmetry.
As previously shown (Walsh 2001), the robustness of such estimates is strongly influenced by the
number of STRs investigated, so we tried to maximise the number of investigated loci.
Tracking genetic footprints of the GC legacy in Italy
In order to detect Greece-to-Italy genetic contributions from the Archaic Period (1000-400 B.C.),
we first performed pairwise comparisons at 20-locus YSTRs haplotypes between either sources
(from Euboea, Corinth) or reference populations (from Croatia, Albania, Turkey) and putative
recipient populations (20 Italian groups pooled in six geographical districts, Table S1). Then, we
calculated, for each population pair and within the same haplogroup, the proportion of haplotypes
diverging for 8-12 mutational differences. To assess whether the enrichment in haplotype pairs
matching this interval was significantly higher between sources and recipient populations than
between sources and reference populations, we performed Fisher exact tests with the Arlequin
software v 3.5 (Excoffier et al., 2010). Moreover, since the effect of more recent demography
might overestimate this signal, we applied the same procedure to both the whole sample (Not
Filtered or NF) and a subset of haplotypes (Filtered or F), the latter obtained by removing all
haplotypes from recipient populations with fewer than 7 mutational differences from source
population haplotypes.
Computer simulations
To estimate the contribution of Greek colonizers to present-day southern Italian communities, we
applied a hypothesis-testing approach based on the deviation from observed values of the
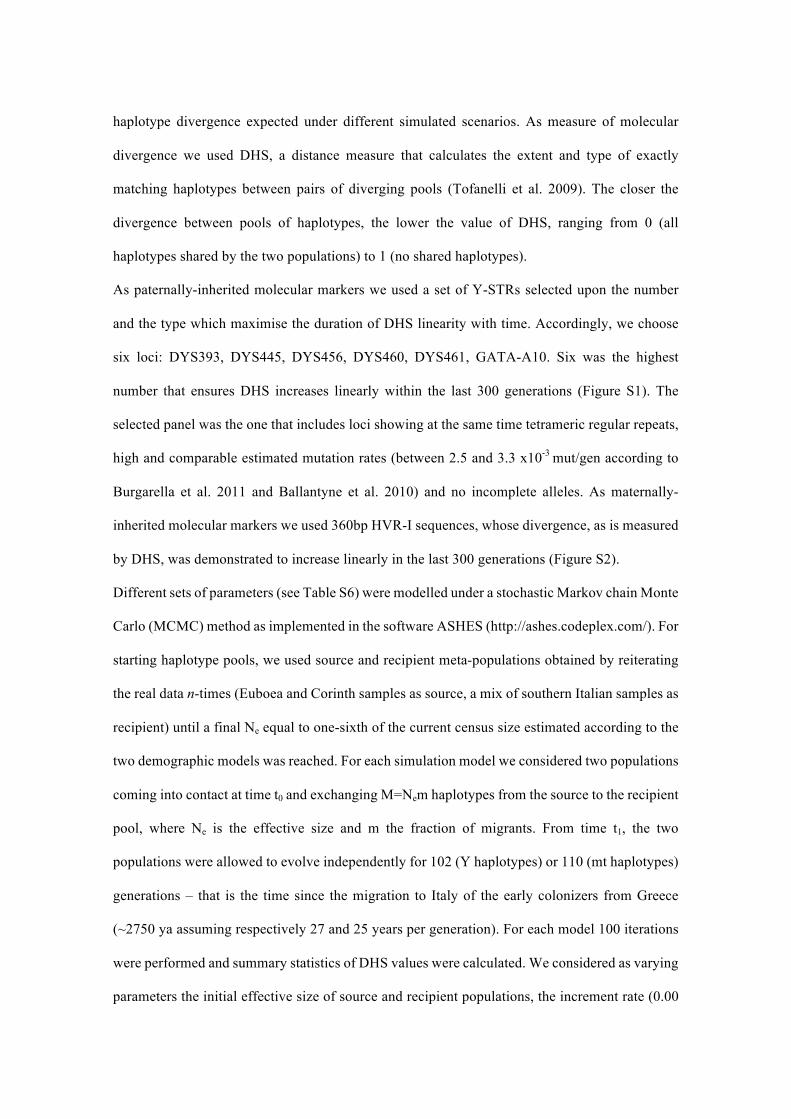
haplotype divergence expected under different simulated scenarios. As measure of molecular
divergence we used DHS, a distance measure that calculates the extent and type of exactly
matching haplotypes between pairs of diverging pools (Tofanelli et al. 2009). The closer the
divergence between pools of haplotypes, the lower the value of DHS, ranging from 0 (all
haplotypes shared by the two populations) to 1 (no shared haplotypes).
As paternally-inherited molecular markers we used a set of Y-STRs selected upon the number
and the type which maximise the duration of DHS linearity with time. Accordingly, we choose
six loci: DYS393, DYS445, DYS456, DYS460, DYS461, GATA-A10. Six was the highest
number that ensures DHS increases linearly within the last 300 generations (Figure S1). The
selected panel was the one that includes loci showing at the same time tetrameric regular repeats,
high and comparable estimated mutation rates (between 2.5 and 3.3 x10⁻³ mut/gen according to
Burgarella et al. 2011 and Ballantyne et al. 2010) and no incomplete alleles. As maternally-
inherited molecular markers we used 360bp HVR-I sequences, whose divergence, as is measured
by DHS, was demonstrated to increase linearly in the last 300 generations (Figure S2).
Different sets of parameters (see Table S6) were modelled under a stochastic Markov chain Monte
Carlo (MCMC) method as implemented in the software ASHES (http://ashes.codeplex.com/). For
starting haplotype pools, we used source and recipient meta-populations obtained by reiterating
the real data n-times (Euboea and Corinth samples as source, a mix of southern Italian samples as
recipient) until a final Ne equal to one-sixth of the current census size estimated according to the
two demographic models was reached. For each simulation model we considered two populations
coming into contact at time t0 and exchanging M=Nem haplotypes from the source to the recipient
pool, where Ne is the effective size and m the fraction of migrants. From time t1, the two
populations were allowed to evolve independently for 102 (Y haplotypes) or 110 (mt haplotypes)
generations – that is the time since the migration to Italy of the early colonizers from Greece
(~2750 ya assuming respectively 27 and 25 years per generation). For each model 100 iterations
were performed and summary statistics of DHS values were calculated. We considered as varying
parameters the initial effective size of source and recipient populations, the increment rate (0.00

ind/gen, stationary model; 0.01 ind/gen, growth model), and the number of exchanged haplotypes
M (0, 500, 1000, 5000). Invariants were the mutation rate (0.0027 mut/site/gen for Y haplotypes;
0.0000041 mut/site/gen for mt haplotypes), the haplotype diversity (0.90 and 0.80 respectively
for source and recipient Y haplotypes; 0.96 and 0.92 respectively for source and recipient mt
haplotypes), and the DHS between source and recipient pools at t0 (0.7 for Y haplotypes; 0.5 for
mt haplotypes). The latter values are those expected between pool of haplotypes coming into
contact 2,750 ya after an initial divergence from an ancestral Anatolian pool some 6,250 (150
gen) or 7,500 (200 gen) ya under a model implying germ-line mutation rates as above and no size
increment.
The distributions of simulated DHS values were compared with empirical values calculated for
each source/recipient pair of samples. Euboea and Corinth have been used as source samples,
Italians (pooled into six main geographic areas: West Sicily, East Sicily, Ionian Italy, South Italy,
Central Italy, and North Italy) have been used as recipient samples. The data were considered to
fit the model when observed DHS values fell within two standard deviations by the mean of the
simulated distribution.
RESULTS
Population relationships
The detailed panel of Y haplogroup frequencies are reported in Table S7 while the overall pattern
of inter-population genetic relationships is shown in Figure 2. Cretan, mainland Greek and
Lebanese samples were introduced to widen the spectrum of the historical players acting in south-
eastern Mediterranean at the time of the GC, as proxies of non-Korinthian Dorian colonizers of
South Sicily (sinceCretecontributed to the foundationofGelaand, in turn,Akragas) , non-
Euboean Ionian colonizers of South Italy and East Sicily, and Phoenician settlers in West Sicily,
respectively. Looking at the reciprocal positions on the plot, little evidence of these historical
events emerges, with the positioning reflecting geography rather than history. Accordingly, we

observe higher genetic distance than that expected based on archaeological evidence between
putative descendants of source (Greeks from Ionia, Korinth, and Crete) and recipient (Sicilians)
groups of the GC, as well as between the putative founders (Lebanese) of the Phoenician colonies
in western Sicily (Motya, Panormos, Solus) and the present-day population.
Signatures of the Hellenic contribution
To detect signatures of Greek migration into southern Italy and Sicily related specifically to the
Archaic period, we searched for pairs of Y chromosome STR haplotypes in population samples
from potential GC sources (Euboea and Korinth in Greece) and recipient geographic areas (East
and West Sicily; Ionic, Southern, Central and Northern Italy) whose molecular distance was
temporally compatible with the historical scenario. We then compared fractions of haplotype
pairs within the 8-12 mutational range, or “GChp”, with the same fractions obtained by using
Albanian, Croatian and Turkish samples as reference sources (Table 1a).
Samples from East Sicily, West Sicily and South Italy showed significant (P<0.01) enrichment
of GChps when the Greek sample from the Euboea Island was compared to Korinth and reference
sources. Except in West Sicily, this enrichment remained highly significant even after correcting
for multiple tests (P<0.05). Conversely, when considering Korinth against other reference
sources, none of the recipient samples showed a full set of significant values, whether or not
multiple test correction was used. The comparisons involving recipients versus Albania most
commonly showed a lack of significant enrichment in GChps with respect to Euboea and Korinth.
We reasoned that contacts either between sources and recipients or between sources after the GC,
i.e during the Classical and Christian periods, might have contributed to increase the GChps rate.
Thus, in order to provide more stringent conditions for haplotype identification, we excluded all
haplotypes with a molecular distance less than 7 mutational steps. This “filtered” dataset
confirmed the pattern observed with the less stringent criteria for the East Sicily/Euboea pair,
which showed significant enrichment in GChps in two out of three comparisons even after the
Bonferroni correction (Table 1b). The results for West Sicily and South Italy did not hold

statistical significance when a Bonferroni correction was applied. None of the other Italian
recipients showed a full set of significant enrichment with Euboea or Korinth.
Estimating Greek contribution
The number of GChps identified using the suggested molecular distance cannot be used either to
directly estimate the current Greek legacy in Italian populations, or to provide an indication of the
original demographic contribution. Nevertheless, this approach helped us to identify population
samples from East Sicily, and, to a lesser degree, West Sicily and South Italy, that are
characterized by a significant association with Greek populations derived during the time window
of interest.
To quantify the original demographic impact of the Greek settlers inferable from present-day Y
chromosome variability, we explored two main census scenarios using a simulation-based
approach. In the first scenario, High-count or HC, we based our model on the demographic
estimates of Beloch (Beloch 1886, Mc Evedy & Jones 1978), who suggested a census size of 1.35
Million people for Sicily and of 3 Million for Greece at the time of the Hellenic colonization in
the Archaic Period. In the second scenario, Low-Count or LC, we modelled population size
estimates that were smaller by an order of magnitude (Turchin & Scheidel 2009). Nevertheless,
the two scenarios have similar source/recipient effective size ratios (S/R). If we assume that the
proportions of past Sicilian, Euboean and Peloponnese census and male (and female) effective
population sizes, is one sixth of the current census size, we estimate a S/R of 3.65 for the HC
model and a S/R of 3.75 for the LC model. Simulation results are reported on Figure 3 and Table
S8. When considering Y-STR haplotypes, the observed DHS value between Euboea and East
Sicily (0.5353) is compatible with an effective number of migrants ranging between 500 and
5,000, clearly rejecting larger contributions (10,000), irrespective of the scenario considered. The
DHS value obtained for HVR-I haplotypes (0.5995) supports an effective number of migrants
between 500 and 1,000, with larger contributions clearly excluded. When the NRY- and mtDNA-
based estimates are paired according to the demographic model, the male-to-female migrant ratio

ranged between 1:1 and 2:1 under a population growth model and between 2:1 and 10:1 under a
constant population size model.
Lineage-based demographic estimates
Previous investigations (Di Gaetano et al. 2009, King et al. 2011) have suggested the Y
chromosome lineage E-V13 is a marker of the Hellenic contribution in the Mediterranean. In
order to test the validity of this approach we repeated the enrichment test described above by
considering only haplotypes belonging to the E-V13 lineage. Given the relatively low frequency
of this haplogroup in areas outside the Balkan peninsula, only the East Sicily sample provided a
size of NRY haplotypes (N=20) large enough to perform meaningful comparisons. All the 20 E-
V13 haplotypes in the sample from East Sicily had matches in the 8-12 mutational range when
compared with GC and reference sources (except for Turkey, only 14 haplotypes). Accordingly,
no enrichment in GChps was found except vs Turkey (Fisher's exact test, p<0.01). When
haplotype pairs with mismatches of 0-7 steps were removed (F dataset), both Croatian and Turkish
samples showed an increased relative number of GChps (respectively 9 and 7) with respect to the
other source samples (2 in Albanian and Korinth samples, 1 in the Euboean sample).
We further explored the impact of haplotypes belonging to specific lineages by calculating the
fraction of GChps belonging to the various SNP-defined lineages contributing to the overall
enrichment (Table S9). E-V13 is the major contributor for all the sources excluding Croatia,
where it still approached (21.7%) the frequency of the major one (R-S116*, 22.8%). The
contribution of E-V13 in Euboea and Korinth was much lower than in the three reference sources
(range 12.6-17.1% vs 17.5-22.8%). Similarly, we evaluated the contribution of E-V13 GChps in
the F dataset (Table S9). As such, E-V13 haplotypes are no longer the major fraction of GChps
and were under-represented in Korinth (3.4%) and Euboea (1.1%). Figure 4 clearly shows that
for these two candidate GC sources the largest quote of E-V13 haplotypes pairs did not fall in the
8-12 but in the 1-4 mutational steps interval. Moreover, it demonstrates that only haplotype pairs
within the Albania sample reached the highest peak within the 8-12 range.
DISCUSSION
Evidence of Hellenic genetic echoes in Italy
The history of the European continent has been characterised by a large number of migration and
admixture events (Hellenthal et al. 2014). Given this demographic ‘palimpsest’, the disentangling
process allowing for the identification and characterisation of signatures related to specific
historical events is expected to be challenging. In many cases only hints of such episodes are left
to be identified in the genetic profile of extant populations. The history of the peopling of the
Mediterranean is a clear example of this complexity, with movements across its shores starting
with the early colonisation of the European continent more than 40,000 years ago (Higham et al,
2011; Benazzi et al, 2011). In this scenario, the use of descriptive approaches aiming at
summarising the observed genetic variation can easily miss signatures related to a given event.
Aware of these limitations, we attempted to recover genetic signals related to the Greek
colonisation in southern Italy by analysing samples specifically collected to provide information
on the source and recipient populations that were involved in this historical event. None of the
Italian populations showed a closer affinity with Greek and Greek-related sources when Y
chromosome data was analysed using MDS analyses (Figure 2). There are many explanations for
this: limited historical migration between the two countries; lack of continuity between original
and present-day source populations with current samples not being a good proxy of the ancestral
populations they come from; and the signal of the ancestry could be confounded by more recent
or more ancient events. Nevertheless, when we used an approach designed to take into account
the mutational process we recovered a signature Greek Contribution to Sicily during the Archaic
Period. A first-level analysis based of the Bayesian posterior distribution of mutational steps
compatible with the former colonization phase (GChps) showed that the most evident signal was
in East Sicily, but this was also found to have parallels, or have diffused into neighbouring regions
of West Sicily and South Italy. A second-level analysis, performed under more stringent
conditions, again detected a signal in East Sicily. The lack of similar signals in other areas known
to have been colonised by Greek migrants (e.g. Ionic Italy) can be explained by inadequate source

samples (i.e. the Achaia region is not represented in our dataset), as well as by either a lower
demographic impact or subsequent population discontinuity. We note that many of the pairwise
comparisons were not significant due to high background signals from the Albanian sample, this
being particularly noticeable when the Korinth sample was involved. The easiest explanation for
this is the close genetic affinity observed among the two areas (see Figure 2) deriving from direct
and/or indirect gene-flow. For example, it is known that Greek colonies in present Albanian
territory, such as Apollonia and Epidamnos, were founded by Korinthians (Boardman 1980) and
that the area around Korinth was settled by southern Albanian orthodox Christians between the
13th and 16th century (as reported in Byzantine records, a more precise date is probably 1,404 to
1,405 AD called by the Despotate of Mystras to re-people the area near the Corinthian Isthmus),
the descendants of whom are identified as Arvanites (Hall 2000). During the sample collection,
attention was given to this issue: individuals who self-reported as Arvanite were excluded from
the analysis. Nevertheless, some Arvanite ancestry will have been unreported and may have
affected the results. A legacy of an ancient Greece-to-Albania gene flow is also supported by a
more conservative E-V13 haplogroup pattern in the Albanian sample.
Despite the multiple alternative explanations for historical gene flow, it is relevant to stress here
that a signature specifically related to the Euboea island in East Sicily was consistently found at
different levels of analysis, in line with the historical and archaeological evidences (Boardman
1980, Pugliese Carratelli 1996, Guzzo 2011), attesting an extended and numerically important
Greek presence in this region.
Sex-biased gene flow
The numerical dimensions of the migration from Greece that resulted in the establishment of
Hellenic colonies have been debated by scholars for centuries (see among others Asheri 1996,
Scheidel 2003, Hansen 2006, Malkin 2009, Yntema 2011). The estimation of the demographic
impact is hard to ascertain due to the complexity of the phenomenon, which took specific
connotations depending on the various settlements.

The signal from East Sicily points toward the lower end of the size spectrum proposed by
historical demographers, with values in the order of thousands when considering the male
effective component and few hundreds when considering the female effective component. From
this perspective, our results are then compatible with the hypothesis that the migration and
settlement process was driven by males. Interestingly this is one of the few cases of sex-biased
gene flow skewed towards an increased male instead of female contribution (Heyer et al, 2012).
It is obvious that such numbers refer to the colonists who arrived in East Sicily as inferred from
the descendants still living today. It is also worth stressing here that such estimates should not be
taken as absolute but considered as indicative of the scale of the contribution. A possible flaw in
these results could be also due to the sex-differential migratory rate after the first settlement. It is
known that patrilocality is a commonplace in continental Italy and Sicily. This may have
facilitated the diffusion of mtDNA variation at a larger scale than Y chromosome variation, thus
lowering the probability of finding local female genetic signatures of the GC (Heyer et al, 2012,
but see Marks et al, 2012).
Lineage-based estimations
The genetic contribution of a given source within a defined historical scenario has often been
estimated using the number of chromosomes assigned to given haplogroups assumed to have a
specific geographic/ethnic origin. In relation to the Greek colonization of the Mediterranean, the
lineage defined by the E-V13 marker has been used to estimate the Hellenic contribution to the
Sicilian gene pool (Di Gaetano et al. 2009). By assuming that all E-V13 chromosomes have a
Hellenic origin, authors estimated a contribution of approximately 37% to the population in Sicily.
The reconstruction of a STR-based network linking the Sicilian modal haplotype and its one-step
neighboring haplotypes provided a TMRCA of about 2,380 years before present, with a 95%
confidence ranging between 675 and 6,940 years ago. More recent contributions and differential
origins are expected to affect such estimates, but attempts to mitigate the impact of these
phenomena were not implemented.
In this study we highlighted that, when alternative sources were taken in consideration, E-V13
did not show any specificity as a marker of the Hellenic contribution. The signal that we found
using the full set of haplotypes within a limited range of mutational distance disappeared when
only E-V13 unbounded haplotypes are considered, becoming even significant for other non-Greek
sources when a filter for recent gene-flow was applied. The contribution of E-V13 from Korinth
and Euboea, in fact, reaches its peak well before the 8-12 mutational steps range (Figure 4), while
in this range and samples it showed minor relative frequency.
These findings suggest a poor association between the Y haplogroup E-V13 and the East-to-West
GC migratory waves. The effects of more recent gene-flow or sampling bias, may have masked
the original E-V13 signal from Greece. At any rate, our results caution against the use of specific
lineage-based approaches to test for hypothesized population contributions and underline the need
for a more targeted approach to explain the occurrence of given haplotypes within a population,
providing tests of alternative hypotheses, a wide spectrum of reference samples and mutation-
limited inference methodology.
Acknowledgements
This project was funded by the British Academy (BARDA-47870; CC). The authors would like
to acknowledge all the participants who offered their biological samples for analyses. We thank
Giacomo De Leo and Anna Flugy (Università di Palermo) and the staff of the Servizio di
Medicina Trasfusionale dell'Ospedale Muscatello di Augusta, AVIS Comunale di Santa Croce
camerina, UOC Medicina Trasfusionale, Ospedale di Lentini, Unita` Operativa Complessa di
Medicina Trasfusionale, Azienda Ospedaliera Umberto I, Siracusa for assistance in sample
collection. The Croatian collection was funded by grants from the Medical Research Council
(UK), European Commission Framework 6 project EUROSPAN (Contract No. LSHG-CT-2006-
018947) and Republic of Croatia Ministry of Science, Education and Sports research grants to
I.R. (108-1080315-0302).
Conflict of interest
The authors declare no conflict of interest.

References
1. Graham AJ: The Colonial Expansion of Greece; In Boardman J, Hammond NG (eds): The
Cambridge Ancient History. The Expansion of the Greek World, Eighth to Sixth Centuries.
Cambridge, 1982, pp 83-162.
2. Pugliese Carratelli G: An outline of the political history of the Greeks in the West. In Pugliese
Carratelli G (ed): The Western Greeks. Milano, 1996 pp 141-176.
3. Guzzo PG: Fondazioni greche. L’Italia meridionale e la Sicilia (VIII e VII sec. a.C.). Roma,
carrocci editore, 2011.
4. Boardman J: The Greeks overseas. London, Thames & Hudson, 1980.
5. Yntema D: Archaeology and the Origo Myths of the Greek Apoikiai. Ancient West & East 2011;
10:243-266.
6. Dunbabin TJ: The Western Greeks. Oxford, Thames & Hudson, 1948.
7. Faure P: La vie quotidienne des colons grecs. Paris, Hachette, 1978.
8. Scheidel W: The Greek Demographic Expansion: Models and Comparisons. Journal of Hellenic
Studies 2003; 123:120-140.
9. Piazza A, Cappello N, Olivetti E et al: A genetic history of Italy. Ann Hum Genet 1988; 52:203-
213.
10. Cavalli Sforza LL, Menozzi P, Piazza A: The History and Geography of Human Genes. Princeton,
Princeton University press, 1994.
11. Capelli C, Brisighelli F, Scarnicci F et al: Y chromosome genetic variation in the Italian
peninsula is clinal and supports an admixture model for the Mesolithic-Neolithic encounter. Mol
Phylogenet Evol 2007; 44:228-239.
12. Brisighelli F, Álvarez-Iglesias V, Fondevila M et al: Uniparental Markers of Contemporary Italian
Population Reveals Details on Its Pre-Roman Heritage. PLoS One 2012; 7(12): e50794.
13. Boattini A, Martinez-Cruz B, Sarno S et al: Uniparental markers in Italy reveal a sex-biased
genetic structure and different historical strata. PLoS One 2013; 29:e65441.

14. Di Gaetano C, Cerutti N, Crobu F et al: Differential Greek and northern African migrations to
Sicily are supported by genetic evidence from the Y chromosome. Eur J Hum Genet 2009; 17:91-
99.
15. King RJ, Di Cristofaro J, Kouvatsi A et al: The coming of the Greeks to Provence and Corsica:
Y-chromosome models of archaic Greek colonization of the western Mediterranean. BMC Evol
Biol 2011;11:69.
16. Edmonds CA, Lillie AS, Cavalli-Sforza LL (2004) Mutations arising in the wave front of an
expanding population. Proc Natl Acad Sci U S A 101: 975–979.
17. Klopfstein S, Currat M, Excoffier L (2006) The fate of mutations surfing on the wave of a range
expansion. Mol Biol Evol 23: 482–490.
18. Beloch KJ, Die Bevölkerung der griechisch-römischen Welt. Leipzig, Germany: Duncker, 1886.
19. McEvedy C, Jones R, Atlas of World Population History . Middlesex, England: Penguin, 1978.
20. Hansen MH, The Shotgun Method. The Demography of the Ancient Greek City-State Culture.
Columbia-Missouri, USA: University of Missouri Press, 2006.
21. Turchin P, Scheidel W: Coin Hoards Speak of Population Declines in Ancient Rome. PNAS 2009;
106:17276-17279.
22. Ferri G, Tofanelli S, Alù M et al: Y-STR variation in Albanian populations: implications on the
match probabilities and the genetic legacy of the minority claiming an Egyptian descent. Int J
Legal Med. 2010 Sep;124(5):363-70.
23. Rudan I, Marusić A, Janković S et al: "10001 Dalmatians:" Croatia launches its national biobank.
Croat Med J. 2009 Feb;50(1):4-6.
24. Richards M, Macaulay V, Hickey E et al: Tracing European founder lineages in the Near Eastern
mtDNA pool. Am J Hum Genet. 2000 Nov;67(5):1251-76.
25. Walsh B: Estimating the time to the MRCA for the Y chromosome or mtDNA for a pair of
individuals. Genetics 2001;158:897-912.
26. Busby GB, Brisighelli F, Sánchez-Diz P et al: The peopling of Europe and the cautionary tale of
Y chromosome lineage R-M269. Proc Biol Sci 2012; 279:884-892.

27. The Y Chromosome Consortium: A Nomenclature System for the Tree of Human Y-
Chromosomal Binary Haplogroups. Genome Res 2002; 12:339-348.
28. Slatkin M: A measure of population subdivision based on microsatellite allele frequencies.
Genetics 1995; 139:457-462.
29. Excoffier L, Lischer HEL: Arlequin suite ver 3.5: A new series of programs to perform population
genetics analyses under Linux and Windows. Molecular Ecology Resources 2010; 10: 564-567.
30. Kruskal J: Nonmetric multidimensional scaling: a numerical method. Psychometrika1964; 29:28-
42.
31. Martinez L, Underhill PA, Zhivotovsky LA, et al: Paleolithic Y-haplogroup heritage
predominates in a Cretan highland plateau. Eur J Hum Genet. 2007; 15:485-93.
32. King RJ, Ozcan SS, Carter T et al: Differential Y-chromosome Anatolian influences on the Greek
and Cretan Neolithic. Ann Hum Genet 2008; 72:205-214.
33. Zalloua PA, Xue Y, Khalife J et al: Y-chromosomal diversity in Lebanon is structured by recent
historical events. Am J Hum Genet 2008; 82:873-882.
34. Sturrock K, Rocha J: A Multidimensional Scaling Stress Evaluation Table. Field Methods 2000;
12:49-60.
35. Capelli C, Onofri V, Brisighelli F et al: Moors and Saracens in Europe: estimating the medieval
North African male legacy in southern Europe. Eur J Hum Genet 2009; 17:848-852.
36. Burgarella C, Navascués M: Mutation rate estimates for 110 Y-chromosome STRs combining
population and father-son pair data. Eur J Hum Genet 2011; 19:70-75.
37. Ballantyne KN, Goedbloed M, Fang R et al: Mutability of Y-Chromosomal Microsatellites:
Rates, Characteristics, Molecular Bases, and Forensic Implications. Am J Hum Genet 2010;
87:341-353.
38. Hammer MF: A recent common ancestry for human Y chromosomes. Nature 1995;
378(6555):376-378.

39. Helgason A, Hrafnkelsson B, Gulcher JR, Ward R, Stefa´nsson K. 2003. A populationwide
coalescent analysis of Icelandic matrilineal and patrilineal genealogies: evidence for a faster
evolutionary rate of mtDNA lineages than Y chromosomes. Am J Hum Genet 72:1370–1388.
40. Bonné-Tamir B, Korostishevsky M, Redd AJ, Pel-Or Y, Kaplan ME, Hammer MF. 2003.
Maternal and paternal lineages of the Samaritan isolate: mutation rates and time to most recent
common male ancestor. Ann Hum Genet 67:153–164.
41. Tofanelli S, Bertoncini S, Castrì L et al: On the origins and admixture of Malagasy: new evidence
from high-resolution analyses of paternal and maternal lineages. Mol Biol Evol 2009; 26(9):2109-
2124.
42. Bonferroni C E: Teoria statistica delle classi e calcolo delle probabilità. Pubblicazioni del R
Istituto Superiore di Scienze Economiche e Commerciali di Firenze 1936; 8:1-62.
43. Hellenthal G, Busby GB, Band G et al: A genetic atlas of human admixture history. Science 2014;
343(6172):747-751.
44. Higham T, Compton T, Stringer C et al: The earliest evidence for anatomically modern humans
in northwestern Europe. Nature 2011; 479(7374):521-524.
45. Benazzi S, Douka K, Fornai C et al: Early dispersal of modern humans in Europe and implications
for Neanderthal behaviour. Nature 2011; 479:525-528.
46. Hall JM: Ethnic Identity in Greek Antiquity. Cambridge, Cambridge University Press, 2000.
47. Asheri D: Colonizzazione e decolonizzazione. In S. Settis (ed): I Greci. Storia Cultura Arte
Società. I. Noi e i Greci. Torino, Einaudi, 1996, pp 63-115.
48. Malkin I: Foundations. In Raaflaub KA, van Wees H: A Companion to Archaic Greece. Oxford,
Wiley, 2009, pp 373-394.
49. Heyer E, Chaix R, Pavard S et al: Sex-specific demographic behaviours that shape human
genomic variation. Mol Ecol 2012; 21:597-612.
50. Marks SJ, Levy H, Martinez-Cadenas C et al: Migration distance rather than migration rate
explains genetic diversity in human patrilocal groups. Mol Ecol 2012; 21:4958-4969.