The role of Ribose-5-phosphate isomerase A in the regulation ...
Upload
khangminh22Category
view
3download
0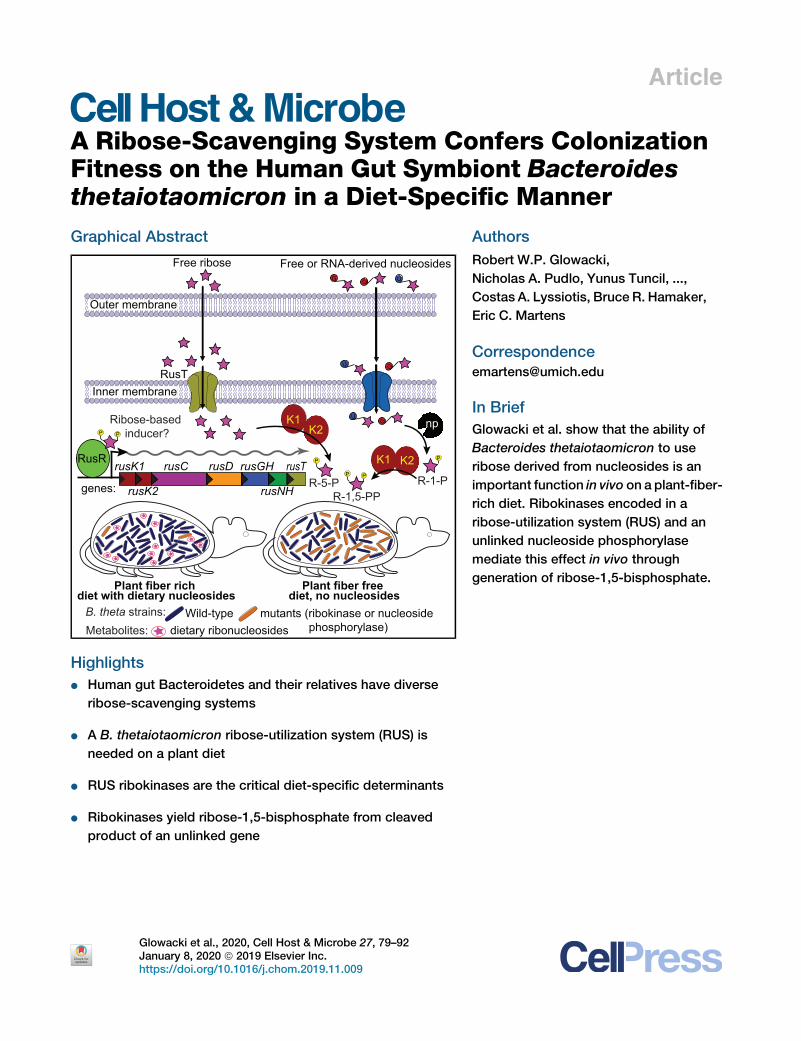
Article
A Ribose-Scavenging System Confers Colonization
Fitness on the Human Gut Symbiont Bacteroidesthetaiotaomicron in a Diet-Specific MannerGraphical Abstract
Plant fiber rich diet with dietary nucleosides
Plant fiber free diet, no nucleosides
Wild-type mutants (ribokinase or nucleoside phosphorylase)
B. theta strains:Metabolites: dietary ribonucleosides
RusT Inner membrane
G U
U G
G
Free ribose
Outer membrane
Free or RNA-derived nucleosides
rusC rusD
rusK2
rusK1 rusGH
rusNH
rusTRusR
G
P
U
genes:
K1K2 np
P
P P
R-5-P R-1-P
K1 K2
R-1,5-PP
P P
Ribose-based inducer?
Highlights
d Human gut Bacteroidetes and their relatives have diverse
ribose-scavenging systems
d A B. thetaiotaomicron ribose-utilization system (RUS) is
needed on a plant diet
d RUS ribokinases are the critical diet-specific determinants
d Ribokinases yield ribose-1,5-bisphosphate from cleaved
product of an unlinked gene
Glowacki et al., 2020, Cell Host & Microbe 27, 79–92January 8, 2020 ª 2019 Elsevier Inc.https://doi.org/10.1016/j.chom.2019.11.009
Authors
Robert W.P. Glowacki,
Nicholas A. Pudlo, Yunus Tuncil, ...,
Costas A. Lyssiotis, Bruce R. Hamaker,
Eric C. Martens
In Brief
Glowacki et al. show that the ability of
Bacteroides thetaiotaomicron to use
ribose derived from nucleosides is an
important function in vivo on a plant-fiber-
rich diet. Ribokinases encoded in a
ribose-utilization system (RUS) and an
unlinked nucleoside phosphorylase
mediate this effect in vivo through
generation of ribose-1,5-bisphosphate.
Cell Host & Microbe
Article
A Ribose-Scavenging System Confers ColonizationFitness on the Human Gut Symbiont Bacteroidesthetaiotaomicron in a Diet-Specific MannerRobert W.P. Glowacki,1 Nicholas A. Pudlo,1 Yunus Tuncil,2,4 Ana S. Luis,1,5 Peter Sajjakulnukit,3 Anton I. Terekhov,2
Costas A. Lyssiotis,3 Bruce R. Hamaker,2 and Eric C. Martens1,6,*1Department of Microbiology and Immunology, University of Michigan Medical School, Ann Arbor, MI 48109, USA2Department of Food Science and Whistler Center for Carbohydrate Research, Purdue University, West Lafayette, IN 47907, USA3Department of Molecular and Integrative Physiology, University of Michigan Medical School, Ann Arbor, MI 48109, USA4Present address: Department of Food Engineering, Ordu University, Ordu, Turkey5Present address: Department of Medical Biochemistry and Cell Biology, Institute of Biomedicine, University of Gothenburg, Gothenburg,
Sweden6Lead Contact
*Correspondence: [email protected]
https://doi.org/10.1016/j.chom.2019.11.009
SUMMARY
Efficient nutrient acquisition in the human gut isessential for microbial persistence. Although poly-saccharides have been well-studied nutrients forthe gut microbiome, other resources such as nucleicacids and nucleosides are less studied. We describeseveral ribose-utilization systems (RUSs) that arebroadly represented in Bacteroidetes and appear tohave diversified to access ribose from a variety ofsubstrates. One Bacteroides thetaiotaomicron RUSvariant is critical for competitive gut colonization ina diet-specific fashion. We used molecular geneticsto probe the required functions of the system andthe nature of the nutrient source(s) underlying thisphenotype. Two RUS-encoded ribokinases werethe only components required for this effect, pre-sumably because they generate ribose-phosphatederivatives from products of an unlinked but essen-tial nucleoside phosphorylase. Our results under-score the extensive mechanisms that gut symbiontshave evolved to access nutrients and the potential forunexpected dependencies among systems thatmediate colonization and persistence.
INTRODUCTION
Symbiotic microorganisms that inhabit the human intestine com-
plement digestive capacity in numerous ways, the most mecha-
nistically understood examples of which involve degradation of
diverse dietary polysaccharides (Porter and Martens, 2017). In
contrast, the digestive fates of nucleic acids (from diet, host, or
microbial origin) and their component ribo- and deoxyribonu-
cleosides are less understood, as are their contributions to
gut-microbiota community structure and physiology. Mutualistic
Lactobacillus (McLeod et al., 2011) and Bifidobacterium
Cell H
(Pokusaeva et al., 2010) and pathogenic and non-pathogenic
Escherichia coli (Fabich et al., 2008) and Salmonella enterica
(Harvey et al., 2011) have characterized ribose-degrading sys-
tems. Additional systems containing nucleoside-cleaving
enzymes have been defined in E. coli and fecal isolates of Cory-
nebacterium (Hammer-Jespersen et al., 1971; Kim et al., 2006).
In E. coli, DNA can serve as a sole carbon source through the ac-
tion of competence genes and exonucleases (Finkel and Kolter,
2001; Palchevskiy and Finkel, 2009). Mechanisms for assimi-
lating exogenous RNA have not been explored.
Members of the phylum Bacteroidetes constitute a major
portion of bacteria in the human gut; individual species devote
large portions of their genomes toward carbohydrate utilization
via coordinately regulated polysaccharide utilization loci
(PULs). A number of these PULs targeting dietary polysaccha-
rides from plant cell walls or fermented foods have been thor-
oughly characterized (Cuskin et al., 2015; Larsbrink et al.,
2014; Luis et al., 2018; Ndeh et al., 2017; Rogowski et al.,
2015). Other characterized PULs are involved in the degradation
of infrequent dietary substrates such as agarose and porphyran
in edible seaweed (Hehemann et al., 2012; Pluvinage et al., 2018)
or host-derived glycans such as those in mucus (Brili�ut _e et al.,
2019; Martens et al., 2008). Despite variations in the substrates
they target, the cellular systems encoded by Bacteroidetes
PULs are similarly patterned to the prototypic starch utilization
system (Sus)—each contains one or more TonB-dependent re-
ceptors (SusC homologs) and corresponding substrate-binding
lipoproteins (SusD homologs). These two proteins form a com-
plex (Glenwright et al., 2017) and work in concert with a variable
repertoire of carbohydrate-degrading enzymes, substrate-bind-
ing proteins, and regulators to bind, degrade, and import sub-
strates. Despite these studies, many identified PULs within
genomes of gut and environmental Bacteroidetes lack existing
knowledge of their target substrates (Terrapon et al., 2018), sug-
gesting that they have evolved to target a broader range of nutri-
ents beyond the common plant and host polysaccharides that
have been evaluated (Martens et al., 2011; McNulty et al., 2013).
Here, we describe a ribose-responsive PUL in the human
gut symbiont Bacteroides thetaiotaomicron (Bt). Variants of this
ost & Microbe 27, 79–92, January 8, 2020 ª 2019 Elsevier Inc. 79

28031
10
100
1000High fiber diets Low fiber diets
30 day-old weaned
adult mice
17 day-old suckling
adult mice (simple sugar)
A
Fold
cha
nge
rela
tive
to M
M+G
luco
se
C
0.1
1
10
100
1000
BT28
03
BT28
04
BT28
05
BT28
06
BT28
07
BT28
08
BT28
09
Fold
cha
nge
rela
tive
to M
M+G
luco
se
BT28
02B
BT2802 03 04 05 06 07 08 09
D2804BT: 2805 2806 2807 2808 2809
putative regulator
(rusR)
K1 K2
ribokinases(rusK1, rusK2)
outer membrane transport
(rusC, rusD)
unclassifiedglycoside hydrolase
(rusGH)
nucleoside hydrolase(rusNH)
Abso
rban
ce (6
00nm
)
Time (hr)
5 mg/ml ribose
0.0
0.5
1.0
1.5
0 24 48 72 96
wild-type∆BT2802-09
sugar transport,inner membrane
(rusT)
Figure 1. Bt Upregulates a PUL for Ribose Metabolism In Vivo and In Vitro in Response to Ribose
(A) In vivo Genechip data showing fold change in relation to in vitro growth MM, plus glucose for BT2803–2809 in mice fed high-fiber diets (dark- and light-green
bars for adult and 30-day-old weaned mice, respectively) and low-fiber diets (red and purple bars for adult and 17-day-old suckling mice, respectively).
(B) Organization of the rus locus with locus tag numbers, names, and predicted functions.
(C) In vitro transcriptional response of Bt rus genes in MM-ribose in comparison with MM-glucose reference (n = 3; error bars are SD of the mean).
(D) Growth in MM ribose (5 mg/mL) for wild-type Bt (black) or a strain lacking rus (red) (minimum of n = 5 separate replicates).
PUL exist in a diverse range of human gut and environmental
Bacteroidetes but on the basis of enzymatic diversity have
most likely evolved to target a variety of different ribose-contain-
ing nutrients. Using Bt as a model, we investigated the functions
of this PUL in vivo inmultiple diet conditions and in vitro in defined
media. We show that this PUL is essential for utilization of ribose
through the activity of two ribokinases, enzymes that catalyze
formation of ribose-5-phosphate from ribose or ribose-1,5-bi-
sphosphate from the product of a genomically unlinked nucleo-
side phosphorylase that is required for growth on nucleosides.
The ability to catabolize ribose through PUL-encoded functions
and the unlinked nucleoside phosphorylase confers a strong,
diet-specific competitive advantage to Bt in vivo. This suggests
amodel in which a diet-specific nucleoside-scavenging pathway
has become dependent on cellular ribokinases, which are critical
for creating phosphorylated ribose intermediates and are persis-
tently activated in the gut by an unknown signal. Our results
reveal that a variety of host-associated and terrestrial bacteria
have evolved mechanisms to scavenge ribose and nucleosides
that are important for colonization. The common regulation of a
family of highly diversified PULs by ribose, which occurs in nu-
80 Cell Host & Microbe 27, 79–92, January 8, 2020
cleic acids, co-factors, modifications (ADP- and poly-ADP-
ribose), bacteriocins, and bacterial capsules, suggests that
these systems have adapted at the level of encoded enzymes
to release ribose from varied sources, thus diversifying the
nutrient niches available to these bacteria. However, the results
of our in vivo studies highlight that underlying mechanisms for
observed colonization advantages are context specific and not
always directly attributable to the most obvious function per-
formed or predicted by a particular system.
RESULTS
A Ribose-Inducible Gene Cluster Is Highly Active In Vivo
and Required for Fitness in a Diet-Dependent FashionMembers of the human gut Bacteroidetes typically encode coor-
dinated degradative functions within discrete PULs, facilitating
identification of components that work together to access partic-
ular nutrients (Martens et al., 2009). Previous work using gnoto-
biotic mice colonized with only Bt identified one such locus
(BT2803–2809) for which all individual genes are upregulated
between 10- and 139-fold in mice fed high- or low-fiber diets
Fiber-Free Diet (FF) FF Diet with 1% nucleoside Water
Fiber-Free Diet (FF) FF Diet with 1% RNA Water
Fiber-Free Diet (FF)
B
D
A
C
Days
Fiber-Rich Diet (FR)
2 7 12 17 22 27 32 37 420.001
0.01
0.1
1
Rel
ativ
e Ab
unda
nce
Days
Rel
ativ
e Ab
unda
nce
2 7 12 17 22 27 32 37 420.001
0.01
0.1
1
wild-type∆rus
wild-type∆rus
0 2 7 12 17 22 27 32 37 420.001
0.01
0.1
1
Rel
ativ
e Ab
unda
nce
wild-type∆rus
0 2 7 12 17 22 27 32 37 420.001
0.01
0.1
1
Rel
ativ
e Ab
unda
nce
wild-type∆rus
E
0 2 7 12 17 22 27 32 37 420.001
0.01
0.1
1
Rel
ativ
e Ab
unda
nce
wild-type∆rus
1
10
100
1000
Fold
chan
gere
l ativ
et o
MM
+Glu
cose
FR Diet
FF Diet
FF Diet+ 1%
Ribose
FF Diet+ 1%
Nucleo
sides
FF Diet+ 1%
Yeast
RNA
Fiber-Free Diet (FF) FF Diet with 1% Ribose Water
F
*
***
***
****
**** ****
**
*
*
***
****
**** ********
****
**
*
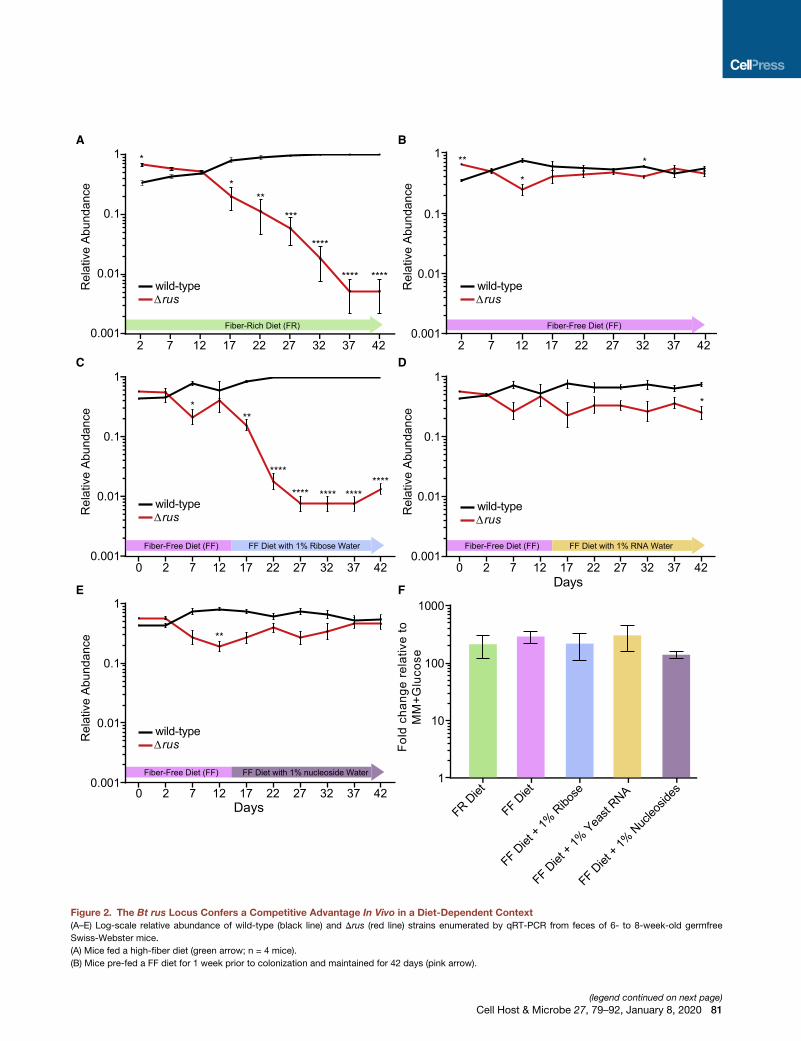
Figure 2. The Bt rus Locus Confers a Competitive Advantage In Vivo in a Diet-Dependent Context
(A–E) Log-scale relative abundance of wild-type (black line) and Drus (red line) strains enumerated by qRT-PCR from feces of 6- to 8-week-old germfree
Swiss-Webster mice.
(A) Mice fed a high-fiber diet (green arrow; n = 4 mice).
(B) Mice pre-fed a FF diet for 1 week prior to colonization and maintained for 42 days (pink arrow).
(legend continued on next page)
Cell Host & Microbe 27, 79–92, January 8, 2020 81
(Figure 1A). During low fiber, Bt’s physiology shifts to expression
of genes involved in host glycan foraging (Bjursell et al., 2006;
Martens et al., 2008; Sonnenburg et al., 2005). Thus, expression
of BT2803–2809 in the absence of dietary fiber suggested that it
could also target endogenous nutrients.
Typically, PULs involved in host glycan foraging encode
enzymes required for liberating sugars frommucins andother gly-
coconjugates (fucosidases, sulfatases, etc.), but the content of
the BT2803–2809 PULs was different in several ways (Figure 1B).
Three predicted enzymes (one nucleoside hydrolase and two ri-
bokinases) suggested a role in assimilating ribose from sub-
strate(s) such as nucleosides. A previous study determined
that Bt grows on ribose (Martens et al., 2011), but the genes
involved, relevant source(s) of ribose, and whether enzymatic
liberation is required from complex substrates were not explored.
The immediate upstream gene (BT2802) is predicted to have
DNA-binding motifs and could act as a regulator, but the gene
shares no homology to regulators previously associated with
PULs. In addition to the enzymes noted above, other PUL genes
encode homologs of the Bacteroides SusC and SusD outer-
membrane proteins (BT2805, BT2806), a glycoside hydrolase of
unassigned family and function (BT2807), a predicted nucleoside
hydrolase (BT2808), and a sugar permease (BT2809).
The enzymes encoded in this PUL suggested the hypothesis
that it is responsible for Bt’s ability to catabolize ribose and
possibly liberate it from more complex sources such as nucleo-
sides. To test whether this gene cluster is transcriptionally
responsive to growth on ribose, we performed in vitro growth
in minimal medium (MM) that contains ribose as the sole carbon
source and measured expression of BT2803–2809. All genes
were activated 142- to 240-fold during growth on ribose as
compared to growth on glucose (Figure 1C). Other mono- and di-
saccharides did not activate this PUL as sole carbon sources
(Figure S1A). We next examined the requirement for this locus
by deleting BT2802–2809. Loss of the PUL eliminated growth
on free ribose (Figure 1D) but did not affect growth on non-ribose
substrates (Table S1). On the basis of these findings, we classi-
fied this PUL as the Bt ribose-utilization system, rus, and listed
gene annotations in Figure 1B.
Because rus exhibits high transcriptional activity in the gnoto-
biotic mouse gut and is elevated in fiber-starved mice, we next
hypothesized that the ability to utilize endogenous sources of
ribose is advantageous in vivo during fiber-deficient diets. To
test this, we inoculated 6- to 8-week-old germfree (GF) female
Swiss-Webster mice with an equal mixture of wild-type and
Drus Bt strains and maintained mice on either a fiber-rich (FR)
diet containing several unprocessed plant-derived fiber polysac-
charides or an accessible fiber-free (FF) diet consisting mainly of
glucose, protein, lipids, and cellulose (Desai et al., 2016). With
qPCR, we measured the relative abundance of each strain for
42 days in DNA extracted from feces. In opposition to our
initial hypothesis, the Drus strain was strongly outcompeted
(C–E) Same diet and strain competition as in (B), but mice were given water conta
yeast tRNAs (D), or a 1%w/vmixture of nucleosides (0.25% each of uridine, cytidi
shaded blue, orange, or purple.
(F) rusC transcript levels measured by qRT-PCR from cecal contents of mice in (
In (A)–(F), the mean ± SEM is shown at each time point. In (A)–(E), asterisks indica
calculated by Student’s t test between strains at the same day.
82 Cell Host & Microbe 27, 79–92, January 8, 2020
(�100-fold) in mice fed the FR diet (Figure 2A). In contrast, in
mice fed the FF diet, Drus exhibited similar abundance to wild-
typeBt (Figure 2B). A similar competitive defect of theDrus strain
in mice fed the FR diet was observed in separate experiments
with 12-week-old female and 6- to 8-week-old male mice (Fig-
ures S1B and S1C), suggesting that the effect is not influenced
by sex or age within the range tested. The FR-diet-associated
defect was not a result of a lack of colonization or persistence
because the levels of each strain were similar over time in mice
colonized with either strain alone (Figures S1D and S1E). Addi-
tionally, the defect in the FR diet could not be attributed to the
wild-type strain exhibiting different expression of the rus PUL
because wild-type Bt exhibited similarly high levels of rus
expression in mice fed either diet when present alone or in
competition with the Drus mutant (Figure S1F).
Gas chromatography-mass spectrometry (GC-MS) analysis of
the diets revealed ribose present only in the FR diet, at levels
similar to those of other common monosaccharides, in an
acid-hydrolyzable (i.e., covalently linked) but not free form. This
suggested the presence of a ribose-containing molecule(s),
such as RNA, nucleosides, or cofactors (Figure S2A). In cecal
contents of FR-diet-fed mice mono-colonized with wild-type Bt
or Drus strains, ribose was not detectable above our limit of
detection (LOD) (Figure S2B). However, the LOD for ribose in
the cecal contents was near the amount observed in the uneaten
FR diet, raising the possibility that substantial amounts reach the
cecum but are obscured. This ambiguity about the amount of
diet-derived ribose in vivo prompted us to test whether different
sources of dietary ribose affect Bt in the gut. We colonized three
separate groups of GF mice with a mixture of wild-type and Drus
strains and maintained them on the FF diet. After 14 days of
stable competition between strains, water was supplemented
with 1% ribose, 1% RNA, or 1% pyrimidine nucleosides (purines
were not tested because of insolubility). The results clearly show
that free ribose in the water exerts an effect against the Drus
strain similar in magnitude to the defect in mice fed the FR diet
(Figure 2C). Little or no defect was observed in mice provided
water containing RNA or nucleosides (Figures 2D and 2E) even
though increased acid-hydrolyzable ribose was detectable in
the cecum (Figure S2C). There was comparable expression of
the rus locus in all conditions, suggesting that rus expression
differences did not account for different fitness outcomes
(Figure 2F).
A Subset of Ribose-Utilization Functions Is Required forCompetitive Colonization in MiceThe experiments described so far used a mutant lacking all eight
rus genes, but only a subset of the functions might be important
for competition. We therefore took amolecular genetic approach
to more precisely probe the required functions and get a clearer
idea of the nature of the important nutrient(s) in the FR diet. We
constructed single and double gene deletions on the basis of
ining 1% weight per volume (w/v) ribose (C), 1% w/v RNA from type IV Torula
ne, thymidine, and 5-methyl uridine) (E). The period of water supplementation is
A)–(E).
te significant differences (*p < 0.05, **p < 0.01, ***p < 0.001, and ****p < 0.0001)
Fiber-Rich Diet (FR)
A B
C D
Rel
ativ
eAb
unda
nce
0 2 7 12 17 22 27 32 37 420.001
0.01
0.1
1 ****
***
********
**** ******** ****
∆rusK1/K2wild-type
0 2 7 12 17 22 27 32 37 420.001
0.01
0.1
1
wild-type∆rusGH/NH
Rel
a tiv
eAb
unda
nce
Rel
ativ
eAb
unda
nce
0.001
0.01
0.1
1
0 2 7 12 17 22 27 32 37 42Days
wild-type∆rusK2
0.001
0.01
0.1
1
0 2 7 12 17 22 27 32 37 42Days
wild-type∆rusK1
Rel
ativ
eAb
unda
nce
Fiber-Rich Diet (FR)
Fiber-Rich Diet (FR)
Fiber-Rich Diet (FR)
****
****
******** **** **** **** ****
** *** **** *** ********
** ***** ** ** ** ********
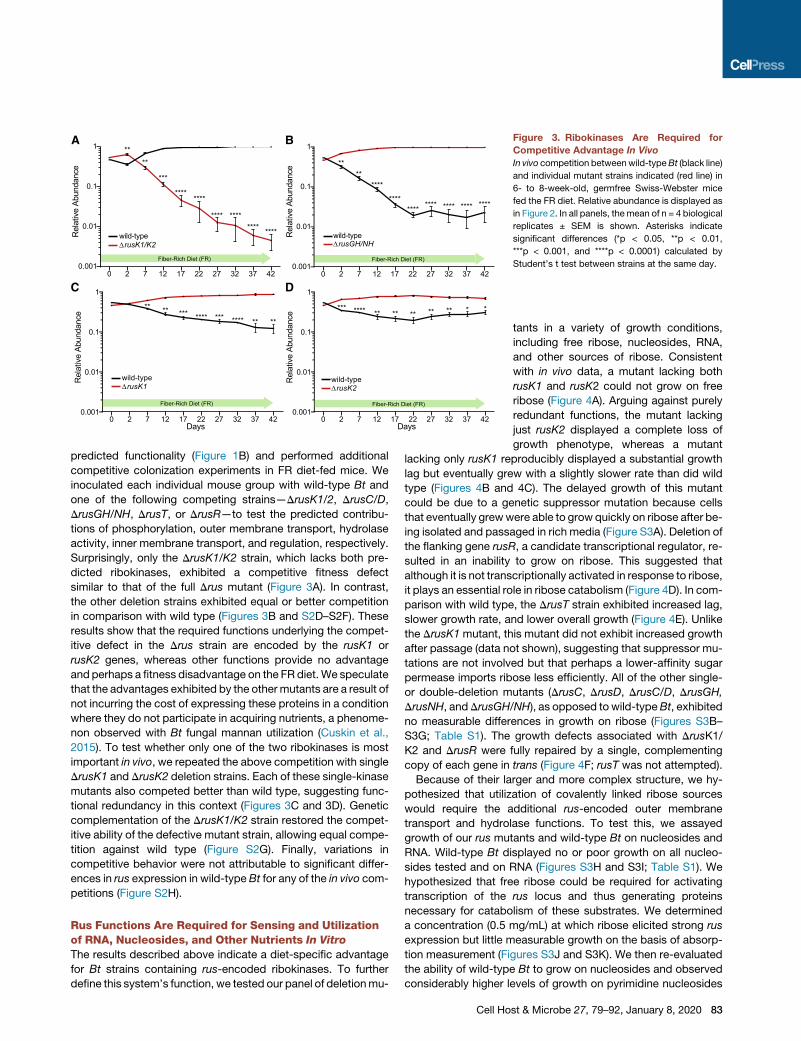
Figure 3. Ribokinases Are Required for
Competitive Advantage In Vivo
In vivo competition betweenwild-typeBt (black line)
and individual mutant strains indicated (red line) in
6- to 8-week-old, germfree Swiss-Webster mice
fed the FR diet. Relative abundance is displayed as
in Figure 2. In all panels, themean of n = 4 biological
replicates ± SEM is shown. Asterisks indicate
significant differences (*p < 0.05, **p < 0.01,
***p < 0.001, and ****p < 0.0001) calculated by
Student’s t test between strains at the same day.
predicted functionality (Figure 1B) and performed additional
competitive colonization experiments in FR diet-fed mice. We
inoculated each individual mouse group with wild-type Bt and
one of the following competing strains—DrusK1/2, DrusC/D,
DrusGH/NH, DrusT, or DrusR—to test the predicted contribu-
tions of phosphorylation, outer membrane transport, hydrolase
activity, inner membrane transport, and regulation, respectively.
Surprisingly, only the DrusK1/K2 strain, which lacks both pre-
dicted ribokinases, exhibited a competitive fitness defect
similar to that of the full Drus mutant (Figure 3A). In contrast,
the other deletion strains exhibited equal or better competition
in comparison with wild type (Figures 3B and S2D–S2F). These
results show that the required functions underlying the compet-
itive defect in the Drus strain are encoded by the rusK1 or
rusK2 genes, whereas other functions provide no advantage
and perhaps a fitness disadvantage on the FR diet. We speculate
that the advantages exhibited by the other mutants are a result of
not incurring the cost of expressing these proteins in a condition
where they do not participate in acquiring nutrients, a phenome-
non observed with Bt fungal mannan utilization (Cuskin et al.,
2015). To test whether only one of the two ribokinases is most
important in vivo, we repeated the above competition with single
DrusK1 and DrusK2 deletion strains. Each of these single-kinase
mutants also competed better than wild type, suggesting func-
tional redundancy in this context (Figures 3C and 3D). Genetic
complementation of the DrusK1/K2 strain restored the compet-
itive ability of the defective mutant strain, allowing equal compe-
tition against wild type (Figure S2G). Finally, variations in
competitive behavior were not attributable to significant differ-
ences in rus expression in wild-type Bt for any of the in vivo com-
petitions (Figure S2H).
Rus Functions Are Required for Sensing and Utilizationof RNA, Nucleosides, and Other Nutrients In Vitro
The results described above indicate a diet-specific advantage
for Bt strains containing rus-encoded ribokinases. To further
define this system’s function, we tested our panel of deletionmu-
Cell Ho
tants in a variety of growth conditions,
including free ribose, nucleosides, RNA,
and other sources of ribose. Consistent
with in vivo data, a mutant lacking both
rusK1 and rusK2 could not grow on free
ribose (Figure 4A). Arguing against purely
redundant functions, the mutant lacking
just rusK2 displayed a complete loss of
growth phenotype, whereas a mutant
lacking only rusK1 reproducibly displayed a substantial growth
lag but eventually grew with a slightly slower rate than did wild
type (Figures 4B and 4C). The delayed growth of this mutant
could be due to a genetic suppressor mutation because cells
that eventually grewwere able to grow quickly on ribose after be-
ing isolated and passaged in rich media (Figure S3A). Deletion of
the flanking gene rusR, a candidate transcriptional regulator, re-
sulted in an inability to grow on ribose. This suggested that
although it is not transcriptionally activated in response to ribose,
it plays an essential role in ribose catabolism (Figure 4D). In com-
parison with wild type, the DrusT strain exhibited increased lag,
slower growth rate, and lower overall growth (Figure 4E). Unlike
the DrusK1mutant, this mutant did not exhibit increased growth
after passage (data not shown), suggesting that suppressor mu-
tations are not involved but that perhaps a lower-affinity sugar
permease imports ribose less efficiently. All of the other single-
or double-deletion mutants (DrusC, DrusD, DrusC/D, DrusGH,
DrusNH, andDrusGH/NH), as opposed to wild-typeBt, exhibited
no measurable differences in growth on ribose (Figures S3B–
S3G; Table S1). The growth defects associated with DrusK1/
K2 and DrusR were fully repaired by a single, complementing
copy of each gene in trans (Figure 4F; rusT was not attempted).
Because of their larger and more complex structure, we hy-
pothesized that utilization of covalently linked ribose sources
would require the additional rus-encoded outer membrane
transport and hydrolase functions. To test this, we assayed
growth of our rus mutants and wild-type Bt on nucleosides and
RNA. Wild-type Bt displayed no or poor growth on all nucleo-
sides tested and on RNA (Figures S3H and S3I; Table S1). We
hypothesized that free ribose could be required for activating
transcription of the rus locus and thus generating proteins
necessary for catabolism of these substrates. We determined
a concentration (0.5 mg/mL) at which ribose elicited strong rus
expression but little measurable growth on the basis of absorp-
tion measurement (Figures S3J and S3K). We then re-evaluated
the ability of wild-type Bt to grow on nucleosides and observed
considerably higher levels of growth on pyrimidine nucleosides
st & Microbe 27, 79–92, January 8, 2020 83
0.0
0.5
1.0
1.5 ∆rusK1 (BT2803) ∆rusR (BT2802) ∆rusK2 (BT2804) ∆rusK1/2 (BT2803-04)
∆rusT (BT2809) ∆rus (BT2802-09)wild-type
wild type∆rusC
∆rusD ∆rusGH
∆rusNH∆rusGH/NH
Yeast RNA 5 mg/ml*
∆rusR∆rusK1
∆rusK2∆rusK1/K2
∆rusT∆rus
∆rusC/D
Glucose 5 mg/mlRibose 5 mg/ml
Uridine 5 mg/mlCytidine 5 mg/ml
5-methyl Uridine 5 mg/mlThymidine 5 mg/mlRibose 0.5 mg/ml
0.0
0.5
1.0
1.5
0.0
0.1
0.2
0.3
0.4
0.5
0 24 48 72 96Time (hr)
0 24 48 72 96Time (hr)
0 24 48 72 96Time (hr)
0 24 48 72 96Time (hr)
BA C D
GE F H
I J
Abso
rban
ce (6
00nm
)Ab
sorb
ance
(600
nm)
Abso
rban
ce (6
00nm
) Yeast RNA 5 mg/ml*
0.0
0.1
0.2
0.3
0.4
0.5
Figure 4A-E:
Figure 4I-J:* Exogenous IAP and RNase A added
Figure 4G-H:
0 24 48 72 96Time (hr)
0 24 48 72 96Time (hr)
0 24 48 72 96Time (hr)
0 24 48 72 96Time (hr)
0 24 48 72 96Time (hr)
0.0
0.5
1.0
1.5 Ribose 5 mg/ml∆rusR::BT2802∆rusK1/K2::BT2803-04wild-type∆rusR∆rusK1/K2
0 24 48 72 96Time (hr)
0 30 60 90 1200.1
1
10
100
1000
10000
Time (min)
Fold
chan
gere
lativ
et o
MM
+ Glu
c ose wild-type
∆rusR∆rusK1∆rusK2
∆rusK1/2∆rusT
K
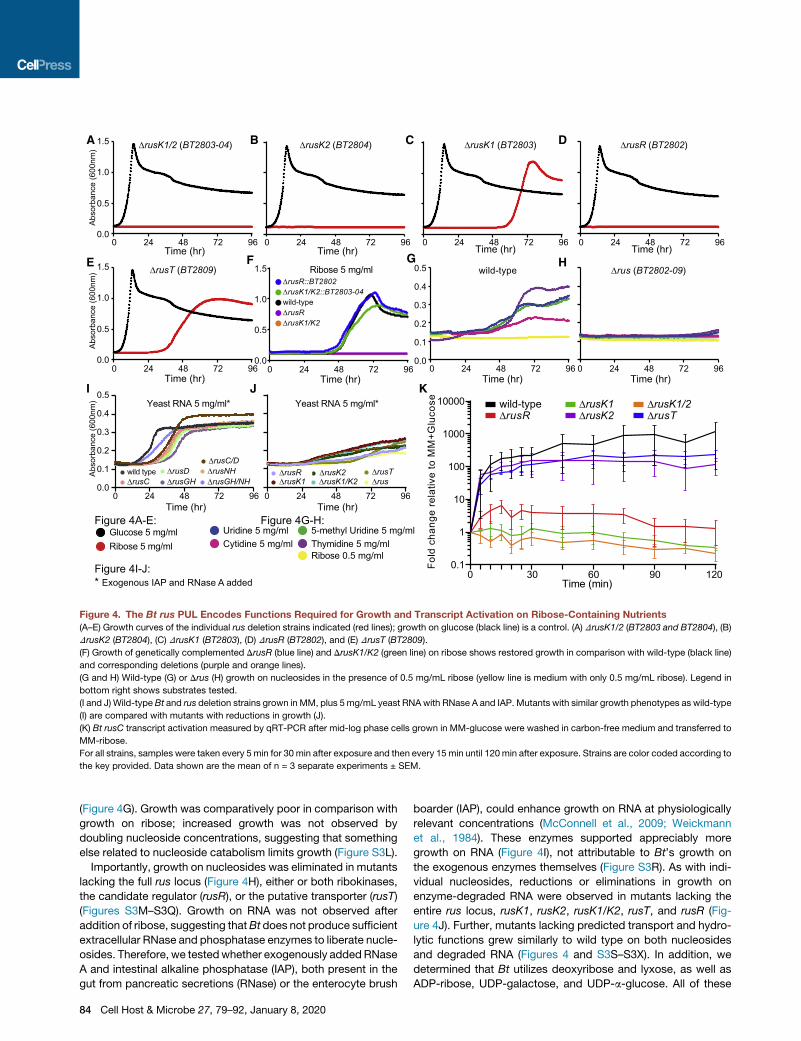
Figure 4. The Bt rus PUL Encodes Functions Required for Growth and Transcript Activation on Ribose-Containing Nutrients
(A–E) Growth curves of the individual rus deletion strains indicated (red lines); growth on glucose (black line) is a control. (A) DrusK1/2 (BT2803 and BT2804), (B)
DrusK2 (BT2804), (C) DrusK1 (BT2803), (D) DrusR (BT2802), and (E) DrusT (BT2809).
(F) Growth of genetically complemented DrusR (blue line) and DrusK1/K2 (green line) on ribose shows restored growth in comparison with wild-type (black line)
and corresponding deletions (purple and orange lines).
(G and H) Wild-type (G) or Drus (H) growth on nucleosides in the presence of 0.5 mg/mL ribose (yellow line is medium with only 0.5 mg/mL ribose). Legend in
bottom right shows substrates tested.
(I and J) Wild-type Bt and rus deletion strains grown in MM, plus 5mg/mL yeast RNAwith RNase A and IAP. Mutants with similar growth phenotypes as wild-type
(I) are compared with mutants with reductions in growth (J).
(K) Bt rusC transcript activation measured by qRT-PCR after mid-log phase cells grown in MM-glucose were washed in carbon-free medium and transferred to
MM-ribose.
For all strains, samples were taken every 5 min for 30 min after exposure and then every 15 min until 120min after exposure. Strains are color coded according to
the key provided. Data shown are the mean of n = 3 separate experiments ± SEM.
(Figure 4G). Growth was comparatively poor in comparison with
growth on ribose; increased growth was not observed by
doubling nucleoside concentrations, suggesting that something
else related to nucleoside catabolism limits growth (Figure S3L).
Importantly, growth on nucleosides was eliminated in mutants
lacking the full rus locus (Figure 4H), either or both ribokinases,
the candidate regulator (rusR), or the putative transporter (rusT)
(Figures S3M–S3Q). Growth on RNA was not observed after
addition of ribose, suggesting thatBt does not produce sufficient
extracellular RNase and phosphatase enzymes to liberate nucle-
osides. Therefore, we testedwhether exogenously addedRNase
A and intestinal alkaline phosphatase (IAP), both present in the
gut from pancreatic secretions (RNase) or the enterocyte brush
84 Cell Host & Microbe 27, 79–92, January 8, 2020
boarder (IAP), could enhance growth on RNA at physiologically
relevant concentrations (McConnell et al., 2009; Weickmann
et al., 1984). These enzymes supported appreciably more
growth on RNA (Figure 4I), not attributable to Bt’s growth on
the exogenous enzymes themselves (Figure S3R). As with indi-
vidual nucleosides, reductions or eliminations in growth on
enzyme-degraded RNA were observed in mutants lacking the
entire rus locus, rusK1, rusK2, rusK1/K2, rusT, and rusR (Fig-
ure 4J). Further, mutants lacking predicted transport and hydro-
lytic functions grew similarly to wild type on both nucleosides
and degraded RNA (Figures 4 and S3S–S3X). In addition, we
determined that Bt utilizes deoxyribose and lyxose, as well as
ADP-ribose, UDP-galactose, and UDP-a-glucose. All of these

required the presence of a low amount of ribose and the rus lo-
cus, whereas 21 other substrates did not support Bt growth un-
der any conditions tested (Table S1).
On the basis of our mutant growth phenotypes, we sought to
determine whether the genes required for ribose growth were
also required for activating expression of rus. We examined the
kinetics of rus transcriptional responses when Bt was exposed
to ribose, an assay that allows us to measure response indepen-
dent of ability to grow on ribose. Interestingly, the DrusK2 strain,
which cannot grow on ribose, generated transcript at a rate
similar to that of wild type up to 2 h (Figure 4K). In contrast, the
DrusK1 mutant, which exhibited an extensive lag before growth
on ribose, was unable to quickly generate transcript within 2 h
but eventually achieved near wild-type rus expression once it
actively grew on ribose because of its suspected suppressor
(Figures 4K and S4D). As expected, the DrusK1/K2 double
mutant did not generate transcript. The DrusR mutant achieved
partial (�10%) activation, supporting the hypothesis that RusR
is a positive-acting regulator. The DrusT strain only has a slight
defect, suggesting that another, non-specific permease can
transport ribose. We also measured rus expression dynamics
in our DrusC and DrusD strains but failed to detect any differ-
ences to wild type, consistent with the lack of their requirement
for ribose growth (Figure S4E). Finally, the nucleosides uridine
and inosine did not serve as rus-inducing molecules in wild-
type Bt (Figure S4F).
Non Rus-Encoded Functions Are Required forNucleoside UtilizationThe lack of a requirement for the rus hydrolase functions in
nucleoside catabolism is noteworthy, given that we confirmed
through biochemical experiments with recombinant enzyme
that RusNH is a genuine, albeit weak, nucleoside hydrolase
(Table S2A) and that RusGH can cleave p-nitrophenyl-b-D-ribo-
side (Tables S2B and S2C). The lack of a phenotype associated
with loss of RusNH suggested that other functions in Bt are
responsible for cleavage of free pyrimidine nucleosides or
those liberated from RNA. To identify alternative enzymes, we
searched the Bt genome for functions from known nucleoside
scavenging systems (NSSs) and identified several candidates.
We made deletions of four genes predicted to encode nucleo-
side phosphorylase (BT1881 and BT4554), uridine kinase
(BT0184), and nucleoside permease (BT4330) activities and
tested growth of these mutants on pyrimidine nucleosides (Fig-
ures 5A–5C and S4A). One strain (DBT4554) displayed loss of
growth on all nucleosides tested, suggesting that it encodes
an essential enzyme for cleaving nucleosides and might work
upstream of the rus functions, which are also required. The
DBT4330 mutant exhibited reductions in growth on uridine,
cytidine, and 5-methyl uridine (Figures 5A–5C) and only a slight
defect on thymidine (Figure S4A). The DBT0184 mutant dis-
played enhanced growth that began quicker than wild-type
growth and reached a higher total growth level on all nucleo-
sides, except on thymidine. This phenotype could be due to
its role in 50-phosphorylating scavenged nucleosides and
shunting them toward anabolic pathways, such that its loss fa-
vors catabolism. Like the wild type, DBT1881 did not display
any detectable growth defects, suggesting that the product of
this gene is not essential for pyrimidine catabolism.
To understand how these NSS functions could affect gut colo-
nization, we tested the DBT4554 mutant in our in vivo competi-
tion assay. In mice fed the FR diet, this mutant exhibited a similar
2–3 order of magnitude defect that closely resembled those of
the Drus and DrusK1/K2 mutant strains (Figure 5D). This finding
helps connect the role of rus functions, which in all of the condi-
tions assayed were ubiquitously expressed in vivo, and the FR-
diet-specific fitness advantage experienced by wild-type Bt
in vivo. We cannot definitively determine that nucleosides are
the in-vivo-scavenged nutrients that drive this competitive
advantage. However, (1) similarity of the Drus, DrusK1/K2, and
DBT4554 phenotypes and (2) the dependence on both a small
amount of ribose (i.e., to induce rus) and a functional rus system
for in vitro growth on nucleosides via BT4554 support a model in
which ribose-induced Rus kinases are essential for the in vivo
scavenging of nucleosides processed by BT4554. Although
growth on nucleosides in some NSS mutants was reduced or
eliminated, this phenotype did not extend to growth on RNA or
ribose because the mutant strains exhibited levels of growth
similar to those of the wild type (Figures S4B and S4C). This sug-
gests that, although Rus functions are required for the utilization
of RNA, the NSS functions interrogated here are not individually
essential for catabolism of RNA-derived nucleosides or oligos.
Rus Kinases Are Active toward Ribose- and Nucleoside-Derived Ribose-1-PhosphateTo scrutinize the activities of the rus-encoded kinases in detail,
we produced recombinant forms and performed in vitro phos-
phorylation assays against pentose sugars and other monosac-
charides (E. coli RbsK was a positive control). RusK2 has a
preferred specificity toward ribose and deoxyribose while ex-
hibiting weaker activity on arabinose and xylose (Table S2D).
RusK1 displayed nearly 10-fold weaker activity on ribose and
deoxyribose than did RusK2 and weak activity toward other
sugars tested (Table S2D). The initial assay used to measure
activity from RusK1 and RusK2 did not determine positional
phosphorylation specificity. We hypothesized that an important
difference in these kinases might be their positional phosphor-
ylation at either the 1 or 5 carbon of ribose. When RusK1 and
RusK2 enzymes were incubated with ribose and analyzed by
LC-MS/MS, both generated ribose-5-phosphate (R5P) as the
major detectable product (Figure 5E). We did not detect forma-
tion of ribose-1-phosphate (R1P) from ribose despite being
able to reliably distinguish this compound as a standard (Table
S2E). We next performed reactions with R1P as the substrate
to test whether this product, which we expect to be generated
by BT4554 phosphorolysis of nucleosides, could be a substrate
for the Rus kinases. Interestingly, our results show that ribose-
1,5-bisphosphate (PRibP) is generated from R1P by both
RusK1 and RusK2 (Figure 5F). In addition, RusK2 could
generate a product with the same predicted mass as PRibP
when given R5P as a substrate, even though RusK2 did not
form R1P from ribose (Figure 5F). The mechanism involved in
generating PRibP, or ribokinases capable of phosphorylation
in the 1 position, has not yet been identified in eubacteria.
Rather, generation of PRibP by a different family of kinases
has been described in archaea and plants as part of the
RuBISCO pathway (Hove-Jensen et al., 2018). Our results
help connect the function of Rus-encoded kinases with
Cell Host & Microbe 27, 79–92, January 8, 2020 85
A B C
F
Cytidine (5mg/ml)
0 24 48 72 96Time (hr)
wild-type∆BT0184 ∆BT1881∆BT4330 ∆BT4554
5-methyl Uridine (5mg/ml)
0 24 48 72 96Time (hr)
wild-type∆BT0184 ∆BT1881∆BT4330 ∆BT4554
D E
0 24 48 72 960.0
0.1
0.2
0.3
0.4
0.5 Uridine (5mg/ml)
Time (hr)
wild-type∆BT0184 ∆BT1881∆BT4330 ∆BT4554
Abso
rban
ce (6
00nm
)
0 2 7 12 17 22 27 32 37 420.001
0.01
0.1
1
Rel
ativ
e Ab
unda
nce
wild-type∆BT4554
Fiber-Rich Diet (FR)
Days
**
*
*****
**** ****
1
0.01
0.1
10
100
Fold
chan
gere
lativ
eto
MM
+Glu
cose
BT0787
BT1196
BT1449
BT1762
BT2157
BT2569
BT3024
BT3345
BT4689
BT0786
BT0788
BT1323
BT1448
BT1450
BT1564
BT1757
BT1758
BT1759
BT1760
BT1761
BT1763
BT1765
BT2156
BT2158
BT2159
BT2442
BT2756
BT3025
BT3026
BT3027
BT3344
BT3346
BT3347
BT4686
BT4688
BT4690
BT4744
ECF-
fact
or
star
ch-d
ebra
nchi
ngen
zym
e
Suga
r-pho
spha
teis
omer
ase
Pyru
vate
ca
rbox
ylas
e
Prop
iony
l-CoA
carb
oxyl
ase
Succ
inyl
-CoA
synt
heta
se
-sub
unit
Fruc
toki
nase
Mon
osac
cahr
ide
trans
porte
rG
H32
GH
32O
uter
mem
bran
ebi
ndin
g pr
otei
nSu
sD-li
ke
SusC
-like
GH
32
Inne
r mem
bran
eph
osph
ate
trans
porte
r
Om
pA-li
ke
C4-
dica
rbox
ylat
etra
nspo
rter
SusD
-like
SusC
-like
SusD
-like
SusC
-like
Hyp
othe
tical
pro
tein
Gly
cosi
de h
ydro
lase
Hyp
othe
tical
pro
tein
Hyp
othe
tical
pro
tein
Mec
hano
sens
itive
ion
chan
nel
Hyp
othe
tical
pro
tein
star
ch-d
ebra
nchi
ngen
zym
eIn
osito
l pho
spha
tase
Succ
inyl
-CoA
synt
heta
se
-sub
unit
Acet
yl-C
oAca
rbox
ylas
e s
ubun
it
Acet
yl-C
oAca
rbox
ylas
e su
buni
t
Hyp
othe
tical
pro
tein
Hyp
othe
tical
pro
tein
Gfo
/Idh/
Moc
A fa
mily
oxid
ored
ucta
seG
fo/Id
h/M
ocA
fam
ilyox
idor
educ
tase
Qui
nosi
ne b
iosy
nthe
sis
gen
e qu
eF
Enzyme and starting substrateRus
K1 + R
ib
RusK2 +
Rib
RusK1 +
R1P
RusK2 +
R1P
RusK1 +
R5P
RusK2 +
R5P
Generation of PRibP
Area
(Ion
Cou
nts)
103
104
105
106
107
108
Enzyme and starting substrate
Generation of Ribose 5P
103
104
105
106
107
108
Area
(Ion
Cou
nts )
RusK1 +
Rib
RusK2 +
Rib
G
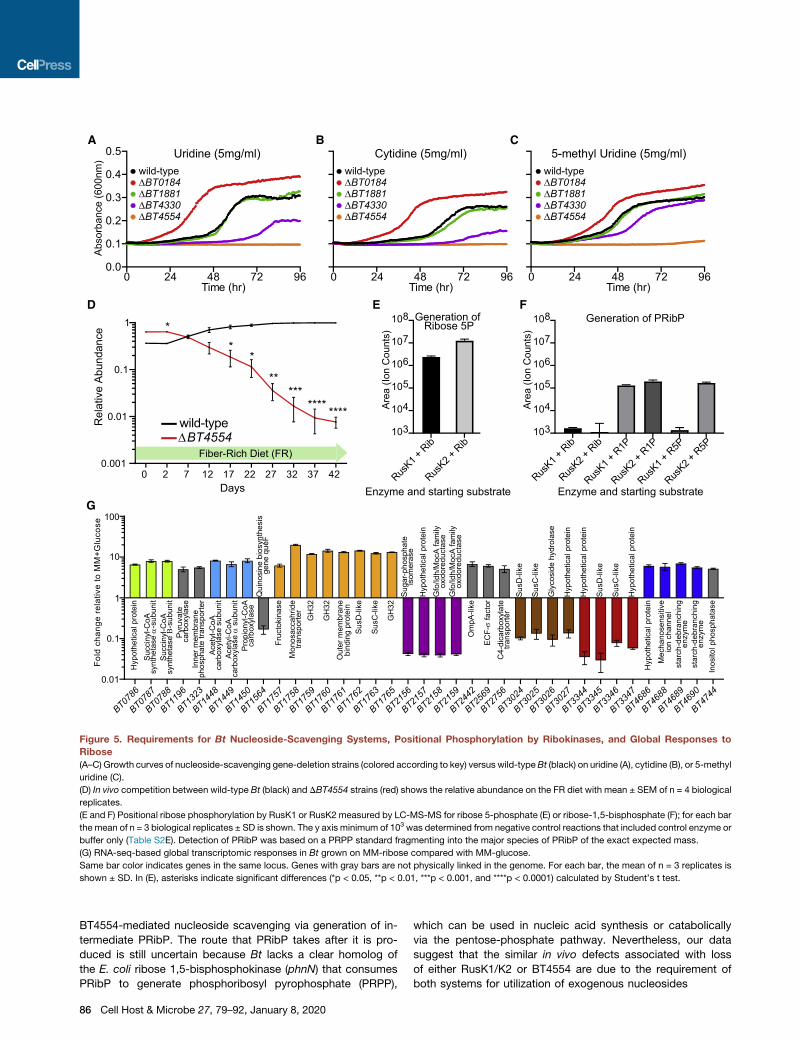
Figure 5. Requirements for Bt Nucleoside-Scavenging Systems, Positional Phosphorylation by Ribokinases, and Global Responses to
Ribose
(A–C) Growth curves of nucleoside-scavenging gene-deletion strains (colored according to key) versus wild-typeBt (black) on uridine (A), cytidine (B), or 5-methyl
uridine (C).
(D) In vivo competition between wild-type Bt (black) and DBT4554 strains (red) shows the relative abundance on the FR diet with mean ± SEM of n = 4 biological
replicates.
(E and F) Positional ribose phosphorylation by RusK1 or RusK2 measured by LC-MS-MS for ribose 5-phosphate (E) or ribose-1,5-bisphosphate (F); for each bar
the mean of n = 3 biological replicates ± SD is shown. The y axis minimum of 103 was determined from negative control reactions that included control enzyme or
buffer only (Table S2E). Detection of PRibP was based on a PRPP standard fragmenting into the major species of PRibP of the exact expected mass.
(G) RNA-seq-based global transcriptomic responses in Bt grown on MM-ribose compared with MM-glucose.
Same bar color indicates genes in the same locus. Genes with gray bars are not physically linked in the genome. For each bar, the mean of n = 3 replicates is
shown ± SD. In (E), asterisks indicate significant differences (*p < 0.05, **p < 0.01, ***p < 0.001, and ****p < 0.0001) calculated by Student’s t test.
BT4554-mediated nucleoside scavenging via generation of in-
termediate PRibP. The route that PRibP takes after it is pro-
duced is still uncertain because Bt lacks a clear homolog of
the E. coli ribose 1,5-bisphosphokinase (phnN) that consumes
PRibP to generate phosphoribosyl pyrophosphate (PRPP),
86 Cell Host & Microbe 27, 79–92, January 8, 2020
which can be used in nucleic acid synthesis or catabolically
via the pentose-phosphate pathway. Nevertheless, our data
suggest that the similar in vivo defects associated with loss
of either RusK1/K2 or BT4554 are due to the requirement of
both systems for utilization of exogenous nucleosides

Global Responses to Ribose CatabolismWe hypothesized that growth on ribose could affect expression
of a global regulon. To test this, we performed RNA-sequencing
(RNA-seq)-based whole-genome transcriptional profiling on
wild-type Bt grown on ribose or glucose. Indeed, the data re-
vealed a global response in which 81 genes were differentially
expressed on the basis of the parameters and thresholds
used. Many of the genes (46%) belong to other PULs or meta-
bolic pathways (Table S3). Notable changes included upregula-
tion of a previously defined PUL for fructose and b2,6-linked
fructan metabolism (BT1757–1765; average 15-fold upregula-
tion), which interestingly liberates fructose that initiates the
pentose phosphate pathway (PPP) (Sonnenburg et al., 2010)
and suppresses rus expression (Figure S1A). At the same time,
two other PULs of unknown specificity (BT3024–3027 and
BT3344–3347) were repressed. Further, several genes encoding
tricarboxylic acid (TCA) cycle enzymes leading to generation of
succinate and propionate, of which Bt has a partial pathway
(Pan and Imlay, 2001), were upregulated. In contrast, genes pre-
dicted to participate in sugar-phosphate isomerization and
metabolism were strongly repressed (BT2156–2159; average
of 24-fold) (Figure 5G). An experiment to test whether cross-
regulation between ribose metabolism and the fructan PUL
contributes to the FR-diet-specific competitive defect failed to
support this model (Figures S4G and S4H).
An Enzyme-Diversified Family of Rus Systems Existsthroughout the BacteroidetesThe data described above support the idea that the Bt rus PUL is
necessary, but not always sufficient, for metabolizing ribose and
nucleosides. Because it is strongly activated in response to the
simple sugar ribose and not an oligosaccharide cue, rus is rela-
tively unique and only the second PUL after the Bt fructan PUL
shown to be activated in response to a monosaccharide (Son-
nenburg et al., 2010). The architecture of this system suggests
that it is equipped to liberate ribose from additional unknown
sources via its hydrolases. Therefore, we hypothesized that
rus-like systems could be found in other gut isolates and perhaps
more broadly across the Bacteroidetes. To test this, we
measured the growth ability of 354 different human and animal
gut Bacteroidetes in MM-ribose, revealing that ribose utilization
is widely but variably present in different species (Figures 6A and
S5A; Table S4). To determine whether sequenced representa-
tives of the species and strains that grow on ribose contain a
homolog of the experimentally validated Bt rus, we used
comparative genomics to search for homologs of this PUL within
these gut isolates. This revealed that all of the sequenced strains
that grow on ribose possess a candidate rus-like PUL, whereas
none of the strains unable to grow on ribose have a homologous
gene cluster. Interestingly, our analysis revealed very similar
homologs of some rus genes in sequenced gut isolates (e.g.,
Prevotella) beyond those present in our initial survey. When we
expanded the search to include Bacteroidetes isolates found in
other body sites and in the environment, we detected rus-like
systems across the phylum and found that systems in the genus
Bacteroidesweremost similar to the prototype fromBt. Remark-
ably, we identified a total of 70 different rus configurations,
ranging from simple two-gene units (permease and kinase)
to rus PULs containing as many as 36 genes (Figures 6B
and S5B). For almost all rus-like systems, the following genes
were present: rusC and rusD, an upstream rusR (or to a lesser
extent different regulator types), either one or two rusK genes,
and a rusT homolog. Perhapsmost intriguingly, the predicted en-
zymes found in different rus-like systems are exceptionally vari-
able; there are at least 22 different predicted glycoside hydrolase
families, ADP-ribosylglycohydrolases, carbohydrate esterases,
and nucleoside hydrolases, among others. This plethora of enzy-
matic potential encoded in rus homologs across the Bacteroi-
detes suggests that individual species or strains target
different ribose-containing nutrients. To further connect these
predicted rus-like systems with ribose utilization, we probed
the transcriptional response of eight different systems
during growth on MM-ribose and found that all strains tested
exhibited �100- to 1,000-fold upregulation in relation to an
MM-glucose reference (Figure 6C).
DISCUSSION
Diet affects the gut microbiota in many ways, and members of
the prominent Bacteroidetes phylum have developed sophisti-
cated strategies to liberate sugars from very complex dietary fi-
ber polysaccharides, such as pectins (Luis et al., 2018; Ndeh
et al., 2017). Such abilities equip these bacteria to compete for
dietary and endogenous nutrients to sustain their populations.
Diet-, microbiome-, and host-derived RNA, nucleosides, cofac-
tors, and other sources of ribose have been largely unexplored
as potential nutrients scavenged by members of the gut micro-
biota. Our findings demonstrate that Bt utilizes free and cova-
lently linked sources of ribose and that this metabolic capability
contributes to competitive fitness in vivo in a diet-dependent
fashion—most likely through a more complicated metabolic
mechanism that interconnects ribose sensing and nucleoside
scavenging (Figure 7). It is also clear from comparative genomics
that the ability to access ribose from diverse sources extends
across the Bacteroidetes phylum and is present in many animal
gut, oral, and environmental isolates.
Although we have not yet uncovered a more complex ribose-
containing polymer requiring Rus transport and hydrolase
functions, a key aspect of our ribose-utilization model is that
Rus-encoded kinases are required for growth on free and
RNA-derived nucleosides, the latter only after RNase and IAP
degradation (Figure 7). In light of this pathway for nucleoside
assimilation, the roles of periplasmic RusNH and cell-surface
RusGH remain enigmatic. Given the weak activities of these en-
zymes toward the substrates tested, it is probable that they are
optimized to cleave substrates that we have not yet been able to
test and that are the bona fide nutrient targets of the Bt Rus sys-
tem. At least for the pyrimidine nucleosides tested in vitro, the
BT4554 phosphorylase, which generates a cleaved base plus
R1P, is the primary component required. A novel aspect of the
model we have determined for Bt is that Rus-encoded riboki-
nases are required for conversion of R1P to PRibP, and this con-
version requires ribose induction of Rus to activate production of
the ribokinases. This interconnection could stem from the dual
function of the ribokinases, phosphorylating both ribose to R5P
and R1P to PRibP. On the basis of our growth and positional
phosphorylation data, it is unlikely that R5P is being shunted
directly into catabolism as canonically represented in KEGG
Cell Host & Microbe 27, 79–92, January 8, 2020 87
A
B
C
B. xylanisolvens
B. o
vatu
s
B. fin
egold
ii
B. cacca
eB. thetaiotaomicron
B. salyersiae
B. nordii
B. fragilis
B. intestinalis
B. cellulosilyticusB. oleiciplenus
B. uniformis
B. fluxus B.
egg
erth
iiB.
ste
rcor
is
B. clarus
B. pleb
eius
B. massi
liensis
B. vulgatus
B. dorei
D. gadei
D. mossii
O. splanchnicusB. intestinihominis
P. distasonisP. merdae
P. johnsonii
P. gordonii
P. goldsteinii
P. c
opri
58 1
No. of strains tested:
29 14
58 129 14
No. of ribose degrading strains:
B.c
acca
eA
TCC
4318
5
B.o
l eic
iple
n us
DSM
2253
5
B.i
n tes
t inal
isD
SM17
3 93
B.o
vatu
sA
TCC
8483
B.o
vatu
s3_
8_47
FAA
B.c
ellu
losi
lytic
usD
SM14
838
B.x
ylan
isol
vens
2_1_
22
1
10
100
1000
10000
Fold
cha
nge
rela
tive
to M
M+G
luco
se rusC-like transcriptional response of Bacteroidetes strains grown on MM+Ribose
B. t
heta
iota
omic
ron
dnLK
V9
DNAH PBS DPP7
Alistipes senegalensis (1) Type 24GH49 Pectin Lyase Sulfatase
GH38
Alistipes finegoldii (1) Type 33 LacI
Alistipes obesi (1) Type 29GH49
GTP. distasonis (9) Type 14
B. uniformis (2) Type 13
GH*GH** B. oleiciplenus (1) Type 12
GH 43 GH** B. intestinalis (1) / B. stercorirosoris (2) Type 11
GH* GH 35 GH 2B. cellulosilyticus (2) Type 10
B. dorei (2) Type 9
ADP-RGH EsteraseLacI * B. xylanisolvens (12)* B. ovatus (14) Type 8
GH 43 DHDPS MFS GH 43* B. xylanisolvens (4) Type 7
GH*B. xylanisolvens (1) Type 6
GH*B. xylanisolvens (2) Type 5
GH 97* B. caccae (3) Type 4
GH* BACONB. ovatus (2) Type 3
GH 16 * B. thetaiotaomicron dnLKV9 (1) Type 2
rus C rus D rusGHrusK2rusK1 rusNHrusR rusT* B. thetaiotaomicron (16) Type 1
TAT ROK N-acyl-Epimerase SIAE GH*
GH98Dysgonomonas mossii DSM 22836 (1) Type 37
rusR-like Glycoside hydrolase BACON ADP-RGH DPP7 TATRibokinase Nucleoside hydrolase DHDPS Esterase ROK
Glycosyl transferase
rusC-like Permease/transporter MFS transporter DNAH Lyase N-acyl-epimerase
rusD-like Hypothetical Protein SulfataseLacI-type regulator
SIAE
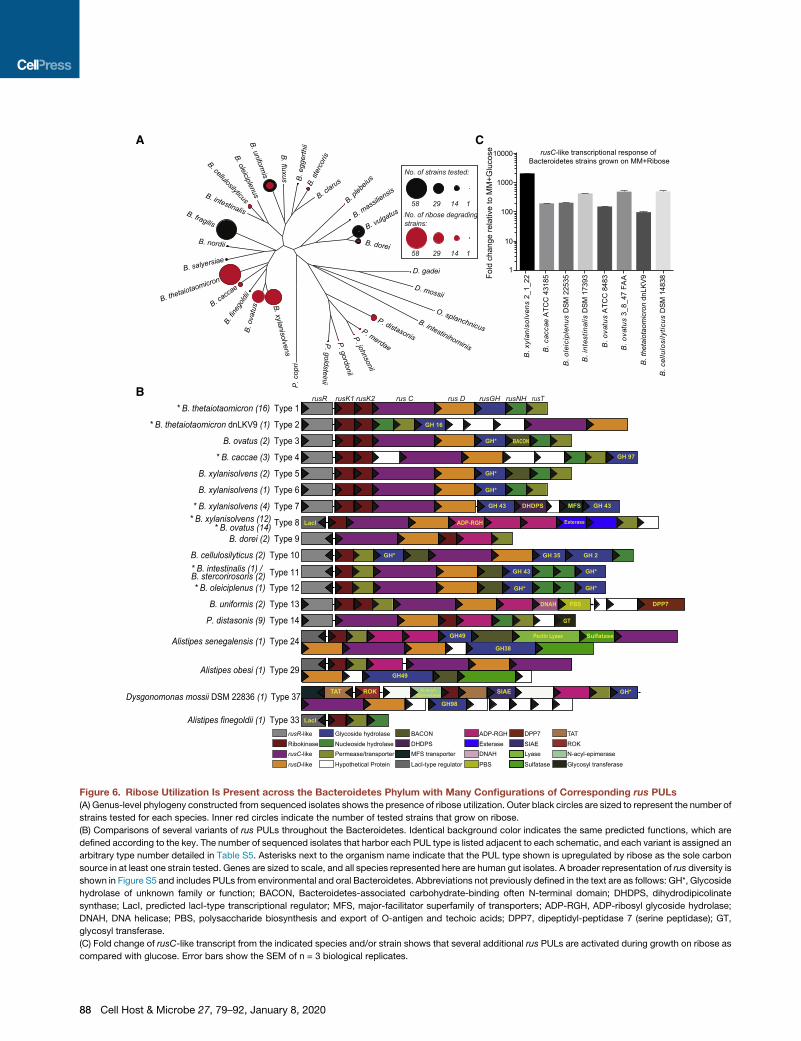
PBS
Figure 6. Ribose Utilization Is Present across the Bacteroidetes Phylum with Many Configurations of Corresponding rus PULs(A) Genus-level phylogeny constructed from sequenced isolates shows the presence of ribose utilization. Outer black circles are sized to represent the number of
strains tested for each species. Inner red circles indicate the number of tested strains that grow on ribose.
(B) Comparisons of several variants of rus PULs throughout the Bacteroidetes. Identical background color indicates the same predicted functions, which are
defined according to the key. The number of sequenced isolates that harbor each PUL type is listed adjacent to each schematic, and each variant is assigned an
arbitrary type number detailed in Table S5. Asterisks next to the organism name indicate that the PUL type shown is upregulated by ribose as the sole carbon
source in at least one strain tested. Genes are sized to scale, and all species represented here are human gut isolates. A broader representation of rus diversity is
shown in Figure S5 and includes PULs from environmental and oral Bacteroidetes. Abbreviations not previously defined in the text are as follows: GH*, Glycoside
hydrolase of unknown family or function; BACON, Bacteroidetes-associated carbohydrate-binding often N-terminal domain; DHDPS, dihydrodipicolinate
synthase; LacI, predicted lacI-type transcriptional regulator; MFS, major-facilitator superfamily of transporters; ADP-RGH, ADP-ribosyl glycoside hydrolase;
DNAH, DNA helicase; PBS, polysaccharide biosynthesis and export of O-antigen and techoic acids; DPP7, dipeptidyl-peptidase 7 (serine peptidase); GT,
glycosyl transferase.
(C) Fold change of rusC-like transcript from the indicated species and/or strain shows that several additional rus PULs are activated during growth on ribose as
compared with glucose. Error bars show the SEM of n = 3 biological replicates.
88 Cell Host & Microbe 27, 79–92, January 8, 2020
RusT
NucleosidesRNA
RusDOuter membrane
Other sugar permease(s)
RusGH
NMPs
RNase
Cytosol
RusK1/K2
BT4330
Nucleosides
np
Nucleoside Transporter
D-ribose-1-P
BT4554
IAP
RusNH
Substrate X
RusC
Inner membrane
TonB
BT0184 udk
Anabolism Catabolism NMPs
P
RusK1/K2
P
P P
PP P D-ribose-1,5-P
P P P P P
U C m5U U G
P
U
P
G
G
U
U
P
U
U
G
U
G
U
= ribose
freeribose
D-ribose-5-P
Ribose phosphatepyrophosphokinase
(BT0748)
BT0346/BT1986
PRPP
RusK2
D-Glyceraldehyde-3P
D-Ribulose-5P
D-Sedoheptulose-7PTransketolase
DNA/RNA/Amino Acid Biogenesis
sisylocylG
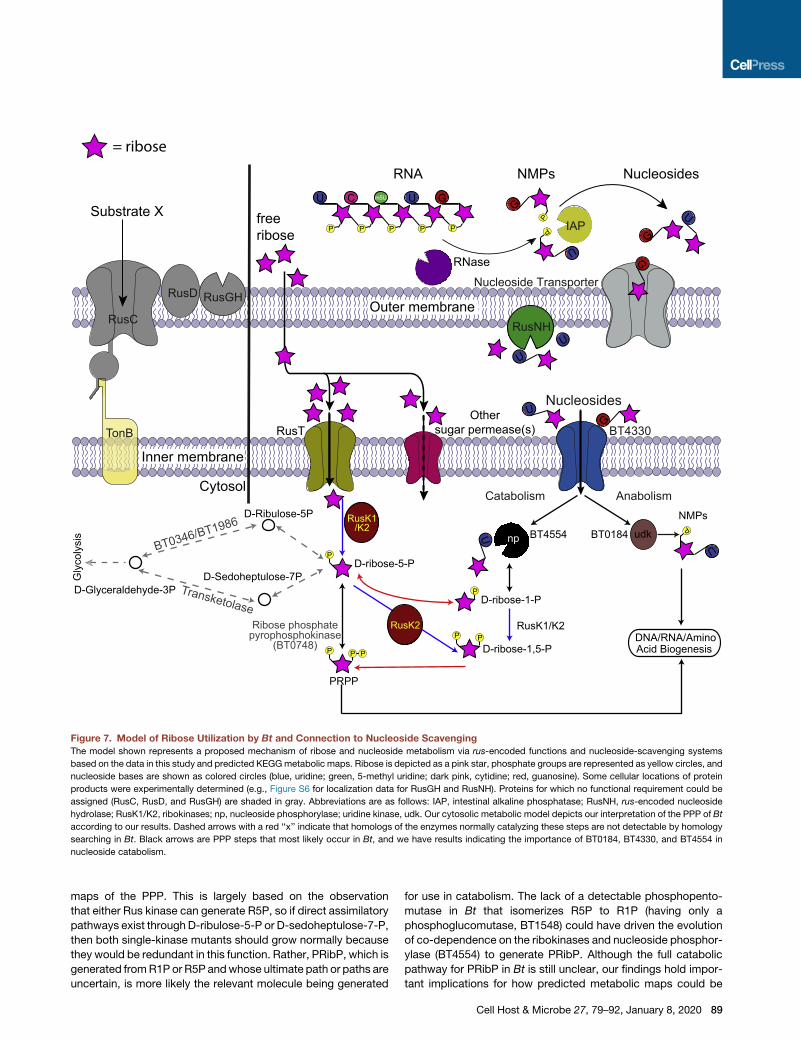
Figure 7. Model of Ribose Utilization by Bt and Connection to Nucleoside Scavenging
The model shown represents a proposed mechanism of ribose and nucleoside metabolism via rus-encoded functions and nucleoside-scavenging systems
based on the data in this study and predicted KEGGmetabolic maps. Ribose is depicted as a pink star, phosphate groups are represented as yellow circles, and
nucleoside bases are shown as colored circles (blue, uridine; green, 5-methyl uridine; dark pink, cytidine; red, guanosine). Some cellular locations of protein
products were experimentally determined (e.g., Figure S6 for localization data for RusGH and RusNH). Proteins for which no functional requirement could be
assigned (RusC, RusD, and RusGH) are shaded in gray. Abbreviations are as follows: IAP, intestinal alkaline phosphatase; RusNH, rus-encoded nucleoside
hydrolase; RusK1/K2, ribokinases; np, nucleoside phosphorylase; uridine kinase, udk. Our cytosolic metabolic model depicts our interpretation of the PPP of Bt
according to our results. Dashed arrows with a red ‘‘x’’ indicate that homologs of the enzymes normally catalyzing these steps are not detectable by homology
searching in Bt. Black arrows are PPP steps that most likely occur in Bt, and we have results indicating the importance of BT0184, BT4330, and BT4554 in
nucleoside catabolism.
maps of the PPP. This is largely based on the observation
that either Rus kinase can generate R5P, so if direct assimilatory
pathways exist through D-ribulose-5-P or D-sedoheptulose-7-P,
then both single-kinase mutants should grow normally because
they would be redundant in this function. Rather, PRibP, which is
generated fromR1P or R5P andwhose ultimate path or paths are
uncertain, is more likely the relevant molecule being generated
for use in catabolism. The lack of a detectable phosphopento-
mutase in Bt that isomerizes R5P to R1P (having only a
phosphoglucomutase, BT1548) could have driven the evolution
of co-dependence on the ribokinases and nucleoside phosphor-
ylase (BT4554) to generate PRibP. Although the full catabolic
pathway for PRibP in Bt is still unclear, our findings hold impor-
tant implications for how predicted metabolic maps could be
Cell Host & Microbe 27, 79–92, January 8, 2020 89

incomplete in some instances and should be interpreted with
caution. By investigating this pathway more deeply, we demon-
strate previously undescribed bacterial ATP-dependent riboki-
nases able to generate PRibP from R1P.
Similar to only one other previously characterized Bacteroides
PUL for fructan utilization (Sonnenburg et al., 2010), the rus PUL
is activated in response to a monosaccharide (fructose and
ribose for the respective systems) (Figure 1C) and also contains
a dedicated permease and kinase, revealing that these two
systems are similarly patterned around a core monosaccharide
utilization pathway. Although the activation signal for rus is
derived from extracellular ribose, we are unable to conclude
the exact phosphorylation status of the ribose that activates
expression. Our results show that the kinases and the putative
regulator RusR are required for generation of transcript. Often,
the enzyme content encoded in Bacteroidetes PULs provides
a window into the nutrient linkages that any given system has
evolved to target (Cuskin et al., 2015; Larsbrink et al., 2014;
Temple et al., 2017). Ribose is present in many diverse sources
with different linkages, including RNA and nucleosides, bacterial
capsules, cofactors such as NAD, cellular modification such as
(poly) ADP-ribose, andmore exotic molecules such as microcins
(Duquesne et al., 2007). The breadth of enzymatic diversity
emphasized by the presence of at least 22 different glycoside hy-
drolase families plus others and 70 different configurations of
ribose-utilization systems across the phylum supports a hypoth-
esis whereby species have adapted to liberate ribose from
different and diverse sources. We initially hypothesized that the
nutrient mediating the competitive advantage in vivo for Bt rus
would be endogenous nucleosides or RNA from bacteria or
host cells in a FF diet. However, our results suggest that in the
FR diet, nucleosides are the nutrients targeted by the combined
actions of BT4554 and the rus kinases. Although pyrimidine
nucleoside addition to water in mice fed the FF diet did not reveal
a competitive defect, it is possible that purine nucleosides, which
were not tested because of low solubility, could be present in the
FR diet and exert this effect.
The results described here highlight how survival of bacteria in
the human gut and other ecosystems has driven adaptations to
sense and scavenge the ubiquitous sugar ribose. Because
enterohemorrhagic E. coli (EHEC) and other pathogenic E. coli
preferentially utilize ribose in vivo (Fabich et al., 2008; Marti-
nez-Jehanne et al., 2009) or upregulate genes for the catabolism
of this nutrient in the environment (Bufe et al., 2019), these sub-
strates could represent unexplored nutrient niches competed for
by commensal and pathogenicmicroorganisms and could there-
fore help mediate colonization resistance against pathogens.
The evolution of diverse enzyme functions throughout the Bac-
teroidetes could be analogous to a molecular ‘‘Swiss Army
knife,’’ in which the core function is utilization of ribose, but the
various blades and other implements represent the enzymes
equipping the system to sense, import, or harvest ribose from
diverse sources. This molecular adaptability is particularly
important in the context of the nutrient niche hypothesis of gut
bacterial survival. Although some nutrients could be scarce in
comparison with abundant dietary fiber polysaccharides,
competition for these lower-abundance nutrients could be less
intense, and organisms capable of accessing them could
thereby occupy a stable niche. Although a number of gut bacte-
90 Cell Host & Microbe 27, 79–92, January 8, 2020
ria, including pathogens, are capable of utilizing free ribose, the
Bacteroides could have developed a more sophisticated ability
to scavenge multiple sources by cleaving it from covalently
linked forms. From this perspective, understanding the struggle
to access this ‘‘simple’’ sugar could reveal additional layers un-
derpinning the interplay between native gut mutualists and
invading pathogens.
STAR+METHODS
Detailed methods are provided in the online version of this paper
and include the following:
d KEY RESOURCES TABLE
d LEAD CONTACT AND MATERIALS AVAILABILITY
d EXPERIMENTAL MODEL AND SUBJECT DETAILS
B Gnotobiotic Mouse Experiments
B Bacterial Strains, Culturing Conditions, and Molecular
Genetics
d METHOD DETAILS
B Genetic Manipulation and Recombinant Protein Purifi-
cation in E. coli
B Measurements of Transcriptional Responses by qPCR
B Antibody Production, Western Blotting and Immuno-
fluorescent Microscopy
B Functional Annotation and Comparative Genomics of
rus PULs across Bacteroidetes Genomes
B RNaseq Analysis
B Enzyme Assays
B Determination of Free and Acid Hydrolysable Mono-
saccharide Content in Diets and Cecal Contents Using
GC/MS
B LC/MS/MS Determination of Positional Ribose Phos-
phorylation by rus Ribokinases
d QUANTIFICATION AND STATISTICAL ANALYSIS
d DATA AND CODE AVAILABILITY
SUPPLEMENTAL INFORMATION
Supplemental Information can be found online at https://doi.org/10.1016/j.
chom.2019.11.009.
ACKNOWLEDGMENTS
R.W.G. was supported by the NIH Molecular Mechanisms in Microbial Patho-
genesis training grant (T32AI007528). This work was supported by NIH grant
number AI128120. A.S.L. is supported by theMarie Sk1odowska-Curie Individ-
ual Fellowship (grant no. 748336). Metabolomics studies performed at the Uni-
versity of Michigan were supported by NIH grant DK097153. We would like to
thank the Germ-Free Mouse Facility at the University of Michigan for expert
assistance with in vivo experiments. Wewould also like to thank N.M. Koropat-
kin and R.M. Pollet of the University of Michigan Department of Microbiology
and Immunology for helping formulate ideas for enzyme purification and assay
development, as well as members of the Martens lab for fruitful discussion of
the results.
AUTHOR CONTRIBUTIONS
R.W.G. and E.C.M. designed the experiments. R.W.G. conducted the bulk of
experiments and performed data analysis. Y.T. and A.I.T. performed GC-MS
analysis, and B.R.H. provided helpful insight. P.S. and C.A.L. conducted LC-
MS-MS experiments and analysis. A.S.L. assisted in enzyme purification.

N.A.P. performed the growth assays on ribose for the 354 Bacteroides iso-
lates. R.W.G. and E.C.M. wrote the paper.
DECLARATION OF INTERESTS
The authors declare no competing interests.
Received: March 12, 2019
Revised: October 3, 2019
Accepted: November 18, 2019
Published: December 31, 2019
REFERENCES
Bjursell, M.K., Martens, E.C., and Gordon, J.I. (2006). Functional genomic and
metabolic studies of the adaptations of a prominent adult human gut symbiont,
Bacteroides thetaiotaomicron, to the suckling period. J. Biol. Chem. 281,
36269–36279.
Brili�ut _e, J., Urbanowicz, P.A., Luis, A.S., Basle, A., Paterson, N., Rebello, O.,
Hendel, J., Ndeh, D.A., Lowe, E.C., Martens, E.C., et al. (2019). Complex
N-glycan breakdown by gut Bacteroides involves an extensive enzymatic
apparatus encoded by multiple co-regulated genetic loci. Nat. Microbiol. 4,
1571–1581.
Bufe, T., Hennig, A., Klumpp, J., Weiss, A., Nieselt, K., and Schmidt, H. (2019).
Differential transcriptome analysis of enterohemorrhagic Escherichia coli
strains reveals differences in response to plant-derived compounds. BMC
Microbiol. 19, 212.
Cameron, E.A., Kwiatkowski, K.J., Lee, B.H., Hamaker, B.R., Koropatkin,
N.M., andMartens, E.C. (2014). Multifunctional nutrient-binding proteins adapt
human symbiotic bacteria for glycan competition in the gut by separately pro-
moting enhanced sensing and catalysis. MBio 5, e01441-14.
Chuvikovsky, D.V., Esipov, R.S., Skoblov, Y.S., Chupova, L.A., Muravyova,
T.I., Miroshnikov, A.I., Lapinjoki, S., and Mikhailopulo, I.A. (2006). Ribokinase
from E. coli: expression, purification, and substrate specificity. Bioorg. Med.
Chem. 14, 6327–6332.
Cuskin, F., Lowe, E.C., Temple, M.J., Zhu, Y., Cameron, E., Pudlo, N.A.,
Porter, N.T., Urs, K., Thompson, A.J., Cartmell, A., et al. (2015). Human gut
Bacteroidetes can utilize yeast mannan through a selfish mechanism. Nature
517, 165–169.
Datsenko, K.A., and Wanner, B.L. (2000). One-step inactivation of chromo-
somal genes in Escherichia coli K-12 using PCR products. Proc. Natl. Acad.
Sci. USA 97, 6640–6645.
Desai, M.S., Seekatz, A.M., Koropatkin, N.M., Kamada, N., Hickey, C.A.,
Wolter, M., Pudlo, N.A., Kitamoto, S., Terrapon, N., Muller, A., et al. (2016).
A Dietary Fiber-Deprived Gut Microbiota Degrades the Colonic Mucus
Barrier and Enhances Pathogen Susceptibility. Cell 167, 1339–1353.e21.
Duquesne, S., Petit, V., Peduzzi, J., and Rebuffat, S. (2007). Structural and
functional diversity of microcins, gene-encoded antibacterial peptides from
enterobacteria. J. Mol. Microbiol. Biotechnol. 13, 200–209.
Fabich, A.J., Jones, S.A., Chowdhury, F.Z., Cernosek, A., Anderson, A.,
Smalley, D., McHargue, J.W., Hightower, G.A., Smith, J.T., Autieri, S.M.,
et al. (2008). Comparison of carbon nutrition for pathogenic and commensal
Escherichia coli strains in the mouse intestine. Infect. Immun. 76, 1143–1152.
Finkel, S.E., and Kolter, R. (2001). DNA as a nutrient: novel role for bacterial
competence gene homologs. J. Bacteriol. 183, 6288–6293.
Glenwright, A.J., Pothula, K.R., Bhamidimarri, S.P., Chorev, D.S., Basle, A.,
Firbank, S.J., Zheng, H., Robinson, C.V., Winterhalter, M., Kleinekathofer,
U., et al. (2017). Structural basis for nutrient acquisition by dominant members
of the human gut microbiota. Nature 541, 407–411.
Hammer-Jespersen, K., Munch-Petersen, A., Schwartz, M., and Nygaard, P.
(1971). Induction of enzymes involed in the catabolism of deoxyribonucleo-
sides and ribonucleosides in Escherichia coli K 12. Eur. J. Biochem. 19,
533–538.
Harvey, P.C., Watson, M., Hulme, S., Jones, M.A., Lovell, M., Berchieri, A., Jr.,
Young, J., Bumstead, N., and Barrow, P. (2011). Salmonella enterica serovar
typhimurium colonizing the lumen of the chicken intestine grows slowly and
upregulates a unique set of virulence and metabolism genes. Infect. Immun.
79, 4105–4121.
Hehemann, J.H., Kelly, A.G., Pudlo, N.A., Martens, E.C., and Boraston, A.B.
(2012). Bacteria of the human gut microbiome catabolize red seaweed glycans
with carbohydrate-active enzyme updates from extrinsic microbes. Proc. Natl.
Acad. Sci. USA 109, 19786–19791.
Holdeman, L.V.E. (1977). Anaerobe laboratory manual (Virginia Ho University).
Hove-Jensen, B., Brodersen, D.E., and Manav, M.C. (2018). The Prodigal
Compound: Return of Ribosyl 1,5-Bisphosphate as an Important Player in
Metabolism. Microbiol. Mol. Biol. Rev. 83, e00040-18.
Kim, H.S., Lee, J.H., Lee, W.S., and Bang, W.G. (2006). Genes encoding ribo-
nucleoside hydrolase 1 and 2 from Corynebacterium ammoniagenes.
Microbiology 152, 1169–1177.
Koropatkin, N.M., Martens, E.C., Gordon, J.I., and Smith, T.J. (2008). Starch
catabolism by a prominent human gut symbiont is directed by the recognition
of amylose helices. Structure 16, 1105–1115.
Larsbrink, J., Rogers, T.E., Hemsworth, G.R., McKee, L.S., Tauzin, A.S.,
Spadiut, O., Klinter, S., Pudlo, N.A., Urs, K., Koropatkin, N.M., et al. (2014).
A discrete genetic locus confers xyloglucan metabolism in select human gut
Bacteroidetes. Nature 506, 498–502.
Luis, A.S., Briggs, J., Zhang, X., Farnell, B., Ndeh, D., Labourel, A., Basle, A.,
Cartmell, A., Terrapon, N., Stott, K., et al. (2018). Dietary pectic glycans are
degraded by coordinated enzyme pathways in human colonic Bacteroides.
Nat. Microbiol. 3, 210–219.
Markowitz, V.M., Chen, I.-M.A., Palaniappan, K., Chu, K., Szeto, E., Pillay, M.,
Ratner, A., Huang, J., Woyke, T., Huntemann, M., et al. (2014). IMG 4 version of
the integrated microbial genomes comparative analysis system. Nuc. Acids
Res. 42, D560–D567.
Martens, E.C., Chiang, H.C., and Gordon, J.I. (2008). Mucosal glycan foraging
enhances fitness and transmission of a saccharolytic human gut bacterial
symbiont. Cell Host Microbe 4, 447–457.
Martens, E.C., Koropatkin, N.M., Smith, T.J., and Gordon, J.I. (2009). Complex
glycan catabolism by the human gut microbiota: the Bacteroidetes Sus-like
paradigm. J. Biol. Chem. 284, 24673–24677.
Martens, E.C., Lowe, E.C., Chiang, H., Pudlo, N.A., Wu, M., McNulty, N.P.,
Abbott, D.W., Henrissat, B., Gilbert, H.J., Bolam, D.N., and Gordon, J.I.
(2011). Recognition and degradation of plant cell wall polysaccharides by
two human gut symbionts. PLoS Biol. 9, e1001221.
Martinez-Jehanne, V., du Merle, L., Bernier-Febreau, C., Usein, C., Gassama-
Sow, A., Wane, A.A., Gouali, M., Damian, M., Aıdara-Kane, A., Germani, Y.,
et al. (2009). Role of deoxyribose catabolism in colonization of the murine in-
testine by pathogenic Escherichia coli strains. Infect. Immun. 77, 1442–1450.
McConnell, R.E., Higginbotham, J.N., Shifrin, D.A., Jr., Tabb, D.L., Coffey,
R.J., and Tyska, M.J. (2009). The enterocyte microvillus is a vesicle-generating
organelle. J. Cell Biol. 185, 1285–1298.
McLeod, A., Snipen, L., Naterstad, K., and Axelsson, L. (2011). Global tran-
scriptome response in Lactobacillus sakei during growth on ribose. BMC
Microbiol. 11, 145.
McNulty, N.P., Wu, M., Erickson, A.R., Pan, C., Erickson, B.K., Martens, E.C.,
Pudlo, N.A., Muegge, B.D., Henrissat, B., Hettich, R.L., and Gordon, J.I.
(2013). Effects of diet on resource utilization by a model human gut microbiota
containing Bacteroides cellulosilyticusWH2, a symbiont with an extensive gly-
cobiome. PLoS Biol. 11, e1001637.
Ndeh, D., Rogowski, A., Cartmell, A., Luis, A.S., Basle, A., Gray, J., Venditto, I.,
Briggs, J., Zhang, X., Labourel, A., et al. (2017). Complex pectin metabolism by
gut bacteria reveals novel catalytic functions. Nature 544, 65–70.
Palchevskiy, V., and Finkel, S.E. (2009). A role for single-stranded exonucle-
ases in the use of DNA as a nutrient. J. Bacteriol. 191, 3712–3716.
Pan, N., and Imlay, J.A. (2001). How does oxygen inhibit central metabolism in
the obligate anaerobe Bacteroides thetaiotaomicron. Mol. Microbiol. 39,
1562–1571.
Parkin, D.W., Horenstein, B.A., Abdulah, D.R., Estupinan, B., and Schramm,
V.L. (1991). Nucleoside hydrolase from Crithidia fasciculata. Metabolic role,
Cell Host & Microbe 27, 79–92, January 8, 2020 91
purification, specificity, and kinetic mechanism. J. Biol. Chem. 266,
20658–20665.
Petersen, C., andMøller, L.B. (2001). The RihA, RihB, and RihC ribonucleoside
hydrolases of Escherichia coli. Substrate specificity, gene expression, and
regulation. J. Biol. Chem. 276, 884–894.
Pettolino, F.A., Walsh, C., Fincher, G.B., and Bacic, A. (2012). Determining the
polysaccharide composition of plant cell walls. Nat. Protoc. 7, 1590–1607.
Pluvinage, B., Grondin, J.M., Amundsen, C., Klassen, L., Moote, P.E., Xiao, Y.,
Thomas, D., Pudlo, N.A., Anele, A., Martens, E.C., et al. (2018). Molecular basis
of an agarose metabolic pathway acquired by a human intestinal symbiont.
Nat. Commun. 9, 1043.
Pokusaeva, K., Neves, A.R., Zomer, A., O’Connell-Motherway,M., MacSharry,
J., Curley, P., Fitzgerald, G.F., and van Sinderen, D. (2010). Ribose
utilization by the human commensal Bifidobacterium breve UCC2003.
Microb. Biotechnol. 3, 311–323.
Porter, N.T., and Martens, E.C. (2017). The Critical Roles of
Polysaccharides in Gut Microbial Ecology and Physiology. Annu. Rev.
Microbiol. 71, 349–369.
Pudlo, N.A., Urs, K., Kumar, S.S., German, J.B., Mills, D.A., and Martens, E.C.
(2015). Symbiotic Human Gut Bacteria with Variable Metabolic Priorities for
Host Mucosal Glycans. MBio 6, e01282-15.
Rogowski, A., Briggs, J.A., Mortimer, J.C., Tryfona, T., Terrapon, N., Lowe,
E.C., Basle, A., Morland, C., Day, A.M., Zheng, H., et al. (2015). Glycan
complexity dictates microbial resource allocation in the large intestine. Nat.
Commun. 6, 7481.
92 Cell Host & Microbe 27, 79–92, January 8, 2020
Sonnenburg, J.L., Xu, J., Leip, D.D., Chen, C.H., Westover, B.P., Weatherford,
J., Buhler, J.D., and Gordon, J.I. (2005). Glycan foraging in vivo by an intestine-
adapted bacterial symbiont. Science 307, 1955–1959.
Sonnenburg, E.D., Zheng, H., Joglekar, P., Higginbottom, S.K., Firbank, S.J.,
Bolam, D.N., and Sonnenburg, J.L. (2010). Specificity of polysaccharide use in
intestinal bacteroides species determines diet-inducedmicrobiota alterations.
Cell 141, 1241–1252.
Speer, M.A. (2013). Development of a genetically modified silage inoculant for
the biological pretreatment of lignocellulosic biomass. A Dissertation In
Agricultural and Biological Engineering. https://etda.libraries.psu.edu/files/
final_submissions/7579.
Temple, M.J., Cuskin, F., Basle, A., Hickey, N., Speciale, G., Williams, S.J.,
Gilbert, H.J., and Lowe, E.C. (2017). A Bacteroidetes locus dedicated to fungal
1,6-b-glucan degradation: Unique substrate conformation drives specificity of
the key endo-1,6-b-glucanase. J. Biol. Chem. 292, 10639–10650.
Terrapon, N., Lombard, V., Drula, E., Lapebie, P., Al-Masaudi, S., Gilbert, H.J.,
and Henrissat, B. (2018). PULDB: the expanded database of Polysaccharide
Utilization Loci. Nucleic Acids Res. 46 (D1), D677–D683.
Weickmann, J.L., Olson, E.M., and Glitz, D.G. (1984). Immunological assay of
pancreatic ribonuclease in serum as an indicator of pancreatic cancer. Cancer
Res. 44, 1682–1687.
Wu, Z.L. (2011). Phosphatase-coupled universal kinase assay and kinetics for
first-order-rate coupling reaction. PLoS One 6, e23172.
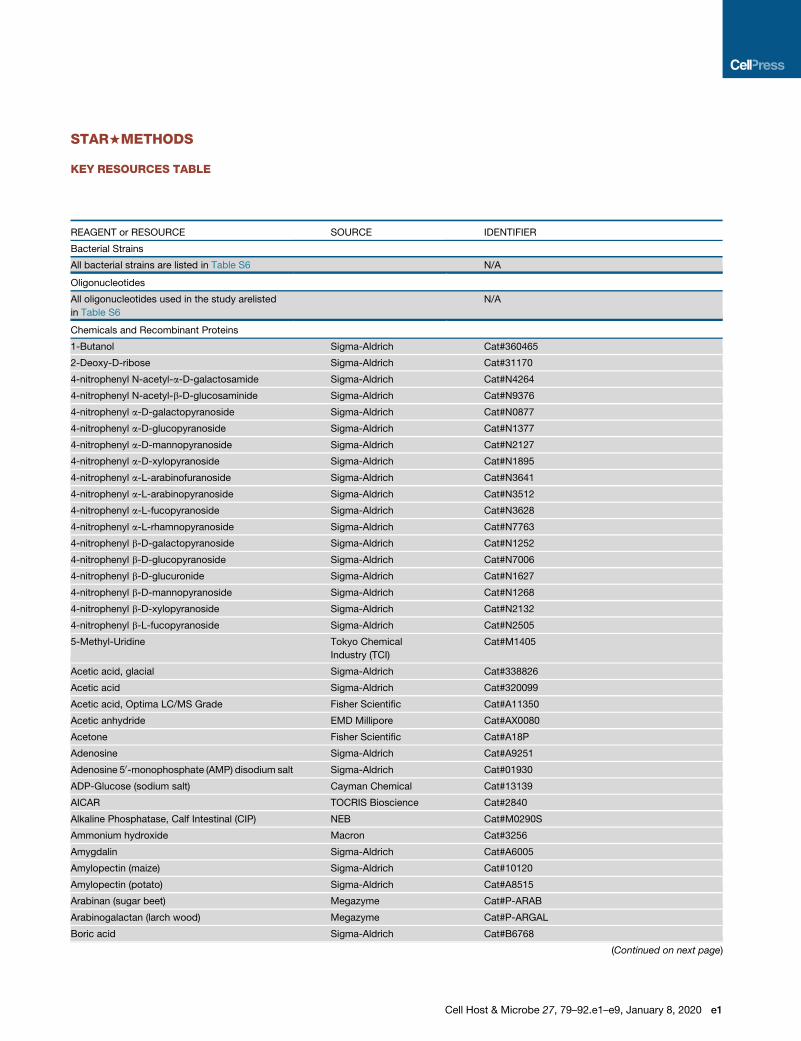
STAR+METHODS
KEY RESOURCES TABLE
REAGENT or RESOURCE SOURCE IDENTIFIER
Bacterial Strains
All bacterial strains are listed in Table S6 N/A
Oligonucleotides
All oligonucleotides used in the study arelisted
in Table S6
N/A
Chemicals and Recombinant Proteins
1-Butanol Sigma-Aldrich Cat#360465
2-Deoxy-D-ribose Sigma-Aldrich Cat#31170
4-nitrophenyl N-acetyl-a-D-galactosamide Sigma-Aldrich Cat#N4264
4-nitrophenyl N-acetyl-b-D-glucosaminide Sigma-Aldrich Cat#N9376
4-nitrophenyl a-D-galactopyranoside Sigma-Aldrich Cat#N0877
4-nitrophenyl a-D-glucopyranoside Sigma-Aldrich Cat#N1377
4-nitrophenyl a-D-mannopyranoside Sigma-Aldrich Cat#N2127
4-nitrophenyl a-D-xylopyranoside Sigma-Aldrich Cat#N1895
4-nitrophenyl a-L-arabinofuranoside Sigma-Aldrich Cat#N3641
4-nitrophenyl a-L-arabinopyranoside Sigma-Aldrich Cat#N3512
4-nitrophenyl a-L-fucopyranoside Sigma-Aldrich Cat#N3628
4-nitrophenyl a-L-rhamnopyranoside Sigma-Aldrich Cat#N7763
4-nitrophenyl b-D-galactopyranoside Sigma-Aldrich Cat#N1252
4-nitrophenyl b-D-glucopyranoside Sigma-Aldrich Cat#N7006
4-nitrophenyl b-D-glucuronide Sigma-Aldrich Cat#N1627
4-nitrophenyl b-D-mannopyranoside Sigma-Aldrich Cat#N1268
4-nitrophenyl b-D-xylopyranoside Sigma-Aldrich Cat#N2132
4-nitrophenyl b-L-fucopyranoside Sigma-Aldrich Cat#N2505
5-Methyl-Uridine Tokyo Chemical
Industry (TCI)
Cat#M1405
Acetic acid, glacial Sigma-Aldrich Cat#338826
Acetic acid Sigma-Aldrich Cat#320099
Acetic acid, Optima LC/MS Grade Fisher Scientific Cat#A11350
Acetic anhydride EMD Millipore Cat#AX0080
Acetone Fisher Scientific Cat#A18P
Adenosine Sigma-Aldrich Cat#A9251
Adenosine 50-monophosphate (AMP) disodium salt Sigma-Aldrich Cat#01930
ADP-Glucose (sodium salt) Cayman Chemical Cat#13139
AICAR TOCRIS Bioscience Cat#2840
Alkaline Phosphatase, Calf Intestinal (CIP) NEB Cat#M0290S
Ammonium hydroxide Macron Cat#3256
Amygdalin Sigma-Aldrich Cat#A6005
Amylopectin (maize) Sigma-Aldrich Cat#10120
Amylopectin (potato) Sigma-Aldrich Cat#A8515
Arabinan (sugar beet) Megazyme Cat#P-ARAB
Arabinogalactan (larch wood) Megazyme Cat#P-ARGAL
Boric acid Sigma-Aldrich Cat#B6768
(Continued on next page)
Cell Host & Microbe 27, 79–92.e1–e9, January 8, 2020 e1

Continued
REAGENT or RESOURCE SOURCE IDENTIFIER
Brain heart infusion (Bacto) Becton Dickinson Cat#237500
Chloroform Sigma-Aldrich Cat#496189
Chondroitin sulfate Sigma-Aldrich Cat#C9819
Cytidine Sigma-Aldrich Cat#C4654
D-Arabinose Sigma-Aldrich Cat#10850
Deoxyadenosine monohydrate Sigma-Aldrich Cat#D7400
Deoxycytidine Sigma-Aldrich Cat#D3897
Deoxyinosine Sigma-Aldrich Cat#D5287
Deoxyuridine Sigma-Aldrich Cat#D5412
Dextran Sigma-Aldrich Cat#31389
Dichloromethane Sigma-Aldrich Cat#270997
D-Fructose Sigma-Aldrich Cat#F0127
D-Lyxose Acros Organics Cat#205230050
D-Rhamnose Sigma-Aldrich Cat#R3875
D-Mannose Acros Organics Cat#150601000
D-Melezitose Sigma-Aldrich Cat#M5375
D-Psicose Tokyo Chemical
Industry (TCI)
Cat#P1699
D-Ribose Sigma-Aldrich Cat#R7500
D-Ribose 1-phosphate
bis(cyclohexylammonium) salt
Sigma-Aldrich Cat#83866
D-Ribose 5-phosphate disodium salt dihydrate Sigma-Aldrich Cat#83875
5-Phospho-D-Ribose 1-diphosphate
(PRPP) (sodium salt)
Cayman Chemical Cat#18897
2’-Deoxyribose 1-phosphate
bis(cyclohexylammonium) salt
Sigma-Aldrich Cat#D6539
2’-Deoxyribose 5-phosphate sodium salt Sigma-Aldrich Cat#D3126
D-Tagatose Sigma-Aldrich Cat#T2751
D-Xylose Sigma-Aldrich Cat#X1500
Ethanolamine Hydrochloride Sigma-Aldrich Cat#E6133
Erlose Sigma-Aldrich Cat#E1895
EST-L Low Concentration Tuning Mix Agilent Technologies Cat#G1969-85000
Fiber-rich diet (rodent breeder diet) LabDiet Cat#5013
Galactose Sigma-Aldrich Cat#G0625
Galacturonic acid Sigma-Aldrich Cat#73960
Glucosamine hydrochloride Sigma-Aldrich Cat#G4875
Glucuronic acid Sigma-Aldrich Cat#G8645
Glycogen Sigma-Aldrich Cat#G0885
Hyaluronin Sigma-Aldrich Cat#53747
Isopropanol LC/MS Grade Fisher Scientific Cat#A461
Isopropanol Sigma-Aldrich Cat#I9030
Mucin O-glycans Sigma-Aldrich Custom extraction from Cat#M1778
N-acetyl galactosamine Sigma-Aldrich Cat#A2795
N-acetyl glucosamine Sigma-Aldrich Cat#A3286
Levan Sigma-Aldrich Cat#L8647
Heparin Sigma-Aldrich Cat#H4784
Glucose Sigma-Aldrich Cat#158968
Guanosine Sigma-Aldrich Cat#G6264
(Continued on next page)
e2 Cell Host & Microbe 27, 79–92.e1–e9, January 8, 2020
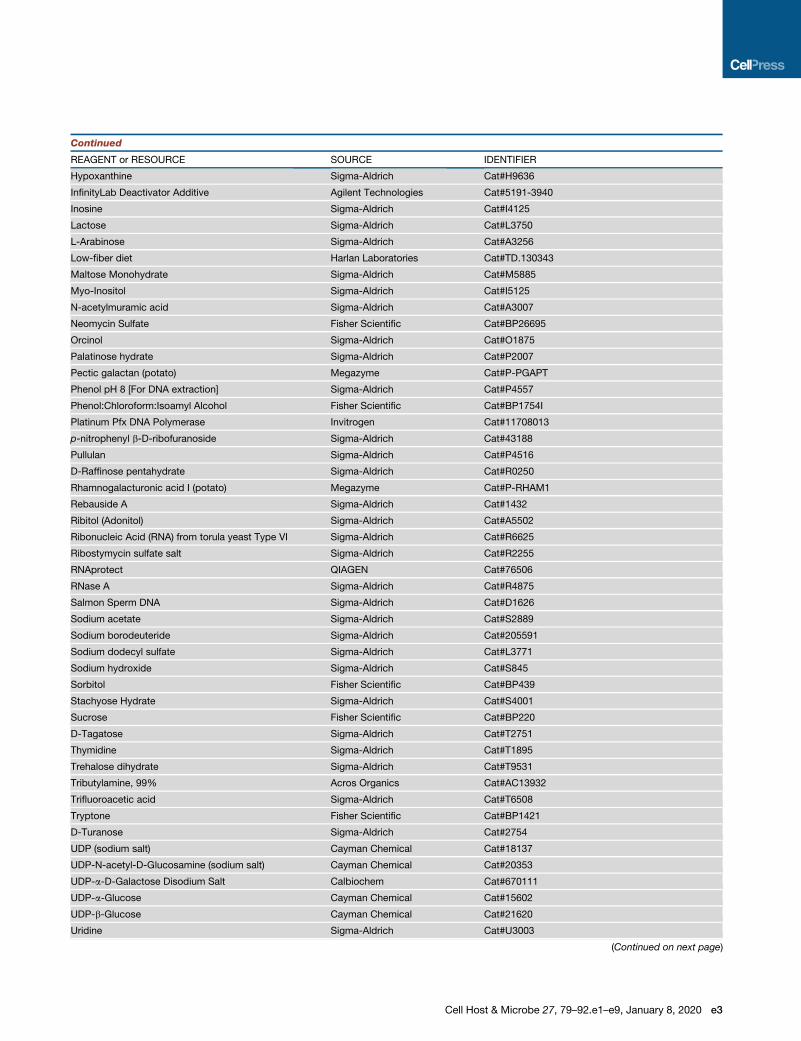
Continued
REAGENT or RESOURCE SOURCE IDENTIFIER
Hypoxanthine Sigma-Aldrich Cat#H9636
InfinityLab Deactivator Additive Agilent Technologies Cat#5191-3940
Inosine Sigma-Aldrich Cat#I4125
Lactose Sigma-Aldrich Cat#L3750
L-Arabinose Sigma-Aldrich Cat#A3256
Low-fiber diet Harlan Laboratories Cat#TD.130343
Maltose Monohydrate Sigma-Aldrich Cat#M5885
Myo-Inositol Sigma-Aldrich Cat#I5125
N-acetylmuramic acid Sigma-Aldrich Cat#A3007
Neomycin Sulfate Fisher Scientific Cat#BP26695
Orcinol Sigma-Aldrich Cat#O1875
Palatinose hydrate Sigma-Aldrich Cat#P2007
Pectic galactan (potato) Megazyme Cat#P-PGAPT
Phenol pH 8 [For DNA extraction] Sigma-Aldrich Cat#P4557
Phenol:Chloroform:Isoamyl Alcohol Fisher Scientific Cat#BP1754I
Platinum Pfx DNA Polymerase Invitrogen Cat#11708013
p-nitrophenyl b-D-ribofuranoside Sigma-Aldrich Cat#43188
Pullulan Sigma-Aldrich Cat#P4516
D-Raffinose pentahydrate Sigma-Aldrich Cat#R0250
Rhamnogalacturonic acid I (potato) Megazyme Cat#P-RHAM1
Rebauside A Sigma-Aldrich Cat#1432
Ribitol (Adonitol) Sigma-Aldrich Cat#A5502
Ribonucleic Acid (RNA) from torula yeast Type VI Sigma-Aldrich Cat#R6625
Ribostymycin sulfate salt Sigma-Aldrich Cat#R2255
RNAprotect QIAGEN Cat#76506
RNase A Sigma-Aldrich Cat#R4875
Salmon Sperm DNA Sigma-Aldrich Cat#D1626
Sodium acetate Sigma-Aldrich Cat#S2889
Sodium borodeuteride Sigma-Aldrich Cat#205591
Sodium dodecyl sulfate Sigma-Aldrich Cat#L3771
Sodium hydroxide Sigma-Aldrich Cat#S845
Sorbitol Fisher Scientific Cat#BP439
Stachyose Hydrate Sigma-Aldrich Cat#S4001
Sucrose Fisher Scientific Cat#BP220
D-Tagatose Sigma-Aldrich Cat#T2751
Thymidine Sigma-Aldrich Cat#T1895
Trehalose dihydrate Sigma-Aldrich Cat#T9531
Tributylamine, 99% Acros Organics Cat#AC13932
Trifluoroacetic acid Sigma-Aldrich Cat#T6508
Tryptone Fisher Scientific Cat#BP1421
D-Turanose Sigma-Aldrich Cat#2754
UDP (sodium salt) Cayman Chemical Cat#18137
UDP-N-acetyl-D-Glucosamine (sodium salt) Cayman Chemical Cat#20353
UDP-a-D-Galactose Disodium Salt Calbiochem Cat#670111
UDP-a-Glucose Cayman Chemical Cat#15602
UDP-b-Glucose Cayman Chemical Cat#21620
Uridine Sigma-Aldrich Cat#U3003
(Continued on next page)
Cell Host & Microbe 27, 79–92.e1–e9, January 8, 2020 e3

Continued
REAGENT or RESOURCE SOURCE IDENTIFIER
Uridine-50-diphosphoglucuronic acid (sodium salt) Cayman Chemical Cat#20674
Xanthosine dihydrate Sigma-Aldrich Cat#X0750
Yeast Extract Fisher Scientific Cat#BP1422
Dnase I NEB Cat#M0303
Hot Start Taq NEB Cat#M0495
10X Thermopol� Reaction Buffer NEB Cat#B9004
dNTPs Invitrogen Cat#10297018
MgSO4 NEB Cat#B1003
RbsK Recombinant Protein MyBioSource Cat#MBS1212370
Commercial Assays
Universial Kinase Activity Kit R&D Systems Cat#EA004
SYBR Green I Lonza Cat#50513
DNeasy Blood & Tissue Kit QIAGEN Cat#69504
KAPA SYBR FAST qPCR Master Mix KAPA Biosystems Cat#KK4601
MinElute PCR Purification Kit QIAGEN Cat#28006
Ribo-Zero rRNA Removal Kits (Bacteria) Illumina Cat#MRZB12424
RNA Clean and Concentrator-5 Zymo Research Cat#R1015
RNeasy Mini Kit QIAGEN Cat #74106
Superscript III Reverse Transcriptase Thermo Fisher Scientific Cat#18080093
TURBO DNA-free Kit Ambion [Thermo Fisher
Scientific]
Cat#AM1907
Software and Algorithms
Arraystar DNASTAR https://www.dnastar.com/software/genomics/
Integrated Microbial Genomes database Markowitz et al., 2014 https://img.jgi.doe.gov/
SeqMan Pro DNASTAR https://www.dnastar.com/software/molecular-
biology/
EditSeq DNASTAR N/A
PrimerSelect DNASTAR N/A
Prism version 8 GraphPad N/A
Agilent Masshunter Workstation version B.08.02 Agilent Technologies N/A
Other (Essential Equipment)
Anaerobic chamber Coy manufacturing Vinyl Type A + Type B
Automated plate handling device Biotek Instruments BIOSTACK2WR
Bead beater Biospec Products Mini-BeadBeater 16
Microtiter plate absorbance reader Biotek Instruments Synergy HT
Microtiter plate absorbance reader Biotek Instruments PowerWave HT
qPCR thermocycler Eppendorf Mastercycler ep realplex
Ultra Cruz UV Plate, 96 well, Flat Bottom Santa Cruz Biotechnology Cat#sc-213228
Gas Chromatography Instrument Agilent Technologies Model 7890A
Mass Spectrometer Agilent Technologies Model 5975C
Fused Silica Capillary Column (60 m x 0.25mm
x 0.2mm)
Supelco Analytical Cat#SP-2330
Triple Quadrupole 6470 Mass Spectrometer Agilent Technologies Model 6470
ZORBAX RRHD Extend-C18 Column
(2.1 m x 150mm x 1.8mm)
Agilent Technologies Cat#759700-902
ZOBAX Extend Fast Guard Agilent Technologies Cat#823750-937
1290 Infinity II Multicolumn Thermostat Agilent Technologies Cat#G7116B
(Continued on next page)
e4 Cell Host & Microbe 27, 79–92.e1–e9, January 8, 2020

Continued
REAGENT or RESOURCE SOURCE IDENTIFIER
1290 Infinity II Multisampler Agilent Technologies Cat#G7167B
1290 Infinity II LC Flexible Pump
(Quaternary Pump)
Agilent Technologies Cat#G7104A
Deposited Data
Glucose Replicate #1 This study GEO: GSM4081867
Glucose Replicate #2 This study GEO: GSM4081868
Glucose Replicate #3 This study GEO: GSM4081869
Ribose Replicate #1 This study GEO: GSM4081870
Ribose Replicate #2 This study GEO: GSM4081871
Ribose Replicate #3 This study GEO: GSM4081872
LEAD CONTACT AND MATERIALS AVAILABILITY
This study did not generate new or unique reagents other than genetic deletions within the strainBacteroides thetaiotaomicron ATCC
29148 (VPI-5482). All requests for these mutant strains, protein constructs, or expressing strains or any other questions about
methods or reagents used in this study will be available through directing inquiries to the Lead Contact, Eric C. Martens
EXPERIMENTAL MODEL AND SUBJECT DETAILS
Gnotobiotic Mouse ExperimentsAll experiments involving animals, including euthanasia via carbon dioxide asphyxiation, were approved by the University Committee
on Use and Care of Animals at the University of Michigan (NIH Office of Laboratory Animal Welfare number A3114-01) and overseen
by a veterinarian. Six to eight-week-old, germfree female Swiss-Webster mice were initially maintained on the standard, fiber-rich lab
diet (LabDiet 5010, LabDiet, St. Louis, MO), where appropriate, mice were switched to a fiber-free diet (Envigo-Teklad TD 130343)
andmaintained for oneweek prior to colonization withBt strains. After stable colonization had been observed, at day 14 some groups
of mice were provided water ab libitum containing one of the following: 1% ribose, 1%Nucleoside mixture (0.25% thymidine, 0.25%
uridine, 0.25% 5-methyl uridine, and 0.25% cytidine) or Type VI torula yeast RNA. DNA was extracted from fecal pellets throughout
the experiment and strain abundance was quantified as described previously (Desai et al., 2016). Relative abundance of each strain
was normalized to the original abundance on day of gavage (day 0). Post-sacrifice, cecal contents were collected, flash frozen and
stored at�80�C. RNAwas extracted as described previously (Porter andMartens, 2017), briefly, RNAwas phenol-chloroform treated
and ethanol precipitated, DNA removed by treatment with TURBOTM DNaseI (Ambion), followed by purification using RNeasymini kit
(QIAGEN) according to manufactures instructions.
Bacterial Strains, Culturing Conditions, and Molecular GeneticsB. thetaiotaomicron ATCC 29148 (VPI-5482) and its genetic variants, as well as other Bacteroides strains used in this study,
were routinely grown in tryptone-yeast extract-glucose (TYG) broth medium (Holdeman, 1977), in minimal medium (MM),
plus a defined carbon source (Martens et al., 2008), or on brain heart infusion agar with 10% defibrinated horse blood (Colorado
Serum Co.). Unless otherwise noted, carbon sources used in MM were added to a final concentration of 5 mg/mL. Cultures
were grown at 37�C in an anaerobic chamber (10% H2, 5% CO2, and 85% N2; Coy Manufacturing, Grass Lake, MI). Genetic
deletions and mutations were performed by counter-selectable allelic exchange as previously described (Koropatkin et al.,
2008). Complementation of deletion strains was performed using pNBU2 vectors as described previously (Martens et al.,
2008), containing 314 bp upstream of BT2802, predicted to contain the promoter sequence for the DrusR strain or 186 bp up-
stream of BT2803-04 containing the entire intergenic region for the DrusK1/K2 strain. Primers used in this study are listed in
Table S6 To quantify growth on carbon sources and examine mutant phenotypes, increase in culture absorbance (600 nm)
in 200ml cultures in 96-well plates was measured at 10 min intervals for at least 96 h on an automated plate reader as previously
described (Martens et al., 2011). To achieve consistent and robust growth on nucleosides and other covalently linked sources of
ribose, free ribose was added at a final concentration of 0.5 mg/mL to MM containing 5 mg/mL of carbon source. Growth on
5mg/mL of MM containing Type IV Torula yeast RNA (Sigma) was obtained by adding 100 units of calf-intestinal alkaline phos-
phatase (CIP) (New England Biolabs) and 2mg/mL RNase A (Sigma). Growth parameters and conditions for all substrates are
summarized in Table S1.
Cell Host & Microbe 27, 79–92.e1–e9, January 8, 2020 e5
METHOD DETAILS
Genetic Manipulation and Recombinant Protein Purification in E. coli
To create a nucleoside hydrolase-free expression background, E. coli BL21-AITM One Shot� cells (Invitrogen) were manipulated
using lambda red recombineering to introduce genetic deletions of the ribose-inducible hydrolase genes (rih) to avoid contaminating
activity in downstream applications of purified proteins (Petersen and Møller, 2001). The E. coli gene deletion procedure developed
by Datsenko andWanner (Datsenko andWanner, 2000) was followed with fewmodifications. Briefly, BL21-AI cells were transformed
with the pKD46 plasmid. Transformed cells were grown overnight in LB + Amp100 and sub-cultured, when the culture absorbance
(600 nm) reached 0.1, L-arabinosewas added to 10mMfinal concentration to induce the PBAD promoter of pKD46, cells were allowed
to grow to an OD between 0.6-0.8 and made competent for electroporation by cold water washes and stored in 10% glycerol ali-
quots. For recombineering, 400ng of gel-purified PCR product was added to freshlymade cells and incubated for 10min on ice, elec-
troporated in a 2mmgap cuvette at 2500 V, recovered in 1mL LB at 30�C for 5 h. All knockouts weremade sequentially in this manner
via introduction of the following antibiotic cassettes (spectinomycin from K11497 for DrihA; hygromycin from K11521 for DrihB;
gentamicin from K11590 for DrihC), and the following concentrations of antibiotic were used for selection: Spec80, Hygro200,
Gent10. Following construction of the last deletion, the pKD46 plasmid was heat-cured by passaging twice at 42�C in LB. To better
control background expression of the T7 promoter, the T7 lysozyme containing plasmid, pLysS from BL21 (DE3) (Lucigen) was intro-
duced into the strain via Ca2+ chemical competence/heat shock. Protein purification was accomplished using the pETite N-His vector
(Lucigen). PCR primers were designed to amplify products for BT2803, BT2804, BT2807 and BT2808 containing all amino acids for
BT2804 residues 1-311, or all amino acids downstream of the predicted signal peptide sequences, residues 22-539 for BT2807 and
residues 22-338 for BT2808, for BT2803 two constructs were made containing either all amino acids 1-321 or a construct based on
an alternative start site containing residues 15-321 (only this construct produced robust expression, while the full length failed to pro-
vide active product or good expression), amplified and transformed into Hi-Control 10G cells according to manufactures protocol
(Lucigen, ExpressoTM T7 cloning and expression system). pETite plasmids containing BT2803, BT2804, or BT2807 were transformed
into E. coli strains TUNER or for BT2808 into BL21-AIDrihABC + pLysS. A single colony was grown in 5mL of LB+Kan50 for 16 h. This
pre-inoculum was added to to 1L of Terrific-Broth with 50ng/ul of Kanamycin and 10 ng/ul of Chloramphenicol (BT2808) or 50ng/ul of
Kanamycin (BT2807) and culture was grown with shaking at 37�C until absorbance 0.4 at 600nm. BT2807 and BT2808 cells were
induced with a final concentration of 0.2mMor 1mM IPTG and 0.2%20mML-arabinose, respectively, and temperature was reduced
to 16�C and outgrown overnight. The recombinant proteins were purified by immobilized metal ion affinity chromatography using co-
balt (BT2807) or nickel-affinity (BT2808) columns was accomplished as described previously (Cameron et al., 2014).
Measurements of Transcriptional Responses by qPCRBt and otherBacteroides strains were grown tomid-exponential phase 0.6-0.8 (absorbance at 600nm) inMM-ribose, MM-arabinose,
MM-xylose, or MM-glucose, two volumes of RNA protect added, followed by centrifugation and storage of cell pellets at�80�C. To-tal RNA was extracted using the RNeasy mini kit buffers (QIAGEN) and purified on RNA-binding spin columns (Epoch), treated with
TURBO DNaseI (Ambion) or DNase I (NEB) after elution and purified again using a second RNeasy mini kit isolation column. Reverse
transcription was performed using SuperScript III reverse transcriptase and random primers (Invitrogen). The abundance of each
target transcript in the resulting cDNAwas quantified using either KAPA SYBR� FAST qPCRmix (KAPA Biosystems) or a homemade
qPCRmix as described previously (Speer, 2013). Each 20 uL reaction contained 1X Thermopol Reaction Buffer (NEB), 125uMdNTPs,
2.5mM MgSO4, 1X SYBR Green I (Lonza), 500nM gene specific or 65nM 16S rRNA primer and 0.5 units Hot Start Taq Polymerase
(NEB), and 10ng of template cDNA. For the KAPAmix, 400 nM of primers specific for genes in the rus locus ofBt or the rusC-like gene
of otherBacteroides species or 62.5 nMof 16S rRNA primers and 10ng of template cDNA as described previously (Pudlo et al., 2015).
Using the ddCT method, raw values were normalized to 16S rRNA values and then MM+ribose values were referenced to the values
obtained in MM-glucose to obtain a fold-change. Measurements of transcriptional response over time in MM-ribose or nucleosides
was performed similarly to previously described (Cameron et al., 2014). Briefly, strains were grown in TYG, subcultured 1:50 intoMM-
glucose, at mid-exponential phase, cells were washed twice in MM-no carbon and resuspended inMM-ribose with time points being
taken every 5 min for the first 30 min and every 15 min for a total of 120 min. Measurements of transcriptional responses to varying
amounts of ribose were performed similarly as above, but only one time point was taken after 30 min of exposure to varying concen-
tration of MM-ribose ranging from 0.0005 mg/mL to 5mg/mL.
Antibody Production, Western Blotting and Immunofluorescent MicroscopyPurified recombinant BT2807 and BT2808 proteins were used as antigens to raise rabbit polyclonal antibodies (Cocalico Biologicals,
Inc, Stevens PA). Antibody specificity and cellular localization for BT2807 and BT2808 were determined by western blotting of wild-
type and relevant mutant strains and by immunofluorescent microscopy of Bt VPI-5482 grown in MM+glucose or MM+ribose.
Growth conditions are described above, cells for WB were grown to mid-log optical absorbance (600 nm) 0.6-0.7 or 0.4-0.5 for
IF. Western blots of Bt whole cell lysates were performed using the primary, polyclonal antibodies mentioned above and secondary
antibody conjugated to goat anti-Rabbit IgG conjugated alkaline phosphatase (Sigma) and detectedwith NBT/BCIP (Roche). Surface
expression of BT2807 or BT2808 was examined by staining with a BT2807- or BT2808-specific primary antibody in non-permeabi-
lized formaldehyde-fixed Bt cells and detected with Alexa-Flour� 488 conjugated goat anti-Rabbit IgG secondary (Molecular
e6 Cell Host & Microbe 27, 79–92.e1–e9, January 8, 2020

Probes), as described previously (Cameron et al., 2014). Cells were imaged on an IX-70 inverted microscope (Olympus) with images
captured at 100x magnification. A minimum of five fields of view per slide was observed with n = 2 biological replicates.
Functional Annotation and Comparative Genomics of rus PULs across Bacteroidetes GenomesInitial functional annotations of Bt rus genes were taken from the Integrated Microbial Genomes (IMG) database using the Pfam, In-
terPro, COG, or KOG predictions. In cases where multiple annotations, we selected the more inclusive terms (e.g., nucleoside phos-
phorylase instead of purine or pyrimidine-specific nucleoside phosphorylase). A total of 354 different Bacteroidetes strains were
tested for growth on ribose as a sole carbon source as shown in Figure 6A and summarized in Table S4. The ability to use ribose
is shown in the context of a previously published human gut Bacteroidetes phylogeny that used 14 conserved genes across phylum
members (Larsbrink et al., 2014). To search for rus locus homologs across the Bacteroidetes phylum, we used the amino acid se-
quences of the rusK1, rusK2, rusT, and rusR genes from the Bt type strain as deletion of these genes yielded growth defects on
ribose. We searched the IMG database (current as of May 2018) and performed phylum-level BLAST searches with an E-value cutoff
of 1e-50. We chose this stringent cutoff as initial searches using lower values obtained many non-specific hits of genes encoding
other kinases and permeases that did not appear to be specific for ribose, including in the Bt VPI-5482 genome for which Rusk1
and RusK1 are the only kinases able to promote ribose growth. After we completed our search for rusK, rusT, and rusR homologs
we used the Gene Neighborhood tool in IMG to determine if these hits were located directly next to other genes involved in ribose
utilization. The presence of a minimum of two adjacent rus gene homologs was required to count the presence of a candidate uti-
lization locus. Following this first round of searching we observed that many of the rus loci contained one ormore nucleoside cleaving
enzymes such as homologs of Bt rusNH or ADP-ribosylglycohydrolases (RGH) and upstream putative regulatory genes. To give our
search more power and potentially find additional rus homologs we performed additional searches with the same E-value threshold
for homologs ofBt rusNH, or homologs of the ADP-RGH inB. xylanisolvens XB1A. When assembling the comparative genomics data,
gene names and glycoside hydrolase family assignments are shown as predicted within IMG by either annotation, Pfam and/or In-
terPro predictions or confirmed by BLAST of the amino acid sequence of individual genes. Further, in refinement, a handful of genes
were found below our E-value, but included in the table as it is clear from gene neighborhood views in IMG that it is likely part of a rus
locus due to adjacent hits of rus homologs. Types of rus have been assigned based only on gene content and arrangement as a way
to indicate differences, however subtle. In completing our table we have included the bit score as well as the amino acid% identities
compared toBt rus genes orBx XB1A ADP-RGH genes. All of the positive gene hits with locus tag information, isolation location, and
other relevant strain information is summarized in Table S5.
RNaseq AnalysisTo determine the global transcriptional response to growth in ribose as the sole carbon source, Bt cells were grown overnight in rich
TYG media then transferred to fresh MM containing either 5 mg/mL glucose or 5 mg/mL ribose. Cells were then grown until mid-log
phase (absorbance between 0.6-0.8) and two volumes of RNA Protect (QIAGEN) were added to cells. RNAwas isolated as described
above and purified whole RNA was then rRNA depleted using the Ribo-Zero Bacterial rRNA Removal Kit (Illumina Inc.) and concen-
tratedwith the RNAClean andConcentrator-5 kit (ZymoResearch Corp, Irvine, CA). Samples weremultiplexed for sequencing on the
Illumina HiSeq platform at the University of Michigan Sequencing Core. Data was analyzed using Arraystar software (DNASTAR, Inc.)
using RPKM normalization with default parameters. Gene expression in ribose was compared to gene expression in a glucose
reference. Geneswith significant up- or downregulationwere determined by the following criteria: geneswith an average fold-change
R 5-fold and with at least 2/3 biological replicates with a normalized expression levelR 1% of the overall average RPKM expression
level in either glucose or ribose, and a p value < 0.05 (t test with Benjamini-Hochberg correction) (Table S3).
Enzyme AssaysRecombinant proteins purified in E. coli, were used to determine enzyme kinetics for RusGH, RusNH, RusK1, and RusK2. For RusNH
we used a p-nitrophenol-ribofuranoside substrate with absorbance readings at 405nm over a 24 h period as described previously
(Desai et al., 2016), withmodifications for using purified protein instead of crude extract, using 0.5mMof enzyme in a buffer containing
20mMHEPES and 100mMNaCl, at pH 6.7 at 37�C and continuous absorbance readings. For RusGH, a panel of other 4-nitrophenol
based substrates in addition to p-NP-ribofuranoside were tested at pH 9.0 in 100 mM Tris at 37�C for 16 h with 1.5-15 mMof enzyme
and using endpoint absorbance measurements. Ion requirements of the RusGH were assayed in p-NP-ribofuranoside by addition of
divalent cations in the form of CaCl2, ZnCl2, or MgCl2, at 2, 5, or 10mMconcentrations, or in the presence of 10mMEDTA. Specificity
and kinetic parameters for RusNH on natural nucleoside substrates were determined as described previously using a UV-based
assay (Parkin et al., 1991). Briefly, a 96-well, UV-compatible microplate (Santa Cruz Biotechnologies) was used with substrate con-
centrations ranging from 0.025mM-2.5mM, and enzyme concentrations of 0.25-1uM. Assays were immediately read after addition of
enzyme by continuous reading of absorbance at 262nm or 280nmwith time points taken every 2.5 min over 12-24 h at 37�C. Volume
was 250uL in all assays and carried out in buffer containing 20mMHEPES and 100mMNaCl, at pH 6.7, adjustedwith acetic acid. As a
measure of catalytic efficiency, (Kcat/KM) was unable to be determined by classical Michaels-Menton kinetics as Vmax was
never reached and therefore Km values were not accurate, so we used a previously established method of estimating this value
(Ndeh et al., 2017). Briefly, we used a single substrate concentration to calculate (kcat/KM) and checked to be < <KM by halving
and doubling the substrate concentration and observing a proportionate increase or decrease in rate. Therefore the equation,
V0 = (kcat/KM)[S][E] was used to calculate kcat/KM in our case. For, RusGH a panel of other 4-nitrophenol based substrates in addition
Cell Host & Microbe 27, 79–92.e1–e9, January 8, 2020 e7
to p-NP-ribofuranoside were tested at pH 9.0 in 100 mM Tris at 37�C for 16 h with 1.5-15 mM of enzyme with endpoint absorbance
measurements. Ion requirements of the RusGH were assayed in p-NP-ribofuranoside by addition of divalent cations in the form of
CaCl2, ZnCl2, or MgCl2, at 2, 5, or 10mM concentrations, or in the presence of 1 mMEDTA. The RusGHwas tested against a panel of
oligosaccharides, nucleosides and nucleotides. Briefly, the reactions were performed with 10 mM of RusGH, 8mg/mL substrate or
5mM monosaccharide in 50 mM TRIS pH 9.0 at 37�C for 16 h. A control reaction was performed in the same conditions without
enzyme. The activity was qualitative determined by thin layer chromatography. 6 mL of the reaction was spotted on foil backed silica
plate (Silicagel 60, 203 20, Merck) and develop in butanol:acetic acid:water 2:1:1 (mobile phase). The products of the reaction were
detected by immersing the TLC plate in developer (sulphuric acid/ethanol/water 3:70:20 v/v, orcinol 1%) for 30 s and heating to 100�Cfor 2 min. A standard of ribose was run in all TLC plates. For RusK1/K2 a phosphatase-coupled, universal kinase assay was used
according tomanufacturer instructions to determine a specific activity of the kinases on pentose sugars. (R&DSystems,Minneapolis,
MN) (Wu, 2011). Specifically, all reactions were carried out in buffer containing 70 mM Tris, 100 mM KCl, and 5 mMMgCl2 at pH 7.5,
this buffer is based on previous studies examining ribokinase activities and showing this buffer provided maximal enzymatic activity
(Chuvikovsky et al., 2006). Reactions were carried out in 50 mL at 37�C for 30 min. All reactions contained 1 mM ATP, 100 ng of
coupling phosphatase, and a range of enzyme concentrations ranging from 0.1-10 mM of RusK1, RusK2, or E. coli RbsK (MyBio-
Source, San Diego, CA), as a positive control, and for the acceptor substrate either 10 mM of ribose or deoxyribose or 200 mM of
all other sugars tested including: arabinose, xylose, glucose or fructose etc. Determination of specific activity was based off of a
coupling rate of 0.399 and a rate constant of 97.78 nmol/min/mg/mM (empirically determined by the kit manufacture). In brief, our
specific activity is based on an endpoint observation across a minimum of 5 enzyme concentrations, the resulting absorbance is
fit to a known phosphate standard curve equation and the resulting rate is nM (product formed)/min (held standard at 30 min)/uM
enzyme/mM of substrate. This is the specific activity at a defined endpoint and so should not be confused with a rate taken at several
enzyme concentrations over different time points, but rather used a crude measurement for which to compare different enzymes.
Determination of Free and Acid Hydrolysable Monosaccharide Content in Diets and Cecal Contents Using GC/MSPrior to analysis, dietswere ground to a fine powder using a blender followed bymortar and pestle, while cecal contents were dried by
lyophilization. Samples were analyzed for free and linked monosaccharides using the following method described in (Pettolino et al.,
2012). In brief, all reactions began with 1-3mg of sample and samples were hydrolyzed in 100ul of 2.5 M TFA for 90 min at 121�C.Samples were allowed to cool to room temperature (RT) and myo-inositol was added as an internal standard (20ul of 2.5mg/mL)
and dried under nitrogen. 150ul of methanol was added, dried and repeated once more. Dried samples were then reduced by dis-
solving in 50ul of 2M NH4OH followed by addition of 50 ul of freshly made 1M NaDB4 in 2M NaOH. This mixture was sonicated in a
water bath for 1 min, followed by incubation at room temperature for 2.5 h. 23ul of glacial acetic acid was added and samples dried
and evaporated 2x with 250ul of 5% (v/v) acetic acid in methanol, followed by 2x evaporation with 250ul of methanol, drying after
each step. Acetylation was done by addition of 250ul acetic anhydrate and sonicated 5 min followed by incubation at 100�C for
2.5 h. 2ml of ddH2O was added and sample vortexed to dissolve residue, followed by room temperature incubation for 10 min.
1ml of dichloromethane (DCM) was added and vortexed followed by centrifugation at 2000 rpm for 2.5 min. The aqueous phase
was discarded and the DCM phase washed 2x with 2 mL of ddH2O. DCM phase was dried and residue dissolved in 250 ul acetone.
For free monosaccharide analysis the initial hydrolysis step with TFA was not performed. To establish a limit of detection in cecal
contents, varying amounts of ribose (0.00002-0.2 mg, in 10-fold increments) were added at the same time as the myo-inositol
standard to establish percent recovery throughout the methods used. Acetylated samples were analyzed on a gas chromatography
(Agilent Technologies model 7890A) coupled mass spectrometer (Agilent Technologies model 5975C) using a fused silica capillary
column (60 m x 0.25 mm x 0.2mm SP-2330, Supelco Analytical).
LC/MS/MS Determination of Positional Ribose Phosphorylation by rus RibokinasesSamples were prepared as follows with reactions containing the following: 1mMof either enzyme (RusK1 or RusK2), 10mM of a start-
ing substrate (ribose, ribose 1-phosphate, or ribose 5-phosphate), 1mM ATP, with all components dissolved in a buffer containing
70 mM Tris, 100 mM KCl, and 5 mMMgCl2 at pH 7.5and incubated at 37�C for 30 min. Reactions were then flash frozen and stored
at �80�C until processing. For analysis, 100% MeOH was added to thawed samples in buffer at a 4:1 ratio to extract metabolites.
Samples were then dried down and reconstituted in 45 mL of 1:1 MeOH/H2O. Samples were run on a 6470 Series Agilent Technol-
ogies Triple Quadrupole Mass Spectrometer with Ion-Pairing chromatography. The acquisition method was programed to detect for
dynamic multiple reaction monitoring (dMRM) of four compounds of interest: ribose, ribose 1-phosphate, ribose 5-phosphate,
and ribose 1,5-bisphosphate. The dMRM scan is used with a 0.07 min peak width and acquisition time of 24 min. The detected frag-
ments displayed the following dMRM transitions: ribose 149->89 at 1.31 min with collision energy (CE) of 5 eV; ribose-1-phosphate
229->210 at 9.4 min with CE of 9eV; ribose-5-phosphate 229-> 97 at 7.9 min with CE of 13eV; ribose-1,5-bisphosphate 309->211 at
14.6 min with CE of 13 eV. The following parameters were incorporated into the method: delta retention time of plus andminus 1 min,
fragmentor of 40 eV and cell accelerator of 5 eV. Agilent Qualitative Analysis version 7.00 was used for post-acquisition analysis. Our
empirically determined range of detection was established above a noise baseline determined by running enzyme, buffer, sample,
and internal controls for each species of interest where we did not anticipate these species being detected. This was determined to
be 103 which was our highest background reading (Table S2e). Detailed instrumentation running parameters are here described. The
following solvents were used during processing, Solvent A: 97% H2O and 3% MeOH, Solvent B: 15 mM acetic acid and 10 mM
tributylamine at pH 5. Solvent C: 15 mM acetic acid and 10 mM tributylamine in MeOH. Washing Solvent D is 100% acetonitrile.
e8 Cell Host & Microbe 27, 79–92.e1–e9, January 8, 2020
LC system seal washing solvent is 90% water and 10% isopropanol, while the needle washing solvent is 75% methanol and 25%
water. The Agilent Technologies Triple Quad 6470 LC/MS system used here consists of 1290 Infinity II LC Flexible Pump (Quaternary
Pump), 1290 Infinity II Multisampler, 1290 Infinity II Multicolumn Thermostat with 6 port valve and 6470 triple quadrupole mass spec-
trometer. Agilent Masshunter Workstation Software LC/MS Data Acquisition for 6400 Series Triple Quadrupole MS with Version
B.08.02 is used for compound optimization and data acquisition. The following column was used for separation: Agilent ZORBAX
RRHD Extend-C18, 2.1 3 150 mm, 1.8 um and ZORBAX Extend Fast Guards for UHPLC are used in the separation. LC gradient
profile is: at 0.25 mL/min, 0-2.5 min, 100% A; 7.5 min, 80% A and 20% C; 13 min 55% A and 45% C; 20 min, 1% A and 99% C;
24 min, 1% A and 99% C; 24.05 min, 1% A and 99% D; 27 min, 1% A and 99% D; at 0.8 mL/min, 27.5-31.35 min, 1% A and
99%D; at 0.6mL/min, 31.50min, 1%A and 99%D; at 0.4mL/min, 32.25-39.9min, 100%A; at 0.25mL/min, 40min, 100%A. Column
temperature is kept at 35�C, samples at 4�C, and injection volume is 2 ml. The 6470 Triple Quad MS was calibrated with ESI-L Low
concentration Tuningmix. Source parameters: Gas temp 150�C, Gas flow 10 l/min, Nebulizer 45 psi, Sheath gas temp 325�C, Sheathgas flow 12 l/min, Capillary �2000 V, Delta EMV �200 V.
QUANTIFICATION AND STATISTICAL ANALYSIS
Student’s t tests for in vivo data were performed for each time point in GraphPad Prism version 8.1 with a paired, two-tailed distri-
bution. Detailed statistical information is included in the figure legends where appropriate.
DATA AND CODE AVAILABILITY
Data from this study have been deposited in the NCBI Gene Expression Omnibus (GEO) database under the following accession
identifiers: RNA-seq data (GEO: GSM4081867, GSM4081868, GSM4081869, GSM4081870, GSM4081871, GSM4081872).
Cell Host & Microbe 27, 79–92.e1–e9, January 8, 2020 e9
Cell Host & Microbe, Volume 27
Supplemental Information
A Ribose-Scavenging System Confers Colonization
Fitness on the Human Gut Symbiont Bacteroides
thetaiotaomicron in a Diet-Specific Manner
Robert W.P. Glowacki, Nicholas A. Pudlo, Yunus Tuncil, Ana S. Luis, PeterSajjakulnukit, Anton I. Terekhov, Costas A. Lyssiotis, Bruce R. Hamaker, and Eric C.Martens

Supplementary Figure S1. In vitro rus activation specificity and supplemental in vivo competitions,
related to Figures 1 and 2. A) rusC (BT2805) expression during mid-log phase growth in MM containing
a sole carbon source from either mono-, di-, or trisaccharide’s compared to growth on MM-glucose, the
dashed orange line represents a 2-fold upregulation, while the dotted black line is a 5-fold upregulation,
error bars represent the SD of n=3 replicates. (B-F), in vivo competitions all performed in germfree Swiss
Webster mice and fed a fiber rich (FR) diet. Relative abundance was enumerated by qRT-PCR of unique
chromosomally encoded barcodes for wild type (black line) vs. Δrus strain (red line) in FR diet in (B) 12
week old female mice or (C) 6-8 week old male mice. (D) 6-8 week old female mice mono-associated with
either wild-type Bt (pink circles) or Δrus strain (green circles) where absolute abundance was assayed by
dilution plating from fresh fecal samples to obtain CFU/g feces. Error bars show SEM of the biological
average of n=3 mice. (E) As in (D), but enumerating absolute cecal abundance in mono-associated mice.
(F) Wild type rus expression from cecal contents from experiments in Fig. 2A-B and Fig. S2A-B, with the
SEM displayed for each sample. P-values were calculated for B-F using Student’s t test, specifically in B-
E, the relative abundance of each strain is tested with an (*) indicates a statistically significant difference
of (P<0.05), while (**) represents (P<0.01), and (***) indicates (P<0.001) and (****) is used to express
(P<0.0001) or no significant (ns). In (F) the values used for t test compare all other samples to rus expression
in 6-8 week old females on FR diet shown as lines above the bars.

Supplementary Figure S2. Monosaccharide content of diets and cecal contents, and additional in vivo
experiments and in vivo complementation of ΔrusK1/K2 deletion, related to Figures 2 and 3. A-C)
GC/MS analysis of free and linked (acid hydrolyzed) monosaccharides from fiber-rich (FR) or fiber-free
(FF) diets (B) cecal contents of wild type or Δrus mono-associated 6-8 week old, female Swiss Webster
mice maintained on the FR diet or (C) ribose content only analysis from mice maintained on the FF diet
provided water containing ribose, nucleosides, or RNA. Data is presented as mg of sugar per gram of diet
or cecal contents. (A) Blue and green bars represent the FR diet linked or free respectively, while the red
or purple bars represent the FF diet linked or free respectively. (B) The pink and olive green bars represent
wild type linked and free respectively, while the orange and green represent linked or free for the Δrus
colonized mice. In figures A-C error bars show the SEM of n=3 biological replicates. N.D. indicates that
the sugar was not detectable above our limit of detection (L.O.D.) which is shown as a dotted line above
the ribose bars only in (B), or as a dotted line in (C). (D-G) In vivo competition with 6-8 week old Swiss
Webster mice inoculated with both wild-type Bt (black line) against one other mutant or complemented

strain (red line) with fecal relative abundance shown as enumerated by qRT-PCR with error bars showing
the SEM. (D) Wild-type Bt and ΔrusR strain, (E) wild-type Bt and ΔrusC/D strain, (F) wild-type Bt and
ΔrusT strain; all deletion strains in D-F displayed slight, but significant competitive advantages over wild-
type Bt with n=4 biological replicates. (G) Competition of wild-type Bt against the complementation of the
ΔrusK1/K2 strain (ΔBT2803-04::BT2803-04) n=5 biological replicates. (H) in vivo rus transcript measured
by qRT-PCR from cecal contents where the gene deleted in the mutant strain was probed to assay rus
transcript levels, thus transcript is representative of the wild-type strain only, in the case of Δrus and ΔrusR,
the rusC gene was probed. In panels D-G, P-values were calculated by Student’s t test. An (*) indicates a
statistically significant difference of (P<0.05), while (**) represents (P<0.01), and (***) indicates
(P<0.001) and (****) is used to express (P<0.0001) in the relative abundance of each strain compared to
the other at each separate time point.
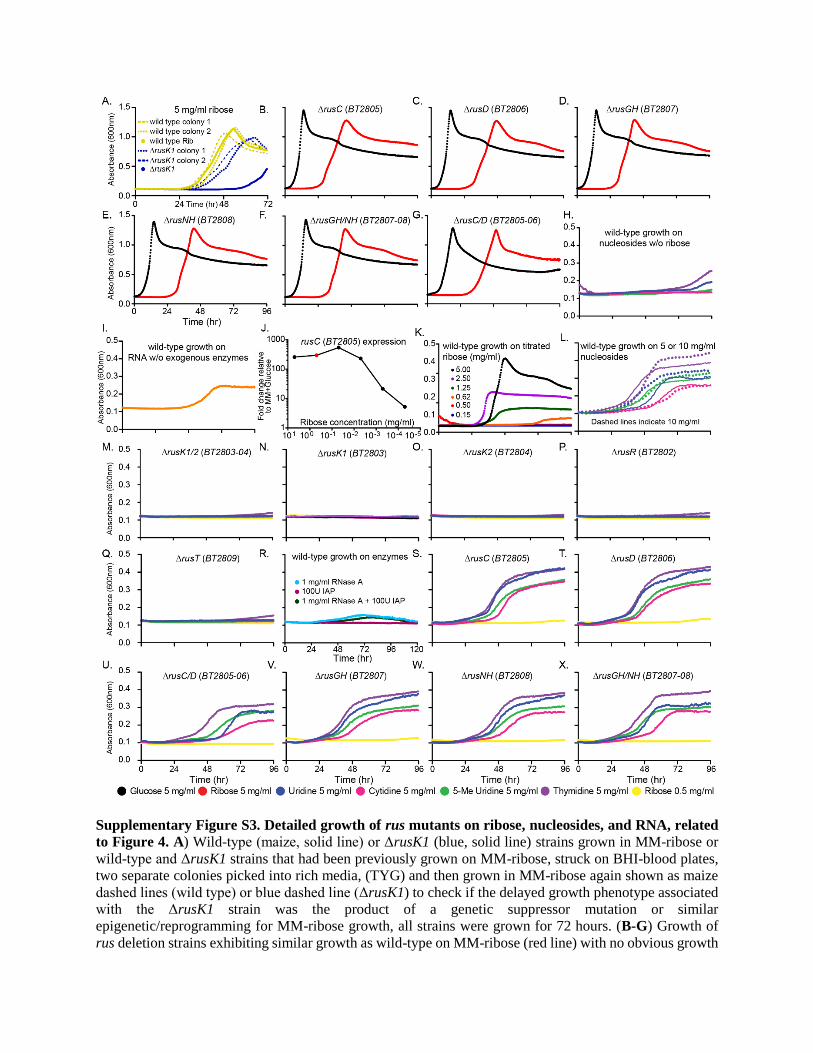
Supplementary Figure S3. Detailed growth of rus mutants on ribose, nucleosides, and RNA, related
to Figure 4. A) Wild-type (maize, solid line) or ΔrusK1 (blue, solid line) strains grown in MM-ribose or
wild-type and ΔrusK1 strains that had been previously grown on MM-ribose, struck on BHI-blood plates,
two separate colonies picked into rich media, (TYG) and then grown in MM-ribose again shown as maize
dashed lines (wild type) or blue dashed line (ΔrusK1) to check if the delayed growth phenotype associated
with the ΔrusK1 strain was the product of a genetic suppressor mutation or similar
epigenetic/reprogramming for MM-ribose growth, all strains were grown for 72 hours. (B-G) Growth of
rus deletion strains exhibiting similar growth as wild-type on MM-ribose (red line) with no obvious growth

defects, growth on MM-glucose (black line) is also shown for comparison: ΔrusC (B), ΔrusD (C), ΔrusGH
(D), ΔrusNH (E), ΔrusGH/NH (F), ΔrusC/D (G). For panel (H) wild-type Bt was grown in MM containing
5 mg/ml of one of the following nucleosides (uridine, blue line; cytidine, pink line; 5-methyl uridine, green
line; or thymidine, purple line) without any ribose added. (I)Wild-type Bt growth on MM containing 5
mg/ml of yeast RNA without any exogenous enzymes. (J) rusC transcriptional response when wild-type Bt
was exposed to titrated amounts of ribose (mg/ml) where each data point represents a different 10-fold
dilution of ribose. The red dot represents 0.5 mg/ml ribose which induces rus activation to comparable
levels as 5 mg/ml ribose compared to growth in MM-glucose. (K) Wild-type growth on different
concentrations of MM containing ribose at the following concentrations (mg/ml): 5, black line; 2.5, purple;
1.25, green; 0.625, orange; 0.5, red; or 0.15, blue. Growth was not detectable at levels ≤0.5 mg/ml. (L)
Wild-type growth on MM containing nucleosides at concentrations of 5 mg/ml (solid lines) or 10 mg/ml
(dashed lines) in the presence of 0.5 mg/ml ribose. Individual nucleoside growths are colored same as (G).
rus deletion strains exhibiting a complete lack of growth phenotype on all nucleosides tested are shown in
(M-Q) as follows with lines colored same as (H): ΔrusK1/2 (M), ΔrusK1 (N), ΔrusK2 (O), ΔrusR (P), and
ΔrusT (Q). (R) Wild-type growth curves on enzyme only controls for media supplemented with 1 mg/ml
RNase A (teal line), 100 U calf Intestinal Alkaline Phosphatase (IAP) (plum line), or 1 mg/ml RNase A and
100 U IAP (green line), demonstrating that without a carbon source, these enzymes do not support growth
of Bt. (S-X) Growth of deletion strains on nucleosides with 0.5 mg/ml ribose added to induce rus expression
where growth was similar to wild type levels: ΔrusC (S), ΔrusD (T), ΔrusC/D (U), ΔrusGH (V), ΔrusNH
(W), or ΔrusGH/NH (X). For panels (B-I) and (K-X) growth curves are plotted on a 96 hour timescale with
dashes denoting 24 hour increments.

Supplementary Figure S4. Potential crosstalk between ribose and other metabolism genes and PULs,
related to Figure 5. A-C) Growth of NSSs deletion strains or wild-type Bt on thymidine (A), ribose (B),
or RNA (C) (with added enzymes) out to 96 hours. Strains are color coded (wild-type, black; ΔBT0184,
red; ΔBT1881, green; ΔBT4330, purple; or ΔBT4554, orange). (D) rusK2 (left bars) or rusC (right bars)
transcript expression of wild-type Bt (purple) or ΔrusK1 strains when grown to mid-log phase in MM-
ribose compared to growth in MM-glucose, error bars represent the SD of n=3 replicates. (E) rus transcript
during a time course experiment where cells were shifted from growth on MM-glucose to MM-ribose, and
transcript probed over time with points every 5 minutes for the first 30 minutes and every 15 minutes after
out to the conclusion at 120 minutes post-ribose exposure. For the wild-type (black line) and ΔrusD (dark
yellow line) strains, the rusC gene was probed, while for the ΔrusC strain (red line), the rusD gene was
probed (similar kinetics were seen in the wild-type strain when the rusD gene was used to assay rus
activation, data not shown). Error bars represent the SEM of n=3 replicates performed on separate days. (F)
Similar to the experiment in (E) but using nucleosides (inosine, black line or uridine, green line) and probing
rusC expression to address if nucleosides could stimulate rus activation, with no response detected
compared to growth in MM-glucose. (G) in vivo competition of a strain lacking the entire fructan PUL,
BT1754-1765 (Δfruc, blue line) against a strain lacking both the fructan PUL and the rus PUL (Δfruc/Δrus,
orange line) in 6-8 week old Swiss-Webster female mice maintained on the FR diet. The relative fecal
abundance is shown on a log scale as assayed by qRT-PCR over the course of the experiment, error bars
show the SEM of n=4 mice. (H) in vivo rus expression from cecal contents of the mice from Fig S4G
probing the rusC gene, error bar shows the SEM of n=4 mice. P-values for (G) were calculated using
Student’s t test for the relative abundance of each strain (*) indicates a statistically significant difference of
(P<0.05), while (**) represents (P<0.01), and (***) indicates (P<0.001) and (****) is used to express
(P<0.0001).

Supplementary Figure S5. An expanded repertoire of rus architectures across the Bacteroidetes
phylum, related to Figure 6 and Table S5. A comparative genomics approach across the Bacteroidetes

phylum revealed many different types and subtypes of the rus locus. This figure displays almost all of the
additional types found in both the human gut isolates as an expansion from Fig. 6B, and those found in
aquatic, soil, and human oral cavity isolates. Not shown are subtypes, where the same genes are present,
but arranged differently, as well as types 21, 30, 33, 36, 39, 44, 48, 46, and 61, all of these types only had
one isolate and were of lesser complexity than the majority shown in this figure and are instead listed in
Table S5. As in Fig. 6, the gene size represents the amino acid length, and the background color is kept
constant for genes predicted to encode the same or very similar functions. Gene abbreviations are as follows
in order of appearance: (DeoR, DeoR-like family of transcriptional regulator; MFS, Major Facilitator
Superfamily of transporters; FADOR, Flavin (FAD) Oxidoreductase; NAD, NAD Binding Protein; CK,
Carbohydrate Kinase, unknown family; GDPDE, Glycerophosphoryl Diester Phosphodiesterase; NH,
Nucleoside Hydrolase; GH, Glycoside hydrolase; HAD, Haloacid Dehydrogenase; LacI, LacI-type
transcriptional regulator; FrcK, fructokinase; FGE, Formylglycine-Generating Enzyme, required for
sulfatase activity; NADP-DH, NADP-Dependent aldehyde Dehydrogenase; ALT-DH, Altronate
Dehydrogenase; kdxD, 2-dehydro-3-deoxy-D-arabinonate dehydratase; AraC, AraC-like transcriptional
regulator; Rib Iso, Ribose-5-Phosphate Isomerase; Tn-ase, transposase; BACON, Bacteroidetes-Associated
Carbohydrate-binding Often N-terminal domain; cpdA, 3’.5’-cyclic AMP phosphodiesterase; EEPase,
Endo-Exo Nucleoside-Phosphatase; TAT, Twin-Arginine Translocase; BNR, BNR repeat-like domain;
SIAE, Sialate O-acetylesterase; DPP IV, Dipeptidyl-peptidase IV; ***, RNA polymerase sigma factor ECF
subfamily; FecR, FecR-like transcriptional regulator; SusE, Bacteroides SusE-like outer membrane binding
protein; GntR, GntR-like transcriptional regulator; FBA, Fructose Bisphosphate Aldolase; Xyl Iso, Xylose
Isomerase; ROK, Repressor/ORF/Kinase domain containing protein; ADH, Alcohol Dehydrogenase;
LmbE, N-acetylglucosaminyl deacetylase LmbE-like family; E/L/P, Esterase/Lipase/Peptidase-like domain
containing protein; RhaA, Regulator of RNaseE activity; Acid Pase, Acid Phosphotase-like protein). We
have included a color-coded legend on the figure with the abbreviations listed next to them to help clarify
the relationship between the colored genes.

Supplementary Figure S6. Localization of RusGH and sequence alignment of conserved residues of
RusNH, related to Figure 7. A) Immunofluorescent microscopy of Bt grown in MM-ribose media
staining with anti-BT2807 (RusGH) antibody, indicating that the protein is localized to the outer
membrane as the secondary antibody has clearly labeled nearly all of the cells seen in the brightfield
image (left), a green color in the fluorescent image at (right). (B) Multiple sequence alignment of BT2808
(RusNH) and other RusNH-like proteins from Bacteroidetes (red boxed region) compared to previously
validated nucleoside hydrolases isolated from bacteria (E. coli, RihA,B,C and P. fluorescens), archaea (S.
solfataricus), parasitic eukaryotes (T. vivax, L. major, and C. fasciculata), moss (P. patens), maize (Zea
mays), and yeast (S. pombe), indicating that the predicted nucleoside hydrolase of BT2808 shares the
universally conserved N-terminal DXDXXXDD motif responsible for Ca2+ coordination (2nd and 4th
yellow-highlighted aspartic acid residues) and ribose binding (3rd yellow-highlighted aspartic acid), as
well as the nearly conserved canonical 1st aspartic acid residue denoting the motif (yellow or green
highlighted position). Specific to the Bacteroidetes nucleoside hydrolases, there are two residues, an
asparagine and an additional aspartic acid within the motif (highlighted in teal) not found IUNH family
nucleoside hydrolases outside of the Bacteroidetes.
Copyright © 2022 FDOKUMEN