Genetic polymorphisms and breast cancer risk: evidence from meta-analyses, pooled analyses, and...
16
REVIEW Genetic polymorphisms and breast cancer risk: evidence from meta-analyses, pooled analyses, and genome-wide association studies Sihua Peng • Bingjian Lu ¨ • Wenjing Ruan • Yimin Zhu • Hongqiang Sheng • Maode Lai Received: 14 February 2011 / Accepted: 15 March 2011 / Published online: 29 March 2011 Ó Springer Science+Business Media, LLC. 2011 Abstract To address the association between variants and breast cancer, an increasing number of articles on genetic association studies, genome-wide association studies (GWASs), and related meta- and pooled analyses have been published. Such studies have prompted an updated assess- ment of the associations between gene variants and breast cancer risk. We searched PubMed, Medline, and Web of Science and retrieved a total of 87 meta- and pooled anal- yses, which addressed the associations between 145 gene variants and breast cancer. Analyses met the following criteria: (1) breast cancer was the outcome, (2) the articles were all published in English, and (3) in the recent pub- lished meta- and pooled analyses, the analyses with more subjects were selected. Among the 145 variants, 46 were significantly associated with breast cancer and the other 99 (in 62 genes) were not significantly associated with breast cancer. The summary ORs for the 46 significant associa- tions (P \ 0.05) were further assessed by the method of false-positive report probability (FPRP). Our results demonstrated that 10 associations were noteworthy: CASP8 (D302H), CHEK2 (*1100delC), CTLA4 (?49G [ A), FGFR2 (rs2981582, rs1219648, and rs2420946), HRAS (rare alleles), IL1B (rs1143627), LSP1 (rs3817198), and MAP3K1 (rs889312). In addition, eight GWASs were identified, in which 25 loci were obtained (14 in nine genes, six near a gene or genes, and five intergenic loci). Of the 25 SNPs, 20 were noteworthy: C6orf97 (rs2046210 and rs3757318), FGFR2 (rs2981579, rs1219648, and rs2981582), LSP1 (rs909116), RNF146 (rs2180341), SLC4A7 (rs4973768), MRPS30 (rs7716600), TOX3 (rs3803662 and rs4784227), ZNF365 (rs10995190), rs889312, rs614367, rs13281615, rs13387042, rs11249433, rs1011970, rs614367, and rs1562430. In summary, in this review of genetic association studies, 31.7% of the gene- variant breast cancer associations were significant, and 21.7% of these significant associations were noteworthy. However, in GWASs, 80% of the significant associations were noteworthy. Keywords Breast cancer Polymorphism Meta-analysis Genome-wide association study Pooled analysis Introduction Breast cancer remains a major health problem around the world, and its incidence continues to increase [1]. It accounts for 26% of all new cancer cases among women in the United States [2]. During the last few decades, Electronic supplementary material The online version of this article (doi:10.1007/s10549-011-1459-5) contains supplementary material, which is available to authorized users. S. Peng H. Sheng M. Lai (&) Department of Pathology, Zhejiang University School of Medicine, 388 Yuhangtang Road, Hangzhou 310058, Zhejiang, People’s Republic of China e-mail: [email protected] B. Lu ¨ Department of Surgical Pathology, Affiliated Women’s Hospital, Zhejiang University School of Medicine, Hangzhou 310003, People’s Republic of China W. Ruan Department of Respiratory Diseases, Affiliated Sir Run Run Shaw Hospital, Zhejiang University School of Medicine, Hangzhou 310016, People’s Republic of China Y. Zhu Department of Public Health, School of Medicine, Zhejiang University, Hangzhou 310058, People’s Republic of China 123 Breast Cancer Res Treat (2011) 127:309–324 DOI 10.1007/s10549-011-1459-5
-
Upload
independent -
Category
Documents
-
view
2 -
download
0
Transcript of Genetic polymorphisms and breast cancer risk: evidence from meta-analyses, pooled analyses, and...

REVIEW
Genetic polymorphisms and breast cancer risk: evidencefrom meta-analyses, pooled analyses, and genome-wideassociation studies
Sihua Peng • Bingjian Lu • Wenjing Ruan •
Yimin Zhu • Hongqiang Sheng • Maode Lai
Received: 14 February 2011 / Accepted: 15 March 2011 / Published online: 29 March 2011
� Springer Science+Business Media, LLC. 2011
Abstract To address the association between variants and
breast cancer, an increasing number of articles on genetic
association studies, genome-wide association studies
(GWASs), and related meta- and pooled analyses have been
published. Such studies have prompted an updated assess-
ment of the associations between gene variants and breast
cancer risk. We searched PubMed, Medline, and Web of
Science and retrieved a total of 87 meta- and pooled anal-
yses, which addressed the associations between 145 gene
variants and breast cancer. Analyses met the following
criteria: (1) breast cancer was the outcome, (2) the articles
were all published in English, and (3) in the recent pub-
lished meta- and pooled analyses, the analyses with more
subjects were selected. Among the 145 variants, 46 were
significantly associated with breast cancer and the other 99
(in 62 genes) were not significantly associated with breast
cancer. The summary ORs for the 46 significant associa-
tions (P \ 0.05) were further assessed by the method of
false-positive report probability (FPRP). Our results
demonstrated that 10 associations were noteworthy: CASP8
(D302H), CHEK2 (*1100delC), CTLA4 (?49G[A),
FGFR2 (rs2981582, rs1219648, and rs2420946), HRAS
(rare alleles), IL1B (rs1143627), LSP1 (rs3817198), and
MAP3K1 (rs889312). In addition, eight GWASs were
identified, in which 25 loci were obtained (14 in nine genes,
six near a gene or genes, and five intergenic loci). Of
the 25 SNPs, 20 were noteworthy: C6orf97 (rs2046210
and rs3757318), FGFR2 (rs2981579, rs1219648, and
rs2981582), LSP1 (rs909116), RNF146 (rs2180341),
SLC4A7 (rs4973768), MRPS30 (rs7716600), TOX3
(rs3803662 and rs4784227), ZNF365 (rs10995190),
rs889312, rs614367, rs13281615, rs13387042, rs11249433,
rs1011970, rs614367, and rs1562430. In summary, in this
review of genetic association studies, 31.7% of the gene-
variant breast cancer associations were significant, and
21.7% of these significant associations were noteworthy.
However, in GWASs, 80% of the significant associations
were noteworthy.
Keywords Breast cancer � Polymorphism �Meta-analysis � Genome-wide association study �Pooled analysis
Introduction
Breast cancer remains a major health problem around the
world, and its incidence continues to increase [1]. It
accounts for 26% of all new cancer cases among women in
the United States [2]. During the last few decades,
Electronic supplementary material The online version of thisarticle (doi:10.1007/s10549-011-1459-5) contains supplementarymaterial, which is available to authorized users.
S. Peng � H. Sheng � M. Lai (&)
Department of Pathology, Zhejiang University School
of Medicine, 388 Yuhangtang Road, Hangzhou 310058,
Zhejiang, People’s Republic of China
e-mail: [email protected]
B. Lu
Department of Surgical Pathology, Affiliated Women’s Hospital,
Zhejiang University School of Medicine, Hangzhou 310003,
People’s Republic of China
W. Ruan
Department of Respiratory Diseases, Affiliated Sir Run Run
Shaw Hospital, Zhejiang University School of Medicine,
Hangzhou 310016, People’s Republic of China
Y. Zhu
Department of Public Health, School of Medicine, Zhejiang
University, Hangzhou 310058, People’s Republic of China
123
Breast Cancer Res Treat (2011) 127:309–324
DOI 10.1007/s10549-011-1459-5

extensive efforts have identified sources of genetic sus-
ceptibility to breast cancer. With the help of continuing
technological advances, many observational studies eval-
uating the association between variants in different genes
and breast cancer risk have been published [3]. These
studies prompted us to estimate their general contribution
to our current understanding of the genetic susceptibility to
breast cancer [4, 5].
One of the drawbacks of genetic epidemiology is that the
results are not easily replicated. Many studies attempting to
explore previously published, statistically significant find-
ings for the variants have failed to repeat those findings,
suggesting that false-positive results may exist in certain
studies [6]. Recently, Burton et al. [7] emphasized that if
sample sizes are large enough, it is possible to identify and
replicate genetic associations with common complex dis-
eases. Therefore, the size issue is an important methodo-
logical concern in genetic association studies [8].
Meta-analysis was defined by Glass [9] as ‘‘the statis-
tical analysis of a large collection of analysis results from
individual studies for the purpose of integrating the find-
ings.’’ Blettner [10] gave a definition of pooled analysis:
‘‘prospectively planned, pooled analysis of several studies,
where pooling is already a part of the protocol. Data col-
lection procedures, definition of variables, questions and
hypotheses are standardized for the individual studies.’’
Clearly, meta-analyses and pooled analyses are very good
tools for combining results from different studies. To this
end, we collected evidence from articles published on
meta-analyses and pooled analyses to assess the associa-
tions between breast cancer risk and various polymor-
phisms [11].
As early as 1999, Dunning et al.[12] published a sys-
tematic review of the associations of genetic variants and
breast cancer risk, in which 46 case–control studies
involving 18 genes were identified. They reported 12
variants to be significantly associated with breast cancer
risk. Since then, more articles on the associations between
variants and breast cancer risk have been published.
In 2008, Dong et al. [13] published another insightful
systematic review on the associations between genetic
variants and cancer risk, in which 20 variants were reported
to be significantly related to breast cancer risk. However,
only 3 years later, more than 100 new meta-analyses and
pooled analyses have been published, including more than
90 meta-analyses published in 2010 and 2011. Thus, the
results have been thoroughly updated. To this end, an
updated and systematic review on this issue is urgently
needed to evaluate the associations between genetic vari-
ants and breast cancer risk.
In contrast, a genome-wide association study (GWAS)
examines all or most of the genes in the genome of dif-
ferent individuals of a particular species to identify the
extent to which the genes vary from individual to indi-
vidual [14]. In humans, GWASs can identify the associa-
tions of particular genes with diseases, such as type 2
diabetes and breast cancer [15, 16]. In a GWAS, at least
100,000 single nucleotide polymorphisms (SNPs) of hun-
dreds or thousands of individuals are tested. To date, more
than 812 human GWASs have examined approximately
150 diseases and traits and have found more than 3,977
SNP associations [17, 18]. Therefore, GWASs evaluating
the associations between the various SNPs and breast
cancer risk were also reviewed in this article.
Methods
We searched PubMed, Medline, and Web of Science up to
Jan. 2011 for meta-analyses and pooled analyses involving
the associations between various polymorphisms and breast
cancer risk. We performed a literature search of the above
databases using three search themes, which were combined
using the Boolean operator ‘‘and.’’ The first theme was
(‘‘breast neoplasms’’ OR ‘‘breast cancer’’); the second was
(‘‘gene’’ OR ‘‘polymorphism’’ OR ‘‘single nucleotide
polymorphisms’’ OR ‘‘variant’’); and the third was (‘‘meta-
analysis’’ OR ‘‘pooled analysis’’).
Using this search strategy, 282, 302, and 214 articles (a
total of 798) were retrieved from PubMed, Medline, and
the Web of Science, respectively. Finally, after reading the
abstracts and/or full text, we selected 87 articles to include
in this review (Fig. 1). To be included, studies had to meet
the following criteria: (1) the outcome investigated in the
meta-analyses and pooled analyses was breast cancer; (2)
the articles were published in English; and (3) to avoid
overlap of results from more than one meta-analysis or
pooled analysis addressing the same variant, the analyses
with more subjects were selected. Data extracted from each
meta-analysis or pooled analysis included gene name,
genetic variant, OR (odds ratio) and 95% CI (confidence
interval), the number of studies, the number of subjects
(cases/controls), the test for between-study heterogeneity
(e.g., Q test [19]), and the test for publication bias (Egger’s
test [20]).
In this review, associations were considered statistically
significant if the reported P value was\0.05 or if the 95%
CI exceeded 1.0. For each statistically significant associa-
tion reported, we estimated the false-positive report prob-
ability (FPRP) using the method described by Wacholder
et al. [21] The magnitude of the FPRP is determined by
three parameters: (1) prior probability p of a true associa-
tion of the tested genetic variant with a disease, (2) a level
or observed P value, and (3) statistical power to detect the
OR of the alternative hypothesis at the given a level or
P value. They suggested estimating statistical power based
310 Breast Cancer Res Treat (2011) 127:309–324
123

on the ability to detect an OR of 1.5, with an a level equal
to the observed P value. Because much smaller ORs were
reported recently, we think that this estimate is too con-
servative. Therefore, ORs of both 1.5 and 1.2 were chosen
to present results. To assess whether the associations were
noteworthy, an FPRP cutoff value of 0.2 was used [21].
Thereby FPRP values less than 0.2 indicate an association
and are referred to as noteworthy in this review. Statistical
power and FPRP values were calculated by the Excel
spreadsheet which can be downloaded from the web site of
Wacholder et al. [21].
GWAS articles were obtained by searching PubMed and
checking the web site at www.genome.gov/gwastudies
[18]. The inclusion/exclusion criteria were as follows: (1)
only significant associations between various SNPs and
breast cancer risk were included, with a cutoff value of
P \ 1910-5 and (2) if the OR and CI were not reported,
this GWAS was excluded. FPRP methodology was also
used to evaluate the significant associations.
Results
We identified 87 published articles with meta-analyses and
pooled analyses, encompassing 80 different genes. These 87
meta-analyses and pooled analyses addressed associations
between 145 gene variants and breast cancer, including 40
meta-analyses and pooled analyses that reported significant
associations between 46 variants (in 35 genes) and breast
cancer (Table 1) and 61 meta-analyses and pooled analyses
that reported non-significant associations between 99 vari-
ants (in 62 genes) and breast cancer (Tables S1 and S2). Of
these 87 articles, 76 (87.4%) were published after 2009, 67
(77.0%) after 2010, and 6 (6.9%) in 2011.
Significant gene-variant breast cancer associations
Among the 145 gene-variant breast cancer associations that
were evaluated, the summary ORs for 46 (31.7%) associ-
ations were statistically significant (Fig. 2; Table 1).
Inverse associations for the variants were found in 8
of these 46 associations: CASP8 (D302H) [22], ESR1
(rs2234693 and rs1801132) [23], ESR2 (rs4986938) [24],
NBS1 (8360G[C) [25], NOS3 (-786T[C) [26], TP53
(rs1042522) [27], and XRCC3 (rs1799796) [28], with a
mean OR of 0.86 (median, 0.89; range, 0.66-0.95). The
other 38 analyses reported ORs higher than 1.0, with a mean
OR of 1.39 (median, 1.15; range, 1.05–3.13) (Table 1).
To evaluate the robustness of these findings, we calcu-
lated FPRP values. Among the 46 significant associations,
36 gene-variant breast cancer associations had FPRP values
[0.2 at the pre-specified prior probability of 0.001; these
associations were not considered noteworthy. For example,
although the OR from the pooled analysis for CCND1
(G870A) indicated a significant association with breast
cancer (OR, 1.09; 95% CI, 1.01–1.18), FPRP values were
higher than 0.2; therefore, this result was not considered
noteworthy. At a prior probability level of 0.001 and sta-
tistical power to detect an OR of 1.5, ten associations were
noteworthy (FPRP \ 0.2): CASP8 (D302H), CHEK2
Records excluded (n=123)
Full-text articles excluded, with reasons: Not meta-analysis/pooled-analysis,
genetic polymorphism, or breast cancer (n1=42).
Not latest meta-analysis (n2=19).
Total n=61
Records screened by title (n=393)
Records screened by abstract (n=270)
Records excluded (n=122)
Additional records identified through other sources
(n=0)
Records identified through database searching (PubMed 282, Medline 302,
and Web of Science 214) (n=798)
Meta-analyses and pooled analyses (n=87)
Records excluded (n=405)
Records after overlaps removed (n=798)
Full-text articles assessed for eligibility (n=148)
Fig. 1 Selection of studies
Breast Cancer Res Treat (2011) 127:309–324 311
123

Table 1 Statistically significant gene-variant breast cancer overall associations and false-positive report probabilities (FPRP)
Gene (variant) Year Comparison OR (95% CI) Publication
bias/
heterogeneity
No. of
studies
Cases/control Power
OR,
1.5
Power
OR,
1.2
FPRP values
at prior
probability
of 0.001
Ref.
OR
1.5
OR
1.2
CASP8 (D302H) 2010 Dominant
model
0.87 (0.83–0.92) No/0.66 4 39,109 (18,791/20,318) 1.0 0.935 0.001 0.001 [22]
CCND1 (G870A) 2010 AA vs. GG 1.09 (1.01–1.18) 0.054/0.122 13 21,082 (9,911/11,171) 1.0 0.991 0.971 0.971 [145]
CHEK2
(*1100delC)
2008 Heterozygotes
vs.
noncarrier
2.40 (1.80–3.20) 0.08/NA 12 36,909 (18,329/18,580) 0.001 \0.000 0.004 0.678 [95]
CTLA4 (?49G[A) 2010 Dominant
model
1.24 (1.18–1.32) 0.998/0.11 32 24,452 (11,273/13,179) 1.0 0.152 0.000 0.000 [146]
CYP19 ((TTTA)10) 2010 (TTTA)10 1.52 (1.12–2.06) 0.58/0.06 14 16,104 (7,743/8,361) 0.466 0.064 0.937 0.991 [42]
ERCC2
(Lys751Gln)
2010 Dominant
model
1.13 (1.02–1.24) 0.036/0.0001 32 29,897 (14,545/15,352) 1.0 0.898 0.908 0.917 [47]
ESR1 (rs2234693) 2010 Dominant
model
0.95 (0.89–1.00) 0.97/0.39 11 26,920 (10,300/16,620) 1.0 1.0 0.980 0.980 [23]
(rs1801132) Dominant
model
0.92 (0.85–0.99) 0.86/0.66 7 12,505 (5,649/6,856) 1.0 0.996 0.963 0.963 [23]
ESR2 (rs4986938) 2010 Dominant
model
0.94 (0.90–0.99) 0.748/0.379 9 26,858 (10,837/16,021) 1.0 1.0 0.951 0.951 [24]
FGFR2 (rs2981582) 2010 GG vs. AA 1.48 (1.35–1.61) [0.05/
\ 0.000
11 91,890 (40,292/51,598) 0.0 0.0 0.000 0.000 [147]
(rs1219648) GG vs. AA 1.50 (1.36–1.65) [0.05/0.09 9 58,903 (13,930/44,973) 0.548 0.0 0.000 0.000 [147]
(rs2420946) CC vs. TT 1.52 (1.37–1.68) [0.05/0.20 6 15,329 (6,781/8,548) 0.413 0.0 0.000 0.000 [147]
GSTM1 (null/
present)
2010 Null vs.
present
1.10 (1.04–1.16) 0.445/0.003 59 46,281 (20,993/25,288) 1.0 0.999 0.303 0.303 [148]
GSTT1 (null/
present)
2010 Null vs.
present
1.11 (1.04–1.20) 0.048/0.059 41 36,584 (16,589/19,995) 1.0 0.975 0.897 0.899 [53]
For Chinese 2010 Null vs.
present
1.06 (0.87–1.29) 0.742/0.017 8 5,980 (2,450/3,530) – – – – [53]
HER2 (Ile655Val) 2010 Dominant
model
1.10 (1.01–1.20) 0.03/0.01 27 24,042 (11,504/12,538) 1.0 0.975 0.969 0.970 [149]
HRAS (rare alleles) 1997 Per-allele
comparison
2.7 (2.10–3.40) NA/NA 8 1,631 (694/937) 0.0 0.0 0.000 0.000 [150]
IGFBP3 (A-202C) 2010 CC vs. AA 1.06 (1.02–1.11) 0.63/0.60 27 78,811 (33,557/45,254) 1.0 1.0 0.93 0.93 [96]
IL1B (rs1143627) 2010 Recessive
model
1.40 (1.17–1.67) No/0.49 4 2,708 (1,543/1,165) 0.778 0.043 0.191 0.809 [58]
LSP1 (rs3817198) 2010 Allele contrast 1.06 (1.04–1.08) No/0.166 7 69,591 (33,920/35,671) 1.0 1.0 0.000 0.000 [151]
MAP3K1(rs889312) 2010 Dominant
model
1.10 (1.06–1.13) 0.696/0.43 7 59,977 (26,015/33,962) 1.0 1.0 0.000 0.000 [152]
MDM2(SNP309) 2010 GT vsTT 1.06 (1.00–1.12) No/0.77 16 25,979 (12,986/12,993) 1.0 1.0 0.974 0.974 [153]
For non-Chinese 2010 G vs. T 1.02 (0.97–1.08) No/No 13 23,652 (12,094/11,558) – – – – [153]
MMP-2 (-1306
C/T)
2010 CC vs.
CT ? TT
1.27 (1.10–1.47) No/\0.001 4 3,243 (1,590/1,653) 0.987 0.224 0.579 0.859 [61]
MTHFR (C667T) 2010 TT vs.
CC ? CT
1.12 (1.01–1.24) No/0.001 41 38,868 (16,480/22,388) 1.0 0.908 0.967 0.970 [154]
NBS1 (657del5) 2006 Carrier vs.
noncarrier
3.13 (1.40–7.00) No/No 2 2,406 (1,620/786) 0.037 0.010 0.993 0.993 [97]
(8360G[C) 2010 CC vs. GG 0.75 (0.74–0.98) 0.20/0.13 10 10,117 (4,452/5,665) 0.806 0.220 0.977 0.994 [25]
NOS3 (eNOS,894
G[T)
2010 TT vs. GG 1.29 (1.06–1.56) 0.110/0.223 11 9,507 (4,665/4,842) 0.94 0.228 0.902 0.974 [155]
(-786T[C) 2010 Dominant
model
0.66 (0.47–0.94) No/0.741 3 3,326 (1,856/1,470) 0.478 0.098 0.978 0.995 [26]
POR (Gly5Gly) 2007 GG vs. AA 1.58 (1.04–2.41) NA/0.85 4 1,915 (1,038/877) 0.405 0.101 0.988 0.997 [98]
312 Breast Cancer Res Treat (2011) 127:309–324
123

(*1100delC), CTLA4 (?49G[A), FGFR2 (rs2981582,
rs1219648, and rs2420946), HRAS (rare alleles), IL1B
(rs1143627), LSP1 (rs3817198), and MAP3K1 (rs889312).
This number was further reduced to eight when we cal-
culated the statistical power based on a lower OR of 1.2:
CASP8 (D302H), CTLA4 (?49G[A), FGFR2 (rs2981582,
rs1219648, and rs2420946), HRAS (rare alleles), LSP1
(rs3817198), and MAP3K1 (rs889312).
Non-significant gene-variant breast cancer associations
Besides the statistically significant associations, statisti-
cally non-significant associations were reported for 99
variants (with P values [ 0.05; Table S1) [22–24, 29–86].
Of these 99 associations, 49 (49.5%) were inverse associ-
ations for the variants, with a mean OR of 0.91 (median,
0.96; range, 0.39–0.99).
Table 1 continued
Gene (variant) Year Comparison OR (95% CI) Publication
bias/
heterogeneity
No. of
studies
Cases/control Power
OR,
1.5
Power
OR,
1.2
FPRP values
at prior
probability
of 0.001
Ref.
OR
1.5
OR
1.2
RAD51 (135G[C) 2010 Recessive
model
1.35 (1.05–1.74) 0.16/0.06 9 26,444 (13,241/13,203) 0.722 0.182 0.963 0.991 [156]
SULT1A1 (R213H) 2011 Dominant
model
1.13 (1.01–1.26) No/0.001 16 23,445 (9,881/13,564) 1.0 0.86 0.965 0.970 [157]
For Asians 2011 Dominant
model
1.11 (0.94–1.32) No/0.004 7 23,445 (4,966/7,770) – – – – [157]
TGFB1 (rs1982073) 2010 Dominant
model
1.05 (1.01–1.10) 0.675/0.195 30 47,817 (20,401/27,416) 1.0 1.0 0.975 0.975 [99]
TNF (rs1800629) 2009 Recessive
model
1.10 (1.04–1.17) \0.05/0.45 11 23,095 (10,184/12,911) 1.0 0.997 0.996 0.996 [158]
TOX3 (rs3803662) 2010 Dominant
model
1.15 (1.00–1.32) 0.249/0.000 8 29,505 (25,828/36,177) 1.0 0.727 0.979 0.985 [67]
TP53 (rs1042522) 2010 Dominant
model
0.90 (0.82–0.99) 0.015/0.001 39 55,720 (26,041/29,679) 1.0 0.943 0.968 0.970 [27]
(rs17878362) 2010 Ins/Ins vs. Del/
Del
1.81 (1.30–2.52) No/0.30 9 5,310 (2,715/2,595) 0.133 0.007 0.768 0.983 [159]
TYMS (TSER) 2010 2R/2R vs. non-
2R/
non-2R
1.30 (1.10–1.53) NA/0.74 6 6,141 (2,718/3,423) 0.957 0.168 0.625 0.905 [69]
VDR (FokI) 2009 ff vs. FF 1.14 (1.03–1.27) No/0.006 13 29,880 (12,464/17,416) 1.0 0.824 0.946 0.955 [71]
WDR79
(rs2287499)
2007 GG vs. CC 1.60 (1.04–2.47) NA/0.44 2 6,059 (2,692/3,367) 0.385 0.097 0.989 0.997 [31]
(rs2287498) 2007 CT vs. CC 1.15 (1.00–1.32) NA/0.19 2 6,009 (2,655/3,354) 1.0 0.727 0.979 0.985 [31]
XRCC1
(Arg399Gln)
2009 Gln/Gln vs.
Arg/Arg
1.14 (1.01–1.29) 0.006/0.002 37 46,386 (22,481/23, 905) 1.0 0.792 0.974 0.979 [100]
For Asians
(Arg399Gln)
2009 Recessive
model
1.26 (0.96–1.64) 0.006/0.571 4 3,275 (1,573/1,702) – – – – [100]
(-77T[C) 2011 CC vs. TT 2.55 (1.11–5.86) No/No 7 6,065 (2,888/3,177) 0.106 0.038 0.996 0.999 [160]
XRCC3
(rs1799794)
2010 Dominant
model
1.09 (1.01–1.17) No/0.15 4 12,866 (6,303/6,563) 1.0 0.996 0.945 0.945 [28]
(rs1799796) 2010 GG vs. AA 0.86 (0.77–0.96) No/0.21 4 12,952 (6,270/6,682) 1.0 0.713 0.878 0.910 [28]
(rs861539) 2010 TT vs. CC 1.07 (1.01–1.14) 0.116/0.200 23 43,028 (20,791/22,237) 1.0 1.0 0.979 0.979 [161]
For Chinese
(rs861539)
2010 TT vs. CC 0.57 (0.34–0.98) NA/0.819 3 2,328 (1,216/1,112) 0.285 0.085 0.993 0.998 [161]
ZNF350 (D35D) 2006 TC vs. TT 1.10 (1.01–1.20) NA/0.09 2 2,950 (1,554/1,396) 1.0 0.975 0.969 0.970 [86]
(S472P) 2006 Ser/Pro vs.
Ser/Ser
1.24 (1.05–1.48) NA/0.01 2 5,101 (2,719/2,382) 0.983 0.358 0.946 0.980 [86]
NA not available, No significant publication bias/heterogeneity was not found
Breast Cancer Res Treat (2011) 127:309–324 313
123

The other 50 analyses reported ORs higher than 1.0,
with a mean value of 1.08 (median, 1.04; range, 1.00–1.64)
(Table S1).
Significant gene-variant breast cancer associations
in genome-wide association studies (GWASs)
By searching PubMed and checking the web site (A Cat-
alog of Genome-Wide Association Studies), eight GWASs
were identified [11, 87–93], which included 25 SNPs, with
a threshold of P values \1 9 10-5 (Table 2; Fig. 3). Of
these 25 SNPs, 14 were in 9 genes, six were near a gene or
genes, and five were intergenic. These 25 associations
reported ORs [ 1.0, with a mean value of 1.19 (median,
1.17; range, 1.04–1.43). At a prior probability level of
0.001 and statistical power to detect an OR of 1.5/1.2, 20
SNPs maintained noteworthy associations with breast
cancer (FPRP \ 0.2) (Table 2).
Discussion
We found that 31.7% of all the gene-variant breast cancer
associations from published meta-analyses and pooled
analyses were statistically significant. With continuous
progress in genotyping technologies, a large number of
genetic variants can be tested. Therefore, many false-
positive results are likely to be published due to the widely
used significance threshold of P \ 0.05. Therefore, we also
used FPRP methodology, as did Dong et al. in their sys-
tematic review. FPRP is based not only on the observed
P value but also on both the power and the prior probability
of the hypothesis. By using this method, we can integrate
the prior knowledge of the tested variants [13]. Thomas and
Clayton [94] suggested that the prior probability will usu-
ally exceed 0.001. Thus, at a prior probability of 0.001,
only 10 of the associations were noteworthy, and these 10
may be true associations.
CASP8CCND1CHEK2CTLA4CYP19ERCC2ESR1ESR1ESR2FGFR2FGFR2FGFR2GSTM1GSTT1HER2HRASIGFBP3IL1BLSP1MAP3K1MDM2MMP-2MTHFRNBS1NBS1NOS3NOS3PORRAD51SULT1A1TGFB1TNFTNRC9TP53TP53TYMSVDRWDR79WDR79XRCC1XRCC1XRCC3XRCC3XRCC3ZNF350ZNF350
Gene
D302HG870A*1100delC+49G > A(TTTA)10Lys751Glnrs2234693rs1801132rs4986938rs2981582rs1219648rs2420946null/presentnull/presentIle655Valrare allelesA-202Crs1143627rs3817198rs889312SNP309-1306 C/TC667T657del58360G>C894 G>T-786T>CGly5Gly135G>CR213Hrs1982073rs1800629rs3803662rs1042522rs17878362TSERFokIrs2287499rs2287498Arg399Gln-77T>Crs1799794rs1799796rs861539D35DS472P
Polymorphism
2010201020082010201020102010201020102010201020102010201020101997201020102010201020102010201020062010201020102007201020102010200920102010201020102009200720072009201020102010201020062006
Year
39,10921,08236,90924,45216,10429,89726,92012,50526,85891,89058,90315,32946,28136,58424,0421,63178,8112,70833,92059,97725,9793,24338,8682,40610,1179,5073,3261,91526,44423,44547,81723,09529,50555,7205,3106,14129,8806,0596,00946,3861,99912,86612,95243,0282,9505,101
Subjects
0.87 (0.82, 0.92)1.09 (1.01, 1.18)2.40 (1.80, 3.20)1.24 (1.16, 1.32)1.52 (1.12, 2.06)1.13 (1.03, 1.24)0.95 (0.90, 1.00)0.92 (0.85, 0.99)0.94 (0.89, 0.99)1.48 (1.36, 1.61)1.50 (1.36, 1.65)1.52 (1.38, 1.68)1.10 (1.04, 1.16)1.11 (1.03, 1.20)1.10 (1.01, 1.20)2.70 (2.14, 3.40)1.06 (1.01, 1.11)1.40 (1.17, 1.67)1.06 (1.04, 1.08)1.10 (1.07, 1.13)1.06 (1.00, 1.12)1.27 (1.10, 1.47)1.12 (1.01, 1.24)3.13 (1.40, 7.00)0.75 (0.57, 0.98)1.29 (1.07, 1.56)0.66 (0.46, 0.94)1.58 (1.04, 2.41)1.35 (1.05, 1.74)1.13 (1.01, 1.26)1.05 (1.00, 1.10)1.10 (1.03, 1.17)1.15 (1.00, 1.32)0.90 (0.82, 0.99)1.81 (1.30, 2.52)1.30 (1.10, 1.53)1.14 (1.02, 1.27)1.60 (1.04, 2.47)1.15 (1.00, 1.32)1.14 (1.01, 1.29)2.55 (1.11, 5.86)1.09 (1.02, 1.17)0.86 (0.77, 0.96)1.07 (1.00, 1.14)1.10 (1.01, 1.20)1.24 (1.04, 1.48)
ratio (95% CI)Odds
1.2 1 1.5
Fig. 2 Risk of breast cancer
and genetic variants, as
evaluated in meta-analyses and
pooled analyses with significant
summary risk estimates
314 Breast Cancer Res Treat (2011) 127:309–324
123
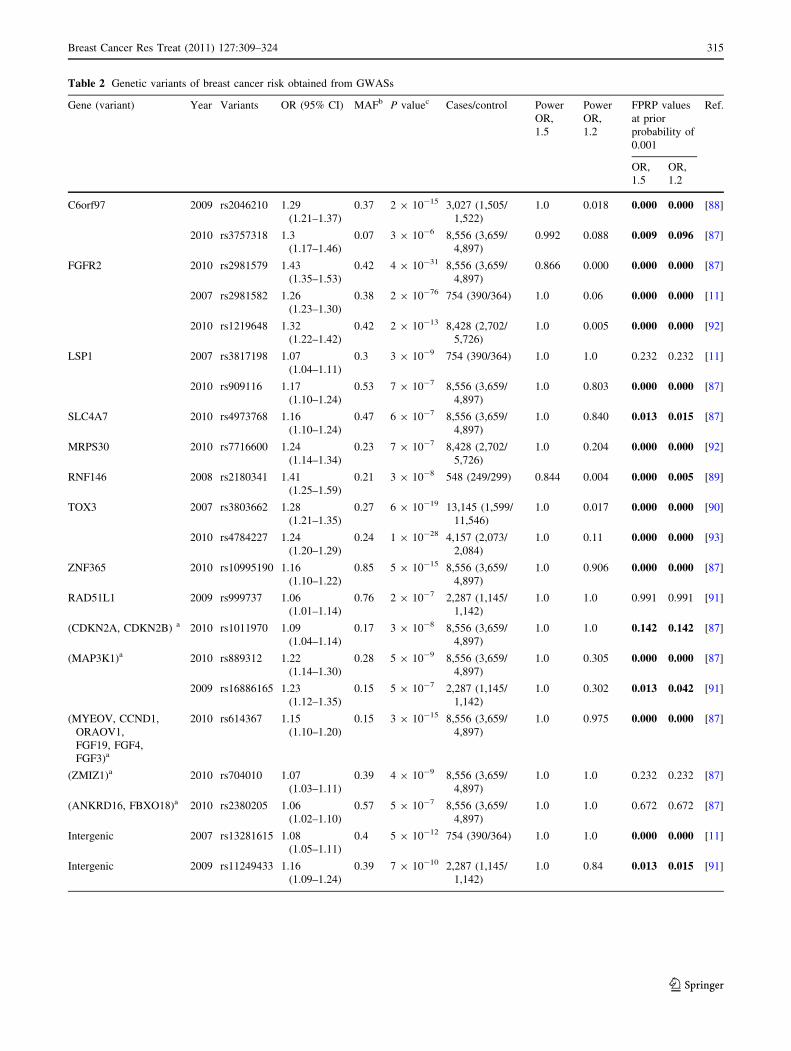
Table 2 Genetic variants of breast cancer risk obtained from GWASs
Gene (variant) Year Variants OR (95% CI) MAFb P valuec Cases/control Power
OR,
1.5
Power
OR,
1.2
FPRP values
at prior
probability of
0.001
Ref.
OR,
1.5
OR,
1.2
C6orf97 2009 rs2046210 1.29
(1.21–1.37)
0.37 2 9 10-15 3,027 (1,505/
1,522)
1.0 0.018 0.000 0.000 [88]
2010 rs3757318 1.3
(1.17–1.46)
0.07 3 9 10-6 8,556 (3,659/
4,897)
0.992 0.088 0.009 0.096 [87]
FGFR2 2010 rs2981579 1.43
(1.35–1.53)
0.42 4 9 10-31 8,556 (3,659/
4,897)
0.866 0.000 0.000 0.000 [87]
2007 rs2981582 1.26
(1.23–1.30)
0.38 2 9 10-76 754 (390/364) 1.0 0.06 0.000 0.000 [11]
2010 rs1219648 1.32
(1.22–1.42)
0.42 2 9 10-13 8,428 (2,702/
5,726)
1.0 0.005 0.000 0.000 [92]
LSP1 2007 rs3817198 1.07
(1.04–1.11)
0.3 3 9 10-9 754 (390/364) 1.0 1.0 0.232 0.232 [11]
2010 rs909116 1.17
(1.10–1.24)
0.53 7 9 10-7 8,556 (3,659/
4,897)
1.0 0.803 0.000 0.000 [87]
SLC4A7 2010 rs4973768 1.16
(1.10–1.24)
0.47 6 9 10-7 8,556 (3,659/
4,897)
1.0 0.840 0.013 0.015 [87]
MRPS30 2010 rs7716600 1.24
(1.14–1.34)
0.23 7 9 10-7 8,428 (2,702/
5,726)
1.0 0.204 0.000 0.000 [92]
RNF146 2008 rs2180341 1.41
(1.25–1.59)
0.21 3 9 10-8 548 (249/299) 0.844 0.004 0.000 0.005 [89]
TOX3 2007 rs3803662 1.28
(1.21–1.35)
0.27 6 9 10-19 13,145 (1,599/
11,546)
1.0 0.017 0.000 0.000 [90]
2010 rs4784227 1.24
(1.20–1.29)
0.24 1 9 10-28 4,157 (2,073/
2,084)
1.0 0.11 0.000 0.000 [93]
ZNF365 2010 rs10995190 1.16
(1.10–1.22)
0.85 5 9 10-15 8,556 (3,659/
4,897)
1.0 0.906 0.000 0.000 [87]
RAD51L1 2009 rs999737 1.06
(1.01–1.14)
0.76 2 9 10-7 2,287 (1,145/
1,142)
1.0 1.0 0.991 0.991 [91]
(CDKN2A, CDKN2B) a 2010 rs1011970 1.09
(1.04–1.14)
0.17 3 9 10-8 8,556 (3,659/
4,897)
1.0 1.0 0.142 0.142 [87]
(MAP3K1)a 2010 rs889312 1.22
(1.14–1.30)
0.28 5 9 10-9 8,556 (3,659/
4,897)
1.0 0.305 0.000 0.000 [87]
2009 rs16886165 1.23
(1.12–1.35)
0.15 5 9 10-7 2,287 (1,145/
1,142)
1.0 0.302 0.013 0.042 [91]
(MYEOV, CCND1,
ORAOV1,
FGF19, FGF4,
FGF3)a
2010 rs614367 1.15
(1.10–1.20)
0.15 3 9 10-15 8,556 (3,659/
4,897)
1.0 0.975 0.000 0.000 [87]
(ZMIZ1)a 2010 rs704010 1.07
(1.03–1.11)
0.39 4 9 10-9 8,556 (3,659/
4,897)
1.0 1.0 0.232 0.232 [87]
(ANKRD16, FBXO18)a 2010 rs2380205 1.06
(1.02–1.10)
0.57 5 9 10-7 8,556 (3,659/
4,897)
1.0 1.0 0.672 0.672 [87]
Intergenic 2007 rs13281615 1.08
(1.05–1.11)
0.4 5 9 10-12 754 (390/364) 1.0 1.0 0.000 0.000 [11]
Intergenic 2009 rs11249433 1.16
(1.09–1.24)
0.39 7 9 10-10 2,287 (1,145/
1,142)
1.0 0.84 0.013 0.015 [91]
Breast Cancer Res Treat (2011) 127:309–324 315
123

In the review by Dong et al. [13], only 20 variants (in 20
genes) were reported to have significant associations with
breast cancer risk, and only three of the 20, were consid-
ered noteworthy. However, we found 46 significant asso-
ciations between the variants and breast cancer risk. Of
these 46 associations, 10 were noteworthy at a prior
probability of 0.001 and statistical power to detect an OR
of 1.5. Interestingly, 10 variants, which were reported to be
significantly associated with breast cancer risk in the
review by Dong et al., were not significantly associated
with breast cancer risk in the more recent meta-analyses (or
pooled analyses); these were ATP1B2 (-8852T?C),
COMT (Met108/158Val), CYP17 (rs4919687), CYP17
(rs4919682), CYP1A1 (A2455G), CYP1B1 (Leu432Val),
GATA3 (rs570613), PGR (PR, PROGINS), PTGS2
(Ex10?837), and TGFBR1 (*6A). Only 10 variants were
still reported to be significantly associated with breast cancer
risk based on the updated data (from novel meta-analyses or
pooled analyses); these were CASP8 (D302H) [22], CHEK2
(*1100delC) [95], CYP19 ((TTTA)10) [42], IGFBP3 (A-
202C) [96], NBS1 (657del5) [97], POR (Gly5Gly) [98],
TGFB1 (Leu10Pro) [99], WDR79 (Arg68Gly and Phe150-
Phe) [31], and XRCC1 (Arg399Gln) [100]. In addition,
another 36 polymorphisms (in 28 genes) that were signifi-
cantly associated with breast cancer risk in recent meta-
analyses or pooled analyses were added (Table 1). The
reasons for the discrepancies between results from recent
meta- and pooled analyses and previous published results
can be described as follows: (1) as technology advances,
fewer and fewer genotype errors in the subsequent individual
studies were produced; (2) with the lapse of time, the sample
sizes in the individual studies are increasing, with results of
higher power than that of previous studies; and (3) the sample
sizes in recent meta- and pooled analyses are bigger than
those of previous meta- and pooled analyses. Therefore, the
recent results are more plausible statistically than previous
results.
Recently, results from GWASs on breast cancer have
become available. In those studies, 25 SNPs (Table 2) were
significantly associated with breast cancer in eight
GWASs. Interestingly, in the eight GWASs, only three
SNPs overlapped with previous association studies, two in
FGFR2 (rs1219648 and rs2981582) and one in LSP1
(rs3817198).
Different genetic associations between polymorphisms
and breast cancer risk in various ethnic groups have been
found for many genetic variants. For example, statistically
significant associations were found between GSTT1 (null/
present), SULT1A1 (R213H), and XRCC1 (Arg399Gln)
and breast cancer risk in the overall population, but in
Asians, only non-significant associations were found
(Table 1). In particular, XRCC3 (rs861539) was signifi-
cantly associated with breast cancer in the overall popu-
lation (OR: 1.07, CI: 1.01–1.14), but an inverse (protective)
association was found in the Chinese population (OR: 0.57,
CI: 0.34–0.98) (Table 1). AURKA (T91a), ASP8 (-652
6N del), ERCC2 (Asp312Asn), HSD17B1 (Ser312Gly),
and MTR (A2756G) were not statistically associated with
breast cancer risk in overall population effects. However,
significant protective associations were found in Asians
(AURKA and ERCC2), Chinese (ASP8), Caucasians
(HSD17B1), and Europeans (MTR) (Table S1). In contrast,
CYP1A1 (A2455G), GSTP1 (Ile105Val), and MDM2
(SNP309) were not found to be significantly associated
with breast cancer risk, but significant associations were
found between breast cancer and CYP1A1 (A2455G),
GSTP1 (Ile105Val), and MTR (A2756G) in Caucasians,
Chinese, and European populations (with ORs and CI: 2.08
(1.19–3.61), 1.27 (1.01–1.61), and 0.90 (0.82–0.97)),
respectively.
Table 2 continued
Gene (variant) Year Variants OR (95% CI) MAFb P valuec Cases/control Power
OR,
1.5
Power
OR,
1.2
FPRP values
at prior
probability of
0.001
Ref.
OR,
1.5
OR,
1.2
Intergenic 2007 rs13387042 1.2
(1.14–1.26)
0.5 1 9 10-13 13,145 (1,599/
11,546)
1.0 0.50 0.000 0.000 [90]
Intergenic 2007 rs981782 1.04
(1.01–1.08)
0.53 9 9 10-6 754 (390/364) 1.0 1.0 0.977 0.977 [11]
Intergenic 2010 rs1562430 1.17
(1.10–1.25)
0.58 6 9 10-7 8,556 (3,659/
4,897)
1.0 0.773 0.003 0.004 [87]
a The SNP is near the gene/genes in bracketsb Minor Allele Frequency (MAF) in Controlsc The P values are all less than 1 9 10-5
316 Breast Cancer Res Treat (2011) 127:309–324
123

With regard to the 46 variants with statistically signifi-
cant associations, inconsistent results were reported in
many studies of the contribution of genetic polymorphisms
to breast cancer risk, e.g., of the 29 studies of TP53 (codon
72) concerning European populations, 13 ORs were greater
than 1.0 and 16 ORs were less than 1.0 [27]. In this case,
further studies are needed to clarify the contribution of
TP53 (codon 72) to breast cancer risk. From this perspec-
tive, further studies are also needed to clarify the associa-
tions between some other variants and breast cancer risk
due to many inconsistent results reported, including GSTT1
(null/present), HER2 (Ile655Val), MDM2 (SNP309),
MTHFR (C667T), RAD51 (135G[C), SULT1A1 (R213H),
TNF (rs1800629), TP53 (rs1042522 and rs17878362), VDR
(FokI), XRCC1 (Arg399Gln), and XRCC3 (rs861539).
CASP8, which was identified as noteworthy, belongs to
many key pathways, including p53 signaling, apoptosis,
and cancer [101]. CASP8 plays a important role in apop-
tosis [102]. The decreased risk for breast cancer with
CASP8 Asp302His was revealed in the pooled analysis and
has been replicated in a recent association study [103]. This
finding was also addressed in a recent meta-analysis [22].
CHEK2, located on chr22 and identified in our review as
being noteworthy at an OR of 1.5, is associated with DNA
repair, the cell cycle pathway and the p53 signaling pathway
[101]. It was reported that the protein encoded by CHEK2 is
a cell-cycle checkpoint regulator. And this protein is a
putative tumor suppressor containing a forkhead-associated
protein interaction domain, which is essential for activation
in response to DNA damage [104, 105]. When activated, the
CHEK2 protein inhibits CDC25C phosphatase, preventing
entry into mitosis, and also stabilizes the tumor suppressor
protein p53. Furthermore, the protein encoded by CHEK2
interacts with and phosphorylates BRCA1 [106].
CTLA4 is a member of the immunoglobulin super-
family, and this gene encodes a protein transmitting an
inhibitory signal to T cells. CTLA4 in humans maps to
chromosome 2q33 [107]. Schneider et al. concluded that
CTLA4 increases T-cell motility and overrides the T-cell
receptor-induced stop signal required for stable conjugate
formation between T cells and antigen-presenting cells
[108]. A series of SNPs were discovered by Ueda et al.
[109]. The polymorphisms in CTLA4 were tested by
Zhernakova et al. for association with type I diabetes [110].
The FGFR2 (fibroblast growth factor receptor 2) gene is
located on chromosome 10q26 and contains at least 22
exons [111]. FGFR2 is involved in the MAPK signaling
pathway, the endocytosis pathway, regulation of the actin
cytoskeleton pathway, pathways in cancer, and the prostate
cancer pathway [101]. The protein encoded by FGFR2 is a
member of the fibroblast growth factor receptor family,
which contributes to cell growth, invasiveness, motility,
and angiogenesis [112]. FGFR2 is over-expressed in both
breast cancer cell lines [113] and breast tumor tissues
[114]. Koziczak et al. identified the mechanism by which
FGFR promotes the proliferation of breast cancer cells
[115]. Moffa and Ethier concluded that aberrant expression
of FGFR2 in breast cancer cells results in sustained
C6orf97C6orf97FGFR2FGFR2FGFR2LSP1LSP1SLC4A7MRPS30RNF146TOX3TOX3ZNF365RAD51L1(CDKN2A,CDKN2B)(MAP3K1)(MAP3K1)(MYEOV,CCND1...)(ZMIZ1)(ANKRD16,FBXO18)IntergenicIntergenicIntergenicIntergenicIntergenic
Gene
rs2046210rs3757318rs2981579rs2981582rs1219648rs3817198rs909116rs4973768rs7716600rs2180341rs3803662rs4784227rs10995190rs999737rs1011970rs889312rs16886165rs614367rs704010rs2380205rs13281615rs11249433rs13387042rs981782rs1562430
Polymorphism
2009201020102007201020072010201020102008200720102010200920102010200920102010201020072009200720072010
Year
3,0278,5568,5567548,4287548,5568,5568,42854813,1454,1578,5562,2878,5568,5562,2878,5568,5568,5567542,28713,1457548,556
Subjects
1.29 (1.21, 1.37)1.30 (1.16, 1.46)1.43 (1.34, 1.53)1.26 (1.22, 1.30)1.32 (1.23, 1.42)1.07 (1.03, 1.11)1.17 (1.10, 1.24)1.16 (1.09, 1.24)1.24 (1.15, 1.34)1.41 (1.25, 1.59)1.28 (1.21, 1.35)1.24 (1.19, 1.29)1.16 (1.10, 1.22)1.06 (0.99, 1.14)1.09 (1.04, 1.14)1.22 (1.14, 1.30)1.23 (1.12, 1.35)1.15 (1.10, 1.20)1.07 (1.03, 1.11)1.06 (1.02, 1.10)1.08 (1.05, 1.11)1.16 (1.09, 1.24)1.20 (1.14, 1.26)1.04 (1.00, 1.08)1.17 (1.10, 1.25)
ratio (95% CI)Odds
1.2 1 1.5
Fig. 3 Risk of breast cancer
and genetic variants, as
evaluated in GWAS studies
Breast Cancer Res Treat (2011) 127:309–324 317
123

activation of signal transduction leading to transformation
[116].
HRAS was an additional variant identified in our review
as being noteworthy. HRAS is located on chromosome
11p15.5 and belongs to the Ras oncogene family. The
proteins encoded by these genes were reported to function
in signal transduction pathways. Defects in this gene are
implicated in many cancers, such as bladder cancer, fol-
licular thyroid cancer, and oral squamous cell carcinoma
[117, 118].
The IL1B (IL-1beta) protein, located at 5q11.2, is a
member of the interleukin 1 cytokine family [119]. This
cytokine is a pivotal mediator of the inflammatory
response, and it is involved in cell proliferation, differen-
tiation, and apoptosis. Microenvironmental IL1B and
IL1-alpha are required for the in vivo angiogenesis and
invasiveness of different tumor cells [120]. Furthermore,
antiangiogenic effects of IL1RN were reported, suggesting
a possible therapeutic role in cancer. Ben-Sasson et al.
[121] reported that IL1B signaling in T cells markedly
induces robust and durable primary and secondary CD4
responses.
LSP1 was mapped to 11p15.5 by May et al. [122] They
reported that LSP1 is an intracellular Ca2?- and F-actin
binding protein. Liu et al. [123] reported that LSP1
expressed in endothelium regulates neutrophil transendo-
thelial migration. Interestingly, the association between
rs3817198 (in LSP1) and breast cancer risk was noteworthy
in the genetic association studies but not noteworthy in the
GWAS. This finding may be due to the fact that to obtain
higher statistical power, the smaller the effect size is, the
bigger the sample size we required. With a small sample
size (390 cases and 364 controls) and a small OR: 1.07
(1.04–1.11) in the GWAS, the statistical power may be
small. Whereas with a bigger sample size (33,920 cases
and 35,671 controls) and a small OR: 1.06 (1.04–1.08) in
the genetic association studies, clearly, the statistical power
may be bigger than that in the GWAS. Thus, we think that
the noteworthy association between rs3817198 and breast
cancer is plausible.
MAP3K1, located at 5q11.2, is a serine/threonine
kinase. This kinase plays a key role in a network of
phosphorylating enzymes integrating cellular responses to
a number of mitogenic and metabolic stimuli [124]. Lu
et al. reported that MAP3K1 is an upstream activator of
ERK and JNK, and MAP3K1 is also an E3 ligase through
its PHD domain [125]. Roy et al. [126] demonstrated that
IFNG induces MEKK1 to up-regulate cellular responses.
C6orf97 is located at 6q25.1. The function of this gene
and its encoded protein is not known. Several GWASs have
suggested that the region around this gene is involved in
breast cancer [87, 88] and bone mineral density [127], but
no link to this specific gene has been found.
SLC4A7 is located on 3p22 [128]. Reiners et al. [129]
demonstrated that SLC4A7 and the USH2 (Usher syn-
drome 2A) proteins are partners in the supramolecular USH
protein network in the retina and inner ear. The visual and
auditory systems require H? disposal, which is mediated
by the sodium bicarbonate cotransporter NBC3 that is
encoded by the SLC4A7 gene [130].
MRPS30, located on 5p12-q11, is one of more than 70
protein components of mitochondrial ribosomes that are
encoded by the nuclear genome [131]. MRPS30 orthologs
were identified by Koc et al. in mouse, Drosophila, and
C. elegans but not in yeast or E. coli [132].
RNF146 is located on 6q22.1-q22.33 and contains 5
exons. It is up-regulated in the inferior temporal lobes of
Alzheimer disease patients compared with healthy controls
[133].
TOX3, located on 16q12.1 [90], belongs to the large and
diverse family of HMG-box proteins [134]. TOX3 is dif-
ferentially expressed in patients who experienced breast
cancer relapse to bone versus those patients who experi-
enced relapse elsewhere in the body [135]. Antoniou et al.
found that rs3803662 in TOX3 has multiplicative effects
on breast cancer risk in BRCA1 or BRCA2 mutation car-
riers [136].
The ZNF365 gene is located on 10q21.2 and contains 15
exons spanning approximately 300 kb. This gene has a
complex pattern of alternative splicing and transcriptional
start sites [137]. Wang et al. [138] found that ZNF365A
localizes to the centrosome throughout the cell cycle in
several human cell lines. A mutation analysis demonstrated
that the centrosomal localization of ZNF365A requires 2
coiled-coil subdomains but not the C-terminal zinc finger
structure. Over-expression of ZNF365A leads to abnormal
mitosis. A mutant form of ZNF365A lacking the C-termi-
nal region disruptes the localization of gamma-tubulin to
the centrosome.
As for the 99 variants with non-significant association
results, further studies are also needed to clarify the asso-
ciations with breast cancer risk, especially for those variants
with inconsistent results across different populations,
including AURKA (T91a), CYP1A1 (A2455G), ERCC2
(Asp312Asn), GSTP1 (Ile105Val), HSD17B1 (Ser312Gly),
MDM2 (SNP309), MTR (A2756G), and PGR (rs10895068).
We found 46 statistically significant associations
between gene variants and breast cancer, of which 10
(in eight genes) were considered noteworthy at a prior
probability of 0.001, and 99 statistically non-significant
gene-variant breast cancer associations. In addition, 25
statistically significant gene-variant breast cancer associa-
tions were reported in the GWASs, but only three SNPs
(rs2981582 and rs1219648 in FGFR2 and rs3817198 in
LSP1) were significantly associated with breast cancer risk
in both genetic association studies and GWASs, suggesting
318 Breast Cancer Res Treat (2011) 127:309–324
123

that the capacity of GWASs to detect disease susceptibility
genes is limited. To clarify the contribution of genetic
variants to breast cancer risk in different populations, fur-
ther studies are needed with large sample sizes and better
study design.
There are some limitations in this review, such as (1) the
associations were confined to those summarized in meta-
analyses, pooled analyses, and GWASs. Some individual
studies with larger sample sizes may have been missed, and
may possess more power to find significant associations
than some meta-analyses, pooled analyses, and GWASs;
(2) in the individual meta-analysis, the publication bias was
always addressed by the funnel plot and Egger’s tests. But
it is argued that the funnel plot can be misleading and
Egger’s test does not really test publication bias [139].
Actually, some studies with results of non-significant
associations tend to not be published. Furthermore, to
address the publication bias issue effectively in this review
was not realistic. Therefore, to some extent, the file drawer
problem may inevitably arise. In this case, even a small
number of studies lost ‘‘in the file drawer’’ can result in a
significant bias.
Undoubtedly, genetic association studies have been
helpful in the discovery of genetic susceptibility genes. In
particular, with the help of GWASs, many susceptibility
genes of several diseases have been confirmed. However,
several deficiencies of genetic association studies (or
GWASs) were observed, including their high cost and a
poor capacity to detect genetic susceptibility genes. Per-
haps the GWAS era will gradually wane, and with the
advance in technologies and price reductions, next-gener-
ation sequencing can open a new era in the discovery of
genetic susceptibility disease genes [140–144].
In summary, in this review of genetic association stud-
ies, 31.7% of the gene-variant breast cancer associations
were significant, and 21.7% of these significant associa-
tions were noteworthy. However, in GWASs, 80% of the
significant associations were noteworthy.
Acknowledgments This study was supported by The ‘‘Eleventh
Five-Year’’ Science and Technology Support Plan of the Ministry of
Science and Technology of China (MSTC, 2009BA180B00) and a
grant from the Natural Science Foundation of Zhejiang Province
(NSFZJ, Y2090081). We thank Dr. Iain Bruce for valuable comments
and English editing.
Conflict of interest None.
References
1. Parkin DM, Bray F, Ferlay J, Pisani P (2005) Global cancer
statistics, 2002. Cancer J Clin 55:74–108
2. Jemal A, Siegel R, Ward E, Hao YP, Xu JQ et al (2008) Cancer
statistics, 2008. Cancer J Clin 58:71–96. doi:10.3322/ca.2007.
0010
3. Pharoah PDP, Dunning AM, Ponder BAJ, Easton DF (2004)
Association studies for finding cancer-susceptibility genetic
variants. Nat Rev Cancer 4:850–860. doi:10.1038/nrc1476
4. Thompson D, Easton D (2004) The genetic epidemiology of
breast cancer genes. J Mammary Gland Biol Neoplasia 9:
221–236
5. Oldenburg RA, Meijers-Heijboer H, Cornelisse CJ, Devilee P
(2007) Genetic susceptibility for breast cancer: how many more
genes to be found? Crit Rev Oncol Hematol 63:125–149. doi:
10.1016/j.critrevonc.2006.12.004
6. Ioannidis JPA, Ntzani EE, Trikalinos TA, Contopoulos-Ioanni-
dis DG (2001) Replication validity of genetic association stud-
ies. Nat Genet 29:306–309
7. Burton PR, Hansell AL, Fortier I, Manolio TA, Khoury MJ et al
(2009) Size matters: just how big is BIG? Quantifying realistic
sample size requirements for human genome epidemiology. Int J
Epidemiol 38:263–273. doi:10.1093/Ije/Dyn147
8. Gordon D, Finch SJ (2005) Factors affecting statistical power in
the detection of genetic association. J Clin Invest 115:1408–1418
9. Glass GV (1976) Primary, secondary and meta-analysis of
research. Educ Res 5:3–8. doi:10.3102/0013189X005010003
10. Blettner M, Sauerbrei W, Schlehofer B, Scheuchenpflug T,
Friedenreich C (1999) Traditional reviews, meta-analyses and
pooled analyses in epidemiology. Int J Epidemiol 28:1–9
11. Easton DF, Pooley KA, Dunning AM, Pharoah PD, Thompson
D et al (2007) Genome-wide association study identifies novel
breast cancer susceptibility loci. Nature 447:1087–1093. doi:
10.1038/nature05887
12. Dunning AM, Healey CS, Pharoah PDP, Teare MD, Ponder BAJ
et al (1999) A systematic review of genetic polymorphisms
and breast cancer risk. Cancer Epidemiol Biomarkers Prev
8:843–854
13. Dong LM, Potter JD, White E, Ulrich CM, Cardon LR et al
(2008) Genetic susceptibility to cancer—the role of polymor-
phisms in candidate genes. JAMA 299:2423–2436
14. Wang WYS, Barratt BJ, Clayton DG, Todd JA (2005) Genome-
wide association studies: theoretical and practical concerns. Nat
Rev Genet 6:109–118. doi:10.1038/nrg1522
15. Hirschhorn JN, Daly MJ (2005) Genome-wide association
studies for common diseases and complex traits. Nat Rev Genet
6:95–108. doi:10.1038/nrg1521
16. McCarthy MI, Abecasis GR, Cardon LR, Goldstein DB, Little J
et al (2008) Genome-wide association studies for complex traits:
consensus, uncertainty and challenges. Nat Rev Genet 9:
356–369. doi:10.1038/nrg2344
17. Hindorff LA, Sethupathy P, Junkins HA, Ramos EM, Mehta JP
et al (2009) Potential etiologic and functional implications of
genome-wide association loci for human diseases and traits.
Proc Natl Acad Sci USA 106:9362–9367. doi:10.1073/pnas.
0903103106
18. Hindorff LA, Junkins HA, Hall PN, Mehta JP, Manolio TA. A
catalog of published genome-wide association studies. Available
at: www.genome.gov/gwastudies
19. Cochran WG (1954) The combination of estimates from dif-
ferent experiments. Biometrics 10:101–129
20. Egger M, Smith GD, Schneider M, Minder C (1997) Bias in
meta-analysis detected by a simple, graphical test. Br Med J
315:629–634
21. Wacholder S, Chanock S, Garcia-Closas M, El ghormli L,
Rothman N (2004) Assessing the probability that a positive
report is false: an approach for molecular epidemiology studies.
J Natl Cancer Inst 96:434–442. doi:10.1093/jnci/djh075
22. Sergentanis TN, Economopoulos KP (2010) Association of two
CASP8 polymorphisms with breast cancer risk: a meta-analysis.
Breast Cancer Res Treat 120:229–234. doi:10.1007/s10549-
009-0471-5
Breast Cancer Res Treat (2011) 127:309–324 319
123

23. Li N, Dong J, Hu Z, Shen H, Dai M (2010) Potentially func-
tional polymorphisms in ESR1 and breast cancer risk: a meta-
analysis. Breast Cancer Res Treat 121:177–184. doi:10.1007/
s10549-009-0532-9
24. Yu KD, Rao NY, Chen AX, Fan L, Yang C et al (2011) A
systematic review of the relationship between polymorphic sites
in the estrogen receptor-beta (ESR2) gene and breast cancer risk.
Breast Cancer Res Treat 126:37–45. doi:10.1007/s10549-010-
0891-2
25. Wang Z, Cui D, Lu W (2010) NBS1 8360G[C polymorphism is
associated with breast cancer risk: a meta-analysis. Breast
Cancer Res Treat 123:557–561. doi:10.1007/s10549-010-0772-8
26. Yao L, Fang F, Zhong Y, Yu L (2010) The association between
two polymorphisms of eNOS and breast cancer risk: a meta-
analysis. Breast Cancer Res Treat 124:223–227. doi:10.1007/
s10549-010-0800-8
27. Zhang Z, Wang M, Wu D, Tong N, Tian Y (2010) P53 codon 72
polymorphism contributes to breast cancer risk: a meta-analysis
based on 39 case-control studies. Breast Cancer Res Treat
120:509–517. doi:10.1007/s10549-009-0480-4
28. Qiu LX, Mao C, Yao L, Yu KD, Zhan P et al (2010) XRCC3 50-UTR and IVS5-14 polymorphisms and breast cancer suscepti-
bility: a meta-analysis. Breast Cancer Res Treat 122:489–493.
doi:10.1007/s10549-009-0726-1
29. Lu PH, Wei MX, Yang J, Liu X, Tao GQ et al (2011) Associ-
ation between two polymorphisms of ABCB1 and breast cancer
risk in the current studies: a meta-analysis. Breast Cancer Res
Treat 125:537–543. doi:10.1007/s10549-010-1033-6
30. The Breast Cancer Association Consortium (2006) Commonly
studied single-nucleotide polymorphisms and breast cancer:
results from the Breast Cancer Association Consortium. J Natl
Cancer Inst 98:1382–1396. doi:10.1093/jnci/djj374
31. Garcia-Closas M, Kristensen V, Langerod A, Qi Y, Yeager M
et al (2007) Common genetic variation in TP53 and its flanking
genes, WDR79 and ATP1B2, and susceptibility to breast cancer.
Int J Cancer 121:2532–2538. doi:10.1002/ijc.22985
32. Hao YJ, Montiel R, Li BH, Huang EY, Zeng LW et al (2010)
Association between androgen receptor gene CAG repeat poly-
morphism and breast cancer risk: a meta-analysis. Breast Cancer
Res Treat 124:815–820. doi:10.1007/s10549-010-0907-y
33. Ding H, Mao C, Li SM, Liu Q, Lin L et al (2011) Lack of
association between ATM C.1066-6T[G mutation and breast
cancer risk: a meta-analysis of 8,831 cases and 4,957 controls.
Breast Cancer Res Treat 125:473–477. doi:10.1007/s10549-010-
0977-x
34. Gao LB, Pan XM, Sun H, Wang X, Rao L et al (2010) The
association between ATM D1853N polymorphism and breast
cancer susceptibility: a meta-analysis. J Exp Clin Cancer Res 29.
doi:10.1186/1756-9966-29-117
35. Lu PH, Wei MX, Si SP, Liu X, Shen W et al (2010) Association
between polymorphisms of the ataxia telangiectasia mutated
gene and breast cancer risk: evidence from the current studies.
Breast Cancer Res Treat. doi:10.1007/s10549-010-1081-y
36. Sun HM, Bai J, Chen F, Jin Y, Yu Y et al (2011) Lack of an
association between AURKA T91A polymorphisms and breast
cancer: a meta-analysis involving 32,141 subjects. Breast Can-
cer Res Treat 125:175–179. doi:10.1007/s10549-010-0936-6
37. Gaudet MM, Milne RL, Cox A, Camp NJ, Goode EL et al
(2009) Five polymorphisms and breast cancer risk: results from
the Breast Cancer Association Consortium. Cancer Epidemiol
Biomarkers Prev 18:1610–1616. doi:10.1158/1055-9965.EPI-
08-0745
38. Qiu LX, Yao L, Xue K, Zhang JA, Mao C et al (2010) BRCA2
N372H polymorphism and breast cancer susceptibility: a meta-
analysis involving 44,903 subjects. Breast Cancer Res Treat
123:487–490. doi:10.1007/s10549-010-0767-5
39. Wang GY, Lu CQ, Zhang RM, Hu XH, Luo ZW (2008) The
E-cadherin gene polymorphism 160C?A and cancer risk: a
HuGE review and meta-analysis of 26 case-control studies. Am
J Epidemiol 167:7–14. doi:10.1093/aje/kwm264
40. Mao C, Wang XW, Qiu LX, Liao RY, Ding H et al (2010) Lack
of association between catechol-O-methyltransferase Val108/
158Met polymorphism and breast cancer risk: a meta-analysis of
25,627 cases and 34,222 controls. Breast Cancer Res Treat
121:719–725. doi:10.1007/s10549-009-0650-4
41. Yao L, Fang F, Wu Q, Yang Z, Zhong Y et al (2010) No
association between CYP17 T-34C polymorphism and breast
cancer risk: a meta-analysis involving 58,814 subjects. Breast
Cancer Res Treat 122:221–227. doi:10.1007/s10549-009-0679-4
42. Ma X, Qi X, Chen C, Lin H, Xiong H et al (2010) Association
between CYP19 polymorphisms and breast cancer risk: results
from 10,592 cases and 11,720 controls. Breast Cancer Res Treat
122:495–501. doi:10.1007/s10549-009-0693-6
43. Sergentanis TN, Economopoulos KP (2010) Four polymorphisms
in cytochrome P450 1A1 (CYP1A1) gene and breast cancer risk: a
meta-analysis. Breast Cancer Res Treat 122:459–469. doi:
10.1007/s10549-009-0694-5
44. Qiu LX, Yao L, Mao C, Yu KD, Zhan P et al (2010) Lack of
association of CYP1A2-164 A/C polymorphism with breast
cancer susceptibility: a meta-analysis involving 17,600 subjects.
Breast Cancer Res Treat 122:521–525. doi:10.1007/s10549-
009-0731-4
45. Yao L, Fang F, Wu Q, Zhong Y, Yu L (2010) No association
between CYP1B1 Val432Leu polymorphism and breast cancer
risk: a meta-analysis involving 40,303 subjects. Breast Cancer
Res Treat 122:237–242. doi:10.1007/s10549-009-0689-2
46. Economopoulos KP, Sergentanis TN (2010) Three polymor-
phisms in cytochrome P450 1B1 (CYP1B1) gene and breast
cancer risk: a meta-analysis. Breast Cancer Res Treat
122:545–551. doi:10.1007/s10549-009-0728-z
47. Pabalan N, Francisco-Pabalan O, Sung L, Jarjanazi H, Ozcelik H
(2010) Meta-analysis of two ERCC2 (XPD) polymorphisms,
Asp312Asn and Lys751Gln, in breast cancer. Breast Cancer Res
Treat 124:531–541. doi:10.1007/s10549-010-0863-6
48. Zhang Z, Xue H, Gong W, Wang M, Yuan L et al (2009) FAS
promoter polymorphisms and cancer risk: a meta-analysis based
on 34 case-control studies. Carcinogenesis 30:487–493. doi:
10.1093/carcin/bgp016
49. Liu Y, Wen QJ, Yin Y, Lu XT, Pu SH et al (2009) FASLG
polymorphism is associated with cancer risk. Eur J Cancer
45:2574–2578. doi:10.1016/j.ejca.2009.04.001
50. Garcia-Closas M, Troester MA, Qi Y, Langerod A, Yeager M
et al (2007) Common genetic variation in GATA-binding pro-
tein 3 and differential susceptibility to breast cancer by estrogen
receptor alpha tumor status. Cancer Epidemiol Biomarkers Prev
16:2269–2275. doi:10.1158/1055-9965.EPI-07-0449
51. Johnatty SE, Couch FJ, Fredericksen Z, Tarrell R, Spurdle AB
et al (2009) No evidence that GATA3 rs570613 SNP modifies
breast cancer risk. Breast Cancer Res Treat 117:371–379. doi:
10.1007/s10549-008-0257-1
52. Hu J, Zhou GW, Wang N, Wang YJ (2010) GPX1 Pro198Leu
polymorphism and breast cancer risk: a meta-analysis. Breast
Cancer Res Treat 124:425–431. doi:10.1007/s10549-010-0841-z
53. Sergentanis TN, Economopoulos KP (2010) GSTT1 and GSTP1
polymorphisms and breast cancer risk: a meta-analysis. Breast
Cancer Res Treat 121:195–202. doi:10.1007/s10549-009-0520-0
54. Zhao T, Lv J, Zhao J, Nzekebaloudou M (2009) Hypoxia-
inducible factor-1alpha gene polymorphisms and cancer risk: a
meta-analysis. J Exp Clin Cancer Res 28:159. doi:
10.1186/1756-9966-28-159
55. Yao L, Cao LH, Qiu LX, Yu L (2010) The association between
HSD17B1 Ser312Gly polymorphism and breast cancer risk: a
320 Breast Cancer Res Treat (2011) 127:309–324
123

meta-analysis including 31,053 subjects. Breast Cancer Res
Treat 123:577–580. doi:10.1007/s10549-010-0784-4
56. Chen X, Guan J, Song Y, Chen P, Zheng H et al (2008) IGF-I
(CA) repeat polymorphisms and risk of cancer: a meta-analysis.
J Hum Genet 53:227–238. doi:10.1007/s10038-007-0241-3
57. Li L, Huang X, Huo K (2010) IGFBP3 polymorphisms and risk
of cancer: a meta-analysis. Mol Biol Rep 37:127–140. doi:
10.1007/s11033-009-9552-0
58. Liu X, Wang Z, Yu J, Lei G, Wang S (2010) Three polymor-
phisms in interleukin-1beta gene and risk for breast cancer: a
meta-analysis. Breast Cancer Res Treat 124:821–825. doi:
10.1007/s10549-010-0910-3
59. Yu KD, Di GH, Fan L, Chen AX, Yang C et al (2010) Lack of
an association between a functional polymorphism in the
interleukin-6 gene promoter and breast cancer risk: a meta-
analysis involving 25,703 subjects. Breast Cancer Res Treat
122:483–488. doi:10.1007/s10549-009-0706-5
60. Yu KD, Chen AX, Yang C, Fan L, Huang AJ et al (2010) The
associations between two polymorphisms in the interleukin-10
gene promoter and breast cancer risk. Breast Cancer Res Treat.
doi:10.1007/s10549-010-1133-3
61. Zhou P, Du L, Lv G, Yu X, Gu Y et al (2010) Current evidence on
the relationship between four polymorphisms in the matrix
metalloproteinases (MMP) gene and breast cancer risk: a meta-
analysis. Breast Cancer Res Treat. doi:10.1007/s10549-010-1294-0
62. Qiu LX, Yao L, Mao C, Chen B, Zhan P et al (2010) Lack of
association between MnSOD Val16Ala polymorphism and
breast cancer risk: a meta-analysis involving 58,448 subjects.
Breast Cancer Res Treat 123:543–547. doi:10.1007/s10549-
010-0777-3
63. Chen Y, Pei J (2011) Possible risk modifications in the associ-
ation between MnSOD Ala-9Val polymorphism and breast
cancer risk: subgroup analysis and evidence-based sample size
calculation for a future trial. Breast Cancer Res Treat
125:495–504. doi:10.1007/s10549-010-0978-9
64. Qi XW, Zhang F, Yang XH, Fan LJ, Zhang Y et al (2010)
Transforming growth factor-beta 1 polymorphisms and breast
cancer risk: a meta-analysis based on 27 case-control studies.
Breast Cancer Res Treat 122:273–279. doi:10.1007/s10549-
010-0847-6
65. Colleran G, McInerney N, Rowan A, Barclay E, Jones AM et al
(2010) The TGFBR1*6A/9A polymorphism is not associated
with differential risk of breast cancer. Breast Cancer Res Treat
119:437–442. doi:10.1007/s10549-009-0395-0
66. Shen C, Sun H, Sun D, Xu L, Zhang X et al (2010) Polymor-
phisms of tumor necrosis factor-alpha and breast cancer risk: a
meta-analysis. Breast Cancer Res Treat. doi:10.1007/s10549-
010-1184-5
67. Chen MB, Wu XY, Shen W, Wei MX, Li C et al (2010)
Association between polymorphisms of trinucleotide repeat
containing 9 gene and breast cancer risk: evidence from 62,005
subjects. Breast Cancer Res Treat. doi:10.1007/s10549-010-
1114-6
68. Hu Z, Li X, Yuan R, Ring BZ, Su L (2010) Three common TP53
polymorphisms in susceptibility to breast cancer, evidence from
meta-analysis. Breast Cancer Res Treat 120:705–714. doi:
10.1007/s10549-009-0488-9
69. Wang J, Wang B, Bi J, Di J (2010) The association between two
polymorphisms in the TYMS gene and breast cancer risk: a
meta-analysis. Breast Cancer Res Treat. doi:10.1007/s10549-
010-1314-0
70. Yao L, Qiu LX, Yu L, Yang Z, Yu XJ et al (2010) The asso-
ciation between TA-repeat polymorphism in the promoter region
of UGT1A1 and breast cancer risk: a meta-analysis. Breast
Cancer Res Treat 122:879–882. doi:10.1007/s10549-010-0742-1
71. Raimondi S, Johansson H, Maisonneuve P, Gandini S (2009)
Review and meta-analysis on vitamin D receptor polymor-
phisms and cancer risk. Carcinogenesis 30:1170–1180. doi:
10.1093/carcin/bgp103
72. Qiu LX, Zhang J, Zhu XD, Zheng CL, Sun S et al (2010) The
p21 Ser31Arg polymorphism and breast cancer risk: a meta-
analysis involving 51,236 subjects. Breast Cancer Res Treat
124:475–479. doi:10.1007/s10549-010-0858-3
73. Yang DS, Sung HJ, Woo OH, Park KH, Woo SU et al (2010)
Association of a progesterone receptor gene ?331G/A poly-
morphism with breast cancer risk: a meta-analysis. Cancer
Genet Cytogenet 196:194–197. doi:10.1016/j.cancergencyto.
2009.10.005
74. Yu KD, Chen AX, Yang C, Qiu LX, Fan L et al (2010) Current
evidence on the relationship between polymorphisms in the
COX-2 gene and breast cancer risk: a meta-analysis. Breast
Cancer Res Treat 122:251–257. doi:10.1007/s10549-009-
0688-3
75. Qiu LX, Zhang J, Li WH, Zhang QL, Yu H et al (2010) Lack of
association between methylenetetrahydrofolate reductase gene
A1298C polymorphism and breast cancer susceptibility. Mol
Biol Rep. doi:10.1007/s11033-010-0361-2
76. Lu MP, Wang F, Qiu JR (2010) Methionine synthase A2756G
polymorphism and breast cancer risk: a meta-analysis involving
18,953 subjects. Breast Cancer Res Treat 123:213–217. doi:
10.1007/s10549-010-0755-9
77. Hu J, Zhou GW, Wang N, Wang YJ (2010) MTRR A66G
polymorphism and breast cancer risk: a meta-analysis. Breast
Cancer Res Treat 124:779–784. doi:10.1007/s10549-010-0892-1
78. Zhang J, Qiu LX, Wang ZH, Wang JL, He SS et al (2010) NAT2
polymorphisms combining with smoking associated with breast
cancer susceptibility: a meta-analysis. Breast Cancer Res Treat
123:877–883. doi:10.1007/s10549-010-0807-1
79. Yuan W, Xu L, Chen W, Wang L, Fu Z et al (2011) Evidence on
the association between NQO1 Pro187Ser polymorphism and
breast cancer risk in the current studies. Breast Cancer Res Treat
125:467–472
80. Gu D, Wang M, Zhang Z, Chen J (2010) Lack of association
between the hOGG1 Ser326Cys polymorphism and breast can-
cer risk: evidence from 11 case-control studies. Breast Cancer
Res Treat 122:527–531. doi:10.1007/s10549-009-0723-4
81. Tang C, Chen N, Wu M, Yuan H, Du Y (2009) Fok1 poly-
morphism of vitamin D receptor gene contributes to breast
cancer susceptibility: a meta-analysis. Breast Cancer Res Treat
117:391–399. doi:10.1007/s10549-008-0262-4
82. Qiu LX, Wang K, Yang S, Mao C, Zhao L et al (2010) Current
evidences on vascular endothelial growth factor polymorphisms
and breast cancer susceptibility. Mol Biol Rep. doi:10.1007/
s11033-010-0579-z
83. Francisco G, Menezes PR, Eluf-Neto J, Chammas R (2008) XPC
polymorphisms play a role in tissue-specific carcinogenesis: a
meta-analysis. Eur J Hum Genet 16:724–734. doi:10.1038/
ejhg.2008.6
84. Li H, Ha TC, Tai BC (2009) XRCC1 gene polymorphisms and
breast cancer risk in different populations: a meta-analysis.
Breast 18:183–191. doi:10.1016/j.breast.2009.03.008
85. Yu KD, Chen AX, Qiu LX, Fan L, Yang C et al (2010) XRCC2
Arg188His polymorphism is not directly associated with breast
cancer risk: evidence from 37,369 subjects. Breast Cancer Res
Treat 123:219–225. doi:10.1007/s10549-010-0753-y
86. Garcia-Closas M, Egan KM, Newcomb PA, Brinton LA, Titus-
Ernstoff L et al (2006) Polymorphisms in DNA double-strand
break repair genes and risk of breast cancer: two population-
based studies in USA and Poland, and meta-analyses. Hum
Genet 119:376–388. doi:10.1007/s00439-006-0135-z
Breast Cancer Res Treat (2011) 127:309–324 321
123

87. Turnbull C, Ahmed S, Morrison J, Pernet D, Renwick A et al
(2010) Genome-wide association study identifies five new breast
cancer susceptibility loci. Nat Genet 42:504–507. doi:10.1038/
ng.586
88. Zheng W, Long J, Gao YT, Li C, Zheng Y et al (2009) Genome-
wide association study identifies a new breast cancer susceptibility
locus at 6q25.1. Nat Genet 41:324–328. doi:10.1038/ng.318
89. Gold B, Kirchhoff T, Stefanov S, Lautenberger J, Viale A et al
(2008) Genome-wide association study provides evidence for a
breast cancer risk locus at 6q22 33. Proc Natl Acad Sci USA
105:4340–4345. doi:10.1073/pnas.0800441105
90. Stacey SN, Manolescu A, Sulem P, Rafnar T, Gudmundsson J
et al (2007) Common variants on chromosomes 2q35 and 16q12
confer susceptibility to estrogen receptor-positive breast cancer.
Nat Genet 39:865–869. doi:10.1038/ng2064
91. Thomas G, Jacobs KB, Kraft P, Yeager M, Wacholder S et al
(2009) A multistage genome-wide association study in breast
cancer identifies two new risk alleles at 1p11.2 and 14q24.1
(RAD51L1). Nat Genet 41:579–584. doi:10.1038/ng.353
92. Li J, Humphreys K, Heikkinen T, Aittomaki K, Blomqvist C
et al (2010) A combined analysis of genome-wide association
studies in breast cancer. Breast Cancer Res Treat. doi:10.1007/
s10549-010-1172-9
93. Long J, Cai Q, Shu XO, Qu S, Li C et al (2010) Identification of
a functional genetic variant at 16q12 1 for breast cancer risk:
results from the Asia Breast Cancer Consortium. PLoS Genet
6:e1001002. doi:10.1371/journal.pgen.1001002
94. Thomas DC, Clayton DG (2004) Betting odds and genetic
associations. J Natl Cancer Inst 96:421–423. doi:10.1093/jnci/
djh094
95. Weischer M, Bojesen SE, Ellervik C, Tybjaerg-Hansen A,
Nordestgaard BG (2008) CHEK2*1100delC genotyping for
clinical assessment of breast cancer risk: meta-analyses of
26,000 patient cases and 27,000 controls. J Clin Oncol
26:542–548. doi:10.1200/JCO.2007.12.5922
96. Qiu LX, Yao L, Yuan H, Mao C, Chen B et al (2010) IGFBP3
A-202C polymorphism and breast cancer susceptibility: a meta-
analysis involving 33,557 cases and 45,254 controls. Breast
Cancer Res Treat 122:867–871. doi:10.1007/s10549-010-0739-9
97. Steffen J, Nowakowska D, Niwinska A, Czapczak D, Kluska A
et al (2006) Germline mutations 657del5 of the NBS1 gene
contribute significantly to the incidence of breast cancer in Cen-
tral Poland. Int J Cancer 119:472–475. doi:10.1002/Ijc.21853
98. Haiman CA, Setiawan VW, Xia LY, Le Marchand L, Ingles SA
et al (2007) A variant in the cytochrome p450 oxidoreductase gene
is associated with breast cancer risk in African Americans. Cancer
Res 67:3565–3568. doi:10.1158/0008-5472.CAN-06-4801
99. Qiu LX, Yao L, Mao C, Chen B, Zhan P et al (2010) TGFB1 L10P
polymorphism is associated with breast cancer susceptibility:
evidence from a meta-analysis involving 47,817 subjects. Breast
Cancer Res Treat 123:563–567. doi:10.1007/s10549-010-0781-7
100. Huang Y, Li L, Yu L (2009) XRCC1 Arg399Gln, Arg194Trp
and Arg280His polymorphisms in breast cancer risk: a meta-
analysis. Mutagenesis 24:331–339. doi:10.1093/mutage/gep013
101. KEGG: http://www.genome.jp/kegg/pathway.html
102. Grenet J, Teitz T, Wei T, Valentine V, Kidd VJ (1999) Structure
and chromosome localization of the human CASP8 gene. Gene
226:225–232
103. Sigurdson AJ, Bhatti P, Doody MM, Hauptmann M, Bowen L et al
(2007) Polymorphisms in apoptosis- and proliferation-related
genes, ionizing radiation exposure, and risk of breast cancer among
US radiologic technologists. Cancer Epidemiol Biomarkers Prev
16:2000–2007. doi:10.1158/1055-9965.Epi-07-0282
104. Peng CY, Graves PR, Thoma RS, Wu ZQ, Shaw AS et al (1997)
Mitotic and G(2) checkpoint control: regulation of 14-3-3
protein binding by phosphorylation of Cdc25C on serine-216.
Science 277:1501–1505
105. Matsuoka S, Huang MX, Elledge SJ (1998) Linkage of ATM to
cell cycle regulation by the Chk2 protein kinase. Science
282:1893–1897
106. Entrez Gene: http://www.ncbi.nlm.nih.gov/gene/11200
107. Dariavach P, Mattei MG, Golstein P, Lefranc MP (1988) Human
Ig superfamily Ctla-4 gene—chromosomal localization and
identity of protein-sequence between murine and human Ctla-4
cytoplasmic domains. Eur J Immunol 18:1901–1905
108. Schneider H, Downey J, Smith A, Zinselmeyer BH, Rush C et al
(2006) Reversal of the TCR stop signal by CTLA-4. Science
313:1972–1975. doi:10.1126/science.1131078
109. Ueda H, Howson JMM, Esposito L, Heward J, Snook H et al
(2003) Association of the T-cell regulatory gene CTLA4 with
susceptibility to autoimmune disease. Nature 423:506–511. doi:
10.1038/Nature01621
110. Zhernakova A, Eerligh P, Barrera P, Weseloy JZ, Huizinga TWJ
et al (2005) CTLA4 is differentially associated with autoim-
mune diseases in the Dutch population. Hum Genet 118:58–66.
doi:10.1007/s00439-005-0006-z
111. Ingersoll RG, Paznekas WA, Tran AK, Scott AF, Jiang G et al
(2001) Fibroblast growth factor receptor 2 (FGFR2): genomic
sequence and variations. Cytogenet Cell Genet 94:121–126
112. Ricol D, Cappellen D, El Marjou A, Gil-Diez-de-Medina S,
Girault JM et al (1999) Tumour suppressive properties of
fibroblast growth factor receptor 2-IIIb in human bladder cancer.
Oncogene 18:7234–7243
113. Tannheimer SL, Rehemtulla A, Ethier SP (2000) Characteriza-
tion of fibroblast growth factor receptor 2 overexpression in the
human breast cancer cell line SUM-52PE. Breast Cancer Res
2:311–320
114. Adnane J, Gaudray P, Dionne CA, Crumley G, Jaye M et al
(1991) BEK and FLG, two receptors to members of the FGF
family, are amplified in subsets of human breast cancers.
Oncogene 6:659–663
115. Koziczak M, Holbro T, Hynes NE (2004) Blocking of FGFR
signaling inhibits breast cancer cell proliferation through
downregulation of D-type cyclins. Oncogene 23:3501–3508.
doi:10.1038/sj.onc.1207331
116. Moffa AB, Ethier SP (2007) Differential signal transduction of
alternatively spliced FGFR2 variants expressed epithelial in
human mammary cells. J Cell Physiol 210:720–731. doi:
10.1002/Jcp.20880
117. Tamir A, Fawzi AB, Northup JK (1990) Unique guanine-
nucleotide binding-properties of the human placental Gtp-
binding protein Gp. Biochemistry 29:6947–6954
118. Sakai E, Rikimaru K, Ueda M, Matsumoto Y, Ishii N et al (1992)
The P53 tumor-suppressor gene and Ras oncogene mutations in
oral squamous-cell carcinoma. Int J Cancer 52:867–872
119. March CJ, Mosley B, Larsen A, Cerretti DP, Braedt G et al
(1985) Cloning, sequence and expression of two distinct human
interleukin-1 complementary DNAs. Nature 315:641–647
120. Voronov E, Shouval DS, Krelin Y, Cagnano E, Benharroch D
et al (2003) IL-1 is required for tumor invasiveness and angio-
genesis. Proc Natl Acad Sci USA 100:2645–2650. doi:
10.1073/pnas.0437939100
121. Ben-Sasson SZ, Hu-Li J, Quiel J, Cauchetaux S, Ratner M et al
(2009) IL-1 acts directly on CD4 T cells to enhance their anti-
gen-driven expansion and differentiation. Proc Natl Acad Sci
USA 106:7119–7124. doi:10.1073/pnas.0902745106
122. May W, Korenberg JR, Chen XN, Lunsford L, Wood WJ
et al (1993) Human lymphocyte-specific Pp52 gene is a
member of a highly conserved dispersed family. Genomics
15:515–520
322 Breast Cancer Res Treat (2011) 127:309–324
123

123. Liu LX, Cara DC, Kaur J, Raharjo E, Mullaly SC et al (2005)
LSP1 is an endothelial gatekeeper of leukocyte transendothelial
migration. J Exp Med 201:409–418. doi:10.1084/Jem.20040830
124. Vinik BS, Kay ES, Fiedorek FT (1995) Mapping of the Mek
kinase gene (Mekk) to mouse chromosome-13 and human-
chromosome-5. Mamm Genome 6:782–783
125. Lu ZM, Xu SC, Joazeiro C, Cobb MH, Hunter T (2002) The
PHD domain of MEKK1 acts as an E3 ubiquitin ligase and
mediates ubiquitination and degradation of ERK1/2. Mol Cell
9:945–956
126. Roy SK, Hu JB, Meng QJ, Xia Y, Shapiro PS et al (2002)
MEKK1 plays a critical role in activating the transcription factor
gene expression in C/EBP-beta-dependent response to IFN-
gamma. Proc Natl Acad Sci USA 99:7945–7950
127. Styrkarsdottir U, Halldorsson BV, Gretarsdottir S, Gudbjartsson
DF, Walters GB et al (2008) Multiple genetic loci for bone
mineral density and fractures. N Engl J Med 358:2355–2365
128. Pushkin A, Abuladze N, Lee I, Newman D, Hwang J et al (1999)
Cloning, tissue distribution, genomic organization, and func-
tional characterization of NBCS, a new member of the sodium
bicarbonate cotransporter family. J Biol Chem 274:16569–
16575
129. Reiners J, van Wijk E, Marker T, Zimmermann U, Jurgens K
et al (2005) Scaffold protein harmonin (USH1C) provides
molecular links between Usher syndrome type 1 and type 2.
Hum Mol Genet 14:3933–3943. doi:10.1093/Hmg/Ddi417
130. Bok D, Galbraith G, Lopez I, Woodruff M, Nusinowitz S et al
(2003) Blindness and auditory impairment caused by loss of the
sodium bicarbonate cotransporter NBC3. Nat Genet 34:313–319.
doi:10.1038/Ng1176
131. Kenmochi N, Suzuki T, Uechi T, Magoori M, Kuniba M et al
(2001) The human mitochondrial ribosomal protein genes: map-
ping of 54 genes to the chromosomes and implications for human
disorders. Genomics 77:65–70. doi:10.1006/geno.2001.6622
132. Koc EC, Burkhart W, Blackburn K, Moseley A, Spremulli LL
(2001) The small subunit of the mammalian mitochondrial
ribosome—identification of the full complement of ribosomal
proteins present. J Biol Chem 276:19363–19374
133. von Rotz RC, Kins S, Hipfel R, von der Kammer H, Nitsch RM
(2005) The novel cytosolic RING finger protein dactylidin is up-
regulated in brains of patients with Alzheimer’s disease. Eur J
Neurosci 21:1289–1298. doi:10.1111/j.1460-9568.2005.03977.x
134. O’Flaherty E, Kaye J (2003) TOX defines a conserved subfamily
of HMG-box proteins. BMC Genomics 4:13
135. Smid M, Wang YX, Klijn JGM, Sieuwerts AM, Zhang Y et al
(2006) Genes associated with breast cancer metastatic to bone.
J Clin Oncol 24:2261–2267. doi:10.1200/Jco.2005.03.8802
136. Antoniou AC, Spurdle AB, Sinilnikova OM, Healey S, Pooley
KA et al (2008) Common breast cancer-predisposition alleles
are associated with breast cancer risk in BRCA1 and BRCA2
mutation carriers. Am J Hum Genet 82:937–948. doi:10.1016/
j.ajhg.2008.02.008
137. Gianfrancesco F, Esposito T, Ombra MN, Forabosco P, Mani-
nchedda G et al (2003) Identification of a novel gene and a
common variant associated with uric acid nephrolithiasis in a
Sardinian genetic isolate. Am J Hum Genet 72:1479–1491
138. Wang Q, Du XL, Meinkoth J, Hirohashi Y, Zhang HT et al
(2006) Characterization of Su48, a centrosome protein essential
for cell division. Proc Natl Acad Sci USA 103:6512–6517. doi:
10.1073/pnas.0601682103
139. Lau J, Ioannidis JPA, Terrin N, Schmid CH, Olkin I (2006)
Evidence based medicine—the case of the misleading funnel
plot. Br Med J 333:597–600
140. Shendure J, Ji HL (2008) Next-generation DNA sequencing. Nat
Biotechnol 26:1135–1145. doi:10.1038/nbt1486
141. Pfeifer GP, Hainaut P (2011) Next-generation sequencing:
emerging lessons on the origins of human cancer. Curr Opin
Oncol 23:62–68. doi:10.1097/CCO.0b013e3283414d00
142. Metzker ML (2010) Sequencing technologies—the next gener-
ation. Nat Rev Genet 11:31–46. doi:10.1038/nrg2626
143. Mardis ER (2008) The impact of next-generation sequencing
technology on genetics. Trends Genet 24:133–141
144. Meyerson M, Gabriel S, Getz G (2010) Advances in under-
standing cancer genomes through second-generation sequenc-
ing. Nat Rev Genet 11:685–696. doi:10.1038/nrg2841
145. Sergentanis TN, Economopoulos KP (2010) Cyclin D1 G870A
polymorphism and breast cancer risk: a meta-analysis com-
prising 9,911 cases and 11,171 controls. Mol Biol Rep. doi:
10.1007/s11033-010-0639-4
146. Zheng J, Yu X, Jiang L, Xiao M, Bai B et al (2010) Association
between the cytotoxic T-lymphocyte antigen 4 ?49G[A poly-
morphism and cancer risk: a meta-analysis. BMC Cancer
10:522. doi:10.1186/1471-2407-10-522
147. Jia C, Cai Y, Ma Y, Fu D (2010) Quantitative assessment of the effect
of FGFR2 gene polymorphism on the risk of breast cancer. Breast
Cancer Res Treat 124:521–528. doi:10.1007/s10549-010-0872-5
148. Qiu LX, Yuan H, Yu KD, Mao C, Chen B et al (2010) Gluta-
thione S-transferase M1 polymorphism and breast cancer sus-
ceptibility: a meta-analysis involving 46,281 subjects. Breast
Cancer Res Treat 121:703–708. doi:10.1007/s10549-009-0636-2
149. Lu S, Wang Z, Liu H, Hao X (2010) HER2 Ile655Val poly-
morphism contributes to breast cancer risk: evidence from 27
case–control studies. Breast Cancer Res Treat 124:771–778. doi:
10.1007/s10549-010-0886-z
150. Weston A, Godbold JH (1997) Polymorphisms of H-ras-1 and
p53 in breast cancer and lung cancer: a meta-analysis. Environ
Health Perspect 105(Suppl 4):919–926
151. Chen MB, Li C, Shen WX, Guo YJ, Shen W et al (2010)
Association of a LSP1 gene rs3817198T[C polymorphism with
breast cancer risk: evidence from 33,920 cases and 35,671
controls. Mol Biol Rep. doi:10.1007/s11033-010-0603-3
152. Lu PH, Yang J, Li C, Wei MX, Shen W et al (2010) Association
between mitogen-activated protein kinase kinase kinase 1
rs889312 polymorphism and breast cancer risk: evidence from
59,977 subjects. Breast Cancer Res Treat. doi:10.1007/s10549-
010-1151-1
153. Economopoulos KP, Sergentanis TN (2010) Differential effects
of MDM2 SNP309 polymorphism on breast cancer risk along
with race: a meta-analysis. Breast Cancer Res Treat
120:211–216. doi:10.1007/s10549-009-0467-1
154. Qi XW, Ma XY, Yang XH, Fan LJ, Zhang Y et al (2010)
Methylenetetrahydrofolate reductase polymorphisms and breast
cancer risk: a meta-analysis from 41 studies with 16,480 cases
and 22,388 controls. Breast Cancer Res Treat 123:499–506. doi:
10.1007/s10549-010-0773-7
155. Hao Y, Montiel R, Huang Y (2010) Endothelial nitric oxide
synthase (eNOS) 894 G[T polymorphism is associated with
breast cancer risk: a meta-analysis. Breast Cancer Res Treat
124:809–813. doi:10.1007/s10549-010-0833-z
156. Wang Z, Dong H, Fu Y, Ding H (2010) RAD51 135G[C
polymorphism contributes to breast cancer susceptibility: a
meta-analysis involving 26,444 subjects. Breast Cancer Res
Treat 124:765–769. doi:10.1007/s10549-010-0885-0
157. Sun YY, Zang ZH, Xu XH, Zhang ZL, Zhong L et al (2011) The
association of SULT1A1 codon 213 polymorphism and breast
cancer susceptibility: meta-analysis from 16 studies involving
23,445 subjects. Breast Cancer Res Treat 125:215–219. doi:
10.1007/s10549-010-0953-5
158. Fang F, Yao L, Yu XJ, Yu L, Wu Q (2010) TNF alpha-308 G/A
polymorphism is associated with breast cancer risk: a meta-
Breast Cancer Res Treat (2011) 127:309–324 323
123

analysis involving 10,184 cases and 12,911 controls. Breast
Cancer Res Treat 122:267–271. doi:10.1007/s10549-009-0698-1
159. Hu Z, Li X, Qu X, He Y, Ring BZ et al (2010) Intron 3 16 bp
duplication polymorphism of TP53 contributes to cancer sus-
ceptibility: a meta-analysis. Carcinogenesis 31:643–647. doi:
10.1093/carcin/bgq018
160. Liu L, Yuan P, Wu C, Zhang X, Guo H et al (2011) A functional
-77T[C polymorphism in XRCC1 is associated with risk of
breast cancer. Breast Cancer Res Treat 125:479–487. doi:
10.1007/s10549-010-0959-z
161. Economopoulos KP, Sergentanis TN (2010) XRCC3 Thr241Met
polymorphism and breast cancer risk: a meta-analysis. Breast
Cancer Res Treat 121:439–443. doi:10.1007/s10549-009-0562-3
324 Breast Cancer Res Treat (2011) 127:309–324
123