Cystic fibrosis: a review of pulmonary and nutritional therapies
Upload
independentCategory
view
6download
0
Ann. Hum. Genet. (1997), 61, 411–424
Printed in Great Britain
411
Genetic history of cystic fibrosis mutations in Italy. I. Regional distribution
S. RENDINE", F. CALAFELL", N. CAPPELLO", R. GAGLIARDINI#, G. CARAMIA#,
N. RIGILLO$, M. SILVETTI%, M. ZANDA%, A. MIANO&, F. BATTISTINI&, L. MARIANELLI',
G. TACCETTI', M. C. DIANA(, L. ROMANO(, C. ROMANO(, A. GIUNTA), R. PADOAN),
A. PIANAROLI), V. RAIA*, G. DE RITIS*, A. BATTISTINI"!, G. GRZINCICH"!,
L. JAPICHINO"", F. PARDO"", M. ANTONELLI"#, S. QUATTRUCCI"#, V. LUCIDI"$,
M. CASTRO"$, B. SANTINI"%, M. CASTELLO"%, G. GUANTI"&, G. B. LEONI"', A. CAO"',
C. TOFFOLI"(, E. LUCCI"(, C. VULLO"(, F. TORRICELLI"), F. SBERNINI"), G. ROMEO"*,
P. RONCHETTO"*, M. SEIA#!, A. ROSSI#!, M. FERRARI#", L. CREMONESI#",
F. SALVATORE##, G. CASTALDO##, E. D’ALCAMO#$, A. MAGGIO#$, F. SANGIUOLO#%,
B. DALLAPICCOLA#%, P. MACERATESI#%, L. BISCEGLIA#&, P. GASPARINI#&,
A. CARBONARA", A. BONIZZATO#', G. CABRINI#', C. BOMBIERI#(, P. F. PIGNATTI#(,
G. BORGO#), C. CASTELLANI#), A. VILLANI#), C. ARDUINO#*, D. SALVATORE$!,
G. MASTELLA#) A. PIAZZA",*
"Dipartimento di Genetica, Biologia e Biochimica and Centro CNR-CIOS, Torino; #Ospedale
Dei Bambini ‘G. Salesi ’, Ancona; $Clinica Pediatrica, Universita[ , Bari; %Div. Pediatria, Ospedale,
Cagliari; &Centro Fibrosi Cistica, Osp. ‘M. Bufalini ’, Cesena; 'Ospedale ‘Mayer ’, Firenze; (Clinica
Pediatrica Istituto ‘G. Gaslini ’, Genova; )Centro Regionale Fibrosi Cistica, II° Clinica Pediatrica,
Universita[ , Milano; *Dipartimento Pediatria, Universita[ Federico II, Napoli; "!Clinica Pediatrica,
Universita[ , Parma; ""Ospedale Dei Bambini ‘Di Cristina ’, Palermo; "#Centro Fibrosi Cistica,
Regione Lazio, Ist. Clinica Pediatrica, Universita[ ‘La Sapienza ’, Roma; "$Ospedale ‘Bambin Gesu[ ’,Roma; "%Ospedale ‘Regina Margherita ’, Clinica Pediatrica, Universita[ , Torino; "& Ist. Genetica
Medica, Universita[ , Bari; "' Ist. Clinica e Biologia Eta[ Evolutiva, Universita[ , Cagliari; "(Div.
Pediatrica, Arcispedale ‘S. Anna ’, Ferrara; ")U.O. Citogenetica e Genetica, Azienda Ospedale
Careggi, Firenze; "*Lab. Genetica Molecolare, Ist. ‘G. Gaslini ’, Genova; #!Laboratorio, Istituti Clinici
Perfezionamento, Universita[ , Milano; #" I.R.C.C.S. Ospedale San Raffaele, Lab. Biologia Molecolare
Clinica, Milano; ##G.E.I.N.G.E., Biotecnologie Avanzate e Dip. Biochimica e Biotecnologie Mediche,
Universita[ Federico II, Napoli; #$Serv. Talassemie, Ospedale ‘V. Cervello ’, Palermo; #%Dip. Sanita[Pubblica e Biologia Cellulare, Cattedra Genetica Umana, Universita[ ‘Tor Vergata ’, Roma; #&Serv.
Gen. Med. IRCSS ‘Casa Sollievo dalla Sofferenza ’, San Giovanni Rotondo, Foggia; #'Lab. Genetica
Molecolare, Centro Fibrosi Cistica, Osp. Maggiore, Verona; #( Ist. Biologia e Genetica, Universita[ ,Verona; #)Centro Fibrosi Cistica, Osp. Maggiore, Verona; #*Servizio Universitario Genetica Medica,
Azienda S. Giovanni, Torino; $!Serv. Pediatria, Osp. Villa D’Agri, Potenza
(Received 17.1.97. Accepted 24.6.97)
Earlier analysis of the Italian population showed patterns of genetic differentiation that were
interpreted as being the result of population settlements going back to pre-Roman times. DNA
disease mutations may be a powerful tool in further testing this hypothesis since the analysis of
diseased individuals can detect variants too rare to be resolved in normal individuals. We present
data on the relative frequencies of 60 cystic fibrosis (CF) mutations in Italy and the geographical
distribution of the 12 most frequent CF mutations screened in 3492 CF chromosomes originating in
13 Italian regions. The 12 most frequent mutations characterize about 73% of the Italian CF
chromosomes. The most common mutation, ∆F508, has an average frequency of 51%, followed by
* Correspondence: Prof. Alberto Piazza, Dipartimento di Genetica, Biologia e Biochimica, Via Santena 19, 10126Torino, Italy. Tel. 39-11-6706650; Fax 39-11-674040. E-mail : Piazza!cios.to.cnr.it

412 S. R
Fig. 1. For legend see opposite.

Cystic fibrosis mutations in Italy 413
Fig. 1. a, Italian regions: ABR, Abruzzo; BAS, Basilicata; CAL, Calabria; CAM, Campania; EMI, EmiliaRomagna; FRI, Friuli ; LAZ, Lazio; LIG, Liguria; LOM, Lombardia; MAR, Marche; MOL, Molise ; PIE,Piemonte; PUG, Puglia; SAR, Sardegna (Sardinia Island); SIC, Sicilia ; TOS, Toscana; TRE, Trentino AltoAdige; UMB, Umbria; VEN, Veneto. b-1 to b-8, Geographical distribution of the most common CFmutations in Italy. Regions with less than 100 chromosomes tested were left blank for their high samplingerrors.
N1303K and G542X, both with average frequencies around 5%. Multivariate analyses show that the
relative frequencies of CF mutations are heterogeneous among Italian regions, and that this
heterogeneity is weakly correlated with the geographical pattern of non-DNA ‘classical ’ genetic
markers. The northern regions are well differentiated from the central-southern regions and within
the former group the western and eastern regions are remarkably distinct. Moreover, Sardinia shows
the presence of mutation T338I, which seems absent in any other European CF chromosome. The
north-western regions of Italy, characterized by the mutation 1717-1GUA, were under Celtic
influence, while the north-east regions, characterized by the mutations R1162X, 2183AAUG and
7115GUA, were under the influence of the Venetic culture.

414 S. R
An analysis of genetic data may be helpful in
tracing historical and prehistorical events (Nei &
Roychoudhury, 1982; Cavalli-Sforza et al. 1988,
1993, 1994). An earlier genetic study of the
Italian population, based on blood group and
protein polymorphisms, showed patterns of
differentiation that were interpreted as being the
result of events dating back to pre-Roman times
(Piazza et al. 1988). Expressed markers, however,
may reflect a small fraction of the DNA variation
and DNA disease mutations may be a powerful
tool to dissect it : the analysis of patients can
detect variants too rare to be resolved in samples
of non-affected individuals (Dianzani et al. 1994).
We have studied the geographical distribution
of several cystic fibrosis (CF; MIM 219700)
mutations in Italy. CF is the most common
autosomal recessive lethal disorder in Caucasoid
populations, with an average incidence of about
1 in 2500 individuals (Welsh et al. 1995) and a
carrier rate of 1 in 25. CF is caused by mutations
in a 27 exon gene spanning about 250 kb on
chromosome 7 (region q31.3) and codes for a
1480 amino acid protein named Cystic Fibrosis
Transmembrane conductance Regulator (CFTR)
(Riordan et al. 1989). To date more than 600 CF
mutations have been described in the world
population, among which ∆F508 is the most
common, with an average relative frequency
among Caucasoids of about 66% (Cystic Fibrosis
Genetic Analysis Consortium, 1994) and
http:}}genet.sickkids.on.ca). Most mutations
are rare and either have specific geographical or
ethnical patterns or are sporadic. The ∆F508
mutation is present in about 80% of North
European CF chromosomes (87% in Denmark)
and only in around 50% of South European
chromosomes (European Working Group on CF
Genetics, 1990; Gasparini et al. 1990; Cystic
Fibrosis Genetic Analysis Consortium, 1994).
This means that other mutations are expected to
be found in Mediterranean populations.
The aim of this work is to present an analysis
of CF mutation relative frequencies in the Italian
regions. Our results might prove of practical use
when designing strategies for DNA analysis of
patients for diagnostic purpose, for prenatal
diagnosis of CF cases, and when planning
population screening for heterozygotes : the car-
rier status cannot be detected clinically or
biochemically, but only by mutation analysis.
Therefore a screening programme (if considered)
should be planned on the basis of the regional
mutation prevalence. Our sampling, however,
may be biased in regions with few affected
individuals and, in such regions, the possible
order of mutations to be tested must be con-
sidered with some caution.
A less practically oriented but nevertheless
interesting hypothesis to test is whether the
geographical patterns of the mutations causing
this genetic disorder retrace those shown by non-
DNA-polymorphisms: the history of a single
gene and the genetic history of a population do
not necessarily follow the same pattern, as the
date of a single mutation does not provide, by
itself, a reference to date the separation of
human demic units.
The present report resulted from a joint
collaboration of 14 Italian laboratories and 15 CF
centres, and adds new data to those already
published (Cremonesi et al. 1990; Nunes et al.
1991; Gasparini et al. 1993; Bonizzato et al. 1995)
and completes the picture of CF mutation
distribution in Italy. This is, to the best of our
knowledge, the second largest CF mutation data
set for a single country after that published by
Schwarz et al. (1995).
Subjects
A sample of 1746 CF patients was collected.
The geographic origin of all the 3492 CF
chromosomes was established by assessing the
birthplace of the four grandparents assigning
each chromosome (or fraction of it, if the
grandparents giving origin to it were born in
different places) to one of the Italian regions
defined in the first column of Table 3 and
represented in Figure 1a. When families included
more than one CF patient, only one of them was
randomly selected. No patients from
consanguineous marriages were included.
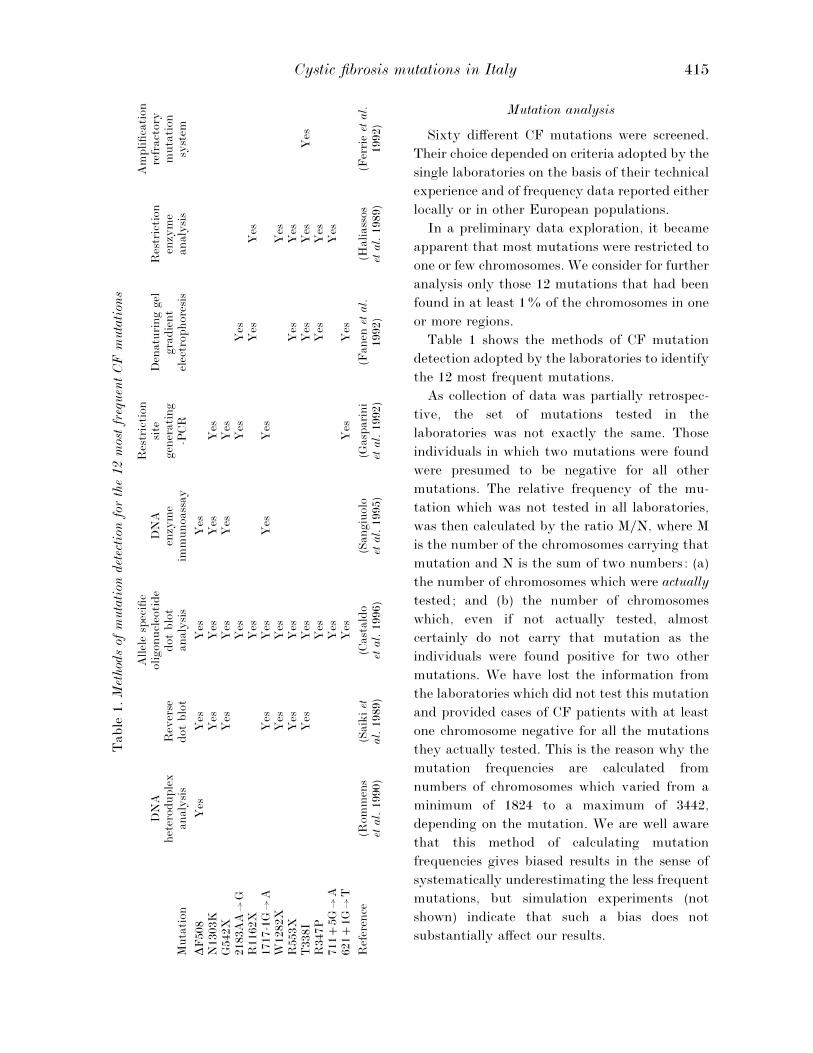
Cystic fibrosis mutations in Italy 415
Table
1.M
ethod
sof
muta
tion
det
ection
for
the
12
mos
tfr
equen
tCF
muta
tion
s
Muta
tion
DN
Ahet
eroduple
xanaly
sis
Rev
erse
dot
blo
t
Allel
esp
ecifi
coligonucl
eoti
de
dot
blo
tanaly
sis
DN
Aen
zym
eim
munoass
ay
Res
tric
tion
site
gen
erati
ng
-PCR
Den
atu
ring
gel
gra
die
nt
elec
trophore
sis
Res
tric
tion
enzy
me
analy
sis
Am
plifica
tion
refr
act
ory
muta
tion
syst
em
∆F
508
Yes
Yes
Yes
Yes
N1303K
Yes
Yes
Yes
Yes
G542X
Yes
Yes
Yes
Yes
2183A
AU
GY
esY
esY
esR
1162X
Yes
Yes
Yes
1717-1
GU
AY
esY
esY
esY
esW
1282X
Yes
Yes
Yes
R553X
Yes
Yes
Yes
Yes
T338I
Yes
Yes
Yes
Yes
Yes
R347P
Yes
Yes
Yes
711
5G
UA
Yes
Yes
621
1G
UT
Yes
Yes
Yes
Ref
eren
ce(R
om
men
set
al.
1990)
(Saik
iet
al.
1989)
(Cast
ald
oet
al.
1996)
(Sangiu
olo
etal.
1995)
(Gasp
ari
ni
etal.
1992)
(Fanen
etal.
1992)
(Haliass
os
etal.
1989)
(Fer
rie
etal.
1992)
Mutation analysis
Sixty different CF mutations were screened.
Their choice depended on criteria adopted by the
single laboratories on the basis of their technical
experience and of frequency data reported either
locally or in other European populations.
In a preliminary data exploration, it became
apparent that most mutations were restricted to
one or few chromosomes. We consider for further
analysis only those 12 mutations that had been
found in at least 1% of the chromosomes in one
or more regions.
Table 1 shows the methods of CF mutation
detection adopted by the laboratories to identify
the 12 most frequent mutations.
As collection of data was partially retrospec-
tive, the set of mutations tested in the
laboratories was not exactly the same. Those
individuals in which two mutations were found
were presumed to be negative for all other
mutations. The relative frequency of the mu-
tation which was not tested in all laboratories,
was then calculated by the ratio M}N, where M
is the number of the chromosomes carrying that
mutation and N is the sum of two numbers: (a)
the number of chromosomes which were actually
tested; and (b) the number of chromosomes
which, even if not actually tested, almost
certainly do not carry that mutation as the
individuals were found positive for two other
mutations. We have lost the information from
the laboratories which did not test this mutation
and provided cases of CF patients with at least
one chromosome negative for all the mutations
they actually tested. This is the reason why the
mutation frequencies are calculated from
numbers of chromosomes which varied from a
minimum of 1824 to a maximum of 3442,
depending on the mutation. We are well aware
that this method of calculating mutation
frequencies gives biased results in the sense of
systematically underestimating the less frequent
mutations, but simulation experiments (not
shown) indicate that such a bias does not
substantially affect our results.

416 S. R
Methods of genetic analysis
Only the 13 regions with sample sizes higher
than 100 chromosomes (Table 3) were included in
multivariate analyses based on the 12 more
frequent CF mutations.
1. Principal component analysis (Hotelling,
1933) was used to reduce the dimensional
space of the 12 mutations into a two-
dimensional space with the least distortion so
that the relative position of the Italian regions
in this space gives the best possible rep-
resentation of their mutual differences.
2. Dendograms are very popular ways of
displaying and clustering objects (in our case
the Italian regions) under the form of trees of
descent even if no phylogenetic relationship
among them holds. There are many
algorithms to reconstruct trees, depending on
which model of evolution among the objects is
assumed. We used the methods of neighbour-
joining (Saitou & Nei, 1987), based on
Reynolds et al.’s (1983) genetic distances, and
maximum likelihood (Felsenstein, 1981). The
maximum likelihood method to reconstruct
trees is by definition the best when allele
frequencies are used and in fact it has been
applied to the frequencies of the haplotypes
involving the CF gene region microsatellites
(Estivill et al. 1994) but its optimal behaviour
is doubtful when relative frequencies of
mutations are used.
3. The robustness of a dendrogram representa-
tion was tested by the bootstrap technique
(Felsenstein, 1985; Efron & Tibshirani, 1993).
The relative frequency of each splitting into
500 bootstrapped tree representations was
calculated and indicated in the displayed
dendrogram, a percentage larger than 50%
indicating a reliable clustering.
Genetic distances and dendograms were
produced by using the 3.5c package
(Felsenstein, 1989).
The 60 different mutations screened in our
Italian sample of CF patients are shown in Table
2 with their frequencies. We estimated (last
column of table 2) that about 77% of CF
chromosomes can be attributed to these 60
mutations. Among these, 20 mutations were
found in 2–10 chromosomes and 28 mutations
are present only in one chromosome. Note,
however, a possible source of bias, specially in
the range of low frequencies, the number of cases
negative for one mutation being somewhat
correlated with the number of positive cases
ascertained for another mutation, as CF patients
with two mutations identified have been assigned
negative for all mutations even though they were
not actually tested for those mutations. Table 3
shows the distribution in 19 Italian regions of the
relative frequencies of the 12 more frequent CF
mutations: ∆F508, N1303K, G542X, 2183AAUG, R1162X, 1717-1GUA, W1282X, R553X,
T338I, R347P, 7115GUA, 6211GUT. No
CF chromosomes with origin in Valle d’Aosta
region were found.
The most common mutation in Italy is ∆F508,
with an average frequency of 51%. The highest
frequencies are found in Piemonte, Umbria and
Campania (" 60%), the lowest in Friuli and
Marche (! 40%). The next more frequent
mutations are N1303K and G542X, with mean
frequencies of 4±84% and 4±83% respectively.
The N1303K mutation is relatively common in
central and south-eastern regions (Abruzzo,
Marche, Lazio, Molise and Puglia), with
frequencies between 8% and 10%; it is rare in
Piemonte and Trentino Alto Adige (! 1%).
G542X shows frequencies ranging from 2%
(Trentino Alto Adige) to 13%; frequencies higher
than 10% are found in three regions (Basilicata,
Friuli and Liguria) with a low number of
chromosomes tested. The 2183AAUG mutation,
with a mean frequency of 3%, is the fourth most
common mutation in Italy, reaching its highest
frequencies (7%) in Trentino Alto Adige and
Veneto. Mutation R1162X shows an average
frequency of 2±42%, but reaches frequencies of
14% in Trentino Alto Adige and 9% in Veneto.
The 1717-1GUA mutation accounts for 4–6% of
the CF chromosomes in Lombardia, Piemonte
and Liguria, but is rare or absent in the central
and southern regions (! 2%).

Cystic fibrosis mutations in Italy 417
Table 2. Frequencies of the 60 different mutations screened in the Italian sample of CF patients
MutationNumber of
chromosomes tested FrequencyCumulativefrequency
∆F508 3442 0±5107 0±5107N1303K 3056 0±0484 0±5591G542X 3082 0±0483 0±60752183 AA-"G 2596 0±0266 0±6341R1162X 2850 0±0242 0±65831717-1G-"A 2892 0±0211 0±6794W1282X 2600 0±0123 0±6917R553X 2882 0±0115 0±7031T338I 2306 0±0069 0±7101R347P 2642 0±0061 0±71617115G-"A 2454 0±0057 0±7218G85E 1980 0±0040 0±72596211G-"T 2594 0±0039 0±7297R334W 2366 0±0030 0±7327R352Q 2112 0±0024 0±7350S549N 2118 0±0024 0±7374R347H 2184 0±0018 0±7392L1077P 1840 0±0016 0±7409R1158X 1878 0±0016 0±7425541delC 1884 0±0016 0±7440R1066H 1918 0±0016 0±7456E585X 1922 0±0016 0±7472Q552X 2172 0±0014 0±7486D1152H 1824 0±0011 0±74972790-2A-"G 1862 0±0011 0±75073132delTG 1862 0±0011 0±75183667ins4 1876 0±0011 0±7529DelI507 1914 0±0010 0±753918983A-"G 1920 0±0010 0±7550G1244E 1960 0±0010 0±75601784delG 2052 0±0010 0±7569G551D 2600 0±0008 0±75774382delA 1822 0±0005 0±75832184insG 1822 0±0005 0±7588H139R 1822 0±0005 0±75947113AG 1824 0±0005 0±7599L558S 1836 0±0005 0±7605L1065P 1838 0±0005 0±7610M348K 1838 0±0005 0±7615S912X 1854 0±0005 0±76211706del17 1856 0±0005 0±7626G1349D 1856 0±0005 0±7632F693L 1862 0±0005 0±7637M1V 1862 0±0005 0±7642R709X 1862 0±0005 0±76481717-8G-"A 1876 0±0005 0±7653406-1G-"C 1876 0±0005 0±7658457TAT-"C 1876 0±0005 0±7664G178R 1876 0±0005 0±7669D579G 1880 0±0005 0±767438494A-"G 1882 0±0005 0±7680W57G 1884 0±0005 0±7685D1270N 1896 0±0005 0±7690384910KbC-"T 1912 0±0005 0±7695I148T 1916 0±0005 0±7701R1066C 1920 0±0005 0±7706C524X 1948 0±0005 0±77112909delT 1956 0±0005 0±7716S549RA-"C 2018 0±0005 0±77211078delT 2136 0±0005 0±7726

418 S. R
Table
3.
Rel
ative
freq
uen
cies
and
sam
ple
size
sof
the
12
mor
efr
equen
tCF
muta
tion
sin
the
Italian
regi
ons
∆F
508
N1303K
G542X
2183A
A-"
GR
1162X
1717-1
G-"
AW
1282X
R553X
T338I
R347P
711
5G
-"A
621
1G
-"T
Tota
lf
Abru
zzoc
64a(4
9)b
58
(10)
51
(6)
38
(0)
50
(2)
42
(2)
37
(7)
50
(0)
37
(0)
39
(0)
40
(0)
43
(0)
76
Basi
lica
tac
76
(47)
67
(6)
69
(11)
60
(5)
54
(0)
64
(0)
59
(3)
64
(0)
45
(0)
54
(0)
61
(0)
66
(0)
72
Cala
bri
a148
(45)
133
(5)
137
(3)
97
(2)
119
(0)
123
(2)
102
(2)
121
(1)
102
(0)
112
(3)
97
(0)
115
(0)
63
Cam
pania
223
(61)
216
(7)
215
(4)
182
(2)
197
(0)
207
(1)
182
(2)
204
(1)
149
(0)
195
(0)
193
(0)
200
(0)
78
Em
il.-R
om
.241
(54)
214
(3)
226
(6)
168
(1)
198
(1)
212
(2)
176
(1)
212
(1)
162
(0)
172
(1)
166
(0)
168
(0)
69
Fri
uli
c24
(35)
18
(4)
22
(13)
17
(3)
19
(5)
19
(0)
18
(6)
21
(0)
15
(0)
16
(0)
16
(0)
17
(0)
66
Lazi
o235
(46)
225
(10)
219
(3)
164
(0)
178
(0)
184
(1)
127
(2)
179
(0)
134
(0)
174
(0)
178
(0)
209
(2)
64
Lig
uri
ac
46
(60)
37
(4)
37
(12)
33
(0)
35
(0)
37
(4)
34
(0)
38
(4)
35
(0)
37
(0)
35
(0)
36
(0)
85
Lom
bard
ia401
(50)
384
(4)
385
(4)
268
(1)
310
(1)
385
(6)
362
(1)
374
(1)
329
(0)
350
(0)
263
(0)
292
(0)
67
Marc
he
144
(39)
130
(9)
135
(6)
113
(2)
116
(0)
126
(2)
119
(2)
129
(2)
112
(0)
110
(1)
111
(1)
114
(1)
65
Molise
c27
(47)
23
(9)
24
(4)
19
(0)
20
(0)
21
(0)
13
(0)
22
(0)
16
(0)
20
(5)
20
(0)
21
(0)
65
Pie
monte
117
(66)
109
(0)
108
(4)
97
(0)
106
(0)
104
(5)
104
(0)
108
(0)
76
(0)
108
(0)
99
(0)
102
(0)
75
Puglia
240
(54)
227
(8)
221
(6)
172
(1)
201
(0)
206
(1)
191
(0)
202
(2)
161
(0)
183
(0)
171
(0)
184
(0)
72
Sard
egna
139
(58)
136
(3)
138
(6)
123
(2)
132
(0)
136
(1)
128
(0)
134
(0)
128
(11)
133
(0)
124
(0)
126
(1)
84
Sic
ilia
380
(52)
331
(3)
339
(7)
272
(2)
301
(0)
330
(0)
318
(3)
333
(3)
269
(0)
296
(2)
274
(0)
282
(0)
73
Tosc
ana
191
(51)
148
(5)
154
(5)
111
(0)
119
(0)
145
(1)
124
(2)
145
(2)
96
(0)
121
(2)
115
(0)
118
(0)
69
Tre
nti
no
113
(51)
102
(1)
101
(3)
106
(7)
103
(14)
98
(1)
88
(1)
93
(0)
83
(0)
90
(0)
95
(6)
89
(0)
85
Um
bri
ac
37
(67)
35
(3)
35
(10)
29
(0)
29
(0)
31
(0)
29
(0)
32
(3)
27
(0)
30
(0)
28
(0)
30
(0)
83
Ven
eto
552
(45)
426
(4)
429
(2)
496
(7)
528
(9)
387
(3)
357
(0)
384
(0)
307
(0)
371
(0)
340
(2)
351
(0)
73
Mix
edd
44
(61)
37
(4)
37
(4)
31
(0)
35
(1)
35
(0)
32
(0)
37
(3)
23
(0)
31
(0)
28
(1)
31
(0)
74
Italy
3442
(51)
3056
(5)
3082
(5)
2596
(3)
2850
(2)
2892
(2)
2600
(1)
2882
(1)
2306
(1)
2642
(1)
2454
(1)
2594
(0)
73
Italy
e3398
(51)
3019
(5)
3045
(5)
2565
(3)
2815
(2)
2857
(2)
2568
(1)
2845
(1)
2283
(1)
2611
(1)
2426
(1)
2563
(0)
73
aN
um
ber
ofch
rom
oso
mes
test
ed;b
per
centa
ge;c
num
ber
ofch
rom
oso
mes
test
edle
ssth
an
50
foratle
ast
one
muta
tion
;d
indiv
iduals
wit
hatle
ast
one
gra
ndpare
nt
born
outs
ideIt
aly
;e
‘mix
ed’in
div
iduals
are
notco
nsi
der
ed;f
theto
talnum
ber
ofch
rom
oso
mes
test
edis
notgiv
en,asnotall
chro
moso
mes
wer
ete
sted
forall
muta
tions.

Cystic fibrosis mutations in Italy 419
Fig. 2. Biplot of the CF mutation relative frequencies for the 13 Italian regions. Regions and axes of CFmutations (dotted lines) are represented in the space of the first two principal components summarizing52±1% of the total variation. Each point (region) is at the centre of a circle whose area is inverselyproportional to the euclidean distance between the point in this two-dimensional space and the same pointin the multidimensional space. The projection of a point (centre of the circle) on a mutation frequency axisgives the relative contribution of that mutation in determining the position of the point in the plot (for moredetails see Gabriel, 1981).
The six remaining mutations are less frequent
(average frequencies near 1%) and more locally
distributed: W1282X has high frequencies in
Abruzzo and Friuli (both regions have small
sample sizes) ; 7115GUA is present only in
Marche, Trentino Alto Adige and Veneto;
whereas T338I is an exclusively Sardinian mu-
tation. The 48 mutations not selected for further
analysis account for 2±6% (93}3492) of CF
chromosomes.
As mentioned before, most but not all
chromosomes were tested for all 12 mutations,
therefore our frequencies may represent biased
estimates of the relative frequencies of the less
frequent mutations. It is therefore reassuring
that the results we obtained agree with those
reported for a smaller subsample where all the
coding and adjoining non-coding portions of the
gene were sequenced (Bonizzato et al. 1995).
The regional frequencies of the most common
mutations are displayed in Figure 1b-1 to 1b-8.
Regions where less than 100 chromosomes were
tested were left blank for their high sampling
errors.
Figure 2 shows 13 Italian regions in the space
of the first two principal components
summarizing 52±1% of the original mutation
variation with a graphical display of the dis-
tortion introduced in the two-dimensional rep-
resentation. The first principal component, which

420 S. R
Fig. 3. Dendrogram of 13 Italian regions according to the maximum likelihood method of reconstruction(Felsenstein, 1981). Segments whose lengths are statistically different from zero are drawn with bold lines.Numbers on branches indicate ‘bootstrap’ percentages, i.e. the relative frequencies of the clusterings in thedendrogram shared among 500 replicates. Percentages higher than 50 reflect a robust structure.
explains 30±68% of the total variation, clearly
separates Trentino Alto Adige and Veneto from
the other regions. These two regions show high
frequencies of three mutations: R1162X,
2183AAUG, and 7115GUA. The second prin-
cipal component explains 21±42% of the variance
and is highly correlated with the ∆F508 mutation
(r¯ 80%); north-western regions of Italy
(Piemonte and Lombardia) and Sardinia are
differentiated from central and southern regions.
The third principal component (16±16% of the
variation, not shown) discriminates Lazio, with a
relatively high frequency of 6211GUT, and
Sardinia, which shows the ‘private’ mutation
T338I, from the other regions.
A neighbour-joining dendrogram based on
Reynolds et al.’s (1983) genetic distances (not
shown) groups the 13 Italian regions according to
their ∆F508 mutation frequencies: the wide
variation in ∆F508 frequencies seems to override
the contribution of the other mutations.
A more informative dendrogram can be
reconstructed by the maximum likelihood
method (Fig. 3). As it uses the variance-
covariance matrix between regions, it takes into
account the mutation relative frequency varia-
bility (variance) within each region. Only one
cluster of Figure 3 is robust (bootstrap value
51%): it includes the four northern regions
(Trentino Alto Adige, Veneto, Lombardia and

Cystic fibrosis mutations in Italy 421
Piemonte). Within this group, Trentino Alto
Adige and Veneto form a subcluster with the
highest bootstrap value (93%). Central and
southern regions are poorly structured, as
indicated by the low bootstrap frequencies and
by the many segments of the dendrogram whose
lengths are statistically not different from zero.
The segments leading to Sardinia, Lazio and
Sicilia are statistically different from zero for the
high frequencies of mutations T338I, 6211GUT and R553X respectively.
A preliminary point to stress is that we are
dealing with ‘relative’ mutation frequencies, and
therefore they do not estimate the frequencies of
the mutation in the population if the prevalence
of the disease varies from region to region:
however, the relative frequencies have the ad-
vantage of being roughly independent from the
prevalence of the disease (thus from selective
factors) and it seemed interesting to evaluate
how they work as population markers.
The present study characterized the Italian
CF chromosomes, and the geographical pattern
of 12 relatively frequent mutations in Italy as
given by the birthplaces of the grandparents of
the CF cases. One can ask whether this way of
distributing the chromosomes among the Italian
regions is not only of anthropological value but
also of practical use in DNA testing which would
require data for the current population. Table 3
has been recalculated by considering the samples
who currently live in the various regions (data
not shown) and we found that only the regions
Abruzzo, Basilicata, Calabria, Friuli, and
Umbria show some discrepancies : with the
exception of Calabria, in these regions the
number of chromosomes tested was less than 50
and in fact they have been excluded from further
analyses. In Calabria the relative frequency of
the mutation ∆F508 changes from 45% of Table
3 to 51% which is reasonable since Calabria is
one of the southern regions most affected by
emigration over the last two generations.
As it is well known, the most common
mutation is ∆F508, with an average frequency of
51%, followed by N1303K and G542X, both
with average frequencies around 4±8%. This
pattern is common to other European countries
which share relatively low ∆F508 frequencies but
high N1303K and G542X frequencies, and where
a high number of mutations accounts for a
relatively low fraction of CF chromosomes
(Claustres et al. 1993; Chillo! n et al. 1994;
Bertranpetit & Calafell, 1996). An analysis of the
relationship between our Italian CF sample and
those of other European populations will be
reported elsewhere.
Our microgeographic analysis of CF mutation
relative frequencies in Italy points to a genetic
heterogeneity among Italian regions. Northern
regions are well differentiated from central-
southern regions (Figs 2, 3). Within the former
group two subclusters show well defined
identities : the north-western regions (Piemonte
and Lombardia) and the north-eastern regions
(Trentino Alto Adige and Veneto). Sardinia,
known to be genetically very different from the
continental Italian population and from other
European populations (Piazza et al. 1988), shows
the presence of the ‘private’ mutation T338I,
which, to the best of our knowledge, has not been
identified in any other CF sample.
A relevant question to investigate is whether
the frequency of the CF gene is homogeneous
among the Italian regions. Very unfortunately
we do not have reliable gene frequencies at a
regional level which take into account the region
of origin of the patients. The gene frequencies
inferred from consanguineous marriages (Romeo
et al. 1985) show figures from 0±02055 to 0±02473
(depending on the calculation method) which
seem non-heterogeneous among regions, but the
estimates are indirect and it is difficult to
evaluate their standard error.
A previous work based on ‘classical ’ non-DNA
polymorphisms (Piazza et al. 1988) showed that
the genetic structure of modern Italy may reflect
ancient patterns of ethnic differentiation going
back to pre-Roman times. A Greek influence was
suggested to have shaped the gene pool of
422 S. R
southern Italian regions. Other well defined
civilizations at the end of the sixth century BC
played a very important role in the history of
Italy and were described as possibly related to
important components of the Italian genetic
structure: Etrurian in Central Italy; Ligurian in
North-western Italy; and Osco-Umbrian in
central-eastern regions. At that time North Italy
showed culturally and ethnically well
characterized areas. The western and central
regions (corresponding to modern Valle d’Aosta,
Piemonte and Lombardia) were under the Celtic
influence; in the Central-eastern Alps (Trentino
Alto Adige) lived the Rhaeti, and Veneto was the
home of the Venetic culture (Pallottino, 1984).
The distribution of CF mutation relative
frequencies shows a geographic pattern that
seems similar to that obtained by using non-DNA
markers only in North Italy. It is suggested that
in the northern regions, near the physical barrier
of the Alps, genetic drift played a significant role
in determining the high frequencies observed
for mutation 1717-1GUA in central-western
regions, and for mutations R1162X, 2183AAUG
and 7115GUA in eastern regions.
Central and southern Italy show a more
blurred pattern. Genetic distances between
Italian regions, when measured from 19 loci and
76 classical gene frequencies (Piazza et al.
1989a, b), are not significantly correlated with
CF mutation frequencies with and without
∆F508 (data not shown). A plausible interpret-
ation, not to recall the possibility of recurrent
mutations, is that while most polymorphisms of
the classical markers probably predate the origin
of our species and therefore can accumulate a
large variability between ethnic groups, it is
probable that CF mutations arose at different
and relatively recent times, as suggested for
∆F508 (Morral et al. 1994) and G542X and
N1303K (Morral et al. 1993). Another more
interesting reason for the discrepancy may be a
historical one: the history of South Italy, being
connected with the Mediterranean populations,
is much more complex than the history of the
northern part of Italy, too complex to be reached
from CF mutations (taken separately or together)
if their date of appearance is not available. An
alternative and much more trivial reason may
simply be that the size of our sample or the
geographical distribution of the disease itself do
not allow to dissect what is shared and what is
not between the two histories, the history of
a single gene from the history of a complex
population.
A microsatellite haplotype analysis of ∆F508
carrying chromosomes in Europe was performed
to estimate the age of this mutation (Morral et al.
1994): the minimum age for the ∆F508 mutation
was estimated at 52000 years ago, that is before
Italy and Europe were settled by anatomically
modern humans. Watterson & Guess (1977)
asked the question whether the most frequent
allele is also the oldest. If the frequency and the
age of a mutation are proportional, it is sugges-
tive that the time of origin of the mutations
typical of North Italy (namely, 1717-1GUA,
R1162X, 2183AAUG and 7115GUA) are
compatible with the spread of Celtic and Venetic
speaking people: a more rigorous estimate would
be of interest when microsatellite polymorphisms
will be available for most mutations.
This work was supported by MURST 60% (Italy) ; byCNR Target Projects ‘Human Genome’, ‘Genetic En-gineering’, ‘Beni Culturali ’ and ‘FATMA’; by Associ-ation OFFICIUM, Rome; Ministero della Sanita' FSN1996 sulla Fibrosi Cistica, and Associazione VenetaFibrosi Cistica, Verona. Calafell F. was granted anEuropean Community Fellowship within the project‘The Biological History of European Populations’. Dataconcerning some CF patients were also supplied byCastiglione N. (Clinica Pediatrica, Universita' , Catania),Magazzu' G. (Clinica Pediatrica, Universita' , Messina).Computer time was granted by CSI-Piemonte, Torino,Italy.
B, J. & C, F. (1996). Genetic andgeographical variability in cystic fibrosis : evolutionaryconsiderations. In Variation in the human genome (ed.),pp. 97–118. Chichester (Ciba Foundation Symposium197): Wiley.
B, A., B, L., M, C., N, E.,B, C., C, C., B, G., Z,L., M, G., C, G., G, P. &P, P. F. (1995). Analysis of the complete codingregion of the CFTR gene in a cohort of CF patientsfrom North-Eastern Italy: identification of 90% of themutations. Hum. Genet. 95, 397–402.
C, G., R, E., S, G., R, V.,E, P., D R, G., S, D. &
Cystic fibrosis mutations in Italy 423
S, F. (1996). Molecular epidemiology ofcystic fibrosis mutations and respective haplotypes inSouthern Italy evaluated with an improvedsemiautomated robotic procedure. J. Med. Genet. (inpress).
C-S, L. L., P, A., M, P. &M, J. L. (1988). Reconstruction of humanevolution; bringing together genetic, archaeological,and linguistic data. Proc. Natl. Acad. Sci. USA 85,6002–6006.
C-S, L. L., M, P. & P, A. (1993).Demic expansions and human evolution. Science 259,639–646.
C-S, L. L., M, P. & P, A. (1994).History and geography of human genes. Princeton, NJ:Princeton University Press.
C! , M., C, T., G! , J., R, M. D.,P, A., M, N., E, X. & N, V.(1994). Analysis of the CFTR gene confirms theheterogeneity of the Spanish population: 43 mutationsaccount for only 78% of CF chromosomes. Hum.Genet. 93, 447–451.
C, M., M, L., D, M.,G, M., C, J. F., R, G.,G, B. & D, J. (1993). Analysis of the 27exons and flanking regions of the cystic fibrosis gene:40 different mutations account for 91±2% of themutant alleles in Southern France. Hum. Molec. Gen. 2,1209–1213.
C, L., R, L., S, M., R, S., G,A., R, P., F, L., R, L., D,M., R, G. & F, M. (1990). Frequency of theDF508 mutation in a sample of 175 Italian cysticfibrosis patients. Hum. Genet. 85, 400–402.
C F G A C (1994).Population variation of common cystic fibrosismutations. Hum. Mutat. 4, 167–177.
D, I., G, S., D S, L., M,E., P, A., C, C. & P, A.(1994). Genetic history of PKU mutations in Italy.Am. J. Hum. Genet. 55, 849–850.
E, B. & T, R. J. (1993). An introduction tothe bootstrap. New York: Chapman & Hall.
E, X., M, N. & B, J. (1994).Reply to Kaplan, N. L., Lewis, P. O. and Weir, B. S.Nature Genetics 8, 216–218.
E W G CF G (1990).Gradient of distribution in Europe of the major CFmutation and of its associated haplotypes. Hum. Genet.85, 436–441.
F, P., G, N., V, M., B, C.,M, J., C, B., P, F. & G, M.(1992). Molecular characterization of Cystic Fibrosis :16 novel mutations identified by analysis of the wholeCystic Fibrosis Conductance Transmembrane Regu-lator (CFTR) coding regions and spile site junctions.Genomics 13, 770–776.
F, J. (1981). Evolutionary trees from genefrequencies and quantitative characters : finding maxi-mum likelihood estimates. Evol. Biol. 35, 1229–1242.
F, J. (1985). Confidence limits onphylogenies : an approach using the bootstrap.Evolution 39, 783–791.
F, J. (1989). PHYLIP – Phylogeny InferencePackage (Version 3.2). Cladistics 5, 164–166.
F, R. M., S, M. J., R, N. H., et al.(1992). Development, multiplexing, and application ofARMS tests for common mutations in the CFTR gene.Am. J. Hum. Genet. 51, 251–262.
G, K. R. (1981). Biplot display of multivariatematrices for inspection of data and diagnosis. InInterpreting multivariate data (ed. B. Barnett), pp.147–173. Chichester : Wiley.
G, P., P, P. F., N, G.,D, B., N, V., C, T., E,X., F, E., B, A., L-, D., L, J., S, L. & K, R.(1990). Mutation analysis in cystic fibrosis. N. Eng.J. Med. 323, 62–63.
G, P., B, A., D, M. & P,P. F. (1992). Restriction Site Generating PolymeraseChain Reaction (PCR) for the probeless detection ofhidden genetic variation: application to the study ofsome common cystic fibrosis mutations. Mol. CellProbes 6, 1–7.
G, P., M, C., B, G., N, E.,Z, L., B, C., B, G., P,P. F. & C, G. (1993). Screening of 62 mutationsin a cohort of CF patients from north eastern Italy:their incidence and clinical features of defined geno-types. Hum. Mutat. 2, 389–394.
H, A., C, G., T, L., et al. (1989).Modification of enzymatically amplified DNA for thedetection of point mutations. Nuc. Ac. Res. 17, 3606.
H, H. (1933). Analysis of a complex of stat-istical variables into principal components. J. Educ.Psych. 24, 417–441, 498–520.
M, N. (1967). The detection of disease clusteringand a generalized regression approach. Cancer Res. 27,209–220.
M, N., N, V., C, T., C! , M.,G! , J., B, J. & E, X. (1993).Microsatellite haplotypes for cystic fibrosis : mutationframeworks and evolutionary tracers. Hum. Molec.Gen. 2, 1015–1022.
M, N., B, J., E, X., N,V., C, T., G! , J., R, A., V-M, R., M, M., K, L.,A, D., D, R., R, G., R,M. P., G, S., R, G., F, M.,M, C., C, M., D, M.,S, M., S, M., D, B.,N, G., F, C., A, M., N, M.,K, J., A, M., D, N. & K, L. (1994).The origin of the major cystic fibrosis mutation(DeltaF508) in European populations. Nature Genetics7, 169–175.
N, M. & R, A. K. (1982). Geneticrelationship and evolution of human races. Evol. Biol.14, 1–59.
N, V., G, P., N, G., G, A.,B, A., S, F., B, A.,G! , F. J., D, M., R-G, M.,C, M., M, V., K, R., D,B., P, P. F., L, D., C, T. &E, X. (1991). Analysis of 14 cystic fibrosismutations in five South European populations. Hum.Genet. 87, 737–738.

424 S. R
P, M. (1984). Storia della prima Italia. Milano:Rusconi.
P, A., C, N., O, E. & R, S.(1988). A genetic history of Italy. Ann. Hum. Genet. 52,203–213.
P, A., O, E., B, M., R, G.,D, R., G, A., B, P., C,L., C, P., B, A., B, V., C' ,C., P, V. L., F, A. & B, M. (1989a).The distribution of some polymorphisms in Italy. GeneGeography 3, 69–139.
P, A., O, E., G, R. M., R, S.,A, A., B, M., C, C., C, C.,C, R., F, B., G, L., L, G.,M, D., M, M., M, P. L.,M, A., M, V., M, L., P, M.& S, M. (1989b). The distribution of HLA antigensin Italy. Gene Geography 3, 141–164.
R, J., W, B. S. & C, C. C. (1983).Estimation of the coancestry coefficient: basis for ashort term genetic distance. Genetics 105, 767–779.
R, J. R., R, J. M., K, B.-S., A,N., R, R., G, Z., Z, J.,L, S., P, N., C, J.-L., D, M. L.,I, M. C., C, F. S. & T, L.-C. (1989).Identification of the cystic fibrosis gene: cloning andcharacterization of complementary DNA. Science 245,1066–1073.
R, G., B, M., D, M., M, P.,M, G., G, A. M., M, C.,A, M., B, A., S, F.,C, D., M, A., M, A. G., M,
A. & M, A. (1985). Incidence in Italy, geneticheterogeneity and segregation analysis of cysticfibrosis. Am. J. Hum. Genet. 37, 338–349.
R, J., K, B. S., G, W., C, P.,T, L. C. & R, P. (1990). Rapid nonradioactivedetection of the major cystic fibrosis mutation. Am. J.Hum. Genet. 46, 395–396.
S, R. H., W, P. S., L, C. H. & E,H. A. (1989). Genetic analysis of amplified DNA withimmobilized sequence-specific oligonucleotide probes.Proc. Natl. Acad. Sci. USA 87, 8447–8451.
S, N. & N, M. (1987). The neighbor-joiningmethod: a new method for reconstructing phylogenetictrees. Mol. Biol. Evol. 4, 406–425.
S, F., M, P., M, A., et al.(1995). Simultaneous detection of DelF508, G542X,N1303K, G551D and 1717-1G-"A cystic fibrosisalleles by a multiplex DNA enzyme immunoassay. Int.J. Clin. Lab. Res. 25, 142–145.
S, M. J., M, G. M., H, A.,C, J. P., M, L. A., G, A.,S, H. I., et al. (1995). Cystic fibrosis mutationanalysis : report from 22 U.K. regional geneticlaboratories. Hum. Mutat. 6, 326–333.
W, G. A. & G, H. A. (1977). Is the mostfrequent allele the oldest? Theor. Pop. Biol. 11,141–160.
W, M. J., T, L.-C., B, T. F. & B,A. L. (1995). Cystic fibrosis. In The metabolic and mol-ecular bases of inherited disease (ed. C. R. Scriver,A. L. Beaudet, W. S. Sly & D. Valle), pp. 3799–3876.New York: McGraw-Hill Inc. Publ.
Copyright © 2022 FDOKUMEN