Linear growth at different growth phases of pancreatic sufficient children with cystic fibrosis
Upload
khangminh22Category
view
0download
0
i
Non-invasive assessment of paediatric cystic fibrosis liver disease and the role of
microRNAs in disease mechanism
Diego Calvopina
Bachelor of Science
Master of Biotechnology
A thesis submitted for the degree of Doctor of Philosophy at
The University of Queensland in 2018
Faculty of Medicine

ii
Abstract
Cystic fibrosis (CF)-associated liver disease (CFLD) is a hepatobiliary complication of CF
responsible for significant morbidity and mortality in children with the disease. It is estimated
that ~30% of children with CF develop severe liver abnormalities during the first decade of
life. However, the real prevalence of CFLD could be higher, as shown by autopsies
performed in adults with CF. The reason why only a subset of CF children develop liver
disease is not fully elucidated. Current methods to diagnose CFLD are non-specific and the
gold standard to assess disease severity relies on an invasive liver biopsy which can be
associated with significant complications. New current trialled methods for the diagnosis of
CFLD focus on biological and physical properties to indirectly assess the degree of fibrosis
in the liver. Development of new non-invasive diagnostic modalities is necessary to more
accurately detect and monitor liver disease progression and thus to improve the quality of
life of children with CF. In this thesis, Supersonic shearwave elastography (SSWE) and
serum microRNAs (miRNAs) were assessed as novel non-invasive methods for the
diagnosis and monitoring of liver fibrosis in children with CF. Furthermore, the role of
miRNAs were explored by identifying their mRNA targets and their potential involvement in
the mechanism of fibrosis development. Chapter 3 demonstrates the utility of SSWE to
detect CFLD in children with CF by providing real time measurement of liver stiffness and
the capacity of SSWE to assess liver stiffness over time. Chapter 4 stablishes a serum
miRNA panel capable of discriminating liver disease in CF children outperforming current
proposed biomarkers. Moreover, this work demonstrates that serum levels of a single
miRNA can discriminate liver severity in children with CFLD. miRNAs reported in Chapter 3
were further investigated in Chapters 4 and 5 where miRNA targets were identified and
validated, and their role explored in the liver’s fibrogenic response using liver cultured cells.
Overall, this thesis demonstrated that SSWE and serum miRNAs are capable of diagnosing
CFLD and stratify liver disease severity in children with CF. This work has also identified
miRNA targets and their potential regulatory role in liver cells involved in fibrogenesis which
could lead to the discovery of novel therapeutic interventions for CFLD and other fibrosing
chronic liver diseases.

iii
Declaration by author
This thesis is composed of my original work, and contains no material previously published
or written by another person except where due reference has been made in the text. I have
clearly stated the contribution by others to jointly-authored works that I have included in my
thesis.
I have clearly stated the contribution of others to my thesis as a whole, including statistical
assistance, survey design, data analysis, significant technical procedures, professional
editorial advice, financial support and any other original research work used or reported in
my thesis. The content of my thesis is the result of work I have carried out since the
commencement of my higher degree by research candidature and does not include a
substantial part of work that has been submitted to qualify for the award of any other degree
or diploma in any university or other tertiary institution. I have clearly stated which parts of
my thesis, if any, have been submitted to qualify for another award.
I acknowledge that an electronic copy of my thesis must be lodged with the University Library
and, subject to the policy and procedures of The University of Queensland, the thesis be
made available for research and study in accordance with the Copyright Act 1968 unless a
period of embargo has been approved by the Dean of the Graduate School.
I acknowledge that copyright of all material contained in my thesis resides with the copyright
holder(s) of that material. Where appropriate I have obtained copyright permission from the
copyright holder to reproduce material in this thesis and have sought permission from co-
authors for any jointly authored works included in the thesis.
iv
Publications included in this thesis
Calvopina DA, Coleman MA, Lewindon PJ, Ramm GA. Function and Regulation of
MicroRNAs and Their Potential as Biomarkers in Paediatric Liver Disease. International
Journal of Molecular Sciences 2016; 17:1795.
Calvopina DA, Chatfield MD, Weis A, Coleman MA, Fernandez-Rojo MA, Noble C, Ramm
LE, Leung DH, Lewindon PJ, Ramm GA. MicroRNA Sequencing Identifies a Serum
MicroRNA Panel, Which Combined With Aspartate Aminotransferase to Platelet Ratio Index
Can Detect and Monitor Liver Disease in Pediatric Cystic Fibrosis. Hepatology 2018;
68:2301-2316.

v
Submitted manuscripts included in this thesis
No manuscripts submitted for publication
Other publications during candidature
Articles under review:
Genz B, Coleman MA, Irvine KM, Kutasovic JR, Miranda M, Calvopina DA, Weis A,
Cloonan N, Robinson H, Hill MM, Al-Ejeh F, Ramm GA. Overexpression of miRNA-25-3p
inhibits Notch1 signalling and TGF-β-induced collagen expression in hepatic stellate cells.
Scientific reports. Under review.
Lewindon PJ, Puertolas-Lopez M, Ramm LE, Noble C, Pereira T, Wixey J, Hartel G,
Calvopina DA, Leung DH, Ramm GA. Utility of transient elastography combined with APRI
for liver disease detection and staging hepatic fibrosis in pediatric Cystic Fibrosis.
Hepatology Communications. Under review.
Patent:
A Complete Patent application (Australia and US only) was filed on April 18 to protect the
intellectual property associated with this thesis, entitled ‘DETECTION OF LIVER DISEASE
(CF LIVER DISEASE)’. Patent number: AU2018202717; Inventors: Diego Calvopina, Grant
A. Ramm.

vi
Contributions by others to the thesis
Prof. Grant A. Ramm conceived the idea and contributed with the design and analysis of all
experiments. A/Prof. Peter J. Lewindon conceived the idea of Chapter 3 and assisted with
study design, enrolment of patients and collection of tissue specimens for Chapters 4 and
5. Dr. Miranda A. Coleman and Dr. Manuel A. Fernandez-Rojo provided critical feedback
and proofread this thesis.
In Chapter 3, Charlton Noble helped with patient enrolment and performed liver stiffness
scans using SSWE. Anna Weis and Louise Ramm assisted with the collection of clinical
data. Dr. Gunter Hartel assisted with the more advanced statistical analyses. Dr. Leesa
Wockner performed sample size calculation.
In Chapter 4, Dr. Daniel Leung provided advice on study design. Anna Weis and Louise
Ramm assisted with the collection of clinical data. Charlton Noble helped with patient
enrolment and collection of tissue specimens. Dr. Mark Chatfield performed the more
advanced statistical analysis. Dr. Leesa Wockner performed sample size calculation.
Quantification of cDNA libraries, template preparation, sequencing and sequence data
acquisition and analysis was performed by the Genomics Research Centre (GFC; Brisbane-
Australia).
In Chapter 5, library preparation and sequencing of enriched BMOL samples was performed
by the Centre for Brain Genomics of the Queensland Brain Institute (QBI; The University of
Queensland, St. Lucia, Brisbane). Library preparation and sequencing of enriched LX2
samples was performed by the IMB Sequencing Facility (ISF) of the Institute for Molecular
Bioscience (IMB; The University of Queensland, St. Lucia, Australia). Initial sequencing
analysis (e.g. de-multiplexing, conversion, quality control, trimming and alignment) was
performed by members of the Clinical Genomics Group (QIMR Berghofer, Queensland-
Australia).

vii
In Chapter 6, Dr. Michael Pearen and Diem Hoang-Le performed and analysed western blot
analysis. Functional assays were performed with advice and support of Dr. Michael Pearen,
Dr. Berit Genz and Anna Weis.

viii
Statement of parts of the thesis submitted to qualify for the award of another degree
No works submitted towards another degree have been included in this thesis.
Research Involving Human or Animal Subjects
This study was approved by the Human Research Ethics Committee of the Children’s Health
Services Queensland (Queensland Children’s Hospital; Brisbane-Australia) under the
reference number HREC/10/QRCH/87 and the Human Research Ethics Committee of the
QIMR-Berghofer Research Institute under the reference number P1083.

ix
Acknowledgements
This is the end of a life-long journey in which many people have been involved in one way
or the other. I cannot name all, but I am grateful for every one of you.
I would like to start by thanking my supervisor Prof. Grant A. Ramm and co-supervisors
A/Prof. Peter J. Lewindon, Dr. Miranda A. Coleman and Dr. Manuel A. Fernandez-Rojo for
your guidance during these past four years. A special thanks to Grant, whose support from
day one made this all possible.
My lab members, which were always available for discussing project related matters or
taking a break. Special thanks to Michael Pearen, Berit Genz and Anna Weis who have
been my biggest help especially when experiments stopped working.
A part of this thesis involved patient enrolment, and it would have not been possible without
the help of the Department of Gastroenterology and Hepatology staff at the Queensland
Children’s Hospital; in particular Charlton Noble who spent many hours and lunch breaks
scanning patients. Of course, without the support of the children and their families none of
this would have been possible, thank you.
To my parents and siblings, this has been a common goal and I am infinitely happy to share
it with you. I am aware of all the sacrifices and effort and I would not be who I am today
without your encouragement. Lastly but not least, to my partner Anna Weis, I have been
lucky enough to have found someone that shares my craziness and who doesn’t mind
spending hours talking about science. These four years were easier just by having you by
my side and I am looking forward to whatever tomorrow brings.

x
Financial support
This research was supported by The University of Queensland International Scholarship
(UQI) tuition free award and the Australian Liver Foundation (ALF) Pitcher Partners PhD
Scholarship for Paediatric Liver Disease Research.
Keywords
microRNA, serum, miRNA-sequencing, cystic fibrosis liver disease, Supersonic, transient
elastography, biotin pulldown assay, diagnostic, hepatic stellate cells, liver progenitor cells.

xi
Australian and New Zealand Standard Research Classifications (ANZSRC)
ANZSRC code: 110307, Gastroenterology and Hepatology, 60%
ANZSRC code: 060106, Cellular Interactions, 10%
ANZSRC code: 060111, Signal Transduction, 10%
ANZSRC code: 060405, Gene Expression, 20%
Fields of Research (FoR) Classification
FoR code: 1103, Clinical Sciences, 60%
FoR code: 0604, Genetics, 20%
FoR code: 0601, Biochemistry and Cell Biology, 20%

xii
Table of Content
CHAPTER 1 Introduction and literature review …… .................................................. 1
1.1 Chapter contribution ............................................................................................. 2
1.2 INTRODUCTION .................................................................................................. 3
1.3 Cystic fibrosis ....................................................................................................... 4
1.4 Epidemiology of cystic fibrosis liver disease (CFLD) ............................................. 6
1.5 Pathogenesis of CFLD ......................................................................................... 6
1.6 Mechanisms of fibrosis in CFLD ........................................................................... 8
1.7 Ductular reaction .................................................................................................. 9
1.8 Manifestations of CFLD ...................................................................................... 10
1.9 Detection of CFLD .............................................................................................. 11
1.10 Liver biopsy ........................................................................................................ 14
1.11 Imaging techniques ............................................................................................ 17
1.12 Liver enzymes .................................................................................................... 18
1.13 Novel non-invasive methods of liver disease detection ....................................... 18
1.14 HYPOTHESES AND AIMS ................................................................................. 27
CHAPTER 2 Materials and Methods .......................................................................... 29
2.1 Chapter contribution ........................................................................................... 30
2.2 Patients .............................................................................................................. 31
2.3 In vitro studies .................................................................................................... 34
2.4 Nucleic Acid studies ........................................................................................... 43
2.5 Statistical and data analysis ............................................................................... 55
CHAPTER 3 Assessment of paediatric CFLD using Supersonic shearwave
elastography ................................................................................................................ 63
3.1 INTRODUCTION ................................................................................................ 64
3.2 RESULTS .......................................................................................................... 67
3.3 DISCUSSION ..................................................................................................... 79
3.4 Summary and future directions ........................................................................... 83
CHAPTER 4 Investigation of a serum microRNA signature for the discrimination
of liver disease in CF and monitoring liver disease severity in paediatric CFLD ...... 85
4.1 Chapter contribution ........................................................................................... 86
4.2 INTRODUCTION ................................................................................................ 87
4.3 RESULTS .......................................................................................................... 89
xiii
4.4 DISCUSSION ................................................................................................... 133
4.5 Summary and future directions ......................................................................... 138
CHAPTER 5 Identification of microRNA targets in HSCs and LPCs ..................... 139
5.1 INTRODUCTION .............................................................................................. 140
5.2 RESULTS ........................................................................................................ 143
5.3 DISCUSSION ................................................................................................... 166
5.4 Summary and future directions ......................................................................... 171
CHAPTER 6 Validation of miRNA targets and the role of microRNAs in HSC and
LPC biology .............................................................................................................. 172
6.1 INTRODUCTION .............................................................................................. 173
6.2 RESULTS ........................................................................................................ 176
6.3 DISCUSSION ................................................................................................... 216
6.4 Summary and future directions ......................................................................... 228
CHAPTER 7 General discussion .............................................................................. 229
7.1 Chapter contribution ......................................................................................... 230
CHAPTER 8 References ........................................................................................... 238
CHAPTER 9 Appendices ………………………………………………………………….268

xiv
List of Figures
Figure 1.1. Classification of CFTR mutations. ..................................................................... 5
Figure 3.1. Liver stiffness measurements (LSM) in healthy controls, CFnoLD and CFLD
children............................................................................................................................. 70
Figure 3.2. Diagnostic assessment of SSWE for the discrimination of CFLD. ................... 71
Figure 3.3. CART decision tree for predicting liver disease in children with CF. ............... 73
Figure 3.4. ROC curves for assessment of hepatic fibrosis severity in CFLD. .................. 74
Figure 4.1. miRNA library distribution. .............................................................................. 92
Figure 4.2. Relative serum miRNA expression levels in CFLD, CFnoLD and Control groups.
....................................................................................................................................... 118
Figure 4.3.Relative serum miRNA expression and APRI levels in CFLD F0 fibrosis vs.
CFnoLD. ......................................................................................................................... 120
Figure 4.4. ROC curves for the discrimination of CFLD vs CFnoLD................................ 122
Figure 4.5. Association between relative serum miRNA expression and hepatic fibrosis
staging in CFLD. ............................................................................................................. 124
Figure 4.6. ROC curves for assessment of CFLD severity. ............................................. 127
Figure 4.7. Scatterplots of serum miRNAs versus lung function. ................................... 132
Figure 5.1. BMOL pulldown assay for let7g-5p putative target identification. .................. 149
Figure 5.2. BMOL pulldown assay for miR-142-3p putative target identification. ............ 150
Figure 5.3. BMOL pulldown assay for miR-34a-5p putative target identification. ............ 151
Figure 5.4. BMOL pulldown assay for miR-365a-3p putative target identification. .......... 152
Figure 5.5. LX2 pulldown assay for let7g-5p putative target identification. ...................... 153
Figure 5.6. LX2 pulldown assay for miR-142-3p putative target identification. ................ 154
Figure 5.7. LX2 pulldown assay for miR-34a-5p putative target identification. ................ 155
Figure 5.8. LX2 pulldown assay for miR-365a-3p putative target identification. .............. 156
Figure 5.9. Comparison of pulldown experimental assay and bioinformatics predicted
targets. ........................................................................................................................... 157

xv
Figure 6.1. qRT-PCR assessment of putative let7g-5p targets in BMOL cells. ............... 177
Figure 6.2. qRT-PCR assessment of putative miR-34a-5p targets in BMOL cells. .......... 178
Figure 6.3. qRT-PCR assessment of putative miR-365a-3p targets in BMOL cells. ........ 179
Figure 6.4. qRT-PCR assessment of differentiation markers on BMOL cells transfected with
let7g-5p. ......................................................................................................................... 181
Figure 6.5. qRT-PCR assessment of differentiation markers on BMOL cells transfected with
miR-34a-5p. ................................................................................................................... 182
Figure 6.6. qRT-PCR assessment of differentiation markers on BMOL cells transfected with
miR-365a-3p................................................................................................................... 183
Figure 6.7. Western blot assessment of cholangiocyte and hepatocyte proteins in BMOL
cells transiently transfected with let7g-5p. ...................................................................... 184
Figure 6.8. BMOL functional assays for let7g-5p. ........................................................... 185
Figure 6.9. BMOL functional assays for miR-34a-5p. ..................................................... 186
Figure 6.10. BMOL functional assays for miR-365a-3p................................................... 187
Figure 6.11. qRT-PCR assessment of putative let7g-5p targets in LX2 cells. ................. 189
Figure 6.12. qRT-PCR assessment of putative miR-142-3p targets in LX2 . ................... 190
Figure 6.13. qRT-PCR assessment of putative miR-34a-5p targets in LX2 cells. ........... 191
Figure 6.14. qRT-PCR assessment of putative miR-365a-3p targets in LX2 cells........... 192
Figure 6.15. qRT-PCR assessment of HSC activation and quiescence markers on LX2 cells
transfected with let7g-5p. ............................................................................................... 194
Figure 6.16. qRT-PCR assessment of HSC activation and quiescence markers on LX2 cells
transfected with miR-142-3p. .......................................................................................... 196
Figure 6.17. qRT-PCR assessment of HSC activation and quiescence markers on LX2 cells
transfected with miR-34a-5p. .......................................................................................... 198
Figure 6.18. qRT-PCR assessment of HSC activation and quiescence markers on LX2 cells
transfected with miR-365a-3p. ........................................................................................ 200
Figure 6.19. Transduction of LX2 cells using lentivirus miRNA constructs. ..................... 202
Figure 6.20. LX2 functional assays for let7g-5p. ............................................................. 203

xvi
Figure 6.21. LX2 functional assays for miR-142-3p. ....................................................... 204
Figure 6.22. LX2 functional assays for miR-34a-5p. ....................................................... 205
Figure 6.23. LX2 functional assays for miR-365a-3p. ..................................................... 206
Figure 6.24. qRT-PCR assessment of HSC activation markers on LX2 cells transduced with
let7g-5p. ......................................................................................................................... 207
Figure 6.25. qRT-PCR assessment of HSC activation markers on LX2 cells transduced with
miR-365a-3p................................................................................................................... 208
Figure 6.26. Let7g-5p pulldown putative targets interacting with genes associated with HSC
activation. ....................................................................................................................... 211
Figure 6.27. miR-365a-3p pulldown putative targets interacting with genes associated with
HSC activation. ............................................................................................................... 212
Figure 6.28. Dual luciferase assay of validated LX2 let7g-5p targets. ............................. 214
Figure 6.29. Dual luciferase assay of validated LX2 miR-365a-3p targets. ..................... 215
Figure 6.30. Potential mechanistic role of let7g-5p and miR-365a-3p in the synthesis of
collagen. ......................................................................................................................... 225
xvii
List of Tables
Table 1.1. Bile acid toxic effects. ........................................................................................ 9
Table 1.2. CFLD classification. ......................................................................................... 11
Table 1.3. Current accepted CFLD definitions. ................................................................. 13
Table 1.4. Clinical value of liver biopsy in paediatric chronic liver diseases. ..................... 14
Table 1.5. miRNA target identification parameters. ........................................................... 25
Table 2.1. miRNA mimics. ................................................................................................ 36
Table 2.2. Lenti-miRNA viral particles used for LX2 transduction. .................................... 37
Table 2.3. Biotinylated miRNA duplexes. .......................................................................... 39
Table 2.4.Primary antibodies used for Western blot analysis. ........................................... 41
Table 2.5. miRNA 3’UTR target clones used during luciferase assay. .............................. 43
Table 2.6. miRNA primer sequences. ............................................................................... 51
Table 2.7. BMOL self-designed RNA primer sequences. .................................................. 53
Table 2.8.LX2 self-designed RNA primer sequences. ...................................................... 54
Table 2.9.Commercial RNA primer sequences. ................................................................ 55
Table 3.1. Patient characteristics. ..................................................................................... 68
Table 3.2. Assessment of LSM progression. .................................................................... 76
Table 3.3. Yearly LSM follow-up. ...................................................................................... 77
Table 3.4. Correlations of LSM with patient demographics, liver related serum enzymes and
APRI. ................................................................................................................................ 78
Table 4.1. Patient characteristics ...................................................................................... 90
Table 4.2. miRNA sequence summary. ............................................................................ 93
Table 4.3. Differentially expressed miRNAs ...................................................................... 94
Table 4.4.Differentially expressed miRNAs in CFLD vs CFnoLD children. ...................... 116
Table 4.5. Logistic regression model for discriminating liver disease in CF..................... 123
Table 4.6. Differentially expressed miRNAs between fibrotic stages in CFLD children. .. 126

xviii
Table 4.7. Diagnostic test accuracy to predict severity in CFLD. .................................... 128
Table 4.8. Correlations of circulatory miRNA levels with liver related serum enzymes and
APRI. .............................................................................................................................. 130
Table 5.1. BMOL RNA-sequence summary. ................................................................... 144
Table 5.2. LX2 RNA-sequence summary........................................................................ 146
Table 5.3. BMOL RNA putative mRNA targets summary. ............................................... 148
Table 5.4. LX2 RNA putative mRNA targets summary. ................................................... 152
Table 5.5. Gene set enrichment analysis (IPA). .............................................................. 158
Table 5.6. Selected putative miRNA targets in BMOL cells. ........................................... 161
Table 5.7. Selected putative miRNA targets in LX2 cells. ............................................... 163
Table 6.1. Let7g-5p putative targets mediating HSC activation markers. ........................ 209
Table 6.2. miR-365a-3p putative targets mediating HSC activation markers. ................. 210
xix
List of Abbreviations
%FEV1p Percent predicted forced expiratory volume in one second
∆∆CT Comparative CT method
95% CI 95% confidence interval
A Adenine
ABC ATP-binding cassette
Acvr2a Activin A receptor 2A
Adam17 ADAM Metallopeptidase domain 17
AGO Argonaute
AIH Autoimmune hepatitis
Akt3 AKT serine/threonine kinase 3
ALP Alkaline phosphatase
ALT Alanine amino transferase
AMOT Angiomotin
ANOVA One-way analysis of variance
Appl2 Adaptor protein phosphotyrosine zipper 2
APRI Aspartate aminotransferase (AST) to platelet ratio index
APS Ammonium persulfate
ARFI Acoustic radiation force impulse
AS Alagille syndrome
AST Aspartate amino transferase
ATL A-tailing mix
AUC Area under the curve
AUROC Area under the receiver operating characteristic curve
BA Biliary atresia
BBB Bead binding buffer
BL Base line
BMI Body mass index
BMOL Bipotential murine oval cell line
bp Base pairs
BWB Bead washing buffer
CART Classification and Regression tree modelling
CD109 CD109 molecule;
CD248 Endosialin

xx
CF Cystic fibrosis
CFLD Cystic fibrosis-associated liver disease
CFnoLD CF with no liver disease
CFTR Cystic fibrosis transmembrane conductance regulator
CI Confidence interval
COL4A1 Collagen type IV α-1
COL4A2 Collagen type IV α-2
COL4A5 Collagen type IV α-5;
Cq Quantification cycle
Crkl CRK like proto-oncogene
CSNK1G2 Casein kinase 1 γ-2
c-statistic Concordance statistic
CTA A-tailing control
CTE End repair control
CTL Ligation control
Cx3cr1 C-X3-C Motif chemokine receptor 1
DDX5 DEAD-Box helicase 5
DR The ductular reaction
Dvl3 Dishevelled segment polarity protein 3
E Young’s modulus
ECM Extracellular matrix
EFSUMB European Federation of Societies for Ultrasound in Medicine and Biology
ELB Elution buffer
Ep300 E1A Binding protein P300
EP300 E1A Binding protein P300
ESPGHAN European Society for Paediatric Gastroenterology, Hepatology and Nutrition
Ets1 ETS proto-oncogene 1
F Phenylalanine
F0 No fibrosis
F1 Portal fibrosis only (minimal scaring)
F2 Portal fibrosis with rare fibrous septa
F3 Portal fibrosis with numerous fibrous septa
F4 Cirrhosis
xxi
FBC Focal biliary cirrhosis
FBS Foetal bovine serum
FC Fold change
FDR False discovery rate
FIB-4 Fibrosis 4
FIC1 Familial intrahepatic cholestasis type 1
FPF Fragment prime finish mix
FSA First strand synthesis act D
FU Follow-up
Fzd2 Frizzled class receptor 2
GATA4 GATA binding protein 4
GEO Gene Expression Omnibus
GGT γ-glutamyl transferase
GLI3 Glioma-associated oncogene family zinc finger 3
GRC Genomics Research Centre
GSEA Gene set enrichment analysis
HCC Hepatocellular carcinoma
Hnf4α Hepatocyte nuclear factor 4α
HNRNPA1 Heterogenous nuclear ribonucleoprotein A1
HSC Hepatic stellate cells
IDT Integrated DNA technologies
IL1RAP Interleukin 1 receptor accessory protein
IMB Institute for Molecular Bioscience
IPA Ingenuity Pathway Analysis
IQR Interquartile range
IRC Inter-run calibrator
ISPs Ion Sphere Particles
Itga2 Integrin α-2
K Rate constant
kPa Kilopascals
LATS1 Large tumor supressor kinase 1
Lenti miR LX2 cells transduced with miRNA of interest
Lenti NegCtrl LX2 cells transduced with miRNA negative control
LIG Ligation mix
logCPM Log-counts per million

xxii
logFC Log-fold change
LPC Liver progenitor cells
LSM Liver stiffness measurement
LT-β Lymphotoxin-β
LX2 Lieming Xu-2 human hepatic stellate cell line
M Median
M value Expression stability value
m/s meters/second
MAP3K1 Mitogen activated protein kinase kinase kinase 1
MAP3K9 Mitogen activated protein kinase kinase kinase 9
miRISC miRNA-induced silencing complex
miRNA microRNA
MMP-1 Matrix metalloproteinase-1
MOI Multiplicity of infection
MYD88 Myeloid differentiation primary response 88
n Number
NA Not available
NaCl Sodium chloride
NAFLD Non-alcoholic fatty liver disease
Nfkβ1 Nuclear factor Kappa β-1
NGS Next-generation sequencing
NOX2 NADPH oxidase
NR1D1 Nuclear receptor-1 group D-1
nt Nucleotides
NUPR1 Nuclear protein 1
ORF Open reading frame
P P-value
PAMPs Pathogen associated molecular patterns
PBS Phosphate buffered saline
PD Pulldown
PH Prolyl hydroxylase
PHOX Phagocytic NADPH oxidase
PHT Portal hypertension
PILBDs Paucity of interlobular bile ducts
PMM PCR master mix

xxiii
PPC PCR primer cocktail
pre-miRNA Precursor miRNA
pri-miRNAs Primary miRNAs
Prob Probability
pSWE Point shear-wave elastography
Ptch1 Patched 1
PTCH1 Patched 1
Ptpn11 Protein tyrosine phosphatase 11
QBI Queensland Brain Institute
QC Quality control
qRT-PCR Reverse transcription-quantitative polymerase chain reaction
RBP RNA purification beads
RBP RNA binding proteins
RFX5 Regulatory factor X5
RFXAP Regulatory factor X associated protein
RISC RNA-induced silencing complex
RNases Ribonucleases
ROC Receiver operating characteristics
Rock1 Rho associated coiled-coil containing protein kinase 1
ROCK1 Rho associated coiled-coil containing protein kinase 1
ROI Region of interest
ROS Reactive oxygen species
rs Spearman's correlation coefficient
RSB Resuspension buffer
RT Reverse transcription
S Small
SAV1 Salvador family WW domain 1
SD Standard deviation
SEM Standard error of mean
SMAD3 Mothers against decapentaplegic homolog 3
SNPs Single nucleotide polymorphisms
SP1 Specificity protein 1
SSM Second strand marking master mix
SSWE Supersonic shearwave elastography

xxiv
STL Stop ligation buffer
TE Transient elastography
TEAD1 TEA Domain transcription factor 1
TEM Transmission electron microscopy
TEMED Tetramethylethylenediamine
TGF- β1 Transforming growth factor-β1
TGFβR1 Transforming growth factor-β receptor 1
TGFβRI TGFβ-receptor 1
TIMP-1 Tissue inhibitor of metalloproteinase 1
TIMP-4 Tissue inhibitor of metalloproteinase 4
TLR4 Toll like receptor 4
TNFα Tumour necrosis-α
TWEAK TNF-related weak inducer of apoptosis
UDCA Ursodeoxycholic acid
UTR Untranslated region
V Volts
VCL Vinculin
WD Wilson disease
WFUMB World Federation for Ultrasound in Medicine and Biology
WHO World Health Organization
WWC1 WW and C2 domain containing 1
XL Extra Large
Y Year

1
CHAPTER 1
Introduction and literature review ……
2
1.1 Chapter contribution
The microRNA sections on this chapter (1.13.2.2; 1.13.3;1.13.4; 1.13.5 and 1.13.6)
have been published in the following review article:
Calvopina DA, Coleman MA, Lewindon PJ, Ramm GA. Function and Regulation of
MicroRNAs and Their Potential as Biomarkers in Paediatric Liver Disease.
International Journal of Molecular Sciences 2016; 17:1795.
Diego A. Calvopina researched the content, wrote the manuscript and designed
tables and figures.
Miranda A. Coleman, Peter J. Lewindon and Grant A. Ramm edited, revised and
approved the content of the literature review.
3
1.2 INTRODUCTION
Chronic liver disease remains a growing burden for the health care system. Over the
past two decades a concerted research effort has taken place internationally to better
understand the aetiology and mechanisms associated with the development of
paediatric liver diseases. One driving force has been that liver disease with onset
during childhood is a precursor of chronic liver disease in adults. Prevention as well
as better clinical management of these liver diseases at an early stage can expect to
have major long-term impacts not just for individual patient care but also the whole
community.
In the US alone, approximately 15000 children are hospitalized for liver disease every
year (1). However, the relative lack of epidemiological research studies in children
masks the true prevalence of chronic liver disease which is likely underestimated.
Paediatric liver disease has an important impact on health care costs, leads to
premature death and impacts on quality of life in affected children. Paediatric liver
diseases are often diagnosed late, mainly due to the lack of symptoms during early
stages. The diagnosis is challenging when symptoms are non-specific such as loss of
appetite, abdominal pain or fatigue. Recent advances in the availability, accuracy and
affordability of molecular techniques and genetic testing have resulted in more routine
use in the clinic improving diagnosis and disease management. This has also lead to
a renewed focus on hereditary diseases such as cystic fibrosis (CF)-associated liver
disease (CFLD).
This literature review will discuss the epidemiology and pathogenesis of CFLD as well
as a brief overview of possible mechanisms by which hepatic injury occurs in some
patients with CF. There remain significant challenges in the diagnosis and assessment
of disease severity in paediatric CFLD, thus the following review will also discuss
current research approaches to provide better, novel diagnostic methods for CFLD
detection which will provide a preface to the research conducted in my PhD project.
4
1.3 Cystic fibrosis
Cystic fibrosis (CF) is the most common, lethal, inherited autosomal recessive disorder
in Caucasian populations, widespread especially in western countries. CF is caused
by a mutation on chromosome 7 encoding the cystic fibrosis transmembrane
conductance regulator (CFTR) protein (2). CFTR is expressed on the apical
membrane of epithelial cells in multiple organs including lungs, sweat glands, vas
deferens, pancreas, liver and intestines. To date more than 2000 mutations have been
described (3), the most common being a deletion of phenylalanine (F) at position 508
(∆F508), which encodes a binding domain of CFTR.
CFTR is part of the ATP-binding cassette (ABC) transporters which function as a
cAMP-dependent chloride channel (4), maintaining pH levels and diluting fluid
secretions (5). Defects in CFTR result in the inability of the organ duct lumen to hydrate
macromolecules which precipitate into concentrated, viscous secretions. As a
consequence of this precipitation, ductular fluid flow is reduced and properties of
secretions change, resulting in ductular or glandular plugging that culminates in
exocrine organ damage and the manifestations of CF (6, 7). CFTR mutations are
classified into six groups depending on the predicted functional consequences of the
mutation. Class I mutations produce non-functional proteins due to defective
biosynthesis. Class II mutations (includes ∆F508) result in a misfolded CFTR that is
intracellularly degraded. Class III mutations disrupt channel activation by preventing
hydrolysis of ATP at a binding domain of CFTR. Class IV mutations produce a
defective anion conduction protein due to abnormal splicing or promoter mutations.
Class V mutations are characterized by a reduction in functional CFTR proteins on the
apical surface. Class VI mutations produce a functional but unstable CFTR protein
due to a truncation at the C-terminus of CFTR (8) (Figure 1.1)

5
Figure 1.1. Classification of CFTR mutations.
Mutations in the cystic fibrosis transmembrane conductance regulator gene (CFTR). Classes I-III produce non-functional chloride channels (most
severe form of the disease), whereas classes IV-VI produce chloride channels with decreased activity (adapted from (9))

6
1.4 Epidemiology of cystic fibrosis liver disease (CFLD)
During recent decades the median life span of patients with CF has dramatically
improved, thanks to improved management of respiratory complications associated
with CF. In western countries the prevalence of CF is expected to increase by 50% in
2025, corresponding to 20% and 75% in children and adults respectively (10). Life
expectancy in CF has improved from 34.0 years during the period 1991-1995 to a
mean of 47.7 years in 2016 (11) and is now expected to exceed 50 years for infants
born after the year 2000 (12). This improvement in life expectancy has exposed a rise
in non-respiratory complications of CF such as CFLD, which is the leading cause of
non-respiratory mortality associated with CF. According to the World Health
Organization (WHO), CF affects 1 out of 2500 newborns (13), 15.6% of which develop
clinically significant liver abnormalities and 5% that develop significant morbidity
culminating in cirrhosis and death or transplantation (14). CFLD usually develops
during the first decade of life and presenting with significant clinical manifestation
during the second decade.
1.5 Pathogenesis of CFLD
CFTR is expressed on the apical membrane of cholangiocytes and gall bladder
epithelium (15). It regulates fluid and electrolyte content and therefore controls
intrahepatic biliary ductal secretion by increasing chloride transport and bile flow.
Malfunction or absence of CFTR affects chloride channels, decreasing bile flow.
Thickened secretions produce blockage of bile ducts which leads to acute and chronic
periductal inflammation, hepatic and cholangiocyte injury, bile duct proliferation and
depletion of hepatic antioxidants, which results in fibrosis of portal tracts.
CFLD is characterized by non-uniform portal tract abnormalities including focal biliary
fibrosis, which in some patients can lead to focal biliary cirrhosis (FBC) and eventually
multilobular biliary cirrhosis. Hepatic stellate cells (HSC) play an important role in
7
wound healing associated with liver regeneration as the main cells responsible for the
synthesis of fibrotic tissue in the liver following activation and transformation into
myofibroblast-like cells. In the early stages of liver injury HSCs are activated, probably
by increased levels of hydrophobic bile acids, causing damage to hepatocytes which
secrete HSC-stimulating growth factors and cytokines (16-18). As a result,
extracellular matrix (ECM) composition changes, enriching fibril-forming collagens
which increases ECM density and matrix stiffness. Activated HSCs generate scar
tissue as part of the wound healing process, which leads to fibrogenesis and
eventually to liver disease. As fibrosis advances, collagenous bands are formed
containing large numbers of activated HSCs that impede portal blood flow. Failure to
degrade fibril-forming collagens and scar matrix is an important determinant in fibrosis
progression. When liver injury persists, HSC activation and excessive collagen
deposition leads to FBC and in some cases multilobular cirrhosis (17).
An alternative hypothesis (and potentially additive mechanism) for the pathogenesis
of CFLD suggests that other factor such as CF-specific bacterial colonisation,
infections, constant exposure to antibiotic treatment and increased permeability of
intestines of CF patients contribute to the development of CFLD (19). This increased
permeability together with increased presence of an adverse CF microbiota leads to
the absorption of pathogen associated molecular patterns (PAMPs) to the portal
circulation, stimulating inflammation and fibrosis (20). Inflammation has been well
documented to participate in liver fibrogenesis (21, 22) and studies have shown
increased permeability in CF patients by several methods (23-25). Similarly, it has
been proposed that the leaky gut phenomenon is also responsible for the development
of fibrosis and portal hypertension (26), as shown by increased intestinal inflammatory
lesions and slower small bowel transit in cirrhotic CF patients (19). Altered permeability
(leaky gut) was present in >95% of CFLD patients and more important, the faecal
microbiome composition of these patients was significantly different compared to
patients that did not have liver disease (19).

8
Several risk factors have been associated with the development of CFLD. These risk
factors include the most severe CFTR mutations classes I-III, male sex, history of
meconium ileus or carriers of the SERPINA1 Z allele (27-29).
1.6 Mechanisms of fibrosis in CFLD
The accumulation of bile acids due to cholestasis and plugging of bile ducts has a toxic
effect on different liver cell types, including HSCs. Bile acids are a product of
cholesterol metabolism generated in hepatocytes that are secreted into bile ducts
where they are stabilised by bicarbonate ions and water from cholangiocytes as they
transit from the liver into the gall bladder. Their main function is to aid in the
solubilisation and absorption of lipids and lipid-soluble vitamins, after which bile acids
are recycled into the liver through the portal venous system. Bile acids are polar due
to their role in lipid absorption and digestion, which makes them toxic to hepatocellular
membranes (30). Bile toxicity is determined by its polarity; the more hydrophobic the
bile acid, the more toxic compared to hydrophilic bile acids (30).
Bile acid composition is altered in CFLD children and plays a role in the progression
of liver injury (16). Correlation exists between serum cholic acids and staging of
hepatic fibrosis in CFLD patients. Ursodeoxycholic acid (UDCA), a hydrophilic bile
acid, is increased in CF children with no liver disease (CFnoLD) compared to CFLD,
suggesting a protective function in the liver (16). In contrast, the hydrophobic bile acid
taurocholate has been shown to be significantly increased in bile and serum of CFLD
children (31). As with others bile acids, taurocholate increases the expression of
inflammatory genes in the liver, stimulating cytokine secretion and HSC migration (31-
34). Hepatocellular injury produced by bile acid toxicity results in the activation of
quiescent HSCs into collagen-producing myofibroblasts. Bile acid toxic effects are
listed in Table 1.1.

9
Table 1.1. Bile acid toxic effects.
Toxicity effect Activation mechanism on HSC
Apoptosis Degradation of cellular components to
apoptotic bodies phagocyte by Kupffer
cells and HSCs (35-37)
Reactive oxygen species (ROS) Lipid peroxidation metabolites
produced by impaired electron
transport in mitochondria of liver cells
(38, 39)
Phagocytic NADPH oxidase (PHOX) Catalyses production of ROS in
Kupffer cells, which produce tumour
necrosis-α (TNF-α) that activates
HSCs (40, 41)
NADPH oxidase (NOX2) Induce oxidative stress directly in
HSCs (40, 42)
Necrosis At high concentrations, hydrophobic
bile acids have detergent action and
cell necrosis is predominant (43)
1.7 Ductular reaction
During acute injury of the liver, hepatocyte-mediated liver regeneration predominates
(44). In the case of severe or chronic injury, bipotential adult stem-like cells termed
liver progenitor cells (LPCs) are activated in periportal regions of the liver or the Canals
of Hering (45). These progenitor cells have the capacity to differentiate into biliary
epithelial cells and hepatocytes. The ductular reaction (DR) refers to the phenotypic
reaction of LPCs that differentiates into biliary epithelia (46). During chronic liver
injury, the disorganised DR affects liver architecture producing bile duct hyperplasia
or proliferation. Furthermore, the DR not only manifests as a proliferation of bile ducts,

10
but also with infiltration of inflammatory cells in portal areas which contribute to
fibrogenesis and progression of liver injury (47). LPCs are found in close association
with other liver cells including HSCs and macrophages (48) which incorporates the
LPC niche. Cellular interactions occurring in this niche are driven via different
signalling pathways involving Wnt, Notch or Hedgehog (49, 50).
A clear correlation exists between the DR and the severity of fibrosis across various
liver pathologies including biliary atresia, chronic hepatitis C, non-alcoholic
steatohepatitis and CFLD among others (51-55). Animal model studies have shown
that reduced numbers of LPCs are associated with a reduction in liver fibrosis (56). In
contrast, increased numbers of LPCs are reflected in an increase in liver fibrosis (57).
In fact, proinflammatory and profibrogenic factors released by LPCs and cells of the
DR are hypothesised to interact with HSCs playing an important role in fibrogenesis
(58).
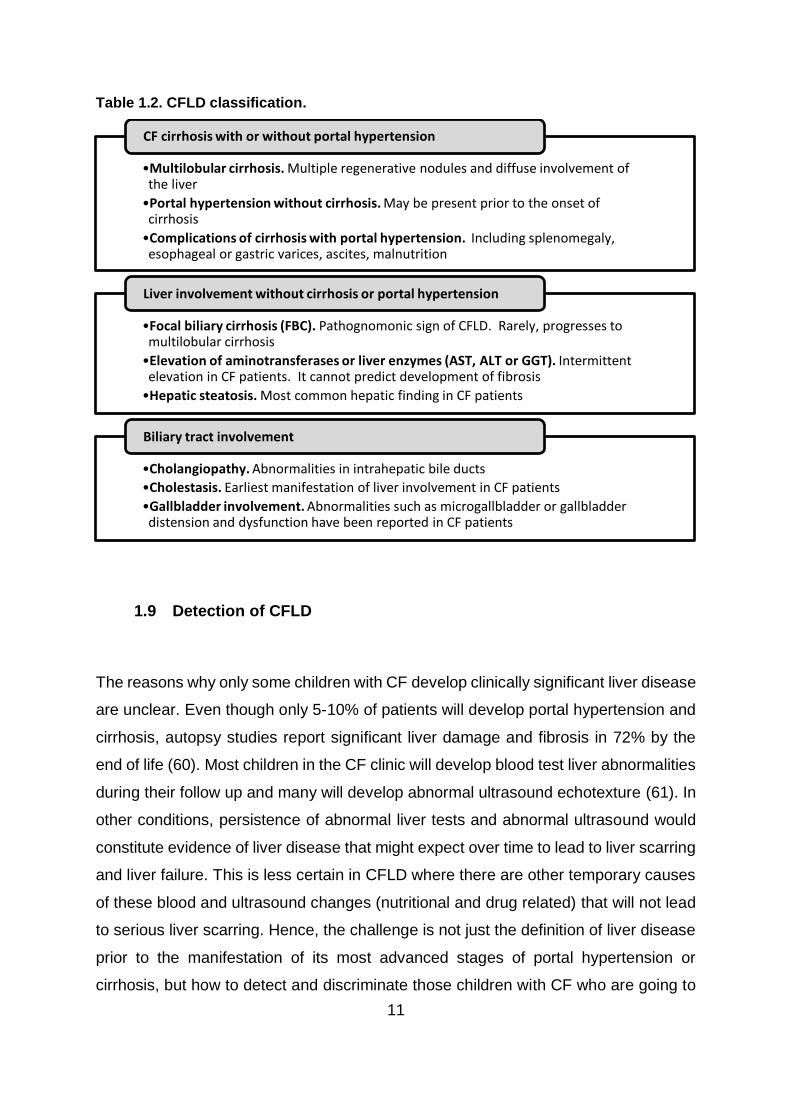
1.8 Manifestations of CFLD
Different definitions and classifications have been used for the diagnosis of CFLD,
including the use of clinical assessment and/or biochemical signs of liver disease.
However, the variability in definitions between different centres and indeed countries
makes CFLD classification challenging. In 2007, the Cystic Fibrosis Foundation in the
United States proposed a classification system based on phenotypic characterization
of liver involvement, separating cirrhosis with or without portal hypertension from other
liver diseases in an attempt to standardised international reporting data (59) (see
Table 1.2).
11
Table 1.2. CFLD classification.
1.9 Detection of CFLD
The reasons why only some children with CF develop clinically significant liver disease
are unclear. Even though only 5-10% of patients will develop portal hypertension and
cirrhosis, autopsy studies report significant liver damage and fibrosis in 72% by the
end of life (60). Most children in the CF clinic will develop blood test liver abnormalities
during their follow up and many will develop abnormal ultrasound echotexture (61). In
other conditions, persistence of abnormal liver tests and abnormal ultrasound would
constitute evidence of liver disease that might expect over time to lead to liver scarring
and liver failure. This is less certain in CFLD where there are other temporary causes
of these blood and ultrasound changes (nutritional and drug related) that will not lead
to serious liver scarring. Hence, the challenge is not just the definition of liver disease
prior to the manifestation of its most advanced stages of portal hypertension or
cirrhosis, but how to detect and discriminate those children with CF who are going to
•Multilobular cirrhosis. Multiple regenerative nodules and diffuse involvement of the liver
•Portal hypertension without cirrhosis. May be present prior to the onset of cirrhosis
•Complications of cirrhosis with portal hypertension. Including splenomegaly, esophageal or gastric varices, ascites, malnutrition
CF cirrhosis with or without portal hypertension
•Focal biliary cirrhosis (FBC). Pathognomonic sign of CFLD. Rarely, progresses to multilobular cirrhosis
•Elevation of aminotransferases or liver enzymes (AST, ALT or GGT). Intermittent elevation in CF patients. It cannot predict development of fibrosis
•Hepatic steatosis. Most common hepatic finding in CF patients
Liver involvement without cirrhosis or portal hypertension
•Cholangiopathy. Abnormalities in intrahepatic bile ducts
•Cholestasis. Earliest manifestation of liver involvement in CF patients
•Gallbladder involvement. Abnormalities such as microgallbladder or gallbladder distension and dysfunction have been reported in CF patients
Biliary tract involvement

12
develop clinically significant and life changing liver scarring from those who will not,
and to detect it early enough to permit and develop interventions to improve later
outcomes. Therefore, early detection of CFLD is crucial for better clinical management
and in identifying patients at risk of developing cirrhosis and portal hypertension (59).
However, paediatric liver diseases are often missed or diagnosed late, mainly due to
the lack of symptoms in early stages of the disease. CFLD is frequently asymptomatic
and shows a wide spectrum of manifestations. The lack of a uniform clinical definition
and classification for CFLD only contributes to an already challenging identification.
Currently, there are two accepted definitions for CFLD. In North America, CFLD is
classified by the presence of advanced liver damage with cirrhosis/portal hypertension
or liver abnormalities such as persistent elevation of liver enzymes, steatosis, fibrosis,
cholangiopathy and/or abnormal ultrasound findings (59) (Table 1.3). In Europe,
following the guidelines and recommendations by the European Society for Paediatric
Gastroenterology, Hepatology and Nutrition (ESPGHAN), CFLD should be considered
when at least two of the following conditions are present after the exclusion of
steatosis: abnormal physical examination defined by the presence of hepatomegaly
and/or splenomegaly, persistent abnormalities of liver function test defined as increase
levels of transaminases (AST and ALT) and GGT above 1.5 times the upper normal
limit over 12 months and evidence of liver involvement by ultrasonographic means or
portal hypertension (62) (Table 1.3).

13
Table 1.3. Current accepted CFLD definitions.
North America* (CFLD classification)
Europe** (considered with at least two of the following characteristics)
CFLD with cirrhosis/portal hypertension. Based on:
Clinical exam
Imaging
Histology
Laparoscopy
Hepatomegaly
Increased liver span relative to age or 2cm below mid-clavicular line
Prominent left lobe in epigastrium in cases of multilobular cirrhosis
Splenomegaly
Confirmed by ultrasound
Liver involvement without cirrhosis/portal hypertension. Consisting of at least one of the following:
Persistent elevation AST, ALT, GGT>2 times upper limit or intermittent elevation above laboratory values
Steatosis (histologic determination)
Fibrosis (histologic determination)
Cholangiopathy (based on ultrasound, MRI, CT)
Ultrasound abnormalities not consistent with cirrhosis
Abnormal liver function tests (above upper normal limit over 12 months)
Increase transaminases levels (AST and ALT)
Increase GGT levels
Preclinical. No evidence of liver disease.
Liver involvement by ultrasonographic means
Increased and/or heterogeneous echogenicity
Irregular margins
Nodularity
Portal hypertension
Increased thickness of lesser omentum
Splenorenal anastomosis
Ascites * Adapted from Flass et al. (59). ** Adapted from Debray et al. (62).
Both definitions use non-specific diagnostic criteria and prioritise advanced liver
disease and cirrhosis against early phases of the development of the disease that
could lead to epidemiological confusion, as discussed by Debray et al. (60) and thus,
a common definition of CFLD and a better and standardized method for CFLD
diagnosis are necessary.

14
1.10 Liver biopsy
Liver biopsy is considered the ‘gold standard’ to assess disease severity, in particular
fibrosis, and stratify paediatric liver disease. Since its introduction in the decade of
1950 (63) several improvements such as dual-pass liver biopsy which increased the
predictive value of liver biopsy in CFLD (64) have been implemented, however, there
are still major limitations in its use. When combined with histopathological techniques
such as transmission electron microscopy (TEM) or immunohistochemistry, liver
biopsy can be a powerful tool for assessing liver diseases. Constant improvements
understanding the aetiology, molecular basis and treatment of paediatric liver diseases
have determined the indications in which liver biopsy is advised. In children these
indications include forms of cholestasis, autoimmune hepatitis, metabolic liver
disorders or viral hepatitis as summarised in Table 1.4.
Table 1.4. Clinical value of liver biopsy in paediatric chronic liver diseases.
Disease Value of liver biopsy
Histopathological findings
Comments
Biliary atresia (BA) Diagnostic Ductular reaction, bile plugs, portal-tract expansion by
oedema and fibrosis
90% diagnostic accuracy
(experienced pathologist) (65).
Α1-antitrypsin disorder
Diagnostic Granular cytoplasmic bodies
stained with periodic acid-Schiff stain after diastase
digestion
Not required for diagnostic.
Unclear if helpfully reflect liver
disease severity (66)

15
Disease Value of liver biopsy
Histopathological findings
Comments
Alagille syndrome (AS)
Diagnostic Paucity of interlobular bile ducts (PILBDs)
PILBDs may not be present in
young infants (67)
Familial intrahepatic
cholestasis type 1 (FIC1)
Diagnostic Canalicular cholestasis and hepatocellular
ballooning
TEM of sample containing
coarsely and loosely granular
canalicular content (68)
Cystic fibrosis liver disease (CFLD)
Diagnostic Steatosis or focal biliary cirrhosis
Lesions focally distributed
Non-alcoholic fatty liver disease
(NAFLD)
Diagnostic Increased inflammation in
portal tracts, steatosis with less
Mallory hyaline bodies
Liver biopsy required for
definitive diagnosis. It
excludes other diseases if
advanced disease is suspected (69)
Autoimmune hepatitis (AIH)
Diagnostic Dense mononuclear and
plasma cell filtration, interface
hepatitis, parenchymal
collapse
Liver biopsy necessary to
confirm diagnosis and mandatory to
document absence of
inflammation(70)
Wilson disease (WD)
Diagnostic Liver copper content ≥250µg/g
(dry tissue)
Sampling error in paediatric patients can render test as
unreliable in patients with cirrhosis and
evidence of WD (71)
Viral hepatitis (hepatitis B and
hepatitis C)
Diagnostic
Prognostic
Grade of inflammation and stage of fibrosis
Liver biopsy recommended for compensated liver
disease before initiating therapy
for hepatitis B (72)

16
The standard represents 1/50000th of the entire liver. It is estimated that 11 complete
portal tracts and a diameter of between 1.2 and 1.8 mm with a length from 7 to 9 cm
is required to adequately diagnose chronic hepatopathies (73, 74). The small size of
the biopsy sample and the focal nature of liver diseases, especially CFLD, can
misrepresent the overall liver histology. In these cases, a dual pass liver biopsy can
improve the detection of fibrosis as has been reported in paediatric CFLD (64).
Liver biopsy needs special consideration when performed in children. Lack of patient
cooperation requires the use of general anaesthesia in an operating room for the
procedure, which makes liver biopsy more complex and expensive than in adults. Inter
and intra-observation variation is a limiting factor in the interpretation of liver biopsy
(75), which highlights the need for experienced pathologists. Inexperience accounts
for 25% of all misdiagnosed cases (76).
Complications of biopsy can be categorised as either major or minor. Minor
complications include pain, subcapsular bleeding without transfusion, infection, bile
leak or haemobilia and arteriovenous fistula. Major complications include bleeding,
haemobilia (requiring transfusion, surgery or intensive care management),
pneumothorax or haemothorax and death (77). Minor complications generally occur
during the first two hours after biopsy in 60% of cases, whereas major complications
occur within the first 24 hours in 96% of cases (78).
Bleeding in which haemodynamic repercussion or transfusion is required, occurs in 1
of 10000 biopsies in adults (79). In children bleeding has been reported in 2.8% of
cases (80), with this incidence increased to 15% in children with oncological disease
(81). A recent study reports an increased risk of bleeding in patients with focal lesions
and administrated with low molecular weight heparin (82). Moreover the same study
shows that routine ultrasonography after liver biopsy revealed unsuspected
haemorrhage in 2.6% of the cases (82).

17
Pain is the most common informed complication after biopsy. Pain is reported at the
site of puncture or as referred pain in the right shoulder. It affects 84% of adult
patients; however no studies have been conducted in children (83). As a less common
complication, only one case of arteriovenous fistula with a fatal outcome has been
shown after transplantation (84). Similarly, there is only one case (0.2%) of
pneumothorax in a paediatric study (80). Cases of organ perforation in adults are low
with only 0.07% of all cases (85). Rare complications include bile leak and haemobilia
with an incidence of 0.6% in children (80). Systemic or local infections are both a
possible complication, although extremely rare. The rate of death from liver biopsy
was reported in one study to be ~0.6% (80), however recent studies have not reported
any deaths (82, 86).
1.11 Imaging techniques
Additional non-invasive modalities such as imaging techniques are commonly utilised
in the diagnosis of CFLD. Ultrasound is routinely used during clinical assessment and
considered in the CFLD diagnostic criteria (Table 1.3). However, ultrasound has poor
sensitivity and specificity for staging fibrosis (87). It can detect cirrhosis but results are
unreliable for differentiating early stages of liver fibrosis from steatosis, which is
sonographically similar to focal biliary cirrhosis. In fact, children with normal
ultrasound can have advanced fibrosis (87). Non-concordance has been reported
between liver function tests and ultrasound scores (88, 89). Despite these limitations,
ultrasound has proven to be a useful diagnostic tool for complications of portal
hypertension such as ascites, gallstones, bile duct stones or splenomegaly (87).
Similarly, magnetic resonance imaging especially when combined with magnetic
resonance cholangiography, can detect intra and extrahepatic bile duct alteration,
periportal fibrosis and evaluate parenchyma (90). Magnetic resonance
cholangiography alone can detect cholangiopathy in CF patients more reliably than
ultrasound (91) however the presence of cholangiopathy does not correlate with the
presence of, nor progression to, more advanced liver fibrosis. Furthermore, newer

18
‘next generation’ magnetic resonance imaging can also be used for determining fat
content or steatosis of patients (92), which remains of academic interest only.
1.12 Liver enzymes
Aspartate amino transferase (AST), alanine amino transferase (ALT) and γ-glutamyl
transferase (GGT) are widely used as biochemical markers of liver function. However,
in CF their elevation is intermittent and does not always correlates with histological
findings, meaning these markers are not reliable enough for detection of fibrosis or its
progression. Changes in the levels of these biochemical markers can be due to
infection, medication and furthermore, children with advanced fibrosis can show
normal biochemistry. According to the guidelines provided by the Cystic Fibrosis
Foundation, CFLD must be suspected in any case where liver enzymes are elevated
by more than 1.5 times the upper limit on two subsequent occasions (93).
1.13 Novel non-invasive methods of liver disease detection
Due to the issues outlined above associated with the use of liver biopsy and the lack
of sensitivity and specificity of existing modalities to diagnose CFLD, current
investigations are focussed on biological and physical properties of the liver to
indirectly assess the degree of fibrosis. Liver biological properties are surveyed
through the study of circulatory biomarkers (either serum or plasma), whereas physical
properties are assessed by measuring liver stiffness via the use of modified ultrasound
techniques such as elastographic imaging.
1.13.1 Elastographic imaging
Elastographic imaging relies on the principle of transient elastography (TE) to measure
liver stiffness which increases with the progression of fibrosis and cirrhosis. TE uses
19
low frequency elastic waves that are transmitted via an ultrasound a probe applied
against the body wall to measure liver stiffness. The velocity of the wave propagation
is proportional to the collagen fibres in the liver; thus the more collagen, the higher the
stiffness, the faster the waves are propagated and higher the median transient
elasticity value (94). Liver stiffness correlates with liver fibrosis in different liver disease
aetiologies such as primary biliary cirrhosis (95), NAFLD (96) or cholangitis (97). No
TE method directly images the elastic properties of the liver, thus, to observe liver
deformation in response to the elastic waves applied, an existing modality such as
ultrasound is used to display an elasticity image or elastogram. Therefore, TE shows
the tissue response to mechanical excitation producing a quantitative image
corresponding to the stiffness of the liver. Differences of elasticity of soft tissues are
expressed by elastic moduli such as the Young’s modulus (E), which represents liver
resistance to be deformed by mechanical stimuli. Young’s modulus is expressed in
kilopascals (kPa) and is expressed by E=3PC2, where P represents the tissue density
(~ 1000 kg/m3) and C the shear wave velocity (m/s) (98).
Currently, there are three main ultrasound-based elastography methods
commercialised: transient elastography (TE, Fibroscan ®), acoustic radiation force
impulse (ARFI, VTQ) and Supersonic shearwave elastography (SSWE).
1.13.1.1 Fibroscan
Fibroscan measures the velocity of propagation of an elastic shearwave through the
liver. The shearwave is produced by a piston vibrator placed in the thoracic wall
between the intercostal ribs. The speed of the wave is measured by a pulse-echo
ultrasound one dimensional probe and is proportional to the liver stiffness. The area
of the liver assessed is measured at a depth of 25-65mm in an area of 1x4cm, 100
times of the area assessed by liver biopsy (99). Fibroscan allows multiple readings
from different areas which decreases sampling error. Measurements are considered
to be accurate when the ratio between successful measurements and total
measurements is ≥60% and the interquartile range (IQR) is within 30% of the median

20
(100). In most cases the successful rate is affected by the lack of short and direct path
to the liver where the penetration is limited. Furthermore, accuracy is decreased by
patient characteristics such as narrow rib interspace or patients with obesity or ascites
(101). The loss of accuracy due to obese patients has been partially overcome by the
introduction of the XL (Extra Large) probe obtaining 61% of readings that were
unreliable using the M (Median) probe (102). Similar studies have been conducted in
children using the S (Small) and M probes based on thorax circumference (103).
However, special consideration must be taken as using different probes introduces
measurement bias as the technical characteristics are variable between probes and
therefore not necessarily comparable (104).
Fibroscan has been successfully used to demonstrate increase liver stiffness in
several diseases including CFLD, biliary atresia or non-alcoholic fatty liver disease
among others (105-109).
Fibroscan is efficient at distinguishing cirrhotic patients from non-cirrhotic as high
elastography values normally are indicative of cirrhosis. However, its values have
been shown to be elevated by extrahepatic cholestasis independent of liver stiffness
due to fibrosis in patients with biliary atresia suggesting that caution needs to be
exercised in some patients with cholestatic liver disease (110).
1.13.1.2 Acoustic radiation force impulse (ARFI)
As the name implies, ARFI uses short duration acoustic pulse waves of less than 1
millisecond as a mechanism to stimulate a force pulse through the liver. ARFI is
integrated into a standard ultrasound machine which facilitates a complete deep
ultrasound examination of the liver which informs about the mechanical properties in
vivo. Having ARFI integrated to an ultrasound machine gives the operator the
opportunity to choose the region of interest (ROI) where stiffness is measured,
avoiding heterogeneous and vascular regions which decreases unreliable

21
examinations compared to Fibroscan (111). The shear wave speed is expressed in
meters/second (m/s) and quantified in a ROI of 1x0.5 cm (112).
Correlation between Fibroscan and ARFI fibrosis indices have been reported in adult
patients with CFLD during a prospective study assessing CFLD simultaneously by
Fibroscan and ARFI (113). As with studies using Fibroscan, only a few ARFI studies
have been conducted on paediatric CFLD patients (114, 115). Despite the evidence
suggested by these studies on the feasibility of ARFI to assess CFLD, correlation
between elastrography values and histological findings are not available in children.
1.13.1.3 Supersonic shearwave elastography (SSWE)
SSWE is a two dimensional study in which the shearwave is generated by a focalized
ultrasound pulse. The push pulses create a real time plane shear wave at different
frequencies ranging from 60 to 600Hz which allows a synchronous evaluation of
several shear waves in a wide frequency range that propagates across the tissue (116,
117). Similar to ARFI, SSWE is integrated into an ultrasound system which allows real
time assessment, detection of focal lesions and choice of ROI. The speed of the pulse
transmitted through the liver is estimated by Doppler-like acquisition in real time (118,
119). The estimated elasticity is colour coded creating a 2D quantitative liver map
expressed in kPa and m/s. The real time acquisition means that ROI can be selected
and adjusted to represent a better average physiological condition and therefore
fibrotic stage. Additionally, SSWE uses shear waves with greater bandwidths which
should also improve the differentiation between intermediate liver fibrotic stages (116).
Accuracy of measurements with the SSWE is dependent in the operator and patient
characteristics such as obesity that decrease the rate of reliable examinations.
Furthermore, a recent study in obese adult patients showed increased reliable
measurements in experienced operators compared to novice operators (120).

22
1.13.2 Circulatory biomarkers
1.13.2.1 Serum biomarkers
The development of fibrosis in all chronic liver diseases occurs via an imbalance
between collagen deposition/synthesis and degradation (121). Evaluation of the
molecules involved in fibrogenesis has been of significant interest in recent years both
from a mechanistic viewpoint but also in the search for better diagnostic biomarkers.
Collagen type IV (COL-IV), tissue inhibitor of metalloproteinase 1 (TIMP-1), prolyl
hydroxylase (PH) or matrix metalloproteinase-1 (MMP-1) are but a few such
biomarkers that have been proposed as promising candidates for the early detection
of CFLD (122, 123). TIMP-4 and endoglin have also been described as potential
biomarkers for CFLD. Increased expression of TIMP-4 and endoglin correlates with
fibrosis staging and interestingly, in combination with TE measurements, diagnosis
can be improved (123). Similarly, the aspartate aminotransferase (AST) to platelet
ratio index (APRI) and the fibrosis 4 (FIB-4) indices are readily available via routine
blood tests and are simple serum biomarkers that have been shown to be significantly
increased in CFLD children and are capable of discriminating liver disease in CF
children (124).
1.13.2.2 MicroRNA (miRNA)
miRNAs are short interfering RNAs which catalytically silence gene expression at a
posttranscriptional level. They constitute the most abundant class of endogenous
small non-coding RNA with approximately 50000 copies per cell in the liver (125).
Since Ambros’ discovery in 1993 (126), miRNAs have been extensively investigated
due to their role in RNA-induced silencing. In 2000, the miRNA let-7 was identified
(127). In contrast to previous miRNAs described, let-7 was shown to be widely
conserved across different animal species (128). This breakthrough discovery started

23
an intensive search for novel miRNAs conserved over different species including
humans (125, 129-131).
1.13.3 miRNA biogenesis
Mature miRNAs are single stranded RNAs of about 17-24 nucleotides (nt) which
interact with RNA-induced silencing complex (RISC) in the cytoplasm of eukaryotic
cells (132). miRNAs are encoded by specific genes that are transcribed by RNA Pol
II into polyadenylated and capped stem-loop transcripts termed primary miRNAs (pri-
miRNAs) (133, 134). Most miRNA genes encode a single miRNA, however, some
miRNAs are encoded in clusters and can include up to six miRNAs with a similar
sequence (135). A minority of miRNAs are located in introns of coding genes which
form miRNA precursors during splicing (136). miRNA biogenesis is regulated at a
transcriptional and post-transcriptional level and single nucleotide polymorphisms
(SNPs) in miRNA genes can modulate activity and function (137).
pri-miRNA undergoes a process of maturation in the nucleus, mediated by a complex
called microprocessor. The microprocessor is formed by RNase III endonuclease
Drosha and RNA-binding protein DGCR8 (138, 139). Drosha cuts the stem loop of
the pri-miRNA, releasing a hairpin shaped RNA of 60-70nt with a two nucleotide 3’
overhang named precursor miRNA (pre-miRNA) (140).
Once Drosha has processed pre-miRNA, it is exported to the cytoplasm by a complex
formed of exportin 5 and GTP-binding nuclear protein RanGTP (141, 142). In the
cytoplasm, pre-miRNA is processed by the RNase III endonuclease called Dicer (143,
144). Dicer recognizes the 5’ phosphate and 3’ overhang at the base of the stem loop
and cuts both RNA strands, liberating a mature miRNA with 5’ phosphate and two
nucleotide 3’ overhang on each end of the double stranded RNA (145, 146). The
mature miRNA processed by Dicer consists of a guide strand, which is antisense to
the target sense strand on mRNA, and an unstable passenger strand.

24
The recently formed mature miRNA is loaded onto a protein called argonaute (AGO)
which is a family of four members (147). This interaction forms an effector complex
known as RNA-induced silencing complex (RISC) (148, 149). AGO proteins present a
PAZ domain in the N-terminal lobe which binds to single stranded and duplex RNA
(150, 151).
Assembly of RISC involves two steps: the binding of miRNA duplex and its unwinding
(152). In humans there is no strict RNA sorting system as in other species such as
Drosophila (153). RNA binds to any of the four AGO proteins with preference of small
RNA duplexes with central mismatches between nucleotides in position 8-11 (154,
155). Once the RNA duplex is bound to an AGO protein, the passenger strand is
removed to generate the mature and functional RISC complex (148). This process is
mediated by AGO2 which has helicase and endonuclease activity (156). The guide
strand presents mismatches at positions 2-8nt and 12-15nt that promote the unwinding
of the duplex (154, 157).
1.13.4 miRNA target identification
Identification of the target mRNA by the miRNA within the RISC complex is essential.
Watson-Crick base pairing of the nucleotides on the 5’ end of the miRNA and the target
mRNA take place during this interaction (158-160). The region in which mRNA and
miRNA hybridization occurs is termed the “seed” sequence (158, 161) and consists of
a minimum of six base pairs (bp) which correspond to nucleotides 2-7 from the 5’ end
of the miRNA (3’UTR of the mRNA). The seed sequence can be up to 8bp in length,
based on the homology at position eight or the presence of an adenine (A) at
nucleotide position one of the target mRNA (161).
However, seed matching alone is not enough to identify validated targets (162). The
context in which seed matching occurs plays an important role in determining miRNA

25
targets in the canonical 3’UTR or different segments of the mRNA. Grimson et al. (162)
described the characteristics of the most common miRNA targets (Table 1.5). These
parameters have been implemented in computational tools and algorithms which
predict miRNA targets.
Table 1.5. miRNA target identification parameters.
1.13.5 Circulatory miRNA as biomarkers
miRNAs finely adjust rather than completely repress gene expression (163). It is
estimated that most of the genes expressed in mammals (164) are to some extent
regulated by the 2654 mature miRNAs that have been identified to date (165). Many
biological pathways are regulated by miRNAs including proliferation, differentiation,
apoptosis, cell cycle regulation and development. Furthermore, the roles of miRNAs
have been described in several diseases, including cancers (166-169), coronary
diseases (170-172), autoimmune diseases (173-175) or viral infections such as viral
hepatitis (176-179). miRNAs are predominantly present intracellularly, however, it is
possible to find miRNA in extracellular environments such as serum, plasma, semen,
cerebrospinal fluid or urine (180-187). Circulatory miRNAs are relatively stable,
especially compared with most extracellular RNAs. miRNAs are packed in vesicles or
Parameters for the
identification of miRNA
targets
Closely spaced miRNAs often act synergistically
Watson-Crick pairing at nucleotide 12-17nt in addition to seed match enhanced miRNA targeting
Effective targets reside within locally AU-rich context
Effective targets reside in 3'UTR strand but not close to stop codon
Effective sites preferentially reside near both ends of the 3'UTR

26
in association with RNA binding proteins to prevent digestion by ribonucleases
(RNases) (188).
Two hypotheses have been proposed regarding the origin of miRNAs in the circulation.
First, cells evolved to selectively release miRNA in paracrine or endocrine routes to
mediate cell-cell signalling (189, 190). Second, miRNAs are released in a non-
selective manner after cell death, which correlates to the increased levels of miRNAs
in blood after toxicity in certain organs (191-193). Regardless of their origin, it is clear
that the presence of miRNAs in readily accessible body fluids makes them attractive
biomarker candidates. The ideal biomarker should meet stringent criteria, such as
being disease specific, detected in a non-invasive manner, be an indicator of disease
at an early stage of disease, or responsive through the progression of the disease or
treatment. miRNAs are disease specific, tissue specific, stable in circulation and
capable of distinguishing between healthy and diseased individuals, making
circulating miRNAs attractive biomarkers (194).
1.13.6 Circulatory miRNAs as biomarkers in paediatric liver disease
Several studies have explored the potential targets and mechanistic role of miRNAs
in chronic liver diseases, including those affecting children (reviewed elsewhere
(195)). These studies used liver tissue or animal models to identify miRNA expression
profiles in the context of a specific disease. Once miRNAs of interest had been
selected, liver and biliary cell lines were used to identify potential target genes and
their effect on protein synthesis, mRNA expression or their role in different cellular
functions and pathways. These studies not only show the importance of gene
regulation through miRNAs in liver disease, but also the complex mechanisms that
drive fibrosis in which miRNAs also play an important role. For instance, miR-122 has
been the subject of extensive investigation in liver disease. miR-122 knockdown
experiments in mice demonstrated important hepatopathological effects of miR-122
as mice aged including hepatocyte proliferation, imbalance in cellular differentiation
and ductular reaction (196). Similarly, multiple studies have shown increased serum
27
levels of miR-122 corresponding to different liver aetiologies, suggesting that
upregulation of miR-122 in serum may be a global marker of liver injury rather than
disease-specific (193, 197-199). These evident roles for miRNAs in physiological and
pathological pathways and their reflection in the circulation could be utilised for the
non-invasive detection of CFLD.
Few studies have explored the utility of circulatory miRNAs as biomarkers for CFLD.
Sera from children diagnosed with CFLD, cystic fibrosis but no liver disease (CFnoLD)
and healthy control children were collected to identify a circulating miRNA signature in
CF children using a limited miRNA PCR array (200). In this pilot study, 84 miRNAs
were evaluated by PCR array and validated by qRT-PCR. Analysis revealed
upregulation of serum miR-122 in the CFLD group compared to both CFnoLD and
control groups. Furthermore, miR-21 and miR-25 were elevated in sera from CFnoLD
compared to both CFLD and control groups. Therefore, a panel consisting of miR122,
miR-21 and miR-25 showed the potential for early diagnosis of CFLD demonstrating
the potential utility of serum miRNAs to diagnose liver disease in CF children.
1.14 HYPOTHESES AND AIMS
There is no consensus about the definition and classification of CFLD. Currently,
annual clinical reviews, physical examination, biochemical markers, imaging
techniques and liver biopsy (not widely employed) are used to assess liver
abnormalities in CF patients. While of some use in the detection of CFLD, these
approaches are insensitive and non-specific in the detection and monitoring of fibrosis
severity. Moreover, the health risks and discomfort associated with liver biopsy,
reinforces the need for a better non-invasive diagnostic method. This non-invasive
method should be able to determine CF patients at risk of cirrhosis prior its
development and to identify patients with a compromised liver who present without
showing any biochemical or imaging signs of liver disease.

28
Therefore, the hypotheses of this thesis are:
1. That serum miRNAs and Supersonic shearwave elastography (SSWE) can be
used as non-invasive methods for the diagnosis and assessment of liver fibrosis
in children with CF.
2. That miRNAs differentially expressed in children with CFLD regulate the
expression of genes in hepatic stellate cells (HSC) and/or liver progenitor cells
(LPC) involved in the development of fibrosis and ultimately progression to
cirrhosis.
Hence, the aims proposed for this thesis are:
1. To evaluate the clinical utility and feasibility of Supersonic ShearWave
Elastography as a screening tool for both the early detection of liver disease
and monitoring liver disease progression in children with CF.
2. To identify novel and previously described circulatory miRNAs which are
differentially expressed among children with CFLD versus those with
CFnoLD
3. To identify downstream targets of differentially expressed miRNAs involved
in fibrogenesis and disease progression to cirrhosis and their potential role
in CFLD

29
CHAPTER 2
Materials and Methods………

30
2.1 Chapter contribution
Segments of the material and methods described in this chapter (in sections 2.2.1;
2.4.1; 2.4.3; 2.4.5; 2.5.1; 2.5.3; 2.5.4 and 2.5.6) have been published in the following
research article:
Calvopina DA, Chatfield MD, Weis A, Coleman MA, Fernandez-Rojo MA, Noble C,
Ramm LE, Leung DH, Lewindon PJ, Ramm GA. MicroRNA Sequencing Identifies a
Serum MicroRNA Panel, Which Combined With Aspartate Aminotransferase to
Platelet Ratio Index Can Detect and Monitor Liver Disease in Pediatric Cystic Fibrosis.
Hepatology 2018; 68:2301-2316.
Diego A. Calvopina allocated patients into their respective cohorts (under the
supervision of Peter J. Lewindon and Grant A. Ramm), extracted miRNA from serum
samples, constructed miRNA libraries, performed miRNA reverse transcription and
miRNA qRT-PCR, collected, analysed and interpreted data and wrote the research
article.
Mark D. Chatfield performed the more advanced statistical analyses (e.g. logistic
regression, concordance statistic and Obuchowski method). Grant A. Ramm
conceived the idea for the study. Anna Weis and Louise E. Ramm collected clinical
data. Peter J. Lewindon assisted in study design and collection of tissue specimens
and blood samples. Charlton Noble helped enrol patients and collected tissue
specimens and blood samples. Miranda A. Coleman, Manuel A. Fernandez-Rojo and
Daniel H. Leung provided advice on study design.
31
2.2 Patients
2.2.1 Patient recruitment and characteristics
This study was approved by the Human Research Ethics Committees of the QIMR
Berghofer Medical Research Institute (Brisbane, Australia) and the Children’s Health
Services Queensland (Brisbane, Australia) under the reference number
HREC/10/QRCH/87. Parental informed consent was obtained for every patient prior
to data collection.
All children were prospectively evaluated for this study while attending the Queensland
Children’s Hospital (Brisbane, Australia) and allocated in one of three study cohorts
(CFLD, CFnoLD, Controls), as described below. Children with CFLD were selected by
the presence of at least two of the following three signs or symptoms: hepatomegaly
± splenomegaly; persistent elevation (> six months) of serum alanine
aminotransferase (ALT >1.5x upper limit of normal) and abnormal ultrasound scan
(showing abnormal echogenicity or nodularity suggesting cirrhosis as has previously
been described) (60, 62, 64).
In the serum miRNA biomarker study, archival serum samples were accessed and all
of these patients had percutaneous dual-pass liver biopsies to assess CFLD and stage
liver fibrosis, as previously described (64). Liver histology was staged for hepatic
fibrosis by two independent and blinded pathologists based on the METAVIR scoring
system as follows: F0: no fibrosis; F1: portal fibrosis only (minimal scaring); F2: portal
fibrosis with rare fibrous septa; F3: portal fibrosis with numerous fibrous septa and F4:
cirrhosis. The higher fibrosis stage was used if fibrosis stages between the two
biopsies were not the same.
In the Supersonic ShearWave elastography study, patients were prospectively
enrolled with CFLD children subcategorised in no/mild/moderate fibrosis (equivalent
to METAVIR score F0-F2) or severe fibrosis/cirrhosis (equivalent to METAVIR score

32
F3-4). In the absence of liver biopsy (as biopsy is currently not routinely performed in
these patients), severe fibrosis/cirrhosis was designated by two separate approaches:
(i) clinical assessment based on the presence of portal hypertension and ultrasound
scan showing unequivocal macronodularity (60, 64) or (ii) APRI cut-offs based on a
previous study (124), where children with an APRI score >0.462 were classified as
having severe fibrosis/cirrhosis.
Children with CF but no signs of liver disease by clinical, biochemical or
ultrasonographic means in the two years prior to sampling or in annual clinical follow-
up performed over the duration of the study were selected as CFnoLD. A group of
non-CF and non-liver disease paediatric control patients were enrolled as the healthy
controls while attending the hospital for minor routine procedures such as:
orthopaedic, plastic, otolaryngology and burns consultations.
APRI and FIB-4 scores were calculated as described previously (124), according to
the following equations:
APRI =
AST (U L)⁄Upper limit of normal AST (U L)⁄ × 100
Platelet Count (109 L)⁄
FIB − 4 =Age (years) × AST (U L)⁄
Platelet Count (109 L)⁄ × (√ALT [U L]⁄ )
An AST value of 40U/L was used as upper limit of normal.
2.2.2 Liver stiffness measurement (LSM)
LSM was performed according to the procedures recommended by the World
Federation for Ultrasound in Medicine and Biology (WFUMB) and the European

33
Federation of Societies for Ultrasound in Medicine and Biology (EFSUMB) (201, 202).
LSM was performed using the Supersonic shearwave elastography (SSWE; Aixplorer,
Supersonic Imagine SA, Aix-en-Provence, France). All examinations were performed
by a single trained and accredited operator (Charlton Noble, Paediatric Hepatology
& Liver Transplant Coordinator, Queensland Children’s Hospital, with >3 years of
elastography experience) using the convex abdominal SC6-1 paediatric transducer
probe for all patients. Evaluation was performed in dual mode (including grey-scale
ultrasound and elastogram displayed in real time). Children were non-fasting while
scanned as the procedure was performed opportunistically during scheduled visits to
the CF and outpatients clinics. A minimum of three measurements were obtained with
patients holding their breath. Children were placed in the supine position with their
right arm extended under the head for optimal intercostal access. During the
procedure, the operator chose the best segment in the right upper lobe of the liver and
the region of interest (ROI) placed 1-2cm below Glisson’s capsule of the liver avoiding
artefacts such as rib shadowing, gallbladder and large vessels. Once the optimal ROI
was selected, it was fixed and liver elasticity measured. Successful SSWE was defined
by a stiffness measure >1Kpa as described by others (119, 203, 204).
2.2.3 LSM progression
Liver stiffness progression was evaluated using SSWE in children with CF with more
than one LSM taken in no less than a 12 month period. Following a similar strategy as
performed using Fibroscan®-based transient elastography (105), LSM progression
was expressed as the absolute difference between LSM at Baseline (BL) and LSM at
Follow-up (FU); relative progression (%) expressed as (FU – BL)/BL*100; rate of
progression (kPa/year) expressed as (FU – BL)/years between the two
measurements; and relative rate of progression (%/year) expressed as (FU – BL)/-
BL/time. BL represents the first LSM for each patient. FU represents the last
measurement available for each patient.
34
2.3 In vitro studies
2.3.1 Cell culture
The immortalised murine oval cell line, bipotential murine oval (BMOL), were cultured
as described previously (205) in Williams’ E medium (Thermo Fisher, Massachusetts,
USA) containing 2mM glutamine (GlutaMAX; Thermo Fisher), 1% penicillin-
streptomycin (Life Technologies, Carlsbad, CA, USA), epidermal growth factor (10
ng/mL; Thermo Fisher), insulin-like growth factor II (30 ng/mL; GroPep Bioreagents,
Adelaide, SA, Australia), insulin (10µg/mL; Life Technologies) and 10% foetal bovine
serum (FBS; Life Technologies). The Lieming Xu-2 (LX2) human hepatic stellate cell
(HSC) line, were cultured as previously described (206) in high glucose Dulbecco’s
modified eagle medium (DMEM; Sigma Aldrich, St. Louis, Missouri, USA) containing
2mM glutamine (GlutaMAX; Thermo Fisher), 1% penicillin-streptomycin (Life
Technologies) and 2% FBS (Life Technologies). Both cell lines were grown in a 5%
CO2 atmosphere at 37°C.
2.3.2 Transient miRNA transfection and transfection efficiency
Cells were transfected in either 6 well-plates (Corning Inc., Corning, New York, USA)
or 10cm-plates (Corning Inc.) depending on the application. BMOL cells were
transfected at 70-90% confluency using Lipofectamine 2000 reagent (Thermo Fisher)
as suggested by the manufacturer. Transfection reagent mix was prepared fresh
containing the following components for 6-well plate transfection: 495.5µL Opti-MEM
medium (Life Technologies), 2.5µL lipofectamine 2000 and 2µL of 10µM of selected
miRNA mimic. For the 10cm-plate transfection, the mix was prepared as follows: 1mL
Opti-MEM medium, 40µL lipofectamine 2000 and 5µL of 10µM selected miRNA mimic.
LX2 cells were transfected at 70-90% confluency using Lipofectamine LTX reagent
(Thermo Fisher) to minimise cell death due to toxicity observed when using
Lipofectamine 2000. Transfection reagent mix was prepared fresh containing the
following components for 6-well plate transfection: 500µL Opti-MEM medium (Life

35
Technologies), 14µL plus reagent, 14µL lipofectamine LTX and 2µL of 10µM of
selected miRNA mimic. For 10cm-plate transfection: 1mL Opti-MEM medium, 40µL of
PLUS reagent, 40µL of lipofectamine LTX and 5µL of 10µM selected miRNA mimic.
For all cases, transfection mix was vortexed for 15 seconds and incubated for 10
minutes at room temperature. Cells were washed twice with phosphate buffered saline
(PBS) and 1.5mL of fresh medium added to the 6-well plates and 4mL to the 10-cm
plates. Transfection mix was then evenly distributed dropwise for each well/plate.
Transfection was optimised for each cell line and efficiency measured using the
AccuTarget fluorescein-labelled miRNA mimic negative control #1 (Bioneer
Corporation, Daedeok, Daejeon, Republic of Korea). Uptake of fluorescein-labelled
miRNA mimic was assessed after 24 hours through cell counting performed on EVOS
fluorescence cell imaging system (Thermo Fisher). For both cell lines the average
transfection efficiency was >50%. miRNA mimics used are shown in Table 2.1.

36
Table 2.1. miRNA mimics.
Name Product number Supplier
AccuTarget fluorescein-labelled miRNA mimic
negative control #1
SMC-4002 Bioneer Corporation
MISSION miRNA negative control 2
HMC0003 Sigma Aldrich
miScript Inhibitor negative control
1027271 Qiagen
MISSION miRNA mimic hsa-let-7g
HMI0019 Sigma Aldrich
MISSION miRNA mimic hsa-miR34a-5p
HMI0508 Sigma Aldrich
MISSION miRNA mimic hsa-miR365a-3p
HMI0522 Sigma Aldrich
Syn-hsa-miR-142-3p miScript miRNA Mimic
MSY0000434 Qiagen
Selected miRNA mimics used for the different studies in this thesis.
2.3.3 miRNA transduction
Mission Lenti-miRNA Constructs (Sigma-Aldrich) expressing let-7g-5p, miR-142-3p,
miR-34a-5p and miR-365a-3p were used to induce stable expression in LX2 cells.
Lentiviral constructs used are shown in Table 2.2. Transduction was performed as
follows: 150000 cells per well were seeded into 6-well pates. The following day
lentivirus was thawed on ice; in the meantime, cell media was replaced by fresh total
media without antibiotics and with hexadimethrine bromidepolybrene (polybrene,
Sigma-Aldrich) at a final concentration of 8μg/mL. Following polybrene addition, viral
particles were added to the cells at a multiplicity of infection (MOI) of 10, gently swirled
and centrifuged at 2500 rpm for 30 minutes at 30°C before incubating the cells for 24
hours at 37°C and 5% CO2. After 24 hours media was replaced and cells incubated
for an additional 42 hours. Following this second incubation, transduced cells were
selected by selection media with 1μg/mL of puromycin (Thermo Fisher). miRNA stable
expression in LX2 cells was assessed by qRT-PCR.

37
Table 2.2. Lenti-miRNA viral particles used for LX2 transduction.
Name Product number Accession number
MISSION Lenti microRNA Negative Control 2
NCLMIR002 NA
MISSION Lenti microRNA
let7g-5p
HLMIR0019 MIMAT0000414
MISSION Lenti microRNA
miR-34a-5p
HLMIR0508 MIMAT0000255
MISSION Lenti microRNA
miR-365a-3p
HLMIR052 MIMAT0000710
Lenti-miRNA viral particles purchased from Sigma-Aldrich. Accession number based on miRBase V20 Mature ID Database.
2.3.4 Biotin pulldown assay to identify miRNA targets
In order to detect miRNA-mRNA interactions and identify potential miRNA targets, an
experimental pulldown method was used (207). Buffers and wash solutions were
made following the instructions in the pulldown protocol (207). BMOL were seeded in
10-cm plates at a density of 80000 cells, whereas, LX2 were seeded in 10cm-plates
at a density of 1200000 cells which resulted in 80% confluency after 24 hours. Seeded
cells were transfected (as described in section 2.3.2) with each selected biotinylated
miRNA duplex at a concentration of 20pmol per 10cm-plate and incubated for 24 hours
at 37°C and 5% CO2. The number of plates needed for each cell line was optimised
to obtain sufficient yield of enriched mRNA. For BMOL cells four 10cm-plates were
used per replicate, whereas, for LX2 sixteen 10cm-plates were used per replicate as
LX2 cells showed a lower RNA yield. On the day of transfection, streptavidin magnetic
beads (Dynabeads MyOne Streptavidin C1; Thermo Fisher) were washed and blocked
in preparation for the next day. Beads were resuspended by vortexing and 25µL
beads/plate transferred to a 2mL Eppendorf LoBind tube (Sigma Aldrich). LoBind
tubes were placed for two minutes in a magnetic rack and the supernatant discarded.
Beads were resuspended with 100µL of wash buffer for three times and resuspended
for two times in 100µL Solution A, followed by a final wash with 100µL Solution B. After

38
this final wash, beads were resuspended in 200µL of freshly made bead blocking
solution and incubated on a rotating mixer at 4°C overnight.
On the second day, transfected cells were washed with PBS and fresh medium added.
Cells were lifted from the plate using a cell scrapper (Corning Inc.) and transferred to
a 15mL falcon tube (Corning Inc.) pooling the cells from the 10cm-plates that constitute
a replicate together (i.e. four plates for BMOL and sixteen for LX2) into a final volume
of 8mL. Harvested cells were centrifuged at 1000rpm for five minutes at room
temperature, after which the supernatant was discarded and cells washed with 5mL
PBS and centrifuged. Supernatant was discarded and cells resuspended in 250µL of
freshly made lysis buffer, incubate for five minutes on dry ice and allowed to thaw at
room temperature for better lysis of cells. Lysate was transferred into a 2mL LoBind
tube and centrifuged at 13000rmp at 4°C for two minutes after which the clear
supernatant was transferred to a clean LoBind tube. A 10µL aliquot of the lysate was
kept on ice to be used as a control as it reflects changes undergone by the transfected
cells that otherwise would not be considered. Clear supernatant had sodium chloride
(NaCl) added to a final concentration of 1M and kept on ice.
In the meantime, streptavidin beads blocked on day one were prepared by being
washed two times with 100µL wash buffer, after which they were resuspended in
300µL of wash buffer. Next, the 300µL resuspended streptavidin beads were added
to the clear supernatant + NaCl and incubated on a rotating mixer at room temperature
for 30 minutes. Cell supernatant + streptavidin beads mix were washed four times in
300µL of wash buffer and resuspended in 100µL of nuclease free water which then
contained the target mRNAs. Subsequently, target mRNAs captured on streptavidin
beads and the control RNA were purified using the RNA clean-up protocol from the
RNeasy kit (Qiagen, Venio, The Netherlands) and eluted twice in a total of 50µL
nuclease free water. Finally, purified RNA targets and controls were concentrated by
centrifuging them at 5000rpm for two minutes at room temperature using an Amicon
Ultra-0.5 Centrifugal filter (Merck PTY LTD., Kenilworth, NJ, USA). Enriched targeted
mRNA and control RNA were quantified using NanodropTM 2000/2000c (Thermo
Fisher) and RNA 6000 Pico chip (Agilent Technologies, Santa Clara, USA) in the 2100

39
Bioanalyzer instrument (Agilent Technologies) using the manufacturer’s protocol. All
buffers and solutions were prepared fresh as indicated in the pulldown protocol (207)
Design of miRNA duplexes was performed as indicated on the pulldown assay
protocol (207) with biotin attached to the 3’ OH of the mature strand via a C6 linker, a
two nucleotide overhang at the 3’ end of each strand and two mismatches in the
passenger strand to favour incorporation into the RISC complex. Synthetic biotinylated
miRNA duplexes were synthesised by Integrated DNA technologies (IDT; Coralville,
Iowa, United States) and sequences are shown in Table 2.3.
Table 2.3. Biotinylated miRNA duplexes.
Name Sequence (5’– 3’) Accession number
hsa-miR-365a-3p
PO4-UGUAGUGUUUCCUACUUUAUGGAAG-OH-C6-Biotin
PO4-AUAACGAUUUUUAGGGUCAUUAAG-OH
MIMAT0000710
hsa-Let-7g-5p
PO4-UGAGGUAGUAGUUUGUACAGUUAG-OH-C6-Biotin
PO4-AACUCUACAAACUACUACCUUAAG-OH
MIMAT0000414
hsa-miR-142-3p
PO4- UGUAGUGUUUCCUACUUUAUGGAAG-OH-C6-Biotin
PO4-UCCACAAAGUAGGAAACACUAUAAG-OH
MIMAT0000434
hsa-miR-34a-5p
PO4- UGGCAGUGUCUUAGCUGGUUGUAG-OH-C6-Biotin
PO4-ACAACUAGCUAAGACACUGCUAAG-OH
MIMAT0000255
Sequences of the synthetic biotinylated miRNA duplexes. Bold shows nucleotide overhangs. Italics and underline shows mismatches of the passenger strand. Accession number is based on miRBase database v21.

40
2.3.5 Protein extraction and western blot
BMOL cells in 6-well plates were placed on ice, washed twice with cold PBS. Following
PBS washes, 100µL of RIPA buffer was added in each well and a cell scrapper used
to lyse cells. BMOL lysates were collected into cooled Eppendorf tubes and spun at
8000 x g for five minutes at 4°C after which the supernatant was transferred to new
cooled Eppendorf tubes and stored at -20°C until needed. Extracted protein was
quantified using the Pierce BCA protein assay (Thermo Fisher) as suggested by the
manufacturer. Western blot was performed using 10ng of cell protein extract mixed
with 1X Loading Buffer and boiled at 95°C and spun down before loading the samples
into 10% SDS-PAGE gels. Gels were prepared as follow: separating gel comprised of
2.5mL acrylamide, 1.5mL of 5x separating buffer, 3.5mL of milliQ water, 25µL of 10%
ammonium persulfate (APS) and 7.5µL of tetramethylethylenediamine (TEMED),
whereas, the stacking gel was prepared using 0.5mL of acrylamide/bis-acrylamide
(29:1), 0.5mL of 10x stacking buffer, 4mL of milliQ water, 15µL of 10% APS and 12µL
of TEMED. Proteins on the gels were separated by electrophoresis at 100volts (V) for
25 minutes until the separating gel was reached, followed by 200V for additional 40
minutes. Transfer to Immobilion-FL polyvinyl difluoride membranes (Millipore,
Burlington, Massachusetts, USA) was performed at 100V for 1 hour at room
temperature. Membranes were blocked in TBST LI-COR Odyssey blocking buffer (LI-
COR Bioscience, Lincoln, NE, USA) for 30 minutes and probed overnight at 4°C with
antibodies diluted in TBST LI-COR Odyssey blocking buffer. Primary antibodies used
are shown on Table 2.4. Blots were then incubated with either, anti-mouse 680RD or
anti-rabbit 800CW secondary antibodies at 1:20000 in TBST LI-COR Odyssey
blocking buffer and localization detected with the LI-COR Odyssey CLx Infrared
Imaging System (LI-COR Bioscience). Band quantification was performed using
Image Studio Lite version 5.2 (LI-COR Bioscience).

41
Table 2.4.Primary antibodies used for Western blot analysis.
Name Product number Dilution Supplier
Anti-Ck19 AB15463 1:2000 Abcam
Anti-acetylated
α-tubulin
T7451 1:1000 Sigma-Aldrich
Anti-Hnf4α SC6556 1:1000 Santa Cruz
Anti-β actin A5441 1:4000 Sigma-Aldrich
Primary antibodies used for western blot analysis.
2.3.6 Proliferation assay
Proliferation was performed using the IncuCyte Zoom live-cell imaging system (Essen
Bioscience, Ann Arbor, Michigan, USA). BMOL cells at 80% confluency in 10-cm
plates (Corning Inc.) were transfected with miRNA mimics of interest or miRNA
negative control as described in section 2.3.2. At 24 hours post-transfection, 12000
transiently-transfected BMOL cells were re-seeded into 12-well plates (Corning, Inc.)
in triplicates for each miRNA and incubated in the IncuCyte Zoom system. Remaining
cells were lysed, miRNA extracted and quantified by qRT-PCR as described in
sections 2.4.1 and 2.4.5. LX2 stably-transduced cells expressing either the miRNA
of interest or the negative control were seeded into 12-well plates (Corning, Inc.) in
triplicates at a density of 20000 cells per well and incubated in the IncuCyte Zoom
system. Cell growth in BMOL and LX2 was measured at three hour intervals for up to
five days and data collected using the IncuCyte Zoom 2016A software (Essen
Bioscience).
2.3.7 Migration assay
Migration was performed using the IncuCyte Zoom live-cell imaging system (Essen
Bioscience). BMOL cells at 80% confluency in 10-cm plates (Corning Inc.) were
transiently-transfected with miRNA mimics of interest or miRNA negative control as
described in section 2.3.2. At six hours post-transfection, 40000 transfected BMOL
42
cells were re-seeded into 96-well Image Lock Plate (Essen Bioscience) in 12
replicates. Remaining cells were lysed, miRNA extracted and quantified by qRT-PCR
as described in sections 2.4.1 and 2.4.5. LX2 stably-transduced cells expressing
either the miRNA of interest or the negative control were seeded into 96-well Image
Lock Plate (Essen Bioscience) in 12 replicates at a density of 55000 cells per well.
Both BMOL and LX2 seeded cells in the 96-well Image Lock Plates were incubated
for 18 hours at 37°C and 5% CO2 after which they were scratched using the Scratch
Wound Maker (Essen Bioscience) following manufacturers’ instructions and incubated
in the IncuCyte Zoom system. Cell migration of BMOLs and LX2s were measured at
one hour intervals for 24 hours and data collected using the IncuCyte Zoom 2016A
software (Essen Bioscience). Only wells showing clean, defined scratch wounds were
assessed by the IncuCyte imaging and selected for further analysis.
2.3.8 Dual luciferase assay
Luciferase reporter assays were used for miRNA target mRNA validation. LX2 cells
were co-transfected in 6-well plates (see section 2.3.2) with 50ng of miRNA 3’UTR
target clone and either miRNA mimic or miRNA negative control to a final
concentration of 20nM. At 48 hours post-transfection, luciferase activity was assayed
using the Luc-Pair Duo-Luciferase Assay Kit 2.0 (GeneCopoeia, Rockville, MD, USA)
following manufacturers’ instructions and detected on a Synergy H4 Hybrid Multi-Mode
Microplate Reader (BioTek, Winooski, Vermont, USA). Luciferase activity was
normalised to Renilla activity in each well. Assays were performed in duplicates and
independently repeated three times. miRNA 3’UTR target clones purchased from
GeneCopoeia are listed in Table 2.5.
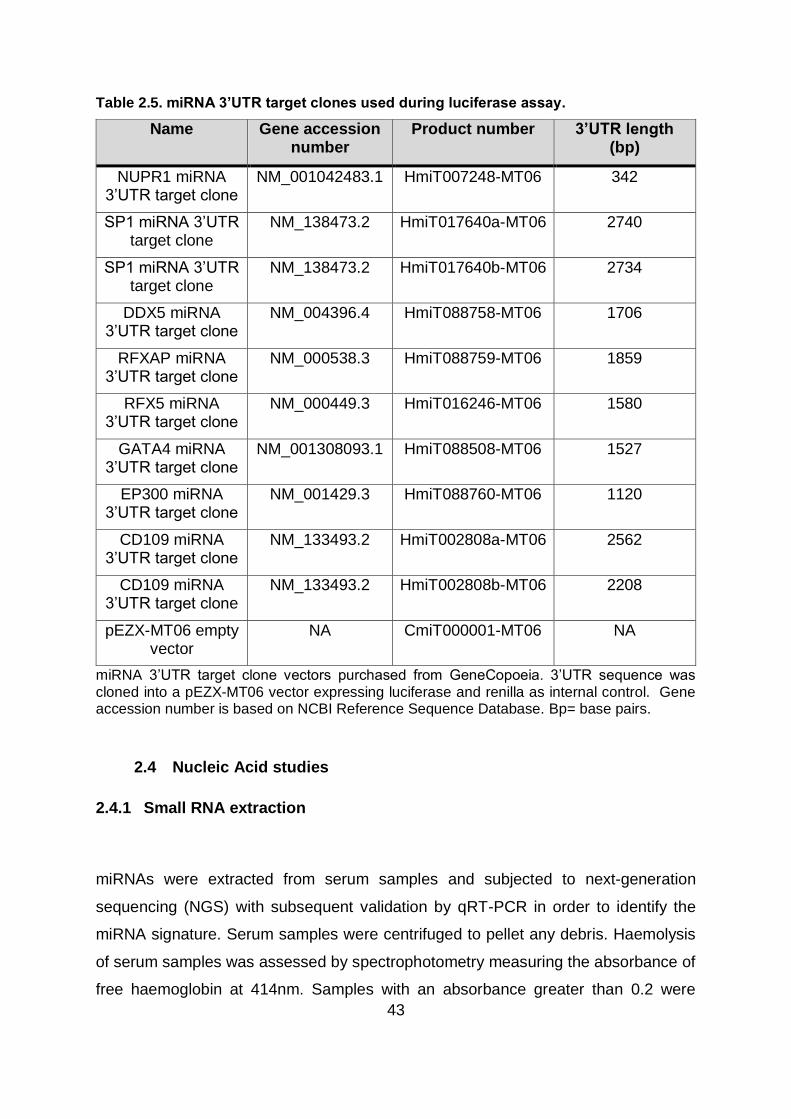
43
Table 2.5. miRNA 3’UTR target clones used during luciferase assay.
Name Gene accession number
Product number 3’UTR length (bp)
NUPR1 miRNA 3’UTR target clone
NM_001042483.1 HmiT007248-MT06 342
SP1 miRNA 3’UTR target clone
NM_138473.2 HmiT017640a-MT06 2740
SP1 miRNA 3’UTR target clone
NM_138473.2 HmiT017640b-MT06 2734
DDX5 miRNA 3’UTR target clone
NM_004396.4 HmiT088758-MT06 1706
RFXAP miRNA 3’UTR target clone
NM_000538.3 HmiT088759-MT06 1859
RFX5 miRNA 3’UTR target clone
NM_000449.3 HmiT016246-MT06 1580
GATA4 miRNA 3’UTR target clone
NM_001308093.1 HmiT088508-MT06 1527
EP300 miRNA 3’UTR target clone
NM_001429.3 HmiT088760-MT06 1120
CD109 miRNA 3’UTR target clone
NM_133493.2 HmiT002808a-MT06 2562
CD109 miRNA 3’UTR target clone
NM_133493.2 HmiT002808b-MT06 2208
pEZX-MT06 empty vector
NA CmiT000001-MT06 NA
miRNA 3’UTR target clone vectors purchased from GeneCopoeia. 3’UTR sequence was cloned into a pEZX-MT06 vector expressing luciferase and renilla as internal control. Gene accession number is based on NCBI Reference Sequence Database. Bp= base pairs.
2.4 Nucleic Acid studies
2.4.1 Small RNA extraction
miRNAs were extracted from serum samples and subjected to next-generation
sequencing (NGS) with subsequent validation by qRT-PCR in order to identify the
miRNA signature. Serum samples were centrifuged to pellet any debris. Haemolysis
of serum samples was assessed by spectrophotometry measuring the absorbance of
free haemoglobin at 414nm. Samples with an absorbance greater than 0.2 were
44
excluded from the NGS discovery phase (208). Small RNA was extracted from 200µL
serum using the Plasma/Serum RNA Purification Mini Kit (Norgen Biotek Corporation,
Thorold, Canada) following manufacturers’ instructions as follows: 200µL of serum
was combined to 600µL of lysis buffer A (10µL β-mercaptoethanol/1mL lysis buffer A)
and mixed, after which 800µL of ethanol (96-100%) was added. The mixture was
transferred into a micro spin column (650µL) and centrifuged for two minutes at 3300
x g. The flow-through was discarded and the process repeated until the entire mixture
was passed through the column. The spin column was then washed three times with
400µL of the kit manufacturer’s wash solution A by centrifuging the column for 30
seconds at 3300 x g and discarding the flowthrough after each wash. The column was
spun empty in a new collection tube for two minutes at 13000 x g. The spin column
was transferred into a new Eppendorf tube and 20µL of RNase-free water applied and
let stand for two minutes at room temperature after which it was centrifuged for one
minute at 400 x g, followed by two minutes at 5800 x g. In order to increase the yield
of RNA, the elution from the previous step was added back to the spin column and re-
eluted. NanodropTM 2000/2000c (Thermo Fisher) was used to assess the presence of
inhibitors that could interfere in downstream applications, while the presence and
relative abundance of small RNA was assessed using the RNA 6000 Pico chip (Agilent
Technologies) in the 2100 Bioanalyzer instrument (Agilent Technologies).
2.4.2 RNA extraction
RNA isolated from cultured BMOL or LX2 cells was used to assess the role of miRNAs
in LPCs and HSCs biology. RNA was extracted using the RNeasy Mini Kit (Qiagen)
following manufacturers’ instructions as follows: medium was completely aspirated,
350µL of buffer RLT added and cells harvested using a cell scrapper. An equal volume
(e.g. 350µL) of 70% ethanol was added to the cell lysate, mixed and the total volume
transferred to an RNeasy Mini spin column and centrifuged for 15 seconds at 8000 x
g. The flowthrough was discarded and the 700µL of buffer RW1 added to the column
and centrifuged for 15 seconds at 8000 x g. After discarding the flowthrough, the spin
column was washed two times with 500µL of buffer RPE and centrifuged for 15
45
seconds at 8000 x g and two minutes at 8000 x g respectively discarding the
flowthrough after each wash. The column was spun empty in a new collection tube for
one minute at 8000 x g. Then, the spin column was transferred into a new Eppendorf
tube and 20µL of RNase-free water applied and centrifuged for one minute at 8000 x
g to elute RNA. NanodropTM 2000/2000c (Thermo Fisher) was used to quantify and
assess the quality of extracted RNA.
2.4.3 Small RNA library construction and NGS
cDNA libraries were prepared from miRNA isolated from serum samples (see section
2.4.1), followed by NGS to identify a circulating miRNA signature in CFLD and CFnoLD
children. An equal RNA input of 5µL from every sample was pooled into its respective
library following a common strategy when working with circulatory miRNAs (200, 209).
Libraries were prepared using the Ion Total RNA-Seq Kit v2 protocol (Thermo Fisher,
Revision E). For the hybridization and ligation of small RNAs with the adaptor, 5µL of
extracted RNA from each sample was added to its corresponding pool and
concentrated to a final volume of 3µL with the Savant DNA 120 SpeedVac
Concentrator (Thermo Fisher). The resultant 3µL of concentrated small RNA was
combined with 5µL of hybridization master mix containing 3µL of hybridization solution
and 2µL of Ion adaptor mix v2 and incubated at 65°C for 10 minutes and 16°C for five
minutes. After incubation time, 12µL of ligation master mix formed by 10µL of 2X
ligation buffer and 2µL of ligation enzyme mix was added to the hybridization reaction
and incubated at 16°C for 16 hours.
Reverse transcription (RT) of the ligated small RNA was performed using a S1000
Thermal Cycler (Biorad, California, USA), as follows: 16µL of RT master mix
(containing 2µL of nuclease-free water, 4µL of 10X RT buffer, 2µL of 2.5 mM dNTP
mix and 8µL of ion RT primer v2) was added to the 20µL of ligated small RNA. RT
reaction was then incubated at 70°C for 10 minutes, snap-cooled on ice, added 40µL
of 10X Superscript III Enzyme Mix and incubated at 42°C for 30 minutes. Following

46
RT reaction, cDNA was purified and size selected using the Magnetic Bead Cleanup
Module and eluted in 12µL of nuclease-free water.
Amplification of the obtained cDNA was performed by adding 46µL of PCR mix
(containing 45µL of Platinum PCR SuperMix High Fidelity and 1µL of Ion Xpress RNA
3’ Barcode Primer) and 1µL of Ion Xpress RNA-seq Barcode BC primer (choose from
BC01-BC16 for each library) to 6µL of purified cDNA. PCR reaction was then placed
in a S1000 Thermal Cycler (Biorad) and amplified using the following program: 94°C
for two minutes; (94°C for 30 seconds, 50°C for 30 seconds and 68°C for 30 seconds)
for 2 cycles; (94°C for three seconds, 62°C for 30 seconds and 68°C for 30 seconds)
for 14 cycles and 68°C for five minutes. The amplified cDNA was then purified and
size selected using the Magnetic Bead Cleanup Module and eluted in 15µL of
nuclease-free water.
Yield and size distribution of amplified cDNA libraries was assessed by Agilent 2100
Bioanalyzer instrument with the High Sensitivity DNA Kit (Agilent Technologies) as
described in the Ion Total RNA-Seq Kit v2 protocol. A total of 1µL of the cDNA
barcoded library was used and smear analysis performed to determine size
distribution. The ratio of mRNA ligation in the total ligation products was calculated
using the following formula: [Area (94-114bp)] ÷ [Area (50-300bp)]. The molar
concentration for each library was determined using the size range 50-300bp and
diluted to a final concentration of 100pM as suggested in the protocol. Equimolar
volumes of the diluted libraries were combined for the following steps.
Pooled diluted libraries were used to generate template-positive Ion Sphere Particles
(ISPs) coated with clonally amplified cDNA. Emulsion PCR (emPCR) was performed
using the Ion OneTouch 2 System (Thermo Fisher) following the instructions of the Ion
PI Hi-Q OT2 200 Kit (Revision C). Enrichment of the template-positive Ion PI ISPs was
performed using the Ion OneTouch ES as detailed in the Ion PI Hi-Q OT2 200 Kit
protocol.

47
miRNA sequencing was performed on the Ion Proton System (Thermo Fisher) using
the Ion PI Chip v3 (Thermo Fisher) following the Ion PI Hi-Q Sequencing 200 Kit
protocol (Revision C). Sequencing primer and Control Ion Spheres were added to the
enriched template-positive ISPs from the previous step. After annealing, sequencing
polymerase was added and a final volume of 55µL loaded into the Ion PI Chip.
Quantification of cDNA libraries, template preparation and sequencing was performed
by the Genomics Research Centre (GRC) (Brisbane, Australia).
2.4.4 RNA library construction and RNA-sequencing
RNA libraries were constructed from enriched RNA and control RNA samples obtained
during the biotin pulldown assay using the TruSeq Stranded mRNA Library Prep Kit
(Illumina, San Diego, Cal, USA) following manufacturers’ protocol described in
Document # 1000000040498 v00. For all libraries an RNA input of 100ng was used.
Purification of polyA RNA was performed by placing 50µL of each RNA input and 50µL
of RNA purification beads into individual wells of the RNA purification beads (RBP)
plate. Samples were mixed by shaking the plate at 1000rpm for one minute and
incubated at 65°C for five minutes followed by one minute on ice. Next, the RBP plate
was incubated at room temperature for five minutes and placed on a magnetic stand
to remove supernatant and washed with 200µL of Bead washing buffer (BWB) and
50µL of Elution buffer (ELB), after which it was placed on an S1000 (Biorad) 80°C pre-
heated thermal cycler for two minutes and snapped on ice. Purified polyA mRNA was
then fragmented by adding 50µL of bead binding buffer (BBB) incubated at 65°C for
five minutes followed by one minute on ice followed by additional five minutes
incubation at room temperature. The plate was then placed on a magnetic stand and
washed with 200µL of BWB and 19.5µL of fragment prime finish mix (FPF), centrifuged
at 280 x g for one minute and placed on a S1000 (Biorad) 100°C pre-heated thermal
cycler for eight minutes at 94°C and held at 4°C. After fragmentation, cleaved RNA
fragments were reverse transcribed into first strand cDNA by transferring 17µL
fragmented RNA to a cDNA plate and adding 8µL of first strand synthesis act D (FSA)
+ SuperScript II mixture, mixed thoroughly and centrifuged at 280 x g for one minute

48
and placed on a S1000 (Biorad) 100°C pre-heated thermal cycler for 10 minutes at
25°C; 15 minutes for 42°C; 70°C for 15 minutes and held at 4°C. Next, during the
synthesis of second strand cDNA, RNA template was removed and replaced by the
complementary cDNA strand by adding 5µL of resuspension buffer (RSB) + end repair
control (CTE) to each sample, followed by 20µL of second strand marking master mix
(SSM), centrifuged at 280 x g for one minute and placed on S1000 (Biorad) 16°C pre-
heated thermal cycler for one hour at 16°C and brought to room temperature. Two-
stranded cDNA was then purified by adding 90µL of AMPure XP beads, incubated for
15 minutes at room temperature and centrifuged at 280 x g for one minute before the
supernatant was discarded. AMPure XP beads were then washed twice with 200µL
80% ethanol and air-dried for 15 minutes, after which 17.5µL of resuspension buffer
(RSB) was added, placed on a magnetic stand and the supernatant transferred to a
clean plate. One adenine (A) nucleotide was then added to the 3’ ends of purified
cDNA to prevent them from ligating to each other by adding 2.5µL of RSB + A-tailing
control (CTA), centrifuged at 600 x g for five seconds, followed by the addition of
12.5µL of A-tailing mix (ATL) and incubated for 30 minutes at 37°C, 70°C for five
minutes and placed on ice for one minute. Barcode multiplex adapters were then
added to the double stranded cDNA fragments by adding 2.5µL of RSB + ligation
control (CTL); 2.5µL ligation mix (LIG); 2.5µL RNA adapter, centrifuged at 280 x g for
one minute and incubated at 30°C for ten minutes. Then, 5µL of stop ligation buffer
(STL) were added and centrifuged at 280 x g for one minute after which ligated
fragments were cleaned up using the AMPure XP Beads. Following adapter ligation,
cDNA fragments with adapter molecules were enriched and amplified by adding 5µL
of PCR primer cocktail (PPC) and 25µL of PCR master mix (PMM) to the cDNA
fragments on a PCR plate on ice and placed on S1000 (Biorad) 100°C pre-heated
thermal cycler for 30 seconds at 98°C; 15 cycles of: 98°C for 10 seconds, 60°C for 30
seconds, 72°C for 30 seconds; followed by 72°C for five minutes and held at 4°C.
cDNA amplification was performed by adding 25µL of PMM and placed on S1000
(Biorad) 100°C pre-heated thermal cycler for 30 seconds at 98°C; 15 cycles of: 98°C
for 10 seconds, 60°C for 30 seconds, 72°C for 30 seconds; followed by 72°C for five
minutes and held at 4°C. Amplified cDNA was cleaned up using the AMPure XP
Beads.

49
Quantification and yield of DNA libraries was assessed by Agilent 2100 Bioanalyzer
instrument with the High Sensitivity DNA Kit (Agilent Technologies) and libraries
normalized and pooled for cluster generation. Clustered cDNA libraries were
sequenced on the NextSeq500 (Illumina Inc.), 150 cycle (2x75bpp) High Output Run
following the setup recommended by the manufacturer. Library preparation and
sequencing of enriched BMOL samples was performed by the Centre for Brain
Genomics of the Queensland Brain Institute (QBI; The University of Queensland, St.
Lucia, Australia). Library preparation and sequencing of enriched LX2 samples was
performed by the IMB Sequencing Facility (ISF) of the Institute for Molecular
Bioscience (IMB; The University of Queensland, St. Lucia, Australia).
2.4.5 miRNA Reverse transcription (RT) and miRNA qRT-PCR Validation
Following NGS, miRNA candidates were selected for individual validation in 124
individual patient samples by qRT-PCR. Similarly to the small library preparation, a
fixed RNA volume input of 4µL per sample was used for the RT reaction due to
limitations in quantifying circulatory miRNAs. Extracted RNA was reverse transcribed
using the miScript II RT Kit (Qiagen) following manufacturer’s indication as follows:
4µL of extracted RNA from each sample was added to 16µL RT master mix (comprised
of 4µL miScript HiSpec Buffer, 2µL 10X Nucleics Mix, 2µL miScript Reverse
Transcriptase Mix and 8µL of nuclease-free water). The RT reaction mix was then
incubated at 37°C for 60 minutes and 95°C for five minutes using a S1000 Thermal
Cycler (Biorad). cDNA was diluted 1:10 in nuclease-free water, split into aliquots for
qRT-PCR and stored at -80°C.
qRT-PCR assay was performed using the miScript SYBR Green PCR Kit (Qiagen) as
follows: 2µL of cDNA template was added to 8µL of qRT-PCR master mix (containing
5µL of 2X QuantiTect SYBR Green PCR Master Mix, 1µL of 10X miScript Universal
Primer, 1µL of 5µM miRNA primer and 1µL of nuclease-free water) and added in
triplicates for each sample to LightCycler 384-multiwell plates (Roche, Basel,
Switzerland). PCR amplification was performed in the CFX384 Touch Real-Time PCR

50
Detection System (Biorad) with the following cycling parameters: PCR initial activation
step at 95°C for 15 minutes; (denaturing step at 95°C for 15 seconds, annealing step
at 60°C for one minute and extension step at 95°C for 15 seconds [fluorescence data
collected]) for 40 cycles. Melting curve analysis was performed by increasing the
temperature of the plate from 55°C to 90°C with fluorescence measurements obtained
every one degree increment. The analysis confirmed the production of a single
amplicon in every run. A 1:10 cDNA inter-run calibrator (IRC) was made by pooling
RNA from Huh7 cultured cells (hepatocyte lineage) and run in triplicate to correct for
inter-plate variation.
miRNA primer design was performed using the miRprimer algorithm which generates
a number of putative primers with a score assigned based on its predicted
performance (210). Briefly, the miRprimer algorithm designs the primers with a melting
temperature of 59°C, using the assigned score to calculate secondary structures.
Finally, primers are combined and a new score assigned based on the scores of each
primer included and the score for the propensity of primer formation. Primers were
synthesised by Integrated DNA technologies (IDT). miRNA primer sequences are
shown in Table 2.6.

51
Table 2.6. miRNA primer sequences.
Name Sequence (5’-3’) Accession number
hsa-miR-122-5p TGGAGTGTGACAATGGTGT MIMAT0000421
hsa-miR-25-3p CATTGCACTTGTCTCGGT MIMAT0000081
hsa-miR-199a-3p CAGACAGTAGTCTGCACATTG MIMAT0000232
hsa-miR-365a-3p GCAGTAATGCCCCTAAAAATCC MIMAT0000710
hsa-miR-18a-5p GTAAGGTGCATCTAGTGCAG MIMAT0000072
hsa-miR-126-5p CGCAGCATTATTACTTTTGGT MIMAT0000444
hsa-miR-142-3p CGCAGTGTAGTGTTTCCT MIMAT0000434
hsa-Let-7g-5p CGCAGTGAGGTAGTAGTTTG MIMAT0000414
hsa-miR-103a-3p GCAGAGCAGCATTGTACAG MIMAT0000101
hsa-miR-34a-5p GCAGTGGCAGTGTCTTAG MIMAT0000255
hsa-miR-484 GCAGTCAGGCTCAGTCCCCT MI0002468
hsa-miR-19b-3p AGTGTGCAAATCCATGCAA MIMAT0000074
hsa-miR-93-5p GCAAAGTGCTGTTCGTG MIMAT0000093
hsa-miR-20a-5p CGCAGTAAAGTGCTTATAGTG MIMAT0000075
hsa-Let-7i-5p GCAGTGAGGTAGTAGTTTGTG MIMAT0000415
hsa-Let-7b-5p CAGTGAGGTAGTAGGTTGTGT MIMAT0000063
hsa-Let-7d-5p CGCAGAGAGGTAGTAGGTTG MIMAT0000065
hsa-miR-27a-3p GCAGTTCACAGTGGCTAAG MIMAT0000084
hsa-miR-146a-5p GCAGTGAGAACTGAATTCCA MIMAT0000449
Sequences of the primers used for miRNA qRT-PCR validation. Accession number is based on miRBase database v21.
2.4.6 RNA reverse transcription (RT) and RNA qRT-PCR Validation
RNA was reverse transcribed using the Sensifast cDNA Synthesis Kit (Bioline;
Meridian Bioscience, Cincinnati, Ohio, USA) following manufacturer’s indication as
follows: 500ng of BMOL extracted RNA and 1000ng of extracted RNA for LX2 were
used as RNA template input and added to 20µL RT master mix (comprised of 4µL 5x
TransAmp Buffer and 1µL of Reverse Transcriptase). The RT reaction mix was then
incubated at 25°C for 10 minutes followed by 42°C for 15 minutes and 85°C for five

52
minutes using a S1000 Thermal Cycler (Biorad). cDNA was diluted 1:10 in nuclease-
free water, split into aliquots for qRT-PCR and stored at -80°C.
qRT-PCR assay was performed using the Platinum SYBR Green qPCR SuperMix-
UDG (ThermoFisher) as follows: 3µL of cDNA template from the previous step was
added to 12µL of qRT-PCR master mix (containing 7.5µL of Platinum SYBR Green,
1.5µL of RNA primer mix (forward and reverse primers at a 5µM concentration each)
and 3µL of nuclease-free water) and added in triplicates for each sample to LightCycler
384-multiwell plates (Roche). PCR amplification was performed in the CFX384 Touch
Real-Time PCR Detection System (Biorad) with the following settings: 50°C for two
minutes; 95°C for two minutes followed by 40 cycles of 95°C for three seconds and
60°C for 30 seconds. Melting curve analysis was performed by increasing the
temperature of the plate from 55°C to 90°C with fluorescence measurements obtained
every one degree increment. The analysis confirmed the production of a single
amplicon in every run. A 1:10 cDNA inter-run calibrator (IRC) was made by pooling
RNA from Huh7 cultured cells (hepatocyte lineage) and run in triplicate to correct for
inter-plate variation. Most RNA primers were self-designed and synthesised by
Integrated DNA technologies (IDT); however, three were purchased from Qiagen, a
commercial supplier. Self-designed RNA and commercial RNA primer sequences are
shown in Table 2.7, Table 2.8 and Table 2.9.

53
Table 2.7. BMOL self-designed RNA primer sequences.
Gene Forward primer (5’- 3’) Reverse primer (5’- 3’)
Itga2 TGTCACGATTCCCCTCATGA TGCAGTCATAGCCAACAGCAA
Crkl CCTGGACACTACCACCTTAATCG TCTTCTGCTGTAGGTAAGTTGGG
Ptch1 GTTCTGGACGGTGCTGTGTC GCCAGGACGGCAAAGAAG
Rock1 TGTTGTGGTAAGCAGCAAAAA CTTGGGTTACAGGTCGGACA
Ep300 AGCACACACAGCTGATCCAGAGAA
CGCTGGCACTTGTGAGCATGTAAA
Nfkβ1 AGCAGGATGCTGAGGATTCTG GGCAACTCTGTCCTGCACCTA
Hnf4α GGCCACCGGCAAACACTAC CACACATTGTCGGCTAAACCTG
Notch1 CAGCTTGCACAACCAGACAGAC ACGGAGTACGGCCCATGTT
Dvl3 GTCACCTTGGCGGACTTTAAG AAGCAGGGTAGCTTGGCATTG
Appl2 TTGATAGGCTTTGCCACAGGA TCCACCTGAATGCTCTGAACCA
Akt3 TGGGTTCAGAAGAGGGGAGAA AGGGGATAAGGTAAGTCCACATC
Ptpn11 CTGAAAGAGAAGAATGGAGATG CTTTTCCAGACAAGTGACC
Acvr2a GCGTTCGCCGTCTTTCTTATC GTTGTTTCTGTCTCTTTCCCAAT
Ets1 AGTCTTGTCAGTCCTTTATCAGC TCGCACACAAAGCGGTAT
Adam17 CAGCAGCACTCCATAAGGAAA TTTGTAAAAGCGTTCGGTA
Fzd2 CCGACGGCTCTATGTTCTTC TAGCAGCCGGACAGAAAGAT
Cx3cr1 CAGCATCGACCGGTACCTT GCTGCACTGTCCGGTTGTT
Hprt GCCCCAAAATGGTTAAGGTTGC AACAAAGTCTGGCCTGTATCCAAC
Ggt1 ACAGAAGGCACTGACGTATCACC GCTCATGTTGCGGATCACCT
Tat TCGGGACGGGCTGGTGAA GGGTGCGCTGAAGGATGCTC
Sequences of the self-designed primers used for miRNA target qRT-PCR validation in BMOL
cells.
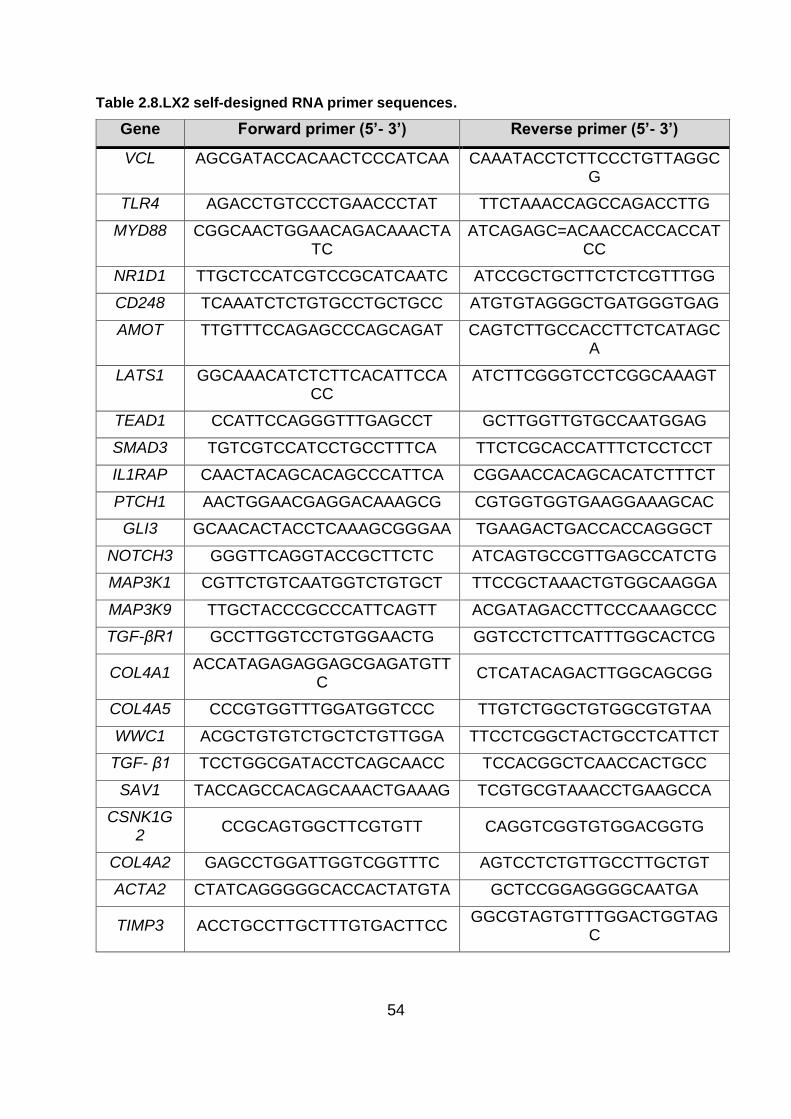
54
Table 2.8.LX2 self-designed RNA primer sequences.
Gene Forward primer (5’- 3’) Reverse primer (5’- 3’)
VCL AGCGATACCACAACTCCCATCAA CAAATACCTCTTCCCTGTTAGGCG
TLR4 AGACCTGTCCCTGAACCCTAT TTCTAAACCAGCCAGACCTTG
MYD88 CGGCAACTGGAACAGACAAACTATC
ATCAGAGC=ACAACCACCACCATCC
NR1D1 TTGCTCCATCGTCCGCATCAATC ATCCGCTGCTTCTCTCGTTTGG
CD248 TCAAATCTCTGTGCCTGCTGCC ATGTGTAGGGCTGATGGGTGAG
AMOT TTGTTTCCAGAGCCCAGCAGAT CAGTCTTGCCACCTTCTCATAGCA
LATS1 GGCAAACATCTCTTCACATTCCACC
ATCTTCGGGTCCTCGGCAAAGT
TEAD1 CCATTCCAGGGTTTGAGCCT GCTTGGTTGTGCCAATGGAG
SMAD3 TGTCGTCCATCCTGCCTTTCA TTCTCGCACCATTTCTCCTCCT
IL1RAP CAACTACAGCACAGCCCATTCA CGGAACCACAGCACATCTTTCT
PTCH1 AACTGGAACGAGGACAAAGCG CGTGGTGGTGAAGGAAAGCAC
GLI3 GCAACACTACCTCAAAGCGGGAA TGAAGACTGACCACCAGGGCT
NOTCH3 GGGTTCAGGTACCGCTTCTC ATCAGTGCCGTTGAGCCATCTG
MAP3K1 CGTTCTGTCAATGGTCTGTGCT TTCCGCTAAACTGTGGCAAGGA
MAP3K9 TTGCTACCCGCCCATTCAGTT ACGATAGACCTTCCCAAAGCCC
TGF-βR1 GCCTTGGTCCTGTGGAACTG GGTCCTCTTCATTTGGCACTCG
COL4A1 ACCATAGAGAGGAGCGAGATGTT
C CTCATACAGACTTGGCAGCGG
COL4A5 CCCGTGGTTTGGATGGTCCC TTGTCTGGCTGTGGCGTGTAA
WWC1 ACGCTGTGTCTGCTCTGTTGGA TTCCTCGGCTACTGCCTCATTCT
TGF- β1 TCCTGGCGATACCTCAGCAACC TCCACGGCTCAACCACTGCC
SAV1 TACCAGCCACAGCAAACTGAAAG TCGTGCGTAAACCTGAAGCCA
CSNK1G2
CCGCAGTGGCTTCGTGTT CAGGTCGGTGTGGACGGTG
COL4A2 GAGCCTGGATTGGTCGGTTTC AGTCCTCTGTTGCCTTGCTGT
ACTA2 CTATCAGGGGGCACCACTATGTA GCTCCGGAGGGGCAATGA
TIMP3 ACCTGCCTTGCTTTGTGACTTCC GGCGTAGTGTTTGGACTGGTAG
C

55
Gene Forward primer (5’- 3’) Reverse primer (5’- 3’)
COL1A1 CGATGGCTGCACGAGTCACA AAGCCGAATTCCTGGTCTGG
COL1A2 TGCTAAAGGAGAAAGAGGAGCCA CCATCACCACGACTTCCAGC
PPAR-γ GGCTTCATGACAAGGGAGTTTC AACTCAAACTTGGGCTCCATAAA
G
CDH1 CTGGTTCAGATCAAATCCAACA CTTCAGCCATCCTGTTTCTCTT
GAPDH GACACCCACTCCTCCACCTTTGA GTCCACCACCCTGTTGCTGTAG
Sequences of the self-designed primers used for miRNA target qRT-PCR validation in LX2
cells.
Table 2.9.Commercial RNA primer sequences.
Gene Species Product number Supplier
EP300 Human QT00094500 Qiagen
ROCK1 Human QT00034972 Qiagen
HNRNPA1 Human QT00089859 Qiagen
Sequences of the commercial primers used for miRNA target qRT-PCR validation.
2.5 Statistical and data analysis
2.5.1 Validation of reference miRNAs
geNorm v3.0 (211) and NormFinder v20 (212) were used to analyse the expression
stability of candidate reference miRNAs selected from the differential expression
analysis performed in the NGS part of the study. For both programs, quantification
cycle (Cq) values were transformed into relative quantification data applying the 2-∆∆CT
equation, by subtracting the highest Cq value from the Cq value of every measured
miRNA. By doing so, all data input represented relative expression to the least
expressed miRNA. geNorm provides a ranking of the tested miRNAs based on
expression stability (M value) which represents the mean pairwise variation of one of
the candidates when compared to the other candidates. The lowest M value
represents the most stable candidate. The stability ranking is generated by stepwise
exclusion of the candidate with the highest M value, after which the M value is
recalculated with the remaining candidates until the two most stable candidates are

56
selected. Normfinder uses an inter- and intra-group variation approach to calculate the
stability value for each of the candidates. It ranks the miRNA candidates according to
stability expression and experimental design. NormFinder ranks the candidates with
lowest stability highest.
2.5.2 qRT-PCR data analysis
Cq values were determined using the CFX Manager Software v3.1 (Biorad) with the
linear regression setting. Relative quantities of miRNA or RNA expression were
calculated using the comparative CT method (∆∆CT method). In order to correct for
differences in the quantities of cDNA used as template for qRT-PCR reactions,
reference endogenous miRNA and RNA controls were used to normalize expression
data. In the miRNA assay miR-93-5p, miR-20a-5p and let-7i-5p were used as the most
stable reference miRNAs, whereas Hprt and GADPH were used to normalise RNA
expression in BMOL and LX2 cell lines respectively. The amount of target, normalized
to the endogenous reference controls is given by the following formula:
2-∆∆CT
The mean and standard deviation of the triplicate Cq values were estimated, after
which the ∆CT values were calculated by:
∆CT=Cq target – Cq reference
The ∆∆CT was then calculated by:
∆∆CT=∆CT test sample - ∆CT calibrator sample
57
The ∆∆CT values were then incorporated into the fold-difference by using:
2-∆∆CT
Normalized relative quantities were then subject to statistical analysis.
2.5.3 miRNA-Sequence data acquisition and analysis
NGS data was analysed using the Torrent Suite v5.0.4 (Thermo Fisher) with the
default settings. The miRBase miRNA hairpin database (miRBase v21) was used as
the alignment reference following the recommendations of manufacturer (Thermo
Fisher). Cutadapt was used to remove adapter sequences and initial alignment was
carried out using Tophat2. Unmapped sequences were converted from bam to fastq
files using bam2fastq after which were aligned using Bowtie2. Finally, Bam files were
merged with Picard using the MergeSamFiles module.
mirPRo software pipeline (213) was used to perform quality control (QC), alignment
and small RNA counting, as well as prediction of potentially novel miRNAs. Briefly,
mirPRo extract mature and precursor miRNA sequences annotated by miRBase21
database for human miRNA and mapped these mature miRNAs to their corresponding
hairpins using Novoalign. Only perfect mappings are selected and positioned to their
corresponding hairpins for downstream analysis. Raw read quality filtering was
performed by FASTX-Toolkit and adapter sequence trimmed using
mirpro_findAdapter. Clean reads were collapsed and expression numbers counted
after which they were mapped to the known pre-miRNAs (hairpin sequences) using
Novoalign. mirPRo uses Novoalign to mapped final clean sequence reads to the
reference genome sequences for cataloguing clean reads in terms of genome
annotation. Clean reads are then categorized and counted in different features
annotated in gene annotation GTF files. Differential expression analysis was
performed in R v3.3.2 (214). Results from the separate raw count results were

58
combined (mixture of precursor and mature miRNAs), however, no difference was
observed in counts between precursor and mature miRNAs so these last ones were
used for the analysis. Initial threshold filtering was performed on raw count data as
follows: miRNA with two or fewer non-zero counts were selected as noise, with 10
counts selected as noise threshold. Any miRNA with a maximum count of less than
the noise threshold was excluded from the analysis. The miRNA read counts identified
by the mirPRo pipeline were normalized for compositional bias in sequenced libraries
and library size using the DESeq2 v1.15.28 package (215). Next, differential
expression of miRNA read counts was performed using DESeq2. Pair-wise
comparisons were generated between the different conditions of interest. Sequence
data acquisition and analysis was performed by the Genomics Research Centre
(GRC) (Brisbane, Australia).
2.5.4 Data deposition
Raw NGS of the miRNA-sequencing data used in this study are available from the
Gene Expression Omnibus (GEO) under accession number GSE111754.
2.5.5 RNA-sequencing data acquisition and analyses
RNA sequencing data output was de-multiplexed and converted from BCL to FASTQ
file format using the bcl2fastq Conversion Software v2.20 (Illumina Inc.). Sequencing
quality control (QC) was performed using RNA-SeQC v.1.1.8 (216). Converted
sequencing reads were processed as follows: Cutadapt v1.11 (217) was used to trim
adapters and aligned with STAR v2.5.2a (218), using the GRCh37 database as
alignment reference and assembled with Ensembl (release 70) features including
gene, transcripts and exon. Gene expression was estimated using RSEM v1.2.30
(219). Differential expression analysis was performed in R v3.3.2 (214), using the
edgeR Bioconductor package (220). Pair-wise comparisons were generated between
controls and enriched pulldown RNA for each miRNA duplex and cell line used. De-

59
multiplexing, conversion, QC, trimming and alignment was performed by members of
the Clinical Genomics Group (QIMR Berghofer, Queensland, Australia).
2.5.6 miRNA-sequencing statistical analysis
All statistical analyses were performed in GraphPad Prism v7 (GraphPad Software,
San Diego, USA) and STATA v15 (Stata Corp LLC, Texas, USA), with P values <0.05
considered statistically significant. Sample size calculation was based on a previous
study (200). Limited work has been undertaken in miRNA-sequencing statistical
design, however, in this study the statistical design is based on RNA-sequencing
studies using a method developed by Hart et al.(221). This method bases its
calculations on a negative binomial distribution (NB) that accounts for both biological
and technical variability. It was determined that a minimum of 10 samples per group
were required to detect a fold change of two or greater, reading depth of 20X, 80% of
power and 5% error.
Normalised qRT-PCR data was transformed to log base 2 and analysed using one-
way analysis of variance (ANOVA) and Tukey post-hoc test to compare the differences
between all of the groups. Correlation analyses were performed using Spearman rank
correlations. Receiver operating characteristics (ROC) analysis was used to assess
the ability of selected miRNAs to distinguish between CFnoLD and CFLD children.
miRNA panel calculations to differentiate study groups were based on stepwise logistic
regression using the lowest Bayesian information criterion for model selection and
Liu’s method to determine the optimal cut-point. The probability that a patient has
CFLD using the proposed miRNAs can be determined based on the coefficient
estimated by the logistic regression analysis based on the following equation:
ln (pᵢ
1-pᵢ) = Intercept + ∑ Slopek x ∆CPmiRNAk
k
k=1
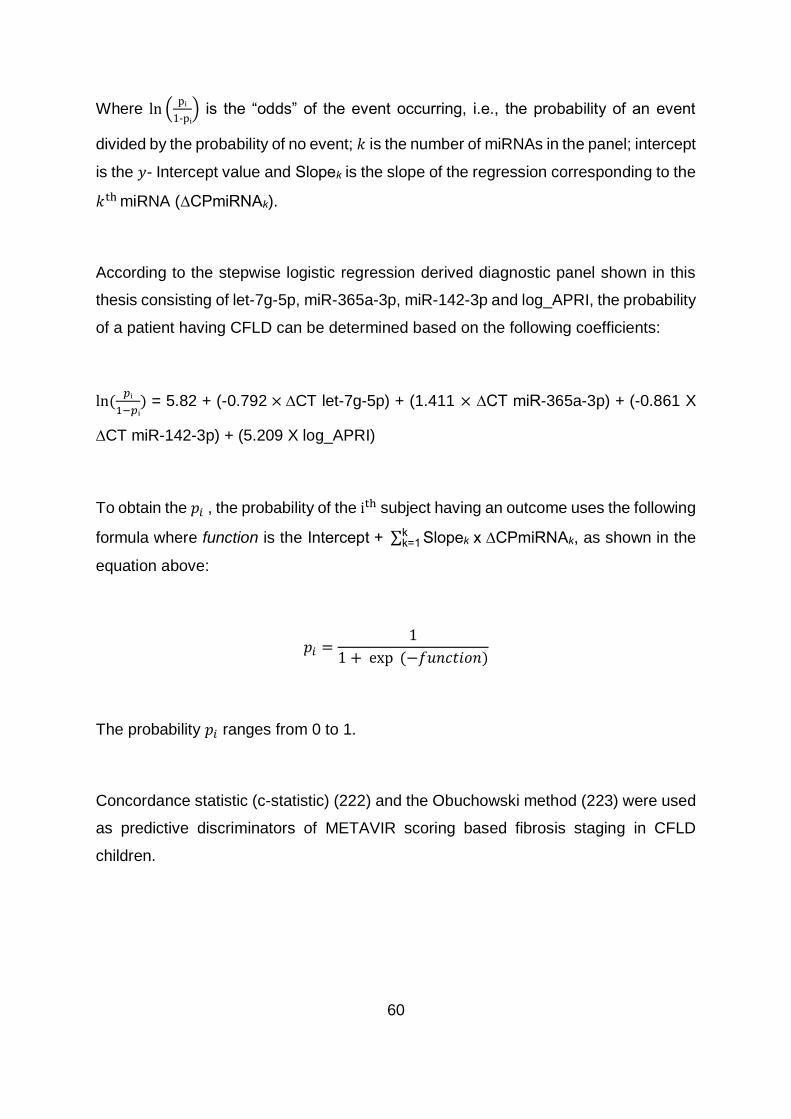
60
Where ln (pᵢ
1-pᵢ) is the “odds” of the event occurring, i.e., the probability of an event
divided by the probability of no event; 𝑘 is the number of miRNAs in the panel; intercept
is the 𝑦- Intercept value and Slopek is the slope of the regression corresponding to the
𝑘th miRNA (∆CPmiRNAk).
According to the stepwise logistic regression derived diagnostic panel shown in this
thesis consisting of let-7g-5p, miR-365a-3p, miR-142-3p and log_APRI, the probability
of a patient having CFLD can be determined based on the following coefficients:
ln (𝑝ᵢ
1−𝑝ᵢ) = 5.82 + (-0.792 × ∆CT let-7g-5p) + (1.411 × ∆CT miR-365a-3p) + (-0.861 X
∆CT miR-142-3p) + (5.209 X log_APRI)
To obtain the 𝑝𝑖 , the probability of the ith subject having an outcome uses the following
formula where function is the Intercept + ∑ Slopek x ∆CPmiRNAkkk=1 , as shown in the
equation above:
𝑝𝑖 =1
1 + exp (−𝑓𝑢𝑛𝑐𝑡𝑖𝑜𝑛)
The probability 𝑝𝑖 ranges from 0 to 1.
Concordance statistic (c-statistic) (222) and the Obuchowski method (223) were used
as predictive discriminators of METAVIR scoring based fibrosis staging in CFLD
children.

61
2.5.7 Liver stiffness statistical analysis
All statistical analyses were performed in GraphPad Prism v7 (GraphPad Software,
San Diego, USA) and JMP Pro version 14.1.0 (SAS Institute Inc., North Carolina,
USA), with P values <0.05 considered statistically significant. All LSM measurements
were expressed as median with interquartile range (IQR) (224). Sample size
calculation was performed based on a previous study (225) on an Acuson S2000
device (Siemens Medical Solutions, Mountain View, CA, USA) as it uses acoustic
radiation force impulse to create the mechanical pulse-wave, similar to SSWE. Based
on this study, standard deviation of the stiffness measurement in the right lobe of the
liver is 0.15; hence, sample size was calculated to detect differences between 0.05
and 0.35 meters/second (m/s) assuming that the analysis will be a one-way ANOVA.
It was determined that a minimum of 34 samples per group are required to detect a
difference of 0.1m/s in at least one of the three enrolled patient groups with 80% power
and 5% significance level.
LSM differences between the study groups were analysed using Mann-Whitney test
or Kruskal-Wallis and Dunn’s post-hoc test as appropriate. Correlation between LSM
and clinical characteristics and liver biochemistries were performed using Spearman
rank correlations. Receiver operating characteristics (ROC) analysis and
Classification and Regression tree (CART) modelling were used to assess the
performance of SSWE to discriminate liver disease alone, or in combination with APRI,
in CF children. During CART analysis the dataset is divided based on ranges of the
LSM and APRI as predictor variables into high and low risk groups. CART was
performed using 5-fold cross-validation and a minimum split size of 10 to reduce over
fitting. Area under the curve (AUC) was performed using ROC curve in the CART
model to assess its diagnostic performance.

62
2.5.8 Network and pathway analyses
Predicted miRNA-mRNA interactions were obtained using the TargetScan algorithm
v7.2 (226). Enriched mRNA obtained from the pulldown assays were compared with
targets predicted by TargetScan using Ingenuity Pathway Analysis (IPA; Qiagen).
Putative targets were selected based on significance (P<0.05) and fold change (FC)
≥1.5. The Functional analysis tool on IPA was used to identify the most representative
biological functions represented by enriched RNA captured during the pulldown assay.

63
CHAPTER 3
Assessment of paediatric CFLD using Supersonic
shearwave elastography....

64
3.1 INTRODUCTION
The implementation of respiratory and microbial management, nutrition optimization,
cystic fibrosis transmembrane conductance regulator (CFTR) modulators and
mucoactive drugs over the past several decades has increased the life expectancy of
cystic fibrosis (CF) patients from 34.0 years during 1991-1995 to 47.7 years in 2016
(11) and is expected to exceed 50 years of age in patients born after the year 2000
(12). Simultaneously, the number of patients with CF in western countries is expected
to increase by 50% in 2025, corresponding to 20% and 75% in children and adults
respectively (10). This improved life expectancy and increase in the prevalence of CF
has drawn attention to non-respiratory complications such as cystic fibrosis-
associated liver disease (CFLD), currently, the leading cause of non-respiratory
mortality and morbidity associated with CF. It has been proposed that during CFLD,
abnormal CFTR function leads to inspissation of viscid bile in the biliary tree which
results in biliary obstruction, hepatocyte and cholangiocyte injury and periductal
inflammation producing fibrosis and cirrhosis (227).
According to the World Health Organization (WHO), CF affects 1 out of 2500 newborns
(13), 15.6% of whom are diagnosed with severe liver abnormalities and 5% die due to
end stage liver disease prior to the advent of liver transplantation (228). The true
prevalence of CFLD, however, is likely to be higher as an autopsy study reported that
up to 70% of CF patients showed significant focal biliary cirrhosis (60). Indeed,
advanced fibrosis of the liver including cirrhosis and the complications of portal
hypertension are reported in 5- 10% of children during the paediatric years (229).
Similarly, the impact of CFLD on mortality has been underestimated as demonstrated
by studies reporting increased all-cause childhood mortality in those with CFLD (64,
230). With an increasing CF population, diagnosis and monitoring of non-pulmonary
complications such as CFLD will be required to better manage patient care and
treatment.

65
Paediatric liver diseases are often missed or diagnosed late, mainly due to the lack of
symptoms at early stages of the disease. CFLD is frequently asymptomatic and shows
a wide spectrum of manifestations. The lack of a uniform clinical definition and
classification for CFLD only contributes to an already challenging diagnosis. Currently,
liver biopsy is the gold standard method to assess and stratify the severity of liver
damage in CFLD prior to the advent of cirrhosis and portal hypertension. However,
liver biopsy has limitations as the specimen collected represents 1/50,000th (231) of
the entire liver which limits it reliability given the sampling limitations and the known
focal distribution of CFLD lesions. Modifications such as the use of dual-pass liver
biopsy can improve the assessment of liver fibrosis in CFLD as demonstrated by
Lewindon et al. (64). Despite these improvements, liver biopsy is not popular as it is
invasive with the potential for severe complications including bleeding, pneumothorax,
haemothorax and death, and management pathways are not well elucidated (77).
Non-invasive diagnostic modalities to diagnose CFLD and stratify disease severity are
paramount to identify children with CF at risk of developing liver disease, for
surveillance and screening for complications, or predict the most appropriate timing
for liver transplantation and effectively evaluate emerging therapies. The utility of
serum biomarkers such as aspartate aminotransferase to platelet ratio index (APRI)
(124) or circulatory miRNAs (232) to detect CFLD has recently been demonstrated.
Over the past decade, non-invasive imaging techniques such as ultrasound-based
elastography have been developed and extensively assessed for detection of hepatic
fibrosis in adult chronic liver diseases (94, 233). The principle behind elastography is
complex (reviewed elsewhere (234)); briefly, it is based on a directional mechanical
excitation such as a pulse-wave applied to the liver causing a deformation or change
of shape to assess liver stiffness. Due to the liver’s elastic restoring forces, the tissue
acts against the change of shape and propagates a shearwave that travels through
the liver and back to the probe where it can be evaluated. Elastography uses
ultrasound to detect the deformation in the liver in response to the applied force and
measures the velocity of propagation of the shearwave in the tissue. The velocity of
the wave is proportional to liver stiffness, propagating faster in a stiffer tissue which

66
changes with the presence of hepatic stiffening content such as blood congestion, bile
retention in biliary obstruction and most significantly, of fibrosis (202).
Several studies have shown the ability of transient elastography (TE; Fibroscan®,
Echosens) to effectively discriminate fibrosing liver disease, not only in adults but also
in children with CF (106, 235-237). Similar studies have been conducted using
acoustic radiation force impulse (ARFI)-based techniques or point shear-wave
elastography (pSWE; Virtual Touch Quantification (VTQ). Siemens), showing
reliability as a non-invasive tool to diagnose liver fibrosis in CFLD in children and adults
(113-115, 238, 239). However, no studies have been conducted for utility in CFLD of
using 2-D ShearWave elastography (Supersonic, Aixplorer). Supersonic ShearWave
elastography (SSWE) uses acoustic radiation force to create a supersonic moving
mechanical excitation that produces tissue displacement. SSWE is integrated into an
ultrasound allowing real-time visual imaging to avoid artefacts influencing the
measurements, but also generates a real-time coloured map displaying the elasticity
values at any given time in the region of interest. These characteristics, and the
generation of a wider frequency excitation band offer distinct advantages compared to
TE and pSWE (117) including, as proposed by some, the detection of intermediate
liver fibrotic stages (204). The hypothesis for this chapter is that Supersonic
ShearWave elastography (SSWE) can be used as a non-invasive method for the
diagnosis and assessment of liver fibrosis in children with CF. Hence, the proposed
aim is to evaluate the clinical utility and feasibility of SSWE as a screening tool for the
detection of paediatric CFLD. For this chapter, I have enrolled patients and measured
liver stiffness in children with either CFLD, CFnoLD or healthy controls using SSWE
in order to prospectively evaluate its utility as a non-invasive tool for the detection of
CFLD, as well as to determine normal liver stiffness values compared to CF children
without signs of liver disease.

67
3.2 RESULTS
3.2.1 Patient characteristics
Between 2015 and 2018, a total of 125 children were prospectively enrolled and
evaluated for this study, comprising the following: 29 healthy paediatric controls, 41
children with CFnoLD and 55 children with CFLD. All children were scanned using
SSWE to assess their LSM, with 100% success rate. CFLD children were older than
children with CFnoLD and controls (P=0.0556). There were more males with CFLD
enrolled in this study (P=0.0072). Children with CFLD had increased body mass index
(BMI, P=0.0421), aspartate aminotransferase (AST, P=0.0086), alanine
aminotransferase (ALT, P=0.0109), γ-glutamyl transpeptidase (GGT, P=0.0022) and
APRI (P=0.0049), when compared to CFnoLD children. APRI was calculated in 55 CF
children (CFLD, n=36; CFnoLD, n=19) with available liver biochemistries and platelet
counts within a sixty day timeframe from the day of the SSWE scan. Patient
characteristics are shown in Table 3.1.

68
Table 3.1. Patient characteristics.
Controls
(n=29)
CFnoLD
(n=41)
CFLD
(n=55)
CFLD vs CFnoLD
P-value
Sex
Male, n (%)
Female, n (%)
21 (72.4)
8 (27.6)
19 (46.3)
22 (53.7)
30 (54.5)
25 (45.5)
0.5363a
Age (years)
Mean ± SD
IQR
7.72 ± 4.99
4 - 13
8.63 ± 3.94
6 - 12
10.27 ± 4.21
8 – 14
0.0556b
BMI (Kg/m2)
Geometric mean ± geometric SD
IQR
NA 16.42 ± 1.11
15 - 17
17.38 ± 1.15
16 - 19
0.0421c
Aspartate aminotransferase, AST (U/L)
Geometric mean ± geometric SD
IQR
NA 40.10 ± 1.38
33 - 52
61.49 ± 2.06
37 - 91
0.0086c
Alanine aminotransferase, ALT (U/L)
Geometric mean ± geometric SD
IQR
NA 38.00 ± 1.83
24 - 67
62.68 ± 2.14
36 - 100
0.0109c
γ-Glutamyl transpeptidase, γGT (U/L)
Geometric mean ± geometric SD
IQR
NA 14.67 ± 1.85
10 - 19
28.50 ± 2.31
14 - 59
0.0022c
Alkaline phosphatase, ALP (U/L)
Geometric mean ± geometric SD
IQR
NA 257.5 ± 1.40
195 - 332
239.3 ± 1.61
205 - 296
0.7657c
AST to platelet ratio index , APRI (arbitrary units)
Geometric mean ± geometric SD
IQR
NA 0.31 ± 1.62
0.21 – 0.42
0.56 ± 2.28
0.34 – 0.82
0.0049c

69
Controls
(n=29)
CFnoLD
(n=41)
CFLD
(n=55)
CFLD vs CFnoLD
P-value
Diagnostic criteria, n (%)
Clinical hepatomegaly
Present NA 1 (2.4) 22 (40.0)
Persistent elevation of ALT
Present NA 28 (68.3) 52 (94.5)
Abnormal ultrasound
Present NA 2 (4.9) 53 (96.4)
CFnoLD= cystic fibrosis no liver disease; CFLD= cystic fibrosis-associated liver disease; NA= data not available; SD= standard deviation; a= Fisher’s exact test; b= Student t test; c= Mann-Whitney Test; IQR=interquartile range.
3.2.2 CFLD children showed higher liver stiffness values compared to CFnoLD
and healthy controls
CFLD children showed significantly higher median LSM (8.1kPa, IQR= 6.7 – 11.9)
compared to both CFnoLD (6.2kPa, IQR= 5.6 – 7.0; P<0.0001) and controls (5.3kPa,
IQR= 4.9 – 5.8; P<0.0001). LSM was also increased in CFnoLD compared to controls
(P=0.0192) (Figure 3.1).

70
Figure 3.1. Liver stiffness measurements (LSM) in healthy controls, CFnoLD and CFLD children.
SSWE liver stiffness measurements (LSM) of children with CFLD versus CFnoLD and Controls. Representative SSWE image and analysis performed in children with either (A) CFnoLD showing an LSM = 5.1kPa, or (B) CFLD with an LSM = 40.5kPa. Images show real-time stiffness colour map which is homogeneous in the region of interest (circle). (C) Liver stiffness values expressed in kPa for healthy controls, CFnoLD and CFLD children. Lines represent median ± 95%CI. * P<.05, **P<.01 and ***P<.001 by Kruskal-Wallis with Dunn’s post-hoc test. LSM= Liver stiffness measurement; 95%CI= 95% confidence interval; kPa= Kilopascal; CFnoLD = cystic fibrosis no liver disease; CFLD = cystic fibrosis-associated liver disease.
3.2.3 SSWE and APRI can discriminate children with CFLD
Receiver operating characteristics (ROC) analysis revealed that SSWE demonstrated
good diagnostic accuracy for CFLD (AUC= 0.79, P<0.0001) (Figure 3.2.A). Youden’s
index determined 6.85kPa as the optimal cut-point to distinguish CFLD children with
a sensitivity of 75% and specificity of 71% (Figure 3.2.B). In this model, a LSM

71
increase of 1kPa detected by SSWE is associated with 1.7-fold (CI: 1.3 – 2.4) increase
odds of having liver disease in paediatric CF.
Figure 3.2. Diagnostic assessment of SSWE for the discrimination of CFLD.
(A) ROC curve of SSWE (AUC= 0.79, P<0.0001). (B) LSM optimal cut-point of 6.85kPa for CFLD discrimination (sensitivity= 75%; specificity= 71%). (C) ROC curve analysis in CART model combining LSM and APRI showed improve diagnostic accuracy for CFLD (AUC= 0.84, sensitivity=67%, specificity=88%). (D) Scatterplot illustrates cut-points determined by CART modelling used to discriminate CFLD from CFnoLD children. Blue dots represent CFnoLD. Red dots represent CFLD
Several studies have shown the use of APRI as a non-invasive biomarker for the
detection of CFLD (124, 232). ROC curve analysis of APRI for detection of liver
disease in this cohort (i.e., CFLD vs CFnoLD) showed an AUC= 0.74 (P=0.0040),
similar to previous reports (124). Therefore, classification and regression tree (CART)
modelling was used to assess the combined performance of SSWE and APRI to
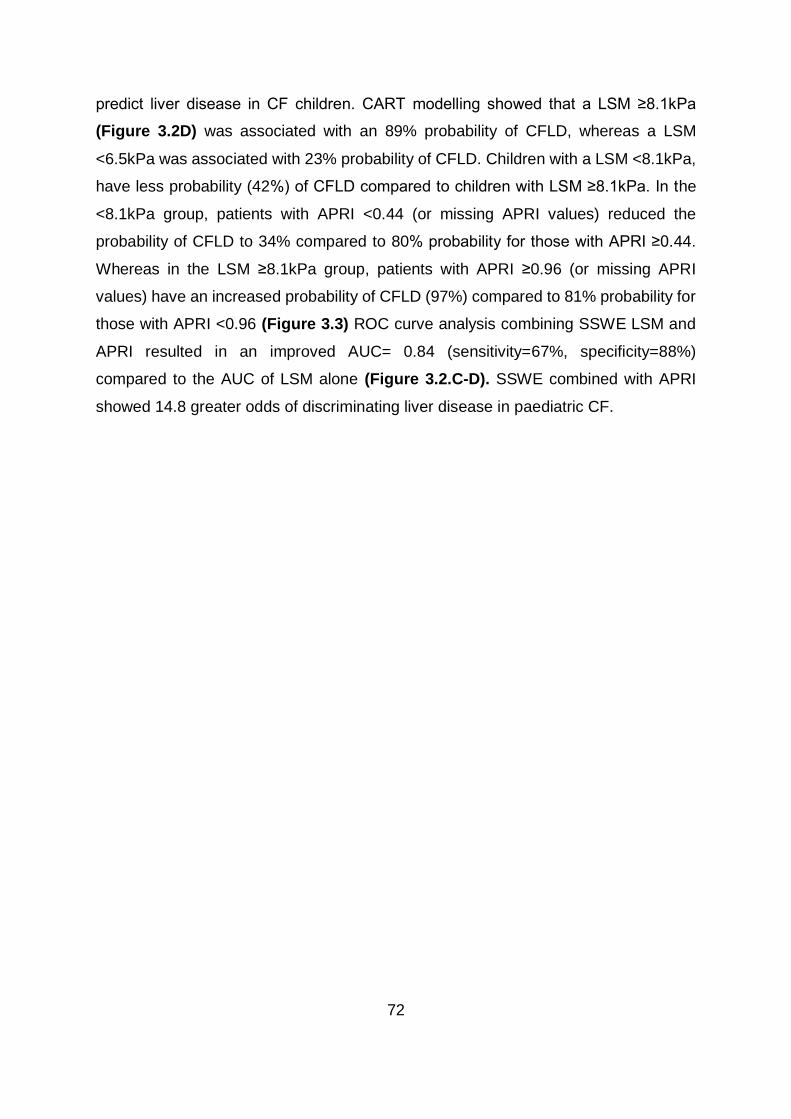
72
predict liver disease in CF children. CART modelling showed that a LSM ≥8.1kPa
(Figure 3.2D) was associated with an 89% probability of CFLD, whereas a LSM
<6.5kPa was associated with 23% probability of CFLD. Children with a LSM <8.1kPa,
have less probability (42%) of CFLD compared to children with LSM ≥8.1kPa. In the
<8.1kPa group, patients with APRI <0.44 (or missing APRI values) reduced the
probability of CFLD to 34% compared to 80% probability for those with APRI ≥0.44.
Whereas in the LSM ≥8.1kPa group, patients with APRI ≥0.96 (or missing APRI
values) have an increased probability of CFLD (97%) compared to 81% probability for
those with APRI <0.96 (Figure 3.3) ROC curve analysis combining SSWE LSM and
APRI resulted in an improved AUC= 0.84 (sensitivity=67%, specificity=88%)
compared to the AUC of LSM alone (Figure 3.2.C-D). SSWE combined with APRI
showed 14.8 greater odds of discriminating liver disease in paediatric CF.
73
Figure 3.3. CART decision tree for predicting liver disease in children with CF.
Recursive partition analysis (using CART) revealed the best cut-points for LSM and APRI that discriminate liver disease in children with CF. All 96 CF patients had LSM, however, only 55 had APRI available within sixty days of the time of SSWE (CFLD, n=37 and CFnoLD, n=18). The term “Missing” represents children for whom APRI is not available. Table (top left corner) shows the number of patients classified in each assigned cut-point (leaf). Red colour represents CFLD children. Blue colour represents CFnoLD children. LSM= Liver stiffness measurement; kPa= Kilopascal; APRI= Aspartate aminotransferase (AST) to platelet ratio index; Prob= probability; CFnoLD = cystic fibrosis no liver disease; CFLD = cystic fibrosis-associated liver disease.
3.2.4 SSWE for assessing hepatic fibrosis severity in CFLD
Children with CFLD and severe fibrosis/cirrhosis were identified via two separate
approaches, using (i) clinical assessment or (ii) published APRI cut-offs for F3/F4
fibrosis (as described in Chapter 2, section 2.2.1). (i) Using the clinical assessment
of fibrosis severity approach, in the 55 CFLD children, 17 were classified with severe
(F3/F4) fibrosis, whereas 38 were classified with no/mild/moderate (F0-F2) fibrosis.
SSWE demonstrated excellent diagnostic accuracy in the ROC curve analysis for the
detection of severe fibrosis/cirrhosis with an AUC= 0.95 (P<0.0001), with sensitivity=
88% and specificity= 87% at an LSM cut-point of 9.05kPa, as determined by Youden’s
index (Figure 3.4.A). No improvement was observed in the diagnostic performance

74
by combining LSM and APRI. (ii) Using the published APRI cut-off for fibrosis severity
approach, 37 had APRI available from which 21 were classified as severe fibrosis and
16 as no/mild/moderate fibrosis. ROC curve analysis yielded an AUC= 0.65
(P=0.1144) with a sensitivity= 88% and specificity= 25% with a cut-point of 6.3kPa
(Figure 3.4.B). Thus, when fibrosis severity is diagnosed based on clinical
assessment, an increase of 1kPa in LSM detected by SSWE is associated with 2.2-
fold (C= 1.4 – 3.3) increase odds of having severe liver disease. This is compared to
a 1.1-fold (CI=1.0 – 1.2) increase odds when severe fibrosis/cirrhosis is classified
according to APRI score.
Figure 3.4. ROC curves for assessment of hepatic fibrosis severity in CFLD.
(A) ROC curve of SSWE based on clinical assessment to distinguish between mild/moderate fibrosis (n= 38) vs. severe fibrosis/cirrhosis (n=17); AUC= 0.95 (P<0.0001). (B) ROC curve of SSWE based on APRI score for severe fibrosis/cirrhosis (124), to distinguish between mild/moderate fibrosis (n= 16) vs. severe fibrosis/cirrhosis (n= 21); AUC= 0.65 (P=0.1144).
3.2.5 The utility of SSWE in assessing LSM progression in paediatric CF
CF children with no less than 12 months between SSWE measurements were
considered for LSM progression assessment. A total of 35 children with CF had at
least one additional LSM during the three year duration of the study, distributed as
follows: 22 children with CFLD (one year, n= 18; 2 years, n= 11; 3 years, n= 4) and 13
children with CFnoLD (one year, n= 8; two years, n= 7, three years, n= 0). None of the
CFnoLD children showed clinical evidence of CFLD development over the three year
75
duration of the study. In children with CF (CFLD and CFnoLD considered together) the
median time period between SSWE scans was 2 years (IQR= 1-2); the median LSM
progression was 0.9kPa (IQR= 0.5 – 2.4) which represents an LSM difference of
13.9% (IQR= 8.9 – 28.3); the median rate of progression was 0.7kPa/year (IQR= 0.4
– 1.3) representing a relative progression of 10%/year (IQR= 5 – 18) (Table 3.2.). For
CFnoLD children the median time period between the readings was 2 years (IQR= 1-
2); the median LSM progression was 0.9kPa (IQR= 0.6 – 1.3); which represents an
LSM difference of 15.7% (IQR= 9.8 – 21.7); the median rate of progression was
0.5kPa/year (IQR= 0.4 – 1.1) representing a relative progression of 9%/year (IQR= 8
– 14.5) (Table 3.2). For CFLD children the median time period between the readings
was 2 years (IQR= 1-2); the median LSM progression was 1.1kPa (IQR= 0.5 – 2.8)
which represents an LSM difference of 13.3% (IQR= 6.5 – 34.2); the median rate of
progression was 0.8kPa/year (IQR= 0.4 – 2.4) representing a relative progression of
11%/year (IQR= 3.8 – 21.3) (Table 3.2).
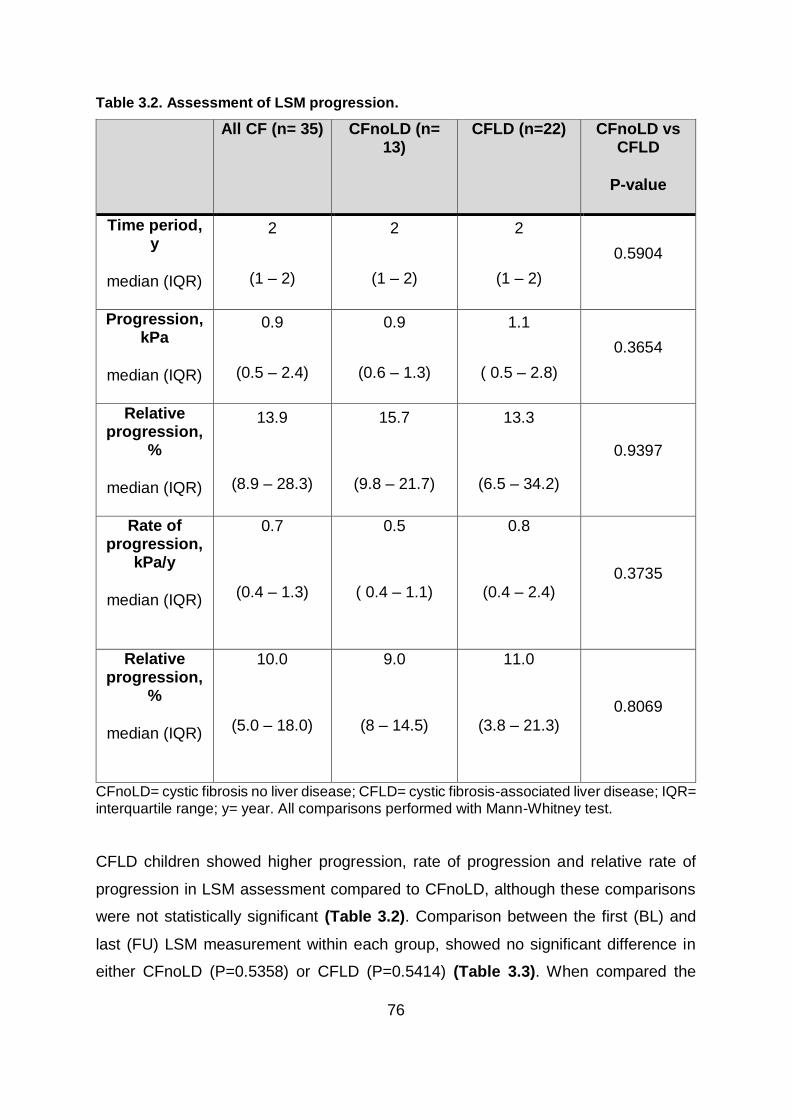
76
Table 3.2. Assessment of LSM progression.
All CF (n= 35) CFnoLD (n= 13)
CFLD (n=22) CFnoLD vs CFLD
P-value
Time period, y
median (IQR)
2
(1 – 2)
2
(1 – 2)
2
(1 – 2)
0.5904
Progression, kPa
median (IQR)
0.9
(0.5 – 2.4)
0.9
(0.6 – 1.3)
1.1
( 0.5 – 2.8)
0.3654
Relative progression,
%
median (IQR)
13.9
(8.9 – 28.3)
15.7
(9.8 – 21.7)
13.3
(6.5 – 34.2)
0.9397
Rate of progression,
kPa/y
median (IQR)
0.7
(0.4 – 1.3)
0.5
( 0.4 – 1.1)
0.8
(0.4 – 2.4) 0.3735
Relative progression,
%
median (IQR)
10.0
(5.0 – 18.0)
9.0
(8 – 14.5)
11.0
(3.8 – 21.3)
0.8069
CFnoLD= cystic fibrosis no liver disease; CFLD= cystic fibrosis-associated liver disease; IQR= interquartile range; y= year. All comparisons performed with Mann-Whitney test.
CFLD children showed higher progression, rate of progression and relative rate of
progression in LSM assessment compared to CFnoLD, although these comparisons
were not statistically significant (Table 3.2). Comparison between the first (BL) and
last (FU) LSM measurement within each group, showed no significant difference in
either CFnoLD (P=0.5358) or CFLD (P=0.5414) (Table 3.3). When compared the
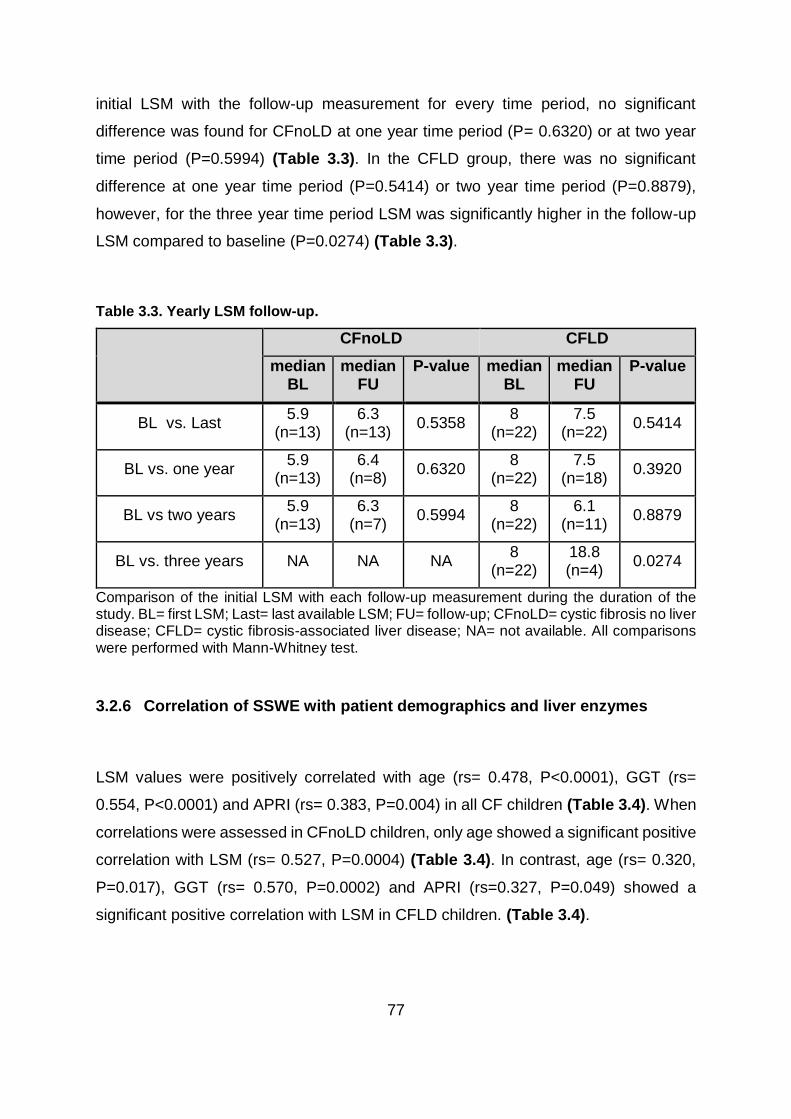
77
initial LSM with the follow-up measurement for every time period, no significant
difference was found for CFnoLD at one year time period (P= 0.6320) or at two year
time period (P=0.5994) (Table 3.3). In the CFLD group, there was no significant
difference at one year time period (P=0.5414) or two year time period (P=0.8879),
however, for the three year time period LSM was significantly higher in the follow-up
LSM compared to baseline (P=0.0274) (Table 3.3).
Table 3.3. Yearly LSM follow-up.
CFnoLD CFLD
median BL
median FU
P-value median BL
median FU
P-value
BL vs. Last 5.9
(n=13) 6.3
(n=13) 0.5358
8 (n=22)
7.5 (n=22)
0.5414
BL vs. one year 5.9
(n=13) 6.4
(n=8) 0.6320
8 (n=22)
7.5 (n=18)
0.3920
BL vs two years 5.9
(n=13) 6.3
(n=7) 0.5994
8 (n=22)
6.1 (n=11)
0.8879
BL vs. three years NA NA NA 8
(n=22) 18.8 (n=4)
0.0274
Comparison of the initial LSM with each follow-up measurement during the duration of the study. BL= first LSM; Last= last available LSM; FU= follow-up; CFnoLD= cystic fibrosis no liver disease; CFLD= cystic fibrosis-associated liver disease; NA= not available. All comparisons were performed with Mann-Whitney test.
3.2.6 Correlation of SSWE with patient demographics and liver enzymes
LSM values were positively correlated with age (rs= 0.478, P<0.0001), GGT (rs=
0.554, P<0.0001) and APRI (rs= 0.383, P=0.004) in all CF children (Table 3.4). When
correlations were assessed in CFnoLD children, only age showed a significant positive
correlation with LSM (rs= 0.527, P=0.0004) (Table 3.4). In contrast, age (rs= 0.320,
P=0.017), GGT (rs= 0.570, P=0.0002) and APRI (rs=0.327, P=0.049) showed a
significant positive correlation with LSM in CFLD children. (Table 3.4).

78
Table 3.4. Correlations of LSM with patient demographics, liver related serum enzymes and APRI.
Study group Age BMI AST ALT GGT ALP APRI
All CF
rs 0.478 0.177 0.149 0.130 0.554 0.015 0.383
P-value
<0.0001 0.076 0.268 0.328 <0.0001 0.906 0.004
CFnoLD
rs 0.527 -0.127 -0.208 -0.150 0.197 -0.080 0.192
P-value
0.0004 0.428 0.378 0.505 0.380 0.723 0.447
CFLD
rs 0.320 0.131 0.040 -0.003 0.570 0.126 0.327
P-value
0.017 0.341 0.813 0.987 0.0002 0.463 0.049
CFnoLD= cystic fibrosis no liver disease; CFLD= cystic fibrosis-associated liver disease; rs= Spearman's correlation coefficient; BMI= body mass index; AST= aspartate-aminotransferase; ALT= alanine aminotransferase; GGT= γ-glutamyl transpeptidase; ALP= alkaline phosphatase; APRI= aspartate aminotransferase to platelet ratio.

79
3.3 DISCUSSION
Over the past 10-20 years, improvements made in CF patient management such as
nutrition optimization, better understanding and strategies in antibiotic treatment,
multidisciplinary care and specially improvements in pulmonary complications have
increased life expectancy (11). Most of these advances have had a direct impact on
the respiratory complications of CF. However, non-pulmonary complications such as
CFLD, have a reported incidence of between 20-40% (61, 240), and is responsible for
approximately 2.8% of overall deaths in the CF population (62), with little advances
made in the early diagnosis or treatment of those at risk of severe liver abnormalities.
The identification of children at risk of developing CFLD with subsequent progression
to cirrhosis and portal hypertension is of great clinical importance for better patient
management. Diagnosis of CFLD is currently based on non-specific and insensitive
clinical, imaging and liver enzyme assessment (62). While dual-pass liver biopsy has
been shown to improve diagnostic accuracy to both monitor severity and the
progression of hepatic fibrosis in CFLD (64), it is not widely utilised and is an invasive
procedure with inherent risks (77) and thus it is not practical for monitoring disease
progression. Therefore, the development of non-invasive methods to assess hepatic
fibrosis is a clinical priority in CF. Ultrasound based elastography, has emerged as a
promising tool suitable for indirectly evaluating hepatic fibrosis by measuring liver
stiffness. There are three principal ultrasound-based elastography methods including
transient elastography (TE, Fibroscan), pSWE (ARFI, VTQ) and 2DSWE
(Supersonic). TE has been available for a longer period of time and therefore it has
been assessed and validated in a number of adult and paediatric chronic liver
diseases, including CFLD (235, 236). In this chapter, I have evaluated the utility of
Supersonic shearwave elastography (SSWE) to diagnose paediatric CFLD. It was
hypothesised that children with CFLD will have more liver fibrosis when compared to
those with CFnoLD and non-CF controls, leading to a higher liver stiffness. Therefore,
the difference in liver stiffness could be detected with SSWE and used to diagnose
and monitor CFLD.
In this study SSWE-derived LSM was successfully performed in 100% of subjects
scanned, similar to previous studies in paediatric patients (204, 241). Measurements

80
were well tolerated even in children < one year old. SSWE confirmed increased liver
stiffness in CFLD compared to both CFnoLD and healthy controls. The most
appropriate case definition of CFLD remains a topic of ongoing discussion in paediatric
hepatology. This thesis uses the definitions and guidelines recommended by the
European Society for Paediatric Gastroenterology, Hepatology and Nutrition
(ESPGHAN) to categorise CFLD. These guidelines state that CFLD should be
considered when at least two of the following conditions are present: abnormal
physical examination (hepatomegaly ± splenomegaly), persistent abnormalities of liver
function tests and ultrasonographic evidence of liver involvement (including increased
and/or heterogeneous echogenicity, nodularity) or portal hypertension (62). By using
these criteria the risk of ignoring important aspects of the disease as well as over
interpreting others such as elevation of serum transaminases, which are relatively
common among the CF population are reduced. Others have proposed that CFLD
should be defined as the presence of cirrhosis/portal hypertension or intermittent
elevation of liver enzymes, steatosis, fibrosis, cholangiopathy or ultrasound
abnormalities (59). Both definitions use non-specific diagnostic criteria and prioritise
advanced liver disease/cirrhosis against early manifestations of the disease or
fibrogenic processes that could potentially lead to misclassification. There are
limitations in the current ‘best practise’ guidelines for the definition of CFLD, thus these
limitations in case definition in the cohorts used in this thesis need to be considered
when assessing the clinical utility of the findings thorough the entire thesis.
Several studies have evaluated LSM using SSWE in healthy control children
demonstrating median values ranging from 5.5kPa to 7.4kPa (204, 241, 242), similar
to the median LSM of 5.3kPa in this study. No previous studies have investigated the
utility of SSWE in CF subjects. However, comparative elastography studies using
SSWE and Fibroscan-TE have been performed in other chronic liver diseases showing
no major differences in stiffness measurements using these two techniques (243-245).
Several TE studies reported higher LSM in CFLD compared to CFnoLD children. In
this study, CFnoLD had a median LSM of 6.2kPa; similar to that reported for CFnoLD
by other groups using TE (106, 236, 237).The median LSM for CFLD using SSWE
reported here was of 8.1kPa, again similar to the median LSM of 8.2kPa from Klotter

81
et al. (106). However, other TE studies report much higher median LSM of between
14 – 15.1 kPa (236, 237). These differences are due to differences in study design.
TE studies with lower median kPa values for CFLD (106, 236), comparable to the
current study, used the European Society for Paediatric Gastroenterology, Hepatology
and Nutrition (ESPGHAN) guidelines to classify CFLD (62) which does not require the
presence of portal hypertension. Others define CFLD based on the presence of at
least one of the following: increased ALT, prescription of ursodeoxycholic acid,
abnormal ultrasound findings or portal hypertension (237).
SSWE demonstrated good clinical utility to discriminate liver disease in CF children
with an AUROC of 0.79 (Figure 3.2.A). Fibroscan-TE studies, however, have
demonstrated much better results with AUROC for CFLD ranging between 0.91 - 0.96.
This appears to be principally due to the classification used to define CFLD in these
patient cohorts including more patients with portal hypertension and cirrhosis (i.e.,
classifying CFLD as severe having liver abnormalities, rather than a continuum of
disease progression), as well as the inclusion of young adults up to 25 years of age.
Of interest, the suggested cut-points to distinguish CFLD in these TE studies are
between 6-7 kPa, which we confirmed in our SSWE study with a cut-point of 6.85 kPa
(Figure 3.2.B). We have previously shown the ability of APRI to differentiate CFLD
children (124). In the present study the diagnostic performance for CFLD detection
was improved when SSWE-derived LSM was combined with APRI using CART
modelling, resulting in an AUC = 0.84 (Figure 3.2.C), increasing the odds of detecting
liver disease by 15-fold.
Diagnosis of CFLD severity is a significant clinical need with major implications in the
clinical management and quality of life of children with CFLD. In the absence of liver
biopsy in this study, children with CFLD were classified as having severe
fibrosis/cirrhosis or mild/moderate fibrosis using two different approaches: firstly, using
clinical assessment i.e., ± PHT or ultrasound-based cirrhosis, and secondly based on
previously reported APRI cut-off for severe fibrosis/cirrhosis (124). Using these
classifications, 17 children were classified with severe fibrosis/cirrhosis and 38 with
mild/moderate fibrosis via clinical assessment, whereas 21 and 16 children were

82
classified with severe fibrosis/cirrhosis and mild/moderate fibrosis, respectively, by
APRI cut-off (where APRI was available). Using SSWE the diagnostic accuracy for
discriminating severe fibrosis/cirrhosis on clinical assessment was excellent with an
AUC=0.95 (sensitivity= 88% and specificity= 87%) at a proposed cut-point of 9.05 kPa
(Figure 3.4.A). Others have reported similar values for SSWE when compared to liver
biopsy to assess hepatic fibrosis severity in a variety of chronic liver diseases (204,
246). Franchi-Abella et al. (204) measured liver stiffness in children with chronic liver
disease including patients after liver transplantation, biliary atresia and cholestasis,
with an AUC= 0.97 (sensitivity= 91.7% and specificity= 95.7; cut-point of 9.49 kPa) for
severe fibrosis. Similarly, a meta-analysis of 12 studies with 550 children with chronic
liver disease demonstrated an overall AUC=0.91 (sensitivity= 81% and specificity=
91%) with a cut-point of 9.4 kPa to predict significant liver disease (246). Taken
together, these results confirm the strength of SSWE in detecting advanced fibrosis in
children with CFLD, comparable to its use in other liver diseases. When hepatic
fibrosis severity was assessed based on APRI, the diagnostic performance of SSWE
for severe fibrosis/cirrhosis was sub-optimal with an AUC= 0.65 (sensitivity= 88% and
specificity= 25% with a cut-point of 6.3kPa) (Figure 3.4.B). These differences may be
explained by the relatively small number of children with CF where APRI data was
available at the time of SSWE performance. Furthermore, when classifying patients
via clinical assessment, children with the most severe form of the disease are more
likely to be grouped together than when APRI was used to classify patients. This is
reflected on the higher cut-point suggested for the clinical assessment classification
(9.05kPa), compared to lower cut-point suggested for the APRI-based classification
(6.3 kPa).
Monitoring the development and evolution of disease severity in CF children is also of
great clinical importance as it provides information on patients likely to develop CFLD
as well as those with worsening fibrosis. In the present study, LSM increased in all CF
children over a median follow-up of two years, representing an average increase of
10% per year (Table 3.2). Assessed by study groups, LSM increased in children with
CFnoLD by 0.5 kPa per year, representing a 9% increase in LSM/year. In children with
CFLD, LSM increased at a rate of 0.8 kPa per year, representing an 11% increase in
83
LSM/year (Table 3.2). No significant difference was observed in progression of liver
stiffness between children with CFLD or CFnoLD, although there was a significant
increase in LSM in CFLD comparing year 3 follow-up to baseline LSM (Table 3.3),
which supports the potential utility of SSWE-derived LSM in monitoring fibrosis
progression in paediatric CFLD. Other studies have however demonstrated
differences in TE-derived LSM between CFLD and CFnoLD over time. Gominon et al.
(105) did not classify CFLD at the initial TE-LSM scan in children with CF and
examined progression of liver stiffness in only those that developed CFLD over the
subsequent 3.5 years. Others have shown increased TE-LSM progression in CFLD
compared to CFnoLD after a 4-5 year follow-up (106). A limitation of our study was
the relatively short follow-up time and extending this period up to 5 years may reveal
similar observations to the observations of others.
3.4 Summary and future directions
In this chapter, I have shown the potential utility of the non-invasive ultrasound-based
SSWE for the detection of CFLD in children with CF, providing real time measurement
of liver stiffness for the discrimination of liver disease severity. SSWE showed very
good diagnostic accuracy for CFLD which was improved when used in combination
with APRI. An important finding from this study lies in the assessment of LSM
progression in CFLD over time. These findings can provide guidance as a bedside tool
for clinicians in the implementation of strategies to assess the presence of CFLD or in
anticipating progression to advanced fibrosis and liver transplantation.
The study design was selected based on replicating as close as possible a typical
case during annual review in the CF clinic as it informs the real applicability of SSWE
as a bedside tool. Although some factors such as fasting status, or free-breathing have
been reported to influence LSM (201), this study showed that SSWE is still robust
enough to detect important clinical differences. Likewise, when combining APRI and
LSM, children with missing APRI values were included in the model to prevent bias
when interpreting the data. This replicates real life clinical situations where SSWE but

84
not APRI may be available. This is particularly important as it demonstrates the real
utility and applicability of the technique with no need of special preparations or
cooperation from younger children.
In the future, this study could benefit from validation in a larger cohort with biopsy
validated fibrotic staging to better assess the capability of SSWE to discriminate
between intermediate degrees of fibrosis. Similarly, the combination of SSWE and
serum biomarkers is particularly exciting as it seeks to improve the diagnostic
accuracy. SSWE has proved to be a good discriminator of CFLD with a better
diagnostic performance compared to current accepted methods although not in
routinely clinical practise, such as APRI. Despite outperforming APRI, SSWE probably
lacks the diagnostic accuracy to be utilised as a stand-alone test for CFLD detection
or assessing fibrosis severity, therefore, in the next chapter I will explore the potential
of circulatory miRNAs as CFLD biomarkers.

85
CHAPTER 4
Investigation of a serum microRNA signature for the
discrimination of liver disease in CF and monitoring
liver disease severity in paediatric CFLD

86
4.1 Chapter contribution
Segments of the introduction, results and discussion of this chapter have been
published in the following research article:
Calvopina DA, Chatfield MD, Weis A, Coleman MA, Fernandez-Rojo MA, Noble C,
Ramm LE, Leung DH, Lewindon PJ, Ramm GA. MicroRNA Sequencing Identifies a
Serum MicroRNA Panel, Which Combined With Aspartate Aminotransferase to
Platelet Ratio Index Can Detect and Monitor Liver Disease in Pediatric Cystic Fibrosis.
Hepatology 2018; 68:2301-2316.
Diego A. Calvopina allocated patients into their respective cohorts (under the
supervision of Peter J. Lewindon and Grant A. Ramm), extracted miRNA from serum
samples, constructed miRNA libraries, performed miRNA reverse transcription and
miRNA qRT-PCR, collected, analysed and interpreted data and wrote the research
article.
Mark D. Chatfield performed the more advanced statistical analyses (e.g. logistic
regression, concordance statistic and Obuchowski method). Grant A. Ramm
conceived the idea for the study. Anna Weis and Louise E. Ramm collected clinical
data. Peter J. Lewindon assisted in study design and collection of tissue specimens
and blood samples. Charlton Noble helped enrol patients and collected tissue
specimens and blood samples. Miranda A. Coleman, Manuel A. Fernandez-Rojo and
Daniel H. Leung provided advice on study design.
87
4.2 INTRODUCTION
Non-invasive diagnostic modalities to diagnose CFLD and stratify disease severity are
paramount to identify children with CF at risk of developing liver disease, for
surveillance and screening for complications, or to predict the most appropriate timing
for liver transplantation. Current non-invasive candidates for CFLD assessment focus
on biological (serum biomarkers) and physiological properties (transient
elastrography) to indirectly assess the degree of fibrosis in the liver. Despite the
potential for these non-invasive techniques, limited studies have been undertaken in
paediatric CF populations. Increase expression of tissue inhibitor metalloproteinase 4
(TiIMP-4) and endoglin have been described in serum of adult CFLD patients (123),
while the aspartate aminotransferase (AST) to platelet ratio index (APRI) and the
fibrosis-4 (FIB-4) index have been proposed as biomarkers for diagnosis and
assessment of severity of CFLD in children (124). During the past decade, microRNAs
(miRNAs) have been considered as potential biomarkers for several chronic diseases
as they are disease- and tissue-specific, accessible in body fluids and stable in
circulation which makes them attractive circulatory biomarkers (194).
miRNAs are short interfering RNAs which catalytically silence gene expression at a
post-transcriptional level. They constitute the most abundant class of endogenous,
small, non-coding RNA with approximately 50000 copies per cell in the liver (125, 247).
miRNAs are involved in the regulation of all biological and pathological processes of
every cell type and their altered expression has been associated with a broader
fibrogenic response or liver damage (248). Furthermore, the expression profiles of
miRNAs also seem to be specific when compared between liver diseases of different
aetiologies. miRNAs predominantly exist intracellularly, however, it is possible to find
miRNAs in extracellular environments such as in serum, plasma, semen,
cerebrospinal fluid and urine (180-183, 185, 187) making them attractive biomarker
candidates.
The hypothesis for this chapter is that there is an alteration in the circulating miRNA
signature of children with CFLD that can be used to diagnose liver disease and assess
88
the progression of fibrosis severity among the CF population. Hence, the proposed
aim is to identify novel and previously described circulatory miRNAs that are
differentially expressed among CFLD and CF but no liver disease (CFnoLD) children.
In this chapter, I have used next-generation sequencing (NGS) to identify differentially
expressed serum miRNAs in children with liver biopsy validated CFLD vs. CFnoLD
children and healthy controls. Selected miRNA candidates were then validated by
qRT-PCR in an extended patient cohort. Furthermore, statistical analysis was
performed to assess the diagnostic performance of validated differentially expressed
miRNAs, alone or in combination with APRI, in the detection of liver disease in CF
children.
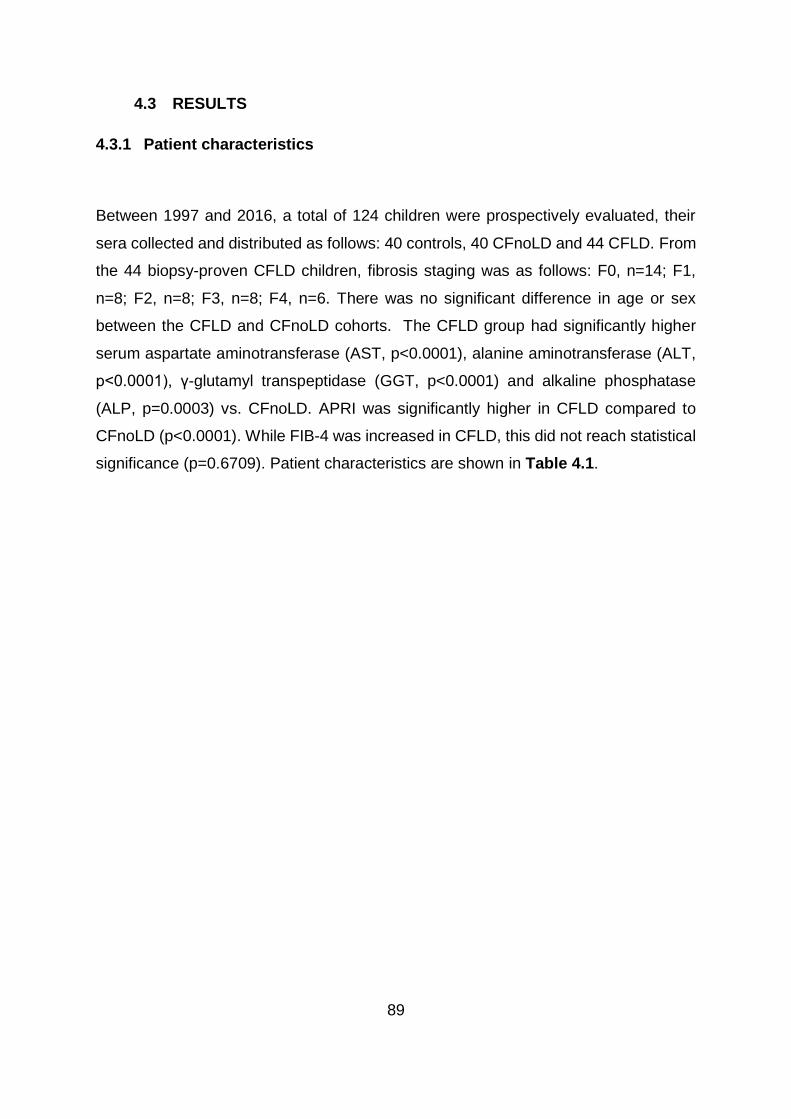
89
4.3 RESULTS
4.3.1 Patient characteristics
Between 1997 and 2016, a total of 124 children were prospectively evaluated, their
sera collected and distributed as follows: 40 controls, 40 CFnoLD and 44 CFLD. From
the 44 biopsy-proven CFLD children, fibrosis staging was as follows: F0, n=14; F1,
n=8; F2, n=8; F3, n=8; F4, n=6. There was no significant difference in age or sex
between the CFLD and CFnoLD cohorts. The CFLD group had significantly higher
serum aspartate aminotransferase (AST, p<0.0001), alanine aminotransferase (ALT,
p<0.0001), γ-glutamyl transpeptidase (GGT, p<0.0001) and alkaline phosphatase
(ALP, p=0.0003) vs. CFnoLD. APRI was significantly higher in CFLD compared to
CFnoLD (p<0.0001). While FIB-4 was increased in CFLD, this did not reach statistical
significance (p=0.6709). Patient characteristics are shown in Table 4.1.
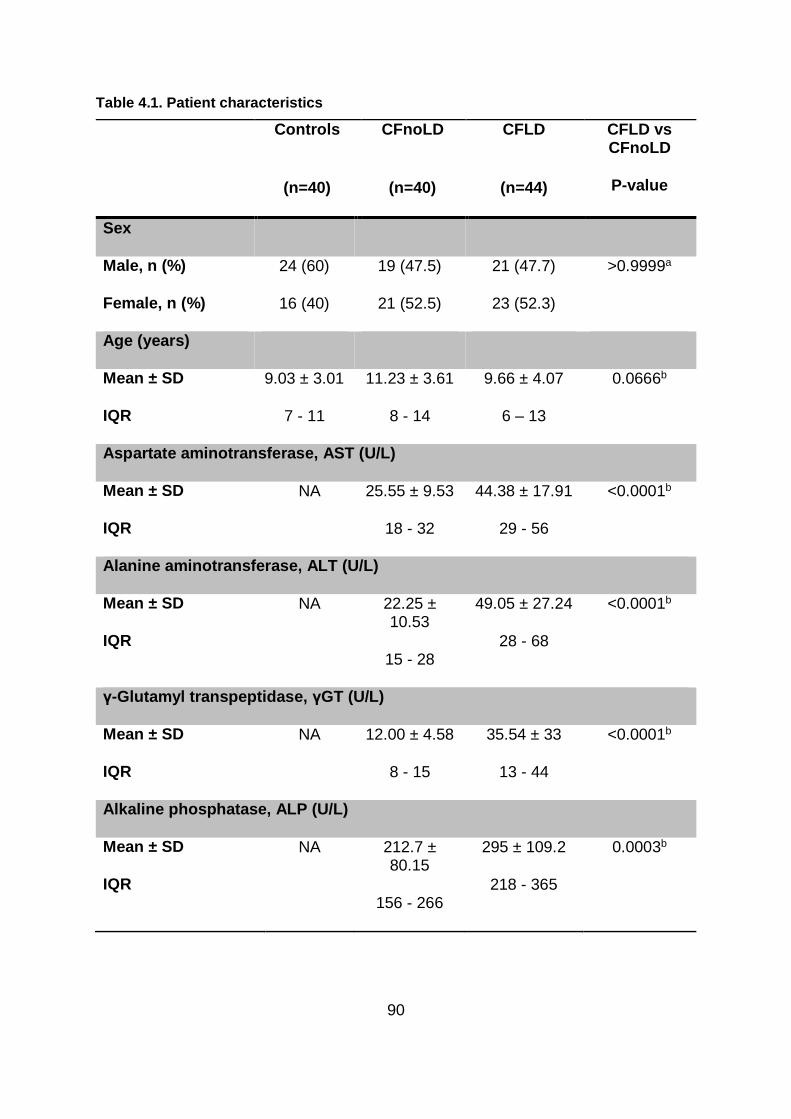
90
Table 4.1. Patient characteristics
Controls
(n=40)
CFnoLD
(n=40)
CFLD
(n=44)
CFLD vs CFnoLD
P-value
Sex
Male, n (%)
Female, n (%)
24 (60)
16 (40)
19 (47.5)
21 (52.5)
21 (47.7)
23 (52.3)
>0.9999a
Age (years)
Mean ± SD
IQR
9.03 ± 3.01
7 - 11
11.23 ± 3.61
8 - 14
9.66 ± 4.07
6 – 13
0.0666b
Aspartate aminotransferase, AST (U/L)
Mean ± SD
IQR
NA 25.55 ± 9.53
18 - 32
44.38 ± 17.91
29 - 56
<0.0001b
Alanine aminotransferase, ALT (U/L)
Mean ± SD
IQR
NA 22.25 ± 10.53
15 - 28
49.05 ± 27.24
28 - 68
<0.0001b
γ-Glutamyl transpeptidase, γGT (U/L)
Mean ± SD
IQR
NA 12.00 ± 4.58
8 - 15
35.54 ± 33
13 - 44
<0.0001b
Alkaline phosphatase, ALP (U/L)
Mean ± SD
IQR
NA 212.7 ± 80.15
156 - 266
295 ± 109.2
218 - 365
0.0003b

91
Controls
(n=40)
CFnoLD
(n=40)
CFLD
(n=44)
CFLD vs CFnoLD
P-value
AST to platelet ratio index , APRI (arbitrary units)
Geometric mean ± geometric SD
IQR
NA 0.20 ± 1.48
0.16 – 0.25
0.40 ± 2.05
0.25 – 0.52
<0.0001c
Fibrosis-4 index, FIB-4 (arbitrary units)
Geometric mean ± geometric SD
IQR
NA 0.18 ± 1.56
0.13 – 0.26
0.22 ± 2.26
0.14 – 0.28
0.6709c
CFTR genotype (%)
ΔF508 NA 65 75
Other NA 35 25
Diagnostic criteria, n (%)
Clinical hepatomegaly
Present NA 0 (0) 27 (61.3)
Persistent elevation of ALT
Present NA 12 (30) 32 (72.7)
Abnormal ultrasound
Present NA 6 (15) 35 (79.5)
CFnoLD= cystic fibrosis no liver disease; CFLD= cystic fibrosis-associated liver disease; NA= data not available; SD= standard deviation; a= Fisher’s exact test; b= Student t test; c= Mann-Whitney Test; IQR=interquartile range.
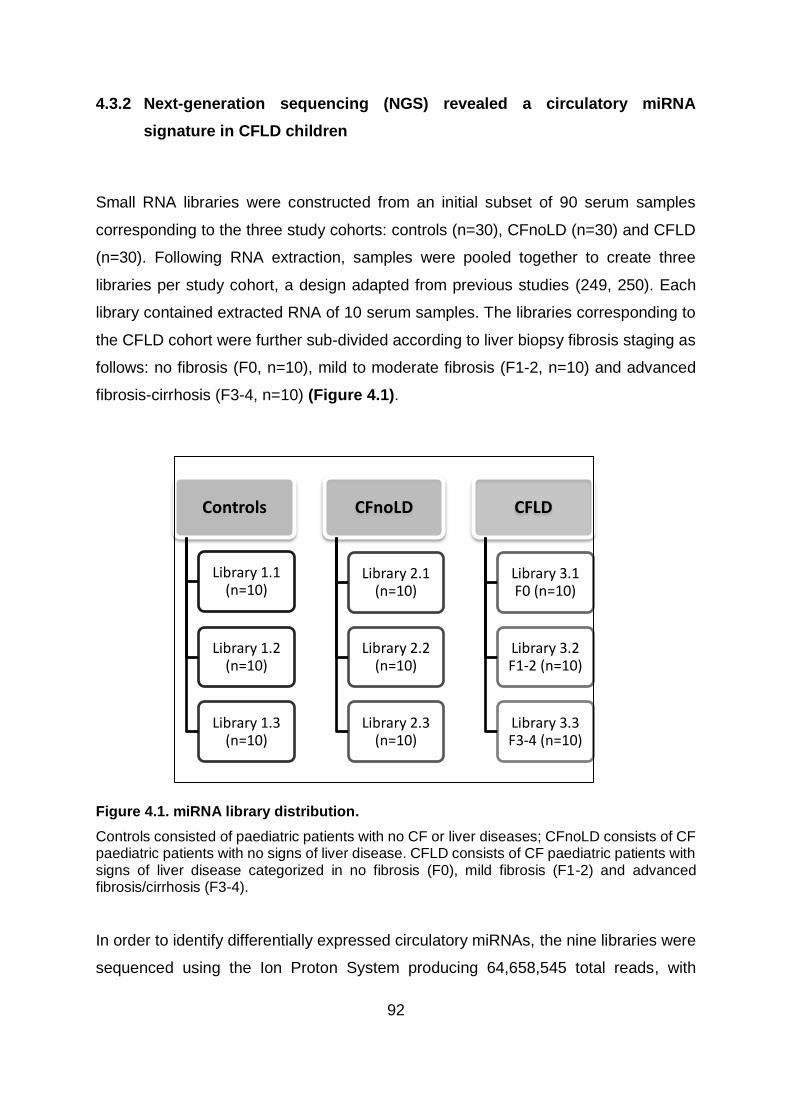
92
4.3.2 Next-generation sequencing (NGS) revealed a circulatory miRNA
signature in CFLD children
Small RNA libraries were constructed from an initial subset of 90 serum samples
corresponding to the three study cohorts: controls (n=30), CFnoLD (n=30) and CFLD
(n=30). Following RNA extraction, samples were pooled together to create three
libraries per study cohort, a design adapted from previous studies (249, 250). Each
library contained extracted RNA of 10 serum samples. The libraries corresponding to
the CFLD cohort were further sub-divided according to liver biopsy fibrosis staging as
follows: no fibrosis (F0, n=10), mild to moderate fibrosis (F1-2, n=10) and advanced
fibrosis-cirrhosis (F3-4, n=10) (Figure 4.1).
Figure 4.1. miRNA library distribution.
Controls consisted of paediatric patients with no CF or liver diseases; CFnoLD consists of CF paediatric patients with no signs of liver disease. CFLD consists of CF paediatric patients with signs of liver disease categorized in no fibrosis (F0), mild fibrosis (F1-2) and advanced fibrosis/cirrhosis (F3-4).
In order to identify differentially expressed circulatory miRNAs, the nine libraries were
sequenced using the Ion Proton System producing 64,658,545 total reads, with
Controls
Library 1.1 (n=10)
Library 1.2 (n=10)
Library 1.3 (n=10)
CFnoLD
Library 2.1 (n=10)
Library 2.2 (n=10)
Library 2.3 (n=10)
CFLD
Library 3.1 F0 (n=10)
Library 3.2 F1-2 (n=10)
Library 3.3 F3-4 (n=10)

93
average read lengths between 17-23 nucleotides (Table 4.2), the expected size for
miRNAs.
Table 4.2. miRNA sequence summary.
Library Number of reads Number of
bases Phred (≥Q20)
Control 1 4,301,615 224,702,541 216,458,153
Control 2 4,987,003 255,396,641 242,380,662
Control 3 5,241,708 269,660,791 257,464,638
CFnoLD 1 4,887,864 256,643,536 245,565,056
CFnoLD 2 5,275,420 250,121,205 235,918,877
CFnoLD 3 3,324,667 156,565,113 149,733,646
CFLD 1 2,348,026 114,431,120 110,016,466
CFLD 2 2,571,561 134,331,880 129,660,436
CFLD 3 19,745,706 1,036,283,169 992,314,962
Sequencing summary of the miRNA libraries used for this study. Phred represents the number of bases with a base call accuracy of over 99%.
During processing of the sequencing data, significantly low counts mapped from the
CFnoLD library 3 were noticed. Following principal component analysis this library was
confirmed to be an outlier and excluded from the analysis, however this did not
decrease statistical power based of the sample size calculation. Analysis of the
remaining libraries identified 659 miRNAs with a minimum average count of 10.
miRNAs were then selected for further validation by qRT-PCR based on the NGS
differential analysis, miRNA scatter plots clustering and previous literature reporting
the functions of these miRNAs related to liver function or fibrosis. Similarly, stable
expressed miRNAs were selected to identify endogenous miRNAs necessary to qRT-
PCR data. A list of the most relevant miRNAs identified can be found in Table 4.3.

94
Table 4.3. Differentially expressed miRNAs
DIFFERENTIALLY EXPRESSED miRNAs
miRNA
CFLD vs Controls CFLD vs. CFnoLD
miRNA cluster
Previously published description of role in liver disease
logFC P value LogFC P value
miR-122-5p 2.80 0.015 1.93 0.071 122/3591 • 1.5x FC tissue expression associated with increased GGT (251)
miR-132-3p 1.70 0.018 1.46 0.036 • 2x FC expression in cholestatic livers vs no cholestasis (251)
miR-365a-3p 1.44 0.080 2.59 0.004
miR-365b-3p 1.44 0.080 2.59 0.004
miR-454-5p -1.21 0.096 -1.26 0.080 • Decreased expression of α-SMA and inhibit activation Of TGFB1 treated HSCs by targeting Smad4 (252)
• Increased expression in cirrhotic liver. Negative correlation with CYP3A activity (253)
miR-664a-5p -1.27 0.099 -1.62 0.042 • Increased expression in HCC. Regulates MAT1A. Decrease MAT1A correlates with poor prognosis (254)
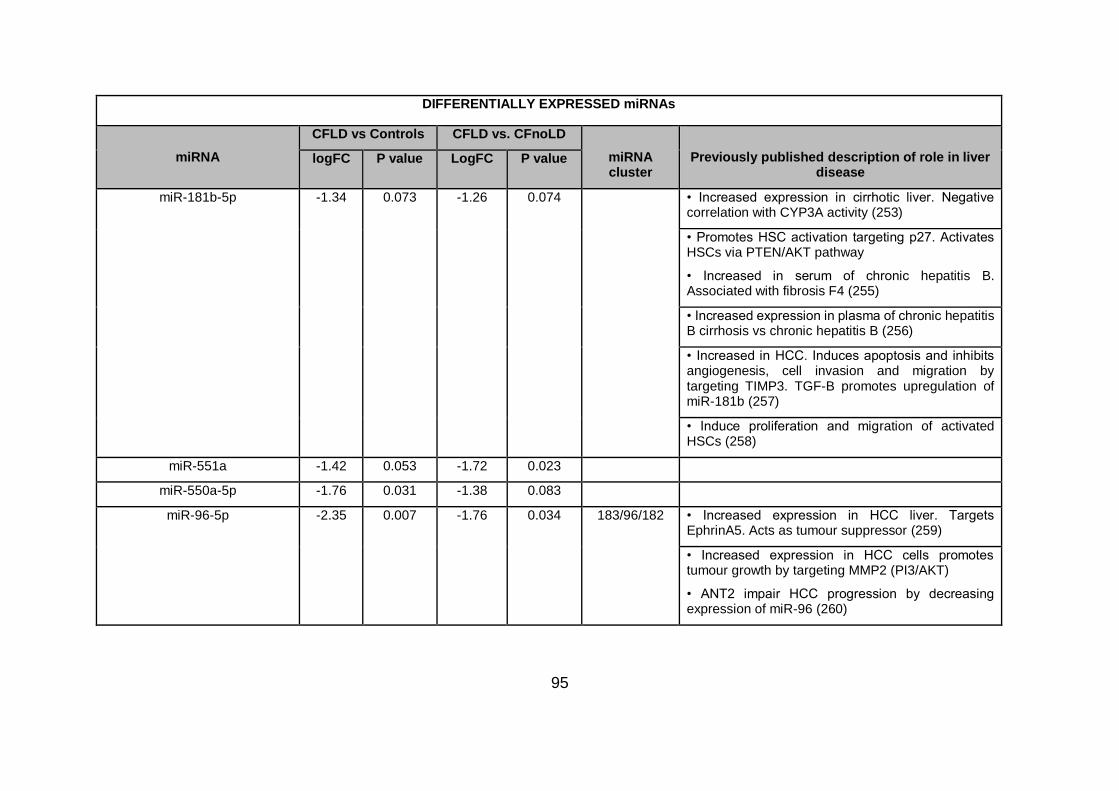
95
DIFFERENTIALLY EXPRESSED miRNAs
miRNA
CFLD vs Controls CFLD vs. CFnoLD
miRNA cluster
Previously published description of role in liver disease
logFC P value LogFC P value
miR-181b-5p -1.34 0.073 -1.26 0.074 • Increased expression in cirrhotic liver. Negative correlation with CYP3A activity (253)
• Promotes HSC activation targeting p27. Activates HSCs via PTEN/AKT pathway
• Increased in serum of chronic hepatitis B. Associated with fibrosis F4 (255)
• Increased expression in plasma of chronic hepatitis B cirrhosis vs chronic hepatitis B (256)
• Increased in HCC. Induces apoptosis and inhibits angiogenesis, cell invasion and migration by targeting TIMP3. TGF-B promotes upregulation of miR-181b (257)
• Induce proliferation and migration of activated HSCs (258)
miR-551a -1.42 0.053 -1.72 0.023
miR-550a-5p -1.76 0.031 -1.38 0.083
miR-96-5p -2.35 0.007 -1.76 0.034 183/96/182 • Increased expression in HCC liver. Targets EphrinA5. Acts as tumour suppressor (259)
• Increased expression in HCC cells promotes tumour growth by targeting MMP2 (PI3/AKT)
• ANT2 impair HCC progression by decreasing expression of miR-96 (260)

96
DIFFERENTIALLY EXPRESSED miRNAs
miRNA
CFLD vs Controls CFLD vs. CFnoLD
miRNA cluster
Previously published description of role in liver disease
logFC P value LogFC P value
miR-126-5p n.a. n.s. 4.89 0.034 • Increased in liver fibrosis (tissue). Increase expression inhibits activation and migration of HSC by targeting CPK.
• Increased expression targets NFkB inhibitor-α leading to NFKB activation
• Regulates VCAM-1 and PI3K/AKT/mTOR pathways. Anti-inflammatory mechanism in colon tumorigenesis (261)
miR-574-3p 2.61 0.102 n.a. n.s.
miR-200b-3p 2.54 0.012 n.a. n.s. 200 • Highly implicated in EMT
• Targets ZEB1/2 which repress E-cadherin (enhance EMT) (262)
Increased regulation accelerates proliferation and migration of HSCs through PI3K/AKT (258)
• Aberrant expression of miR-200 cluster associated with hepatic fibrosis
• miR-200b targets FOG2 and activates PI3K/AKT pathway that leads to proliferation and migration of HSCs
• miR-200b enhanced expression of MMP-2 which increase HSCs migration (263)
miR-26a-5p n.a. n.s. 3.998 0.065
miR-142-3p n.a. n.s. 3.509 0.035

97
DIFFERENTIALLY EXPRESSED miRNAs
miRNA
CFLD vs Controls CFLD vs. CFnoLD
miRNA cluster
Previously published description of role in liver disease
logFC P value LogFC P value
miR-194-5p n.a. n.s. 2.631 0.063 • Increased expression in HSCs inhibits cell migration and decrease α-SMA and collagen (262)
• Decrease expression in HSC isolated from fibrotic livers. Targets c-Myb and Rac1 inhibiting HSC activation and ECM production (261)
• Increased expression in bile of patients who develop acute cellular rejection after liver transplantation showing liver damage (264)
• Decrease expression in HCC tissue correlates with vascular invasion
• Increase expression in HCC cells suppresses migration and invasiveness
• Targets TRIM23 having restrictive function on NFKB signalling in HCC cells
• HNF1α decrease transcription of miR-194 (265)
miR-4429 n.a. n.s. -1.517 0.081
miR-10b-5p n.a. n.s. 2.251 0.030

98
DIFFERENTIALLY EXPRESSED miRNAs
miRNA
CFLD vs Controls CFLD vs. CFnoLD
miRNA cluster
Previously published description of role in liver disease
logFC P value LogFC P value
miR-20a-5p n.a. n.s. 5.32 0.020 17/92 • Cluster 17/92 involved in regulation of fibrosis in rodent and human livers.
• Increased expression in plasma associated to HCV infection and fibrosis.
• Increased expression in HCV patients correlate with progression of fibrosis (178)
• Increased expression in gall bladder carcinoma (GCC) promotes invasion and proliferation • Targets Smad7 (inhibitor of TGF-B) (266)
• 17/92 cluster highly expressed in cholangiocarcinoma cells vs normal biliary epithelial cells
• Expression of 17/92 cluster regulated by IL-6/STAT3 suggesting IL-6/STAT-3-miR17-92/PTEN is crucial in cholangiocarcinogenesis and tumour progression (267)

99
DIFFERENTIALLY EXPRESSED miRNAs
miRNA
CFLD vs Controls CFLD vs. CFnoLD
miRNA cluster
Previously published description of role in liver disease
logFC P value LogFC P value
let-7g-5p n.a. n.s. 4.56 0.047 • Regulates EMT by targeting K-Ras and HMGA2A in HCC cells
• Negatively regulates Bcl-xL inducing apoptosis in HCC
• Inhibits cell migration in HCC by targeting collagen I α-2
• Re-expression in HCC cells blocks EMT by decreasing regulation of K-Ras/ERK1/2 pathways (268)
• Involved in suppression of HCC migration. Decreased in regulated in metastatic HCC
• Increased expression in HCC cells. Decrease cell motility by degrading Col1A2 interfering in cell migration (269)

100
DIFFERENTIALLY EXPRESSED miRNAs
miRNA
CFLD vs Controls CFLD vs. CFnoLD
miRNA cluster
Previously published description of role in liver disease
logFC P value LogFC P value
miR-144-3p n.a. n.s. 4.48 0.010 144/451 • Decrease expression in fibrotic liver and correlated to TGF-B1 expression. May regulate TGF-B1 induced HSCs activation
• Act as tumour suppressor in HCC by targeting Akt3 (258)
• Decrease expression in HCC liver tissue
• Increased expression of miR-144 inhibit HCC metastasis, invasion and EMT by targeting Smad4 (270)
• Increase expression reduce cell proliferation, increase apoptosis and supresses migration and invasion of HCC cells
• miR-144 targets E2F3. Expression of miR-144 negatively correlated with E2F3 in HCC tissue (271)

101
DIFFERENTIALLY EXPRESSED miRNAs
miRNA
CFLD vs Controls CFLD vs. CFnoLD
miRNA cluster
Previously published description of role in liver disease
logFC P value LogFC P value
miR-15b-5p n.a. n.s. 4.24 0.036 15/107 • Increase expression inhibits proliferation and induces apoptosis of HSCs via Bcl-2 and cyclinD1 (262)
• Increased expression in serum of fatty liver disease patients.
• Increased expression of miR-15b leads to decrease of cell proliferation
• miR-15b can induce cell apoptosis by targeting BCL2 gene (272)
• Increased expression in HCC cells inhibits proliferation by targeting Bcl-2 (273)
• Regulates apoptosis by inhibiting anti-apoptotic genes e.g. Bcl-2
• Considered as redoximiRs: miRNAs that response to osmotic stress
• Targets IKKB: Inhibitor of NFk-B. Protects liver against TNF-α induced apoptosis (274)
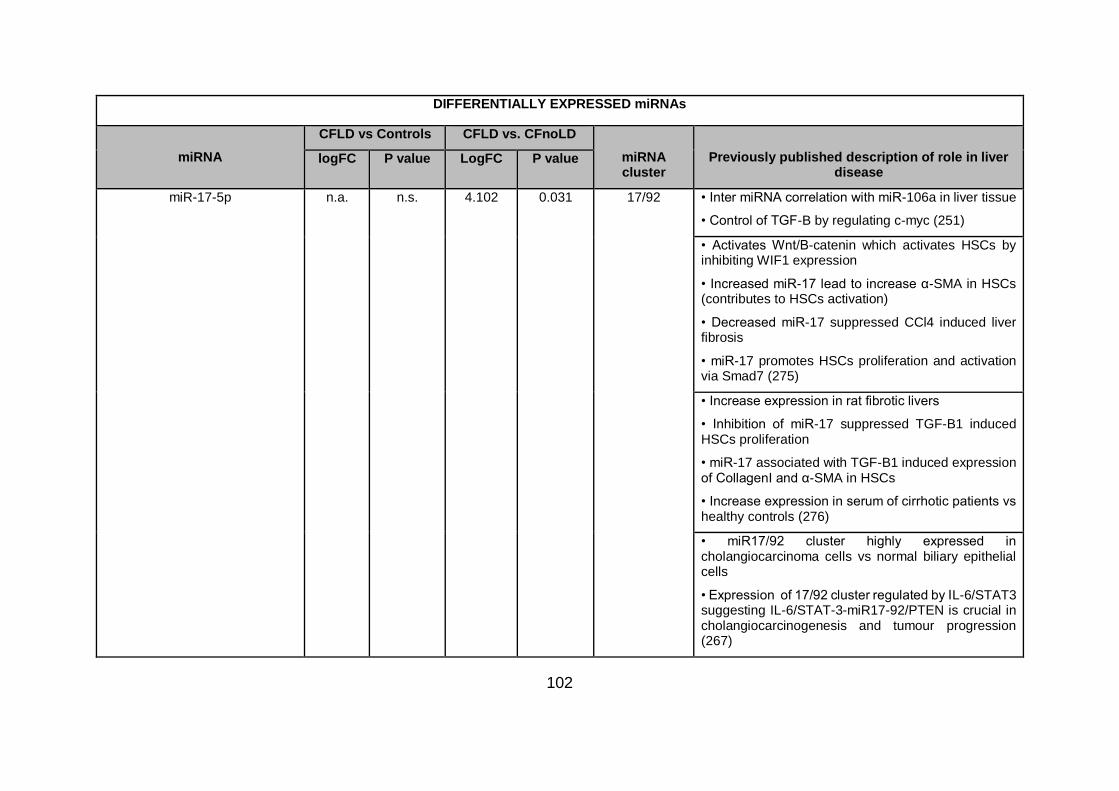
102
DIFFERENTIALLY EXPRESSED miRNAs
miRNA
CFLD vs Controls CFLD vs. CFnoLD
miRNA cluster
Previously published description of role in liver disease
logFC P value LogFC P value
miR-17-5p n.a. n.s. 4.102 0.031 17/92 • Inter miRNA correlation with miR-106a in liver tissue
• Control of TGF-B by regulating c-myc (251)
• Activates Wnt/B-catenin which activates HSCs by inhibiting WIF1 expression
• Increased miR-17 lead to increase α-SMA in HSCs (contributes to HSCs activation)
• Decreased miR-17 suppressed CCl4 induced liver fibrosis
• miR-17 promotes HSCs proliferation and activation via Smad7 (275)
• Increase expression in rat fibrotic livers
• Inhibition of miR-17 suppressed TGF-B1 induced HSCs proliferation
• miR-17 associated with TGF-B1 induced expression of CollagenI and α-SMA in HSCs
• Increase expression in serum of cirrhotic patients vs healthy controls (276)
• miR17/92 cluster highly expressed in cholangiocarcinoma cells vs normal biliary epithelial cells
• Expression of 17/92 cluster regulated by IL-6/STAT3 suggesting IL-6/STAT-3-miR17-92/PTEN is crucial in cholangiocarcinogenesis and tumour progression (267)
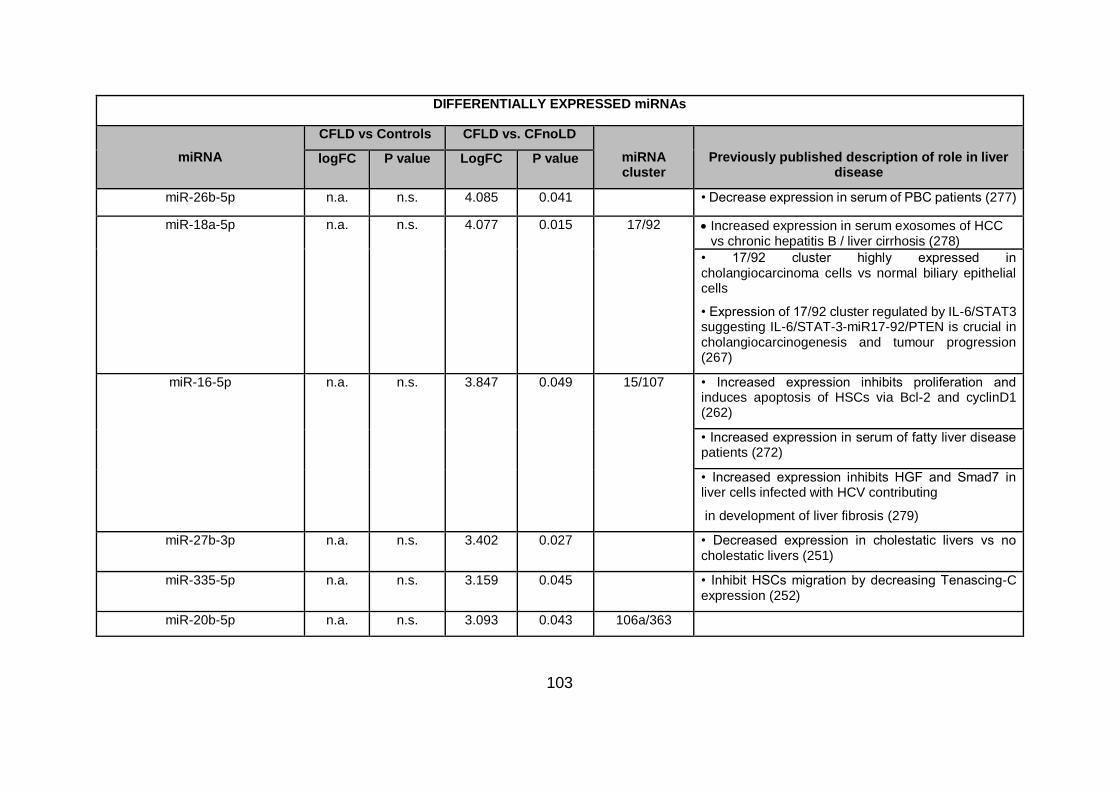
103
DIFFERENTIALLY EXPRESSED miRNAs
miRNA
CFLD vs Controls CFLD vs. CFnoLD
miRNA cluster
Previously published description of role in liver disease
logFC P value LogFC P value
miR-26b-5p n.a. n.s. 4.085 0.041 • Decrease expression in serum of PBC patients (277)
miR-18a-5p n.a. n.s. 4.077 0.015 17/92 Increased expression in serum exosomes of HCC vs chronic hepatitis B / liver cirrhosis (278)
• 17/92 cluster highly expressed in cholangiocarcinoma cells vs normal biliary epithelial cells
• Expression of 17/92 cluster regulated by IL-6/STAT3 suggesting IL-6/STAT-3-miR17-92/PTEN is crucial in cholangiocarcinogenesis and tumour progression (267)
miR-16-5p n.a. n.s. 3.847 0.049 15/107 • Increased expression inhibits proliferation and induces apoptosis of HSCs via Bcl-2 and cyclinD1 (262)
• Increased expression in serum of fatty liver disease patients (272)
• Increased expression inhibits HGF and Smad7 in liver cells infected with HCV contributing
in development of liver fibrosis (279)
miR-27b-3p n.a. n.s. 3.402 0.027 • Decreased expression in cholestatic livers vs no cholestatic livers (251)
miR-335-5p n.a. n.s. 3.159 0.045 • Inhibit HSCs migration by decreasing Tenascing-C expression (252)
miR-20b-5p n.a. n.s. 3.093 0.043 106a/363

104
DIFFERENTIALLY EXPRESSED miRNAs
miRNA
CFLD vs Controls CFLD vs. CFnoLD
miRNA cluster
Previously published description of role in liver disease
logFC P value LogFC P value
miR-30b-5p n.a. n.s. 2.826 0.046 30b/30d
miR-130a-3p n.a. n.s. 2.610 0.020 • Increased expression in rat fibrotic liver. Targets PPAR-γ and enhance activation of HSCs (280)
miR-18b-5p n.a. n.s. 2.453 0.001 106a/363
miR-143-3p n.a. n.s. 2.318 0.044 • 1.5x FC tissue expression associated with increased GGT (251)
miR-25-3p n.a. n.s. -2.007 0.043
miR-146b-5p n.a. n.s. -2.169 0.058 • Decreased expression in serum of biopsy proven NAFLD vs healthy controls (281)

105
DIFFERENTIALLY EXPRESSED miRNAs
miRNA
CFLD vs Controls CFLD vs. CFnoLD
miRNA cluster
Previously published description of role in liver disease
logFC P value LogFC P value
miR-155-5p n.a. n.s. -2.821 0.052 • Increased expression in cirrhotic liver. Negative correlation with CYP3A activity (253)
• Increased expression promotes liver fibrosis and inflammation from alcohol induced steatosis
• miR-155 targets PPRE and PPAR-α which decreased MCP1 production (282)
• Decreased expression attenuates steatosis and fibrosis but not liver injury in MCD mouse model (regulation depends on model and genes involved)
• Fibrotic mechanism by miR-155 targeting caspase3, Smad3, PDGF and C/EBPB
• miR-155 has negative regulatory role of inflammatory pathways in NASH (283)
• Decreased expression in activated HSCs, sera and liver of cirrhotic patients
• Targets simultaneously TCF4 and AGTR1 which regulate EMT and ERK1pathway (284)
miR-5100 n.a. n.s. -2.869 0.033
miR-489-3p n.a. n.s. -3.332 0.029
miR-302d-3p n.a. n.s. -3.675 0.032

106
DIFFERENTIALLY EXPRESSED miRNAs
miRNA
CFLD vs Controls CFLD vs. CFnoLD
miRNA cluster
Previously published description of role in liver disease
logFC P value LogFC P value
miR-27a-3p n.a. n.s. 4.040 0.054 • Increase expression in tissue, plasma and adipose tissue of obese-related cancer patients
• miR-27a promoted HCC proliferation by targeting FOXO1 promoting G1/S cell cycle
transition by decreasing p21 and p27 and increasing cyclin D1 (285)
miR-30d-5p n.a. n.s. 3.883 0.074 30b/30d
miR-30e-5p n.a. n.s. 3.814 0.063 miR-39 • Decreased expression in sera HCC patients vs chronic liver disease patients (286)
miR-148a-3p n.a. n.s 3.324 0.061 148/152 • Inter miRNA correlation with miR-101 (tissue)
• Decreased expression in cholestatic livers vs no cholestatic livers (251)
• Potent inducer of hepatocytic differentiation
• Decreased expression in HCC. Correlated with phenotypic differentiation of tumours measured by expression levels of hepatocytic markers
• Targets IKK-α which inhibits NUMB/NOTCH signalling (287)
Increased expression in bile of patients who develop acute cellular rejection after liver transplantation showing liver damage(264)

107
DIFFERENTIALLY EXPRESSED miRNAs
miRNA
CFLD vs Controls CFLD vs. CFnoLD
miRNA cluster
Previously published description of role in liver disease
logFC P value LogFC P value
miR-19a-3p n.a. n.s. 3.004 0.061 17/92 • Control of TGF-B by regulating c-myc (tissue) (251)
• Increased expression in HCC cells promotes tumour growth by targeting MMP2 (PI3/AKT)
• ANT2 impair HCC progression by decreasing expression of miR-19a (260)
• 17/92 cluster highly expressed in cholangiocarcinoma cells vs normal biliary epithelial cells
• Expression of 17/92 cluster regulated by IL-6/STAT3 suggesting IL-6/STAT-3-miR17-92/PTEN is crucial in cholangiocarcinogenesis and tumour progression
• Increased expression of miR-19a enhances tumour cell proliferation, colony formation and invasiveness in cholangiocarcinoma cells
• miR-19a targets PTEN (267)
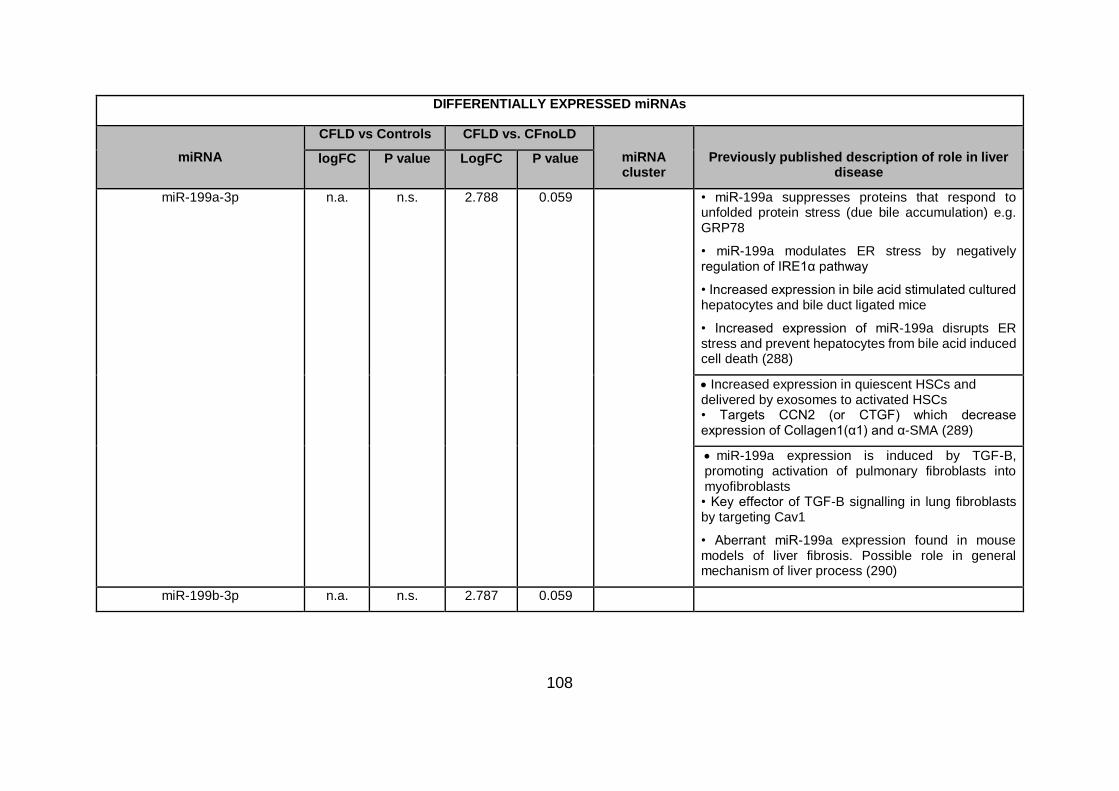
108
DIFFERENTIALLY EXPRESSED miRNAs
miRNA
CFLD vs Controls CFLD vs. CFnoLD
miRNA cluster
Previously published description of role in liver disease
logFC P value LogFC P value
miR-199a-3p n.a. n.s. 2.788 0.059 • miR-199a suppresses proteins that respond to unfolded protein stress (due bile accumulation) e.g. GRP78
• miR-199a modulates ER stress by negatively regulation of IRE1α pathway
• Increased expression in bile acid stimulated cultured hepatocytes and bile duct ligated mice
• Increased expression of miR-199a disrupts ER stress and prevent hepatocytes from bile acid induced cell death (288)
Increased expression in quiescent HSCs and delivered by exosomes to activated HSCs • Targets CCN2 (or CTGF) which decrease expression of Collagen1(α1) and α-SMA (289)
miR-199a expression is induced by TGF-B, promoting activation of pulmonary fibroblasts into myofibroblasts • Key effector of TGF-B signalling in lung fibroblasts by targeting Cav1
• Aberrant miR-199a expression found in mouse models of liver fibrosis. Possible role in general mechanism of liver process (290)
miR-199b-3p n.a. n.s. 2.787 0.059

109
DIFFERENTIALLY EXPRESSED miRNAs
miRNA
CFLD vs Controls CFLD vs. CFnoLD
miRNA cluster
Previously published description of role in liver disease
logFC P value LogFC P value
miR-101-3p n.a. n.s. 2.718 0.055 • Inter miRNA correlation with miR-148a (tissue) (251)
• Increased expression in serum supress liver fibrosis by targeting TGF-B pathway (261)
• Decreased expression of miR-101 associated with increased expression of ZEB1 and decreased expression of E-cadherin. Loss of miR-101 promotes hepatocyte EMT
• Exogenous expression of miR-101 supressed mesenchymal phenotype and metastasis of HCC by increasing regulation of epithelial genes and repression of mesenchymal ones (291)
• Decreased expression of miR-101 in fibrotic liver, activated HSCs and injured hepatocytes
• Targets TBRI (TGF-B receptor) and KLF6 suppressing TGF-B pathway in hepatocytes and HSCs
• miR-101 promotes transformation from activated to quiescent HSCs by suppressing proliferation, migration, loss of activation markers and gain of specific quiescent markers (292)
miR-99a-5p n.a. n.s. 2.702 0.069

110
DIFFERENTIALLY EXPRESSED miRNAs
miRNA
CFLD vs Controls CFLD vs. CFnoLD
miRNA cluster
Previously published description of role in liver disease
logFC P value LogFC P value
miR-139-5p n.a. n.s. 2.622 0.067 • Decreased expression in livers of advanced PBC
• Increased expression in lymphocyte-derived hepatocytes (293)
• Decreased expression in HCC tissues and cell lines
• Inhibits EMT, migration and invasion in HCC cell lines by targeting ZEB1/2 (294)
miR-376c-3p n.a. n.s. 2.535 0.074
miR-106a-5p n.a. n.s. 2.174 0.051 106a/363 • Inter miRNA correlation with miR-148a (tissue) (251)
miR-4508 n.a. n.s. -1.747 0.081

111
DIFFERENTIALLY EXPRESSED miRNAs
miRNA
CFLD vs Controls CFLD vs. CFnoLD
miRNA cluster
Previously published description of role in liver disease
logFC P value LogFC P value
miR-92a-1-5p n.a. n.s. -1.820 0.059 17/92 • Cluster 17/92 involved in regulation of fibrosis in rodent and human livers.
• Increased expression in plasma associated to HCV infection and fibrosis.
• miR-92a may serve as biomarker for early detection for benign lesions before neoplastic lesions
• Expression of miR-92a inversely correlated with fibrotic stage (178)
• 17/92 cluster highly expressed in cholangiocarcinoma cells vs normal biliary epithelial cells
• Expression of 17/92 cluster is regulated by IL-6/STAT3 suggesting IL-6/STAT-3-miR17-92/PTEN is crucial in cholangiocarcinogenesis and tumour progression
• Increased expression of miR-92a enhances tumour cell proliferation, colony formation and invasiveness in cholangiocarcinoma cells
• miR-92a targets PTEN (267)
miR-3667-5p n.a. n.s. -1.886 0.059
miR-30c-5p n.a. n.s. -2.462 0.074 miR-39

112
DIFFERENTIALLY EXPRESSED miRNAs
miRNA
CFLD vs Controls CFLD vs. CFnoLD
miRNA cluster
Previously published description of role in liver disease
logFC P value LogFC P value
miR-34a-5p n.a. n.s. -2.702 0.079 • 1.5x FC tissue expression associated with increased GGT
• 2xFC expression in cholestatic livers vs no cholestasis (251)
• Increased expression in serum of NAFLD patients (272)
miR-7-5p n.a. n.s. -2.796 0.055 • miR-7 targets PDX-1 which activates Ngn-3 (expressed in proliferating cholangiocytes)
• Targets Ngn-3 which decreased cholangiocyte proliferation and collagen deposition (295)

113
DIFFERENTIALLY EXPRESSED miRNAs
miRNA
CFLD vs Controls CFLD vs. CFnoLD
miRNA cluster
Previously published description of role in liver disease
logFC P value LogFC P value
miR-183-5p n.a. n.s. -2.826 0.064 183/96/182 • Increased expression confers oncogenic function in HCC cell dissemination
• FOXO1 is the only target of the 183/96/182 cluster (3 members). It is correlated with poor
prognosis
• Increased regulation of the cluster members are correlated with metastatic features. Cluster is downstream effector of Wnt pathway through CTNNB1. CTNNB1-TCF produce translation of cluster that targets FOXO1 and enhance metastasis (296)
• Inhibits TGF-B1 induced apoptosis in HCC cells by targeting PDCD4 (297)
miR-21-5p 2.020 0.139 n.a. n.s. • 2xFC expression in cholestatic livers vs no cholestasis (251)
Differentially expressed miRNAs between controls, CFnoLD and CFLD. logFC: logarithmic fold change; FC: fold change, miR: microRNA; n.s.: not significant; n.a.: not available; GGT: gamma-glutamyl transferase; α-SMA: α-smooth muscle actin; TGFB1: transforming growth factor β-1; HSCs: hepatic stellate cells; Smad4: mother against decapentaplegic homolog 4; CYP3A: cytochrome P450 family 3 subfamily A; HCC: hepatocellular carcinoma; MAT1A: methionine adenosyltransferase 1A; p27: cyclin dependent kinase inhibitor 1B; TIMP3: metallopeptidase inhibitor 3; MMP2: matrix metallopeptidase 2; ANT2: solute carrier family 25 member 5; CPK: phosphatidylinositol-4-phosphate 3-kinase catalytic subunit type 2 α; NFKβ: nuclear factor kappa β; VCAM-1: vascular cell adhesion molecule 1; EMT: epithelial-mesenchymal transition: ZEB1/2: zinc finger E-box binding homeobox1/2; FOG2: zinc finger protein, fork family member 2; c-Myb: MYB proto-oncogene transcription factor: Rac1: Rac family small GTPase 1; ECM: extracellular matrix; TRIM23: tripartite motif containing 23; HNF1α: hepatocyte nuclear factor 1 α; HCV: hepatitis C virus; Smad7: mother against decapentaplegic homolog 7; K-Ras: KRAS proto-oncogene GTPase; HMGA2A: high mobility group AT-Hook 2; Bcl-xl: protein phosphatase 1 regulatory subunit 52; Col1A2: collagen type 1 α 2; Akt3: AKT serine/threonine kinase 3; E2F3: E2F transcription factor 3; Bcl2: protein phosphatase 1 regulatory subunit 50; IKKB: inhibitor of nuclear factor kappa B kinase subunit β; TNFα: tumor necrosis factor; c-myc: myc proto-oncogene BHLH transcription factor; CCl4: C-C motif chemokine ligand 4; PBC: primary biliary cirrhosis; HGF:

114
hepatocyte growth factor; PPAR-γ: peroxisome proliferator activated receptor γ; NAFLD: non-alcoholic fatty liver disease; MCP1: C-C motif chemokine ligand 2; MCD: methionine-choline deficient; PDGF: platelet derived growth factor B; CEBPB: Inteleukin 6- dependent DNA-binding protein; NASH: non-alcoholic steatohepatitis; TCF4: transcription factor 4; AGTR1: angiotensin II receptor type 1; ERK1: mitogen-activated protein kinase 3; p21: cyclin dependent kinase inhibitor 1A; PTEN: phosphatase and tensin homolog; GRP78: heat shock protein family A (HSP70) member 5; ER: endoplasmic reticulum; IRE1α: endoplasmic reticulum 2 nucleus signalling 1; CCN2: cellular communication network factor 2; Cav-1: caveolin 1; KLF6: Kruppel like factor 6; PDX-1: pancreatic and duodenal homeo-box 1; Ngn-3: neurogenin 3; FOXO1: forkhead-box O1; CTNNB1: catenin β1; PDCD4: program cell death 4.

115
Based on miRNA-seq and differential expression analysis miR-122-5p; miR-25-3p;
miR-199a-3p; miR-365a-3p; miR-18a-5p; miR-126-5p; miR-142-3p; let-7g-5p; miR-
103a-3p; miR-34a-5p and miR-484 were selected as potential biomarkers of CFLD,
while, miR-19b-3p; miR-93-5p; miR-20a-5p; let-7i-5p; let-7b-5p; let-7d-5p; miR-27a-
3p and miR-146a-5p were selected as potential endogenous reference miRNAs.
An independent subset of 30 samples (n=10/patient cohort) were used to measure the
expression of potential endogenous reference miRNAs. geNorm and NormFinder
algorithms determined an optimal panel of miR-93-5p; miR-20a-5p and let-7i-5p to be
used as endogenous reference miRNA for data normalization.
4.3.3 Circulatory miRNA signature confirmation by qRT-PCR
The expression of differentially expressed miRNA candidates was then confirmed in
the entire cohort of 124 patients (Table 4.4).

116
Table 4.4.Differentially expressed miRNAs in CFLD vs CFnoLD children.
CFnoLD (n=40)
CFLD (n=44) P-value AUC
miR-19b-3p 1.65 (0.79) 1.83 (0.75) 0.652 0.58
let-7g-5p -0.12 (1.07) -0.98 (1.41) 0.003 0.71
miR-103a-3p -0.59 (1.05) -0.82 (1.11) 0.513 0.57
miR-34a-5p -6.62 (2.33) -5.25 (1.60) 0.004 0.71
miR-484 -1.16 (0.90) -1.08 (1.03) 0.904 0.51
miR-122-5p -0.50 (1.97) 1.14 (2.12) 0.002 0.70
miR-365a-3p -5.02 (1.25) -3.91 (1.24) <0.001 0.74
miR-18a-5p -2.27 (0.59) -2.24 (0.68) 0.974 0.55
miR-199a-3p -1.75 (1.20) -1.58 (1.16) 0.786 0.53
miR-126-5p -2.36 (1.25) -1.61 (1.36) 0.055 0.65
miR-142-3p -3.09 (1.18) -3.74 (1.44) 0.005 0.62
miR-25-3p 1.03 (0.58) 1.19 (0.97) 0.674 0.55
Data correspond to qRT-PCR derived log 2 base scale relative expression of miRNAs. Data are represented as mean (standard deviation). CFnoLD= cystic fibrosis no liver disease; CFLD= cystic fibrosis-associated liver disease; AUC= area under the curve.
Serum levels of miR-122-5p were significantly elevated in CFLD compared to both
CFnoLD (fold change [FC] =3.1, P=0.0015) and Controls (FC=7.5, P<0.0001), and
also in CFnoLD compared to Controls (FC=2.4, P=0.022) (Figure 4.2.A). Expression
levels of serum miR-34a-5p were also elevated in CFLD compared to both CFnoLD
and Controls (FC=2.6, P=0.0042 and FC=2.9, P=0.0011, respectively) (Figure 4.2.B).
Similarly, circulatory miR-365a-3p was overexpressed in CFLD when compared to
both CFnoLD and Controls (FC=2.2, P=0.0002 and FC=2.2, P=0.0001, respectively)
(Figure 4.2.C). In contrast, expression levels of let-7g-5p were downregulated in
CFLD compared to both CFnoLD and Controls (FC=-1.8, P=0.0034 and FC=-2.1,
P=0.0003, respectively) (Figure 4.2.D), while expression levels of miR-142-3p were
elevated in CFnoLD compared to CFLD (FC=1.6, P=0.0047) (Figure 4.2.E). miR-126-
5p was significantly downregulated in CFnoLD compared to Controls (FC=-1.7,
P=0.042) and increased in CFLD compared to CFnoLD however this did not reach
statistical significance (FC=1.7, P=0.0549).

117
Serum miR-18a-5p levels were upregulated in both CFnoLD and CFLD compared to
controls (FC=1.7, P<0.0001 and FC=1.7, P<0.0001, respectively) (Figure 4.2.F).
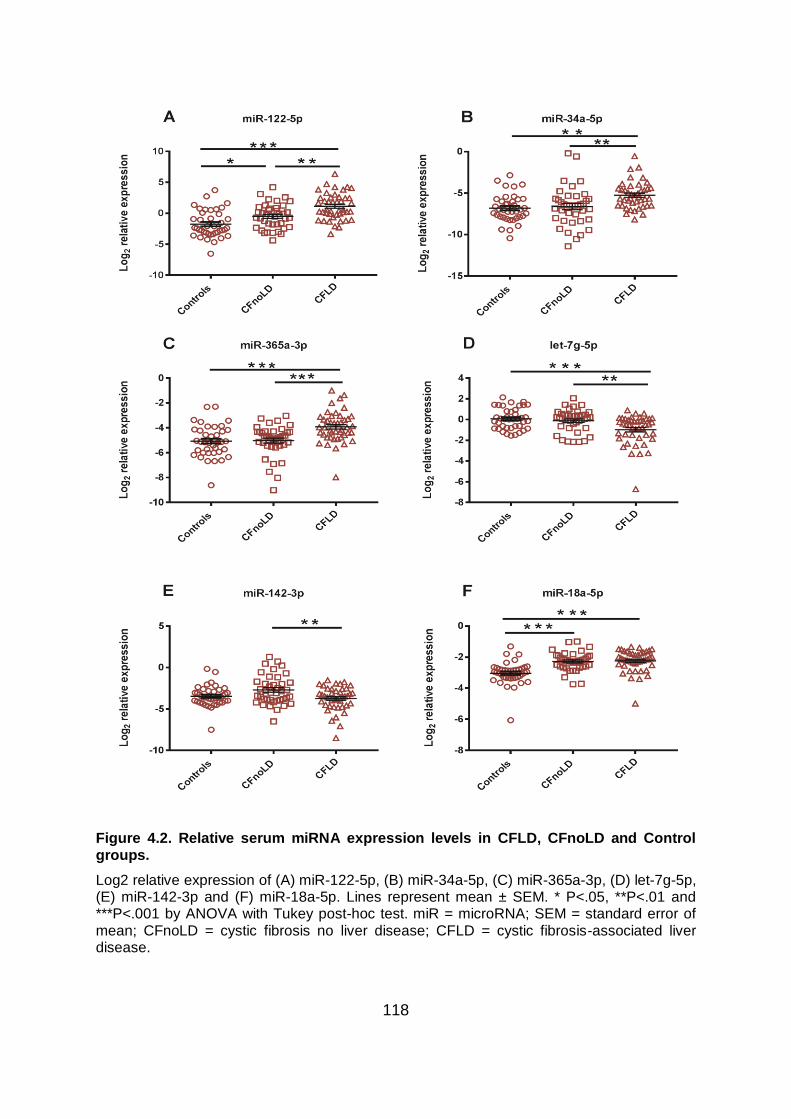
118
Figure 4.2. Relative serum miRNA expression levels in CFLD, CFnoLD and Control groups.
Log2 relative expression of (A) miR-122-5p, (B) miR-34a-5p, (C) miR-365a-3p, (D) let-7g-5p, (E) miR-142-3p and (F) miR-18a-5p. Lines represent mean ± SEM. * P<.05, **P<.01 and ***P<.001 by ANOVA with Tukey post-hoc test. miR = microRNA; SEM = standard error of mean; CFnoLD = cystic fibrosis no liver disease; CFLD = cystic fibrosis-associated liver disease.

119
4.3.4 Circulatory miRNA expression in CFLD F0 fibrosis staging
Fourteen children within the CFLD cohort had F0 fibrosis on dual-pass liver biopsy.
Despite the absence of overt histological collagen deposition these patients were
classified as having liver disease based on clinical assessment (as defined in Chapter
2, section 2.2.1). A sub-analysis was performed on these patients with F0 fibrosis to
determine whether they were distinct from children classified as CFnoLD. CFLD
subjects with F0 fibrosis showed significant higher serum levels of miR-122-5p
(FC=4.9, P=0.001), miR-365a-3p (FC=2.2, P=0.009) and APRI (FC=2.0, P<0.0003)
compared to CFnoLD children (Figure 4.3.A-C), while miR-142-3p (FC=-2.95,
P0.0006) showed significant decreased expression in F0 compared to CFnoLD
(Figure 4.3.D). Moreover, ROC curve analysis revealed the ability of miR-122-5p
(area under the curve [AUC] =0.76, P=0.004), miR-142-3p (AUC=0.75, P=0.006) and
APRI (AUC=0.86, P=0.0006) to discriminate F0 from CFnoLD children (Figure 4.3.E).

120
Figure 4.3.Relative serum miRNA expression and APRI levels in CFLD F0 fibrosis vs. CFnoLD.
Relative expression of (A) log2 miR-122-5p, (B) log2 miR-365a-3p, (C) APRI, (D) log2 miR-142-3p and (E) ROC curves of miR-122-5p (AUC=0.76), miR-142-3p (AUC=0.75) and APRI (AUC=0.86) . Lines represent mean ± SEM for miRNAs, or geometric mean and geometric standard deviation for APRI. * P<.05, **P<.01 and ***P<.001 by two-tailed T test for miRNAs and Mann-Whitney test for APRI. miR = microRNA; SEM = standard error of mean; CFnoLD = cystic fibrosis no liver disease; F0= no fibrosis based on METAVIR score.

121
4.3.5 Validated miRNA candidates can discriminate liver disease in children
with CF
miR-365a-3p demonstrated the best diagnostic accuracy for liver disease (AUC=0.74;
sensitivity=70%; specificity=67%; P=0.0001), while miR-122-5p (AUC=0.70;
sensitivity=70%; specificity=63%; P=0.0001), miR-34a-5p (AUC=0.71;
sensitivity=71%; specificity=64.%; P=0.0014) and let-7g-5p (AUC=0.71;
sensitivity=70%; specificity=65%; P=0.0010) showed similar differential diagnostic
performance (Figure 4.4.A).
Next, to derive a panel of miRNAs that could diagnose liver disease in CF children,
stepwise logistic regression analysis was performed using subsets of up to four
miRNAs (794 models in total). Model selection, based on Bayesian information
criterion, resulted in a model including miR-365a-3p, miR-142-3p and let-7g-5p
yielding an AUC=0.87 (P<0.0001) (Figure 4.4.B). In order to assess the performance
of this selected miRNA panel to diagnose liver disease in CF children, the statistical
model evaluation method 5-fold internal cross validation was performed within the
same cohort of CFLD and CFnoLD children. The result of the cross-validation showed
AUC=0.79 with a sensitivity of 63% and specificity of 77% across the different
validation sets.

122
Figure 4.4. ROC curves for the discrimination of CFLD vs CFnoLD.
A) ROC curves of APRI (AUC = 0.80, n=75), miR-122-5p (AUC = 0.70, n=84), let-7g-5p (AUC = 0.71, n=84), miR-34a-5p (AUC = 0.71, n=84) and miR-365-3p (AUC = 0.74, n=84). (B) Logistic regression model based on the combination of miR-365a-3p, miR-142-3p and let-7g-5p with the addition of log(APRI) (AUC = 0.91, n=75) and without the addition of log(APRI) (AUC = 0.87, n=84) to detect liver disease in CF. (C) miRNA panel cut point of 1.41*miR-365a-3p-0.86*miR-142-3p-0.79*let-7g-5p+5.21*log10(APRI) = -5.81 based on Liu’s method discriminates CFLD from CFnoLD.
4.3.6 Addition of APRI to miRNA panel for differential diagnosis of CFLD
The utility of APRI to detect liver disease in children with CF has been previously
shown (124) , thus APRI was calculated on CF children with available biochemistries
and platelet counts (CFLD, n=36 and CFnoLD, n=36). In this cohort of CFLD vs.
CFnoLD children, APRI demonstrated an AUC=0.80 (P<0.0001) with a sensitivity of
79% and specificity of 80%, recapitulating the results obtained in previous reports
(Figure 4.4.A) (124). Logistic regression analysis combining APRI with the three

123
miRNA panel demonstrated a markedly improved diagnostic accuracy with an
AUC=0.91. A cut-point of -5.81 was optimal for liver disease discrimination
demonstrating a sensitivity of 83% and specificity of 92% (see logistic regression
equation in Table 4.5) (Figure 4.4.C). Performance evaluation of the new proposed
CFLD panel using 5-fold cross validation resulted in an AUC=0.86 with a sensitivity of
73% and specificity of 76%. Using this three miRNA + APRI panel with a cut-point of
-5.81 predicted a 21 times greater odds of children with CF having CFLD, compared
to the ~6 times greater odds when APRI is used alone, as previously described (124).
Table 4.5. Logistic regression model for discriminating liver disease in CF.
Risk factor Coefficient 95% CI P-value
let-7g-5p -0.792 -1.429 to -0.154 0.015
miR-365a-3p 1.411 0.534 to 2.289 0.002
miR-142-3p -0.861 -1.584 to -0.138 0.020
log10APRI 5.209 1.502 to 8.915 0.006
(Intercept) 5.821
Logistic regression model for discriminating liver disease in CF. CI= confidence interval.
4.3.7 Serum miRNAs reflect hepatic fibrosis severity in CFLD
The expression of serum miRNA candidates was analysed to assess the potential
association with hepatic fibrosis severity in CFLD. Expression levels of miR-19b-3p
(FC=1.6, P=0.0465), miR-18a-5p (FC=1.8, P=0.0011) and miR-142-3p (FC=2.6,
P=0.0244) were all increased in serum from CFLD patients with severe
fibrosis/cirrhosis (F3/F4) compared to CFLD children with no fibrosis (F0). Expression
of miR-142-3p was increased in CFLD with mild/moderate fibrosis (F1/F2) compared
to F0 fibrosis (FC=2.5, P=0.026), whereas expression of miR25-3p was significantly
lower (FC=-1.9, P=0.023) in F1/F2 vs. F0 fibrosis. A significant positive correlation
between both miR-19b-3p (rs=0.35, P=0.021) and miR-18a-5p (rs=0.56, P<0.0001)
and increasing fibrosis severity was observed. miRNA expression levels and
correlations with hepatic fibrosis stage are depicted in Figure 4.5.

124
Figure 4.5. Association between relative serum miRNA expression and hepatic fibrosis staging in CFLD.
Scatter plots show log2 relative expression of (A) miR-19b-3p, (B) miR-18a-5p, (C) miR-142-3p, (D) miR-25-3p vs. hepatic fibrosis severity. Correlation between log2 miRNA expression levels and hepatic fibrosis stage for (E) miR-19b-3p and (F) miR-18a-5p. Lines represent mean ± SEM. * P<.05, **P<.01 and ***P<.001 by ANOVA with Tukey post-hoc test. miR = microRNA; SEM = standard error of mean; rs = Spearman's correlation coefficient; CFnoLD = cystic fibrosis no liver disease; CFLD = cystic fibrosis-associated liver disease; F0 = no fibrosis; F1-2 = mild/moderate fibrosis; F3-4 = severe fibrosis/cirrhosis (fibrosis staging based on METAVIR score).

125
4.3.8 Association between serum miR-18a-5p levels and hepatic fibrosis stage
in CFLD
From the validated differentially expressed miRNAs only miR-18a-5p demonstrated
potential for discriminating the severity of liver disease in CF children (Table 4.6). ROC
curve analysis to determine the ability of miR-18a-5p to distinguish liver disease
severity within CFLD yielded the following: F0 vs. any fibrosis/cirrhosis (F1-4) exhibited
an AUC=0.78 (P=0.003; sensitivity=76%; specificity=64%), while F0-F1 vs. F2-F4
showed an AUC=0.76 (P=0.003; sensitivity=86%; specificity=59%) and F0-F2 vs. F3-
4 demonstrated an AUC=0.82 (P=0.004; sensitivity=92%; specificity=73%) (Figure
4.6).

126
Table 4.6. Differentially expressed miRNAs between fibrotic stages in CFLD children.
F0-2 (n=30) F3-4 (n=14) P-value AUC C-statistic Obuchowski (Lambert et al.)
Obuchowski
miR-19b-3p 1.68 (0.85) 2.15 (0.33) 0.054 0.67 0.64 0.68 0.63
let-7g-5p -0.96 (1.56) -1.01 (1.07) 0.92 0.57 0.60 0.63 0.61
miR-103a-3p -0.80 (1.22) -0.86 (0.86) 0.88 0.54 0.53 0.54 0.51
miR-34a-5p -5.40 (1.72) -4.94 (1.34) 0.39 0.60 0.55 0.56 0.53
miR-484 -0.92 (1.04) -1.41 (0.94) 0.14 0.65 0.57 0.60 0.55
miR-122-5p 1.17 (2.33) 1.07 (1.66) 0.89 0.51 0.55 0.55 0.56
miR-365a-3p -3.93 (1.41) -3.86 (0.83) 0.87 0.51 0.52 0.53 0.53
miR-18a-5p -2.44 (0.73) -1.82 (0.26) 0.004 0.82 0.74 0.79 0.74
miR-199a-3p -1.60 (1.26) -1.53 (0.94) 0.86 0.52 0.51 0.51 0.53
miR-126-5p -1.72 (1.55) -1.37 (0.81) 0.43 0.64 0.57 0.59 0.54
miR-142-3p -3.95 (1.62) -3.28 (0.85) 0.15 0.62 0.60 0.63 0.63
miR-25-3p 1.21 (1.16) 1.13 (0.30) 0.80 0.53 0.51 0.50 0.55
APRI 0.31 (1.70) 0.65 (2.20) 0.002 0.77 0.64 0.68 0.59
FIB-4 0.17 (1.80) 0.35 (2.61) 0.007 0.70 0.66 0.69 0.63
Data correspond to log 2 base scale relative expression. Data are represented as mean (standard deviation) for miRNAs and geometric mean (geometric standard deviation) for APRI and FIB-4. F0-2= not severe fibrosis; F3-4= severe fibrosis/cirrhosis; AUC= area under the curve; C-statistic= concordance statistic; Obuchowski (Lambert et al.)= Obuchowski measure using penalties proportional to the difference in stages apart; Obuchowski= Obuchowski measure with the penalties used in this study prioritizing the differences between contiguous fibrotic stages.

127
Figure 4.6. ROC curves for assessment of CFLD severity.
(A) ROC curves of miR-18a-5p (n=44) to distinguish between F0 vs. F1-4 (AUC = 0.78); F0-1 vs. F2-4 (AUC = 0.76); F0-2 vs. F3-4 (AUC = 0.82). (B) ROC curves of APRI (n=36) to distinguish between F0 vs. F1-4 (AUC = 0.53); F0-1 vs. F2-4 (AUC = 0.69); F0-2 vs. F3-4 (AUC = 0.77).
Concordance statistic (c-statistic) (222) and the Obuchowski method (223) were used
to assess the discriminative potential of miR-18a-5p to identify hepatic fibrosis staging
in CFLD. C-statistic shows the proportion of all pairs of subjects in which predictions
and outcomes are concordant and expresses the probability of correctly ranking two
random patients from different stages. The Obuchowski method was used as
multinomial version of AUROC based on the fibrosis stages categorised by the
METAVIR scoring system using a weighting scheme based on fibrosis stage
distribution and a penalty proportional to the difference of the fibrosis stages. Pairwise
comparison of the Obuchowski measure was weighted based on fibrosis stage
distribution of the study cohort including the following penalties between METAVIR
categories: 0 between no fibrosis (F0) and cirrhosis (F4); 0.5 between mild fibrosis
(F1) and severe fibrosis (F3) and moderate fibrosis (F2) and cirrhosis (F4); and 1 for
all other combinations. This scheme prioritizes the differences between contiguous
fibrosis stages that are normally misclassified in comparison to distant fibrosis stages
(e.g. F0 to F4) that can be detected by other effective means such as imaging.
In this model, miR-18a-5p demonstrated a c-statistic = 0.74, while APRI had a c-
statistic = 0.64; in addition, miR-18a-5p had an Obuchowski measure = 0.74, whereas
APRI had an Obuchowski measure = 0.59 (Table 4.7).

128
Table 4.7. Diagnostic test accuracy to predict severity in CFLD.
Biomarkers performance to predict disease severity in CFLD
AUC (Pvalue)
miR-18a-5p
(n=44)
APRI (n=36)
F0 vs F1-4
0.78 (0.003)
0.53 (0.804)
F0-1 vs F2-4
0.76 (0.003)
0.69 (0.054)
F0-2 vs F3-4
0.82 (0.004)
0.77 (0.002)
Concordance statistic (c-statistic)
miR-18a-5p
(n=44)
APRI (n=36)
0.74
0.64
Obuchowski measure
miR-18a-5p
(n=44)
APRI (n=36)
0.74
0.59
AUC, c-statistic and Obuchowski measure for miR-18a-5p (n=44) and APRI (n=36) to assess their performance in discriminating fibrosis stages in CFLD. Fibrosis stages based on METAVIR scoring system. AUC=area under the curve; F0= no fibrosis; F1-4= any fibrosis/cirrhosis; F0-1= no fibrosis/mild fibrosis; F2-4= moderate fibrosis/cirrhosis; F0-2= not severe fibrosis; F3-4= severe fibrosis/cirrhosis.
Stepwise ordinal logistic regression analysis was performed to evaluate the
performance of selected miRNAs + APRI in predicting CFLD severity, however, only
miR-18a-5p demonstrated a statistically significant result (P=0.001). One unit of
increased log2 relative expression is associated with 7-fold increased odds of having
advanced fibrosis. When APRI was added to miR-18a-5p as a predictor of CFLD
severity in combined logistic regression, there was no improvement in its performance
with an Obuchowski measure of 0.71 for both miR-18a-5p alone and combined with
APRI.

129
4.3.9 Serum miRNA expression levels correlate with liver enzymes
In CFnoLD children, AST and GGT showed significant positive correlation with miR-
365a-3p and miR-34a-5p respectively, while significant negative correlations were
observed between GGT with miR-19b-3p, miR-103a-3p and miR-484; and ALP with
miR-34a-5p (Table 4.8). In CFLD children, significant positive correlations were
observed for AST with miR-34a-5p; ALT with miR-122-5p, miR-34a-5p and miR-19b-
3p; and ALP with miR-19b-3p (Table 4.8). Similar correlations were observed between
APRI and these miRNAs which is expected as APRI is based on AST and platelet
count. In fact, when compared to APRI as a biomarker for liver disease progression,
miR-365a-3p showed a positive correlation in CFnoLD children, whereas, miR-34a-5p
was positively correlated in CFLD patients (Table 4.8).

130
Table 4.8. Correlations of circulatory miRNA levels with liver related serum enzymes and APRI.
miR-122-5p miR-34a-5p miR-365a-3p miR-19b-3p miR-103a-3p miR-484
CFnoLD CFLD CFnoLD CFLD CFnoLD CFLD CFnoLD CFLD CFnoLD CFLD CFnoLD CFLD
AST
rs
95%CI
P
0.197
-0.130 - 0.487
0.221
0.312
-0.025-0.584
0.060
0.016
-0.308-0.339
0.918
0.398
0.065-0.651
0.017
0.362
0.047-0.611
0.021
0.164
-0.178-0.417
0.332
-0.147
-0.446-0.181
0.362
0.230
-0.114-0.552
0.171
-0.117
-0.425
0.478
0.243
-0.097-0.533
0.147
0.144
-0.189
0.382
0.186
-0.157-0.489
0.271
ALT
rs
95%CI
P
0.184
-0.144-0.476
0.255
0.508
0.224-0.712
<0.001
-0.089
-0.401-0.241
0.588
0.457
0.151-0.683
0.004
0.161
-0.167-0.457
0.321
0.272
-0.051-0.545
0.088
-.034
-0.351-0.288
0.831
0.163
-0.165-0.459
0.313
0.005
-0.320-0.328
0.978
0.263
-0.063-0.537
0.102
-0.119
-0.426-0.214
0.473
0.279
-0.044-0.550
0.080
GGT
rs
95%CI
P
0.134
-0.193-0.435
0.407
0.175
-0.167-0.479
0.300
0.372
0.054-0.621
0.019
0.121
-0.231-0.445
0.489
0.003
-0.316-0.323
0.980
0.060
-0.278-0.385
0.772
-0.316
-0.577-0.004
0.047
0.371
0.044-0.626
0.024
-0.338
-0.597--0.016
0.035
0.131
-0.212-0.444
0.442
-0.451
-0.676-0.148
0.004
0.055
-0.283-0.381
0.746
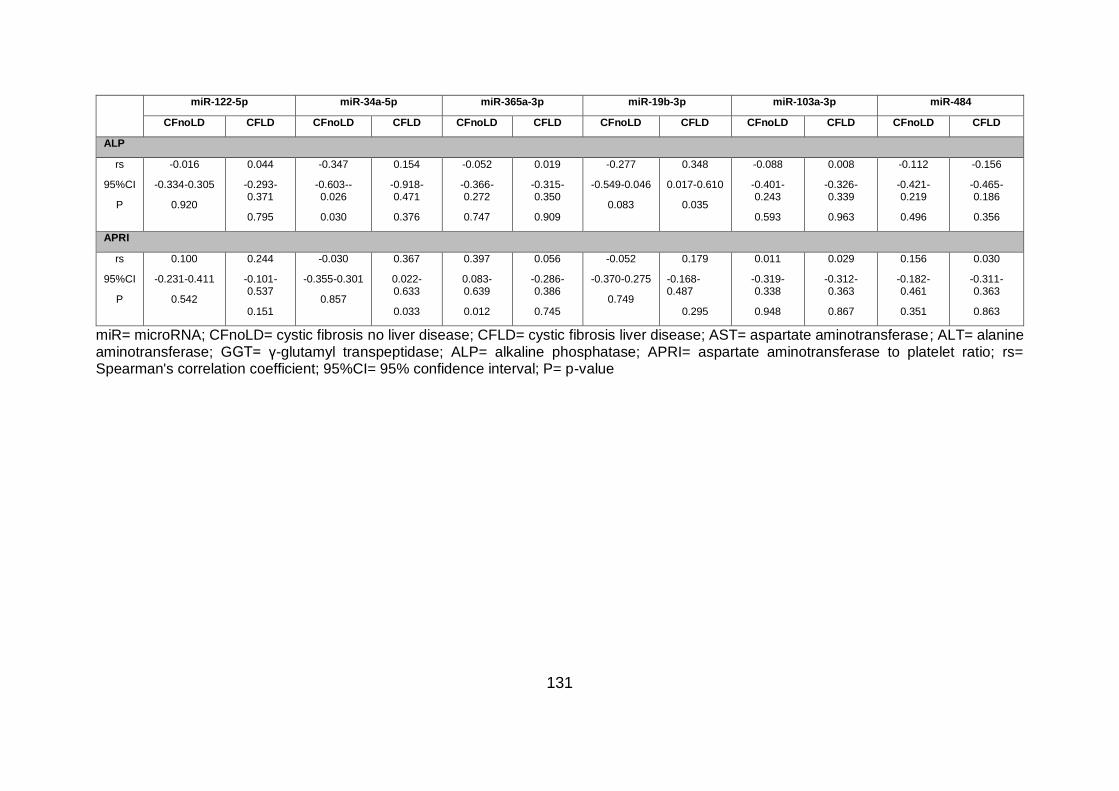
131
miR-122-5p miR-34a-5p miR-365a-3p miR-19b-3p miR-103a-3p miR-484
CFnoLD CFLD CFnoLD CFLD CFnoLD CFLD CFnoLD CFLD CFnoLD CFLD CFnoLD CFLD
ALP
rs
95%CI
P
-0.016
-0.334-0.305
0.920
0.044
-0.293-0.371
0.795
-0.347
-0.603--0.026
0.030
0.154
-0.918-0.471
0.376
-0.052
-0.366-0.272
0.747
0.019
-0.315-0.350
0.909
-0.277
-0.549-0.046
0.083
0.348
0.017-0.610
0.035
-0.088
-0.401-0.243
0.593
0.008
-0.326-0.339
0.963
-0.112
-0.421-0.219
0.496
-0.156
-0.465-0.186
0.356
APRI
rs
95%CI
P
0.100
-0.231-0.411
0.542
0.244
-0.101-0.537
0.151
-0.030
-0.355-0.301
0.857
0.367
0.022-0.633
0.033
0.397
0.083-0.639
0.012
0.056
-0.286-0.386
0.745
-0.052
-0.370-0.275
0.749
0.179
-0.168-0.487
0.295
0.011
-0.319-0.338
0.948
0.029
-0.312-0.363
0.867
0.156
-0.182-0.461
0.351
0.030
-0.311-0.363
0.863
miR= microRNA; CFnoLD= cystic fibrosis no liver disease; CFLD= cystic fibrosis liver disease; AST= aspartate aminotransferase; ALT= alanine aminotransferase; GGT= γ-glutamyl transpeptidase; ALP= alkaline phosphatase; APRI= aspartate aminotransferase to platelet ratio; rs= Spearman's correlation coefficient; 95%CI= 95% confidence interval; P= p-value

132
Next, the association between circulatory miRNAs and lung function, represented by
percent predicted forced expiratory volume in one second (%FEV1p) was analysed.
No correlations were found between miR-18a-5p and %FEV1p in either CFLD or
CFnoLD, suggesting that the altered serum levels of miR-18a-5p seen in CFLD may
be liver-specific, although this required further investigation which is beyond the scope
of the current study. CFnoLD children showed significant positive correlation with miR-
103a-3p (rs=0.401, P=0.017) (Figure 4.7.A), and significant negative correlation with
miR-34a-5p (rs=-0.442, P=0.008) (Figure 4.7.B). No correlations were found between
circulatory miRNAs and %FEV1p in CFLD children, however, a significant negative
correlation was found with let-7g-5p (rs=-0.280, P=0.023) in CF children with and
without liver disease (Figure 4.7.C).
Figure 4.7. Scatterplots of serum miRNAs versus lung function.
(A) Spearman rank correlation of log2 miR-103a-3p and %FEV1p in CFnoLD children (rs= 0.401) (B) Spearman rank correlation of log2 miR-34a-5p and %FEV1p in CFnoLD children (rs= -0.442) (C) Spearman rank correlation of log2 let-7g-5p and %FEV1p in CF children with and without liver disease (rs=-0.280). miR= microRNA; rs= Spearman's correlation coefficient; P= p-value; %FEV1p= percent predicted forced expiratory volume in one second.

133
4.4 DISCUSSION
The prevalence of liver disease in children with CF ranges between 20-40% (61, 240)
depending on definitions and tools employed. The reasons why only select CF patients
develop clinically significant liver damage remain unclear. CFLD can be asymptomatic
with multiple manifestations making classification difficult. The lack of a uniform clinical
definition hinders the diagnosis of CFLD in children as it relies on non-specific clinical,
biochemical and imaging assessments. Fibrosis markers including collagen IV, prolyl
hydroxylase and tissue inhibitor of metalloproteinase 1 has been shown to have some
discriminatory potential in diagnosing CFLD (122). Similarly, APRI seems to predict
CFLD and severe fibrosis (124), although the relative diagnostic accuracy of APRI and
other modalities are less than ideal. The potential utility of circulatory miRNA for
discriminating liver disease in CF children and disease severity has recently been
assessed using a limited miRNA array screen (200). In this chapter, I have used serum
miRNA-Seq with PCR-validation to assess all novel and known miRNAs in children
with liver biopsy-validated CFLD to demonstrate differential miRNA expression
compared to children with CFnoLD and healthy Controls, as well as to assess utility in
predicting hepatic fibrosis severity. It was reasoned that a potential serum miRNA
signature may change during the development and progression of CFLD. Therefore,
it was hypothesised that if serum miRNAs were differentially expressed in CFLD
compared to CFnoLD children then they could be used to identify paediatric patients
at highest risk for the development of CFLD.
Following miRNA-Seq, qRT-PCR validation on serum of 124 children confirmed
increased expression of miR-122-5p, miR-34a-5p and miR-365a-3p in CFLD vs.
CFnoLD while let-7g-5p and miR-142-3p expression was decreased. The most
abundant miRNA in the liver is miR-122 which accounts for more than half of the total
hepatic miRNA content (247). Multiple studies have reported increased circulatory
levels of miR-122 in paediatric chronic liver diseases such as biliary atresia, CFLD,
non-alcoholic fatty liver disease (NAFLD) and hepatitis B (200, 298-300). This shows
increased circulatory miR-122 levels in children with CFLD when compared to both
CFnoLD and healthy controls. Over expression of miR-122 in CFnoLD compared to

134
healthy controls was also found. It is possible that altered circulatory miR-122
expression is an early marker of liver injury and thus detected before the existing
clinical modalities used in this study to classify children with CFLD. Autopsy studies
have reported that up to 70% of CF patients show focal biliary cirrhosis (60), which
suggests that some of the CFnoLD children included in this study may have liver
damage that may manifest as an overexpression of miR-122 before liver disease
detection by the traditional diagnostic methods. Overexpression of miR-34a-5p and
miR-365a-3p was also found in serum of CFLD compared to CFnoLD children.
Increased serum levels of miR-34a have been reported in chronic liver diseases such
as hepatitis C and NAFLD (197, 301). miR-34a has been associated with liver
regeneration, having a direct repressor effect on hepatocyte proliferation and
senescence in alcoholic liver injury and in animal models of partial hepatectomy (302,
303). Moreover, a significant increase of miR-34a expression has been reported in
liver disease, including cholestasis (251). Based on previous findings (31), a role for
the hydrophobic bile acid taurocholate in the abnormal development of bile ducts, a
process known as the ductular reaction, in CFLD has been proposed (55). Key
components of the Notch signalling pathway such as Notch1, Notch2 and Jagged1
are direct targets of miR-34a (304). There is supporting evidence that hepatic stellate
cells and macrophages can influence the differentiation of liver progenitor cells into
reactive biliary cells and bile ducts via the Notch pathway (50), therefore suggesting a
potential role of miR-34a in the manifestation of CFLD. A potential role of miR-365 has
been implicated in paediatric chronic liver disease including biliary atresia (305) and
increased levels of circulating miR-365a-3p have been found in the plasma of children
with hepatitis B, suggesting its potential as a biomarker for disease progression (299,
306). However, further mechanistic studies are required to fully elucidate the role of
miR-34a-5p and miR-365a-3p in the pathogenesis of these paediatric liver diseases.
A decreased expression of serum let-7g-5p and miR-142-3p in CFLD compared to
CFnoLD children was also found. Both let-7g-5p and miR-142-3p expression are
downregulated in hepatocellular carcinoma (HCC) (269, 307) and are involved in
suppressing HCC cell migration, motility and invasion (269, 308). Downregulated miR-
142-3p has also been found in activated hepatic stellate cells (HSC) controlling cell

135
viability and cell growth by targeting TGFβ-receptor 1 (TGFβRI) (309). Based on the
functions that these miRNAs play in HCC and in HSCs, it is possible that their
decreased expression in CFLD children may play a role in preventing fibrosis.
Functional studies are required to establish the origin and potential role that these
differentially expressed miRNAs may play in CFLD and in the development of fibrosis.
Serum miR-365a-3p, miR-34a-5p and let-7g-5p individually demonstrated moderate
clinical utility for liver disease detection in CF with AUROCs ranging between 0.71-
0.74 (Table 4.4). However, using stepwise logistic regression analysis I identified a
miRNA panel consisting of miR-365a-3p, miR-142-3p and let-7g-5p with the ability to
discriminate liver disease in CF children with an AUC=0.87. Recently, it was reported
that APRI can differentiate liver disease in CF children with an AUC=0.75, as well as
severe CFLD (F3-F4) from mild to moderate CFLD (F0-F2) with an AUC=0.81 (124).
When APRI was combined with the proposed miRNA panel a marked improvement in
discriminating CFLD from CFnoLD was observed with an AUC=0.91. Performance
evaluation of the selected miRNA panel using 5-fold cross validation resulted in an
AUC=0.79 for the three miRNA panel alone and an AUC=0.86 when the miRNA panel
was combined with APRI, thus validating significant discriminatory capacity. The new
proposed three miRNA + APRI panel outperforms APRI alone in predicting CFLD even
in 5-fold cross validation evaluation. This study represents one of the largest biopsy-
proven CFLD cohorts with internal cross-validation methodology that confirms the
clinical utility of the combined three miRNA + APRI biomarker panel.
There is a clinical need for the continuous assessment of CFLD to monitor disease
progression in order to provide anticipatory guidance or identify patients in need of
future liver transplantation. In this study, significant differences in the expression of
miR-19b-3p, miR-25-3p, miR-18a-5p and miR-142-3p between varying METAVIR
fibrosis stages were found. Moreover, a significant positive correlation between miR-
19b-3p and miR-18a-5p with fibrosis advancement was identified. Specifically, miR-
18a-5p discriminated severe fibrosis (F3-4) from mild to moderate fibrosis (F0-2)
(Table 4.6). miR-18-5p was able to discriminate liver disease severity in CFLD children
when comparing F0 vs. F1-4 (AUC=0.78), F0-1 vs. F2-4 (AUC=0.76) and F0-2 vs. F3-

136
4 (AUC=0.82).This data suggests that miR-18a-5p was able to significantly
differentiate CFLD severity in all three cases and its diagnostic performance was better
than previously published results for APRI in stratifying disease progression (Table
4.7). ROC curve analysis dichotomizes the observations as it works on the assumption
of a binary system; however, fibrosis staging in liver disease is based on an ordinal
scale subject to the distribution of the study cohort, thus I further analysed this result
using the Obuchowski measure to assess the diagnostic accuracy of miR-18a-5p, as
recommended by Lambert et al. (310). In this model the assessment of miR-18a-5p to
discriminate severity in CFLD resulted in an Obuchowski measure of 0.74 which was
superior to APRI with an Obuchowski measure of 0.59. Lambert et al. suggests using
penalties proportional to the difference in METAVIR units between stages. Applying
this penalty scheme, miR-18a-5p remains superior to APRI in discriminating disease
severity with an Obuchowski measure of 0.79 vs. 0.68 respectively (Table 4.6).
Logistic regression with stepwise variable selection was used to select a linear
combination of miRNAs to discriminate CFLD severity, however, only miR-18a-5p was
significant in this model.
It has been suggested that children with CFLD appear to have a better pulmonary
prognosis than children with CFnoLD (311). In this study, there were no confounding
effects of worsening lung function as measured by %FEV1p, on the levels of serum
miRNAs in CFLD. No correlation was found between serum miR-18a-5p and %FEV1p
in CF children with or without liver disease, suggesting that the altered serum levels
of miR-18a-5p seen in CFLD may be liver-specific and thus reflecting hepatic fibrosis,
although this required further investigation.
As mentioned in Chapter 3, there is a lack of consensus regarding the classification of
patients having CFLD with two different guidelines commonly used to define CFLD
(59, 62). This impacts the categorization of CF children into the study cohorts defined
here (i.e. CFnoLD and CFLD). However, the observations of this study are robust for
several reasons. Firstly, this study used dual-pass liver biopsy to stage hepatic fibrosis
in all children classified as CFLD, as previously reported (64). Fibrosis staging
revealed 14 children without histological evidence of fibrosis (F0 fibrosis). Thus
137
secondly, a sub-analysis on this group vs CFnoLD subjects to assess whether this
group was potentially misclassified based on the current clinical criteria was
performed. This analysis showed that serum miR-122-5p, miR-365a-3p and APRI
were all significantly increased, while miR-142-3p was significantly decreased in CFLD
F0 fibrosis when compared to CFnoLD, which mirror the observations for the collective
CFLD cohort. These findings support previous observations (64, 124) which suggest
the majority of subjects classified as CFLD were correctly classified, even though in
some there was an absence of overt histological fibrosis. Finally, the clinical utility of
these observations lies in the use of the 3 miRNA panel + APRI to identify liver disease
in children with CF, who may potentially be at risk of the development of severe
complications such as cirrhosis and portal hypertension, with miR-18-5p used in the
stratification of liver disease severity.
During this study, discrepancies were found between the miRNAs patterns expressed
in CFLD children reported previously by Cook et al (200). These kinds of discrepancies
have been reported by others (298, 301) and may be due to methodological
differences. In this study, I used NGS to select potential miRNA candidates by pooling
small RNA from serum of selected subjects using a study design to minimise loss of
power (249). Subsequent validation was performed by qRT-PCR in individual subjects
using a panel of endogenous reference miRNAs for data normalization. By using
geNorm and NormFinder algorithms I selected miR-93-5p, miR-20a-5p and let-7i-5p
as the most suitable combination of endogenous miRNAs to normalize miRNA
expression data. miR-93 and let-7i have been previously described as stable
references for normalization of serum miRNAs (312, 313), while miR-20a expression
in plasma has been associated to hepatitis C and liver disease progression (178).
However, in this cohort miR-20a was among the most stable miRNAs across all
groups. These differences in the study design, added to the differences in sample
processing including RNA extraction methods and qRT-PCR reagents may be the
reasons for the observed discrepancies and highlights the need for standardized
methodological designs to guarantee reproducibility and clinical utility.

138
4.5 Summary and future directions
In this chapter, I have demonstrated a distinctive serum miRNA expression profile in
children with CFLD compared to CF children with no evidence of liver disease.
Moreover, I have shown differential circulatory miRNA expression in CFLD between
different stages of fibrosis. This particular circulatory miRNA expression profile is
important as it can be used to diagnose and assess CFLD. I have demonstrated that
a combination of circulatory levels of miR-365a-3p, miR-142-3p and let-7g-5p, when
used in combination with the free readily available APRI biochemical index has
excellent diagnostic utility for the early diagnosis of CFLD. Additionally, circulatory
expression of miR-18a-5p was able to stratify fibrosis severity in children with CFLD.
Current diagnostic methods for CFLD are non-specific, insensitive and are
controversial as the definition of CFLD is not standardized. Assessment of CFLD still
relies on liver biopsy, an invasive procedure; associate with severe complications and
with an important impact on health care costs. The development of non-invasive
methods to identify and stratify CFLD, especially at an early stage where timely
intervention is critical, is paramount. miRNA expression has the potential to be used
as a novel serum biomarker for the diagnosis of CFLD, especially when combined with
other non-invasive methods currently in development such as transient elastography.
The miRNA panel proposed in this chapter requires further independent validation in
a larger study cohort. Future studies could investigate the origin of the circulatory
miRNAs described here. The development of a reliable CFLD animal model could be
useful not only to determine the origin of the circulatory miRNAs, but also to investigate
the role they play in the development of CFLD, reveal future therapeutic strategies and
may offer further insights into CFLD pathogenesis. Based on the results presented
here, the next chapters will focus on the identification of the genes being targeted by
these miRNAs and the potential role they play in the development of hepatic disease
and liver fibrosis.

139
CHAPTER 5
Identification of microRNA targets in HSCs and LPCs…

140
5.1 INTRODUCTION
Since their discovery in 1993 (126), small microRNAs (miRNAs) have been
extensively studied due to their role in controlling gene expression. With the
description of let-7, a widely conserved miRNA in several species (128), research in
the miRNA field grew attempting to identify novel miRNAs, their functions and relation
to physiological and pathological processes. miRNAs play an important role regulating
more than a third of the human mRNA described in the genome (314). In order to
exert their function, miRNAs bind to a four family member protein called Argonaute
(AGO) (147) to form the ribonucleoprotein effector complex known as RNA-induced
silencing complex (RISC) (148). In the RISC complex, miRNAs bind to complementary
sequences in target mRNAs guiding the effect of proteins that form part of RISC and
thus silence gene expression.
The liver is known for its remarkable regenerative capacity. During acute liver injury,
uninjured hepatocytes increase in size, enter the cell cycle and proliferate, causing an
augmentation in the volume of the remaining liver lobes producing a compensatory
hypertrophy (315). During chronic injury, as observed in CFLD, continuous insult to
the liver produces a significant degree of hepatocyte damage/loss that impairs
hepatocyte-mediated regeneration. In this scenario, bipotential liver progenitor (stem)
cells (LPC) are induced to proliferate and differentiate into either hepatocytes or
cholangiocytes to facilitate hepatic regeneration. LPCs are estimated to become active
with a 50% loss of hepatocytes in the liver (316). It has been suggested that LPCs
originate in the canals of Hering (317, 318) which forms a canalicular link between
hepatocytes and the biliary tree. In chronic injury, a process known as the ductular
reaction occurs leading LPCs to expand and differentiate into cholangiocytes and form
reactive bile ducts. The ductular reaction is present in a broad range of chronic liver
diseases including non-alcoholic fatty liver disease (NAFLD) (47), cholestatic diseases
(319) and viral hepatitis (320). Moreover, different studies have shown the direct
correlation between hepatic fibrosis severity and the ductular reaction in different
aetiologies including CFLD (52, 55, 320, 321). Expansion and differentiation of LPCs
occur in close association with other hepatic non-parenchymal cells in the LPC niche

141
including hepatic stellate cells (HSCs), macrophages and extracellular matrix (48).
HSCs are liver mesenchymal cells that account for approximately 10% of the liver cell
population (322). In the absence of injury, HSCs exhibit a quiescent and non-
proliferative phenotype were the presence of vitamin A lipid droplets is their main
feature storing 50-80% of the total vitamin A in the body (323). Following liver injury,
HSCs are transformed from a quiescent to an activated myofibroblast-like phenotype
which are contractile, proliferative and motile (324) and characterized as being the
major source of extracellular matrix (ECM) including fibrillary collagens. During chronic
liver injury, persistent activation of HSCs results in a widespread and disorganised
formation of scar tissue typical of liver fibrosis. It has been proposed that crosstalk
between cells of the LPC niche in chronic liver disease ultimately leads to fibrosis
(325).
miRNAs subtly regulate cell processes by, in most cases, repressing the expression
of mRNA targets by interacting with the 3’ untranslated region (UTR) (314). miRNAs
can influence a vast number of gene transcripts with more than one miRNA acting
over each specific mRNA (161) which creates a complex regulatory network
influencing fundamental biological processes including those in the liver (reviewed
elsewhere (248)). Thus, the identification of miRNA targets is vital to understand not
only the contribution of specific miRNAs to cellular homeostasis and disease, but more
importantly to increase our understanding of the origin and progression of human
pathologies to enable the identification of potential novel therapeutic avenues.
For this chapter, the hypothesis is that miRNAs differentially expressed in CFLD
(reported in chapter 4) play a role in regulating liver disease development in CF.
Hence; the proposed aim is to identify downstream targets of these miRNAs that
contribute to the development of fibrogenesis and disease progression to cirrhosis in
CFLD. Consequently, I have identified potential targets of let-7g-5p, miR-142-3p, miR-
34a-5p and miR-365a-3p in the LPC line bipotential murine oval cells (BMOL) and in
the Lieming Xu-2 (LX2) human HSC line. BMOL cells are non-tumorigenic progenitor
cells (205) commonly known as oval cells in rodents due to their ovoid shape. LX2
cells are human HSCs, that contrary to LX1, are immortalised without sustained

142
expression of T antigen (206). Identification of potential miRNA-mRNA target
interactions was performed using a pulldown experimental method (207) as described
in Chapter 2, section 2.3.4.

143
5.2 RESULTS
5.2.1 RNA-sequencing assessment of pulldown enriched mRNA targets
In order to identify potential putative targets of miRNAs selected based on their
differential expression in serum of CFLD children (as shown in Chapter 4), an
experimental pulldown method using biotinylated synthetic miRNA duplexes was used
(207). This method involves the transient transfection of biotinylated miRNA duplexes
of either miR-365a-3p, Let-7g-5p, miR-142-3p or miR-34a-5p into BMOL and LX2 cells
and analysis of the captured target mRNA using RNA-sequencing. Expression
profiling between pulldown enriched mRNA and total RNA lysate used as controls was
then performed for each cell line and synthetic miRNA duplex. Samples were
sequenced using the Illumina NextSeq500 platform, processed and aligned to the
GRCh37 database as alignment reference. RNA-sequencing summary for BMOL and
LX2 cells are shown in Table 5.1 and Table 5.2 respectively. Two libraries
corresponding to Control 3 in BMOL transfected with miR-365a-3p and Control 2 in
LX2 transfected with miR-142-3p showed low mapping rates of 67% and 60%
respectively and therefore, were excluded from further analysis.
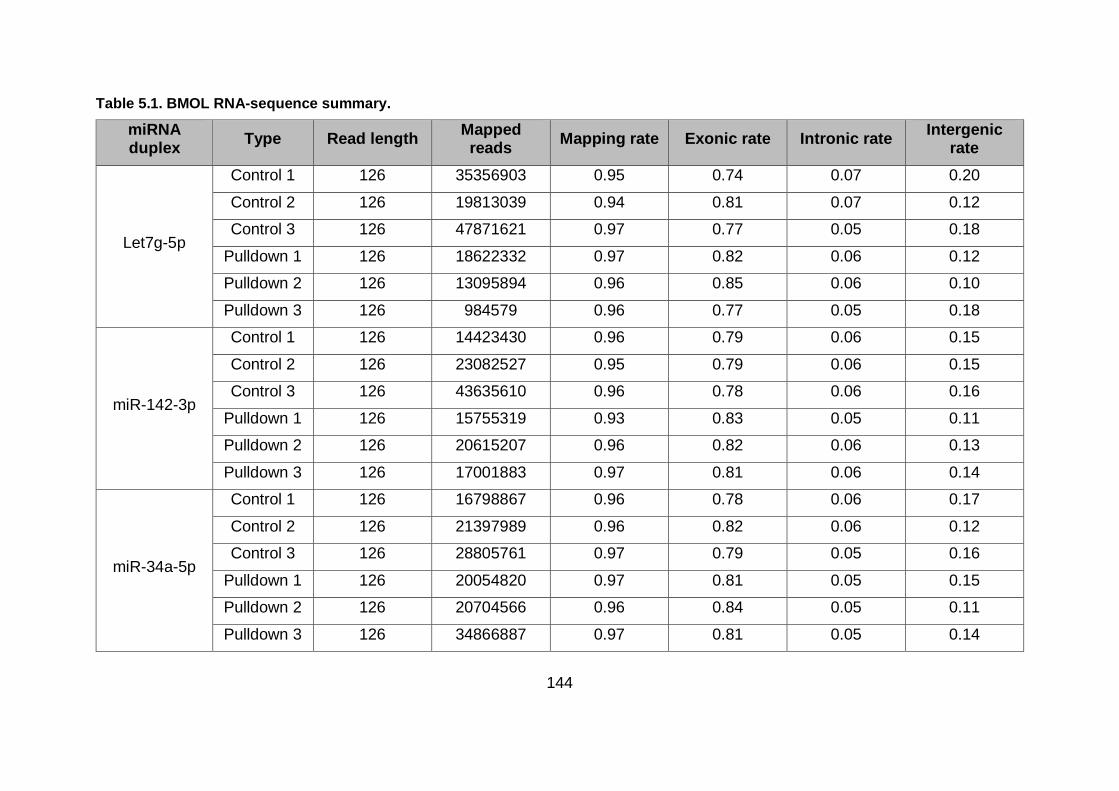
144
Table 5.1. BMOL RNA-sequence summary.
miRNA duplex
Type Read length Mapped reads
Mapping rate Exonic rate Intronic rate Intergenic
rate
Let7g-5p
Control 1 126 35356903 0.95 0.74 0.07 0.20
Control 2 126 19813039 0.94 0.81 0.07 0.12
Control 3 126 47871621 0.97 0.77 0.05 0.18
Pulldown 1 126 18622332 0.97 0.82 0.06 0.12
Pulldown 2 126 13095894 0.96 0.85 0.06 0.10
Pulldown 3 126 984579 0.96 0.77 0.05 0.18
miR-142-3p
Control 1 126 14423430 0.96 0.79 0.06 0.15
Control 2 126 23082527 0.95 0.79 0.06 0.15
Control 3 126 43635610 0.96 0.78 0.06 0.16
Pulldown 1 126 15755319 0.93 0.83 0.05 0.11
Pulldown 2 126 20615207 0.96 0.82 0.06 0.13
Pulldown 3 126 17001883 0.97 0.81 0.06 0.14
miR-34a-5p
Control 1 126 16798867 0.96 0.78 0.06 0.17
Control 2 126 21397989 0.96 0.82 0.06 0.12
Control 3 126 28805761 0.97 0.79 0.05 0.16
Pulldown 1 126 20054820 0.97 0.81 0.05 0.15
Pulldown 2 126 20704566 0.96 0.84 0.05 0.11
Pulldown 3 126 34866887 0.97 0.81 0.05 0.14

145
miRNA duplex
Type Read length Mapped reads
Mapping rate Exonic rate Intronic rate Intergenic
rate
miR-365a-3p
Control 1 126 27036783 0.95 0.77 0.06 0.17
Control 2 126 26150898 0.95 0.76 0.06 0.18
Control 3 126 23686794 0.67 0.75 0.05 0.20
Pulldown 1 126 22707323 0.96 0.78 0.06 0.17
Pulldown 2 126 20128354 0.96 0.77 0.06 0.18
Pulldown 3 126 26862309 0.97 0.79 0.05 0.16
RNA-sequencing summary for BMOL controls and pulldown enriched libraries. miRNA duplex shows the synthetic biotinylated miRNA duplex transfected into BMOL cells. Mapping rate shows the proportion of total reads mapped to the reference genome. Exonic rate shows the ratio of mapped exonic regions and mapped unique reads. Intronic rate shows the ratio of mapped intron regions and mapped unique reads. Intergenic rate shows the ratio of reads mapped to intergenic regions and mapped unique reads.

146
Table 5.2. LX2 RNA-sequence summary.
miRNA duplex
Type Read length Mapped reads
Mapping rate Exonic rate Intronic rate Intergenic
rate
Let7g-5p
Control 1 76 39820358 0.97 0.92 0.06 0.02
Control 2 76 22445582 0.96 0.92 0.06 0.02
Control 3 76 31094339 0.97 0.92 0.06 0.03
Pulldown 1 76 30490634 0.94 0.95 0.04 0.01
Pulldown 2 76 32653576 0.96 0.95 0.04 0.01
Pulldown 3 76 23148839 0.97 0.94 0.05 0.01
miR-142-3p
Control 1 76 34178434 0.96 0.92 0.06 0.02
Control 2 76 15434608 0.60 0.92 0.06 0.02
Control 3 76 25767656 0.97 0.92 0.06 0.02
Pulldown 1 76 30188056 0.92 0.92 0.06 0.02
Pulldown 2 76 37474651 0.96 0.92 0.06 0.02
Pulldown 3 76 38985085 0.96 0.92 0.06 0.02
miR-34a-5p
Control 1 76 27693000 0.97 0.93 0.05 0.02
Control 2 76 29134184 0.97 0.92 0.06 0.02
Control 3 76 15817783 0.96 0.93 0.06 0.01
Pulldown 1 76 20087815 0.96 0.93 0.05 0.02
Pulldown 2 76 12440017 0.98 0.94 0.05 0.01
Pulldown 3 76 27165611 0.96 0.94 0.05 0.01
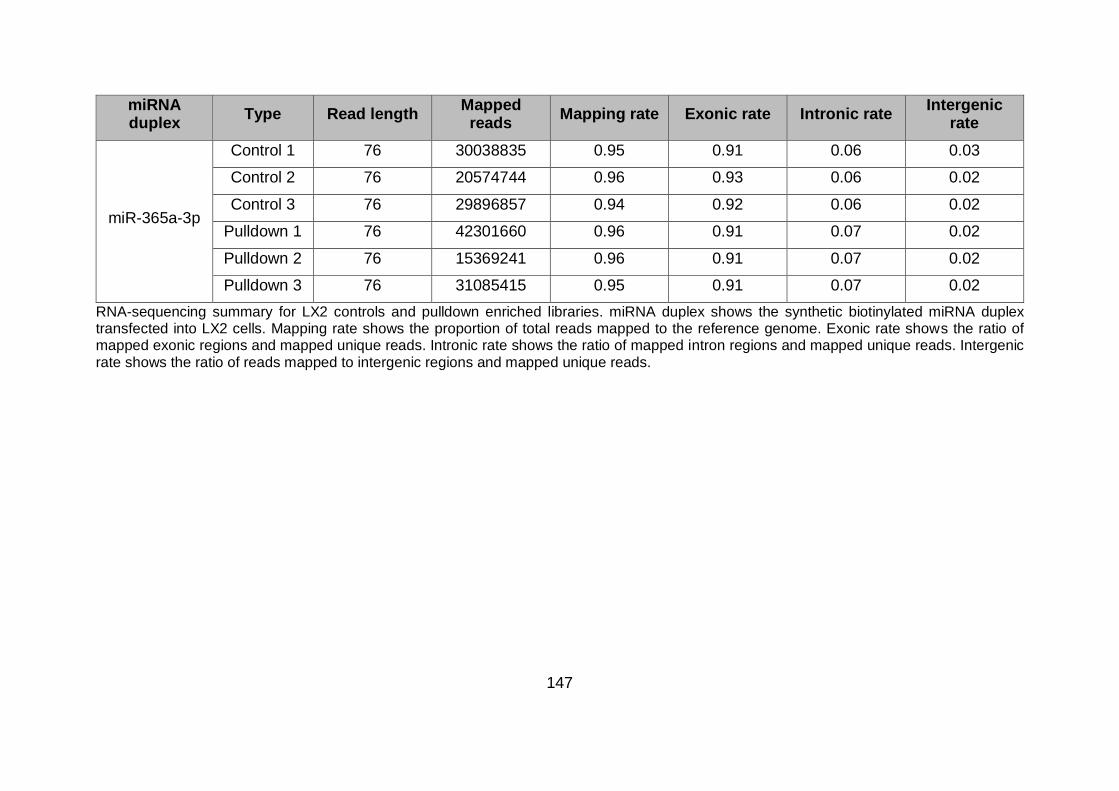
147
miRNA duplex
Type Read length Mapped reads
Mapping rate Exonic rate Intronic rate Intergenic
rate
miR-365a-3p
Control 1 76 30038835 0.95 0.91 0.06 0.03
Control 2 76 20574744 0.96 0.93 0.06 0.02
Control 3 76 29896857 0.94 0.92 0.06 0.02
Pulldown 1 76 42301660 0.96 0.91 0.07 0.02
Pulldown 2 76 15369241 0.96 0.91 0.07 0.02
Pulldown 3 76 31085415 0.95 0.91 0.07 0.02
RNA-sequencing summary for LX2 controls and pulldown enriched libraries. miRNA duplex shows the synthetic biotinylated miRNA duplex transfected into LX2 cells. Mapping rate shows the proportion of total reads mapped to the reference genome. Exonic rate shows the ratio of mapped exonic regions and mapped unique reads. Intronic rate shows the ratio of mapped intron regions and mapped unique reads. Intergenic rate shows the ratio of reads mapped to intergenic regions and mapped unique reads.
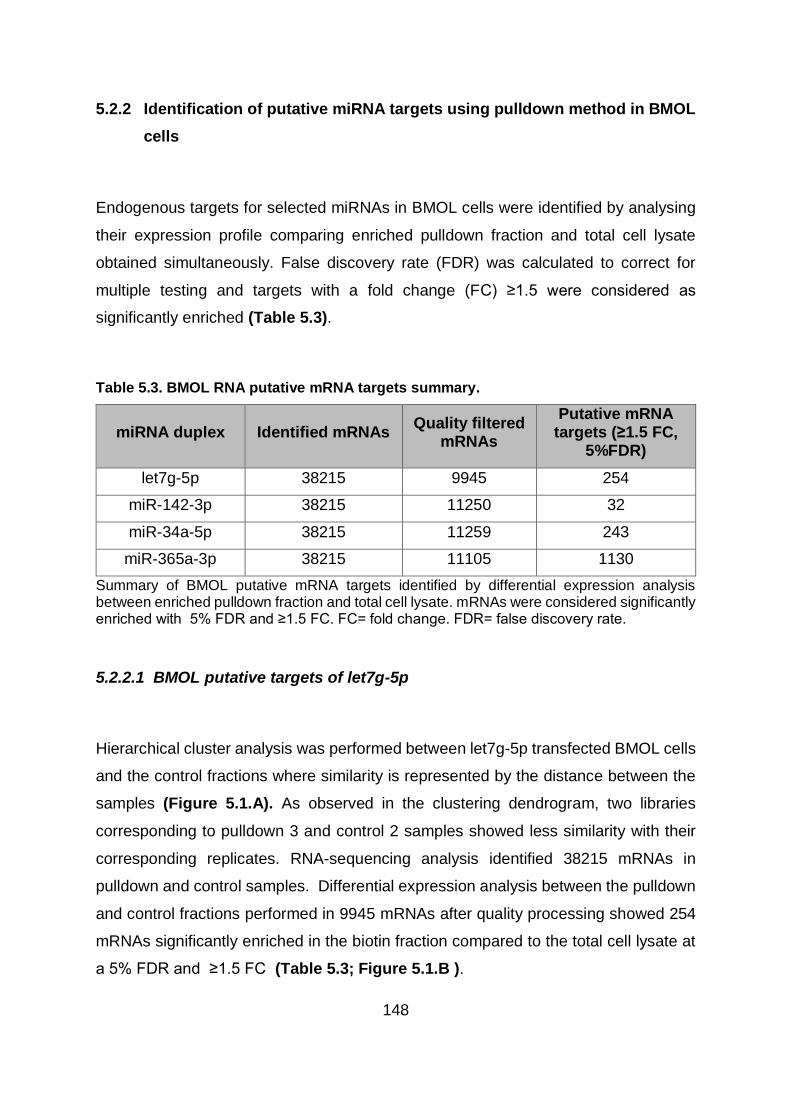
148
5.2.2 Identification of putative miRNA targets using pulldown method in BMOL
cells
Endogenous targets for selected miRNAs in BMOL cells were identified by analysing
their expression profile comparing enriched pulldown fraction and total cell lysate
obtained simultaneously. False discovery rate (FDR) was calculated to correct for
multiple testing and targets with a fold change (FC) ≥1.5 were considered as
significantly enriched (Table 5.3).
Table 5.3. BMOL RNA putative mRNA targets summary.
miRNA duplex Identified mRNAs Quality filtered
mRNAs
Putative mRNA targets (≥1.5 FC,
5%FDR)
let7g-5p 38215 9945 254
miR-142-3p 38215 11250 32
miR-34a-5p 38215 11259 243
miR-365a-3p 38215 11105 1130
Summary of BMOL putative mRNA targets identified by differential expression analysis between enriched pulldown fraction and total cell lysate. mRNAs were considered significantly enriched with 5% FDR and ≥1.5 FC. FC= fold change. FDR= false discovery rate.
5.2.2.1 BMOL putative targets of let7g-5p
Hierarchical cluster analysis was performed between let7g-5p transfected BMOL cells
and the control fractions where similarity is represented by the distance between the
samples (Figure 5.1.A). As observed in the clustering dendrogram, two libraries
corresponding to pulldown 3 and control 2 samples showed less similarity with their
corresponding replicates. RNA-sequencing analysis identified 38215 mRNAs in
pulldown and control samples. Differential expression analysis between the pulldown
and control fractions performed in 9945 mRNAs after quality processing showed 254
mRNAs significantly enriched in the biotin fraction compared to the total cell lysate at
a 5% FDR and ≥1.5 FC (Table 5.3; Figure 5.1.B ).

149
Figure 5.1. BMOL pulldown assay for let7g-5p putative target identification.
Identification of putative mRNA targets of let7g-5p by biotin pulldown assay. (A) Clustering dendogram of biotin enriched mRNA and total lysate controls. Vertical distance represents similarity. (B) MA plot (“M”=log-fold change; “A”= counts for each gene) MA plot confirmed the presence of pulldown enriched mRNAs with a fold change ≥1.5 and a minimum expression intensity of ≥ 4 million counts. Red dots showed genes with 5% FDR. PD= pulldown; logFC= log-fold change; logCPM= log- counts per million.
5.2.2.2 BMOL putative targets of miR-142-3p
Hierarchical cluster analysis performed between miR-142-3p transfected BMOL cells
and the control fractions showed the control 1 and pulldown 1 have less similarity than
their corresponding replicates (Figure 5.2.A). RNA-sequencing analysis identified
38215 mRNAs in pulldown and control samples. Differential expression analysis
between the pulldown and control fractions performed in 11250 mRNAs after quality
processing showed 32 mRNAs significantly enriched in the biotin fraction compared
to the total cell lysate at a 5% FDR and ≥1.5FC (Table 5.3; Figure 5.2.B).

150
Figure 5.2. BMOL pulldown assay for miR-142-3p putative target identification.
Identification of putative mRNA targets of miR-142-3p by biotin pulldown assay. (A) Clustering dendogram of biotin enriched mRNA and total lysate controls. Vertical distance represents similarity. (B) MA plot (“M”=log-fold change; “A”= counts for each gene). MA plot confirmed the presence of pulldown enriched mRNAs with a fold change ≥1.5 and a minimum expression intensity of ≥ 4 million counts. Red dots showed genes with 5% FDR. PD= pulldown; logFC= log-fold change; logCPM= log- counts per million.
5.2.2.3 BMOL putative targets of miR-34a-5p
Hierarchical cluster analysis performed between miR-34a-5p transfected BMOL cells
and the control fractions showed that control 2 and pulldown 3 samples have less
similarity with their corresponding replicates (Figure 5.3.A). RNA sequencing
identified 38215 mRNAs in control and pulldown samples. Differential expression
analysis between the pulldown and control fractions performed in 11259 mRNAs after
quality processing showed 243 mRNAs significantly enriched in the biotin fraction
compared to the total cell lysate at a 5% FDR and ≥1.5FC (Table 5.3; Figure 5.3.B).

151
Figure 5.3. BMOL pulldown assay for miR-34a-5p putative target identification.
Identification of putative mRNA targets of miR-34a-5p by biotin pulldown assay. (A) Clustering dendogram of biotin enriched mRNA and total lysate controls. Vertical distance represents similarity. (B) MA plot (“M”=log-fold change; “A”= counts for each gene). MA plot confirmed the presence of pulldown enriched mRNAs with a fold change ≥1.5 and a minimum expression intensity of ≥ 4 million counts. Red dots showed genes with 5% FDR. PD= pulldown; logFC= log-fold change; logCPM= log- counts per million.
5.2.2.4 BMOL putative targets of miR-365a-3p
Hierarchical cluster analysis performed between miR-365a-3p transfected BMOL cells
and the control fractions showed pulldown 3 sample shared less similarity with the
other pulldown replicates (Figure 5.4.A). RNA sequencing identified 38215 mRNAs in
control and pulldown samples. Differential expression analysis between the pulldown
and control fractions performed in the remaining 11105 mRNAs after quality
processing showed 1130 mRNAs significantly enriched in the biotin fraction compared
to the total cell lysate at a 5% FDR and ≥1.5FC (Table 5.3; Figure 5.4.B).
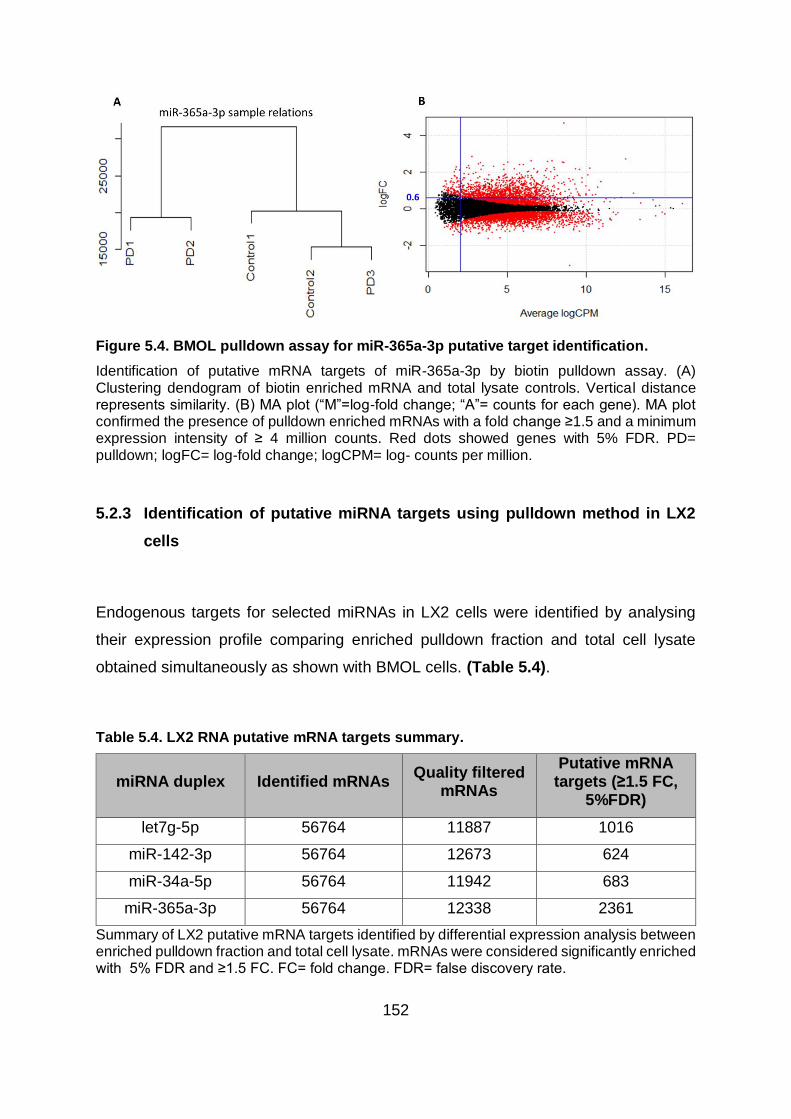
152
Figure 5.4. BMOL pulldown assay for miR-365a-3p putative target identification.
Identification of putative mRNA targets of miR-365a-3p by biotin pulldown assay. (A) Clustering dendogram of biotin enriched mRNA and total lysate controls. Vertical distance represents similarity. (B) MA plot (“M”=log-fold change; “A”= counts for each gene). MA plot confirmed the presence of pulldown enriched mRNAs with a fold change ≥1.5 and a minimum expression intensity of ≥ 4 million counts. Red dots showed genes with 5% FDR. PD= pulldown; logFC= log-fold change; logCPM= log- counts per million.
5.2.3 Identification of putative miRNA targets using pulldown method in LX2
cells
Endogenous targets for selected miRNAs in LX2 cells were identified by analysing
their expression profile comparing enriched pulldown fraction and total cell lysate
obtained simultaneously as shown with BMOL cells. (Table 5.4).
Table 5.4. LX2 RNA putative mRNA targets summary.
miRNA duplex Identified mRNAs Quality filtered
mRNAs
Putative mRNA targets (≥1.5 FC,
5%FDR)
let7g-5p 56764 11887 1016
miR-142-3p 56764 12673 624
miR-34a-5p 56764 11942 683
miR-365a-3p 56764 12338 2361
Summary of LX2 putative mRNA targets identified by differential expression analysis between enriched pulldown fraction and total cell lysate. mRNAs were considered significantly enriched with 5% FDR and ≥1.5 FC. FC= fold change. FDR= false discovery rate.

153
5.2.3.1 LX2 putative targets of let7g-5p
Hierarchical cluster analysis performed between let7g-5p transfected LX2 cells and
the control fractions showed high similarity in control and pulldown samples (Figure
5.5.A). RNA-sequencing analysis identified 56764 mRNAs in pulldown and control
samples. Differential expression analysis between the pulldown and control fractions
performed in 11887 mRNAs after quality processing showed 1016 mRNAs
significantly enriched in the biotin fraction compared to the total cell lysate at a 5%
FDR and ≥1.5FC (Table 5.4; Figure 5.5.B).
Figure 5.5. LX2 pulldown assay for let7g-5p putative target identification.
Identification of putative mRNA targets of let7g-5p by biotin pulldown assay. (A) Clustering dendogram of biotin enriched mRNA and total lysate controls. Vertical distance represents similarity. (B) MA plot (“M”=log-fold change; “A”= counts for each gene). MA plot confirmed the presence of pulldown enriched mRNAs with a fold change ≥1.5 and a minimum expression intensity of ≥ 4 million counts. Red dots showed genes with 5% FDR. PD= pulldown; logFC= log-fold change; logCPM= log- counts per million.
5.2.3.2 LX2 putative targets of miR-142-3p
Hierarchical cluster analysis performed between miR-142-3p transfected LX2 cells
and the control fractions showed high similarity in control and pulldown samples
(Figure 5.6.A). RNA-sequencing analysis identified 56764 mRNAs in pulldown and
control samples. Differential expression analysis between the pulldown and control
fractions performed in 12673 mRNAs after quality processing showed 624 mRNAs

154
significantly enriched in the biotin fraction compared to the total cell lysate at a 5%
FDR and ≥1.5FC (Table 5.4; Figure 5.6.B ).
Figure 5.6. LX2 pulldown assay for miR-142-3p putative target identification.
Identification of putative mRNA targets of miR-142-3p by biotin pulldown assay. (A) Clustering dendogram of biotin enriched mRNA and total lysate controls. Vertical distance represents similarity. (B) MA plot (“M”=log-fold change; “A”= counts for each gene). MA plot confirmed the presence of pulldown enriched mRNAs with a fold change ≥1.5 and a minimum expression intensity of ≥ 4 million counts. Red dots showed genes with 5% FDR. PD= pulldown; logFC= log-fold change; logCPM= log- counts per million.
5.2.3.3 LX2 putative targets of miR-34a-5p
Hierarchical cluster analysis performed between miR-34a-5p transfected LX2 cells
and the control fractions showed a slight decrease in the similarity of pulldown sample
1 compared to the remaining pulldown biological replicates (Figure 5.7.A). RNA-
sequencing analysis identified 56764 mRNAs in pulldown and control samples.
Differential expression analysis between the pulldown and control fractions performed
in 11942 mRNAs after quality processing showed 683 mRNAs significantly enriched
in the biotin fraction compared to the total cell lysate at a 5% FDR and ≥1.5FC (Table
5.4; Figure 5.7.B).
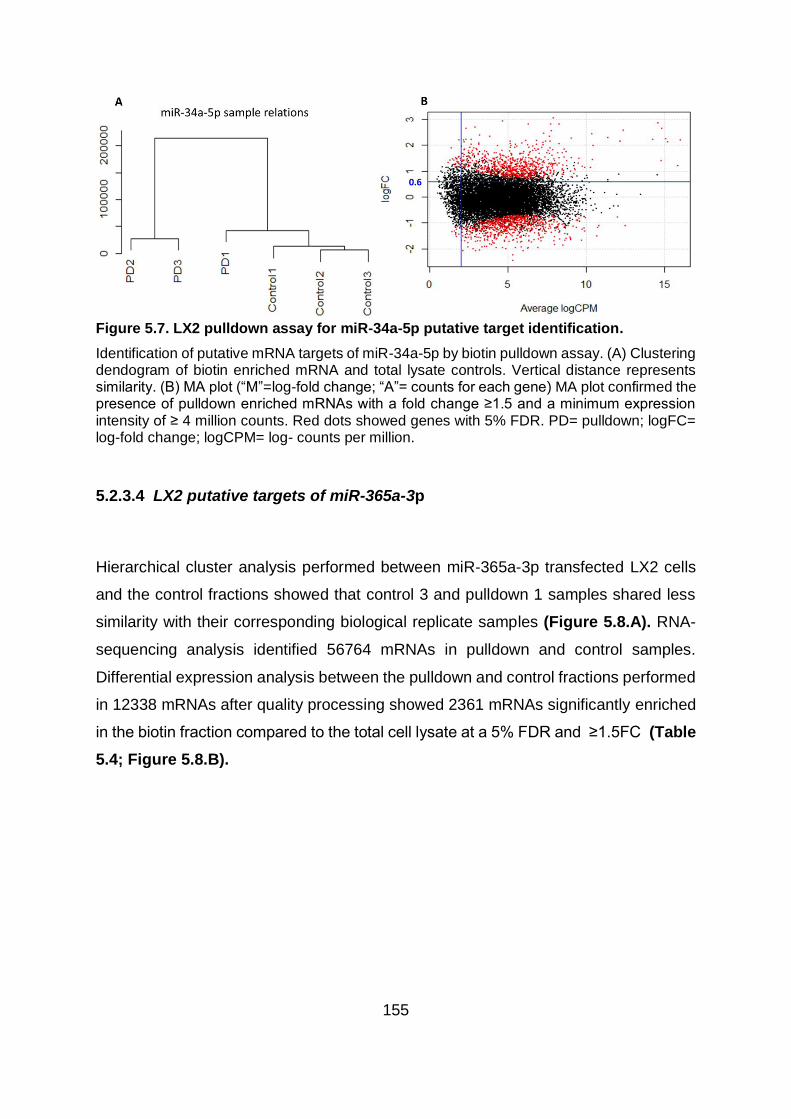
155
Figure 5.7. LX2 pulldown assay for miR-34a-5p putative target identification.
Identification of putative mRNA targets of miR-34a-5p by biotin pulldown assay. (A) Clustering dendogram of biotin enriched mRNA and total lysate controls. Vertical distance represents similarity. (B) MA plot (“M”=log-fold change; “A”= counts for each gene) MA plot confirmed the presence of pulldown enriched mRNAs with a fold change ≥1.5 and a minimum expression intensity of ≥ 4 million counts. Red dots showed genes with 5% FDR. PD= pulldown; logFC= log-fold change; logCPM= log- counts per million.
5.2.3.4 LX2 putative targets of miR-365a-3p
Hierarchical cluster analysis performed between miR-365a-3p transfected LX2 cells
and the control fractions showed that control 3 and pulldown 1 samples shared less
similarity with their corresponding biological replicate samples (Figure 5.8.A). RNA-
sequencing analysis identified 56764 mRNAs in pulldown and control samples.
Differential expression analysis between the pulldown and control fractions performed
in 12338 mRNAs after quality processing showed 2361 mRNAs significantly enriched
in the biotin fraction compared to the total cell lysate at a 5% FDR and ≥1.5FC (Table
5.4; Figure 5.8.B).
156
Figure 5.8. LX2 pulldown assay for miR-365a-3p putative target identification.
Identification of putative mRNA targets of miR-365a-3p by biotin pulldown assay. (A) Clustering dendogram of biotin enriched mRNA and total lysate controls. Vertical distance represents similarity. (B) MA plot (“M”=log-fold change; “A”= counts for each gene). MA plot confirmed the presence of pulldown enriched mRNAs with a fold change ≥1.5 and a minimum expression intensity of ≥ 4 million counts. Red dots showed genes with 5% FDR. PD= pulldown; logFC= log-fold change; logCPM= log- counts per million.
5.2.4 Assessment of enriched putative pulldown targets compared to target
prediction
There are no experimental studies validating targets of different miRNAs on a large
scale, however, there are computational algorithms that predict miRNA targets based
on known parameters of miRNA-mRNA interaction such as pairing with the seed
region, location of binding sites or nucleotide composition (195). The TargetScan tool
(161) was used to compared predicted targets of let-7g-5p, miR-142-3p, miR-34a-5p
and miR-365a-3p with enriched putative targets identified from the biotin pulldown
assay in BMOL and LX2 cells together, as TargetSCan does not discriminate based
on cell type. An overlap of 125 genes (P=0.0013) for let7g-5p; 67 genes (P=0.0121)
for miR-142-3p; 56 genes (P=0.0121) for miR-34a-5p and 96 genes (P<0.0001) for
miR-365a-3p was observed between the biotin pulldown experimental method and the
TargetScan predicted targets (Figure 5.9.A-D).

157
Figure 5.9. Comparison of pulldown experimental assay and bioinformatics predicted targets.
Venn diagrams showing the overlap of genes between (A) TargetScan predicted targets of let7g-5p and biotinylated let7g-5p pulldown predicted targets in BMOL and LX2 cells (B) TargetScan predicted targets of miR-142-3p and biotinylated miR-142-3p pulldown predicted targets in BMOL and LX2 cells (C) TargetScan predicted targets of miR-34a-5p and biotinylated miR-34a-3p pulldown predicted targets in BMOL and LX2 cells (D) TargetScan predicted targets of miR-34a-5p and biotinylated miR-34a-3p pulldown predicted targets in BMOL and LX2 cells. In all cases the overlap was significantly more than expected by chance when assessed by Fisher’s exact test.
5.2.5 Involvement of pulldown experimental predicted targets in cellular
functions and pathways
In order to infer the potential regulatory roles of let-7g-5p, miR-142-3p, miR-34a-5p
and miR-365a-3p on BMOL and LX2 cell phenotype, gene set enrichment analysis
(GSEA) was performed using Ingenuity Pathway Analysis (IPA). GSEA analysis
revealed the involvement of let-7g-5p, miR-142-3p, miR-34a-5p and miR-365a-3p in

158
key molecular and cellular processes involving a significant number of putative targets
in both BMOL and LX2 cell lines (Table 5.5).
Table 5.5. Gene set enrichment analysis (IPA).
miRNA duplex
Cell type
Molecular and cellular functions P-value Targets
(n)
let7g-5p BMOL
Gene Expression 2.94x10-
9 80
Cell Morphology 5.84x10-
8 92
Cellular Movement 2.15x10-
7 77
Cell Death and Survival 4.36x10-
6 101
Cellular Assembly and Organization 4.53x10-
6 68
miR-142-3p
BMOL
Cell Morphology 2.17x10-
6 11
Cellular Development 2.17x10-
6 15
Cellular Function and Maintenance 2.17x10-
6 15
Cellular Growth and Proliferation 2.17x10-
6 15
Cellular Movement 2.44x10-
4 11
miR-34a-5p
BMOL
Cellular Development 4.12x10-
5 82
Cellular Function and Maintenance 4.12x10-
5 48
Cellular Growth and Proliferation 4.12x10-
5 78
Cell Cycle 6.88x10-
5 34
Cell Morphology 1.10x10-
4 42

159
miRNA duplex
Cell type
Molecular and cellular functions P-value Targets
(n)
miR-365a-3p
BMOL
RNA Post-Transcriptional Modification 1.28x10-
15 49
Gene Expression 4.99x10-
9 168
Cell Cycle 7.66x10-
9 136
Protein Synthesis 5.56x10-
7 80
Cell Death and Survival 2.28x10-
6 219
let7g-5p LX2
Gene Expression 1.57x10-
8 208
Cellular Movement 2.16x10-
4 180
Amino Acid Metabolism 2.28x10-
4 4
Small Molecule Biochemistry 2.28x10-
4 17
RNA Post-Transcriptional Modification 3.46x10-
4 35
miR-142-3p
LX2
Cellular Assembly and Organization 1.12x10-
7 125
Cellular Function and Maintenance 1.12x10-
7 130
Cell Death and Survival 1.97x10-
6 102
Post-Translational Modification 2.16x10-
6 51
Cellular Movement 3.11x10-
6 140
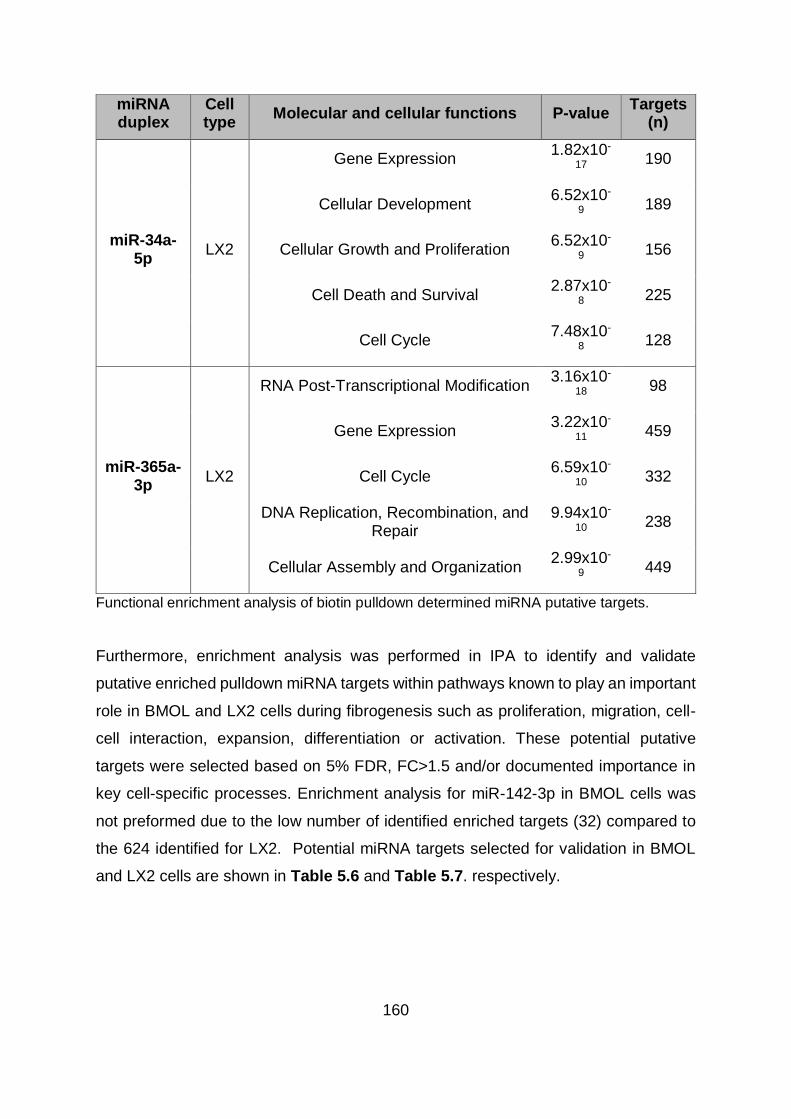
160
miRNA duplex
Cell type
Molecular and cellular functions P-value Targets
(n)
miR-34a-5p
LX2
Gene Expression 1.82x10-
17 190
Cellular Development 6.52x10-
9 189
Cellular Growth and Proliferation 6.52x10-
9 156
Cell Death and Survival 2.87x10-
8 225
Cell Cycle 7.48x10-
8 128
miR-365a-3p
LX2
RNA Post-Transcriptional Modification 3.16x10-
18 98
Gene Expression 3.22x10-
11 459
Cell Cycle 6.59x10-
10 332
DNA Replication, Recombination, and Repair
9.94x10-
10 238
Cellular Assembly and Organization 2.99x10-
9 449
Functional enrichment analysis of biotin pulldown determined miRNA putative targets.
Furthermore, enrichment analysis was performed in IPA to identify and validate
putative enriched pulldown miRNA targets within pathways known to play an important
role in BMOL and LX2 cells during fibrogenesis such as proliferation, migration, cell-
cell interaction, expansion, differentiation or activation. These potential putative
targets were selected based on 5% FDR, FC>1.5 and/or documented importance in
key cell-specific processes. Enrichment analysis for miR-142-3p in BMOL cells was
not preformed due to the low number of identified enriched targets (32) compared to
the 624 identified for LX2. Potential miRNA targets selected for validation in BMOL
and LX2 cells are shown in Table 5.6 and Table 5.7. respectively.

161
Table 5.6. Selected putative miRNA targets in BMOL cells.
miRNA duplex
Gene Log Fold change
False discovery
rate Pathway/Role
let7g-5p
Itga2 1.62 9.61x10⁻⁵ HGF/ Reverts myofibroblast phenotype in LPC
Crkl 0.86 0.0223 PDGF/ Induce chemotaxis in HSC
Ptch1 0.60 0.0411 SHH/ LPC proliferation and differentiation
Rock1 1.34 2.66x10⁻¹⁴ VEGF/ Matrix deposition and degradation in HSC
Ep300 1.27 2.26x10⁻⁸ LTX-β/ LPC proliferation
TGF- β1/ Induces myofibroblast phenotype in LPC
Nfkβ1 0.47 0.0193 TWEAK/ LPC expansion
Hnf4α 0.35 0.011 Hepatocyte differentiation
miR-34a-5p
Itga2 0.79 8.48x10⁻⁴ HGF/ Reverts myofibroblast phenotype in LPC
Crkl 1.26 3.94x10⁻⁸ PDGF/ Induce chemotaxis in HSC
Notch1 0.75 1.98x10⁻⁵ NOTCH/ LPC differentiation
Ep300 0.70 3.84x10⁻⁶ LTX-β/ LPC proliferation
TGF- β1/ Induces myofibroblast phenotype in LPC
Nfkβ1 0.43 4.96x10⁻⁴ TWEAK/ LPC expansion
Dvl3 0.65 1.71x10⁻⁴ WNT-β catenin/ LPC differentiation
Appl2 0.60 7.05x10⁻⁷ WNT-β catenin/ LPC differentiation

162
miRNA duplex
Gene Log Fold change
False discovery
rate Pathway/Role
miR-365a-3p
Akt3 0.93 7.65 x10⁻⁶ EGF/ Reverts myofibroblast phenotype in LPC
Nfkβ1 0.82 2.15 x10⁻⁶ TWEAK/ LPC expansion
Dvl31 0.52 0.0275 WNT-β catenin/ LPC differentiation
Ptpn11 0.87 5.31 x10⁻¹⁰ LTX-β/ LPC proliferation
PDGF/ Induce chemotaxis in HSC
Acvr2a 0.59 0.0283 TGF- β1/ Induces myofibroblast phenotype in LPC
Ets1 0.59 0.0003 HGF/ Reverts myofibroblast phenotype in LPC
Adam17 0.54 0.0245 NOTCH/ LPC differentiation
Fzd2 0.51 0.0298 WNT-β catenin/ LPC differentiation
Cx3cr1 1.16 0.0010 Mediates adhesion and migration in HSC
Putative enriched targets in BMOL cells selected for follow-up. Targets were selected based on 5%FDR, FC>1.5 and/or documented role in BMOL cellular processes. LPC= liver progenitor cell; HSC= hepatic stellate cell; Itga2= Integrin α-2; Crkl= CRK like proto-oncogene; Ptch1= Patched 1; Rock1= Rho associated coiled-coil containing protein kinase 1; Ep300= E1A Binding protein P300; Nfkβ1= Nuclear factor Kappa β-1; Hnf4α= Hepatocyte nuclear factor 4α; Dvl3= Dishevelled segment polarity protein 3; Appl2= Adaptor protein phosphotyrosine zipper 2; Akt3= AKT serine/threonine kinase 3; Ptpn11= Protein tyrosine phosphatase 11; Acvr2a= Activin A receptor 2A; Ets1= ETS proto-oncogene 1; Adam17= ADAM Metallopeptidase domain 17; Fzd2= Frizzled class receptor 2; Cx3cr1= C-X3-C Motif chemokine receptor 1; HGF= Hepatocyte growth factor; PDGF= platelet-derived growth factor; SHH= Sonic hedgehog; VEGF= Vascular endotelial growth factor; LTX-β= Lymphotoxin- β; TGF- β1= Transforming growth factor-β1; TWEAK= TNF related weak inducer of apoptosis; EGF= Epidermal growth factor.

163
Table 5.7. Selected putative miRNA targets in LX2 cells.
miRNA duplex
Gene Log Fold change
False discovery
rate Pathway/Role
let7g-5p
EP300 0.87 4.94x10⁻¹³ WNT-β catenin/ HSC activation
TGF- β1/ HSC activation
ROCK1 2.24 2.02x10-60 VEGF/ HSC proliferation
VCL 0.71 5.40x10⁻¹¹ VEGF/ HSC proliferation
TLR4 0.89 2.89x10⁻⁵ HSC activation
MYD88 0.80 3.03x10⁻¹¹ HSC activation
NR1D1 0.94 4.39x10⁻¹¹ HSC activation
CD248 0.94 1.95x10⁻⁶ HSC proliferation

164
miRNA duplex
Gene Log Fold change
False discovery
rate Pathway/Role
miR-142-3p
AMOT 1.36 5.10x10⁻⁵ HIPPO/ HSC activation
LATS1 0.99 4.04x10⁻¹⁰ HIPPO/ HSC activation
TEAD1 0.86 2.07x10⁻¹⁶ HIPPO/ HSC activation
SMAD3 0.61 4.73x10⁻¹⁰ HIPPO/ HSC activation
TGF- β1/ HSC activation
IL1RAP 0.65 0.0010 IL-1/ HSC survival
PTCH1 0.77 0.0110 SHH/ HSC activation
GLI3 0.68 2.52x10⁻⁵ SHH/ HSC activation
NOTCH3 1.16 0.0007 NOTCH/ HSC activation
MAP3K1 0.94 0.0030 SAP-JNK/ HSC activation
MAP3K9 0.91 0.0050 SAP-JNK/ HSC activation
TGFβR1 1.03 1.68x10⁻²² TGF- β1/ HSC activation
COL4A1 0.63 4.18x10⁻⁸ Collagen 4 predominantly in healthy liver
COL4A5 0.76 0.0115 Collagen 4 predominantly in healthy liver
miR-34a-5p
AMOT 1.28 0.0158 HIPPO/ HSC activation
WWC1 1.05 0.0152 HIPPO/ HSC activation
TGF- β1 1.18 0.0008 TGF- β1/ HSC activation

165
miRNA duplex
Gene Log Fold change False discovery
rate Pathway/Role
miR-365a-3p
WWC1 1.81 9.46x10⁻¹⁰ HIPPO/ HSC activation
AMOT 0.72 0.0179 HIPPO/ HSC activation
LATS1 1.06 0.0003 HIPPO/ HSC activation
SAV1 0.68 0.0276 HIPPO/ HSC activation
CSNK1G2 0.97 0.0002 WNT-β catenin/ HSC activation
HNRNPA1 2.36 3.69x10⁻¹¹ HSC activation
COL4A1 2.02 1.76x10⁻⁸ Collagen 4 predominantly in healthy liver
COL4A2 1.65 3.75x10⁻⁶ Collagen 4 predominantly in healthy liver
COL4A5 1.35 0.0006 Collagen 4 predominantly in healthy liver
Putative enriched targets in LX2 cells selected for follow-up. Targets were selected based on 5%FDR, FC>1.5 and/or documented role in LX2 cellular processes. HSC= hepatic stellate cell; EP300= E1A Binding protein P300; ROCK1= Rho associated coiled-coil containing protein kinase 1; VCL= Vinculin; TLR4= Toll like receptor 4; MYD88= Myeloid differentiation primary response 88; NR1D1= Nuclear receptor-1 group D-1; CD248= Endosialin; AMOT= Angiomotin; LATS1= Large tumor supressor kinase 1; TEAD1= TEA Domain transcription factor 1; SMAD3= Mothers against decapentaplegic homolog 3; IL1RAP= Interleukin 1 receptor accessory protein; PTCH1= Patched 1; GLI3= Glioma-associated oncogene family zinc finger 3; MAP3K1= Mitogen activated protein kinase kinase kinase 1; MAP3K9= Mitogen activated protein kinase kinase kinase 9; TGFβR1= Transforming growth factor-β receptor 1; COL4A1= Collagen type IV α-1; COL4A5= Collagen type IV α-5; WWC1= WW and C2 domain containing 1; TGF- β1= Transforming growth factor-β1; SAV1= Salvador family WW domain 1; CSNK1G2= Casein kinase 1 γ-2; HNRNPA1= Heterogeneous nuclear ribonucleoprotein A1; COL4A2= Collagen type IV α-2; VEGF= Vascular endotelial growth factor; IL-1= Interleukin 1;
SHH= Sonic hedgehog; SAP-JNK= Stress-activated protein kinases/ Jun amino-terminal kinase.
166
5.3 DISCUSSION
microRNAs have gained great interest in recent years due to their role as regulators
of gene expression. Two decades on from their discovery, the effector mechanisms of
miRNAs that regulate mRNA expression are not entirely elucidated. miRNAs control
gene expression at a post-transcriptional level by binding to complementary
sequences in mRNA targets. Understanding how this binding occurs in chronic liver
disease is not only fundamental to explore miRNA regulatory effects, but also to infer
the biological functions of miRNAs that contribute to hepatic fibrosis initiation and
progression, and to the identification of potential anti-fibrotic therapies.
As part of this process, miRNAs need to form the miRNA-induced silencing complex
(miRISC) which guides the RISC complex to the target mRNA, mediating its regulation
(326). In animals most of the miRNA-mRNA interactions occur in the mRNA 3’UTR
region. Some miRNA targets show perfect complementarity to the six nucleotides
corresponding to position 2-7 at the 3’UTR end of the mRNA. This region is known as
the seed sequence (158, 327) and can include up to eight nucleotides in length based
on the homology at position eight or if the nucleotide in position one correspond to an
adenine (A) (161, 328). Binding sites in mRNA targets with perfect complementarity
with the eight nucleotides of the seed sequence are known as canonical sites (161).
Marginal sites (complementarity with the six nucleotide seed sequence) and non-
canonical site interactions produce a milder regulatory effect than the ones observed
in canonical sites (314). However, sequence complementarity alone cannot explain
miRNA-mRNA binding interactions. Additional features such as target site
accessibility, nucleotide composition, multiple binding sites, RNA binding proteins,
miRISC regulation or target interactions influence regulation efficacy.
The majority of miRNA target sites are located in 3’UTR regions, however, there is
enough experimental evidence showing binding sites in the 5’UTR and open reading
frame (ORF) regions (329, 330) as well. It is thought that the reduced frequency of
5’UTR and ORFs as miRNA binding sites is due to the displacement of the miRISC

167
complex from the translation machinery (132). The fact that a great number of
conserved binding sites are at least at a 15 nucleotide distance from the stop codon
and different than the middle of long UTRs support this explanation as it avoids
ribosome interference (162). The nucleotide composition is as important as the
location of the binding site within the UTR region. Sites rich in AU content perform best
as they provide a more accessible UTR context favourable to the miRISC complex
(331).
Co-expression of binding sites for the same or different miRNAs can be found in
miRNA targets. Binding site studies of the miRNAs lin-4 and lin-14 3’UTRs revealed
that multiple sites can function cooperatively with effects similar to what would be
expected if each site contributes independently, multiplying the response from each
binding site by itself (332). When two binding sites are within 40nt but no closer than
8nt, the increased repression surpasses the expected independent contribution of
each site (333). By this mechanism, miRNA regulatory effects can be enhanced and
become more sensitive to changes in miRNA expression levels. However, when a site
overlap is present, the effects can be either enhanced or repressed (333, 334).
External factors can also influence the target binding capacity independently of the
site length or composition. RNA binding proteins (RBP) antagonize miRNA regulation
by interacting with mRNA AU-rich sequences protecting them from degradation (335).
This mechanism can be observed in ELAV1 preventing the repression of CAT1 by
miR-122 (336) or DND1 which reduces the interaction between miR-430 and TDRD7
(337). Members of the miRISC complex are also subject to regulation, enhancing or
repressing its functions. LIN41 and MEI-P26 members of the TRIM-NHL family, target
Argonaute (AGO) for proteosome-mediated degradation which reduce AGO levels
promoting miRISC instability by decreasing the association of miRNA and the RISC
complex (338, 339). In contrast, other members of the TRIM-NHL family such as
NHL2 and TRIM32 positively regulate miRISC function. Interaction of NHL2 has been
studied in C. elegans (340) showing stimulatory effects when it associates with AGO
and the helicase CGH-1 (341). Studies on TRIM32 have shown to enhance the
repression mediated by let-7 miRNA in mouse neural progenitor cells, although the
168
process is yet to be determined (342). Other mechanisms such as phosphorylation
can also influence miRISC performance. Human AGO2 can be phosphorylated at
multiple positions including the region that serves as a binding pocket to the miRNA
which results in a reduced ability to bind to miRNA and form the miRISC complex
(343).
Interactions between the miRISC complex members can also have an effect on
miRNA regulatory functions. For instance, increased expression of AGO results in the
upregulation of mature miRNA levels (339), while loss of AGO reduces miRNA
abundance (145), suggesting that the presence of AGO in the cell is a limiting factor.
Similarly, interaction between miRNA and mRNA also has a regulatory effect as
extensive pairing between miRNA and its targets produce 3’ miRNA end trimming and
the addition of non-templated uridines which can lead to miRNA destabilization (344,
345). Interestingly, miRNA activity can be repressed by interaction that does not
necessarily produce changes in miRNA levels or the miRISC complex. Several studies
have shown that competition between common targets for different miRNAs can
influence the potency of miRNA regulation (346-348). Target decoys have also been
identified where several transcripts present target sites for specific miRNAs by which
they cross-regulate each other and titrate the activity of the miRNA where they share
a similar target site, thus functioning as a sink of miRNA activity (349, 350).
Given the number of mRNAs that are the subject of miRNA regulation, the interest in
identifying miRNA targets to determine their function in cells and organs has grown
exponentially. Genome-wide computational methods were developed to predict
potential miRNA targets. Most of these target prediction algorithms focus on canonical
sites or sequence complementarity with the seed sequence (161). Experimental data
continue to expand our knowledge on target identification such as the preference for
AU-rich regions which increase the prediction accuracy of potential target sites (314),
however, this new information is not always incorporated to the existent algorithms.
As discussed above, miRNA-mRNA target interaction is complex and subject to
multiple factors that can affect its efficiency. These factors, including mismatches, G:U
wobbles and bulges affects the performance of computational methods to predict

169
miRNA targets with studies ranging in their false positive rate between 24-70% (163,
351, 352). Additionally, target prediction programs normally produce different lists of
predicted targets due to alignment artefacts, different source databases for 3’UTR and
miRNA sequences, or their own configuration settings used in each program.
Moreover, these computational algorithms do not discriminate for cell gene expression
specificity, which adds a layer of difficulty when exploring the role that miRNAs play in
different hepatic cell populations during liver fibrosis. Therefore, in this chapter I have
characterised the mRNA targets of let-7g-5p, miR-142-3p, miR-34a-5p and miR-365a-
3p identified in Chapter 4 using an experimental co-purification method of bound
biotinylated miRNA and mRNA (207) in the LPC line BMOL and the human HSC line
LX2. This miRNA pulldown protocol is a modification of a biochemical approach to
enrich miRNA targets developed by Orom et al. (353) which permits enrichment of
mRNA targets of a single miRNA.
In BMOL cells, the pulldown method identified 254 significant putative targets for let7g-
5p, 32 for miR-142-3p, 243 for miR-34a-5p and 1130 for miR-365a-3p (Table 5.3).
Whereas in LX2 cells, 1016 putative targets were identified for let7g-5p, 624 for miR-
142-3p, 683 for miR-34a-5p and 2361 for miR-365a-3p (Table 5.4). Hierarchical
clustering analysis showed some technical variation between replicates in BMOL cells
with the four selected miRNAs (Figure 5.1 - Figure 5.4), while LX2 showed a slight
variation between replicates with miR-34a-5p and miR-365a-3p (Figure 5.8). The
most likely explanation for this is due to differences during the experimental process
that affected the assay performance including transfection efficiency, day-to-day
variation, cell density or the effect of pooling cells together. Despite these observed
variations, the pulldown assay was demonstrated to be a robust method enriching
computationally predicted targets (Figure 5.9). When comparing the pulldown
enriched targets with TargetScan predicted targets (226), an overlap of 125 genes for
let-7g-5p (Figure 5.9.A), 67 genes for miR-142-3p (Figure 5.9.B), 56 genes for miR-
34a-5p (Figure 5.9.C) and 96 genes for miR-365a-3p (Figure 5.9.D) was found. This
overlap was significantly higher than the number of genes that would be expected by
chance (P=0.0013 for let7g-5p, P=0.0121 for miR-142-3p, P= 0.0121 for miR-34a-59
and P<0.0001 for miR-365a-3p) confirming that the pulldown method enriched true

170
miRNA targets. A previous study exploring miRNAs and their targets in human
quiescent HSCs identified MTHFD1L, PFKP, DOCK7 and WNKY as mRNA targets of
miR-142, whereas PPAP2A was identified as a target of let-7g (354). These previously
identified targets were also enriched during the pulldown assay performed in this study
confirming the validity of the methodological approach used for the miRNA target
identification. No large scale experimental miRNA target validation has been
performed for miR-34a and miR-365a in LX2 cells or for any miRNA in BMOL cells.
Gene set enrichment analysis (GSEA) of pulldown-enriched mRNA targets in BMOL
cells revealed core functions involved in cell homeostasis (Table 5.5) including cellular
movement and survival for let7g-5p; cellular development, maintenance and
proliferation for miR34a; and cell cycle and survival for miR365a. Several potential
putative targets were selected for further validation in all miRNAs except miR-142
(Table 5.6) due the low number of significantly enriched targets found in BMOL cells
suggesting that miR-142 does not appear to play a significant role in BMOL cells.
These putative targets were selected based on their participation in differentiation,
proliferation or cell-interaction pathways important in the role of LPCs during hepatic
fibrosis and will be discussed in more depth in chapter 6. In LX2 cells, GSEA analysis
also revealed the enrichment of putative targets in key cellular functions (Table 5.5)
including cellular movement and metabolism for let-7g; cellular movement,
organization, survival and maintenance for miR-142; cellular development,
proliferation and survival in miR-34a; and cell cycle and organization, gene expression
and DNA replication for miR-365a. As for BMOL, several potential putative targets
were selected for further validation based on their involvement in pathways that drive
the activation of HSCs (Table 5.7), important in the establishment, progression and
maintenance of hepatic fibrosis. The implication of these pathways with the selected
miRNAs will be discussed in more detail in chapter 6.
171
5.4 Summary and future directions
In this chapter, I have used an experimental method to identify putative targets for let-
7g-5p, miR-142-3p, miR-34a-5p and miR-365a-3p in LPC and HSCs, known to play
an important role during chronic liver injuries including CFLD. An advantage of the
biotin pulldown method used in this chapter is the capacity to capture all the mRNAs
that interact with a specific miRNA in a specific cell. This approach allows a better
understanding of the complex gene networks that are regulated by miRNAs that would
not be possible by using gene-specific target identification. Furthermore, these
findings reflect interactions in cells directly involved in the hepatic fibrosis process
mirrored in the BMOL and LX2 selected as in vitro models of two cell populations from
the LPC niche. Although some variation in the replicates was observed between the
control and pulldown enriched samples, the assay was robust as demonstrated by the
significant enrichment of predicted targets when compared to TargetScan and
previously validated targets of miR-142 and let7g in quiescent HSCs. The use of gene
set enrichment analysis identified key cellular and molecular functions in BMOL and
LX2 cells which reveal part of the gene regulation pathways mediated by miRNAs and
how they are implicated in CFLD development. For this reason, several putative
targets were selected for validation. The next chapter will show the validation of these
putative targets and will further investigate their function in regulating hepatic fibrosis
and the LPC niche and provide some context to their potential role in the mechanisms
associated with the development of CFLD.

172
CHAPTER 6
Validation of miRNA targets and the role of microRNAs
in HSC and LPC biology

173
6.1 INTRODUCTION
Bile duct plugging and toxic bile acid accumulation during CFLD is proposed to lead
to the development of hepatic fibrosis which in some cases progresses to focal biliary
cirrhosis and ultimately multilobular biliary cirrhosis. As with other chronic liver
diseases where the persistent insult to the liver impairs hepatocyte-mediated liver
regeneration, liver progenitor cells (LPCs) contribute to the restoration of liver integrity.
Despite the diverse aetiologies of chronic liver disease, LPC-mediated liver
regeneration follows a common pathway of liver wound healing and repair involving
inflammation, activation and expansion of LPCs and fibrogenesis which incorporates
activation of hepatic stellate cells (355, 356).
LPCs, also called oval cells in rodents due to their characteristically ovoid shape, are
facultative bipotential stem-like cells with the capacity to differentiate in hepatocytes
or cholangiocytes (357, 358). Following activation, LPCs expand and form reactive
ductular structures and intermediate hepatocytes in a process known as the ductular
reaction (DR). The DR is a regenerative response in which LPCs predominantly from
terminal ducts of the biliary tree or the canals of Hering proliferate and form bile ducts
resulting in biliary hyperplasia (359). The DR has a heterogeneous profile which
seems to depend on the regenerative conditions influenced by the disease aetiology.
For instance in chronic biliary damage, the DR mainly consists of cells with biliary traits
and stem cell markers with strong activation of the Notch signalling pathway (52, 360),
while in chronic hepatocyte damage, the DR mainly consists of cells with intermediate
hepatocyte characteristics with strong activation of the Wnt signalling pathway (360).
Several factors can promote LPC activation including the cellular environment, injury
severity and specific inflammatory cytokines involved in the liver injury (361). The LPC
response during liver regeneration can be characterised into four distinctive phases:
activation, proliferation, migration and differentiation (362) with several factors
influencing the extent of the response of these phases. Activation and expansion of
LPCs occurs during the first 7 days after liver injury with differentiation happening over
the following 7 days (363), a much slower response compared to hepatocyte-mediated
regeneration. Expansion of LPCs starts from Sox9 expressing ductal cells via the

174
action of IFN-γ (364) and TNF-α from inflammatory cells (365). Other mediators such
as hedgehog ligand released by injured hepatocytes (366), hormones such as
somatostatin (367) and adipokines (368) also regulate LPC proliferation and
differentiation. In addition to these factors, several signalling pathways have been
identified as important regulators of LPC-mediated regeneration such as TNF-related
weak inducer of apoptosis (TWEAK), Notch, Wnt – β catenin, HGF or EGF among
others (reviewed elsewhere (369)). The LPC niche formed as part of the wound
healing response of hepatic regeneration incorporates LPCs, macrophages, hepatic
stellate cells (HSCs) and extracellular matrix (ECM) (48).
In the absence of injury, HSCs are non-proliferative quiescent vitamin A-storing cells
that reside in the Space of Dissé regulating vascular tone. During liver injury, HSCs
are activated into a myofibroblast-like phenotype that is proliferative, contractile and
chemotactic playing an important role in fibrogenesis by producing fibrotic tissue
through the accumulation of ECM (370). This accumulation depends on a fine balance
between matrix synthesis and degradation in which tissue inhibitor of
metalloproteinase (TIMP) proteins and matrix metalloproteases (MMPs) have a
predominant role (371). HSC activation occurs in two distinctive steps: initiation and
perpetuation. During initiation, induction of growth factor receptors, modulation of
growth factor signalling and the change into a contractile and fibrogenic phenotype
sensitise HSC to activation signals. During the perpetuation stage, characteristics of
active HSC are amplified in response to cytokines and growth factors enhancing HSC
proliferation, contractility and pro-inflammatory signalling. (372). As with LPCs, HSC
activation is controlled by different mediators and signalling pathways. TGF-β, a
fibrogenic cytokine (373), promotes the synthesis of collagen 1 and 3 (abundant in
fibrotic livers) in active HSCs through the activation of SMAD3 (374, 375). TGF-β also
promotes HSC activation by other mechanisms involving the regulation of ERK, c-JUN
and JNK (376, 377). Furthermore, studies have increasingly revealed (reviewed
elsewhere (378)) the implication of additional cytokines (e.g. PDGF, VEGF or CTGF)
and pathways (e.g. Hedgehog, Notch, JNK, PTEN, WNT or Hippo) in promoting HSC
proliferation and migration.

175
The LPC niche is closely related to ECM (379) as observed by the reduced activation
and expansion of LPCs due to inhibition of ECM remodelling (380). Moreover,
important cell crosstalk occurs between cells of the LPC niche due to their close spatial
association. Communication between LPCs and HSCs has been observed through
lymphotoxin-β (LT-β) expressed on LPCs and its receptor on activated HSCs (381,
382). Expression of MCP-1 by cholangiocytes and mature bile ducts enhances
chemotaxis of HSCs (31). Similarly, activated HSCs express ICAM-1 and RANTES
which attracts LPCs to the injury site (381) whereas TWEAK produced by
macrophages induces proliferation of LPCs (383, 384).
The hypothesis for this chapter is that the putative miRNA target mRNAs identified in
Chapter 5 mediate LPC differentiation and HSC activation which drives fibrogenesis
during CFLD. Hence, the proposed aims of this Chapter are to assess the effects of
let-7g-5p, miR-142-3p, miR-34a-5p and miR-365a-3p on the expression of their
putative targets (and validate them as definitive targets) in LPCs and HSCs; and to
determine the potential role of let-7g-5p, miR-142-3p, miR-34a-5p and miR-365a-3p
on the function and biology of LPCs and HSCs using the respective cell lines, BMOL
and LX2.

176
6.2 RESULTS
6.2.1 LPCs
6.2.1.1 Effect of miRNAs on putative target mRNA expression
Following synthetic miRNA duplex transient transfection of BMOL cells, biotin-
pulldown and NGS analysis to identify putative miRNA targets in BMOLs, I identified
seven potential targets of interest for let7g-5p, seven for miR-34a-5p and nine for miR-
365a-3p (see Chapter 5, Table 5.6) and subsequently assessed their gene
expression by qRT-PCR. Differential expression between miRNA negative control and
miRNA mimic of interest was assessed at 24, 48 and 72 hours post-transfection in six
replicates. Pair-wise comparison between miRNA negative control and selected
miRNA mimic at each time point was performed using multiple T-test corrected with
Holm-Sidak post-hoc test.
BMOL cells transfected with let7g-5p had significantly decrease expression of Rock1
(P<0.001), Hnf4α (P=0.0288) and Ep300 (P=0.0244) at 24 hours; Rock1 (P=0.0041)
and Ep300 (P=0.0328) at 48 hours; and Hnf4α (P=0.0288) and Ep300 (P=0.0354) at
72 hours compared to BMOL cells transfected with miRNA negative control (Figure
6.1.A-C). Ptch1 showed decreased expression in BMOL cells transfected with let7g-
5p compared to miRNA negative control at 24 (P=0.1860) and 48 hours (P=0.0995)
however this did not reach statistical significance (Figure 6.1.D).

177
Figure 6.1. qRT-PCR assessment of putative let7g-5p targets in BMOL cells.
Relative expression of putative let7g-5p targets assessed at 24 hours intervals up to 72 hours. Gene expression was compared between BMOL cells transfected with miRNA negative control and let7g-5p mimic (n= 6) for (A) Rock1, (B) Hnf4α, (C) Ep300 and (D) Ptch1. Lines represent mean ± SEM. * P<.05, **P<.01 and ***P<.001 by multiple T-test with Holm-Sidak post-hoc test. Hprt was used as endogenous control for normalization.
No significant decreased expression was found on any of the selected potential
putative targets in BMOL cells transfected with miR-34a-5p when compared to miRNA
negative control, however, Itga2 showed decreased relative expression at 48 hours
(P=0.2031) (Figure 6.2).

178
Figure 6.2. qRT-PCR assessment of putative miR-34a-5p targets in BMOL cells.
Relative expression of Itga2, a putative miR-34a-5p target assessed at 24 hours intervals up to 72 hours. Gene expression was compared between BMOL cells transfected with miRNA negative control and miR-34a-5p mimic (n=6). Lines represent mean ± SEM. Analysis made by multiple T-test with Holm-Sidak post-hoc test. Hprt was used as endogenous control for normalization.
BMOL cells transfected with miR-365a-3p showed significantly decrease expression
of Cx3xr1 (P=0.047), Shp2 (P=0.0118) and Akt3 (P=0.0060) at 48 hours, whereas
significant decreased expression of Fzd2 was observed at 48 (P=0.0040) and 72 hours
(P=0.0040) (Figure 6.3.A-D). Adam17 (P=0.4521) and Nfkβ1 (P=0.2055) had
decreased expression at 72 hours, although this did not reach statistical significance
(Figure 6.3.E-F). Similarly, Acvr2a also showed decreased expression in miR-365a-
3p transfected cells at 24 (P=0.2796), 48 (P=0.0619) and 72 hours (P=0.2796) (Figure
6.3.G).

179
Figure 6.3. qRT-PCR assessment of putative miR-365a-3p targets in BMOL cells.
Relative expression of putative miR-365a-3p targets assessed at 24 hours intervals up to 72 hours. Gene expression was compared between BMOL cells transfected with miRNA negative control and miR-365a-3p mimic (n=6) for (A) Cx3cr1, (B) Shp2, (C) Akt3, (D) Fzd2, (E) Adam17, (F) Nfkβ1 and (G) Acvr2a. Lines represent mean ± SEM. * P<.05, **P<.01 and ***P<.001 by multiple T-test with Holm-Sidak post-hoc test. Hprt was used as endogenous control for normalization.

180
6.2.1.2 Impact of miRNAs on LPC differentiation
In order to evaluate the effect of the selected miRNAs on the differentiation of LPCs,
gene expression of the cholangiocyte markers Ggt1 and Cx43, and of the hepatocyte
markers Tat and Hnf4α were assessed in six replicates by qRT-PCR. BMOL cells
transfected with let7g-5p showed a significantly decreased expression of Ggt1
(P=0.0060) at 24 hours (Figure 6.4.A) compared to the cells transfected with negative
control. No significant difference was observed in the expression of the other
cholangiocyte marker Cx43 (Figure 6.4.B). When hepatocyte markers were assessed
cells transfected with let7g-5p showed a significant decreased expression in Tat at 48
hours (P=0.0153) (Figure 6.4.C) and in Hnf4α at 24 (P=0.0288) and 72 hours
(P=0.0287) (Figure 6.4.D).

181
Figure 6.4. qRT-PCR assessment of differentiation markers on BMOL cells transfected with let7g-5p.
Relative expression of LPC differentiation markers assessed at 24 hours intervals up to 72 hours. Gene expression was compared between BMOL cells transfected with miRNA negative control and let7g-5p mimic for cholangiocyte markers (n=6): (A) Ggt1 and (B) Cx43; and for hepatocyte markers (n=6): (C) Tat and (D) Hnf4α. Lines represent mean ± SEM. * P<.05, **P<.01 and ***P<.001 by multiple T-test with Holm-Sidak post-hoc test. Hprt was used as endogenous control for normalization.
No statistical significance was observed between BMOL cells transfected with miR-
34a-5p and negative control for any of the differentiation markers (Figure 6.5). Of note,
miR-34a-5p transfected cells exhibited a trend toward increased expression of Ggt1
at 48 (P=0.6352) and 72 hours (P=0.8459) (Figure 6.5.A) as well as increased
expression of Hnf4α at 24 (P=0.5348) and 48 hours (P=0.7443) (Figure 6.5.D).

182
Figure 6.5. qRT-PCR assessment of differentiation markers on BMOL cells transfected with miR-34a-5p.
Relative expression of LPC differentiation markers assessed at 24 hours intervals up to 72 hours. Gene expression was compared between BMOL cells transfected with miRNA negative control and miR-34a-5p mimic for cholangiocyte markers (n=6): (A) Ggt1 and (B) Cx43; and for hepatocyte markers (n=6): (C) Tat and (D) Hnf4α. Lines represent mean ± SEM. Analysis made by multiple T-test with Holm-Sidak post-hoc test. Hprt was used as endogenous control for normalization.
BMOL cells transfected with miR-365a-3p showed a significant decrease in both
hepatocyte markers. Expression of Tat was decreased at 48 (P=0.0025) and 72 hours
(P=0.0220) (Figure 6.6.C), while Hnf4α exhibited decreased expression at 24
(P=0.0494), 48 (P=0.0403) and 72 hours (P=0.0232) (Figure 6.6.D). Interestingly,
miR-365a-3p transfected cells also showed a trend towards decrease expression of
Ggt1 at 24 (P=0.1098), 48 (P=0.1626) and 72 hours (P=0.1626) (Figure 6.6.A); and
of Cx43 at 48 (P=0.1507) and 72 hours (P=0.1507) (Figure 6.6.B) although this did
not reach statistical significance.

183
Figure 6.6. qRT-PCR assessment of differentiation markers on BMOL cells transfected with miR-365a-3p.
Relative expression of LPC differentiation markers assessed at 24 hours intervals up to 72 hours. Gene expression was compared between BMOL cells transfected with miRNA negative control and miR-365a-3p mimic for cholangiocyte markers (n=6): (A) Ggt1 and (B) Cx43; and for hepatocyte markers (n=6): (C) Tat and (D) Hnf4α. Lines represent mean ± SEM. * P<.05, **P<.01 and ***P<.001 by multiple T-test with Holm-Sidak post-hoc test. Hprt was used as endogenous control for normalization.
Next, the effect of let7g-5p on the expression of cholangiocyte proteins Ck19 and
acetylated α-tubulin, as well as the hepatocyte specification protein Hnf4α were
assessed in six replicates by western blot (Figure 6.7). Overall, no statistical
significance was observed between BMOL cells transfected with let7g-5p and negative
control for any of the assessed proteins. However, in let7g-5p transfected BMOL cells,
there was a time-dependent increase in the expression of Ck19 (P<0.0001 by two-
way ANOVA) (Figure 6.7.B). Conversely, the expression of the hepatocyte marker
Hnf4α (P=0.7311) was decreased at 72 hours in let7g-5p transfected BMOL cells, but
this did not reach statistical significance (Figure 6.7.D).

184
Figure 6.7. Western blot assessment of cholangiocyte and hepatocyte proteins in BMOL cells transiently transfected with let7g-5p.
Relative protein expression of cholangiocyte and hepatocyte proteins assessed at 24 hour intervals up to 72 hours. Protein expression was compared between BMOL cells transfected with miRNA negative control and let7g-5p mimic (n=6). (A) Size distribution (in kDa) of the assessed proteins. Band signal quantification for the cholangiocyte proteins (B) Ck19 and (C) acetylated α-tubulin, and for the hepatocyte protein (D) Hnf4α. Protein extracted from the hepatocyte cell line Huh7 was used as positive control in (A). Histograms represent mean ± SEM. Analysis made by multiple T-test with Holm-Sidak post-hoc test. Β-actin was used as endogenous control for normalization. Ctrl = Control; Let7g = let7g-5p; kDa = kilo Dalton; Trunc= truncated. h= hours.
6.2.1.3 Effect of miRNAs on BMOL proliferation and migration
Functional assays, performed in triplicates, were used to assess the effect of let7g-5p,
miR-34a-5p and miR-365a-3p on the proliferation and migration potential of BMOL
cells. Cells transfected with let7g-5p exhibited a significantly decreased proliferation
rate compared to negative control (P=0.0005) (Figure 6.8.A-B). Similarly, let7g-5p
significantly decreased the migration of BMOL cells compared to the negative control
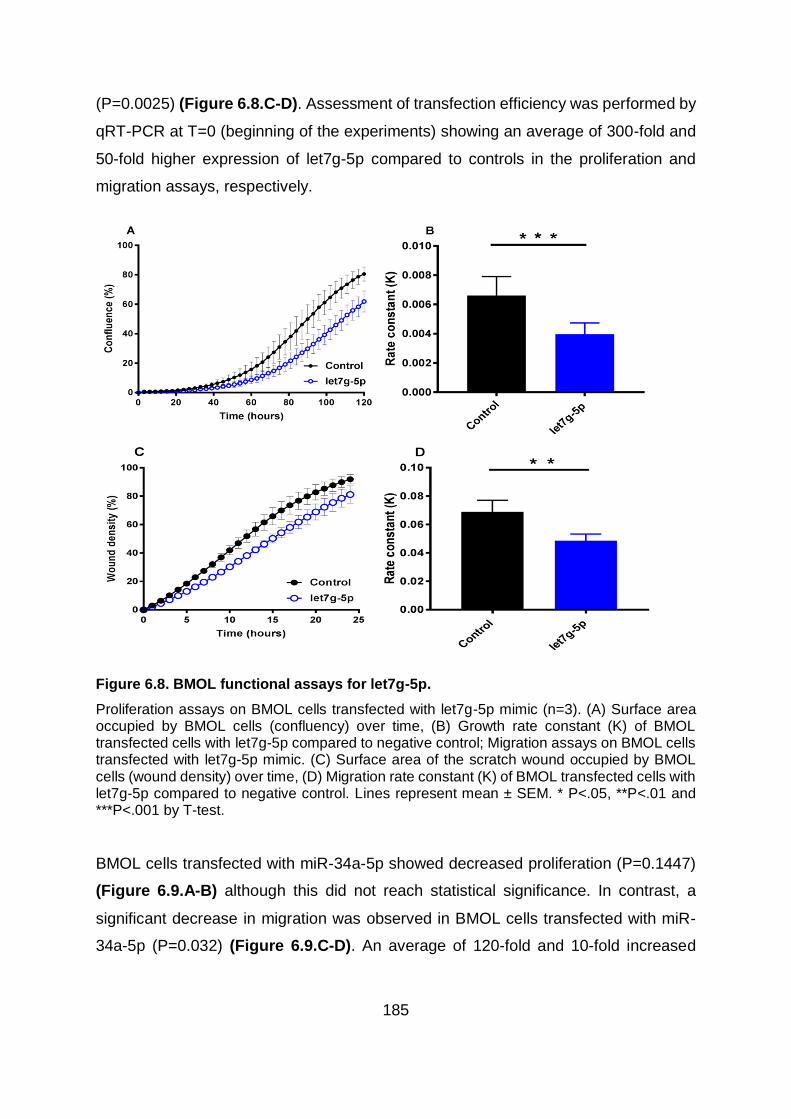
185
(P=0.0025) (Figure 6.8.C-D). Assessment of transfection efficiency was performed by
qRT-PCR at T=0 (beginning of the experiments) showing an average of 300-fold and
50-fold higher expression of let7g-5p compared to controls in the proliferation and
migration assays, respectively.
Figure 6.8. BMOL functional assays for let7g-5p.
Proliferation assays on BMOL cells transfected with let7g-5p mimic (n=3). (A) Surface area occupied by BMOL cells (confluency) over time, (B) Growth rate constant (K) of BMOL transfected cells with let7g-5p compared to negative control; Migration assays on BMOL cells transfected with let7g-5p mimic. (C) Surface area of the scratch wound occupied by BMOL cells (wound density) over time, (D) Migration rate constant (K) of BMOL transfected cells with let7g-5p compared to negative control. Lines represent mean ± SEM. * P<.05, **P<.01 and ***P<.001 by T-test.
BMOL cells transfected with miR-34a-5p showed decreased proliferation (P=0.1447)
(Figure 6.9.A-B) although this did not reach statistical significance. In contrast, a
significant decrease in migration was observed in BMOL cells transfected with miR-
34a-5p (P=0.032) (Figure 6.9.C-D). An average of 120-fold and 10-fold increased

186
expression of miR-34a-5p was observed in the proliferation and migration assays,
respectively, when transfection efficiency was assessed compared to controls at T=0.
Figure 6.9. BMOL functional assays for miR-34a-5p.
Proliferation assays on BMOL cells transfected with miR-34a-5p mimic (n=3). (A) Surface area occupied by BMOL cells (confluency) over time, (B) Growth rate constant (K) of BMOL transfected cells with miR-34a-5p compared to negative control; Migration assays on BMOL cells transfected with miR-34a-5p mimic. (C) Surface area of the scratch wound occupied by BMOL cells (wound density) over time, (D) Migration rate constant (K) of BMOL transfected cells with miR-34a-5p compared to negative control. Lines represent mean ± SEM. * P<.05, **P<.01 and ***P<.001 by T-test.
BMOL cells transfected with miR-365a-3p showed markedly decreased proliferation
(P=0.1544) (Figure 6.10.A-B) although this did not reach statistical significance,
potentially due to technical variation between the (n=3) replicates. miR-365a-3p did
not have any effect on the migration of BMOL cells compared to negative control
(P=0.8577) (Figure 6.10.C-D). miRNA transfected BMOL cells had an average of 170-
fold and 155-fold increased expression of miR-365a-3p in the proliferation and
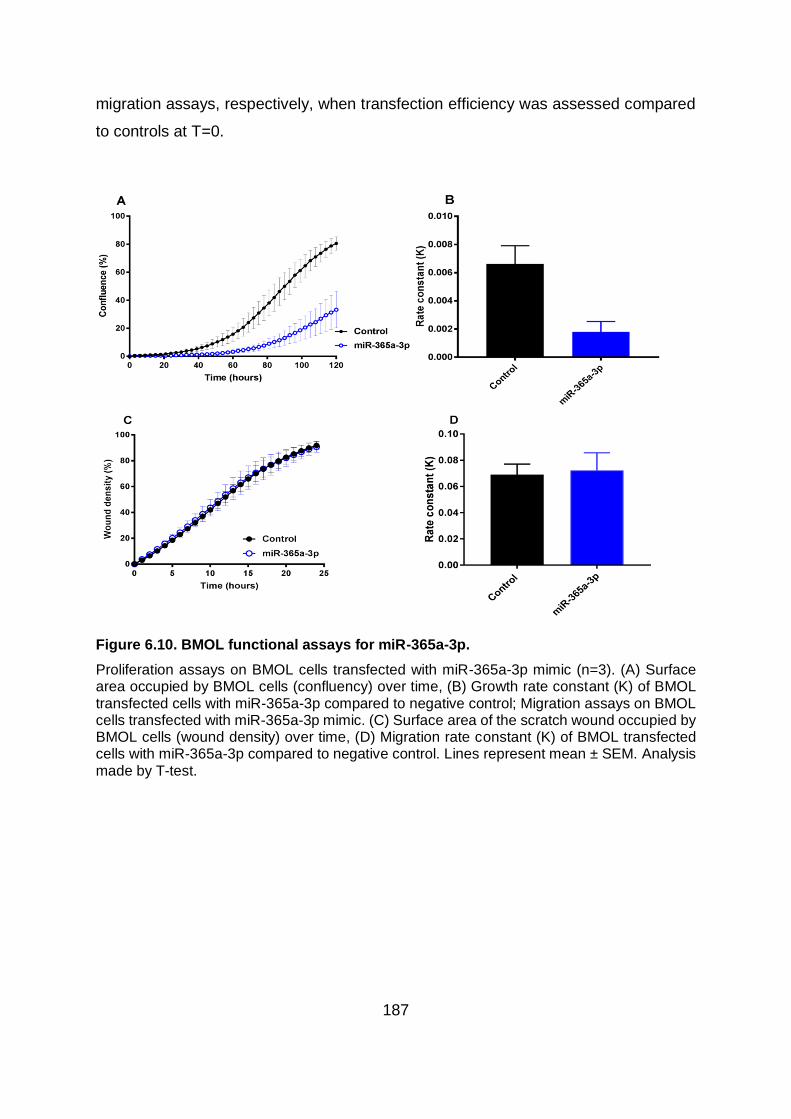
187
migration assays, respectively, when transfection efficiency was assessed compared
to controls at T=0.
Figure 6.10. BMOL functional assays for miR-365a-3p.
Proliferation assays on BMOL cells transfected with miR-365a-3p mimic (n=3). (A) Surface area occupied by BMOL cells (confluency) over time, (B) Growth rate constant (K) of BMOL transfected cells with miR-365a-3p compared to negative control; Migration assays on BMOL cells transfected with miR-365a-3p mimic. (C) Surface area of the scratch wound occupied by BMOL cells (wound density) over time, (D) Migration rate constant (K) of BMOL transfected cells with miR-365a-3p compared to negative control. Lines represent mean ± SEM. Analysis made by T-test.

188
6.2.2 HSCs
6.2.2.1 Effect of miRNAs on putative target mRNA expression
Following synthetic miRNA transfection and biotin pulldown assay to identify putative
miRNA targets in LX2 cells, seven potential targets for let7g-5p, 13 for miR-142-3p,
three for miR-34a-5p and nine for miR-365a-3p were selected (see Chapter 5, Table
5.7) to assess their gene expression by qRT-PCR. Differential expression between
miRNA negative control and miRNA mimic of interest was assessed at 24, 48 and 72
hours post-transfection in five replicates. Pair-wise comparison between miRNA
negative control and selected miRNA mimic at each time point was performed using
multiple T-test corrected with Holm-Sidak post-hoc test.
No significantly decreased expression was found on any of the selected potential
putative targets in LX2 cells transfected with let7g-5p when compared to miRNA
negative control (not shown), however, CD248 showed decreased relative expression
at 72 hours (P=0.1014) (Figure 6.11).
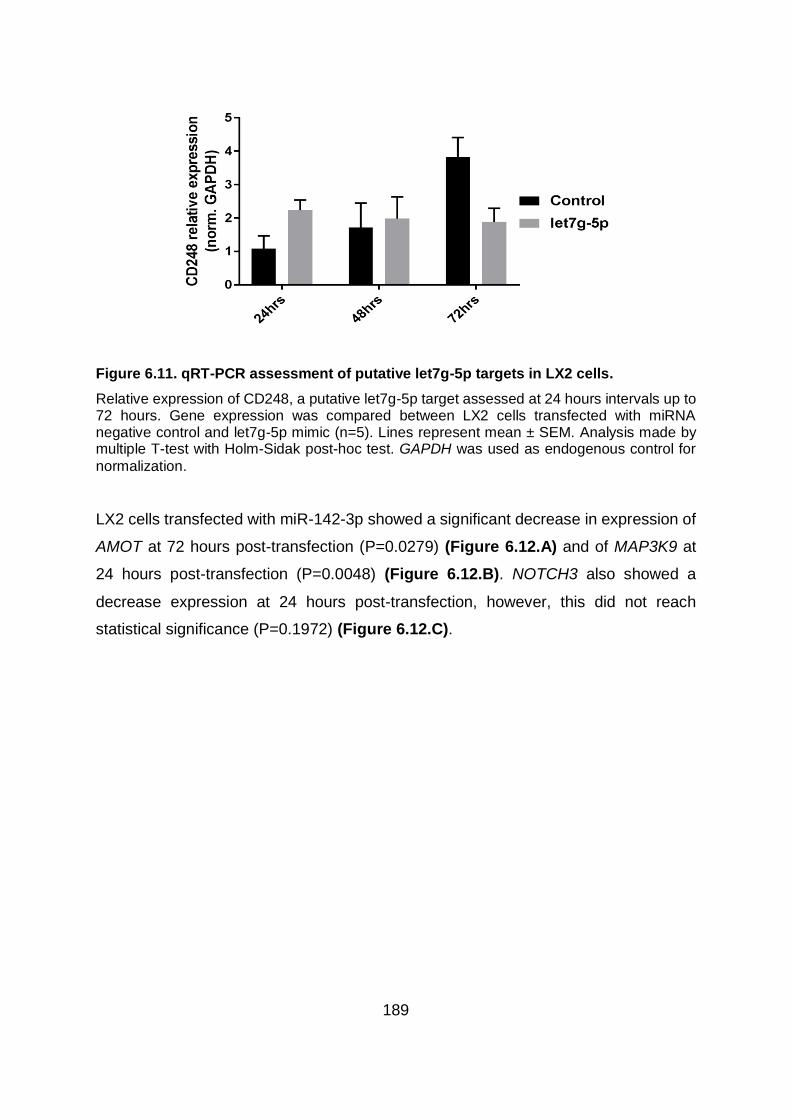
189
Figure 6.11. qRT-PCR assessment of putative let7g-5p targets in LX2 cells.
Relative expression of CD248, a putative let7g-5p target assessed at 24 hours intervals up to 72 hours. Gene expression was compared between LX2 cells transfected with miRNA negative control and let7g-5p mimic (n=5). Lines represent mean ± SEM. Analysis made by multiple T-test with Holm-Sidak post-hoc test. GAPDH was used as endogenous control for
normalization.
LX2 cells transfected with miR-142-3p showed a significant decrease in expression of
AMOT at 72 hours post-transfection (P=0.0279) (Figure 6.12.A) and of MAP3K9 at
24 hours post-transfection (P=0.0048) (Figure 6.12.B). NOTCH3 also showed a
decrease expression at 24 hours post-transfection, however, this did not reach
statistical significance (P=0.1972) (Figure 6.12.C).

190
Figure 6.12. qRT-PCR assessment of putative miR-142-3p targets in LX2 .
Relative expression of putative miR-142-3p targets assessed at 24 hours intervals up to 72 hours. Gene expression was compared between LX2 cells transfected with miRNA negative control and miR-142-3p mimic (n=5) for (A) AMOT, (B) MAP3K9 and (C) NOTCH3. Lines represent mean ± SEM. * P<.05, **P<.01 and ***P<.001 by multiple T-test with Holm-Sidak post-hoc test. GAPDH was used as endogenous control for normalization.
As with LX2 transfected with let7g-5p, none of the selected potential putative targets
for miR-34a-5p showed decreased expression in any time point post-transfection (not
shown). Nevertheless, WWC1 showed decrease expression in LX2 transfected cells
at 48 (P=0.5924) and 72 hours (P=0.7440) (Figure 6.13).

191
Figure 6.13. qRT-PCR assessment of putative miR-34a-5p targets in LX2 cells.
Relative expression of WWC1, a putative miR-34a-5p target assessed at 24 hours intervals up to 72 hours. Gene expression was compared between LX2 cells transfected with miRNA negative control and miR-34a-5p mimic (n=5). Lines represent mean ± SEM. Analysis made by multiple T-test with Holm-Sidak post-hoc test. GAPDH was used as endogenous control for normalization.
LX2 cells transfected with miR-365a-3p showed a significant decreased expression of
AMOT (P=0.0271) (Figure 6.14.A) and LATS1 (P=0.0487) (Figure 6.14.B) at 72
hours post-transfection. Decreased expression of COL4A5 was also observed at 24
hours post-transfection of miR-365a-3p, however, this decrease was not statistically
significant (P= 0.3928) (Figure 6.14.C).

192
Figure 6.14. qRT-PCR assessment of putative miR-365a-3p targets in LX2 cells.
Relative expression of putative miR-365a-3p targets assessed at 24 hours intervals up to 72 hours. Gene expression was compared between LX2 cells transfected with miRNA negative control and miR-365a-3p mimic (n=5) for (A) AMOT, (B) LATS1 and (C) COL4A5. Lines represent mean ± SEM. * P<.05, **P<.01 and ***P<.001 by multiple T-test with Holm-Sidak post-hoc test. GAPDH was used as endogenous control for normalization.
6.2.2.2 Impact of miRNA transfection on HSC activation
In order to evaluate the effect of the selected miRNAs on the processes of HSC
activation and fibrogenesis, gene expression of known activation/quiescence markers
were assessed in five replicates of transiently transfected LX2 cells by qRT-PCR. LX2
cells transfected with let7g-5p showed significant increased expression of HSC
activation markers ACTA2 (P=0.0167), TIMP3 (P=0.0164), TGFβ1 (P=0.0034) and
COL1A1 (P=0.0416) at 24 hours post-transfection. At 48 hours post–transfection
ACTA2 (P=0.0041), TIMP3 (P=0.0118), TGFβ1 (P<0.001) and COL1A2 (P=0.0023)
also showed significant increased expression compared to cells transfected with the
negative control (Figure 6.15.A-F). No significant difference was observed in the
expression of HSC quiescence markers, however, CDH1 showed a tendency towards

193
increased expression at 24 (P=0.1485), 48 (P=0.1485) and 72 hours (P=0.4606) in
cells transfected with let7g-5p compared to negative control (Figure 6.15.H).

194
Figure 6.15. qRT-PCR assessment of HSC activation and quiescence markers on LX2 cells transfected with let7g-5p.
Relative expression of HSC activation and quiescence markers assessed at 24 hours intervals up to 72 hours. Gene expression was compared between LX2 cells transfected with miRNA negative control and let7g-5p mimic for HSC activation markers (n=5): (A) ACTA2, (B) TIMP3, (C) TGFβR1, (D) TGFβ1, (E) COL1A1 and (F) COL1A2; and for HSC quiescence markers (n=5): (G) PPARγ and (H) CDH1. Lines represent mean ± SEM. * P<.05, **P<.01 and ***P<.001 by multiple T-test with Holm-Sidak post-hoc test. GAPDH was used as endogenous
control for normalization.

195
LX2 cells transfected with miR-142-3p showed significant increased expression of
HSC activation markers TGFβ1 at 24 hours (P=0.0498) and 48 hours (P=0.0498) post-
transfection (Figure 6.16.D), whereas, TGFβR1 was significantly increased at 48
hours post-transfection (P=0.0282) (Figure 6.16.C). Other HSC activation markers
showed a non-significant increase; such as ACTA2 at 24 hours (P=0.4936) and 48
hours (P=0.1879) post-transfection (Figure 6.16.A); TIMP3 at 24 hours (P=0.5634)
and 48 hours (P=0.3539) post-transfection (Figure 6.16.B) and COL1A1 at 24 hours
(P=0.6963) and 72 hours (P=0.7777) post-transfection (Figure 6.16.E). A significant
reduced expression was observed in the HSC quiescent marker PPARγ at 72 hours
(P=0.0127) post-transfection (Figure 6.16.G) in contrast to the non-significant
increased expression of CDH1 at 24 hours (P=0.2512) and 48 hours (P=0.2551) post-
transfection (Figure 6.16.H).

196
Figure 6.16. qRT-PCR assessment of HSC activation and quiescence markers on LX2 cells transfected with miR-142-3p.
Relative expression of HSC activation and quiescence markers assessed at 24 hours intervals up to 72 hours. Gene expression was compared between LX2 cells transfected with miRNA negative control and miR-142-3p mimic for HSC activation markers (n=5): (A) ACTA2, (B) TIMP3, (C) TGFβR1, (D) TGFβ1, (E) COL1A1 and (F) COL1A2; and for HSC quiescence markers (n=5): (G) PPARγ and (H) CDH1. Lines represent mean ± SEM. * P<.05, **P<.01 and ***P<.001 by multiple T-test with Holm-Sidak post-hoc test. GAPDH was used as endogenous control for normalization.

197
LX2 cells transfected with miR-34a-5p showed significant decreased expression of the
HSC activation marker COL1A1 at 24 hours (P=0.0337) post-transfection (Figure
6.17.E). Although non-significant, decreased expression of TIMP3 at 48 hours
(P=0.7836) post-transfection and 72 hours post-transfection (P=0.7836) (Figure
6.17.B); TGFβR1 at 48 hours (P=0.9520) post-transfection and 72 hours post-
transfection (P=0.9520) (Figure 6.17.C) and TGFβ1 at 48 hours (P=0.7716) post-
transfection and 72 hours post-transfection (P=0.7716) (Figure 6.17.D) was observed
in LX2 transfected cells compared to negative control. When HSC quiescent markers
were assessed, both PPARγ at 24 hours (P=0.3832) and 48 hours (P=0.3673) (Figure
6.17.G) and CDH1 at 24 hours (P=0.4316) and 48 hours (P=0.4316) (Figure 6.17.H)
were decreased in LX2 miR-34a-5p transfected cells although this did not react
statistical significance.

198
Figure 6.17. qRT-PCR assessment of HSC activation and quiescence markers on LX2 cells transfected with miR-34a-5p.
Relative expression of HSC activation and quiescence markers assessed at 24 hours intervals up to 72 hours. Gene expression was compared between LX2 cells transfected with miRNA negative control and miR-34a-5p mimic for HSC activation markers (n=5): (A) ACTA2, (B) TIMP3, (C) TGFβR1, (D) TGFβ1, (E) COL1A1 and (F) COL1A2; and for HSC quiescence markers (n=5): (G) PPARγ and (H) CDH1. Lines represent mean ± SEM. * P<.05, **P<.01 and ***P<.001 by multiple T-test with Holm-Sidak post-hoc test. GAPDH was used as endogenous control for normalization.

199
Transfected LX2 cells with miR-365a-3p showed significant increased expression of
ACTA2 at 72 hours (P=0.0142) post-transfection (Figure 6.18.A), TIMP3 at 48 hours
(P=0.0326) post-transfection (Figure 6.18.B) and TGFβ1 at 24 hours (P=0.0014), 48
hours (P=0.0149) and 72 hours (P=0.0139) post-transfection (Figure 6.18.D). A non-
significant increase of COL1A1 at 48 hours (P=0.6780) and 72 hours (P=0.6780) post-
transfection and COL1A2 at 24 hours (P=0.3667) post-transfection was observed in
miRNA transfected LX2 compared to negative control (Figure 6.18.E-F). No significant
difference was observed in HSC quiescent markers, however, PPARγ exhibited a
decreased expression at 72 hours (P=0.2747) post-transfection, whereas, CDH1
increased its expression at 48 hours (P=0.6021) and 72 hours (P=0.6021) post-
transfection (Figure 6.18.G-H).
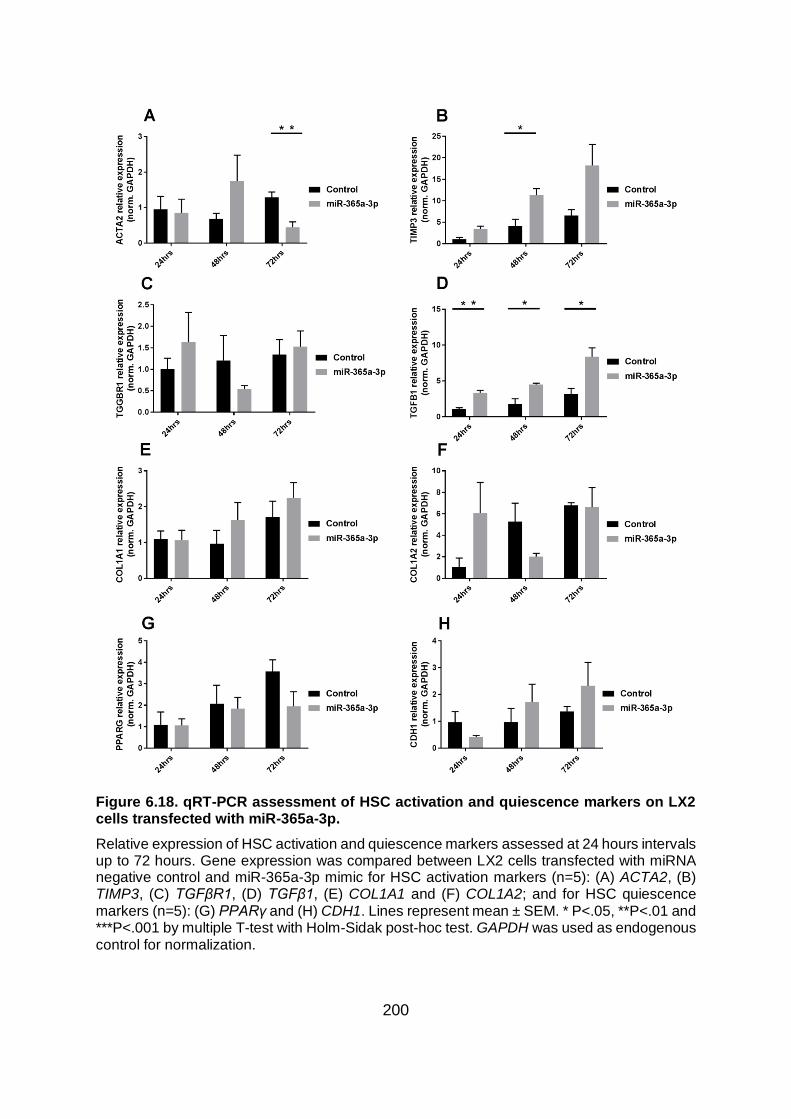
200
Figure 6.18. qRT-PCR assessment of HSC activation and quiescence markers on LX2 cells transfected with miR-365a-3p.
Relative expression of HSC activation and quiescence markers assessed at 24 hours intervals up to 72 hours. Gene expression was compared between LX2 cells transfected with miRNA negative control and miR-365a-3p mimic for HSC activation markers (n=5): (A) ACTA2, (B) TIMP3, (C) TGFβR1, (D) TGFβ1, (E) COL1A1 and (F) COL1A2; and for HSC quiescence markers (n=5): (G) PPARγ and (H) CDH1. Lines represent mean ± SEM. * P<.05, **P<.01 and ***P<.001 by multiple T-test with Holm-Sidak post-hoc test. GAPDH was used as endogenous control for normalization.
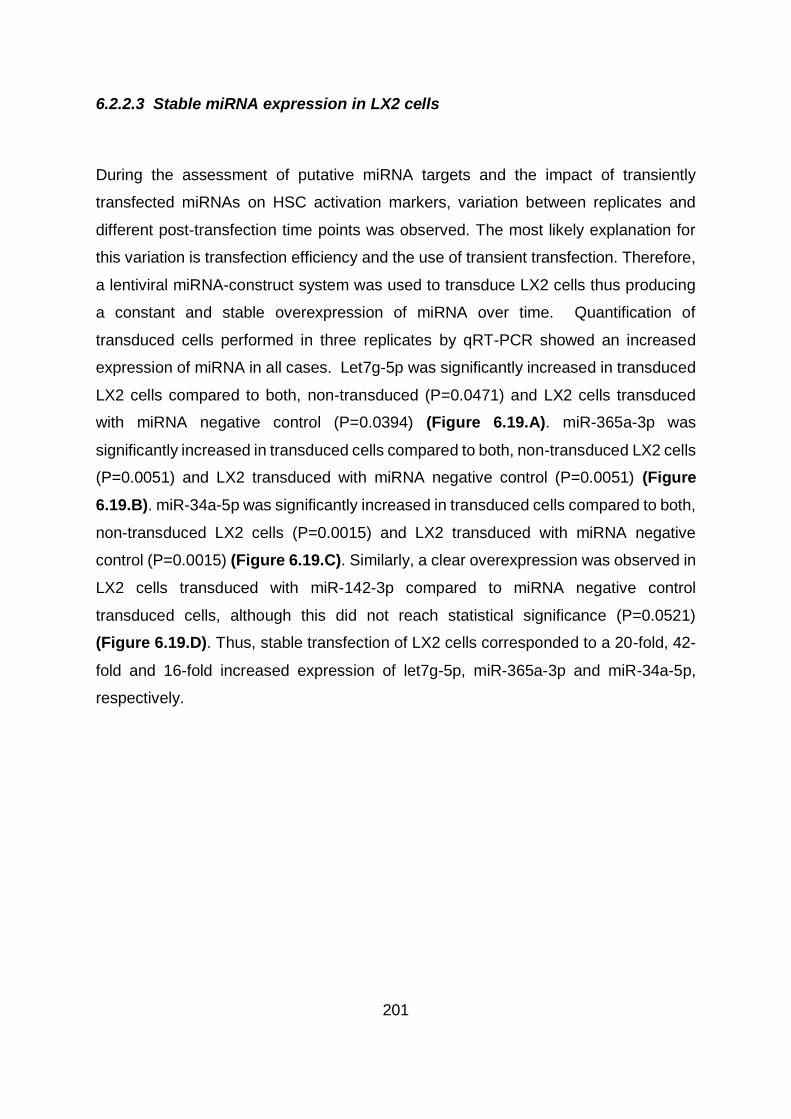
201
6.2.2.3 Stable miRNA expression in LX2 cells
During the assessment of putative miRNA targets and the impact of transiently
transfected miRNAs on HSC activation markers, variation between replicates and
different post-transfection time points was observed. The most likely explanation for
this variation is transfection efficiency and the use of transient transfection. Therefore,
a lentiviral miRNA-construct system was used to transduce LX2 cells thus producing
a constant and stable overexpression of miRNA over time. Quantification of
transduced cells performed in three replicates by qRT-PCR showed an increased
expression of miRNA in all cases. Let7g-5p was significantly increased in transduced
LX2 cells compared to both, non-transduced (P=0.0471) and LX2 cells transduced
with miRNA negative control (P=0.0394) (Figure 6.19.A). miR-365a-3p was
significantly increased in transduced cells compared to both, non-transduced LX2 cells
(P=0.0051) and LX2 transduced with miRNA negative control (P=0.0051) (Figure
6.19.B). miR-34a-5p was significantly increased in transduced cells compared to both,
non-transduced LX2 cells (P=0.0015) and LX2 transduced with miRNA negative
control (P=0.0015) (Figure 6.19.C). Similarly, a clear overexpression was observed in
LX2 cells transduced with miR-142-3p compared to miRNA negative control
transduced cells, although this did not reach statistical significance (P=0.0521)
(Figure 6.19.D). Thus, stable transfection of LX2 cells corresponded to a 20-fold, 42-
fold and 16-fold increased expression of let7g-5p, miR-365a-3p and miR-34a-5p,
respectively.

202
Figure 6.19. Transduction of LX2 cells using lentivirus miRNA constructs.
Quantification of miRNA in LX2 transduced cells using lentiviral miRNA-constructs (n=3) for (A) let7g-5p, (B) miR-365a-3p, (C) miR-34a-5p and (D) miR-142-3p. Lines represent mean ± SEM. * P<.05, **P<.01 and ***P<.001 by by ANOVA with Tukey post-hoc test. RNU6 was used as endogenous control for normalization. LX2 = non-transduced LX2 cells. Lenti NegCtrl = LX2 cells transduced with miRNA negative control. Lenti miR = LX2 cells transduced with miRNA of interest.
6.2.2.4 Effect of stably transfected miRNAs on LX2 proliferation and migration
Functional assays, performed in triplicate on LX2 transduced cells, were used to
assess the effect of let7g-5p, miR-142-3p, miR-34a-5p and miR-365a-3p on
proliferation and migration of LX2 cells. No significant difference was observed in the
proliferation of LX2 cells transduced with let7g-5p (P=0.4672) (Figure 6.20.A-B). In
contrast, let7g-5p significantly decreased the migration of LX2 cells compared to
negative control (P=0.0152) (Figure 6.20.C-D).

203
Figure 6.20. LX2 functional assays for let7g-5p.
Proliferation assays on LX2 cells transduced with let7g-5p (n=3). (A) Surface area occupied by LX2 cells (confluency) over time, (B) Growth rate constant (K) of LX2 transduced with let7g-5p compared to negative control; Migration assays on LX2 cells transduced with let7g-5p. (C) Surface area of the scratch wound occupied by LX2 cells (wound density) over time, (D) Migration rate constant (K) of LX2 transduced cells with let7g-5p compared to negative control. Lines represent mean ± SEM. * P<.05, **P<.01 and ***P<.001 by T-test.
LX2 cells transduced with miR-142-3p showed significantly decreased proliferation
compared to the negative control (P=0.0413) (Figure 6.21.A-B). Similarly, decreased
migration was observed in LX2 cells overexpressing miR-142-3p although this did not
reach statistical significance (P=0.2058) (Figure 6.21.C-D).

204
Figure 6.21. LX2 functional assays for miR-142-3p.
Proliferation assays on LX2 cells transduced with miR-142-3p (n=3). (A) Surface area occupied by LX2 cells (confluency) over time, (B) Growth rate constant (K) of LX2 transduced with miR-142-3p compared to negative control; Migration assays on LX2 cells transduced with miR-142-3p. (C) Surface area of the scratch wound occupied by LX2 cells (wound density) over time, (D) Migration rate constant (K) of LX2 transduced cells with miR-142-3p compared to negative control. Lines represent mean ± SEM. * P<.05, **P<.01 and ***P<.001 by T-test.
No significant difference was observed in LX2 cells transduced with miR-34a-5p for
either proliferation (P=0.1463) or migration (P=0.8293) when compared to the negative
control (Figure 6.22).

205
Figure 6.22. LX2 functional assays for miR-34a-5p.
Proliferation assays on LX2 cells transduced with miR-34a-5p (n=3). (A) Surface area occupied by LX2 cells (confluency) over time, (B) Growth rate constant (K) of LX2 transduced with miR-34a-5p compared to negative control; Migration assays on LX2 cells transduced with miR-34a-5p. (C) Surface area of the scratch wound occupied by LX2 cells (wound density) over time, (D) Migration rate constant (K) of LX2 transduced cells with miR-34a-5p compared to negative control. Lines represent mean ± SEM. Analysis made by T-test.
In LX2 cells transduced with miR-365a-3p, no difference was observed in proliferation
(P=0.8702) (Figure 6.23.A-B), however, LX2 cells showed decrease migration
compared to controls, although this difference was not statistically significant
(P=0.1444) (Figure 6.23.C-D).

206
Figure 6.23. LX2 functional assays for miR-365a-3p.
Proliferation assays on LX2 cells transduced with miR-365a-3p (n=3). (A) Surface area occupied by LX2 cells (confluency) over time, (B) Growth rate constant (K) of LX2 transduced with miR-365a-3p compared to negative control; Migration assays on LX2 cells transduced with miR-365a-3p. (C) Surface area of the scratch wound occupied by LX2 cells (wound density) over time, (D) Migration rate constant (K) of LX2 transduced cells with miR-365a-3p compared to negative control. Lines represent mean ± SEM. Analysis made by T-test.
6.2.2.5 Effect of stable transfection with either let7g-5p or miR-365a-3p on HSC
activation.
In order to confirm the observed effects of transiently transfected miRNAs on HSC
activation, LX2 stably transduced cells overexpressing let7g-5p or miR-365a-3p were
selected to assess the expression of HSC activation markers (in triplicate) by qRT-
PCR. Transduced LX2 cells overexpressing let7g-5p showed significantly increased
expression of TIMP3 (P=0.0033), TGFβR1 (P=0.0391), COL1A1 (P=0.0164) and
COL1A2 (P=0.0337) (Figure 6.24.B-C,E-F). ACTA2 (P=0.1317) and TGFβ1
(P=0.8341) also showed increased expression although this did not reach statistical
significance (Figure 6.24.A-D).

207
Figure 6.24. qRT-PCR assessment of HSC activation markers on LX2 cells transduced with let7g-5p.
Relative expression of HSC activation markers. Gene expression was compared between LX2 cells transduced with miRNA negative control vs. let7g-5p (n=3). (A) ACTA2, (B) TIMP3, (C) TGFβR1, (D) TGFβ1, (E) COL1A1 and (F) COL1A2. Lines represent mean ± SEM. * P<.05, **P<.01 and ***P<.001 by T-test. GAPDH was used as endogenous control for normalization. Lenti NegCtrl = LX2 cells transduced with miRNA negative control. Lenti let7g-5p = LX2 cells transduced with let7g-5p.
Transduced LX2 cells overexpressing miR-365a-3p showed significantly increased
expression of TGFβR1 (P=0.0100), COL1A1 (P=0.0156) and COL1A2 (P=0.0359)
(Figure 6.25.C, E-F). ACTA2 (P=0.2205), TIMP3 (P=0.4015) and TGFβ1 (P=0.7485)
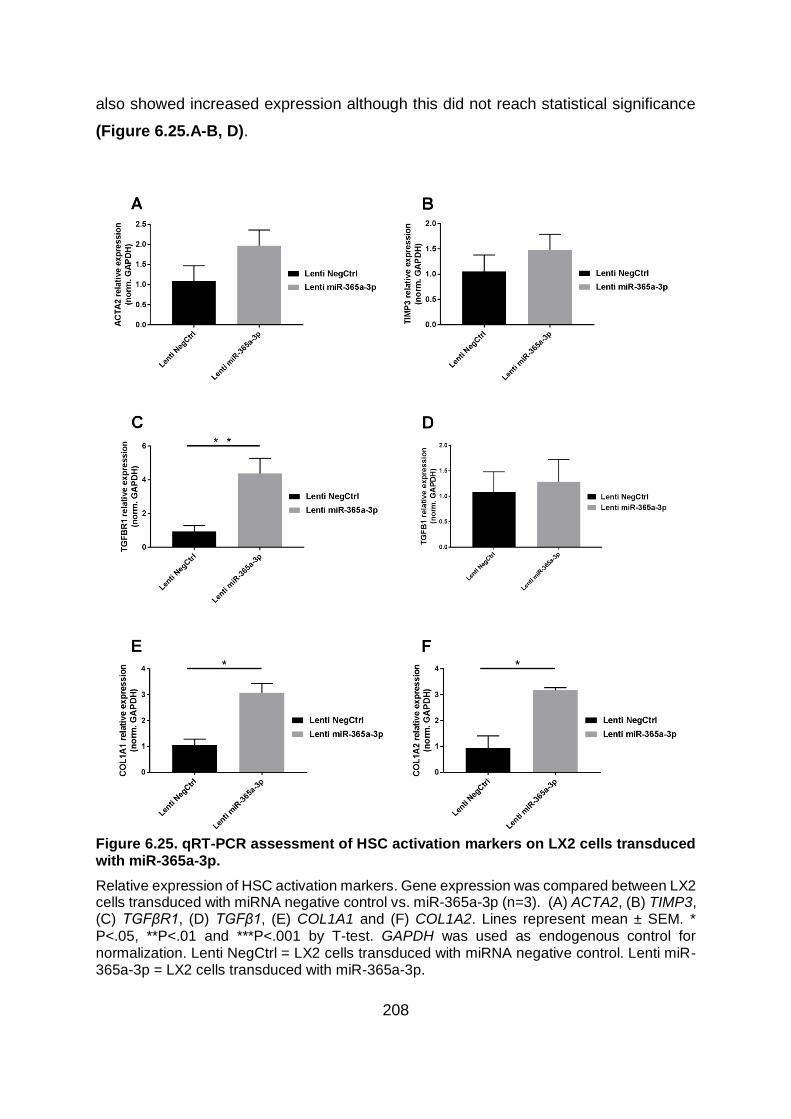
208
also showed increased expression although this did not reach statistical significance
(Figure 6.25.A-B, D).
Figure 6.25. qRT-PCR assessment of HSC activation markers on LX2 cells transduced with miR-365a-3p.
Relative expression of HSC activation markers. Gene expression was compared between LX2 cells transduced with miRNA negative control vs. miR-365a-3p (n=3). (A) ACTA2, (B) TIMP3, (C) TGFβR1, (D) TGFβ1, (E) COL1A1 and (F) COL1A2. Lines represent mean ± SEM. * P<.05, **P<.01 and ***P<.001 by T-test. GAPDH was used as endogenous control for normalization. Lenti NegCtrl = LX2 cells transduced with miRNA negative control. Lenti miR-365a-3p = LX2 cells transduced with miR-365a-3p.

209
6.2.2.6 Validation of putative pulldown targets of let7g-5p and miR-365a-3p
involved in HSC activation.
The overexpression of let7g-5p and miR-365a-3p increased the expression of several
HSC activation markers, especially those involved in the collagen synthetic pathway
associated with fibrosis, as described above. These activation markers have not been
described as targets for let7g-5p or miR-365a-3p in any previous experimental study
or predictive algorithms. Therefore, based on the identified putative targets obtained
for these miRNAs (see Chapter 5), IPA was used to construct a network model of
putative targets that are reported transcription factors for the HSC activation markers
assessed in this study. Subsequently, a number of putative targets were then selected
for further validation by luciferase reporter assay based on fold change, P-value and
relevant previously published information. For let7g-5p, EP300, GATA4 and SP1 were
selected for further validation (Table 6.1 and Figure 6.26). Similarly, for miR-365a-3p,
NUPR1, RFXAP, RFX5, CD109, DDX5 and SP1 were selected for further validation
(Table 6.2 and Figure 6.27).
Table 6.1. Let7g-5p putative targets mediating HSC activation markers.
Putative target FC P-value Potential role
EP300 1.67 4.94x10⁻¹³ Inhibits collagen
GATA4 1.83 2.62x10⁻⁸ Inhibits collagen
SP1 1.61 1.06x10⁻⁹ Transcription factor mediating
genes involved in fibrogenesis
Let7g-5p putative targets with direct interactions to HSC activation markers selected for validation by luciferase activity assay. FC = fold change; EP300 = E1A Binding protein P300; GATA4 = GATA binding protein 4; SP1 = Specificity protein 1.

210
Table 6.2. miR-365a-3p putative targets mediating HSC activation markers.
Putative target FC P-value Potential role
NUPR1 2.87 2.53x10⁻⁶ Inhibits collagen
RFXAP 2.81 1.49x10⁻⁵ Inhibits collagen
RFX5 2.07 3.92x10⁻⁴ Inhibits collagen
CD109 2.43 0.0019 Regulates TGFβ signalling
DDX5 2.85 1.92x10⁻⁶ Regulates TGFβ signalling
SP1 2.27 9.84x10⁻⁵ Transcription factor mediating
genes involved in fibrogenesis
miR-365a-3p putative targets with direct interactions to HSC activation markers selected for validation by luciferase activity assay. FC = fold change; NUPR1 = Nuclear protein 1; RFXAP = Regulatory factor X associated protein; RFX5 = Regulatory factor X5; CD109 = CD109 molecule; DDX5 = DEAD-Box helicase 5; SP1 = Specificity protein 1.
211
Figure 6.26. Let7g-5p pulldown putative targets interacting with genes associated with HSC activation.
Network model showing putative targets of let7g-5p identified during the biotin pulldown assay (see Chapter 5). HSC activation markers used in this chapter are highlighted in blue. Selected putative targets for validation by luciferase reporter assay are highlighted in purple.

212
Figure 6.27. miR-365a-3p pulldown putative targets interacting with genes associated with HSC activation.
Network model showing putative targets of miR-365a-3p identified during the biotin pulldown assay (see Chapter 5). HSC activation markers used in this chapter are highlighted in blue. Selected putative targets for validation by luciferase reporter assay are highlighted in purple.
Dual luciferase reporter assay showed a 34-fold significant decrease for GATA4
(P=0.0389), 12-fold significant decrease for SP1(a) (P=0.0013) and 58-fold significant
decrease for SP1(b) (P=0.1964) in relative luciferase activity for LX2 cells co-

213
transfected with let7g-5p (Figure 6.28.B,D-E), demonstrating that these genes are
definitive targets of let7g-5p. In contrast, no significant difference was observed in the
relative luciferase activity of EP300 in LX2 cells co-transfected with miRNA negative
control or let7g-5p mimic (Figure 6.28.C). LX2 cells co-transfected with miR-365a-3p
showed a 42-fold, 66-fold, 26-fold, 4-fold, 18-fold, 31-fold and 27-fold significant
decrease in relative luciferase activity for NUPR1 (P=0.0147), RFXAP (P=0.0103),
RFX5 (P=0.0130), Sp1 (a) (P=0.0003), SP1 (b) (P=0.0018), CD109 (a) (P=0.0461)
and DDX5 (P=0.0032), respectively (Figure 6.29.B-G,I), identifying these genes as
definitive targets of miR-365a. No significant difference was observed in the luciferase
activity of CD109 (b) (P=0.8310) transfected with miR-365a-3p compared to miRNA
negative control mimic (Figure 6.29.H). Of note, due to the large size of their 3’UTR
region, SP1 and CD109 were cloned into two separate pEZX-MT06 luciferase reporter
vectors.

214
Figure 6.28. Dual luciferase assay of validated LX2 let7g-5p targets.
LX2 cells were co-transfected with miRNA negative control or let7g-5p mimic and pEZ-MT06 luciferase construct (n=6). (A) empty; or containing the 3’UTR region of (B) GATA4, (C) EP300, (D-E) SP1. Due to the size of SP1 3’UTR region, it was cloned in two different constructs. Lines represent mean ± SEM. * P<.05, **P<.01 and ***P<.001 by T-test. Luciferase activity was normalized to Renilla activity.

215
Figure 6.29. Dual luciferase assay of validated LX2 miR-365a-3p targets.
LX2 cells were co-transfected with miRNA negative control or miR-365a-3p mimic and pEZ-MT06 luciferase construct (n=6). (A) empty; or containing the 3’UTR region of (B) NUPR1, (C) RFXAP, (D) RFX5, (E-F) SP1, (G-H) CD109 and (I) DDX5. Due to the size of SP1 and CD109 3’UTR region, they were cloned in two different constructs. Lines represent mean ± SEM. * P<.05, **P<.01 and ***P<.001 by T-test. Luciferase activity was normalized to Renilla activity.
216
6.3 DISCUSSION
Several studies have explored the role of miRNAs in the context of chronic liver
disease and their potential implication in either fibrogenesis or its progression
(reviewed elsewhere (248, 385). miRNAs finely tune rather than completely repress
the expression of their target genes (163); this characteristic along with their
ubiquitous expression in every cell and involvement in the regulation of multiple
signalling pathways show their importance as regulators of cellular and tissue
homeostasis. However, studying how miRNAs exert their regulatory effects is
challenging as several miRNAs can target the same gene, one miRNA can target
several members of the same pathway and some effects can be the product of indirect
regulation. Moreover, due to the varied mechanisms by which miRNAs repress their
respective targets decreased gene expression measured by qRT-PCR is not enough
to identify miRNA targets. miRNAs can either induce mRNA degradation or inhibit its
translation, thus additional confirmation through luciferase reporter assays or western
blot are necessary in targets repressed by translation inhibition. Therefore, this chapter
expands on the previous findings of Chapter 5 where putative LPC and HSC targets
for let7g-5p, miR-142-3p, miR-34a-5p and miR-365a-3p were identified using biotin
pulldown assay.
6.3.1 LPCs
mRNA expression levels of putative targets for let7g-5p, miR-34a-5p and miR-365a-
3p were assessed by qRT-PCR in the murine LPC line, BMOL, that were transiently
transfected for each specific miRNA. In the case of BMOL cells, it was decided not to
use miR-142-3p due to the low numbers of putative targets identified in the biotin
pulldown assay compared to putative targets identified in LX2 cells, which suggests
that miR-142-3p does not play a specific role in LPCs (See Chapter 5).

217
BMOL cells transfected with let7g-5p showed significant decreased expression of
Rock1, Hnf4α and Ep300 (Figure 6.1), whereas miR-365a-3p showed significant
decreased expression in Cx3cr1, Ptpn11, Akt3 and Fzd2 (Figure 6.3). Rock1 is a
serine/threonine kinase that constitutes one of the two members of the Rock family.
The Rock family is a major downstream effector of the small GTPase RhoA that play
an important role in cytoskeleton organization including matrix deposition and
degradation (386). Increased expression of Rock1 has been described in
hepatocellular carcinoma or breast cancer (386, 387). Rock1 is also part of the VEGF
signalling pathway by which LPCs influence HSCs (388), suggesting a potential role
of let7g-5p in the crosstalk between LPCs and HSCs during fibrogenesis. Hnf4α is a
transcription factor that affects liver specific target genes and other liver-enriched
transcription factors (389). The main role of Hnf4α is to maintain the hepatocyte
phenotype, supported by the high number of genes expressed in the liver with binding
sites for Hnf4α which makes it a global regulator in the liver (390). The decreased
expression of Hnf4α in BMOL cells transfected with let7g-5p, suggests a potential role
of let7g-5p in regulating LPC differentiation, favouring the cholangiocyte lineage.
Ep300 is a histone acetyltransferase and acts as a transcriptional regulator and co-
activator in different signalling pathways (391). Ep300 has been described as both a
tumour suppressor and an oncogene (392, 393). Ep300 is a member of the
Lymphotoxin β (LT-β) pathway, thus potentially important in the context of LPC biology
and the ductular reaction (388). LT-β expressed on LPCs interacts with the LT-β
receptor on HSCs which triggers a proinflamatory cascade that contributes to
fibrogenesis (381). Decreased expression of Ep300 in BMOLs mediated by let7g-5p
suggests a potential negative regulatory effect on fibrogenesis. Cx3cr1, the chemokine
receptor of Cx3cl1, is expressed in several liver cells including hepatocytes, HSCs and
Kupffer cells (394-396). Cx3cl1-Cx3cr1 interaction has a functional effect on migration
and homeostasis (397, 398). Furthermore, a deficiency of Cx3cr1 has been reported
to increase liver inflammation and fibrosis by regulating the TNFα pathway (394, 399).
It has been hypothesised that the expression of Cx3cl1 by LPCs and ductular reaction
cells promotes chemotaxis of macrophages that contributes to the activation of HSCs
and the establishment of fibrosis (359). This suggests a potential role for miR-365a in
cell-cell communication within the LPC niche by targeting Cx3cr1. Ptpn11 is a tyrosine
phosphatase which has been shown to play an important role in the early phase of
218
liver regeneration, migration, proliferation or apoptosis (400-402). Ptpn11 is a
downstream effector of the LT-β pathway and as such, miR-365a could have a
regulatory effect on fibrogenesis via this pathway. Akt3 is a serine/threonine kinase
involved in several cellular processes including apoptosis, cell proliferation and
migration (403). Akt3 is downstream of EGF which has been shown to maintain LPC
niche activation (388) suggesting a potential role for miR-365a in LPC-mediated
fibrogenesis. Fd2 is a seven-transmembrane receptor of the Wnt5a/b ligand which
forms part of the non-canonical Wnt signalling pathway (404). Wnt5a has been shown
to be upregulated in liver fibrosis (405, 406), mediated by the induction of TGFβ (407)
and it has been proposed to play an important role in non-canonical Wnt signalling
through Fzd2 and in the development of liver fibrosis (406). Thus, this suggests a
potential regulatory role of miR-365a in the LPC niche in the development of fibrosis
during CFLD.
During chronic liver injury when hepatocyte-mediated regeneration is impaired, LPCs
are induced to proliferate and can differentiate in either hepatocytes or cholangiocytes
where the subsequent formation of reactive bile ducts contribute to the appearance of
the ductular reaction and fibrosis (408). Therefore, the effect of let7g-5p, miR-34a-5p
and miR-365a-3p on LPC differentiation was assessed by measuring the mRNA
expression levels of cholangiocyte markers Ggt1 and Cx43; and hepatocyte markers
Hnf4α and Tat. BMOL cells transfected with let7g-5p showed a significant decrease in
the expression of hepatocyte specific markers Tat and Hnf4α (Figure 6.4.C-D).
Interestingly, let7g-5p also decreased the expression levels of Ggt1, an enzyme
expressed and secreted by functional cholangiocytes (Figure 6.4.A), suggesting that
let7g-5p may play a role in LPCs differentiation. In order to further clarify the role of
let7g-5p in LPCs differentiation; hepatocyte and cholangiocyte markers were also
assessed at a protein level. Transient transfection of let7g-5p induced a significant
increase in the time-dependent expression of the cholangiocyte specific structural
protein Ck19 (Figure 6.7.B), but had no significant effect on acetylated α-tubulin. In
contrast, the expression of the hepatocyte specification protein HNF4α was decreased
after 72hrs, although this did not reach statistical significance (Figure 6.7.C-D). An
interesting observation remains that BMOL cells transfected with let7g-5p showed a

219
decreased expression of both hepatocyte and cholangiocyte specific genes/proteins
(apart from CK19 which was increased). A possible explanation is that let7g-5p might
have an effect in maintaining the stem phenotype or stemnness of LPCs. Stem cells
have two important properties: self-renewal while maintaining an undifferentiated
status and the potential to differentiate into specific cell types (409). Many pathways
including Wnt, TGFβ or FGF have been implicated as regulators that control
differentiation of stem cells by modulating lineage commitment (410). This suggests
that let7g-5p could be regulating one or more of these pathways maintaining LPCs in
an undifferentiated state, although further experimental work is necessary to confirm
the effect of let7g-5p on LPCs differentiation. A decrease in the mRNA levels of the
hepatocyte differentiation markers Hnf4α and Tat was also observed in BMOL cells
transfected with miR-365a-3p (Figure 6.6.C-D), once again suggesting an effect
favouring the differentiation of LPCs towards a cholangiocyte type phenotype.
After chronic injury, the LPC response can be characterized in four distinctive phases:
activation, proliferation, migration and differentiation (411). BMOLs transfected with
let7g-5p showed a significant decrease in both proliferation (Figure 6.8.A-B) and
migration (Figure 6.8.C-D) suggesting, perhaps, an effect towards the end of the LPC
response to chronic liver disease. As the work described in this thesis is among the
first to assess the role of these miRNAs in LPC biology, further extensive investigation
into the mechanisms involved in regulating LPC differentiation are required.
6.3.2 HSCs
mRNA expression levels of putative targets of let7g-5p, miR-142-3p, miR-34a-5p and
miR-365a-3p were assessed by qRT-PCR in LX2 cells transiently transfected for each
specific miRNA. A significant decreased expression in the levels of MAP3K9 and
AMOT for miR-142 (Figure 6.12.A-B) and AMOT and LATS1 for miR-365a (Figure
6.14.A-B) transfected LX2 cells was observed. MAP3K9 is a serine/threonine kinase
member of the mixed lineage kinases family that regulate the activity of MAPKs (412).
MAP3K9 is an important component of the JNK transduction pathway (413) acting as

220
an upstream activator of the MKK/JNK cascade that activates JNK (414). It has been
shown that JNK promotes HSC activation (376, 377), moreover, JNK in HSCs but not
in hepatocytes enhance fibrosis in murine animal models (415, 416). This suggests a
potential role of miR-142 in fibrosis by regulating the activation of JNK through
MAP3K9. AMOT is a member of the angiomotin protein family (417, 418) that regulate
YAP and LATS in the Hippo signalling pathway (419, 420). The regulatory
mechanisms of AMOT are not fully understood (421) as it has been described as both
a stimulator (422) and suppressor of YAP (423). LATS1 is a kinase with a key
regulatory role by phosphorylating YAPS which increase its cytoplasmic retention and
proteasome-mediated degradation (424, 425) and as such, together with AMOT, is a
key component of the Hippo signalling pathway. The Hippo pathway intervenes in
several cellular functions such as organ growth and stem cell development of cancer
progression (426, 427). The cascade of kinase activity of this pathway results in the
phosphorylation and inactivation of YAP1. YAP1 has a critical role in the activation of
HSCs with animal model experiments showing improvement in liver fibrosis when
YAP1 is inhibited (428, 429). This suggests a potential regulatory role for miR-142 and
miR-365a in the Hippo pathway by targeting AMOT and LATS1 which contributes to
the activation of HSCs. It is also possible, that the role of AMOT as a promoter or
inhibitor of YAP could be partially controlled by the activity of a specific miRNA, with
miR-142 promoting the inactivation of YAP1 in CFnoLD children, while miR-365a
activates it in children with CFLD, although this speculatory and would require further
extensive investigation to fully elucidate the mechanisms involved.
Transient transfection of HSCs with miRNAs resulted in significantly increased mRNA
expression of HSC activation markers ACTA2, TIMP3, TGFβ1, COL1A1 and COL1A2
when transfected with let7g-5p (Figure 6.15); TGFβ1 and TGFβR1 with miR-142-3p
(Figure 6.16); COL1A1 with miR-34a-5p (Figure 6.17); and ACTA2, TIMP3 and
TGFβ1 with miR-365a-3p (Figure 6.18). In contrast, only miR-142-3p transfected LX2
cells showed significant decrease of the HSC quiescence marker PPARγ (Figure
6.16). qRT-PCR expression data used to assess putative targets and effect of
overexpressed miRNAs on HSC activation showed a high variation between replicates
and inconsistent effects over time, probably due to differing transfection efficiencies
221
and the use of a transient transfection system. Therefore, it was decided to induce
stable overexpression of the miRNAs in LX2 cells using a miRNA lentiviral construct.
This transduction of LX2 cells resulted in a clear overexpression of miRNA in the cells
transduced with the lenti-miRNA vector compared to cells transduced with lenti-
negative miRNA vector (Figure 6.19). Stable over-expressing LX2 cells were used for
the remaining functional assays.
Chronic liver injury causes HSCs to transactivate from a quiescent phenotype to
activated myofibroblasts that are highly proliferative, contractile (hence motile),
fibrogenic and chemotactic (378). As a result of stable transfection (transduction) of
LX2 cells with miR-142-3p, there was a significant decrease in the proliferation rate
(Figure 6.21.A-B). Decreased migration was observed in LX2 cells transduced with
let7g-5p (Figure 6.20.C-D) and while miR-365-5p also inhibited migration, this was
not statistically significant but with further replicates may prove to be a real effect
(Figure 6.23.C-D). If considered together with their effect on the increased expression
of several collagen synthetic pathway markers, it could be postulated that let7g-5p and
miR-365a-3p may play a role in immobilised HSCs at the site of injury where they
synthesise increased levels of ECM characteristic of hepatic fibrosis, although again
this speculation would require further functional validation in future studies
Further assessment of HSC activation markers in let7g-5p and miR-365a-3p was
performed on transduced LX2 cells to validate their effect on cells stably over-
expressing these miRNAs. As expected, the results obtained using transient
transfection (Figure 6.24; Figure 6.25) were replicated using stable transfection of
miRNAs, confirming a role of let7g-5p and miR-365a-3p in promoting HSC activation.
Pathway analysis was performed to identify putative targets for let7g-5p and miR-
365a-3p with a direct interaction in regulating these HSC activation markers (Figure
6.26; Figure 6.27). From all the possible targets three transcription factors were
selected for validation in let7g-5p transduced LX2 cells: GATA4, EP300 and SP1,
whereas six transcription factors were selected in miR-365a-3p transduced cells:
NUPR1, RFXAP, RFX5, SP1, CD109 and DDX5. GATA4 is a zinc finger transcription
factor member of the GATA family comprising two subfamilies: GATA 1, 2 and 3

222
expressed in hematopoietic stem cells and neurons; and GATA 4, 5 and 6 expressed
in mesodermal and endodermal tissues (430). Several studies have reported a
regulatory role of the GATA family in pathways such as TGFβ, Rho or VEGF (431,
432). GATA4 shares a consensus sequence with the interferon regulatory transcription
factor of the unique open chromatin site of the COL1A2 gene which inhibits its
transcription (433, 434). As stated above, EP300 is a histone acetyltransferase
transcriptional regulator which has been reported to act as a mediator in the inhibition
of collagen through several pathways in fibroblast-type cells including HSCs (435-
437). SP1 is a zinc finger transcription factor member of the SP/KLF family that binds
to GC-motifs of several promoters (438, 439). It has been described in the regulation
of several cellular processes including proliferation or cell growth and cancer (440,
441). SP1 has been shown to be greatly increased in activated HSCs mediating the
expression of several fibrotic genes. When binding of SP1 to the promoter region of
genes is effectively blocked, proteins such as cyclin D1, TGFβ1, α-SMA or COL1A1
are decreased in HSC, providing evidence of its important role in HSC activation (442).
NUPR1 or P8 is a nuclear helix-loop-helix protein which is a stress response molecule
associated to several functions such as transcriptional regulation, cell cycle or
apoptosis (443-445). NUPR1 acts as a co-regulator for several transcription factors
including P300 or FoxO3 (444, 446). Although few studies have explored its role in the
liver, ablation of NUPR1 in mouse cardiac cells increases Col1A2 and it has been
speculated that this occurs through the inhibition of MMP9 (447). RFXAP and RFX5
are part of the three member RFX5 transcriptional complex which also includes RFXB.
Interaction with DNA is primarily mediated by RFX5 (448), while RFXB promotes
protein-protein interactions (449) and the C-terminal domain of RFXAP serves as a
bridge between RFX5 and RFXB (448). The RFX5 complex can bind to the
transcription start site of the Col1A2 gene were it represses its expression (450-452).
CD109 is a glycosylphosphatidylinositol anchored protein member of the α2-
macroglobulin/complement family (453). Decreased expression of CD109 has been
reported in breast cancer, melanoma or colorectal cancer (454, 455). TGFβ signal
transduction requires receptor endocytosis in order to be effective. Internalization of
TGFβR in clathrin-coated pits leads to phosphorylation of SMAD 2/3 and TGFβR
recycling (456-458). In contrast, lipid raft-dependent internalization in caveolae (459)
promotes the interaction of TGFβR with caveolin-1 (460) which downregulates

223
SMAD2/3 signalling and degrades the receptor via ubiquitination by the E3-ubiquitin
ligase SMURF2 (460, 461). CD109 has been shown to inhibit TGFβ signalling in a
caveolin-dependent manner by promoting TGFβR caveolae endocytosis and
promoting TGFβR degradation (462). DDX5 is a transcriptional repressor member of
the DEAD box helicase family (463). Expression of DDX5 has been described in the
nucleus of both primary HSCs and LX2 cells (464). Furthermore, inhibition of DDX5 in
LX2 cells increased the expression of COL1A2, TIMP1 and TGFβ1 indicating the role
DDX5 plays in regulating HSC activation (464).
From all these potential targets, all except EP300 were confirmed as direct targets of
either let7g-5p or miR-365a-3p via luciferase reporter activity assays in LX2 cells co-
transfected with the 3’UTR luciferase reporter vector and the miRNA mimic. This
suggests that miR-365a-3p and let7g-5p may act as pro-fibrotic mediators of HSC
activation by promoting the synthesis of collagen as modelled in the following
schematic representation (Figure 6.30). miR-365a-3p targets the TGFβ1 co-receptor
CD109 decreasing TGFβR lipid raft endocytosis and thus preventing its degradation.
LX2 miR-365a-3p biotin pulldown assay (performed in Chapter 5) also identified
SMURF2 as a potential target (fold change= 1.80; P=0.0273). SMURF2 is an E3-
ligase that ubiquitinates TGFβR in a process that is necessary for its degradation. By
targeting CD109 and SMURF2, miR-365a-3p represses TGFβR degradation mediated
by lipid-raft endocytosis. This in turn, promotes TGFβ signalling through the
internalization in clathrin-coated pits leading to the synthesis of COL1A1. By targeting
RFXAP and RFX5, miR-365a-3p counteracts the inhibitory effect of the RFX5 complex
allowing RNA polymerase II to bind to the TATA box of the COL1A2 gene to start its
transcription, thus increasing collagen synthesis. Similarly, by targeting DDX5, miR-
365a-3p prevents the inhibitory effect of DDX5 which increases the expression of
COL1A2 and presumably TIMP1 and TGFβ1. Finally, it is possible that the repression
of NUPR1 by miR-365a-3p decreases collagen degradation by inhibiting MMP activity,
which results in a net increase of collagen in the liver. Regarding the effect of let7g-
5p, by targeting GATA4, let7g-5p reduces the competition on the open chromatin site
of the COL1A2 gene increasing the transcription of COL1A2. These proposed actions
of miR-365a-3p and let7g-5p on the collagen synthetic pathway in HSCs require

224
further validation. However, the mechanisms described would appear to be plausible
and if proven in future confirmatory studies have the potential to provide important
novel new targets for therapeutic intervention in the treatment of hepatic fibrosis in all
chronic liver disease.
As shown in this thesis, miRNAs have an impact on the biological function of liver
progenitor cells and hepatic stellate cells, specifically in processes related to
fibrogenesis. There is potential for therapeutic manipulation of endogenous miRNA
expression in the treatment of hepatic fibrogenesis in chronic liver disease. Several
challenges need to be overcome in order to use miRNAs as successful drug therapies
including the potential for degradation by serum nucleases (465), organ/tissue/cell-
specific targeting and delivery strategies for uptake of miRNAs into the cell cytoplasm
(466). Several strategies have been successfully implemented to overcome some of
these challenges including the use of locked nucleic acid (LNA) modifications which
protect against degradation (467). Miravirsen, a 15 nucleotide LNA oligonucleotide
miRNA inhibitor, has been successfully tested in phase II clinical trials for the treatment
of HCV infection (468) by targeting human liver miR-122 to inhibit HCV RNA viral
replication (469). Another successful example of miRNA therapeutic intervention is
MRX34 which is in phase II clinical trials. MRX34 consists of a liposomal nanoparticle
containing miR-34a mimics used as a tumour suppressor in solid tumours including
liver (470-472). These examples show the promising adaptation of miRNAs as
therapeutics. It has been suggested that the liver is a promising target for miRNA
therapeutics due to the use of lipid based delivery methods (468, 471). The use of
nanoparticles as a delivery strategy has also been reported by others (473) as an
important mechanism to overcome Sorafenib resistance in HCC by using miR-7 (474).
In this thesis, I have shown a potential pro-fibrotic role of miR-365a-3p and let7g-5p in
HSCs by increasing collagen synthesis. In the future the use of miRNAs inhibitors
against miR-365a-3p and let7g-5p could potentially be used as an anti-fibrotic liver
therapy.

225
Figure 6.30. Potential mechanistic role of let7g-5p and miR-365a-3p in the synthesis of collagen.
miR-365a-3p targets CD109, a co-receptor of TGFβ1, which permits clathrin-coated pit endocytosis promoting signalling towards synthesis of COL1A1, instead of CD109-driven lipid raft endocytosis which degrades TGFβR1. miR-365a-3p also induces the synthesis of COL1A2 by inhibiting the RFX5 complex by targeting RFXAP and RFX5 and by targeting the transcriptional repressor DDX5. Increased hepatic collagen levels can also be mediated by miR-365a-3p by targeting NUPR1 which inhibits metalloproteases (thus decreasing potential MMP-driven collagen degradation). Let7g-5p promotes the expression of COL1A2 by targeting GATA4 which releases the competition for the transcription site of the COL1A2 gene. Faint red highlights luciferase assay validated miR-365a-3p targets. Faint green highlights yet to be validated miR-365a-targets. Faint purple highlights luciferase assay validated let7g-5p targets.

226
It is interesting to note that miR-365a-3p targets molecules of different pathways but also
targets core molecules within the same pathway. Considering the effect of miRNAs on gene
expression, where translation is decreased but not totally repressed, targeting several key
molecules within the same signalling pathway represents an effective regulatory
mechanism. It is also interesting to note the large number of potential targets for each
miRNA and the apparent contradictory effects each miRNA may have on different genes.
For instance, miR-365a-3p and let7g-5p which this study has shown to have pro-fibrotic
roles in HSCs increasing collagen synthesis by inhibiting collagen repressors, also directly
target SP1, a known transcription factor for several pro-fibrogenic genes including collagen.
This demonstrates the complexity of miRNAs and highlights the need to consider not only
direct miRNA targets, but also indirect effects driven by miRNA regulation.
Limitations of this study include the use of transient transfection of BMOLs and LX2 cells
which resulted in high variation between replicates and inconsistent effects of miRNAs on
target genes over time. Given that the experimental conditions were the same, it is likely
that the transfection efficiency for each replicate was responsible for this variation. This had
a clear impact on the statistical significance of several assessed mRNA targets and cell
function assays and was mostly corrected when stable overexpression by lentiviral
transduction was used, as shown for the additional miR-365a-3p and let7g-5p experiments
conducted in LX2 cells. In addition, mRNA assessment by qRT-PCR is not the best method
to validate miRNA targets as miRNAs control gene expression by either degrading mRNA
(when there is perfect complementarity with the seed sequence, not common in mammals)
or by translational repression which is not reflected in the measured mRNA levels.
Therefore, although the decreased expression of several of the selected putative targets is
encouraging, validation by luciferase reporter assay or alternatively, assessment of protein
expression by western blot would be required for those putative targets not further assessed
in this thesis. Due to the very large number of genes identified as potential targets for the
four separate miRNAs in two different cell types it was not possible to investigate all of the
identified putative targets.
Another limitation of this study is the use of a single immortalized progenitor cell line and a
single immortalised hepatic stellate cell line. Thus, the data generated in this thesis may not

227
be a full representation of miRNA function in complex physiological processes and therefore
should be further validated using additional cell lines and primary cultures of both liver
progenitor cells and hepatic stellate cells.
228
6.4 Summary and future directions
In this chapter, I have used several cellular and molecular techniques to determine the
potential role of let-7g-5p, miR-142-3p, miR-34a-5p and miR-365a-3p in the biology of LPCs
and HSCs and in their potential to drive fibrogenesis. To do so, a detailed exploration of
miRNA targets principally at mRNA level but also at the protein level was conducted. The
performance of these functional assays was optimised by stably overexpressing miRNAs
instead of using transient transfection which reduced the high variation initially observed
between experimental replicates. Moreover, functional assays including proliferation,
migration, differentiation and activation assays were performed to determine the biological
effects of these miRNAs in both LPCs and HSCs.
The work presented in this chapter is far from complete. It would be of interest to replicate
the work done in BMOL cells by using miRNA stably-transduced cells as was performed
with LX2 cells. This would provide a more accurate description of the mechanistic role of the
investigated miRNAs in LPCs. I have also shown a potential role, especially for let7g-5p, in
regulating the differentiation of LPCs (as shown at both the mRNA and protein level) which
deserves to be explored in greater depth. Using a similar approach to than used for HSCs,
identifying putative targets that directly interact with LPC differentiation markers would be of
great interest.
The most remarkable result of this chapter was the demonstration of the potential pro-fibrotic
role of miR-365a-3p in HSCs. I have proposed a regulatory mechanism by which miR-365a-
3p may increase collagen synthesis and could contribute to understand the development of
hepatic fibrosis, not just in CFLD but potentially in all chronic liver disease.

229
CHAPTER 7
General discussion

230
7.1 Chapter contribution
The paragraph summarising challenges when working with circulatory miRNAs (Chapter 4)
was published in the following literature review:
Calvopina DA, Coleman MA, Lewindon PJ, Ramm GA. Function and Regulation of
MicroRNAs and Their Potential as Biomarkers in Paediatric Liver Disease. International
Journal of Molecular Sciences 2016; 17:1795.
Diego A. Calvopina researched the content, wrote the manuscript and designed tables and
figures.
Miranda A. Coleman, Peter J. Lewindon and Grant A. Ramm edited, revised and approved
the content of the literature review.
231
CFLD is a significant cause of morbidity and mortality in children with CF. CFLD
manifestations range from benign non-specific elevation of liver enzymes to portal
hypertension, end-stage liver cirrhosis and premature death. Thus, CFLD is a high impact
disease in paediatric practice as evidenced by the documented increased childhood
mortality by all causes in children with CFLD compared to those who do not have liver
disease (64, 230). In fact, others have shown that liver disease is predictive of increased
risk of death and lung transplantation (62, 475). Moreover, CFLD impacts the quality of life
and overall survival of affected children due to complications such as steatosis, nutrition,
altered lipid metabolism, constipation or varices among others (59, 476, 477). The only
treatment for liver disease in patients with CF is ursodeoxycholic acid (UDCA), an
endogenous hydrophilic bile acid, which is thought to delay CFLD progression by promoting
bile flow in the bile ducts and thus improving liver histology (16, 478). However, there is no
evidence that UDCA alters the natural progression of the disease or improves survival (479,
480). Additional nutritional management is also recommended to control the essential fatty
acid deficiencies and low body-mass index common in CFLD (475). When multilobular
cirrhosis and portal hypertension are established, liver transplantation is the only remaining
therapeutic option that reflects a survival benefit (481, 482). The most appropriate time to
perform liver transplantation is a topic of controversy with some authors recommending
transplantation at an early disease stage before lung function is compromised (483, 484). In
contrast, others suggest liver transplantation to be reserved for cases with hepatic
decompensation (485).
Overall, CFLD is a complex disease with multiple and subtle manifestations which lacks a
clear definition. This lack of definition and the use of non-specific methods for detection
make the diagnosis of CFLD challenging. Furthermore, monitoring and assessment of
disease severity by liver biopsy is not only invasive and associated with severe
complications, but due to the focal distribution of CFLD lesions, can be unreliable. Thus,
finding non-invasive alternative modalities to diagnose and monitor CFLD is a clinical
imperative. The implementation of these new methods have the potential to identify CF
children at risk of developing CFLD and more severe complications such as portal
hypertension. It could also assist planning strategies for disease management including the
frequency of clinical assessment or choosing the best time for liver transplantation.

232
In this thesis, I explored the potential of circulatory miRNAs and Supersonic shearwave
elastography (SSWE) as novel non-invasive methods for the diagnosis of CFLD in children.
These modalities are not only non-invasive but also could be used as bedside diagnostic
tools in the clinical setting. Moreover, miRNAs have the potential to be used as a new
therapeutic avenue due to their function in regulating gene expression in disease. Although
several studies have reported the use of circulatory miRNAs and SSWE in various different
chronic liver diseases, studies investigating their potential utility in paediatric CFLD are
scarce. Chapter 3 demonstrated that SSWE is capable of differentiating liver disease in CF
children with a better diagnostic accuracy than other methods such as the validated serum
biomarker APRI (124). Interestingly, the diagnostic performance of SSWE was increased
when combined with APRI which suggests a synergistic effect when these two modalities
are combined capturing patients that would not be detected if these tests were used
separately. There are no published studies of SSWE in CFLD, however, when compared to
studies performed in CFLD using Fibroscan, similar outcomes were observed including
AUROCs, sensitivity, specificity and cut-off values. Although this study did not include liver
biopsy validated fibrosis staging within the CFLD group, SSWE was also capable to
distinguish between no/mild/moderate fibrosis and severe fibrosis/cirrhosis children. The
fact that SSWE was able to discriminate disease severity when two different classification
methods such as clinical assessment and APRI-based classification were used shows the
robust nature of this technique. Future studies performed in larger cohorts including liver
biopsy validated CFLD children would strength the findings reported in this thesis. It would
also be interesting to explore the diagnostic accuracy of SSWE when combined with
biomarkers other than APRI such as miRNAs. One of the most clinically useful aspects of
SSWE lays in its use as a bedside diagnostic tool. In Chapter 3, I have also shown that
SSWE can be used to monitor liver stiffness progression over time. This is particularly
important as it gives a frame of reference for clinicians to assess if the liver is deteriorating
and how rapidly, providing vital information to manage the disease in a better way. Despite
being able to be used as a diagnostic method for CFLD in children, SSWE does not improve
the diagnostic accuracy of other currently used methods and thus when used alone would
not be an ideal test to replace liver biopsy.
Therefore, Chapter 4 explored the use of serum miRNAs as biomarkers to diagnose and
assess the progression of CFLD. I have shown that serum of CFLD children have a
233
distinctive miRNA signature compared to those CF children without liver disease.
Furthermore, a panel combining serum levels of miR-365a-3p, miR-142-3p, let-7g-5p and
APRI outperforms biomarkers that have been proposed until now for the detection of CFLD.
In addition, in Chapter 4, I showed that miR-18a-5p was able to stratify fibrosis severity in
CFLD children that had fibrosis validated by liver biopsy. miR-18a-5p showed the potential
to discriminate between fibrosis grouped in different combinations and between intermediate
degrees of fibrosis when assessed using several statistical methods. This answers the
clinical need of continuous assessment of disease progression, providing key information
that can be objectively used to decide patients that could benefit from liver transplantation.
As with SSWE, miRNAs benefit from the use in combination with APRI and therefore, future
studies combining miRNAs, SSWE and other biomarkers could provide even greater levels
of diagnostic accuracy.
It is worth noting that the study of circulatory miRNAs has some inherent challenges. Pre-
analytical variation can affect the quantification of miRNAs. During sample collection it is
essential to remove cellular components such as erythrocytes, leukocytes and platelets from
blood. In particular, erythrocytes express high levels of miR-451 and miR-16, which
correlates with haemolysis in plasma samples (208, 486). Heparin, a traditional
anticoagulant used in plasma, shows a dose dependent inhibitory effect by binding to
calcium and magnesium used in PCR reactions (487, 488). Although miRNAs are resilient
in serum or plasma, repeated freeze-thaw cycles decreases detectable miRNA levels and
should be avoided (489). One major challenge is the relatively low abundance of miRNA in
plasma and serum along with high levels of proteins and lipids which can interfere with the
isolation process. Originally, TRIzol was used as an effective method for small RNA
isolation, however, phenol contamination and difficulty with pellet resuspension regularly
interfered with the process. These problems have been partially solved by method
modifications including small RNA binding columns common to multiple commercial kits.
Traditional RNA quantification methods, such as spectrophotometer or capillary
electrophoresis, are unable to assess size or quality of the isolated miRNA accurately, due
to the low yield and limits of detection. As such, this study demanded extensive optimization
tailored specifically to the disease and application which resulted in the methodology
detailed at length in Chapter 2. Future studies will need to consider these methodological
differences (e.g. NGS design or choice of endogenous reference miRNAs to normalise

234
circulatory expression) when assessing and comparing the clinical utility of these findings.
As with SSWE, circulatory miRNAs are not yet developed or accepted enough to replace
liver biopsy, which is still the gold standard to assess CFLD (although less used every time).
However, the potential combination of these new modalities with physical examination and
imaging techniques could provide promising tools that may be useful in the clinical setting.
Validation studies in larger cohorts would be required before the three miRNA + APRI panel
described in this thesis were found to be acceptable for routine clinical practise. The findings
of this chapter would be greatly strengthened by studies exploring questions that have not
been answered here. For instance, identifying the origin of the described miRNAs would
confirm their specificity as liver disease specific markers and thus of potential therapeutic
use. It is not possible to do these studies in liver tissue as it is unethical to perform liver
biopsy in CF children with no liver disease where there is no clinical benefit. Alternatively,
animal models could be used; however, there are no well-defined animal models for CFLD.
Thus, the use of cultured liver cells is the best option to explore the generic role of miRNAs
in chronic liver disease and how they regulate fibrogenesis and its progression.
miRNAs described in Chapter 4 were explored in more depth in Chapters 5 and 6 using
cell lines of LPCs (BMOL) and HSCs (LX2), which are two crucial liver cell populations
associated with wound repair and fibrogenesis in all chronic liver disease. In Chapter 5 I
used an experimental method of miRNA cell transfection to pulldown mRNA targets,
successfully identifying a long list of potential miRNA targets in both cell lines. miRNAs are
known to regulate cell functions; thus, it was not surprising to find via pathway analysis that
key cellular and molecular processes involved in the LPCs and HSCs response to fibrosis
were affected by the transfected miRNAs. Due to the large number of potential targets
identified, only a few were selected for further validation. Several of the remaining potential
targets were not selected and provide a comprehensive list of candidates to be studied by
others in the future. This opens a myriad of possibilities, especially in LPCs where no miRNA
work has previously been conducted.
The work on miRNA targets was extended in Chapter 6. Selected targets were validated
and functional assays performed in BMOL and LX2 cells to determine the role of these
miRNAs in the biology of LPCs and HSCs respectively. qRT-PCR showed the decrease

235
mRNA expression of some of the selected genes confirming them as putative miRNA
targets. miRNAs are known to regulate gene expression by either inducing mRNA
degradation or by inhibiting its translation. In mammals, about 20% of miRNA-induced
repression is due to translation inhibition (490). Thus, some of the genes that did not show
decreased expression might be still miRNA targets regulated by the translation inhibitory
effect of miRNAs. Several mRNAs were confirmed as definitive targets for let7g-5p and miR-
365a-3p in HSCs by using luciferase reporter assays, which demonstrated a direct link
between the specific miRNA and its binding site in the 3’UTR region of the target mRNA.
Future experiments could be performed on those additional potential mRNA targets that did
not show decreased expression in response to miRNA transfection using luciferase reporter
assays, which may assist in identifying new regulatory mechanistic roles of these miRNAs
in both LPCs and HSCs. I have also shown the effect that these miRNAs appear to have on
LPC differentiation and HSC activation, both crucial events in fibrogenesis following chronic
liver injury. Further investigation is required to elucidate the complex mechanisms by which
miRNAs exert their effects on these processes. An important contribution of this chapter is
the demonstration of the potential pro-fibrotic role of miR-365a-3p in regulating the collagen
synthetic pathway in HSCs. This effect needs to be confirmed and expanded; however, it
offers a potential mechanistic process via which molecules that can be targeted for a long
awaited therapeutic intervention not only in CFLD but also in other fibrosing liver diseases.
Interestingly, it was observed that the miRNAs targeted several members of the same
pathway, as demonstrated with the impact of miR-365a-3p on the collagen synthetic
pathway in HSCs. This is encouraging as others have shown that miRNAs regulate specific
cellular processes by concomitant repression of gene members of the same pathway (491,
492) confirming the findings of this chapter. It was also observed that miRNAs can bind to
targets promoting opposite effects. For example, let7g-5p and miR-365a-3p showed a pro-
fibrotic effect in HSCs which translates to the increased synthesis of collagen, however, SP1
(a pro-fibrogenic transcription factor) is also a direct target of both miRNAs. This potential
dual function of miRNA has been described previously (493-495) and has been proposed
that the activation or inhibitory effect of the miRNA depends on the relative expression levels
of the targets (496). An alternative and not exclusive explanation is that SP1 is a strong
transcription factor that could easily compensate the subtle regulation by miRNA to the point
that it could even mask the contribution of other pathway members. Future studies exploring

236
mechanisms and conditions in which this regulation occurs could lead to advances in anti-
fibrotic therapies.
A clear limitation of this chapter is the use of transient transfection. miRNA cell uptake was
not constant across the different experiments which translated as high variability between
replicates and inconsistent miRNA effects over time. These problems were mostly overcome
with the use of cells stably overexpressing miRNA as observed in LX2 cells transduced with
lentiviral miRNA vectors. The results presented in this chapter would benefit from repeating
the same experimental settings (i.e. qRT-PCR validation, functional assays, western blot)
using this stable transfection system to produce miRNA-transduced BMOL and LX2 cells.
An additional benefit of using miRNA transduced cells is that it closely replicates
physiological conditions. Studies have shown that the range by which most endogenous
miRNAs fluctuate to modulate gene expression is 20-30% (497). Overexpression of miRNA,
generally significantly greater than physiological levels, have the potential to generate false
positive results (498). In Chapter 6, I have shown miRNA overexpression that ranges from
16-40 fold using lentiviral transduction compared to the 100-300 fold increase when using
transient transfection.
In conclusion, this thesis has successfully demonstrated the utility of SSWE and serum
miRNAs as non-invasive methods for the diagnosis of CFLD and stratification of liver
disease severity. Specifically, I have shown that SSWE is a feasible and useful bedside tool
to discriminate CFLD especially when combined with other modalities. I have also shown
that CFLD children have a specific serum miRNA signature compared to CF children with
no liver disease that is more accurate than other currently used methods to identify liver
disease and monitor liver fibrosis progression. Finally, I have identified targets of these
miRNAs which play an important role in the liver’s fibrogenic response mediated by LPCs
and HSCs, which has a potential role not just in CFLD but in all fibrosing liver disease. It has
been hypothesized that cross-talk between LPCs and HSCs may drive the ductular reaction
and fibrogenesis in chronic liver disease (325, 388), therefore I selected these two liver cells
to investigate the potential mechanistic role of miRNAs, identified as being modified in
CFLD, in the development of fibrosis. The identification and functional work on these targets

237
may reveal the potential to discover novel therapeutic interventions for the future treatment
of CFLD as well as other chronic liver diseases.

238
CHAPTER 8
References

239
1. Arya G, Balistreri WF. Pediatric liver disease in the United States: epidemiology and impact. J Gastroenterol Hepatol 2002;17:521-525. 2. Van Cong N, Braman JC, Barker D, Brown VA, Schumm JW, Tsui L-C, Knowlton RG, et al. A polymorphic DNA marker linked to cystic fibrosis is located on chromosome 7. Nature 1985;318:380-382. 3. Castellani C, Cuppens H, Macek M, Jr., Cassiman JJ, Kerem E, Durie P, Tullis E, et al. Consensus on the use and interpretation of cystic fibrosis mutation analysis in clinical practice. J Cyst Fibros 2008;7:179-196. 4. Bear CE, Li C, Kartner N, Bridges RJ, Jensen TJ, Ramjeesingh M, Riordan JR. Purification and functional reconstitution of the cystic fibrosis transmembrane conductance regulator (CFTR). Cell 1992;68:809-818. 5. Beuers U. The biliary HCO3− umbrella: A unifying hypothesis on pathogenetic and therapeutic aspects of fibrosing cholangiopathies. Hepatology 2010;52:1489-1496. 6. Feranchak AP, Sokol RJ. Cholangiocyte Biology and Cystic Fibrosis Liver Disease. Seminars in liver disease 2001;21:471-488. 7. O'Sullivan BP, Freedman SD. Cystic fibrosis. The Lancet 2009;373:1891-1904. 8. Bonadia LC, de Lima Marson FA, Ribeiro JD, Paschoal IA, Pereira MC, Ribeiro AF, Bertuzzo CS. CFTR genotype and clinical outcomes of adult patients carried as cystic fibrosis disease. Gene 2014;540:183-190. 9. Elborn JS. Cystic fibrosis. The Lancet 2016;388:2519-2531. 10. Burgel P-R, Bellis G, Olesen HV, Viviani L, Zolin A, Blasi F, Elborn JS. Future trends in cystic fibrosis demography in 34 European countries. European Respiratory Journal 2015;46:133-141. 11. Cystic Fibrosis Foundation CF. Cystic Fibrosis Foundation Patient Registry: 2016 Annual Data Report. In. Bethesda, Maryland: Cystic Fibrosis Foundation; 2017. 12. Dodge JA, Lewis PA, Stanton M, Wilsher J. Cystic fibrosis mortality and survival in the UK: 1947-2003. European Respiratory Journal 2007;29:522-526. 13. World Health Organization. The molecular genetic epidemiology of cystic fibrosis: report of a joint meeting of WHO/ECFTN/ICF (M) A/ECFS. Geneva, WHO 2004. 14. Bell SC, Bye PTP, Cooper PJ, Martin AJ, McKay KO, Robinson PJ, Ryan GF, et al. Cystic fibrosis in Australia, 2009: results from a data registry. The Medical journal of Australia 2011;195:396-400. 15. Kinnman N, Lindblad A, Housset C, Buentke E, Scheynius A, Strandvik B, Hultcrantz R. Expression of cystic fibrosis transmembrane conductance regulator in liver tissue from patients with cystic fibrosis. Hepatology 2000;32:334-340. 16. Smith JL, Lewindon PJ, Hoskins AC, Pereira TN, Setchell KDR, O'Connell NC, Shepherd RW, et al. Endogenous ursodeoxycholic acid and cholic acid in liver disease due to cystic fibrosis. Hepatology 2004;39:1673-1682. 17. Lewindon PJ, Pereira TN, Hoskins AC, Bridle KR, Williamson RM, Shepherd RW, Ramm GA. The Role of Hepatic Stellate Cells and Transforming Growth Factor-β1 in Cystic Fibrosis Liver Disease. The American Journal of Pathology 2002;160:1705-1715. 18. Cirera S, Busk PK: Quantification of miRNAs by a simple and specific qPCR method. Methods Mol Biol. In press. 19. Flass T, Tong S, Frank DN, Wagner BD, Robertson CE, Kotter CV, Sokol RJ, et al. Intestinal lesions are associated with altered intestinal microbiome and are more frequent in children and young adults with cystic fibrosis and cirrhosis. PLoS One 2015;10:e0116967. 20. Seki E, De Minicis S, Osterreicher CH, Kluwe J, Osawa Y, Brenner DA, Schwabe RF. TLR4 enhances TGF-beta signaling and hepatic fibrosis. Nature medicine 2007;13:1324.

240
21. Blanco PG, Zaman MM, Junaidi O, Sheth S, Yantiss RK, Nasser IA, Freedman SD. Induction of colitis in cftr-/- mice results in bile duct injury. Am J Physiol Gastrointest Liver Physiol 2004;287:G491-496. 22. Martin CR, Zaman MM, Ketwaroo GA, Bhutta AQ, Coronel E, Popov Y, Schuppan D, et al. CFTR dysfunction predisposes to fibrotic liver disease in a murine model. Am J Physiol Gastrointest Liver Physiol 2012;303:G474-481. 23. Werlin SL, Benuri-Silbiger I, Kerem E, Adler SN, Goldin E, Zimmerman J, Malka N, et al. Evidence of intestinal inflammation in patients with cystic fibrosis. J Pediatr Gastroenterol Nutr 2010;51:304-308. 24. Dhaliwal J, Leach S, Katz T, Nahidi L, Pang T, Lee JM, Strachan R, et al. Intestinal inflammation and impact on growth in children with cystic fibrosis. J Pediatr Gastroenterol Nutr 2015;60:521-526. 25. Adriaanse MP, van der Sande LJ, van den Neucker AM, Menheere PP, Dompeling E, Buurman WA, Vreugdenhil AC. Evidence for a Cystic Fibrosis Enteropathy. PLoS One 2015;10:e0138062. 26. Cariello R, Federico A, Sapone A, Tuccillo C, Scialdone VR, Tiso A, Miranda A, et al. Intestinal permeability in patients with chronic liver diseases: Its relationship with the aetiology and the entity of liver damage. Dig Liver Dis 2010;42:200-204. 27. Wilschanski M, Rivlin J, Cohen S, Augarten A, Blau H, Aviram M, Bentur L, et al. Clinical and Genetic Risk Factors for Cystic Fibrosis-related Liver Disease. Pediatrics 1999;103:52-57. 28. Bartlett JR, Friedman KJ, Ling SC, et al. Genetic modifiers of liver disease in cystic fibrosis. JAMA 2009;302:1076-1083. 29. Colombo C, Battezzati PM, Crosignani A, Morabito A, Costantini D, Padoan R, Giunta A. Liver disease in cystic fibrosis: A prospective study on incidence, risk factors, and outcome. Hepatology 2002;36:1374-1382. 30. Thomas C, Pellicciari R, Pruzanski M, Auwerx J, Schoonjans K. Targeting bile-acid signalling for metabolic diseases. Nat Rev Drug Discov 2008;7:678-693. 31. Ramm GA, Shepherd RW, Hoskins AC, Greco SA, Ney AD, Pereira TN, Bridle KR, et al. Fibrogenesis in pediatric cholestatic liver disease: Role of taurocholate and
hepatocyte-derived monocyte chemotaxis protein-1 in hepatic stellate cell recruitment. Hepatology 2009;49:533-544. 32. Allen K, Jaeschke H, Copple BL. Bile acids induce inflammatory genes in hepatocytes: a novel mechanism of inflammation during obstructive cholestasis. Am J Pathol 2011;178:175-186. 33. Lamireau T, Zoltowska M, Levy E, Yousef I, Rosenbaum J, Tuchweber B, Desmouliere A. Effects of bile acids on biliary epithelial cells: proliferation, cytotoxicity, and cytokine secretion. Life Sci 2003;72:1401-1411. 34. Marra F, Romanelli RG, Giannini C, Failli P, Pastacaldi S, Arrighi MC, Pinzani M, et al. Monocyte chemotactic protein-1 as a chemoattractant for human hepatic stellate cells. Hepatology 1999;29:140-148. 35. Anty R, Lemoine M. Liver fibrogenesis and metabolic factors. Clinics and Research in Hepatology and Gastroenterology 2011;35:S10-S20. 36. Higuchi H, Yoon J-H, Grambihler A, Werneburg N, Bronk SF, Gores GJ. Bile acids stimulate cFLIP phosphorylation enhancing TRAIL-mediated apoptosis. Journal of Biological Chemistry 2003;278:454-461. 37. Wang K, Lin B, Brems J, Gamelli R. Hepatic apoptosis can modulate liver fibrosis through TIMP1 pathway. Apoptosis 2013;18:566-577.

241
38. den Hartog GJM, Qi S, van Tilburg JHO, Koek GH, Bast A. Superoxide anion radicals activate hepatic stellate cells after entry through chloride channels: a new target in liver fibrosis. European journal of pharmacology 2014;724:140-144. 39. Novo E, Parola M. The role of redox mechanisms in hepatic chronic wound healing and fibrogenesis. Fibrogenesis and Tissue Repair 2012;5:S4-S4. 40. Paik YH, Iwaisako K, Seki E, Inokuchi S, Schnabl B, Osterreicher CH, Kisseleva T, et al. The nicotinamide adenine dinucleotide phosphate oxidase (NOX) homologues NOX1 and NOX2/gp91(phox) mediate hepatic fibrosis in mice. Hepatology 2011;53:1730-1741. 41. Canbay A, Feldstein AE, Higuchi H, Werneburg N, Grambihler A, Bronk SF, Gores GJ. Kupffer cell engulfment of apoptotic bodies stimulates death ligand and cytokine expression. Hepatology 2003;38:1188-1198. 42. Cui W, Matsuno K, Iwata K, Ibi M, Matsumoto M, Zhang J, Zhu K, et al. NOX1/nicotinamide adenine dinucleotide phosphate, reduced form (NADPH) oxidase promotes proliferation of stellate cells and aggravates liver fibrosis induced by bile duct ligation. Hepatology 2011;54:949-958. 43. Jaeschke H, Lemasters JJ. Apoptosis versus oncotic necrosis in hepatic ischemia/reperfusion injury. Gastroenterology 2003;125:1246-1257. 44. Michalopoulos GK. Liver regeneration. Journal of Cellular Physiology 2007;213:286-300. 45. Forbes S, Vig P, Poulsom R, Thomas H, Alison M. Hepatic stem cells. The Journal of Pathology 2002;197:510-518. 46. Roskams TA, Theise ND, Balabaud C, Bhagat G, Bhathal PS, Bioulac-Sage P, Brunt EM, et al. Nomenclature of the finer branches of the biliary tree: canals, ductules, and ductular reactions in human livers. Hepatology 2004;39:1739-1745. 47. Gadd VL, Skoien R, Powell EE, Fagan KJ, Winterford C, Horsfall L, Irvine K, et al. The portal inflammatory infiltrate and ductular reaction in human nonalcoholic fatty liver disease. Hepatology 2014;59:1393-1405. 48. Lorenzini S, Bird TG, Boulter L, Bellamy C, Samuel K, Aucott R, Clayton E, et al. Characterisation of a stereotypical cellular and extracellular adult liver progenitor cell niche in rodents and diseased human liver. Gut 2010;59:645-654. 49. Syn WK, Jung Y, Omenetti A, Abdelmalek M, Guy CD, Yang L, Wang J, et al. Hedgehog-Mediated Epithelial-to-Mesenchymal Transition and Fibrogenic Repair in Nonalcoholic Fatty Liver Disease. Gastroenterology 2009;137:1478-1488.e1478. 50. Boulter L, Govaere O, Bird TG, Radulescu S, Ramachandran P, Pellicoro A, Ridgway RA, et al. Macrophage-derived Wnt opposes Notch signaling to specify hepatic progenitor cell fate in chronic liver disease. Nat Med 2012;18:572-579. 51. Fabris L, Cadamuro M, Guido M, Spirli C, Fiorotto R, Colledan M, Torre G, et al. Analysis of liver repair mechanisms in Alagille syndrome and biliary atresia reveals a role for notch signaling. Am J Pathol 2007;171:641-653. 52. Clouston AD, Powell EE, Walsh MJ, Richardson MM, Demetris AJ, Jonsson JR. Fibrosis correlates with a ductular reaction in hepatitis C: Roles of impaired replication, progenitor cells and steatosis. Hepatology 2005;41:809-818. 53. Richardson MM, Jonsson JR, Powell EE, Brunt EM, Neuschwander–Tetri BA, Bhathal PS, Dixon JB, et al. Progressive Fibrosis in Nonalcoholic Steatohepatitis: Association With Altered Regeneration and a Ductular Reaction. Gastroenterology 2007;133:80-90. 54. Kinugasa Y, Nakashima Y, Matsuo S, Shono K, Suita S, Sueishi K. Bile ductular proliferation as a prognostic factor in biliary atresia: an immunohistochemical assessment. J Pediatr Surg 1999;34:1715-1720.
242
55. Pozniak KN, Pearen MA, Pereira TN, Kramer CSM, Kalita-De Croft P, Nawaratna SK, Fernandez-Rojo MA, et al. Taurocholate Induces Biliary Differentiation of Liver Progenitor Cells Causing Hepatic Stellate Cell Chemotaxis in the Ductular Reaction: Role in Pediatric Cystic Fibrosis Liver Disease. Am J Pathol 2017;187:2744-2757. 56. Knight B, Akhurst B, Matthews VB, Ruddell RG, Ramm GA, Abraham LJ, Olynyk JK, et al. Attenuated liver progenitor (oval) cell and fibrogenic responses to the choline deficient, ethionine supplemented diet in the BALB/c inbred strain of mice. Journal of Hepatology 2007;46:134-141. 57. Knight B, Lim R, Yeoh GC, Olynyk JK. Interferon-γ exacerbates liver damage, the hepatic progenitor cell response and fibrosis in a mouse model of chronic liver injury. Journal of Hepatology 2007;47:826-833. 58. Ramm GA. Chemokine (C-C motif) receptors in fibrogenesis and hepatic regeneration following acute and chronic liver disease. Hepatology 2009;50:1664-1668. 59. Flass T, Narkewicz MR. Cirrhosis and other liver disease in cystic fibrosis. Journal of cystic fibrosis 2013;12:116. 60. Debray D, Narkewicz MR, Bodewes F, Colombo C, Housset C, de Jonge HR, Jonker JW, et al. Cystic Fibrosis-related Liver Disease: Research Challenges and Future Perspectives. J Pediatr Gastroenterol Nutr 2017;65:443-448. 61. Colombo C. Liver disease in cystic fibrosis. Curr Opin Pulm Med 2007;13:529-536. 62. Debray D, Kelly D, Houwen R, Strandvik B, Colombo C. Best practice guidance for the diagnosis and management of cystic fibrosis-associated liver disease. J Cyst Fibros 2011;10 Suppl 2:S29-36. 63. Menghini G, Carnevali O, Orlandi F, Benda N. Clinical evaluation of liver biopsy: considerations on four year experiences. Il Progresso medico 1953;9:1-10. 64. Lewindon PJ, Shepherd RW, Walsh MJ, Greer RM, Williamson R, Pereira TN, Frawley K, et al. Importance of hepatic fibrosis in cystic fibrosis and the predictive value of liver biopsy. Hepatology 2011;53:193-201. 65. Yang J-G, Ma D-Q, Peng Y, Song L, Li C-L. Comparison of different diagnostic methods for differentiating biliary atresia from idiopathic neonatal hepatitis. Clinical imaging 2009;33:439-446. 66. Bakula A, Socha P, Pawlowska J, Teisseyre M, Jankowska I, Kalicinski P. Good and Bad Prognosis of Alpha-1-Antitrypsin Deficiency in Children: When to List for Liver Transplantation. Transplantation proceedings 2007;39:3186-3188. 67. Subramaniam P, Knisely A, Portmann B, Qureshi SA, Aclimandos WA, Karani JB, Baker AJ. Diagnosis of Alagille Syndrome—25 Years of Experience at Kingʼs College Hospital. Journal of pediatric gastroenterology and nutrition 2011;52:84-89. 68. Bull LN, Carlton VE, Stricker NL, Baharloo S, DeYoung JA, Freimer NB, Magid MS, et al. Genetic and morphological findings in progressive familial intrahepatic cholestasis (Byler disease [PFIC-1] and Byler syndrome): evidence for heterogeneity. Hepatology 1997;26:155-164. 69. Vajro P, Lenta S, Socha P, Dhawan A, McKiernan P, Baumann U, Durmaz O, et al. Diagnosis of Nonalcoholic Fatty Liver Disease in Children and Adolescents: Position Paper of the ESPGHAN Hepatology Committee. Journal of pediatric gastroenterology and nutrition 2012;54:700-713. 70. Mieli-Vergani G, Vergani D. Autoimmune hepatitis. Nature reviews.Gastroenterology & hepatology 2011;8:320-329. 71. Martins da Costa C, Baldwin D, Portmann B, Lolin Y, Mowat AP, Mieli-Vergani G. Value of urinary copper excretion after penicillamine challenge in the diagnosis of Wilson's disease. Hepatology 1992;15:609-615.

243
72. Jonas MM, Block JM, Haber BA, Karpen SJ, London WT, Murray KF, Narkewicz MR, et al. Treatment of children with chronic hepatitis B virus infection in the United States: patient selection and therapeutic options. Hepatology (Baltimore, Md.) 2010;52:2192. 73. Sporea I, Popescu A, Sirli R. Why, who and how should perform liver biopsy in chronic liver diseases. World journal of gastroenterology: WJG 2008;14:3396. 74. El-Shabrawi MH, El-Karaksy HM, Okahsa SH, Kamal NM, El-Batran G, Badr KA. Outpatient blind percutaneous liver biopsy in infants and children: is it safe? Saudi journal of gastroenterology : official journal of the Saudi Gastroenterology Association 2012;18:26-33. 75. Czaja AJ, Carpenter HA. Optimizing Diagnosis From the Medical Liver Biopsy. Clinical Gastroenterology and Hepatology 2007;5:898-907. 76. Hahm GK, Niemann TH, Lucas JG, Frankel WL. The value of second opinion in gastrointestinal and liver pathology. Archives of Pathology & Laboratory Medicine 2001;125:736. 77. Ovchinsky N, Moreira RK, Lefkowitch JH, Lavine JE. The Liver Biopsy in Modern Clinical Practice: A Pediatric Point-of-View. Advances in anatomic pathology 2012;19:250. 78. Pietrobattista A, Fruwirth R, Natali G, Monti L, Devito R, Nobili V. Is juvenile liver biopsy unsafe? Putting an end to a common misapprehension. Pediatric radiology 2009;39:959-961. 79. Rockey DC, Caldwell SH, Goodman ZD, Nelson RC, Smith AD, American Association for the Study of Liver D. Liver biopsy. Hepatology 2009;49:1017-1044. 80. Cohen MB, Kader H, Lambers D, Heubi J. Complications of percutaneous liver biopsy in children. Gastroenterology 1992;102:629-632. 81. Hoffer F. Liver biopsy methods for pediatric oncology patients. Pediatric radiology 2000;30:481-488. 82. Westheim BH, Østensen AB, Aagenæs I, Sanengen T, Almaas R. Evaluation of risk factors for bleeding after liver biopsy in children. Journal of pediatric gastroenterology and nutrition 2012;55:82-87. 83. Eisenberg E, Konopniki M, Veitsman E, Kramskay R, Gaitini D, Baruch Y. Prevalence and characteristics of pain induced by percutaneous liver biopsy. Anesthesia & Analgesia 2003;96:1392-1396. 84. Otobe Y, Hashimoto T, Shimizu Y, Nakamura T, Yamamori N, Hayashi S, Kurono K, et al. Formation of a fatal arterioportal fistula following needle liver biopsy in a child with a living-related liver transplant: report of a case. Surgery today 1995;25:916-919.
85. Van Der Poorten D, Kwok A, Lam T, Ridley L, Jones DB, Ngu MC, Lee AU. Twenty-year audit of percutaneous liver biopsy in a major Australian teaching hospital. Internal Medicine Journal 2006;36:692-699. 86. Amaral JG, Schwartz J, Chait P, Temple M, John P, Smith C, Taylor G, et al. Sonographically Guided Percutaneous Liver Biopsy in Infants: A Retrospective Review. American Journal of Roentgenology 2006;187:W644-W649. 87. Mueller-Abt PR, Frawley KJ, Greer RM, Lewindon PJ. Comparison of ultrasound and biopsy findings in children with cystic fibrosis related liver disease. Journal of Cystic Fibrosis 2008;7:215-221. 88. Lenaerts C, Lapierre C, Patriquin H, Bureau N, Lepage G, Harel F, Marcotte J, et al. Surveillance for cystic fibrosis-associated hepatobiliary disease: early ultrasound changes and predisposing factors. The Journal of pediatrics 2003;143:343-350. 89. Williams SM, Goodman R, Thomson A, McHugh K, Lindsell DRM. Ultrasound Evaluation of Liver Disease in Cystic Fibrosis as Part of an Annual Assessment Clinic: A 9-year Review. Clinical radiology 2002;57:365-370.

244
90. Taouli B, Ehman RL, Reeder SB. Advanced MRI methods for assessment of chronic liver disease. AJR. American journal of roentgenology 2009;193:14. 91. Durieu I, Pellet O, Simonot L, Durupt S, Bellon G, Durand DV. Sclerosing cholangitis in adults with cystic fibrosis: a magnetic resonance cholangiographic prospective study. Journal of hepatology 1999;30:1052-1056. 92. Reeder SB, Cruite I, Hamilton G, Sirlin CB. Quantitative assessment of liver fat with magnetic resonance imaging and spectroscopy. Journal of Magnetic Resonance Imaging 2011;34:729-749. 93. Sokol RJ, Durie PR. Recommendations for management of liver and biliary tract disease in cystic fibrosis. Journal of pediatric gastroenterology and nutrition 1999;28:S1-S13. 94. Sandrin L, Fourquet B, Hasquenoph J-M, Yon S, Fournier C, Mal F, Christidis C, et al. Transient elastography: a new noninvasive method for assessment of hepatic fibrosis. Ultrasound in medicine & biology 2003;29:1705-1713.
95. Corpechot C, Carrat F, Poujol-Robert A, Gaouar F, Wendum D, Chazouillères O,
Poupon R. Noninvasive elastography-based assessment of liver fibrosis progression and prognosis in primary biliary cirrhosis. Hepatology 2012;56:198-208. 96. Lee SS, Park SH. Radiologic evaluation of nonalcoholic fatty liver disease. World journal of gastroenterology 2014;20:7392. 97. Corpechot C, Gaouar F, El Naggar A, Kemgang A, Wendum D, Poupon R, Carrat F, et al. Baseline values and changes in liver stiffness measured by transient elastography are associated with severity of fibrosis and outcomes of patients with primary sclerosing cholangitis. Gastroenterology 2014;146:970. 98. Shiina T, Nightingale KR, Palmeri ML, Hall TJ, Bamber JC, Barr RG, Castera L, et al. WFUMB Guidelines and Recommendations for Clinical Use of Ultrasound Elastography: Part 1: Basic Principles and Terminology. Ultrasound in Medicine & Biology 2015;41:1126-1147. 99. Nobili V, Monti L, Alisi A, Zupone CL, Pietrobattista A, Tomà P. Transient elastography for assessment of fibrosis in paediatric liver disease. Pediatric radiology 2011;41:1232-1238. 100. Castera L, Forns X, Alberti A. Non-invasive evaluation of liver fibrosis using transient elastography. Journal of Hepatology 2008;48:835-847. 101. Castera L, Pinzani M. Non-invasive assessment of liver fibrosis: are we ready? The Lancet;375:1419-1420. 102. Myers RP, Pomier-Layrargues G, Kirsch R, Pollett A, Duarte-Rojo A, Wong D, Beaton M, et al. Feasibility and diagnostic performance of the FibroScan XL probe for liver stiffness measurement in overweight and obese patients. Hepatology 2012;55:199-208. 103. Engelmann G, Gebhardt C, Wenning D, Wühl E, Hoffmann GF, Selmi B, Grulich-Henn J, et al. Feasibility study and control values of transient elastography in healthy children. European journal of pediatrics 2012;171:353-360. 104. Ferraioli G, Lissandrin R, Zicchetti M, Filice C. Assessment of liver stiffness with transient elastography by using S and M probes in healthy children. European journal of pediatrics 2012;171:1415-1415. 105. Gominon A-L, Frison E, Hiriart J-B, Vergniol J, Clouzeau H, Enaud R, Bui S, et al. Assessment of liver disease progression in cystic fibrosis using transient elastography. Journal of pediatric gastroenterology and nutrition 2018;66:455-460. 106. Klotter V, Gunchick C, Siemers E, Rath T, Hudel H, Naehrlich L, Roderfeld M, et al. Assessment of pathologic increase in liver stiffness enables earlier diagnosis of CFLD: Results from a prospective longitudinal cohort study. PLOS ONE 2017;12:e0178784.
245
107. Shen QL, Chen YJ, Wang ZM, Zhang TC, Pang WB, Shu J, Peng CH. Assessment of liver fibrosis by Fibroscan as compared to liver biopsy in biliary atresia. World J Gastroenterol 2015;21:6931-6936. 108. Kim S, Kang Y, Lee MJ, Kim MJ, Han SJ, Koh H. Points to be considered when applying FibroScan S probe in children with biliary atresia. J Pediatr Gastroenterol Nutr 2014;59:624-628. 109. Ferraioli G, Calcaterra V, Lissandrin R, Guazzotti M, Maiocchi L, Tinelli C, De Silvestri A, et al. Noninvasive assessment of liver steatosis in children: the clinical value of controlled attenuation parameter. BMC Gastroenterol 2017;17:61. 110. Millonig G, Reimann FM, Friedrich S, Fonouni H, Mehrabi A, Büchler MW, Seitz HK, et al. Extrahepatic cholestasis increases liver stiffness (FibroScan) irrespective of fibrosis. Hepatology 2008;48:1718-1723.
111. Bota S, Herkner H, Sporea I, Salzl P, Sirli R, Neghina AM, Peck-Radosavljevic M.
Meta-analysis: ARFI elastography versus transient elastography for the evaluation of liver fibrosis. Liver International 2013;33:1138-1147. 112. D’Onofrio M, Crosara S, De Robertis R, Canestrini S, Demozzi E, Gallotti A, Pozzi Mucelli R. Acoustic radiation force impulse of the liver. World Journal of Gastroenterology : WJG 2013;19:4841-4849. 113. Karlas T, Neuschulz M, Oltmanns A, Güttler A, Petroff D, Wirtz H, Mainz JG, et al. Non-invasive evaluation of cystic fibrosis related liver disease in adults with ARFI, transient elastography and different fibrosis scores. PloS one 2012;7:e42139. 114. Behrens CB, Langholz JH, Eiler J, Jenewein R, Naehrlich L, Fuchs K, Harth S, et al. A pilot study of the characterization of hepatic tissue strain in children with cystic-fibrosis-associated liver disease (CFLD) by acoustic radiation force impulse imaging. Pediatric radiology 2013;43:552-557. 115. Manco M, Zupone CL, Alghisi F, D'Andrea ML, Lucidi V, Monti L. Pilot study on the use of acoustic radiation force impulse imaging in the staging of cystic fibrosis associated liver disease. Journal of Cystic Fibrosis 2012;11:427-432. 116. Bavu É, Gennisson J-L, Couade M, Bercoff J, Mallet V, Fink M, Badel A, et al. Noninvasive In Vivo Liver Fibrosis Evaluation Using Supersonic Shear Imaging: A Clinical Study on 113 Hepatitis C Virus Patients. Ultrasound in medicine & biology 2011;37:1361-1373. 117. Bercoff J, Tanter M, Fink M. Supersonic shear imaging: a new technique for soft tissue elasticity mapping. Ultrasonics, Ferroelectrics, and Frequency Control, IEEE Transactions on 2004;51:396-409. 118. Ferraioli G, Tinelli C, Zicchetti M, Above E, Poma G, Di Gregorio M, Filice C. Reproducibility of real-time shear wave elastography in the evaluation of liver elasticity. European journal of radiology 2012;81:3102-3106. 119. Ferraioli G, Tinelli C, Dal Bello B, Zicchetti M, Filice G, Filice C. Accuracy of real-time shear wave elastography for assessing liver fibrosis in chronic hepatitis C: a pilot study. Hepatology 2012;56:2125-2133. 120. Grădinaru-Taşcău O, Sporea I, Bota S, Jurchiş A, Popescu A, Popescu M, Şirli R, et al. Does experience play a role in the ability to perform liver stiffness measurements by means of supersonic shear imaging (SSI)? Med Ultrason 2013;15:180-183. 121. Madsen DH, Jürgensen HJ, Ingvarsen S, Melander MC, Vainer B, Egerod KL, Hald A, et al. Endocytic collagen degradation: a novel mechanism involved in protection against liver fibrosis. The Journal of pathology 2012;227:94-105. 122. Pereira TN, Lewindon PJ, Smith JL, Murphy TL, Lincoln DJ, Shepherd RW, Ramm GA. Serum markers of hepatic fibrogenesis in cystic fibrosis liver disease. J Hepatol 2004;41:576-583.
246
123. Rath T, Hage L, Kügler M, Menendez Menendez K, Zachoval R, Naehrlich L, Schulz R, et al. Serum proteome profiling identifies novel and powerful markers of cystic fibrosis liver disease. PloS one 2013;8:e58955. 124. Leung DH, Khan M, Minard CG, Guffey D, Ramm LE, Clouston AD, Miller G, et al. Aspartate aminotransferase to platelet ratio and fibrosis-4 as biomarkers in biopsy-validated pediatric cystic fibrosis liver disease. Hepatology 2015;62:1576-1583. 125. Chang J, Nicolas E, Marks D, Sander C, Lerro A, Buendia MA, Xu C, et al. miR-122, a mammalian liver-specific microRNA, is processed from hcr mRNA and maydownregulate the high affinity cationic amino acid transporter CAT-1. RNA biology 2004;1:106-113. 126. Lee RC, Feinbaum RL, Ambros V. The C. elegans heterochronic gene lin-4 encodes small RNAs with antisense complementarity to lin-14. Cell 1993;75:843-854. 127. Reinhart BJ, Slack FJ, Basson M, Pasquinelli AE, Bettinger JC, Rougvie AE, Horvitz HR, et al. The 21-nucleotide let-7 RNA regulates developmental timing in Caenorhabditis elegans. Nature 2000;403:901-906. 128.Pasquinelli AE, Reinhart BJ, Slack F, Martindale MQ, Kuroda MI, Maller B, Hayward DC, et al. Conservation of the sequence and temporal expression of let-7 heterochronic regulatory RNA. Nature 2000;408:86-89. 129. Lee RC, Ambros V. An extensive class of small RNAs in Caenorhabditis elegans. Science 2001;294:862-864. 130. Lau NC, Lim LP, Weinstein EG, Bartel DP. An abundant class of tiny RNAs with probable regulatory roles in Caenorhabditis elegans. Science 2001;294:858-862. 131. Lagos-Quintana M, Rauhut R, Lendeckel W, Tuschl T. Identification of novel genes coding for small expressed RNAs. Science 2001;294:853-858. 132. Bartel DP. MicroRNAs: genomics, biogenesis, mechanism, and function. cell 2004;116:281-297. 133. Cai X, Hagedorn CH, Cullen BR. Human microRNAs are processed from capped, polyadenylated transcripts that can also function as mRNAs. RNA 2004;10:1957-1966. 134. Lee Y, Kim M, Han J, Yeom KH, Lee S, Baek SH, Kim VN. MicroRNA genes are transcribed by RNA polymerase II. The EMBO journal 2004;23:4051-4060. 135. Lee Y, Jeon K, Lee JT, Kim S, Kim VN. MicroRNA maturation: stepwise processing and subcellular localization. The EMBO journal 2002;21:4663-4670. 136. Ruby JG, Jan CH, Bartel DP. Intronic microRNA precursors that bypass Drosha processing. Nature 2007;448:83-86. 137. Sun G, Yan J, Noltner K, Feng J, Li H, Sarkis DA, Sommer SS, et al. SNPs in human miRNA genes affect biogenesis and function. RNA 2009;15:1640-1651. 138. Han J, Lee Y, Yeom K-H, Kim Y-K, Jin H, Kim VN. The Drosha-DGCR8 complex in primary microRNA processing. Genes & development 2004;18:3016-3027. 139. Hannon GJ, Plasterk RHA, Denli AM, Tops BBJ, Ketting RF. Processing of primary microRNAs by the Microprocessor complex. Nature 2004;432:231-235. 140. Lee Y, Ahn C, Han J, Choi H, Kim J, Yim J, Lee J, et al. The nuclear RNase III Drosha initiates microRNA processing. Nature 2003;425:415-419. 141. Bohnsack MT, Czaplinski K, Gorlich D. Exportin 5 is a RanGTP-dependent dsRNA-binding protein that mediates nuclear export of pre-miRNAs. RNA 2004;10:185-191. 142. Lund E, Güttinger S, Calado A, Dahlberg JE, Kutay U. Nuclear Export of MicroRNA Precursors. Science 2004;303:95-98. 143.Caudy AA, Bernstein E, Hannon GJ, Hammond SM. Role for a bidentate ribonuclease in the initiation step of RNA interference. Nature 2001;409:363-366.

247
144. Hutvágner G, McLachlan J, Pasquinelli AE, Bálint É, Tuschl T, Zamore PD. A Cellular Function for the RNA-Interference Enzyme Dicer in the Maturation of the let-7 Small Temporal RNA. Science 2001;293:834-838. 145. Grishok A, Pasquinelli AE, Conte D, Li N, Parrish S, Ha I, Baillie DL, et al. Genes and Mechanisms Related to RNA Interference Regulate Expression of the Small Temporal RNAs that Control C. elegans Developmental Timing. Cell 2001;106:23-34. 146. Ketting RF, Fischer SE, Bernstein E, Sijen T, Hannon GJ, Plasterk RH. Dicer functions in RNA interference and in synthesis of small RNA involved in developmental timing in C. elegans. Genes & development 2001;15:2654-2659. 147. Chen PY, Meister G. microRNA-guided posttranscriptional gene regulation. Biological chemistry 2005;386:1205-1218. 148. Beach D, Bernstein E, Hammond SM, Hannon GJ. An RNA-directed nuclease mediates post-transcriptional gene silencing in Drosophila cells. Nature 2000;404:293-296. 149. Mourelatos Z, Dostie J, Paushkin S, Sharma A, Charroux B, Abel L, Rappsilber J, et al. miRNPs: a novel class of ribonucleoproteins containing numerous microRNAs. Genes & development 2002;16:720-728. 150. Schirle NT, MacRae IJ. The Crystal Structure of Human Argonaute2. Science 2012;336:1037-1040. 151. Simon B, Lingel A, Izaurralde E, Sattler M. Structure and nucleic-acid binding of the Drosophila Argonaute 2 PAZ domain. Nature 2003;426:465-469. 152. Kawamata T, Tomari Y. Making RISC. Trends in biochemical sciences 2010;35:368-376. 153. Förstemann K, Horwich MD, Wee L, Tomari Y, Zamore PD. Drosophila microRNAs Are Sorted into Functionally Distinct Argonaute Complexes after Production by Dicer-1. Cell 2007;130:287-297. 154. Iwasaki S, Paroo Z, Liu Q, Ye X, Tomari Y, Kawamata T, Yoda M. ATP-dependent human RISC assembly pathways. Nature Structural & Molecular Biology 2010;17:17-23. 155. Meister G, Landthaler M, Patkaniowska A, Dorsett Y, Teng G, Tuschl T. Human Argonaute2 Mediates RNA Cleavage Targeted by miRNAs and siRNAs. Molecular Cell 2004;15:185-197. 156. Song J-J, Smith SK, Hannon GJ, Joshua-Tor L. Crystal Structure of Argonaute and Its Implications for RISC Slicer Activity. Science 2004;305:1434-1437. 157. Tomari Y, Kawamata T, Seitz H. Structural determinants of miRNAs for RISC loading and slicer-independent unwinding. Nature Structural & Molecular Biology 2009;16:953-960. 158. Brennecke J, Stark A, Russell RB, Cohen SM. Principles of microRNA-target recognition. PLoS Biol 2005;3:e85. 159. Krek A, Grün D, Poy MN, Wolf R, Rosenberg L, Epstein EJ, MacMenamin P, et al. Combinatorial microRNA target predictions. Nature genetics 2005;37:495-500. 160. Lewis BP, Shih Ih, Jones-Rhoades MW, Bartel DP, Burge CB. Prediction of Mammalian MicroRNA Targets. Cell 2003;115:787-798. 161. Lewis BP, Burge CB, Bartel DP. Conserved seed pairing, often flanked by adenosines, indicates that thousands of human genes are microRNA targets. Cell 2005;120:15-20. 162. Grimson A, Farh KK-H, Johnston WK, Garrett-Engele P, Lim LP, Bartel DP. MicroRNA targeting specificity in mammals: determinants beyond seed pairing. Molecular cell 2007;27:91-105. 163. Baek D, Villén J, Shin C, Camargo FD, Gygi SP, Bartel DP. The impact of microRNAs on protein output. Nature 2008;455:64-71.

248
164. Friedman RC, Farh KK, Burge CB, Bartel DP. Most mammalian mRNAs are conserved targets of microRNAs. Genome Res 2009;19:92-105. 165. University of Manchester. miRBase. In; 2018. 166. Aherne ST, Madden SF, Hughes DJ, Pardini B, Naccarati A, Levy M, Vodicka P, et al. Circulating miRNAs miR-34a and miR-150 associated with colorectal cancer progression. BMC cancer 2015;15:329. 167. Salazar C, Calvopiña D, Punyadeera C. miRNAs in human papilloma virus associated oral and oropharyngeal squamous cell carcinomas. Expert Review of Molecular Diagnostics 2014;14:1033-1040. 168. Sinha SK, Sattar A. A Robust Approach to Identifying Differential Circulating miRNAs in Breast Cancer. International Journal of Statistics and Probability 2014;4. 169. Shen J, Wang A, Wang Q, Gurvich I, Siegel AB, Remotti H, Santella RM. Exploration of genome-wide circulating microRNA in hepatocellular carcinoma: MiR-483-5p as a potential biomarker. Cancer epidemiology, biomarkers & prevention : a publication of the American Association for Cancer Research, cosponsored by the American Society of Preventive Oncology 2013;22:2364-2373. 170. Miller CL, Haas U, Diaz R, Leeper NJ, Kundu RK, Patlolla B, Assimes TL, et al. Coronary heart disease-associated variation in TCF21 disrupts a miR-224 binding site and miRNA-mediated regulation. PLoS genetics 2014;10:e1004263. 171. Ren J, Zhang J, Xu N, Han G, Geng Q, Song J, Li S, et al. Signature of circulating microRNAs as potential biomarkers in vulnerable coronary artery disease. PloS One 2013;8:e80738. 172. Wang F, Long G, Zhao C, Li H, Chaugai S, Wang Y, Chen C, et al. Atherosclerosis-related circulating miRNAs as novel and sensitive predictors for acute myocardial infarction. PloS One 2014;9:e105734. 173. Fenoglio C, Ridolfi E, Cantoni C, De Riz M, Bonsi R, Serpente M, Villa C, et al. Decreased circulating miRNA levels in patients with primary progressive multiple sclerosis. Multiple Sclerosis Journal 2013;19:1938-1942.
174. Punga T, Panse R, Andersson M, Truffault F, Berrih-Aknin S, Punga AR. Circulating
miRNAs in myasthenia gravis: miR-150-5p as a new potential biomarker. Annals of Clinical and Translational Neurology 2014;1:49-58. 175. Zeng L, Cui J, Wu H, Lu Q. The emerging role of circulating microRNAs as biomarkers in autoimmune diseases. Autoimmunity 2014;47:419-429. 176. Arataki K, Hayes CN, Akamatsu S, Akiyama R, Abe H, Tsuge M, Miki D, et al.
Circulating microRNA-22 correlates with microRNA-122 and represents viral replication and liver injury in patients with chronic hepatitis B. Journal of Medical Virology 2013;85:789-798. 177. El-Diwany R, Wasilewski LN, Witwer KW, Bailey JR, Page K, Ray SC, Cox AL, et al. Acute Hepatitis C Virus Infection Induces Consistent Changes in Circulating MicroRNAs That Are Associated with Nonlytic Hepatocyte Release. Journal of virology 2015;89:9454.
178. Shrivastava S, Petrone J, Steele R, Lauer GM, Bisceglie AM, Ray RB. Up-regulation
of circulating miR-20a is correlated with hepatitis C virus-mediated liver disease progression. Hepatology 2013;58:863-871. 179. Sinigaglia A, Lavezzo E, Trevisan M, Sanavia T, Di Camillo B, Peta E, Scarpa M, et al. Changes in microRNA expression during disease progression in patients with chronic viral hepatitis. Liver International 2015;35:1324-1333. 180. Ben-Dov IZ, Tan Y-C, Morozov P, Wilson PD, Rennert H, Blumenfeld JD, Tuschl T. Urine microRNA as potential biomarkers of autosomal dominant polycystic kidney

249
disease progression: description of miRNA profiles at baseline. PloS One 2014;9:e86856. 181. Burgos KL, Javaherian A, Bomprezzi R, Ghaffari L, Rhodes S, Courtright A, Tembe W, et al. Identification of extracellular miRNA in human cerebrospinal fluid by next-generation sequencing. RNA 2013;19:712-722. 182. Liu TE, Cheng W, Gao Y, Wang HUI, Liu Z. Microarray analysis of microRNA expression patterns in the semen of infertile men with semen abnormalities. Molecular Medicine Reports 2012;6:535-542. 183. Salazar C, Nagadia R, Pandit P, Cooper-White J, Banerjee N, Dimitrova N, Coman WB, et al. A novel saliva-based microRNA biomarker panel to detect head and neck cancers. Cellular Oncology 2014;37:331-338. 184. Takeshita N, Hoshino I, Mori M, Akutsu Y, Hanari N, Yoneyama Y, Ikeda N, et al. Serum microRNA expression profile: miR-1246 as a novel diagnostic and prognostic biomarker for oesophageal squamous cell carcinoma. British journal of cancer 2013;108:644-652. 185. Wang K, Yuan Y, Cho J-H, McClarty S, Baxter D, Galas DJ. Comparing the MicroRNA spectrum between serum and plasma. PloS One 2012;7:e41561.
186. Wang L, Lv J, Guo C, Li H, Xiong C. Recovery of cell-free mRNA and microRNA from human semen based on their physical nature. Biotechnology and Applied Biochemistry 2014;61:342-348. 187. Yang Y, Li Y-x, Yang X, Jiang L, Zhou Z-j, Zhu Y-q. Progress risk assessment of oral premalignant lesions with saliva miRNA analysis. BMC cancer 2013;13:129-129. 188. Turchinovich A, Weiz L, Langheinz A, Burwinkel B. Characterization of extracellular circulating microRNA. Nucleic acids research 2011:254. 189. Chen X, Liang H, Zhang C-Y, Zhang J, Zen K. Secreted microRNAs: a new form of intercellular communication. Trends in Cell Biology 2012;22:125-132. 190. Valadi H, Sjöstrand M, Bossios A, Ekström K, Lee JJ, Lötvall JO, Sahlgrenska a, et al. Exosome-mediated transfer of mRNAs and microRNAs is a novel mechanism of genetic exchange between cells. Nature Cell Biology 2007;9:654-659. 191. Corsten MF, Dennert R, Jochems S, Kuznetsova T, Devaux Y, Hofstra L, Wagner DR, et al. Circulating MicroRNA-208b and MicroRNA-499 Reflect Myocardial Damage in Cardiovascular Disease. Circulation: Cardiovascular Genetics 2010;3:499-506. 192. Pritchard CC, Kroh E, Wood B, Arroyo JD, Dougherty KJ, Miyaji MM, Tait JF, et al. Blood cell origin of circulating microRNAs: a cautionary note for cancer biomarker studies. Cancer prevention research 2012;5:492-497. 193. Zhang Y, Jia Y, Zheng R, Guo Y, Wang Y, Guo H, Fei M, et al. Plasma microRNA-122 as a biomarker for viral-, alcohol-, and chemical-related hepatic diseases. Clinical chemistry 2010;56:1830-1838. 194. Reid G, Kirschner MB, van Zandwijk N. Circulating microRNAs: Association with disease and potential use as biomarkers. Critical Reviews in Oncology / Hematology 2011;80:193-208. 195. Calvopina D, Coleman M, Lewindon P, Ramm G. Function and Regulation of MicroRNAs and Their Potential as Biomarkers in Paediatric Liver Disease. International Journal of Molecular Sciences 2016;17:1795. 196. Hand NJ, Master ZR, Le Lay J, Friedman JR. Hepatic function is preserved in the absence of mature microRNAs. Hepatology 2009;49:618-626. 197. Cermelli S, Ruggieri A, Marrero JA, Ioannou GN, Beretta L. Circulating MicroRNAs in Patients with Chronic Hepatitis C and Non-Alcoholic Fatty Liver Disease. PLOS ONE 2011;6:e23937.
250
198. Bihrer V, Friedrich-Rust M, Kronenberger B, Forestier N, Haupenthal J, Shi Y, Peveling-Oberhag J, et al. Serum miR-122 as a biomarker of necroinflammation in patients with chronic hepatitis C virus infection. The American journal of gastroenterology 2011;106:1663-1669. 199. Qu KZ, Zhang K, Li H, Afdhal NH, Albitar M. Circulating microRNAs as biomarkers for hepatocellular carcinoma. Journal of clinical gastroenterology 2011;45:355-360. 200. Cook NL, Pereira TN, Lewindon PJ, Shepherd RW, Ramm GA. Circulating MicroRNAs as Non-Invasive Diagnostic Biomarkers of Liver Disease in Children With Cystic Fibrosis. Journal of pediatric gastroenterology and nutrition 2014;60:247-254. 201. Dietrich CF, Bamber J, Berzigotti A, Bota S, Cantisani V, Castera L, Cosgrove D, et al. EFSUMB Guidelines and Recommendations on the Clinical Use of Liver Ultrasound Elastography, Update 2017 (Long Version). Ultraschall in Med 2017;38:e16-e47. 202. Ferraioli G, Filice C, Castera L, Choi BI, Sporea I, Wilson SR, Cosgrove D, et al. WFUMB guidelines and recommendations for clinical use of ultrasound elastography: Part 3: liver. Ultrasound in medicine & biology 2015;41:1161-1179. 203. Poynard T, Munteanu M, Luckina E, Perazzo H, Ngo Y, Royer L, Fedchuk L, et al. Liver fibrosis evaluation using real-time shear wave elastography: Applicability and diagnostic performance using methods without a gold standard. Journal of Hepatology 2013;58:928-935. 204. Franchi-Abella S, Corno L, Gonzales E, Antoni G, Fabre M, Ducot B, Pariente D, et al. Feasibility and Diagnostic Accuracy of Supersonic Shear-Wave Elastography for the Assessment of Liver Stiffness and Liver Fibrosis in Children: A Pilot Study of 96 Patients. Radiology 2016;278:554-562. 205. Tirnitz-Parker JE, Tonkin JN, Knight B, Olynyk JK, Yeoh GC. Isolation, culture and immortalisation of hepatic oval cells from adult mice fed a choline-deficient, ethionine-supplemented diet. The international journal of biochemistry & cell biology 2007;39:2226-2239. 206. Xu L, Hui A, Albanis E, Arthur M, O’byrne S, Blaner W, Mukherjee P, et al. Human hepatic stellate cell lines, LX-1 and LX-2: new tools for analysis of hepatic fibrosis. Gut 2005;54:142-151. 207. Wani S, Cloonan N. Profiling direct mRNA-microRNA interactions using synthetic biotinylated microRNA-duplexes. bioRxiv 2014:005439. 208. Kirschner MB, Kao SC, Edelman JJ, Armstrong NJ, Vallely MP, van Zandwijk N, Reid G. Haemolysis during sample preparation alters microRNA content of plasma. PLoS One 2011;6:e24145. 209. Kroh EM, Parkin RK, Mitchell PS, Tewari M. Analysis of circulating microRNA biomarkers in plasma and serum using quantitative reverse transcription-PCR (qRT-PCR). Methods 2010;50:298-301. 210. Busk PK. A tool for design of primers for microRNA-specific quantitative RT-qPCR. BMC Bioinformatics 2014;15:29. 211. Vandesompele J, De Preter K, Pattyn F, Poppe B, Van Roy N, De Paepe A, Speleman F. Accurate normalization of real-time quantitative RT-PCR data by geometric averaging of multiple internal control genes. Genome biology 2002;3:research0034. 0031. 212. Jensen J, Ørntoft T. Normalization of real-time quantitative RT-PCR data: a model based variance estimation approach to identify genes suited for normalization-applied to bladder-and colon-cancer data-sets. Cancer Research 2004;64:5245-5250. 213. Shi J, Dong M, Li L, Liu L, Luz-Madrigal A, Tsonis PA, Del Rio-Tsonis K, et al. mirPRo-a novel standalone program for differential expression and variation analysis of miRNAs. Sci Rep 2015;5:14617.

251
214. Team R Core. R: A language and environment for statistical computing. Vienna, Austria: R Foundation for Statistical Computing; 2014. In; 2014. 215. Love MI, Huber W, Anders S. Moderated estimation of fold change and dispersion for RNA-seq data with DESeq2. Genome biology 2014;15:550. 216. DeLuca DS, Levin JZ, Sivachenko A, Fennell T, Nazaire MD, Williams C, Reich M, et al. RNA-SeQC: RNA-seq metrics for quality control and process optimization. Bioinformatics 2012;28:1530-1532. 217. Martin M. Cutadapt removes adapter sequences from high-throughput sequencing reads. EMBnet. journal 2011;17:pp. 10-12. 218. Dobin A, Davis CA, Schlesinger F, Drenkow J, Zaleski C, Jha S, Batut P, et al. STAR: ultrafast universal RNA-seq aligner. Bioinformatics 2013;29:15-21. 219. Li B, Dewey CN. RSEM: accurate transcript quantification from RNA-Seq data with or without a reference genome. BMC bioinformatics 2011;12:323. 220. Robinson MD, McCarthy DJ, Smyth GK. edgeR: a Bioconductor package for differential expression analysis of digital gene expression data. Bioinformatics 2010;26:139-140. 221. Hart SN, Therneau TM, Zhang Y, Poland GA, Kocher JP. Calculating sample size estimates for RNA sequencing data. J Comput Biol 2013;20:970-978. 222. Harrell FE, Jr., Lee KL, Mark DB. Multivariable prognostic models: issues in developing models, evaluating assumptions and adequacy, and measuring and reducing errors. Stat Med 1996;15:361-387. 223. Obuchowski NA, Goske MJ, Applegate KE. Assessing physicians' accuracy in diagnosing paediatric patients with acute abdominal pain: measuring accuracy for multiple diseases. Stat Med 2001;20:3261-3278. 224. Yoon JH, Lee JM, Han JK, Choi BI. Shear wave elastography for liver stiffness measurement in clinical sonographic examinations: evaluation of intraobserver reproducibility, technical failure, and unreliable stiffness measurements. J Ultrasound Med 2014;33:437-447. 225. Canas T, Macia A, Munoz-Codoceo RA, Fontanilla T, Gonzalez-Rios P, Miralles M, Gomez-Mardones G. Hepatic and Splenic Acoustic Radiation Force Impulse Shear Wave Velocity Elastography in Children with Liver Disease Associated with Cystic Fibrosis. Biomed Res Int 2015;2015:517369. 226. Agarwal V, Bell GW, Nam J-W, Bartel DP. Predicting effective microRNA target sites in mammalian mRNAs. E-life 2015;4:e05005. 227. Moyer K, Balistreri W. Hepatobiliary disease in patients with cystic fibrosis. Current opinion in gastroenterology 2009;25:272-278. 228. Lindblad A, Glaumann H, Strandvik B. Natural history of liver disease in cystic fibrosis. Hepatology 1999;30:1151-1158. 229. Haller W, Ledder O, Lewindon PJ, Couper R, Gaskin KJ, Oliver M. Cystic fibrosis: an update for clinicians. Part 1: nutrition and gastrointestinal complications. Journal of gastroenterology and hepatology 2014;29:1344-1355. 230. Rowland M, Gallagher C, Gallagher CG, Laoide RÓ, Canny G, Broderick AM, Drummond J, et al. Outcome in patients with cystic fibrosis liver disease. Journal of cystic fibrosis 2015;14:120-126. 231. Regev A, Berho M, Jeffers LJ, Milikowski C, Molina EG, Pyrsopoulos NT, Feng Z-Z, et al. Sampling error and intraobserver variation in liver biopsy in patients with chronic HCV infection. The American journal of gastroenterology 2002;97:2614. 232. Calvopina DA, Chatfield MD, Weis A, Coleman MA, Fernandez-Rojo MA, Noble C, Ramm LE, et al. MicroRNA Sequencing Identifies a Serum MicroRNA Panel, Which
252
Combined With Aspartate Aminotransferase to Platelet Ratio Index Can Detect and Monitor Liver Disease in Pediatric Cystic Fibrosis. Hepatology 2018;68:2301-2316. 233. Sandrin L, Tanter M, Catheline S, Fink M. Shear modulus imaging with 2-D transient elastography. IEEE Transactions on Ultrasonics, Ferroelectrics, and Frequency Control 2002;49:426-435. 234. Bamber J, Cosgrove D, Dietrich CF, Fromageau J, Bojunga J, Calliada F, Cantisani V, et al. EFSUMB guidelines and recommendations on the clinical use of ultrasound elastography. Part 1: Basic principles and technology. Ultraschall Med 2013;34:169-184. 235. Menten R, Leonard A, Clapuyt P, Vincke P, Nicolae A-C, Lebecque P. Transient elastography in patients with cystic fibrosis. Pediatric Radiology 2010;40:1231-1235. 236. Van Biervliet S, Verdievel H, Vande Velde S, De Bruyne R, De Looze D, Verhelst X, Geerts A, et al. Longitudinal Transient Elastography Measurements Used in Follow-up for Patients with Cystic Fibrosis. Ultrasound in Medicine & Biology 2016;42:848-854. 237. Aqul A, Jonas MM, Harney S, Raza R, Sawicki GS, Mitchell PD, Fawaz R. Correlation of Transient Elastography With Severity of Cystic Fibrosis–related Liver Disease. Journal of Pediatric Gastroenterology and Nutrition 2017;64:505-511. 238. Monti L, Manco M, Lo Zupone C, Latini A, D'Andrea ML, Alghisi F, Lucidi V, et al. Acoustic radiation force impulse (ARFI) imaging with Virtual Touch Tissue Quantification in liver disease associated with cystic fibrosis in children. Radiol Med 2012;117:1408-1418. 239. Friedrich-Rust M, Schlueter N, Smaczny C, Eickmeier O, Rosewich M, Feifel K, Herrmann E, et al. Non-invasive measurement of liver and pancreas fibrosis in patients with cystic fibrosis. Journal of Cystic Fibrosis 2013;12:431-439. 240. Lamireau T, Monnereau S, Martin S, Marcotte JE, Winnock M, Alvarez F. Epidemiology of liver disease in cystic fibrosis: a longitudinal study. J Hepatol 2004;41:920-925. 241. Zhou LY, Jiang H, Shan QY, Chen D, Lin XN, Liu BX, Xie XY. Liver stiffness measurements with supersonic shear wave elastography in the diagnosis of biliary atresia: a comparative study with grey-scale US. Eur Radiol 2017;27:3474-3484. 242. Tutar O, Beser ÖF, Adaletli I, Tunc N, Gulcu D, Kantarci F, Mihmanli I, et al. Shear Wave Elastography in the Evaluation of Liver Fibrosis in Children. Journal of Pediatric Gastroenterology and Nutrition 2014;58:750-755. 243. Piscaglia F, Salvatore V, Mulazzani L, Cantisani V, Colecchia A, Di Donato R, Felicani C, et al. Corrigendum to "Differences in liver stiffness values obtained with new ultrasound elastography machines and fibroscan: A comparative study". Dig Liver Dis 2018;50:633. 244. Cassinotto C, Boursier J, de Ledinghen V, Lebigot J, Lapuyade B, Cales P, Hiriart JB, et al. Liver stiffness in nonalcoholic fatty liver disease: A comparison of supersonic shear imaging, FibroScan, and ARFI with liver biopsy. Hepatology 2016;63:1817-1827. 245. Cassinotto C, Lapuyade B, Mouries A, Hiriart JB, Vergniol J, Gaye D, Castain C, et al. Non-invasive assessment of liver fibrosis with impulse elastography: comparison of Supersonic Shear Imaging with ARFI and FibroScan(R). J Hepatol 2014;61:550-557. 246. Kim JR, Suh CH, Yoon HM, Lee JS, Cho YA, Jung AY. The diagnostic performance of shear-wave elastography for liver fibrosis in children and adolescents: A systematic review and diagnostic meta-analysis. Eur Radiol 2018;28:1175-1186. 247. Hou J, Lin L, Zhou W, Wang Z, Ding G, Dong Q, Qin L, et al. Identification of miRNomes in Human Liver and Hepatocellular Carcinoma Reveals miR-199a/b-3p as Therapeutic Target for Hepatocellular Carcinoma. Cancer Cell 2011;19:232-243. 248. Szabo G, Bala S. MicroRNAs in liver disease. Nat Rev Gastroenterol Hepatol 2013;10:542-552.

253
249. Kendziorski C, Irizarry RA, Chen KS, Haag JD, Gould MN. On the utility of pooling biological samples in microarray experiments. Proc Natl Acad Sci U S A 2005;102:4252-4257. 250. Zhang W, Carriquiry A, Nettleton D, Dekkers JC. Pooling mRNA in microarray experiments and its effect on power. Bioinformatics 2007;23:1217-1224. 251. Rieger JK, Klein K, Winter S, Zanger UM. Expression variability of ADME-related microRNAs in human liver: influence of non-genetic factors and association with gene expression. Drug Metabolism and Disposition 2013:dmd. 113.052126. 252. Zhu D, He X, Duan Y, Chen J, Wang J, Sun X, Qian H, et al. Expression of microRNA-454 in TGF-β1-stimulated hepatic stellate cells and in mouse livers infected with Schistosoma japonicum. Parasites & vectors 2014;7:1. 253. Vuppalanchi R, Liang T, Goswami CP, Nalamasu R, Li L, Jones D, Wei R, et al. Relationship between differential hepatic microRNA expression and decreased hepatic cytochrome P450 3A activity in cirrhosis. PLoS One 2013;8:e74471. 254. Yang H, Cho ME, Li TW, Peng H, Ko KS, Mato JM, Lu SC. MicroRNAs regulate methionine adenosyltransferase 1A expression in hepatocellular carcinoma. The Journal of clinical investigation 2013;123:285-298. 255. Yu F, Zhou G, Li G, Chen B, Dong P, Zheng J. Serum miR-181b Is correlated with Hepatitis B virus replication and disease progression in chronic Hepatitis B patients. Digestive diseases and sciences 2015;60:2346-2352. 256. Chen Y-J, Zhu J-M, Wu H, Fan J, Zhou J, Hu J, Yu Q, et al. Circulating microRNAs as a fingerprint for liver cirrhosis. PloS one 2013;8:e66577. 257. Wang B, Hsu S-H, Majumder S, Kutay H, Huang W, Jacob ST, Ghoshal K. TGFβ-mediated upregulation of hepatic miR-181b promotes hepatocarcinogenesis by targeting TIMP3. Oncogene 2010;29:1787-1797. 258. Liu Z, Yi J, Ye R, Liu J, Duan Q, Xiao J, Liu F. miR-144 regulates transforming growth factor-β1 iduced hepatic stellate cell activation in human fibrotic liver. International journal of clinical and experimental pathology 2015;8:3994. 259. Wang TH, Yeh CT, Ho JY, Ng KF, Chen TC. OncomiR miR-96 and miR-182 promote cell proliferation and invasion through targeting ephrinA5 in hepatocellular carcinoma. Molecular carcinogenesis 2016;55:366-375. 260. Baik SH, Lee J, Lee Y-S, Jang J-Y, Kim C-W. ANT2 shRNA downregulates miR-19a and miR-96 through the PI3K/Akt pathway and suppresses tumor growth in hepatocellular carcinoma cells. Experimental & molecular medicine 2016;48:e222. 261. Feng X, Tan W, Cheng S, Wang H, Ye S, Yu C, He Y, et al. Upregulation of microRNA-126 in Hepatic Stellate Cells May Affect Pathogenesis of Liver Fibrosis Through the NF-κB Pathway. DNA and cell biology 2015;34:470-480.
262. Bowen T, Jenkins RH, Fraser DJ. MicroRNAs, transforming growth factor beta-1, and tissue fibrosis. The Journal of pathology 2013;229:274-285. 263. Xiao Y, Wang J, Chen Y, Zhou K, Wen J, Wang Y, Zhou Y, et al. Up-regulation of miR-200b in biliary atresia patients accelerates proliferation and migration of hepatic stallate cells by activating PI3K/Akt signaling. Cellular signalling 2014;26:925-932. 264. Schmuck RB, Reutzel-Selke A, Raschzok N, Morgul HM, Struecker B, Lippert S, de Carvalho Fischer C, et al. Bile: miRNA pattern and protein-based biomarkers may predict acute cellular rejection after liver transplantation. Biomarkers 2016:1-9. 265. Bao C, Li Y, Huan L, Zhang Y, Zhao F, Wang Q, Liang L, et al. NF-kB signaling relieves negative regulation by miR-194 in hepatocellular carcinoma by suppressing the transcription factor HNF-1o. Sci Signal 2015;8:387. 266. Chang Y, Liu C, Yang J, Liu G, Feng F, Tang J, Hu L, et al. MiR-20a triggers metastasis of gallbladder carcinoma. Journal of hepatology 2013;59:518-527.

254
267. Zhu H, Han C, Lu D, Wu T. miR-17-92 cluster promotes cholangiocarcinoma growth: evidence for PTEN as downstream target and IL-6/Stat3 as upstream activator. The American journal of pathology 2014;184:2828-2839. 268. Chen K-j, Hou Y, Wang K, Li J, Xia Y, Yang X-y, Lv G, et al. Reexpression of Let-7g microRNA inhibits the proliferation and migration via K-Ras/HMGA2/snail axis in hepatocellular carcinoma. BioMed research international 2014;2014. 269. Ji J, Zhao L, Budhu A, Forgues M, Jia HL, Qin LX, Ye QH, et al. Let-7g targets collagen type I alpha2 and inhibits cell migration in hepatocellular carcinoma. J Hepatol 2010;52:690-697. 270. Yu M, Lin Y, Zhou Y, Jin H, Hou B, Wu Z, Li Z, et al. Mir-144 suppresses cell proliferation, migration, and invasion in hepatocellular carcinoma by targeting SMAD4. OncoTargets and therapy 2016;9:4705. 271. Cao T, Li H, Hu Y, Ma D, Cai X. miR-144 suppresses the proliferation and metastasis of hepatocellular carcinoma by targeting E2F3. Tumor Biology 2014;35:10759-10764. 272. Zhang Y, Cheng X, Lu Z, Wang J, Chen H, Fan W, Gao X, et al. Upregulation of miR-15b in NAFLD models and in the serum of patients with fatty liver disease. Diabetes research and clinical practice 2013;99:327-334. 273. Zhang Y, Huang F, Wang J, Peng L, Luo H. MiR-15b mediates liver cancer cells proliferation through targeting BCL-2. International journal of clinical and experimental pathology 2015;8:15677. 274. Santosa D, Castoldi M, Paluschinski M, Sommerfeld A, Häussinger D. Hyperosmotic stress activates the expression of members of the miR-15/107 family and induces downregulation of anti-apoptotic genes in rat liver. Scientific reports 2015;5. 275. Yu F, Lu Z, Huang K, Wang X, Xu Z, Chen B, Dong P, et al. MicroRNA-17-5p-activated Wnt/β-catenin pathway contributes to the progression of liver fibrosis. Oncotarget 2016;7:81. 276. Yu F, Guo Y, Chen B, Dong P, Zheng J. MicroRNA-17-5p activates hepatic stellate cells through targeting of Smad7. Laboratory Investigation 2015;95:781-789. 277. Tan Y, Pan T, Ye Y, Ge G, Chen L, Wen D, Zou S. Serum microRNAs as potential biomarkers of primary biliary cirrhosis. PloS one 2014;9:e111424. 278. Sohn W, Kim J, Kang SH, Yang SR, Cho J-Y, Cho HC, Shim SG, et al. Serum exosomal microRNAs as novel biomarkers for hepatocellular carcinoma. Experimental & molecular medicine 2015;47:e184. 279. Zhu B, Wei X-x, Wang T-b, Zhou Y-c, Liu A-m, Zhang G-w. Increased miR-16 expression induced by hepatitis C virus infection promotes liver fibrosis through downregulation of hepatocyte growth factor and Smad7. Archives of virology 2015;160:2043-2050. 280. Lu L, Wang J, Lu H, Zhang G, Liu Y, Wang J, Zhang Y, et al. MicroRNA-130a and-130b enhance activation of hepatic stellate cells by suppressing PPARγ expression: A rat fibrosis model study. Biochemical and biophysical research communications 2015;465:387-393. 281. Celikbilek M, Baskol M, Taheri S, Deniz K, Dogan S, Zararsiz G, Gursoy S, et al. Circulating microRNAs in patients with non-alcoholic fatty liver disease. World J Hepatol 2014;6:613-620. 282. Bala S, Csak T, Saha B, Zatsiorsky J, Kodys K, Catalano D, Satishchandran A, et al. The pro-inflammatory effects of miR-155 promote liver fibrosis and alcohol-induced steatohepatitis. Journal of hepatology 2016;64:1378-1387.

255
283. Csak T, Bala S, Lippai D, Kodys K, Catalano D, Iracheta-Vellve A, Szabo G. MicroRNA-155 deficiency attenuates liver steatosis and fibrosis without reducing inflammation in a mouse model of steatohepatitis. PloS one 2015;10:e0129251. 284. Dai W, Wu K, Tang N, Zhao J, Zeng X, Ye C, Shi J, et al. mir-155 attenuates activation of Hsc by simultaneously preventing Emt process and Erk1 pathway. Journal of Gastroenterology and Hepatology 2013;28:176-177. 285. Sun B, Li J, Shao D, Pan Y, Chen Y, Li S, Yao X, et al. Adipose tissue-secreted miR-27a promotes liver cancer by targeting FOXO1 in obese individuals. OncoTargets and therapy 2015;8:735. 286. Bhattacharya S, Steele R, Shrivastava S, Chakraborty S, Di Bisceglie AM, Ray RB. Serum miR-30e and miR-223 as Novel Noninvasive Biomarkers for Hepatocellular Carcinoma. The American journal of pathology 2016;186:242-247.
287. Jung KH, Zhang J, Zhou C, Shen H, Gagea M, Rodriguez-Aguayo C, Lopez-Berestein G, et al. Differentiation therapy for hepatocellular carcinoma: Multifaceted
effects of miR-148a on tumor growth and phenotype and liver fibrosis. Hepatology 2016. 288. Dai B, Geng L, Wang Y, Sui C, Xie F, Shen R, Shen W, et al. microRNA-199a-5p protects hepatocytes from bile acid-induced sustained endoplasmic reticulum stress. Cell death & disease 2013;4:e604. 289. Chen L, Chen R, Velazquez VM, Brigstock DR. Fibrogenic signaling is suppressed in hepatic stellate cells through targeting of connective tissue growth factor (CCN2) by cellular or exosomal microRNA-199a-5p. The American journal of pathology 2016;186:2921-2933. 290. Cardenas CLL, Henaoui IS, Courcot E, Roderburg C, Cauffiez C, Aubert S, Copin M-C, et al. miR-199a-5p Is upregulated during fibrogenic response to tissue injury and mediates TGFbeta-induced lung fibroblast activation by targeting caveolin-1. PLoS Genet 2013;9:e1003291.
291. Zhao S, Zhang Y, Zheng X, Tu X, Li H, Chen J, Zang Y, et al. Loss of MicroRNA-101 Promotes Epithelial to Mesenchymal Transition in Hepatocytes. Journal of cellular physiology 2015;230:2706-2717.
292. Tu X, Zhang H, Zhang J, Zhao S, Zheng X, Zhang Z, Zhu J, et al. MicroRNA-101 suppresses liver fibrosis by targeting the TGFβ signalling pathway. The Journal of pathology 2014;234:46-59. 293. Katsumi T, Ninomiya M, Nishina T, Mizuno K, Tomita K, Haga H, Okumoto K, et al. MiR-139-5p is associated with inflammatory regulation through c-FOS suppression, and contributes to the progression of primary biliary cholangitis. Laboratory Investigation 2016. 294. Qiu G, Lin Y, Zhang H, Wu D. miR-139-5p inhibits epithelial–mesenchymal transition, migration and invasion of hepatocellular carcinoma cells by targeting ZEB1 and ZEB2. Biochemical and biophysical research communications 2015;463:315-321. 295. Marzioni M, Agostinelli L, Candelaresi C, Saccomanno S, Minicis S, Maroni L,
Mingarelli E, et al. Activation of the developmental pathway neurogenin-3/microRNA-7a regulates cholangiocyte proliferation in response to injury. Hepatology 2014;60:1324-1335. 296. Leung WK, He M, Chan AW, Law PT, Wong N. Wnt/β-Catenin activates MiR-183/96/182 expression in hepatocellular carcinoma that promotes cell invasion. Cancer letters 2015;362:97-105. 297. Li J, Fu H, Xu C, Tie Y, Xing R, Zhu J, Qin Y, et al. miR-183 inhibits TGF-β1-induced apoptosis by downregulation of PDCD4 expression in human hepatocellular carcinoma cells. BMC cancer 2010;10:1.

256
298. Peng X, Yang L, Liu H, Pang S, Chen Y, Fu J, Chen Y, et al. Identification of Circulating MicroRNAs in Biliary Atresia by Next-Generation Sequencing. Journal of pediatric gastroenterology and nutrition 2016. 299. Winther TN, Bang-Berthelsen CH, Heiberg IL, Pociot F, Hogh B. Differential plasma microRNA profiles in HBeAg positive and HBeAg negative children with chronic hepatitis B. PloS One 2013;8:e58236. 300. Thompson MD, Cismowski MJ, Serpico M, Pusateri A, Brigstock DR. Elevation of circulating microRNA levels in obese children compared to healthy controls. Clin Obes 2017;7:216-221. 301. Salvoza NC, Klinzing DC, Gopez-Cervantes J, Baclig MO. Association of Circulating Serum miR-34a and miR-122 with Dyslipidemia among Patients with Non-Alcoholic Fatty Liver Disease. PLOS ONE 2016;11:e0153497. 302. Chen H, Sun Y, Dong R, Yang S, Pan C, Xiang D, Miao M, et al. Mir-34a Is Upregulated during Liver Regeneration in Rats and Is Associated with the Suppression of Hepatocyte Proliferation. PLOS ONE 2011;6:e20238. 303. Wan Y, McDaniel K, Wu N, Ramos-Lorenzo S, Glaser T, Venter J, Francis H, et al. Regulation of Cellular Senescence by miR-34a in Alcoholic Liver Injury. The American Journal of Pathology 2017;187:2788-2798. 304. Kwon H, Song K, Han C, Zhang J, Lu L, Chen W, Wu T. Epigenetic Silencing of miRNA-34a in Human Cholangiocarcinoma via EZH2 and DNA Methylation: Impact on Regulation of Notch Pathway. Am J Pathol 2017;187:2288-2299. 305. Bessho K, Shanmukhappa K, Sheridan R, Shivakumar P, Mourya R, Walters S, Kaimal V, et al. Integrative genomics identifies candidate microRNAs for pathogenesis of experimental biliary atresia. BMC systems biology 2013;7:104-104. 306. Winther TN, Jacobsen KS, Mirza AH, Heiberg IL, Bang-Berthelsen CH, Pociot F, Hogh B. Circulating MicroRNAs in Plasma of Hepatitis B e Antigen Positive Children Reveal Liver-Specific Target Genes. International journal of hepatology 2014;2014:791045. 307. Tsang FH-C, Au SL-K, Wei L, Fan DN-Y, Lee JM-F, Wong CC-L, Ng IO-L, et al. MicroRNA-142-3p and microRNA-142-5p are downregulated in hepatocellular carcinoma and exhibit synergistic effects on cell motility. Frontiers of Medicine 2015;9:331-343. 308. Lan FF, Wang H, Chen YC, Chan CY, Ng SS, Li K, Xie D, et al. Hsa-let-7g inhibits proliferation of hepatocellular carcinoma cells by downregulation of c-Myc and upregulation of p16(INK4A). Int J Cancer 2011;128:319-331. 309. Yang X, Dan X, Men R, Ma L, Wen M, Peng Y, Yang L. MiR-142-3p blocks TGF-β-induced activation of hepatic stellate cells through targeting TGFβRI. Life Sciences 2017;187:22-30. 310. Lambert J, Halfon P, Penaranda G, Bedossa P, Cacoub P, Carrat F. How to measure the diagnostic accuracy of noninvasive liver fibrosis indices: the area under the ROC curve revisited. Clin Chem 2008;54:1372-1378. 311. Slieker MG, van der Doef HPJ, Deckers-Kocken JM, van der Ent CK, Houwen RHJ. Pulmonary prognosis in cystic fibrosis patients with liver disease. The Journal of Pediatrics 2006;149:144. 312. Chen X, Liang H, Guan D, Wang C, Hu X, Cui L, Chen S, et al. A combination of Let-7d, Let-7g and Let-7i serves as a stable reference for normalization of serum microRNAs. PLoS One 2013;8:e79652. 313. Song J, Bai Z, Han W, Zhang J, Meng H, Bi J, Ma X, et al. Identification of suitable reference genes for qPCR analysis of serum microRNA in gastric cancer patients. Dig Dis Sci 2012;57:897-904.

257
314. Bartel DP. MicroRNAs: target recognition and regulatory functions. Cell 2009;136. 315. Itoh T, Miyajima A. Liver regeneration by stem/progenitor cells. Hepatology 2014;59:1617-1626. 316. Katoonizadeh A, Nevens F, Verslype C, Pirenne J, Roskams T. Liver regeneration in acute severe liver impairment: a clinicopathological correlation study. Liver Int 2006;26:1225-1233. 317. Theise ND, Saxena R, Portmann BC, Thung SN, Yee H, Chiriboga L, Kumar A, et al. The canals of Hering and hepatic stem cells in humans. Hepatology 1999;30:1425-1433. 318. Paku S, Schnur J, Nagy P, Thorgeirsson SS. Origin and structural evolution of the early proliferating oval cells in rat liver. Am J Pathol 2001;158:1313-1323. 319. Addante A, Roncero C, Almale L, Lazcanoiturburu N, Garcia-Alvaro M, Fernandez M, Sanz J, et al. Bone morphogenetic protein 9 as a key regulator of liver progenitor cells in DDC-induced cholestatic liver injury. Liver Int 2018;38:1664-1675. 320. Prakoso E, Tirnitz-Parker JE, Clouston AD, Kayali Z, Lee A, Gan EK, Ramm GA, et al. Analysis of the intrahepatic ductular reaction and progenitor cell responses in hepatitis C virus recurrence after liver transplantation. Liver Transpl 2014;20:1508-1519. 321. Lowes KN, Brennan BA, Yeoh GC, Olynyk JK. Oval cell numbers in human chronic liver diseases are directly related to disease severity. Am J Pathol 1999;154:537-541. 322. Wake K. "Sternzellen" in the liver: perisinusoidal cells with special reference to storage of vitamin A. Am J Anat 1971;132:429-462. 323. Blomhoff R, Rasmussen M, Nilsson A, Norum KR, Berg T, Blaner WS, Kato M, et al. Hepatic retinol metabolism. Distribution of retinoids, enzymes, and binding proteins in isolated rat liver cells. J Biol Chem 1985;260:13560-13565. 324. Friedman SL. Hepatic stellate cells. Prog Liver Dis 1996;14:101-130.
325. Tirnitz-Parker JE, Olynyk JK, Ramm GA. Role of TWEAK in coregulating liver progenitor cell and fibrogenic responses. Hepatology 2014;59:1198-1201. 326. Ameres SL, Zamore PD. Diversifying microRNA sequence and function. Nature reviews Molecular cell biology 2013;14:475. 327. Khorshid M, Hausser J, Zavolan M, Van Nimwegen E. A biophysical miRNA-mRNA interaction model infers canonical and noncanonical targets. Nature methods 2013;10:253. 328. Gaidatzis D, van Nimwegen E, Hausser J, Zavolan M. Inference of miRNA targets using evolutionary conservation and pathway analysis. BMC bioinformatics 2007;8:69. 329. Kloosterman WP, Wienholds E, Ketting RF, Plasterk RH. Substrate requirements for let-7 function in the developing zebrafish embryo. Nucleic acids research 2004;32:6284-6291. 330. Lytle JR, Yario TA, Steitz JA. Target mRNAs are repressed as efficiently by microRNA-binding sites in the 5′ UTR as in the 3′ UTR. Proceedings of the National Academy of Sciences 2007;104:9667-9672. 331. Kertesz M, Iovino N, Unnerstall U, Gaul U, Segal E. The role of site accessibility in microRNA target recognition. Nature genetics 2007;39:1278. 332. Nielsen CB, Shomron N, Sandberg R, Hornstein E, Kitzman J, Burge CB. Determinants of targeting by endogenous and exogenous microRNAs and siRNAs. Rna 2007. 333. Sætrom P, Heale BS, Snøve Jr O, Aagaard L, Alluin J, Rossi JJ. Distance constraints between microRNA target sites dictate efficacy and cooperativity. Nucleic acids research 2007;35:2333-2342.
258
334. Broderick JA, Salomon WE, Ryder SP, Aronin N, Zamore PD. Argonaute protein identity and pairing geometry determine cooperativity in mammalian RNA silencing. Rna 2011. 335. Meisner N-C, Filipowicz W: Properties of the regulatory RNA-binding protein HuR and its role in controlling miRNA repression. In: Regulation of microRNAs: Springer, 2010; 106-123. 336. Bhattacharyya SN, Habermacher R, Martine U, Closs EI, Filipowicz W. Relief of microRNA-mediated translational repression in human cells subjected to stress. Cell 2006;125:1111-1124. 337. Kedde M, Strasser MJ, Boldajipour B, Vrielink JAO, Slanchev K, le Sage C, Nagel R, et al. RNA-binding protein Dnd1 inhibits microRNA access to target mRNA. Cell 2007;131:1273-1286. 338. Chatterjee S, Großhans H. Active turnover modulates mature microRNA activity in Caenorhabditis elegans. Nature 2009;461:546. 339. Diederichs S, Haber DA. Dual role for argonautes in microRNA processing and posttranscriptional regulation of microRNA expression. Cell 2007;131:1097-1108. 340. Hammell CM, Lubin I, Boag PR, Blackwell TK, Ambros V. nhl-2 Modulates microRNA activity in Caenorhabditis elegans. Cell 2009;136:926-938. 341. Eulalio A, Rehwinkel J, Stricker M, Huntzinger E, Yang S-F, Doerks T, Dorner S, et al. Target-specific requirements for enhancers of decapping in miRNA-mediated gene silencing. Genes & development 2007;21:000-000. 342. Schwamborn JC, Berezikov E, Knoblich JA. The TRIM-NHL protein TRIM32 activates microRNAs and prevents self-renewal in mouse neural progenitors. Cell 2009;136:913-925. 343. Rüdel S, Wang Y, Lenobel R, Körner R, Hsiao H-H, Urlaub H, Patel D, et al. Phosphorylation of human Argonaute proteins affects small RNA binding. Nucleic acids research 2010;39:2330-2343. 344. Ameres SL, Horwich MD, Hung J-H, Xu J, Ghildiyal M, Weng Z, Zamore PD. Target RNA–directed trimming and tailing of small silencing RNAs. Science 2010;328:1534-1539. 345. Kai ZS, Pasquinelli AE. MicroRNA assassins: factors that regulate the disappearance of miRNAs. Nature structural & molecular biology 2010;17:5. 346. Cesana M, Cacchiarelli D, Legnini I, Santini T, Sthandier O, Chinappi M, Tramontano A, et al. A long noncoding RNA controls muscle differentiation by functioning as a competing endogenous RNA. Cell 2011;147:358-369. 347. Poliseno L, Salmena L, Zhang J, Carver B, Haveman WJ, Pandolfi PP. A coding-independent function of gene and pseudogene mRNAs regulates tumour biology. Nature 2010;465:1033. 348. Seitz H. Redefining microRNA targets. Current biology 2009;19:870-873. 349. Sumazin P, Yang X, Chiu HS, Chung WJ, Iyer A, Llobet-Navas D, Rajbhandari P, et al. An extensive microRNA-mediated network of RNA-RNA interactions regulates established oncogenic pathways in glioblastoma. Cell 2011;147. 350. Tay Y, Kats L, Salmena L, Weiss D, Tan SM, Ala U, Karreth F, et al. Coding-independent regulation of the tumor suppressor PTEN by competing endogenous mRNAs. Cell 2011;147:344-357. 351. Bentwich I. Prediction and validation of microRNAs and their targets. FEBS letters 2005;579:5904-5910. 352. Selbach M, Schwanhäusser B, Thierfelder N, Fang Z, Khanin R, Rajewsky N. Widespread changes in protein synthesis induced by microRNAs. nature 2008;455:58.

259
353. Ørom UA, Lund AH. Isolation of microRNA targets using biotinylated synthetic microRNAs. Methods 2007;43:162-165. 354. Coll M, El Taghdouini A, Perea L, Mannaerts I, Vila-Casadesus M, Blaya D, Rodrigo-Torres D, et al. Integrative miRNA and Gene Expression Profiling Analysis of Human Quiescent Hepatic Stellate Cells. Sci Rep 2015;5:11549. 355. Bird TG, Lorenzini S, Forbes SJ. Activation of stem cells in hepatic diseases. Cell Tissue Res 2008;331:283-300. 356. Mederacke I, Hsu CC, Troeger JS, Huebener P, Mu X, Dapito DH, Pradere J-P, et al. Fate tracing reveals hepatic stellate cells as dominant contributors to liver fibrosis independent of its aetiology. Nature communications 2013;4:2823. 357. Forster N, Palmer JA, Yeoh G, Ong W-C, Mitchell GM, Slavin J, Tirnitz-Parker J, et al. Expansion and hepatocytic differentiation of liver progenitor cells in vivo using a vascularized tissue engineering chamber in mice. Tissue Engineering Part C: Methods 2010;17:359-366. 358. Suzuki A, Sekiya S, Onishi M, Oshima N, Kiyonari H, Nakauchi H, Taniguchi H.
Flow cytometric isolation and clonal identification of self-renewing bipotent hepatic progenitor cells in adult mouse liver. Hepatology 2008;48:1964-1978. 359. Dwyer B, Olynyk J, Ramm G, Tirnitz-Parker J. TWEAK and LTβ Signaling during Chronic Liver Disease. Frontiers in Immunology 2014;5. 360. Spee B, Carpino G, Schotanus BA, Katoonizadeh A, Vander Borght S, Gaudio E, Roskams T. Characterisation of the liver progenitor cell niche in liver diseases: potential involvement of Wnt and Notch signalling. Gut 2010;59:247-257. 361. Knight B, Yeoh GC. TNF/LTα double knockout mice display abnormal inflammatory and regenerative responses to acute and chronic liver injury. Cell and tissue research 2005;319:61-70. 362. Erker L, Grompe M. Signaling networks in hepatic oval cell activation. Stem cell research 2008;1:90-102. 363. Fausto N, Campbell JS, Riehle KJ. Liver regeneration. Hepatology 2006;43:S45-S53. 364. Brooling JT, Campbell JS, Mitchell C, Yeoh GC, Fausto N. Differential regulation of rodent hepatocyte and oval cell proliferation by interferon γ. Hepatology 2005;41:906-915. 365. Viebahn CS, Tirnitz-Parker JE, Olynyk JK, Yeoh GC. Evaluation of the “Cellscreen” system for proliferation studies on liver progenitor cells. European journal of cell biology 2006;85:1265-1274. 366. Grzelak CA, Martelotto LG, Sigglekow ND, Patkunanathan B, Ajami K, Calabro SR, Dwyer BJ, et al. The intrahepatic signalling niche of hedgehog is defined by primary cilia positive cells during chronic liver injury. Journal of Hepatology 2014;60:143-151. 367. Jung Y, Oh S-H, Witek RP, Petersen BE. Somatostatin stimulates the migration of hepatic oval cells in the injured rat liver. Liver International 2011;32:312-320. 368. Nobili V, Carpino G, Alisi A, Franchitto A, Alpini G, De Vito R, Onori P, et al. Hepatic progenitor cells activation, fibrosis, and adipokines production in pediatric nonalcoholic fatty liver disease. Hepatology 2012;56:2142-2153. 369. Best J, Manka P, Syn W-K, Dollé L, van Grunsven LA, Canbay A. Role of liver progenitors in liver regeneration. Hepatobiliary surgery and nutrition 2015;4:48. 370. Puche JE, Saiman Y, Friedman SL. Hepatic stellate cells and liver fibrosis. Comprehensive Physiology 2011;3:1473-1492. 371. Kessenbrock K, Plaks V, Werb Z. Matrix metalloproteinases: regulators of the tumor microenvironment. Cell 2010;141:52-67.
260
372. Friedman SL. Molecular regulation of hepatic fibrosis, an integrated cellular response to tissue injury. Journal of Biological Chemistry 2000;275:2247-2250. 373. Hellerbrand C, Stefanovic B, Giordano F, Burchardt ER, Brenner DA. The role of TGFβ1 in initiating hepatic stellate cell activation in vivo. Journal of hepatology 1999;30:77-87. 374. Breitkopf K, Godoy P, Ciuclan L, Singer M, Dooley S. TGF-β/Smad signaling in the injured liver. Zeitschrift für Gastroenterologie 2006;44:57-66. 375. Schuppan D, Ruehl M, Somasundaram R, Hahn EG. Matrix as a modulator of hepatic fibrogenesis. In: Seminars in liver disease; 2001: Copyright© 2001 by Thieme Medical Publishers, Inc., 333 Seventh Avenue, New York, NY 10001, USA. Tel.:+ 1 (212) 584-4662; 2001. p. 351-372. 376. Hanafusa H, Ninomiya-Tsuji J, Masuyama N, Nishita M, Fujisawa J-i, Shibuya H, Matsumoto K, et al. Involvement of the p38 mitogen-activated protein kinase pathway in transforming growth factor-β-induced gene expression. Journal of Biological Chemistry 1999;274:27161-27167. 377. Engel ME, McDonnell MA, Law BK, Moses HL. Interdependent SMAD and JNK signaling in transforming growth factor-β-mediated transcription. Journal of Biological Chemistry 1999;274:37413-37420. 378. Tsuchida T, Friedman SL. Mechanisms of hepatic stellate cell activation. Nature reviews Gastroenterology & hepatology 2017;14:397.
379. Van Hul NK, Abarca-Quinones J, Sempoux C, Horsmans Y, Leclercq IA. Relation
between liver progenitor cell expansion and extracellular matrix deposition in a CDE-induced murine model of chronic liver injury. Hepatology 2009;49:1625-1635. 380. Kallis YN, Robson AJ, Fallowfield JA, Thomas HC, Alison MR, Wright NA, Goldin RD, et al. Remodelling of extracellular matrix is a requirement for the hepatic progenitor cell response. Gut 2011;60:525-533.
381. Ruddell RG, Knight B, Tirnitz-Parker JE, Akhurst B, Summerville L, Subramaniam VN, Olynyk JK, et al. Lymphotoxin-β receptor signaling regulates hepatic stellate cell function and wound healing in a murine model of chronic liver injury. Hepatology 2009;49:227-239. 382. Subrata LS, Voon DC, Yeoh GC, Ulgiati D, Quail EA, Abraham LJ. TNF-inducible expression of lymphotoxin-β in hepatic cells: an essential role for NF-κB and Ets1 transcription factors. Cytokine 2012;60:498-504. 383. Jakubowski A, Ambrose C, Parr M, Lincecum JM, Wang MZ, Zheng TS, Browning B, et al. TWEAK induces liver progenitor cell proliferation. The Journal of clinical investigation 2005;115:2330-2340. 384. Viebahn CS, Benseler V, Holz LE, Elsegood CL, Vo M, Bertolino P, Ganss R, et al. Invading macrophages play a major role in the liver progenitor cell response to chronic liver injury. Journal of hepatology 2010;53:500-507. 385. Rogler CE, Rogler LE. miRNAs and Liver Biology. The Liver: Biology and Pathobiology 2009:1029-1052. 386. Tang J, Liu C, Xu B, Wang D, Ma Z, Chang X. ARHGEF10L contributes to liver tumorigenesis through RhoA-ROCK1 signaling and the epithelial-mesenchymal transition. Experimental Cell Research 2018. 387. Bottino J, Gelaleti GB, Maschio LB, Jardim-Perassi BV, de Campos Zuccari DAP. Immunoexpression of ROCK-1 and MMP-9 as prognostic markers in breast cancer. Acta histochemica 2014;116:1367-1373. 388. Williams MJ, Clouston AD, Forbes SJ. Links between hepatic fibrosis, ductular reaction, and progenitor cell expansion. Gastroenterology 2014;146:349-356.

261
389. Costa RH, Kalinichenko VV, Holterman AX, Wang X. Transcription factors in liver development, differentiation, and regeneration. Hepatology 2003;38:1331-1347. 390. Odom DT, Zizlsperger N, Gordon DB, Bell GW, Rinaldi NJ, Murray HL, Volkert TL, et al. Control of pancreas and liver gene expression by HNF transcription factors. Science 2004;303:1378-1381. 391. Ogryzko VV, Schiltz RL, Russanova V, Howard BH, Nakatani Y. The transcriptional coactivators p300 and CBP are histone acetyltransferases. Cell 1996;87:953-959. 392. Eckner R, Ewen ME, Newsome D, Gerdes M, DeCaprio JA, Lawrence JB, Livingston DM. Molecular cloning and functional analysis of the adenovirus E1A-associated 300-kD protein (p300) reveals a protein with properties of a transcriptional adaptor. Genes & development 1994;8:869-884. 393. Muraoka M, Konishi M, Kikuchi-Yanoshita R, Tanaka K, Shitara N, Chong J-M, Iwama T, et al. p300 gene alterations in colorectal and gastric carcinomas. oncogene 1996;12:1565-1569. 394. Karlmark KR, Zimmermann HW, Roderburg C, Gassler N, Wasmuth HE, Luedde T, Trautwein C, et al. The fractalkine receptor CX3CR1 protects against liver fibrosis by controlling differentiation and survival of infiltrating hepatic monocytes. Hepatology 2010;52:1769-1782. 395. Wasmuth HE, Zaldivar MM, Berres M-L, Werth A, Scholten D, Hillebrandt S, Tacke F, et al. The fractalkine receptor CX3CR1 is involved in liver fibrosis due to chronic hepatitis C infection. Journal of hepatology 2008;48:208-215. 396. Lee Y-S, Kim M-H, Yi H-S, Kim SY, Kim H-H, Kim JH, Yeon JE, et al. CX3CR1 differentiates F4/80low monocytes into pro-inflammatory F4/80high macrophages in the liver. Scientific Reports 2018;8:15076. 397. Zimmermann HW, Trautwein C, Tacke F. Functional role of monocytes and macrophages for the inflammatory response in acute liver injury. Frontiers in physiology 2012;3:56. 398. Landsman L, Bar-On L, Zernecke A, Kim K-W, Krauthgamer R, Shagdarsuren E, Lira SA, et al. CX3CR1 is required for monocyte homeostasis and atherogenesis by promoting cell survival. Blood 2009;113:963-972.
399. Aoyama T, Inokuchi S, Brenner DA, Seki E. CX3CL1-CX3CR1 interaction prevents
carbon tetrachloride-induced liver inflammation and fibrosis in mice. Hepatology 2010;52:1390-1400. 400. Bard-Chapeau EA, Yuan J, Droin N, Long S, Zhang EE, Nguyen TV, Feng G-S. Concerted functions of Gab1 and Shp2 in liver regeneration and hepatoprotection. Molecular and cellular biology 2006;26:4664-4674. 401. Tartaglia M, Mehler EL, Goldberg R, Zampino G, Brunner HG, Kremer H, Van der Burgt I, et al. Mutations in PTPN11, encoding the protein tyrosine phosphatase SHP-2, cause Noonan syndrome. Nature genetics 2001;29:465. 402. Qu CK. The SHP-2 tyrosine phosphatase: signaling mechanisms and biological functions. Cell research 2000;10:279. 403. Hers I, Vincent EE, Tavaré JM. Akt signalling in health and disease. Cellular signalling 2011;23:1515-1527. 404. Kohn AD, Moon RT. Wnt and calcium signaling: β-catenin-independent pathways. Cell calcium 2005;38:439-446. 405. Chatani N, Kamada Y, Kizu T, Ogura S, Furuta K, Egawa M, Hamano M, et al.
Secreted frizzled-related protein 5 (Sfrp5) decreases hepatic stellate cell activation and liver fibrosis. Liver International 2015;35:2017-2026.
262
406. Jiang F, Parsons CJ, Stefanovic B. Gene expression profile of quiescent and activated rat hepatic stellate cells implicates Wnt signaling pathway in activation. Journal of hepatology 2006;45:401-409. 407. Kumawat K, Menzen MH, Bos IST, Baarsma HA, Borger P, Roth M, Tamm M, et al. Noncanonical WNT-5A signaling regulates TGF-β-induced extracellular matrix production by airway smooth muscle cells. The FASEB journal 2013;27:1631-1643. 408. Köhn-Gaone J, Gogoi-Tiwari J, Ramm GA, Olynyk JK, Tirnitz-Parker JE. The role of liver progenitor cells during liver regeneration, fibrogenesis, and carcinogenesis. American Journal of Physiology-Gastrointestinal and Liver Physiology 2015;310:G143-G154. 409. Barry ER, Camargo FD. The Hippo superhighway: signaling crossroads converging on the Hippo/Yap pathway in stem cells and development. Current opinion in cell biology 2013;25:247-253. 410. Dong L, Lyu X, Faleti OD, He M-L. The special stemness functions of Tbx3 in stem cells and cancer development. Seminars in Cancer Biology 2018. 411. Duncan AW, Dorrell C, Grompe M. Stem Cells and Liver Regeneration. Gastroenterology 2009;137:466-481. 412. Gallo KA, Johnson GL. Signalling: Mixed-lineage kinase control of JNK and p38 MAPK pathways. Nature reviews Molecular cell biology 2002;3:663. 413. Durkin JT, Holskin BP, Kopec KK, Reed MS, Spais CM, Steffy BM, Gessner G, et al. Phosphoregulation of mixed-lineage kinase 1 activity by multiple phosphorylation in the activation loop. Biochemistry 2004;43:16348-16355. 414. Stronach B, Lennox AL, Garlena RA. Domain specificity of MAP3K family members, MLK and Tak1, for JNK signaling in Drosophila. Genetics 2014:genetics. 113.160937. 415. Kluwe J, Pradere JP, Gwak GY, Mencin A, De Minicis S, Österreicher CH, Colmenero J, et al. Modulation of hepatic fibrosis by c-Jun-N-terminal kinase inhibition. Gastroenterology 2010;138:347-359. 416. Zhao G, Hatting M, Nevzorova YA, Peng J, Hu W, Boekschoten MV, Roskams T, et al. Jnk1 in murine hepatic stellate cells is a crucial mediator of liver fibrogenesis. Gut 2014;63:1159-1172. 417. Paramasivam M, Sarkeshik A, Yates III JR, Fernandes MJ, McCollum D. Angiomotin family proteins are novel activators of the LATS2 kinase tumor suppressor. Molecular biology of the cell 2011;22:3725-3733. 418. Mana-Capelli S, Paramasivam M, Dutta S, McCollum D. Angiomotins link F-actin architecture to Hippo pathway signaling. Molecular biology of the cell 2014;25:1676-1685. 419. Chan SW, Lim CJ, Chong YF, Pobbati AV, Huang C, Hong W. Hippo pathway-independent restriction of TAZ and YAP by angiomotin. Journal of Biological Chemistry 2011:jbc. C110. 212621. 420. Leung CY, Zernicka-Goetz M. Angiomotin prevents pluripotent lineage differentiation in mouse embryos via Hippo pathway-dependent and-independent mechanisms. Nature communications 2013;4:2251. 421. Lv M, Shen Y, Yang J, Li S, Wang B, Chen Z, Li P, et al. Angiomotin Family Members: Oncogenes or Tumor Suppressors? International journal of biological sciences 2017;13:772. 422. Yi C, Shen Z, Stemmer-Rachamimov A, Dawany N, Troutman S, Showe LC, Liu Q, et al. The p130 isoform of angiomotin is required for Yap-mediated hepatic epithelial cell proliferation and tumorigenesis. Sci. Signal. 2013;6:ra77-ra77.

263
423. Zhao B, Li L, Lu Q, Wang LH, Liu C-Y, Lei Q, Guan K-L. Angiomotin is a novel Hippo pathway component that inhibits YAP oncoprotein. Genes & development 2011;25:51-63. 424. Basu S, Totty NF, Irwin MS, Sudol M, Downward J. Akt phosphorylates the Yes-associated protein, YAP, to induce interaction with 14-3-3 and attenuation of p73-mediated apoptosis. Molecular cell 2003;11:11-23. 425. Meng Z, Moroishi T, Guan K-L. Mechanisms of Hippo pathway regulation. Genes & development 2016;30:1-17. 426. Lu L, Li Y, Kim SM, Bossuyt W, Liu P, Qiu Q, Wang Y, et al. Hippo signaling is a potent in vivo growth and tumor suppressor pathway in the mammalian liver. Proceedings of the National Academy of Sciences 2010;107:1437-1442. 427. Aylon Y, Gershoni A, Rotkopf R, Biton IE, Porat Z, Koh AP, Sun X, et al. The LATS2 tumor suppressor inhibits SREBP and suppresses hepatic cholesterol accumulation. Genes & development 2016. 428. Mannaerts I, Leite SB, Verhulst S, Claerhout S, Eysackers N, Thoen LF, Hoorens A, et al. The Hippo pathway effector YAP controls mouse hepatic stellate cell activation. Journal of hepatology 2015;63:679-688. 429. Martin K, Pritchett J, Llewellyn J, Mullan AF, Athwal VS, Dobie R, Harvey E, et al. PAK proteins and YAP-1 signalling downstream of integrin beta-1 in myofibroblasts promote liver fibrosis. Nature communications 2016;7:12502. 430. Lentjes MHFM, Niessen HEC, Akiyama Y, de Bruïne AP, Melotte V, van Engeland M. The emerging role of GATA transcription factors in development and disease. Expert reviews in molecular medicine 2016;18:e3-e3. 431. Heineke J, Auger-Messier M, Xu J, Oka T, Sargent MA, York A, Klevitsky R, et al. Cardiomyocyte GATA4 functions as a stress-responsive regulator of angiogenesis in the murine heart. J Clin Invest 2007;117:3198-3210. 432. Cantor AB, Orkin SH. Coregulation of GATA factors by the Friend of GATA (FOG) family of multitype zinc finger proteins. Semin Cell Dev Biol 2005;16:117-128. 433. Antoniv TT, Tanaka S, Sudan B, De Val S, Liu K, Wang L, Wells DJ, et al. Identification of a repressor in the first intron of the human alpha2(I) collagen gene (COL1A2). J Biol Chem 2005;280:35417-35423. 434. Wang L, Tanaka S, Ramirez F. GATA-4 binds to an upstream element of the human α2(I) collagen gene (COL1A2) and inhibits transcription in fibroblasts. Matrix Biology 2005;24:333-340. 435. Lim J-Y, Oh M-A, Kim WH, Sohn H-Y, Park SI. AMP-activated protein kinase inhibits TGF-β-induced fibrogenic responses of hepatic stellate cells by targeting transcriptional coactivator p300. Journal of Cellular Physiology 2011;227:1081-1089. 436. Asano Y, Trojanowska M. Fli1 represses transcription of the human alpha2(I) collagen gene by recruitment of the HDAC1/p300 complex. PLoS One 2013;8:e74930. 437. Yavrom S, Chen L, Xiong S, Wang J, Rippe RA, Tsukamoto H. Peroxisome proliferator-activated receptor gamma suppresses proximal alpha1(I) collagen promoter via inhibition of p300-facilitated NF-I binding to DNA in hepatic stellate cells. J Biol Chem 2005;280:40650-40659. 438. Tokay E, Kockar F. SP1 is a transcriptional regulator of URG-4/URGCP gene in hepatocytes. Mol Cell Biochem 2016;423:75-83. 439. Hedrick E, Cheng Y, Jin U-H, Kim K, Safe S. Specificity protein (Sp) transcription factors Sp1, Sp3 and Sp4 are non-oncogene addiction genes in cancer cells. Oncotarget 2016;7:22245.
264
440. Black AR, Black JD, Azizkhan-Clifford J. Sp1 and krüppel-like factor family of transcription factors in cell growth regulation and cancer. Journal of cellular physiology 2001;188:143-160. 441. Beishline K, Azizkhan-Clifford J. Sp1 and the ‘hallmarks of cancer’. The FEBS Journal 2014;282:224-258. 442. Chen H, Zhou Y, Chen KQ, An G, Ji SY, Chen QK. Anti-fibrotic effects via regulation of transcription factor Sp1 on hepatic stellate cells. Cell Physiol Biochem 2012;29:51-60. 443. Carracedo A, Lorente M, Egia A, Blázquez C, García S, Giroux V, Malicet C, et al. The stress-regulated protein p8 mediates cannabinoid-induced apoptosis of tumor cells. Cancer cell 2006;9:301-312. 444. Kong DK, Georgescu SP, Cano C, Aronovitz MJ, Iovanna JL, Patten RD, Kyriakis JM, et al. Deficiency of the transcriptional regulator p8 results in increased autophagy and apoptosis, and causes impaired heart function. Molecular biology of the cell 2010;21:1335-1349. 445. Sambasivan R, Cheedipudi S, Pasupuleti N, Saleh A, Pavlath GK, Dhawan J. The small chromatin-binding protein p8 coordinates the association of anti-proliferative and pro-myogenic proteins at the myogenin promoter. Journal of cell science 2009;122:3481-3491. 446. Hoffmeister A, Ropolo A, Vasseur S, Mallo GV, Bodeker H, Ritz-Laser B, Dressler GR, et al. The HMG-I/Y-related Protein p8 Binds to p300 and Pax2trans-Activation Domain-interacting Protein to Regulate thetrans-Activation Activity of the Pax2A and Pax2B Transcription Factors on the Glucagon Gene Promoter. Journal of biological chemistry 2002;277:22314-22319. 447. Georgescu SP, Aronovitz MJ, Iovanna JL, Patten RD, Kyriakis JM, Goruppi S. Decreased metalloprotease 9 induction, cardiac fibrosis, and higher autophagy after pressure overload in mice lacking the transcriptional regulator p8. American Journal of Physiology-Cell Physiology 2011;301:C1046-C1056. 448. DeSandro AM, Nagarajan UM, Boss JM. Associations and Interactions between Bare Lymphocyte Syndrome Factors. Molecular and Cellular Biology 2000;20:6587. 449. Nagarajan UM, Louis-Plence P, DeSandro A, Nilsen R, Bushey A, Boss JM. RFX-B is the gene responsible for the most common cause of the bare lymphocyte syndrome, an MHC class II immunodeficiency. Immunity 1999;10:153-162. 450. Das S, Lin J-H, Papamatheakis J, Sykulev Y, Tsichlis PN. Differential splicing generates Tvl-1/RFXANK isoforms with different functions. Journal of Biological Chemistry 2002. 451. Sengupta PK, Ehrlich M, Smith BD. A methylation-responsive MDBP/RFX site is in the first exon of the collagen α2 (I) promoter. Journal of Biological Chemistry 1999;274:36649-36655. 452. Sengupta PK, Fargo J, Smith BD. The RFX family interacts at the collagen (COL1A2) start site and represses transcription. Journal of Biological Chemistry 2002;277:24926-24937. 453. Lin M, Sutherland DR, Horsfall W, Totty N, Yeo E, Nayar R, Wu XF, et al. Cell surface antigen CD109 is a novel member of the alpha(2) macroglobulin/C3, C4, C5 family of thioester-containing proteins. Blood 2002;99:1683-1691. 454. Sjoblom T, Jones S, Wood LD, Parsons DW, Lin J, Barber TD, Mandelker D, et al. The consensus coding sequences of human breast and colorectal cancers. Science 2006;314:268-274. 455. Hashimoto M, Ichihara M, Watanabe T, Kawai K, Koshikawa K, Yuasa N, Takahashi T, et al. Expression of CD109 in human cancer. Oncogene 2004;23:3716-3720.

265
456. Hayes S, Chawla A, Corvera S. TGFβ receptor internalization into EEA1-enriched early endosomes. role in signaling to Smad2 2002;158:1239-1249. 457. Runyan CE, Schnaper HW, Poncelet AC. The role of internalization in transforming growth factor beta1-induced Smad2 association with Smad anchor for receptor activation (SARA) and Smad2-dependent signaling in human mesangial cells. J Biol Chem 2005;280:8300-8308. 458. Mitchell H, Choudhury A, Pagano RE, Leof EB. Ligand-dependent and -independent Transforming Growth Factor-β Receptor Recycling Regulated by Clathrin-mediated Endocytosis and Rab11. Molecular Biology of the Cell 2004;15:4166-4178. 459. Luga V, McLean S, Le Roy C, O'Connor-McCourt M, Wrana JL, Di Guglielmo GM. The extracellular domain of the TGFbeta type II receptor regulates membrane raft partitioning. Biochem J 2009;421:119-131. 460. Razani B, Zhang XL, Bitzer M, von Gersdorff G, Bottinger EP, Lisanti MP. Caveolin-1 regulates transforming growth factor (TGF)-beta/SMAD signaling through an interaction with the TGF-beta type I receptor. J Biol Chem 2001;276:6727-6738. 461. Di Guglielmo GM, Le Roy C, Goodfellow AF, Wrana JL. Distinct endocytic pathways regulate TGF-β receptor signalling and turnover. Nature Cell Biology 2003;5:410. 462. Bizet AA, Liu K, Tran-Khanh N, Saksena A, Vorstenbosch J, Finnson KW, Buschmann MD, et al. The TGF-beta co-receptor, CD109, promotes internalization and degradation of TGF-beta receptors. Biochim Biophys Acta 2011;1813:742-753. 463. Fuller-Pace FV, Ali S. The DEAD box RNA helicases p68 (Ddx5) and p72 (Ddx17): novel transcriptional co-regulators. In: Portland Press Limited; 2008. 464. Guo J, Hong F, Loke J, Yea S, Lim CL, Lee U, Mann DA, et al. A DDX5 S480A polymorphism is associated with increased transcription of fibrogenic genes in hepatic stellate cells. J Biol Chem 2010;285:5428-5437. 465. Schmidt MF. Drug target miRNAs: chances and challenges. Trends Biotechnol 2014;32:578-585. 466. Li Z, Rana TM. Therapeutic targeting of microRNAs: current status and future challenges. Nat Rev Drug Discov 2014;13:622-638. 467. Koshkin AA, Singh SK, Nielsen P, Rajwanshi VK, Kumar R, Meldgaard M, Olsen CE, et al. LNA (Locked Nucleic Acids): Synthesis of the adenine, cytosine, guanine, 5-methylcytosine, thymine and uracil bicyclonucleoside monomers, oligomerisation, and unprecedented nucleic acid recognition. Tetrahedron 1998;54:3607-3630. 468. Janssen HL, Reesink HW, Lawitz EJ, Zeuzem S, Rodriguez-Torres M, Patel K, van der Meer AJ, et al. Treatment of HCV infection by targeting microRNA. N Engl J Med 2013;368:1685-1694. 469. Shimakami T, Yamane D, Welsch C, Hensley L, Jangra RK, Lemon SM. Base pairing between hepatitis C virus RNA and microRNA 122 3' of its seed sequence is essential for genome stabilization and production of infectious virus. J Virol 2012;86:7372-7383. 470. Beg MS, Brenner AJ, Sachdev J, Borad M, Kang YK, Stoudemire J, Smith S, et al. Phase I study of MRX34, a liposomal miR-34a mimic, administered twice weekly in patients with advanced solid tumors. Invest New Drugs 2017;35:180-188. 471. Bader AG. miR-34 - a microRNA replacement therapy is headed to the clinic. Front Genet 2012;3:120. 472. Zhao J, Kelnar K, Bader AG. In-depth analysis shows synergy between erlotinib and miR-34a. PLoS One 2014;9:e89105. 473. Brown RAM, Richardson KL, Kalinowski FC, Epis MR, Horsham JL, Kabir TD, De Pinho MH, et al. Evaluation of MicroRNA Delivery In Vivo. Methods Mol Biol 2018;1699:155-178.

266
474. Kabir TD, Ganda C, Brown RM, Beveridge DJ, Richardson KL, Chaturvedi V, Candy P, et al. A microRNA-7/growth arrest specific 6/TYRO3 axis regulates the growth and invasiveness of sorafenib-resistant cells in human hepatocellular carcinoma. Hepatology 2018;67:216-231. 475. Chryssostalis A, Hubert D, Coste J, Kanaan R, Burgel PR, Desmazes-Dufeu N, Soubrane O, et al. Liver disease in adult patients with cystic fibrosis: a frequent and independent prognostic factor associated with death or lung transplantation. J Hepatol 2011;55:1377-1382. 476. Staufer K, Halilbasic E, Trauner M, Kazemi-Shirazi L. Cystic fibrosis related liver disease--another black box in hepatology. International journal of molecular sciences 2014;15:13529-13549. 477. Brown KJ, Lingard C, Narkewicz MR: Nutrition and Cystic Fibrosis Related Liver Disease. In: Yen EH, Leonard AR, eds. Nutrition in Cystic Fibrosis: A Guide for Clinicians. Cham: Springer International Publishing, 2015; 165-178. 478. Colombo C, Crosignani A, Battezzati PM, Castellani MR, Comi S, Melzi ML, Giunta A. Delayed intestinal visualization at hepatobiliary scintigraphy is associated with response to long-term treatment with ursodeoxycholic acid in patients with cystic fibrosis-associated liver disease. J Hepatol 1999;31:672-677. 479. Nousia-Arvanitakis S, Fotoulaki M, Economou H, Xefteri M, Galli-Tsinopoulou A. Long-term prospective study of the effect of ursodeoxycholic acid on cystic fibrosis-related liver disease. Journal of clinical gastroenterology 2001;32:324-328.
480. Cheng K, Ashby D, Smyth RL. Ursodeoxycholic acid for cystic fibrosis-related liver disease. Cochrane Database of Systematic Reviews 2014. 481. Melzi ML, Kelly DA, Colombo C, Jara P, Manzanares J, Colledan M, Strazzabosco M, et al. Liver transplant in cystic fibrosis: a poll among European centers. A study from the European Liver Transplant Registry. Transpl Int 2006;19:726-731. 482. Dowman JK, Watson D, Loganathan S, Gunson BK, Hodson J, Mirza DF, Clarke J, et al. Long-term impact of liver transplantation on respiratory function and nutritional status in children and adults with cystic fibrosis. Am J Transplant 2012;12:954-964. 483. Fridell JA, Bond GJ, Mazariegos GV, Orenstein DM, Jain A, Sindhi R, Finder JD, et al. Liver transplantation in children with cystic fibrosis: a long-term longitudinal review of a single center's experience. J Pediatr Surg 2003;38:1152-1156. 484. Molmenti EP, Squires RH, Nagata D, Roden JS, Molmenti H, Fasola CG, Prestidge C, et al. Liver transplantation for cholestasis associated with cystic fibrosis in the pediatric population. Pediatr Transplant 2003;7:93-97. 485. Gooding I, Dondos V, Gyi KM, Hodson M, Westaby D. Variceal hemorrhage and cystic fibrosis: outcomes and implications for liver transplantation. Liver Transpl 2005;11:1522-1526. 486. McDonald JS, Milosevic D, Reddi HV, Grebe SK, Algeciras-Schimnich A. Analysis of circulating microRNA: preanalytical and analytical challenges. Clinical chemistry 2011;57:833-840. 487. García ME, Blanco JL, Caballero J, Gargallo-Viola D. Anticoagulants interfere with PCR used to diagnose invasive aspergillosis. Journal of clinical microbiology 2002;40:1567-1568. 488. Willems M, Moshage H, Nevens F, Fevery J, Yap SH. Plasma collected from heparinized blood is not suitable for HCV-RNA detection by conventional RT-PCR assay. Journal of Virological Methods 1993;42:127-130. 489. Zhao H, Shen J, Hu Q, Davis W, Medico L, Wang D, Yan L, et al. Effects of Preanalytic Variables on Circulating MicroRNAs in Whole Blood. Cancer Epidemiology Biomarkers & Prevention 2014;23:2643-2648.
267
490. Guo H, Ingolia NT, Weissman JS, Bartel DP. Mammalian microRNAs predominantly act to decrease target mRNA levels. Nature 2010;466. 491. Cloonan N, Brown MK, Steptoe AL, Wani S, Chan WL, Forrest AR, Kolle G, et al. The miR-17-5p microRNA is a key regulator of the G1/S phase cell cycle transition. Genome biology 2008;9:R127. 492. Gennarino VA, D'Angelo G, Dharmalingam G, Fernandez S, Russolillo G, Sanges R, Mutarelli M, et al. Identification of microRNA-regulated gene networks by expression analysis of target genes. Genome research 2012. 493. Sander S, Bullinger L, Klapproth K, Fiedler K, Kestler HA, Barth TF, Möller P, et al. MYC stimulates EZH2 expression by repression of its negative regulator miR-26a. Blood 2008;112:4202-4212. 494. Kim H, Huang W, Jiang X, Pennicooke B, Park PJ, Johnson MD. Integrative genome analysis reveals an oncomir/oncogene cluster regulating glioblastoma survivorship. Proceedings of the National Academy of Sciences 2010:200909896. 495. Gandellini P, Folini M, Longoni N, Pennati M, Binda M, Colecchia M, Salvioni R, et al. miR-205 exerts tumor-suppressive functions in human prostate through down-regulation of protein kinase Cε. Cancer research 2009;69:2287-2295. 496. Krishnan K, Steptoe AL, Martin HC, Wani S, Nones K, Waddell N, Mariasegaram M, et al. MicroRNA-182-5p targets a network of genes involved in DNA repair. RNA 2013;19:230. 497. Hobert O. miRNAs play a tune. Cell 2007;131:22-24. 498. Bracken CP, Gregory PA, Kolesnikoff N, Bert AG, Wang J, Shannon MF, Goodall GJ. A double-negative feedback loop between ZEB1-SIP1 and the microRNA-200 family regulates epithelial-mesenchymal transition. Cancer research 2008;68:7846-7854.

268
CHAPTER 9
Appendices

20 April 2018
Phone: 07 3362 0117
Fax: 07 3362 0109 E-mail: [email protected]
Investigators: A
Surname
Ramm
Title
Prof
Initials
G
Dear Prof Ramm,
HREC Reference number: P1083 Project title: Mechanisms of Hepatic Fibrogenesis Associated with Paediatric
Cholestatic Liver Diseases The annual report for this project submitted on 5 March 2018 was reviewed by the QIMR Berghofer-HREC on 20 April 2018.
The study meets the requirements of the NHMRC National Statement and the documents listed below are approved:
5 Mar 2018 – P1083: 2017 Human Annual Report
Renewed approval of this project is valid from 20 April 2018 to 19 April 2019 subject to the following conditions being met:
This QIMR Berghofer-HREC Approval is subject to governance approval/s from all collaborating institutions.
The Principal Investigator will submit an annual report to the QIMR Berghofer-HREC by no later than 5 weeks prior to approval expiry.
The Principal Investigator will immediately report anything that might warrant review of ethical

approval of the project.
The Principal Investigator will notify the QIMR Berghofer-HREC of any event that requires a modification to the protocol, including site changes, or other project documents and submit any required amendments in accordance with the ToR provided by the HREC. These instructions can be found at http://www.qimrberghofer.edu.au/about-us/ethics-committees/qimr-berghofer-human-research-ethics-committee/
The Principal Investigator will submit any necessary reports related to the safety of research participants in accordance with QIMR Berghofer-HREC policy and procedures. These instructions can be found at http://www.qimrberghofer.edu.au/about-us/ethics-committees/qimr-berghofer-human-research-ethics-committee/
The Coordinating Principal Investigator will notify the QIMR Berghofer-HREC of any plan to extend the duration of the project past the approval period listed above and will submit any associated required documentation.
The Coordinating Principal Investigator will notify the QIMR Berghofer-HREC of his or her inability to continue as Coordinating Principal Investigator including the name of and contact information for a replacement.
Should you wish to discuss this matter, please contact the HREC Secretariat at [email protected].
The QIMR-Berghofer HREC wishes you every continued success in your research.
Yours sincerely,
Ian Wilkey QIMR-Berghofer HREC Chair (NHMRC HREC #EC00278)
This HREC is constituted and operates in accordance with the National Health and Medical Research Council’s (NHMRC) National Statement on Ethical Conduct in Human Research (2007). The processes used by this HREC to review multi-centre research proposals have been certified by the National Health and Medical Research Council.

Copyright © 2022 FDOKUMEN