Genetic Disruption of VIP Signaling Alters Intestinal Microbial ...
242
GENETIC DISRUPTION OF VIP SIGNALING ALTERS INTESTINAL MICROBIAL STRUCTURE AND IMMUNITY A Dissertation Submitted to the Graduate Faculty of the North Dakota State University of Agriculture and Applied Science By Manpreet Singh Bains In Partial Fulfillment of the Requirements for the Degree of DOCTOR OF PHILOSOPHY Major Program: Molecular Pathogenesis May 2018 Fargo, North Dakota
-
Upload
khangminh22 -
Category
Documents
-
view
2 -
download
0
Transcript of Genetic Disruption of VIP Signaling Alters Intestinal Microbial ...
GENETIC DISRUPTION OF VIP SIGNALING ALTERS INTESTINAL MICROBIAL
STRUCTURE AND IMMUNITY
A Dissertation
Submitted to the Graduate Faculty
of the
North Dakota State University
of Agriculture and Applied Science
By
Manpreet Singh Bains
In Partial Fulfillment of the Requirements
for the Degree of
DOCTOR OF PHILOSOPHY
Major Program:
Molecular Pathogenesis
May 2018
Fargo, North Dakota

North Dakota State University
Graduate School
Title
Genetic disruption of VIP signaling alters intestinal microbial structure and
immunity
By
Manpreet Singh Bains
The Supervisory Committee certifies that this disquisition complies with North Dakota
State University’s regulations and meets the accepted standards for the degree of
DOCTOR OF PHILOSOPHY
SUPERVISORY COMMITTEE:
Glenn Dorsam, PhD
Chair
John McEvoy, PhD
Eugene Berry, PhD
Lawrence Reynolds, PhD
Approved:
06/27/2018 John McEvoy, PhD
Date Department Chair

iii
ABSTRACT
Vasoactive intestinal peptide (VIP) regulates clock gene expression in the brain that
synchronizes diurnal feeding behaviors in mammals. In the gastrointestinal (GI) tissues, VIP
influences host nutrient absorption from ingested food, and regulates host metabolic functions.
VIP signaling ensures efficient nutrient absorption by influencing ghrelin and leptin expression
to balance caloric intake. Importantly, obese humans have elevated plasma VIP levels,
supporting its association with fat mass accumulation. In contrast, VIP deficiency leads to weight
loss and reduced adiposity, while disrupting epithelial cell nutrient absorption, tight junctions
and mucus secretion. Moreover, VIP regulates host glucose metabolism as VIP knockout mice
are pre-diabetic with elevated blood glucose and insulin levels. In addition to metabolism, VIP is
anti-inflammatory and when knocked out, results in exacerbated inflammatory bowel disease
(IBD) pathology. The GI track is also home to ≈40 trillion bacteria, called the gut microbiota,
which unlock additional calories from fiber for the host. Microbiota dysbiosis is caused by
dysfunction in biological systems downstream from VIP signaling, including dysregulated
expression of host clock genes, metabolic hormones, immune-relevant mediators and metabolic
and inflammatory disease states, like obesity and IBD. It is not known, however, whether the
VIP signaling axis contributes to the maintenance of the gut microbiota structure and diversity.
We hypothesized that VIP deficiency will cause gut dysbiosis, lower bacterial diversity and
reduce its energy extraction potential. To this end, we isolated fecal samples from VIP knockout
mice (VIP-/-) and employed 16S rRNA sequencing. VIP deficiency (VIP-/- and VIP-/+) resulted
in marked gut microbial compositional changes and reduced bacterial diversity compared to male
and female VIP+/+ littermates (n=48). Increased abundance of Bacteroides, Parabacteroides and
Helicobacter genera (gram-negative, GN), with reductions of Lachnospiraceae NK4A136,

iv
Oscillibacter and Ruminiclostridium genera (gram-positive, GP), were the driving force for the
observed increase in the GN/GP ratio. A predicted algorithm program, called PICRUSt, showed
changes in microbial metabolism consistent with elevated lipopolysaccharide metabolism and
reduced intake of fiber in VIP-/- mice. These data support that VIP regulates intestinal
homeostasis by maintaining microbiota balance, diversity and energy harvesting potential, while
upholding an anti-inflammatory tone by limiting lipopolysaccharide biosynthesis.

v
ACKNOWLEDGEMENTS
Thanks to my primary advisor and committee chair, Dr. Glenn Dorsam, for his guidance
and support over the entirety of my career at North Dakota State University. Thank you for
helping me develop a passion for science and gain an understanding and love for the research
that fuels it. The leadership and independent thinking skills gained over the past few years will
be essential as life moves forward. I would also like to thank Dr. John McEvoy, Dr. Eugene
Berry and Dr. Lawrence Reynolds for their guidance, inspiration and support throughout my
graduate career. Their direction and advice over the past few years have been greatly
appreciated. Thanks to the many members of the Dorsam lab group who have come and gone.
Specifically, thanks to Dr. Steve Wanjara and Caleb Laney for their support and friendship.
Thanks also to everyone in the Microbiology Department. Here, lifelong connections have been
forged with friends and mentors who are always willing to listen and provide advice as needed.

vi
DEDICATION
None of my accomplishments were possible without the support of my family and friends to
whom I dedicate this dissertation. My father, Piara, has helped me overcome tremendous
adversity; From the passing of my mother, Ravinder, when I was 8 years old, to his long
weekend shifts at Wal-Mart, all in the hopes of one day seeing me succeed. His unwavering
support and love have not only supported me throughout my life but made me the man I am
today. Even though I’m 29 years old, there is still a lot I can learn from him regarding hard work,
endurance and appreciating all that life has to offer. My step-mother, Veena, has always been
there to listen, love and provide a seemingly never-ending supply of food which I greatly
appreciate. Without the support of my aunt, Joyti, and uncle, Jay, who took us in during our
darkest hour, despite my rough edges, there is no way I would be anywhere close to where I am
today. My wife, Cassandra, is my closest friend and confidant. She has been a constant source of
encouragement, love, and has supported me in my every endeavor. For most of my life I have
felt like a lost traveler, but with her love and affection along with the support of my father-in-
law, Lonnie, my mother-in-law, Nancy, and sister-in-law, Carissa, Fargo has become my home. I
want to thank them for making me part of their family.
I am very thankful for all the love, support and guidance from all my family and friends.
“It would be possible to describe everything scientifically, but it would make no sense; it would
be without meaning, as if you described a Beethoven symphony as a variation of wave pressure.”
- Albert Einstein

vii
TABLE OF CONTENTS
ABSTRACT ................................................................................................................................... iii
ACKNOWLEDGEMENTS ............................................................................................................ v
DEDICATION ............................................................................................................................... vi
LIST OF TABLES .......................................................................................................................... x
LIST OF FIGURES ....................................................................................................................... xi
LIST OF ABBREVIATIONS ...................................................................................................... xiv
LIST OF APPENDIX TABLES .................................................................................................. xix
LIST OF APPENDIX FIGURES.................................................................................................. xx
1. INTRODUCTION ...................................................................................................................... 1
1.1. General introduction and background .................................................................................. 1
1.1.1. Vasoactive intestinal peptide ......................................................................................... 1
1.1.2. Pituitary adenylate cyclase-activating peptide (PACAP): gene to protein .................... 8
1.1.3. G-protein coupled receptors .......................................................................................... 9
1.1.4. Adenylyl cyclase enzyme ............................................................................................ 20
1.1.5. Multiple GPCR pathways ............................................................................................ 23
1.1.6. Biological functions of VIP signaling ......................................................................... 23
2. VIP/PHI DEFICIENCY CAUSES MOUSE GUT DYSBIOSIS.............................................. 29
2.1. Our microbiota ................................................................................................................... 29
2.1.1. Discovery of E. coli and the coining of the microbiome ............................................. 29
2.1.2. Background.................................................................................................................. 34
2.1.3. Implications in disease ................................................................................................ 45
2.1.4. Neuropeptides and the microbiota ............................................................................... 57
2.1.5. Nucleotide sequencing techniques .............................................................................. 65
2.2. Materials and methods ....................................................................................................... 69

viii
2.2.1. Mouse husbandry......................................................................................................... 69
2.2.2. Genomic DNA extraction from tail biopsies ............................................................... 71
2.2.3. Genotyping .................................................................................................................. 71
2.2.4. Fecal sample collection ............................................................................................... 76
2.2.5. DNA extraction (performed at MUMC)...................................................................... 79
2.2.6. Next generation rRNA sequencing (performed at MUMC) ........................................ 79
2.2.7. Bioinformatics analysis ............................................................................................... 80
2.3. Results ................................................................................................................................ 85
2.3.1. Genotyping .................................................................................................................. 85
2.3.2. Genotype affects taxonomic structure ......................................................................... 90
2.3.3. Alpha diversity, within each group, comparisons ..................................................... 101
2.3.4. Beta diversity, between the groups, comparison ....................................................... 103
2.3.5. Predictive metagenome functional content with PICRUSt and the KEGG
database ..................................................................................................................... 105
2.4. Discussion ........................................................................................................................ 108
3. VIP SIGNALING IN T-LYMPHOCYTES AND EOSINOPHILS ....................................... 119
3.1. Introduction ...................................................................................................................... 119
3.1.1. Immune system overview .......................................................................................... 119
3.1.2. The innate immune system ........................................................................................ 120
3.1.3. The adaptive immune system .................................................................................... 122
3.1.4. VIP in the immune system ........................................................................................ 125
3.1.5. VIP in asthma ............................................................................................................ 129
3.1.6. Eosinophils and T-cells in IBD and immune cell trafficking .................................... 132
3.2. Materials and methods ..................................................................................................... 134
3.2.1. Animal cell culture .................................................................................................... 134
3.2.2. cAMP assay ............................................................................................................... 136

ix
3.2.3. Bone-marrow derived eosinophils ............................................................................. 137
3.2.4. Flow cytometry .......................................................................................................... 140
3.3. Results .............................................................................................................................. 140
3.3.1. cAMP ......................................................................................................................... 140
3.3.2. Bone marrow eosinophil differentiation .................................................................... 146
3.3.3. Eosinophil differentiation verification ...................................................................... 150
3.4. Discussion ........................................................................................................................ 153
3.4.1. cAMP assay ............................................................................................................... 153
3.4.2. Eosinophil differentiation .......................................................................................... 154
4. ILLUMINATE-MIRNA: PARADIGM FOR HIGH-THROUGHPUT, LOW-COST,
AND SENSITIVE MIRNA DETECTION IN SERUM SAMPLES AT POINT-OF-
CARE SETTINGS ................................................................................................................. 157
4.1. Introduction ...................................................................................................................... 157
4.1.1. MicroRNA (miRNA) biosynthesis ............................................................................ 158
4.1.2. MicroRNAs as disease biomarkers ........................................................................... 162
4.2. Materials and methods ..................................................................................................... 166
4.2.1. Micro RNA isolation ................................................................................................. 166
4.2.2. First strand cDNA synthesis ...................................................................................... 167
4.2.3. qRT-PCR ................................................................................................................... 167
4.2.4. Percent recovery calculations .................................................................................... 168
4.2.5. iLluminate-miRNA miRNA detection........................................................................ 168
4.3. Results .............................................................................................................................. 172
4.3.1. MicroRNA detection ................................................................................................. 172
4.4. Discussion ........................................................................................................................ 178
5. REFERENCES ....................................................................................................................... 182
APPENDIX. NUMERICAL DATA AND TAXONOMIC TREE EXPANSION ..................... 213

x
LIST OF TABLES
Table Page
1. Amino acid (AA) sequence comparison between VIP and the other Secretin family
members. ................................................................................................................................... 3
2. VIP AA sequence homology among different species ............................................................. 5
3. Neurotransmitter secretions by microorganisms. ................................................................... 61
4. PCR primers used to interrogate WT and KO alleles for VIP, VPAC1, and VPAC2. ........... 72
6. Fecal sample collection summary for this study. .................................................................... 77
7. Qiime mapping file. ................................................................................................................ 81
8. Legend for figure 27 genotyping ............................................................................................ 89
9. Let-7 expression levels in different human cancers. ............................................................. 162
10. Summary of iLluminate-miRNA and qRT-PCR data and from spiked-in Let-7b
experiments. .......................................................................................................................... 177
11. Comparison to predicted percent recovery to 100%. ............................................................ 178

xi
LIST OF FIGURES
Figure Page
1. The evolutionary history of the secretin-glucagon superfamily. .............................................. 4
2. Central dogma scheme for the VIP gene. ................................................................................. 7
3. Information flow for the PACAP gene. .................................................................................... 9
4. Defining characteristics of GPCRs. ........................................................................................ 12
5. The 5 classes of GPCRs. ......................................................................................................... 15
6. VIP/VPAC1/2 signaling by eliciting [cAMP] through heterotrimeric G-protein
activation of adenylyl cyclase. ................................................................................................ 18
7. Schematic representation of the enzymatic regulation of AC by G-protein binding. ............. 22
8. Locations of VIP receptors. .................................................................................................... 25
9. Diversity of biomass through the human gastrointestinal tract. ............................................. 32
10. Assortment of microbial populations throughout the human body. ....................................... 35
11. Changes in human gut microbiota diversity based upon location. ......................................... 37
12. Gut microbiota diversity amongst the biological kingdom Animalia. .................................... 39
13. Selectivity of the human gut in comparison to other ecosystems. .......................................... 41
14. The change in our intestinal microbiota composition through different stages of life. .......... 45
15. Importance of microbiota function in weight control. ............................................................ 48
16. Disease state differences between Crohn’s disease and ulcerative colitis. ............................. 50
17. Distribution of bacterial populations on the skin. ................................................................... 53
18. The endocrine organs of the human body. .............................................................................. 59
19. Gel electrophoresis result from an example Sanger sequencing run. ..................................... 66
20. VIPKO generation and primer target location. ....................................................................... 73
21. Replacement of VPAC1 exons 4 to 6 with PGK-1-Neomycin cassette. ................................ 74
22. Generation of VPAC2 knockout mice. ................................................................................... 75

xii
23. Fecal sample collection strategy. ............................................................................................ 78
24. Group mean multiple comparison. .......................................................................................... 84
25. PICRUSt metagenomic analysis using the LEfSe tool. .......................................................... 85
26. Punnett square demonstrating mouse breeding strategy, predicted and actual
outcomes. ................................................................................................................................ 87
27. Characteristic example results from the genotyping PCR reaction. ....................................... 88
28. Phylum level taxonomic differences between VIP male and female +/+, +/- and -/-. ............ 92
29. Microbial community changes at the genus level for VIP mouse strains. .............................. 93
30. Levels of Bacteroidetes and Firmicutes among the mice strains. ........................................... 94
31. Ratio of Firmicutes to Bacteroidetes between tested mouse strains. ...................................... 95
32. Phylum level statistical differences between VIP strains and sexes. ...................................... 97
33. Changes in group 1, Bacteroides, uncultured Porphyromonadaceae and Helicobacter. ........ 99
34. Genus level analysis of group 2, Mucispirillum, Alistipes and uncultured
Bacteroidales S24-7. ............................................................................................................. 100
35. Changes in the Peptococcaceae family and the Lachnospiraceae NK4A136 group
(group 3)................................................................................................................................ 101
36. PD whole tree analysis of alpha diversity. ............................................................................ 103
37. Weighted unifrac beta diversity PCoA analysis. .................................................................. 105
38. Predicted functional metagenomics using PICRUSt. ........................................................... 107
39. PICRUSt results interpretation. ............................................................................................ 117
40. The localization of VIP throughout the alveolar epithelium during allergen challenge. ...... 131
41. Visualized bone marrow isolation protocol. ......................................................................... 138
42. Bone marrow derived eosinophil generation protocol. ......................................................... 139
43. cAMP ELISA standard curve. .............................................................................................. 142
44. Changes in cAMP concentration in Hut-78 cells by VIP. .................................................... 143
45. Effects of VIP signaling on cAMP in Molt-4 cells. .............................................................. 144

xiii
46. Impact of VIP signaling pathway on MCF-7 epithelial cell line cAMP levels. ................... 145
47. Changes in cell density during the 14-day differentiation protocol. ..................................... 147
48. Eosinophil generation from bone marrow with 25 million seeded cells in 5 mL. ................ 148
49. Changes in eosinophil numbers over 14 days when seeded at 1 x10⁶ cells/mL. .................. 149
50. Cytospin verification of bone marrow derived eosinophils. ................................................. 151
51. Flow cytometry analysis of Siglec-F PE expression levels on day 14. ................................ 152
52. Nuclear miRNA biosynthesis steps. ..................................................................................... 160
53. Cytoplasmic modifications and protein translation silencing by miRNA. ........................... 161
54. Experimental strategy for miRNA detection method testing. ............................................... 170
55. Nanogap structure and fluorescent enhancement due to nanogap size. ................................ 171
56. Let-7b recovery in water sample. .......................................................................................... 173
57. Percent recovery of Let-7b spiked into human serum samples. ........................................... 174
58. Scrambled versus Let-7b detection in water and serum by both iLluminate-miRNA
and qRT-PCR platforms. ...................................................................................................... 175
59. Direct percent recovery comparisons at 12nM in water and serum...................................... 176

xiv
LIST OF ABBREVIATIONS
AA ..................................................................Amino Acid
Ab ...................................................................Antibody
ADCY ............................................................Adenylyl cyclase type
ADHD ............................................................Attention deficit hyperactivity disorder
ANOVA ........................................................Analysis of variance
APC ...............................................................Antigen presenting cell
ATCC .............................................................American Type Cell Culture
ATP ................................................................Adenosine triphosphate
BAL................................................................Bronchoalveolar lavage
BDNF .............................................................Brain-derived neurotropic factor
BM ................................................................Bone marrow
BSA ................................................................Bovine serum albumin
Ca2+ ...............................................................Calcium ion
cAMP ............................................................Cyclic adenosine monophosphate
CD .................................................................Cluster of differentiation
chFBS ............................................................Characterized fetal bovine serum
CNG ..............................................................Cyclic nucleotide-gated ion channels
CNS ...............................................................Central nervous system
COX ..............................................................Cyclooxygenase
DEP ...............................................................Dielectrophoretic label
DMEM ..........................................................Dulbecco’s Modified Eagle Medium
DMSO ...........................................................Dimethyl sulfoxide
DNA ..............................................................Deoxyribose nucleic acid
EAE ................................................................Experimental autoimmune encephalomyelitis

xv
EDTA .............................................................Ethylenediaminetetraacetic acid
EGFR .............................................................Epidermal growth factor receptor
ELISA ...........................................................Enzyme-linked immunosorbent assay
EMEM ...........................................................Eagle’s Minimum Essential Medium
EPAC ............................................................Exchange factor directly activated by cAMP
EOS ................................................................Eosinophils
FACS .............................................................Fluorescence-activated cell sorting
FITC ..............................................................Fluorescein isothiocyanate
GDP ...............................................................Guanosine diphosphate
GEF ...............................................................Guanine-nucleotide exchange factor
GHRH ...........................................................Growth hormone–releasing hormone
GI ..................................................................Gastrointestinal
GIP ................................................................Gastric inhibitory polypeptide
GPCR ............................................................G protein-coupled receptor
GTP ................................................................Guanosine triphosphate
H&E ...............................................................Hematoxylin and eosin
H2R ................................................................Histamine receptor 2
HBSS..............................................................Hank’s balanced salt solution
HCl .................................................................Hydrochloric acid
HET ................................................................Heterozygous
HIV ................................................................Human immunodeficiency virus
IACUC ..........................................................Institutional Animal Care and Use Committee
IBD ................................................................Inflammatory Bowel Disease
IBMX ............................................................Isobutylmethylxanthine
IFN ................................................................Interferon

xvi
Ig_ ..................................................................Immunoglobulin_
IL- ..................................................................Interleukin-
kDa ................................................................kilodalton
KEGG ............................................................Kyoto Encyclopedia of Genes and Genomes
KO ..................................................................Knockout
LPS .................................................................Lipopolysaccharides
mRNA ...........................................................Messenger ribonucleic acid
miRNA ..........................................................micro RNA
MUMC ..........................................................University of Missouri Metagenomics Center
MyD88 ..........................................................Myeloid differentiation primary response 88
NOD ..............................................................Non-obese diabetic
OTU ..............................................................Operational Taxonomic Unit
PAC1 .............................................................Pituitary adenylate cyclase-activating polypeptide
type I receptor
PACAP ..........................................................Pituitary adenylate cyclase-activating polypeptide
PAMPs ..........................................................Pathogen-associated molecular patterns
PBS ...............................................................Phosphate buffer solution
PCoA .............................................................Principal Coordinates Analysis
PCR ................................................................Polymerase chain reaction
PICRUSt ........................................................Phylogenetic Investigation of Communities by
Reconstruction of Unobserved States
pH ...................................................................Potential of hydrogen
PHI .................................................................Peptide-Histidine Isoleucine
PHM ...............................................................Peptide-Histidine Methionine
PHV................................................................Peptide-Histidine Valine
PKA................................................................Protein Kinase A

xvii
PKC ................................................................Protein Kinase C
PRP ...............................................................PACAP-related peptide
PRRs .............................................................Pattern recognition receptors
PSA ...............................................................Polysaccharide A
qPCR ..............................................................Quantitative polymerase chain reaction
qRT-PCR........................................................Quantitative reverse transcriptase polymerase chain
reaction
RA .................................................................Rheumatoid Arthritis
RNA ..............................................................Ribonucleic acid
ROS ...............................................................Reactive oxygen species
RPMI .............................................................Roswell Park Memorial Institute Medium
rRNA .............................................................Ribosomal ribonucleic acid
RT-PCR..........................................................Reverse transcriptase polymerase chain reaction
SCFA..............................................................Short chain fatty acid
SEM ...............................................................Standard error of mean
Siglec-F ..........................................................Sialic acid-binding immunoglobulin-like lectin F
siRNA ............................................................Small interfering RNA
SL ...................................................................Stem loop
snoRNA..........................................................Small nucleolar RNA
T cell ..............................................................T lymphocyte cell
T-MyD88KO..................................................T-cell specific MyD88 knockout
Th ..................................................................T helper l
TMD ..............................................................Transmembrane domain
TNF ................................................................Tumor necrosis factor
VIP ................................................................Vasoactive intestinal peptide

xviii
VPAC1 ..........................................................Vasoactive intestinal peptide/pituitary adenylate
cyclase activating polypeptide receptor 1
VPAC2 ..........................................................Vasoactive intestinal peptide/pituitary adenylate
cyclase activating polypeptide receptor 2
WT .................................................................Wild Type

xix
LIST OF APPENDIX TABLES
Table Page
A1. VIP Strains at the phylum taxonomic level. ........................................................................ 213
A2. VIP Strains at the class taxonomic level. ............................................................................ 213
A3. VIP Strains at the order taxonomic level. ............................................................................ 214
A4. VIP Strains at the family taxonomic level. .......................................................................... 215
A5. VIP Strains at the genus taxonomic level. ........................................................................... 216

xx
LIST OF APPENDIX FIGURES
Figure Page
A1. Changes at the class level in VIP strains. ............................................................................ 219
A2. VIP male and female order level taxonomic changes. ........................................................ 220
A3. Changes in abundance between individual bacterial families. ............................................ 221

1
1. INTRODUCTION
This first paragraph summarizes the structure and assists in visualizing the makeup of
each of the five chapters of my dissertation. The first chapter consists of a literature review,
while chapters 2, 3, and 4 concentrate on performed research with the 5th holding the references.
Chapter 1 delves into the history of vasoactive intestinal peptide (VIP) and its receptors,
discusses G-protein coupled receptor signaling and describes the roles of VIP in bodily systems
and disease. The second chapter contains a literature review of recent microbiome research and
discusses our 16S rRNA sequencing findings regarding changes in the intestinal microbiota due
to the genetic silencing of the VIP ligand in both sexes of mice. The third chapter reviews the
role of VIP in the immune system. It discusses my cAMP quantification contributions towards a
laboratory publication, research into different receptor profiles of human T-cell lines, and how
VIP signals through each receptor on T-cells, as well as eosinophilic differentiation of VPAC2
knockout mice whom exhibit a delayed eosinophilic response during allergic asthma versus wild
type. A side-collaboration with Dr. Nawarathna’s laboratory in the Department of Electrical and
Computer engineering is discussed in chapter 4. My contributions to this project included qRT-
PCR expertise which were used to determine the efficacy of the new iLluminate-miRNA
microRNA detection technique. The last chapter (5) contains references for all of the previous
chapters. I hope you enjoy reading this dissertation as much as I enjoyed writing it and learn
something new and interesting along the way.
1.1. General introduction and background
1.1.1. Vasoactive intestinal peptide
Vasoactive intestinal peptide (VIP) is a 3.3 kilodalton (kDa) protein consisting of 28-
amino acids (AA), and is expressed heterogeneously in mammalian tissues. VIP was first

2
discovered in porcine intestines by Sami Said and Viktor Mutt in 1970 who hypnotized there
were vasoactive proteins located in the gut (Said and Mutt 1970). Two years later, the same two
scientists confirmed VIP’s vasodilatory role using canine femoral arteries (Said and Mutt 1972).
The peptide’s discovery in the intestines, and its vasoactive activity resulting in increased artery
diameters, contributed to its designation as vasoactive intestinal peptide or VIP for short.
Located on position 25.2 of the longer arm of the 6th human chromosome (Kitts et al. 2016), VIP
is a member of a family of evolutionarily related proteins called the Secretin family (Ulrich,
Holtmann, and Miller 1998). This peptide family is composed of 15 known peptide hormones
whose ligands share amino acid similarity, and their endogenous receptors possess structural
likeness (Millar, Newton, and Roseweir 2012). Some of these peptides include: glucagon, gastric
inhibitory polypeptide (GIP), secretin, pituitary adenylate cyclase activating polypeptide
(PACAP) (see table 1) (Segre and Goldring 1993). When aligned at the amino acid level, as
displayed in Table 1, the members of this family share AA sequence similarities, with the
primary AA sequences of VIP and PACAP sharing the most at 68% similarity (Ng et al. 2012).
This AA similarity permits cross-reactivity, called receptor shuffling (Hamann, Hartmann, and
van Lier 1996), allowing VIP and PACAP ligands to bind common receptors (Shivers et al.
1991).

3
Table 1. Amino acid (AA) sequence comparison between VIP and the other Secretin family
members.
Family
member
(% similarity)
Amino acid residues
VIP (100%) HSDAV FTDNY TRLRK QMAVK KYLNS ILN
PACAP (68%) HSDGI FTDSY SRYRK QMAVK KYAAV VL
PHI-27 (39%) HADGV FTSDF SRLLG QLSAK KYLES LI
Secretin (32%) HSDGT FTSEL SRLRE GARLQ RLLQG LV
GHRH (29%) YADAI FTNSY RKVLG QLSAR KLLQD DIMSE QQGES NQERG ARARL
Glucagon
(18%) HSQGT FTSDY SKYLD SRRAQ DFVQW LMNT
GIP (10%) YAEGT FISDY SIAMD KIHQQ DFVNW LLAQK GKKND WKHNI TQ
Transthyretin
(7%)
GPTGT GESKC PLMVK VLDAV RGSPA INVAV HVFRK AADDT WEPFA SGKTS
ESGEL HGLTT EEEFV EGIYK VEIDT KSYWK ALGIS PFHEH AEVVF TANDS GPRRY
TIAAL LSPYS YSTTA VVTNP KE
1.1.1.1. VIP amino acid sequence
Table 1 utilizes single letter abbreviations for amino acids. The three letter primary amino
acid sequence for human VIP is His-Ser-Asp-Ala-Val-Phe-Thr-Asp-Asn-Tyr-Thr-Arg-Leu-Arg-
Lys-Gln-Met-Ala-Val-Lys-Lys-Tyr-Leu-Asn-Ser-Ile-Leu-Asn (Mutt and Said 1974).
Determined by Edman degradation, this amino acid sequence is completely conserved in other
mammals studied, such as cows, mice, rats, horses and dogs. So far, the guinea pig is the only
mammal studied whose VIP AA sequence is not 100% identical to humans. Their VIP sequence
is 86% homologous at the amino acid level due to four amino acid substitutions (Du et al. 1985).
Table 2 compares VIP sequences between a variety of different species. What is made clear by
analysis of these AA sequences is that VIP has been evolutionarily conserved for over hundreds
of millions of years. Evidence for this was provided by Kumar and Hedges, who analyzed
differences between 658 nuclear genes to determine that Cod (Gadus morhua), from class

4
Actinopterygii, and humans (Homo sapiens) from class Mammalia, are evolutionarily separated
by over 450 million years (Kumar and Hedges 1998). Maintenance of AA sequence identity of
VIP between Cod and Human (83%, see table 2) (Smalley, Barrow, and Foster 2009), suggests
an essential role for the VIP peptide and may explain its stringent evolutionary sequence
conservation over this geological time-frame of nearly half a billion years.
Figure 1. The evolutionary history of the secretin-glucagon superfamily.
Hundreds of millions of years of evolution have resulted in the formation of different ligands
from one ancestral gene (PACAP/glucagon). It is currently theorized that numerous
duplications of the gene have resulted in our current repertoire of ligands. (Figure from
Handbook of Hormones, 2016, and Yoshio Takei (Takei 2016)).

5
Table 2. VIP AA sequence homology among different species
Species
% sequence
homology to
human VIP
VIP amino acid residues
Human pig mouse cow rat horse
dog cat (Du et al. 1985)
100% HSDAV FTDNY TRLRK QMAVK KYLNS ILN
Guinea pig (Smalley, Barrow, and
Foster 2009)
86% HSDAL FTDTY TRLRK QMAMK KYLNS VLN
Chicken (Nilsson 1975) 86% HSDAV FTDNY SRFRK QMAVK KYLNS VLT
Alligator (Wang and Conlon 1993) 86% HSDAV FTDNY SRFRK QMAVK KYLNS VLT
Frog (Chartrel et al. 1995) 86% HSDAV FTDNY SRFRK QMAVK KYLNS VLT
Cod (Thwaites et al. 1989) 83% HSDAV FTDNY SRFRK QMAAK KYLNS VLT
This table was recreated from data compiled by (Smalley, Barrow, and Foster 2009).
1.1.1.2. Creation of the VIP protein
VIP is initially translated into a 170-amino acid polypeptide, [prepro-VIP], which is post-
translationally tailored to generate the full length, 28 AA VIP ligand (Kristensen, Georg, and
Fahrenkrug 1997). Biosynthesis of the prepro-VIP forerunner supplies, PHI (peptide histidine
isoleucine) in mice, or its human counterpart PHM (peptide histidine methionine), or a C-
terminally extended form of PHI/M, called PHV (peptide histidine valine) in all species (Harmar
et al. 2012), and VIP in all species, by proteolytic processing (visualized in figure 2) (Noguchi et
al. 1989). Post-translational proteolytic processing allows for removal of the signal sequence
once the protein has been directed to the lumen of the endoplasmic reticulum (Tsukada et al.
1985). As the prepro-VIP protein migrates to the Golgi apparatus, proteases tailor it to yield VIP
and related peptides for secretion, thus generating multiple peptide products (Ballesta et al.
1985).

6
Tissue-specific variations in the generation and processing of prepro-VIP along with
alternative splicing at the mRNA level (Fahrenkrug 1985) are additional mechanisms that can
alter expression levels of the prepro-VIP related peptides, resulting in differential expression
profiles of VIP and PHM/V in various tissues (Ishihara et al. 1992). Importantly, it should be
noted that each of the three bioactive peptides are encoded entirely within a single gene
(PHM/PHI/PHV encoded by exon 4 and VIP encoded by exon 5) (You et al. 1995; Kitts et al.
2016), thus allowing mRNA splicing mechanisms to tailor the final mRNA product with both or
one of the VIP-related peptides encoded in the processed mRNA template. Examples of
expression of VIP have come from measurements of cerebral cortex and suprachiasmatic nucleus
extracts revealing that among the peptides synthesized downstream of the prepro-VIP peptide,
VIP was found in the highest concentrations (Mikkelsen and Fahrenkrug 1994). Analysis of
these peptides in the gastrointestinal tract (focused organ for chapter 2 research), revealed greater
expression of VIP-immunoreactive nerves. VIP and PHI concentrations were similar in all
regions of the gut except the fundus (cranial portion of the stomach), where VIP presence far
exceeded PHI (Bishop et al. 1984). Various biologically active peptide derivatives of VIP
include: VIP4–28, VIP6–28 and VIP10–28. VIP4–28 acts as a potent agonist for VIP’s vasoactive
intestinal peptide/pituitary adenylate cyclase activating polypeptide receptor 1 (VPAC1) receptor
and acts as an antagonist for the VPAC2 receptor (Summers et al. 2003). VIP6–28 and VIP10–28
both act as antagonists for both VIP receptors (discussed later) (Fishbein et al. 1994; Mohney
and Zigmond 1998; Turner, Jones, and Bylund 1986).

7
PHI
Figure 2. Central dogma scheme for the VIP gene.
The VIP gene consists of 7 exons (rectangles) transcribed into an mRNA molecule as
indicated. This is translated into a 170-amino acid polypeptide known as prepro-VIP. The
signal peptide, sometimes referred to as the localization sequence, is a short N-terminal
peptide that directs the protein towards the secretory pathway (Blobel et al. 1979). Post
processing results in the formation of PHM (human) (27 AA), PHI (mouse) (27 AA), PHV
(all species) (42 AA), and VIP (all species) (28 AA) (Dejda, Matczak, and Nowak 2004),
which are present in various concentrations in most regions of the body (Palle, Ottesen, and
Fahrenkrug 1992).
PHV
(22-79)
PHV
111-
122 VIP
Signal
Peptide
156-
170 PHM/I
170 amino acids
prepro-VIP
mRNA
VIP
post processing
VIP gene
PHM or
Translational Start Site

8
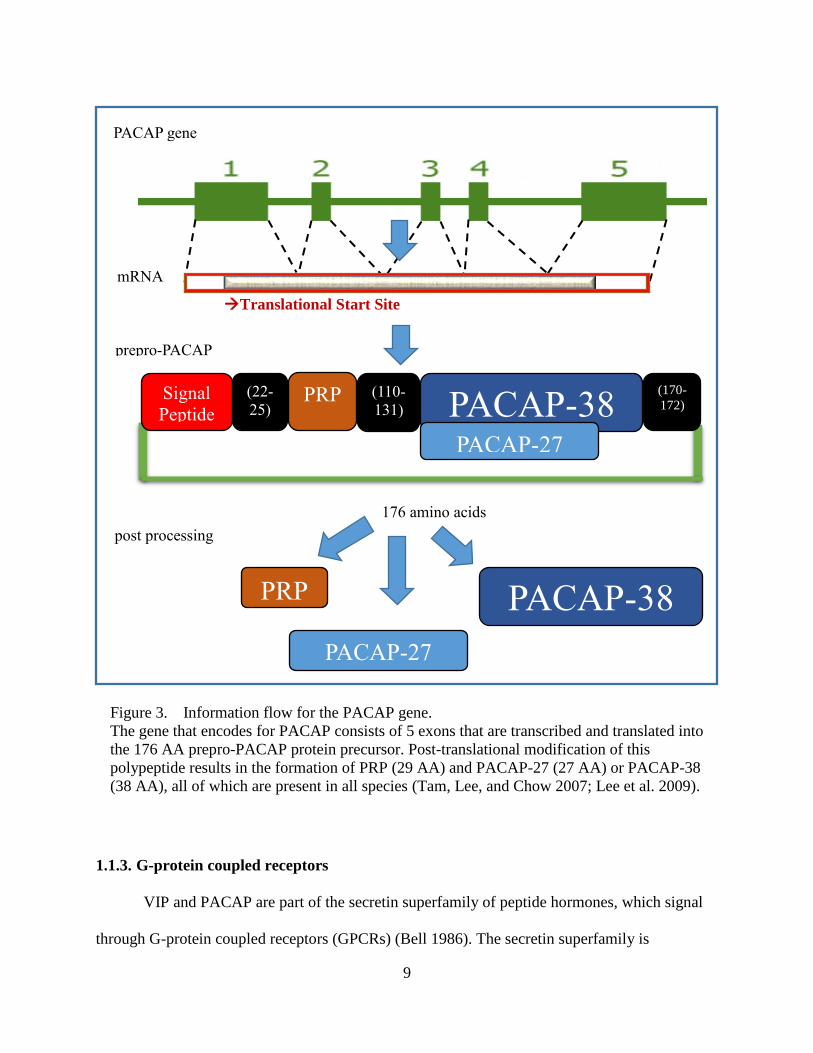
1.1.2. Pituitary adenylate cyclase-activating peptide (PACAP): gene to protein
PACAP, the member of the Secretin family that shares the greatest AA similarity (68%)
to VIP and is hypothesized to be the progenitor gene for VIP. As demonstrated in figure 3,
PACAP is also organized at the DNA level and synthesized into a bioactive peptide in a similar
fashion to VIP. This likeness at the DNA and protein level gives support for a gene duplication
mechanism giving rise to VIP, GHRH, and secretin genes (see Figure 1). The name pituitary
adenylate cyclase activating polypeptide originates from this protein’s ability to activate the
adenylyl cyclase enzyme in pituitary cells (Miyata et al. 1989). At least two forms of PACAP are
synthesized and denoted by a number that refers to its AA length. For example, PACAP-27,
consists of 27 AA, and is very similar in length to VIP sharing 68% AA sequence similarity
(Miyata et al. 1990). At the C-terminal end, PACAP-38 is extended C-terminally by an
additional 11 amino acids. The initial translated precursor polypeptide, which is later post-
translationally modified by proteases to form both forms of PACAP, is called prepro-PACAP
(Okazaki et al. 1992). Similar to VIP’s prepro precursor, this 176 AA sequence also encodes an
additional bioactive peptide called PRP (PACAP-related peptide) and PACAP (Hosoya et al.
1992). Depending on intracellular processing location, the PACAP sequence results in a
mutually-exclusive PACAP-27 or PACAP-38 protein from the prepro-PACAP precursor (Tam,
Lee, and Chow 2007).
9
1.1.3. G-protein coupled receptors
VIP and PACAP are part of the secretin superfamily of peptide hormones, which signal
through G-protein coupled receptors (GPCRs) (Bell 1986). The secretin superfamily is
Figure 3. Information flow for the PACAP gene.
The gene that encodes for PACAP consists of 5 exons that are transcribed and translated into
the 176 AA prepro-PACAP protein precursor. Post-translational modification of this
polypeptide results in the formation of PRP (29 AA) and PACAP-27 (27 AA) or PACAP-38
(38 AA), all of which are present in all species (Tam, Lee, and Chow 2007; Lee et al. 2009).
176 amino acids
prepro-PACAP
mRNA
PRP
post processing
(22-
25) PRP (110-
131) Signal
Peptide
(170-
172) PACAP-38
PACAP-27
PACAP-38
PACAP-27
PACAP gene
Translational Start Site

10
comprised of evolutionarily related peptides that cross link GPCRs to induce signal transduction
(Parker et al. 1984). GPCRs are the largest family of receptors comprising over 800 unique genes
encoded in the human body (Bjarnadottir et al. 2006). Crystallographers Robert Lefkowitz and
Brian Kobika, both received the Nobel prize in chemistry in 2012 for their discovery of GPCR
structure (Kobilka 1995). Found primarily in eukaryotes, GPCR’s are vital to cellular function,
and they represent about 3% of encoded genes within in the human genome (based on an
estimate of 22 thousand genes in the human genome) (Fredriksson et al. 2003). To date, around
45% of all pharmaceutical drugs target GPCR’s, and/or associated upstream/downstream
signaling molecules (Drews 2000), further supporting these receptors as an important “lynchpin”
regulating human health and disease (Overington, Al-Lazikani, and Hopkins 2006). All known
cellular effects mediated by VIP and PACAP are manifested through the binding and subsequent
signal transduction from at least three endogenously expressed GPCRs that will be the focus of
the next section (Leceta et al. 2000).
1.1.3.1. VIP Receptors denoted as VPAC1 and VPAC2
The receptors for VIP and PACAP include vasoactive intestinal peptide/pituitary
adenylate cyclase activating polypeptide receptor 1 (VPAC1) and VPAC2, while PACAP
preferentially (1000x greater affinity compared to VIP) binds to pituitary adenylate cyclase-
activating polypeptide receptor type I (PAC1) (Nussdorfer and Malendowicz 1998). As the
naming implies, VPAC1 and VPAC2 are receptors for both VIP and PACAP, while PAC1
preferentially binds to PACAP. VIP does bind to PAC1, but the binding affinity is a thousand
times lower than PACAP. Both VPAC1 and VPAC2 bind VIP and PACAP with equal affinity
(Kd ≈ 1 nM). PAC1 has high affinity for PACAP-27 and PACAP-38 (Kd ≈ 0.5 nM), and low
affinity for VIP (Kd > 500 nM) (Shivers et al. 1991) (Robberecht et al. 1991). This was

11
determined with receptor autoradiography, where excess VIP did not displace either PACAP-27
or 38 (Shivers et al. 1991). For this reason, VPAC1 and VPAC2 do not discriminate between
either VIP or PACAP peptide, where PAC1 is more selective towards PACAP. VPAC1 is
located at position 22.1 of the short arm of the third human chromosome (position 72.5 of the
long arm of the ninth mouse chromosome), VPAC2 is located at position 36.3 on the long arm of
the seventh human chromosome (position 62.6 on the long arm of the twelfth mouse
chromosome), and PAC1 is found at position 14 on the short arm of the seventh human
chromosome (position 7 on the short arm of the seventeenth mouse chromosome) (Kitts et al.
2016).
1.1.3.2. GPCR characteristics
GPCRs are characterized by a few similar features. First, the amino terminus of the
GPCR polypeptide exists in the extracellular environment, called the ectodomain and this N-
terminus makes up part of the ligand binding site. The peptide chain then “snakes” through the
plasma membrane seven times (Palczewski et al. 2000). This membrane spanning alpha-helical
hydrophobic region was, and continues to be, problematic with respect to obtaining enzyme
crystals, due to its extensive hydrophobic (e.g. greasy) nature, and is why GPCRs have been
historically so difficult to obtain X-ray structure information (Gether and Kobilka 1998). The
carboxyl terminus, which resides within the cytoplasm, interacts with signaling proteins to
transmit information from the plasma membrane to internal locales in the cell (Michino et al.
2009). One important signaling protein target that the C-terminus recognizes upon ligand
binding-induced conformational changes are heterotrimeric G proteins (Gilman 1970).
The repeated zigzagging of the protein’s primary sequence through the plasma membrane
results in the formation of three extracellular and intracellular loops connecting the seven

12
transmembrane domains of the GPCR protein (see Figure 4) (Trumpp-Kallmeyer et al. 1992).
The transmembrane domains work to lock the protein into the membrane and form the three
intracellular and extracellular loops (ICL1-3, ECL1-3). The extracellular loops are important for
receptor stability and work with the ectodomain for ligand recognition, binding and specificity
(Cook and Eidne 1997). Together the intracellular loops 2 and 3 form a guanine-nucleotide
exchange factor (GEF) responsible for signal transduction (Natochin, Gasimov, and Artemyev
2001). These structural features are all shared by the 800 different GPCR receptors in the human
body and have been categorized into multiple groups that will now be discussed.
Figure 4. Defining characteristics of GPCRs.
The two horizontal lines represent the phospholipid bilayer of the plasma membrane of the
cell. A GPCR is defined as a receptor which contains 7 transmembrane domains. These are
accompanied by 3 intracellular, 3 extracellular loops, an N-terminus ectodomain, and an
intracellular C-terminus region.
1 2 3
1 2 3

13
1.1.3.3. Class 1 GPCRs
GPCRs are categorized into five individual GPCR families (Fredriksson et al. 2003;
Graul and Sadée 2001; Bockaert and Pin 1999). The first family, commonly known as class 1 or
class A, possesses the largest molecular mass of the GPCR families (Angel, Chance, and
Palczewski 2009). Class 1 family GPCRs perform a multitude of critical biological functions,
including light detection, hormonal secretion and extracellular signaling (Kakarala and Jamil
2014). Currently, receptors in class 1 have been divided into 19 sub-groups (Joost and Methner
2002). Since rhodopsin was the first discovered member of this family, Class 1 is also frequently
referred to as the rhodopsin family. Rhodopsin, the eponym for this family, was the first GPCR
classified in this family and is a light-sensitive receptor found in the rods of the retina and is
involved in visual transduction. This receptor binds to a light sensitive biological pigment,
known as retinal, that absorbs energy in the visible range (~400 – 700 nm) range of the
electromagnetic radiation spectrum causing it to change its shape, which in turn causes a
conformational change in Rhodopsin initiating signal transduction and the conversion of light
into electrical signals (Farrens et al. 1996). Class 1 GPCRs bind their ligands between the outer
1/3 of the transmembrane region of the protein (Trumpp-Kallmeyer et al. 1995) (see figure 5).
1.1.3.4. Class 2 GPCRs
The second receptor family is titled class 2, class B, or the secretin family. This family
binds VIP, PHM/I, PHV, PACAP, PRR, glucagon, secretin, peptide HI-27, transthyretin
(prealbumin), GIP (gastric inhibitory peptide) and GHRH (growth hormone-releasing hormone),
(non-exhaustive list) (Laburthe, Couvineau, and Tan 2007). All members of this family
physically recognize peptide ligands, unlike class 1, that can recognize different classes of
molecular signals, including photons (Okada et al. 2001), and chemical pheromones (Choi et al.

14
2003). Class 2 GPCRs have an extended N-terminal domain, called the ectodomain, which
assists in binding their peptide ligands (Pantaloni et al. 1996). To illicit down-stream signaling,
the ligands bind between the amino terminal domain and the transmembrane domains (Hoare
2005).
1.1.3.5. Class 3, 4, and 5 GPCRs
The class 3 GPCRs or class C, is referred to as the glutamate family of GPCRs and
possesses a distinct extracellular domain called the Venus flytrap module (VFTM) (Wu et al.
2014; Bargmann 1997). This domain functions in a similar trapping manner as the carnivorous
plant, Dionaea muscipula or Venus flytrap. The ligand binds the extracellular ectodomain and
the receptor closes around it (Pin et al. 2004). The adhesion family, also called class 4 or class D,
has an extremely long amino terminal domain, in comparison to other GPCR families, which
does not bind to peptides but rather to components of the extracellular matrix (Bjarnadóttir et al.
2004). An example of this family is G protein-coupled receptor 56 (GPR56), whose ligand is
type III collagen (Luo et al. 2011). The final family is called Frizzled GPCRs, class 5, or class E.
This unconventional group contains the remainder of GPCRs that do not fall into classes 1-4
(Schulte and Bryja 2007). Frizzleds are activated by the wingless/int1 (WNT) family of
lipoglycoproteins (Koval et al. 2011).

15
Class 1 Class 2
Class 3
Class 4 Class 5
Figure 5. The 5 classes of GPCRs.
Schmatic representation of all five GPCR classes with ligand binding sites denoted by
diamonds. All of these classes share certain defining characteristics. For example, they share
a seven-transmembrane region, but the location of ligand binding differs for all five classes
as depicted. N-terminus (NH2) and C-terminus (COOH) are indicated for each GPCR class.
Venus Fly Trap mechanism (VFTm) is emphasized for class 3 GPCRs.

16
1.1.3.6. VIP signaling via Heterotrimeric G-proteins
Once VIP binds to one of its class 2 receptors (VPAC1/2 Kd ≈ 1 nM) (PAC1 Kd ≈ 1 µM)
(Shivers et al. 1991) (Robberecht et al. 1991), the ligand binding causes conformational changes
within the GPCR structure, which illicit downstream signaling by binding and activating
heterotrimeric G-proteins (Unger et al. 1997; Baldwin, Schertler, and Unger 1997). Three
individual subunits make up heterotrimeric G-proteins, called alpha, beta, and gamma proteins
(Noel, Hamm, and Sigler 1993). These are not integral membrane proteins. The alpha subunit is
targeted to and becomes associated with the cell membrane through a lipid palmitoyl post-
translational modification (PTM), that inserts the alpha subunit into the cell’s plasma membrane
(Linder et al. 1993). The alpha-protein is activated when bound to GTP (guanosine triphosphate).
Upon the hydrolysis of GTP to GDP (guanosine diphosphate), the alpha protein becomes
inactivated (Coleman et al. 1994; Markby, Onrust, and Bourne 1993).
The G-alpha subunit exists in several sub-types. For class 2 GPCR’s the primary subunits
are Gαs (adenylate cyclase stimulator) and Gαi (adenylate cyclase inhibitor) (Sprang 1997). The
Gαs subunit increases the production of intracellular cAMP (cyclic adenosine monophosphate)
from ATP (adenosine triphosphate) hydrolysis by binding to and stimulating the enzyme
adenylyl cyclase (Gilman 1990). The Gαi subunit counteracts the Gαs subunit and inhibits the
conversion of ATP to cAMP (Coleman et al. 1994). The adenylyl cyclase enzyme contains one
binding site for Gαi and another for Gαs (Tang and Gilman 1991; Gilman 1984). A Nobel prize
was awarded to Alfred Gilman in 1994 for his work on the regulation of adenylyl cyclase by G
proteins (Gilman 1995).
The gamma subunit also utilizes a lipid moiety for insertion into the plasma membrane’s
phospholipid bilayer (Linder et al. 1991). Under physiological conditions the beta and gamma

17
subunits are typically found together, and are collectively known as the beta-gamma complex
(Pitcher et al. 1992). These three G-proteins are found as a heterotrimeric complex only when the
alpha subunit is in the inactive, or off state (GDP bound). Upon ligand/ GPCR binding the α-
subunit dissociates from the beta-gamma dimer, inducing the α monomer to exchange GDP for a
free GTP; Thus activating the α-subunit. (Oldham and Hamm 2008). Gα/GTPactive then moves
within the membrane plane from the receptor to bind to adenylyl cyclase and increase its Kcat and
formation of the secondary signaling messenger, cAMP (visualized in figure 6) (Robishaw,
Smigel, and Gilman 1986).

18
VPAC1/2
Figure 6. VIP/VPAC1/2 signaling by eliciting [cAMP] through heterotrimeric G-
protein activation of adenylyl cyclase.
The binding of the VIP ligand causes a conformational change in the VPAC1/2 GPCR for Gα
binding and its exchange of GTP for GDP to its active form. The Gα GTP active protein
dissociates from the Gβγ complex to bind and activate adenylyl cyclase, which coverts ATP to
cAMP and organic phosphates. The Gα GTP active becomes inactivated as the GTP is replaced
by GDP, which allows for the reformation of the heterotrimeric G-protein and terminates the
signal as Gαs GDP inactive dissociates from adenylyl cyclase resulting in the reduction of its
activity. Figure recreated by author and based on Respiratory Research 2003 (Billington and
Penn 2003).
other
signaling
pathways

19
1.1.3.7. G-protein signaling
The cycle of G-protein signaling begins with ligand binding. Once binding has occurred
to its cognate receptor, conformational changes in the GPCR allow for the binding of the
heterotrimeric G-protein complex by physically engaging the alpha subunit. Once bound to the
receptor, the alpha subunit is in the off-state and bound to GDP. It becomes induced to exchange
GDP for GTP by binding to the GPCR, thereby converting Gα into an active, or the on-state. The
GPCR, therefore, acts as a guanine nucleotide exchange factor (GEF) by stimulating the release
of GDP and allowing the binding of GTP (Luttrell, Daaka, and Lefkowitz 1999; Buday and
Downward 1993). The activated state of Gα/GTP induces the dissociation of the alpha-subunit
from the beta-gamma complex. This dissociation results in an activated alpha subunit bound to
the GPCR and the beta-gamma complex moving away to induce other signaling that will not be
discussed (van Biesen et al. 1995). Here, the beta-gamma complex functions as a negative
regulator of the Gα protein. In the heterotrimeric form, the Gβγ subunit also increases the affinity
of the G protein for GDP, keeping it in an inactive state (Brandt and Ross 1985). The alpha
subunit preferentially binds to the GPCR if complexed with the beta-gamma complex and
therefore the Gα subunit is delivered to the GEF-activating GPCR to induce: 1. Exchange GDP
for GTP and 2. Gα GTP:active dissociation for the Gβγ dimer (Naor, Benard, and Seger 2000)
(Markby, Onrust, and Bourne 1993).
The active Gα/GTP subunit binds to adenylyl cyclase increasing its enzyme kinetics to
promote increasing the conversion of ATP to cAMP; a necessary secondary messenger for
protein kinase A (PKA) activation and other down-stream signaling molecules (Dessauer and
Gilman 1997). The alpha subunit is categorized as a GTPase, hydrolyzing GTP to GDP +
inorganic phosphate (Kleuss et al. 1994). Upon binding to its target, in this case adenylyl

20
cyclase, the active alpha subunit hydrolyzes GTP to GDP inducing its off-state and dissociation
from adenylyl cyclase (Cassel and Selinger 1978). Thus, intrinsic GTPase activity limits its time
bound to adenylyl cyclase and acts as a self-limiting “timer” for adenylyl cyclase activation. The
kcat for this reaction is very slow and takes about 5 minutes. The free roaming G-alpha subunit
(GDP) re-attaches to a beta-gamma complex to form a heterotrimeric G-protein complex
(Logothetis et al. 1987). This cycle of activation and inactivation allows for intracellular
signaling to occur. These steps occur for VIP’s two primary receptors VPAC1 and VPAC2
(Murthy et al. 1993).
1.1.4. Adenylyl cyclase enzyme
In mammals, currently there are ten known isoforms of adenylyl cyclase enzymes,
dubbed ADCY1 through ADCY10 (Hanoune and Defer 2001). Of these ten, ADCY1 through
ADCY9 are transmembrane enzymes, while ADCY10 is the only soluble form identified to date
(Chen et al. 2013). Found primarily in the male spermatozoa, ADCY10 functions independent of
G protein dependent signaling, but rather acts as a pH (potential of hydrogen) sensor within the
cell. Researchers discovered ADCY10 when trying to understand the cAMP-dependent
activation process in mature male sperm (spermatozoa) (Chen et al. 2000). ADCY1 through
ADCY9 are made up of a single polypeptide (~154 kDa (Neer 1976)) and have very similar
structures (Harayama 2013).
The ADCYe proteins are comprised of two transmembrane domains (TMD) 1 and
TMD2. Each transmembrane domain has a cluster of 6 transmembrane segments that “wind”
through and anchor the enzyme into the plasma membrane (Tang and Gilman 1995). The small
bridge between TMD1 and TMD2 is named the C1 domain, while the peptides near the

21
carboxylic acid terminus are called the C2 domain. Each of these domains is further separated
into 2 sections, called C1a and C1b, and C2a and C2b (Zhang et al. 1997).
When these two domains are distal from each other (figure 7), the adenylyl cyclase
enzyme is in its inactive state. The Gαs/GTP subunit unifies these two domains by joining the
C2a domain with the C1a and C1b domains. The dimerization of these two domains then allows
for the enzymatic conversion of ATP to cAMP and pyrophosphate (Yan et al. 1996; Whisnant,
Gilman, and Dessauer 1996; Yan et al. 1997; Zimmermann, Zhou, and Taussig 1998). The Gαi
subunit reverses these steps and switches adenylyl cyclase into the off state. The small “bridge”
created by Gαs acts as the binding site for Gαi inactivating the enzyme and stopping cAMP
production (Dessauer et al. 1998). Interestingly Gαs GTP active binding to adenylyl cyclase is
responsible for generating a Gαi GTP active binding site, therefore allowing the cell to limit
adenylyl cyclase acitivity even more rapidly than the GTPase activity of Gαs.
The G-beta-gamma complex that dissociates from the Gαi/αs proteins can also act upon
adenylyl cyclase (Diel et al. 2006). A binding site for the Gβγ complex is present on adenylyl
cyclase and can act to temporarily upregulate this enzyme (Chen et al. 1995). In addition to
adenylyl cyclase activation from Gαs, Gβγ can also activate adenylyl cyclase and i[cAMP]
elevation (Inglese et al. 1994) (Wittpoth et al. 1999). Adenylyl cyclase can also be activated by
directly bypassing the GPCR, through forskolin, a tool to induce cAMP production, which binds
to the Gαs site on adenylyl cyclase (Shu and J. Scarpace 1994), and can increase its enzymatic
activity by 103 (Liu et al. 1997). The cAMP produced by adenylyl cyclase continues the
downstream signaling of the GPCR and is pictured in figure 7. The amount of cAMP produced
along with the pathways activated/inhibited by cAMP are cell specific.

22
Inactive
Active
Gαs
Gαs
Gαi
Gαi
Figure 7. Schematic representation of the enzymatic regulation of AC by G-protein
binding.
The adenylyl cyclase enzyme contains 12 trans-membrane anchors (TMD1 and TMD2), with
a C1 and C2 domain, which needs to become “tethered” together to promote a functional
active site for conversion of ATP to cAMP + Pi. Activation by Gαs “wraps” the C2a domain
over the C1 domain and increases the enzymatic activity of AC. This “wrap” creates a
binding site for Gαi, which reverses the domain overlap and halts enzymatic activity and
subsequent cAMP production.

23
1.1.5. Multiple GPCR pathways
GPCRs like VPAC1/2 through their heterotrimeric G-proteins, can activate several
different pathways. Through adenylyl cyclase, the cAMP pathway can stimulate hormone
receptors (Filardo 2002; Reiter et al. 2001; Ji et al. 2002), activate protein kinase A (PKA)
(Thevelein and de Winde 1999), stimulate cyclic nucleotide-gated (CNG) ion channels (Rakhilin
et al. 2004) and nucleotide exchange factors directly activated by cAMP (EPAC) (Borland,
Smith, and Yarwood 2009), all of which illicit downstream signaling pathways of their own.
These pathways modulate cell adhesion and migration (Kinashi and Katagiri 2005), vascular
inflammation regulation (Schmidt et al. 2007), cytokine signaling regulation (Sands et al. 2006),
cell proliferation modulation (Stork and Schmitt 2002), cellular differentiation (Hoffman et al.
1994), and cellular hypo/hypertrophy (Ulucan et al. 2007). The variety, cellular concentrations,
intracellular targeting GPCRs through heterotrimeric G-proteins and the competition between
Gαs, Gαi and Gβγ binding, can all impact VIP’s ability to illicit cellular effects (Hillenbrand et al.
2015). Moreover, newer models of GPCR functional activity have demonstrated the importance
of extra/intracellular proteins on GPCR activation. This overturns the simple “on/off” theory,
adding additional complexity to these receptors (Maudsley et al. 2012).
1.1.6. Biological functions of VIP signaling
1.1.6.1. VIP receptor localization
Over the past half century, VIP research has demonstrated that this peptide plays
important biological roles in the brain, gastrointestinal tract, cardiovascular system and immune
system. Although VIP receptors are disseminated throughout the body, the expression patterns of
VPAC1 and VPAC2 receptors differ. VPAC1 is found in the liver, kidneys, spleen, breast tissue,

24
prostate, bladder, immune cells, lungs, gastrointestinal mucosa, thyroid, and lymphoid tissues
(locations represented in figure 8) (Reubi 2000).
In the central nervous system (CNS), VPAC1 is found the supraoptic nucleus, pyriform
cortex, the putamen, and the pineal gland. The VPAC2 receptor is found throughout smooth
muscle layers in blood vessels, gastrointestinal tract, lung, reproductive tract. It is also found in
the vasculature of the kidney, the colon, the thyroid, pancreas, and immune cells (Harmar et al.
2004). In the CNS, VPAC2 is found in the amygdala, the hypothalamus, the thalamus,
periventricular nucleus, cerebral cortex, and the suprachiasmatic nucleus (Vertongen et al. 1998)
(Usdin, Bonner, and Mezey 1994).
1.1.6.2. VIP signaling in the nervous system
Through VPAC2, VIP serves as a master regulator of the circadian rhythm, managing the
oscillation of our endogenous 24-hour circadian clock in the brain (Pauls et al. 2014) (Vosko et
al. 2015). This circadian regulation was discovered by Harmar et. al who generated a VPAC2
knockout mouse strain. They discovered that the disruption of this signaling pathway resulted in
disrupted wheel-running activity when compared to the WT strain. Clock genes, which act as
circadian pacemakers in the brain, were found to be weakly expressed in the VPAC2 receptor
knockout mice with their rhythmicity disrupted upon dark conditions (Harmar et al. 2002). VIP
signaling is also upstream of brain-derived neurotropic factor (BDNF), which is critical in
day/night synchronization and neural structural plasticity, the ability of the brain to strengthen
and create new synaptic connections (Girardet et al. 2013).
To determine the signaling pathway responsible for VIP’s neuroprotective effects against
neuro-excitotoxicity, it was demonstrated that VIP’s protection was lost in VPAC2 knockout
mice and/or when VPAC1 agonists were utilized (Rangon et al. 2006). Through the VPAC1

25
receptor, VIP stimulates neuroprotective proteins, which have been implicated in the treatment of
Alzheimer’s disease (Gozes 2001). VIP is also linked in neurotoxicity reduction, through its
recognition of neurotoxins, which are plaque forming substances including β-amyloid (Offen et
al. 2000). VIP’s ability to prevent neurodegeneration, suggests the potential therapeutic use of
VIP in neurogenerative disorders like multiple sclerosis and Parkinson’s disease (Delgado and
Ganea 2003; Korkmaz et al. 2010; Fernandez-Martin et al. 2006).
Figure 8. Locations of VIP receptors.
The distribution of VPAC1/2 receptors throughout the human body suggests the importance
of this peptide signaling in physiology. Human body picture is a public domain image
(Wikimedia commons).

26
1.1.6.3. The gastrointestinal tract and VIP
In the gastrointestinal tract, VIP functions as a promoter of intestinal barrier homeostasis
and a protector against inflammatory bowel diseases (IBD) by downregulating inflammatory
cytokine production (Wu, Conlin, et al. 2015). VIP promotes intestinal barrier homeostasis by its
ability to restore protein kinase C (PKC) pathways disrupted during infection (Morampudi et al.
2015). Mice deficient in VIP (VIP knockout; VIPKO), have demonstrated distorted colonic
crypts, defective epithelial proliferation and increased permeability (Wu, Conlin, et al. 2015). In
the mucosa-associated lymphoid tissues (MALT) of the gastrointestinal tract, VIP upregulates
cell junctions and decreases intestinal permeability, reducing pathogen uptake (Abad et al. 2003;
Jonsson, Norrgard, and Forsgren 2012). VIP’s regulation of smooth muscle contraction, is also
involved in gastric motility, peristalsis and sphincter function (Love, Go, and Szurszewski 1988;
Biancani et al. 1988). Moreover, VIP acts as an important metabolic regulator in both the brain
and gut and its removal in mice results in weight loss and fat storage deficits, supporting the
notion that VIP signaling is an essential regulator to metabolic homeostasis (Vu et al. 2015).
VIP signaling plays a key role in appetite control, fat mass accumulation, and metabolic
hormone regulation. VIPKO mice, when compared to their wild type (WT) littermates, showed
significantly lower body weight and lower body fat percentage. Interestingly, while they
consumed similar amounts of food as WT littermates, they consumed food throughout the day
and night, whereas the WT mice consumed their food during the night (mice are nocturnal
animals). In the VIPKO mice, researchers found increased leptin, “the full hormone” and
decreased ghrelin, “the hunger hormone” which works in opposition of leptin. These levels
remained unchanged after food consumption (Vu et al. 2015). Leptin acts as satiety sensor,
notifying your brain you have eaten enough, while ghrelin informs your body you need to eat

27
(Schussler et al. 2012). Research by Liu et al. analyzing gene pathways predisposing individuals
to obesity demonstrated that the VIP signaling pathway was the most important in the
development of higher BMI and body fat ass. This study genotyped ~500,000 single-nucleotide
polymorphisms in 1,000 US caucasian males analyzing over 960 different pathways to establish
VIP’s reputation (Liu et al. 2010).
1.1.6.4. Role of VIP in the cardiovascular system
The substantial cardiovascular effects of VIP suggest that this peptide is important in
regulation of arterial blood flow, cardiac contraction, and heart rate. Two years after its
discovery, VIP was found to relax vascular smooth musculature. As the Hagen-Poiseuille law
states, this reduces the pressure upon arterial walls, allowing for greater blood flow (Said and
Mutt 1972). Research in feline craniums demonstrated that VIP’s involvement in lowering blood
pressure was extended to neurogenic dilation, or a severe drop in blood pressure that reduces the
amount of blood returning to the heart (Bevan et al. 1986). During disrupted heart rhythm or
atrial fibrillation, oxygen scarcity and heart failure, VIP is released by intracardiac neurons
around the atrioventricular nodes to reduce blood pressure (Xi et al. 2013). In healthy subjects,
VIP infusions caused sustained vasodilation and decreased arterial pressure (Frase et al. 1987).
Exogenous released and endogenously injected VIP can significantly increase heart rate and has
a more potent effect on heart rate than norepinephrine (Henning and Sawmiller 2001). VIP
deficiency has also displayed lower body temperatures, due to weaker heart rates caused by
disrupted physiological circadian rhythmicity in the heart (Schroeder et al. 2011). It’s ability to
reduce blood pressure has resulted in its consideration as a drug for pulmonary hypertension
treatment (Petkov et al. 2003).

28
1.1.6.5. Immunoregulation by VIP
With respect to immunity, VIP acts as a chemoattractant (e.g. acts as a chemical
recruiter) of leukocytes and mediates anti-inflammatory effects (El-Shazly et al. 2013). In 1978,
it was discovered that VIP can be produced by immune cells (Cutz et al. 1978). A few years
later, mast cells were found to produce a truncated form of VIP (10-28), which acts as an
antagonist to VIP signaling by competing for VPAC1/2 binding sites (Wershil et al. 1993).
Examples of VIP’s anti-inflammatory role include its inhibition of proinflammatory cytokines
like TNFα, IL-6, and IL-12 to name a few. It also upregulates the production of IL-10, a potent
anti-inflammatory cytokine (Feldmann, Brennan, and Maini 1996). VIP supports the survival and
generation of TH2 cells (Delgado 2003).
During sepsis, VIP is significantly increased in plasma assisting in inflammation
reduction (Kuncova et al. 2011). VIP’s extensive presence throughout the gastrointestinal tract,
its involvement in inflammatory bowel diseases as well as the disruption of the intestinal
epithelium in VIP knockout mice, eludes to its importance in the alimentary canal. Changes in
receptor expression in resting versus activated lymphocytes, along with delayed eosinophilic
response during allergy in VPAC2 knockout mice, advocates for its significance as an immune
modulator (Dorsam et al. 2010; Vomhof-DeKrey and Dorsam 2008). To gain a better
understanding of VIP’s role in the digestive and immune systems, microbiome and eosinophil
differentiation experiments were conducted (discussed in chapter 2 and 3).

29
2. VIP/PHI DEFICIENCY CAUSES MOUSE GUT DYSBIOSIS
2.1. Our microbiota
Altogether, it is estimated that our planet is host to nearly 6 x 1030 bacterial cells. This far
exceeds the biomass of all other kingdoms (animalia, plantae, fungi and protists) on the
phylogenetic tree of life (Whitman, Coleman, and Wiebe 1998). The bustling communities of
symbiotic, commensal, and pathogenic microorganisms that call our body home are our
microbiota. This term is very general, and includes all microorganisms like, viruses, archaea,
fungi and bacteria existing in an environment. The microbiome on the other hand refers to the
genetic composition of this microbiota or all the genes of a microbial population. Bacteria, the
largest kingdom of prokaryotes inhabit all known environments on our planet. They are found in
even the most environments, such as deserts, rainforests, the frozen tundra and plains. They can
even survive in harshest known surroundings, like the town of Pripyat, Ukraine, which has been
saturated with high-levels of radiation since the level 7 nuclear energy accident (Chernobyl
disaster) in 1986 (Zavilgelsky et al. 1998). Research by Igor Shuryak has demonstrated
cooperation between these communities, where radiosensitive bacteria are protected from
ionizing radiation by neighboring radio-resistant ones (Shuryak et al. 2017). Bacteria have also
been found to dominate the harsh environments of deep-sea hydrothermal vents, once thought to
be void of life (Xu et al. 2014).
2.1.1. Discovery of E. coli and the coining of the microbiome
The discovery of Escherichia coli, by Theodor Escherich in the 1880’s, opened the door
to the isolation of numerous oral, digestive, and respiratory flora. It led to the realization that we
are not “alone”, and that our bodies play host to numerous other organisms. Since then,
researchers have speculated on the importance of our bacterial communities. To gain a better

30
understanding of the significance of our microbiota, the use of pathogen-free laboratory animals
was suggested in 1962 (Petter-Lane 1962). The utilization of germ-free animals has been critical
in illuminating the interplay between our bodies and the microorganisms that “call it home”.
Although the individual who first coined the term “microbiome” is uncertain, it was first
authored in a manuscript by John Whipps in 1988 (Whipps JM 1988).
2.1.1.1. Relative number of bacteria
Although many publications credit Dwayne Savage for determining the intestinal
bacterial load in late 1972, it was T. D. Luckey from the University of Missouri, Columbia,
whom postulated that the microbial population of our bodies, our microbiota, outnumber our
cells 10 to 1 (Savage 1977; Luckey 1972). Luckey estimated there were 37.2 x 10¹³ bacterial
cells with an estimated 3.72 x 10¹³ human cells (Bianconi et al. 2013). This number (37.2 x 10¹³)
was estimated based upon the total number of microbes/gram found in the intestinal tract and the
total volume capacity of the alimentary tract estimated to be 1 L. Nearly four and a half decades
later, T. D. Luckey’s hypothesis was challenged and reanalysis by Ron Sender who calculated
that the ratio was closer to 1 to 1. This was based upon the revised total volume capacity of the
intestinal tract to be around 0.4 mL based on magnetic resonance imaging (MRI) scans. Using
this reduced capacity and the microorganism density throughout the alimentary canal, Sender
approximated that our microbial populations amounted to nearly 3.7 x 10¹³ cells, the same
estimated number of cells that make up our own body (Sender, Fuchs, and Milo 2016).
In terms of genomics, the 2.91 billion base pair human genome was first published in
2001 (Venter et al. 2001; International Human Genome Sequencing 2001) and later
revised/finalized in 2003. Prior to the revealing of its sequence, it was estimated that the human
genome was composed of nearly 100,000 protein encoding genes. Surprisingly, the human

31
genome project demonstrated that there were only a scant 20,500 protein-coding genes (Clamp et
al. 2007). In comparison, metagenomic analysis of the human gut microbiota has characterized
3.3 million non-redundant genes; a gene set around 150 times larger than the human genome.
Analysis found the human microbiome to contain nearly 8 million unique protein coding genes
or 390 times more than the human genome (Qin et al. 2010). What consequence could this
immense genetic content and protein producing potential have on the health and disease of the
host?
The 6.5-meter length of the human gastrointestinal tract hosts the highest presence of
microorganisms and therefore the “lion’s share” of this extended bacterial genome. The
microbial biomass in the human small intestines reaches cellular densities between 104 and 105
per milliliter of chime, while the large intestines plays host to considerably higher amounts,
estimated between 108 and 1011 cells per milliliter of fecal matter (Wang et al. 2005; Wang et al.
2003). Visualized in figure 9, the microbial biomass changes throughout the alimentary canal,
with the highest concentration present in the large intestine. This is primarily due to the drastic
changes in pH that occur throughout the tract and resources availability (Walter and Ley 2011).
The desire to determine which microbes are present and how they may impact host physiology
has opened up the field of microbiome sequencing. Its history is discussed in the next section.

32
Figure 9. Diversity of biomass through the human gastrointestinal tract.
Differences in bacterial load between different parts of the alimentary canal as pH changes.
Figure recreated by author (GI tract is a public domain image (Wikimedia commons)) and
based on Jens Walter, Annual Review of Microbiology (Walter and Ley 2011).

33
2.1.1.2. Sequencing and analysis history of the microbiome
Our ability to determine the nucleotide sequence of a DNA fragment has increased in
accuracy and speed exponentially over the past century, since Ray Wu first published a method
for DNA sequencing in 1972 (Wu 1972). This string of nucleotides, the DNA molecules, were
first identified by Friedrich Miescher in 1871 (Miescher-Rüsch 1871). Nineteen years after the
accurate deduction of the DNA double helix by James Watson, Francis Crick and Rosalind
Franklin (Watson and Crick 1953), it was Ray Wu at Cornell who developed the first method for
DNA sequencing (Wu 1972). Double Nobel laureate and sequencing pioneer, Frederick Sanger
added his primer-extension technique to create more rapid DNA sequencing techniques (Sanger,
Nicklen, and Coulson 1977). These techniques will be discussed later in this chapter.
Sanger was the first to publish an entire genome of an organism; The bacteriophage phi
X174, which contained approximately 5,375 nucleotides (Sanger et al. 1977). Sanger’s chain-
termination method, better known as Sanger sequencing, was the method of choice for DNA
sequencing until the mid-2000s. Advancements to the Sanger sequencing technique, including
faster reading techniques, were responsible for the completion of the first complete human
genome (Venter et al. 2001; International Human Genome Sequencing 2001). Sequence
commercialization and advancements in computing have resulted in the creation of numerous
industrial high-throughput methods, such as Illumina sequencing (used in this study), 454-
Pyrosequencing, Ion Torrent sequencing and Single-molecule real time sequencing. Detailed
description of these methods will be discussed later in this chapter.

34
2.1.2. Background
2.1.2.1. The microbiota
Our understanding of the microbial communities in the environment has surged over the
past few decades with the development of high throughput DNA sequencing technologies,
cultivating with next generation sequencing technologies. This is primarily due to the speed and
accuracy at which these microbes can now be identified as well as computing advances
(bioinformatics) in analysis of results. Most microorganisms are difficult to culture and thus have
historically been difficult to identify. Culturing microbes from a variety of environments can also
result in favorable environments for some and unfavorable for others, thus biasing the results and
changing the total compositional profile. Utilization of gel electrophoresis technologies by
Sanger sequencing were slow compared to modern technologies and required immense
manpower for sequencing. This was because each nucleotide was determined by each individual
lane in the gel, as demonstrated later in this chapter (2.1.5 Sequencing Techniques). Since then,
the generation of a more robust Taq polymerase through DNA recombinant technologies, the
ability to fluorescently tag nucleotides, improvements in fluorophore detection and the
prodigious advancements in computer science have rendered these older techniques obsolete.
The identification of microbes using culture-independent DNA sequencing acts as a magnifying
glass, allowing us to discover and catalog the world of microbes.

35
Figure 10. Assortment of microbial populations throughout the human body.
The biodiversity of bacterial communities throughout the human habitat is extreme as shown
by pie graphs for different regions throughout the body. Visualization of the varied
populations, demonstrates that our bodies may be better defined as ecosystems. Figure
obtained from Elizabeth Costello, Science 2009 (Costello et al. 2009).

36
Our microbiota is comprised of a wide group of microorganisms, ranging from bacteria
and archaea to fungi and viruses. In total they make up around 3% of our body mass, resulting in
nearly two and a half kilograms (5.5 lbs.) in an eighty-kilogram (176.4 lbs.) adult. The variety in
bacterial composition as well as their colonization locations are demonstrated in figure 10.
Research has shown the importance of the microbial presence with the formation of germ-free
mice. It has been reported that the microbiota in our gut is responsible for metabolism of non-
digestible carbohydrates to yield short chain fatty acids (SCFA) as a waste product of
fermentation, which act as an energy source for intestinal epithelial cells (Layden et al. 2013).
Essential amino acids, vitamin K, B vitamins and folic acid are synthesized by the intestinal
microbial population and are absorbed by the host (LeBlanc et al. 2013). The regulation of the
endocrine network by the microbiota through manipulation of bile acids, gastrointestinal
hormones, lipid metabolites and neurotransmitters has also been demonstrated (Ridlon et al.
2014; Kasubuchi et al. 2015).
2.1.2.2. Microbial co-evolution
The co-existence of microorganisms with animals has been found throughout the animal
kingdom. Little was understood about our inventory of microbes just a decade ago. The co-
evolution of the host and their microbial counterparts is almost impossible to establish, due to
lack of coprolites, or fossilized feces. One exception to this was in 2008 when Raúl Tito
examined two 1,300-year-old paleofecal samples from cave deposits near Durango, Mexico.
Conclusions from their next generation sequencing study showed the prominence of both
Bacteroidetes and Firmicutes phyla (Tito et al. 2008), similar to predominant phyla found in the
current human gut (Qin et al. 2010).
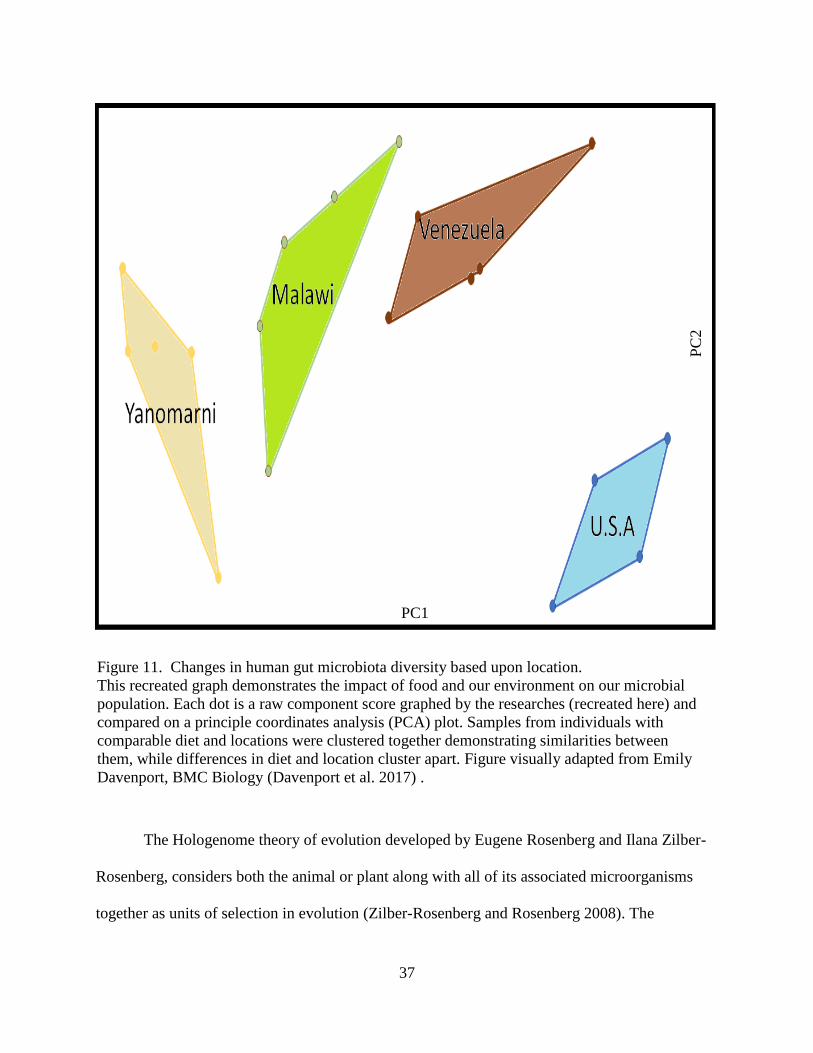
37
The Hologenome theory of evolution developed by Eugene Rosenberg and Ilana Zilber-
Rosenberg, considers both the animal or plant along with all of its associated microorganisms
together as units of selection in evolution (Zilber-Rosenberg and Rosenberg 2008). The
Figure 11. Changes in human gut microbiota diversity based upon location.
This recreated graph demonstrates the impact of food and our environment on our microbial
population. Each dot is a raw component score graphed by the researches (recreated here) and
compared on a principle coordinates analysis (PCA) plot. Samples from individuals with
comparable diet and locations were clustered together demonstrating similarities between
them, while differences in diet and location cluster apart. Figure visually adapted from Emily
Davenport, BMC Biology (Davenport et al. 2017) .
PC1
PC
2

38
importance of bacterial populations in Drosophila melanogaster demonstrated this concept by
showing that manipulations of fruit fly intestinal flora resulted in altered mating patterns and a
change in offspring production. (Sharon et al. 2011). Furthermore, changes in gut bacteria also
modulated body mass of female, but not male fly offspring, suggesting a trans-generational
effect of parental gut-microbiota (Morimoto, Simpson, and Ponton 2017).
2.1.2.3. The Homo sapiens ecosystem
You are your body’s “wildlife” manager. Our bodies represent a biosphere that possesses
a wide variety of ecosystems, similar to deserts and rainforests, each colonized by different
animals and planets. These microbes have evolved to replicate and flourish in their particular
microenvironment on our body. Just like these larger ecosystems on the Earth, various human
body parts form microbial communities that coexist with us. These ecosystems require
organisms to be able to obtain resources and survive challenges generated by different variables
within a particular including temperature, pH, water availability, oxygen richness, and resource
accessibility. These stressors impact the presence of the microorganisms that reside there,
altering their composition, genetic materials, metabolites and consequently their impact on our
bodies (Jordan et al. 2015). The selectivity of the human GI tract in comparison to other
ecosystems can be seen in figure 13, where two bacterial phyla, Bacteroidetes and Firmicutes,
primarily dominate the vertebrate gut in comparison to soil samples, where more than 70
different phyla can be present.

39
Figure 12. Gut microbiota diversity amongst the biological kingdom Animalia.
This figure demonstrates that when compared to other residents of the animal kingdom, the
human intestines are very selective towards microbial populations whereas variations
between human populations seems indiscernible. Raw component scores from each
population are represented as colored dots on a PCA plot with the legend equating colors to
animals. Figure adapted from Emily Davenport, BMC Biology (Davenport et al. 2017).
PC1
PC
2

40
2.1.2.4. Diversity of the gut microbiome
Within the human gut resides an estimated 160 distinct species of bacteria (Qin et al.
2010). The majority of these belong to the Bacteroidetes, Firmicutes, Actinobacteria, and
Proteobacteria phyla. Amongst human populations, the percentage of these phyla differs based
upon location, diet and environment (Moodley et al. 2009). For example, comparisons between
the microbial populations of humans residing in industrialized regions, such as the United States,
versus non-industrialized areas, such as the amazon, (Figure 11) demonstrates the changes in
diversity of these microorganisms. Analysis by 16S rRNA sequencing, has shown that the
intestinal microbiota of humans in first world countries, contains lower diversity levels than their
third world cousins (Davenport et al. 2017). Diversity meaning the difference in abundance
between the different types of microorganisms that reside within the intestinal tract (analyzed
through fecal matter) of these populations.
Detailed analysis of diversity changes in gut microbiota moving to other taxonomic levels
was accumulated by Davenport et al.. The graphed results (Figure 12) illustrate the changes in
microbiota during evolution. As the microbial compositions of more evolved organisms are
analyzed, they cluster closer together, for example in birds (lower on the evolutionary tree) the
16S reads are dispersed when compared to hoofed mammals (higher on the evolutionary tree)
whose reads are clustered closer together. This suggests that as more complex species evolve,
selective pressure is placed on the microbial community that reside on them and their bacterial
diversity is reduced. Although figure 11 seems to show big differences between human
populations, analysis against mammals, fish, birds and reptiles, minimizes these distances when
compared against others in the animal kingdom (Figure 12) (Davenport et al. 2017).

41
Figure 13. Selectivity of the human gut in comparison to other ecosystems.
Each color in this bar graph represents the percent of a particular phylum present within a
sample which is indicated on the x-axis. This demonstrates the selectivity of the vertebrate
gut and its two primary phyla, Bacteroidetes (red) and Firmicutes (blue), when compared to
other environments such as soil and salt water. Figure from ('Structure, function and diversity
of the healthy human microbiome' 2012).

42
When analyzed, the microbiomes of humans consuming a western diet (60 kcal% fat) vs
a non-western diet (10 kcal% fat), were considerably different. The western diet microbiomes
were composed of higher percentages of Bacteroides in comparison to non-western
microbiomes, that consisted of higher percentages of Firmicutes and Proteobacteria (Rampelli et
al. 2015; Schnorr et al. 2014; Clemente et al. 2015). The western populations also consisted of 15
to 30% fewer microbial species than non-western populations. This has led to the hypothesis that
industrialization and westernization are responsible for the reduction of intestinal diversity (or
the gradual disappearance in species from the human gut over time). It is theorized this is due to
the focus on sanitation and drastic changes in our diet, such as increased consumption of animal
products (Segata 2015). The western diets are also rich in sugars and fats, and poor in fiber;
which is the opposite of non-western diets. This along with the bigger focus on hygiene and
greater use of antibiotics in western populations may be responsible for decreased diversity
(Blaser and Falkow 2009).
2.1.2.5. Causes of gut microbiota change
Methods of fetal delivery, such as cesarean section vs natural delivery can inoculate a
newborn with different bacteria. The natural delivery method results in introduction from the
mother’s fecal and vaginal microbes, whereas a cesarean birth (C-section) results in the
introduction of skin microbes (Gueimonde et al. 2006). In addition to the mother’s skin, C-
section infants are exposed bacteria present in the operating room (Shin et al. 2015). Babies are
born with a small placental microbiome present and an intestinal tract that becomes colonized
with different microbial populations over time (Wassenaar and Panigrahi 2014). These bacterial
populations constitute the newborns GI tract immediately after birth. For the first three months of
life, C-section infants, in contrast to natural born babies, possess a lower diversity of

43
Actinobacteria, Bacteroidetes and Bifidobacterium with a concomitant increase in variety of
Firmicutes in their feces (Rutayisire et al. 2016). Chu et al. have demonstrated that the microbial
community structure is only impacted by birthing method during the first 6 weeks of life, after
which it is primarily driven by differences in food intake (Chu et al. 2017). Other studies have
suggested the change can last 6 to 12 months (Rutayisire et al. 2016) or even up to 2 years
(Jakobsson et al. 2014). This lack of consistency can be linked to difficulties in controlling infant
environment and diet.
The differences in the type of milk fed to the infant can also impact their gut microbiota.
The specific compounds present in human milk are thought to be involved in the establishment
and development of the early gut bacteria. Commensal bacterial populations seem to benefit
from the intake of breast milk in comparison to formula (Holscher et al. 2012). The addition of
prebiotic oligosaccharides to formula has shown to bring the gastrointestinal microbiota closer to
that of breast fed infants. These prebiotics also decrease fecal pH and increase short chain fatty
acids (SCFA) while reducing diarrhea and bringing fecal consistency to a similar level to breast
fed infants (Vandenplas, Zakharova, and Dmitrieva 2015). By eleven months, the microbiota of
the infant becomes distinct from their mother (Vaishampayan et al. 2010). After the first year,
the gastrointestinal microbiota starts to resemble that of an adult human (Palmer et al. 2007).
From this age (> 1 year), the types of food eaten and the environment in which the child resides,
play the largest roles in shaping the microbiota composition. As visualized in figure 14, the
human microbial composition changes with age and influences human health. A study in Japan
analyzed the microbiomes of subjects ranging from newborns to centenarians and demonstrated
that the gut microbiota changes throughout our lifespan (Odamaki et al. 2016). Below is a list of

44
the modifying factors that alter gut microbiota composition throughout life. List generated based
on data from Abubucker et al. (Abubucker et al. 2012).
• Infant (up to 2–3 years)
o Vaginal vs caesarian delivery
o Gestational age
o Infant hospitalization
o Breast vs formula fed
o Age at solid food introduction
o Malnutrition
o Antibiotic treatments
• Adult
o Diet
o Hormonal cycles
o Travel
o Therapies
o Illness
• Elderly (> 70 years)
o Lifestyle changes
o Nutritional changes
o Increased susceptibility to infections and inflammatory diseases
o Use of more medications

45
2.1.3. Implications in disease
The composition of microorganisms that inhabit the human body can vary. Their vast
metagenomic capability have resulted in the classification of the microbiota as an invisible
Figure 14. The change in our intestinal microbiota composition through different
stages of life.
This figure complies changes in the main bacterial phyla from different studies and visually
demonstrates the key established factors that determine how they could change over a
lifetime. The blue arrow demonstrates human age with above pie charts representing bacterial
phyla. Figure recreated with data and pie charts from (Ottman, Smidt, and Belzer 2012).

46
endocrine organ. Comparisons between the microbiota and other endocrine organs are discussed
later in this chapter. An imbalance in this organ/community, through high-fat, high-sugar
western diets or the excessive use of antibiotics can lead to changes in its composition, as well as
changes to host endocrine secretions. For example, Aquilera et al. demonstrated that the use of
antibiotics and stress (water avoidance) resulted in increased bacteria with the ability to adhere to
the intestinal mucosa (Aguilera, Vergara, and Martinez 2013).
Barouei et al. showed that a high fat diet altered liver hormones, reduced short chain fatty
acids (SCFA) in the intestines and urine metabolites along with the intestinal microbiota
(Barouei et al. 2017). The impact of microbial secretions and their impact on numerous body
systems has led to the association of the microbiota with a number of diseases, such as metabolic
syndromes (obesity), diabetes, rheumatoid arthritis, Crohn’s disease, ulcerative colitis,
cardiovascular disease, autoimmune diseases and neurological disorders such as autism
(Tremaroli and Backhed 2012; Tilg and Moschen 2014; Singh, Qin, and Reid 2015; Petra et al.
2015).
2.1.3.1. Obesity
Obesity is an energy disorder, where net excess intake of calories compared to energy
expenditure causes increased fat deposition and body weight. Studies of the microbiome of obese
and normal mice have demonstrated differences in the composition and function. Obese mice
particularly exhibited a reduction in the total percentage of Bacteroidetes and an increase in the
Firmicutes phyla (Ley et al. 2005). The change of this ratio has also been demonstrated in human
populations. Studies of obese patients revealed the same increase in Firmicutes and decrease in
Bacteroidetes (Murphy, Velazquez, and Herbert 2015). Interestingly, once these obese patients

47
were placed on a calorie restrictive diet, this F:B relationship reverted to ones found in leaner
individuals (Ley et al. 2006).
Using C57BL/6J (B6) WT and Rag1-/- mice, Fredrik Bäckhed, demonstrated that the
obesity phenotype was transmissible through the microbiota and not dependent on lymphocytes
(Rag1-/-). In their first experiment (figure 15a), both wild type and germ-free mice were fed a
high-fat/high-sugar western diet, but the obesity phenotype was only observed in the wild type
mice. The microbiota of the wild type mouse was altered (↑ F/B ratio) along with weight gain.
This result suggests that the lack of a microbial community in the germ-free mice protects the
mouse from died induced obesity. In their second experiment (figure 15b), three groups of germ-
free and three groups of wild type mice were utilized. The wild type mice were split into normal,
obese and underweight categories. Microbiota from each of these three wild type categories were
transplanted into each of the three germ-free groups. Remarkably, the previously-germ-free
recipients group adopted the phenotypes of their donors, resulting in a normal, obese and
underweight phenotype (Bäckhed et al. 2004). Similar findings have been discovered with fecal
microbiota transfers from obese human donors to germ-free mouse. The mice in these studies
have also resulted in donor phenotype adoption. This observation has been contested by other
researchers who failed to find phyla level differences based upon obesity (Bell 2015; Rabot et al.
2016). Recent advancements on this ratio have focused on the ratio of gram negative to gram
positive bacteria rather than the ratio of these two phyla (Kasselman et al. 2018).

48
Figure 15. Importance of microbiota function in weight control.
A. The utilization of a high fat/high sugar diet in conventional versus germ free mice results
in the adoption of an obese phenotype in the conventional wild type mice whereas the germ-
free mice remain resistant to diet induced obesity (DIO). B. Transplantation of the intestinal
microbiota from wild type, obese, and underweight donors into germ-free mice results in the
adoption of the donor phenotype in the fecal recipient. Figure recreated and based on data
from (Clarke et al. 2014).
A
A
B
B

49
Numerous individual bacteria have been implicated in obesity. One study in Shanghai,
China, sequenced the microbiome of a morbidly obese volunteer, and found 35% of his gut
bacteria to be Enterobacter. This opportunistic pathogen dropped to undetectable levels after the
individual lost 51.4 kg (113.3 lbs.) of his total 174.8 kg (385.37 lbs.) weight, by dieting for 23
weeks. Upon isolation and introduction of this endotoxin producing pathogen into germ-free
mice on a high-fat diet, researchers found the mice to become obese and insulin resistant when
compared to mice not inoculated with the Enterobacter. This same phenotype was not observed
with normal chow, suggesting a dramatic increase in Enterobacter through high fat diet
consumption and may contribute to the obesity phenotype in humans (Fei and Zhao 2013). This
relationship between obesity and the microbiota may hold potential therapeutic implications.
2.1.3.2. Inflammatory bowel diseases
Research into inflammatory bowel diseases (IBD) has suggested a link between microbial
composition and the severity of these conditions (Becker, Neurath, and Wirtz 2015; Sheehan,
Moran, and Shanahan 2015). An estimated 3 million adults in the United States are diagnosed
with IBD annually (Dahlhamer et al. 2016). IBD is an umbrella term used to describe chronic,
idiopathic, inflammatory gastrointestinal (GI) disorders. Ulcerative colitis and Crohn’s disease,
are collectively defined as inflammatory bowel diseases. These two disorders have distinct
pathogenic and inflammatory profiles (figure 16). Ulcerative colitis is characterized by
continuous rectal bleeding, diarrhea, abdominal pain, and mucosal inflammation in the rectum
that spreads proximally up the large intestine. Crohn’s disease may affect any part of the
gastrointestinal tract and patients suffer from weight loss, diarrhea and pain with increased risk
of cancer.

50
The gastrointestinal tract and the microbiota contained within are responsible for food
digestion, nutrient extraction, absorption and waste expulsion. Disruption of these essential
processes can be extremely harmful to the body. Researchers have confirmed that IBD patients
suffer from numerous vitamin deficiencies and have lower levels of minerals, such as zinc, iron,
and magnesium proposed to be caused by a reduction in intestinal absorption (Valberg et al.
1986; Dotevall and G Kock 1968; Lomer et al. 2004). A characteristic of IBD is damage to the
intestinal mucosal epithelium. A study conducted by Sarkis K. Mazmanian showed the protective
capacity of the human microbiota against IBD inflammatory parameters and epithelial mucosal
tight junctions. Mazmanian reported that Bacteroides fragilis protected mice from colitis induced
Crohn’s Disease Ulcerative Colitis
Figure 16. Disease state differences between Crohn’s disease and ulcerative
Crohn’s Disease Ulcerative Colitis
Figure 16. Disease state differences between Crohn’s disease and ulcerative colitis.
This figure demonstrates inflammation patterns (red color) between Ulcerative colitis and
Crohn’s disease. Ulcerative colitis only affects the large intestine and moves proximally up the
colon while Crohn’s disease can affect the entire gastrointestinal tract, with a discontinuous
pattern of inflammation that can develop anywhere throughout the alimentary canal, from the
mouth all the way to the anus. Image adapted from Wikimedia commons, under the creative
commons license.

51
by an opportunistic pathogen, Helicobacter hepaticus, through the production of polysaccharide
A (PSA). This was done by comparing a mutant strain of Bacteroides fragilis that did not
possess the ability to produce PSA against the wild type strain. Previous studies that analyzed the
immune response during IBD have demonstrated that IL-17 is a key mediator of colitis (Elson et
al. 2007). When Mazmanian et al. analyzed the two groups, they observed that mice without
PSA expressed significantly higher amounts of IL-17 in comparison to their PSA counterparts.
They concluded that PSA administration was required to suppress IL-17 inflammatory response
in intestinal immune cells. In contrast, mice housing B. fragilis, but not expressing PSA,
experienced H. hepaticus mediated IBD. PSA was also found to increase IL-10 production, a
potent anti-inflammatory cytokine (Mazmanian, Round, and Kasper 2008). PSA mediates
immune anti-inflammatory response through IL-10 secretion induced by plasmacytoid dendritic
cell which when exposed to PSA stimulate IL-10 secretion by CD4+ T-cells (Dasgupta et al.
2014). This along with other studies speak to the importance of a healthy microbiota and to the
connection between microbial dysbiosis and IBD.
2.1.3.3. Integumentary system ailments
The skin, hair and nails all make up the integumentary system, which is also colonized by
a heterogeneous population of bacteria. Visualized in figure 17, the variety of microbes that
inhabit the various regions of the integumentary system demonstrates the various ecosystems
present on the human body. Colonization of these ecosystems is driven by the ecology of the
specific environment, which depends primarily on exogenous environmental factors, like
temperature, sun exposure, humidity, food availability, pH and region of the host (Grice and
Segre 2011). Skin diseases like psoriasis, acne and eczema all seem to be directly related to
changes in microbial composition (Kong 2011). The relapsing pruritic inflammatory skin

52
disorder known as eczema has been on the rize over the past 30 years. Ninety percent of eczema
patients show an increase in the presence of Staphylococcus aureus on their skin, a bacteria not
seen on control patients. This bloom in S. aureus, decreases microbial diversity on the skin
possibly driving the pathobiology of eczema (Kong et al. 2012). S. aureus blooms were limited
by the presense of Staphylococcus epidermidis, which inhibits S. aureus growth (Iwase et al.
2010). These findings demonstrate a possible novel approach where microbes could be used to
combat worrisome pathogens instead of current antibiotic therapeutic treatments.

53
Figure 17. Distribution of bacterial populations on the skin.
This figure demonstrates the drastic changes in bacterial populations throughout the
integumentary system. Colors on the pie chart are representative of families of bacteria
and correspond with skin sites all over the body. The sites seem to group in
correspondence with the presence of oils and moisture. Figure from Elizabeth Grice,
Nature (Grice and Segre 2011)

54
2.1.3.4. Immune system disorders
According to the National Institutes of Health, the immune system is a network of cells,
tissues, and organs that work together to protect the body from infecticious diseases and self
diseases like cancers (Candeias and Gaipl 2016). Research into autoimmune diseases, has
demonstrated a connection between host microbiota and immune response/activation (Thaiss et
al. 2016). For example, polysccharide A protects against IBD (discussed in 2.1.3.2.
Inflammatory Bowel Diseases) and is secreted by B. fragilis. Proteolytically processed peptides
from PSA are presented to CD4 T-cells on MHC class II complexes by dendritic cells resulting
in cytokine production which stimulates T regulatory (Treg) cell development and increases non-
inflammatory cytokines like IL-10. Utilization of a PSA mutant was unable to restore normal
immunological function. Germ free mice (not possessing any microbiota) have reported defects
in splenic size, cell number, and development. The addition of wild type B. fragilis seems to
restore the mouse spleens to normality, while germ-free mice colonized with B. fragilis with
mutated PSA, were unable to commence splenic organogensis, demonstrating the direct link
between PSA from bacteria influencing immune cell numbers (Mazmanian et al. 2005).
This relationship is seen in a number of autoimmune disorders such as diabetes mellitus
type 1. This debilitating disease is caused by the autoimmune destruction of insulin producing β
cells in the pancreas (Xie, Chang, and Zhou 2014). The rise of this devastating autoimmune
disorder in the developed world has caused many scientists to purpose a connection to
environment, diet and the host microbiota (Patterson et al. 2001). Non-obese diabetic (NOD)
mice can be utilized to better understand type 1 diabetes, due to their spontaneous development
of the disease. The rates of these incidents can be affected by alterations to their microbiota
(Sadelain et al. 1990). Amazingly, NOD mice deficient in myeloid differentiation primary

55
response 88 (MyD88) protein are resistant to type 1 diabetes while NOD MyD88WT are not,
suggesting an innate immune mechanism as MyD88 is essential for toll like receptor signaling
during PAMP recognition (Wen et al. 2008).
The pathway for the MyD88 intracellular signaling molecule is initiated from multiple
toll like receptors (except TLR4 and TLR3) to activate nuclear factor-κB (NF-κB). A study
conducted by Kubinak et al. demonstrated that signaling through the T-cell MyD88 pathway was
essential for the development of IgA secreting B-cells in lymphoid germinal centers. This was
tested by comparing wild type to T-cell specific MyD88 knockout (T-MyD88KO) mice. The T-
MyD88KO mice had reduced numbers of IgA secreting B-cells, suggesting the importance of T-
cell specific MyD88 signaling for germinal center activation of these B-cells. Analysis into the
impacts on the microbial populations by the research team also showed community
dissimilarities and changes in the mucosal bacterial populations (Kubinak et al. 2015). Other
studies have also demonstarted the importance of MYD88 signaling in immune homeostates,
protection from infection (Brandl et al. 2007) and intestinal epithelial repair (Pull et al. 2005).
Another major immune disorder linked with the microbiota is Rheumatoid Arthritis (RA).
This disease is characterized by chronic pain and inflammation in the joints. Like type 1
diabetes, RA levels in the developed world are also increasing. Human microbiota dysbiosis
linked to the widespread use of antibiotics has been considered a culprit in these actions
(Patterson et al. 2001). Patients suffering from RA present increased Treg cell numbers in
circulation and increased IL-17 levels in the joints (Hot and Miossec 2011). The cause of this
increase is currently unkown. Jose Scher has hypothesized that gut disbyosis caused by
environmental or genetic factors could allow for the domination of harmful microorganisms.
Expansion of a proinflammatory response along with the activation of other immune components

56
(T cells, B cells and macrophages) could migrate to synovial tissue within the joints and lead to
arthritis (Scher and Abramson 2011).
2.1.3.5. Nervous system disorders
Variations in the intestinal microbiota have been linked to several nervous system
disorders like autism, multiple sclerosis (MS) and anxiety. These are hypothesized due to
molecular interactions between the central nervous system and the intestines, dubbed the
microbiota-gut-brain axis. This multifaceted axis of communication refers to the cross-talk of
metabolites between the microbiota and the brain (Burokas et al. 2015).Thus, the microbiota-gut-
brain axis is much more influential than was previously realized.
According to the National Autism Association, “Autism is a bio-neurological
developmental disability, which impacts the normal development of the brain in the areas of
social interaction, communication skills, and cognitive function.” The rise in incidence of this
disorder has caused scientists to purpose numerous environmental factors that could play a role
such as antibiotics, drugs, infections and the gut microbiota (Dietert, Dietert, and Dewitt 2011).
Common symptoms connected with autism include diarrhea, vomiting, constipation and acid
reflux. Comparative taxonomic analysis of the intestinal microbiota by 16S rRNA sequencing
between control children and ones suffering from autism, showed the genus Sutterella
represented 1 to 7% of the autistic children’s microbiomes, and was not detected in the control
children (Benach, Li, and McGovern 2012). Other studies comparing the two microbiome groups
have demonstrated greater amounts of Clostridium species in autistic children in comparison to
controls (Finegold et al. 2002). The use of probiotics (ingested microorganisms) along with
targeted short term antibiotics has showed temporary improvements in autism intestinal
symptoms, which are remarkably similar to those seen in IBD patients (Critchfield et al. 2011).

57
Multiple sclerosis (MS) is characterized by damage to myelin sheaths of neurons,
demyelination, in the brain and spinal cord (Makris, Piperopoulos, and Karmaniolou 2014). This
degenerative disease occurs over time and results in a gradual lack of muscle control (Bhargava
and Mowry 2014). Currently, the best animal model for MS is the induction of myelin proteins
emulsified in an adjuvant to induce an immune reaction. This induced animal model is called
experimental autoimmune encephalomyelitis (EAE). The connection between MS and
environmental factors such as gut commensal bacteria has been established. Research by Ochoa-
Repáraz, demonstrated the reduction of gut bacteria impaired EAE development. They used
antibiotic treatment to modify the microbial populations and protect against the onset of MS
(Ochoa-Reparaz et al. 2009).
A study conducted by Miyake et al. compared patients suffering from MS to those who
were not diagnosed with the disease. While conducting 16S sequences Miyake found changes in
MS patients with a depletion in the Clostridia and Bacteroidetes lineages (Miyake et al. 2015).
Studies analyzing early onset pediatric MS by Tremlett et al. demonstrated changes in their
microbiota composition. Metagenomic analysis by Phylogenetic Investigation of Communities
by Reconstruction of Unobserved States (PICRUSt) (discussed later in this chapter), predicted an
increase in neurodegenerative pathways (Tremlett et al. 2016). The purposed use of targeted
antibiotics or microbiota transfers may provide novel therapies for patients struggling with these
neurological diseases (Ren et al. 2017).
2.1.4. Neuropeptides and the microbiota
2.1.4.1. The microbiota-gut-brain axis
The coevolved mutualistic relationship between the host and the gut microbiota has
brought about multiple communicational pathways between the microbiota, gastrointestinal

58
track, and the brain. The multiple signaling pathways between the gut microbiota and the brain
have resulted in their denotation as the microbiota-gut-brain axis (Sampson and Mazmanian
2015). Imbalances in this bidirectional communicational conduit have been implicated in
numerous diseases such as IBD, MS, or immune system disorders. An example of this includes
influence over gastrointestinal hormone production based on the presence of certain probiotics
(Dockray 2014). These changes in hormones like ghrelin, the hunger hormone, can allow the
intestinal microbiota to regulate appetite (Darzi, Frost, and Robertson 2011).
2.1.4.2. Endocrine classification of the microbiome
The biochemical capacity of the microbiota is colossal. The microorganisms of the
human gut perform several essential functions though out our body. Due to microbiota’s broad
influence and its methods of communication with host tissues, researchers have begun to classify
our microbiota as an additional endocrine organ (Clarke et al. 2014). Messages from this “organ”
can be carried through the vagus nerve, afferent neurons, cytokines and/or microbial factors
secreted into the blood stream (Collins, Surette, and Bercik 2012). The composition of the
microbiome can even impact mammalian emotion. Research by Neufeld et al. has demonstrated
that germ free mice when compared to specific pathogen-free mice expresses different behaviors.
These were tested using mazes and locomotor activity (anxiety measurement). In the maze tests,
germ free mice seemed to be more active over time in contrast to specific germ free mice. It was
also determined using motor activity tests that the germ free mice acted in a less anxious manner
(Neufeld et al. 2011). This suggests that the microbial population may assist in our emotional
and mental development.

59
Figure 18. The endocrine organs of the human body.
Endocrine glands across the body produce regulatory metabolic humoral agents. The
biochemical capacity of the gut microbiota surpasses all of these organs, justifying its
consideration as an endocrine organ. Figure from (Clarke et al. 2014).
60
2.1.4.3. Neurotransmitters and the microbiome
Neuropeptides, such as VIP, are important mediators in the microbiota-gut-brain axis.
Several neuropeptides function as gut hormones as well as neuronal signal transducers. Our
microbiota has the capacity to secrete a number of neurotransmitters, as displayed in table 3.
Microbiota derived neuronal factors like dopamine have been suggested to play a role in the rate
of nutrient absorption in the intestinal lumen (Asano et al. 2012). Research from Aarts et. al.
demonstrates that the microbial composition of adults diagnosed with attention deficit
hyperactivity disorder (ADHD) included an increase in the Bifidobacterium genus. Although the
shift in bacterial structure was not drastic, predictive 16S metagenomic analysis using the
bioinformatics software, Phylogenetic Investigation of Communities by Reconstruction of
Unobserved States (PICRUSt), demonstrated that the bacterial gene responsible for the creation
of arogenate dehydratase, was significantly enhanced in ADHD cases. Arogenate dehydratase is
a precursor for dopamine and may decrease the neural response to reward expectation. This
decrease in reward expectation is considered a hallmark of ADHD (Aarts et al. 2017).
The activation of the histamine receptor 2 (H2R) is also associated with the microbiota.
Like VIP’s receptors, the activation of H2R (a GPCR), stimulates adenylate cyclase via Gαs and
results in anti-inflammatory effects (Seifert et al. 2013). A number of bacterium, including L.
saerimneri strain 30a and L. rhamnosus have been demonstrated to have the capacity to activate
the H2R receptor. When the THP-1 human white blood cell line was cultured with L saerimneri,
the response to LPS was significantly reduced when compared to LPS alone (with L saerimneri
no present) (Ferstl et al. 2014). A study conducted by Frei et al. demonstrated that the anti-
inflammatory effects of these microorganisms were nullified in H2R deficient mice (Frei et al.
2013).

61
Table 3. Neurotransmitter secretions by microorganisms.
Neurotransmitters Bacterial Strain
Serotonin Lactococcus lactis subsp. cremoris (MG 1363)
L. lactis subsp. lactis (IL1403)
Lactobacillus plantarum (FI8595)
Streptococcus thermophilus (NCFB2392)
Escherichia coli K-12
Morganella morganii (NCIMB, 10466)
Klebsiella pneumoniae (NCIMB, 673)
Hafnia alvei (NCIMB, 11999)
Dopamine Bacillus cereus
B. mycoides
B. subtilis
Proteus vulgaris
Serratia marcescens
S. aureus
E.coli
E. coli K-12
M. morganii (NCIMB, 10466)
K. pneumoniae (NCIMB, 673)
H. alvei (NCIMB, 11999)
Noradrenaline B. mycoides
B. subtilis
P. vulgaris
S. marcescens

62
Table 3. Neurotransmitter secretions by microorganisms (continued).
Neurotransmitters Bacterial Strain
E. coli K-12
GABA L. brevis DPC6108
B. adolescentis DPC6044
B. dentium DPC6333
B. dentium NFBC2243
B. infantis UCC35624
L. rhamnosus YS9
Acetylcholine L. plantarum
Histamine L. lactis subsp. cremoris (MG 1363)
L. lactis subsp. lactis (IL1403)
L. plantarum (FI8595)
S. thermophiles (NCFB2392)
M. morganii (NCIMB, 10466)
K. pneumoniae (NCIMB, 673)
H. alvei (NCIMB, 11999)
Examples of bacterial strains present in the human microbiota and the neurotransmitters they can
produce. Table adapted from (Clarke et al. 2014)
Serotonin is another neurotransmitter secreted by the intestinal microbiota which also
binds GPCRs. This tryptophan derived chemical regulates intestinal movement (Barboza, Okun,
and Moshiree 2015), immune response and inflammation (Shajib and Khan 2015), regulates
metabolism (El-Merahbi et al. 2015) and impacts mood and cognition (Jenkins et al. 2016). In
germ-free mice the plasma concentrations of tryptophan and serotonin are greatly increased,
perhaps due to compensatory mechanisms by the host and were restored to normal levels once

63
the mice were recolonized with normal gut flora (Clarke et al. 2012). The absence of a gut
microbiota, like that of germ-free mice, can profoundly disturb central nervous system pathways.
This imbalance was found to be extremely difficult to restore if the normal gut flora is not
restored in childhood.
2.1.4.4. VIP and the microbiome
VIP signaling pathways are prominent in the gastrointestinal tract (its original place of
discovery) and is involved in similar pathways to the neurotransmitters previously discussed.
Inside the intestines, vasoactive intestinal peptide functions to prevent epithelial barrier
disruption during infection through reduction of intestinal inflammatory response (Morampudi et
al. 2015). In inflammatory bowel diseases, such as Crohn’s and ulcerative colitis, VIP signaling
cascades are disrupted (Wu, Conlin, et al. 2015). Mice deficient in VIP (same strain studied in
this dissertation) were more susceptible to induced colitis models (Colwell et al. 2003). These
mice also displayed disruption in intestinal epithelial morphology (Vu et al. 2014). After
analyzing nearly 963 pathways Liu et al. confirmed that the VIP signaling axis is the most
important in the development of obese phenotypes (Liu et al. 2010).
First published in the American Journal of Physiology, Conlin et al. demonstrated that
VIP was essential for the regulation of intestinal epithelial permeability. To test this, researchers
administered Citrobacter rodentium, a murine pathogen known to infect colonic epithelium,
cause increased permeability and induce ulcerative colitis in mice. The introduction of this
pathogen resulted in a significant increase in epithelial VIP secretion and an overall reduction in
body weight. Intraperitoneal injections of additional VIP prevented this weight loss. Mannitol
was added to mouse diet and its measurements were taken in the intestinal lumen and serous
membrane. While diseased mice showed a significant increase in unidirectional mannitol flow,

64
amazingly, mice given additional VIP returned to nearly control levels for intestinal
permeability. Histological evaluations of the intestines also displayed an ablation of ulcerative
colitis in mice given VIP (Conlin et al. 2009). Research published later from the same group
demonstrated that the protective capacity of VIP was through the protein kinase C (PKC)
pathway, which is activated by the VIP-cAMP signaling axis (Morampudi et al. 2015).
VIP and the microbiome have also both been implicated in circadian synchronization.
This hormonal internal clock is controlled by rhythms in gene expression and light detection.
VIP has been shown to mediate the expression of clock genes mediated through its VPAC2
receptor which is highly expressed in the suprachiasmatic nucleus in the brain (Miller et al. 2014;
Shen et al. 2000). This region of the hypothalamus acts as the circadian pacemaker for the host
and the lack of VIP (like in VIP knockout mice) shifts behavior (Lucassen et al. 2012), alters
sleep patterns (Hu et al. 2011) and through altered clock gene expression can even affect
cardiovascular function (Schroeder et al. 2011). The microbiome of mice whose circadian
rhythm is dysregulated are altered when compared to control mice. Research by Voigt et al.
demonstrated that mice with disrupted circadian cycling by mutated Clock(Δ19) gene had altered
microbial composition as well as decreased diversity in comparison to their wild type
counterparts (Voigt et al. 2016). This was confirmed by Liang et al. who analyzed the impact of
Bmal1, another circadian regulation gene, causing microbiota compositional changes. Their
study demonstrated that the lack of circadian synchronization affects feeding times, fecal
composition and changes based on gender of the mouse (Liang, Bushman, and FitzGerald 2015).
The importance of this rhythm is also essential for immune homeostasis. A publication by Lange
et al. demonstrated the increased presence of immune cells in blood during sleep. These cells

65
seem to work in contrast to epinephrine and noradrenaline which interestingly can be secreted by
the microbiota (Lange, Dimitrov, and Born 2010).
Disruptions in vasoactive intestinal peptide signaling and the intestinal microbiota are
associated with similar diseases including inflammatory bowel disease, circadian dysregulation,
obesity and immune regulation. Despite this overlap, the potential relationship between VIP
signaling and the intestinal microbiota is currently unknown; therefore, in this study, VIP
signaling disruption with the application of knockout mouse models was used to determine the
impact on the intestinal microbiome. Below we demonstrate that the genetic removal of VIP
results in compositional microbial changes in the intestines. Moreover, the overall diversity of
the microbiota is reduced in VIP deficient mice. These changes also results in altered
metabolomic predicts which suggest an increase in the glyoxylate cycle, gluconeogenesis, and
the pentose phosphate pathway, perhaps caused by an increased presence of fats in the intestinal
lumen.
2.1.5. Nucleotide sequencing techniques
2.1.5.1. Sanger Sequencing (Chain termination method)
Although it has mostly been replaced by high-throughput sequencing methods, Sanger
sequencing or chain termination sequencing was the gold standard for DNA sequencing for
nearly 30 years (Sanger et al. 1977). It utilizes two forms of deoxynucleotide substrates. The first
is the naturally occurring deoxyculeotides (dNTPs) and the second is the chain terminating
dideoxynucleoties (ddNTPs). Four reactions are utilized containing all four deoxynucleotides
(dATP, dTTP, dCTP and dGTP) at 100x and a different modified chain-terminating
dideoxynucleotides (ddATP, ddTTP, ddCTP and ddGTP) per reaction at 1x, along with template
DNA, a primer and DNA polymerase. The modified ddNTPs are chain-elongating terminators

66
with no 3’-hydroxy group, but rather an electrophile, incapable of forming a phosphodiester
bond, thereby terminating the elongation of the DNA strand (Sanger, Nicklen, and Coulson
1977). These DNA strands are then heat denatured to remove template DNA and separated by
size using polyacrylamide gel electrophoresis (Sanger and Coulson 1978). The visualization of
these reactions from the gel allows for sequencing as demonstrated in figure 19. An advancement
to this technique was employing fluorescently labeled ddNTPs, each with a different
fluorophore, allowing for a single reaction coupled with a more rapid gel reading by a laser,
which drastically increased the sequencing time (Quesada et al. 1991).
2.1.5.2. 454-Pyrosequencing
The 454-pyrosequencing DNA order determination technique utilizes fragmented base
DNA sequences. After fragmentation, the ends of the DNA sequences are ligated with adapters
of known DNA sequences and then denatured to produce single stranded DNA molecules. Aided
Figure 19. Gel electrophoresis result from an example Sanger sequencing run.
This figure contains an example Sanger DNA sequencing run gel. The arrow indicates the
direction for reading DNA sequences in a 5’ to 3’ manner. Figure modified and adapted from
(Lorenzo-Díaz et al. 2012)
5’ 3’

67
by the adapters, the sequences are then captured through hybridization onto beads, with a unique
DNA fragment binding per bead. These beads are spread across a slide, where each bead is
placed into an individual well. A single dNTP is then flooded onto the plate and if added to the
complementary sequence by the DNA polymerase, an enzymatic reaction produces light that a
highly sensitive camera detects the emission wavelength of each well. The wells are washed and
the process repeated until the DNA fragments, acting as templates for the synthesis of
complementary strand are completely sequenced. These individual pieces of fragmented DNA
are then assembled into one large sequence. This technology is also no longer in use due to its
replacement by newer sequencing platforms.
2.1.5.3. Ion Torrent sequencing
The Ion Torrent sequencing platform from Thermo Fisher Scientific (Waltham,
Massachusetts) utilizes a digital semiconductor chip to determine nucleotide order. Similar to
454-pyrosequencing, fragmented DNA strands are hybridized onto individual beads. The DNA
strands on these beads are copied until the entire bead is covered with the same DNA strand.
These beads are then placed into individual wells on a digital semiconductor. Wells are
immersed with one of the four nucleotides, with the addition of each nucleotide releasing a
hydrogen ion, which changes the pH of the solution in each individual well to identify DNA
sequence of the growing complementary strand. Beneath the semiconductor is a pH sensitive
layer, which can measure the change in pH caused by the binding of the added nucleotide. Each
dNTP produces the same change in pH, but since only one dNTP is added to the wells at a time
and then removed, it can be determined which dNTP was added to which well. In the event of a
repeated sequence with more than one of the same nucleotide in a row, the pH change is greater
and is recorded. The wells are repeatedly washed and the next nucleotide is added. The

68
sequences of each individual well are then overlapped and assembled into a large sequence
(Rothberg et al. 2011).
2.1.5.4. Single-molecule real time sequencing (SMRT sequencing)
The SMRT DNA sequencing technique was created by Pacific Biosciences (Menlo Park,
CA) and contains a chip with tens of thousands of wells, each containing a single DNA
polymerase. The unique feature of this technique is its ability to sequence long strands of DNA,
where all other techniques require the fragmentation of DNA into short strands. These DNA
strands are added to this chip resulting in an estimated one strand per well (containing the DNA
polymerase). The presence of one polymerase per well eliminates the possibility of sequencing
multiple strands at the same time. The four nucleotides are simultaneously added across this
chip, each labeled with a different fluorophore molecule. The utilization of these nucleotides by
the DNA polymerase enzyme, results in their release and the emission of a specific wavelength
of light. This light is detected by a photo-multiplying plate and turned into electrical conductivity
that corresponds to a specific nucleotide. These sequences are overlapped and converted into one
large DNA sequence. SMRT sequencing and the Illumina sequencing platforms are the two
primary strategies for DNA sequencing used today. The Illumina platform is well ahead in
utilization and is currently considered the gold standard for DNA sequencing. It will be covered
in the materials and methods section of this chapter.
2.1.5.5. Illumina sequencing
The most widely used sequencing technology is called Illumina and is a product of
Illumina Inc. (San Diego, CA). This technology in able to read the nucleotide arrangement using
cluster generation followed by DNA sequencing. Although there are various methods for sample
preparation, typically DNA samples are first hydrolyzed into smaller sequences between 200 and

69
600 base pairs. To these fragment adapters, or short known DNA sequences, are added on both
the 5’ and 3’ ends. These adapters also contain sequences complementary to oligos bound to the
flow cell. The flow cell is a glass slide where amplification and DNA sequence reads occur.
Once the adapters are added the samples are washed across the flow cell. Here, the adapter
sequences bind to the DNA previously attached to the flow cell and form a lawn of small clusters
of similar sequences.
Once bound, a polymerase enzyme catalyzes a complementary DNA strand of the DNA
fragment hybridized to the surface. The original sample of DNA is now washed away and the
complementary strand folds over, and the adapter on the other side binds a nearby previously
attached DNA stand on the surface. This process, called bridge amplification, repeats these steps
over and over again, resulting in expansion of all of the fragments and creating numerous clonal
DNA clusters. Reverse DNA strands are now washed away and the sequencing of the DNA
begins. Fluorescently labeled nucleotides are added to the flow cell similar to current DNA
sequencing catalyzed by DNA polymerase. As each complementary nucleotide binds and is
added to the 3’ end of the growing complementary strand, a particular wavelength of light is
emitted and recorded by the instrument. Each wavelength produced by each cluster is analyzed
by a photodetector to determine sequence. This process is known as bridge-amplification and
sequencing by synthesis.
2.2. Materials and methods
2.2.1. Mouse husbandry
The C57 Black 6 mice (C57BL/6) were purchased from Jackson Laboratories (Bar
Harbor, ME). Mice deficient in VIP were obtained from James Waschek at the University of
California, Los Angeles (Colwell et al. 2003). Mice missing the VPAC1 gene (VPAC1KO) were

70
given to our laboratory by Mary Sue O’Dorisio, Univeristy of Iowa, Iowa City (Fabricius et al.
2011). VPAC2 knockout (VPAC2KO) mice originally created by John Harmar were a kind gift
from Jane Schuh at North Dakota State University (Harmar et al. 2002). All of these mouse
strains were bred and housed in the Dorsam lab mouse vivarium at the Animal Nutrition and
Physiology Center (ANPC) at North Dakota State University and met compliance rules approved
by the IACUC committee at NDSU and satisfied all state and federal regulations. Mice were fed
Laboratory Rodent Diet 5001 from LabDiet (St. Louis, MO), which was purchased through the
Animal Supply Company (Irving, TX). Animals were fed food and water ad libitum and
maintained on a 12-hour day/night cycle.
Animals were housed in material vented cages (13.5” L x 11.5” W x 6.1” H; 75 square
inches) from Animal Care Systems (Centennial, CO). The Optimice caging system from Animal
Care System includes a 100-cage carrying capacity each equipped with air filters and utilized
Alpha-Dri paper bedding (Shepherd Specialty Papers, Milford NJ). Most breeding of these
knockout strains used a harem breeding method of two females (+/-) and one male (+/-); at times
a single female was used based on supply. In order to increase the frequency of WT or KO
VPAC1 or VPAC2, some breeding cages used WT or KO males, but the females were always
heterozygous as gut microbiota are vertically transferred down to offspring. Only brother-sister
breeding was employed in order to reduce genetic drift. (Schei et al. 2017). All pups were
cohoused until maturity (4 weeks), at which time they were weaned into new cages based upon
gender. During the weaning process, mice were identified with ear punches and tail biopsies
collected to determine genotype by PCR. Mice were limited to 4 males or 5 females per cage
irrespective of genotype. All studies were conducted with protocols approved by the NDSU
Institutional Animal Care and Use Committee (IACUC) and met all state and federal regulations.

71
2.2.2. Genomic DNA extraction from tail biopsies
From each weaned pup, a 2 to 4 mm tail biopsy was collected using alcohol sterilized
forceps and scissors and placed into a 1.5 mL centrifuge tube on ice. These tail clips were either
exacted immediately or stored in a -20oC freezer until assayed. To extract DNA, extraction
solution (Sigma Aldrich, Catalog # E7526-24ML) and tissue preparation (Sigma Aldrich,
Catalog # T3073-30ML) were mixed in a 4 (40 µL) to 1 (10 µL) ratio, respectively, and 50 µL
total was added to tail tissue. After a brief ten second microcentrifuge, to ensure tail submersion,
the tubes were incubated at room temperature for 20-120 minutes to ensure cell lysis. Samples
were then placed in a 95oC sand bath for 4 minutes. Neutralization buffer (40 µL) (Sigma
Aldrich, Catalog # N3910-24ML) was added, and samples were vortexed for 30 seconds. Tail
samples were diluted 1/20 in nuclease free water or TE buffer, and then added to the PCR
reaction. Polymerase chain reaction (PCR) was conducted to determine the genotype of each tail.
2.2.3. Genotyping
PCR was performed to interrogate the presence of wild type and/or mutant alleles after
DNA extraction. The green GoTaq® G2 master mix system (Promega, Catalog # M7823) was
used to perform the PCR reaction. A mixture of four total primers (each pair of primers specific
for the WT or KO allele) was used for the VPAC1KO and three primers for VIP and VPAC2KO
mouse strains. Here, the VIP + VPAC2KO reactions, utilized unique 5’ primers specific for the
WT or KO allele sequence and a common 3’ primer. Primer sets are listed in table 4 below with
figures 20, 21, and 22 demonstrating the strategy behind the creation of the knockout mice and
the primer hybridization location on the allele.

72
Table 4. PCR primers used to interrogate WT and KO alleles for VIP, VPAC1, and VPAC2.
Strain Primer Name Primer Sequence
VIP
Both V1 5’ - TTTCAAGGTGTGGGGCTAGAGACATACA - 3’
WT allele V2 5’ - TTACCTGATTCGTTTGCCAATGAGTGAC - 3’
KO allele N1 5’ - GCCCGGAGATGAGGAAGAGGAGAACAG- 3’
VPAC1
WT allele VPAC1WT 5' 5’ - GGTTGCCATGGCTATCTTGA - 3’
WT allele VPAC1WT 3' 5’ - AGTGGTCTGTCTCCCCGTTGTT - 3’
KO allele VPAC1KO 5' 5’ - TTCAACTGTTTTCCCCCATTCAC - 3’
KO allele VPAC1KO 3' 5’ - CCAGCTCATTCCTCCCACTCA - 3’
VPAC2
WT allele P2 5’ - TAGGGGTGTTCCCAACTCCA - 3’
KO allele P4 5’ - GGAAGCATTCTGCTCTGGAT - 3’
Both 596 5’ – ACTTCAACCCCACTTCTGGC – 3’
A list of the primers used to interrogate WT and KO alleles in the mouse genome.

73
Figure 20. VIPKO generation and primer target location.
Above is the schematic used by Colwell et al. in the creation of the VIPKO strain. The
complementary binding sites for the VIP primers used in our genotyping protocol are
displayed with the V2 primer binding for both WT and KO, while the V1 and N1 only
binding for WT and KO respectively. Figure recreated and adapted from (Colwell et al.
2003)

74
Figure 21. Replacement of VPAC1 exons 4 to 6 with PGK-1-Neomycin cassette.
To determine mouse genotype the PCR primers used examine the exon 4 to 6 region. The WT
primers will engage a region present between exons 4 and 6, while the KO primers will
engage a region on the cassette itself. Figure recreated and adapted from (Fabricius et al.
2011)

75
Table 5. Master mix recipe.
Reagents μl/rxn # of reactions Volume (μl)
H2O 7.75 10 77.5
Primer sets at 25 uM each 0.25 10 2.5
2X G2 GoTaq 10 10 100
PCR reaction master mix composition and reaction example.
PCR reactions were performed under the following parameters: 94oC for 3’ 94oC for
15’’ 62oC for 45’’ 72oC for 1’ Repeat a total 40 cycles 72oC for 1’’ 4oC
Figure 22. Generation of VPAC2 knockout mice.
A neomycin-resistance gene was inserted into the VPAC2 gene. P1 and P2 primers were used
to interrogate the WT gene and the P3 and P4 primers to interrogate the ends of the neomycin
gene. Figure recreated and adapted from (Harmar et al. 2002)

76
indefinitely. EZ-Vision dye (Amresco, Catalog # N391-15MLDRP) was added 3 µL (diluted 1/6
with H2O) to the PCR samples to visualize DNA amplicons by UV light exposure (302 nm trans
illumination) and the mixture (~16 µL) was added to wells in 1.5% agarose gels. After separation
of amplicons by gel electrophoreses (~100 V/hr), gels were imaged by the Syngene Chemi
Genius 2 platform (Syngene Frederick, MD) or similar UV detection systems. Genotypes for all
mice were confirmed by two individuals, performing separate PCR reactions from the same
extracted DNA samples.
2.2.4. Fecal sample collection
At 8 weeks of age (53 – 59 days old), fecal samples were collected between 10 and 11 am
on Thursday or Friday of each calendar week. Mice were placed inside a sterile autoclaved
filtered cage and two fecal pellets were collected from each mouse using sterile toothpicks and
placed into sterilized 2 mL microcentrifuge tubes. These tubes were instantly placed on ice and
transferred to the a -80oC freezer. The samples were then shipped drozen to the University of
Missouri Metagenomics Center (MUMC) by overnight shipping.
Eight fecal samples were collected from both male and female wild type (WT),
heterozygous (HET) and homozygous mutant (KO) littermates from VIP, VPAC1 and VPAC2
strains. All three strains are on C57BL/6 genetic background and therefore to increase
thoroughness and rigor an additional eight fecal samples for male and females were also
collected from wild type C57BL/6 mice from Jackson Labs (Bar Harbor, ME). Table 6 below
summaries the fecal samples collected for this study. Figure 23 is a visual representation of how
the mice were housed and a timeline of when fecal samples were obtained.
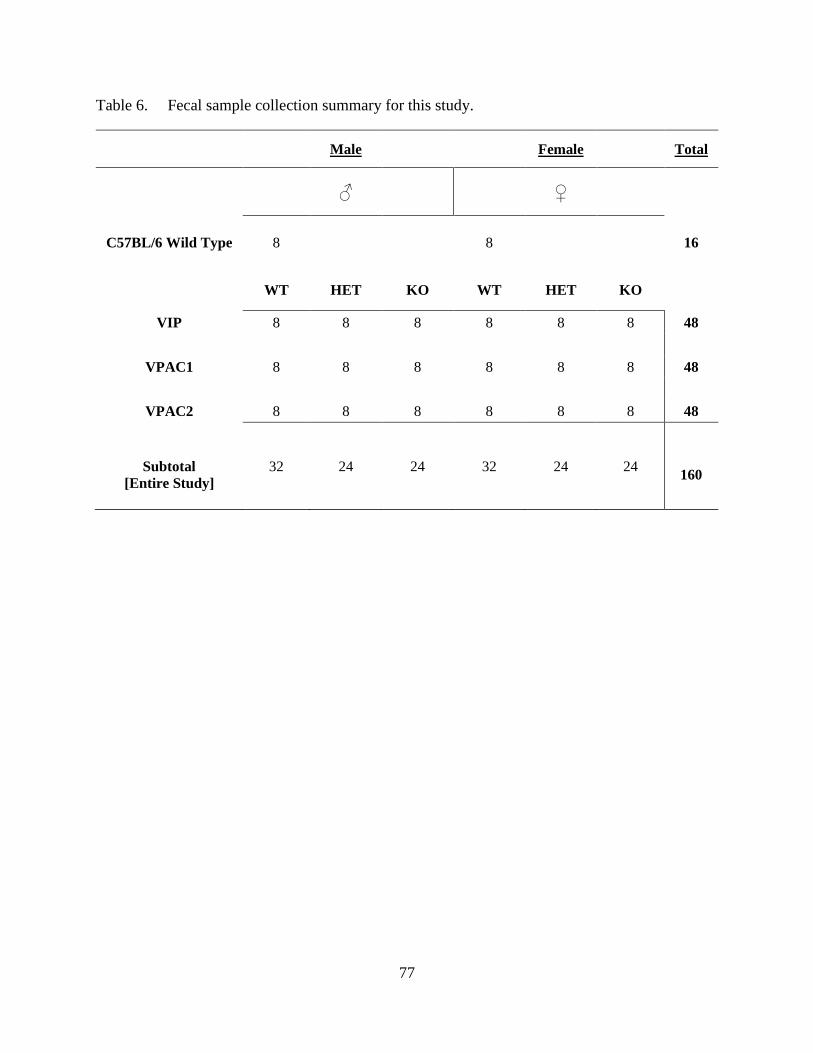
77
Table 6. Fecal sample collection summary for this study.
Male Female Total
♂ ♀
C57BL/6 Wild Type 8 8 16
WT HET KO WT HET KO
VIP 8 8 8 8 8 8 48
VPAC1 8 8 8 8 8 8 48
VPAC2 8 8 8 8 8 8 48
Subtotal
[Entire Study]
32 24 24 32 24 24
160

78
Figure 23. Fecal sample collection strategy.
Collected in accordance with table 5, this breeding and collection strategy was applied for all
strains. After 4 weeks of co-housing with breeding pairs, pups were weaned, separated by
gender, ear clipped, and genotyped by PCR. At 8 weeks of age, fecal samples were collected
and sequenced.
PCR genotyping Mendelian ratio
~ 1/2/1 for WT/HET/KO

79
2.2.5. DNA extraction (performed at MUMC)
DNA from fecal samples were extracted using the Qiagen DNeasy Blood and Tissue kit
extraction method. In a recent comparative study, this method was found to be the best at DNA
extraction (Hart et al. 2015). Eight hundred μL of lysis buffer (500 mM NaCl, 50 mM Tris-HCl
pH 8.0, 50 mM EDTA, and 4% sodium dodecyl sulfate) and a stainless-steel bead were added
the fecal samples. The Qiagen TissueLyser II was used for mechanical disruption of the samples
at 30 Hz for 3 minutes. The samples were centrifuged after a 70°C incubation for twenty
minutes. The supernatants were transferred to a new tube containing 200 μL of 10 mM
ammonium acetate. After a 5-minute centrifuge at 5,000 x g, the supernatant was transferred to a
tube on ice containing chilled isopropanol for 30 minutes. Samples were then centrifuged at 4°C
for 15 minutes at 16,000 x g. The supernatant was discarded and DNA pellets were washed
several times with 70% ethanol. Pellets were then resuspended in 150 μL of Tris-EDTA, 15 μL
of proteinase K and 200 μL of AL buffer (provided by Qiagen). After a 10-minute incubation at
70°C, 200 μL of 100% ethanol was added. Samples were applied to the DNeasy spin column and
eluted into EB buffer (Qiagen, DNeasy Blood and Tissue Kit Catalog # 69506)
2.2.6. Next generation rRNA sequencing (performed at MUMC)
The Illumina MiSeq platform was used for 16S rRNA sequencing at the University of
Missouri Core facility. The V4 hypervariable region of the 16S gene was targeted by universal
primers created William Walters et al. U515F (5′-GTGCCAGCMGCCGCGGTAA-3′) and R806
(5′-GGACTACHVGGGTWTCTAAT-3′) (Walters et al. 2011). The PCR parameters were: 98oC
for 3’ 98oC for 15’’ 50oC for 30’’ 72oC for 30’’ Repeat a total 25 cycles] 72oC
for 7’ 4oC indefinitely. The product was washed with 80% ethanol and resuspended in Qiagen
EB buffer. The amplicons were then pooled for sequencing using the Illumina MiSeq platform.

80
The MiSeq platform utilizes adaptors which are added to the ends of the amplified DNA
fragments. Here, regions complementary to the adaptors are bound to the bottom of the Illumina
MiSeq flow cell. The fragments of each sample are then added to a lane on the Illumina flow cell
and bind to their complementary oligos. The double stranded strands are denatured with one
strand binding to the complementary oligo and the other being washed away. Bound to the flow
cell, the fragment folds over and binds to the other oligo on the cell. DNA polymerases are then
used to form the complementary strands and create double stranded bridges all over the cell.
Denaturing of this bridge results in two copies of the strand. These steps are repeated
continuously for clonal amplification of the DNA strand. The reverse strands are then cleaved
and washed off. As with other sequencing techniques, fluorescently labeled nucleotides are then
added and upon binding emit a fluorescent signal. This signal is then picked up by a detector and
all of the signals are read simultaneously. The millions of reads are then overlapped and
contiguous sequences are formed.
2.2.7. Bioinformatics analysis
2.2.7.1. Paired-end FASTQ processing
The Qiime 1.9.1 software, created by the Knight Laboratory at the University of
California San Diego, was utilized for analysis of the 16S DNA reads (Kuczynski et al. 2012).
To ensure quality reads, a Phred quality score of 20 were utilized. This ensured the probability of
an incorrect base call at 1 in 100 or 99% accurate. The join_paired_ends.py script took forward
and reverse reads and joined them together, with a minimum overlap length of 10 base-pairs and
a maximum percent difference within overlap set at 25%. The maximum bad run length, or
number of consecutive low-quality reads before truncation was set to 3. The
make_mapping_files.py and validate_mapping_files.py commands were used to remove barcode

81
sequences (mapping file displayed in table 7 below). The split_libraries_fastq.py script was used
for quality trimming and placement into a sequence file.
Table 7. Qiime mapping file.
SampleID BarcodeSequence ForwardFastqFile ReverseFastqFile TreatmentGroup Description
1MWT CTTGAGCTTTGA MB001-B2_S14_L001_R1_001.fastq MB001-B2_S14_L001_R2_001.fastq 1_MWT MWT1
2MWT CACCGATTGGTA MB002-B3_S15_L001_R1_001.fastq MB002-B3_S15_L001_R2_001.fastq 1_MWT MWT2
3MWT TGGTTCGAGTAC MB003-B4_S16_L001_R1_001.fastq MB003-B4_S16_L001_R2_001.fastq 1_MWT MWT3
4MWT CAATCGCCGGAA MB004-B5_S17_L001_R1_001.fastq MB004-B5_S17_L001_R2_001.fastq 1_MWT MWT4
5MWT TCTCCGCATGTC MB005-B6_S18_L001_R1_001.fastq MB005-B6_S18_L001_R2_001.fastq 1_MWT MWT5
6MWT TGTATGGGTGCG MB006-B7_S19_L001_R1_001.fastq MB006-B7_S19_L001_R2_001.fastq 1_MWT MWT6
7MWT ACGCTTCAATGT MB007-B8_S20_L001_R1_001.fastq MB007-B8_S20_L001_R2_001.fastq 1_MWT MWT7
8MWT CTAAATGTCGTC MB008-B9_S21_L001_R1_001.fastq MB008-B9_S21_L001_R2_001.fastq 1_MWT MWT8
9MHET CCGAGTAGTTGG MB009-B10_S22_L001_R1_001.fastq MB009-B10_S22_L001_R2_001.fastq 2_MHET MHET1
10MHET CGCTGATAACGG MB010-B11_S23_L001_R1_001.fastq MB010-B11_S23_L001_R2_001.fastq 2_MHET MHET2
11MHET GGTTTGGCCATA MB011-B12_S24_L001_R1_001.fastq MB011-B12_S24_L001_R2_001.fastq 2_MHET MHET3
12MHET CTCTCCCGTGAT MB012-C1_S25_L001_R1_001.fastq MB012-C1_S25_L001_R2_001.fastq 2_MHET MHET4
13MHET TCCTAGCAGTGA MB013-C2_S26_L001_R1_001.fastq MB013-C2_S26_L001_R2_001.fastq 2_MHET MHET5
14MHET CACTCTGATTAG MB014-C3_S27_L001_R1_001.fastq MB014-C3_S27_L001_R2_001.fastq 2_MHET MHET6
15MHET TGCCAATGCCAA MB015-C4_S28_L001_R1_001.fastq MB015-C4_S28_L001_R2_001.fastq 2_MHET MHET7
16MHET CCTCGGATTATA MB016-C5_S29_L001_R1_001.fastq MB016-C5_S29_L001_R2_001.fastq 2_MHET MHET8
17MKO ACGCTATCTGGA MB017-C6_S30_L001_R1_001.fastq MB017-C6_S30_L001_R2_001.fastq 3_MKO MKO1
18MKO GGTGACCGGATT MB018-C7_S31_L001_R1_001.fastq MB018-C7_S31_L001_R2_001.fastq 3_MKO MKO2
19MKO TACCAAGCACTT MB019-C8_S32_L001_R1_001.fastq MB019-C8_S32_L001_R2_001.fastq 3_MKO MKO3
20MKO CGACCCTTTACC MB020-C9_S33_L001_R1_001.fastq MB020-C9_S33_L001_R2_001.fastq 3_MKO MKO4
21MKO GATTGAGAAAGC MB021-C10_S34_L001_R1_001.fastq MB021-C10_S34_L001_R2_001.fastq 3_MKO MKO5
22MKO AGGACGCACTGT MB022-C11_S35_L001_R1_001.fastq MB022-C11_S35_L001_R2_001.fastq 3_MKO MKO6
23MKO GGTACATCGGTT MB024-D1_S37_L001_R1_001.fastq MB024-D1_S37_L001_R2_001.fastq 3_MKO MKO8
24FWT ACGGCCAATCGA MB025-D2_S38_L001_R1_001.fastq MB025-D2_S38_L001_R2_001.fastq 4_FWT FWT1
25FWT GTCCAGTAATGC MB026-D3_S39_L001_R1_001.fastq MB026-D3_S39_L001_R2_001.fastq 4_FWT FWT2
26FWT TATGTGGCCCAA MB027-D4_S40_L001_R1_001.fastq MB027-D4_S40_L001_R2_001.fastq 4_FWT FWT3
27FWT TGACTTTGTGTG MB028-D5_S41_L001_R1_001.fastq MB028-D5_S41_L001_R2_001.fastq 4_FWT FWT4
28FWT CCTATCCTTGGC MB029-D6_S42_L001_R1_001.fastq MB029-D6_S42_L001_R2_001.fastq 4_FWT FWT5
29FWT ATACACGTGGCG MB030-D7_S43_L001_R1_001.fastq MB030-D7_S43_L001_R2_001.fastq 4_FWT FWT6
30FWT ACAATCGGTTGC MB031-D8_S44_L001_R1_001.fastq MB031-D8_S44_L001_R2_001.fastq 4_FWT FWT7
31FWT CCTAAGCACATG MB032-D9_S45_L001_R1_001.fastq MB032-D9_S45_L001_R2_001.fastq 4_FWT FWT8
32FHET1 TAATGGAGGAAC MB033-D10_S46_L001_R1_001.fastq MB033-D10_S46_L001_R2_001.fastq 5_FHET FHET1
33FHET2 GAAAGGACAGGT MB034-D11_S47_L001_R1_001.fastq MB034-D11_S47_L001_R2_001.fastq 5_FHET FHET2
34FHET3 TTGGGCGTGAAC MB035-D12_S48_L001_R1_001.fastq MB035-D12_S48_L001_R2_001.fastq 5_FHET FHET3
35FHET4 CGTTGCCTCGTT MB036-E1_S49_L001_R1_001.fastq MB036-E1_S49_L001_R2_001.fastq 5_FHET FHET4
36FHET5 GTCGCTGTCTTC MB037-E2_S50_L001_R1_001.fastq MB037-E2_S50_L001_R2_001.fastq 5_FHET FHET5
37FHET6 GATCGCAGGTGT MB038-E3_S51_L001_R1_001.fastq MB038-E3_S51_L001_R2_001.fastq 5_FHET FHET6
38FHET7 GAATGCAACGCC MB039-E4_S52_L001_R1_001.fastq MB039-E4_S52_L001_R2_001.fastq 5_FHET FHET7
39FHET8 CTGAACGCTAGT MB040-E5_S53_L001_R1_001.fastq MB040-E5_S53_L001_R2_001.fastq 5_FHET FHET8
40FKO1 ACTTTGTCGCAA MB041-E6_S54_L001_R1_001.fastq MB041-E6_S54_L001_R2_001.fastq 6_FKO FKO1
41FKO2 CATATACTCGCA MB042-E7_S55_L001_R1_001.fastq MB042-E7_S55_L001_R2_001.fastq 6_FKO FKO2
42FKO3 TTCGTTGTGGTA MB043-E8_S56_L001_R1_001.fastq MB043-E8_S56_L001_R2_001.fastq 6_FKO FKO3
43FKO4 AACCGTTCCAGA MB044-E9_S57_L001_R1_001.fastq MB044-E9_S57_L001_R2_001.fastq 6_FKO FKO4
44FKO5 CCGAGGTAGTAC MB045-E10_S58_L001_R1_001.fastq MB045-E10_S58_L001_R2_001.fastq 6_FKO FKO5
45FKO6 GGTTAACAGGAA MB046-E11_S59_L001_R1_001.fastq MB046-E11_S59_L001_R2_001.fastq 6_FKO FKO6
46FKO7 CCACTTGGATAG MB047-E12_S60_L001_R1_001.fastq MB047-E12_S60_L001_R2_001.fastq 6_FKO FKO7
47FKO8 ATCCGTCATAAC MB048-F1_S61_L001_R1_001.fastq MB048-F1_S61_L001_R2_001.fastq 6_FKO FKO8
Table including all sample IDs, barcode sequences, groups and forward and reverse files for the
VIP group of samples.

82
2.2.7.2. OTU assignment
The output file from the split_libraries_fastq.py script was used to pick closed reference
operational taxonomic units (OTUs) using pick_closed_reference_otus.py command. This OTU
picking process clusters the reads against a reference sequence database. Any sequences not
found in this collection are excluded and removed from any downstream analysis. For our
analysis the SILVA database, release 128, was used for sequence comparison (Quast et al. 2013).
The threshold for sequence clustering similarity within individual OTUs was set to 99%. For
PICURSt analysis, the Greengenes database was used for sequence assessment (DeSantis et al.
2006). A phylogenetic tree was constructed using the make_phylogeny.py command and an
otu_table.biom file was made through make_otu_table.py. The resulting otu_table.biom file was
utilized for core diversity analysis.
2.2.7.3. Alpha and beta diversity
Qiime was utilized to calculate alpha and beta diversity from our dataset. The terms
alpha, beta and gamma diversity were introduced by Robert Wittaker (Whittaker 1972, 1960).
Alpha diversity refers to changes within each group and beta diversity represents differences
amongst various groups. Gamma diversity is the measurement of variety within an entire
landscape, such as a rainforest and not relevant to this analysis. For alpha diversity analysis
observed species (Mittelbach Gary et al. 2001), PD whole tree (Faith 1992), chao1 (Chao 1984)
and Shannon indexes (Shannon 1948) were utilized for comparison. The number of different
species present in a community is a measure of richness, which is the only variable in the
observed species analysis. Chao1 and the Shannon indexes measure both richness and evenness.
Evenness is the measurement of the relative abundance of all of the species present in a sample.
The PD whole tree analysis includes richness, evenness and it measures the length of branches

83
on the phylogenetic tree. The core_diversity_analysis.py command utilized the OTU dataset to
calculate these different diversities.
Beta diversity measurements, represented as weighted or unweighted unique fraction,
were for sample to sample comparisons. The weighted analysis compares the abundance of
individual microorganisms while the unweighted analysis compares just the presence and
absence of these individuals introspective of their abundance. These results were visualized
using a Principal Coordinates Analysis (PCoA) matrix. This three-dimensional plot visually
displays the phylogenetic distances between samples in three axes, PC1, PC2 and PC3, with the
distance between the plots representing the variation in the dataset. Beta diversity was also
measured using the jackknifed_beta_diversity.py and make_boostrapped_tree.py commands.
This allowed for the formation of newick trees which visualized the similarities between
samples.
2.2.7.4. PICRUSt
The bioinformatics software PICRUSt (Phylogenetic Investigation of Communities by
Reconstruction of Unobserved States) was used to predict metagenomic function. As discussed
in the OTU assignment section, to utilize this software the Greengenes database was utilized.
The reason for database change was because the PICRUSt predictive tool currently only supports
the Greengenes database at 99% similarity (Langille et al. 2013). A closed reference OTU table
was picked against the database and the resulting .biom file was utilized for PICRUSt analysis.
The normalize_by_copy_number.py script was used to normalize the OTU table against a known
abundance number. This was followed by the predict_metagenomics.py command which
compares results against the Kyoto encyclopedia of genes and genomes (KEGG) database
(Kanehisa et al. 2017; Kanehisa et al. 2016; Kanehisa and Goto 2000; Kanehisa et al. 2012). The

84
output file was then mapped and analyzed using the Lda Effective Size (LEfSe) module
visualized in figure 25.
2.2.7.5. Statistics
Statistical analysis and graph creation was done using GraphPad Prism Software v.7.00
(GraphPad La Jolla, CA), Microsoft Excel 2016 (Microsoft Seattle, WA) and Qiime v1.9.1.
Two-Way ANOVA analysis was performed on the taxonomic data with the mean of each
organism within each treatment group at every taxonomic rank compared against the means of
that organism in every other treatment group (figure 24). The Bonferroni multiple comparisons
test was utilized with a 95% confidence interval (0.05 represented by *, 0.005 **, 0.0005 ***
and 0.00005 ****).
Figure 24. Group mean multiple comparison.
A snapshot of the analysis performed comparing the mean of each bacterium of each strain to
every other strain at every taxonomic level. Picture taken from GraphPad Prism Software (La
Jolla, CA).

85
2.3. Results
2.3.1. Genotyping
In order to properly classify mouse genotypes, PCR reactions of tail genomic DNA
extracts were performed to interrogate the presence of the WT and/or mutant alleles by use of
specific primers. At four weeks, pups were weaned, and tail biopsies collected for genotyping.
Males and females were separately cohoused irrespective of genotype until eight weeks of age at
which time fecal samples were collected (see figure 23). In theory, the utilization of male HET
and female HET breeding pairs should result in a 1:2:1 Mendelian inheritance as demonstrated in
figure 26. Genotyping data of over 355 mice over 10 experiments were compiled to determine an
Figure 25. PICRUSt metagenomic analysis using the LEfSe tool.
After the PICRUSt analysis is completed using the predict_metagenomics.py command, the
data is input into the LEfSe tool for biomarker discovery. In step one this took uses the
Kruskall-Wallis text to determine whether the values are statistically different. Any values
over 0.05 p-value do not move on. In step two, a Wilcoxon test checks pairwise comparisons
between groups and any that significantly differ from one another are scored and ranked. This
method was first devised by Segata et. all in 2011 and has been extensively validated on
several microbiomes. Figure from (Segata et al. 2011).

86
estimated ratio obtained by our laboratory. Although it did not perfectly match predicted values,
this ratio was closely maintained for all stains expect VPAC1 which resulted in greater HET +/-
and WT +/+ and far fewer KO -/- pups, as demonstrated in figure 26. All PCR reactions were
performed with positive and negative controls and repeated by another individual. The positive
controls were a previously extracted, stored genomic DNA extract, with confirmed genotype. For
example, genotype analysis of VIP mice was conducted with three known WT, HET and KO
samples as positive controls. The negative control was nuclease free water, which ensured no
primer, water and/or Taq contamination. Figure 27 is a representative agarose gel of these PCR
reactions and demonstrates the bands created by each genotype. The analyzed results of this gel
are depicted in table 8.

87
Figure 26. Punnett square demonstrating mouse breeding strategy, predicted and actual
outcomes.
Pups created by the harem breeding approach for VIP and VPAC2 strains resulted in a nearly
1:2:1, WT, HET and KO, ratio. This allowed for utilization of littermate pups 16S studies,
eliminating concerns regarding environment on microbiota. VPAC1 breeders resulted in lower
KO pup production, confirming previously documented work by O’Dorisio lab (Fabricius et al.
2011)
+/+ 3:10 30%
+/- ~1:2 46%
-/- ~1:4 24%
VIP offspring genotypes:
+/+ ~1:3 34%
+/- 3:5 60%
-/- ~1:4 6%
VPAC1 offspring genotypes:
+/+ ~1:4 23%
+/- ~1:2 54%
-/- ~1:4 23%
VPAC2 offspring genotypes:

88
Figure 27. Characteristic example results from the genotyping PCR reaction.
Representative gel electrophoresis data of genotyping conducted on VIP, VPAC1 and VPAC2
strains. This gel includes unknown samples as well as controls for each strain with the
analysis characterized in table 8.
1 2 3 4 5 6 A B C D 7 8 9
E F G H 10 11 12 13 14 15 I J K

89
Table 8. Legend for figure 27 genotyping
Lane number Tail number Strain Result
1 Unknown 1 VIP WT
2 Unknown 2 VIP WT
3 Unknown 3 VIP HET
4 Unknown 4 VIP HET
5 Unknown 5 VIP KO
6 Unknown 6 VIP KO
A VIP WT Control VIP WT
B VIP HET Control VIP HET
C VIP KO Control VIP KO
D VIP H2O Control VIP N/D
7 Unknown 7 VPAC1 WT
8 Unknown 8 VPAC1 WT
9 Unknown 9 VPAC1 HET
E VPAC1 WT Control VPAC1 WT
F VPAC1 HET Control VPAC1 HET
G VPAC1 KO Control VPAC1 KO
H VPAC1 H2O Control VPAC1 N/D
10 Unknown 10 VPAC2 HET
11 Unknown 11 VPAC2 KO
12 Unknown 12 VPAC2 HET
13 Unknown 13 VPAC2 HET
14 Unknown 14 VPAC2 HET
15 Unknown 15 VPAC2 HET
I VPAC2 WT Control VPAC2 WT
J VPAC2 HET Control VPAC2 HET
K VPAC2 KO Control VPAC2 KO
I (not shown) VPAC2 H2O Control VPAC2 N/D

90
2.3.2. Genotype affects taxonomic structure
The vasoactive intestinal peptide and intestinal microbiota signaling pathways have both
been implicated in similar settings such as obesity, immune dysregulation and inflammatory
bowel diseases. Although their roles in the body intersect, a critical gap in knowledge remains as
no research has yet analyzed their potential relationship. We hypothesize that disruption of the
VIP signaling pathway will alter the taxonomic make up, as well as the endocrine functionality
of the microbiome. The microbial communities from fecal samples of mice lacking the VIP
peptide were sequenced to test this hypothesis.
Figure 28 depicts a stacked bar graph representing the 16S sequencing results at the
phylum level. Separated into male and female with all three genotypes, we can see a reduction in
Firmicutes in both male and female KO mice when compared to WT. This reduction is
compensated by an increase in Bacteroidetes and Proteobacteria. The smaller Deferribacteres
population is similar in abundance from WT to HET and drops in the KO strain. The removal of
VIP regardless of sex reduces Deferribacteres and Firmicutes populations, while increasing the
levels of Bacteroidetes. The changes between WT, HET and KO are similar between male and
female mouse groups. The main differences are seen in the male and female WT groups. The
male WT mice seem to act as an intermediary between the HET and KO mice, and differ from
the female WT mice. This is interesting as the male HET and KO strains are similar in microbial
abundance when compared to females. This suggests that gender and sex hormones may play a
role in bacterial abundance through VIP.
The ratio of the Firmicutes to the Bacteroidetes phyla has been linked to obesity
phenotypes in mice and in humans. Discussed to greater detail in 2.1.3.1, increases in Firmicutes
and decreases in Bacteroidetes have been linked to obesity in patients. First the average of these

91
two groups were individually plotted in figure 30. Here we can see that as the gene is
extinguished (KO), the levels of Bacteroidetes greatly increase and the levels of Firmicutes
decrease. The HET mice for both genders seem to host similar levels of these two phyla.
Interestingly, the WT mice have a greater amount of Bacteroidetes, with the male WT levels
residing between HET and KO. Our data suggests that the partial removal of VIP results in a
shift towards the obese phenotype and an increase in Firmicutes, whereas the complete removal
of VIP shifts towards a lean phenotype observed in both sexes.
To determine changes in this relationship, the ratio data was plotted in a box and whisker
plot in figure 31. This graph shows a range of ratios for both WT and HET for both sexes with a
small F to B ratio in the KO strains. This was important to demonstrate the clear spread between
these ratios as well as provide an insight into the differences between genotypes. The WT and
HET mouse group data is scattered with ratios ranging from nearly zero all the way to 3.5. The
KO mice on the other hand present just the opposite, with a compact ratio between 0 and 1. The
data indicates that the lack of VIP reduces the F to B ratio. We conclude that based on the F to B
ratio, the KO mice must be leaner in comparison to HET and WT.
The genus level stacked bar graph in figure 29, demonstrates that changes in bacterial
abundance can be found all the way to the genus taxonomic level. Both knockout strains show a
decrease in uncultured S24-7 Bacteroidales (black) and an increase in Bacteroides (dark green)
and Helicobacter (purple). The number of genera present makes for difficult interpretation of the
stacked bar data and will be separated out into individual genus later in this section. Although
similar compositional changes are seen at every level of the taxonomic tree, for simplicity, only
phylum and genus level changes are shown below. The remaining taxonomic graphs and
breakdowns can be found in appendix A.

92
W T H E T K O W T H E T K O0
5 0
1 0 0
P h y lu m L e v e l T a x o n o m y
Ab
un
da
nc
e
Figure 28. Phylum level taxonomic differences between VIP male and female +/+, +/-
and -/-.
Sequenced fecal sample data is represented as a stacked bar graph. This graph represents
changes at the phyla taxonomic level, with the males on the left and the females on the right.
The key below the graph represents the different phyla indicated by color.

93
WT
HE
TK
OW
T
HE
TK
O
0
5 0
1 0 0
G e n u s L e v e l T a x o n o m yA
bu
nd
an
ce
Figure 29. Microbial community changes at the genus level for VIP mouse strains.
This stacked bar graph represents the percent abundance of various bacterial genera for each
genotype for both sexes. The figure legend depicts an n=8 (7 for male KO) for all strains. The
figure legend below the depicts the various color-coded genera. Percent values are available
in appendix A.
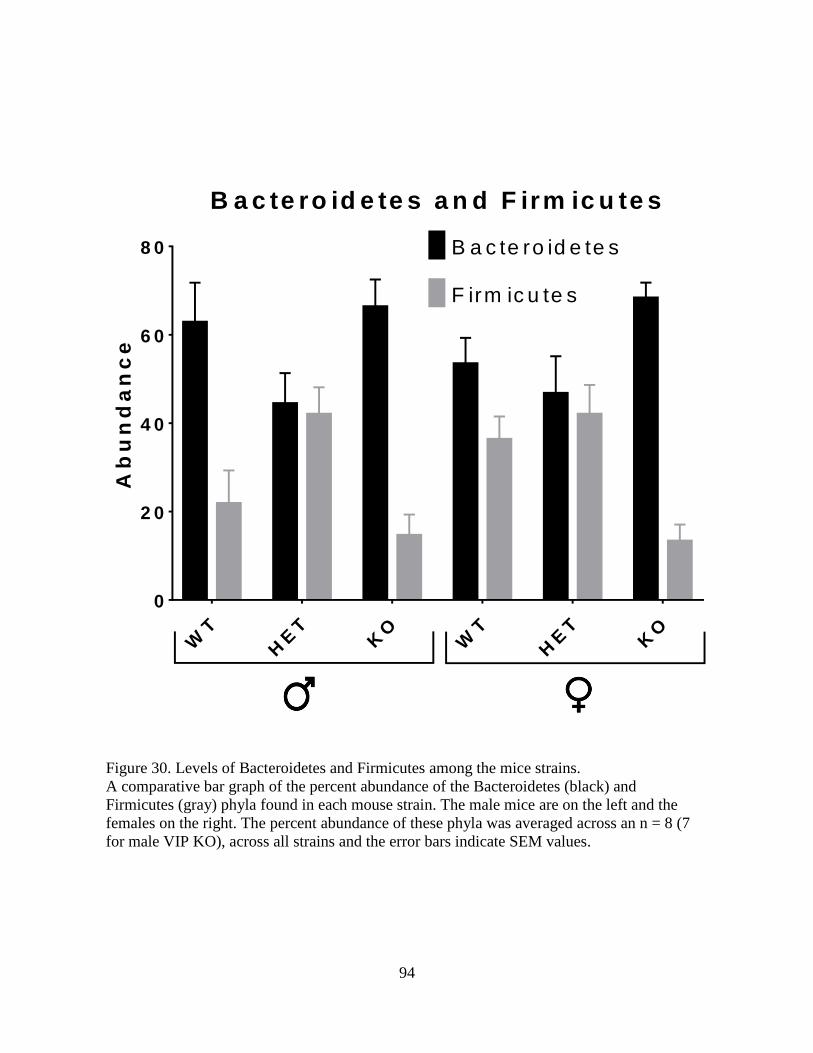
94
WT
HE
TK
OW
T
HE
TK
O
0
2 0
4 0
6 0
8 0
B a c te ro id e te s a n d F irm ic u te s
Ab
un
da
nc
e
B a c te ro id e te s
F irm ic u te s
Figure 30. Levels of Bacteroidetes and Firmicutes among the mice strains.
A comparative bar graph of the percent abundance of the Bacteroidetes (black) and
Firmicutes (gray) phyla found in each mouse strain. The male mice are on the left and the
females on the right. The percent abundance of these phyla was averaged across an n = 8 (7
for male VIP KO), across all strains and the error bars indicate SEM values.
Figure 31. Ratio of Firmicutes to Bacteroidetes between tested mouse strains.Figure 30.
Levels of Bacteroidetes and Firmicutes among the mice strains.
A comparative bar graph of the percent abundance of the Bacteroidetes (black) and
Firmicutes (gray) phyla found in each mouse strain. The male mice are on the left and the
females on the right. The percent abundance of these phyla was averaged across an n = 8 (7
for male VIP KO), across all strains and the error bars indicate SEM values.

95
WT
HE
TK
OW
T
HE
TK
O
0
1
2
3
4
F irm ic u te s o v e r B a c te ro id e te s R a t io (F /B )
Figure 31. Ratio of Firmicutes to Bacteroidetes between tested mouse strains.
The ratio of Firmicutes to Bacteroidetes in each individual mouse tested in represented above
each strain category. The male mice are on the left and the females are on the right. The ratios
are then plotted in a box-and-whisker plot representing the maximum, 3rd quartile, median, 1st
quartile and minimum values from the top down respectively.
Figure 32. Phylum level statistical differences between VIP strains and sexes.Figure 31. Ratio
of Firmicutes to Bacteroidetes between tested mouse strains.
The ratio of Firmicutes to Bacteroidetes in each individual mouse tested in represented above
each strain category. The male mice are on the left and the females are on the right. The ratios
are then plotted in a box-and-whisker plot representing the maximum, 3rd quartile, median, 1st
quartile and minimum values from the top down respectively.

96
The intersection of VIP and the microbiota signaling pathways suggests a possible
relationship between them. Although the stacked bar graphs allow for visualization of
fluctuations within the entire microbial community, the analysis of changes in individual phyla is
better demonstrated by individual bar graphs. This allows for the addition of standard error of
mean (SEM) which is not presentable in the stacked bar graph. Figure 32 shows phyla that
exhibited significant changes between VIP strains, using the Bonferroni multiple comparisons
test (2.2.7.5). In the Bacteroidetes phyla, the KO strain was statistically higher than both the WT
and HET strains. This was not seen in the male mice though, where the KOs were statistically
higher than the HET but not the WT. Interestingly, the WT and HET strains seem to have a
lower Bacteroidetes percent than the KOs, suggesting that the absence of VIP may be hindering
this phylum. The Firmicutes phylum seems to the opposite of the Bacteroidetes phylum,
decreasing and increasing in response to the Bacteroidetes change. Similar to the Bacteroidetes,
no statistical change is observed between the male WT and KO strains, but is seen in the female
mice. In both sexes we observe an increase from WT to HET and a decrease from HET to KO.
Proteobacteria, was only present around 3 to 7 percent in the WT and HET strains for both sexes.
Although not statistically different in the males, the KO strains both observed a drastic overall
increase of nearly 10 percent. Seen in the KOs this increase may suggest that the lack of VIP
results in a drastic increase in Proteobacteria. The Actinobacteria phylum was very unique and
only observed in the KO mice. The large error bars are the result as not every KO mouse tested
contained the phylum. In conclusion, the removal of the VIP signaling pathway greatly changes
the percent abundance of the phyla present within the feces. The partial presence of the VIP gene
(HET) does not impact the microbiota as much as its complete ablation. The male WT mice also
seem to differ from their female counterparts and seem to reside between HET and KO strains.

97
MW
T
MH
ET
MK
O
FW
T
FH
ET
FK
O
0
2 0
4 0
6 0
8 0
P h y lu m : B a c te ro id e te s
% T
ota
l R
ea
ds
* * *
* *
* * *
** * * *
* * * *
* * * *
* *
MW
T
MH
ET
MK
O
FW
T
FH
ET
FK
O
0
2 0
4 0
6 0
P h y lu m : F im ic u te s
% T
ota
l R
ea
ds
* * * *
* * * *
* * * *
* * * *
* * * *
* * * ** * * *
* * * *
* *
MW
T
MH
ET
MK
O
FW
T
FH
ET
FK
O
0
5
1 0
1 5
2 0
P h y lu m : P ro te o b a c te r ia
% T
ota
l R
ea
ds
*
*
*
MW
T
MH
ET
MK
O
FW
T
FH
ET
FK
O
0 .0
0 .1
0 .2
0 .3
0 .4
P h y lu m : A c t in o b a c te r ia
% T
ota
l R
ea
ds
Figure 32. Phylum level statistical differences between VIP strains and sexes.
Each bar graph represents an individual phylum and its changes between the mouse strains.
The male mice are on the left and the female mice are on the right. The error bars depict
calculated SEM values with horizontal lines depicting statistical significance. Stats were run
using the Bonferroni test discussed further in 2.2.7.5.
Figure 33. Changes in group 1, Bacteroides, uncultured Porphyromonadaceae and
Helicobacter.Figure 32. Phylum level statistical differences between VIP strains and sexes.
Each bar graph represents an individual phylum and its changes between the mouse strains.
The male mice are on the left and the female mice are on the right. The error bars depict
calculated SEM values with horizontal lines depicting statistical significance. Stats were run
using the Bonferroni test discussed further in 2.2.7.5.

98
Although phylum level analysis can reveal changes between the tested strains, it is only
the second taxonomic level and just skims the surface of bacterial changes. To better understand
the impact of VIP deficiency on the microbiota, genus level changes were analyzed. The 16S
genera taxonomic data was split into three groups, based on trends of change between the mouse
genotypes. Figure 33 for instance, demonstrates the first group containing the Bacteroides,
uncultured Porphyromonadaceae and Helicobacter genera. These three bacterium all increased in
number when VIP was absent. Interestingly, the partial removal of VIP, determined by analysis
of HET mice, did not statistically change their percentage compared to wild type. These
observations were true in both male and female mice. Both uncultured Porphyromonadaceae and
Helicobacter increased in the KO strains by nearly 10 percent. A discrepancy was observed with
the male WT mice, whom showed an increase in the Bacteroides genus, when compared to HET,
but were still statistically lower than the KO.
The second group, visualized in figure 34, is composed of Mucispirillum, Alistipes and
uncultured Bacteroidales S24-7. These genera acted opposite to the first group and demonstrated
lower levels in the KO strains and higher/similar levels in the WT and HET strains. These 3
genera all demonstrated significant differences between the WT and KO strains, suggesting that
the removal of VIP really impacts their abundance. The HET strain did not differ much from the
WT group. For these three genera it seems that the partial removal of VIP does not significantly
impact their presence. Group 3 (figure 35) is composed of uncultured Peptococcaceae and
Lachnospiraceae NK4A136. In males, these two genera showed an increase from WT to HET
and a decrease from HET to KO. Male WT in both were much lower than the female WT and
similar to the KOs. In females, we see a decrease from WT to HET to KO, with a greater change
from HET to KO. We conclude that VIP deficiency impacts the total abundance of these genera.

99
MW
T
MH
ET
MK
O
FW
T
FH
ET
FK
O
0
1 0
2 0
3 0
4 0
G e n u s : B a c te ro id e s%
To
tal
Re
ad
s
* * * *
* * * *
* * * *
* * * *
* * * *
* * * *
* * * *
* * * * * * * *
* * * *
* * * *
*
WT
HE
TK
OW
T
HE
TK
O
0
5
1 0
1 5
F a m ily :P o rp h y ro m o n a d a c e a e
G e n u s :u n c u ltu re d
% T
ota
l R
ea
ds
* * * *
* * * *
* * * *
* * * *
* * * *
* * * * * * * *
* * * *
MW
T
MH
ET
MK
O
FW
T
FH
ET
FK
O
0
5
1 0
1 5
G e n u s : H e lic o b a c te r
% T
ota
l R
ea
ds
* * * *
* * * *
* * * * * * * ** * * *
* * * *
* * * * * * * *
Figure 33. Changes in group 1, Bacteroides, uncultured Porphyromonadaceae and
Helicobacter.
These three bar graphs depict the levels of Bacteroides, uncultured Porphyromonadaceae and
Helicobacter genera. These were grouped together due to the similarity of their change
between genotypes. Both the male and female groups demonstrate a high abundance in the
KO and a low abundance in the WT and HET strains. Error bars depict SEM values.
Figure 34. Genus level analysis of group 2, Mucispirillum, Alistipes and uncultured
Bacteroidales S24-7.Figure 33. Changes in group 1, Bacteroides, uncultured
Porphyromonadaceae and Helicobacter.
These three bar graphs depict the levels of Bacteroides, uncultured Porphyromonadaceae and
Helicobacter genera. These were grouped together due to the similarity of their change
between genotypes. Both the male and female groups demonstrate a high abundance in the
KO and a low abundance in the WT and HET strains. Error bars depict SEM values.

100
MW
T
MH
ET
MK
O
FW
T
FH
ET
FK
O
0
2
4
6
8
1 0
G e n u s : M u c is p ir i l lu m
% T
ota
l R
ea
ds
* * * *
* * * *
*
* *
*
* * * *
MW
T
MH
ET
MK
O
FW
T
FH
ET
FK
O
0
1 0
2 0
3 0
4 0
F a m ily :B a c te ro id a le s S 2 4 -7
g ro u p G e n u s :u n c u ltu re d
b a c te r iu m
% T
ota
l R
ea
ds
* * * *
* * * *
* * * *
* * * *
* * * * * * * *
* * * *
* * * *
* * * *
* * * *
MW
T
MH
ET
MK
O
FW
T
FH
ET
FK
O
0
5
1 0
1 5
G e n u s : A lis t ip e s
% T
ota
l R
ea
ds
* * * *
* * * *
* * * *
* * * *
* * * *
* * * * * * * *
* * * *
Figure 34. Genus level analysis of group 2, Mucispirillum, Alistipes and uncultured
Bacteroidales S24-7.
The average abundance is plotted on individual bar graphs with error bars indicating SEM
values. These genera are categorized as group 2 due to similarities in overall change. Male
mice are presented on the left and the females are presented on the right.
Figure 35. Changes in the Peptococcaceae family and the Lachnospiraceae NK4A136 group
(group 3).Figure 34. Genus level analysis of group 2, Mucispirillum, Alistipes and uncultured
Bacteroidales S24-7.
The average abundance is plotted on individual bar graphs with error bars indicating SEM
values. These genera are categorized as group 2 due to similarities in overall change. Male
mice are presented on the left and the females are presented on the right.
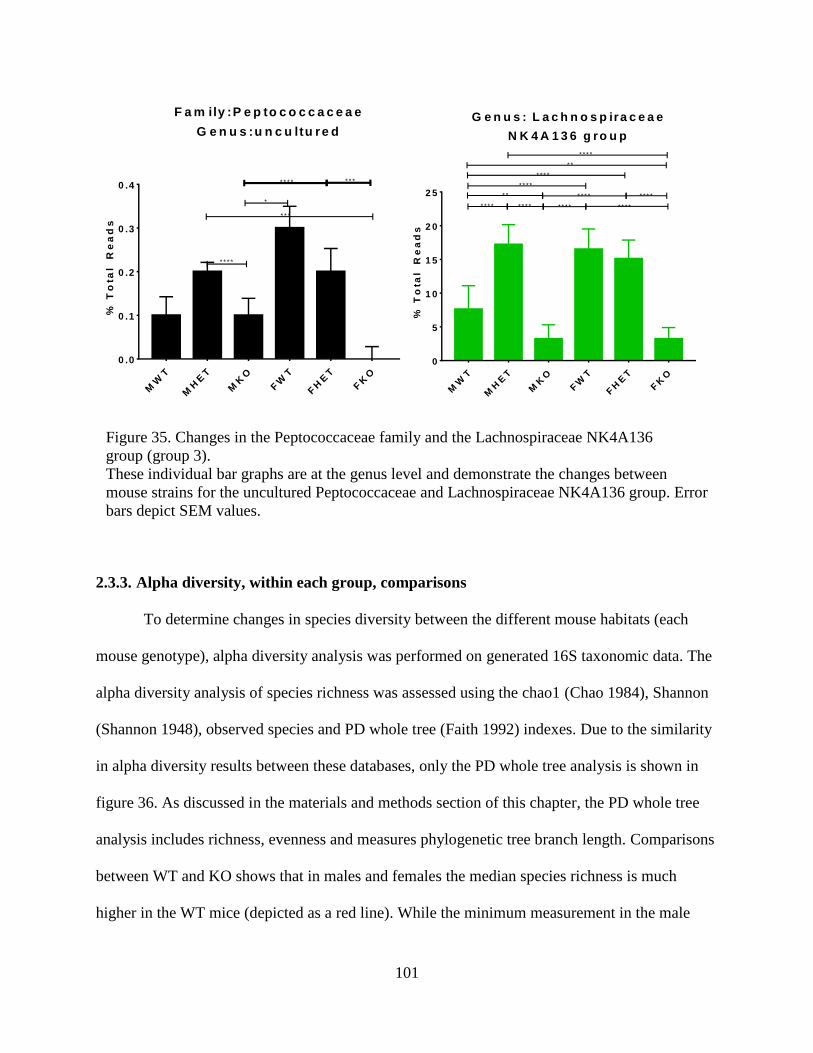
101
MW
T
MH
ET
MK
O
FW
T
FH
ET
FK
O
0 .0
0 .1
0 .2
0 .3
0 .4
F a m ily :P e p to c o c c a c e a e
G e n u s :u n c u ltu re d
% T
ota
l R
ea
ds
* * ** * * *
*
* * *
* * * *
MW
T
MH
ET
MK
O
FW
T
FH
ET
FK
O
0
5
1 0
1 5
2 0
2 5
G e n u s : L a c h n o s p ira c e a e
N K 4 A 1 3 6 g ro u p
% T
ota
l R
ea
ds
* *
* *
* * * * * * * * * * * * * * * *
* * * * * * * *
* * * *
* * * *
* * * *
2.3.3. Alpha diversity, within each group, comparisons
To determine changes in species diversity between the different mouse habitats (each
mouse genotype), alpha diversity analysis was performed on generated 16S taxonomic data. The
alpha diversity analysis of species richness was assessed using the chao1 (Chao 1984), Shannon
(Shannon 1948), observed species and PD whole tree (Faith 1992) indexes. Due to the similarity
in alpha diversity results between these databases, only the PD whole tree analysis is shown in
figure 36. As discussed in the materials and methods section of this chapter, the PD whole tree
analysis includes richness, evenness and measures phylogenetic tree branch length. Comparisons
between WT and KO shows that in males and females the median species richness is much
higher in the WT mice (depicted as a red line). While the minimum measurement in the male
Figure 35. Changes in the Peptococcaceae family and the Lachnospiraceae NK4A136
group (group 3).
These individual bar graphs are at the genus level and demonstrate the changes between
mouse strains for the uncultured Peptococcaceae and Lachnospiraceae NK4A136 group. Error
bars depict SEM values.
Figure 36. PD whole tree analysis of alpha diversity.Figure 35. Changes in the
Peptococcaceae family and the Lachnospiraceae NK4A136 group (group 3).
These individual bar graphs are at the genus level and demonstrate the changes between
mouse strains for the uncultured Peptococcaceae and Lachnospiraceae NK4A136 group. Error
bars depict SEM values.

102
WT is similar to the minimum value in male KOs, the 3rd quartile (around 560) and median
(around 525) suggests that overall the male WT measurements are higher than their male KO
counterparts.
Comparisons between genders do not show significant differences between male and
female HET strains. In the WT groups, we see a lower median and a much greater spread in the
males than in the females. The female WT samples are compact with a small box and whisker
plot while the males are diffused out. The size of the knockout group plot suggests similar
variations in richness for both genders. The median for the females suggests higher overall
richness than the males, but in comparison to WT and HET we see a drop in richness for both
KO genders. In conclusion, both male and female mice see a trend of higher richness in WT and
HET mice and a lower richness for the KOs.

103
2.3.4. Beta diversity, between the groups, comparison
Beta diversity measurements assist in understanding the differences in species
composition between different environments, while alpha diversity analyzes variety at each
individual environment. Figure 37 depicts a three-dimensional principle coordinates analysis plot
(PCoA) which displays the relative distance relating the different mouse intestinal biological
communities. The weighted PCoA plot was chosen because weighted samples take relative
abundance of taxa into account while unweighted only considers presence. Each collected
Figure 36. PD whole tree analysis of alpha diversity.
Examination of species richness by PD whole tree looks at branch length as well as
differences in species. This box and whisker plot visualizes the drop-in richness in both of the
knockout strains, when compared to both WT and HET mice. A drop in microbial diversity is
associated with a number of disease phenotype models.

104
sample is represented as a dot upon the graph with its color representing its genotype and gender.
The z-axis (PC3) images are not shown due to lack of separation between the samples in that
plane. Two major ovals were added to the PCoA plot to depict clustered samples.
As the blue oval demonstrates, the WT and HET samples from both sexes clustered
together. This implies the most similarity between WT and HET groups. As previously seen with
taxonomic analysis and with alpha diversity analysis, we see a similarity between WT and HET
mice regardless of sex. This infers that the partial removal of the VIP gene does not significantly
impact the microbial community. Remarkably, the knockout samples from both sexes grouped
together (depicted by the yellow oval) apart from the WT and HET group, with a clear divide
between the two ovals. The clustering of KO suggests similarity between the KO samples and a
separation from the KO mice to the WT and HET. This data suggests a change in diversity is
caused by the environments present between WT and HET, and KO strains. We do see a group
of three male WT samples off on their own (once again the odd-ball) which may be leading to
alpha diversity and taxonomic differences observed previously. This demonstrates the
importance of including both sexes in studies, as we demonstrate that gender may impact the
microbiome.

105
2.3.5. Predictive metagenome functional content with PICRUSt and the KEGG database
The communicational pathways between the microbiota and the host are changed
between the knockout, heterozygous and wild type mouse strains. Changes in the microbial
community composition can impact the endocrine functions of the microbiome. To determine
changes in the metagenome upon removal of VIP, analysis of metabolic pathways was conducted
Figure 37. Weighted unifrac beta diversity PCoA analysis.
This three-dimensional principle coordinates analysis plot displays the relative distance
comparing the mouse intestinal biological communities from each genotype and gender. Post-
analysis ovals are added to demonstrate clustering of similar microbial communities. Each dot
on the graph is representative of an individual sample with the legend identifying its genotype
and gender. This PCoA plot is 3-dimensional but a focus is placed on the X and Y axis
changes as no significant changes were observed in the Z (PC3) plane.

106
using the PICRUSt bioinformatics software against the KEGG database. This analysis was
performed for all genotypes and genders. The changes in taxonomy between these strains results
in changes in predictive metagenomics between them. Figure 38 visualizes our findings, where
an increase in a number of nucleotide and ATP biosynthesis pathways was found. These were
found to be increased in the KO mouse strains for both genders. The knockout mice also
demonstrated an increase in glyoxylate cycle function, suggesting the utilization of fats for
energy. This may be feeding into the gluconeogenesis cycle as we see an increase in that as well.
This could suggest the presence of excess energy and that the breakdown of glucose is not
necessary for energy generation. An increase in the pentose phosphate pathway indicates the
creation of NADPH which may be used in nucleotide and cholesterol biosynthesis and anabolic
pathways.

107
Figure 38. Predicted functional metagenomics using PICRUSt.
This horizontal bar graph depicts changes in metagenomic pathways as analyzed by the
PICRUSt predictive software. PICRUSt investigates changes in bacterial communities and
predictions functional change in pathways based on previously established databases.

108
2.4. Discussion
This study provided novel and interesting findings regarding the connections between
neuropeptides and the gut microbiota. We conclude that the partial or complete genetic removal
of VIP results in changes in the taxonomic structure of intestinal bacteria. For example, in the
Bacteroidetes phyla, we see an increase of nearly 20% in knockout female mice vs HET and WT.
The depletion of VIP also reduces the alpha-diversity within the intestines and is much lower in
the VIP -/- strains than the VIP +/+ and +/- littermates. Additionally, we discovered changes in
the predicted metagenomic functionality among the strains. In the KO mice for instance, we see
an increase in the pentose phosphate and sugar transport pathways. The lack of VIP altered a
number of biosynthetic pathways within the microbiota. This research also makes us question
whether previous changes observed in VIP KO mice were caused by the altered microbiota or by
the lack of VIP alone?
Understanding the importance of VIP in the gastrointestinal tract, we hypothesized that
VIP signaling through VPAC1/VPAC2 would change the makeup of the intestinal microbiota.
After utilizing PCR to genotype mouse subjects, fecal samples were used to determine microbial
composition. The resulting taxonomy graphed in figures 28 through 29 shows these overall
changes. These observations demonstrate that the disruption of VIP signaling, whether partial
(HET) or complete (KO), results in changes at the taxonomic level. The utilization of HET mice
here is important. We hypothesized that these partial knockouts would result in changes
intermediary to WT and KO. Even at the top of the taxonomic rankings this hypothesis was
disproved.
Our WT compared to C57BL/6 mice from other colonies are similar to some colonies and
different from others (Fransen et al. ; Johnson et al. 2016). As discussed previously, the

109
microbiota can be impacted by a number of things. Differences can be caused by different
sources of food and water used in each mouse colony. Things like humidity (Davenport et al.
2014), bedding (Bai et al. 2016), feeding patterns (Zarrinpar et al. 2014), temperature (Chevalier
et al. 2015) and type of housing (Ericsson et al. 2015) can also impact the microbiota. A
difference in mother’s genotypes could also change what bacteria are present. In our studies all
of these variables were kept consistent for all test mice used. Only heterozygous mothers were
used to produce progeny in order to eliminate impact of breast milk on microbial growth.
Between the wild type and heterozygous mice, we observed a reduction in Bacteroidetes
levels and an increase in the Firmicutes phylum. This trend was more apparent in the male
gender but still present in the females. The change between WT and HET to KO was consistent
between the two sexes. For both males and females, we observed an increase in Bacteroidetes
and a greater decrease in Firmicutes. This decrease was compensated by an increase in
Proteobacteria in the KO strains. The ratios of Bacteroidetes and Firmicutes have been linked to
obesity in a number of publications. It has been published that mice with an obese phenotype
will exhibit a reduction in the total percentage of Bacteroidetes and an increase in the Firmicutes
phyla.
The ratio of these two phyla is visualized in figures 30 and 31. Figure 30 displays the
level of both phylum while 31 displays the ratio between the two. Analysis of this ratio also
demonstrates the importance of using both genders in mouse research. In figure 30 the change of
Bacteroidetes and Firmicutes in male mice from WT to KO is not statistically different, but in
female mice it is. But when the ratio of the two is calculated (𝐹𝑖𝑟𝑚𝑖𝑐𝑢𝑡𝑒𝑠/𝐵𝑎𝑐𝑡𝑒𝑟𝑜𝑖𝑑𝑒𝑡𝑒𝑠) with
standard error of the mean (SEM), we see the changes becomes more apparent. The trend of

110
weight for our knockout mice is similar to previous findings, where our knockout mice weight
less than WT and HET.
The KO strains were also the only strain to contain the Actinobacteria phylum. Although
this phylum was present in very low amounts (0.20% MKO and 0.10% FKO), no other strains
contained any Actinobacteria. This interesting phylum is found more often distributed in
terrestrial and aquatic ecosystems (Barka et al. 2016). Downstream at the genus taxonomic rank,
following their phylum, Bifidobacterium are the only Actinobacteria subset with presentation
only in the knockout strains. This interesting genus is very sensitive to O2, suggesting that
perhaps the KO strains have lower oxygen levels in their intestines (Kawasaki et al. 2006).
Recent research has also demonstrated that the utilization of Bifidobacterium as probiotics,
reduces the impacts of Crohn’s disease and other inflammatory bowel diseases (Ghouri et al.
2014). A recent study comparing the changes in microbiota between high-fat, low-fat and high
and low fat with exercise, demonstrated that the Bifidobacteriaceae family (the family of
Bifidobacterium) was present only in low fat diet mice and undetected in their high-fat diet
counterparts. Curiously, the low-fat diet mice that exercised lowered their total percent of
Bifidobacteriaceae in comparison to the sedentary group (Evans et al. 2014). This could suggest
that fat is being rapidly used in VIP deficient mice (perhaps by the microbiota), when compared
to HET or WT, leaving a low-fat environment in the external gastro-intestinal tract allowing for
their survival.
As we continue the analysis down to the genus level, the number of differences increases.
The genus Bacteroides, under the Bacteroidetes phylum, seem to change similarly to their
phylum. Bacteroides levels were statistically higher in the knockout strains when compared to
their WT and HET counterparts. This member of the gut microbiota has been shown to

111
exacerbate Escherichia coli (EHEC) infections in mice. Increasing this microbe during infection
resulted in increased gut permeability and an increase in mortality when compared to mice free
of this genus (Curtis et al. 2014). Bacteroides also produce metallo-β-lactamase which can shield
other microorganisms in the gut from antibiotic attack and even defend pathogens like EHEC
(Stiefel, Tima, and Nerandzic 2015). A rise in this genus in the knockout mice, may lead to a
decrease in antibiotic functionality. The increased gut permeability caused by the lack of VIP
(Wu, Conlin, et al. 2015) may also not be a direct result of the missing VIP, but rather due to the
rise in the Bacteroides genus. The utilization of germ-free VIP -/- mice would be important to
answer this question.
The Bacteroidales S24-7 family is an example of how far we still have to go to
completely understand host microbiota relationships. Out of the total taxonomies identified over
all the strains, this family makes up 22.8% of those reads (figure 29). None of these have been
identified down to the genus level. On top of that only 47 publications are found when searching
“S24-7” on PubMed.gov. Although it has been as widely researched as other microorganisms,
the Bacteroidales S24-7 family plays an important role in the intestines. Research by Evans et al.
and Tomas et al. demonstrates that mice fed a high-fat diet significantly lowered their S24-7
percentage, but the addition of exercise increased it equally between low fat and high fat diet
mice (low-fat diet was still statistically higher than high-fat) (Evans et al. 2014; Tomas et al.
2016). The levels of this family have also been linked to hepatic metabolism and function. Post
partial hepatectomy (removal of 2/3rds of the liver), a rapid increase of S24-7 from 11.1% to
47.7% was observed. Analyzing predicted metabolic pathways from PICRUSt, these researchers
found the S24-7 family in these mice was responsible for an increase in bile acid production
pathways (Liu et al. 2016). In comparison to the WT and HET strains, the KO strains for both

112
males and females had a reduction in the S24-7 bacterium. From the WT to HET to KO the S24-
7 family gradually reduced in percentage (figure 31). This reduction which is opposite of the
change in the Bacteroides may suggest a change in the fat content of the chime. Mass
spectrometry could be utilized in future studies to determine the composition of intestinal chime
in these mouse strains to test this hypothesis.
The change in percentage of the Porphyromonadaceae family and the Helicobacter genus
are similar to the Bacteroides genus. The knockout strains for both sexes increase significantly
when compared to the HET and the WT strains (figure 32). In 2013, decreases in this family of
bacteria was seen in tumor-bearing mice by Zackular et. al. Using antibiotics to manipulate the
microbiota resulted in a decrease in the number and size of tumors in these mice. This suggests a
link between this family and tumorigenesis (Zackular et al. 2013). The increase of this family in
both knockout strains may suggest the elimination of VIP results in resistance to the
development of colon cancers and tumor growth.
The discovery of the Helicobacter genus revolutionized microbiota research, by changing
previously held beliefs that the stomach was a sterile organ (Marshall and Warren 1984). Since
its discovery it has been implicated in a number of gastric cancers, vitamin B12 deficiency,
anemia and ulcer formation (Sheh and Fox 2013). In human patients colonization by
Helicobacter has been characterized mainly with severe bacteremia (De Witte et al. 2016). The
lack of this genera has also recently been associated with disease, with evidence suggesting
balance in its levels may be the key to disease prevention (Otero, Ruiz, and Perez Perez 2014). In
the six strains tested, the Helicobacter genus made up nearly 9% more of the total taxonomic
reads in the male and female knockout strains than in the wild type. Heterozygous mice from
both sexes were only slightly higher than the WT and significantly lower than the knockouts

113
(figure 32). This increase in the KO strains may indicate increased susceptibility towards cancers
and ulcer formation. Previous research suggests VIP KO mice are more vulnerable to colitis
models (Jonsson, Norrgard, and Forsgren 2012), and the presence of this pathogenic strain may
be the reason why.
The Mucispirillum and Alistipes genera both share extremely similar trends in change
between wild type, heterozygous and knockout between males and females. These two strains
impress the importance of utilizing both genders for studies. In the females we see a greater
overall reduction in total percentage in comparison to males by nearly 3% (figure 32). The
Mucispirillum genus was first discovered in murine intestines. Scientists investigating the mucus
layer of the gastrointestinal tract discovered a distinct subgroup that had not previously been
characterized (Robertson et al. 2005). Since its discovery, increase in Mucispirillum levels have
been pinned as an indicator for oncoming colitis as Mucispirillum acts as a mucin degrader and
can provide other microorganisms easier access to the intestinal epithelia (Berry et al. 2012). A
reduction in Mucispirillum levels in knockout mice may suggest higher mucus levels in these
mice as opposed to their wild type littermates. Reduction of the Alistipes genus was found to be
correlated with depression, while an increase has been associated with stress in mice
(Naseribafrouei et al. 2014). In humans, a study conducted by David et al. analyzed the influence
of animal vs plant-based diets. They found that the change to an animal-based diet increases the
abundance of Alistipes and suggested this genus may increase due to its protein fermentative
capacity (David et al. 2014).
The Lachnospiraceae NK4A136 group is a prominent member of the intestinal
microbiota. When compared to the WT and HET strains, the KO strains had statistically lower
amounts of this group. In female knockouts, Lachnospiraceae was reduced by nearly 13%. In

114
males, the change from HET to KO was just as large as the females. From WT to KO though
was only about a 5% decrease. In the gastrointestinal tract, higher levels of this genus have been
shown in children with a reduction in adults (Hollister et al. 2015). Reeves et al. inoculated
germfree mice with Lachnospiraceae and found that the presence of this genus prevented the
colonization of Clostridium difficile. In the United States Clostridium difficile infections affect
nearly half a million people annually (Reeves et al. 2012). This number may be reduced by the
introduction of Lachnospiraceae as a probiotic. In our mouse strains this could suggest that the
knockout mice are more susceptible to disease and infection as compared to the wild type and
heterozygous mice.
The overall changes in taxonomy in the VIP knockout mice are similar between the
genders. The trends of change from WT to HET to KO seem mostly consistent regardless of sex.
There are a few fluctuations at the genus level which indicate differences in total percentage
between males and females. Conclusions drawn from the taxonomic data go along with
previously published VIP research. Our data suggests that the VIP KO mice contain more
bacteria connected with inflammatory bowel disease susceptibility. Previous research has
demonstrated that the induction of colitis in the KO strain, results in a more severe response than
the WT. These research studies did not consider the role played by the intestinal bacterial
communities in inflammation. Therefore, it is entirely plausible that the increased vulnerability
to IBD in the KO mice was an indirect effect of the loss of VIP rather than a direct one. In future
studies, the utilization of germ-free VIP knockout mice could provide an answer to this question,
by eliminating the bacterial component of the equation.
As discussed previously in the introduction section of this chapter, the microbial
community plays an essential role in obesity. Previous studies have demonstrated that in both

115
obese mice and humans, there is a reduction in the total percentage of Bacteroidetes and an
increase in the Firmicutes phylum (Ley et al. 2005; Ley et al. 2006; Murphy, Velazquez, and
Herbert 2015). These changes were also observed in the strains of mice used for this study. In
males, Bacteroidetes levels decreased from WT to HET and increases slightly from WT to KO.
The Firmicutes in the male mice increased from WT to HET and decreased from WT to KO. In
female mice the trend was similar between HET and KO but different in the WT. The WT in the
female mice showed higher Firmicutes than the HET and KO and higher Bacteroidetes than the
KO (figure 34). Analysis of the ratio between Bacteroidetes and Firmicutes demonstrated a huge
increase in both KO strains (figure 35). This data is similar to published VIPKO data where
weights of the knockouts are lower than their wild type littermates.
The influences of the microbiota on host metabolism and its involvement in the gut-brain
axis are based on the diversity of bacteria are make it up. Previous research has linked a
reduction in bacterial diversity to increased disease susceptibility. In the strains tested, we found
that the diversity levels in the knockout strains were significantly lower than their HET and WT
counterparts. This was true when alpha-diversity analysis was completed against the Shannon,
chao1, observed species and the PD whole tree indices. The PD whole tree analysis used
measures not only the species diversity, but also the degree to which they are related. This local
measure of species richness demonstrates that there are a lower number of species within the
knockout strains compared to both wildtype and heterozygous. Interestingly the diversity in the
male wild type strains was widely spread (figure 36). Although the average is still higher than
the KO, the high range of male wild types suggests variety between the wild samples collected,
confirmed in the beta-diversity analysis. The levels of reduced diversity in the knockout strains is
surprising and suggests that VIP plays a major role in modulating taxonomic diversity.

116
The weighted beta diversity in figure 37 demonstrates the differences between all of the
samples analyzed. Three ovals have been placed in the figure to demonstrate a grouping
phenomenon inside the plot. A quick look shows three male wild type samples grouped
separately from the other wild type and heterozygous strains. We suspect these samples are
responsible for the spread within the alpha diversity (figure 36) analysis of their category. This
may be due to males being more susceptible to microbiota changes or an error in previous steps,
like genotyping. A genotyping error may have classified these mice into the wild type category
while they may in fact be knockouts. This could cause a ripple effect and alter all taxonomic,
diversity and metagenome data, but is important to correct if true. These samples will be re-
genotyped to ensure proper categorization. The grouping of the knockout strains together
demonstrates that these populations are very similar to each other and far apart from the wild
type and heterozygous groups. We believe that this similarity suggests a change in the
gastrointestinal environment and a change in the linage of the microorganisms present in the
knockout strains versus the WT and HET, due to the lack of VIP. Interestingly, the close
proximity of the HET and WT mice, indicates that the partial reduction of VIP does not
significantly change the microbial population in comparison to their WT littermates.
The consideration of the intestinal microbiota as an endocrine organ means that changes
in its composition may alter the metabolites that are secreted from it. Changes in taxonomy, as
found amongst our six strains, results in the change of secretions and metabolites. Comparison of
known populations against the KEGG database, predicts a drastic change in the metabolic
pathways. The biggest change is observed in the knockout strains, where we find the greatest
increase in the biotin and riboflavin biosynthesis pathways. Previous studies have demonstrated
that the consumption of a high-fat diet causes a biotin deficiency in mice (Yuasa et al. 2013).

117
Infants fed with formula also result in biotin deficiency (Fujimoto et al. 2005). As previously
hypothesized, we predict this increase in biotin biosynthesis may be due to faster fat uptake by
the host, resulting in a low-fat environment in the intestines, resulting in an increase in biotin
synthesis in the knockout strains. Many riboflavin pathways are location in the nervous system.
An increase in this vitamin has resulted in migraine-headaches in mouse subjects (Butun et al.
2015). The depletion of riboflavin also leads to reduction in ATP levels in cells and an increase
in reactive oxygen species (ROS) (Riboflavin depletion of intestinal cells in vitro leads to
impaired energy generation and enhanced oxidative stress). We hypothesize that the increase in
Figure 39. PICRUSt results interpretation.
Data interpretation suggests an increase in the glyoxylate pathway perhaps due to higher fat
content in the intestines resulting in conversion of fats to pyruvate, which may be funneled
into gluconeogenesis. An increase in gluconeogenesis results in increased glucose
production shunted into the pentose phosphate pathway for NADPH formation. This
anabolic pathway could be used by the microbiota for fatty acid, nucleotide, and other
cellular component synthesis.

118
riboflavin production in the knockout mice alongside the increase in ATP and GTP synthesis
may lead to an abundance of energy for intestinal epithelial cells.
An important observation made is that genotype does directly affect the microbial
community. This research is novel in the testing of a neuropeptide deficiency and its link to the
microbiota. It provides a clearer understanding of just how influential the gut-brain axis pathway
is not just on the host, but also on the microorganisms that reside there. We hypothesize that the
change in taxonomic structure, diversity, and predicted metagenome may be caused by an
increase in fat absorption rates within the knockout strain. This hypothesis would be difficult to
prove as mouse weight data demonstrates that knockout mice are smaller in size, but an increase
in uptake does not directly imply an increase in storage. An important question brought forward
by this research is the impact of the microbiota on VIP research. A number of papers using VIP
knockout mice have published increases in intestinal inflammation and changes in neuronal
patterns. These differences may not be directly related to the loss of VIP but may be due to the
change in the microbial environment itself. This would call into question whether these changes
are a direct or an indirect effect from VIP. We recommend the utilization of germ-free knockout
mice as a method for future research to eliminate this question.

119
3. VIP SIGNALING IN T-LYMPHOCYTES AND EOSINOPHILS
3.1. Introduction
3.1.1. Immune system overview
The mammalian immune system consists of biological proteins, cells, tissues and organs
focused on host defense from foreign pathogenic invaders and “rogue” self-cells. This biological
security mechanism called the immune system, is found throughout the animal kingdom from
fruit flies to humans and immune-like systems even exist in plants and single-celled bacteria.
Like an arms race between warring nations, the immune system and the pathogenic
microorganisms it fights are perpetually evolving, always trying to gain a selective advantage
over one another. The immune system works by first recognizing molecular patterns called
antigens, presented on or secreted by pathogens, like parasites, bacteria and viruses, while
ensuring the body’s own cells remain unscathed, disease and cancer free. Its importance is truly
recognized in immunodeficient individuals, whom possess a reduced potential for clearing
unwanted foreign/self-cells from the host. This condition, where the hosts body is unable to
defend itself against infection for example, can be caused by genetic disorders, cancers and/or
pathogens like the human immunodeficiency virus (HIV). These immunocompromised persons
are susceptible to opportunistic infections, unnoticed in everyday people. Hormones, circadian
rhythm, nutrition and the nervous system are all involved in the regulation of these guardians.
The immune system is categorized into two parts, the innate and adaptive immune
systems. This layered defense is divided by specificity. The innate immune system is the first
responder and is activated upon the identified of microbes by pattern recognition receptors
(PRRs). The cells of the innate immune system respond to stress cytokines and chemotax in
response to infected areas. The innate immune system responds in a generic manner and its

120
defenses are non-specific in comparison to adaptive immunity. The adaptive immune system is
activated by the innate immune system, creating a lag time between pathogen exposure and
adaptive response. This antibody based, or humoral immune response is specific to the antigens
presented to the adaptive immune cells. Adaptive immunity is also crucial for immunological
memory, an essential component of vaccine function.
The extensive distribution of VIP is indicative of its various effects throughout the body.
It has been demonstrated that in the cardiovascular system VIP effects vasodilation and cardiac
output. In the nervous system, VIP influences learning, behavior, and works as a master
circadian regulator in the body. Through the gastrointestinal tract VIP works on motility and
modulates the pancreatic release of insulin and glucagon. In the immune system VIP acts in an
anti-inflammatory aspect, reducing inflammatory marker expression. These effects were made
possible through VIP binding to its two receptors VPAC1 and VPAC2. VIP were first found to
elicit cAMP production in immune cells by O’Dorisio et al. in 1981 (O'Dorisio et al. 1981).
Since then, its receptors have also been found on numerous immune cells like macrophages,
dendritic cells, mast cells, CD4 and CD8 T cells. It’s actions in the immune system have resulted
in its categorization as an anti-inflammatory molecule, downregulating inflammatory cytokines
and reducing Th1 immune responses, discussed later in this chapter.
3.1.2. The innate immune system
Innate immunity provides a polyclonal, immediate, non-specific response to pathogens,
while the adaptive immune system recognizes and responds to a specific antigen. The innate
immune system recognizes pathogen associated molecular patterns (PAMPs) with PRRs in a
specific manner. The integumentary system, considered by many to be a part of the innate
immune system, acts as a physical and chemical barrier between our body and the external

121
world. Its epithelial cells line the insides of our respiratory and gastrointestinal tracts and act as
the first line of defense against foreign invaders. Goblet cells interspersed within the lining of the
epithelial membrane, secrete proteins that make up the mucus layer which traps and removes
harmful substances and opportunistic pathogens. This debris littered mucus is then pushed out by
hair-like extensions, called cilia, on epithelial cells.
The cells of the innate immune system recognize a group of molecular patterns that are
evolutionarily conserved and essential for pathogen survival. These molecular patterns or
pathogen-associated molecular patterns (PAMPs), are recognized by the innate immune system’s
family of receptors called pattern recognition receptors (PRRs). Examples of PAMPs include the
whip-like flagella, which allows for the propulsion of bacteria and the lipopolysaccharide (LPS)
endotoxin, found in the membrane of gram negative bacteria. These receptors work alongside a
group of soluble proteins that stimulate phagocytosis and assist in immune response, called
complement proteins. Leukocytes from patients suffering from autoimmune diseases such as
Sjögren's syndrome, have a reduced ability to phagocytose pathogens (Hauk et al. 2014).
Although it remains to be discovered, it’s possible that VIP may play a role in complement
activation. A subset of the innate immune system, the complement system is made up of more
than 30 soluble proteins produced by hepatocytes in the liver. Circulating in the plasma, these
proteins amplify antibody response and act directly with PRRs, aiding in the lysis and
phagocytosis of pathogens.
Macrophages are a type of resident innate immune cell that infiltrate tissues during
inflammation and remain as immune sentinels protecting against invaders. This cell quickly
phagocytes invading microorganisms detected by the PAMP’s, which have be coated with
complement proteins. A second innate immune cell involved in phagocytosis is the neutrophil.

122
These cells reside in the blood, but are recruited to sites of infection or inflammation by cytokine
and chemoattractant chemicals. Cytokines are small proteins important to cell signaling and can
affect cellular behavior. Inflammation is depicted by redness, pain, swelling and heat and is
promoted by cytokines like interleukin (IL) -1, IL-12, IL-18 and interferon (IFN)-gamma.
Cytokines that work in an anti-inflammatory manner include: IL-4, IL-6, IL-10 and IL-13. Both
macrophages and neutrophils express PRRs in order to detect, engulf pathogens and work
alongside the complement system. They can also detect the Fc region of antibodies produced by
the adaptive immune system, assisting the adaptive immune system in pathogen removal
(discussed in greater detail later in this chapter).
Defense against large multicellular parasites, that cannot be phagocytosed is the
responsibility of neutrophils and eosinophils. These white blood cells aggregate, surrounding
large invaders, where the eosinophils degranulate and rapidly release reactive oxygen (ROS)
species in what’s called the oxidative burst. ROS can degrade cell membranes, damage DNA and
RNA killing invaders. This release of reactive oxygen species from eosinophils can be harmful
to both the pathogens and host tissues. While eosinophils make up nearly three percent of white
blood cells, they are associated with a number of diseases, like asthma. During asthma the
degranulating eosinophils cause unintended damage to the respiratory tract while attempting to
eliminate inhaled pathogens like fungi. Eosinophils, along with other lymphocytes also circulate
in a circadian manner. Their plasma numbers increase during the night and reduce during the
daytime. This circadian synchronization is partially controlled by neurohormones, like VIP.
3.1.3. The adaptive immune system
This second layer of immune defense evolved during the Cambrian explosion over 500
million years ago. This is around the time vertebrate life was dominated by fish and tetrapods

123
(fish out of water) were climbing out of the sea. (Cooper and Herrin 2010). While the innate
immune system is essential for basic defense, the adaptive immune system is more precise and
specifically target pathogens or antigens. The adaptive system is mediated by antibodies, targeted
proteins secreted by B lymphocytes, which assist in cell mediated responses. Adaptive immunity
also has a slower response time and can take days before a full response is mounted. This is
because the adaptive immune system must be presented an antigen by circulating dendritic cells
it recognizes as foreign, which takes time. An adaptive immune response also sometimes leads to
the formation of immunological memory, which is what immunologists take advantage of when
administering vaccines.
The cellular basis of the adaptive immune response are lymphocytes. These immune cells
are concentrated in lymphatic tissues around the body, like lymph nodes, tonsils and the spleen.
These are activated in part by antigen-presenting cells (APCs) like dendritic cells, which
circulate the body and present microbial antigens to inactivated T-lymphocytes. T-lymphocytes
or T-cells derive their name from the thymus, where they develop and mature. Once activated,
these T-cells can help activate B-cells to make antibodies against the invader. B-lymphocytes or
B-cells are differentiated from hematopoietic stem cells in the bone marrow. All of these cells
respond to threats by clonal selection/expansion. Mature B lymphocytes (B-cells), called plasma
cells also introduce antibodies into mucosal secretions. Nearly five grams of one of these
antibodies, Immunoglobulin A (IgA), in secreted into the intestinal tract daily. This antibody
assists in pathogen clearance by blocking bacterial access to epithelial receptors, capturing these
microorganisms in mucosal secretions. Present in breast milk, IgA acts as a prebiotic for specific
commensal bacteria and reduces the virulence of others (PMC3774538).
124
In clonal selection, a diverse set of lymphocytes are created, each possessing a unique
receptor. Through negative selection, any cell that binds with to host MHC peptides undergoes
apoptosis, called clonal deletion. Progenitor T-cells then migrate to the thymus where they
mature and depart as naïve T-cells. This process prevents the formation of T-cells that could
induce autoimmune diseases. For the activation of the surviving mature lymphocytes, dendritic
cells must present complementary antigen on MHC class II molecules. A secondary signal
through the binding of CD28 by CD80 must also be present to initialize activation. Upon binding
to the receptor, the lymphocyte starts to clonally expand. This results in numerous clones, all of
which express matching antigen receptors. This focused approach targets the specific antigen
presented to the T-cell by the dendritic cell. After the antigen has been cleared, these clones
undergo apoptosis, leaving a few effector cells behind. These effector cells stay alive for years,
ready for expansion in case the antigen is seen again. Although the process behind this memory
cell formation is not well understood, recent research by Youngblood et al. has demonstrated that
memory cells display particular DNA methylation profiles, not seen in cells that undergo
apoptosis (Youngblood et al. 2017).
Both innate and adaptive systems work together to protect the host from pathogens. The
innate responses are activated directly by the PAMPs, while the stimulation of the adaptive
immune arm is done by dendritic cells. Occasionally these safety mechanisms protecting the host
can turn against their master, resulting in sometimes fatal autoimmune diseases. This includes
diseases such as type 1 diabetes, where the immune system destroys insulin producing pancreatic
cells, or rheumatoid arthritis, where antibodies attack the linings of joints. Current treatments for
these conditions generally focus on immune system reducing, similar to how asthma and other
inflammatory diseases are treated. The protein of focus in our laboratory, VIP, has been

125
implicated in a number of these immune disease. For instance, research by Martinez et al. has
shown that lower levels of VIP may be an early indicator of arthritis (Martinez et al. 2014).
3.1.4. VIP in the immune system
A look into the expression profiles of VIP receptors in the immune system can give us
insight into the functions of VIP as an immune modulator. In the immune system, the VIP
protein plays a number of roles in both the innate and the adaptive immune systems. VIP is
delivered to immune organs by VIPergic nerves, secreted by epithelial cells and by lymphocytes
themselves. The production of cAMP through the addition of VIP to immune cells in 1981, by
Guerrero et al. and O’Dorisio et al., was the first indication of the existence of VIP receptors on
lymphocytes (O'Dorisio et al. 1981; Guerrero et al. 1981). qRT-PCR and ELISA analysis by
Gomariz et al. demonstrates that human VIP mRNA and protein is produced and present in CD4
and CD8 T-cells and B-cells (Gomariz et al. 1992; Gomariz et al. 1990).
Throughout the immune system, VIP functions as a potent anti-inflammatory molecule,
switching from a proinflammatory Th1 response to an anti-inflammatory Th2 response (Voice et
al. 2003). Inflammation results in the secretion of chemokines and cytokines that induce the
chemotaxis of several immune cells to the inflammatory site. VIP works to block these
pathways, causing a reduction in inflammation. Activated macrophages secrete proinflammatory
cytokines like IL-6 and IL-12, which are inhibited by the activation of the VPAC1 receptor.
Research by Delgado et al. shows the reduction in cyclooxygenase (COX)-2 expression with the
addition of VIP (Delgado et al. 2004). Daily intraperitoneal injections of VIP in mouse colitis
models showed a reduction in TLR expression on macrophages and dendritic cells. The drop in
these expression levels reduces the ability of these innate immune cells to respond to pathogens,
reducing inflammation (Gomariz et al. 2005). VIP has also been coined a macrophage

126
deactivating factor, where primarily through VPAC1 and cAMP it inhibited proinflammatory
cytokine production and reduce macrophage response in disease (Delgado, Munoz-Elias, et al.
1999).
The primary connection between the innate and adaptive immune systems are dendritic
cells. The presentation of processed extracellular antigen by dendritic cells, activates CD4 T-
cells. This activation requires two signals: the binding of the major histocompatibility complex
(MHC) class II to the T-cell receptor (TCR) and co-stimulation by the APC. This co-stimulation
is done by the binding of CD28 to CD80/86. Together the CD80 and CD86 proteins make up the
B7 protein on the APC. Studies conducted by Delgado et al. have demonstrated that VIP reduces
the expression levels of CD80 and CD86, lessening the dendritic cells capacity to activate CD4
T-cells and acting in an anti-inflammatory manner (Delgado, Sun, et al. 1999).
Naïve T-cells or Th0 cells, transform into either Th1, Th2, Th17 or Treg, depending on the
cytokines they are exposed to by the dendritic cell. This is to ensure a proper response to the
diverse type of pathogens our bodies encounter. Th1 cells function to clear intracellular
pathogens or cellular immunity. This pro-inflammatory response assists macrophages and
cytotoxic (CD8+) T-cells, to eliminate host cells infected with intracellular pathogens like
viruses and/or malignant cells (Yoshimoto et al. 1998). Th2 cells work to clear extracellular
pathogens like parasites and work with humoral immunity. Th2 response is an anti-inflammatory
response, the imbalance of which can cause tissue thickening and is linked with allergic diseases.
The Th2 response activates mast cells and eosinophils and increases mucus production. Both Th1
and Th2 responses, are self-promoting and their cytokines act in a positive feedback loop,
promoting more of that response while continuing to inhibit the other. Th17 cells assist in
autoimmunity and help in the clearance of certain extracellular pathogens. This pro-

127
inflammatory subset inhibits the differentiation of T regulatory (Treg) cells (Bettelli et al. 2006).
Treg cells suppress the immune response, preventing damage to the host, and build tolerance to
communal microorganisms (Korn et al. 2009). This allows for a symbiotic relationship with the
microbes that call reside on the human body.
The Th2 skewing ability of VIP is well documented. Ganea et al. demonstrated both in
vitro and in vivo that VIP acted to shift cells towards the Th2 lineage (Ganea, Rodriguez, and
Delgado 2003). To determine the receptor responsible for this shift receptor knockout mice were
used. Goetzel el al. demonstrated that in mice deficient in the VPAC2 receptor, the Th1 response
was prominent (Goetzl et al. 2001). In contrast, in CD4 T-cell VPAC2 transgenic mice
(overexpressing the VPAC2 receptor) by Voice et al., the Th1 response was reduced and the
immune system of these mice skewed towards the Th2 response. These research studies
demonstrate the importance of the role of the VPAC2 receptor and its abundance in T-cell
differentiation.
The chemotaxis of these Th1 and Th2 T-cells is also affected by VIP. This is not just due
to the Th2 skewing ability of VIP, but by its effects on dendritic cells. Jiang et al. studied the
immunoregulatory effects of VIP on chemokines and survivability markers, CXCL10 and
CCL22. Both of these proteins are secreted by dendritic cells and interact with Th1 (CXCL10
interacts with CXCR3) and Th2 (CCL22 acts on CCR4) cells. Dendritic cells isolated from the
spleens of male BALB/c mice were cultured with the VIP protein. Another group of the same
mice received intraperitoneal injections of VIP, 16 hours after which CXCL10 and CXCR3
levels were measured by ELISA. VIP was found to down regulate the secretion of CXCL10 and
increase the secretion of CCL22 both in vivo and ex vivo (Jiang, Jing, and Ganea 2002). The Th2
skewing effect of VIP, can impact numerous other bodily functions. For instance, Wolf et al.

128
demonstrated that Th2 cells acted as protectors of central nervous system tissue from secondary
injury (Wolf et al. 2002).
Th17 cells are a T-cell subset which secretes proinflammatory cytokines. These cells are
activated by extracellular pathogens. Th17 cells have been implicated in a number of autoimmune
diseases such as multiple sclerosis, rheumatoid arthritis and type 1 diabetes. In a type 1 diabetes
mouse model using non-obese diabetic mice (NOD), the intraperitoneal injection of VIP reduced
the expression profile of Th17 cells and delayed the onset of type 1 diabetes (Jimeno et al. 2010).
For the autoimmune disorder, rheumatoid arthritis, VIP acts in a therapeutic manner, reducing
inflammation and decreasing abnormal immune response. Recent research by Jimeno et al.
suggests this may be due the downregulation of cytokines that enhance the pathogenic
phenotypes of Th17 cells (Jimeno et al. 2015).
Understanding the roles that each of the two VIP receptors (VPAC1 and VPAC2) play in
T cell biology is important for gaining a better understanding of how VIP acts. The role VIP
plays in T cell morphology is well documented as described in the previous section. Previous
studies conducted by Dorsam et al. have demonstrated the differential regulation of nearly 350
gene targets in both resting and activated murine CD4 T-cells by VIP (Dorsam et al. 2010).
Further analysis of these gene pathways by Steve Wanjara using qRT-PCR demonstrated
increases in EGFR, APP, ADAM15, Grb7, PAK1 and Snail1 over 24 hours after VIP
introduction (unpublished data).
This revelation opens the door to determining which of the two receptors is responsible
for these changes. To fill this gap in knowledge, this author worked on a research project with
Travis Van Der Steen (V. D. Steen et al. 2016). Contributions included cAMP analysis of human
T-cells lines to determine cAMP response from agonists for each receptor. The T-cell lines used
129
included Hut-78 and Molt-4 cells. An epithelial cell line, MCF-7, was also used as a positive
control. The Hut-78 cell line exclusively expresses VPAC1 mRNA, while Molt-4 cells primarily
express VPAC2 mRNA as confirmed by qPCR (Xia et al. 1996).
3.1.5. VIP in asthma
Asthma is pulmonary disease that affects an estimated 39.5 million Americans, including
10.5 million children. The innate and the adaptive immune systems work together to protect us
against a number of respiratory diseases. Some of these diseases, like allergic asthma, are the
result immune triggers to non-pathogenic antigens like pollen or pet dander. VIP protein is
plentiful in the respiratory system and is secreted by nerve fibers that innervate both the lungs
and the arteries around them (Dey, Shannon, and Said 1981). In the respiratory tract, VIP acts as
a potent airway and pulmonary artery dilator, emerging as a potential treatment for
cardiopulmonary disorders.
Szema et al. used VIP knockout mice to gain a better understanding of the role of VIP in
asthma. They discovered that mice lacking VIP were more susceptible to asthma in comparison
to their wild type counterparts (Szema et al. 2011). The addition of VIP into tracheobronchial
smooth muscle resulted in its relaxation and bronchial dilation (Lundberg et al. 1984). It was
shown to counteract the effects of histamines and assist in allergy relief (Groneberg, Springer,
and Fischer 2001). VIP knockout mice were shown to have easily triggered bronchospasms with
high inflammatory cytokine levels in the bronchoalveolar lavage (BAL). Interestingly, the
intraperitoneal reintroduction of VIP eliminated these phenotypes over a two-week period
(Szema et al. 2006).
To better understand the VIP pathway responsible for its effects on the respiratory tract
receptor knockout mice have been used. Research by Samarasinghe et al. has demonstrated that
130
three days post-allergen challenge, mice lacking the VPAC2 gene have significantly reduced
eosinophilic response in the BAL. Interestingly, the eosinophils in the tissues, as well as other
immune cells, were not nearly as effected by the lack of VPAC2 signaling (Samarasinghe,
Hoselton, and Schuh 2010a). Another research article by Samarasinghe et al. demonstrated the
importance of VIP in asthmatic response. Here Amali Samarasinghe demonstrated in wild type
mice via immunohistochemistry (IHC), that within three days following antigen challenge, the
amount of VIP present in the lungs decreases radically. During this time the eosinophils invade
the lung and attempt to clear out the antigen (Samarasinghe, Hoselton, and Schuh 2010b). This
suggests that the presence of VIP acts as a shield, preventing the infiltration of eosinophils into
the BAL, while its ablation allows for eosinophilic invasion. Figure 39 shows the reduction in
VIP protein after allergen challenge and an increase in eosinophil numbers in the BAL during
that time.

131
Figure 40. The localization of VIP throughout the alveolar epithelium during allergen
challenge.
This IHC VIP stain (brown) demonstrates the change in VIP levels after allergic response.
The three columns represent epithelial tissue, smooth muscle and blood vessels. Reduction in
VIP levels is seen in all tissue samples on day 3 and returns by day 14. Line graphs of
eosinophil numbers in BAL follow the opposite pattern with an increase in number at day 3
and reduction by day 14. Figure from (Samarasinghe, Hoselton, and Schuh 2010b)

132
The reduction in eosinophil numbers in VPAC2 KO mice opens a gap in knowledge.
Why are there fewer eosinophils present in the BAL of the VPAC2 deficient mice when
compared to wild type? A hypothesis put forward from this observation suggested this reduction
may be due to the hinderance of eosinophil production within the bone marrow of VPAC2 KO
mice. To test this, bone marrow cells from VPAC2 KO and WT mice were obtained and
differentiated into eosinophils. First published in 2009, Dyer et al. demonstrated different rates of
eosinophil differentiation in toll like receptor (TLR) 3 knockout mice (Dyer, Percopo, and
Rosenberg 2009). These experiments were used as guidelines to determine the impact of lack of
VPAC2 on eosinophil generation.
3.1.6. Eosinophils and T-cells in IBD and immune cell trafficking
Eosinophils are distinguishable by large granules held within their cytoplasm and their
bilobed nucleus (figure 49). These innate immune cells mature in the bone marrow where they
are differentiated from hematopoietic stem cells (HSCs). HSCs, which give rise to all blood
cells, differentiate into eosinophils when exposed to certain cytokines, such as IL-5, a system
which our research group manipulated to create in vitro eosinophils from mouse bone marrow
cells (3.2.3) (Lampinen et al. 2004). Recent research has pointed to a connection between
inflammatory bowel diseases (IBD) and eosinophil migration to the gastrointestinal tract. The
inflammatory process of these diseases involves a number of inflammatory immune cells such as
eosinophils and T-cells. Patients suffering from IBD present more active eosinophils than
controls. During IBD remission, these numbers remain high, but the eosinophils present a resting
phenotype (Lampinen et al. 2005).
In the bone marrow, eosinophils are derived from CD34+ pluripotent HSCs. Eosinophils
develop in response to IL-5 and IL-3, after which they are released into the blood stream

133
(Sitkauskiene et al. 2004). A number of chemo attractants induce chemotaxis in eosinophils, such
as the eotaxin group. Serum analysis of patients suffering from IBD have demonstrated elevated
levels of eotaxin (Chen et al. 2001; Mir et al. 2002). The expression of these chemo attractants
and the secretion of IL-5 (some by T-cells and mast cells), which increases during inflammation,
in the GI tract result in the recruitment of eosinophils to the alimentary canal (Mishra et al.
1999). Biopsies taken from patients with active IBD found larger numbers of eosinophils
present, with a larger number degranulated when compared to controls (Garcia-Zepeda et al.
1996). The explosive degranulation of eosinophils expels cytotoxic granule cationic proteins (for
example: eosinophil cationic protein, eosinophil peroxidase, and eosinophil-derived neurotoxin)
which can damage local tissues (Gleich and Adolphson 1986). Attempts at reducing eosinophilic
response in IBD by using antibodies to IL-5 showed a reduction in intestinal inflammation and
suggest a possible therapy to counter IBD (Lampinen et al. 2001).
T-cells which assist in eosinophil recruiting are also actively involved in IBD (Carvalho
et al. 2003). Recent research has pointed to an increase in the number of CD4+ T-lymphocytes in
the intestinal walls of patients suffering from IBD. T-cell generation starts with the migration of
HSCs from the bone marrow to the thymus. Here, T-cells develop specific T-cell markers, such
as CD3, CD4, or CD8. Through positive selection, which occurs in the thymus cortex, CD4 and
CD8 cells are allowed to survive. In the medulla of the thymus, negative selection allows for the
removal of self-reactive T-cells which bind with high affinity to self-antigens (Sprent et al.
1988). Recent studies have demonstrated the importance of these cells in IBD pathology
(Zenewicz, Antov, and Flavell 2009).
The influx of T-cells to inflamed GI tissues suggests a key role in IBD pathogenesis.
Research by Smids et. al, focused on profiling intestinal T-cells in IBD patients and found higher

134
percentage of CD4+ and Tregs when compared to healthy controls (Smids et al. 2018). These T-
regs for example were also shown to have altered properties in IBD patients (Muzes, Molnar,
and Sipos 2012). Utilization of animal disease models for IBD, shows an increase in mortality
when T-cell populations were removed (Kuhl et al. 2002). Similarly, IBD patients who are also
infected with HIV, and in turn reduce numbers of CD4+ T-cells, demonstrate a reduce
inflammatory profile compared to controls (Viazis et al. 2010). These reports have resulted in the
utilization of drugs to target CD4+ T-cell trafficking and reduce cell numbers to manage IBD
(Mosli, Rivera-Nieves, and Feagan 2014). The intestinal microbiota differs greatly between
individuals and its composition is greatly dependent on genetics, diet, and the environment.
Dysregulation of the relationship between the microbiota and the immune system (discussed in
the previous chapter), plays an important role in determining the immune response during IBD
(Larmonier et al. 2015).
3.2. Materials and methods
3.2.1. Animal cell culture
Three tissue culture cell lines were used for these experiments all of which were
purchased from the American Type Culture Collection (ATCC, Manassas, VA). They included,
Molt-4, Hut-78 and MCF-7 cells. Molt-4 cells are a human T-lymphocyte cell line derived from
a 19-year-old male patient, and primarily express the VPAC2 receptor mRNA. Hut-78 cells are
another Homo sapien T lymphocyte cell line, which were derived from a 53-year-old male, and
solely express the VPAC1 receptor mRNA. The MCF-7 cell line is an epithelial cell like taken
from the mammary glands of a 69-year-old female. MCF-7 cells express both VPAC1 and
VPAC2 receptors.

135
These cells were cultured according to ATCC guidelines. Both the Hut-78 and Molt-4
cells were cultured in 89% Roswell Park Memorial Institute medium (RPMI-1640, GE Life
Sciences, Pittsburgh, PA), with 10% characterized fetal bovine serum (chFBS) and 1%
100µg/mL penicillin/streptomycin (penn/strep). During culturing, these non-adherent cells were
washed off their individual flasks with phosphate buffer solution (PBS) and centrifuged for 5
minutes at 300 x g. They were then stained with the living cell exclusion dye, trypan blue,
counted using a hemocytometer and reseeded to continue the culture. Both cell lines were
cultured twice a week at a concentration of 300,000 cells/mL (M and W), and at 200,000
cells/mL on Fridays.
The MCF-7 cells were cultured in ATCC-formulated Eagle's Minimum Essential
Medium (EMEM, GE Life Sciences, Pittsburgh, PA), also containing 10% chFBS and 1%
100µg/mL penn/strep. This adherent cell line was cultured three times a week (M, W, and F).
The cell layer was rinsed with PBS to remove any residual media, and trypsin-EDTA solution is
added to the flask. After a 5 to 10-minute incubation, the cells were observed to ensure
dispersion from the flask and centrifuged. These cells were centrifuged at 300 x g for 5 minutes,
resuspended in fresh EMEM media and reseeded.
ATCC guidelines were followed for culture conditions and cryopreservation. All three
cell lines were cultured in an incubator maintained at 37°C with a 95% air and 5% carbon
dioxide (CO2) atmosphere ratio. Cryopreservation freeze media was composed of 95% complete
growth media (medium, chFBS and penn/strep) and 5% dimethyl sulfoxide (DMSO), followed
by storage in liquid nitrogen.

136
3.2.2. cAMP assay
3.2.2.1. Preparation
For this experiment, Hut-78, Molt-4 and MCF-7 cells were used. In preparation for the
cAMP assay, all three cell lines were centrifuged, counted and resuspended into 2 mL of Hank’s
balanced salt solution (HBSS) buffer (HBSS + 0.5% bovine serum albumin (BSA)) at a
concentration of 0.5 x 10^6 cells/mL. To each sample 750 µM of isobutylmethylxanthine
(IBMX), a phosphodiesterase inhibitor, was added to prevent cAMP degradation. The cells were
then incubated at 37°C for 45 minutes. Seven different sample groups were used for each cell
type in triplicate. These sample groups included:
1. HBSS (negative control)
2. VIP 10^-6 or VIP 10^-10 (test)
3. VIP 10-28 10^-6 (VIP antagonist)
4. [Ala2,8,9,11,19,22,24,25,27,28]-VIP (VPAC1 agonist test)
5. Bay 55-9837 (VPAC2 agonist test)
6. DMSO (VIP vehicle negative control)
7. Forskolin (50 uM final concentration) (positive control)
These samples were incubated at 37°C for 30 minutes in a 24 well plate, before 1 mL of
0.2 M hydrochloric acid (HCl) was added to each well. The 24 well plate was then placed on a
shaker for 30 minutes at room temperature. After the thirty minutes, the cells were frozen at -
20°C or kept cool at 4°C before performing the cAMP ELISA.
3.2.2.2. ELISA
The Cayman chemical (Ann Arbor, MI) cyclic AMP enzyme-linked immunosorbent
assay (ELISA) kit was utilized to determine cAMP concentrations within the cultured cells. The
24 well plate was thawed and the mixture was triturated. The plate was then centrifuged at 1000

137
x g for 10 minutes and the supernatant was used to determine cAMP levels. Eight 1:3 serial
diluted sample standards were used starting with 750 pmol/mL and ending with 0.3 pmol/mL.
These standards were used to uncover cAMP levels in each of the test groups.
3.2.3. Bone-marrow derived eosinophils
3.2.3.1. Day 0
The legs from sacrificed mice were isolated with a focus on sterility. The cut was made
above the head of the femur and at the distal articular surface of the tibia. Once isolated, the tibia
and the femur were separated, and any tissue remaining and was scraped off. The top and bottom
of the femur and the tibia where cut, allowing access to the bone marrow inside the tubular
middle section of the bones. Held by forceps, the bone marrow was flushed out by a needle and
isolation buffer (PBS with 2% cfFBS and 1 mM EDTA added). Once the redness in the bones
was no longer visible, the isolation buffer and the cells inside it was passed through a 70 µm
filter. The media was then centrifuged at 300 x g for 5 minutes.
Red blood cell removal and cell counts were performed before the bone marrow cells
were cultured. This was done by removing the media after centrifugation and resuspending the
pellet in 3 mL of 1x red blood cell (RBC) lysis buffer (eBiosciences ThermoFisher, Waltham,
MA). This was vortexed and incubated at room temperature with regular hand inversions for 3
minutes. Forty-seven mL of PBS (1x) was added for a total volume of 50 mL. These 50 mL were
passed through another 70 µm filter and centrifuged. The pellet was then resuspended in bone
marrow media (80% RPMI, 20% chFBS, 1% penn/strep, 1% glutamine, 1mM sodium pyruvate
and 50 µM beta-mercaptoethanol (β-ME). After trituration, the cells were counted and seeded
into bone marrow media along with 100 ng/mL (1x) stem cell factor (SCF) and 100 ng/mL (1x)
fms-like tyrosine kinase 3 (FLT-3). This was placed into a 37°C incubator with an atmosphere

138
setting of 5% CO2 and 95% external air. These steps are visualized in figure 40 as shown by
Madaan et al..
3.2.3.2. Day 4, 8, 10, 12 and 14
Four days after the initial seeding of the bone marrow cells, the cells were centrifuged
and counted. The cells were removed from the flask and centrifuged at 300 x g for 10 minutes.
Half of the conditioned media was repurposed for resuspension and reused in the same flask.
Only on day 8 are the cells moved to a new flask. After counting the cells, they were
resuspended in half of the total volume of fresh bone marrow media with 2x interleukin-5 (IL-5)
spiked in. The cells and the new media were added to the conditioned media and incubated for 4
Figure 41. Visualized bone marrow isolation protocol.
Bone marrow isolation steps demonstrated by (Madaan et al. 2014). Each step demonstrates
the processes of flushing bone to obtain cells for culture.

139
or 2 days. On day 14, the cells were analyzed by flow cytometry and cytospins to ensure
eosinophil differentiation. The complete protocol is visualized in figures 41 and 42.
Figure 42. Bone marrow derived eosinophil generation protocol.
Steps performed over a 14-day period to obtain eosinophils from bone marrow.
Figure 43. cAMP ELISA standard curve.Figure 42. Bone marrow derived eosinophil
generation protocol.
Steps performed over a 14-day period to obtain eosinophils from bone marrow.

140
3.2.4. Flow cytometry
To confirm eosinophil differentiation from bone marrow cells, an anti-sialic acid-binding
immunoglobulin-like lectin F (Siglec-F) (CD170) -phycoerythrin (PE) and isotype control
antibodies was used for cellular staining. A total of 30,000 events were counted, with 1 million
cells resuspended in flow binding buffer (1% BSA and PBS). These cells were incubated with
their respective antibody, with one cells alone negative control without any antibody, for 30
minutes at 4°C in the dark to prevent photobleaching. After antibody staining, the cells were
washed with 3 mL of PBS twice and centrifuged at 300 x g. These cells were resuspended into
200 µL of binding buffer and analyzed using the BD Accuri C6 Plus (San Jose, CA) flow
cytometer.
3.3. Results
3.3.1. cAMP
Microarray analysis by the Dorsam laboratory has demonstrated changes in transcriptome
of activated and resting mouse CD4 T-cells. This revealed that over 530 transcripts were
modulated by VIP binding (Dorsam et al. 2010). What this study didn’t show, was which
receptor was responsible for these changes. The two VIP receptors have previously been
implicated in the chemotaxis of human T cells (Schratzberger et al. 1998). Contrary to this
finding, the chemotaxis of the Hut-78 cell line, which exclusively express VPAC1 mRNA, are
repelled by VIP (Xia et al. 1996). This change in cellular motility could be caused by a cAMP
response due to VIP receptor signaling.
To discover this, inactivated T-lymphocyte cell lines were used to determine the
differences in cAMP response between the two VIP receptors. To accomplish this, three cell
lines, including 2 T-cells and 1 epithelial cell line, were tested. Each cell line was exposed to a

141
concentration of VIP known to elicit the highest cAMP response, along with a VPAC1 agonist
(V1 in graphs), VPAC2 agonist (V2 in graphs), and positive (Forskolin) and negative controls
(H2O and DMSO). DMSO is used as a vehicle control for the VIP protein. Forskolin is a tool to
increase cAMP levels by the direct activation of the adenylyl cyclase enzyme. The standard
curve generated from one of the ELISA’s is displayed in figure 42 with a linear trend line
equation of 𝑦 = −0.637 ln 𝑥 + 1.5592 and an r2 values of 0.9961. This r2 value is consistent
between cAMP assay runs.
Figures 44, 45 and 46 demonstrate the cAMP changes in each of the three cell lines tested
with error bars representing SEM values. In the Hut-78 cells, no distinguishable change between
the different test groups was seen. The Molt-4 cells did demonstrate higher amounts of cAMP
from the VPAC2 agonist in comparison to the controls but was not statistically significant. To
remove any concerns over peptide/agonist viability/functionality, the cAMP assay did show an
increase in cAMP production in MCF-7 cells from VIP, VPAC1 agonist, VPAC2 agonist and
forskolin. In conclusion the effects of VIP on inactivated T-cells are not statistically significant
but a slight increase in Molt-4 cells by the VPAC2 agonist is detected. The MCF-7 epithelial cell
line seems more susceptible to VIP/receptor agonist induced production of cAMP than the T-cell
lines.

142
Figure 43. cAMP ELISA standard curve.
A line graph of known cAMP concentration serial dilutions to determine unknown
concentrations. Each dot is a plotted point with a plotted trendline with an R2 value of 0.9961.

143
Hu
t-78 H
2O
Hu
t-78 D
MS
O
Hu
t-78 V
IP 1
0-1
0
Hu
t-78 B
ay 5
5-9
837 (
V2)
Hu
t-78 A
la -
VIP
(V
1)
Hu
t-78 F
ors
ko
lin
0
1
2
3
4
5
7 5
8 0
8 5
9 0
9 5
1 0 0
c A M P c o n c e n tra t io n in H u t-7 8 c e lls
pm
ol/
mL
Figure 44. Changes in cAMP concentration in Hut-78 cells by VIP.
This bar graph depicts pmol/mL of cAMP levels in the Hut-78 T-cell line which only contains
VPAC1 receptors. H2O and DMSO are negative controls with forskolin acting as the positive
control. SEM values are plotted above each bar.
Figure 45. Effects of VIP signaling on cAMP in Molt-4 cells.Figure 44. Changes in cAMP
concentration in Hut-78 cells by VIP.
This bar graph depicts pmol/mL of cAMP levels in the Hut-78 T-cell line which only contains
VPAC1 receptors. H2O and DMSO are negative controls with forskolin acting as the positive
control. SEM values are plotted above each bar.

144
Mo
lt-4
H2O
Mo
lt-4
DM
SO
Mo
lt-4
VIP
10-6
Mo
lt-4
Bay 5
5-9
837 (
V2)
Mo
lt-4
Ala
- V
IP (
V1)
Mo
lt-4
Fo
rsko
lin
0 .0
0 .5
1 .0
1 .5
2 .0
8 0
1 0 0
1 2 0
1 4 0
c A M P c o n c e n tra t io n in M o lt-4 c e lls
pm
ol/
mL
Figure 45. Effects of VIP signaling on cAMP in Molt-4 cells.
Bar graphs are representative of cAMP concentration within Molt-4 cells. The small Y-axis
demonstrates low endogenous cAMP levels. VIP, VPAC2 agonist (V2), and VPAC1 agonist
(V1) show no significant change over control. Error bars indicate SEM values.

145
MC
F7 H
2O
MC
F7 D
MS
O
MC
F7 V
IP 1
0-6
MC
F7 B
ay 5
5-9
837 (
V2)
MC
F7 A
la -
VIP
(V
1)
MC
F7 F
ors
ko
lin
02468
1 0
5 0
1 0 0
1 5 0
2 0 0
3 0 03 5 04 0 04 5 05 0 05 5 0
c A M P c o n c e n tra t io n in M C F -7 c e lls
pm
ol/
mL
Figure 46. Impact of VIP signaling pathway on MCF-7 epithelial cell line cAMP
levels.
MCF7 H2O and DMSO bar graphs demonstrate endogenous cAMP levels and control for
forskolin respectively. Increases in cAMP are caused by VIP and both receptor agonists with
forskolin confirming assay functionality.

146
3.3.2. Bone marrow eosinophil differentiation
To determine the impact of the lack of the VPAC2 receptor on eosinophil differentiation,
differences in rate of bone marrow eosinophil differentiation were tested using bone marrow
cells from VPAC2 KO and WT mice. As discussed previously, bone marrow cells were obtained
from both strains of mice and incubated with cytokines over 14 days. These cells were counted
during these 14 days to determine changes in differentiation rates. The cells were also visualized
on a microscope whose pictures are displayed in figure 47. Two different seeding concentrations,
5 x 10⁶ and 1 x 10⁶ cells/mL were used for the initial seeding of bone marrow cells. Both seeding
concentrations followed the same culturing protocol.
The cell count results for 5 x 10⁶ cells/mL from sixteen wild type and twelve knock out
replicates are displayed in figure 48 with SEM values. Figure 49 shows cell count results from
nine wild type and three knock out replicates at 1 x 10⁶ cells/mL with SEM values. The p-values
between the two strains were not statistically different for either initial seeding concentration, for
any of the five days where the cells were counted. The 5 x 10⁶ cells/mL flasks reduced in total
cell number over the 14 days and both strains seemed to change numbers in a similar manner.
The 1 x 10⁶ cells/mL initial seed flasks, seemed to increase in total cell number in the middle of
the 14-day study and reduced to about half of the initial seeding concentration by day 14.
Analysis of this data suggests that the rate of in vitro differentiation of eosinophils from bone
marrow precursor cells is not different between the two strains.

147
Figure 47. Changes in cell density during the 14-day differentiation protocol.
Microscopy images of bone marrow cells over the completion of the eosinophil generation
protocol. Changing flasks, as discussed in figure 41 removes a large number of adherent cells.
Pictures were taken after completion of steps per day.

148
0 4 810
12
14
0
11 0 0 7
21 0 0 7
31 0 0 7
E o s in o p h il d if fe re n t ia t io n w ith 5 E 6 c e lls /m L
D a y s
To
tal
ce
ll n
um
be
r
W T
V P A C 2 K O
Figure 48. Eosinophil generation from bone marrow with 25 million seeded cells in 5
mL.
This bar graph depicts cell counts over the 14-day protocol. Black bars are WT samples and
gray bars are VPAC2 KO samples. Error bars depict SEM values.

149
0 4 810
12
14
0
21 0 0 6
41 0 0 6
61 0 0 6
81 0 0 6
E o s in o p h il d if fe re n t ia t io n w ith 1 E 6 c e lls /m L
D a y s
To
tal
ce
ll n
um
be
r
W T
V P A C 2 K O
Figure 49. Changes in eosinophil numbers over 14 days when seeded at 1 x10⁶
cells/mL.
Cell number differences between WT (black) and VPAC2 (gray) differentiation are depicted
as bar graphs.

150
3.3.3. Eosinophil differentiation verification
Cytospins and flow cytometry were used to verify that the seeded bone marrow cells
indeed differentiated into eosinophils. These tests were run on day 14 cells of the experiment.
The cytospun slides were stained with hematoxylin and eosin (H&E) and viewed on a
microscope. Figure 50 demonstrates an example of the cytospin results obtained on day 14. Flow
cytometry experiments were conducted using the BD Accuri C6 with an anti-SIGLEC-F mouse
antibody used to determine eosinophilic differentiation. Figure 51 is demonstrating the shift in
SIGLEC-F expression when compared to isotype control for each sample. In this figure a shift of
96.3% was seen, suggesting a highly enriched eosinophil population. For most of the eosinophil
differentiation runs, a greater than 90% shift was seen when compared to isotype control. These
results suggest that although a difference in eosinophil number is not seen, the cells seeded
initially do become eosinophils by day 14.

151
Figure 50. Cytospin verification of bone marrow derived eosinophils.
Changes in bone marrow cell morphology after 14 days. This picture is a cytospin of the cells
remaining on day 14 stained with H&E stain. The purple bilobed nuclei are characteristic of
eosinophils.
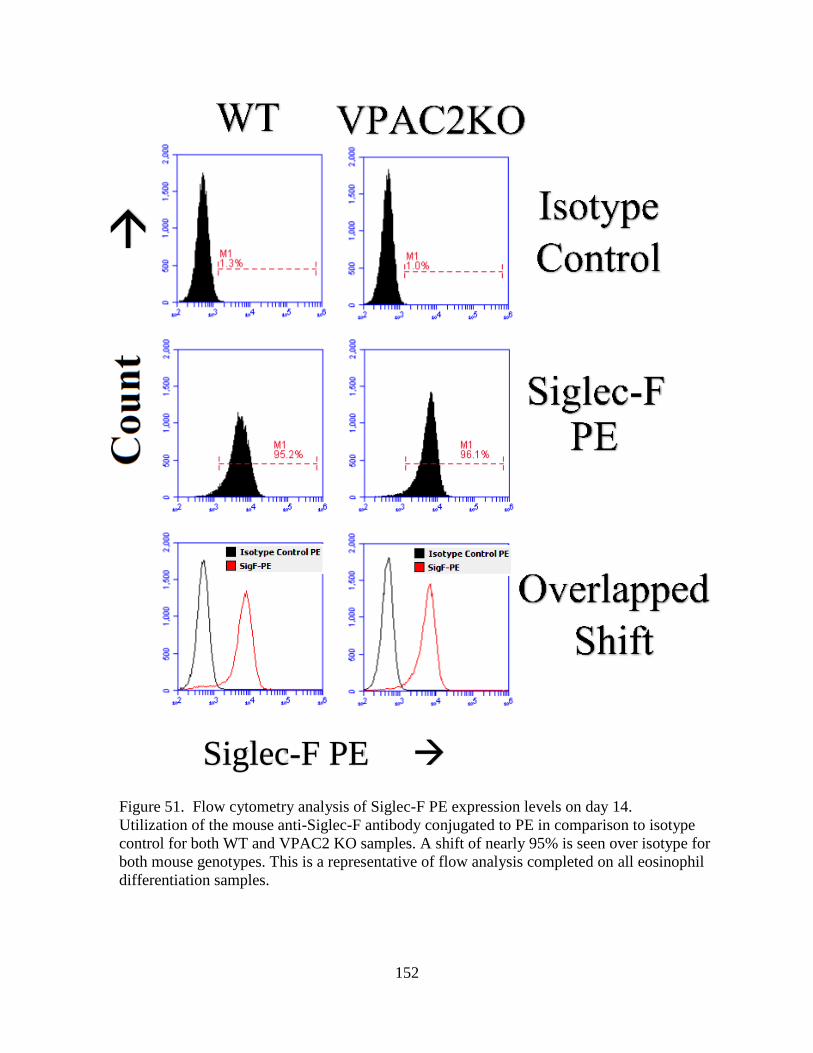
152
Figure 51. Flow cytometry analysis of Siglec-F PE expression levels on day 14.
Utilization of the mouse anti-Siglec-F antibody conjugated to PE in comparison to isotype
control for both WT and VPAC2 KO samples. A shift of nearly 95% is seen over isotype for
both mouse genotypes. This is a representative of flow analysis completed on all eosinophil
differentiation samples.
Siglec-F PE

153
3.4. Discussion
3.4.1. cAMP assay
One of the major finding of this cAMP study was the diminutive cAMP produced by VIP
signaling for the two human T-cell lines, Hut-78 and Molt-4. The change in cAMP was
indiscernible in the Hut-78 cell line. Neither VIP or the two receptor agonists created significant
change in cAMP levels over H2O and DMSO. Previous research by Xia et al. has demonstrated
that the Hut-78 cell line expresses low levels of VPAC1, which may be the reason that no
significant cAMP changes were detected (Xia et al. 1996). A similar trend was seen in the Molt-
4 cells, where cAMP levels did not significantly change between the experimental vs control
groups. As previously reported by Summers et al., the Molt-4 cells only express the VPAC2
receptor (Summers et al. 2003). A slight upwards trend was detected with the addition of the
Bay-55-9837 VPAC2 agonist, which seems logical as only the VPAC2 receptor is expressed on
Molt-4 cells.
This was confirmed by microarray analysis conducted on these two cell lines by Travis
Van Der Steen, which showed no changes in gene expression after exposure to VIP (V. D. Steen
et al. 2016). QRT-PCR analysis by Steve Wanjara with assistance from myself, has demonstrated
that in mouse CD4 T-cells, the addition of VIP upregulates mRNA levels of an EGFR-pathway
(currently unpublished data). This pathway was not upregulated when the same analysis was
done using donor human blood isolated CD4 T-cells. While this makes it difficult to understand
which receptor is responsible for the chemotactic effects of VIP on these cells, it does tell us that
VIP performs different functions between human and mouse CD4 T-cells.
Interestingly, the MCF-7 epithelial cell line demonstrated nearly a 20-fold increase in
cAMP concentration when exposed to VIP. These cells also responded to both receptor agonists

154
which was not seen in either of the T-cell lines. Previous research with these cells has shown that
the addition of VIP, inhibits the growth of this breast cancer line (Moody et al. 2002). The drastic
increase in cAMP in this cell line when compared to the T-cell lines may suggest a greater role
of VIP in the epithelia than in the immune system. Future studies can include the utilization of
other T-cell lines. A previous publication by Dorsam et al. contains a comprehensive list of VIP
receptor expression in human and mouse T-cell lines (Dorsam et al. 2011). This allows for the
utilization of other lines such as H9, which exclusively expresses the VPAC1 receptor (Xia et al.
1996), and Sup T1s, which solely express VPAC2 (Goursaud et al. 2005). Also, the utilization of
CD4 T-cells from VPAC1 and VPAC2 knockout mice, could answer the question as to which
receptor is responsible for changes in the mouse CD4 T-cells. Obtaining cells from knockout
mice would allow for the use of just VIP and remove the agonists from future experiments. qRT-
PCR analysis of knockout CD4 T-cells would also answer the question posed by Steve
Wanjara’s research as to which receptor is altering the EGFR pathway.
3.4.2. Eosinophil differentiation
The results of the 14-day differentiation study from donor bone marrow cells tell us that
between mice lacking VPAC2 and their WT counterparts, there are no significant changes in the
rate of eosinophil differentiation. This lack of change was observed in both 1 x 10⁶ cells/mL and
5 x 10⁶ cells/mL concentrations. Interestingly, the slope of the numbers of cells over the 14 days
differed between these two concentrations. In the 5 x 10⁶ cells/mL experiment a large number of
cells died off within the first four days, with a slight U-shaped decline over the remaining ten
days. There was a trend towards an increase in day 14 in VPAC2KO, suggesting that perhaps if
the experiment was expanded into more days a difference could be visualized.

155
In the 1 x 10⁶ cells/mL cellular concentration, there was cell death between days 0 and 4
as well, but not as great a change in total number as in the 5 x 10⁶ cells/mL. Over the remaining
ten days of the experiment an initial increase in total cell number for both strains was observed,
with a decrease towards the end. As previously mentioned for 5 x 10⁶ cells/mL, on day 14 of the
1 x 10⁶ cells/mL experiment, a large margin of error for the VPAC2KO mice with a trend
towards an increase in that population over WT, was observed. An expansion of the experimental
days may result in a significant change over time.
Analysis of cytospins confirmed that the cells observed on day 14 of the experiments
were indeed eosinophils. The cytospin pictures were very similar to those published by Dyer et
al. (Dyer et al. 2008) confirming the change from bone marrow progenitors to eosinophils. The
sickle shaped nucleus of the cells is a hallmark of eosinophils, with pink spots depicting the
small granules within the eosinophil’s cytoplasm which was observed in bone marrow derived
eosinophils from both strains. Flow cytometry analysis confirmed the cytospin analysis by using
Siglec-F antibody against the derived cells. An average shift of 95% for the Siglec-F receptor
was seen in both WT and VPAC2KO strains throughout the numerous runs. Although Dyer et al.
did not publish the numerical percent shifts over isotype control, the visual change in Siglec-F
decades observed for both strains is extremely similar to ours (Dyer et al. 2008).
This lack in significance of eosinophil differentiation was similar between both strains,
suggesting that perhaps there is no difference in the ability of stem cell progenitors of either
strain to differentiate into eosinophils. The total number of these stem cells between VPAC2KO
and WT may also be similar. A possible explanation for the difference in eosinophilic response
to fungus induced allergic asthma in the VPAC2 knockout as reported by Samarasinghe et al
may be differences in IL-5 levels in either mouse strain (Samarasinghe, Hoselton, and Schuh

156
2010a). Preliminary data gathered by myself using a proteome profiler (R&D Systems,
Minneapolis, MN) has uncovered a fold increase of 2.54 in serum IL-5 levels, which is a major
regulator of eosinophilic endurance and function. IL-5 ELISA work needs to be conducted to
confirm the validity of this preliminary data and hypothesis. Changes in the rate of
differentiation have been published in other knockout mouse models such as miR-223 deficient
mice reported by Lu et al. (Lu et al. 2013) and CCR3 deficient mice published by Sturm et al.
(Sturm et al. 2013). Changes in rate of eosinophil growth in the BALB/c mouse strain has been
demonstrated to be much faster when compared to the C57 BL/6 linage used in our laboratory
(Dyer et al. 2008).
Future aims to explain the delayed arrival of eosinophils in the BAL of VPAC2KO mice
include, the chemotactic capabilities of VIP on eosinophils and the blunted infiltrabilities of
eosinophils in VPAC2KO mice. This could involve analysis of the degranulability of eosinophils
for both strains. The addition of VPAC1, VIP and CRTH2 knockout mice to these experiments
could shed light the functions of VIP and its other receptor. Although eosinophils contain neither
VPAC1 or VPAC2 receptors, research by El-Shazly et al. has uncovered the association of VIP
and the CRTH2 receptor (El-Shazly et al. 2013). It seems this prostaglandin-D2 (PGD2) receptor
(CRTH2) binds VIP (also secreted in an autocrine fashion by eosinophils) and induces
eosinophilic chemotaxis (eosinophilotactis) at levels just below eotaxin, the benchmark for
eosinophil chemotaxis (Rothenberg et al. 1996). Taking these knockouts through the allergic
asthma model could help better understand how these proteins affect eosinophil function.

157
4. ILLUMINATE-MIRNA: PARADIGM FOR HIGH-THROUGHPUT, LOW-COST, AND
SENSITIVE MIRNA DETECTION IN SERUM SAMPLES AT POINT-OF-CARE
SETTINGS
4.1. Introduction
First discovered in the 1990’s, microRNAs (miRNA) are a class of small, non-coding
RNA molecules that are involved in translational gene regulation. These non-coding RNAs are
found in most eukaryotes and account for nearly 5 % of the human genome. Since their
discovery, researchers have uncovered a great deal about the life cycle of miRNAs, of which this
chapter provides a brief overview. Mature miRNA molecules bind messenger RNA (mRNA) and
prevent the translation of mRNA into protein. MiRNAs have also been implicated in various
stages of cancer progression. The changes in profile expression can be used as cancer biomarkers
for various tumor types.
There are many different classifications for small, non-coding RNA molecules, such as
small interfering RNA (siRNA), small nucleolar RNA (snoRNA), ribosomal RNA (rRNA) and
micro RNA (miRNA). Each classification describes the function of that individual group of
small RNA molecules. Between these small RNA molecules are arbitrary distinctions but no
unified agreement upon classification or differentiation (Li and Liu 2011). This results in some
small RNA molecules being classified into multiple categories based upon the researcher’s
discretion. Ribosomal RNA (rRNA) for instance, is a component of the ribosome, which is
approximately 60% RNA by weight and is crucial for protein synthesis as it acts as the
enzymatic catalyst for peptide bond formation inside the cell. Small nucleolar RNAs act as
guides for other RNA molecules (Kiss 2001). For example, the snR30 snoRNA was found by
Lemay et al. to be essential for the 18S ribosome formation in yeast cells (Lemay et al. 2011).

158
SiRNA are similar to miRNA in size and operate within similar pathways. Discovered by
Andrew Fire and Craig Mello, whom received the Nobel Prize for this discovery (Fire and Mello
2006), siRNA interfere with specific gene function and expression by mRNA degradation
(Yoshizawa et al. 2015).
MiRNAs, the focus of this research, function in inhibiting mRNA directed protein
translation. Although similar to other small non-coding RNA molecules, miRNAs form hairpin
loops upon biosynthesis by folding upon themselves due to intramolecular complementary
sequences. The first miRNA to be discovered was lin-4, by Lee et al. in 1993. Lin-4 is essential
in the postembryonic development of the transparent nematode (roundworm) known as C.
elegans (Lee, Feinbaum, and Ambros 1993). So far, we know that a majority of miRNAs are
transcribed by RNA polymerase II and a few by RNA polymerase III (Lee et al. 2004). The
miRNAs transcribed by RNA polymerase III are critical for the regulation of the mammalian cell
cycle, and the cell’s growth and maintenance (Goodfellow and White 2007). Although the bulk
of miRNAs function within the cytoplasm, some extracellular miRNAs are found in carriers,
such as exosomes. Known as circulating microRNA, these molecules are found in whole blood
and plasma or serum. These are found in exosomes, which are used to deliver miRNAs to nearby
tissues and cells (Yeh et al. 2015).
4.1.1. MicroRNA (miRNA) biosynthesis
RNA polymerase II or III transcribe most eukaryotic microRNA genes, generating a
primary transcript or pri-microRNA sequence (Borchert, Lanier, and Davidson 2006). After
transcription, the pri-microRNA sequence folds into a stem loop structure with numerous
unpaired nucleotide sequences throughout the double strand (visualized in figure 51) (Cramer
2004). This pri-microRNA is then processed by Drosha (called the microprocessor) and DGCR8

159
(Denli et al. 2004). These two proteins form a complex known as the microprocessor complex,
which cleaves the 5’ and 3’ ends of the pri-microRNA, releasing a 60 to 70 nucleotide sequence
known as pre-microRNA (Hutvagner et al. 2001). The pre-microRNA is then recognized by a
nuclear export factor known as Exportin-5 (Exp5) (Bohnsack, Czaplinski, and Gorlich 2004).
This Exp5 protein mediates the export of the pre-microRNA molecules from the nucleus and into
the cytoplasm (Yi et al. 2003). These steps are presented in figure 51.
In the cytoplasm, the pre-microRNA molecules encounter Dicer, an endonuclease that is
present in all eukaryotes (Zhang et al. 2002). The product of this Dicer enzyme is known as the
miR:miR*duplex. This duplex carries two strands, one called the guide strand and the other
called the passenger strand (Lau et al. 2001; Schwarz et al. 2003). The miR:miR*duplex carries
two nucleotide 3’ overhangs which are complementary (Rand et al. 2005). The Argonaut enzyme
grabs the duplex and removes the miR*passenger strand leaving the guide strand with its
nucleotides exposed. Once the miR*passenger strand is removed, the Argonaut protein and its
guide strand are known as the miRISC complex (Matranga et al. 2005). This complex then
searches for complementary RNA or DNA sequence for gene silencing. Once a sequence has
been found, transcription/translation is repressed and the mRNA sequence is destabilized (Zeng,
Yi, and Cullen 2003). While recent research has determined how miRNAs are generated, their
regulation and expression still remains largely unknown (Ha and Kim 2014; He and Hannon
2004; Hayes, Peruzzi, and Lawler 2014).

160
Figure 52. Nuclear miRNA biosynthesis steps.
MicroRNA genes are transcribed by RNA polymerase II or III (cut blue oval) into (70-80 bp)
Pri-microRNA, where intro-complementary regions cause the molecule to take on a stem-
loop structure. The Drosha and DGCR8 enzymes cleave its 5’ and 3’ ends generating Pre-
microRNA. The Exportion-5 protein present in the nuclear membrane transports the Pre-
microRNA into the cytoplasm.
Stem Loop

161
Figure 53. Cytoplasmic modifications and protein translation silencing by miRNA.
In the cytoplasm, the ends of the pre-microRNA are cleaved by the Dicer enzyme, which
leaves the miR:miR*duplex with overhangs. This duplex is loaded into the Argonaut protein
which removes the miR*passenger strand, leaving the Argonaut protein with the miR guide
strand. This is known as the miRISC complex, which binds complementary DNA or RNA
sequences silencing translation.

162
4.1.2. MicroRNAs as disease biomarkers
Over the past decade, researchers have found a link between miRNA expression profiles
and disease states in the body (Ebert and Sharp 2012). The link between microRNA
dysregulation and cancer was first established by Calin et. al who demonstrated that more than
half of leukemia patients suffered from the deletion of a microRNA gene region (Calin et al.
2002). Since then, the role of microRNA’s in the regulation of oncogenes and tumor suppressors
has been better established (Stahlhut and Slack 2013). A database linking known microRNAs to
their cancer targets, known as the Tarbase was established by Sethupathy et al (Sethupathy,
Corda, and Hatzigeorgiou 2006). MicroRNA-34A for instance, was shown to inhibit the
metastasis of human gastric cancer, where its expression was down-regulated (Peng et al. 2014)..
The let-7 microRNA family has also been implicated in cancers and neurological
diseases. Research into this thirteen-member family has demonstrated a decline in let-7
expression in lung cancer (Takamizawa et al. 2004), lymphoma and sarcoma (O'Hara et al. 2009)
and ovarian cancer (Dahiya et al. 2008). A more comprehensive list of cancers affected, and the
Let-7 family members involved are listed in table 9 below and on the next page.
Table 9. Let-7 expression levels in different human cancers.
Family member Cancer type
Downregulated ⇊ Up-regulated ⮅
7a Breast
Lung
Melanoma
Pancreatic
Primary pigmented nodular
adrenocortical disease (PPNAD)
Lung
Lymphoma
Ovarian

163
Table 9. Let-7 expression levels in different human cancers (continued).
Family member Cancer type
Downregulated ⇊ Up-regulated ⮅
7b Childhood acute lymphoblastic
leukemia (ALL)
Melanoma
Ovarian
PPNAD
Prostate
Retinoblastoma
Gastrointestinal stromal
tumor (GIST)
Lymphoma
7c Burkitt lymphoma
Lung
PPNAD
Prostate
7d Head and neck squamous cell
carcinoma (HNSCC)
Ovarian
Prostate
7e Ovarian
Prostate
7f Lung
Ovarian
Prostate
Sarcoma
Breast
7g Lung
PPNAD
Prostate
7i Ovarian
Prostate
HNSCC
Lymphoma
Modified table compiled by and obtained from (Boyerinas et al. 2010)

164
As reported by Wu et al., the precise expression levels of let-7 are important for tumor
detection and suppression. These microRNAs are also correlated with numerous oncogenic
pathways. The overexpression of let-7 microRNAs can result in liver damage, an increased
susceptibility to hepatic cancers and obstruction of liver regeneration (Wu, Nguyen, et al. 2015).
This family has also been implicated in the myelination of nerves. Research by Gökbuget et al.
demonstrated that the suppression of notch1 by let-7 was essential for proper myelination of
Schwann cells. In mice with reduced levels of let-7 resulted in a demyelination
phenotype(Gokbuget et al. 2015).
The importance of these microRNA’s in disease regulation also lends to their importance
as biomarkers. Over the past few years, researchers have been pursuing numerous different
methods to quantify microRNA levels in serum as a non-invasive strategy for early diagnosis.
An approach by Liu et al. utilized magnetic microparticles with complimentary sequences to
bind target microRNA’s. The researchers claimed that the device was able to detect as low as 1
fmol of target microRNA in binding buffer (Liu, Zhou, and Xing 2014). Other techniques, such
as one from the RIKEN biological laboratory have also been published. These engineers utilized
complementary DNA strands bound to glass slides to capture desired microRNA’s. Secondary
antibodies with fluorophores were then added to allow for microRNA detection. These
researchers were able to detect a minimum of 0.5 pM of microRNA sample (Arata, Hosokawa,
and Maeda 2014).
In addition to the utilization of hybridization detection methods that are non-enzymatic in
nature, the gold standard for detection is still the enzymatic based quantitative reverse
transcription polymerase chain reaction (qRT-PCR) (Costa, Leitao, and Enguita 2014). Due to
the short length of microRNA samples, additional strategies have been necessary to successfully

165
use qRT-PCR. One of these includes the utilization of stem-loop (SL) primers. The SL primer
allows for superior binding specificity to short nucleotide sequences and easier
access/amplification by the taq polymerase (Tong et al. 2015). Another is the improved isolation
of microRNAs from exosomes. Research by Gallo et al. has demonstrated that in serum a
majority of detectable microRNAs are tightly associated with exosomes. To demonstrate this,
serum samples were separated into two fractions, exosome-depleted serum fraction and serum
containing exosomes fraction. qRT-PCR reactions conducted on both groups showed that the
exosome intact group contained significantly greater amounts of miRNA than the exosome-
depleted samples (Gallo et al. 2012).
A fast and accurate detection platform of microRNAs is important for early detection in
an effort to save lives. However, qRT-PCR reactions are costly and require time (hours/days) to
detect specific microRNA’s in human serum. In order to provide accurate results in point-of-care
settings such as hospitals, more rapid and cost-effective methods are required. To fill this void,
Keerthi Nawarathna Ph.D., an assistant professor at NDSU in the Department of Electrical
Engineering, alongside his graduate student Logeeshan Velmanickam, developed a novel high-
throughput, low-cost microRNA detection platform called iLluminate-miRNA. A collaborative
effort between the Nawarathna and the Dorsam labs was initiated for our lab’s expertise in qRT-
PCR technology. My contributions included conducting miRNA isolation, running parallel qRT-
PCR experiments, teaching Logeeshan molecular biology techniques, weekly lab meetings, and
assistance with writing the manuscript currently under review.

166
4.2. Materials and methods
4.2.1. Micro RNA isolation
For isolation of miRNAs from serum and water, the Sigma-Aldrich mirPremier
microRNA Isolation Column Chromatography kit (St. Louis, MO) was used. Let-7b miRNA (5’
-UGAGGUAGUAGGUUGUGUGGUU - 3’) was purchased from the Midland Certified Reagent
Company (Midland, TX). Let-7b miRNA was spiked into water starting at 1 nM and 10
subsequent ¼ serial dilutions were performed ending with 11.44 fM. Let-7b was also spiked into
human serum obtained from Innovate Research (Novi, MI) at concentrations ranging from 12
nM to 120 fM. Both serum and water samples were also spiked with Let-7c miRNA (5’ -
UGAGGUAGUAGGUUGUAUGGUU - 3’), which differs from Let-7b by a single nucleotide
change, and a random scrambled miRNA sequence (5’ – UGAGGUAGUAGGUUGUAUGGUU
– 3’), both purchased from Midland Certified Reagent Company (Midland, TX), to assess
specificity of the new iLluminate-miRNA detection platform.
The provided Sigma-Aldrich protocol (2017) was followed for isolation. Each sample
concentration was placed in a 2 mL microcentrifuge tube with 700 µL of lysis buffer. Samples
were incubated for 5 minutes with gentle rocking followed by centrifugation at 16,000 x g for 5
minutes. The supernatant was collected into a fresh tube, diluted with equal volume of 100%
ethanol, mixed by pipetting and applied to a binding column. Samples were centrifuged at
16,000 x g for 5 minutes and after decanting the flow-through, a second 100% ethanol solution
was applied to the column and centrifuged as above. A third centrifugation step was performed
to dry the column, followed by the addition of 50 µL of elution buffer and centrifugation
repeated, to eluate purified miRNA. This was stored at -20°C until the first strand cDNA
synthesis step was performed.

167
4.2.2. First strand cDNA synthesis
The Agilent Technologies (Santa Clara, CA) miRNA 1st-strand cDNA Synthesis Kit was
used. First, a polyadenylation reaction was catalyzed by E. coli poly A polymerase and
performed to add poly(A) tail to isolated miRNA. Complementary DNA was then synthesized
from the miRNA template molecules using a poly-T primer, for reverse transcription of newly
generated poly-A tail-miRNA molecules. Samples were placed into a thermocycler for the
following incubation steps.
Polyadenylation
1. 37°C for 30 minutes
2. 95°C for 5 minutes
3. Immediate transfer to -20°C for storage or cDNA synthesis
cDNA synthesis
1. 55°C for 5 minutes
2. 25°C for 15 minutes
3. 42°C for 30 minutes
4. 95°C for 5 minutes
5. Stored at -20°C
4.2.3. qRT-PCR
Analysis of miRNA was performed by reverse transcription PCR (qRT-PCR) analysis
utilizing the Aglient miRNA QPCR Master Mix Kit and using cDNA generated from purified
miRNA samples treated with poly-A polymerase. This kit uses the EvaGreen® dye to analyze
double-stranded DNA amplification. The miRNA qRT-PCR master mix, a universal reverse
primer and a Let-7b specific primer were added together to form a master mix, which was added
to each individual well of a 96-well plate. Complementary DNA samples (4 µL) were added to

168
appropriate wells and the Bio-rad CFX96 Real-Time PCR instrument was used to analyze the
samples. The incubation steps of the machine were as follows:
1. 95°C for 10 min
2. 40 cycles of 95°C for 10 seconds
3. 60°C for 15 seconds.
4. Go to 2, 40 x
5. Melt Curve
a. 65°C to 95°C, in increments of 0.5°C
4.2.4. Percent recovery calculations
Ct values for each diluted sample were subtracted from the lowest Ct value detected in
water or serum (ΔCt). Fold-differences for each diluted sample were calculated by using: 2(-ΔCt),
and % recoveries were calculated in an identical manner as the iLluminate-miRNA (Table 10).
Briefly, fold-differences for each diluted sample (numerator) were divided by its maximum at 12
nM in water (denominator) and normalized by multiplying by the dilution factor.
4.2.5. iLluminate-miRNA miRNA detection
The iLluminate-miRNA platform uses miRNA duplexes in 0.01x TE buffer, containing
isolated miRNA samples hybridized to their complementary DNA. The fluorescently labeled
(Fluoresce) probes are added at 10x excess. This mixture is heated up to 95°C for 5 minutes and
then allowed to cool slowly at room temperature for an hour to allow for complete hybridization.
These samples are then plated onto a T-shaped interdigitated array of microelectrodes (TIAM)
electrode array. Evaporation of the buffer increases the concentration of the miRNA/probe
duplexes within the TIAM electrode array. This focusses the miRNA/probe duplexes into semi-
circle shaped nano-gaps, or “hotspots” within the array where the electric field is enhanced
(Figure 54). The application of a 1000 kHz non-uniform electric field, or dielectrophoresis,

169
simultaneously pushes single stranded DNA molecules away while attracting double stranded
complexes towards the nano-gaps on the TIAM array (Velmanickam, Laudenbach, and
Nawarathna 2016). The size of the nano-gaps also allows for fluorescence enhancement. The
nano-gaps are smaller than the emission wavelength of Fluorescein (512 nm in water), causing
the continuous excitement of the fluorophore up to a billion-fold (Velmanickam et al. 2017).
After hybridization this process took ten minutes for completion. After 10 minutes, images were
obtained using fluorescent microscopy and enhancement intensity was calculated using the
MATLAB software (Natick, MA) conducted by professor Nawarathna’s laboratory.

170
Figure 54. Experimental strategy for miRNA detection method testing.
This outline describes the scheme used to compare qRT-PCR to iLluminate-miRNA (DEP)
technologies where Let-7b was spiked into water or human serum and subsequent serial
dilutions. Eluted miRNA samples were split between the two methods for validation. Time
required for the completion of iLluminate-miRNA was significantly lower than qRT-PCR as
indicated.

171
Figure 55. Nanogap structure and fluorescent enhancement due to nanogap size.
A scanning electron microscopy picture of the TIAM electrode array discussed in section
4.2.5 shows the Y and I shaped structures. The light gray color represents the electrode and
the dark gray color represents the glass slide background. Magnification of the array displays
the small nanogaps or “hotspots” present within the gold array. An artistic rendition of how
miRNA-DNA probe duplexes with attached fluorescein are positioned within the nanogaps is
depicted. The size of the nanogaps in comparison to the excitation wavelength allows for the
enhancement of the fluorescent signal.
Y- structure
I- structure

172
4.3. Results
4.3.1. MicroRNA detection
We present proof-of-concept data showing that the iLluminate-miRNA method was able
to detect Let-7b miRNA in a quantitative and specific manner. To this end, we used water and
human serum solutions, which were spiked with known concentrations of Let-7b miRNA.
Samples were divided equally after column chromatography, measured by the iLluminate-
miRNA and compared to qRT-PCR measurements. It is worth noting the rapid measurement
time and cost-effective nature of the iLluminate-miRNA method relative to qRT-PCR (Figure
53). This study confirmed that both the iLluminate-miRNA method and qRT-PCR were effective
at measuring purified Let-7b miRNA (range: 0.0114 pM–12 nM) spiked into water (Figure 55
and Table 10) or human serum (Figure 56 and Table 10).
However, comparison of the percent recoveries of spiked-in Let-7b miRNA to a 100%
predicted recovery (represented as a green line in figures 55 and 56), clearly showed that the
iLluminate-miRNA method was more accurate and precise at all spiked-in Let-7b miRNA
concentrations using both water and human serum as solvents. Compared to qRT-PCR, the
iLluminate-miRNA method resulted in smaller standard errors of the mean (SEM) for Let-7b
miRNA concentrations (Table 10), especially in water. To ensure specificity, figure 57 illustrates
the detection of 12 nM of Let-7b miRNA, but not a randomly generated miRNA (22mer called
scrambled – scr.), for the iLluminate-miRNA technique when spiked into water (set arbitrarily to
100%) or human serum (52%), respectively.
The reduction in percent recovery in serum versus water for the same Let-7b miRNA (12
nM) might not be directly due to the iLluminate-miRNA detection method per se, but rather
because of a reduction in Let-7b miRNA yield during column chromatography. Lastly, the

173
iLluminate-miRNA method was nearly 10- and 660-fold more sensitive at detecting 12 nM
spiked-in Let-7b miRNA compared to qRT-PCR in water or serum (Figure 58). Table 11
summarizes the overall means, +/- SEM and p values for the two methods. These results support
our conclusion that our miRNA detection technique can successfully quantitate Let-7b miRNA
molecules after purification from water or biological fluids in an inexpensive, rapid, accurate,
and precise manner that outperforms the current gold-standard approach of qRT-PCR.
Figure 56. Let-7b recovery in water sample.
This line graph depicts the percent recovery of spiked in Let-7b for both iLluminate-miRNA
(DEP) (black line) and qRT-PCR (red line) in comparison to the predicted value. The
predicted values were based upon a 100% recovery rate at the 12nM concentration.

174
Figure 57. Percent recovery of Let-7b spiked into human serum samples.
Human serum samples spiked in with various concentrations of Let-7b miRNA was detected
by both iLluminate-miRNA (DEP) (black line) and qRT-PCR (red line). The line graph
shows the percent recovery values of Let-7b for both techniques compared to 100% predicted
(green line), based on 100% recovery at 12nM concentration. All subsequent calculations
were based on this maximum % recovery value.

175
S c r . W a te r S e r u m S c r . W A T ER S e r u m
0
5 0
1 0 0
1 5 0
% R
ec
ov
ery
N D
L e t -7 b
N D
D E P q R T -P C R
N D
Figure 58. Scrambled versus Let-7b detection in water and serum by both iLluminate-
miRNA and qRT-PCR platforms.
Scrambled miRNA (12 nM) or miRNA Let-7b (12 nM) were spiked into water or human
serum. Samples were subsequently purified by column chromatography and measured by
iLluminate-miRNA or qRT-PCR. Data is presented as a bar graph with % recovery means +/-
SEM from 3 independent experiments. The abbreviation of “ND” stands for “not detected.”

176
Figure 59. Direct percent recovery comparisons at 12nM in water and serum.
Direct relative comparisons of % recovery calculations at 12 nM are presented in a bar graph
+/- SEM from 3-4 independent experiments. The fold-difference in % recovery value for
iLluminate-miRNA versus qRT-PCR is placed above the appropriate bar for both water and
human serum solvents.

177
W
ate
r
iL
lum
inat
e-m
iRN
A
qR
T-P
CR
[Let
-7b
pM
] F
.I.E
. M
eans
+/-
SE
M
Exp
ecte
d
Rec
over
y
+/-
SE
M
N
Ct
Mea
ns
+/-
SE
M
Exp
ecte
d
Rec
over
y
+/-
SE
M
N
12
000
75
662
143
21
713
22
2.0
830
31
1
00
*
3
3
10
.398
33
0
.29
20
38
1
00
10
0*
43
.306
59
3
30
00
15
425
028
11
210
1.7
0
.52
07
58
8
1.5
46
87
0
3
1
3.6
86
67
0
.14
94
81
2
5
10
.235
59
5
9.0
50
29
3
75
0
13
172
686
12
400
4
0.1
301
89
2
78
.55
8
0
3
16
.465
0.1
861
67
6
.25
1.4
919
4
29
.215
1
3
18
7.5
5
76
08
3.7
2
31
88
.9
0.0
325
47
4
8.7
28
93
0
3
1
9.9
5
0.5
863
49
1
.56
25
0.1
332
48
8
8.6
20
43
4
46
.9
38
906
6.3
4
17
9.0
31
0
.00
81
41
1
31
.56
9
0
3
23
.321
25
0
.43
26
1
0.3
908
33
0
.01
28
77
7
8.1
06
56
4
11
.7
70
961
32
72
0.0
020
31
9
6.1
91
45
0
3
2
6.1
18
75
0
.99
00
96
0
.09
75
0.0
018
52
1
67
.70
3
4
2.9
1
41
64
33
56
0.0
005
03
7
7.4
62
33
0
3
2
8.7
56
25
0
.76
91
48
0
.02
41
67
0
.00
02
98
1
39
.72
95
4
0.7
32
96
73
22
90
0.0
001
27
2
09
.58
14
0
3
3
0.2
18
33
0
.73
84
97
0
.00
61
0.0
001
08
1
07
.14
36
3
0.1
83
16
09
33
4
3.1
8E
-05
13
9.4
46
5
0
3
33
.708
33
1
.13
82
2
0.0
015
25
9
.62
E-0
6
18
6.2
12
1
3
0.0
458
63
8
78
7.9
5E
-06
22
0.9
31
6
0
3
36
.47
1.0
401
08
0
.00
03
82
1
.42
E-0
6
15
0
3
0.0
114
32
8
35
1.9
8E
-06
45
6.3
22
2
0
3
38
.746
67
1.1
652
41
0.0
000
95
2.9
3E
-07
18
6.2
12
1
3
0
0
0
0
0
0
3
40
.096
67
0
0
1
.15
E-0
7
13
4.6
86
3
Ser
um
iLlu
min
ate-
miR
NA
q
RT
-PC
R
[Let
-7b
pM
] F
.I.E
. M
eans
+/-
SE
M
Exp
ecte
d
Rec
over
y
+/-
SE
M
N
Ct
Mea
ns
+/-
SE
M
Exp
ecte
d
Rec
over
y
+/-
SE
M
N
12
000
40
012
795
95
492
4.4
1
00
52
.88
*
2
3
36
.945
1.6
1
00
1.0
2E
-06
53
.966
05
3
12
0
59
55
.33
3
51
4.7
03
2
1
0.0
078
71
0
3
3
8.0
27
5
2.6
1
4
.82
E-0
9
29
.454
12
4
60
30
27
74
4
0.5
0
.00
40
01
0
3
3
5.9
78
33
2
.28
0.5
9
.97
E-0
9
5.8
066
01
3
30
10
11
.66
7
27
7.1
55
2
0.2
5
0.0
013
37
0
3
3
6.9
76
67
1
.99
0.2
5
2.4
9E
-09
1.1
612
97
3
12
58
8.3
33
3
13
1.1
02
5
0.1
0
.00
07
78
0
3
3
5.8
68
33
0
.76
0.1
2
.15
E-0
9
0.0
860
68
3
1.2
1
32
20
0.0
1
0.0
001
74
0
3
3
6.0
56
25
2
.2
0.0
1
1.8
9E
-10
0.0
853
88
4
0
13
.333
33
3
.75
64
76
0
1
.76
E-0
5
0
3
37
.423
2.3
0
0
0
.02
30
27
4
Tab
le 1
0.
Sum
mar
y o
f iL
lum
inat
e-m
iRN
A a
nd q
RT
-PC
R d
ata
and f
rom
spik
ed-i
n L
et-7
b e
xper
imen
ts.

178
Table 11. Comparison to predicted percent recovery to 100%.
4.4. Discussion
A major finding of this study is the validation of the iLluminate-miRNA platform in
spiked-in miRNA detection from both water and human serum samples. These results
demonstrated that while qRT-PCR is able to detect known microRNA concentrations in water, it
was not able to accurately detect miRNA Let-7b in human serum. The iLluminate-miRNA
technology on the other hand was able to detect microRNA levels in both solvents and with
much greater accuracy and precision than qRT-PCR. The ability to accurately measure
microRNA levels in human serum can greatly improve cancer and other disease diagnosis. The
sensitivity, quickness, and low cost of this early-detection platform may allow for earlier
diagnosis of cancers in the future.
Comparison of the qRT-PCR data to the predicted percent recovery shows a statistical
loss of Let-7b miRNA in both water and serum sample groups. In water the percent recovered
(figure 55) decreases gradually, whereas in serum the highest and lowest Let-7b starting
concentrations are nearly indistinguishable. This could be associated with loss in column
chromatography, but the higher percent recovery for the iLluminate-miRNA system suggests the
column was able to isolate more miRNA than recovered. For the qRT-PCR experiments we see a
steady decline in detection as the sample is diluted with a 0.99 R2 value. This tell us that the
Water
Procedure Mean SEM P value Significance
qRT-PCR 16.85 9.106 0.001 ****
iLluminate-miRNA 167.3 35.89 0.155 ns
Serum
Procedure Mean SEM P value Significance
qRT-PCR 0.01459 0.01311 0.0001 ****
iLluminate-miRNA 9.588 8.661 0.0003 ***

179
dilution of the microRNA samples was well completed with high accuracy. The results show
nearly a 2-fold Cq change per 1 to 4 dilution confirming the doubling amplification of the target
cDNA per Cq. To better visualize the data the y-axis was set to 41 – the average Cq to generate a
downwards slope similar to that observed with the iLluminate-miRNA platform. Many
researchers set a cutoff for Cq at 35, which was not done for this experiment. The inclusion of
data below 35 allows for the visualization of the downward trend all the way to 11 fM of total
let-7b.
The serum results are quite interesting for qRT-PCR and suggested no detection of the
microRNA at all. There is no observable change between 100 ng and 0.01ng of spiked in let-7b.
There may be numerous reasons at play, which could be resulting in this lack of detection. The
human serum may contain Taq inhibitors that may be preventing amplification of the final
product. The ability of the primers to anneal to the final product may be an issue, but the same
sequences were used for detection for the iLluminate-miRNA platform and it was able to detect
the double stranded duplex samples. The isolation was most likely not an issue, as both
iLluminate-miRNA and qRT-PCR used the same samples for detection. Previous research by
Chen et al. has described that the utilization of stem-loop primers may assist in the detection of
microRNA’s by qRT-PCR (Chen et al. 2005). This may help qRT-PCR amplification, but since
the same primer sequences were used by iLluminate-miRNA for hybridization, we can be
confident that the target microRNAs were found and bound by the introduced primers.
Numerous microRNA detection methods have been purposed. For example Rodríguez-
Dorantes et al. published a method of miRNA analysis from urine to detect prostate cancer
markers (Rodríguez-Dorantes, Salido-Guadarrama, and García-Tobilla 2014). Another method
developed at Oregon State University, uses a fluorescent probe to bind to target microRNA

180
complexes and is recognized when excited with a laser (Larkey et al. 2014). Most purposed
platforms, including iLluminate-miRNA utilize a fluorescently labeled complementary sequence
to bind target microRNAs, but the pulldown and isolation of these targets differs. As discussed in
the introduction section of this chapter, approaches include magnetic pulldowns or ELISA type
secondary antibodies. This is where iLluminate-miRNA’s strategy diverges from the rest. This
technology is able to concentrate desired samples into “hotspots” on the TIAM array thereby
allowing for fluorescence amplification due to the shape of the gold-plated electrode.
The detection capabilities of iLluminate-miRNA are seen in both water and serum
samples. In the water samples, we can see the detection limits are greater than those of qRT-PCR
which was reaching the 41 Cq undetectable range at lower concentrations. This did not hold true
for iLluminate-miRNA which was able to detect the lower amounts. Future experiments using
water controls could include lower concentrations of spiked in microRNA to determine this
technology’s lowest detection limit. The human serum samples greatly surpassed expectations
for this platform when compared to qRT-PCR. The enzymatic assay was unable to detect even
the highest amounts of let-7b, whereas the iLluminate-miRNA platform was able to detect the
lowest concentration used equaling 1.2 pM. This data suggests that the iLluminate-miRNA
platform may be an alternative for early cancer biomarker detection due to its ability to detect
low concentrations in human serum.
Future experiments to validate the iLluminate-miRNA technique include the analysis of
in-serum microRNA samples. The samples tested for these previous experiments included
spiked-in microRNA, which is excellent for proof-of-concept, but not applicable in the real
world. The next step would be to test endogenous levels of microRNA present in human serum
samples which would allow for in vivo validation of its detection. A collaboration with medical

181
researchers from Valley Hospital in Ridgewood, NJ, will assist in completing this goal.
Hybridization efficiency optimization is another future goal to minimize product loss and reduce
time during the hybridization step. This involves the testing of different hybridization techniques
and the utilization of the one that allows for the formation of the most miRNA-probe duplexes.
Increases in efficiency may be achieved by modification of temperature, pH, substrate
concentration and time. One final idea is to multiplex this technology using multiple
fluorophores for detection.
182
5. REFERENCES
Aarts, Esther, Thomas H. A. Ederveen, Jilly Naaijen, Marcel P. Zwiers, Jos Boekhorst, Harro M.
Timmerman, Sanne P. Smeekens, Mihai G. Netea, Jan K. Buitelaar, Barbara Franke,
Sacha A. F. T. van Hijum, and Alejandro Arias Vasquez. 2017. 'Gut microbiome in
ADHD and its relation to neural reward anticipation', PLoS One, 12: e0183509.
Abad, C., C. Martinez, M. G. Juarranz, A. Arranz, J. Leceta, M. Delgado, and R. P. Gomariz.
2003. 'Therapeutic effects of vasoactive intestinal peptide in the trinitrobenzene sulfonic
acid mice model of Crohn's disease', Gastroenterology, 124: 961-71.
Abubucker, Sahar, Nicola Segata, Johannes Goll, Alyxandria M. Schubert, Jacques Izard, Brandi
L. Cantarel, Beltran Rodriguez-Mueller, Jeremy Zucker, Mathangi Thiagarajan, Bernard
Henrissat, Owen White, Scott T. Kelley, Barbara Methé, Patrick D. Schloss, Dirk Gevers,
Makedonka Mitreva, and Curtis Huttenhower. 2012. 'Metabolic Reconstruction for
Metagenomic Data and Its Application to the Human Microbiome', PLOS Computational
Biology, 8: e1002358.
Aguilera, M., P. Vergara, and V. Martinez. 2013. 'Stress and antibiotics alter luminal and wall-
adhered microbiota and enhance the local expression of visceral sensory-related systems
in mice', Neurogastroenterol Motil, 25: e515-29.
Angel, Thomas E., Mark R. Chance, and Krzysztof Palczewski. 2009. 'Conserved waters mediate
structural and functional activation of family A (rhodopsin-like) G protein-coupled
receptors', Proceedings of the National Academy of Sciences, 106: 8555-60.
Arata, Hideyuki, Kazuo Hosokawa, and Mizuo Maeda. 2014. 'Rapid Sub-attomole MicroRNA
Detection on a Portable Microfluidic Chip', Analytical Sciences, 30: 129-35.
Asano, Y., T. Hiramoto, R. Nishino, Y. Aiba, T. Kimura, K. Yoshihara, Y. Koga, and N. Sudo.
2012. 'Critical role of gut microbiota in the production of biologically active, free
catecholamines in the gut lumen of mice', Am J Physiol Gastrointest Liver Physiol, 303:
G1288-95.
Bäckhed, Fredrik, Hao Ding, Ting Wang, Lora V. Hooper, Gou Young Koh, Andras Nagy, Clay
F. Semenkovich, and Jeffrey I. Gordon. 2004. 'The gut microbiota as an environmental
factor that regulates fat storage', Proc Natl Acad Sci U S A, 101: 15718-23.
Bai, Z., H. Zhang, N. Li, Z. Bai, L. Zhang, Z. Xue, H. Jiang, Y. Song, and D. Zhou. 2016.
'Impact of Environmental Microbes on the Composition of the Gut Microbiota of Adult
BALB/c Mice', PLoS One, 11: e0160568.
Baldwin, Joyce M., Gebhard F. X. Schertler, and Vinzenz M. Unger. 1997. 'An alpha-carbon
template for the transmembrane helices in the rhodopsin family of G-protein-coupled
receptors11Edited by R. Huber', Journal of Molecular Biology, 272: 144-64.
Ballesta, Jose, Stephen R Bloom, Julia M Polak, and John G Batsakis. 1985. 'Distribution and
localization of regulatory peptides', CRC Critical Reviews in Clinical Laboratory
Sciences, 22: 185-218.
Barboza, J. L., M. S. Okun, and B. Moshiree. 2015. 'The treatment of gastroparesis, constipation
and small intestinal bacterial overgrowth syndrome in patients with Parkinson's disease',
Expert Opin Pharmacother, 16: 2449-64.
Bargmann, Cornelia I. 1997. 'Olfactory receptors, vomeronasal receptors, and the organization of
olfactory information', Cell, 90: 585-87.

183
Barka, E. A., P. Vatsa, L. Sanchez, N. Gaveau-Vaillant, C. Jacquard, J. P. Meier-Kolthoff, H. P.
Klenk, C. Clement, Y. Ouhdouch, and G. P. van Wezel. 2016. 'Taxonomy, Physiology,
and Natural Products of Actinobacteria', Microbiol Mol Biol Rev, 80: 1-43.
Barouei, J., Z. Bendiks, A. Martinic, D. Mishchuk, D. Heeney, Y. H. Hsieh, D. Kieffer, J.
Zaragoza, R. Martin, C. Slupsky, and M. L. Marco. 2017. 'Microbiota, metabolome, and
immune alterations in obese mice fed a high-fat diet containing type 2 resistant starch',
Mol Nutr Food Res, 61.
Becker, C., M. F. Neurath, and S. Wirtz. 2015. 'The Intestinal Microbiota in Inflammatory Bowel
Disease', Ilar j, 56: 192-204.
Bell, D. S. 2015. 'Changes seen in gut bacteria content and distribution with obesity: causation or
association?', Postgrad Med, 127: 863-8.
Bell, G. I. 1986. 'The glucagon superfamily: precursor structure and gene organization', Peptides,
7 Suppl 1: 27-36.
Benach, J. L., E. Li, and M. M. McGovern. 2012. 'A microbial association with autism', MBio, 3.
Berry, D., C. Schwab, G. Milinovich, J. Reichert, K. Ben Mahfoudh, T. Decker, M. Engel, B.
Hai, E. Hainzl, S. Heider, L. Kenner, M. Muller, I. Rauch, B. Strobl, M. Wagner, C.
Schleper, T. Urich, and A. Loy. 2012. 'Phylotype-level 16S rRNA analysis reveals new
bacterial indicators of health state in acute murine colitis', Isme j, 6: 2091-106.
Bettelli, E., Y. Carrier, W. Gao, T. Korn, T. B. Strom, M. Oukka, H. L. Weiner, and V. K.
Kuchroo. 2006. 'Reciprocal developmental pathways for the generation of pathogenic
effector TH17 and regulatory T cells', Nature, 441: 235-8.
Bevan, J. A., G. M. Buga, M. A. Moskowitz, and S. I. Said. 1986. 'In vitro evidence that
vasoactive intestinal peptide is a transmitter of neuro-vasodilation in the head of the cat',
Neuroscience, 19: 597-604.
Bhargava, P., and E. M. Mowry. 2014. 'Gut microbiome and multiple sclerosis', Curr Neurol
Neurosci Rep, 14: 492.
Biancani, P., M. C. Beinfeld, D. H. Coy, C. Hillemeier, J. H. Walsh, and J. Behar. 1988.
'Dysfunction of the gastrointestinal tract. Vasoactive intestinal peptide in peristalsis and
sphincter function', Ann N Y Acad Sci, 527: 546-67.
Bianconi, E., A. Piovesan, F. Facchin, A. Beraudi, R. Casadei, F. Frabetti, L. Vitale, M. C.
Pelleri, S. Tassani, F. Piva, S. Perez-Amodio, P. Strippoli, and S. Canaider. 2013. 'An
estimation of the number of cells in the human body', Ann Hum Biol, 40: 463-71.
Billington, C. K., and R. B. Penn. 2003. 'Signaling and regulation of G protein-coupled receptors
in airway smooth muscle', Respir Res, 4: 2.
Bishop, A. E., J. M. Polak, Y. Yiangou, N. D. Christofides, and S. R. Bloom. 1984. 'The
distributions of PHI and VIP in porcine gut and their co-localisation to a proportion of
intrinsic ganglion cells', Peptides, 5: 255-9.
Bjarnadottir, T. K., D. E. Gloriam, S. H. Hellstrand, H. Kristiansson, R. Fredriksson, and H. B.
Schioth. 2006. 'Comprehensive repertoire and phylogenetic analysis of the G protein-
coupled receptors in human and mouse', Genomics, 88: 263-73.
Bjarnadóttir, Thóra K., Robert Fredriksson, Pär J. Höglund, David E. Gloriam, Malin C.
Lagerström, and Helgi B. Schiöth. 2004. 'The human and mouse repertoire of the
adhesion family of G-protein-coupled receptors', Genomics, 84: 23-33.
Blaser, M. J., and S. Falkow. 2009. 'What are the consequences of the disappearing human
microbiota?', Nat Rev Microbiol, 7: 887-94.

184
Blobel, G., P. Walter, C. N. Chang, B. M. Goldman, A. H. Erickson, and V. R. Lingappa. 1979.
'Translocation of proteins across membranes: the signal hypothesis and beyond', Symp
Soc Exp Biol, 33: 9-36.
Bockaert, J., and J. P. Pin. 1999. 'Molecular tinkering of G protein-coupled receptors: an
evolutionary success', Embo j, 18: 1723-9.
Bohnsack, M. T., K. Czaplinski, and D. Gorlich. 2004. 'Exportin 5 is a RanGTP-dependent
dsRNA-binding protein that mediates nuclear export of pre-miRNAs', Rna, 10: 185-91.
Borchert, G. M., W. Lanier, and B. L. Davidson. 2006. 'RNA polymerase III transcribes human
microRNAs', Nat Struct Mol Biol, 13: 1097-101.
Borland, Gillian, Brian O. Smith, and Stephen J. Yarwood. 2009. 'EPAC proteins transduce
diverse cellular actions of cAMP', British Journal of Pharmacology, 158: 70-86.
Boyerinas, B., S. M. Park, A. Hau, A. E. Murmann, and M. E. Peter. 2010. 'The role of let-7 in
cell differentiation and cancer', Endocr Relat Cancer, 17: F19-36.
Brandl, K., G. Plitas, B. Schnabl, R. P. DeMatteo, and E. G. Pamer. 2007. 'MyD88-mediated
signals induce the bactericidal lectin RegIII gamma and protect mice against intestinal
Listeria monocytogenes infection', J Exp Med, 204: 1891-900.
Brandt, D. R., and E. M. Ross. 1985. 'GTPase activity of the stimulatory GTP-binding regulatory
protein of adenylate cyclase, Gs. Accumulation and turnover of enzyme-nucleotide
intermediates', J Biol Chem, 260: 266-72.
Buday, László, and Julian Downward. 1993. 'Epidermal growth factor regulates p21ras through
the formation of a complex of receptor, Grb2 adapter protein, and Sos nucleotide
exchange factor', Cell, 73: 611-20.
Burokas, A., R. D. Moloney, T. G. Dinan, and J. F. Cryan. 2015. 'Microbiota regulation of the
Mammalian gut-brain axis', Adv Appl Microbiol, 91: 1-62.
Butun, A., M. Naziroglu, S. Demirci, O. Celik, and A. C. Uguz. 2015. 'Riboflavin and vitamin E
increase brain calcium and antioxidants, and microsomal calcium-ATP-ase values in rat
headache models induced by glyceryl trinitrate', J Membr Biol, 248: 205-13.
Calin, G. A., C. D. Dumitru, M. Shimizu, R. Bichi, S. Zupo, E. Noch, H. Aldler, S. Rattan, M.
Keating, K. Rai, L. Rassenti, T. Kipps, M. Negrini, F. Bullrich, and C. M. Croce. 2002.
'Frequent deletions and down-regulation of micro- RNA genes miR15 and miR16 at
13q14 in chronic lymphocytic leukemia', Proc Natl Acad Sci U S A, 99: 15524-9.
Candeias, S. M., and U. S. Gaipl. 2016. 'The Immune System in Cancer Prevention,
Development and Therapy', Anticancer Agents Med Chem, 16: 101-7.
Carvalho, A. T., C. C. Elia, H. S. de Souza, P. R. Elias, E. L. Pontes, H. P. Lukashok, F. C. de
Freitas, and J. R. Lapa e Silva. 2003. 'Immunohistochemical study of intestinal
eosinophils in inflammatory bowel disease', J Clin Gastroenterol, 36: 120-5.
Cassel, Dan, and Zvi Selinger. 1978. 'Mechanism of adenylate cyclase activation through the
beta-adrenergic receptor: catecholamine-induced displacement of bound GDP by GTP',
Proceedings of the National Academy of Sciences, 75: 4155-59.
Chao, Anne. 1984. 'Nonparametric Estimation of the Number of Classes in a Population',
Scandinavian Journal of Statistics, 11: 265-70.
Chartrel, N., Y. Wang, A. Fournier, H. Vaudry, and J. M. Conlon. 1995. 'Frog vasoactive
intestinal polypeptide and galanin: primary structures and effects on pituitary adenylate
cyclase', Endocrinology, 136: 3079-86.
Chen, C., D. A. Ridzon, A. J. Broomer, Z. Zhou, D. H. Lee, J. T. Nguyen, M. Barbisin, N. L. Xu,
V. R. Mahuvakar, M. R. Andersen, K. Q. Lao, K. J. Livak, and K. J. Guegler. 2005.

185
'Real-time quantification of microRNAs by stem-loop RT-PCR', Nucleic Acids Res, 33:
e179.
Chen, J, M DeVivo, J Dingus, A Harry, J Li, J Sui, DJ Carty, JL Blank, JH Exton, RH Stoffel,
and al. et. 1995. 'A region of adenylyl cyclase 2 critical for regulation by G protein beta
gamma subunits', Science, 268: 1166-69.
Chen, Jonathan, Jennifer Martinez, Teresa A Milner, Jochen Buck, and Lonny R Levin. 2013.
'Neuronal expression of soluble adenylyl cyclase in the mammalian brain', Brain
Research, 1518: 1-8.
Chen, W., B. Paulus, D. Shu, Wilson, and V. Chadwick. 2001. 'Increased serum levels of eotaxin
in patients with inflammatory bowel disease', Scand J Gastroenterol, 36: 515-20.
Chen, Yanqiu, Martin J. Cann, Tatiana N. Litvin, Vadim Iourgenko, Meeghan L. Sinclair, Lonny
R. Levin, and Jochen Buck. 2000. 'Soluble Adenylyl Cyclase as an Evolutionarily
Conserved Bicarbonate Sensor', Science, 289: 625-28.
Chevalier, Claire, Ozren Stojanović, Didier J Colin, Nicolas Suarez-Zamorano, Valentina
Tarallo, Christelle Veyrat-Durebex, Dorothée Rigo, Salvatore Fabbiano, Ana Stevanović,
Stefanie Hagemann, Xavier Montet, Yann Seimbille, Nicola Zamboni, Siegfried
Hapfelmeier, and Mirko Trajkovski. 2015. 'Gut Microbiota Orchestrates Energy
Homeostasis during Cold', Cell, 163: 1360-74.
Choi, M. Y., E. J. Fuerst, A. Rafaeli, and R. Jurenka. 2003. 'Identification of a G protein-coupled
receptor for pheromone biosynthesis activating neuropeptide from pheromone glands of
the moth Helicoverpa zea', Proc Natl Acad Sci U S A, 100: 9721-6.
Chu, D. M., J. Ma, A. L. Prince, K. M. Antony, M. D. Seferovic, and K. M. Aagaard. 2017.
'Maturation of the infant microbiome community structure and function across multiple
body sites and in relation to mode of delivery', Nat Med, 23: 314-26.
Clamp, Michele, Ben Fry, Mike Kamal, Xiaohui Xie, James Cuff, Michael F. Lin, Manolis
Kellis, Kerstin Lindblad-Toh, and Eric S. Lander. 2007. 'Distinguishing protein-coding
and noncoding genes in the human genome', Proceedings of the National Academy of
Sciences, 104: 19428-33.
Clarke, G., S. Grenham, P. Scully, P. Fitzgerald, R. D. Moloney, F. Shanahan, T. G. Dinan, and
J. F. Cryan. 2012. 'The microbiome-gut-brain axis during early life regulates the
hippocampal serotonergic system in a sex-dependent manner', Molecular Psychiatry, 18:
666.
Clarke, G., R. M. Stilling, P. J. Kennedy, C. Stanton, J. F. Cryan, and T. G. Dinan. 2014.
'Minireview: Gut microbiota: the neglected endocrine organ', Mol Endocrinol, 28: 1221-
38.
Clemente, Jose C., Erica C. Pehrsson, Martin J. Blaser, Kuldip Sandhu, Zhan Gao, Bin Wang,
Magda Magris, Glida Hidalgo, Monica Contreras, Óscar Noya-Alarcón, Orlana Lander,
Jeremy McDonald, Mike Cox, Jens Walter, Phaik Lyn Oh, Jean F. Ruiz, Selena
Rodriguez, Nan Shen, Se Jin Song, Jessica Metcalf, Rob Knight, Gautam Dantas, and M.
Gloria Dominguez-Bello. 2015. 'The microbiome of uncontacted Amerindians', Science
Advances, 1.
Coleman, David E, Albert M Berghuis, Ethan Lee, Maurine E Linder, and Alfred G Gilman.
1994. 'Structures of active conformations of Gi alpha 1 and the mechanism of GTP
hydrolysis', Science, 265: 1405-12.
Collins, S. M., M. Surette, and P. Bercik. 2012. 'The interplay between the intestinal microbiota
and the brain', Nat Rev Microbiol, 10: 735-42.

186
Colwell, C. S., S. Michel, J. Itri, W. Rodriguez, J. Tam, V. Lelievre, Z. Hu, X. Liu, and J. A.
Waschek. 2003. 'Disrupted circadian rhythms in VIP- and PHI-deficient mice', Am J
Physiol Regul Integr Comp Physiol, 285: R939-49.
Conlin, V. S., X. Wu, C. Nguyen, C. Dai, B. A. Vallance, A. M. J. Buchan, L. Boyer, and K.
Jacobson. 2009. 'Vasoactive intestinal peptide ameliorates intestinal barrier disruption
associated with Citrobacter rodentium-induced colitis', American Journal of Physiology-
Gastrointestinal and Liver Physiology, 297: G735-G50.
Cook, J. V., and K. A. Eidne. 1997. 'An intramolecular disulfide bond between conserved
extracellular cysteines in the gonadotropin-releasing hormone receptor is essential for
binding and activation', Endocrinology, 138: 2800-6.
Cooper, Max D., and Brantley R. Herrin. 2010. 'How did our complex immune system evolve?',
Nature Reviews Immunology, 10: 2.
Costa, M. C., A. L. Leitao, and F. J. Enguita. 2014. 'MicroRNA profiling in plasma or serum
using quantitative RT-PCR', Methods Mol Biol, 1182: 121-9.
Costello, E. K., C. L. Lauber, M. Hamady, N. Fierer, J. I. Gordon, and R. Knight. 2009.
'Bacterial Community Variation in Human Body Habitats Across Space and Time',
Science (New York, NY), 326.
Cramer, P. 2004. 'Structure and function of RNA polymerase II', Adv Protein Chem, 67: 1-42.
Critchfield, J. W., S. van Hemert, M. Ash, L. Mulder, and P. Ashwood. 2011. 'The potential role
of probiotics in the management of childhood autism spectrum disorders', Gastroenterol
Res Pract, 2011: 161358.
Curtis, M. M., Z. Hu, C. Klimko, S. Narayanan, R. Deberardinis, and V. Sperandio. 2014. 'The
gut commensal Bacteroides thetaiotaomicron exacerbates enteric infection through
modification of the metabolic landscape', Cell Host Microbe, 16: 759-69.
Cutz, E., W. Chan, N. S. Track, A. Goth, and S. I. Said. 1978. 'Release of vasoactive intestinal
polypeptide in mast cells by histamine liberators', Nature, 275: 661-2.
Dahiya, Neetu, Cheryl A. Sherman-Baust, Tian-Li Wang, Ben Davidson, Ie-Ming Shih,
Yongqing Zhang, William Wood, III, Kevin G. Becker, and Patrice J. Morin. 2008.
'MicroRNA Expression and Identification of Putative miRNA Targets in Ovarian
Cancer', PLoS One, 3: e2436.
Dahlhamer, J. M., E. P. Zammitti, B. W. Ward, A. G. Wheaton, and J. B. Croft. 2016.
'Prevalence of Inflammatory Bowel Disease Among Adults Aged >/=18 Years - United
States, 2015', MMWR Morb Mortal Wkly Rep, 65: 1166-69.
Darzi, J., G. S. Frost, and M. D. Robertson. 2011. 'Do SCFA have a role in appetite regulation?',
Proc Nutr Soc, 70: 119-28.
Dasgupta, S., D. Erturk-Hasdemir, J. Ochoa-Reparaz, H. C. Reinecker, and D. L. Kasper. 2014.
'Plasmacytoid dendritic cells mediate anti-inflammatory responses to a gut commensal
molecule via both innate and adaptive mechanisms', Cell Host Microbe, 15: 413-23.
Davenport, Emily R., Orna Mizrahi-Man, Katelyn Michelini, Luis B. Barreiro, Carole Ober, and
Yoav Gilad. 2014. 'Seasonal Variation in Human Gut Microbiome Composition', PLoS
One, 9: e90731.
Davenport, Emily R., Jon G. Sanders, Se Jin Song, Katherine R. Amato, Andrew G. Clark, and
Rob Knight. 2017. 'The human microbiome in evolution', BMC Biology, 15: 127.
David, L. A., C. F. Maurice, R. N. Carmody, D. B. Gootenberg, J. E. Button, B. E. Wolfe, A. V.
Ling, A. S. Devlin, Y. Varma, M. A. Fischbach, S. B. Biddinger, R. J. Dutton, and P. J.

187
Turnbaugh. 2014. 'Diet rapidly and reproducibly alters the human gut microbiome',
Nature, 505: 559-63.
De Witte, C., C. Schulz, A. Smet, P. Malfertheiner, and F. Haesebrouck. 2016. 'Other
Helicobacters and gastric microbiota', Helicobacter, 21 Suppl 1: 62-8.
Dejda, A., I. Matczak, and J. Z. Nowak. 2004. '[Peptide histidine-isoleucine and and its human
analogue peptide histidine-methionine: localization, receptors and biological function]',
Postepy Hig Med Dosw (Online), 58: 18-26.
Delgado, M. 2003. 'VIP: a very important peptide in T helper differentiation', Trends Immunol,
24: 221-4.
Delgado, M., and D. Ganea. 2003. 'Vasoactive intestinal peptide prevents activated microglia-
induced neurodegeneration under inflammatory conditions: potential therapeutic role in
brain trauma', Faseb j, 17: 1922-4.
Delgado, M., E. J. Munoz-Elias, R. P. Gomariz, and D. Ganea. 1999. 'Vasoactive intestinal
peptide and pituitary adenylate cyclase-activating polypeptide prevent inducible nitric
oxide synthase transcription in macrophages by inhibiting NF-kappa B and IFN
regulatory factor 1 activation', J Immunol, 162: 4685-96.
Delgado, M., W. Sun, J. Leceta, and D. Ganea. 1999. 'VIP and PACAP differentially regulate the
costimulatory activity of resting and activated macrophages through the modulation of
B7.1 and B7.2 expression', J Immunol, 163: 4213-23.
Delgado, R. M., 3rd, M. A. Nawar, A. M. Zewail, B. Kar, W. K. Vaughn, K. K. Wu, N. Aleksic,
N. Sivasubramanian, K. McKay, D. L. Mann, and J. T. Willerson. 2004.
'Cyclooxygenase-2 inhibitor treatment improves left ventricular function and mortality in
a murine model of doxorubicin-induced heart failure', Circulation, 109: 1428-33.
Denli, A. M., B. B. Tops, R. H. Plasterk, R. F. Ketting, and G. J. Hannon. 2004. 'Processing of
primary microRNAs by the Microprocessor complex', Nature, 432: 231-5.
DeSantis, T. Z., P. Hugenholtz, N. Larsen, M. Rojas, E. L. Brodie, K. Keller, T. Huber, D.
Dalevi, P. Hu, and G. L. Andersen. 2006. 'Greengenes, a chimera-checked 16S rRNA
gene database and workbench compatible with ARB', Appl Environ Microbiol, 72: 5069-
72.
Dessauer, C. W., and A. G. Gilman. 1997. 'The catalytic mechanism of mammalian adenylyl
cyclase. Equilibrium binding and kinetic analysis of P-site inhibition', J Biol Chem, 272:
27787-95.
Dessauer, C. W., J. J. Tesmer, S. R. Sprang, and A. G. Gilman. 1998. 'Identification of a Gialpha
binding site on type V adenylyl cyclase', J Biol Chem, 273: 25831-9.
Dey, R. D., W. A. Shannon, Jr., and S. I. Said. 1981. 'Localization of VIP-immunoreactive
nerves in airways and pulmonary vessels of dogs, cat, and human subjects', Cell Tissue
Res, 220: 231-8.
Diel, S., K. Klass, B. Wittig, and C. Kleuss. 2006. 'Gbetagamma activation site in adenylyl
cyclase type II. Adenylyl cyclase type III is inhibited by Gbetagamma', J Biol Chem, 281:
288-94.
Dietert, R. R., J. M. Dietert, and J. C. Dewitt. 2011. 'Environmental risk factors for autism',
Emerg Health Threats J, 4: 7111.
Dockray, Graham J. 2014. 'Gastrointestinal hormones and the dialogue between gut and brain',
The Journal of Physiology, 592: 2927-41.
Dorsam, G. P., K. Benton, J. Failing, and S. Batra. 2011. 'Vasoactive intestinal peptide signaling
axis in human leukemia', World J Biol Chem, 2: 146-60.

188
Dorsam, S. T., E. Vomhof-Dekrey, R. J. Hermann, J. S. Haring, T. Van der Steen, E. Wilkerson,
G. Boskovic, J. Denvir, Y. Dementieva, D. Primerano, and G. P. Dorsam. 2010.
'Identification of the early VIP-regulated transcriptome and its associated, interactome in
resting and activated murine CD4 T cells', Mol Immunol, 47: 1181-94.
Dotevall, G., and N. G Kock. 1968. Absorption Studies in Regional Enterocolitis (Mb. Crohn).
Drews, J. 2000. 'Drug discovery: a historical perspective', Science, 287: 1960-4.
Du, B. H., J. Eng, J. D. Hulmes, M. Chang, Y. C. Pan, and R. S. Yalow. 1985. 'Guinea pig has a
unique mammalian VIP', Biochem Biophys Res Commun, 128: 1093-8.
Dyer, K. D., J. M. Moser, M. Czapiga, S. J. Siegel, C. M. Percopo, and H. F. Rosenberg. 2008.
'Functionally competent eosinophils differentiated ex vivo in high purity from normal
mouse bone marrow', J Immunol, 181: 4004-9.
Dyer, K. D., C. M. Percopo, and H. F. Rosenberg. 2009. 'Generation of eosinophils from
unselected bone marrow progenitors: wild-type, TLR- and eosinophil-deficient mice',
Open Immunol J, 2: 163-67.
Ebert, M. S., and P. A. Sharp. 2012. 'Roles for microRNAs in conferring robustness to biological
processes', Cell, 149: 515-24.
El-Merahbi, R., M. Loffler, A. Mayer, and G. Sumara. 2015. 'The roles of peripheral serotonin in
metabolic homeostasis', FEBS Lett, 589: 1728-34.
El-Shazly, A. E., D. Y. Begon, G. Kustermans, M. Arafa, E. Dortu, M. Henket, P. P. Lefebvre,
R. Louis, and P. Delvenne. 2013. 'Novel association between vasoactive intestinal
peptide and CRTH2 receptor in recruiting eosinophils: a possible biochemical mechanism
for allergic eosinophilic inflammation of the airways', J Biol Chem, 288: 1374-84.
Elson, C. O., Y. Cong, C. T. Weaver, T. R. Schoeb, T. K. McClanahan, R. B. Fick, and R. A.
Kastelein. 2007. 'Monoclonal anti-interleukin 23 reverses active colitis in a T cell-
mediated model in mice', Gastroenterology, 132: 2359-70.
Ericsson, A. C., J. W. Davis, W. Spollen, N. Bivens, S. Givan, C. E. Hagan, M. McIntosh, and C.
L. Franklin. 2015. 'Effects of vendor and genetic background on the composition of the
fecal microbiota of inbred mice', PLoS One, 10: e0116704.
Evans, Christian C., Kathy J. LePard, Jeff W. Kwak, Mary C. Stancukas, Samantha Laskowski,
Joseph Dougherty, Laura Moulton, Adam Glawe, Yunwei Wang, Vanessa Leone,
Dionysios A. Antonopoulos, Dan Smith, Eugene B. Chang, and Mae J. Ciancio. 2014.
'Exercise Prevents Weight Gain and Alters the Gut Microbiota in a Mouse Model of High
Fat Diet-Induced Obesity', PLoS One, 9: e92193.
Fabricius, D., B. Karacay, D. Shutt, W. Leverich, B. Schafer, E. Takle, D. Thedens, G. Khanna,
S. Raikwar, B. Yang, M. E. Desmond, and M. S. O'Dorisio. 2011. 'Characterization of
intestinal and pancreatic dysfunction in VPAC1-null mutant mouse', Pancreas, 40: 861-
71.
Fahrenkrug, Jan. 1985. 'Evidence for common precursors but differential processing of VIP and
PHM in VIP-producing tumors', Peptides, 6: 357-61.
Faith, Daniel P. 1992. 'Conservation evaluation and phylogenetic diversity', Biological
Conservation, 61: 1-10.
Farrens, David L, Christian Altenbach, Ke Yang, Wayne L Hubbell, and H Gobind Khorana.
1996. 'Requirement of rigid-body motion of transmembrane helices for light activation of
rhodopsin', Science, 274: 768-70.
Fei, N., and L. Zhao. 2013. 'An opportunistic pathogen isolated from the gut of an obese human
causes obesity in germfree mice', Isme j, 7: 880-4.

189
Feldmann, M., F. M. Brennan, and R. N. Maini. 1996. 'Role of cytokines in rheumatoid arthritis',
Annu Rev Immunol, 14: 397-440.
Fernandez-Martin, Amelia, Elena Gonzalez-Rey, Alejo Chorny, Javier Martin, David Pozo,
Doina Ganea, and Mario Delgado. 2006. 'VIP Prevents Experimental Multiple Sclerosis
by Downregulating Both Inflammatory and Autoimmune Components of the Disease',
Annals of the New York Academy of Sciences, 1070: 276-81.
Ferstl, Ruth, Remo Frei, Elisa Schiavi, Patrycja Konieczna, Weronika Barcik, Mario Ziegler,
Roger P. Lauener, Christophe Chassard, Christophe Lacroix, Cezmi A. Akdis, and Liam
O'Mahony. 2014. 'Histamine receptor 2 is a key influence in immune responses to
intestinal histamine-secreting microbes', Journal of Allergy and Clinical Immunology,
134: 744-46.e3.
Filardo, E. J. 2002. 'Epidermal growth factor receptor (EGFR) transactivation by estrogen via the
G-protein-coupled receptor, GPR30: a novel signaling pathway with potential
significance for breast cancer', J Steroid Biochem Mol Biol, 80: 231-8.
Finegold, S. M., D. Molitoris, Y. Song, C. Liu, M. L. Vaisanen, E. Bolte, M. McTeague, R.
Sandler, H. Wexler, E. M. Marlowe, M. D. Collins, P. A. Lawson, P. Summanen, M.
Baysallar, T. J. Tomzynski, E. Read, E. Johnson, R. Rolfe, P. Nasir, H. Shah, D. A.
Haake, P. Manning, and A. Kaul. 2002. 'Gastrointestinal microflora studies in late-onset
autism', Clin Infect Dis, 35: S6-s16.
Fire, Andrew Z., and Craig C. Mello. 2006. 'The Nobel Prize in Physiology or Medicine 2006',
Nobel Media AB 2014, 2006.
Fishbein, V. A., D. H. Coy, S. J. Hocart, N. Y. Jiang, J. E. Mrozinski, Jr., S. A. Mantey, and R.
T. Jensen. 1994. 'A chimeric VIP-PACAP analogue but not VIP pseudopeptides function
as VIP receptor antagonists', Peptides, 15: 95-100.
Fransen, Floris, Elena Zagato, Elisa Mazzini, Bruno Fosso, Caterina Manzari, Sahar El Aidy,
Andrea Chiavelli, Anna Maria D’Erchia, Maya K Sethi, Oliver Pabst, Marinella
Marzano, Silvia Moretti, Luigina Romani, Giuseppe Penna, Graziano Pesole, and Maria
Rescigno. 'BALB/c and C57BL/6 Mice Differ in Polyreactive IgA Abundance, which
Impacts the Generation of Antigen-Specific IgA and Microbiota Diversity', Immunity, 43:
527-40.
Frase, L. L., F. A. Gaffney, L. D. Lane, J. C. Buckey, S. I. Said, C. G. Blomqvist, and G. J.
Krejs. 1987. 'Cardiovascular effects of vasoactive intestinal peptide in healthy subjects',
Am J Cardiol, 60: 1356-61.
Fredriksson, Robert, Malin C. Lagerström, Lars-Gustav Lundin, and Helgi B. Schiöth. 2003.
'The G-Protein-Coupled Receptors in the Human Genome Form Five Main Families.
Phylogenetic Analysis, Paralogon Groups, and Fingerprints', Molecular Pharmacology,
63: 1256-72.
Frei, R., R. Ferstl, P. Konieczna, M. Ziegler, T. Simon, T. M. Rugeles, S. Mailand, T. Watanabe,
R. Lauener, C. A. Akdis, and L. O'Mahony. 2013. 'Histamine receptor 2 modifies
dendritic cell responses to microbial ligands', J Allergy Clin Immunol, 132: 194-204.
Fujimoto, W., M. Inaoki, T. Fukui, Y. Inoue, and T. Kuhara. 2005. 'Biotin deficiency in an infant
fed with amino acid formula', J Dermatol, 32: 256-61.
Gallo, Alessia, Mayank Tandon, Ilias Alevizos, and Gabor G. Illei. 2012. 'The Majority of
MicroRNAs Detectable in Serum and Saliva Is Concentrated in Exosomes', PLoS One, 7:
e30679.

190
Ganea, D., R. Rodriguez, and M. Delgado. 2003. 'Vasoactive intestinal peptide and pituitary
adenylate cyclase-activating polypeptide: players in innate and adaptive immunity', Cell
Mol Biol (Noisy-le-grand), 49: 127-42.
Garcia-Zepeda, E. A., M. E. Rothenberg, R. T. Ownbey, J. Celestin, P. Leder, and A. D. Luster.
1996. 'Human eotaxin is a specific chemoattractant for eosinophil cells and provides a
new mechanism to explain tissue eosinophilia', Nat Med, 2: 449-56.
Gether, U., and B. K. Kobilka. 1998. 'G protein-coupled receptors. II. Mechanism of agonist
activation', J Biol Chem, 273: 17979-82.
Ghouri, Y. A., D. M. Richards, E. F. Rahimi, J. T. Krill, K. A. Jelinek, and A. W. DuPont. 2014.
'Systematic review of randomized controlled trials of probiotics, prebiotics, and
synbiotics in inflammatory bowel disease', Clin Exp Gastroenterol, 7: 473-87.
Gilman, A. G. 1984. 'G proteins and dual control of adenylate cyclase', Cell, 36: 577-9.
———. 1990. 'Regulation of adenylyl cyclase by G proteins', Adv Second Messenger
Phosphoprotein Res, 24: 51-7.
———. 1995. 'Nobel Lecture. G proteins and regulation of adenylyl cyclase', Biosci Rep, 15: 65-
97.
Gilman, Alfred G. 1970. 'A Protein Binding Assay for Adenosine 3′:5′-Cyclic Monophosphate',
Proc Natl Acad Sci U S A, 67: 305-12.
Girardet, Clémence, Bruno Lebrun, Marie‐Jeanne Cabirol‐Pol, Catherine Tardivel, Anne‐Marie
François‐Bellan, Denis Becquet, and Olivier Bosler. 2013. 'Brain‐derived neurotrophic
factor/TrkB signaling regulates daily astroglial plasticity in the suprachiasmatic nucleus:
Electron‐microscopic evidence in mouse', Glia, 61: 1172-77.
Gleich, G. J., and C. R. Adolphson. 1986. 'The eosinophilic leukocyte: structure and function',
Adv Immunol, 39: 177-253.
Goetzl, E. J., J. K. Voice, S. Shen, G. Dorsam, Y. Kong, K. M. West, C. F. Morrison, and A. J.
Harmar. 2001. 'Enhanced delayed-type hypersensitivity and diminished immediate-type
hypersensitivity in mice lacking the inducible VPAC(2) receptor for vasoactive intestinal
peptide', Proc Natl Acad Sci U S A, 98: 13854-9.
Gokbuget, D., J. A. Pereira, S. Bachofner, A. Marchais, C. Ciaudo, M. Stoffel, J. H. Schulte, and
U. Suter. 2015. 'The Lin28/let-7 axis is critical for myelination in the peripheral nervous
system', Nat Commun, 6: 8584.
Gomariz, R. P., A. Arranz, C. Abad, M. Torroba, C. Martinez, F. Rosignoli, M. Garcia-Gomez,
J. Leceta, and Y. Juarranz. 2005. 'Time-course expression of Toll-like receptors 2 and 4
in inflammatory bowel disease and homeostatic effect of VIP', J Leukoc Biol, 78: 491-
502.
Gomariz, Rosa, Monica Fuente, Angel Hernanz, and Javier Leceta. 1992. 'Occurrence of
Vasoactive Intestinal Peptide (VIP) in Lymphoid Organs from Rat and Mousea', Annals
of the New York Academy of Sciences, 650: 13-18.
Gomariz, Rosa P., Maria J. Lorenzo, Lucinda Cacicedo, Angeles Vicente, and Agustin G.
Zapata. 1990. 'Demonstration of immunoreactive vasoactive intestinal peptide (IR-VIP)
and somatostatin (IR-SOM) in rat thymus', Brain, Behavior, and Immunity, 4: 151-61.
Goodfellow, S. J., and R. J. White. 2007. 'Regulation of RNA polymerase III transcription during
mammalian cell growth', Cell Cycle, 6: 2323-6.
Goursaud, S., N. Pineau, L. Becq-Giraudon, P. Gressens, J. M. Muller, and T. Janet. 2005.
'Human H9 cells proliferation is differently controlled by vasoactive intestinal peptide or

191
peptide histidine methionine: implication of a GTP-insensitive form of VPAC1 receptor',
J Neuroimmunol, 158: 94-105.
Gozes, I. 2001. 'Neuroprotective peptide drug delivery and development: potential new
therapeutics', Trends Neurosci, 24: 700-5.
Graul, Richard C, and Wolfgang Sadée. 2001. 'Evolutionary relationships among G protein-
coupled receptors using a clustered database approach', AAps pharmsci, 3: 25.
Grice, E. A., and J. A. Segre. 2011. 'The skin microbiome', Nat Rev Microbiol, 9: 244-53.
Groneberg, D. A., J. Springer, and A. Fischer. 2001. 'Vasoactive intestinal polypeptide as
mediator of asthma', Pulm Pharmacol Ther, 14: 391-401.
Gueimonde, M., S. Sakata, M. Kalliomaki, E. Isolauri, Y. Benno, and S. Salminen. 2006. 'Effect
of maternal consumption of lactobacillus GG on transfer and establishment of fecal
bifidobacterial microbiota in neonates', J Pediatr Gastroenterol Nutr, 42: 166-70.
Guerrero, J. M., J. C. Prieto, F. L. Elorza, R. Ramirez, and R. Goberna. 1981. 'Interaction of
vasoactive intestinal peptide with human blood mononuclear cells', Molecular and
Cellular Endocrinology, 21: 151-60.
Ha, Minju, and V. Narry Kim. 2014. 'Regulation of microRNA biogenesis', Nature reviews
Molecular cell biology, 15: 509.
Hamann, J., E. Hartmann, and R. A. van Lier. 1996. 'Structure of the human CD97 gene: exon
shuffling has generated a new type of seven-span transmembrane molecule related to the
secretin receptor superfamily', Genomics, 32: 144-7.
Hanoune, Jacques, and Nicole Defer. 2001. 'Regulation and role of adenylyl cyclase isoforms',
Annual review of pharmacology and toxicology, 41: 145-74.
Harayama, Hiroshi. 2013. 'Roles of intracellular cyclic AMP signal transduction in the
capacitation and subsequent hyperactivation of mouse and boar spermatozoa', Journal of
Reproduction and Development, 59: 421-30.
Harmar, A. J., H. M. Marston, S. B. Shen, C. Spratt, K. M. West, W. J. Sheward, C. F. Morrison,
J. R. Dorin, H. D. Piggins, J. C. Reubi, J. S. Kelly, E. S. Maywood, and M. H. Hastings.
2002. 'The VPAC(2) receptor is essential for circadian function in the mouse
suprachiasmatic nuclei', Cell, 109: 497-508.
Harmar, A. J., W. J. Sheward, C. F. Morrison, B. Waser, M. Gugger, and J. C. Reubi. 2004.
'Distribution of the VPAC2 receptor in peripheral tissues of the mouse', Endocrinology,
145: 1203-10.
Harmar, Anthony J., Jan Fahrenkrug, Illana Gozes, Marc Laburthe, Victor May, Joseph R.
Pisegna, David Vaudry, Hubert Vaudry, James A. Waschek, and Sami I. Said. 2012.
'Pharmacology and functions of receptors for vasoactive intestinal peptide and pituitary
adenylate cyclase-activating polypeptide: IUPHAR Review 1', British Journal of
Pharmacology, 166: 4-17.
Hart, Marcia L., Alexandra Meyer, Philip J. Johnson, and Aaron C. Ericsson. 2015. 'Comparative
Evaluation of DNA Extraction Methods from Feces of Multiple Host Species for
Downstream Next-Generation Sequencing', PLoS One, 10: e0143334.
Hauk, V., L. Fraccaroli, E. Grasso, A. Eimon, R. Ramhorst, O. Hubscher, and C. Perez Leiros.
2014. 'Monocytes from Sjogren's syndrome patients display increased vasoactive
intestinal peptide receptor 2 expression and impaired apoptotic cell phagocytosis', Clin
Exp Immunol, 177: 662-70.
Hayes, Josie, Pier Paolo Peruzzi, and Sean Lawler. 2014. 'MicroRNAs in cancer: biomarkers,
functions and therapy', Trends Mol Med, 20: 460-69.

192
He, Lin, and Gregory J. Hannon. 2004. 'MicroRNAs: small RNAs with a big role in gene
regulation', Nature Reviews Genetics, 5: 522.
Henning, R. J., and D. R. Sawmiller. 2001. 'Vasoactive intestinal peptide: cardiovascular effects',
Cardiovasc Res, 49: 27-37.
Hillenbrand, M., C. Schori, J. Schoppe, and A. Pluckthun. 2015. 'Comprehensive analysis of
heterotrimeric G-protein complex diversity and their interactions with GPCRs in
solution', Proc Natl Acad Sci U S A, 112: E1181-90.
Hoare, Sam R. J. 2005. 'Mechanisms of peptide and nonpeptide ligand binding to Class B G-
protein-coupled receptors', Drug Discovery Today, 10: 417-27.
Hoffman, L. M., S. E. Brooks, M. R. Stein, and L. Schneck. 1994. 'Cyclic AMP causes
differentiation and decreases the expression of neutral glycosphingolipids in cell cultures
derived from a malignant glioma', Biochim Biophys Acta, 1222: 37-44.
Hollister, E. B., K. Riehle, R. A. Luna, E. M. Weidler, M. Rubio-Gonzales, T. A. Mistretta, S.
Raza, H. V. Doddapaneni, G. A. Metcalf, D. M. Muzny, R. A. Gibbs, J. F. Petrosino, R.
J. Shulman, and J. Versalovic. 2015. 'Structure and function of the healthy pre-adolescent
pediatric gut microbiome', Microbiome, 3: 36.
Holscher, H. D., K. L. Faust, L. A. Czerkies, R. Litov, E. E. Ziegler, H. Lessin, T. Hatch, S. Sun,
and K. A. Tappenden. 2012. 'Effects of prebiotic-containing infant formula on
gastrointestinal tolerance and fecal microbiota in a randomized controlled trial', JPEN J
Parenter Enteral Nutr, 36: 95s-105s.
Hosoya, M., C. Kimura, K. Ogi, S. Ohkubo, Y. Miyamoto, H. Kugoh, M. Shimizu, H. Onda, M.
Oshimura, A. Arimura, and et al. 1992. 'Structure of the human pituitary adenylate
cyclase activating polypeptide (PACAP) gene', Biochim Biophys Acta, 1129: 199-206.
Hot, A., and P. Miossec. 2011. 'Effects of interleukin (IL)-17A and IL-17F in human rheumatoid
arthritis synoviocytes', Ann Rheum Dis, 70: 727-32.
Hu, W. P., J. D. Li, C. S. Colwell, and Q. Y. Zhou. 2011. 'Decreased REM sleep and altered
circadian sleep regulation in mice lacking vasoactive intestinal polypeptide', Sleep, 34:
49-56.
Hutvagner, G., J. McLachlan, A. E. Pasquinelli, E. Balint, T. Tuschl, and P. D. Zamore. 2001. 'A
cellular function for the RNA-interference enzyme Dicer in the maturation of the let-7
small temporal RNA', Science, 293: 834-8.
Inglese, J., L. M. Luttrell, J. A. Iniguez-Lluhi, K. Touhara, W. J. Koch, and R. J. Lefkowitz.
1994. 'Functionally active targeting domain of the beta-adrenergic receptor kinase: an
inhibitor of G beta gamma-mediated stimulation of type II adenylyl cyclase', Proc Natl
Acad Sci U S A, 91: 3637-41.
International Human Genome Sequencing, Consortium. 2001. 'Initial sequencing and analysis of
the human genome', Nature, 409: 860.
Ishihara, Takeshi, Ryuichi Shigemoto, Kensaku Mori, Kenji Takahashi, and Shigekazu Nagata.
1992. 'Functional expression and tissue distribution of a novel receptor for vasoactive
intestinal polypeptide', Neuron, 8: 811-19.
Iwase, T., Y. Uehara, H. Shinji, A. Tajima, H. Seo, K. Takada, T. Agata, and Y. Mizunoe. 2010.
'Staphylococcus epidermidis Esp inhibits Staphylococcus aureus biofilm formation and
nasal colonization', Nature, 465: 346-9.
Jakobsson, H. E., T. R. Abrahamsson, M. C. Jenmalm, K. Harris, C. Quince, C. Jernberg, B.
Bjorksten, L. Engstrand, and A. F. Andersson. 2014. 'Decreased gut microbiota diversity,

193
delayed Bacteroidetes colonisation and reduced Th1 responses in infants delivered by
caesarean section', Gut, 63: 559-66.
Jenkins, T. A., J. C. Nguyen, K. E. Polglaze, and P. P. Bertrand. 2016. 'Influence of Tryptophan
and Serotonin on Mood and Cognition with a Possible Role of the Gut-Brain Axis',
Nutrients, 8.
Ji, I., C. Lee, Y. Song, P. M. Conn, and T. H. Ji. 2002. 'Cis- and trans-activation of hormone
receptors: the LH receptor', Mol Endocrinol, 16: 1299-308.
Jiang, X., H. Jing, and D. Ganea. 2002. 'VIP and PACAP down-regulate CXCL10 (IP-10) and
up-regulate CCL22 (MDC) in spleen cells', J Neuroimmunol, 133: 81-94.
Jimeno, R., R. P. Gomariz, I. Gutierrez-Canas, C. Martinez, Y. Juarranz, and J. Leceta. 2010.
'New insights into the role of VIP on the ratio of T-cell subsets during the development of
autoimmune diabetes', Immunol Cell Biol, 88: 734-45.
Jimeno, R., J. Leceta, M. Garin, A. M. Ortiz, M. Mellado, J. M. Rodriguez-Frade, C. Martinez,
S. Perez-Garcia, R. P. Gomariz, and Y. Juarranz. 2015. 'Th17 polarization of memory Th
cells in early arthritis: the vasoactive intestinal peptide effect', J Leukoc Biol, 98: 257-69.
Johnson, Jethro S., Monica N. Opiyo, Marian Thomson, Karim Gharbi, Jonathan R. Seckl,
Andreas Heger, and Karen E. Chapman. 2016. '11β-hydroxysteroid dehydrogenase-1
deficiency alters the gut microbiome response to Western diet', J Endocrinol, 232: 273-
83.
Jonsson, M., O. Norrgard, and S. Forsgren. 2012. 'Epithelial expression of vasoactive intestinal
peptide in ulcerative colitis: down-regulation in markedly inflamed colon', Dig Dis Sci,
57: 303-10.
Joost, P., and A. Methner. 2002. 'Phylogenetic analysis of 277 human G-protein-coupled
receptors as a tool for the prediction of orphan receptor ligands', Genome Biol, 3:
Research0063.
Jordan, F., M. Lauria, M. Scotti, T. P. Nguyen, P. Praveen, M. Morine, and C. Priami. 2015.
'Diversity of key players in the microbial ecosystems of the human body', Sci Rep, 5:
15920.
Kakarala, Kavita Kumari, and Kaiser Jamil. 2014. 'Sequence-structure based phylogeny of
GPCR Class A Rhodopsin receptors', Molecular Phylogenetics and Evolution, 74: 66-96.
Kanehisa, M., M. Furumichi, M. Tanabe, Y. Sato, and K. Morishima. 2017. 'KEGG: new
perspectives on genomes, pathways, diseases and drugs', Nucleic Acids Res, 45: D353-
d61.
Kanehisa, M., and S. Goto. 2000. 'KEGG: kyoto encyclopedia of genes and genomes', Nucleic
Acids Res, 28: 27-30.
Kanehisa, M., S. Goto, Y. Sato, M. Furumichi, and M. Tanabe. 2012. 'KEGG for integration and
interpretation of large-scale molecular data sets', Nucleic Acids Res, 40: D109-14.
Kanehisa, M., Y. Sato, M. Kawashima, M. Furumichi, and M. Tanabe. 2016. 'KEGG as a
reference resource for gene and protein annotation', Nucleic Acids Res, 44: D457-62.
Kasselman, L. J., N. A. Vernice, J. DeLeon, and A. B. Reiss. 2018. 'The gut microbiome and
elevated cardiovascular risk in obesity and autoimmunity', Atherosclerosis, 271: 203-13.
Kasubuchi, M., S. Hasegawa, T. Hiramatsu, A. Ichimura, and I. Kimura. 2015. 'Dietary gut
microbial metabolites, short-chain fatty acids, and host metabolic regulation', Nutrients,
7: 2839-49.

194
Kawasaki, Shinji, Tsuyoshi Mimura, Takumi Satoh, Kouji Takeda, and Youichi Niimura. 2006.
'Response of the Microaerophilic Bifidobacterium Species, B. boum and B.
thermophilum, to Oxygen', Appl Environ Microbiol, 72: 6854-58.
Kinashi, T., and K. Katagiri. 2005. 'Regulation of immune cell adhesion and migration by
regulator of adhesion and cell polarization enriched in lymphoid tissues', Immunology,
116: 164-71.
Kiss, Tamás. 2001. 'Small nucleolar RNA‐guided post‐transcriptional modification of cellular
RNAs', Embo j, 20: 3617-22.
Kitts, P. A., D. M. Church, F. Thibaud-Nissen, J. Choi, V. Hem, V. Sapojnikov, R. G. Smith, T.
Tatusova, C. Xiang, A. Zherikov, M. DiCuccio, T. D. Murphy, K. D. Pruitt, and A.
Kimchi. 2016. 'Assembly: a resource for assembled genomes at NCBI', Nucleic Acids
Res, 44: D73-80.
Kleuss, Christiane, André S Raw, Ethan Lee, Stephen R Sprang, and Alfred G Gilman. 1994.
'Mechanism of GTP hydrolysis by G-protein alpha subunits', Proceedings of the National
Academy of Sciences, 91: 9828-31.
Kobilka, B. K. 1995. 'Amino and carboxyl terminal modifications to facilitate the production and
purification of a G protein-coupled receptor', Anal Biochem, 231: 269-71.
Kong, H. H. 2011. 'Skin microbiome: genomics-based insights into the diversity and role of skin
microbes', Trends Mol Med, 17: 320-8.
Kong, H. H., J. Oh, C. Deming, S. Conlan, E. A. Grice, M. A. Beatson, E. Nomicos, E. C.
Polley, H. D. Komarow, P. R. Murray, M. L. Turner, and J. A. Segre. 2012. 'Temporal
shifts in the skin microbiome associated with disease flares and treatment in children with
atopic dermatitis', Genome Res, 22: 850-9.
Korkmaz, O. T., N. Tuncel, M. Tuncel, E. M. Oncu, V. Sahinturk, and M. Celik. 2010.
'Vasoactive intestinal peptide (VIP) treatment of Parkinsonian rats increases thalamic
gamma-aminobutyric acid (GABA) levels and alters the release of nerve growth factor
(NGF) by mast cells', J Mol Neurosci, 41: 278-87.
Korn, Thomas, Estelle Bettelli, Mohamed Oukka, and Vijay K. Kuchroo. 2009. 'IL-17 and Th17
Cells', Annu Rev Immunol, 27: 485-517.
Koval, Alexey, Vladimir Purvanov, Diane Egger-Adam, and Vladimir L. Katanaev. 2011.
'Yellow submarine of the Wnt/Frizzled signaling: Submerging from the G protein harbor
to the targets', Biochemical Pharmacology, 82: 1311-19.
Kristensen, Bo, Birgitte Georg, and Jan Fahrenkrug. 1997. 'Cholinergic regulation of VIP gene
expression in human neuroblastoma cells', Brain Research, 775: 99-106.
Kubinak, J. L., C. Petersen, W. Z. Stephens, R. Soto, E. Bake, R. M. O'Connell, and J. L. Round.
2015. 'MyD88 signaling in T cells directs IgA-mediated control of the microbiota to
promote health', Cell Host Microbe, 17: 153-63.
Kuczynski, J., J. Stombaugh, W. A. Walters, A. Gonzalez, J. G. Caporaso, and R. Knight. 2012.
'Using QIIME to analyze 16S rRNA gene sequences from microbial communities', Curr
Protoc Microbiol, Chapter 1: Unit 1E.5.
Kuhl, A. A., C. Loddenkemper, J. Westermann, and J. C. Hoffmann. 2002. 'Role of gamma delta
T cells in inflammatory bowel disease', Pathobiology, 70: 150-5.
Kumar, Sudhir, and S. Blair Hedges. 1998. 'A molecular timescale for vertebrate evolution',
Nature, 392: 917-20.

195
Kuncova, J., J. Chvojka, R. Sykora, J. Sviglerova, M. Stengl, L. Nalos, A. Krouzecky, and M.
Matejovic. 2011. 'Tissue concentrations of vasoactive intestinal peptide are affected by
peritonitis-induced sepsis and hemofiltration in pigs', Physiol Res, 60: 531-40.
Laburthe, Marc, Alain Couvineau, and Var Tan. 2007. 'Class II G protein-coupled receptors for
VIP and PACAP: Structure, models of activation and pharmacology', Peptides, 28: 1631-
39.
Lampinen, M., M. Carlson, L. D. Hakansson, and P. Venge. 2004. 'Cytokine-regulated
accumulation of eosinophils in inflammatory disease', Allergy, 59: 793-805.
Lampinen, M., M. Carlson, P. Sangfelt, Y. Taha, M. Thorn, L. Loof, Y. Raab, and P. Venge.
2001. 'IL-5 and TNF-alpha participate in recruitment of eosinophils to intestinal mucosa
in ulcerative colitis', Dig Dis Sci, 46: 2004-9.
Lampinen, M., A. Ronnblom, K. Amin, G. Kristjansson, F. Rorsman, P. Sangfelt, B. Safsten, M.
Wagner, A. Wanders, O. Winqvist, and M. Carlson. 2005. 'Eosinophil granulocytes are
activated during the remission phase of ulcerative colitis', Gut, 54: 1714-20.
Lange, T., S. Dimitrov, and J. Born. 2010. 'Effects of sleep and circadian rhythm on the human
immune system', Ann N Y Acad Sci, 1193: 48-59.
Langille, Morgan G. I., Jesse Zaneveld, J. Gregory Caporaso, Daniel McDonald, Dan Knights,
Joshua A. Reyes, Jose C. Clemente, Deron E. Burkepile, Rebecca L. Vega Thurber, Rob
Knight, Robert G. Beiko, and Curtis Huttenhower. 2013. 'Predictive functional profiling
of microbial communities using 16S rRNA marker gene sequences', Nature
Biotechnology, 31: 814.
Larkey, Nicholas E., C. Kyle Almlie, Victoria Tran, Marianne Egan, and Sean M. Burrows.
2014. 'Detection of miRNA Using a Double-Strand Displacement Biosensor with a Self-
Complementary Fluorescent Reporter', Analytical Chemistry, 86: 1853-63.
Larmonier, C. B., K. W. Shehab, F. K. Ghishan, and P. R. Kiela. 2015. 'T Lymphocyte
Dynamics in Inflammatory Bowel Diseases: Role of the Microbiome', Biomed Res Int,
2015: 504638.
Lau, N. C., L. P. Lim, E. G. Weinstein, and D. P. Bartel. 2001. 'An abundant class of tiny RNAs
with probable regulatory roles in Caenorhabditis elegans', Science, 294: 858-62.
Layden, B. T., A. R. Angueira, M. Brodsky, V. Durai, and W. L. Lowe, Jr. 2013. 'Short chain
fatty acids and their receptors: new metabolic targets', Transl Res, 161: 131-40.
LeBlanc, J. G., C. Milani, G. S. de Giori, F. Sesma, D. van Sinderen, and M. Ventura. 2013.
'Bacteria as vitamin suppliers to their host: a gut microbiota perspective', Curr Opin
Biotechnol, 24: 160-8.
Leceta, J., R. P. Gomariz, C. Martinez, C. Abad, D. Ganea, and M. Delgado. 2000. 'Receptors
and transcriptional factors involved in the anti-inflammatory activity of VIP and
PACAP', Ann N Y Acad Sci, 921: 92-102.
Lee, L. T., J. K. Tam, D. W. Chan, and B. K. Chow. 2009. 'Molecular cloning and mRNA
distribution of pituitary adenylate cyclase-activating polypeptide (PACAP)/PACAP-
related peptide in the lungfish', Ann N Y Acad Sci, 1163: 209-14.
Lee, R. C., R. L. Feinbaum, and V. Ambros. 1993. 'The C. elegans heterochronic gene lin-4
encodes small RNAs with antisense complementarity to lin-14', Cell, 75: 843-54.
Lee, Y., M. Kim, J. Han, K. H. Yeom, S. Lee, S. H. Baek, and V. N. Kim. 2004. 'MicroRNA
genes are transcribed by RNA polymerase II', Embo j, 23: 4051-60.

196
Lemay, V., A. Hossain, Y. N. Osheim, A. L. Beyer, and F. Dragon. 2011. 'Identification of novel
proteins associated with yeast snR30 small nucleolar RNA', Nucleic Acids Res, 39: 9659-
70.
Ley, R. E., F. Backhed, P. Turnbaugh, C. A. Lozupone, R. D. Knight, and J. I. Gordon. 2005.
'Obesity alters gut microbial ecology', Proc Natl Acad Sci USA, 102.
Ley, Ruth E., Peter J. Turnbaugh, Samuel Klein, and Jeffrey I. Gordon. 2006. 'Microbial
ecology: Human gut microbes associated with obesity', Nature, 444: 1022-23.
Li, L., and Y. Liu. 2011. 'Diverse small non-coding RNAs in RNA interference pathways',
Methods Mol Biol, 764: 169-82.
Liang, X., F. D. Bushman, and G. A. FitzGerald. 2015. 'Rhythmicity of the intestinal microbiota
is regulated by gender and the host circadian clock', Proc Natl Acad Sci U S A, 112:
10479-84.
Linder, Maurine E, Pamela Middleton, John R Hepler, Ronald Taussig, Alfred G Gilman, and
Susanne M Mumby. 1993. 'Lipid modifications of G proteins: alpha subunits are
palmitoylated', Proceedings of the National Academy of Sciences, 90: 3675-79.
Linder, Maurine E, Iok-Hou Pang, Robert J Duronio, Jeffrey I Gordon, Paul C Sternweis, and
Alfred G Gilman. 1991. 'Lipid modifications of G protein subunits. Myristoylation of Go
alpha increases its affinity for beta gamma', Journal of Biological Chemistry, 266: 4654-
59.
Liu, Hui-Xin, Clarissa Santos Rocha, Satya Dandekar, and Yu-Jui Yvonne Wan. 2016.
'Functional analysis of the relationship between intestinal microbiota and the expression
of hepatic genes and pathways during the course of liver regeneration', Journal of
hepatology, 64: 641-50.
Liu, Weipeng, Xiaoming Zhou, and Da Xing. 2014. 'Rapid and reliable microRNA detection by
stacking hybridization on electrochemiluminescent chip system', Biosensors and
Bioelectronics, 58: 388-94.
Liu, Y. J., Y. F. Guo, L. S. Zhang, Y. F. Pei, N. Yu, P. Yu, C. J. Papasian, and H. W. Deng.
2010. 'Biological pathway-based genome-wide association analysis identified the
vasoactive intestinal peptide (VIP) pathway important for obesity', Obesity (Silver
Spring), 18: 2339-46.
Liu, Yu, Arnold E. Ruoho, Vibha D. Rao, and James H. Hurley. 1997. 'Catalytic mechanism of
the adenylyl and guanylyl cyclases: Modeling and mutational analysis', Proceedings of
the National Academy of Sciences, 94: 13414-19.
Logothetis, D. E., Y. Kurachi, J. Galper, E. J. Neer, and D. E. Clapham. 1987. 'The beta gamma
subunits of GTP-binding proteins activate the muscarinic K+ channel in heart', Nature,
325: 321-6.
Lomer, M. C., K. Kodjabashia, C. Hutchinson, S. M. Greenfield, R. P. Thompson, and J. J.
Powell. 2004. 'Intake of dietary iron is low in patients with Crohn's disease: a case-
control study', Br J Nutr, 91: 141-8.
Lorenzo-Díaz, Fabián, Virtu Solano-Collado, Rudi Lurz, Alicia Bravo, and Manuel Espinosa.
2012. 'Autoregulation of the Synthesis of the MobM Relaxase Encoded by the
Promiscuous Plasmid pMV158', Journal of Bacteriology, 194: 1789-99.
Love, J. A., V. L. Go, and J. H. Szurszewski. 1988. 'Vasoactive intestinal peptide and other
peptides as neuromodulators of colonic motility in the guinea pig', Ann N Y Acad Sci,
527: 360-8.

197
Lu, T. X., E. J. Lim, J. A. Besse, S. Itskovich, A. J. Plassard, P. C. Fulkerson, B. J. Aronow, and
M. E. Rothenberg. 2013. 'MiR-223 deficiency increases eosinophil progenitor
proliferation', J Immunol, 190: 1576-82.
Lucassen, E. A., H. C. van Diepen, T. Houben, S. Michel, C. S. Colwell, and J. H. Meijer. 2012.
'Role of vasoactive intestinal peptide in seasonal encoding by the suprachiasmatic
nucleus clock', Eur J Neurosci, 35: 1466-74.
Luckey, T. D. 1972. 'Introduction to intestinal microecology', The American Journal of Clinical
Nutrition, 25: 1292-94.
Lundberg, J. M., J. Fahrenkrug, T. Hokfelt, C. R. Martling, O. Larsson, K. Tatemoto, and A.
Anggard. 1984. 'Co-existence of peptide HI (PHI) and VIP in nerves regulating blood
flow and bronchial smooth muscle tone in various mammals including man', Peptides, 5:
593-606.
Luo, R., S. J. Jeong, Z. Jin, N. Strokes, S. Li, and X. Piao. 2011. 'G protein-coupled receptor 56
and collagen III, a receptor-ligand pair, regulates cortical development and lamination',
Proc Natl Acad Sci U S A, 108: 12925-30.
Luttrell, Louis M, Yehia Daaka, and Robert J Lefkowitz. 1999. 'Regulation of tyrosine kinase
cascades by G-protein-coupled receptors', Current opinion in cell biology, 11: 177-83.
Madaan, Alka, Ritu Verma, Anu T Singh, Swatantra Kumar Jain, and Manu Jaggi. 2014. 'A
stepwise procedure for isolation of murine bone marrow and generation of dendritic
cells', 2014.
Makris, A., A. Piperopoulos, and I. Karmaniolou. 2014. 'Multiple sclerosis: basic knowledge and
new insights in perioperative management', J Anesth, 28: 267-78.
Markby, David W, Rene Onrust, and Henry R Bourne. 1993. 'Separate GTP binding and GTPase
activating domains of a G alpha subunit', Science, 262: 1895-901.
Marshall, B. J., and J. R. Warren. 1984. 'Unidentified curved bacilli in the stomach of patients
with gastritis and peptic ulceration', Lancet, 1: 1311-5.
Martinez, C., A. M. Ortiz, Y. Juarranz, A. Lamana, I. V. Seoane, J. Leceta, R. Garcia-Vicuna, R.
P. Gomariz, and I. Gonzalez-Alvaro. 2014. 'Serum levels of vasoactive intestinal peptide
as a prognostic marker in early arthritis', PLoS One, 9: e85248.
Matranga, C., Y. Tomari, C. Shin, D. P. Bartel, and P. D. Zamore. 2005. 'Passenger-strand
cleavage facilitates assembly of siRNA into Ago2-containing RNAi enzyme complexes',
Cell, 123: 607-20.
Maudsley, S., S. A. Patel, S. S. Park, L. M. Luttrell, and B. Martin. 2012. 'Functional signaling
biases in G protein-coupled receptors: Game Theory and receptor dynamics', Mini Rev
Med Chem, 12: 831-40.
Mazmanian, S. K., C. H. Liu, A. O. Tzianabos, and D. L. Kasper. 2005. 'An immunomodulatory
molecule of symbiotic bacteria directs maturation of the host immune system', Cell, 122:
107-18.
Mazmanian, Sarkis K., June L. Round, and Dennis L. Kasper. 2008. 'A microbial symbiosis
factor prevents intestinal inflammatory disease', Nature, 453: 620.
Michino, Mayako, Enrique Abola, Gpcr Dock participants, Charles L. Brooks Iii, J. Scott Dixon,
John Moult, and Raymond C. Stevens. 2009. 'Community-wide assessment of GPCR
structure modelling and ligand docking: GPCR Dock 2008', Nature Reviews Drug
Discovery, 8: 455.
Miescher-Rüsch, Friedrich. 1871. Ueber die chemische Zusammensetzung der Eiterzellen.

198
Mikkelsen, J. D., and J. Fahrenkrug. 1994. 'Concentrations and distribution of vasoactive
intestinal peptide (VIP), peptide histidine isoleucine (PHI) and peptide histidine valine
(PHV) in the cerebral cortex and the suprachiasmatic nucleus of the mouse', Brain Res,
656: 95-107.
Millar, Robert P., Claire L. Newton, and Antonia K. Roseweir. 2012. 'Chapter 2 -
Neuroendocrine GPCR Signaling A2 - Fink, George.' in Donald W. Pfaff and Jon E.
Levine (eds.), Handbook of Neuroendocrinology (Academic Press: San Diego).
Miller, J. E., D. Granados-Fuentes, T. Wang, L. Marpegan, T. E. Holy, and E. D. Herzog. 2014.
'Vasoactive intestinal polypeptide mediates circadian rhythms in mammalian olfactory
bulb and olfaction', J Neurosci, 34: 6040-6.
Mir, A., M. Minguez, J. Tatay, I. Pascual, A. Pena, V. Sanchiz, P. Almela, F. Mora, and A.
Benages. 2002. 'Elevated serum eotaxin levels in patients with inflammatory bowel
disease', Am J Gastroenterol, 97: 1452-7.
Mishra, A., S. P. Hogan, J. J. Lee, P. S. Foster, and M. E. Rothenberg. 1999. 'Fundamental
signals that regulate eosinophil homing to the gastrointestinal tract', J Clin Invest, 103:
1719-27.
Mittelbach Gary, G., F. Steiner Christopher, M. Scheiner Samuel, L. Gross Katherine, L.
Reynolds Heather, B. Waide Robert, R. Willig Michael, I. Dodson Stanley, and Laura
Gough. 2001. 'WHAT IS THE OBSERVED RELATIONSHIP BETWEEN SPECIES
RICHNESS AND PRODUCTIVITY?', Ecology, 82: 2381-96.
Miyake, S., S. Kim, W. Suda, K. Oshima, M. Nakamura, T. Matsuoka, N. Chihara, A. Tomita,
W. Sato, S. W. Kim, H. Morita, M. Hattori, and T. Yamamura. 2015. 'Dysbiosis in the
Gut Microbiota of Patients with Multiple Sclerosis, with a Striking Depletion of Species
Belonging to Clostridia XIVa and IV Clusters', PLoS One, 10: e0137429.
Miyata, A., A. Arimura, R. R. Dahl, N. Minamino, A. Uehara, L. Jiang, M. D. Culler, and D. H.
Coy. 1989. 'Isolation of a novel 38 residue-hypothalamic polypeptide which stimulates
adenylate cyclase in pituitary cells', Biochem Biophys Res Commun, 164: 567-74.
Miyata, A., L. Jiang, R. D. Dahl, C. Kitada, K. Kubo, M. Fujino, N. Minamino, and A. Arimura.
1990. 'Isolation of a neuropeptide corresponding to the N-terminal 27 residues of the
pituitary adenylate cyclase activating polypeptide with 38 residues (PACAP38)', Biochem
Biophys Res Commun, 170: 643-8.
Mohney, R. P., and R. E. Zigmond. 1998. 'Vasoactive intestinal peptide enhances its own
expression in sympathetic neurons after injury', J Neurosci, 18: 5285-93.
Moodley, Y., B. Linz, Y. Yamaoka, H. M. Windsor, S. Breurec, J. Y. Wu, A. Maady, S.
Bernhoft, J. M. Thiberge, S. Phuanukoonnon, G. Jobb, P. Siba, D. Y. Graham, B. J.
Marshall, and M. Achtman. 2009. 'The peopling of the Pacific from a bacterial
perspective', Science, 323: 527-30.
Moody, T. W., G. Czerwinski, N. I. Tarasova, and C. J. Michejda. 2002. 'VIP-ellipticine
derivatives inhibit the growth of breast cancer cells', Life Sci, 71: 1005-14.
Morampudi, V., V. S. Conlin, U. Dalwadi, X. Wu, K. C. Marshall, C. Nguyen, B. A. Vallance,
and K. Jacobson. 2015. 'Vasoactive intestinal peptide prevents PKCepsilon-induced
intestinal epithelial barrier disruption during EPEC infection', Am J Physiol Gastrointest
Liver Physiol, 308: G389-402.
Morimoto, J., S. J. Simpson, and F. Ponton. 2017. 'Direct and trans-generational effects of male
and female gut microbiota in Drosophila melanogaster', Biol Lett, 13.

199
Mosli, M. H., J. Rivera-Nieves, and B. G. Feagan. 2014. 'T-cell trafficking and anti-adhesion
strategies in inflammatory bowel disease: current and future prospects', Drugs, 74: 297-
311.
Murphy, E. A., K. T. Velazquez, and K. M. Herbert. 2015. 'Influence of high-fat diet on gut
microbiota: a driving force for chronic disease risk', Curr Opin Clin Nutr Metab Care,
18: 515-20.
Murthy, KS, KM Zhang, JG Jin, JR Grider, and GM Makhlouf. 1993. 'VIP-mediated G protein-
coupled Ca2+ influx activates a constitutive NOS in dispersed gastric muscle cells',
American Journal of Physiology-Gastrointestinal and Liver Physiology, 265: G660-G71.
Mutt, Viktor, and Sami I. Said. 1974. 'Structure of the Porcine Vasoactive Intestinal
Octacosapeptide', European Journal of Biochemistry, 42: 581-89.
Muzes, G., B. Molnar, and F. Sipos. 2012. 'Regulatory T cells in inflammatory bowel diseases
and colorectal cancer', World J Gastroenterol, 18: 5688-94.
Naor, Zvi, Outhiriaradjou Benard, and Rony Seger. 2000. 'Activation of MAPK cascades by G-
protein-coupled receptors: the case of gonadotropin-releasing hormone receptor', Trends
in Endocrinology & Metabolism, 11: 91-99.
Naseribafrouei, A., K. Hestad, E. Avershina, M. Sekelja, A. Linlokken, R. Wilson, and K. Rudi.
2014. 'Correlation between the human fecal microbiota and depression',
Neurogastroenterol Motil, 26: 1155-62.
Natochin, M., K. G. Gasimov, and N. O. Artemyev. 2001. 'Inhibition of GDP/GTP exchange on
G alpha subunits by proteins containing G-protein regulatory motifs', Biochemistry, 40:
5322-8.
Neer, E. J. 1976. 'The size of adenylate cyclase and guanylate cyclase from the rat renal medulla',
J Supramol Struct, 4: 51-61.
Neufeld, K. M., N. Kang, J. Bienenstock, and J. A. Foster. 2011. 'Reduced anxiety‐like behavior
and central neurochemical change in germ‐free mice', Neurogastroenterology & Motility,
23: 255-e119.
Ng, Stephanie Y. L., Billy K. C. Chow, Jun Kasamatsu, Masanori Kasahara, and Leo T. O. Lee.
2012. 'Agnathan VIP, PACAP and Their Receptors: Ancestral Origins of Today's Highly
Diversified Forms', PLoS One, 7: e44691.
Nilsson, A. 1975. 'Structure of the vasoactive intestinal octacosapeptide from chicken intestine.
The amino acid sequence', FEBS Lett, 60: 322-6.
Noel, Joseph P, Heidi E Hamm, and Paul B Sigler. 1993. 'The 2.2 Å crystal structure of
transducin-α complexed with GTPγS', Nature, 366: 654.
Noguchi, Koichi, Emiko Senba, Yasuhiro Morita, Makoto Sato, and Masaya Tohyama. 1989.
'Prepro-VIP and preprotachykinin mRNAs in the rat dorsal root ganglion cells following
peripheral axotomy', Molecular Brain Research, 6: 327-30.
Nussdorfer, Gastone G., and Ludwik K. Malendowicz. 1998. 'Role of VIP, PACAP, and related
peptides in the regulation of the hypothalamo—pituitary–adrenal axis', Peptides, 19:
1443-67.
O'Dorisio, M. S., N. S. Hermina, T. M. O'Dorisio, and S. P. Balcerzak. 1981. 'Vasoactive
intestinal polypeptide modulation of lymphocyte adenylate cyclase', J Immunol, 127:
2551-4.
O'Hara, Andrea J., Ling Wang, Bruce J. Dezube, William J. Harrington, Blossom Damania, and
Dirk P. Dittmer. 2009. 'Tumor suppressor microRNAs are underrepresented in primary
effusion lymphoma and Kaposi sarcoma', Blood, 113: 5938-41.

200
Ochoa-Reparaz, J., D. W. Mielcarz, L. E. Ditrio, A. R. Burroughs, D. M. Foureau, S. Haque-
Begum, and L. H. Kasper. 2009. 'Role of gut commensal microflora in the development
of experimental autoimmune encephalomyelitis', J Immunol, 183: 6041-50.
Odamaki, Toshitaka, Kumiko Kato, Hirosuke Sugahara, Nanami Hashikura, Sachiko Takahashi,
Jin-zhong Xiao, Fumiaki Abe, and Ro Osawa. 2016. 'Age-related changes in gut
microbiota composition from newborn to centenarian: a cross-sectional study', BMC
Microbiology, 16: 90.
Offen, D., Y. Sherki, E. Melamed, M. Fridkin, D. E. Brenneman, and I. Gozes. 2000. 'Vasoactive
intestinal peptide (VIP) prevents neurotoxicity in neuronal cultures: relevance to
neuroprotection in Parkinson's disease', Brain Res, 854: 257-62.
Okada, T., O. P. Ernst, K. Palczewski, and K. P. Hofmann. 2001. 'Activation of rhodopsin: new
insights from structural and biochemical studies', Trends Biochem Sci, 26: 318-24.
Okazaki, Kimitake, Chiharu Kimura, Takuo Kosaka, Takuya Watanabe, Shoichi Ohkubo,
Kazuhiro Ogi, Chieko Kitada, Haruo Onda, and Masahiko Fujino. 1992. 'Expression of
human pituitary adenylate cyclase activating polypeptide (PACAP) cDNA in CHO cells
and characterization of the products', FEBS Lett, 298: 49-56.
Oldham, William M, and Heidi E Hamm. 2008. 'Heterotrimeric G protein activation by G-
protein-coupled receptors', Nature reviews Molecular cell biology, 9: 60.
Otero, L. L., V. E. Ruiz, and G. I. Perez Perez. 2014. 'Helicobacter pylori: the balance between a
role as colonizer and pathogen', Best Pract Res Clin Gastroenterol, 28: 1017-29.
Ottman, Noora, Hauke Smidt, and Clara Belzer. 2012. 'The function of our microbiota: who is
out there and what do they do?', Frontiers in Cellular and Infection Microbiology, 2.
Overington, J. P., B. Al-Lazikani, and A. L. Hopkins. 2006. 'How many drug targets are there?',
Nat Rev Drug Discov, 5: 993-6.
Palczewski, Krzysztof, Takashi Kumasaka, Tetsuya Hori, Craig A. Behnke, Hiroyuki
Motoshima, Brian A. Fox, Isolde Le Trong, David C. Teller, Tetsuji Okada, Ronald E.
Stenkamp, Masaki Yamamoto, and Masashi Miyano. 2000. 'Crystal Structure of
Rhodopsin: A G Protein-Coupled Receptor', Science, 289: 739-45.
Palle, Connie, Bent Ottesen, and Jan Fahrenkrug. 1992. 'Peptide histidine valine (PHV) is
present and biologically active in the human female genital tract', Regulatory Peptides,
38: 101-09.
Palmer, C., E. M. Bik, D. B. Digiulio, D. A. Relman, and P. O. Brown. 2007. 'Development of
the Human Infant Intestinal Microbiota', PLoS Biol, 5.
Pantaloni, C, P Brabet, B Bilanges, A Dumuis, S Houssami, D Spengler, J Bockaert, and L
Journot. 1996. 'Alternative splicing in the N-terminal domain of the PACAP receptor
modulates receptor selectivity and relative potencies of PACAP-27 and-38 in
phospholipase C activation', J. Biol. Chem, 271: 22146-51.
Parker, D. S., J. P. Raufman, T. L. O'Donohue, M. Bledsoe, H. Yoshida, and J. J. Pisano. 1984.
'Amino acid sequences of helospectins, new members of the glucagon superfamily, found
in Gila monster venom', J Biol Chem, 259: 11751-5.
Patterson, C. C., G. Dahlquist, G. Soltesz, and A. Green. 2001. 'Is childhood-onset type I
diabetes a wealth-related disease? An ecological analysis of European incidence rates',
Diabetologia, 44 Suppl 3: B9-16.
Pauls, S., N. C. Foley, D. K. Foley, J. LeSauter, M. H. Hastings, E. S. Maywood, and R. Silver.
2014. 'Differential contributions of intra-cellular and inter-cellular mechanisms to the
spatial and temporal architecture of the suprachiasmatic nucleus circadian circuitry in

201
wild-type, cryptochrome-null and vasoactive intestinal peptide receptor 2-null mutant
mice', Eur J Neurosci, 40: 2528-40.
Peng, Yang, Jin-Jun Guo, Yan-Min Liu, and Xiao-Ling Wu. 2014. 'MicroRNA-34A inhibits the
growth, invasion and metastasis of gastric cancer by targeting PDGFR and MET
expression', Biosci Rep, 34: e00112.
Petkov, V., W. Mosgoeller, R. Ziesche, M. Raderer, L. Stiebellehner, K. Vonbank, G. C. Funk,
G. Hamilton, C. Novotny, B. Burian, and L. H. Block. 2003. 'Vasoactive intestinal
peptide as a new drug for treatment of primary pulmonary hypertension', J Clin Invest,
111: 1339-46.
Petra, A. I., S. Panagiotidou, E. Hatziagelaki, J. M. Stewart, P. Conti, and T. C. Theoharides.
2015. 'Gut-Microbiota-Brain Axis and Its Effect on Neuropsychiatric Disorders With
Suspected Immune Dysregulation', Clin Ther, 37: 984-95.
Petter-Lane, W. 1962. 'The Provision and Use of Pathogen-free Laboratory Animals',
Proceedings of the Royal Society of Medicine, 55: 253-63.
Pin, J. P., J. Kniazeff, C. Goudet, A. S. Bessis, J. Liu, T. Galvez, F. Acher, P. Rondard, and L.
Prézeau. 2004. 'The activation mechanism of class-C G-protein coupled receptors',
Biology of the Cell, 96: 335-42.
Pitcher, Julie A, James Inglese, Joyce B Higgins, Jeffery L Arriza, Patrick J Casey, Chong Kim,
Jeffery L Benovic, Madan M Kwatra, Marc G Caron, and Robert J Lefkowitz. 1992.
'Role of beta gamma subunits of G proteins in targeting the beta-adrenergic receptor
kinase to membrane-bound receptors', Science, 257: 1264-67.
Pull, S. L., J. M. Doherty, J. C. Mills, J. I. Gordon, and T. S. Stappenbeck. 2005. 'Activated
macrophages are an adaptive element of the colonic epithelial progenitor niche necessary
for regenerative responses to injury', Proc Natl Acad Sci U S A, 102: 99-104.
Qin, J., R. Li, J. Raes, M. Arumugam, K. S. Burgdorf, C. Manichanh, T. Nielsen, N. Pons, F.
Levenez, T. Yamada, D. R. Mende, J. Li, J. Xu, S. Li, D. Li, J. Cao, B. Wang, H. Liang,
H. Zheng, Y. Xie, J. Tap, P. Lepage, M. Bertalan, J. M. Batto, T. Hansen, D. Le Paslier,
A. Linneberg, H. B. Nielsen, E. Pelletier, P. Renault, T. Sicheritz-Ponten, K. Turner, H.
Zhu, C. Yu, S. Li, M. Jian, Y. Zhou, Y. Li, X. Zhang, S. Li, N. Qin, H. Yang, J. Wang, S.
Brunak, J. Dore, F. Guarner, K. Kristiansen, O. Pedersen, J. Parkhill, J. Weissenbach, P.
Bork, S. D. Ehrlich, and J. Wang. 2010. 'A human gut microbial gene catalogue
established by metagenomic sequencing', Nature, 464: 59-65.
Quast, Christian, Elmar Pruesse, Pelin Yilmaz, Jan Gerken, Timmy Schweer, Pablo Yarza, Jörg
Peplies, and Frank Oliver Glöckner. 2013. 'The SILVA ribosomal RNA gene database
project: improved data processing and web-based tools', Nucleic Acids Res, 41: D590-
D96.
Quesada, M. A., H. S. Rye, J. C. Gingrich, A. N. Glazer, and R. A. Mathies. 1991. 'High-
sensitivity DNA detection with a laser-excited confocal fluorescence gel scanner',
Biotechniques, 10: 616-25.
Rabot, S., M. Membrez, F. Blancher, B. Berger, D. Moine, L. Krause, R. Bibiloni, A. Bruneau,
P. Gerard, J. Siddharth, C. L. Lauber, and C. J. Chou. 2016. 'High fat diet drives obesity
regardless the composition of gut microbiota in mice', Sci Rep, 6: 32484.
Rakhilin, S. V., P. A. Olson, A. Nishi, N. N. Starkova, A. A. Fienberg, A. C. Nairn, D. J.
Surmeier, and P. Greengard. 2004. 'A network of control mediated by regulator of
calcium/calmodulin-dependent signaling', Science, 306: 698-701.

202
Rampelli, S., S. L. Schnorr, C. Consolandi, S. Turroni, M. Severgnini, C. Peano, P. Brigidi, A.
N. Crittenden, A. G. Henry, and M. Candela. 2015. 'Metagenome Sequencing of the
Hadza Hunter-Gatherer Gut Microbiota', Curr Biol, 25: 1682-93.
Rand, T. A., S. Petersen, F. Du, and X. Wang. 2005. 'Argonaute2 cleaves the anti-guide strand of
siRNA during RISC activation', Cell, 123: 621-9.
Rangon, C. M., E. Dicou, S. Goursaud, L. Mounien, S. Jegou, T. Janet, J. M. Muller, V. Lelievre,
and P. Gressens. 2006. 'Mechanisms of VIP-induced neuroprotection against neonatal
excitotoxicity', Ann N Y Acad Sci, 1070: 512-7.
Reeves, A. E., M. J. Koenigsknecht, I. L. Bergin, and V. B. Young. 2012. 'Suppression of
Clostridium difficile in the gastrointestinal tracts of germfree mice inoculated with a
murine isolate from the family Lachnospiraceae', Infect Immun, 80: 3786-94.
Reiter, E., S. Marion, F. Robert, C. Troispoux, F. Boulay, F. Guillou, and P. Crepieux. 2001.
'Kinase-inactive G-protein-coupled receptor kinases are able to attenuate follicle-
stimulating hormone-induced signaling', Biochem Biophys Res Commun, 282: 71-8.
Ren, J., H. Ni, M. Kim, K. L. Cooley, R. M. Valenzuela, and C. V. Asche. 2017. 'Allergies,
antibiotics use, and multiple sclerosis', Curr Med Res Opin, 33: 1451-56.
Reubi, J. C. 2000. 'In vitro evaluation of VIP/PACAP receptors in healthy and diseased human
tissues. Clinical implications', Ann N Y Acad Sci, 921: 1-25.
Ridlon, J. M., D. J. Kang, P. B. Hylemon, and J. S. Bajaj. 2014. 'Bile acids and the gut
microbiome', Curr Opin Gastroenterol, 30: 332-8.
Robberecht, Patrick, Marie-Claire Woussen-Colle, Philippe De Neef, Philippe Gourlet, Louis
Buscail, André Vandermeers, Marie-Claire Vandermeers-Piret, and Jean Christophe.
1991. 'The two forms of the pituitary adenylate cyclase activating polypeptide (PACAP
(1–27) and PACAP (1–38)) interact with distinct receptors on rat pancreatic AR 4-2J cell
membranes', FEBS Lett, 286: 133-36.
Robertson, B. R., J. L. O'Rourke, B. A. Neilan, P. Vandamme, S. L. On, J. G. Fox, and A. Lee.
2005. 'Mucispirillum schaedleri gen. nov., sp. nov., a spiral-shaped bacterium colonizing
the mucus layer of the gastrointestinal tract of laboratory rodents', Int J Syst Evol
Microbiol, 55: 1199-204.
Robishaw, Janet D, Murray D Smigel, and Alfred G Gilman. 1986. 'Molecular basis for two
forms of the G protein that stimulates adenylate cyclase', Journal of Biological
Chemistry, 261: 9587-90.
Rodríguez-Dorantes, Mauricio, A. Ivan Salido-Guadarrama, and Pilar García-Tobilla. 2014.
'Prostate Cancer Detection Using a Noninvasive Method for Quantifying miRNAs.' in
Martha Robles-Flores (ed.), Cancer Cell Signaling: Methods and Protocols (Springer
New York: New York, NY).
Rothberg, J. M., W. Hinz, T. M. Rearick, J. Schultz, W. Mileski, M. Davey, J. H. Leamon, K.
Johnson, M. J. Milgrew, M. Edwards, J. Hoon, J. F. Simons, D. Marran, J. W. Myers, J.
F. Davidson, A. Branting, J. R. Nobile, B. P. Puc, D. Light, T. A. Clark, M. Huber, J. T.
Branciforte, I. B. Stoner, S. E. Cawley, M. Lyons, Y. Fu, N. Homer, M. Sedova, X. Miao,
B. Reed, J. Sabina, E. Feierstein, M. Schorn, M. Alanjary, E. Dimalanta, D. Dressman, R.
Kasinskas, T. Sokolsky, J. A. Fidanza, E. Namsaraev, K. J. McKernan, A. Williams, G.
T. Roth, and J. Bustillo. 2011. 'An integrated semiconductor device enabling non-optical
genome sequencing', Nature, 475: 348-52.
Rothenberg, M. E., R. Ownbey, P. D. Mehlhop, P. M. Loiselle, M. van de Rijn, J. V. Bonventre,
H. C. Oettgen, P. Leder, and A. D. Luster. 1996. 'Eotaxin triggers eosinophil-selective

203
chemotaxis and calcium flux via a distinct receptor and induces pulmonary eosinophilia
in the presence of interleukin 5 in mice', Mol Med, 2: 334-48.
Rutayisire, E., K. Huang, Y. Liu, and F. Tao. 2016. 'The mode of delivery affects the diversity
and colonization pattern of the gut microbiota during the first year of infants' life: a
systematic review', BMC Gastroenterol, 16: 86.
Sadelain, M. W., H. Y. Qin, J. Lauzon, and B. Singh. 1990. 'Prevention of type I diabetes in
NOD mice by adjuvant immunotherapy', Diabetes, 39: 583-9.
Said, S. I., and V. Mutt. 1970. 'Polypeptide with broad biological activity: isolation from small
intestine', Science, 169: 1217-8.
Said, Sami I., and Viktor Mutt. 1972. 'Isolation from Porcine-Intestinal Wall of a Vasoactive
Octacosapeptide Related to Secretin and to Glucagon', European Journal of
Biochemistry, 28: 199-204.
Samarasinghe, A. E., S. A. Hoselton, and J. M. Schuh. 2010a. 'The absence of the VPAC(2)
receptor does not protect mice from Aspergillus induced allergic asthma', Peptides, 31:
1068-75.
———. 2010b. 'Spatio-temporal localization of vasoactive intestinal peptide and neutral
endopeptidase in allergic murine lungs', Regul Pept, 164: 151-7.
Sampson, T. R., and S. K. Mazmanian. 2015. 'Control of brain development, function, and
behavior by the microbiome', Cell Host Microbe, 17: 565-76.
Sands, W. A., H. D. Woolson, G. R. Milne, C. Rutherford, and T. M. Palmer. 2006. 'Exchange
protein activated by cyclic AMP (Epac)-mediated induction of suppressor of cytokine
signaling 3 (SOCS-3) in vascular endothelial cells', Mol Cell Biol, 26: 6333-46.
Sanger, F., G. M. Air, B. G. Barrell, N. L. Brown, A. R. Coulson, C. A. Fiddes, C. A. Hutchison,
P. M. Slocombe, and M. Smith. 1977. 'Nucleotide sequence of bacteriophage phi X174
DNA', Nature, 265: 687-95.
Sanger, F., and A. R. Coulson. 1978. 'The use of thin acrylamide gels for DNA sequencing',
FEBS Lett, 87: 107-10.
Sanger, F., S. Nicklen, and A. R. Coulson. 1977. 'DNA sequencing with chain-terminating
inhibitors', Proc Natl Acad Sci U S A, 74: 5463-7.
Savage, D. C. 1977. 'Microbial ecology of the gastrointestinal tract', Annu Rev Microbiol, 31.
Schei, K., E. Avershina, T. Oien, K. Rudi, T. Follestad, S. Salamati, and R. A. Odegard. 2017.
'Early gut mycobiota and mother-offspring transfer', Microbiome, 5: 107.
Scher, J. U., and S. B. Abramson. 2011. 'The microbiome and rheumatoid arthritis', Nat Rev
Rheumatol, 7: 569-78.
Schmidt, M., C. Sand, K. H. Jakobs, M. C. Michel, and P. A. Weernink. 2007. 'Epac and the
cardiovascular system', Curr Opin Pharmacol, 7: 193-200.
Schnorr, S. L., M. Candela, S. Rampelli, M. Centanni, C. Consolandi, G. Basaglia, S. Turroni, E.
Biagi, C. Peano, M. Severgnini, J. Fiori, R. Gotti, G. De Bellis, D. Luiselli, P. Brigidi, A.
Mabulla, F. Marlowe, A. G. Henry, and A. N. Crittenden. 2014. 'Gut microbiome of the
Hadza hunter-gatherers', Nat Commun, 5: 3654.
Schratzberger, P., A. Geiseler, S. Dunzendorfer, N. Reinisch, C. M. Kahler, and C. J.
Wiedermann. 1998. 'Similar involvement of VIP receptor type I and type II in
lymphocyte chemotaxis', J Neuroimmunol, 87: 73-81.
Schroeder, A., D. H. Loh, M. C. Jordan, K. P. Roos, and C. S. Colwell. 2011. 'Circadian
regulation of cardiovascular function: a role for vasoactive intestinal peptide', Am J
Physiol Heart Circ Physiol, 300: H241-50.

204
Schulte, Gunnar, and Vítězslav Bryja. 2007. 'The Frizzled family of unconventional G-protein-
coupled receptors', Trends in Pharmacological Sciences, 28: 518-25.
Schussler, P., M. Kluge, A. Yassouridis, M. Dresler, M. Uhr, and A. Steiger. 2012. 'Ghrelin
levels increase after pictures showing food', Obesity (Silver Spring), 20: 1212-7.
Schwarz, D. S., G. Hutvagner, T. Du, Z. Xu, N. Aronin, and P. D. Zamore. 2003. 'Asymmetry in
the assembly of the RNAi enzyme complex', Cell, 115: 199-208.
Segata, N. 2015. 'Gut Microbiome: Westernization and the Disappearance of Intestinal
Diversity', Curr Biol, 25: R611-3.
Segata, N., J. Izard, L. Waldron, D. Gevers, L. Miropolsky, W. S. Garrett, and C. Huttenhower.
2011. 'Metagenomic biomarker discovery and explanation', Genome Biol, 12: R60.
Segre, Gino V., and Steven R. Goldring. 1993. 'Receptors for secretin, calcitonin, parathyroid
hormone (PTH)/PTH-related peptide, vasoactive intestinal peptide, glucagonlike peptide
1, growth hormone-releasing hormone, and glucagon belong to a newly discovered G-
protein-linked receptor family', Trends in Endocrinology & Metabolism, 4: 309-14.
Seifert, Roland, Andrea Strasser, Erich H. Schneider, Detlef Neumann, Stefan Dove, and Armin
Buschauer. 2013. 'Molecular and cellular analysis of human histamine receptor subtypes',
Trends in Pharmacological Sciences, 34: 10.1016/j.tips.2012.11.001.
Sender, Ron, Shai Fuchs, and Ron Milo. 2016. 'Revised estimates for the number of human and
bacteria cells in the body', bioRxiv.
Sethupathy, P., B. Corda, and A. G. Hatzigeorgiou. 2006. 'TarBase: A comprehensive database
of experimentally supported animal microRNA targets', Rna, 12: 192-7.
Shajib, M. S., and W. I. Khan. 2015. 'The role of serotonin and its receptors in activation of
immune responses and inflammation', Acta Physiol (Oxf), 213: 561-74.
Shannon, C. E. 1948. 'A Mathematical Theory of Communication', Bell System Technical
Journal, 27: 379-423.
Sharon, G., D. Segal, I. Zilber-Rosenberg, and E. Rosenberg. 2011. 'Symbiotic bacteria are
responsible for diet-induced mating preference in Drosophila melanogaster, providing
support for the hologenome concept of evolution', Gut Microbes, 2: 190-2.
Sheehan, D., C. Moran, and F. Shanahan. 2015. 'The microbiota in inflammatory bowel disease',
J Gastroenterol, 50: 495-507.
Sheh, A., and J. G. Fox. 2013. 'The role of the gastrointestinal microbiome in Helicobacter pylori
pathogenesis', Gut Microbes, 4: 505-31.
Shen, S., C. Spratt, W. J. Sheward, I. Kallo, K. West, C. F. Morrison, C. W. Coen, H. M.
Marston, and A. J. Harmar. 2000. 'Overexpression of the human VPAC2 receptor in the
suprachiasmatic nucleus alters the circadian phenotype of mice', Proc Natl Acad Sci U S
A, 97: 11575-80.
Shin, H., Z. Pei, K. A. Martinez, 2nd, J. I. Rivera-Vinas, K. Mendez, H. Cavallin, and M. G.
Dominguez-Bello. 2015. 'The first microbial environment of infants born by C-section:
the operating room microbes', Microbiome, 3: 59.
Shivers, B. D., T. J. Gorcs, P. E. Gottschall, and A. Arimura. 1991. 'Two high affinity binding
sites for pituitary adenylate cyclase-activating polypeptide have different tissue
distributions', Endocrinology, 128: 3055-65.
Shu, Ye, and Philip J. Scarpace. 1994. Forskolin Binding Sites and G-Protein Immunoreactivity
in Rat Hearts During Aging.
205
Shuryak, I., V. Y. Matrosova, E. K. Gaidamakova, R. Tkavc, O. Grichenko, P. Klimenkova, R.
P. Volpe, and M. J. Daly. 2017. 'Microbial cells can cooperate to resist high-level chronic
ionizing radiation', PLoS One, 12: e0189261.
Singh, B., N. Qin, and G. Reid. 2015. 'Microbiome Regulation of Autoimmune, Gut and Liver
Associated Diseases', Inflamm Allergy Drug Targets, 14: 84-93.
Sitkauskiene, B., A. K. Johansson, S. Sergejeva, S. Lundin, M. Sjostrand, and J. Lotvall. 2004.
'Regulation of bone marrow and airway CD34+ eosinophils by interleukin-5', Am J
Respir Cell Mol Biol, 30: 367-78.
Smalley, S. G., P. A. Barrow, and N. Foster. 2009. 'Immunomodulation of innate immune
responses by vasoactive intestinal peptide (VIP): its therapeutic potential in inflammatory
disease', Clin Exp Immunol, 157: 225-34.
Smids, C., C. S. Horjus Talabur Horje, J. Drylewicz, B. Roosenboom, M. J. M. Groenen, E. van
Koolwijk, E. G. van Lochem, and P. J. Wahab. 2018. 'Intestinal T Cell Profiling in
Inflammatory Bowel Disease: Linking T Cell Subsets to Disease Activity and Disease
Course', J Crohns Colitis, 12: 465-75.
Sprang, Stephen R. 1997. 'G protein mechanisms: insights from structural analysis', Annual
review of biochemistry, 66: 639-78.
Sprent, J., E. K. Gao, O. Kanagawa, and S. R. Webb. 1988. 'T-cell selection in the thymus',
Princess Takamatsu Symp, 19: 127-36.
Stahlhut, C., and F. J. Slack. 2013. 'MicroRNAs and the cancer phenotype: profiling, signatures
and clinical implications', Genome Med, 5: 111.
Stiefel, U., M. A. Tima, and M. M. Nerandzic. 2015. 'Metallo-beta-lactamase-producing
bacteroides species can shield other members of the gut microbiota from antibiotics',
Antimicrob Agents Chemother, 59: 650-3.
Stork, P. J., and J. M. Schmitt. 2002. 'Crosstalk between cAMP and MAP kinase signaling in the
regulation of cell proliferation', Trends Cell Biol, 12: 258-66.
'Structure, function and diversity of the healthy human microbiome'. 2012. Nature, 486: 207-14.
Sturm, E. M., K. D. Dyer, C. M. Percopo, A. Heinemann, and H. F. Rosenberg. 2013.
'Chemotaxis of bone marrow derived eosinophils in vivo: a novel method to explore
receptor-dependent trafficking in the mouse', Eur J Immunol, 43: 2217-28.
Summers, Monica A., M. Sue O'Dorisio, Mary O. Cox, Maria Lara-Marquez, and Edward J.
Goetzl. 2003. 'A Lymphocyte-Generated Fragment of Vasoactive Intestinal Peptide with
VPAC1 Agonist Activity and VPAC2 Antagonist Effects', Journal of Pharmacology and
Experimental Therapeutics, 306: 638-45.
Szema, A. M., S. A. Hamidi, A. Koller, and D. W. Martin. 2011. 'Vasoactive Intestinal Peptide
Knockout (VIP KO) mouse model of sulfite-sensitive asthma: up-regulation of novel
lung carbonyl reductase', BMC Immunol, 12: 66.
Szema, A. M., S. A. Hamidi, S. Lyubsky, K. G. Dickman, S. Mathew, T. Abdel-Razek, J. J.
Chen, J. A. Waschek, and S. I. Said. 2006. 'Mice lacking the VIP gene show airway
hyperresponsiveness and airway inflammation, partially reversible by VIP', Am J Physiol
Lung Cell Mol Physiol, 291: L880-6.
Takamizawa, Junichi, Hiroyuki Konishi, Kiyoshi Yanagisawa, Shuta Tomida, Hirotaka Osada,
Hideki Endoh, Tomoko Harano, Yasushi Yatabe, Masato Nagino, Yuji Nimura, Tetsuya
Mitsudomi, and Takashi Takahashi. 2004. 'Reduced Expression of the <strong><em>let-
7</em></strong> MicroRNAs in Human Lung Cancers in Association with Shortened
Postoperative Survival', Cancer Research, 64: 3753-56.

206
Takei, Yoshio. 2016. 'Chapter 18 - Secretin (Pituitary Adenylate Cyclase-Activating
Polypeptide) Family.' in, Handbook of Hormones (Academic Press: San Diego).
Tam, Janice K. V., Leo T. O. Lee, and Billy K. C. Chow. 2007. 'PACAP-related peptide (PRP)—
Molecular evolution and potential functions', Peptides, 28: 1920-29.
Tang, WJ, and AG Gilman. 1991. 'Type-specific regulation of adenylyl cyclase by G protein beta
gamma subunits', Science, 254: 1500-03.
———. 1995. 'Construction of a soluble adenylyl cyclase activated by Gs alpha and forskolin',
Science, 268: 1769-72.
Thaiss, C. A., N. Zmora, M. Levy, and E. Elinav. 2016. 'The microbiome and innate immunity',
Nature, 535: 65-74.
Thevelein, J. M., and J. H. de Winde. 1999. 'Novel sensing mechanisms and targets for the
cAMP-protein kinase A pathway in the yeast Saccharomyces cerevisiae', Mol Microbiol,
33: 904-18.
Thwaites, D. T., J. Young, M. C. Thorndyke, and R. Dimaline. 1989. 'The isolation and chemical
characterization of a novel vasoactive intestinal peptide-related peptide from a teleost
fish, the cod, Gadus morhua', Biochimica et Biophysica Acta (BBA) - Protein Structure
and Molecular Enzymology, 999: 217-20.
Tilg, H., and A. R. Moschen. 2014. 'Microbiota and diabetes: an evolving relationship', Gut, 63:
1513-21.
Tito, Raúl Y., Simone Macmil, Graham Wiley, Fares Najar, Lauren Cleeland, Chunmei Qu, Ping
Wang, Frederic Romagne, Sylvain Leonard, Agustín Jiménez Ruiz, Karl Reinhard, Bruce
A. Roe, and Cecil M. Lewis, Jr. 2008. 'Phylotyping and Functional Analysis of Two
Ancient Human Microbiomes', PLoS One, 3: e3703.
Tomas, Julie, Céline Mulet, Azadeh Saffarian, Jean-Baptiste Cavin, Robert Ducroc, Béatrice
Regnault, Chek Kun Tan, Kalina Duszka, Rémy Burcelin, Walter Wahli, Philippe J.
Sansonetti, and Thierry Pédron. 2016. 'High-fat diet modifies the PPAR-γ pathway
leading to disruption of microbial and physiological ecosystem in murine small intestine',
Proceedings of the National Academy of Sciences, 113: E5934-E43.
Tong, L., H. Xue, L. Xiong, J. Xiao, and Y. Zhou. 2015. 'Improved RT-PCR Assay to Quantitate
the Pri-, Pre-, and Mature microRNAs with Higher Efficiency and Accuracy', Mol
Biotechnol, 57: 939-46.
Tremaroli, V., and F. Backhed. 2012. 'Functional interactions between the gut microbiota and
host metabolism', Nature, 489: 242-9.
Tremlett, H., D. W. Fadrosh, A. A. Faruqi, F. Zhu, J. Hart, S. Roalstad, J. Graves, S. Lynch, and
E. Waubant. 2016. 'Gut microbiota in early pediatric multiple sclerosis: a case-control
study', Eur J Neurol, 23: 1308-21.
Trumpp-Kallmeyer, S., B. Chini, B. Mouillac, C. Barberis, J. Hoflack, and M. Hibert. 1995.
'Towards understanding the role of the first extracellular loop for the binding of peptide
hormones to G-protein coupled receptors', Pharm Acta Helv, 70: 255-62.
Trumpp-Kallmeyer, S., J. Hoflack, A. Bruinvels, and M. Hibert. 1992. 'Modeling of G-protein-
coupled receptors: application to dopamine, adrenaline, serotonin, acetylcholine, and
mammalian opsin receptors', J Med Chem, 35: 3448-62.
Tsukada, T., S. J. Horovitch, M. R. Montminy, G. Mandel, and R. H. Goodman. 1985. 'Structure
of the human vasoactive intestinal polypeptide gene', Dna, 4: 293-300.

207
Turner, J. T., S. B. Jones, and D. B. Bylund. 1986. 'A fragment of vasoactive intestinal peptide,
VIP(10-28), is an antagonist of VIP in the colon carcinoma cell line, HT29', Peptides, 7:
849-54.
Ulrich, C. D., 2nd, M. Holtmann, and L. J. Miller. 1998. 'Secretin and vasoactive intestinal
peptide receptors: members of a unique family of G protein-coupled receptors',
Gastroenterology, 114: 382-97.
Ulucan, C., X. Wang, E. Baljinnyam, Y. Bai, S. Okumura, M. Sato, S. Minamisawa, S. Hirotani,
and Y. Ishikawa. 2007. 'Developmental changes in gene expression of Epac and its
upregulation in myocardial hypertrophy', Am J Physiol Heart Circ Physiol, 293: H1662-
72.
Unger, Vinzenz M, Paul A Hargrave, Joyce M Baldwin, and Gebhard FX Schertler. 1997.
'Arrangement of rhodopsin transmembrane α-helices', Nature, 389: 203.
Usdin, T. B., T. I. Bonner, and E. Mezey. 1994. 'Two receptors for vasoactive intestinal
polypeptide with similar specificity and complementary distributions', Endocrinology,
135: 2662-80.
V. D. Steen, Travis, Manpreet Bains, Wanjara Steve, Bisnett Brittany, Laney Caleb, Huber Ben,
T. Dorsam Sheri, M. Schuh Jane, and P. Dorsam Glenn. 2016. 'VIP Signaling Fails to
Alter Gene Expression but Induces Different [cAMP]i Responses in Human Malignant
Hut-78 and Molt-4 T Cell Lines; Implications for Different G-protein Coupling for VIP
Receptors', Immunology, Endocrine & Metabolic Agents in Medicinal Chemistry, 16:
178-98.
Vaishampayan, Parag A., Jennifer V. Kuehl, Jeffrey L. Froula, Jenna L. Morgan, Howard
Ochman, and M. Pilar Francino. 2010. 'Comparative Metagenomics and Population
Dynamics of the Gut Microbiota in Mother and Infant', Genome Biology and Evolution,
2: 53-66.
Valberg, L. S., P. R. Flanagan, A. Kertesz, and D. C. Bondy. 1986. 'Zinc absorption in
inflammatory bowel disease', Dig Dis Sci, 31: 724-31.
van Biesen, T., B. E. Hawes, D. K. Luttrell, K. M. Krueger, K. Touhara, E. Porfiri, M. Sakaue,
L. M. Luttrell, and R. J. Lefkowitz. 1995. 'Receptor-tyrosine-kinase- and G beta gamma-
mediated MAP kinase activation by a common signalling pathway', Nature, 376: 781-4.
Vandenplas, Yvan, Irina Zakharova, and Yulia Dmitrieva. 2015. 'Oligosaccharides in infant
formula: more evidence to validate the role of prebiotics', British Journal of Nutrition,
113: 1339-44.
Velmanickam, L., M. Fondakowski, I. T. Lima, Jr., and D. Nawarathna. 2017. 'Integrated
dielectrophoretic and surface plasmonic platform for million-fold improvement in the
detection of fluorescent events', Biomicrofluidics, 11: 044115.
Velmanickam, L., D. Laudenbach, and D. Nawarathna. 2016. 'Dielectrophoretic label-free
immunoassay for rare-analyte quantification in biological samples', Phys Rev E, 94:
042408.
Venter, J. Craig, Mark D. Adams, Eugene W. Myers, Peter W. Li, Richard J. Mural, Granger G.
Sutton, Hamilton O. Smith, Mark Yandell, Cheryl A. Evans, Robert A. Holt, Jeannine D.
Gocayne, Peter Amanatides, Richard M. Ballew, Daniel H. Huson, Jennifer Russo
Wortman, Qing Zhang, Chinnappa D. Kodira, Xiangqun H. Zheng, Lin Chen, Marian
Skupski, Gangadharan Subramanian, Paul D. Thomas, Jinghui Zhang, George L. Gabor
Miklos, Catherine Nelson, Samuel Broder, Andrew G. Clark, Joe Nadeau, Victor A.
McKusick, Norton Zinder, Arnold J. Levine, Richard J. Roberts, Mel Simon, Carolyn

208
Slayman, Michael Hunkapiller, Randall Bolanos, Arthur Delcher, Ian Dew, Daniel
Fasulo, Michael Flanigan, Liliana Florea, Aaron Halpern, Sridhar Hannenhalli, Saul
Kravitz, Samuel Levy, Clark Mobarry, Knut Reinert, Karin Remington, Jane Abu-
Threideh, Ellen Beasley, Kendra Biddick, Vivien Bonazzi, Rhonda Brandon, Michele
Cargill, Ishwar Chandramouliswaran, Rosane Charlab, Kabir Chaturvedi, Zuoming Deng,
Valentina Di Francesco, Patrick Dunn, Karen Eilbeck, Carlos Evangelista, Andrei E.
Gabrielian, Weiniu Gan, Wangmao Ge, Fangcheng Gong, Zhiping Gu, Ping Guan,
Thomas J. Heiman, Maureen E. Higgins, Rui-Ru Ji, Zhaoxi Ke, Karen A. Ketchum,
Zhongwu Lai, Yiding Lei, Zhenya Li, Jiayin Li, Yong Liang, Xiaoying Lin, Fu Lu,
Gennady V. Merkulov, Natalia Milshina, Helen M. Moore, Ashwinikumar K Naik,
Vaibhav A. Narayan, Beena Neelam, Deborah Nusskern, Douglas B. Rusch, Steven
Salzberg, Wei Shao, Bixiong Shue, Jingtao Sun, Zhen Yuan Wang, Aihui Wang, Xin
Wang, Jian Wang, Ming-Hui Wei, Ron Wides, Chunlin Xiao, Chunhua Yan, Alison Yao,
Jane Ye, Ming Zhan, Weiqing Zhang, Hongyu Zhang, Qi Zhao, Liansheng Zheng, Fei
Zhong, Wenyan Zhong, Shiaoping C. Zhu, Shaying Zhao, Dennis Gilbert, Suzanna
Baumhueter, Gene Spier, Christine Carter, Anibal Cravchik, Trevor Woodage, Feroze
Ali, Huijin An, Aderonke Awe, Danita Baldwin, Holly Baden, Mary Barnstead, Ian
Barrow, Karen Beeson, Dana Busam, Amy Carver, Angela Center, Ming Lai Cheng, Liz
Curry, Steve Danaher, Lionel Davenport, Raymond Desilets, Susanne Dietz, Kristina
Dodson, Lisa Doup, Steven Ferriera, Neha Garg, Andres Gluecksmann, Brit Hart, Jason
Haynes, Charles Haynes, Cheryl Heiner, Suzanne Hladun, Damon Hostin, Jarrett Houck,
Timothy Howland, Chinyere Ibegwam, Jeffery Johnson, Francis Kalush, Lesley Kline,
Shashi Koduru, Amy Love, Felecia Mann, David May, Steven McCawley, Tina
McIntosh, Ivy McMullen, Mee Moy, Linda Moy, Brian Murphy, Keith Nelson, Cynthia
Pfannkoch, Eric Pratts, Vinita Puri, Hina Qureshi, Matthew Reardon, Robert Rodriguez,
Yu-Hui Rogers, Deanna Romblad, Bob Ruhfel, Richard Scott, Cynthia Sitter, Michelle
Smallwood, Erin Stewart, Renee Strong, Ellen Suh, Reginald Thomas, Ni Ni Tint,
Sukyee Tse, Claire Vech, Gary Wang, Jeremy Wetter, Sherita Williams, Monica
Williams, Sandra Windsor, Emily Winn-Deen, Keriellen Wolfe, Jayshree Zaveri, Karena
Zaveri, Josep F. Abril, Roderic Guigó, Michael J. Campbell, Kimmen V. Sjolander, Brian
Karlak, Anish Kejariwal, Huaiyu Mi, Betty Lazareva, Thomas Hatton, Apurva
Narechania, Karen Diemer, Anushya Muruganujan, Nan Guo, Shinji Sato, Vineet Bafna,
Sorin Istrail, Ross Lippert, Russell Schwartz, Brian Walenz, Shibu Yooseph, David
Allen, Anand Basu, James Baxendale, Louis Blick, Marcelo Caminha, John Carnes-Stine,
Parris Caulk, Yen-Hui Chiang, My Coyne, Carl Dahlke, Anne Deslattes Mays, Maria
Dombroski, Michael Donnelly, Dale Ely, Shiva Esparham, Carl Fosler, Harold Gire,
Stephen Glanowski, Kenneth Glasser, Anna Glodek, Mark Gorokhov, Ken Graham,
Barry Gropman, Michael Harris, Jeremy Heil, Scott Henderson, Jeffrey Hoover, Donald
Jennings, Catherine Jordan, James Jordan, John Kasha, Leonid Kagan, Cheryl Kraft,
Alexander Levitsky, Mark Lewis, Xiangjun Liu, John Lopez, Daniel Ma, William
Majoros, Joe McDaniel, Sean Murphy, Matthew Newman, Trung Nguyen, Ngoc Nguyen,
Marc Nodell, Sue Pan, Jim Peck, Marshall Peterson, William Rowe, Robert Sanders,
John Scott, Michael Simpson, Thomas Smith, Arlan Sprague, Timothy Stockwell,
Russell Turner, Eli Venter, Mei Wang, Meiyuan Wen, David Wu, Mitchell Wu, Ashley
Xia, Ali Zandieh, and Xiaohong Zhu. 2001. 'The Sequence of the Human Genome',
Science, 291: 1304-51.

209
Vertongen, P., S. N. Schiffmann, P. Gourlet, and P. Robberecht. 1998. 'Autoradiographic
visualization of the receptor subclasses for vasoactive intestinal polypeptide (VIP) in rat
brain', Ann N Y Acad Sci, 865: 412-5.
Viazis, N., J. Vlachogiannakos, O. Georgiou, M. Rodias, D. Georgiadis, V. Papastamopoulos, I.
G. Baraboutis, D. G. Karamanolis, and A. Skoutelis. 2010. 'Course of inflammatory
bowel disease in patients infected with human immunodeficiency virus', Inflamm Bowel
Dis, 16: 507-11.
Voice, J. K., C. Grinninger, Y. Kong, Y. Bangale, S. Paul, and E. J. Goetzl. 2003. 'Roles of
vasoactive intestinal peptide (VIP) in the expression of different immune phenotypes by
wild-type mice and T cell-targeted type II VIP receptor transgenic mice', J Immunol, 170:
308-14.
Voigt, R. M., K. C. Summa, C. B. Forsyth, S. J. Green, P. Engen, A. Naqib, M. H. Vitaterna, F.
W. Turek, and A. Keshavarzian. 2016. 'The Circadian Clock Mutation Promotes
Intestinal Dysbiosis', Alcohol Clin Exp Res, 40: 335-47.
Vomhof-DeKrey, E. E., and G. P. Dorsam. 2008. 'Stimulatory and suppressive signal
transduction regulates vasoactive intestinal peptide receptor-1 (VPAC-1) in primary
mouse CD4 T cells', Brain Behav Immun, 22: 1024-31.
Vosko, A., H. C. van Diepen, D. Kuljis, A. M. Chiu, D. Heyer, H. Terra, E. Carpenter, S.
Michel, J. H. Meijer, and C. S. Colwell. 2015. 'Role of vasoactive intestinal peptide in the
light input to the circadian system', Eur J Neurosci, 42: 1839-48.
Vu, J. P., M. Larauche, M. Flores, L. Luong, J. Norris, S. Oh, L. J. Liang, J. Waschek, J. R.
Pisegna, and P. M. Germano. 2015. 'Regulation of Appetite, Body Composition, and
Metabolic Hormones by Vasoactive Intestinal Polypeptide (VIP)', J Mol Neurosci, 56:
377-87.
Vu, J. P., M. Million, M. Larauche, L. Luong, J. Norris, J. A. Waschek, C. Pothoulakis, J. R.
Pisegna, and P. M. Germano. 2014. 'Inhibition of vasoactive intestinal polypeptide (VIP)
induces resistance to dextran sodium sulfate (DSS)-induced colitis in mice', J Mol
Neurosci, 52: 37-47.
Walter, Jens, and Ruth Ley. 2011. 'The Human Gut Microbiome: Ecology and Recent
Evolutionary Changes', Annual Review of Microbiology, 65: 411-29.
Walters, W. A., J. G. Caporaso, C. L. Lauber, D. Berg-Lyons, N. Fierer, and R. Knight. 2011.
'PrimerProspector: de novo design and taxonomic analysis of barcoded polymerase chain
reaction primers', Bioinformatics, 27: 1159-61.
Wang, Mei, Siv Ahrné, Bengt Jeppsson, and Göran Molin. 2005. 'Comparison of bacterial
diversity along the human intestinal tract by direct cloning and sequencing of 16S rRNA
genes', FEMS Microbiology Ecology, 54: 219-31.
Wang, X., S. P. Heazlewood, D. O. Krause, and T. H. J. Florin. 2003. 'Molecular
characterization of the microbial species that colonize human ileal and colonic mucosa by
using 16S rDNA sequence analysis', Journal of Applied Microbiology, 95: 508-20.
Wang, Y., and J. M. Conlon. 1993. 'Neuroendocrine peptides (NPY, GRP, VIP, somatostatin)
from the brain and stomach of the alligator', Peptides, 14: 573-9.
Wassenaar, T. M., and P. Panigrahi. 2014. 'Is a foetus developing in a sterile environment?', Lett
Appl Microbiol, 59: 572-9.
Watson, J. D., and F. H. Crick. 1953. 'The structure of DNA', Cold Spring Harb Symp Quant
Biol, 18: 123-31.
210
Wen, L., R. E. Ley, P. Y. Volchkov, P. B. Stranges, L. Avanesyan, A. C. Stonebraker, C. Hu, F.
S. Wong, G. L. Szot, J. A. Bluestone, J. I. Gordon, and A. V. Chervonsky. 2008. 'Innate
immunity and intestinal microbiota in the development of Type 1 diabetes', Nature, 455:
1109-13.
Wershil, B. K., C. W. Turck, S. P. Sreedharan, J. Yang, S. An, S. J. Galli, and E. J. Goetzl. 1993.
'Variants of vasoactive intestinal peptide in mouse mast cells and rat basophilic leukemia
cells', Cell Immunol, 151: 369-78.
Whipps JM, Lewis K, Cooke RC. 1988. 'Mycoparasitism and plant disease control', Fungi in
Biological Control Systems: 161–87.
Whisnant, R E, A G Gilman, and C W Dessauer. 1996. 'Interaction of the two cytosolic domains
of mammalian adenylyl cyclase', Proceedings of the National Academy of Sciences, 93:
6621-25.
Whitman, W. B., D. C. Coleman, and W. J. Wiebe. 1998. 'Prokaryotes: the unseen majority',
Proc Natl Acad Sci U S A, 95: 6578-83.
Whittaker, R. H. 1960. 'Vegetation of the Siskiyou Mountains, Oregon and California',
Ecological Monographs, 30: 279-338.
———. 1972. 'Evolution and Measurement of Species Diversity', Taxon, 21: 213-51.
Wittpoth, C., K. Scholich, Y. Yigzaw, T. M. Stringfield, and T. B. Patel. 1999. 'Regions on
adenylyl cyclase that are necessary for inhibition of activity by beta gamma and
G(ialpha) subunits of heterotrimeric G proteins', Proc Natl Acad Sci U S A, 96: 9551-6.
Wolf, S. A., J. Fisher, I. Bechmann, B. Steiner, E. Kwidzinski, and R. Nitsch. 2002.
'Neuroprotection by T-cells depends on their subtype and activation state', J
Neuroimmunol, 133: 72-80.
Wu, Huixian, Chong Wang, Karen J. Gregory, Gye Won Han, Hyekyung P. Cho, Yan Xia,
Colleen M. Niswender, Vsevolod Katritch, Jens Meiler, Vadim Cherezov, P. Jeffrey
Conn, and Raymond C. Stevens. 2014. 'Structure of a Class C GPCR Metabotropic
Glutamate Receptor 1 Bound to an Allosteric Modulator', Science, 344: 58-64.
Wu, L., L. H. Nguyen, K. Zhou, T. Y. de Soysa, L. Li, J. B. Miller, J. Tian, J. Locker, S. Zhang,
G. Shinoda, M. T. Seligson, L. R. Zeitels, A. Acharya, S. C. Wang, J. T. Mendell, X. He,
J. Nishino, S. J. Morrison, D. J. Siegwart, G. Q. Daley, N. Shyh-Chang, and H. Zhu.
2015. 'Precise let-7 expression levels balance organ regeneration against tumor
suppression', Elife, 4: e09431.
Wu, R. 1972. 'Nucleotide sequence analysis of DNA', Nat New Biol, 236: 198-200.
Wu, X., V. S. Conlin, V. Morampudi, N. R. Ryz, Y. Nasser, G. Bhinder, K. S. Bergstrom, H. B.
Yu, C. C. Waterhouse, A. M. Buchan, O. E. Popescu, W. T. Gibson, J. A. Waschek, B.
A. Vallance, and K. Jacobson. 2015. 'Vasoactive intestinal polypeptide promotes
intestinal barrier homeostasis and protection against colitis in mice', PLoS One, 10:
e0125225.
Xi, Y., G. Wu, T. Ai, N. Cheng, J. M. Kalisnik, J. Sun, S. Abbasi, D. Yang, C. Fan, X. Yuan, S.
Wang, M. Elayda, I. D. Gregoric, B. K. Kantharia, S. F. Lin, and J. Cheng. 2013. 'Ionic
mechanisms underlying the effects of vasoactive intestinal polypeptide on canine atrial
myocardium', Circ Arrhythm Electrophysiol, 6: 976-83.
Xia, M., G. O. Gaufo, Q. Wang, S. P. Sreedharan, and E. J. Goetzl. 1996. 'Transduction of
specific inhibition of HuT 78 human T cell chemotaxis by type I vasoactive intestinal
peptide receptors', J Immunol, 157: 1132-8.

211
Xie, Z., C. Chang, and Z. Zhou. 2014. 'Molecular mechanisms in autoimmune type 1 diabetes: a
critical review', Clin Rev Allergy Immunol, 47: 174-92.
Xu, W., M. Li, J. F. Ding, J. D. Gu, and Z. H. Luo. 2014. 'Bacteria dominate the ammonia-
oxidizing community in a hydrothermal vent site at the Mid-Atlantic Ridge of the South
Atlantic Ocean', Appl Microbiol Biotechnol, 98: 7993-8004.
Yan, S. Z., D. Hahn, Z. H. Huang, and W. J. Tang. 1996. 'Two cytoplasmic domains of
mammalian adenylyl cyclase form a Gs alpha- and forskolin-activated enzyme in vitro', J
Biol Chem, 271: 10941-5.
Yan, S. Z., Z. H. Huang, V. D. Rao, J. H. Hurley, and W. J. Tang. 1997. 'Three discrete regions
of mammalian adenylyl cyclase form a site for Gsalpha activation', J Biol Chem, 272:
18849-54.
Yeh, Y. Y., H. G. Ozer, A. M. Lehman, K. Maddocks, L. Yu, A. J. Johnson, and J. C. Byrd.
2015. 'Characterization of CLL exosomes reveals a distinct microRNA signature and
enhanced secretion by activation of BCR signaling', Blood, 125: 3297-305.
Yi, Rui, Yi Qin, Ian G. Macara, and Bryan R. Cullen. 2003. 'Exportin-5 mediates the nuclear
export of pre-microRNAs and short hairpin RNAs', Genes & Development, 17: 3011-16.
Yoshimoto, T., K. Takeda, T. Tanaka, K. Ohkusu, S. Kashiwamura, H. Okamura, S. Akira, and
K. Nakanishi. 1998. 'IL-12 up-regulates IL-18 receptor expression on T cells, Th1 cells,
and B cells: synergism with IL-18 for IFN-gamma production', J Immunol, 161: 3400-7.
Yoshizawa, H., Y. Morishita, M. Watanabe, K. Ishibashi, S. Muto, E. Kusano, and D. Nagata.
2015. 'TGF-beta(1)-siRNA delivery with nanoparticles inhibits peritoneal fibrosis', Gene
Ther, 22: 333-40.
You, S., J. L. Silsby, J. Farris, D. N. Foster, and M. E. el Halawani. 1995. 'Tissue-specific
alternative splicing of turkey preprovasoactive intestinal peptide messenger ribonucleic
acid, its regulation, and correlation with prolactin secretion', Endocrinology, 136: 2602-
10.
Youngblood, Ben, J. Scott Hale, Haydn T. Kissick, Eunseon Ahn, Xiaojin Xu, Andreas Wieland,
Koichi Araki, Erin E. West, Hazem E. Ghoneim, Yiping Fan, Pranay Dogra, Carl W.
Davis, Bogumila T. Konieczny, Rustom Antia, Xiaodong Cheng, and Rafi Ahmed. 2017.
'Effector CD8 T cells dedifferentiate into long-lived memory cells', Nature, 552: 404.
Yuasa, M., T. Matsui, S. Ando, Y. Ishii, H. Sawamura, S. Ebara, and T. Watanabe. 2013.
'Consumption of a low-carbohydrate and high-fat diet (the ketogenic diet) exaggerates
biotin deficiency in mice', Nutrition, 29: 1266-70.
Zackular, Joseph P., Nielson T. Baxter, Kathryn D. Iverson, William D. Sadler, Joseph F.
Petrosino, Grace Y. Chen, and Patrick D. Schloss. 2013. 'The Gut Microbiome Modulates
Colon Tumorigenesis', MBio, 4.
Zarrinpar, Amir, Amandine Chaix, Shibu Yooseph, and Satchidananda Panda. 2014. 'Diet and
Feeding Pattern Affect the Diurnal Dynamics of the Gut Microbiome', Cell Metabolism,
20: 1006-17.
Zavilgelsky, G. B., S. K. Abilev, V. V. Sukhodolets, and S. I. Ahmad. 1998. 'Isolation and
analysis of UV and radio-resistant bacteria from Chernobyl', J Photochem Photobiol B,
43: 152-7.
Zenewicz, Lauren A., Andrey Antov, and Richard A. Flavell. 2009. 'CD4 T-cell differentiation
and inflammatory bowel disease', Trends Mol Med, 15: 199-207.
Zeng, Y., R. Yi, and B. R. Cullen. 2003. 'MicroRNAs and small interfering RNAs can inhibit
mRNA expression by similar mechanisms', Proc Natl Acad Sci U S A, 100: 9779-84.

212
Zhang, Gongyi, Yu Liu, Arnold E Ruoho, and James H Hurley. 1997. 'Structure of the adenylyl
cyclase catalytic core', Nature, 386: 247.
Zhang, H., F. A. Kolb, V. Brondani, E. Billy, and W. Filipowicz. 2002. 'Human Dicer
preferentially cleaves dsRNAs at their termini without a requirement for ATP', Embo j,
21: 5875-85.
Zilber-Rosenberg, I., and E. Rosenberg. 2008. 'Role of microorganisms in the evolution of
animals and plants: the hologenome theory of evolution', FEMS Microbiol Rev, 32: 723-
35.
Zimmermann, G., D. Zhou, and R. Taussig. 1998. 'Genetic selection of mammalian adenylyl
cyclases insensitive to stimulation by Gsalpha', J Biol Chem, 273: 6968-75.

213
APPENDIX. NUMERICAL DATA AND TAXONOMIC TREE EXPANSION
Table A1. VIP Strains at the phylum taxonomic level.
Taxonomy Male Female
WT HET KO WT HET KO
Actinobacteria 0% 0% 0% 0% 0% 0%
Bacteroidetes 63% 44% 66% 53% 47% 68%
Chlamydiae 0% 0% 0% 0% 0% 0%
Cyanobacteria 0% 0% 0% 0% 0% 0%
Deferribacteres 7% 7% 3% 4% 6% 0%
Firmicutes 22% 42% 15% 36% 42% 13%
Proteobacteria 6% 4% 16% 4% 4% 17%
Saccharibacteria 1% 1% 0% 1% 1% 0%
Tenericutes 1% 1% 0% 1% 1% 0%
Verrucomicrobia 1% 0% 0% 0% 0% 1%
Table A2. VIP Strains at the class taxonomic level.
Taxonomy Male Female WT HET KO WT HET KO
Actinobacteria 0% 0% 0% 0% 0% 0%
Coriobacteriia 0% 0% 0% 0% 0% 0%
Bacteroidia 63% 44% 66% 53% 47% 68%
Chlamydiae 0% 0% 0% 0% 0% 0%
Chloroplast 0% 0% 0% 0% 0% 0%
Melainabacteria 0% 0% 0% 0% 0% 0%
Deferribacteres 7% 7% 3% 4% 6% 0%
Bacilli 0% 0% 1% 0% 0% 1%
Clostridia 21% 42% 14% 36% 42% 12%
Erysipelotrichia 0% 0% 0% 0% 0% 0%
Alphaproteobacteria 0% 0% 0% 0% 0% 0%
Betaproteobacteria 4% 1% 5% 2% 2% 4%
Deltaproteobacteria 1% 1% 1% 1% 1% 1%
Epsilonproteobacteria 1% 2% 9% 1% 2% 9%
Gammaproteobacteria 0% 0% 0% 0% 0% 3%
Saccharibacteria;
Unknown Class
1% 1% 0% 1% 1% 0%
Mollicutes 1% 1% 0% 1% 1% 0%
Verrucomicrobiae 1% 0% 0% 0% 0% 1%

214
Table A3. VIP Strains at the order taxonomic level.
Taxonomy Male Female WT HET KO WT HET KO
Bifidobacteriales 0.00% 0.00% 0.20% 0.00% 0.00% 0.10%
Coriobacteriales 0.00% 0.00% 0.00% 0.00% 0.00% 0.00%
Bacteroidales 62.80% 44.40% 66.30% 53.40% 46.70% 68.30%
Chlamydiales 0.30% 0.10% 0.10% 0.30% 0.20% 0.30%
Chloroplast;Ambiguous_taxa 0.00% 0.00% 0.00% 0.00% 0.00% 0.00%
Gossypium arboreum 0.00% 0.00% 0.00% 0.00% 0.00% 0.00%
Gastranaerophilales 0.10% 0.10% 0.00% 0.10% 0.00% 0.10%
Deferribacterales 6.50% 7.20% 2.80% 4.30% 5.70% 0.40%
Lactobacillales 0.30% 0.10% 0.80% 0.10% 0.10% 0.70%
Clostridiales 21.40% 41.80% 13.60% 36.00% 41.70% 12.20%
Erysipelotrichales 0.20% 0.10% 0.30% 0.10% 0.20% 0.40%
Rhodospirillales 0.20% 0.00% 0.00% 0.00% 0.00% 0.00%
Burkholderiales 4.10% 1.40% 5.20% 2.00% 1.70% 4.30%
Desulfovibrionales 0.70% 0.90% 1.00% 0.90% 1.10% 0.80%
Campylobacterales 1.10% 2.10% 9.20% 0.80% 1.50% 8.50%
Enterobacteriales 0.20% 0.00% 0.10% 0.00% 0.00% 3.10%
Saccharibacteria;
Unknown Order
0.70% 1.30% 0.20% 1.20% 0.70% 0.00%
Anaeroplasmatales 0.80% 0.30% 0.00% 0.50% 0.40% 0.00%
Mollicutes RF9 0.10% 0.10% 0.10% 0.20% 0.10% 0.00%
Verrucomicrobiales 0.50% 0.00% 0.20% 0.00% 0.00% 0.70%

215
Table A4. VIP Strains at the family taxonomic level.
Taxonomy Male Female
WT HET KO WT HET KO
Bifidobacteriaceae 0.00% 0.00% 0.20% 0.00% 0.00% 0.10%
Coriobacteriaceae 0.00% 0.00% 0.00% 0.00% 0.00% 0.00%
Bacteroidaceae 16.80% 4.70% 31.90% 6.30% 7.30% 35.80%
Bacteroidales S24-7 group 28.90% 25.30% 12.80% 32.00% 25.50% 13.20%
Porphyromonadaceae 6.30% 0.70% 16.30% 1.10% 2.00% 16.30%
Prevotellaceae 0.80% 1.50% 2.00% 1.30% 0.90% 1.90%
Rikenellaceae 10.10% 12.10% 3.20% 12.70% 11.00% 1.20%
Chlamydiaceae 0.30% 0.10% 0.10% 0.30% 0.20% 0.30%
Chloroplast;Ambiguous_taxa 0.00% 0.00% 0.00% 0.00% 0.00% 0.00%
Gossypium arboreum 0.00% 0.00% 0.00% 0.00% 0.00% 0.00%
Gastranaerophilales;
uncultured bacterium
0.10% 0.10% 0.00% 0.10% 0.00% 0.10%
Deferribacteraceae 6.50% 7.20% 2.80% 4.30% 5.70% 0.40%
Lactobacillaceae 0.20% 0.10% 0.50% 0.10% 0.00% 0.50%
Lactobacillales; uncultured 0.10% 0.00% 0.20% 0.00% 0.00% 0.20%
Christensenellaceae 0.00% 0.00% 0.00% 0.00% 0.00% 0.00%
Clostridiaceae 1 0.10% 0.00% 0.00% 0.10% 0.10% 0.00%
Clostridiales vadinBB60
group
0.50% 0.70% 0.00% 0.40% 1.40% 0.00%
Family XIII 0.00% 0.00% 0.00% 0.00% 0.00% 0.00%
Lachnospiraceae 16.00% 31.70% 11.30% 27.60% 31.90% 10.50%
Peptococcaceae 0.20% 0.20% 0.10% 0.30% 0.30% 0.10%
Peptostreptococcaceae 0.00% 0.00% 0.20% 0.00% 0.00% 0.20%
Ruminococcaceae 4.60% 9.10% 1.90% 7.60% 8.00% 1.50%
Erysipelotrichaceae 0.20% 0.10% 0.30% 0.10% 0.20% 0.40%
Rhodospirillaceae 0.20% 0.00% 0.00% 0.00% 0.00% 0.00%
Alcaligenaceae 4.10% 1.40% 5.20% 2.00% 1.70% 4.30%
Desulfovibrionaceae 0.70% 0.90% 1.00% 0.90% 1.10% 0.80%
Helicobacteraceae 1.10% 2.10% 9.20% 0.80% 1.50% 8.50%
Enterobacteriaceae 0.20% 0.00% 0.10% 0.00% 0.00% 3.10%
Saccharibacteria;
Unknown Family
0.70% 1.30% 0.20% 1.20% 0.70% 0.00%
Anaeroplasmataceae 0.80% 0.30% 0.00% 0.50% 0.40% 0.00%
Mollicutes RF9;
uncultured bacterium
0.10% 0.10% 0.10% 0.20% 0.10% 0.00%
Verrucomicrobiaceae 0.50% 0.00% 0.20% 0.00% 0.00% 0.70%

216
Table A5. VIP Strains at the genus taxonomic level.
Taxonomy Male Female
WT HET KO WT HET KO
Bifidobacterium 0.00% 0.00% 0.20% 0.00% 0.00% 0.10%
Coriobacteriaceae UCG-002 0.00% 0.00% 0.00% 0.00% 0.00% 0.00%
Bacteroides 16.80% 4.70% 31.90% 6.30% 7.30% 35.80%
Bacteroidales S24-7 group;
Ambiguous_taxa
0.50% 0.40% 0.10% 0.40% 0.30% 0.10%
Bacteroidales S24-7 group;
uncultured Bacteroidales
2.20% 1.70% 0.40% 2.40% 1.90% 0.60%
Bacteroidales S24-7 group;
uncultured bacterium
26.30% 23.20% 12.30% 29.10% 23.20% 12.40%
Bacteroidales S24-7 group;
unidentified
0.00% 0.00% 0.00% 0.10% 0.20% 0.00%
Parabacteroides 4.80% 0.30% 7.70% 0.30% 0.50% 7.40%
Porphyromonadaceae; uncultured 1.40% 0.40% 8.60% 0.70% 1.50% 8.80%
Alloprevotella 0.50% 1.00% 0.70% 0.50% 0.50% 1.80%
Prevotella 9 0.00% 0.00% 0.00% 0.00% 0.30% 0.00%
Prevotellaceae NK3B31 group 0.10% 0.10% 1.00% 0.20% 0.00% 0.10%
Prevotellaceae UCG-001 0.20% 0.40% 0.30% 0.60% 0.20% 0.10%
Alistipes 9.60% 11.70% 3.20% 12.20% 10.30% 1.10%
Rikenellaceae RC9 gut group 0.50% 0.40% 0.00% 0.60% 0.70% 0.10%
Chlamydia 0.30% 0.10% 0.10% 0.30% 0.20% 0.30%
Chloroplast;Ambiguous_taxa 0.00% 0.00% 0.00% 0.00% 0.00% 0.00%
Gossypium arboreum 0.00% 0.00% 0.00% 0.00% 0.00% 0.00%
Gastranaerophilales; uncultured
bacterium
0.10% 0.10% 0.00% 0.10% 0.00% 0.10%
Mucispirillum 6.50% 7.20% 2.80% 4.30% 5.70% 0.40%
Lactobacillus 0.20% 0.10% 0.50% 0.10% 0.00% 0.50%
Lactobacillales; uncultured bacterium 0.10% 0.00% 0.20% 0.00% 0.00% 0.20%
Christensenellaceae; uncultured 0.00% 0.00% 0.00% 0.00% 0.00% 0.00%
Candidatus Arthromitus 0.10% 0.00% 0.00% 0.10% 0.10% 0.00%
Clostridiales vadinBB60
group;Ambiguous_taxa
0.40% 0.60% 0.00% 0.30% 1.20% 0.00%
Clostridiales vadinBB60 group;
uncultured bacterium
0.10% 0.10% 0.00% 0.10% 0.30% 0.00%
Family XIII UCG-001 0.00% 0.00% 0.00% 0.00% 0.00% 0.00%
[Eubacterium] nodatum group 0.00% 0.00% 0.00% 0.00% 0.00% 0.00%
Acetatifactor 0.00% 0.00% 0.00% 0.00% 0.00% 0.00%
Anaerosporobacter 0.00% 0.00% 0.00% 0.00% 0.00% 0.00%
Anaerostipes 0.00% 0.00% 0.40% 0.00% 0.00% 0.20%
Blautia 0.40% 0.60% 1.50% 0.70% 0.80% 0.30%
Coprococcus 1 0.10% 0.20% 0.10% 0.20% 0.10% 0.10%
Lachnoclostridium 0.20% 0.30% 1.20% 0.30% 0.20% 1.70%

217
Table A5. VIP Strains at the genus taxonomic level (continued).
Taxonomy Male Female
WT HET KO WT HET KO
Lachnospiraceae FCS020 group 0.00% 0.00% 0.00% 0.00% 0.00% 0.00%
Lachnospiraceae NK4A136 group 7.60% 17.20% 3.20% 16.50% 15.10% 3.20%
Lachnospiraceae UCG-001 0.10% 0.30% 0.20% 0.20% 0.20% 0.20%
Lachnospiraceae UCG-004 0.00% 0.00% 0.00% 0.00% 0.00% 0.00%
Lachnospiraceae UCG-006 0.10% 0.10% 0.00% 0.10% 0.00% 0.00%
Lachnospiraceae UCG-008 0.80% 3.50% 0.30% 2.70% 5.60% 0.20%
Marvinbryantia 0.10% 0.20% 0.00% 0.10% 0.20% 0.10%
Roseburia 1.20% 1.30% 2.20% 0.40% 1.60% 2.00%
Tyzzerella 0.00% 0.00% 0.00% 0.00% 0.00% 0.00%
[Eubacterium] oxidoreducens group 0.00% 0.20% 0.00% 0.10% 0.10% 0.00%
[Eubacterium] xylanophilum group 0.10% 0.10% 0.10% 0.00% 0.10% 0.00%
Lachnospiraceae;
mouse gut metagenome
0.10% 0.20% 0.00% 0.10% 0.10% 0.00%
Lachnospiraceae; uncultured 5.10% 7.50% 2.00% 5.90% 7.60% 2.60%
Peptococcus 0.00% 0.00% 0.00% 0.00% 0.00% 0.00%
Peptococcaceae; uncultured 0.10% 0.20% 0.10% 0.30% 0.20% 0.00%
Peptoclostridium 0.00% 0.00% 0.20% 0.00% 0.00% 0.20%
Anaerotruncus 0.60% 0.90% 0.50% 0.60% 1.00% 0.50%
Butyricicoccus 0.30% 0.50% 0.10% 0.50% 0.40% 0.10%
Flavonifractor 0.00% 0.00% 0.10% 0.00% 0.00% 0.00%
Oscillibacter 0.60% 1.40% 0.20% 0.90% 1.20% 0.20%
Ruminiclostridium 0.60% 1.90% 0.10% 1.20% 1.20% 0.10%
Ruminiclostridium 5 0.10% 0.10% 0.00% 0.20% 0.20% 0.00%
Ruminiclostridium 6 0.10% 0.30% 0.00% 0.30% 0.20% 0.00%
Ruminiclostridium 9 0.80% 1.40% 0.20% 1.40% 1.50% 0.20%
Ruminococcaceae NK4A214 group 0.00% 0.10% 0.00% 0.10% 0.00% 0.00%
Ruminococcaceae UCG-003 0.00% 0.00% 0.00% 0.00% 0.00% 0.00%
Ruminococcaceae UCG-009 0.00% 0.10% 0.00% 0.10% 0.10% 0.00%
Ruminococcaceae UCG-014 0.20% 0.70% 0.20% 0.60% 0.40% 0.00%
Ruminococcus 1 0.10% 0.20% 0.00% 0.20% 0.20% 0.00%
[Eubacterium] coprostanoli genes
group
0.10% 0.00% 0.00% 0.00% 0.00% 0.00%
Ruminococcaceae; uncultured 1.00% 1.50% 0.40% 1.60% 1.70% 0.20%
Erysipelatoclostridium 0.00% 0.00% 0.10% 0.00% 0.10% 0.10%
Faecalibaculum 0.00% 0.00% 0.00% 0.10% 0.00% 0.20%
[Clostridium] innocuum group 0.00% 0.00% 0.10% 0.00% 0.00% 0.00%
Erysipelotrichaceae; uncultured 0.00% 0.00% 0.00% 0.00% 0.10% 0.00%
Erysipelotrichaceae;
uncultured bacterium
0.00% 0.00% 0.00% 0.00% 0.00% 0.00%
Rhodospirillaceae; uncultured 0.20% 0.00% 0.00% 0.00% 0.00% 0.00%

218
Table A5. VIP Strains at the genus taxonomic level (continued).
Taxonomy Male Female
WT HET KO WT HET KO
Parasutterella 4.10% 1.40% 5.20% 2.00% 1.70% 4.30%
Bilophila 0.10% 0.10% 0.00% 0.10% 0.10% 0.00%
Desulfovibrio 0.60% 0.70% 1.00% 0.90% 0.90% 0.80%
Helicobacter 1.10% 2.10% 9.20% 0.80% 1.50% 8.50%
Escherichia-Shigella 0.00% 0.00% 0.00% 0.00% 0.00% 0.30%
Raoultella 0.00% 0.00% 0.00% 0.00% 0.00% 0.10%
Serratia 0.20% 0.00% 0.10% 0.00% 0.00% 2.70%
Saccharimonas 0.70% 1.30% 0.20% 1.20% 0.70% 0.00%
Anaeroplasma 0.80% 0.30% 0.00% 0.50% 0.40% 0.00%
Mollicutes RF9; uncultured bacterium 0.10% 0.10% 0.10% 0.20% 0.10% 0.00%
Akkermansia 0.50% 0.00% 0.20% 0.00% 0.00% 0.70%

219
MW
T
MH
ET
MK
O
FW
T
FH
ET
FK
O
0
5 0
1 0 0
C la s s L e v e l T a x o n o m y
S e x a n d G e n o ty p e
% T
ota
l R
ea
ds
A c tin o b a c te r ia
C o r io b a c te r iia
B a c te ro id ia
C h la m y d ia e
C h lo ro p la s t
M e la in a b a c te ria
D e fe rr ib a c te re s
B a c illi
C lo s tr id ia
E ry s ip e lo tr ic h ia
A lp h a p ro te o b a c te ria
B e ta p ro te o b a c te ria
D e lta p ro te o b a c te ria
E p s ilo n p ro te o b a c te ria
G a m m a p ro te o b a c te ria
U n kn o w n C la ss
M o llicu te s
V e rru c o m ic ro b ia e
Figure A1. Changes at the class level in VIP strains.

220
MW
T
MH
ET
MK
O
FW
T
FH
ET
FK
O
0
5 0
1 0 0
O rd e r L e v e l T a x o n o m y
S e x a n d G e n o ty p e
% T
ota
l R
ea
ds
B if id o b a c te r ia le s
C o rio b a c te r ia le s
B a c te ro id a le s
C h la m y d ia le s
A m b ig u o u s _ ta xa
G o s s y p iu m a rb o re u m
G a s tra n a e ro p h ila le s
D e fe rr ib a c te ra le s
L a c to b a c illa le s
C lo s tr id ia le s
E ry s ip e lo tr ic h a le s
R h o d o s p irilla le s
B u rk h o ld e ria le s
D e s u lfo v ib r io n a le s
C a m p y lo b a c te ra le s
E n te ro b a c te r ia le s
U n k n o w n O rd e r
A n a e ro p la sm a ta le s
M o llic u te s R F 9
V e rru c o m ic ro b ia le s
Figure A2. VIP male and female order level taxonomic changes.

221
MW
T
MH
ET
MK
O
FW
T
FH
ET
FK
O
0
1 0
2 0
3 0
4 0
F a m ily : B a c te ro id a c e a e%
To
tal
Re
ad
s
* * * *
* * * *
* * * *
* * * *
* * * *
* * * *
* * * *
* * * * * * *
* * * *
MW
T
MH
ET
MK
O
FW
T
FH
ET
FK
O
0
1 0
2 0
3 0
4 0
F a m ily : B a c te ro id a le s S 2 4 -7
g ro u p
% T
ota
l R
ea
ds * * * *
* * * *
* * * *
* * * *
* * * * * * * *
* * * *
*
* * * *
MW
T
MH
ET
MK
O
FW
T
FH
ET
FK
O
0
5
1 0
1 5
2 0
F a m ily : P o rp h y ro m o n a d a c e a e
% T
ota
l R
ea
ds
* * * *
* * * *
* * * *
* * * *
* * * * * * * *
* * * *
* * * *
MW
T
MH
ET
MK
O
FW
T
FH
ET
FK
O
0
5
1 0
1 5
F a m ily : R ik e n e lla c e a e
% T
ota
l R
ea
ds
* * * *
* * * *
* * * * * * *
* *
* * *
* * *
*
Figure A3. Changes in abundance between individual bacterial families.
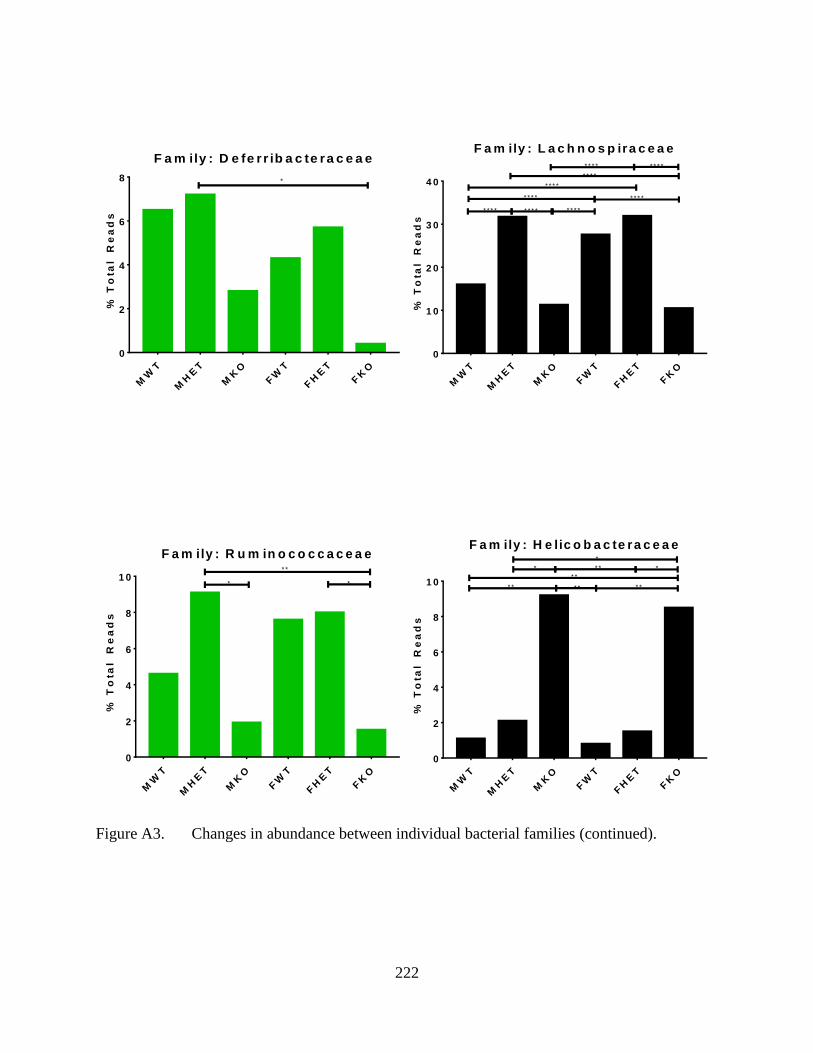
222
MW
T
MH
ET
MK
O
FW
T
FH
ET
FK
O
0
2
4
6
8
F a m ily : D e fe r r ib a c te ra c e a e
% T
ota
l R
ea
ds
*
MW
T
MH
ET
MK
O
FW
T
FH
ET
FK
O
0
1 0
2 0
3 0
4 0
F a m ily : L a c h n o s p ira c e a e
% T
ota
l R
ea
ds
* * * * * * * *
* * * *
* * * *
* * * *
* * * *
* * * *
* * * *
* * * *
MW
T
MH
ET
MK
O
FW
T
FH
ET
FK
O
0
2
4
6
8
1 0
F a m ily : R u m in o c o c c a c e a e
% T
ota
l R
ea
ds
*
* *
*
MW
T
MH
ET
MK
O
FW
T
FH
ET
FK
O
0
2
4
6
8
1 0
F a m ily : H e lic o b a c te ra c e a e
% T
ota
l R
ea
ds
*
* *
*
* *
* *
*
* *
* *
Figure A3. Changes in abundance between individual bacterial families (continued).