The RFM Model Analysis for VIP Customer: - IGI Global
18
DOI: 10.4018/IJKM.290025 International Journal of Knowledge Management Volume 18 • Issue 1 This article published as an Open Access article distributed under the terms of the Creative Commons Attribution License (http://creativecommons.org/licenses/by/4.0/) which permits unrestricted use, distribution, and production in any medium, provided the author of the original work and original publication source are properly credited. 1 The RFM Model Analysis for VIP Customer: A Case Study of Golf Clothing Brand Tung-Hsiang Chou, National Kaohsiung University of Science and Technology, Kaohsiung, Taiwan Shu-Chen Chang, National Kaohsiung University of Science and Technology, Kaohsiung, Taiwan ABSTRACT Numerous firms accumulate large quantities of data or transactions after importing information systems and services, which leads to troubles with data procedure. Firms also have demands to find customers’ information from large datasets and to understand how to develop marketing strategies accurately to adjust their operational methods. Therefore, this study proposed customer ranking combined big data process based on the RFM model (recency, frequency, monetary) to develop a recommendation algorithm using an association rule, which finds greater recommendation to promote operational effects of firms. The authors adjust the weight of potential information to perform the customer ranking, which is conducted by using agglomerate hierarchical clustering. Finally, they present the recommendation by the association rule for each customer level. The datasets in this study use actual sales data; therefore, they are authentic and have been practically applied. The metrics of evaluation showed that the recommended system this study proposes is highly accurate. KeywoRdS Association Rule, Data Mining, Recommended System, RFM Model INTRodUCTIoN In recent years, consumption habits have changed drastically. Take a minute to imagine the world we were in 15 years ago. The current magnate of social media—Facebook—had just appeared; Amazon was still a sales platform for selling books; and Blockbuster seemed to be doing better than Netflix. With the advent of the information age, information technology and other consumer electronics began to flourish. According to an investigative report, firms have made information technology a key tool for business, and it has improved firms’ relationship with the customer (Bahrami, Ghorbani, & Arabzad, 2012). These improvements have sped up business processes by using information systems, such as point-of-sale machines and enterprise-resource-planning software. Over time, firms have thus acquired large-scale data pertaining to many operational situations. Jennex and Bartczak (2013) proposed a well-structured system for data transformation. This information may contain knowledge from which managers can benefit but about which they know very little. Thus, effective use of these data is an important issue. Some researchers have performed methods of data mining, such as association-rules analysis and recommendation systems, in order to analyze the data collected by physical retailers
-
Upload
khangminh22 -
Category
Documents
-
view
1 -
download
0
Transcript of The RFM Model Analysis for VIP Customer: - IGI Global

DOI: 10.4018/IJKM.290025
International Journal of Knowledge ManagementVolume 18 • Issue 1
This article published as an Open Access article distributed under the terms of the Creative Commons Attribution License(http://creativecommons.org/licenses/by/4.0/) which permits unrestricted use, distribution, and production in any medium,
provided the author of the original work and original publication source are properly credited.
1
The RFM Model Analysis for VIP Customer:A Case Study of Golf Clothing BrandTung-Hsiang Chou, National Kaohsiung University of Science and Technology, Kaohsiung, Taiwan
Shu-Chen Chang, National Kaohsiung University of Science and Technology, Kaohsiung, Taiwan
ABSTRACT
Numerous firms accumulate large quantities of data or transactions after importing information systems and services, which leads to troubles with data procedure. Firms also have demands to find customers’ information from large datasets and to understand how to develop marketing strategies accurately to adjust their operational methods. Therefore, this study proposed customer ranking combined big data process based on the RFM model (recency, frequency, monetary) to develop a recommendation algorithm using an association rule, which finds greater recommendation to promote operational effects of firms. The authors adjust the weight of potential information to perform the customer ranking, which is conducted by using agglomerate hierarchical clustering. Finally, they present the recommendation by the association rule for each customer level. The datasets in this study use actual sales data; therefore, they are authentic and have been practically applied. The metrics of evaluation showed that the recommended system this study proposes is highly accurate.
KeywoRdSAssociation Rule, Data Mining, Recommended System, RFM Model
INTRodUCTIoN
In recent years, consumption habits have changed drastically. Take a minute to imagine the world we were in 15 years ago. The current magnate of social media—Facebook—had just appeared; Amazon was still a sales platform for selling books; and Blockbuster seemed to be doing better than Netflix. With the advent of the information age, information technology and other consumer electronics began to flourish.
According to an investigative report, firms have made information technology a key tool for business, and it has improved firms’ relationship with the customer (Bahrami, Ghorbani, & Arabzad, 2012). These improvements have sped up business processes by using information systems, such as point-of-sale machines and enterprise-resource-planning software. Over time, firms have thus acquired large-scale data pertaining to many operational situations. Jennex and Bartczak (2013) proposed a well-structured system for data transformation. This information may contain knowledge from which managers can benefit but about which they know very little. Thus, effective use of these data is an important issue. Some researchers have performed methods of data mining, such as association-rules analysis and recommendation systems, in order to analyze the data collected by physical retailers

International Journal of Knowledge ManagementVolume 18 • Issue 1
2
(Tekin, Köse, Koyuncuoğlu, & Tekin, 2015). When data can give managers a good grasp of the available information, it is easier for physical “brick-and-mortar” stores to adjust market layouts and promotion spaces on a sales basis (Villars, Olofson, & Eastwood, 2011).
Past research has established that many physical stores regularly collect the purchase data of customers but not customer-specific data (Weng, 2017). Without information pertaining to customers’ patterns of behavior, firms may make poor marketing decisions. In this regard, the revised knowledge pyramid constitutes an advanced strategy encompassing big data and the internet of things (IoT) (Jennex, 2017). Researchers have recently proposed an approach to recording customer behavior without collecting demographic information (Hu & Yeh, 2014). The problem to be considered next is how to help physical stores derive useful new customer patterns from data.
Firms have started applying data-mining technologies to marketing planning. The objective is to gain customer loyalty by discovering and harnessing the factors that contribute to customer value. A “recency–frequency–monetary value” (RFM) analysis is a very popular database-marketing metric for quantifying customer transaction histories on the basis of the three aforementioned factors: recency (R), frequency (F), and monetary value (M). RFM scoring essentially assigns R, F, and M values to current customers and then scores the customers according to these values. This scoring metric has been proven to be highly effective in marketing-database applications, such as customer-relationship management (CRM), which includes customer segmentation. Although most studies adopt the RFM model to develop commendation services and the like, the fact is that the data fields have remarkably diverse significance for firms’ sale transactions. Therefore, in the current study, we propose and evaluate a novel RFM-based model to connect high-loyalty customers with improved revenue streams on the basis of historical physical-store data.. Therefore, this study has emerged several issues, for example, most studies adopted association rule and RFM model to develop commendation service, but there are diverse data item in the transactional database. This study will analyze these diverse data item and utilize these data item’s contexts to formalize data meanings.
In summary, we would like to propose a novel model based on RFM model to segment the level of customers, and then explore how to make choices better through analyzing data of physical store, to find the high loyalty customers and improve the revenues. Finally, we verify our promotion of novel model proposed on this study by using evaluation method.
ReLATed woRKS
The objective of this section is to explore the current status of research results and their connections to this study. Specifically, we review works addressing the RFM model, data-mining processes, hybrid recommendation services, and association rules.
CRISP-dM MeTHod
Wirth and Hipp (2000) proposed a cycle flow based on the KDD process (Wirth & Hipp, 2000), which functions as a cross-industry standardized approach to data mining. Developed as a six-stage lifecycle through KDD (Saltz, 2015), CRISP-DM is widely used for analyzing large volumes of valuable data and is considered to be a reliable data-science method available to firms (Saltz & Crowston, 2017). These data mining frameworks have been modified over the years to meet business expectations (Rahman, Desa, Wibowo, & Haris, 2014).
RFM ModeL
RFM analysis is a general approach to measuring customer lifetime value (CLV) (Fader et al., 2005; Hu & Yeh, 2014; Safari et al., 2016), which analysts derive from customer purchase data to predict

International Journal of Knowledge ManagementVolume 18 • Issue 1
3
customer behavior and to evaluate firm performance (Wei, Lin, & Wu, 2010). The three factors making up RFM analysis are defined as follows: recency is the amount of time customers take between their last purchase and the one prior to it, with greater values pointing to lower likelihoods of short gaps between purchases; frequency is the number of times that a customer makes purchases in a certain period, with higher frequency values corresponding to the most loyal customers; and monetary value is the total amount of money spent by customers in a certain period, with higher amounts corresponding to higher customer demand.
Recommendation Systems and Association RulesRecommendation systems provide advice to firms by enabling them to analyze the purchase data of customers. The results of recommendation systems can help firms increase both customer loyalty and customer satisfaction (Beladev, Rokach, & Shapira, 2016). Zhang (2016) proposed a method of group recommendation, which includes activity-oriented group discovery and adjustment of ratings for enhanced accuracy. An evaluation verified that the proposed recommendation system was efficient, objective, and accurate (Zhang, 2016). Rezaeinia and Rahmani (2016) proposed a recommendation-system framework based on customer segmentation. Their study extracted RFM-model variables for segmenting several levels of customers. In addition, results show that the method was relatively accurate and that it reduced the calculation speed and data scalability of the recommendation system (Rezaeinia & Rahmani, 2016).
When a set of items is likely to occur at the same time, associations will occur in the data object. Association-rule mining often used for market-basket analysis (Weng, 2017) and recommendation systems (Liao & Chang, 2016). Agrawal et al. (1993) defined the main problem thus: researchers must derive rules from large-scale data conform to minimum support, lift, and confidence constraints (Agrawal, Imieliński, & Swami, 1993). The formula for the support, lift, and confidence is as follows:
Support X Yfrq X Y
N→( ) = ( ),
(1)
ConfidenceSupport X Y
Support XX Y→( ) = ( )
( )∪
(2)
Lift X YConfidence X Y
Support Y→( ) =
→( )( )
(3)
The general ARM approach involves two outputs:
• All frequent itemsets conforming to the minimum support constraints;• All rules of association conforming to the minimum confidence constraints from the mining
results.
Prior studies have used general RFM models to analyze data, but few of these studies have involved weighted analyses. Although Safari et al. (2016) proposed the weighting of RFM calculations, the step was limited to particular domains. Moreover, previous studies have focused their RFM models

International Journal of Knowledge ManagementVolume 18 • Issue 1
4
on customer consumption but seldom on the revenue of firms and traditional recommendation efforts have faced data-scalability and data-sparsity problems.
ReSeARCH MeTHodoLoGy
In order to segment customers and make accurate behavioral predictions that improve a firm’s bottom line, we started the current study with data collection and then followed input steps to conduct customer-feature sampling. Next, we performed RFM analyses to identify possible recommendations. After separating the data in the output step, we evaluated on the basis of customer segmentation, classification rules, and association rules. Finally, we extracted customer goals and customer values, as shown in Figure 1.
To develop our RFM analysis and association rules for a recommendation system, we configured a pre-recommendation data pool based on the RFM model; and to obtain customer-purchase records, we used data preprocessing. Finally, we used both the segmentation method and association rules to generate a Top-N Recommendation. Figure 2 presents the interconnected steps in our current study’s research framework.
data PreprocessingIn line with the revised knowledge pyramid, our current study collects and preprocesses real-world data. This task, which is one of the most important and often one of the most time-consuming aspects of data-mining projects, involves four steps: data reduction, feature selection, data transformation, and normalization. We eliminated chain-store data from our dataset, and because our segmentation rests on the CLV and RFM methods, our selected features are last-purchase date, purchase count (i.e., the frequency of customer purchases), total customer expenditure during one year, and item count item which refers to variety of customer purchased products. We transformed the data so that they can be exploited by data mining tools. The following table shows the transformed data.
RFM extractionWe drew the attributes of our proposed tools from the RFM technique discussed in Hu and Yeh (2014) and Wei et al. (2010). In addition, Weng (2017) states that firm revenue is an important factor in the analysis of customer-purchase records.
For this component, we identified the most recent date of purchase from each customer to obtain recency values from the data first. After sorting the purchase dates in descending order, we calculated the gaps between the most recent purchase date and the previous purchase date. Next, we calculated the number of customer purchases in a specific period to get frequency values. It is noteworthy that
Figure 1. The RFM research process of the current study

International Journal of Knowledge ManagementVolume 18 • Issue 1
5
the time period is adjustable depending on the requirements of the given firm. Finally, we subtracted the cost of returned items fromin order to calculate the net payments of each customer. In addition, research has established that the RFM model is useful for analyses involving recent purchases and firm revenue (Weng, 2017). Therefore, we integrated firm-revenue factors into the RFM model, extracted the selling price of each product from the database, and subtracted the generation costs from the. Because revenue value is more sensitive than monetary value for reflecting a firm’s profit, our study also focused on revenue that promotes the precision of purchase data.
The traditional RFM model considered each value as being the same weight, and there are many data fields in the firm’s transactional database. For example, the Rc, Fc, and Mc represent customer c in the recency of visiting time, frequency of purchasing records, and monetary of payments. But each
Figure 2. The research framework

International Journal of Knowledge ManagementVolume 18 • Issue 1
6
data field should have different representation, therefore we claim the diverse data reflect customer behavior in real-life applications. We also defined a weighting method for normalizing the RFM score: let I = {i1, i2, …, iN} be a set, and let each purchase record, P, be a set of items, such that P⊆I, with P containing item X if and only if X⊆P.
Finally, to prevent overweighting in the initial range, we used a method of min–max normalization to normalize recency, frequency, monetary value, and revenue as follows:
N RR R
R Rcc min
max min
( ) = −
− (4)
N FF F
F Fcc min
max min
( ) = −
− (5)
N MM M
M Mcc min
max min
( ) = −
− (6)
N ReRe Re
Re Recc min
max min
( ) = −
− (7)
We measured the weight of the RFM value. Firms can adjust each level on the basis of the number of customers. This allows the firms to identify their best customers in advance: customers who made purchases most recently, most often, and with the most amount of money. This approach also helps firm to identify risky customers and so on. With the various insights that this information yields, firms can adjust the weight of RFMs.
The weight of the purchase Pi of customer c is defined as follows:
W PN R N F N M N Re
i
c c c c( ) = ( )+ ( )+ ( )+ ( )number of RFM metric factor
(8)
where:
• Rc
: The recency value of customer c.• F
c: The frequency value of customer c.
• Mc
: The monetary value of customer c.• Re
c: The revenue value of customer c.

International Journal of Knowledge ManagementVolume 18 • Issue 1
7
SeGMeNTATIoN
In this study, we segmented the customers into five levels and then ranked the customers, with customer rankings defined on the basis of the given level. The customer-ranking table can help firms gauge the importance of the customer. The results of the customer ranking helped us to draft recommendations with calculations of RFM values. We will discuss the strategy development as it corresponds to each level. Table 1 shows a ranking table that records the RFM values.
We used the RFM scores to segment customers with a cluster algorithm and divided them by using a hierarchical clustering algorithm. We then joined the two closest clusters and repeated the above steps until there was only a single cluster left. The algorithm is shown in Figure 3. Finally, we used the results of clustering to identify customer level and to recommend the product most appropriate for.
We used two metrics, support and confidence, as evaluations that represented association rules. Finally, we generated the association rules and ranked the products that we wanted to recommend. Let I be an item set so that I = {i_1, i_2, …, i_n}, with each item representing a specific code. D represents a set of purchase records in a database in which each purchase is P. Each itemset P is a subset of I, which is presented as P⊆I. To show the association relation of X and Y, we used X Y→ and the RFM score as the association rule. In this study, therefore, the formula for the support was defined as follows:
Figure 3. Agglomerative hierarchical clustering algorithm
Table 1. Customer ranking table
RANK Description W(Pi) Level
Champions Bought recently, buy often, and spend the most. 1
Loyal Customers Spend good money. Responsive to promotions. 2
General Customers Recent customers, spent good amounts, bought more than once. 3
Indifferent Customers Lowest recency, frequency, monetary value, & revenue scores. 4

International Journal of Knowledge ManagementVolume 18 • Issue 1
8
Support XW P
W P
P X P P D i
P P D i
i
i
( ) =( )
( )⊆( )∧ ∈( )
∈( )
∑∑
Accordingly, we defined the mining algorithm as shown in Figure 4.This algorithm generates an excessive amount of itemsets. Therefore, to discover the high support
values that were normalized through the RFM score from transactions, we had to find all itemsets that satisfy the minimum support threshold. The findings of the high support values are the most computationally expensive procedures in association rules.
eXPeRIMeNT deSIGN
We will now describe the proposed approach and provide a case to illustrate the method for discovering the frequent itemsets from customer purchase transactions. For this study, we used a dataset from the sales records of a Taiwanese apparel store to implement the recommendation of our research framework.
data descriptionThe dataset is the sales data of a Taiwan-based apparel store, as provided in past research (Chang, 2018). This dataset covered all transactions between 2010 and 2017. Each transaction belonged to a list detailing the purchases of the store’s top-500 customers. The details included customer codes, item codes, prices, product costs, sales dates, and discounts. Before we performed the preprocessing tasks, the dataset contained 49,040 transactions. In addition, each product code had a unique meaning. Every serial number was a combination of a letter of the alphabet and four numbers. The letter G represents an apparel style for males; L represents an apparel style for females.
ImplementationIn this section, we explore the five main steps in the process, including the data cleaning, general RFM and revenue, normalization, and weight.
Figure 4. Association rule algorithm

International Journal of Knowledge ManagementVolume 18 • Issue 1
9
Step 1: Data Cleaning and Extract, Transform, and Load (ETL).
The original dataset for this study led to inaccurate analysis results because the data included returned purchases and other information that created confusion. After we finished cleaning the data, we performed ETL. To allow for smooth data preprocessing in step with the RFM model, we first extracted the relevant elements of the dataset, which included order IDs, purchase dates, total consumption records, and costs. Because the RFM units differed from, the data types covered time series and numerical values. We then transformed the RFM elements into a single format. Finally, after the preprocessing, we loaded the data onto the database. As stated above, data cleaning and ETL are important for data preprocessing.
Step 2: RFM Model.
The general RFM model, and the revenue generated by each customer in this dataset. Recency represents the amount of days a customer took between last purchase and a specific date (defined as 2018/01/01 for this study). Frequency represents how often each customer visited store on average. Monetary represents the total consumption of each customer. In addition, the value of revenue is an important factor in this study. Therefore, we calculated the difference between sales and costs.
Step 3: Normalization and Weight.
We calculated recency, frequency, monetary value, and revenue by normalizing their values as follows. Table 2 shows the results of our weighing of the RFM model’s values. The weighted values helped us compare customer data according to a single standard. The normalization results gave us some preliminary insights into. Figure 5, which presents the visualization boxplot that we obtained after having normalized the RFM model, identifies the data distribution of each element, which helped us perform subsequent analyses.
Step 4: Customer Clustering and Ranking.
In this study, we used the clustering approach for customer segmentation. Figure 6 shows the clustering results from the dataset provided. These results show the distribution situation relative to all customer transactions. For the clustering, we completed three steps, discussed below:
First, before clustering, we measured the similarities of each customer to every other customer by using distance computing and by including the weighted RFM parameters W(Pi).
Next, we plotted the distance information into the algorithm and grouped pairs of each element into clusters based on their distance. As the distance measurement involved several dimensions, including the RFM model, we adopted the dimensionality reduction method. Figure 7 shows the distribution of customers’ similarity using a 3D plot, with the same color reflecting the higher similarity.
In the third and final step of the clustering, the clusters linked to one another in ways that created new clusters. We iterated the process until all the clusters in the original dataset were linked together in a hierarchical dendrogram.
Step 5: Association-Rules Analysis.
By using past customers’ purchase records, the RFM model, and revenue-based association rules, we implemented a recommendation system for a Taiwan-based apparel store.
We set the threshold of support at 0.8 in this study, and the lift had to be greater than 1, because it represents a strong association. Table 3 shows the top 10 associate rules. Based on association

International Journal of Knowledge ManagementVolume 18 • Issue 1
10
mining, Tables 4, 5, 6, and 7 present, respectively, the four frequency itemsets: champions, loyal customers, general customers, and indifferent customers.
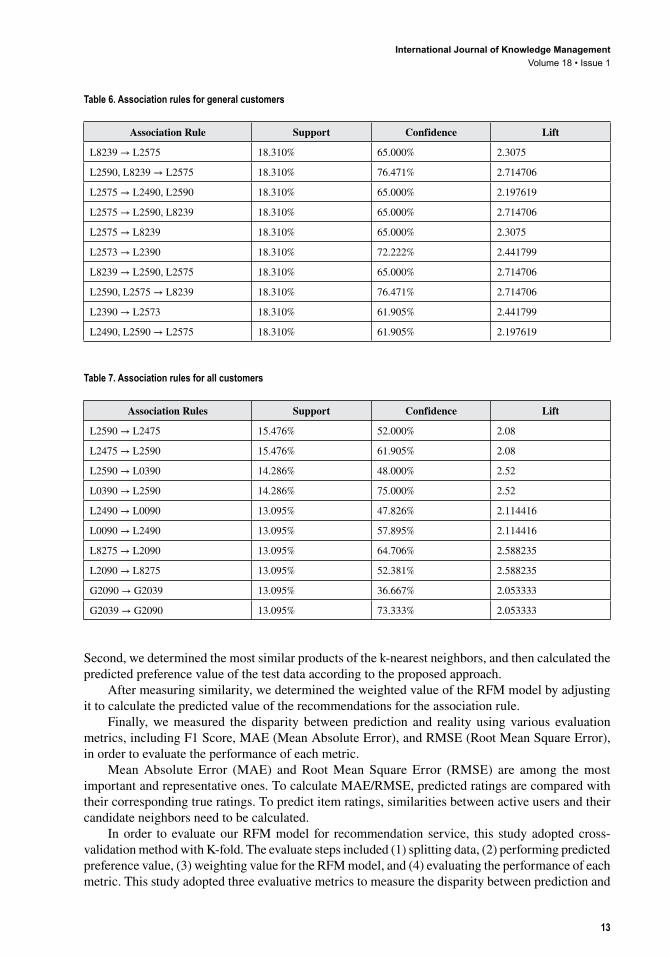
From our analysis of the dataset, we can glean some insights into the apparel store’s customers. In terms of overall customers, we inferred that preferences for male clothing were quite low, as champions, loyal customers, and general customers tended to prefer female clothing. A possible reason for this notable preference is that the rules for overall customers involved neither RFM-model calculations nor weighting and segmentation into sub-groups of customers. In other words, we can make accurate product recommendations only if we use customer ranking, and the purpose of this
Table 2. Normalization results for customers
User ID W(R) W(F) W(M) W(Re) W(Pi)
Q000304 0.907626208 0.145952109 0.078816586 0.045547717 0.294486
Q000464 0.273361976 0.038768529 0.0308088 0.055532451 0.099618
Q000576 0.99301826 0.141391106 0.118431977 0.109695183 0.340634
Q000650 0.544575725 0.010262258 0.009649718 0.000598108 0.141271
Q000798 0.996240602 0.070695553 0.041021962 0.034439135 0.285599
Q000826 0.893662728 0.118586089 0.120174671 0.109871302 0.310574
Q000971 0.861439313 0.095781072 0.08172881 0.078567437 0.279379
Q001073 1 0.132269099 0.115538253 0.104471769 0.33807
Figure 5. Boxplot after normalization of the RFM model

International Journal of Knowledge ManagementVolume 18 • Issue 1
11
study was to employ both the RFM model and weighted calculations in order to help firms refine their recommendation techniques and implement useful customer segmentations.
eVALUATIoN
For this study, we applied the K-fold method, which is a cross-validation approach, to the training datasets. This method helped us to select the best hyperparameters from all recommendation models, and then use the best solution to evaluate the models in terms of the whole dataset (Seo, Kim, Lee, & Baik, 2017).
First, we divided the datasets into a test set and a training set. The constant, k, represents the optional number of folds—in this study, we have it set as k=5. That is, we set aside 20% of the data as “test data” and 80% of the data as “training data” in order to measure the effects of recommendations.
Figure 6. Clustering results
Figure 7. Customer-similarity distribution

International Journal of Knowledge ManagementVolume 18 • Issue 1
12
Table 4. Association rules for champions
Association Rule Support Confidence Lift
L8799 → L8790 13.861% 57.143% 2.098701
L8790 → L8799 13.861% 50.909% 2.098701
L8239 → L8290 12.871% 50.000% 2.195652
L8290 → L8239 12.871% 56.522% 2.195652
L8290 → L8299 11.881% 52.174% 2.242368
L8299 → L8290 11.881% 51.064% 2.242368
L8299 → L2575 11.386% s48.936% 2.059397
L2575 → L8299 11.386% 47.917% 2.059397
L2555 → L2590 11.386% 60.526% 2.445263
L2590 → L2555 11.386% 46.000% 2.445263
Table 5. Association rules for loyal customers
Association Rules Support Confidence Lift
L2590, L8890 → L2090, L2575 20.567% 59.184% 2.035341
L2590, L2090, L8790 → L2575 20.567% 76.316% 2.030288
L2590, L2490 → L2090, L2575 20.567% 60.417% 2.077744
L2090, L2575 → L2590, L2490 20.567% 70.732% 2.077744
L2090, L2575 → L2590, L8890 20.567% 70.732% 2.035341
L2190, L8790 → L8890, L8799 20.567% 67.442% 2.161205
L8890, L8799 → L2190, L8790 20.567% 65.909% 2.161205
L2590, L2090 → L2575, L8790 20.567% 50.000% 2.073529
L2590, L8790 → L2090, L2575 20.567% 65.909% 2.26663
L2090, L2575 → L2590, L8790 20.567% 70.732% 2.26663
Table 3. Association rules for all customers
Association Rules Support Confidence Lift
L8299 → L8275 15.060% 45.181% 2.008929
L8275 → L8299 15.060% 66.964% 2.008929
G0035 → G0099 14.257% 76.344% 2.100517
G0099 → G0035 14.257% 39.227% 2.100517
L8899, L0090 → L2490 13.655% 79.070% 2.083426
L2490 → L8899, L0090 13.655% 35.979% 2.083426
L8890 → L8899, L0090 13.454% 37.640% 2.179645
L8899 → L0090, L8890 13.454% 42.138% 2.037369
L0090, L8890 → L8899 13.454% 65.049% 2.037369
L8899, L0090 → L8890 13.454% 77.907% 2.179645
International Journal of Knowledge ManagementVolume 18 • Issue 1
13
Second, we determined the most similar products of the k-nearest neighbors, and then calculated the predicted preference value of the test data according to the proposed approach.
After measuring similarity, we determined the weighted value of the RFM model by adjusting it to calculate the predicted value of the recommendations for the association rule.
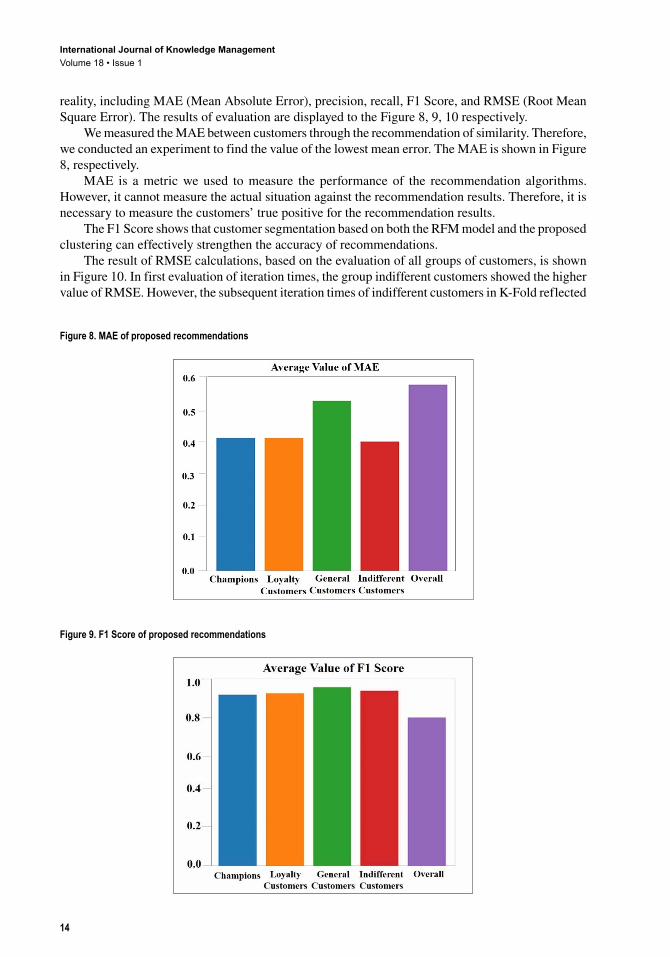
Finally, we measured the disparity between prediction and reality using various evaluation metrics, including F1 Score, MAE (Mean Absolute Error), and RMSE (Root Mean Square Error), in order to evaluate the performance of each metric.
Mean Absolute Error (MAE) and Root Mean Square Error (RMSE) are among the most important and representative ones. To calculate MAE/RMSE, predicted ratings are compared with their corresponding true ratings. To predict item ratings, similarities between active users and their candidate neighbors need to be calculated.
In order to evaluate our RFM model for recommendation service, this study adopted cross-validation method with K-fold. The evaluate steps included (1) splitting data, (2) performing predicted preference value, (3) weighting value for the RFM model, and (4) evaluating the performance of each metric. This study adopted three evaluative metrics to measure the disparity between prediction and
Table 6. Association rules for general customers
Association Rule Support Confidence Lift
L8239 → L2575 18.310% 65.000% 2.3075
L2590, L8239 → L2575 18.310% 76.471% 2.714706
L2575 → L2490, L2590 18.310% 65.000% 2.197619
L2575 → L2590, L8239 18.310% 65.000% 2.714706
L2575 → L8239 18.310% 65.000% 2.3075
L2573 → L2390 18.310% 72.222% 2.441799
L8239 → L2590, L2575 18.310% 65.000% 2.714706
L2590, L2575 → L8239 18.310% 76.471% 2.714706
L2390 → L2573 18.310% 61.905% 2.441799
L2490, L2590 → L2575 18.310% 61.905% 2.197619
Table 7. Association rules for all customers
Association Rules Support Confidence Lift
L2590 → L2475 15.476% 52.000% 2.08
L2475 → L2590 15.476% 61.905% 2.08
L2590 → L0390 14.286% 48.000% 2.52
L0390 → L2590 14.286% 75.000% 2.52
L2490 → L0090 13.095% 47.826% 2.114416
L0090 → L2490 13.095% 57.895% 2.114416
L8275 → L2090 13.095% 64.706% 2.588235
L2090 → L8275 13.095% 52.381% 2.588235
G2090 → G2039 13.095% 36.667% 2.053333
G2039 → G2090 13.095% 73.333% 2.053333
International Journal of Knowledge ManagementVolume 18 • Issue 1
14
reality, including MAE (Mean Absolute Error), precision, recall, F1 Score, and RMSE (Root Mean Square Error). The results of evaluation are displayed to the Figure 8, 9, 10 respectively.
We measured the MAE between customers through the recommendation of similarity. Therefore, we conducted an experiment to find the value of the lowest mean error. The MAE is shown in Figure 8, respectively.
MAE is a metric we used to measure the performance of the recommendation algorithms. However, it cannot measure the actual situation against the recommendation results. Therefore, it is necessary to measure the customers’ true positive for the recommendation results.
The F1 Score shows that customer segmentation based on both the RFM model and the proposed clustering can effectively strengthen the accuracy of recommendations.
The result of RMSE calculations, based on the evaluation of all groups of customers, is shown in Figure 10. In first evaluation of iteration times, the group indifferent customers showed the higher value of RMSE. However, the subsequent iteration times of indifferent customers in K-Fold reflected
Figure 8. MAE of proposed recommendations
Figure 9. F1 Score of proposed recommendations

International Journal of Knowledge ManagementVolume 18 • Issue 1
15
a lower value of RMSE, so that it represented extreme value involvement. Moreover, the RMSE of overall customers increased after each iteration. Therefore, after the five iteration times, the RMSE of clustering obtained by using customer ranking is more efficient than the original.
According to the result of the evaluation, the values of MAE and RMSE show the performance of the recommendation model. The MAE values reflected actual estimation, and we discovered that the MAE values. We encountered the same situation in our RMSE measurements—. In addition, in measuring the positive’s accuracy, we discovered that the performance of the F1 Scores revealed that generation of recommendations using customer ranking was more accurate than.
In summary, our evaluation revealed that our proposed method (1) enhanced the accuracy of recommendations and (2) reduced the error margin between prediction and actual customer preference. Our comparison of use of transaction data for recommendation systems is based on association rules, which promote various components of customer information in order to promote marketing that is more effective than the marketing associated with large-scale data. Therefore, our proposed method provides many suitable methods for measuring recommendation performance in data mining.
CoNCLUSIoN
In this study’s Introduction, we summarized importance of knowledge insight from original data and the ability of physical stores to process large-scale data. In other words, firms now grasp that firms greatly value both data processing and insights are now regarded as very important to firms (Liao & Chang, 2016). Therefore, in this study, we provide several data preprocess methods based on understanding data. Before using these methods, we had to understand domain knowledge because it helped us to prepare for both this study’s initial data analysis, which included the RFM model, and customers’ characteristics from each ranking.
Future workOnline platforms that enable customers’ purchase of items on the Internet have largely replaced physical (brick-and-mortar) services. This massive shift toward online purchases has led to the development of a new term: e-commerce (Chaffey, 2015). With e-commerce, people are never limited by geographic
Figure 10. RMSE of proposed recommendations
International Journal of Knowledge ManagementVolume 18 • Issue 1
16
location. However, e-commerce is deeply reliant on both the generation and the collection of massive amounts of data from customers.
According to Akter and Wamba (2016), there has been a trend of big data analytics in e-commerce in recent years (Akter & Wamba, 2016). Our study analyzed accumulated large-scale data.
As e-commerce websites have expanded quickly, a pressing requirement has arisen for providing recommendations by finding the whole range of available services. Users found that making the most appropriate choices of items from the variety of products and services that websites offer is difficult (Ricci et al., 2015). The explosive growth and variety of information available on the Internet, as well as the constant importation of new items on e-commerce platforms, has caused customers to make bad decisions. Customers who make a choice for themselves, rather than making decisions based on past experiences, the benefit to users will be reduced (Ricci et al., 2015). It is good that users make choices, but the choice is not always better in most situations. In fact, as the number of available choices increase, the freedom, can become very powerful. In fact, as the number of choices increases, choosers become overwhelmed (Schwartz, 2004).
Therefore, researchers should survey the online data processing in the future, including the integration of big data from different sources and formats. Akter and Wamba (2016) also refer to the thinking of “Agile” (Akter & Wamba, 2016), representing a methodology of data engineering. This method focuses on the continuous integration and continuous delivery in the big data environment, and how to change with the evolution of data (Larson & Chang, 2016). Research in the future can refer to the “Agile” method to process the data from e-commerce platforms, as well as integrate our proposed method to implement an online recommendation system.
ACKNowLedGMeNT
We would like to thank the anonymous reviewers and the editor for their insightful comments and suggestions. We would also like to thank to the graduate student Wei-Chung Pan, who helped us process data. This research was partially supported by the Ministry of Science and Technology (MOST) [grant no.: MOST 109-2410-H-992 -024 -].

International Journal of Knowledge ManagementVolume 18 • Issue 1
17
ReFeReNCeS
Agrawal, R., Imieliński, T., & Swami, A. (1993). Mining association rules between sets of items in large databases. SIGMOD Record, 22(2), 207–216. doi:10.1145/170036.170072
Akter, S., & Wamba, S. F. (2016). Wamba, Big data analytics in E-commerce: A systematic review and agenda for future research. Electronic Markets, 26(2), 173–194. doi:10.1007/s12525-016-0219-0
Bahrami, M., Ghorbani, M., & Arabzad, S. M. (2012). Information technology (IT) as an improvement tool for customer relationship management (CRM). Procedia: Social and Behavioral Sciences, 41, 59–64. doi:10.1016/j.sbspro.2012.04.008
Beladev, M., Rokach, L., & Shapira, B. (2016). Recommendation systems for product bundling. Knowledge-Based Systems, 111, 193–206. doi:10.1016/j.knosys.2016.08.013
Chaffey, D. (2015). Digital business and e-commerce management. Pearson Education Limited.
Chang, L-W. (2018). Potential Customer Analysis by Using CRM Application–A Case Study of M Company. Academic Press.
Fader, P. S., Hardie, B. G., & Lee, K. L. (2015). RFM and CLV: Using iso-value curves for customer base analysis. JMR, Journal of Marketing Research, 42(4), 415–430. doi:10.1509/jmkr.2005.42.4.415
Hu, Y.-H., & Yeh, T.-W. (2014). Discovering valuable frequent patterns based on RFM analysis without customer identification information. Knowledge-Based Systems, 61, 76–88. doi:10.1016/j.knosys.2014.02.009
Jennex, M. E. (2017). Big Data, the Internet of Things and the Revised Knowledge Pyramid. The Data Base for Advances in Information Systems, 48(4), 69–79. doi:10.1145/3158421.3158427
Jennex, M. E., & Bartczak, S. E. (2013). A Revised Knowledge Pyramid. International Journal of Knowledge Management, 9(3), 19–30. doi:10.4018/ijkm.2013070102
Kim, B. J., Singh, V., & Winer, R. S. (2017). The Pareto rule for frequently purchased packaged goods: An empirical generalization. Marketing Letters, 28(4), 491–507. doi:10.1007/s11002-017-9442-5
Liao, S., & Chang, H. (2016). A rough set-based association rule approach for a recommendation system for online consumers. Information Processing & Management, 52(6), 1142–1160. doi:10.1016/j.ipm.2016.05.003
Rahman, F. A. (2014). Knowledge Discovery Database (KDD)-Data Mining Application in Transportation. Proceeding of the Electrical Engineering Computer Science and Informatics, 1(1), 116-119. doi:10.11591/eecsi.v1.357
Rezaeinia, S. M., & Rahmani, R. (2016). Recommendation system based on customer segmentation (RSCS). Kybernetes, 45(6), 946–961. doi:10.1108/K-07-2014-0130
Ricci, F., Rokach, L., & Shapira, B. (2015). Recommendation systems: introduction and challenges. In Recommendation systems handbook. Springer.
Safari, F., Safari, N., & Montazer, G. A. (2016). Customer lifetime value determination based on RFM model. Marketing Intelligence & Planning, 34(4), 446–461. doi:10.1108/MIP-03-2015-0060
Saltz, J. S. (2015). The need for new processes, methodologies and tools to support big data teams and improve big data project effectiveness. From Databases to IEEE International Conference on Big Data (Big Data).
Saltz & Crowston. (2017). Comparing data science project management methodologies via a controlled experiment. Proceedings of the 50th Hawaii International Conference on System Sciences.
Schwartz, B. (2004). The paradox of choice: Why more is less. Ecco.
Seo, Y.-D., Kim, Y.-G., Lee, E., & Baik, D.-K. (2017). Personalized recommendation system based on friendship strength in social network services. Expert Systems with Applications, 69, 135–148. doi:10.1016/j.eswa.2016.10.024

International Journal of Knowledge ManagementVolume 18 • Issue 1
18
Tung-Hsiang Chou is a professor of information management at the National Kaohsiung University of Science and Technology (NKUST) in Taiwan. He received his PhD from the Management Information Systems Department at National Chengchi University in 2008. He was also an associate researcher in CHT and worked in the Taiwan telecommunications industry for more than seven years. He had been the Director of the Center of Industry-Academia Collaboration (MOE) and the Dean of the Office of Research and Development at National Kaohsiung First University of Science and Technology and National Kaohsiung University of Science and Technology. Dr. Chou is now involved in providing e-business solutions to local and national firms. His field of research is broadly concerned with industry 4.0, the internet of things, cloud computing, business-process management, business intelligence, big data, and service-oriented architecture. He has published articles in journals such as Information Science, Information & Management, International Journal of Technology Management, Kybernetes, Journal of Organizational and End User Computing, and Technology Analysis and Strategic Management, and in conference papers for such professional associations as IEEE, ACM, DSI and APDSI. Dr. Chou currently serves as a Dean, Office of Educational Programs and Product Promotion.
Shu-Chen Chang is a PhD in management at National Kaohsiung University of Science and Technology (NKUST). She has many years of practical experience as a project manager in e-commerce entrepreneurship and she also worked in Taiwan’s Ministry of Education. Her research fields include customer behavior, e-commerce, marketing planning, brand marketing, local creation promotion, and innovative entrepreneurship personal practical experience. She is also a lecturer who teaches Information Technology /Information Management classes for universities in Taiwan.
Tekin, M. (2015). The Analysis of Product Categories and Sales Relationships among Valuable Customers through Data Mining and Its Application to a National Retailer through Association Rules and Cluster Analysis. Proceedings: Advances in International Interdisciplinary Business and Economics, 5.
Wei, J.-T., Lin, S.-Y., & Wu, H.-H. (2010). A review of the application of RFM model. African Journal of Business Management, 4(19), 4199–4206.
Weng, C.-H. (2017). Revenue prediction by mining frequent itemsets with customer analysis. Engineering Applications of Artificial Intelligence, 63, 85–97. doi:10.1016/j.engappai.2017.04.020
Wirth, R. (2000). CRISP-DM: Towards a standard process model for data mining. Proceedings of the 4th international conference on the practical applications of knowledge discovery and data mining.
Zhang, Y. (2016). GroRec: A group-centric intelligent recommendation system integrating social, mobile and big data technologies. IEEE Transactions on Services Computing, 9(5), 786–795. doi:10.1109/TSC.2016.2592520