Water provision alters wildebeest adaptive habitat selection ...
10
ORIGINAL ARTICLE Water provision alters wildebeest adaptive habitat selection and resilience in the Central Kalahari Moses Selebatso 1,2 | Emily Bennitt 1 | Glyn Maude 2,3 | Richard W. S. Fynn 1 1 Okavango Research Institute, University of Botswana, Maun, Botswana 2 Kalahari Research & Conservation, Maun, Botswana 3 Department of Conservation & Research, Denver Zoological Foundation, Denver, CO, USA Correspondence Moses Selebatso Email: [email protected] Funding information Denver Zoological Foundation; SAVE Wildlife Conservation Fund; Comanis Foundation; Kanabo Conservation Link; Wilderness Wildlife Trust; Office of Research and Development (University of Botswana) Abstract Wildlife populations in semi-arid regions require unrestricted mobility along ecologi- cal gradients and across large landscapes to enable adaptive responses to seasonal variability and patchy resources. In the Kalahari region of Botswana, herbivore pop- ulations historically depended on seasonal access to the nutrient-rich Schwelle area in the wet season and to water from the Boteti River during drought periods. Blue wildebeest Connochaetes taurinus in the Central Kalahari Game Reserve (CKGR) have lost access to these key habitats due to fences and encroachment of livestock and humans. We deployed satellite collars onto 10 female wildebeest in the CKGR to examine seasonal movements and habitat selection in relation to the environ- mental conditions and fragmented ecosystem. Wildebeest favoured open, short- grass pan habitats in all seasons, probably in response to better forage quality and lower predation risk. The ability to remain in pan habitats during the dry season was a result of artificial water provision. A wildebeest herd that had no artificial water in its home range survived the dry season, whereas those wildebeest that were accus- tomed to water provision died when their water points failed in the dry season. Thus, water provision altered adaptive behaviour and reduced resilience of the pop- ulation to the arid environment. R esum e Les populations sauvages des r egions semi-arides exigent une mobilit e sans restriction le long de gradients ecologiques et au travers de vastes paysages pour pouvoir r epon- dre de fac ßon adaptative a la variabilit e saisonni ere et a la dispersion des ressources. Au Botswana, dans la r egion du Kalahari, les populations d’herbivores d ependent depuis toujours de l’acc es saisonnier a la zone riche en nutriments en saison des pluies et al’eau de la rivi ere Boteti pendant les p eriodes de s echeresse. Les gnous bleus Con- nochaetes taurinus de la Central Kalahari Game Reserve (CKGR) ont perdu l’acc es a ces habitats essentiels a cause de cl ^ otures et de l’envahissement du b etail et des hommes. Nous avons plac e des colliers satellite sur dix gnous femelles de la CKGR pour exami- ner leurs d eplacements saisonniers et la s election des habitats en fonction des condi- tions environnementales et de la fragmentation de l’habitat. En toute saison, les gnous privil egiaient les habitats plats (pan), ouverts, couverts d’herbe courte, probablement pour la qualit e de la nourriture et pour le plus faible risque de pr edation. La possibilit e de rester dans ces habitats plats en saison s eche etait le r esultat d’un apport d’eau arti- ficiel. Un troupeau de gnous qui ne disposait pas d’eau « artificielle » dans son Accepted: 6 May 2017 DOI: 10.1111/aje.12439 Afr J Ecol. 2017;1–10. wileyonlinelibrary.com/journal/aje © 2017 John Wiley & Sons Ltd | 1
-
Upload
khangminh22 -
Category
Documents
-
view
0 -
download
0
Transcript of Water provision alters wildebeest adaptive habitat selection ...

OR I G I N A L A R T I C L E
Water provision alters wildebeest adaptive habitat selectionand resilience in the Central Kalahari
Moses Selebatso1,2 | Emily Bennitt1 | Glyn Maude2,3 | Richard W. S. Fynn1
1Okavango Research Institute, University of
Botswana, Maun, Botswana
2Kalahari Research & Conservation, Maun,
Botswana
3Department of Conservation & Research,
Denver Zoological Foundation, Denver, CO,
USA
Correspondence
Moses Selebatso
Email: [email protected]
Funding information
Denver Zoological Foundation; SAVE
Wildlife Conservation Fund; Comanis
Foundation; Kanabo Conservation Link;
Wilderness Wildlife Trust; Office of
Research and Development (University of
Botswana)
Abstract
Wildlife populations in semi-arid regions require unrestricted mobility along ecologi-
cal gradients and across large landscapes to enable adaptive responses to seasonal
variability and patchy resources. In the Kalahari region of Botswana, herbivore pop-
ulations historically depended on seasonal access to the nutrient-rich Schwelle area
in the wet season and to water from the Boteti River during drought periods. Blue
wildebeest Connochaetes taurinus in the Central Kalahari Game Reserve (CKGR)
have lost access to these key habitats due to fences and encroachment of livestock
and humans. We deployed satellite collars onto 10 female wildebeest in the CKGR
to examine seasonal movements and habitat selection in relation to the environ-
mental conditions and fragmented ecosystem. Wildebeest favoured open, short-
grass pan habitats in all seasons, probably in response to better forage quality and
lower predation risk. The ability to remain in pan habitats during the dry season was
a result of artificial water provision. A wildebeest herd that had no artificial water in
its home range survived the dry season, whereas those wildebeest that were accus-
tomed to water provision died when their water points failed in the dry season.
Thus, water provision altered adaptive behaviour and reduced resilience of the pop-
ulation to the arid environment.
R�esum�e
Les populations sauvages des r�egions semi-arides exigent une mobilit�e sans restriction
le long de gradients �ecologiques et au travers de vastes paysages pour pouvoir r�epon-
dre de fac�on adaptative �a la variabilit�e saisonni�ere et �a la dispersion des ressources.
Au Botswana, dans la r�egion du Kalahari, les populations d’herbivores d�ependent
depuis toujours de l’acc�es saisonnier �a la zone riche en nutriments en saison des pluies
et �a l’eau de la rivi�ere Boteti pendant les p�eriodes de s�echeresse. Les gnous bleus Con-
nochaetes taurinus de la Central Kalahari Game Reserve (CKGR) ont perdu l’acc�es �a ces
habitats essentiels �a cause de clotures et de l’envahissement du b�etail et des hommes.
Nous avons plac�e des colliers satellite sur dix gnous femelles de la CKGR pour exami-
ner leurs d�eplacements saisonniers et la s�election des habitats en fonction des condi-
tions environnementales et de la fragmentation de l’habitat. En toute saison, les gnous
privil�egiaient les habitats plats (pan), ouverts, couverts d’herbe courte, probablement
pour la qualit�e de la nourriture et pour le plus faible risque de pr�edation. La possibilit�e
de rester dans ces habitats plats en saison s�eche �etait le r�esultat d’un apport d’eau arti-
ficiel. Un troupeau de gnous qui ne disposait pas d’eau « artificielle » dans son
Accepted: 6 May 2017
DOI: 10.1111/aje.12439
Afr J Ecol. 2017;1–10. wileyonlinelibrary.com/journal/aje © 2017 John Wiley & Sons Ltd | 1

territoire a surv�ecu �a la saison s�eche alors que ceux qui �etaient habitu�es �a l’apport
d’eau sont morts lorsque leurs points d’eau se sont taris en saison s�eche. L’apport
d’eau a donc modifi�e l’adaptabilit�e de leur comportement et r�eduit la r�esilience de la
population face �a un environnement aride.
K E YWORD S
artificial water provision, blue wildebeest, daily distance, forage quality, Kalahari, migration
1 | INTRODUCTION
Habitat loss and fragmentation compromise the resilience of wildlife
populations to variable climatic conditions in semi-arid regions by
restricting their mobility in response to stochastic patchy resources
and habitat heterogeneity (Fryxell et al., 2005; Illius & O’Connor,
2000; Owen-Smith, 2004). In the 1970s, the Kalahari region of Bots-
wana was home to some of Africa’s most abundant herds of ungu-
lates, with an estimated 250,000 blue wildebeest Connochaetes
taurinus a similar number of red hartebeest Alcelaphus buselaphus
and an estimated 100,000 springbok Antidorcas marsupialis (DHV,
1980). Owing to the low, patchy and unpredictable rainfall distribu-
tion of the region, these herds were extremely mobile, following a
nomadic strategy in response to the rainfall-driven spatiotemporal
mosaic of grazing resources in the landscape (Verlinden & Masogo,
1997; Williamson, Williamson, & Ngwamotsoko, 1988). The main
wet season range of the blue wildebeest, hartebeest and springbok
populations in the Kalahari ecosystem was a region with a high den-
sity of saline pans (Lancaster, 1978) between the Central Kalahari
Game Reserve (CKGR) and the Kgalagadi Transfrontier Park (KTP),
commonly known as the Kalahari Schwelle. The saline pans of the
Schwelle probably enabled pregnant and lactating females to meet
their elevated mineral requirements through access to mineral-rich
forage and geophagy (Ayotte, Parker, & Gillingham, 2008; Williamson
et al., 1988).
During dry seasons and mainly drought years, wildebeest made
long distance movements from the Schwelle through the CKGR to
the permanent water of the Boteti River, Lake Ngami and Lake Xau
(450 km) and some to the south-west towards the Nossob River
(150 km; Verlinden, 1998; Williamson et al., 1988). Fences in the
north, east and south of the CKGR, as well as human and livestock
encroachment in the Schwelle (Bergstrom & Skarpe, 1999; Cooke,
1985; Williamson et al., 1988) have increasingly restricted access to
these various ancestral ranges. Furthermore, a recent review of
national land use designated some of the Schwelle area (a part of a
semi-protected wildlife management area) to the west of the CKGR
as livestock ranches (Department of Lands 2009). This change will
potentially exacerbate the isolation of the CKGR wildebeest popula-
tion from the rest of the Kalahari population in the KTP and the
Schwelle. These effects of habitat loss and fragmentation, and land-
scape change are believed to be responsible for the decline of the
Kalahari ungulate populations, especially wildebeest, over the last
30 years (Wallgren et al., 2009), potentially through denied access to
water, high-quality forage (Fryxell, Greever, & Sinclair, 1988; Oliver,
Brereton, & Roy, 2013; Sinclair & Fryxell, 1985) and compromised
persistence of plant–herbivore interactions (Fryxell & Sinclair, 1988).
Wildebeest are the most water-dependent ungulates in the Kalahari
and so loss of access to water in drought years results in mass die-
offs (Williamson et al., 1988). Up to 80,000 wildebeest mortalities
were cited in each drought year of 1961, 1964 and 1970 (Owens &
Owens, 1984) and more than 50,000 were recorded in 1987 (Owens
& Owens, 1984; Williamson et al., 1988).
The government of Botswana addressed the loss of access to
drought ranges by establishing artificial waterholes in the CKGR in
1984 (Bonifica, 1992). Artificial water provision could remove the
need to seek water, thereby selecting for a sedentary population,
which may then decline due to local depletion of forage resources
and ambush by carnivores around waterholes (Rosenstock, Warren,
& James, 1999; Shannon, Matthews, Page, Parker, & Smith, 2009). It
is unknown how the population that is potentially restricted within
the CKGR is utilizing the landscape/habitat heterogeneity and its
spatiotemporal variability within the reserve.
We studied habitat selection and movement patterns of the
CKGR blue wildebeest population in response to seasonal resource
variability. Pans and valleys usually have short, highly nutritious
grasses compared to off-pan habitat (Milton, Dean, & Marincowitz,
1992); therefore, we expected that pan-valley habitat would have
higher forage quality than off-pan habitat. However, in low rainfall
areas, the herbaceous layer in the pans and valleys becomes mois-
ture-limited earlier in the dry season than that in the sandy off-pan
habitats, mainly because larger pore spaces in sands result in loss of
hydraulic conductivity and conservation of soil moisture much later
into the dry season than in clay soils (Alizai & Hulbert, 1970; Noy-
Meir, 1973). This suggests that the off-pan habitat could provide
greener forage during the dry season. We also expected a decline in
forage abundance in the pan-valleys due to limited moisture and
grazing. We predicted that wildebeest would select pan-valley habi-
tat in the wet season. The forage maturation hypothesis proposes
that herbivores aggregate to keep forage biomass at immature
growth stages that are more nutritious than the mature forage (Fryx-
ell, 1991; Wilmshurst, Fryxell, & Bergman, 2000). We expected
wildebeest to remain in the pan-valleys during the wet season and
maintain grazing lawns that provide high-quality forage and optimal
levels of herbaceous biomass (Arsenault & Owen-Smith, 2008; Bon-
net, Fritz, Gignoux, & Meuret, 2010). We also predicted that wilde-
beest would select the off-pan habitats during the dry seasons
2 | SELEBATSO ET AL.
where forage is expected to be greener than in the pan-valley
habitat.
Predation risk avoidance may dominate the hierarchy of deci-
sion-making in habitat selection choices (Rettie & Messier, 2000).
Thus wildebeest would be expected to select pan-valley habitats
with their open short grassland, not only for the better forage qual-
ity of the pans but also for the lower predation risk that pans pro-
vide (Martin, Benhamou, Yoganand, & Owen-Smith, 2015). Artificial
waterholes are also located in the pan-valley habitat, so in the dry
season, wildebeest may be forced to use the pan-valley habitat to
drink and sleep, even if they forage in the off-pan habitat, thereby
extending their foraging area in the dry season. We therefore further
predicted that wildebeest would cover shorter daily distances during
the wet than dry seasons.
2 | MATERIALS AND METHODS
2.1 | Study area
The CKGR northern, eastern and western boundaries and Khutse
Game Reserve (KGR) defined the extent of the study area at
21°000–23°000S and 22°470–25°250E (Figure 1a). The northern and
eastern boundaries of the CKGR, as well as the eastern and southern
boundaries of the KGR are fenced. The CKGR and the KGR cover
52,145 km2 and 2,550 km2, respectively. The area is hot and dry,
with extreme temperatures ranging from �6°C to 43°C in winter
and summer, respectively (DHV, 1980; Williamson & Williamson,
1985). Mean annual rainfall ranges from 350 to 400 mm (DHV,
1980). Although there is no permanent natural surface water in the
reserves, water is provided for wildlife at 13 solar panel powered
artificial waterholes. The area is dominated by Kalahari sandy areno-
sols with a wide distribution of pans and valleys on the Karoo basalt
rock (DHV, 1980).
The CKGR and KGR contain five main habitats: pan and valley
short grassland habitats, which are open and largely treeless with
similar grass composition, and dune, interdunal and plains habitats,
which are composed of savannah and woodland. For the purpose of
this study, pans and valleys were classified as pan-valley habitat, and
dunes, interdunal and plains as off-pan habitat because they gener-
ally have similar grass species. The herbaceous layer in the pan-val-
ley habitat is dominated by Leucosphaera bainesii, Eriocephalus sp.,
Sporobolus ioclados, Enneapogon desvauxii and Cenchrus ciliaris,
whereas the off-pan habitat is dominated by Anthephora pubescens,
Schmidtia pappophoroides, Stipagrostis uniplumis and Urochloa tricho-
pus. The pan-valley habitat contains islands of Acacia sp. and Boscia
albitrunca, and the off-pan habitat is dominated by Rhigozum tri-
chotomum, Catophractes alexandrii, Grewia sp., Acacia sp., Albizia
anthelmintica, Lonchocarpus nelsii, Terminalia sericea and B. albitrunca
(Bekker & De Wit, 1991). Nomenclature for all plant names is
according to Germishuizen, Meyer, Steenkamp, and Keith (2006).
The faunal composition includes ungulates such as giraffe Giraffa
camelopardalis, eland Taurotragus oryx, blue wildebeest, gemsbok
Oryx gazella, kudu Tragelaphus strepsiceros and springbok. Carnivores
are also present, such as lion Panthera leo, leopard Panthera pardus,
cheetah Acinonyx jubatus, wild dog Lycaon pictus, spotted hyaena
Crocuta crocuta, brown hyaena Hyaena brunnea and black-backed
jackal Canis mesomelas. Nomenclature for the animals is according to
Skinner and Chimimba (2005).
2.2 | Collaring and movement dataset
We fitted GPS Plus satellite collars manufactured and programmed
by Vectronic Aerospace GmbH (Vectronic Aerospace, Berlin, Ger-
many) to 10 female wildebeest in different herds each ranging in size
from 6 to 33 individuals, between August 2011 and July 2014. Four
collars were deployed in August 2011, one each in May 2012, July
2012 and September 2012 and three in November and December
2012. All 10 herds were located the pan-valley habitat when they
were darted. One of three experienced wildlife veterinarians regis-
tered with the government of Botswana carried out each darting
and collaring operation, as approved by the Ministry of Wildlife Envi-
ronment and Tourism through a research permit, capture and darting
permits. All darted animals were adult females in good condition that
were not obviously pregnant or with a young calf. Every effort was
made to minimize the stress to darted wildebeest and their herds.
All the animals were darted from a vehicle and we avoided darting
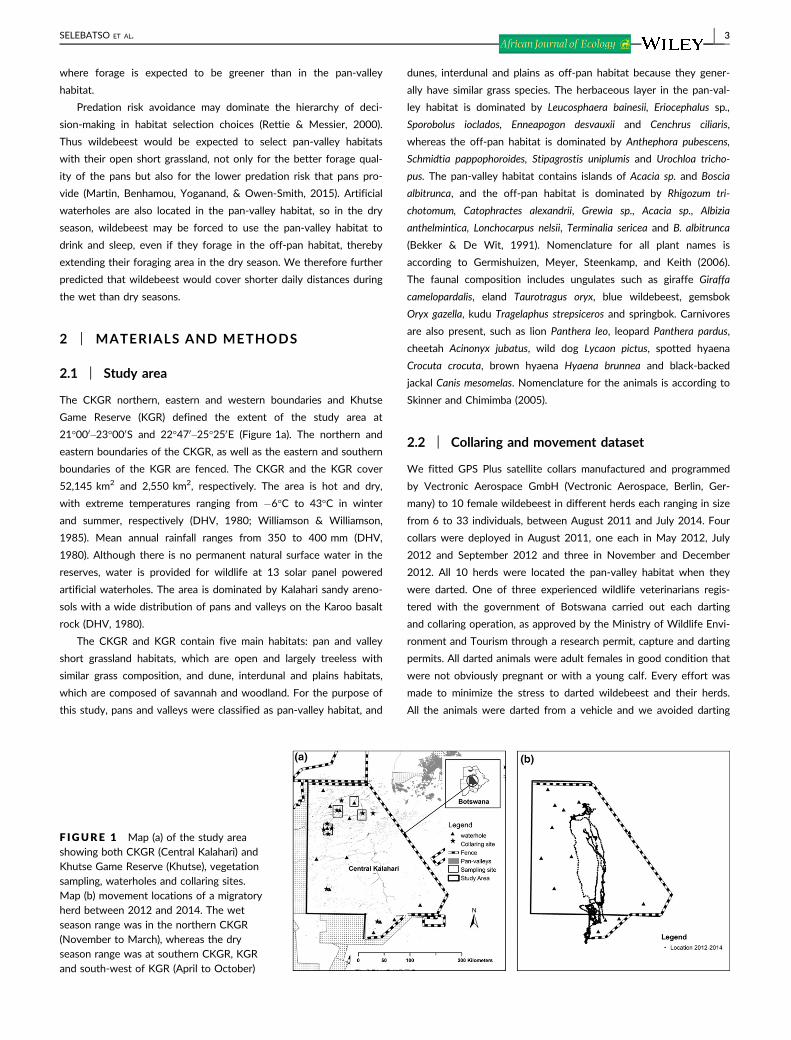
F IGURE 1 Map (a) of the study areashowing both CKGR (Central Kalahari) andKhutse Game Reserve (Khutse), vegetationsampling, waterholes and collaring sites.Map (b) movement locations of a migratoryherd between 2012 and 2014. The wetseason range was in the northern CKGR(November to March), whereas the dryseason range was at southern CKGR, KGRand south-west of KGR (April to October)
SELEBATSO ET AL. | 3

during the hottest time of day. We drove approached herds until
animals were comfortable around with our vehicle before darting,
which took between 10 min and 2 hr depending on the responses
of the herds. The wildebeest were immobilized with 5 mg of Etor-
phine and 100 mg Azaperone, and the tranquilizer was reversed with
25 mg of Diprenorphine. The Etorphine and Diprenorphine were
manufactured by Novartic, Switzerland and Azaperone by Kyron lab-
oratories, South Africa. Reusable Palmer Cap-Chur aluminium dart
syringes with barbed needles were used with a Pneu-dart Model
389 remote delivery system. The animals were monitored after drug
reversal, and we left as soon as they re-joined and were accepted by
the herd. All the satellite collars were removed from the animals
after the study, including three that had stopped transmitting prema-
turely.
Collars were programmed to record hourly Geographical Posi-
tioning System (GPS) fixes. We screened all the recorded GPS loca-
tions and removed locations with a high dilution of precision
(DOP > 9) and a low number of satellites (<3D; D’Eon & Delparte,
2005; Frair et al., 2010; Lewis, Rachlow, Garton, & Vierling, 2007).
We converted all data from decimal degrees to a UTM coordinate
system to allow distance and area estimations. We determined loca-
tion error of the satellite collars by calculating the distance between
the true location of the collar and the collar GPS locations from a
stationary collar (Lewis et al., 2007). The location error (mean � SE)
was 6.8 � 4.9 m. High mortality of study animals (associated with
water availability as discussed later in the results), combined with
the overall small size of the study population, led to fewer than five
datasets during any one season; we therefore used cumulative sea-
sonal data from 2011 to 2014.
2.3 | Seasonal analysis
We divided each year into wet, early dry and late dry seasons, based
on average rainfall and temperature patterns for the area, which
influence surface water availability and forage conditions. Wet and
late dry seasons are usually very hot (up to 43°C) while early dry
season is very cold (�6°C). Due to high variability of the onset date
of the three seasons, we focused our analysis on two peak seasonal
months to create a clear distinction between seasons. We used Jan-
uary and February for the wet, June and July for the early dry, and
September and October for the late dry seasons, respectively.
2.4 | Forage quality and quantity between habitats
During each season, we randomly sampled vegetation in five
0.5 9 0.5 m quadrats from 11 sites in each of the two habitat types:
pan-valley and off-pan. The pan-valley sites were in northern pan-
valley system, and the off-pan sites were around these pan-valley
sites (Figure 1a). At each site, the first quadrat was thrown randomly
to provide a starting point and the other four quadrats were system-
atically located 5 m from the first quadrat in the four cardinal direc-
tions. We recorded the height (to the tip of inflorescence or culm) of
five grasses in each quadrat, selected at random. Grass samples were
clipped to 1 cm above ground from all quadrats. Due to extremely
low amounts of grass in some seasons and habitats, grass samples
from the quadrats were combined for each site. We air-dried the
samples in the field and further dried them in an oven at 60°C for
48 hr. Dry biomass was used as a measure of forage quantity. We
ground each sample and mixed it well to get a homogeneous repre-
sentative subsample and analysed it for crude protein (nitrogen %),
with a LECO nitrogen analyser at the Biological Sciences Depart-
ment, University of Botswana. We then analysed subsamples for
mineral content (phosphorus, sodium and calcium), using ICP-AES
spectrometry at the Okavango Research Institute, University of
Botswana.
We used generalized linear mixed models (lme4 package; Bates,
Maechler, Bolker, & Walker, 2015), in R version 3.2.4 to compare
grass quality (protein, calcium, sodium and phosphorus) and quantity
(biomass and height) between habitats and seasons. Response values
were all positive but did not follow a normal distribution, so we used
a gamma distribution. Habitat, season and the interaction between
the two were used as fixed effects and replica within site was used
as a nested random effect.
2.5 | Habitat selection
Shapefiles of pans and valleys were obtained from the Department of
Survey and Mapping and used to develop a habitat map at a scale of
1:3,600,000. We used the “Minimum Bounding Geometry” tool in Arc-
GIS 10.3 to calculate 100% Minimum Convex Polygons (MCP) from
seasonal movement data to determine the potential area available to
each animal. We used the movement-based kernel density estimation
(MKDE) method from the adehabitatHR package in R (R Development
Core Team, 2015) to calculate the seasonal utilization distribution
(UD) and home range (HR) for each individual (Benhamou, 2011). We
set the minimum distance threshold (MDT) to 10 m, the distance
below which the animal was considered to have been inactive or rest-
ing and set the minimum smoothing parameter to 30 m. We used UD-
weighted grids within the HRs to estimate pan-valley and off-pan use
and availability to determine third order habitat selection patterns
(Johnson, 1980). We used Jacobs’ index to calculate habitat selection
ratios (Jacobs, 1974; Kauhala & Auttila, 2010)
D ¼ r � pr þ p� 2rp
where r is the proportion of habitat used and p the proportion of
habitat available. D varies from �1 (avoidance) to +1 (preference),
and values close to zero indicate that the habitat is used in propor-
tion to its availability. We used multivariate analysis of variance
(MANOVA) in R version 3.2.4 to determine whether selection ratios
differed between seasons.
2.6 | Daily distance analysis
We used hourly location data from collared wildebeest to calculate
the minimum daily distance covered. We adopted the method of
4 | SELEBATSO ET AL.

distance calculation from Ensing et al. (2014), as modified in http://
www.movable-type.co.uk/scripts/latlong.html, to calculate hourly dis-
tance, and summed the hourly distances for each day and for each
animal. We used generalized linear mixed models (Bates et al., 2015)
to compare the daily distance covered between seasons, with the
fixed effect of year to account for annual differences and the ran-
dom effect of individual. During the study, four artificial waterholes
used by study animals dried up due to borehole breakdown and
there was some observed change in the foraging behaviour of the
animals. We compared our results with and without the affected col-
lared animals. We also demonstrated the effects of changing water
availability, by comparing wildebeest movement a month before and
after the waterhole dried up. The generalized linear mixed models
(lme4 package; Bates et al., 2015), in R version 3.2.4, were used to
compare pre- and postperiod waterhole drying periods. Response
values were all positive but did not follow a normal distribution, so
we used a gamma distribution. All statistical analyses were done in R
3.2.4 (R core team, 2015).
2.7 | Model selection
We ran all possible combinations of models for the above variables
(except for habitat selection analysis) and identified the most parsi-
monious based on Akaike’s information criterion (AIC; Akaike, 1974).
We considered models to be competitive if their AIC values were
within two units of the best model, and slightly competitive if there
were between 3 and 7 (Burnham & Anderson, 2002).
3 | RESULTS
3.1 | Forage quality
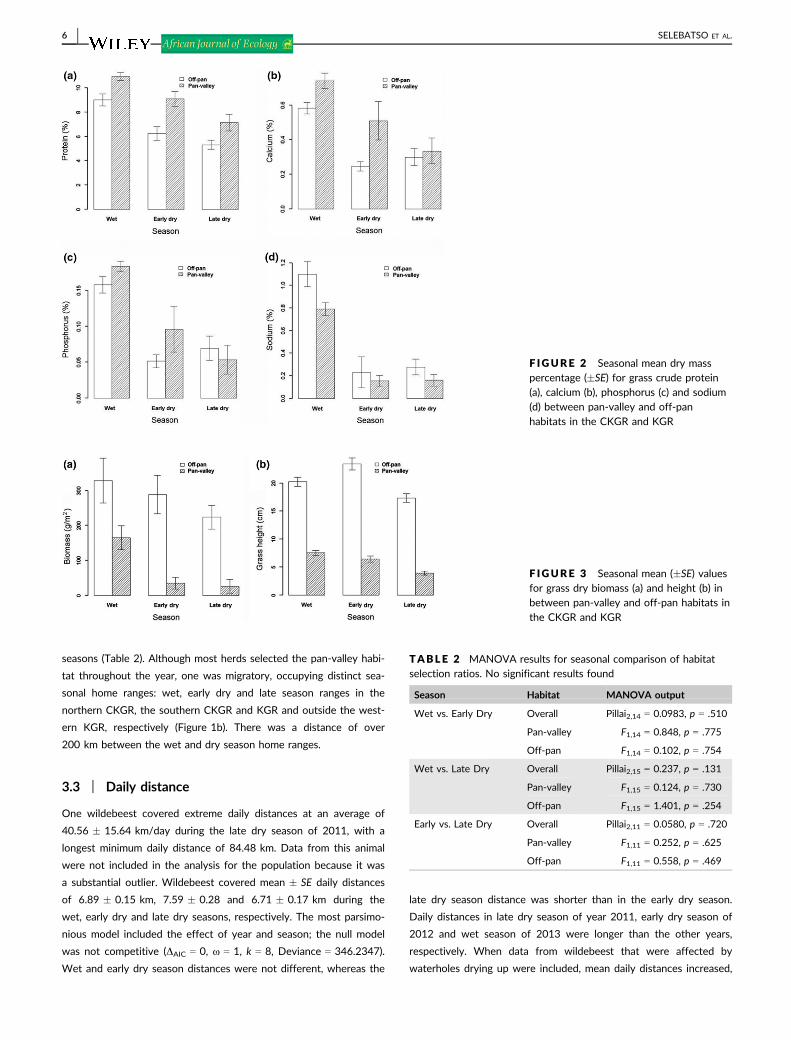
Our results confirmed that forage quality in terms of protein, phos-
phorus and calcium, in the pan-valley habitat was higher than in the
off-pan habitat, except during the late dry season. The full models,
with or without an interaction term, provided the best fit for protein,
calcium and phosphorus (Table 1). Protein content decreased from
the wet season to the early dry and late dry seasons in the pan-
valley habitat, but the decrease in the off-pan habitat was small
between the dry seasons (Figure 2a). In the pan-valley habitat, cal-
cium decreased from the wet season to the early dry and late dry
seasons, but did not change between the early dry and the late dry
seasons in the off-pan habitat (Figure 2b). Phosphorus was higher in
the wet than the early dry and the late dry seasons. Phosphorus was
higher in the in the pan-valley than off-pan habitat (Figure 2c). For
sodium, the most parsimonious model included both fixed effects of
season and habitat. Sodium was higher in the wet than the early dry
season and the late dry season (Figure 2d).
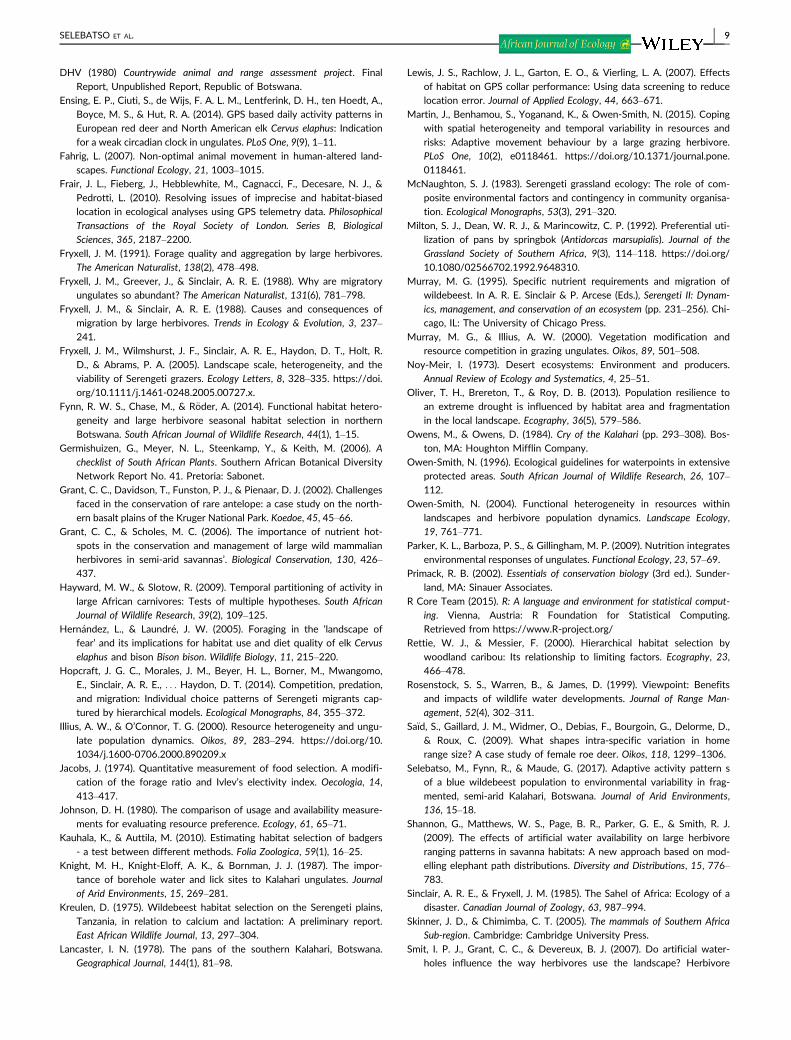
For grass biomass, the model with the best fit was the global
model, which included the fixed effects of season and habitat, and
the interaction between the two terms. Biomass was lower in the
pan-valley habitat than in the off-pan habitat, but within the off-pan
habitat, there was no seasonal difference. In the pan-valley habitat,
there was a difference between the wet and early dry seasons but
not between the early dry and late dry seasons (Figure 3a). For grass
height, the model with the best fit was the global model, which
included the fixed effects of season and habitat, and the interaction
between the two terms. Grass height was lower in the pan-valley
than in the off-pan; it decreased from the wet season to the early
dry season in the pan-valley habitat, but increased from wet to early
dry in the off-pan habitat (Figure 3b). Therefore, sandy off-pan habi-
tats had higher grass biomass and height than pan-valley habitats
throughout the year.
3.2 | Wildebeest habitat selection
Wildebeest strongly selected for the pan-valley habitat in the CKGR,
with a mean (�SE) Jacob’s index of 0.64 � 0.065, 0.68 � 0.10 and
0.60 � 0.10 in the wet, early dry and late dry seasons, respectively.
However, habitat selection did not change significantly between
TABLE 1 Ranking of possible models for forage quality andquantity
Model variables DAIC x k Deviance
Protein
Habitat 9 Season 0 0.737 3 2.009
Habitat + Season 2.203 0.245 3 2.258
Null 45.239 0.000 2 4.521
Calcium
Habitat 9 Season 0 0.706 3 9.460
Habitat + Season 3.377 0.130 3 10.601
Season 2.919 0.164 2 10.547
Null 28.066 0.000 2 16.294
Phosphorus
Habitat + Season 0 0.4724 3 18.759
Habitat 9 Season 1.638 0.2083 3 20.425
Season 0.7838 0.3193 2 20.756
Sodium
Habitat + Season 0 0.452 3 28.843
Habitat 9 Season 1.118 0.258 3 30.095
Season 0.884 0.290 2 31.167
Null 46.171 0.000 2 63.344
Height
Habitat 9 Season 0 1 3 509.977
Null 102.967 0.000 2 563.469
Biomass
Habitat 9 Season 0 0.984 3 103.718
Null 23.159 <0.001 2 154.405
Delta (D) AIC = difference between model AIC and lowest AIC in the
model set. x = Akaike model weight, “weight of evidence” in favour of
model, adding to 1. k = number of estimable parameters in the model.
Deviance = measure of model fit. The model covariates include habitat
and season. Only models with DAIC values less than four units and the
null model are presented.
SELEBATSO ET AL. | 5
seasons (Table 2). Although most herds selected the pan-valley habi-
tat throughout the year, one was migratory, occupying distinct sea-
sonal home ranges: wet, early dry and late season ranges in the
northern CKGR, the southern CKGR and KGR and outside the west-
ern KGR, respectively (Figure 1b). There was a distance of over
200 km between the wet and dry season home ranges.
3.3 | Daily distance
One wildebeest covered extreme daily distances at an average of
40.56 � 15.64 km/day during the late dry season of 2011, with a
longest minimum daily distance of 84.48 km. Data from this animal
were not included in the analysis for the population because it was
a substantial outlier. Wildebeest covered mean � SE daily distances
of 6.89 � 0.15 km, 7.59 � 0.28 and 6.71 � 0.17 km during the
wet, early dry and late dry seasons, respectively. The most parsimo-
nious model included the effect of year and season; the null model
was not competitive (DAIC = 0, x = 1, k = 8, Deviance = 346.2347).
Wet and early dry season distances were not different, whereas the
late dry season distance was shorter than in the early dry season.
Daily distances in late dry season of year 2011, early dry season of
2012 and wet season of 2013 were longer than the other years,
respectively. When data from wildebeest that were affected by
waterholes drying up were included, mean daily distances increased,
F IGURE 2 Seasonal mean dry masspercentage (�SE) for grass crude protein(a), calcium (b), phosphorus (c) and sodium(d) between pan-valley and off-panhabitats in the CKGR and KGR
F IGURE 3 Seasonal mean (�SE) valuesfor grass dry biomass (a) and height (b) inbetween pan-valley and off-pan habitats inthe CKGR and KGR
TABLE 2 MANOVA results for seasonal comparison of habitatselection ratios. No significant results found
Season Habitat MANOVA output
Wet vs. Early Dry Overall Pillai2,14 = 0.0983, p = .510
Pan-valley F1,14 = 0.848, p = .775
Off-pan F1,14 = 0.102, p = .754
Wet vs. Late Dry Overall Pillai2,15 = 0.237, p = .131
Pan-valley F1,15 = 0.124, p = .730
Off-pan F1,15 = 1.401, p = .254
Early vs. Late Dry Overall Pillai2,11 = 0.0580, p = .720
Pan-valley F1,11 = 0.252, p = .625
Off-pan F1,11 = 0.558, p = .469
6 | SELEBATSO ET AL.

and the wet season distance was not different from the late dry sea-
son, whereas the early dry distance was longer than the other sea-
sons. Daily distances early dry season of 2012 and wet season of
2013 were longer than the other years, respectively.
For daily distances travelled before and after the waterholes
dried up, the most parsimonious model included the effect of water
availability; the null model was not competitive (DAIC = 0, x = 1,
k = 2, deviance = 126.538). Distance travelled was shorter before
(5.93 � 0.97) than after (13.35 � 0.25) the waterhole dried up.
Seven (70%) of the 10 collared animals made long distance move-
ments (up to 275 km) when the waterholes they depended upon
dried up. Five (71%) of the seven collared wildebeest that left their
range after a waterhole dried up died before finding an alternative
waterhole. Lions killed three collared wildebeest inside the reserve,
while two left and died outside the reserve, one from apparent
dehydration and the other from unknown causes.
4 | DISCUSSION
Our results show that wildebeest strongly select for the pan-valley
habitat in the CKGR throughout the year. Pans were favoured year-
round because of their shorter grasses, and higher crude protein, cal-
cium and phosphorus content. Unlike in other areas where forage
quantity during the dry season influenced habitat selection of large
herbivores (Anderson et al., 2005; Sa€ıd et al., 2009), the decline in
abundance and quality of forage from the wet to dry seasons did
not influence wildebeest foraging patterns. Thus, they are not limited
by forage quantity in this ecosystem. Wildebeest are adapted for
foraging on relatively short-sward grasslands (Arsenault & Owen-
Smith, 2008; Murray & Illius, 2000; Wilmshurst et al., 2000), which
may explain why they did not select taller grass in the off-pan habi-
tat, even during the dry season.
The key wet season range of wildebeest in the Serengeti is a
vast treeless saline grassland, similar in grass composition and func-
tion to the smaller scale pans in the CKGR. Most pans in the CKGR
are dominated by halophytic grasses such as Sporobolus ioclados, as
are the short-grass saline plains of the Serengeti (McNaughton,
1983), suggesting functional similarities between these key wet sea-
son ranges. Habitats selected by wildebeest in the Kruger National
Park (Grant & Scholes, 2006; Yoganand & Owen-Smith, 2014) and
by some zebra in northern Botswana (Fynn, Chase, & R€oder, 2014)
show similar functional similarities, with relatively high protein and
phosphorus content. A higher concentration of protein and minerals
help to meet the elevated resource demands of pregnant and lactat-
ing females during the wet season (Kreulen, 1975; Murray, 1995;
Voeten, van de Vijver, Olff, & van Langevelde, 2010) and build body
stores from abundant forage to survive the dry seasons (Parker,
Barboza, & Gillingham, 2009).
Habitat quality is likely to be a key determinant of habitat selec-
tion for Kalahari ungulates (e.g., Milton et al., 1992), but it is difficult
to disentangle the relative influence of habitat quality and antipreda-
tor behaviour on selection for pan habitats (Fryxell, 1991; Yoganand
& Owen-Smith, 2014). The open high-visibility nature of the pans,
greatly reduces predation risk (Hern�andez & Laundr�e, 2005; Valeix
et al., 2009), but strongly co-varies with the higher forage quality of
the pans. Therefore, predation risk could also contribute to selection
for the pan-valley habitat, especially at night (Martin et al., 2015),
when predators are most active (Hayward & Slotow, 2009). All the
predation events on collared animals were in the off-pan habitat,
emphasizing that pan-valleys provide a much safer habitat. There-
fore, the extent and hierarchy of the influence of forage quality and
predation risk factors cannot be easily defined and ranked. Thus, in
the Kalahari and other savannah ecosystems, wildebeest take advan-
tage of the low predation risk nature and higher forage quality of
the pan habitats, thereby maintaining growth and reproductive pro-
cesses and reducing predation events.
Our results also suggest that water is a critical component of
wildebeest home ranges, especially when they become accustomed
to artificial water provision (Owen-Smith, 1996; Western, 1975; Wil-
liamson et al., 1988), and therefore influences movement patterns
across the landscape (Smit, Grant, & Devereux, 2007). During the
wet season, the pan-valley habitat had above-optimal grass height
and biomass for a grazer the size of a wildebeest (Wilmshurst et al.,
2000), but wildebeest remained on the pans during the dry season
when grass height and biomass had dropped to 25 g/m2, well below
optimal levels (94 g/m2) for wildebeest (Wilmshurst et al., 2000).
Provision of artificial water points in the pans seemed to have influ-
enced the dry season movement patterns. One wildebeest herd at a
pan without a water point migrated away during the dry season, and
other wildebeest left pans when artificial water points failed during
the dry season. This suggests that water availability during the dry
season was a key limiting factor that influenced habitat selection.
The migratory herd moved over 200 km from its wet season
range to the southern CKGR, apparently attracted to a high abun-
dance of tsamma melons Citrullus lanatus and gemsbok cucumber
Acanthosicyos naudinianus (M. Selebatso, pers. obs.) and to a burned
area during the late dry season. The southern migration of this herd
might be driven by a need for water provided by the tsamma melons
and the likelihood of green regrowth following fires. Moisture pro-
vided by these melons could explain why this herd survived the
entire dry season without access to a waterhole. Knight, Knight-
Eloff, and Bornman (1987) suggested that wildebeest in the KTP
depended on these water-bearing plants when they did not have
access to water. In support of this, all the other herds that had
access to artificial water were sedentary and did not leave the high-
quality pan-valley habitat as long as water was available. This sug-
gests that water provision has resulted in a loss of adaptive foraging
knowledge in water-dependent individuals because all those that
were unable to find alternative water points after the water point in
their favoured pans dried up died, whereas the migratory herd sur-
vived both dry seasons without evidence of accessing a waterhole.
Contrary to our predictions, but consistent with findings by Hop-
craft et al. (2014) in East Africa, wildebeest daily movement dis-
tances were smaller in the late dry season than in the other seasons,
though not significantly different from the wet season. The late dry
SELEBATSO ET AL. | 7

season was when forage availability was lowest and temperatures
were generally very high. Wildebeest probably attempted to con-
serve energy and avoid heat stress during the late dry season by
minimizing their movements (Selebatso, Fynn, & Maude, 2017). The
inconsistent availability of water seems to not only affect habitat
selection, but also energy expenditure and risk, as the wildebeest
had to extend their daily distances following the loss of water. The
nonmigratory wildebeest made long distance movements after the
artificial waterholes in their home ranges dried up. The drying up of
artificial waterholes seemed to push wildebeest to take greater risks
through increased exposure to predation and the potential to lose
condition in an attempt to seek alternative sources of water. Col-
lared wildebeest made exploratory searches for alternative water
sources, and the majority died during the search. Our results empha-
size the need for water provision, especially that removal of anthro-
pogenic factors such as fences and land use changes are highly
unlikely. The provision of artificial water for wildlife in arid environ-
ments disrupt natural processes (Andrew & Lange, 1986; Thrash,
1980; Grant et al., 2002), but when access to key resources are
restricted, much of the natural ecosystems resilience is lost (Fahrig,
2007; Primack, 2002). Maintenance of water-dependent species in
drylands may therefore depend on such artificial water provision,
especially given the continued human-induced habitat fragmentation
and connectivity loss. Furthermore, Owens and Owens (1984)
reported high mortalities of wildebeest due to illegal hunting and
range degradation by livestock in and around Lake Xau, where most
of the wildebeest went in the last recorded drought migration. We
therefore emphasize the need for timely maintenance of existing
waterholes in the CKGR to reduce future mortalities that could
result from the drying of the waterholes.
In conclusion, high-quality forage in pans and valleys, combined
with access to water and reduced predation risk, are important
determinants of the habitat selection and movement patterns of
Kalahari wildebeest. Seasonal forage availability, temperature and
water availability limited the movement patterns and home ranges.
Artificial water provision in arid ecosystems is important to compen-
sate for lost access to natural water sources; however, it promotes a
sedentary strategy and loss of adaptive resilience to shocks, such as
water points failing. Our results reveal how loss of connectivity and
access to seasonal resources could lead to complex consequences
for species reliant on access to distinct seasonal ranges and key
resources. If artificial water development is a necessary option for
wildlife management in arid environments, a clear maintenance pro-
gramme is required to ensure consistency in the provision of water.
ACKNOWLEDGEMENTS
We thank the Government of Botswana for the permission to conduct
this research (Research Permit, EWT/8/36/4XVIII (14)) and capture
and darting permits, WP/RES/15/2/2XX (165), WP/RES/15/2/2XXI
(63), WP/RES/15/2/2XXII, WP/RES/15/2/2XXIII and WP/RES/15/2/
2XXIV (43). We are grateful for the financial support from Denver
Zoological Foundation, SAVE Wildlife Conservation Fund, Comanis
Foundation, Kanabo Conservation Link, Wilderness Wildlife Trust and
Office of Research and Development (University of Botswana). We
thank Dr Mmadi Reuben, Dr John Mhongovoyo, Dr Rob Jackson and
Dr Mark Bing for their professionalism in handling of darting and col-
laring of the study animals. We appreciate the logistical support in the
field from the Kalahari Research and Conservation and the Depart-
ment of Wildlife and National Parks; Bigfoot Tour, Tau Pan Lodge and
Kalahari Plains Lodge for accommodation and support during field-
work. We thank the Okavango Research Institute laboratory for assis-
tance with grass quality analysis. Mario van Telgen provided helpful
comments on the use of generalized linear mixed models in R, and
Othusitse Lekoko was helpful on the use of ArcGIS for maps.
REFERENCES
Akaike, H. (1974). A new look at the statistical model identification. IEEE
Transactions on Automatic Control, 19, 716–723.
Alizai, H. U., & Hulbert, L. C. (1970). Effects of soil texture on evapora-
tive loss and available water in semi-arid climates. Soil Science, 110
(5), 328–332.
Anderson, D. P., Forester, J. D., Turner, M. G., Frair, J. L., Merrill, E. H.,
Fortin, D., . . . Boyce, M. S. (2005). Factors influencing female home
range sizes in elk (Cervus elaphus) in North American landscapes.
Landscape Ecology, 20, 257–271.
Andrew, M. H., & Lange, R. T. (1986). Development of a new piosphere
in arid chenopod shrubland grazed by sheep. 1. Changes to the soil
surface. Australian Journal of Ecology, 11, 395–409.
Arsenault, R., & Owen-Smith, N. (2008). Resource partitioning by grass
heights among grazing ungulates does not follow body size relation.
Oikos, 117, 1711–1717. https://doi.org/10.1111/j.1600-0706.2008.
16575.x.
Ayotte, J. B., Parker, K. L., & Gillingham, M. P. (2008). Use of natural licks
by four species of ungulates in northern British Columbia. Journal of
Mammalogy, 89, 1041–1050.
Bates, D., Maechler, M., Bolker, B., & Walker, S. (2015). Fitting linear
mixed-effects models using lme4. Journal of Statistical Software, 67(1),
1–48. https://doi.org/10.18637/jss.v067.i01.
Bekker, R. P., & De Wit, P. V. (1991). Vegetation map of the Republic of
Botswana. Gaborone: Soil Mapping and Advisory Services Project.
Benhamou, S. (2011). Dynamic approach to space and habitat use based
on biased random bridges. PLoS One, 6, 1–8.
Bergstrom, R., & Skarpe, C. (1999). The abundance of wild herbivores in
a semi-arid savanna in relation to seasons, pans and livestock. African
Journal of Ecology, 37, 12–26.
Bonifica (1992) Technical Assistance to the Project initial measures for the
conservation of the Kalahari ecosystem. Final Report, Unpublished.
Project N.6100. 026. 14. 001. Commission of the European Commu-
nities, Republic of Botswana, 14 pp.
Bonnet, O., Fritz, H., Gignoux, J., & Meuret, M. (2010). Challenges of for-
aging on a high-quality but unpredictable food resource: dynamics of
grass production and consumption in savannah lawns. Journal of Ecol-
ogy, 98, 908–916.
Burnham, K. P., & Anderson, D. R. (2002). Model selection and multimodel
inference: A practical information-theoretic approach (2nd ed.). New
York, NY: Springer.
Cooke, H. J. (1985). The Kalahari today: A case of conflicts over
resources. Geographical Journal, 151, 75–85.
D’Eon, R. G., & Delparte, D. (2005). Effects of radio-collar position and
orientation on GPS radio-collar performance, and the implications of
PDOP in data screening. Journal of Applied Ecology, 42, 383–388.
Department of Lands (2009). Final Report: Review of National Land Use
(161 pp.). Ministry of Lands and Housing, Government of Botswana.
8 | SELEBATSO ET AL.
DHV (1980) Countrywide animal and range assessment project. Final
Report, Unpublished Report, Republic of Botswana.
Ensing, E. P., Ciuti, S., de Wijs, F. A. L. M., Lentferink, D. H., ten Hoedt, A.,
Boyce, M. S., & Hut, R. A. (2014). GPS based daily activity patterns in
European red deer and North American elk Cervus elaphus: Indication
for a weak circadian clock in ungulates. PLoS One, 9(9), 1–11.
Fahrig, L. (2007). Non-optimal animal movement in human-altered land-
scapes. Functional Ecology, 21, 1003–1015.
Frair, J. L., Fieberg, J., Hebblewhite, M., Cagnacci, F., Decesare, N. J., &
Pedrotti, L. (2010). Resolving issues of imprecise and habitat-biased
location in ecological analyses using GPS telemetry data. Philosophical
Transactions of the Royal Society of London. Series B, Biological
Sciences, 365, 2187–2200.
Fryxell, J. M. (1991). Forage quality and aggregation by large herbivores.
The American Naturalist, 138(2), 478–498.
Fryxell, J. M., Greever, J., & Sinclair, A. R. E. (1988). Why are migratory
ungulates so abundant? The American Naturalist, 131(6), 781–798.
Fryxell, J. M., & Sinclair, A. R. E. (1988). Causes and consequences of
migration by large herbivores. Trends in Ecology & Evolution, 3, 237–
241.
Fryxell, J. M., Wilmshurst, J. F., Sinclair, A. R. E., Haydon, D. T., Holt, R.
D., & Abrams, P. A. (2005). Landscape scale, heterogeneity, and the
viability of Serengeti grazers. Ecology Letters, 8, 328–335. https://doi.
org/10.1111/j.1461-0248.2005.00727.x.
Fynn, R. W. S., Chase, M., & R€oder, A. (2014). Functional habitat hetero-
geneity and large herbivore seasonal habitat selection in northern
Botswana. South African Journal of Wildlife Research, 44(1), 1–15.
Germishuizen, G., Meyer, N. L., Steenkamp, Y., & Keith, M. (2006). A
checklist of South African Plants. Southern African Botanical Diversity
Network Report No. 41. Pretoria: Sabonet.
Grant, C. C., Davidson, T., Funston, P. J., & Pienaar, D. J. (2002). Challenges
faced in the conservation of rare antelope: a case study on the north-
ern basalt plains of the Kruger National Park. Koedoe, 45, 45–66.
Grant, C. C., & Scholes, M. C. (2006). The importance of nutrient hot-
spots in the conservation and management of large wild mammalian
herbivores in semi-arid savannas’. Biological Conservation, 130, 426–437.
Hayward, M. W., & Slotow, R. (2009). Temporal partitioning of activity in
large African carnivores: Tests of multiple hypotheses. South African
Journal of Wildlife Research, 39(2), 109–125.
Hern�andez, L., & Laundr�e, J. W. (2005). Foraging in the ‘landscape of
fear’ and its implications for habitat use and diet quality of elk Cervus
elaphus and bison Bison bison. Wildlife Biology, 11, 215–220.
Hopcraft, J. G. C., Morales, J. M., Beyer, H. L., Borner, M., Mwangomo,
E., Sinclair, A. R. E., . . . Haydon, D. T. (2014). Competition, predation,
and migration: Individual choice patterns of Serengeti migrants cap-
tured by hierarchical models. Ecological Monographs, 84, 355–372.
Illius, A. W., & O’Connor, T. G. (2000). Resource heterogeneity and ungu-
late population dynamics. Oikos, 89, 283–294. https://doi.org/10.
1034/j.1600-0706.2000.890209.x
Jacobs, J. (1974). Quantitative measurement of food selection. A modifi-
cation of the forage ratio and Ivlev’s electivity index. Oecologia, 14,
413–417.
Johnson, D. H. (1980). The comparison of usage and availability measure-
ments for evaluating resource preference. Ecology, 61, 65–71.
Kauhala, K., & Auttila, M. (2010). Estimating habitat selection of badgers
- a test between different methods. Folia Zoologica, 59(1), 16–25.
Knight, M. H., Knight-Eloff, A. K., & Bornman, J. J. (1987). The impor-
tance of borehole water and lick sites to Kalahari ungulates. Journal
of Arid Environments, 15, 269–281.
Kreulen, D. (1975). Wildebeest habitat selection on the Serengeti plains,
Tanzania, in relation to calcium and lactation: A preliminary report.
East African Wildlife Journal, 13, 297–304.
Lancaster, I. N. (1978). The pans of the southern Kalahari, Botswana.
Geographical Journal, 144(1), 81–98.
Lewis, J. S., Rachlow, J. L., Garton, E. O., & Vierling, L. A. (2007). Effects
of habitat on GPS collar performance: Using data screening to reduce
location error. Journal of Applied Ecology, 44, 663–671.
Martin, J., Benhamou, S., Yoganand, K., & Owen-Smith, N. (2015). Coping
with spatial heterogeneity and temporal variability in resources and
risks: Adaptive movement behaviour by a large grazing herbivore.
PLoS One, 10(2), e0118461. https://doi.org/10.1371/journal.pone.
0118461.
McNaughton, S. J. (1983). Serengeti grassland ecology: The role of com-
posite environmental factors and contingency in community organisa-
tion. Ecological Monographs, 53(3), 291–320.
Milton, S. J., Dean, W. R. J., & Marincowitz, C. P. (1992). Preferential uti-
lization of pans by springbok (Antidorcas marsupialis). Journal of the
Grassland Society of Southern Africa, 9(3), 114–118. https://doi.org/
10.1080/02566702.1992.9648310.
Murray, M. G. (1995). Specific nutrient requirements and migration of
wildebeest. In A. R. E. Sinclair & P. Arcese (Eds.), Serengeti II: Dynam-
ics, management, and conservation of an ecosystem (pp. 231–256). Chi-
cago, IL: The University of Chicago Press.
Murray, M. G., & Illius, A. W. (2000). Vegetation modification and
resource competition in grazing ungulates. Oikos, 89, 501–508.
Noy-Meir, I. (1973). Desert ecosystems: Environment and producers.
Annual Review of Ecology and Systematics, 4, 25–51.
Oliver, T. H., Brereton, T., & Roy, D. B. (2013). Population resilience to
an extreme drought is influenced by habitat area and fragmentation
in the local landscape. Ecography, 36(5), 579–586.
Owens, M., & Owens, D. (1984). Cry of the Kalahari (pp. 293–308). Bos-
ton, MA: Houghton Mifflin Company.
Owen-Smith, N. (1996). Ecological guidelines for waterpoints in extensive
protected areas. South African Journal of Wildlife Research, 26, 107–
112.
Owen-Smith, N. (2004). Functional heterogeneity in resources within
landscapes and herbivore population dynamics. Landscape Ecology,
19, 761–771.
Parker, K. L., Barboza, P. S., & Gillingham, M. P. (2009). Nutrition integrates
environmental responses of ungulates. Functional Ecology, 23, 57–69.
Primack, R. B. (2002). Essentials of conservation biology (3rd ed.). Sunder-
land, MA: Sinauer Associates.
R Core Team (2015). R: A language and environment for statistical comput-
ing. Vienna, Austria: R Foundation for Statistical Computing.
Retrieved from https://www.R-project.org/
Rettie, W. J., & Messier, F. (2000). Hierarchical habitat selection by
woodland caribou: Its relationship to limiting factors. Ecography, 23,
466–478.
Rosenstock, S. S., Warren, B., & James, D. (1999). Viewpoint: Benefits
and impacts of wildlife water developments. Journal of Range Man-
agement, 52(4), 302–311.
Sa€ıd, S., Gaillard, J. M., Widmer, O., Debias, F., Bourgoin, G., Delorme, D.,
& Roux, C. (2009). What shapes intra-specific variation in home
range size? A case study of female roe deer. Oikos, 118, 1299–1306.
Selebatso, M., Fynn, R., & Maude, G. (2017). Adaptive activity pattern s
of a blue wildebeest population to environmental variability in frag-
mented, semi-arid Kalahari, Botswana. Journal of Arid Environments,
136, 15–18.
Shannon, G., Matthews, W. S., Page, B. R., Parker, G. E., & Smith, R. J.
(2009). The effects of artificial water availability on large herbivore
ranging patterns in savanna habitats: A new approach based on mod-
elling elephant path distributions. Diversity and Distributions, 15, 776–
783.
Sinclair, A. R. E., & Fryxell, J. M. (1985). The Sahel of Africa: Ecology of a
disaster. Canadian Journal of Zoology, 63, 987–994.
Skinner, J. D., & Chimimba, C. T. (2005). The mammals of Southern Africa
Sub-region. Cambridge: Cambridge University Press.
Smit, I. P. J., Grant, C. C., & Devereux, B. J. (2007). Do artificial water-
holes influence the way herbivores use the landscape? Herbivore
SELEBATSO ET AL. | 9
distribution patterns around rivers and artificial surface water sources
in a large African savanna park. Biological Conservation, 136, 85–99.
Thrash, I. (1998). Impact of water provision on herbaceous vegetation in
Kruger National Park, South Africa. Journal of Arid Environment, 38,
437–450.
Valeix, M. L., Lovemore, A. J., Chamaill�e-Jammes, S., Davidson, Z.,
Murindagomo, F., Fritz, H., & Macdonald, D. W. (2009). Behav-
ioral adjustments of African herbivores to predation risk by lions:
Spatiotemporal variations influence habitat use. Ecology, 90, 23–
30.
Verlinden, A. (1998). Seasonal movement patterns of some ungulates in
the Kalahari ecosystem of Botswana between 1990 and 1995. Afri-
can Journal of Ecology, 36, 117–128.
Verlinden, A., & Masogo, R. (1997). Satellite remote sensing of habitat
suitability for ungulates and ostrich in the Kalahari of Botswana. Jour-
nal of Arid Environments, 35, 563–574.
Voeten, M. M., van de Vijver, C., Olff, H., & van Langevelde, F. (2010).
Possible causes of decreasing migratory ungulate populations in an
East African savannah after restrictions in their seasonal movements.
African Journal of Ecology, 48, 169–179.
Wallgren, M., Skarpe, C., Bergstrom, R., Danell, K., Bergstrom, A., Jakob-
sson, T., . . . Strand, T. (2009). Influence of land use on the abundance
of wildlife and livestock in the Kalahari, Botswana. Journal of Arid
Environments, 73, 314–321.
Western, D. (1975). Water availability and its influence on the structure
and dynamics of a savannah large mammal community. African Jour-
nal of Ecology, 13, 265–286.
Williamson, D. T., & Williamson, J. E. (1985). Kalahari ungulates movement
study. Unpublished Report, Final Report, Frankfort Zoological Society.
Williamson, D., Williamson, J., & Ngwamotsoko, K. T. (1988). Wildebeest
migration in the Kalahari. African Journal of Ecology, 26, 269–280.
Wilmshurst, J. F., Fryxell, J. M., & Bergman, C. M. (2000). The allomatry
of patch selection in ruminants. Proceedings of the Royal Society of
London. Series B, 267(1441), 345–349.
Yoganand, K., & Owen-Smith, N. (2014). Restricted habitat use by an
African savanna herbivore through the seasonal cycle: Key resources
concept expanded. Ecography, 37, 969–982.
How to cite this article: Selebatso M, Bennitt E, Maude G,
Fynn RWS. Water provision alters wildebeest adaptive
habitat selection and resilience in the Central Kalahari. Afr J
Ecol. 2017;00:1–10. https://doi.org/10.1111/aje.12439
10 | SELEBATSO ET AL.