transcriptional and epigenetic regulation of human cd4+ t ...
Upload
khangminh22Category
view
1download
0
HAL Id: tel-02111040https://tel.archives-ouvertes.fr/tel-02111040
Submitted on 25 Apr 2019
HAL is a multi-disciplinary open accessarchive for the deposit and dissemination of sci-entific research documents, whether they are pub-lished or not. The documents may come fromteaching and research institutions in France orabroad, or from public or private research centers.
L’archive ouverte pluridisciplinaire HAL, estdestinée au dépôt et à la diffusion de documentsscientifiques de niveau recherche, publiés ou non,émanant des établissements d’enseignement et derecherche français ou étrangers, des laboratoirespublics ou privés.
Genetic and epigenetic control of life cycle transitions inthe brown alga Ectocarpus sp.
Simon Bourdareau
To cite this version:Simon Bourdareau. Genetic and epigenetic control of life cycle transitions in the brown alga Ec-tocarpus sp.. Development Biology. Sorbonne Université, 2018. English. �NNT : 2018SORUS028�.�tel-02111040�
Sorbonne Université
Ecole Doctorale 515 Complexité du Vivant
UMR 8227 CNRS – Sorbonne Université
Laboratoire de Biologie Intégrative des Modèles Marins
Equipe Génétique des Algues
Contrôle génétique et épigénétique des transitions du
cycle de vie chez l’algue brune Ectocarpus sp.
Genetic and epigenetic control of life cycle transitions in the
brown alga Ectocarpus sp.
Par Simon Bourdareau
Thèse de doctorat de Biologie du développement
Dirigée par J. Mark Cock et Susana M. Coelho
Présentée et soutenue publiquement le 27 Mars 2018
Devant un jury composé de :
Dr Gareth Bloomfield, Rapporteur Medical Research Council, UK
Dr Célia Baroux, Rapportrice University of Zurich, Switzerland
Pr Christophe Destombe, Examinateur Sorbonne Université - CNRS
Dr Akira F. Peters, Examinateur Chercheur Indépendant
Dr Frédérique Peronnet, Invitée Sorbonne Université - CNRS
Dr J. Mark Cock, Directeur de thèse Sorbonne Université – CNRS
Dr Susana M. Coelho, Co-directrice de thèse Sorbonne Université – CNRS


i
A ma famille
ii
REMERCIEMENTS
Je tiens à remercier toutes les personnes qui m’ont permis d’achever ce travail. En
premier lieu, je remercie mes directeurs de thèse Mark Cock et Susana Coelho. Ils m’ont
permis de m’épanouir dans le travail tout au long de la thèse. Je les remercie également
pour la confiance qu’ils m’ont apportée. Je ne pouvais pas souhaiter mieux pour mes
premiers pas dans le monde merveilleux de la recherche. Je les remercie également pour
nous avoir toujours ramené des « spécialités culinaires » des pays d’où ils revenaient
même si souvent c’était gustativement répugnant.
Je remercie également les membres de mon comité de thèse, Angela Falciatore, Phillipe
Potin et Leila Tirichine, d’avoir suivi le projet durant ces trois années et pour l’intérêt
qu’ils y ont porté.
Je veux remercier également Delphine Scornet, Laurent Pères et Josselin Guéno (mon
petit Jojo) pour leur aide substantielle dans cette thèse. Sans eux, le projet n’aurait
jamais abouti et ne serait pas ce qu’il est aujourd’hui.
Je remercie spécialement Leila Tirichine (Ecole Normale Supérieure, Paris) pour les
conseils qu’elle a apporté lors de la mise au point du protocole de ChIP-seq. Ainsi que
Damarys Loew et Bérangère Lombard (Institut Curie, Paris) pour les analyses de
spectrométrie de masse des histones. De plus, je remercie José Manuel Franco-Zorrilla
(CSIC, Madrid) avec qui nous avons établi une collaboration fructueuse sur l’analyse des
capacités de fixation à l’ADN des facteurs de transcription.
Je remercie tous les membres de l’équipe présents et passés : la horde des post-
doctorants, Olivier Godfroy, Fuli Liu, Martina Strittmatter, Komlan Avia, Svenja Heesch,
Aga Lipinska, Marie-Mathilde Perrineau, Nick Toda et de contractuels Céline Caillard,
Zofia Nehr, ainsi que la joyeuse tribu des doctorants (Alexandre Cormier, Josselin Guéno,
Laure Mignerot, Rémi Luthringer et Yao Haiqin). Cela a été très enrichissant de
rencontrer tant de personnes venues de quatre coins du monde avec tant de cultures
différentes.

iii
Je remercie également l’ensemble des doctorants du LBI2M et notamment les voisins de
bureau, Céline Conan, Léa Cabioch, Hetty Kleinjan, Jojo et Yao, pour les bonnes tranches
de rigolades, de délires ou de soirées.
Enfin, je remercie tous les membres du LBI2M pour leur gentillesse et pour tous les
conseils échangés.
iv
CONTENTS
Remerciements ii
Contents iv
Chapter 1 – General Introduction 1
SECTION I: Major evolutionary events during the emergence of the eukaryotes 3
The origins of photosynthetic eukaryotes 3
Eukaryotic life cycles 4
The origin of meiotic sex 5
Gamete fusion is broadly conserved across eukaryotes 6
The necessity for “self” recognition 6
Diversity of life-cycles and evolutionary considerations 7
SECTION II: Genetic mechanisms that regulate life-cycle progression: the role of
homeodomain transcription factors 11
Genetic basis of life-cycle progression 11
Homeodomains, a brief history of their discovery 17
Diversity of Homeodomain TFs 18
The Homeodomain is a DNA-Binding domain 20
SECTION III: Epigenetic reprogramming and the specification of cell identity 23
Epigenetics: a brief history and a definition 23
DNA Methylation 24
Nucleosome positioning and DNA compaction 25
Core Histones and Variants 26
Post-translational Modifications of Histones 26
Writers, Erasers and Readers 28
SECTION IV: Using Ectocarpus to explore development and life cycle regulation 31
Ectocarpus, an emerging model for evolutionary developmental biology 31
Genetic dissection of life-cycle progression and related developmental processes in
Ectocarpus 34
Objectives 36
v
Chapter 2 - Characterization of brown alga life cycle mutants indicates deep evolutionary origins of pathways controlling deployment of the sporophyte program
39
Manuscript (in preparation) : Characterization of brown alga life cycle mutants indicates deep
evolutionary origins of pathways controlling deployment of the sporophyte program 41
Abstract 41
Introduction 42
Results 43
The OUROBOROS gene encodes a TALE HD TF 43
Characterisation of additional sporophyte-to-gametophyte conversion mutants 44
sam sporophyte-to-gametophyte conversion mutants exhibit a meiotic defect 45
The SAMSARA gene encodes a TALE HD TF 46
The expression patterns of the ORO and SAM genes are consistent with roles in determining the sporophyte generation
47
ORO and SAM regulate the expression of sporophyte generation genes 47
The ORO and SAM proteins interact in vitro 48
Evolutionary origins and domain structure of the ORO and SAM genes 49
Discussion 50
Methods and Materials 52
Biological material and mutagenesis 52
Microscopy 52
Photopolarisation 52
Treatment with the sporophyte-produced diffusible factor 53
Mapping of genetic loci 53
Reconstruction and sequence correction of the ORO and SAM loci 54
Quantitative reverse transcriptase polymerase chain reaction analysis of mRNA abundance 54
RNA-seq analysis 55
Detection of protein-protein interactions 56
Searches for HD proteins from other stramenopile species 56
Phylogenetic analysis and protein analysis and comparisons 56
References 57
Figures and tables 62
79
vi
Chapter 3 - Functional analysis of the Ectocarpus sp. life cycle regulators OUROBOROS and SAMSARA
Introduction 81
Material and Methods 82
Plasmid Construction 82
Protein Binding Microarray, DAP-seq and epitope production 82
Yeast Two-hybrid bait constructs 83
Yeast Two-Hybrid cDNA library 83
Yeast Two-Hybrid Assay 84
Strain genotypes 84
Selection of bait and prey combinations in yeast 84
Mating and screening for prey-bait interactions 84
Extraction and cloning of prey plasmids 85
Small-scale interaction screening 85
Protein Binding Microarray 86
DAP-seq 86
Production of anti-ORO and anti-SAM antibodies 88
ChIP-nexus 88
Results 90
In vitro DNA-binding capacities of ORO and SAM 90
Genome-wide identification of ORO and SAM binding sites in vivo 98
Identification of ORO-interacting proteins 101
Discussion 104
The DNA binding sites of ORO and SAM are related to those of other TALE homeodomain TFs
but exhibit some novel features 104
ORO and SAM interacting proteins suggest a role for TF complexes and chromatin
modification in the gametophyte-to-sporophyte transition 107
vii
Chapter 4 - An efficient chromatin immunoprecipitation protocol for characterizing histone modifications in the brown alga Ectocarpus
113
Manuscript (in preparation) : An efficient chromatin immunoprecipitation protocol for
characterizing histone modifications in the brown alga Ectocarpus 115
Introduction 115
Procedure 117
Anticipated results 123
References 124
Figures 126
Chapter 5 - Epigenetic modifications associated with life cycle transitions in the brown alga Ectocarpus
129
Manuscript (in preparation) : Epigenetic modifications associated with life cycle transitions in the brown alga Ectocarpus
131
Introduction 131
Results 132
Ectocarpus histones and histone modifier enzymes 132
Identification of histone PTMs in Ectocarpus 133
Genome-wide distribution of selected histone PTMs 133
Epigenetic reprogramming during the Ectocarpus life cycle 135
Discussion 136
Material and Methods 138
Strains and growth conditions 138
Detection of histone PTMs using mass spectrometry 138
Detection of histone PTMs using western blots 138
Genome-wide detection of histone PTMs 138
Comparisons of sporophyte and gametophyte transcriptomes using RNA-seq 140
Searches for histone and histone modifying enzyme encoding genes in Ectocarpus 140
References 140
Figures and Tables 146
Supplementary material 157

viii
Chapter 6 - General Conclusions and Perspectives
171
Regulation of life cycle progression by the ORO and SAM proteins 173
Chromatin modifications during the Ectocarpus life cycle 176
References 181


1
Chapter 1
General Introduction
2
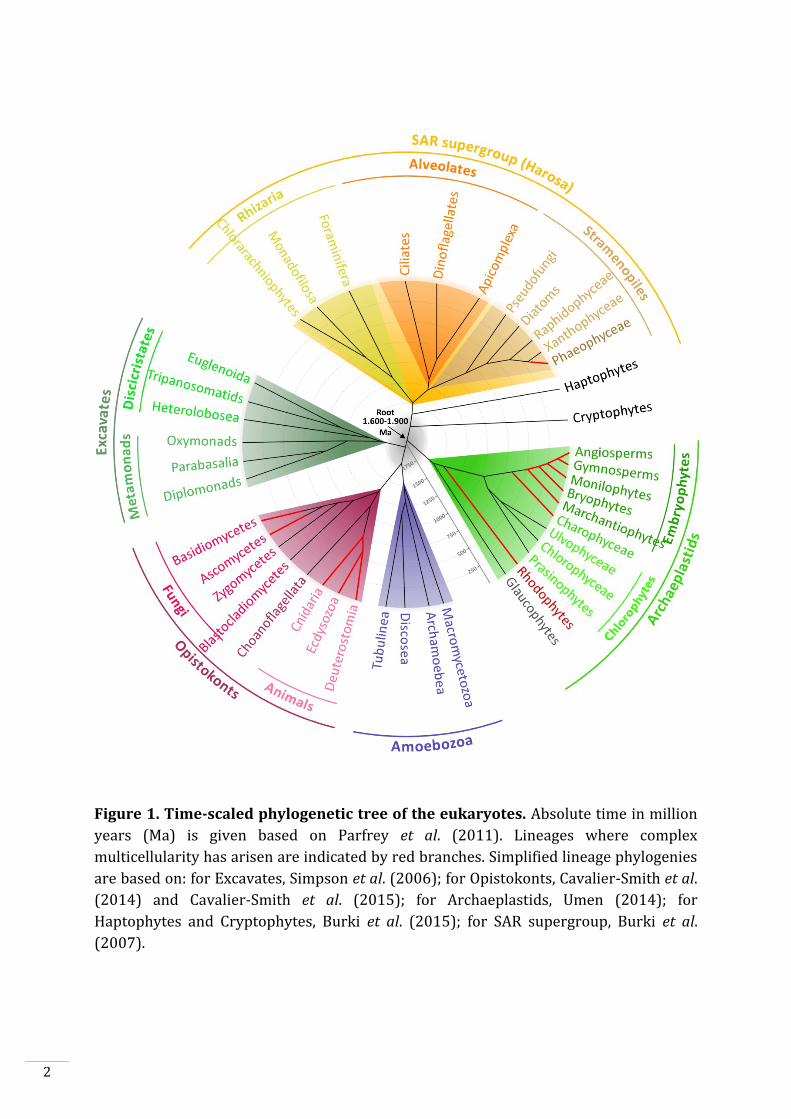
Figure 1. Time-scaled phylogenetic tree of the eukaryotes. Absolute time in million
years (Ma) is given based on Parfrey et al. (2011). Lineages where complex
multicellularity has arisen are indicated by red branches. Simplified lineage phylogenies
are based on: for Excavates, Simpson et al. (2006); for Opistokonts, Cavalier-Smith et al.
(2014) and Cavalier-Smith et al. (2015); for Archaeplastids, Umen (2014); for
Haptophytes and Cryptophytes, Burki et al. (2015); for SAR supergroup, Burki et al.
(2007).
3
SECTION I: Major evolutionary events during the emergence of
the eukaryotes
The origins of photosynthetic eukaryotes
Eukaryogenesis is the process whereby simple ancestral cells, thought to be similar to
extant prokaryotes, acquired eukaryotic-specific characteristics such as a nucleus,
mitochondria and intracellular membrane systems. The details of this process, for
example regarding the order of acquisition of these characteristics, are still largely
unknown and widely debated (Koumandou et al., 2013). It is thought that the Last
Eukaryotic Common Ancestor (LECA) emerged as the unique survivor of many
evolutionary experiments. The LECA, which is defined as possessing a nuclear envelope
and mitochondria, is estimated to have emerged between 1.5 and 2 billion years ago
(Parfrey et al., 2011; Dacks et al., 2016). Based on the universality of eukaryotic
complexity, the LECA must probably already have possessed multiple cellular
compartments, a cytoskeleton, a complex gene regulation machinery and a large gene
content including metabolic and signalling repertoires comparable to those of bacteria
and archaea (Dacks et al., 2016; Zaremba-Niedzwiedzka et al., 2017). The emergence of
the different eukaryotic lineages from this common ancestor involved gain and loss of
gene families, gene duplications and mutations, which diversified the gene repertoire,
providing the ability to develop in contrasting environments. The two major clades of
eukaryotes, Unikonts and Bikonts (Fig. 1), diverged since about 1.6-1.9 billion years
(Parfrey et al., 2011). Unikonts, eukaryotic cells with a single flagellum or no flagella,
include Amoebozoa and Opistokonts. This latter clade includes fungi, choanoflagellates
and animals. Bikonts, eukaryotic cells with two flagella (some have lost the flagella),
includes Archeaplastids, Excavates and the SAR supergroup, which includes the
Stramenopiles, Alveolates and Rhizaria (Fig. 1).
Photosynthesis was acquired by eukaryotes about 1.6 billion years ago after the
enslavement of a cyanobacterium by a non-photosynthetic eukaryote (Yoon et al., 2004).
This event, called primary endosymbiosis, occurred in the lineage that gave rise to the
Archaeplastids, which include Glaucophytes, Rhodophytes (red algae) and
Chloroplastids (green algae and land plants) (Kutschera and Niklas, 2005; Keeling,
2010). Secondary endosymbiosis, the retention of a unicellular alga within a non-
4
photosynthetic eukaryote, is thought to have occurred several times independently
during evolution. The first secondary endosymbiosis, involving the capture of a red alga,
is thought to have occurred about 1.3 billion years ago, in the common ancestor of
Haptophytes, Cryptophytes and SAR supergroup. Several lineages then lost their plastid,
including all Rhizarians, several Alveolates and all Oomycetes (also called pseudofungi).
Secondary endosymbioses have involved engulfment of a green alga. This was the case
for the Euglenids, which belong to the Excavates, and for the Chlorarachniophytes,
which belong to the Rhizarians. The latter event presumably occurred following loss of
the plastid derived from a red alga. Several dinoflagellates seem to have acquired
photosynthesis via tertiary endosymbiosis of a diatom, a haptophyte or a cryptophyte
(Keeling, 2010).
Eukaryotic life cycles
Whereas bacteria and archaea reproduce asexually by cell division, most eukaryotes
have sexual life cycles that involve alternation between a diploid phase and a haploid
phase. Meiosis, which produces the haploid phase from diploid cells, fulfils several
different tasks. First, meiosis reduces ploidy by halving DNA content, generating
complete chromosome complements by independent segregation of non-homologous
chromosomes. Second, meiosis produces recombinant progeny by creating double-
strand breaks and repairing them via crossovers. Third, meiosis allows some deleterious
alleles to be purged and some advantageous recessive alleles to be unmasked, for genes
that are active during the haploid phase (Kondrashov, 1988). Gametes can originate
from independent meiotic events increasing the genetic diversity of populations.
Syngamy, which involves the fusion of two haploid phase cells (gametes), restores the
initial diploid DNA content.
Variants of the sexual life-cycle have evolved in some lineages, such as parasexuality in
the filamentous fungus Aspergillus nidulans, where diploids cells are generated by fusion
of two haploid hyphal cells and the haploid state is restored as a result of random loss of
chromosomes from these diploid cells (Pontecorvo, 1956; Ene and Bennett, 2014).
5
The origin of meiotic sex
Meiosis is one of the eukaryotes’ major evolutionary innovations but its origins are not
clearly understood. First, it is probable that early proto-eukaryotes reproduced
asexually in a similar fashion to bacteria, by DNA replication and cell fission and only
later progressively acquired mechanisms to reduce ploidy in a controlled manner and to
carry out meiotic recombination (Cleveland, 1947; Wilkins and Holliday, 2009).
One of the scenarios proposed for the emergence of ploidy reduction is the necessity for
proto-eukaryotes to control inadvertent endoreduplications which can occur after DNA
replication when mitosis aborts (Cleveland, 1947; Lenormand et al., 2016). Proto-
eukaryotes may have had an imperfect form of mitosis similar to the molecular
mechanism that was originally acquired by bacteria to transmit their unique and
circular chromosome. The emergence of multiple linear chromosomes required a more
robust mechanism to ensure correct segregation.
Another scenario to explain the evolution of a mechanism of ploidy reduction proposes
that meiosis evolved to balance unintended cell fusions in cases of primitive
parasexuality or syngamy, both of which could be caused by selfish elements (plasmids,
transposons) or integrated viruses promoting their horizontal transfer (Hickey and
Rose, 1988; Lenormand et al., 2016). Later, syngamy may have been favoured because it
allowed deleterious mutations to be masked during the diploid phase.
The high complexity of eukaryote genomes requires that homologues be correctly
segregated, requiring pairing of homologues before the initiation of meiosis. Homology
search is based on double-strand breaks (DSBs) and chiasmata formation (Renkawitz et
al., 2013). Chiasmata are then resolved by the recombination machinery. The DNA-
manipulating enzymes that carry out these processes evolved from prokaryote
machinery. For example, SPO11, which creates the double stranded breaks (DSBs)
necessary for the formation of crossovers, is derived from an archaeal topoisomerase VI
that has lost its DNA ligation function (Bergerat et al., 1997).
SPO11 and other enzymes such as RAD50 and MRE11 (which recognize DSBs), DMC1 (a
recombinase that mediates DNA strand exchange) or HOP1 (a structural protein
involved in the synaptonemal complex) are conserved throughout eukaryotes
suggesting their acquisition by the LECA (Loidl, 2016).
6
Gamete fusion is broadly conserved across eukaryotes
On the opposite side of the life cycle, gametes fuse to create a diploid zygote.
GENERATIVE CELL SPECIFIC 1 (GCS1) was found to be essential for fertilization in
Arabidopsis thaliana (Mori et al., 2006). The C. reinhardtii orthologue of GCS1, called
HAPLESS 2 (HAP2), also acts as a gamete fusogen and a similar system was found in the
malaria parasite Plasmodium bergei (Liu et al., 2008). Orthologues of HAP2-GCS1 are
expressed exclusively in spermatogenic cells in cnidarians such as Hydra (Steele and
Dana, 2009) and in the starlet sea anemone Nematostella vectensis (Ebchuqin et al.,
2014). Gamete interactions are controlled by two HAP2-GSCS1 orthologues in the
cellular slime mold Dictyotellium discoideum (Okamoto et al., 2016). Taken together,
these observations suggest that the HAP2-GCS1 fusogen was acquired by the common
ancestor of apicomplexans, archaeplastids, amoebozoa and animals probably during an
age close to that of the LECA. Interestingly, a recent study has revealed that the C.
reinhardtii HAP2 is homologous to class II viral membrane fusion proteins and probably
acts in a similar manner to these proteins (Fédry et al., 2017). This study suggests a
possible viral origin of syngamy early in the eukaryotic evolution story.
However, no orthologues of the HAP2-GCS1 fusogen have be found in Stramenopiles
(which include oomycetes and brown algae) nor in vertebrate animals suggesting that
the GCS1 system may have been replaced by another equivalent mechanism in these
lineages.
The necessity for “self” recognition
One of the evolutionary consequences of syngamy was that eukaryotes needed to evolve
mechanisms to restrict cell-cell attraction and fusion to cells containing homologous
chromosomal content (i.e. belonging to the same species). Without an effective cell
recognition system, syngamy will produce a proportion of unviable offspring, with two
incompatible sets of chromosomes. Cell recognition systems act widely during the
prezygotic phase. Before initiating zygote formation, cells can identify “self” partners
remotely by sensing gradients of pheromones or proximately by direct cell-surface
contacts. Cell recognition molecules are spatiotemporally limited and rarely constitutive.
In unicellular organisms with haplontic life cycles (see the following section for a
definition of this term), cells generally initiate a mitotic phase after meiosis, producing a
7
large quantity of vegetative cells that are unable to fuse until they perceive an exogenous
signal such as a pheromone or an abiotic stress such as a nutrient depletion (usually
nitrogen or carbon) and initiate gametogenesis. In yeasts and filamentous fungi, the
perception of a peptide pheromone by a transmembrane receptor triggers the
expression of genes that turn on the mating-type identity of the cell (Ni et al., 2011). In C.
reinhardtii, nitrogen starvation induces vegetative cells to differentiate into functional
gametes (Lee et al., 2008). Diversification of pheromones and cell-surface molecules are
typical causes of prezygotic isolation and, consequently, speciation. In
Schizosaccharomyces pombe, reproductively isolated populations can be genetically
engineered by mutating the peptide sequence of the pheromone and its receptor (Seike
et al., 2015). Cell-cell recognition can also be mediated by glycoproteins present in the
external layer of the gamete membrane. In Chlamydomonas, the glycoprotein FUS1 is
expressed in the plus gamete and interacts with an unidentified receptor in the minus
gamete (Misamore et al., 2003). In sea urchin, the egg jelly layer surrounding the oocyte
contains glycoproteins that are recognized by Receptor for Egg Jelly (REJ), which coats
the sperm membrane (Moy et al., 1996). Interestingly, female gametes of the brown alga
Ectocarpus siliculosus are decorated by glycoproteins that may be involved in gamete
recognition (Schmid et al., 1994) and male gametes express specific REJ-like proteins
(Lipinska et al., 2013).
Diversity of life-cycles and evolutionary considerations
All eukaryotic sexual life cycles involve iterative alternation between meiosis and
syngamy. Nonetheless, these life cycles vary widely and range between diplontic life
cycles and haplontic life cycles (Fig. 2) (Coelho et al., 2007). In a haplontic life cycle,
mitotic cell divisions occur during the haploid phase. After gametogenesis, gametes fuse
to give a diploid zygotic cell whose first division is meiotic, producing haploid cells. The
life cycles of the green algae Chlamydomonas reinhardtii and members of the
Charophyceae are typically examples of haplontic life cycles. A contrario, in a diplontic
life cycle, mitotic cell divisions occur during the diploid phase. Functional gametes are
produced directly after meiosis and fuse immediately, without undergoing any mitotic
divisions, to regenerate a diploid cell. We are familiar with this life cycle, as Mammals
are classic examples of organisms with diplontic life cycles. Between these two extreme
8
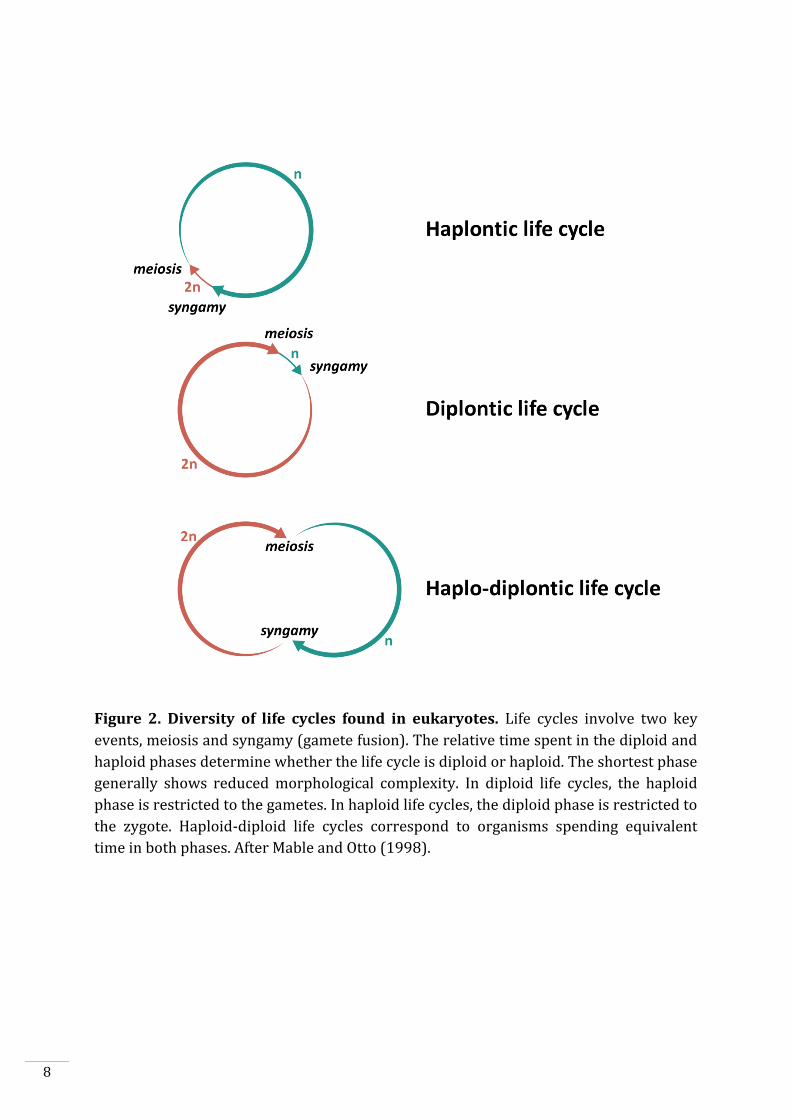
Figure 2. Diversity of life cycles found in eukaryotes. Life cycles involve two key
events, meiosis and syngamy (gamete fusion). The relative time spent in the diploid and
haploid phases determine whether the life cycle is diploid or haploid. The shortest phase
generally shows reduced morphological complexity. In diploid life cycles, the haploid
phase is restricted to the gametes. In haploid life cycles, the diploid phase is restricted to
the zygote. Haploid-diploid life cycles correspond to organisms spending equivalent
time in both phases. After Mable and Otto (1998).
9
cases, some organisms have evolved haploid-diploid (or haplodiplontic) life cycles,
where mitotic divisions occur during both the haploid and diploid phases of the life
cycle. Many green and red algae, most brown algae, some fungi, and all mosses and ferns
have haploid-diploid life cycles, including model organisms such as the moss
Physcomitrella patens or the yeast Saccharomyces cerevisiae. Mitotic cell divisions can
either increase the number of individual cells in case of unicellular organisms (asexual
reproduction) or can result in the development of either a simple or a complex
multicellular body. Complex multicellularity results in the development of a three-
dimensional bodyplan with differentiated cells and tissues. On the other hand, when
differentiation is limited to somatic cells exhibiting limited differentiation and to
gametes the organisms are considered to exhibit simple multicellularity. Multicellular
haploid-diploid organisms are generally multicellular in both generations. Haploid-
diploid life-cycles can be defined as (quasi)isomorphic or heteromorphic depending on
whether the haploid and diploid generations are (nearly) identical or morphologically
distinct (Fig. 2).
The majority of animals have a diplontic life cycle, indicating that this was probably the
ancestral state. In terrestrial plants, the reduction of the haploid phase occurred
progressively over evolutionary time. In the majority of mosses, the photosynthetic
gametophyte is dominant whereas in gymnosperms and angiosperms the gametophyte
is highly reduced and the sporophyte is persistent and photosynthetic. As animals and
terrestrial plants are dominant in terrestrial environments, our perception of life cycle
evolution may be biased in favour of the prominence of diploidy. However, haploid and
haploid-diploid life cycles are common in other eukaryotic lineages and do not display a
tendency to disappear over the course of evolution (Mable and Otto, 1998). This
suggests that the three types of life cycles are stable and each can have evolutionary
advantages. We will briefly list the advantages and disadvantages that are thought to be
associated with diploid, haploid, and haploid-diploid life cycles, respectively. During the
diploid phase, the diploid state of the chromosomes allows many deleterious mutations
to be masked as these mutations are often recessive and will be complemented by wild-
type alleles (Crow and Kimura, 1965). Also, diploid individuals can carry a larger
number of alleles than haploids because there are two copies of each gene present in the
cell (Paquin and Adams, 1983). This production of new allelic variants can be seen as a
source of potential genetic adaptations that may allow adaptation to environmental
10
changes and could act to drive to the acquisition of novel functions. However, mutations
accumulated during the diploid phase may be deleterious during the haploid phase. This
could lead to a shortening of the haploid phase to limit the deleterious effects of such
mutations.
On the other hand, during the haploid phase, mutations are not masked and can be more
efficiently removed by purifying selection. Similarly, recessive advantageous mutations
are immediately useful for a haploid organism. Generally, haploidy will be advantageous
to organisms with longer life cycle phases whereas diploidy tends to be associated with
organisms that have short life cycles or complex multicellular development (Mable and
Otto, 1998).
An explanation for the stability of haploid-diploid life cycles could be that species with
distinct haploid and diploid phases are able to exploit two different ecological niches in
environments varying in space and time (Hughes and Otto, 1999; Rescan et al., 2016).
Haploid-diploid life cycles can be favoured when environmental changes occur
periodically such as seasonal variations, for example (Rescan et al., 2016). Finally,
haploid and diploid generations can be differentiated at the transcription level.
Mutations in genes which are expressed specifically in one generation do not affect the
fitness of the other generation and may be favourable for the first generation in case of
environmental changes (Rescan et al., 2016).
To summarise, eukaryotes exhibit a broad range of life cycles and theoretical studies
indicate that different types of life cycle could be advantageous under different
conditions. The following section will look at what is currently known about the
mechanisms that regulate life cycle progression.
11
SECTION II: Genetic mechanisms that regulate life-cycle
progression: the role of homeodomain transcription factors
Haploid and diploid generations are constructed using information from a shared
genome, which implies that genetic regulation occur during meiosis (diploid-to-haploid
transition) and syngamy (haploid-to-diploid transition) to trigger the initiation of the
appropriate developmental program associated with each generation. In organisms with
haploid-diploid life cycles, diploid and haploid generations are morphologically and/or
functionally distinct. Thus, developmental switches must be tightly controlled to avoid
the production of chimeric organisms. The alternation of generations also needs to be
coupled with ploidy state, indicating a need for sensing systems that assess the level of
ploidy of the cell.
In this section, we will discuss the genetic mechanisms that regulate life-cycle
progression and provide an overview of an important transcription factor family
involved in this process, the homeodomain (HD) transcription factors (TFs).
Genetic basis of life-cycle progression
Several genetic studies have contributed to our understanding of the genetic basis of life
cycle progression, particularly the haploid-to-diploid transition. The first evidence of
genetic control of the haploid-to-diploid transition was found in the unicellular fungus
Saccharomyces cerevisiae (Goutte and Johnson, 1988). The α2 protein and the a1 protein,
produced respectively by the MATα2 locus and MATa1 locus, bind to haploid-specific
genes and repress them. α2 was found to share homology with Drosophila
homeodomain proteins (Shepherd et al., 1984). Similar systems, involving
homeodomain proteins, were subsequently found in Ustilago maydis (Gillissen et al.,
1992), Coprinus cinereus (Kües et al., 1992) and the human pathogen fungus
Cryptococcus neoformans (Hull et al., 2005). The latter system has been particularly well
described. In C. neoformans, sexual development is initiated by the fusion of two haploid
yeast cells of different mating-types (respectively a and α) resulting in the formation of
dikaryotic filaments (Fig. 3.A)(Hull et al., 2005). The nuclei that originate from a and α
cells are strictly separated until the basidium forms. Karyogamy then occurs in the
basidia, followed by the formation of meiotic structures and the production of haploid
12
13
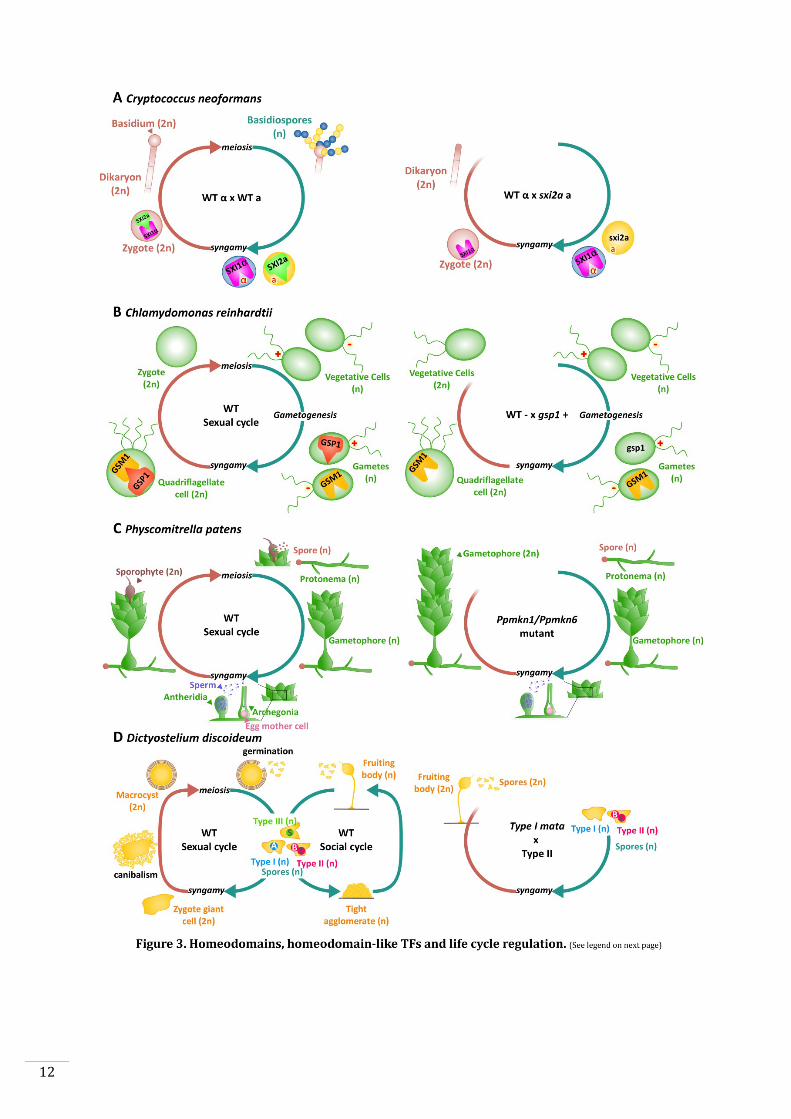
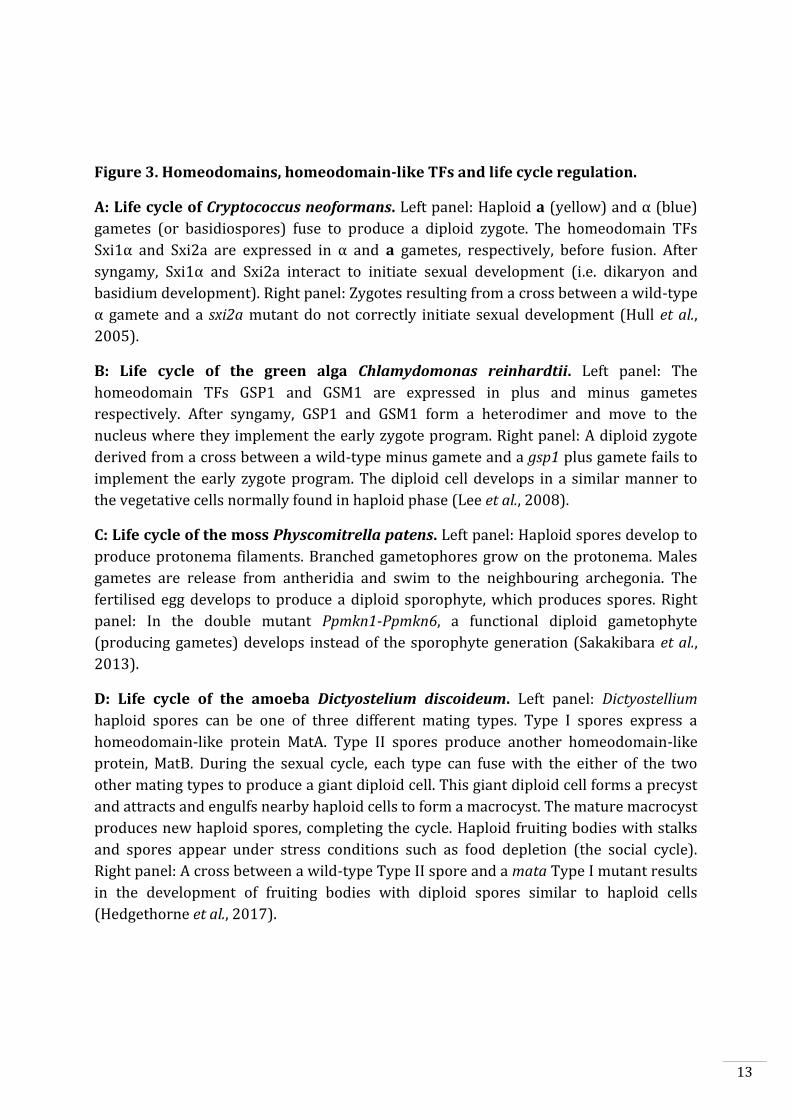
Figure 3. Homeodomains, homeodomain-like TFs and life cycle regulation.
A: Life cycle of Cryptococcus neoformans. Left panel: Haploid a (yellow) and α (blue)
gametes (or basidiospores) fuse to produce a diploid zygote. The homeodomain TFs
Sxi1α and Sxi2a are expressed in α and a gametes, respectively, before fusion. After
syngamy, Sxi1α and Sxi2a interact to initiate sexual development (i.e. dikaryon and
basidium development). Right panel: Zygotes resulting from a cross between a wild-type
α gamete and a sxi2a mutant do not correctly initiate sexual development (Hull et al.,
2005).
B: Life cycle of the green alga Chlamydomonas reinhardtii. Left panel: The
homeodomain TFs GSP1 and GSM1 are expressed in plus and minus gametes
respectively. After syngamy, GSP1 and GSM1 form a heterodimer and move to the
nucleus where they implement the early zygote program. Right panel: A diploid zygote
derived from a cross between a wild-type minus gamete and a gsp1 plus gamete fails to
implement the early zygote program. The diploid cell develops in a similar manner to
the vegetative cells normally found in haploid phase (Lee et al., 2008).
C: Life cycle of the moss Physcomitrella patens. Left panel: Haploid spores develop to
produce protonema filaments. Branched gametophores grow on the protonema. Males
gametes are release from antheridia and swim to the neighbouring archegonia. The
fertilised egg develops to produce a diploid sporophyte, which produces spores. Right
panel: In the double mutant Ppmkn1-Ppmkn6, a functional diploid gametophyte
(producing gametes) develops instead of the sporophyte generation (Sakakibara et al.,
2013).
D: Life cycle of the amoeba Dictyostelium discoideum. Left panel: Dictyostellium
haploid spores can be one of three different mating types. Type I spores express a
homeodomain-like protein MatA. Type II spores produce another homeodomain-like
protein, MatB. During the sexual cycle, each type can fuse with the either of the two
other mating types to produce a giant diploid cell. This giant diploid cell forms a precyst
and attracts and engulfs nearby haploid cells to form a macrocyst. The mature macrocyst
produces new haploid spores, completing the cycle. Haploid fruiting bodies with stalks
and spores appear under stress conditions such as food depletion (the social cycle).
Right panel: A cross between a wild-type Type II spore and a mata Type I mutant results
in the development of fruiting bodies with diploid spores similar to haploid cells
(Hedgethorne et al., 2017).
14
spores. Haploid a and α cells each express a mating-type-specific factor coded by a gene
localized in their mating-type locus. Both the a-specific factor, encoded by SEX INDUCER
2a (SXI2a), and the α-specific factor, encoded by SEX INDUCER 1α (SXI1α), show
similarities with homeodomain transcription factors (HD TFs). HD TFs have been
classed into two groups, TALE and non-TALE, depending on whether they possess a
characteristic three amino acid loop extension (abbreviated as "TALE") of the 60 amino
acid homeodomain. Hull et al. (2005) showed that the non-TALE HD Sxi2a and the TALE
HD (see subsection Diversity of Homeodomain-containing TFs) Sxi1α are able to form a
heterodimer. Mutation of those genes blocks sexual development and therefore affects
the production of new recombinant haploid spores by meiosis. Ectopic expression of
SXI2a in haploid α cells drives the formation of filaments and sporulation without
syngamy. Involvement of HD TFs in life-cycle control is a common feature in both
ascomycetes and basidiomycetes (reviewed by Lee et al., 2010).
Analysis of analogous systems in more distantly-related species indicated that
homeodomain-based mating systems are not rare among eukaryotes and are not limited
to the fungi. The mating system of the green unicellular alga Chlamydomonas reinhardtii,
for example, is striking similar to that of Cryptococcus. In C. reinhardtii, GAMETE
SPECIFIC PLUS1 and GAMETE SPECIFIC MINUS1 encode two TALE HD TFs which are
expressed specifically in plus or minus gametes, respectively, under environmental
conditions that induce gametogenesis (Fig. 3.B). After gamete fusion, GSP1 (a BEL class
HD TF) and GSM1 (a KNOX2 class HD TF) heterodimerize and translocate to the nucleus
where they control zygote-specific gene expression (Lee et al., 2008). Plus gametes that
carry mutations in the GSP1 gene are capable of fusing with minus gametes, but the
zygotic genetic program is not activated and the resulting diploid cells resemble haploid
vegetative cells (Nishimura et al., 2012). Moreover, as observed in equivalent
experiments in C. neoformans, ectopic expression of GSP1 in minus gametes is sufficient
to trigger the diploid program in a haploid context (Lee et al., 2008).
Homeodomain-protein-encoding genes have diversified widely in land plants, evolving
by gene duplication and gain of function. Land plant genomes include multiple BEL,
KNOX1 and KNOX2 genes. The KNOX1 subfamily emerged during terrestrialisation of
the green lineage and is involved in the development and maintenance of plant
meristems. Interestingly, in early branching lineages such as Bryophytes, some KNOX2
15
and BELL genes have retained functions in controlling the haploid-to-diploid transition.
In Physcomitrella patens, for example, two KNOX2 genes, PpMKN1 and PpMKN6, are
expressed in egg cells and nearby archegonial cells and are involved in the
implementation of the diploid sporophyte program (Sakakibara et al., 2013). Diploid
Ppmkn1-Ppmkn6 double mutant embryos developed aposporous gametophytes with
basal protonema filaments and gametophores instead of the sporophyte (Fig. 3.C).
Interestingly, gametophores formed antheridia and archegonia, which produced
functional gametes able to generate tetraploid embryos by self-fertilization (Sakakibara
et al., 2013). This result suggests that these two KNOX2 genes repress the gametophyte
program during the diploid stage and are required for the implementation of the
sporophyte program. Furthermore, the BEL class gene PpBELL1 is expressed in egg and
ventral cells of archegonia and PpBELL2 is expressed in mature archegonia cells and
embryos (Horst et al., 2016). Loss-of-function Ppbell1 mutants fail to build sporophytes
structures (but do not develop as gametophytes instead of sporophytes). A PpBELL1
overexpression line, termed PpBELL1oe, produced apogamous sporophyte-like bodies
on haploid caulonemal cells (Horst et al., 2016).
PpBELL1 and PpMKN proteins (both KNOX1 and KNOX2 classes) are capable of forming
different heterodimer combinations (Horst et al., 2016). It is probable that some
interactions between PpBELL1 and KNOX2 class proteins are involved in the haploid-to-
diploid transition. However, some interactions between KNOX1 class proteins and
PpBELL1 have probably been reemployed in different developmental processes not
directly linked to the haploid-to-diploid transition. Regulatory networks involving KNOX
and BEL class HDs have therefore been complexified in early terrestrial plants compared
to green algae Chlamydomonas.
Functional analysis of angiosperm KNOX and BEL class genes has revealed roles in a
range of developmental processes. However, there is currently no direct evidence of a
role for orthologues BEL and KNOX genes in ploidy transitions in Angiosperms. KNOX1
class genes are expressed essentially in merismatic tissues. The maize KNOTTED-1 HD
targets many genes involved in the auxin, gibberellin and brassinosteroid hormonal
pathways. The knotted-1 mutation has dramatic effects on the development, such as the
formation of reduced female and male inflorescences and leaf deformations (Smith et al.,
1992; Bolduc et al., 2012). In Arabidopsis, the KNOX2 class genes, KNAT3, KNAT4 and
16
KNAT5 are expressed in a large variety of tissues. The KNOX2 class genes have been
proposed to be involved in determining leaf shape (Furumizu et al., 2015) and might
play a role during root development (Truernit and Haseloff, 2014). AtKNAT7 is
potentially a negative regulator of secondary wall biosynthesis in xylem fibers (Li et al.,
2012). In Medicago truncatula, the KNOX2 class gene KNOX4 contributes to the control
of seed dormancy (Chai et al., 2016). It has been suggest that the numerous HD gene
duplications that occurred during land plant evolution resulted in an increase in the
number of interactions between KNOX and BELL proteins resulting in complex genetic
regulatory networks involved in diverse processes during the diploid generation
(Furumizu et al., 2015; Bowman et al., 2016). The diversification of the KNOX and BELL
proteins may be linked to the expansion of the diploid generation in land plants.
In the slime mold Dictyostellium discoideum, mating type proteins (referred as
homeodomain-like proteins) induce zygotic functions after fusion of compatible gametes
(Fig. 3.D) in a similar manner to the mating type proteins of C. reinhardtii (Hedgethorne
et al., 2017). The protein sequences of the homeodomain-like regions of these putative
transcription factors only exhibit very limited similarity to canonical homeodomains but
they have a similar three dimensional structure to homeodomains. Based on these
observations, Hedgethorne et al. (2017) suggested that the D. discoideum mating type
proteins are a group of highly divergent homeodomains specific to the Amoebozan
lineage. Under this hypothesis, these homeodomain-like proteins would have retained
ancestral functions related to the control of the haploid-to-diploid transition in this
lineage.
In animals, the role of HD TFs in life cycle transitions has not been investigated. It is
possible that a comparable mechanism to that observed in fungi, green algae, land plants
and amoebae (i.e. based on a HD two-component system that triggers the activation of
the diploid program) exists in animals but that this mechanism is difficult to detect
because mutation of the HD components lead to lethality. There is however extensive
knowledge about the role of animal HD TFs in the regulation of other developmental
programs, with both non-TALE and TALE HD TFs playing important roles in a broad
range of processes. In Drosophila melanogaster, the non-TALE BITHORAX and
ANTENNAPEDIA genes are required for segmental development (McGinnis et al., 1984a).
A mutation in one of these genes causes a homeotic conversion, resulting in the
17
replacement of one body segment by another segment that would normally be localized
somewhere else in the bodyplan. For example, the bithorax mutation leads to
development of an anterior half of a second thoracic segment be produced at the
position where there should be the anterior half of the third segment, resulting in the
development of wings instead halters (Morata and Garcia-Bellido, 1976). The
antennapedia mutation causes the development of second thoracic legs in place of the
antennas (Postlethwait and Schneiderman, 1971). The ANTENNAPEDIA and BITHORAX
gene families are grouped into two genomic HOX clusters, the Antennapedia (ANT_C)
and Bithorax clusters (BX-C) (Maeda and Karch, 2009 ; Ferrier and Holland, 2001). The
expression patterns of the genes in these clusters along the bodyplan matches the order
of the genes along the chromosome. Additional non-TALE HD TFs are also involved in
animal development. Generally, in animals, TALE HD TFs act as modulators of non-TALE
HD TFs (Hudry et al., 2014; Merabet and Mann, 2016; Kumar et al., 2017).
Homeodomains, a brief history of their discovery
The homeobox, which was first discovered by Walter Gehring and his team in 1984, is a
repetitive DNA sequence identified in genes of the Bithorax and Antennapedia
complexes, ANTENNAPEDIA, FUSHI TARAZU and ULTRABITHORAX (McGinnis et al.,
1984a). A few months later, Gehring discovered that this DNA homology was due to a
shared protein-coding sequence in these three patterning genes (McGinnis et al., 1984b).
Subsequently, the homeobox was found in several invertebrate and vertebrate genomes
and was shown to code for a highly conserved domain of 60 amino-acids (Carrasco et al.,
1984). The HD, which is the protein domain encoded by the homeobox, was born.
The first plant homeobox gene, called KNOTTED-1, was discovered in maize in 1992
(Smith et al., 1992). This gene is expressed in vegetative apical and auxiliary meristems
and controls leaf development but mutation of this gene does not cause homeotic
switching, equivalent to that observed with mutant versions of animal homeobox genes.
Homeoboxes and homeodomains are named based on homology to the HOX genes
rather than the function of the genes and proteins in which they are found, so not all
mutations of homeobox-containing genes lead to homeotic switching.
18
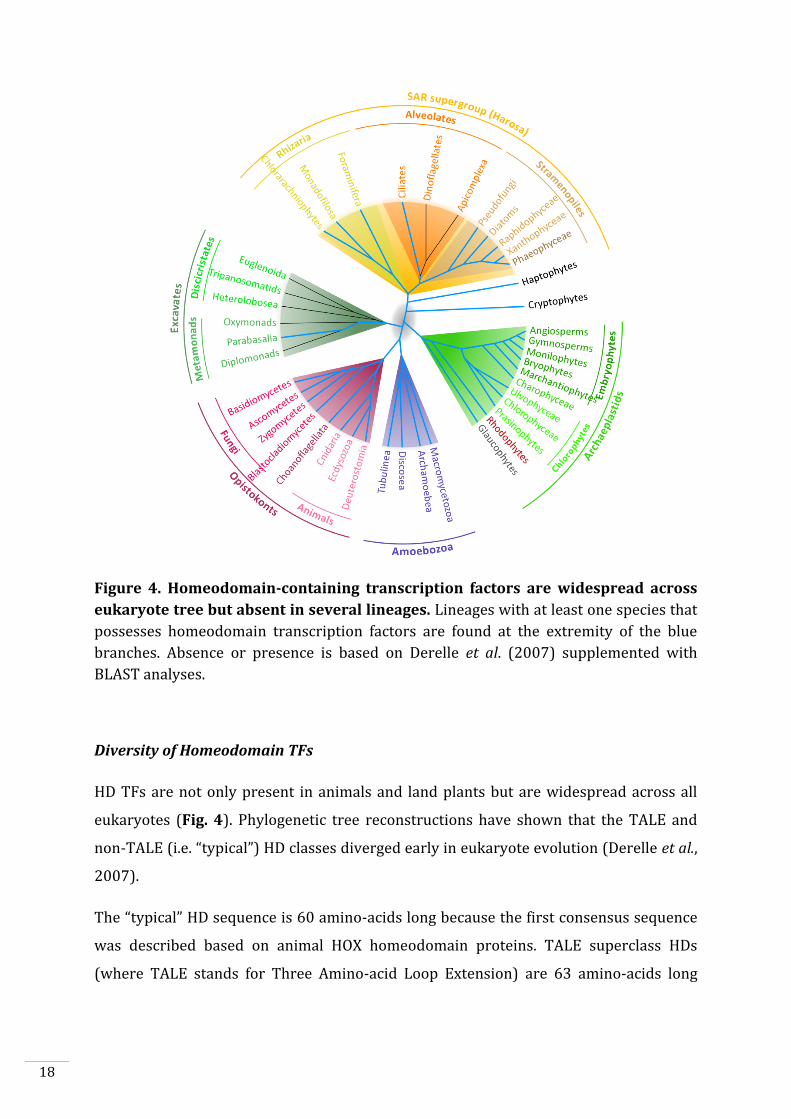
Figure 4. Homeodomain-containing transcription factors are widespread across
eukaryote tree but absent in several lineages. Lineages with at least one species that
possesses homeodomain transcription factors are found at the extremity of the blue
branches. Absence or presence is based on Derelle et al. (2007) supplemented with
BLAST analyses.
Diversity of Homeodomain TFs
HD TFs are not only present in animals and land plants but are widespread across all
eukaryotes (Fig. 4). Phylogenetic tree reconstructions have shown that the TALE and
non-TALE (i.e. “typical”) HD classes diverged early in eukaryote evolution (Derelle et al.,
2007).
The “typical” HD sequence is 60 amino-acids long because the first consensus sequence
was described based on animal HOX homeodomain proteins. TALE superclass HDs
(where TALE stands for Three Amino-acid Loop Extension) are 63 amino-acids long
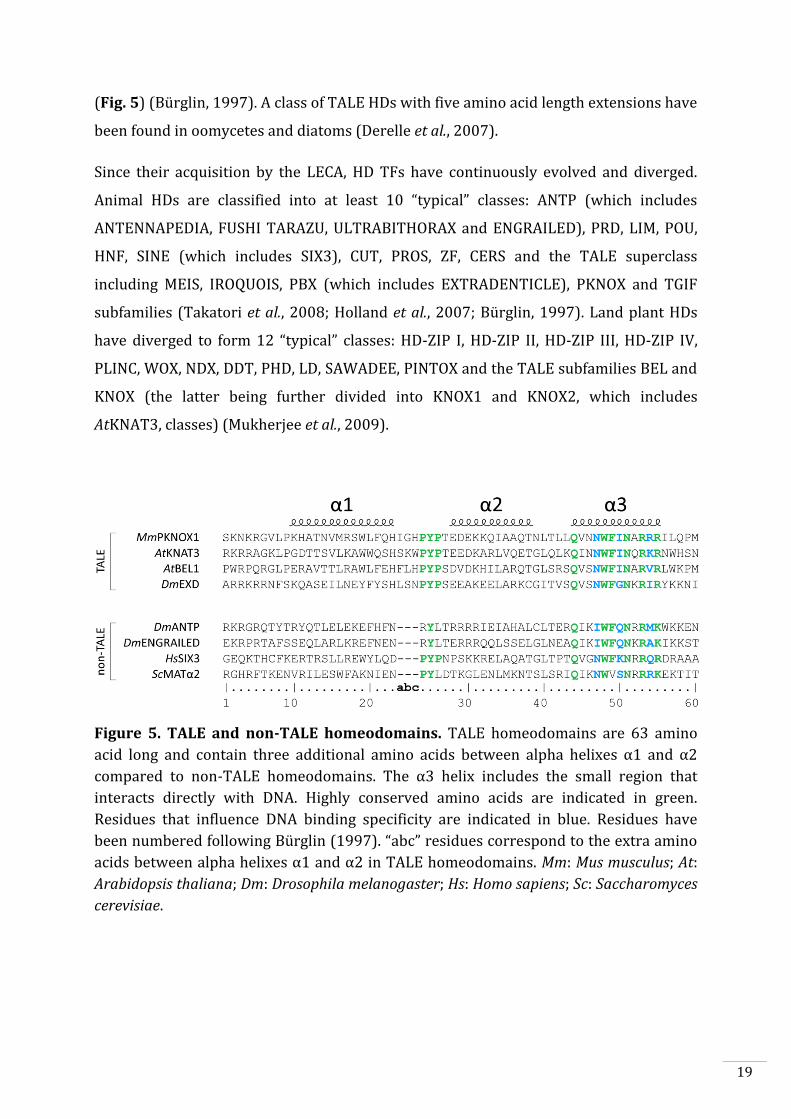
19
(Fig. 5) (Bürglin, 1997). A class of TALE HDs with five amino acid length extensions have
been found in oomycetes and diatoms (Derelle et al., 2007).
Since their acquisition by the LECA, HD TFs have continuously evolved and diverged.
Animal HDs are classified into at least 10 “typical” classes: ANTP (which includes
ANTENNAPEDIA, FUSHI TARAZU, ULTRABITHORAX and ENGRAILED), PRD, LIM, POU,
HNF, SINE (which includes SIX3), CUT, PROS, ZF, CERS and the TALE superclass
including MEIS, IROQUOIS, PBX (which includes EXTRADENTICLE), PKNOX and TGIF
subfamilies (Takatori et al., 2008; Holland et al., 2007; Bürglin, 1997). Land plant HDs
have diverged to form 12 “typical” classes: HD-ZIP I, HD-ZIP II, HD-ZIP III, HD-ZIP IV,
PLINC, WOX, NDX, DDT, PHD, LD, SAWADEE, PINTOX and the TALE subfamilies BEL and
KNOX (the latter being further divided into KNOX1 and KNOX2, which includes
AtKNAT3, classes) (Mukherjee et al., 2009).
Figure 5. TALE and non-TALE homeodomains. TALE homeodomains are 63 amino
acid long and contain three additional amino acids between alpha helixes α1 and α2
compared to non-TALE homeodomains. The α3 helix includes the small region that
interacts directly with DNA. Highly conserved amino acids are indicated in green.
Residues that influence DNA binding specificity are indicated in blue. Residues have
been numbered following Bürglin (1997). “abc” residues correspond to the extra amino
acids between alpha helixes α1 and α2 in TALE homeodomains. Mm: Mus musculus; At:
Arabidopsis thaliana; Dm: Drosophila melanogaster; Hs: Homo sapiens; Sc: Saccharomyces
cerevisiae.
20
MEIS HD TFs in animals and KNOX HD TFs in plants are related because they possess a
conserved MEINOX domain (Bürglin, 1997). Apicomplexans, Dinoflagellates,
Discicristates and some other Excavates have completely lost the HD genes families. In
contrast, both vertebrate and invertebrate animals and terrestrial plants have a
remarkable diversity of HD genes families with 110 homeobox genes in Arabidopsis
thaliana and 129 in human.
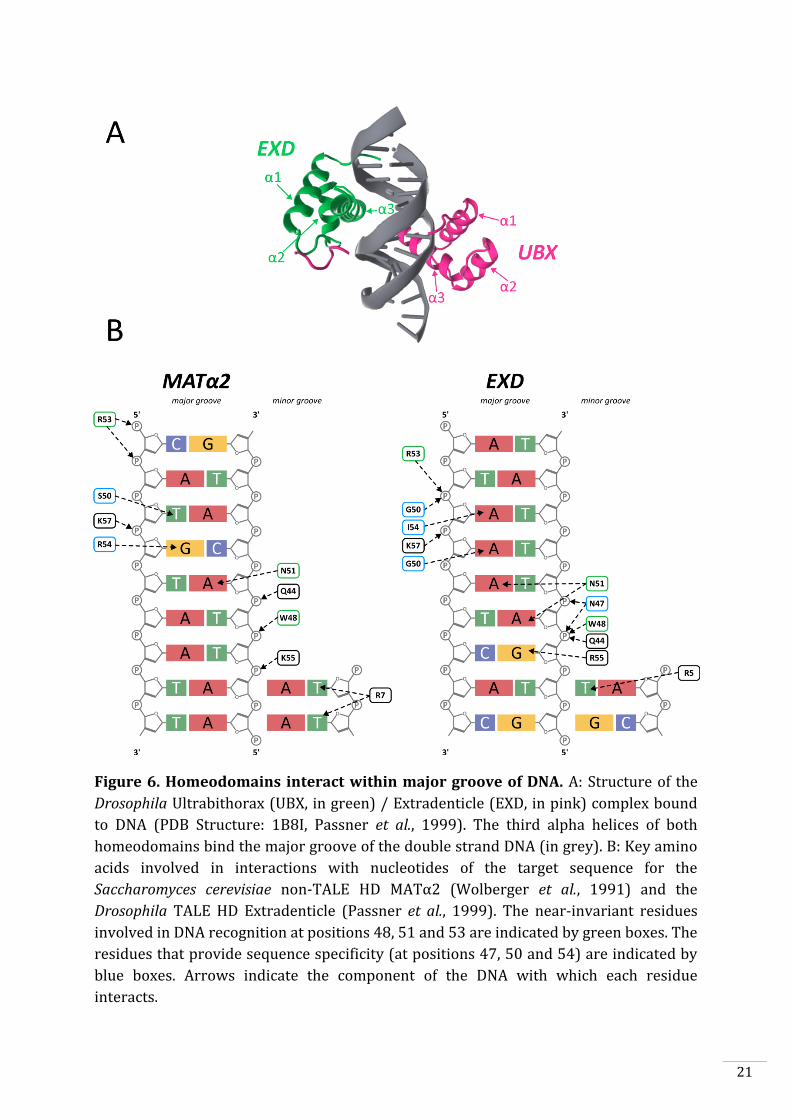
The Homeodomain is a DNA-Binding domain
The HD is involved in DNA recognition. Its DNA-binding modalities have been
extensively analysed with direct mutagenesis and X-ray crystallography. The HD, a 60
amino-acid long domain, is composed of three alpha helices that bind DNA by inserting
the third helix in the major groove making contacts with the sugar-phosphate backbone
and with the bases (Fig. 6). Bürglin proposed rules to number residues of a
homeodomain from one to sixty (Bürglin, 1997). In the consensus core motif WFXN, the
variable X residue is always set as residue 50. In the case of TALE-HD, the additional
residues between positions 23 and 24 are refer to letters a, b and c respectively to
comply with the previous rule (Fig. 5). Critical consensus residues involved in the
interaction with the DNA helix are Trp-48, Phe-49, Asn-51 and Arg-53 (Kissinger et al.,
1990; Wolberger et al., 1991). These residues are found in almost all homeodomains
across the eukaryote tree and are located in the closest section of the helix to the major
groove. The almost invariant residue Asn-51 is expected to establish hydrogen bonds
with an adenine (Fig. 6). Arg-53 makes hydrogen bonds with phosphate groups on the
opposite strand of the DNA. Trp-48 and Phe-49 form a hydrophobic core, stabilizing the
structure and keeping the helix 1 at a distance that avoids steric encumbrance at the
nearby the major groove. Several adjacent HD residues (at positions 47, 50 and 54) are
not conserved but provide sequence-specific interactions (Kissinger et al., 1990;
Wolberger et al., 1991). These residues are the main determinants for binding specificity
as different HD containing the same residues at these positions tend to bind similar
motifs (Berger et al., 2008).
21
Figure 6. Homeodomains interact within major groove of DNA. A: Structure of the
Drosophila Ultrabithorax (UBX, in green) / Extradenticle (EXD, in pink) complex bound
to DNA (PDB Structure: 1B8I, Passner et al., 1999). The third alpha helices of both
homeodomains bind the major groove of the double strand DNA (in grey). B: Key amino
acids involved in interactions with nucleotides of the target sequence for the
Saccharomyces cerevisiae non-TALE HD MATα2 (Wolberger et al., 1991) and the
Drosophila TALE HD Extradenticle (Passner et al., 1999). The near-invariant residues
involved in DNA recognition at positions 48, 51 and 53 are indicated by green boxes. The
residues that provide sequence specificity (at positions 47, 50 and 54) are indicated by
blue boxes. Arrows indicate the component of the DNA with which each residue
interacts.

22
23
SECTION III: Epigenetic reprogramming and the specification
of cell identity
Cell identity is determined by specific patterns of gene expression during the process of
development. Transcription factors play an important role in the implementation of
developmental programs but other regulatory processes also make key contributions. Of
particular importance are the modifications to chromatin states that are both necessary
for switching on and off specific genes during development and for maintaining
differentiated states within specific cell types. Moreover, these two processes interact
during the deployment of a developmental program. For example, certain transcription
factors, when interacting with DNA, lead to profound changes in the architecture of
chromatin. These changes result in chromosomal regions being made accessible to other
transcription factors that will trigger the expression of cell-specific genes. In Ectocarpus,
the sporophyte and gametophyte developmental programs are implemented in cells that
possess the same genomic content and the same ploidy (Bothwell et al, 2010),
underlining the importance of epigenetic reprogramming events in life cycle regulation.
In this section, we will provide an overview of the molecular mechanisms involved in
epigenetic reprogramming.
Epigenetics: a brief history and a definition
Since the discovery of chromosomes by Walter Flemming in 1879 and the work of
Thomas Morgan on sex-linked inheritance of genetic traits in 1911, there is no doubt
that chromosomes carry the genetic information transmitted through generations. At
the time that these studies were carried out, chromosomes were known to consist of
proteins and nucleic acids but the contribution of each was not understood until 1953
when Francis Crick and James Watson showed that nucleic acids carry the genetic
information (Watson and Crick, 1953). Nonetheless, epigenesis, i.e. the processes by
which organisms develop from a seed or an embryo to give adults, remained poorly
understood. The term “epigenetic”, which was introduced in 1942 by Conrad
Waddington (Waddington, 1942), refers to the developmental events by which an
organism is built, based on the instructions in the genetic material. Waddington
imagined an “epigenetic landscape” where a ball (depiction of a stem cell) rolling in a
well-defined valley (cell differentiation), moves towards its final cell fate. The modern
24
definition of “epigenetic” was proposed by Riggs and Porter in 1996 as “the mitotically
and/or meiotically stable changes in gene function that cannot be explained by changes
in the DNA sequence” (Riggs and Porter, 1996). This definition includes the idea that the
same genome can be transcribed differently, through the establishment of different
chromatin states, in a variety of cell types. However, this definition did not take into
account the chromatin dynamics that occur during interphase which allow cells to
reprogram portions of the genome to respond to environmental or developmental
signal. Chromatin states can be highly dynamic and are not always transmitted to the
next cell generation.
Imagined as a continuous, unidirectional restriction of cell fate by Waddington and as
stable changes by Riggs and Porter, the “epigenetic landscape” has in fact been shown to
be dynamic and reversible. An experiment, where human differentiated somatic
fibroblasts were fused with pluripotent embryonic stem cells, showed that the fused
cells were reprogrammed to a transcriptional state corresponding to that of the
pluripotent cells (Cowan et al., 2005). Similarly, plant cells have been shown to
dedifferentiate and redifferentiate following treatment with phytohormones (reviewed
by Fehér et al., 2003; Grafi, 2004).
Consequently, epigenetics can be defined as the study both of the stable changes in
chromatin states transmitted through generations and the chromatin regulation,
dynamics and reprogramming which affect developmental cell fates.
DNA Methylation
The first molecular evidence for epigenetic modifications was found in 1948 when
Hotchkiss discovered that cytosine residues could be methylated on the fifth carbon of
the pyrimidic cycle if they were followed by a guanine in the DNA sequence (Hotchkiss,
1948). The cytosine residues of these CpG dinucleotides are methylated by C5-Cytosine
DNA methyltransferases (DNMT). In mammals, DNMT3a and DNMT3b are responsible
of the de novo deposition of methyl groups, whereas DNMT1 is required for their
maintenance during chromosome replication (Chen and Li, 2006). Methylated CpG
dimers are bound by methyl-CpG-binding protein, which recruits repressor complexes
associated with histone deacetylase activities (Deaton and Bird, 2011). In addition, the
binding of transcription factors to promoters can be reduced or prevented following
25
methylation of the DNA in these regions (O’Malley et al., 2016; Yin et al., 2017). This
direct effect on transcription factor binding contributes to the repressive effect of
methylated C5-Cytosine on gene expression.
Recent studies have shown that DNA can also be methylated on adenine residues by N6-
A methyltransferases (N6-A MTases). N6-A MTases have been acquired several times
independently by eukaryotes through horizontal transfer from prokaryotes and are
therefore highly divergent (Lyer et al., 2015). Interestingly, this DNA modification is
found in various organisms including C. elegans, Drosophila and the green alga
Chlamydomonas reinhardtii (Greer et al., 2015; Zhang et al., 2015; Fu et al., 2015). C.
elegans and Chlamydomonas are often considered to be species with little or no DNA
methylation because, until recently, cytosine was the unique residue thought to be
methylated. In Chlamydomonas, methylated N6-Adenine is associated with the
transcription start sites of active genes (Fu et al., 2015), suggesting that this methylation
acts in a different manner to methylated C5-Cytosine and is rather associated with gene
up-regulation.
Nucleosome positioning and DNA compaction
In 1974, Ada and Donald Olins used electron microscopy to look at the structure of
chromatin (Olins and Olins, 1974). They discovered that chromatin is composed of
repeated spheroid units, called nucleosomes, which do not cover the DNA molecule
uniformly but are organised as “beads on a string” separated by spacer regions.
Characterisation of purified mononucleosomes showed that they consisted of DNA
sequences wrapped around an octamer of two copies each of the four core histones H2A,
H2B, H3 and H4 (Kornberg, 1974). The linker histone H1 participates in the formation of
higher order structures of compacted chromatin (Fyodorov et al., 2017). Compaction of
chromatin can affect accessibility to the DNA for many molecular complexes such as
transcription factors, RNA polymerases and enzymes involved in DNA recombination
and repair. To allow these machineries access to the DNA, chromatin must be locally
slackened. Several molecular mechanisms such as ATP-dependent nucleosome sliding
and eviction (also called chromatin remodeling), post-translational histone
modifications or replacement of histones with variant proteins are involved in this
process.
26
Core Histones and Variants
The core histones are assembled into four histone heterodimers, two H2A/H2B and two
H3/H4, to form the nucleosome core particle. The four core histones all have a
tridimensional structure with disordered N- and C-terminal tails and a central Histone-
Fold Domain (HFD). The HFD of each histone consists of three alpha-helices linked by
two loops (α1-L1-α2-L2-α3). In a heterodimer, the L1 loop of one histone interacts with
the L2 loop of the second histone. The α2 and α3 helices are positioned on the outside
face of the nucleosome and interact with the DNA through positive electrostatic charges.
To assemble the nucleosome, two H3/H4 heterodimers interact in a head to head
arrangement with the two H3 components. A H2A/H2B dimer interacts with half of the
H3/H4-H3/H4 tetramer via the HFDs of the H4 and the H2B (McGinty and Tan, 2014).
The role played by histone variants is not completely understood although it has been
observed that the replacement of canonical histones by variant histone proteins, within
a particular nucleosome, changes the properties of the nucleosome and the interactions
with DNA and with chromatin remodelers and modifiers (Talbert and Henikoff, 2017). It
is commonly accepted that the insertion of variants destabilizes the nucleosome
structure by modifying the amino-acid environment of interacting regions. Furthermore,
some specific variants can be associated with particular chromatin states. In plants, the
canonical H2A is associated with highly expressed genes bodies whereas the variant
H2A.Z is enriched around the nucleotide-depleted region of the transcription start sites.
Conversely, H2A.Z is located in the body of genes with low expression levels (Jiang and
Berger, 2017).
In centromeric chromatin, nucleosome composition alternates between canonical H3-
containing nucleosomes and CENP-A variant nucleosomes. CENP-A exhibits a highly
divergent N-terminal extension facilitating interaction with the kinetochore by
recruiting the inner kinetochore protein CENP-C (Goutte-Gattat et al., 2013).
Post-translational Modifications of Histones
Over the last decade, the detection of proteins modifications has progressed significantly
with the development of mass spectroscopy technologies of increasing sensitivity.
Histones can be modified by the enzymatic addition of a broad range of moieties as a
result of post-translational modifications (PTMs). These modifications include not only
27
methylation, acetylation and ubiquitination but also the recently discovered
propionylation, butyrylation, crotonylation, malonylation, succinylation, formylation,
citrullination, phosphorylation and hydroxylation (Huang et al., 2014). Most of these
modifications occur on lysines, serines and threonines, which are very abundant in
histones.
Histone acetylation occurs on lysine side chains. This modification is thought to
neutralize the positive charge of the amino acids (Strahl and Allis, 2000). As a result,
acetylated lysines do not contribute to the electrostatic interactions with the DNA
leading to decompaction of the chromatin. Consequently, acetylation is consistently
associated with upregulation of gene expression. Moreover, the acetylated lysine
residues may also be targets for methylation and acetylation of a lysine may therefore
prevent it from being methylated (Yang, 2016). As methylation is commonly associated
with repression of gene expression, this antagonistic action will also tend to favour
increased gene expression.
Most methylation sites are located in the side chains of lysine and arginine residues. In
contrast to the effect of acetylation, added methyl groups preserve the positive charge of
lysines and arginines. The lysine residues can be mono-, di, or trimethylated increasing
the complexity (Zhang and Reinberg, 2001). Methylation can be either involved in up- or
downregulation of gene expression depending of the lysine concerned and its genome
localization (Lawrence et al., 2016).
Side chain modifications can affect genome regulation by destabilising the nucleosome
assembly, notably if the modifications occur within the HFD (Bowman and Poirier,
2015). Modifications to the N-terminal extensions of histones are easily accessible and
therefore act often as recognition sites for molecular complexes involved in writing or
erasing of PTMs, or in remodelling of the chromatin compaction to higher states.
28
Writers, Erasers and Readers
Chromatin modification enzymes (or Modifiers) are proteins that add or remove
chemical groups to the side chains of histone amino acids. Writers, i.e. enzymes that
graft modifications onto histones, include acetyltransferases, methyltransferases,
kinases and ubiquitinases. Erasers, i.e. the enzymes that remove modifications, include
deacetylases, demethylases, phosphatases and deubiquitinases (Bannister and
Kouzarides, 2011).
Histone acetyltransferases (HAT) can be categorized in three families, the Gcn5-related
N-acetyltransferases (GNAT), the MYST family (named after the four first discovered
members MOZ, YBF2, SAS2 and TIP60) and the p300/CBP family (standing for CREB-
Binding Protein), together with a divergent fungal-specific member called RTT109 (Lee
and Workman, 2007). HATs catalyse the transfer of an acetyl group from acetyl-
coenzyme A to the ε-amino group of a lysine (Yang and Seto, 2008). Histone deacetylases
(HDAC) can be categorised in two families, the classical HDAC family (classes I, II and IV)
and the SIRT family (class III), also called sirtuins, which require NAD+ as cofactor (Yang
and Seto, 2008).
All known lysine methyltransferases catalyse the deposition of one or more methyl
group onto the ε-amino group of a lysine using S-adenosyl methionine as cofactor
(Cheng and Zhang, 2007). The histone lysine methyltransferases (HMT) fall into two
families, the SET family (named after the first three members identified in Drosophila:
Suppressor of variegation, Enhancer of zeste homolog2 (EZH2) and Trithorax) (Jones
and Gelbart, 1993; Tschiersch et al., 1994) and the seven β-strand lysine
methyltransferases (or 7βSMTs), of which only DOT1 (and its orthologs) is known to
have an activity on histones (Feng et al., 2002). Histone lysine demethylases (KDM) are
classified into two groups depending on their mechanism of action. Lysine specific
demethylases (LSD) catalyse the oxidation reaction using an FAD molecule, whereas
Jumonji-C domain-containing enzymes (JmjC) use α-ketoglutarate to catalyse the
oxidation reaction (Garcia et al., 2016).
Chromatin readers possess domains that can recognize specific histone modifications.
Bromodomains precisely target acetylated lysines, whereas chromodomains and tudor

29
domains bind to methylated lysines and arginines respectively. Reader domains can be
present in chromatin writers, erasers and remodelers.
The signalling networks that involve histone modifications, writers and erasers have not
yet been globally understood. These networks are highly complex due to the large
number of transcription factors and small and long non-coding RNA components
involved and because of the additional control mediated by DNA methylation and the
spatial regulation of chromatin.

30
31
SECTION IV: Using Ectocarpus to explore development and life
cycle regulation
Characterisation of the molecular processes that regulate the life cycle can provide
important insights into the regulations of key developmental processes. In particular,
uncoupling development programs from the life cycle stage with which they are
associated can provide essential information about the underlying molecular
mechanisms. The question of regulation of life cycle progression is difficult to address in
classical model organisms such as Drosophila, mouse or Arabidopsis either because they
only have one life cycle generation or because they have two generations but one is
reduced and difficult to access. In both cases, it is very difficult, or even impossible, to
identify mutations that cause switching between life cycle generations and this type of
mutant can be extremely useful for the dissection of life cycle regulation. This type of
mutant can however be identified in multicellular organisms with haploid-diploid life
cycles consisting of two developmentally independent generations.
Ectocarpus, an emerging model for evolutionary developmental biology
The brown algae, taxonomically defined as the Phaeophyceae, are photosynthetic
organisms with an independent evolutionary history to those of the green and red
lineages, the fungi and the animals. Stramenopiles, the group to which brown algae
belong, diverged from other well-studied multicellular lineages more than a billion years
ago (Fig. 1). Brown algae are one of the few eukaryotic lineages that have evolved
complex multicellularity. Analysis of their life cycles, sexual reproduction,
developmental processes and gene regulation mechanisms are of particular interest as
their evolutionary distance from other lineages means that they exhibit a large number
of novel features. On the other hand, when mechanisms are conserved compared with
other major lineages this can provide glimpses into the early evolutionary story of the
eukaryotes.
Ectocarpus was the first brown alga to be sequenced (Cock et al., 2010) and has since
emerged as a genetic model. Ectocarpus is a small filamentous alga which can reach 30
cm in length in the wild but can grow easily and becomes fertile under laboratory
conditions when less than 2 cm long. Ectocarpus species are distributed in temperate
32
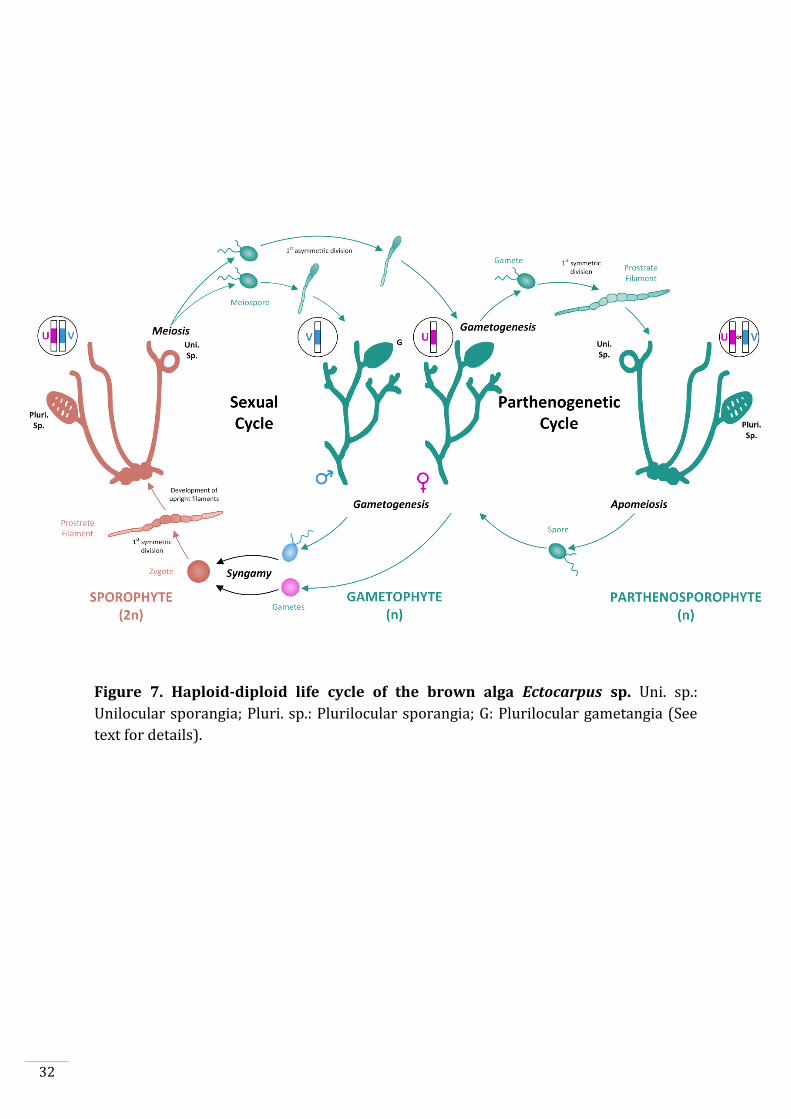
Figure 7. Haploid-diploid life cycle of the brown alga Ectocarpus sp. Uni. sp.:
Unilocular sporangia; Pluri. sp.: Plurilocular sporangia; G: Plurilocular gametangia (See
text for details).
33
regions of both hemispheres but are not found in tropical seas nor in the Antarctic
region. These species grow on rocks, pebbles and other abiotic substrates and as
epiphytes on marine macrophytes such as brown, red or green algae and on seagrass
(Charrier et al., 2008).
Ectocarpus has a haploid-diploid life cycle alternating between a haploid gametophyte
and a diploid sporophyte (Fig. 7). Both generations are multicellular and develop from
free-swimming cells. The sporophyte develops mitotically from a zygote to produce
prostrate (basal) filaments which are attached to the substrate. Branching upright
filaments grow from the basal filaments and develop two types of spore-containing
reproductive structures (plurilocular and unilocular sporangia). Plurilocular sporangia
produce spores via mitosis, which, after germination, give rise to new sporophytes.
Meiosis occurs in unilocular sporangia resulting in the release of haploid meiospores.
These meiospores develop into either male or female gametophytes depending on which
sex chromosome (U or V) they inherited during meiosis. Gametophytes carrying the U
sex chromosome are female, whereas those with a V sex chromosome are male (Ahmed
et al., 2014). Plurilocular gametangia, i.e. the structures that produce gametes, develop
on mature gametophytes. Swimming (flagellated) male and female gametes are released
by the gametophytes and fuse to give rise to a new diploid zygote, restarting the sexual
life cycle. Alternatively, gametes that fail to fuse with a gamete of the opposite sex may
develop spontaneously into a haploid sporophyte through parthenogenesis. Such
haploid sporophytes are called partheno-sporophytes and are morphologically
indistinguishable from diploid sporophytes.
Currently, the tools available for Ectocarpus as a model system include a well-annotated
genome (Cock et al., 2010; Cormier et al., 2017), transcriptomic data based on
microarrays (Dittami et al., 2009) and RNA-seq technologies (Ahmed et al., 2014;
Luthringer et al., 2015; Lipinska et al., 2015; Macaisne et al., 2017), a catalog of small
and long non-coding RNAs (Tarver et al., 2015; Cormier et al., 2017), genetic maps based
on classic genetic markers (Heesch et al., 2010) and RAD sequencing (Avia et al., 2017)
and a collection of mutants generated with ultraviolet light (Godfroy et al., 2015). Some
reverse and forward genetic tools are still under development such as TILLING
methodology, RNA interference (Macaisne et al., 2017) and genetic transformation.
34
Genetic dissection of life-cycle progression and related developmental processes in
Ectocarpus
Functional analysis of mutants affected in life-cycle progression, development or
morphology, provide a tremendous amount of information about the molecular
mechanisms underlying an organism’s biology. The recent identification of the genes
affected in Ectocarpus mutants has demonstrated the feasibility of using this emerging
model organism to study developmental pathways in a distant lineage relative to
animals and land plants.
Several mutants, affected in development, have been already characterized in
Ectocarpus. The immediate upright (imm) mutant was the first to be described and
characterized (Peters et al., 2008; Macaisne et al., 2017). Contrary to the wild-type, the
imm mutant sporophyte directly produces functional upright filaments from the zygote
and therefore shunts the deployment of the basal system, replacing the latter with a
small rhizoid. Transcriptomic data showed clearly that the cell identity of the imm
mutant is closely related to that of the wild-type upright filament. The gametophyte
generation is not affected in terms of morphogenesis indicating that IMMEDIATE
UPRIGHT is involved in a generation-specific process and therefore presumably acts
downstream of the master regulators that implement the sporophyte developmental
program. Interestingly, the IMMEDIATE UPRIGHT gene is part of a large gene family in
Ectocarpus and other brown algae. This family includes a viral gene EsV-1-7. The IMM
protein has a repeated motif with four conserved cysteines and histidines evoking
potentially a new class of zinc-fingers. Outside the brown algae, IMM-like proteins are
found sporadically in opisthokonts, archaeplastids, oomycetes and in some viral
genomes, suggesting possible virus-mediated horizontal transfer and maybe a viral
origin of this gene family in brown algae.
A second mutant, called distag (dis) has lost the ability to attach to the substrate. DISTAG
encodes a Tubulin-specific chaperone D (TBCCd1) protein and the dis mutation affects
the formation of the Golgi and the cytoskeleton and the positioning of the nucleus in
initial cells leading to loss of the basal system during development (Godfroy et al., 2017).
Other Ectocarpus mutants are affected in life cycle transitions. The first mutant of this
type to be identified was called ouroboros (oro). This mutant exhibits conversion of the
35
sporophyte into a functional gametophyte (Coelho et al., 2011). Parthenotes derived
from oro gametes develop as partheno-gametophytes instead of partheno-sporophytes.
Alok Arun showed during his thesis that the oro mutation corresponds to an 11 bp
deletion in the gene with the LocusID Ec-14_005920 (Arun, 2012). This gene is predicted
to encode a TALE HD transcription factor. Three additional mutants exhibit a similar
phenotype (parthenotes from these mutants also develop into partheno-gametophytes).
None of these three lines are mutated in the ORO gene. However, all three carry
mutations in a second gene with the LocusID Ec-27_006660, which also encodes a TALE
HD transcription factor that has been called SAMSARA (SAM).
The oro and sam mutations generate phenotypes that are comparable to those observed
in Physcomitrella when the TALE-HD-encoding genes PpMKN1, PpMKN6 and PpBELL1
are modified or in Chlamydomonas when GSP1 and GSM1 are modified (see SECTION II:
Genetic basis of life-cycle progression). In all these cases, mutations cause the
reiteration of the program associated with the haploid phase during the diploid phase
(or after parthenogenesis).
36
Objectives
The general aim of this PhD thesis was to study the genetic and epigenetic regulatory
processes involved in the transition between the gametophyte and the sporophyte
generations in Ectocarpus sp. The work focused on understanding the role of two TALE
homeodomain transcription factors called OUROBOROS (ORO) and SAMSARA (SAM),
which appear to be master regulators of this transition. The thesis also involved a study
of chromatin dynamics during the life cycle of Ectocarpus. More specifically the
objectives of this thesis were:
1. To determine whether ORO and SAM are able of forming a heterodimer
(Chapter 2). This analysis was incorporated in a manuscript which is in the
process of being submitted for publication. The study also included
phenotypic characterisation, identification of the two genes, comparative
transcriptome analysis and expression analysis of ORO and SAM during life
cycle.
2. To identify DNA binding sites of ORO and SAM using in vitro methods such as
protein binding microarrays and DAP-seq and in vivo methods such as ChIP-
nexus (Chapter 3) and to identify proteins that interact with the transcription
factors using yeast two-hybrid screening (Chapter 3).
3. To set up a chromatin immunoprecipitation (ChIP) protocol to analyse
genome-wide bind of transcription factors and genome-wide distributions of
specific histone modifications (Chapter 4).
4. To analyse the genome-wide distribution of six histone modifications
(H3K4me3, H3K9ac, H3K27ac, H3K9me2, H3K9me3, H3K27me2) during both
the gametophyte and sporophyte generations to investigate in-depth the
chromatin changes that occur during the life cycle (Chapter 5).

37

38
39
Chapter 2
Characterization of brown alga life cycle mutants
indicates deep evolutionary origins of pathways
controlling deployment of the sporophyte program
The Eukaryote sexual cycle alternates between two major processes: meiosis and syngamy.
Meiosis takes place during the diploid generation and allows the chromosome number to be
reduced by half, producing haploid cells. Syngamy, on the other hand, restores the initial number
of chromosomes by fusion of two haploid gametes to form a zygote. Multicellular development
can occur during only the diploid phase (diplontic life cycle), during only the haploid phase
(haplontic life cycle) or in both phases (haplo-diplontic life cycle). In all these cases, the
developmental pathways leading to the development of the uni- or multicellular organism must
be initiated at the correct stage of the life cycle. Implementation of these pathways at the wrong
stage would have dramatic consequences for the organism. This chapter presents the
characterisation of Ectocarpus strains carrying mutations in two genes, OUROBOROS (or ORO)
and SAMSARA (or SAM), that encode Three Amino-Acid Length Extension homeodomain
transcription factors (TALE HD TFs), called OUROBOROS (or ORO) and SAMSARA (or SAM). These
two mutations induce marked modifications of life-cycle progression, causing initiation of the
gametophyte program at stages of the life cycle where the sporophyte program should be
expressed. The chapter has been prepared in the form of a manuscript that will be submitted for
publication shortly. My contribution to this work focused on demonstrating heterodimerization
between the ORO and SAM proteins.

40
41
Characterisation of brown alga life cycle mutants indicates deep
evolutionary origins of pathways controlling deployment of the
sporophyte program
Alok Arun1,†,a, Susana M. Coelho1,a, Akira F. Peters2, Simon Bourdareau1, Laurent
Peres1, Delphine Scornet1, Martina Strittmatter1,‡, Agnieszka P. Lipinska1, Haiqin
Yao1, Olivier Godfroy1, Gabriel J. Montecinos1, Komlan Avia1, Nicolas Macaisne1,§,
Christelle Troadec3, Abdelhafid Bendahmane3, J. Mark Cock1,*
1CNRS, Sorbonne Université, UPMC University Paris 06, Algal Genetics Group, UMR 8227,
Integrative Biology of Marine Models, Station Biologique de Roscoff, CS 90074, F-29688, Roscoff,
France, 2Bezhin Rosko, 29250, Santec, France, 3Institut National de la Recherche Agronomique
(INRA), Institute of Plant Sciences Paris-Saclay (IPS2), CNRS, Université Paris-Sud, Bâtiment 630,
91405,Orsay, France aJoint first author *Author for correspondence ([email protected])
†Current address: Institute of Sustainable Biotechnology, Department of Science and Technology,
Inter American University of Puerto Rico, Barranquitas Campus, PO Box 517, 00794, Puerto Rico,
USA ‡Current address: CNRS, Sorbonne Université, UPMC University Paris 06, UMR 7144, Adaptation
and Diversity in the Marine Environment, Station Biologique de Roscoff, CS 90074, F-29688,
Roscoff, France §Current address: Magee-Womens Research Institute, University of Pittsburgh School of
Medicine, Pittsburgh, Pennsylvania 15213, USA
Short title: Ectocarpus life cycle regulation
Key words: Brown algae; Ectocarpus; TALE homeodomain transcription factor; life cycle
Abstract
Three amino acid loop extension homeodomain transcription factors (TALE HD TFs) act
as life cycle regulators in green algae and land plants. In the moss Physcomitrella patens,
these regulators are required for the deployment of the diploid sporophyte generation.
We show here that mutations in either of two TALE HD TF genes, OUROBOROS or
SAMSARA, in the brown alga Ectocarpus result in conversion of the sporophyte
generation into a gametophyte. The OUROBOROS and SAMSARA proteins interact in
vitro, suggesting that they act as a heterodimer in a similar manner to TALE HD TF life
cycle regulators in the green lineage. Taken together these observations indicate that
TALE-HD-TF-based life cycle regulation systems have an extremely ancient origin,
dating back to the crown radiation of the eukaryotes, and that these systems have been
independently adapted to regulate life-cycle-related developmental programs in
multicellular lineages of at least two different eukaryotic supergroups, the
Archaeplastida and the Chromalveolata.
42
INTRODUCTION
Meiosis arose early in eukaryotic evolution and most extant eukaryotes have a sexual
life cycle that involves an alternation between haploid and diploid phases (Speijer et al.,
2015). In these cycles, meiotic divisions halve the number of chromosomes leading to
the haploid state whereas syngamy (gamete fusion) brings together two sets of
chromosomes, restoring diploidy (Coelho et al., 2007). Many cellular and developmental
processes need to be precisely coordinated with life cycle progression. For example, in
animals with sexual life cycles, embryogenesis is specifically initiated in the cell that
results from syngamy, the zygote. For multicellular organisms with haploid-diploid life
cycles, coordination of life cycle and development is further complicated because two
different developmental programs need to be deployed appropriately at different time
points within a single life cycle. The haploid-diploid life cycles of many plants and
macroalgae, for example, involve the development of a gametophyte generation during
the haploid phase of the cycle and the development of a sporophyte generation during
the diploid phase (Cock et al., 2013).
Genetic analyses have implicated homeodomain transcription factors (HD TFs) in the
regulation of life cycle progression in the green lineage (green algae and land plants;
(Horst et al., 2016; Lee et al., 2008; Sakakibara et al., 2013) and in fungi (Hull et al.,
2005), and recent work indicates a similar role for homeodomain-like transcription
factors in slime molds (Hedgethorne et al., 2017). The plus and minus gametes of the
unicellular green alga Chlamydomonas each express a HD TF of the three amino acid
loop extension (TALE) family: Gsm1 and Gsp1, respectively (Lee et al., 2008). When two
gametes fuse to form a zygote, these two proteins heterodimerise and move to the
nucleus, where they orchestrate the diploid phase of the life cycle. Gsm1 and Gsp1
correspond to the knotted-like homeobox (KNOX) and BEL TALE HD TF classes in land
plants, respectively, and members of these classes have also been shown to play a role in
life cycle regulation in Physcomitrella patens. In this moss, deletion of two KNOX genes,
MKN1 and MKN6, blocks initiation of the sporophyte program leading to conversion of
this generation of the life cycle into a diploid gametophyte (Sakakibara et al., 2013).
Similarly, the moss BEL class gene BELL1 is required for the induction of the sporophyte
developmental program and ectopic expression of BELL1 in gametophytic tissues
induces the development of apogametic sporophytes during the gametophyte
generation of the life cycle (Horst et al., 2016). P. patens KNOX and BEL proteins have
been shown to form heterodimers (Horst et al., 2016) and it is therefore possible that
life cycle regulation also involves KNOX/BEL heterodimers in this species.
In fungi, pairs of HD TFs act in a similar manner to those of the green lineage, forming
heterodimers to direct the deployment of diploid-phase processes such as meiosis and
sporulation (Gillissen et al., 1992; Goutte and Johnson, 1988; Hull et al., 2005; Kües et al.,
1992). In both Chlamydomonas and in the fungal species where homeodomain
expression and localisation has been studied, the two HD TFs that constitute a dimer
pair have been shown to be synthesised in gametes of opposite mating type so that
43
heterodimerisation can only occur after gamete fusion (Hull et al., 2005; Lee et al., 2008;
Urban et al., 1996).
Induction of zygotic functions in Dictyostelium discoideum involves genetic interaction
between mating type loci suggesting that heterodimerisation (in this case of
homeodomain-like mating type proteins) may also play a role in initiating the diploid
program in slime molds (Hedgethorne et al., 2017).
Chromatin modification also appears to be involved in the regulation of the gametophyte
to sporophyte transition. Mutations in the P. patens Polycomb Repressive Complex 2
(PRC2) complex genes PpFIE and PpCLF lead to the production of sporophyte-like bodies
on the side branches of gametophytic protonema filaments (Mosquna et al., 2009; Okano
et al., 2009). Arabidopsis mutants affected in PRC2 function also produce sporophyte-
like structures (e.g. Guitton and Berger, 2005). The recent demonstration that PpCLF is
required for tri-methylation of lysine 27 of Histone H3 proteins at the BELL1 locus
(Pereman et al., 2016) suggests that PRC2 acts, at least in part, by directly repressing
TALE HD TF life cycle regulatory genes.
The filamentous alga Ectocarpus has emerged as a model system for the brown algae
(Cock et al., 2015; Coelho et al., 2012a). This alga has a haploid-diploid life cycle that
involves alternation between multicellular sporophyte and gametophyte generations. A
mutation at the OUROBOROS (ORO) locus has been shown to cause the sporophyte
generation to be converted into a fully functional (gamete-producing) gametophyte
(Coelho et al., 2011; Fig. 1A). This mutation therefore induces a phenotype that is
essentially identical to that observed with the P. patens mkn1 mkn6 double mutant, but
in an organism from a distinct eukaryotic supergroup (the stramenopiles), which
diverged from the green lineage over a billion years ago (Eme et al., 2014).
Here we identify mutations at a second locus, SAMSARA, that also result in conversion of
the sporophyte generation into a gametophyte. Interestingly, both OUROBOROS and
SAMSARA encode TALE HD TFs and the two proteins heterodimerise in vitro. These
observations suggest that TALE-HD-TF-based life cycle regulatory systems have deep
evolutionary origins and have been adapted in at least two eukaryotic supergroups to
coordinate the implementation of developmental programs in multicellular organisms
with life cycle progression.
RESULTS
The OUROBOROS gene encodes a TALE HD TF
Ectocarpus lines carrying the oro mutation are unable to deploy the sporophyte
developmental program and develop as gametophytes (Fig. 1B). This mutation has been
shown to behave as a single-locus, recessive, Mendelian factor (Coelho et al., 2011). To
identify the mutated locus, a family of 2,000 siblings segregating the oro mutation was
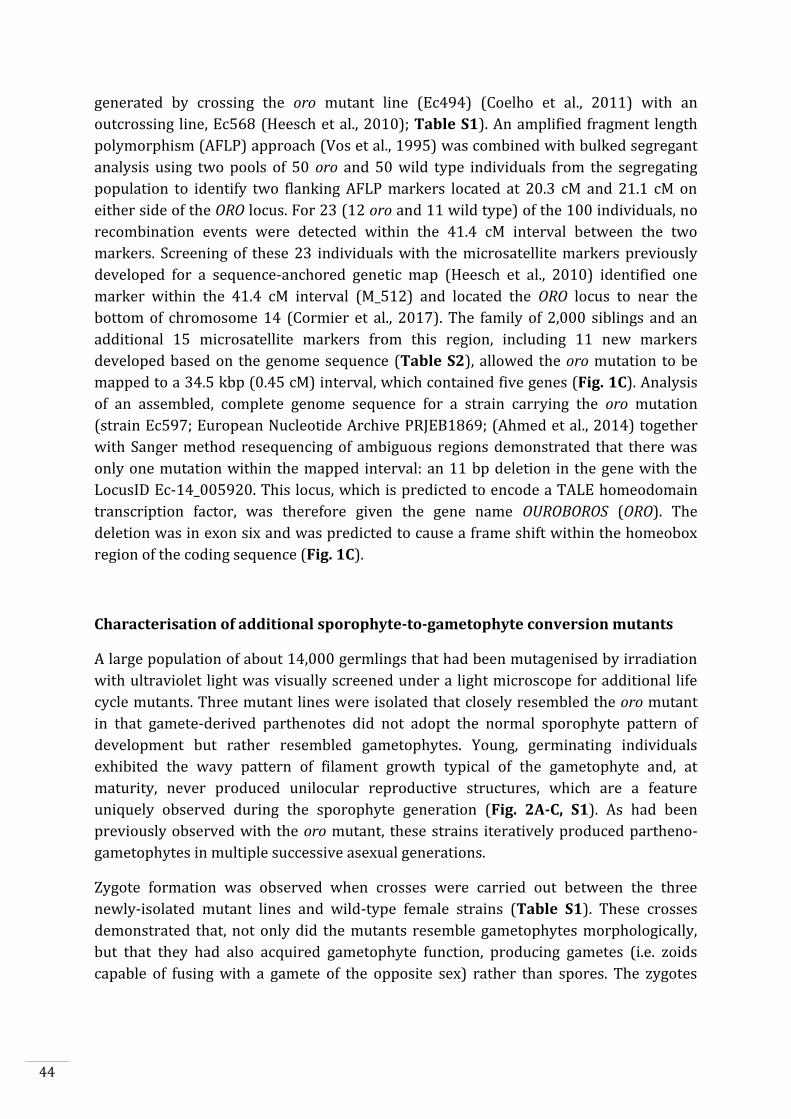
44
generated by crossing the oro mutant line (Ec494) (Coelho et al., 2011) with an
outcrossing line, Ec568 (Heesch et al., 2010); Table S1). An amplified fragment length
polymorphism (AFLP) approach (Vos et al., 1995) was combined with bulked segregant
analysis using two pools of 50 oro and 50 wild type individuals from the segregating
population to identify two flanking AFLP markers located at 20.3 cM and 21.1 cM on
either side of the ORO locus. For 23 (12 oro and 11 wild type) of the 100 individuals, no
recombination events were detected within the 41.4 cM interval between the two
markers. Screening of these 23 individuals with the microsatellite markers previously
developed for a sequence-anchored genetic map (Heesch et al., 2010) identified one
marker within the 41.4 cM interval (M_512) and located the ORO locus to near the
bottom of chromosome 14 (Cormier et al., 2017). The family of 2,000 siblings and an
additional 15 microsatellite markers from this region, including 11 new markers
developed based on the genome sequence (Table S2), allowed the oro mutation to be
mapped to a 34.5 kbp (0.45 cM) interval, which contained five genes (Fig. 1C). Analysis
of an assembled, complete genome sequence for a strain carrying the oro mutation
(strain Ec597; European Nucleotide Archive PRJEB1869; (Ahmed et al., 2014) together
with Sanger method resequencing of ambiguous regions demonstrated that there was
only one mutation within the mapped interval: an 11 bp deletion in the gene with the
LocusID Ec-14_005920. This locus, which is predicted to encode a TALE homeodomain
transcription factor, was therefore given the gene name OUROBOROS (ORO). The
deletion was in exon six and was predicted to cause a frame shift within the homeobox
region of the coding sequence (Fig. 1C).
Characterisation of additional sporophyte-to-gametophyte conversion mutants
A large population of about 14,000 germlings that had been mutagenised by irradiation
with ultraviolet light was visually screened under a light microscope for additional life
cycle mutants. Three mutant lines were isolated that closely resembled the oro mutant
in that gamete-derived parthenotes did not adopt the normal sporophyte pattern of
development but rather resembled gametophytes. Young, germinating individuals
exhibited the wavy pattern of filament growth typical of the gametophyte and, at
maturity, never produced unilocular reproductive structures, which are a feature
uniquely observed during the sporophyte generation (Fig. 2A-C, S1). As had been
previously observed with the oro mutant, these strains iteratively produced partheno-
gametophytes in multiple successive asexual generations.
Zygote formation was observed when crosses were carried out between the three
newly-isolated mutant lines and wild-type female strains (Table S1). These crosses
demonstrated that, not only did the mutants resemble gametophytes morphologically,
but that they had also acquired gametophyte function, producing gametes (i.e. zoids
capable of fusing with a gamete of the opposite sex) rather than spores. The zygotes
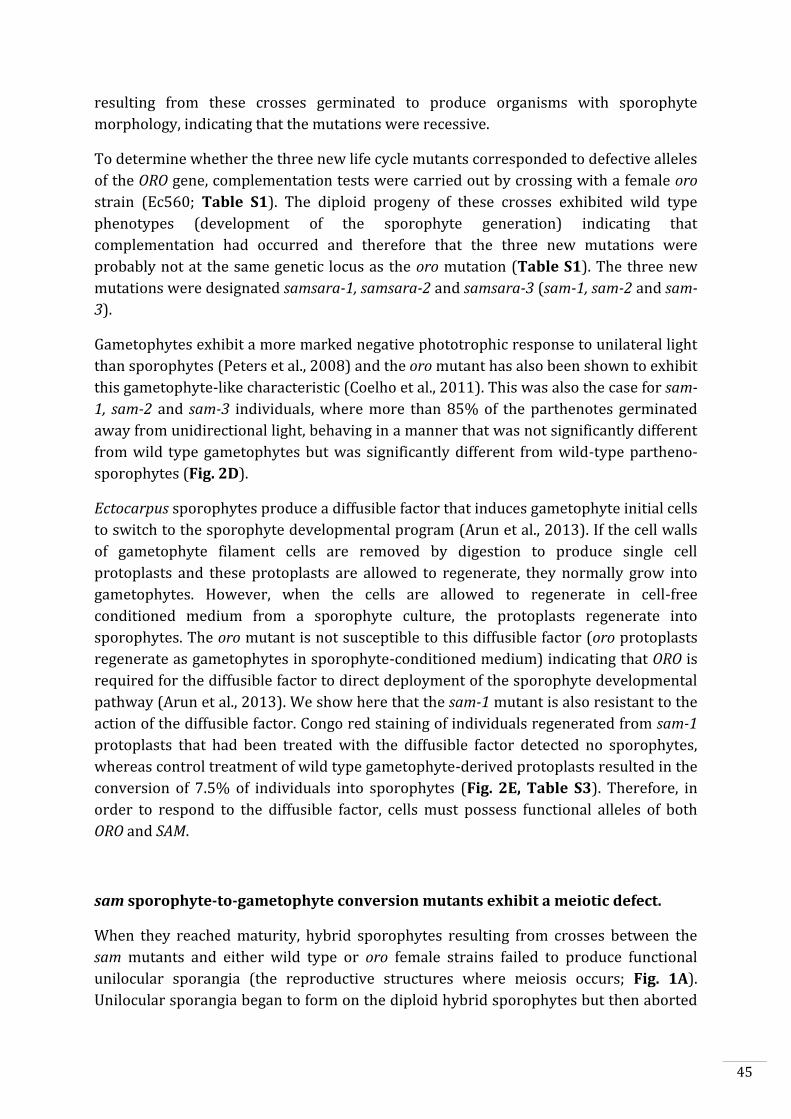
45
resulting from these crosses germinated to produce organisms with sporophyte
morphology, indicating that the mutations were recessive.
To determine whether the three new life cycle mutants corresponded to defective alleles
of the ORO gene, complementation tests were carried out by crossing with a female oro
strain (Ec560; Table S1). The diploid progeny of these crosses exhibited wild type
phenotypes (development of the sporophyte generation) indicating that
complementation had occurred and therefore that the three new mutations were
probably not at the same genetic locus as the oro mutation (Table S1). The three new
mutations were designated samsara-1, samsara-2 and samsara-3 (sam-1, sam-2 and sam-
3).
Gametophytes exhibit a more marked negative phototrophic response to unilateral light
than sporophytes (Peters et al., 2008) and the oro mutant has also been shown to exhibit
this gametophyte-like characteristic (Coelho et al., 2011). This was also the case for sam-
1, sam-2 and sam-3 individuals, where more than 85% of the parthenotes germinated
away from unidirectional light, behaving in a manner that was not significantly different
from wild type gametophytes but was significantly different from wild-type partheno-
sporophytes (Fig. 2D).
Ectocarpus sporophytes produce a diffusible factor that induces gametophyte initial cells
to switch to the sporophyte developmental program (Arun et al., 2013). If the cell walls
of gametophyte filament cells are removed by digestion to produce single cell
protoplasts and these protoplasts are allowed to regenerate, they normally grow into
gametophytes. However, when the cells are allowed to regenerate in cell-free
conditioned medium from a sporophyte culture, the protoplasts regenerate into
sporophytes. The oro mutant is not susceptible to this diffusible factor (oro protoplasts
regenerate as gametophytes in sporophyte-conditioned medium) indicating that ORO is
required for the diffusible factor to direct deployment of the sporophyte developmental
pathway (Arun et al., 2013). We show here that the sam-1 mutant is also resistant to the
action of the diffusible factor. Congo red staining of individuals regenerated from sam-1
protoplasts that had been treated with the diffusible factor detected no sporophytes,
whereas control treatment of wild type gametophyte-derived protoplasts resulted in the
conversion of 7.5% of individuals into sporophytes (Fig. 2E, Table S3). Therefore, in
order to respond to the diffusible factor, cells must possess functional alleles of both
ORO and SAM.
sam sporophyte-to-gametophyte conversion mutants exhibit a meiotic defect.
When they reached maturity, hybrid sporophytes resulting from crosses between the
sam mutants and either wild type or oro female strains failed to produce functional
unilocular sporangia (the reproductive structures where meiosis occurs; Fig. 1A).
Unilocular sporangia began to form on the diploid hybrid sporophytes but then aborted
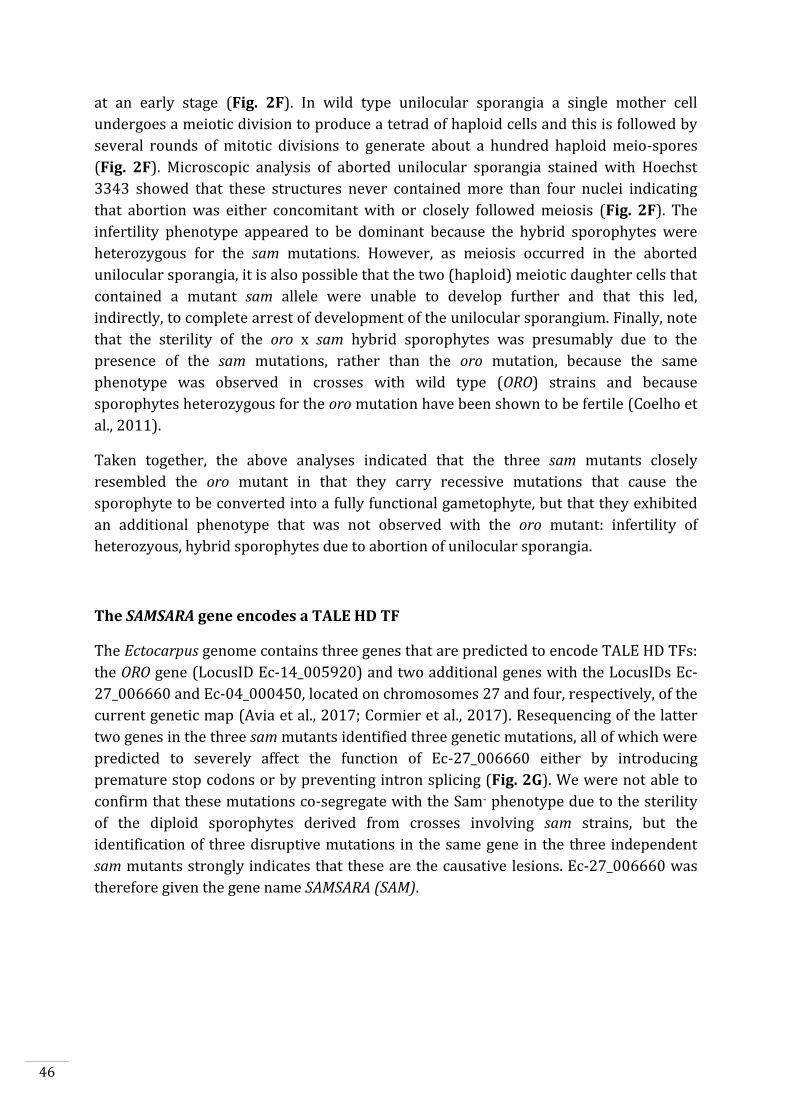
46
at an early stage (Fig. 2F). In wild type unilocular sporangia a single mother cell
undergoes a meiotic division to produce a tetrad of haploid cells and this is followed by
several rounds of mitotic divisions to generate about a hundred haploid meio-spores
(Fig. 2F). Microscopic analysis of aborted unilocular sporangia stained with Hoechst
3343 showed that these structures never contained more than four nuclei indicating
that abortion was either concomitant with or closely followed meiosis (Fig. 2F). The
infertility phenotype appeared to be dominant because the hybrid sporophytes were
heterozygous for the sam mutations. However, as meiosis occurred in the aborted
unilocular sporangia, it is also possible that the two (haploid) meiotic daughter cells that
contained a mutant sam allele were unable to develop further and that this led,
indirectly, to complete arrest of development of the unilocular sporangium. Finally, note
that the sterility of the oro x sam hybrid sporophytes was presumably due to the
presence of the sam mutations, rather than the oro mutation, because the same
phenotype was observed in crosses with wild type (ORO) strains and because
sporophytes heterozygous for the oro mutation have been shown to be fertile (Coelho et
al., 2011).
Taken together, the above analyses indicated that the three sam mutants closely
resembled the oro mutant in that they carry recessive mutations that cause the
sporophyte to be converted into a fully functional gametophyte, but that they exhibited
an additional phenotype that was not observed with the oro mutant: infertility of
heterozyous, hybrid sporophytes due to abortion of unilocular sporangia.
The SAMSARA gene encodes a TALE HD TF
The Ectocarpus genome contains three genes that are predicted to encode TALE HD TFs:
the ORO gene (LocusID Ec-14_005920) and two additional genes with the LocusIDs Ec-
27_006660 and Ec-04_000450, located on chromosomes 27 and four, respectively, of the
current genetic map (Avia et al., 2017; Cormier et al., 2017). Resequencing of the latter
two genes in the three sam mutants identified three genetic mutations, all of which were
predicted to severely affect the function of Ec-27_006660 either by introducing
premature stop codons or by preventing intron splicing (Fig. 2G). We were not able to
confirm that these mutations co-segregate with the Sam- phenotype due to the sterility
of the diploid sporophytes derived from crosses involving sam strains, but the
identification of three disruptive mutations in the same gene in the three independent
sam mutants strongly indicates that these are the causative lesions. Ec-27_006660 was
therefore given the gene name SAMSARA (SAM).
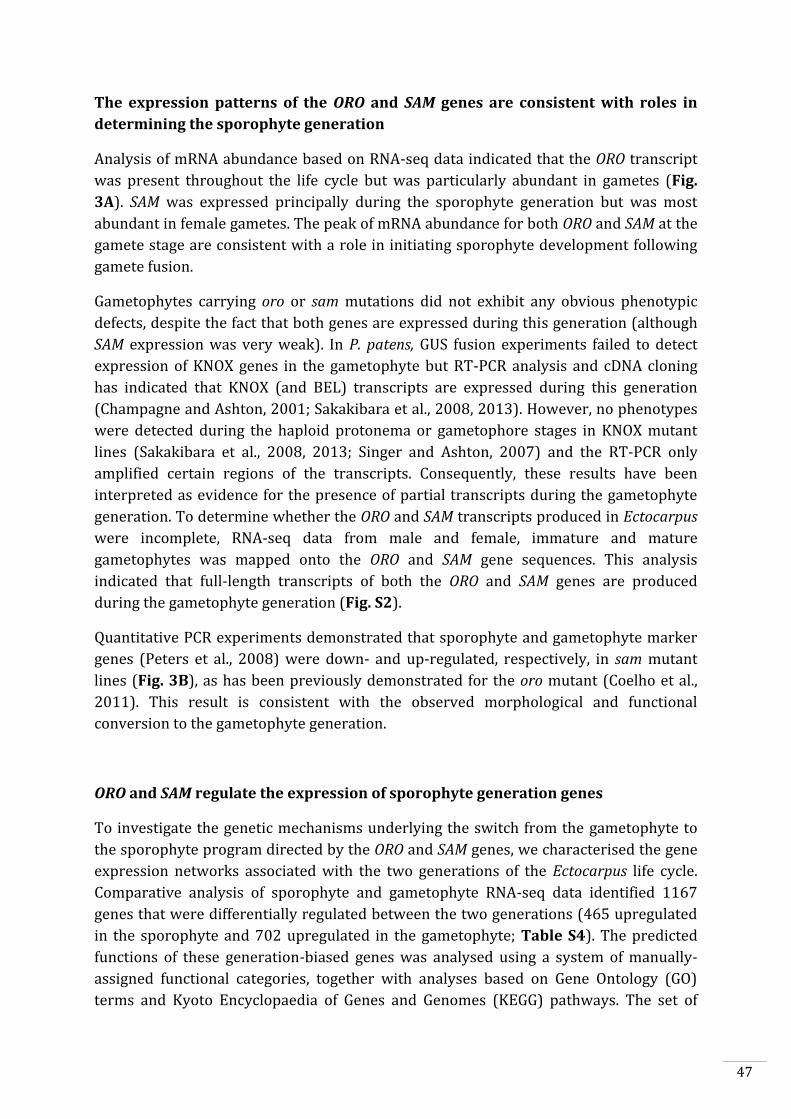
47
The expression patterns of the ORO and SAM genes are consistent with roles in
determining the sporophyte generation
Analysis of mRNA abundance based on RNA-seq data indicated that the ORO transcript
was present throughout the life cycle but was particularly abundant in gametes (Fig.
3A). SAM was expressed principally during the sporophyte generation but was most
abundant in female gametes. The peak of mRNA abundance for both ORO and SAM at the
gamete stage are consistent with a role in initiating sporophyte development following
gamete fusion.
Gametophytes carrying oro or sam mutations did not exhibit any obvious phenotypic
defects, despite the fact that both genes are expressed during this generation (although
SAM expression was very weak). In P. patens, GUS fusion experiments failed to detect
expression of KNOX genes in the gametophyte but RT-PCR analysis and cDNA cloning
has indicated that KNOX (and BEL) transcripts are expressed during this generation
(Champagne and Ashton, 2001; Sakakibara et al., 2008, 2013). However, no phenotypes
were detected during the haploid protonema or gametophore stages in KNOX mutant
lines (Sakakibara et al., 2008, 2013; Singer and Ashton, 2007) and the RT-PCR only
amplified certain regions of the transcripts. Consequently, these results have been
interpreted as evidence for the presence of partial transcripts during the gametophyte
generation. To determine whether the ORO and SAM transcripts produced in Ectocarpus
were incomplete, RNA-seq data from male and female, immature and mature
gametophytes was mapped onto the ORO and SAM gene sequences. This analysis
indicated that full-length transcripts of both the ORO and SAM genes are produced
during the gametophyte generation (Fig. S2).
Quantitative PCR experiments demonstrated that sporophyte and gametophyte marker
genes (Peters et al., 2008) were down- and up-regulated, respectively, in sam mutant
lines (Fig. 3B), as has been previously demonstrated for the oro mutant (Coelho et al.,
2011). This result is consistent with the observed morphological and functional
conversion to the gametophyte generation.
ORO and SAM regulate the expression of sporophyte generation genes
To investigate the genetic mechanisms underlying the switch from the gametophyte to
the sporophyte program directed by the ORO and SAM genes, we characterised the gene
expression networks associated with the two generations of the Ectocarpus life cycle.
Comparative analysis of sporophyte and gametophyte RNA-seq data identified 1167
genes that were differentially regulated between the two generations (465 upregulated
in the sporophyte and 702 upregulated in the gametophyte; Table S4). The predicted
functions of these generation-biased genes was analysed using a system of manually-
assigned functional categories, together with analyses based on Gene Ontology (GO)
terms and Kyoto Encyclopaedia of Genes and Genomes (KEGG) pathways. The set of
48
generation-biased genes was significantly enriched in genes belonging to two of the
manually-assigned categories: "Cell wall and extracellular" and "Cellular regulation and
signalling" and for genes of unknown function (Table S4, Figure 3C). Enriched GO
terms also included several signalling- and cell wall-associated terms and terms
associated with membrane transport (Table S5, Figure 3D). The gametophyte-biased
gene set was enriched for several cell signalling KEGG pathways whereas the
sporophyte-biased gene was enriched for metabolic pathways (Table S6, Figure 3E).
We also noted that the generation-biased genes included 23 predicted transcription
factors and ten members of the EsV-1-7 domain family (Table S4; (Macaisne et al.,
2017). The latter were significantly enriched in the sporophyte-biased gene set (χ2 test
p=0.001).
Both the sporophyte-biased and the gametophyte-biased datasets were enriched in
genes that were predicted to encode secreted proteins (Fisher's Exact Test p=2.02e-8
and p=4.14e-6, respectively; Table S4). Analysis of GO terms associated with the
secreted proteins indicated a similar pattern of enrichment to that observed for the
complete set of generation-biased genes (terms associated with signalling, cell wall and
membrane transport; Table S5). Figure 3C illustrates the relative abundances of
manually-assigned functional categories represented in the generation-biased genes
predicted to encode secreted proteins.
The lists of differentially expressed genes identified by the above analysis were used to
select 200 genes that showed strong differential expression between the sporophyte and
gametophyte generations. The pattern of expression of the 200 genes was then analysed
in the oro and sam mutants and a third mutant, imm, that does not cause switching
between life cycle generations (Macaisne et al., 2017) as a control. Figure 3F shows that
mutation of either the ORO or the SAM gene leads to upregulation of gametophyte
generation genes and downregulation of sporophyte generation genes, consistent with
the switch from sporophyte to gametophyte phenotypic function. Moreover, oro and sam
mutants exhibited similar patterns of expression but the patterns were markedly
different to that of the imm mutant. Taken together with the morphological and
reproductive phenotypes of the oro and sam mutants, this analysis supports the
conclusion that ORO and SAM are master regulators of the gametophyte-to-sporophyte
transition.
The ORO and SAM proteins interact in vitro
HD TFs often associate as heterodimeric complexes. This phenomenon has been
commonly observed for homeodomain transcription factors that act as life cycle
regulators or mating type determinants (Banham et al., 1995; Horst et al., 2016; Hull et
al., 2005; Kämper et al., 1995; Lee et al., 2008). The ORO and SAM proteins were also
shown to be capable of forming a stable heterodimer using an in vitro pull-down
49
approach (Fig. 4). Deletion analysis indicated that the interaction between the two
proteins was mediated by their homeodomains.
These data suggest that SAM and ORO associate in vivo to form a heterodimeric
transcription factor analogous to the Gsm1/Gsp1 heterodimer in Chlamydomonas.
Heterodimer formation would be consistent with the very similar phenotypes of the oro
and sam mutants (at least as far as their roles in regulating the initiation of the
sporophyte developmental program is concerned) and with the similar effects of oro and
sam mutations on the expression of life-cycle-regulated genes (Fig. 3F).
Taken together, the sequence similarity between ORO and SAM, the evidence that these
proteins can heterodimerise in vitro and the effects of the mutations on gene
transcription provide additional support for our identification of the oro and sam
mutations as the causal loci of the Oro- and Sam- phenotypes.
Evolutionary origins and domain structure of the ORO and SAM genes
To investigate the evolutionary origins of the ORO and SAM genes, we searched for
homologous genes in other brown algae using either complete genome sequences,
where available (Saccharina japonica; (Ye et al., 2015); Cladosiphon okamuranus;
(Nishitsuji et al., 2016)), or transcriptome data. Although there has been considerable
divergence of TALE HD-TF sequences during brown algal evolution, all the genes
identified could be clearly classified as orthologues of ORO, SAM or Ec-04_000450 and no
additional TALE HD-TFs were detected in any of the species analysed (Fig. 5A, Table
S7). Orthologues of all three genes were present in a broad range of brown algal species
suggesting that the common ancestor of the brown algae may already have possessed
three TALE HD TFs corresponding to ORO, SAM and Ec-04_000450. However, additional
complete genome sequences, particularly for species from basal groups, will be required
to describe the evolutionary history of these genes more precisely.
Comparison of brown algal ORO and SAM orthologues identified conserved domains
both upstream and downstream of the HDs in both ORO and SAM (Figs. 5B,C, S5). These
domains do not correspond to any known domains in public domain databases and were
not found in any other proteins in the public sequence databases. In particular, the
conserved domains share no detectable similarity with domains that are associated with
TALE HDs in the green (Viridiplantae) lineage, such as the KNOX, ELK and BEL domains.
The homeodomain is the only domain that is found in both the ORO and SAM proteins
(Fig. 5).
Interestingly, both the ORO and SAM proteins possess regions that are predicted to be
highly disordered (Fig. 5B). Intrinsically disordered region are a common feature in
transcription factors and the flexibility conferred by these regions is thought to allow
them to interact with a broad range of partners (Niklas et al., 2015), a factor that may be
important for master developmental regulators such as the ORO and SAM proteins.
50
Heterodimerisation appears to be a conserved feature of brown algal and green lineage
TALE HD TFs (Fig. 4 and Lee et al., 2008) despite the lack of domain conservation.
However, in Ectocarpus heterodimerisation involves the ORO and SAM HDs whereas in
Chlamydomonas, it is the KNOX1 and KNOX2 domains of Gsm1 that interact with the C-
terminal region of Gsp1 (which includes the HD, Ala and DE domains).
To identify more distantly-related orthologues of ORO and SAM, we searched for TALE
HD TFs in a broad range of stramenopile species. All the species analysed possessed at
least two TALE HD TFs, with some species possessing as many as 14 (Table S7). In
almost all cases, similarity between these proteins and ORO and SAM was limited to the
homeodomain and this domain did not provide enough information to construct well-
supported phylogenetic trees, preventing robust identification ORO or SAM orthologues.
We therefore searched for the presence of the additional protein domains conserved in
brown algal ORO and SAM proteins. Only one non-brown-algal TALE HD TF, from the
raphidophyte Heterosigma akashiwo, possessed similarity to these domains, allowing it
to be classed tentatively as an ORO orthologue (gene identifier 231575mod; Figs. 5A,C,
Table S7). The transcriptome of this strain also included a truncated TALE HD TF
transcript similar to SAM but more complete sequence data will be required to confirm
orthology with SAM (gene identifier 296151; Fig. 5A, Table S7). This analysis allowed
the origin of ORO to be traced back to the common ancestor with the raphidophytes
(about 360 Mya; Brown and Sorhannus, 2010) but the rate of divergence of the non-HD
regions of ORO and SAM precluded the detection of more distantly related orthologues.
We also investigated whether the positions of homeobox introns provided any
information about the phylogenetic relationships of homeodomain proteins across the
stramenopiles. Intron position and phase were strongly conserved for homeoboxes of
ORO and SAM orthologues within the brown algae but were not shared with
homeoboxes from other stramenopile groups (Fig. S3). These observations are
consistent with a similar analysis of plant homeobox introns, which showed that intron
positions were strongly conserved in recently diverged classes of homeobox genes but
concluded that homeobox introns were of limited utility to deduce ancient evolutionary
relationships (Mukherjee et al., 2009).
Interestingly, genomes corresponding to several diverse stramenopile lineages outside
the brown algae are predicted to encode proteins with more than one HD (Table S7). It
is possible that these proteins have the capacity to bind regulatory sequences in a
similar manner to heterodimers of proteins with single HDs.
DISCUSSION
The analysis presented here demonstrates that two TALE HD TFs are required for the
deployment of the sporophyte program during the life cycle of the brown alga
51
Ectocarpus. The parallels with life cycle regulation in the green lineage, where TALE HD
TFs have also been shown to regulate deployment of the sporophyte program (Horst et
al., 2016; Sakakibara et al., 2013), are striking. Knockout of the KNOX class TALE HD TF
genes MKN1 and MKN6 in Physcomitrella patens result in conversion of the sporophyte
generation into a functional gametophyte (Sakakibara et al., 2013), essentially the same
phenotype as that observed with Ectocarpus oro or sam mutants despite the fact that
more than a billion years of evolution separate the two lineages (Eme et al., 2014). The
similarities between life cycle regulators in the two lineages suggests that they may be
derived from a common ancestral system that would therefore date back to early
eukaryotic evolution. The presence of life cycle regulators based on homeodomain or
homeodomain-like proteins in fungi and slime molds provides further support for an
ancient origin of these systems (Hedgethorne et al., 2017; Hull et al., 2005; Nasmyth and
Shore, 1987; Van Heeckeren et al., 1998).
It has been proposed that the ancestral function of homeodomain-based life cycle
regulators was to detect syngamy and to implement processes specific to the diploid
phase of the life cycle such as repressing gamete formation and initiating meiosis
(Perrin, 2012) and references therein). With the emergence of complex, multicellular
organisms, it would not have been surprising if additional processes such as
developmental networks had come under the control of these regulators as this would
have ensured that those developmental processes were deployed at the appropriate
stage of the life cycle (Cock et al., 2013). Indeed, it has been suggested that modifications
to homeodomain-based regulatory circuits may have played an important role in the
emergence of sporophyte complexity in the green lineage (Bowman et al., 2016; Lee et
al., 2008). Key events may have included the replacement of the Gsp1-like class of BELL-
related1 genes with alternative (true BEL-class) proteins and diversification of both the
true BEL-class and the KNOX-class TALE HD TFs. In particular, the emergence and
subfunctionalisation of two KNOX subfamilies early in streptophyte evolution is thought
to have facilitated the evolution of more complex sporophyte transcriptional networks
(Furumizu et al., 2015; Sakakibara et al., 2013). In the brown algae, ORO and SAM also
function as major developmental regulators but, in this lineage, the emergence of a
multicellular sporophyte has not been associated with a marked expansion of the TALE
HD TF family. However, there does appear to have been considerable divergence of the
ORO and SAM protein sequences during brown algal evolution, perhaps reflecting the
evolution of new functions associated with multicellular development and divergence of
the sporophyte and gametophyte developmental programs.
Interestingly, diploid sporophytes heterozygous for sam mutations exhibited abortive
development of unilocular sporangia at a stage corresponding to the meiotic division of
the mother cell. At first sight it might seem surprising that a gene should play an
important role both directly following the haploid to diploid transition (initiation of
sporophyte development) and at the opposite end of the life cycle, during the diploid to
haploid transition (meiosis). However, these phenotypes make more sense when viewed
52
from an evolutionary perspective, if the ORO SAM system originally evolved as a global
regulator of diploid phase processes.
There is now accumulating evidence for an ancient role for HD TFs in life cycle
regulation in both the bikont and unikont branches of the eukaryotic tree of life
(Hedgethorne et al., 2017; Horst et al., 2016; Hull et al., 2005; Lee et al., 2008;
Sakakibara et al., 2013) and this study) and these systems appear to have been adapted
to coordinate life cycle progression and development in at least two multicellular
eukaryotic lineages (land plants and brown algae). One particularly interesting
outstanding question is whether HD TFs also play a role in coordinating life cycle
progression and development in animals? Analysis of the functions of TALE HD TFs in
unicellular relatives of animals may help provide some insights into this question.
METHODS AND MATERIALS
Biological material and mutagenesis
The Ectocarpus strains used in this study are described in Table S1. Strain cultivation,
genetic crosses, raising of sporophytes from zygotes and isolation of meiotic families
were carried out as described (Coelho et al., 2012b, 2012c). Life cycle mutants were
obtained by ultra-violet irradiation of gametes of the strain Ec32, as previously
described (Coelho et al., 2011). Many of the gametophyte-like individuals identified in
the mutagenised population were unstable and reverted to sporophyte phenotypes after
several generations of gamete parthenogenesis. These individuals, which had
presumably experienced epigenetic modifications, were not studied further.
Microscopy
Young germlings and adult filaments of Ectocarpus sp. were imaged under inverted
(CKX41, Olympus, Tokyo, Japan or DMi8, Leica, Wetzlar, Germany) or upright (BX41,
Olympus, Tokyo, Japan) microscopes. Young germlings were settled on coverslips at low
density. Nuclei of developing meio-spores in unilocular sporangia were stained with
Hoechst 33342 (Thermofisher).
Photopolarisation
Photopolarisation tests were carried out by growing gametophytes and sporophytes
from initial cells (meio-spores or parthenogenetic gametes) at low density in 5 cm (7-8
mL) Petri dishes under unidirectional white light. Germlings were scored (mean n=138
per Petri dish) as being orientated towards one of four quadrants (towards the light,
away from the light or in one of the two quadrants perpendicular to the light).
Individuals that germinated into the quadrant away from the light were scored as
exhibiting negative phototrophy.
53
Treatment with the sporophyte-produced diffusible factor
Sporophyte-conditioned medium, gametophyte-conditioned medium and protoplasts
were produced as previously described (Arun et al., 2013). Protoplasts were allowed to
regenerate either in sporophyte-conditioned medium supplemented with osmoticum or
in gametophyte-conditioned supplemented with osmoticum as a control. Congo red
staining was used to distinguish sporophytes from gametophytes (Arun et al., 2013). At
least 60 individuals were scored per treatment per experiment. Results are
representative of three independent experiments.
Mapping of genetic loci
AFLP analysis was carried out essentially as described by Vos et al. (Vos et al., 1995).
DNA was extracted from 50 wild type and 50 oro individuals derived from a cross
between the outcrossing line Ec 568 and the oro mutant Ec 494 (Table S1). Equal
amounts of DNA were combined into two pools, for bulk segregant analysis. Pre-
selective amplification was carried out with an EcoRI-anchored primer and an MseI-
anchored primer, each with one selective nucleotide, in five different combinations
(EcoRI+T / MseI+G; EcoRI+T / MseI+A; EcoRI+C / MseI+G; EcoRI+C / MseI+A; EcoRI+A
/ MseI+C). These reactions were diluted 1:150 for the selective amplifications. The
selective amplifications used an EcoRI-anchored primer and an MseI-anchored primer,
each with three selective nucleotides, in various different combinations. The PCR
conditions for both steps were 94°C for 30 sec, followed by 20 cycles of DNA
amplification (30 sec at 94°C, 1 min at 56°C and 1 min at 72°C) and a 5 min incubation at
72°C except that this protocol was preceded by 13 touchdown cycles involving a
decrease of 0.7°C per cycle for the selective amplifications. PCR products were analysed
on a LI-COR apparatus.
Microsatellite-based mapping initially employed two equimolar pools of genomic DNA
corresponding to 12 wild type and 12 oro individuals that did not exhibit any
recombination events within a 41.4 cM region spanning the ORO locus together with the
microsatellite markers used to generate the first Ectocapus genetic map (Heesch et al.,
2010). Fine mapping employed a segregating population of 2,000 individuals derived
from the cross between the oro mutant line (Ec494) and the outcrossing line Ec568 and
additional microsatellite markers within the mapping interval (Table S2) designed
based on the Ectocarpus genome sequence (Cock et al., 2010). PCR reactions contained 5
ng of template DNA, 1.5 μl of 5xGoTaq reaction buffer, 0.25 units of GoTaq-polymerase
(Promega), 10 nmol MgCl2, 0.25 μl of dimethyl sulphoxide, 0.5 nmol of each dNTP, 2
pmol of the reverse primer, 0.2 pmol of the forward primer (which included a 19-base
tail that corresponded to a nucleotide sequence of the M13 bacteriophage) and 1.8 pmol
of the fluorescence marked M13 primer. The PCR conditions were 94°C for 4 min
followed by 13 touch-down cycles (94°C for 30 sec, 65-54°C for 1 min and 72°C for 30
sec) and 25 cycles at 94°C for 30 sec, 53°C for 1 min and 72°C for 30 sec. Samples were
genotyped by electrophoresis on an ABI3130xl Genetic Analyser (Applied Biosystems)
54
and analysis with Genemapper version 4.0 (Applied Biosystems).
Reconstruction and sequence correction of the ORO and SAM loci
The sequence of the 34.5 kbp mapped interval containing the ORO gene (chromosome
27, 5463270-5497776) in the wild type Ectocarpus reference strain Ec32 included one
short region of uncertain sequence 1026 bp downstream of the end of the ORO open
reading frame. The sequence of this region was completed by PCR amplification and
Sanger sequencing and confirmed by mapping Illumina read data to the corrected
region. The corrected ORO gene region has been submitted to Genbank under the
accession number KU746822.
Comparison of the reference genome (strain Ec32) supercontig that contains the SAM
gene (sctg_251) with homologous supercontigs from several independently assembled
draft genome sequences corresponding to closely related Ectocarpus sp. strains (Ahmed
et al., 2014; Cormier et al., 2017) indicated that the sctg_251 was chimeric and that the
first three exons of the SAM gene were missing. The complete SAM gene was therefore
assembled and has been submitted to Genbank under the accession number KU746823.
Quantitative reverse transcriptase polymerase chain reaction analysis of mRNA
abundance
Total RNA was extracted from wild-type gametophytes and partheno-sporophytes
(Ec32) and from sam-1 (Ec374) and sam-2 (Ec364) partheno-gametophytes using the
Qiagen RNeasy Plant mini kit and any contaminating DNA was removed by digestion
with Ambion TURBOTM DNase (Life Technologies). The generation marker genes
analysed were Ec-20_001150 and Ec-26_000310 (sporophyte markers), and Ec-
23_004240 and Ec-21_006530 (gametophyte markers), which are referred to as IDW6,
IDW7, IUP2 and IUP7 respectively, in Peters et al. (Peters et al., 2008). Following reverse
transcription of 50-350 ng total RNA with the ImPro II TM Reverse Transcription
System (Promega), quantitative RT-PCR was performed on LightCycler® 480 II
instrument (Roche). Reactions were run in 10 µl containing 5 ng cDNA, 500nM of each
oligo and 1x LightCycler® 480 DNA SYBR Green I mix (Roche). The sequences of the
oligonucleotides used are listed in Table S8. Pre-amplification was performed at 95°C
for 5 min, followed by the amplification reaction consisting of 45 cycles of 95°C for 10
sec, 60°C for 30 sec and 72°C for 15 sec with recording of the fluorescent signal after
each cycle. Amplification specificity and efficiency were checked using a melting curve
and a genomic DNA dilution series, respectively, and efficiency was always between
90% and 110%. Data were analysed using the LightCycler® 480 software (release
1.5.0). A pair of primers that amplified a fragment which spanned intron 2 of the SAM
gene was used to verify that there was no contaminating DNA (Table S8). Standard
curves generated from serial dilutions of genomic DNA allowed quantification for each
gene. Gene expression was normalized against the reference gene EEF1A2. Three
technical replicates were performed for the standard curves and for each sample.
Statistical analysis (Kruskal-Wallis test and Dunn's Multiple Comparison Post Test) were
55
performed using the software GraphPadPrism5.
RNA-seq analysis
RNA for RNA-seq analysis was extracted from duplicate samples (two biological
replicates) of approximately 300 mg (wet weight) of tissue either using the Qiagen
RNeasy plant mini kit with an on-column Deoxyribonuclease I treatment or following a
modified version (Peters et al., 2008) of the protocol described by (Apt et al., 1995).
Briefly, this second protocol involved extraction with a cetyltrimethylammonium
bromide (CTAB)-based buffer and subsequent phenol-chloroform purification, LiCl-
precipitation, and DNAse digestion (Turbo DNAse, Ambion, Austin, TX, USA) steps. RNA
quality and concentration was then analysed on 1.5% agarose gel stained with ethidium
bromide and a NanoDrop ND-1000 spectrophotometer (NanoDrop products,
Wilmington, DE, USA). Between 21 and 93 million sequence reads were generated for
each sample on an Illumina Hi-seq2000 platform (Table S9). Raw reads were quality
trimmed with Trimmomatic (leading and trailing bases with quality below 3 and the
first 12 bases were removed, minimum read length 50 bp) (Bolger et al., 2014). High
score reads were aligned to the Ectocarpus reference genome (Cock et al., 2010);
available at Orcae; (Sterck et al., 2012) using Tophat2 with the Bowtie2 aligner (Kim et
al., 2013). The mapped sequencing data was then processed with HTSeq (Anders et al.,
2014) to obtain counts for sequencing reads mapped to exons. Expression values were
represented as TPM and TPM>1 was applied as a filter to remove noise.
Differential expression was detected using the DESeq2 package (Bioconductor; (Love et
al., 2014) using an adjusted p-value cut-off of 0.05 and a minimal fold-change of 2.
Heatmaps were generated using the Heatplus package for R (Ploner, 2015) and colour
schemes selected from the ColorBrewer project (http://colorbrewer.org).
The entire set of 16,724 protein-coding genes in the Ectocarpus Ec32 genome were
manually assigned to one of 22 functional categories (Table S10) and this information
was used to determine whether sets of differentially expressed genes were enriched in
particular functional categories compared to the entire nuclear genome (χ2 test).
Blast2GO (Conesa and Götz, 2008) was used to detect enrichment of GO-terms
associated with the genes that were consistently up- or downregulated in pairwise
comparisons of the wild type gametophyte, the sam mutant and the oro mutant with the
wild type sporophyte. Significance was determined using a Fisher exact test with an FDR
corrected p-value cutoff of 0.05. Sub-cellular localisations of proteins were predicted
using Hectar (Gschloessl et al., 2008). Sets of secreted proteins corresponded to those
predicted to possess a signal peptide or a signal anchor.
56
Detection of protein-protein interactions
Pull-down assays were carried out using the MagneGSTTM Pull-Down System
(PROMEGA, Madison, WI) by combining human influenza hemagglutinin (HA)-tagged
and glutathione S-transferase (GST) fusion proteins. In vitro transcription/translation of
HA-tagged ORO proteins was carried out using the TNT Coupled Wheat Germ Extract
System (PROMEGA, Madison, WI). GST-tagged SAM proteins were expressed in
Escherichia coli. Protein production was induced by adding IPTG to a final concentration
of 2mM and shaking for 20 h at 16°C. After the capture phase, beads were washed four
times with 400 L of washing buffer (0.5% IGEPAL, 290 mM NaCl, 10 mM KCl, 4.2 mM
Na2HPO4, 2 mM KH2PO4, at pH 7.2) at room temperature. Beads were then recovered in
SDS-PAGE loading buffer, and proteins analysed by SDS-PAGE followed by ClarityTM
chemiluminescent detection (BIORAD, Hercules, CA). The anti-HA antibody (3F10) was
purchased from Roche, and the anti-GST antibody (91G1) from Ozyme.
Searches for HD proteins from other stramenopile species
Searches for homeodomain proteins from additional brown algal or stramenopile
species were carried out against the NCBI, Uniprot, oneKP (Matasci et al., 2014) and
iMicrobe databases and against sequence databases for individual stramenopile
genomes (Nannochloropsis oceanica, Aureococcus anophagefferens, Phaeodactylum
tricornutum, Thalassiosira pseudonana, Pseudo-nitzschia multiseries) and transcriptomes
(Vaucheria litorea, Heterosigma akashiwo) using both Blast (Blastp or tBlastn) and
HMMsearch with a number of different alignments of brown algal TALE HD TF proteins.
GenomeView (Abeel et al., 2012) was used together with publically available genome
and RNA-seq sequence data (Nishitsuji et al., 2016; Ye et al., 2015) to improve the gene
models for some of the brown algal TALE HD TFs (indicated in Table S7 by adding the
suffix "mod" for modified to the protein identifier).
Phylogenetic analysis and protein analysis and comparisons
Multiple alignments were generated with Muscle in MEGA7 (Tamura et al., 2011).
Phylogenetic trees were then generated with RAxML (Stamatakis, 2015) using 1000
bootstrap replicates and the most appropriate model based on an analysis in MEGA7.
Domain alignments were constructed in Jalview (http://www.jalview.org/) and
consensus sequence logos were generated with WebLogo
(http://weblogo.berkeley.edu/logo.cgi). Intrinsic disorder in protein folding was
predicted using SPINE-D (Zhang et al., 2012), low complexity regions with SEG (default
parameters, 12 amino acid window; (Wootton, 1994) and secondary structure with
PSIPRED (Buchan et al., 2013).
57
AUTHOR CONTRIBUTIONS
S.M.C., O.G., D.S. and A.F.P. isolated life cycle mutants and carried out culture work. A.A.,
A.F.P., D.S., C.T. and A.B. performed the positional cloning. L.P. and S.B. analysed protein
interactions. H.Y. and S.M.C. carried out diffusible factor experiments. M.S., G.J.M., N.M.
and D.S. generated expression and sequence data. A.P.L., K.A. and J.M.C. analysed data.
J.M.C. designed and supervised the research and wrote the article with help from all the
authors.
ACKNOWLEDGMENTS
This work was supported by the Centre National de la Recherche Scientifique; Agence
Nationale de la Recherche (project Bi-cycle ANR-10-BLAN-1727, project Idealg ANR-10-
BTBR-04-01 and project Saclay Plant Sciences (SPS), ANR-10-LABX-40); Interreg
Program France (Channel)-England (project Marinexus); the Sorbonne Université and
the European Research Council (SexSea grant agreement 638240 and ERC-SEXYPARTH).
A.A. and H.Y. were supported by a fellowship from the European Erasmus Mundus
program and the China Scholarship Council, respectively. We thank the ABiMS platform
(Roscoff Marine Station) for providing computing facilities and support.
REFERENCES
Abeel, T., Van Parys, T., Saeys, Y., Galagan, J., and Van de Peer, Y. (2012). GenomeView: a next-generation genome browser. Nucleic Acids Res 40, e12.
Ahmed, S., Cock, J.M., Pessia, E., Luthringer, R., Cormier, A., Robuchon, M., Sterck, L., Peters, A.F., Dittami, S.M., Corre, E., et al. (2014). A Haploid System of Sex Determination in the Brown Alga Ectocarpus sp. Curr Biol 24, 1945–1957.
Anders, S., Pyl, S.T., and Huber, W. (2014). HTSeq — A Python framework to work with high-throughput sequencing data. BioRxiv Prepr.
Apt, K.E., Clendennen, S.K., Powers, D.A., and Grossman, A.R. (1995). The gene family encoding the fucoxanthin chlorophyll proteins from the brown alga Macrocystis pyrifera. Mol Gen Genet 246, 455–464.
Arun, A., Peters, N.T., Scornet, D., Peters, A.F., Cock, J.M., and Coelho, S.M. (2013). Non-cell autonomous regulation of life cycle transitions in the model brown alga Ectocarpus. New Phytol 197, 503–510.
Avia, K., Coelho, S.M., Montecinos, A.E., Cormier, A., Lerck, F., Mauger, S., Faugeron, S., Valero, M., Cock, J.M., and Boudry, P. (2017). High-density genetic map and identification of QTLs for responses to high temperature and low salinity stresses in the model alga Ectocarpus sp. Sci. Rep. 7, 43241.
58
Banham, A.H., Asante-Owusu, R.N., Gottgens, B., Thompson, S., Kingsnorth, C.S., Mellor, E., and Casselton, L.A. (1995). An N-Terminal Dimerization Domain Permits Homeodomain Proteins To Choose Compatible Partners and Initiate Sexual Development in the Mushroom Coprinus cinereus. Plant Cell 7, 773–783.
Bolger, A.M., Lohse, M., and Usadel, B. (2014). Trimmomatic: a flexible trimmer for Illumina sequence data. Bioinforma. Oxf. Engl. 30, 2114–2120.
Bowman, J.L., Sakakibara, K., Furumizu, C., and Dierschke, T. (2016). Evolution in the Cycles of Life. Annu. Rev. Genet.
Brown, J.W., and Sorhannus, U. (2010). A molecular genetic timescale for the diversification of autotrophic stramenopiles (Ochrophyta): substantive underestimation of putative fossil ages. PLoS One 5.
Buchan, D.W.A., Minneci, F., Nugent, T.C.O., Bryson, K., and Jones, D.T. (2013). Scalable web services for the PSIPRED Protein Analysis Workbench. Nucleic Acids Res. 41, W349-357.
Champagne, C.E.M., and Ashton, N.W. (2001). Ancestry of KNOX genes revealed by bryophyte (Physcomitrella patens) homologs. New Phytol. 150, 23–36.
Cock, J.M., Sterck, L., Rouzé, P., Scornet, D., Allen, A.E., Amoutzias, G., Anthouard, V., Artiguenave, F., Aury, J., Badger, J., et al. (2010). The Ectocarpus genome and the independent evolution of multicellularity in brown algae. Nature 465, 617–621.
Cock, J.M., Godfroy, O., Macaisne, N., Peters, A.F., and Coelho, S.M. (2013). Evolution and regulation of complex life cycles: a brown algal perspective. Curr Opin Plant Biol 17, 1–6.
Cock, J.M., Godfroy, O., Strittmatter, M., Scornet, D., Uji, T., Farnham, G., Peters, A.F., and Coelho, S.M. (2015). Emergence of Ectocarpus as a model system to study the evolution of complex multicellularity in the brown algae. In Evolutionary Transitions to Multicellular Life, I. Ruiz-Trillo, and A.M. Nedelcu, eds. (Dordrecht: Springer), pp. 153–162.
Coelho, S., Peters, A.F., Charrier, B., Destombe, C., Valero, M., and Cock, J. (2007). Complex life cycles of multicellular eukaryotes: new approaches based on the use of model organisms. Gene 406, 152–170.
Coelho, S.M., Godfroy, O., Arun, A., Le Corguillé, G., Peters, A.F., and Cock, J.M. (2011). OUROBOROS is a master regulator of the gametophyte to sporophyte life cycle transition in the brown alga Ectocarpus. Proc Natl Acad Sci USA 108, 11518–11523.
Coelho, S.M., Scornet, D., Rousvoal, S., Peters, N., Dartevelle, L., Peters, A.F., and Cock, J.M. (2012a). Ectocarpus: A model organism for the brown algae. Cold Spring Harb. Protoc 2012, 193–198.
Coelho, S.M., Scornet, D., Rousvoal, S., Peters, N., Dartevelle, L., Peters, A.F., and Cock, J.M. (2012b). Genetic crosses between Ectocarpus strains. Cold Spring Harb Protoc 2012, 262–265.
59
Coelho, S.M., Scornet, D., Rousvoal, S., Peters, N.T., Dartevelle, L., Peters, A.F., and Cock, J.M. (2012c). How to cultivate Ectocarpus. Cold Spring Harb Protoc 2012, 258–261.
Conesa, A., and Götz, S. (2008). Blast2GO: A comprehensive suite for functional analysis in plant genomics. Int. J. Plant Genomics 2008, 619832.
Cormier, A., Avia, K., Sterck, L., Derrien, T., Wucher, V., Andres, G., Monsoor, M., Godfroy, O., Lipinska, A., Perrineau, M.-M., et al. (2017). Re-annotation, improved large-scale assembly and establishment of a catalogue of noncoding loci for the genome of the model brown alga Ectocarpus. New Phytol. 214, 219–232.
Eme, L., Sharpe, S.C., Brown, M.W., and Roger, A.J. (2014). On the age of eukaryotes: evaluating evidence from fossils and molecular clocks. Cold Spring Harb. Perspect. Biol. 6.
Furumizu, C., Alvarez, J.P., Sakakibara, K., and Bowman, J.L. (2015). Antagonistic roles for KNOX1 and KNOX2 genes in patterning the land plant body plan following an ancient gene duplication. PLoS Genet. 11, e1004980.
Gillissen, B., Bergemann, J., Sandmann, C., Schroeer, B., Bölker, M., and Kahmann, R. (1992). A two-component regulatory system for self/non-self recognition in Ustilago maydis. Cell 68, 647–657.
Goutte, C., and Johnson, A.D. (1988). a1 protein alters the DNA binding specificity of alpha 2 repressor. Cell 52, 875–882.
Gschloessl, B., Guermeur, Y., and Cock, J. (2008). HECTAR: a method to predict subcellular targeting in heterokonts. BMC Bioinf 9, 393.
Guitton, A.E., and Berger, F. (2005). Loss of function of MULTICOPY SUPPRESSOR OF IRA 1 produces nonviable parthenogenetic embryos in Arabidopsis. Curr Biol 15, 750–754.
Hedgethorne, K., Eustermann, S., Yang, J.-C., Ogden, T.E.H., Neuhaus, D., and Bloomfield, G. (2017). Homeodomain-like DNA binding proteins control the haploid-to-diploid transition in Dictyostelium. Sci. Adv. 3, e1602937.
Heesch, S., Cho, G.Y., Peters, A.F., Le Corguillé, G., Falentin, C., Boutet, G., Coëdel, S., Jubin, C., Samson, G., Corre, E., et al. (2010). A sequence-tagged genetic map for the brown alga Ectocarpus siliculosus provides large-scale assembly of the genome sequence. New Phytol 188, 42–51.
Horst, N.A., Katz, A., Pereman, I., Decker, E.L., Ohad, N., and Reski, R. (2016). A single homeobox gene triggers phase transition, embryogenesis and asexual reproduction. Nat. Plants 2, 15209.
Hull, C.M., Boily, M.-J., and Heitman, J. (2005). Sex-specific homeodomain proteins Sxi1alpha and Sxi2a coordinately regulate sexual development in Cryptococcus neoformans. Eukaryot. Cell 4, 526–535.
60
Kämper, J., Reichmann, M., Romeis, T., Bölker, M., and Kahmann, R. (1995). Multiallelic recognition: nonself-dependent dimerization of the bE and bW homeodomain proteins in Ustilago maydis. Cell 81, 73–83.
Kim, D., Pertea, G., Trapnell, C., Pimentel, H., Kelley, R., and Salzberg, S.L. (2013). TopHat2: accurate alignment of transcriptomes in the presence of insertions, deletions and gene fusions. Genome Biol 14, R36.
Kües, U., Richardson, W.V., Tymon, A.M., Mutasa, E.S., Göttgens, B., Gaubatz, S., Gregoriades, A., and Casselton, L.A. (1992). The combination of dissimilar alleles of the A alpha and A beta gene complexes, whose proteins contain homeo domain motifs, determines sexual development in the mushroom Coprinus cinereus. Genes Dev. 6, 568–577.
Lee, J.H., Lin, H., Joo, S., and Goodenough, U. (2008). Early sexual origins of homeoprotein heterodimerization and evolution of the plant KNOX/BELL family. Cell 133, 829–840.
Love, M.I., Huber, W., and Anders, S. (2014). Moderated estimation of fold change and dispersion for RNA-seq data with DESeq2. Genome Biol 15, 550.
Macaisne, N., Liu, F., Scornet, D., Peters, A.F., Lipinska, A., Perrineau, M.-M., Henry, A., Strittmatter, M., Boo, S.M., and Cock, J.M. (2017). The Ectocarpus IMMEDIATE UPRIGHT gene encodes a member of a novel family of cysteine-rich proteins with an unusual distribution across the eukaryotes. Development 409–418.
Matasci, N., Hung, L.-H., Yan, Z., Carpenter, E.J., Wickett, N.J., Mirarab, S., Nguyen, N., Warnow, T., Ayyampalayam, S., Barker, M., et al. (2014). Data access for the 1,000 Plants (1KP) project. GigaScience 3, 17.
Mosquna, A., Katz, A., Decker, E.L., Rensing, S.A., Reski, R., and Ohad, N. (2009). Regulation of stem cell maintenance by the Polycomb protein FIE has been conserved during land plant evolution. Development 136, 2433–2444.
Mukherjee, K., Brocchieri, L., and Bürglin, T.R. (2009). A comprehensive classification and evolutionary analysis of plant homeobox genes. Mol. Biol. Evol. 26, 2775–2794.
Nasmyth, K., and Shore, D. (1987). Transcriptional regulation in the yeast life cycle. Science 237, 1162–1170.
Niklas, K.J., Bondos, S.E., Dunker, A.K., and Newman, S.A. (2015). Rethinking gene regulatory networks in light of alternative splicing, intrinsically disordered protein domains, and post-translational modifications. Front Cell Dev Biol 3, 8.
Nishitsuji, K., Arimoto, A., Iwai, K., Sudo, Y., Hisata, K., Fujie, M., Arakaki, N., Kushiro, T., Konishi, T., Shinzato, C., et al. (2016). A draft genome of the brown alga, Cladosiphon okamuranus, S-strain: a platform for future studies of “mozuku” biology. DNA Res. Int. J. Rapid Publ. Rep. Genes Genomes.
Okano, Y., Aono, N., Hiwatashi, Y., Murata, T., Nishiyama, T., Ishikawa, T., Kubo, M., and Hasebe, M. (2009). A polycomb repressive complex 2 gene regulates apogamy and gives
61
evolutionary insights into early land plant evolution. Proc Natl Acad Sci U A 106, 16321–16326.
Pereman, I., Mosquna, A., Katz, A., Wiedemann, G., Lang, D., Decker, E.L., Tamada, Y., Ishikawa, T., Nishiyama, T., Hasebe, M., et al. (2016). The Polycomb group protein CLF emerges as a specific tri-methylase of H3K27 regulating gene expression and development in Physcomitrella patens. Biochim. Biophys. Acta 1859, 860–870.
Perrin, N. (2012). What uses are mating types? The “developmental switch” model. Evolution 66, 947–956.
Peters, A.F., Scornet, D., Ratin, M., Charrier, B., Monnier, A., Merrien, Y., Corre, E., Coelho, S.M., and Cock, J.M. (2008). Life-cycle-generation-specific developmental processes are modified in the immediate upright mutant of the brown alga Ectocarpus siliculosus. Development 135, 1503–1512.
Ploner, A. (2015). Heatplus: Heatmaps with row and/or column covariates and colored clusters. R package version 2.22.0. https://github.com/alexploner/Heatplus.
Sakakibara, K., Nishiyama, T., Deguchi, H., and Hasebe, M. (2008). Class 1 KNOX genes are not involved in shoot development in the moss Physcomitrella patens but do function in sporophyte development. Evol. Dev. 10, 555–566.
Sakakibara, K., Ando, S., Yip, H.K., Tamada, Y., Hiwatashi, Y., Murata, T., Deguchi, H., Hasebe, M., and Bowman, J.L. (2013). KNOX2 genes regulate the haploid-to-diploid morphological transition in land plants. Science 339, 1067–1070.
Singer, S.D., and Ashton, N.W. (2007). Revelation of ancestral roles of KNOX genes by a functional analysis of Physcomitrella homologues. Plant Cell Rep. 26, 2039–2054.
Speijer, D., Lukeš, J., and Eliáš, M. (2015). Sex is a ubiquitous, ancient, and inherent attribute of eukaryotic life. Proc. Natl. Acad. Sci. U. S. A. 112, 8827–8834.
Stamatakis, A. (2015). Using RAxML to Infer Phylogenies. Curr. Protoc. Bioinforma. 51, 6.14.1-14.
Sterck, L., Billiau, K., Abeel, T., Rouzé, P., and Van de Peer, Y. (2012). ORCAE: online resource for community annotation of eukaryotes. Nat Methods 9, 1041.
Tamura, K., Peterson, D., Peterson, N., Stecher, G., Nei, M., and Kumar, S. (2011). MEGA5: molecular evolutionary genetics analysis using maximum likelihood, evolutionary distance, and maximum parsimony methods. Mol Biol Evol 28, 2731–2739.
Urban, M., Kahmann, R., and Bölker, M. (1996). Identification of the pheromone response element in Ustilago maydis. Mol. Gen. Genet. MGG 251, 31–37.
Van Heeckeren, W.J., Dorris, D.R., and Struhl, K. (1998). The mating-type proteins of fission yeast induce meiosis by directly activating mei3 transcription. Mol. Cell. Biol. 18, 7317–7326.
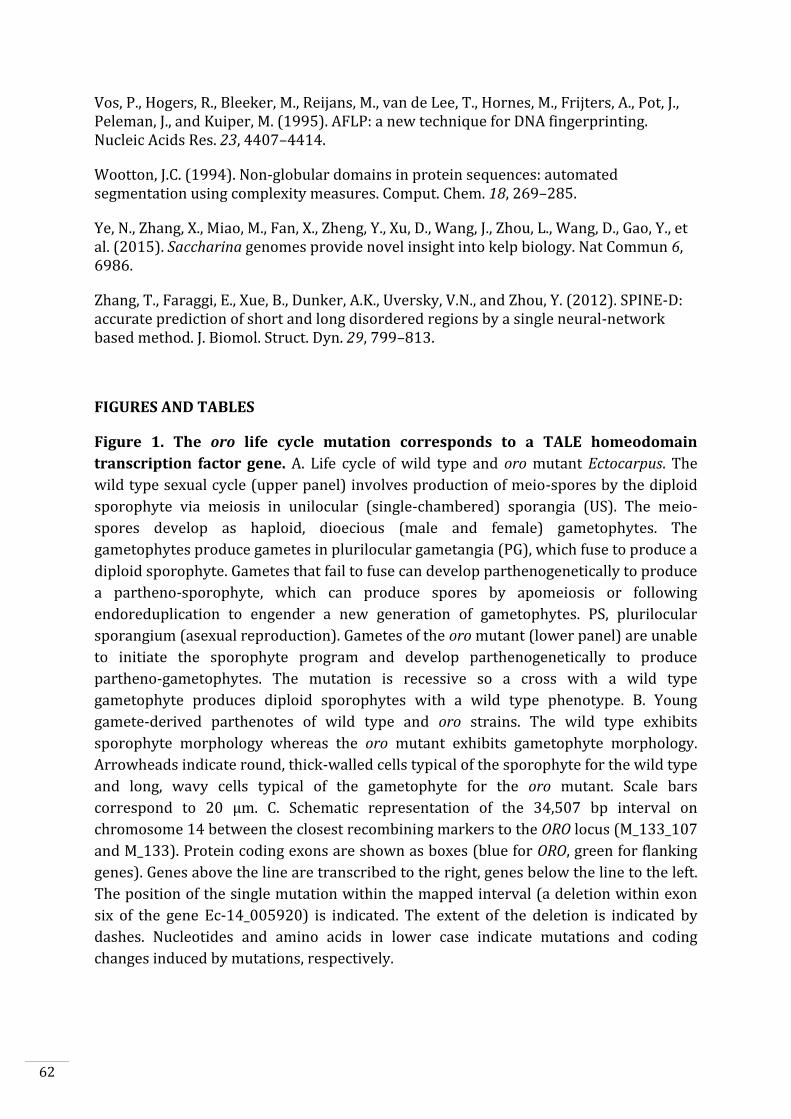
62
Vos, P., Hogers, R., Bleeker, M., Reijans, M., van de Lee, T., Hornes, M., Frijters, A., Pot, J., Peleman, J., and Kuiper, M. (1995). AFLP: a new technique for DNA fingerprinting. Nucleic Acids Res. 23, 4407–4414.
Wootton, J.C. (1994). Non-globular domains in protein sequences: automated segmentation using complexity measures. Comput. Chem. 18, 269–285.
Ye, N., Zhang, X., Miao, M., Fan, X., Zheng, Y., Xu, D., Wang, J., Zhou, L., Wang, D., Gao, Y., et al. (2015). Saccharina genomes provide novel insight into kelp biology. Nat Commun 6, 6986.
Zhang, T., Faraggi, E., Xue, B., Dunker, A.K., Uversky, V.N., and Zhou, Y. (2012). SPINE-D: accurate prediction of short and long disordered regions by a single neural-network based method. J. Biomol. Struct. Dyn. 29, 799–813.
FIGURES AND TABLES
Figure 1. The oro life cycle mutation corresponds to a TALE homeodomain
transcription factor gene. A. Life cycle of wild type and oro mutant Ectocarpus. The
wild type sexual cycle (upper panel) involves production of meio-spores by the diploid
sporophyte via meiosis in unilocular (single-chambered) sporangia (US). The meio-
spores develop as haploid, dioecious (male and female) gametophytes. The
gametophytes produce gametes in plurilocular gametangia (PG), which fuse to produce a
diploid sporophyte. Gametes that fail to fuse can develop parthenogenetically to produce
a partheno-sporophyte, which can produce spores by apomeiosis or following
endoreduplication to engender a new generation of gametophytes. PS, plurilocular
sporangium (asexual reproduction). Gametes of the oro mutant (lower panel) are unable
to initiate the sporophyte program and develop parthenogenetically to produce
partheno-gametophytes. The mutation is recessive so a cross with a wild type
gametophyte produces diploid sporophytes with a wild type phenotype. B. Young
gamete-derived parthenotes of wild type and oro strains. The wild type exhibits
sporophyte morphology whereas the oro mutant exhibits gametophyte morphology.
Arrowheads indicate round, thick-walled cells typical of the sporophyte for the wild type
and long, wavy cells typical of the gametophyte for the oro mutant. Scale bars
correspond to 20 µm. C. Schematic representation of the 34,507 bp interval on
chromosome 14 between the closest recombining markers to the ORO locus (M_133_107
and M_133). Protein coding exons are shown as boxes (blue for ORO, green for flanking
genes). Genes above the line are transcribed to the right, genes below the line to the left.
The position of the single mutation within the mapped interval (a deletion within exon
six of the gene Ec-14_005920) is indicated. The extent of the deletion is indicated by
dashes. Nucleotides and amino acids in lower case indicate mutations and coding
changes induced by mutations, respectively.
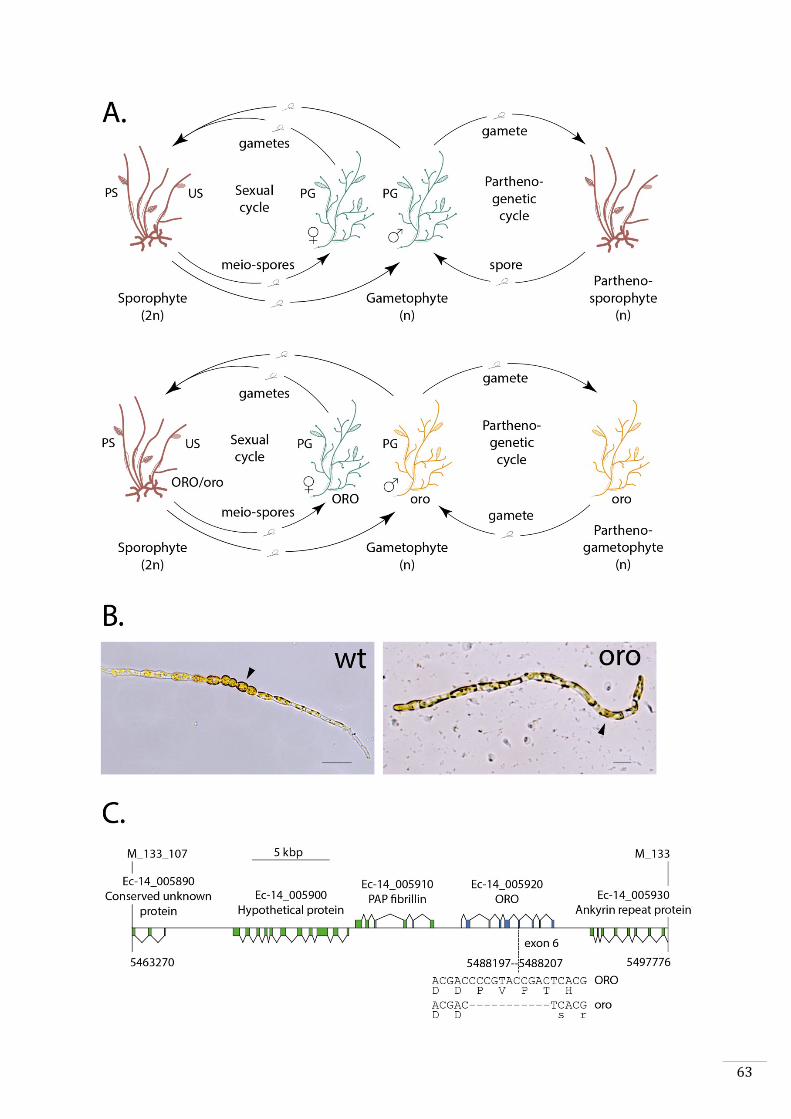
63
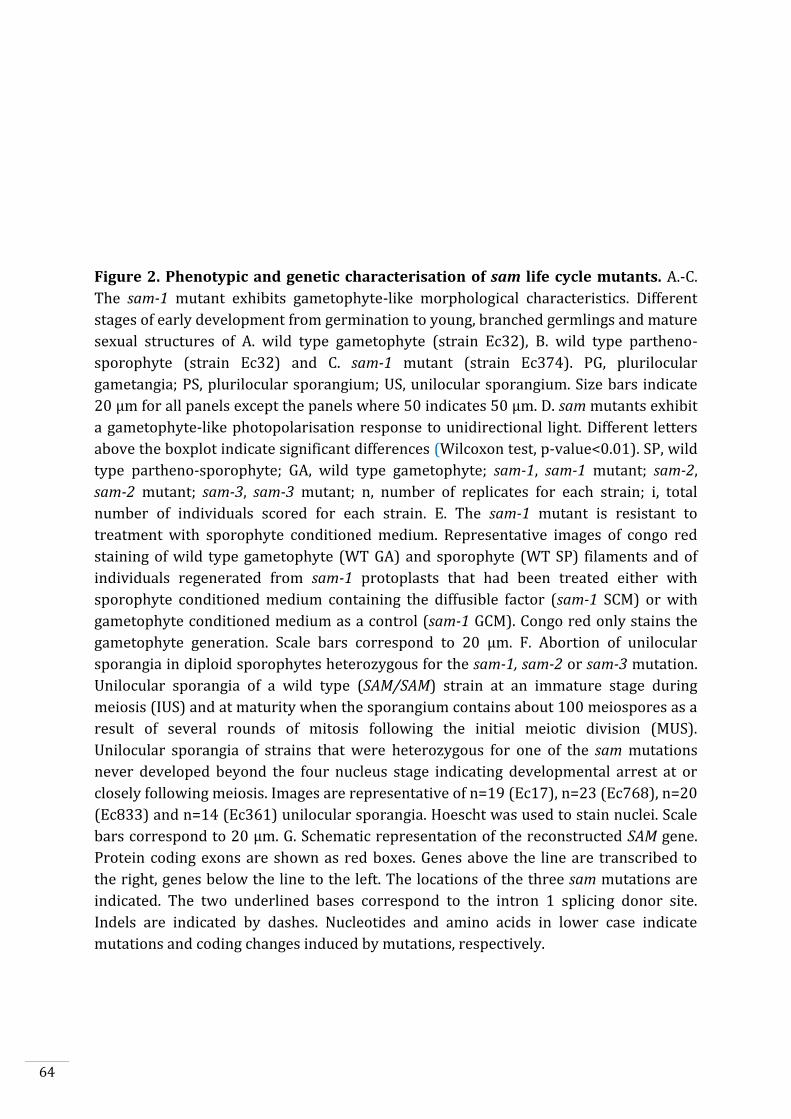
64
Figure 2. Phenotypic and genetic characterisation of sam life cycle mutants. A.-C.
The sam-1 mutant exhibits gametophyte-like morphological characteristics. Different
stages of early development from germination to young, branched germlings and mature
sexual structures of A. wild type gametophyte (strain Ec32), B. wild type partheno-
sporophyte (strain Ec32) and C. sam-1 mutant (strain Ec374). PG, plurilocular
gametangia; PS, plurilocular sporangium; US, unilocular sporangium. Size bars indicate
20 µm for all panels except the panels where 50 indicates 50 µm. D. sam mutants exhibit
a gametophyte-like photopolarisation response to unidirectional light. Different letters
above the boxplot indicate significant differences (Wilcoxon test, p-value<0.01). SP, wild
type partheno-sporophyte; GA, wild type gametophyte; sam-1, sam-1 mutant; sam-2,
sam-2 mutant; sam-3, sam-3 mutant; n, number of replicates for each strain; i, total
number of individuals scored for each strain. E. The sam-1 mutant is resistant to
treatment with sporophyte conditioned medium. Representative images of congo red
staining of wild type gametophyte (WT GA) and sporophyte (WT SP) filaments and of
individuals regenerated from sam-1 protoplasts that had been treated either with
sporophyte conditioned medium containing the diffusible factor (sam-1 SCM) or with
gametophyte conditioned medium as a control (sam-1 GCM). Congo red only stains the
gametophyte generation. Scale bars correspond to 20 µm. F. Abortion of unilocular
sporangia in diploid sporophytes heterozygous for the sam-1, sam-2 or sam-3 mutation.
Unilocular sporangia of a wild type (SAM/SAM) strain at an immature stage during
meiosis (IUS) and at maturity when the sporangium contains about 100 meiospores as a
result of several rounds of mitosis following the initial meiotic division (MUS).
Unilocular sporangia of strains that were heterozygous for one of the sam mutations
never developed beyond the four nucleus stage indicating developmental arrest at or
closely following meiosis. Images are representative of n=19 (Ec17), n=23 (Ec768), n=20
(Ec833) and n=14 (Ec361) unilocular sporangia. Hoescht was used to stain nuclei. Scale
bars correspond to 20 µm. G. Schematic representation of the reconstructed SAM gene.
Protein coding exons are shown as red boxes. Genes above the line are transcribed to
the right, genes below the line to the left. The locations of the three sam mutations are
indicated. The two underlined bases correspond to the intron 1 splicing donor site.
Indels are indicated by dashes. Nucleotides and amino acids in lower case indicate
mutations and coding changes induced by mutations, respectively.
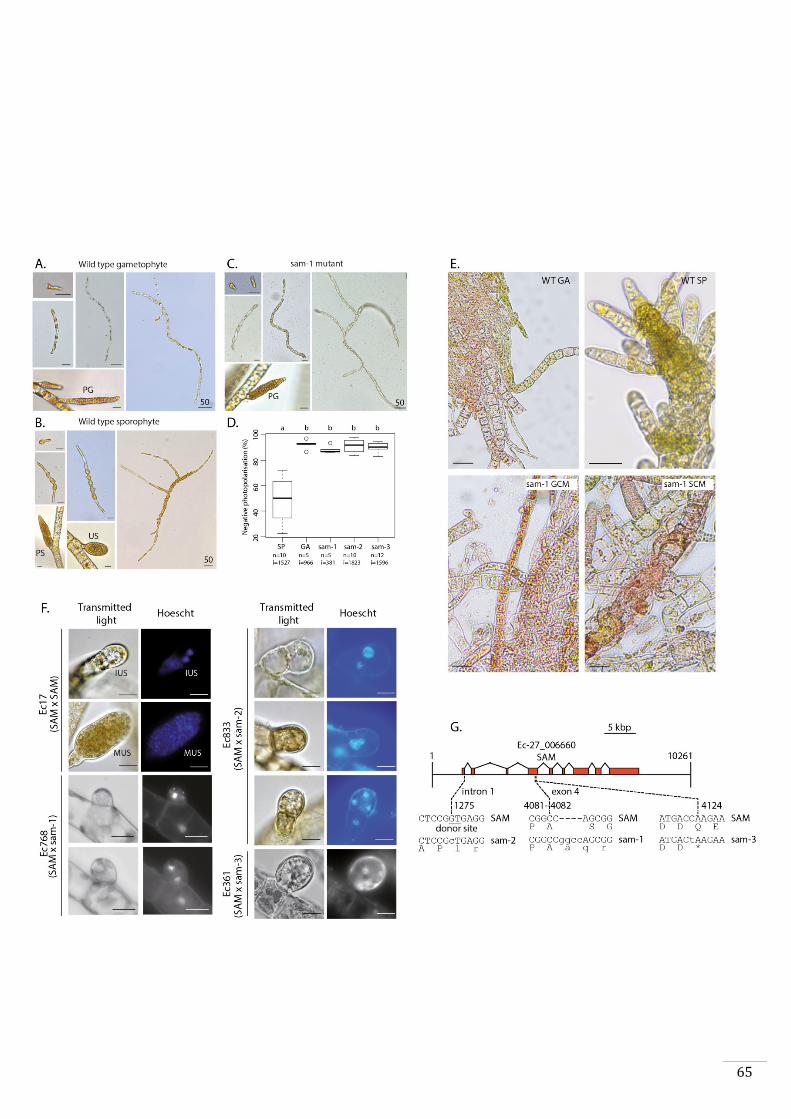
65
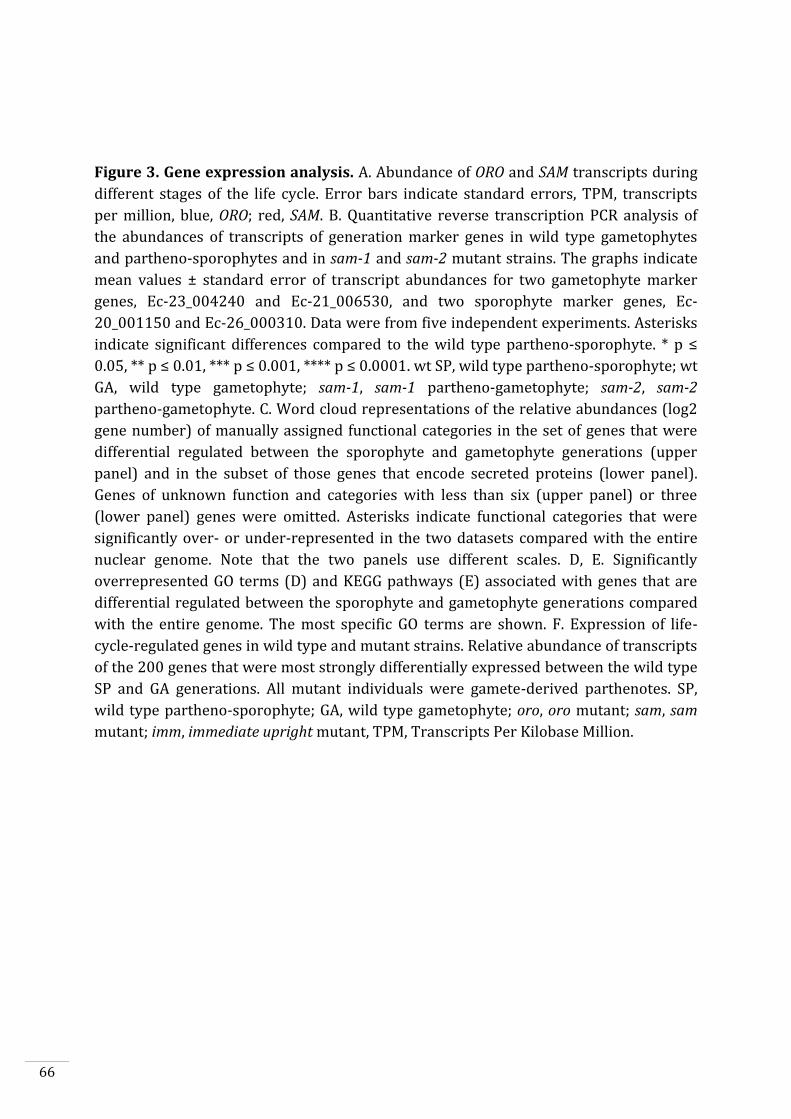
66
Figure 3. Gene expression analysis. A. Abundance of ORO and SAM transcripts during
different stages of the life cycle. Error bars indicate standard errors, TPM, transcripts
per million, blue, ORO; red, SAM. B. Quantitative reverse transcription PCR analysis of
the abundances of transcripts of generation marker genes in wild type gametophytes
and partheno-sporophytes and in sam-1 and sam-2 mutant strains. The graphs indicate
mean values ± standard error of transcript abundances for two gametophyte marker
genes, Ec-23_004240 and Ec-21_006530, and two sporophyte marker genes, Ec-
20_001150 and Ec-26_000310. Data were from five independent experiments. Asterisks
indicate significant differences compared to the wild type partheno-sporophyte. * p ≤
0.05, ** p ≤ 0.01, *** p ≤ 0.001, **** p ≤ 0.0001. wt SP, wild type partheno-sporophyte; wt
GA, wild type gametophyte; sam-1, sam-1 partheno-gametophyte; sam-2, sam-2
partheno-gametophyte. C. Word cloud representations of the relative abundances (log2
gene number) of manually assigned functional categories in the set of genes that were
differential regulated between the sporophyte and gametophyte generations (upper
panel) and in the subset of those genes that encode secreted proteins (lower panel).
Genes of unknown function and categories with less than six (upper panel) or three
(lower panel) genes were omitted. Asterisks indicate functional categories that were
significantly over- or under-represented in the two datasets compared with the entire
nuclear genome. Note that the two panels use different scales. D, E. Significantly
overrepresented GO terms (D) and KEGG pathways (E) associated with genes that are
differential regulated between the sporophyte and gametophyte generations compared
with the entire genome. The most specific GO terms are shown. F. Expression of life-
cycle-regulated genes in wild type and mutant strains. Relative abundance of transcripts
of the 200 genes that were most strongly differentially expressed between the wild type
SP and GA generations. All mutant individuals were gamete-derived parthenotes. SP,
wild type partheno-sporophyte; GA, wild type gametophyte; oro, oro mutant; sam, sam
mutant; imm, immediate upright mutant, TPM, Transcripts Per Kilobase Million.
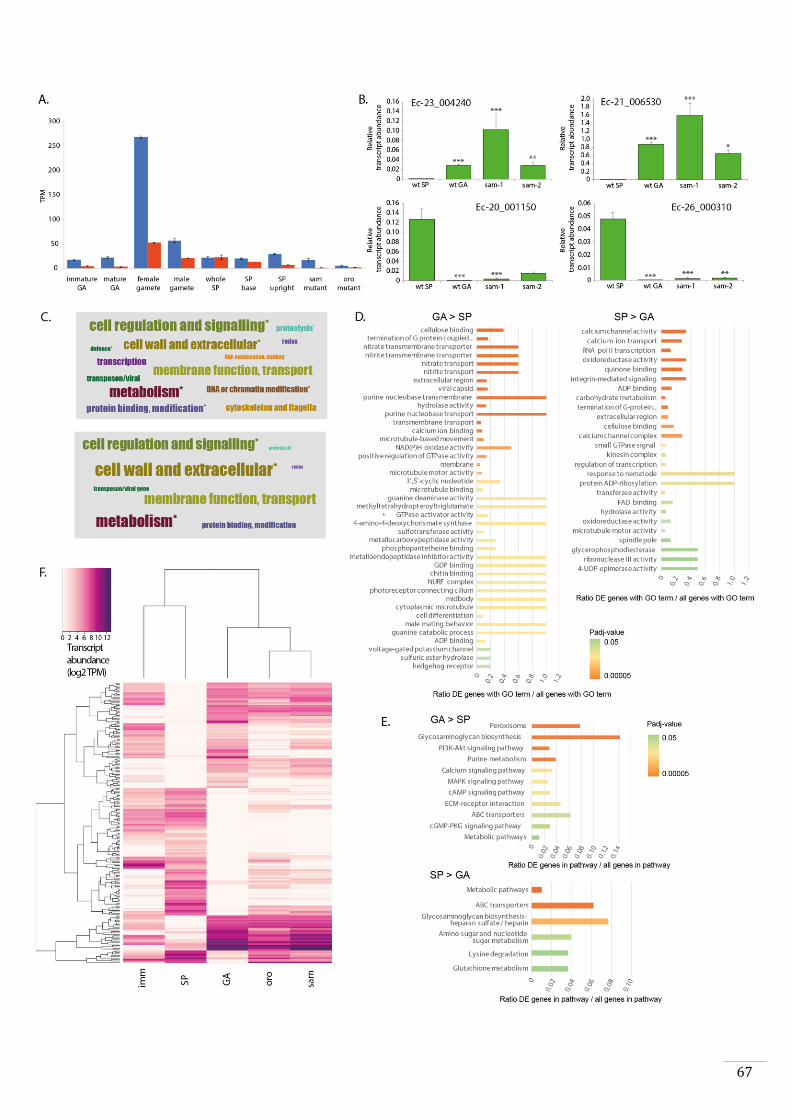
67
68
Figure 4. Detection of ORO-SAM heterodimerisation in vitro using a pull-down
assay. A. Schematic representation of the ORO and SAM constructs used for the pull-
down experiments. "Interaction?" indicates whether an interaction was detected
between ORO and SAM constructs. See figure 5 for details concerning the domain
structure. B. Pull-down assay between SAM and different versions of the ORO protein. C.
Pull-down assay between different versions of the SAM protein and full-length ORO
protein. Note that all ORO proteins were fused with the HA epitope. FL, full-length; HD,
homeodomain.
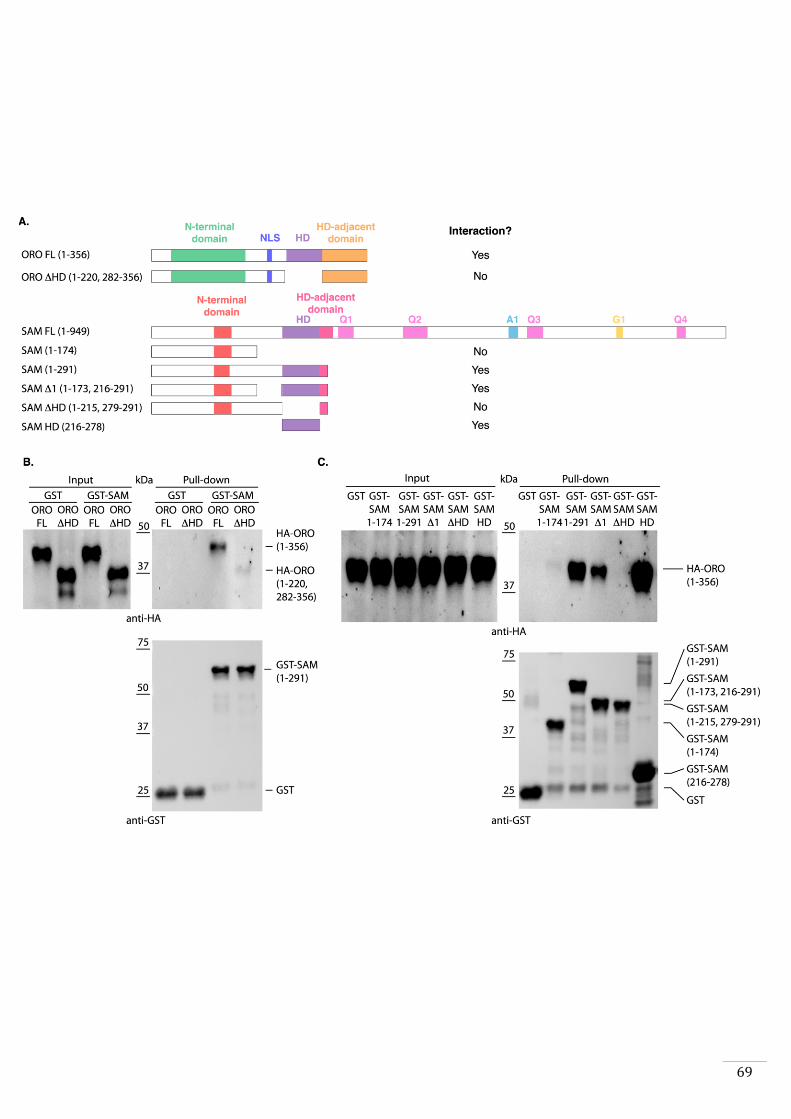
69
70
Figure 5. ORO and SAM conservation and domain conservation. A. Unrooted
maximum likelihood tree based on an alignment of ORO, SAM and Ec-04_000450
orthologues from diverse brown algal species and the raphidophyte Heterosigma
akashiwo. Protein sequences were aligned with Muscle and the phylogenetic tree
generated using RAxML with the JTT+G model and 1000 bootstrap replicates. Bootstrap
support values are indicated at each node. Cok, Cladosiphon okamuranus; Csi,
Colpomenia sinuosa; Dvi, Desmarestia viridis; Esp, Ectocarpus sp.; Hea, Heterosigma
akashiwo; Hfu, Hizikia fusiformis; Iok, Ishige okamurai; Kcr, Kjellmaniella crassifolia; Pfa,
Petalonia fascia; Pla, Punctaria latifolia; Sja, Saccharina japonica; Smu, Sargassum
muticum; Sva, Sargassum vachellianum; Slo, Scytosiphon lomentaria; Upi, Undaria
pinnatifida. Protein sequences are given in Table S7. B. Domain structure of the ORO
and SAM TALE homeodomain transcription factors. Conservation indicates residues that
are strongly (blue) or less strongly (orange) conserved across the brown algae,
secondary structure indicates α-helix (green) and β-strand (red), the disorder plots
indicate disordered (red) and ordered (green) regions of the proteins. Q1-4, A1 and G1
indicate regions rich in glutamine, alanine and glycine, respectively. Dotted lines indicate
corresponding intron positions. C. Conserved domains in ORO and SAM proteins. The
sequence logos summarise sequence conservation for each domain within the brown
algae and indicate the limits of each domain. The numbering at the bottom indicate the
conserved 60 residues of the homeodomain and xxx indicates the three additional amino
acids in TALE HD TFs. Cok, Cladosiphon okamuranus; Csi, Colpomenia sinuosa; Dvi,
Desmarestia viridis; Dun, Dictyopteris undulata; Esp, Ectocarpus sp.; Hea, Heterosigma
akashiwo; Hfu, Hizikia fusiformis; Iok, Ishige okamurai; Kcr, Kjellmaniella crassifolia; Pfa,
Petalonia fascia; Pla, Punctaria latifolia; Sja, Saccharina japonica; Smu, Sargassum
muticum; Sva, Sargassum vachellianum; Sdo, Scytosiphon dotyi; Slo, Scytosiphon
lomentaria; Upi, Undaria pinnatifida. Protein sequences are given in Table S7.
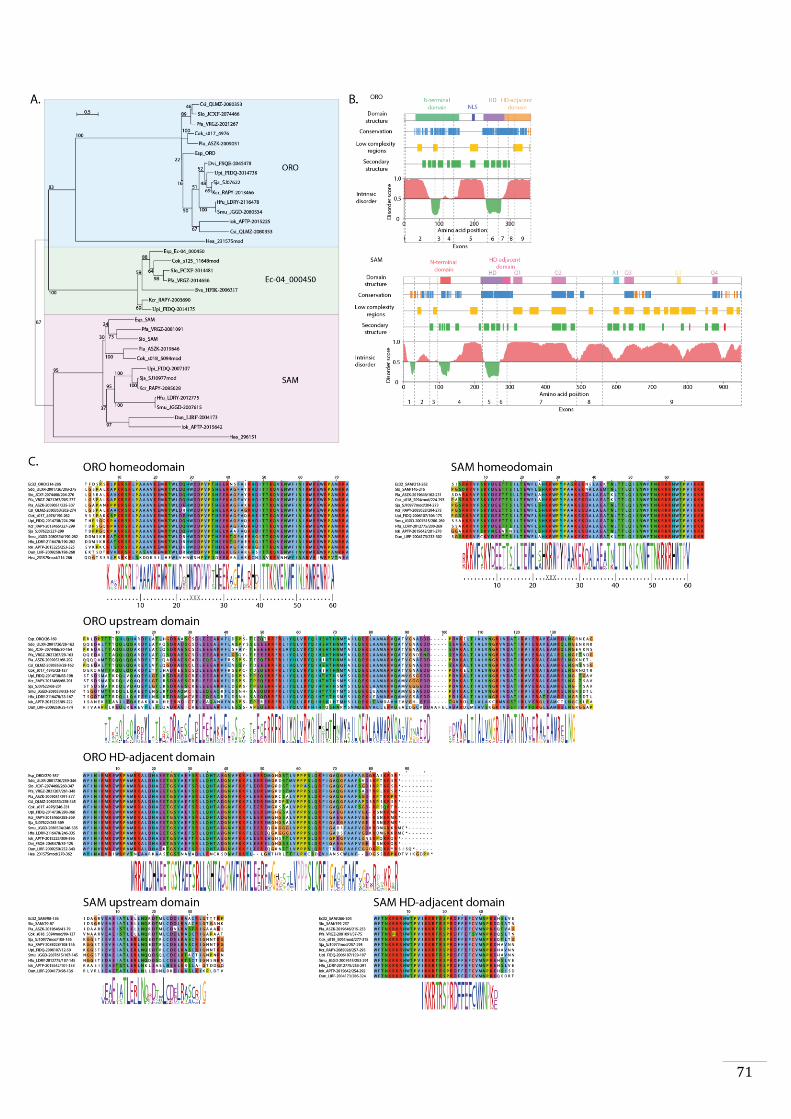
71
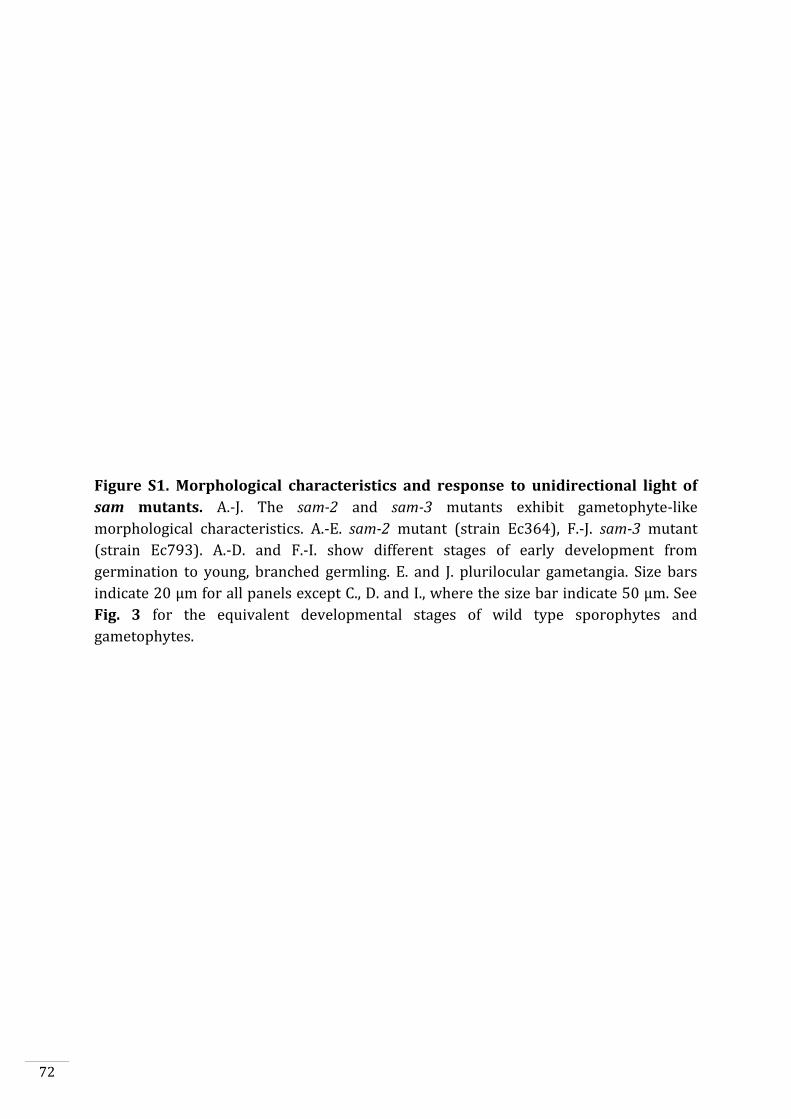
72
Figure S1. Morphological characteristics and response to unidirectional light of
sam mutants. A.-J. The sam-2 and sam-3 mutants exhibit gametophyte-like
morphological characteristics. A.-E. sam-2 mutant (strain Ec364), F.-J. sam-3 mutant
(strain Ec793). A.-D. and F.-I. show different stages of early development from
germination to young, branched germling. E. and J. plurilocular gametangia. Size bars
indicate 20 µm for all panels except C., D. and I., where the size bar indicate 50 µm. See
Fig. 3 for the equivalent developmental stages of wild type sporophytes and
gametophytes.
73
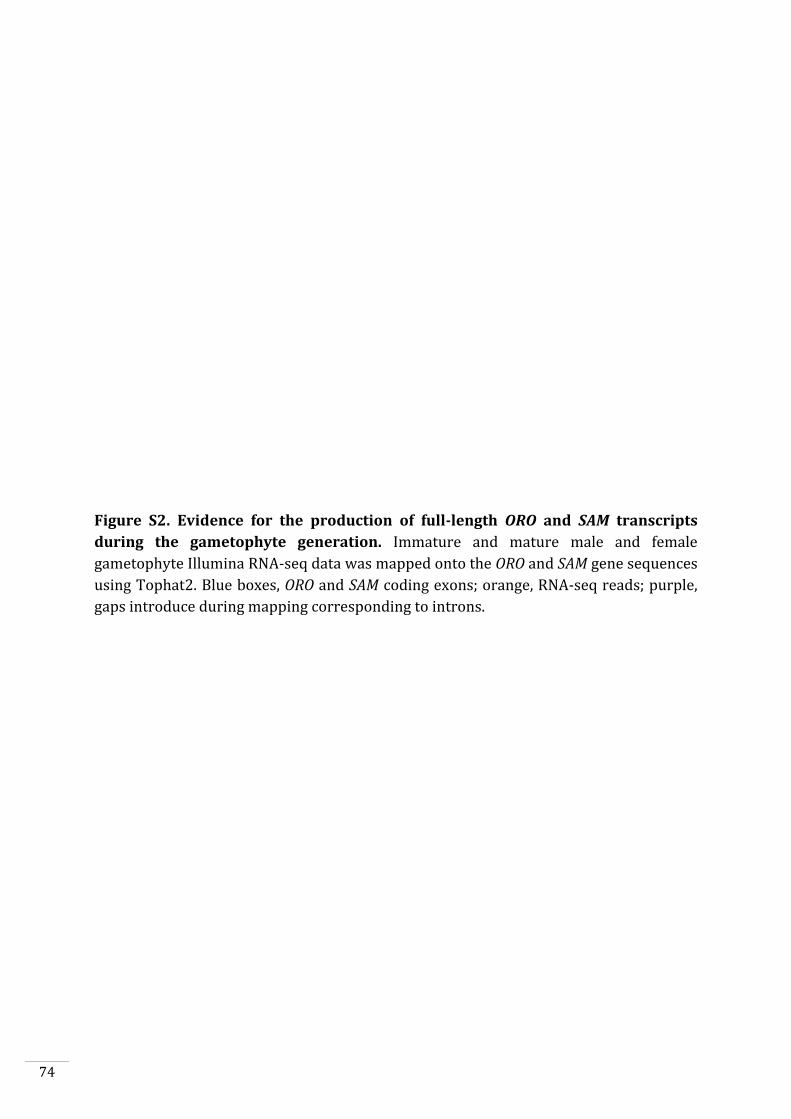
74
Figure S2. Evidence for the production of full-length ORO and SAM transcripts
during the gametophyte generation. Immature and mature male and female
gametophyte Illumina RNA-seq data was mapped onto the ORO and SAM gene sequences
using Tophat2. Blue boxes, ORO and SAM coding exons; orange, RNA-seq reads; purple,
gaps introduce during mapping corresponding to introns.
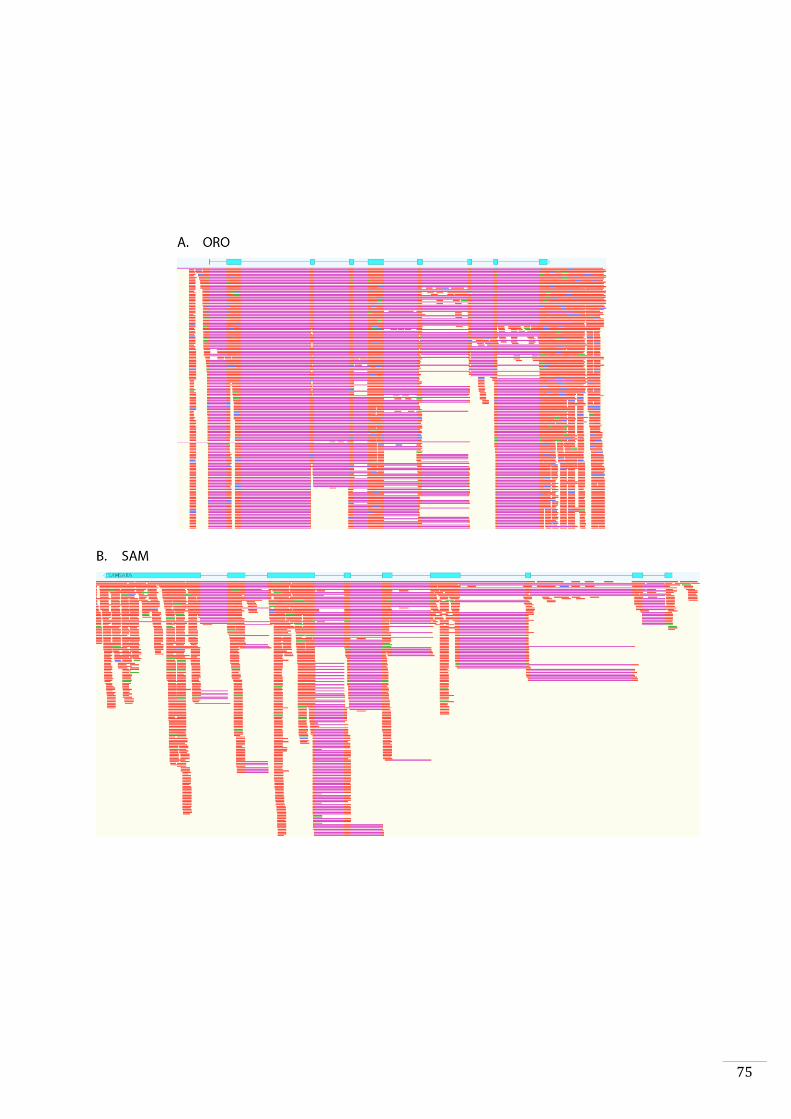
75
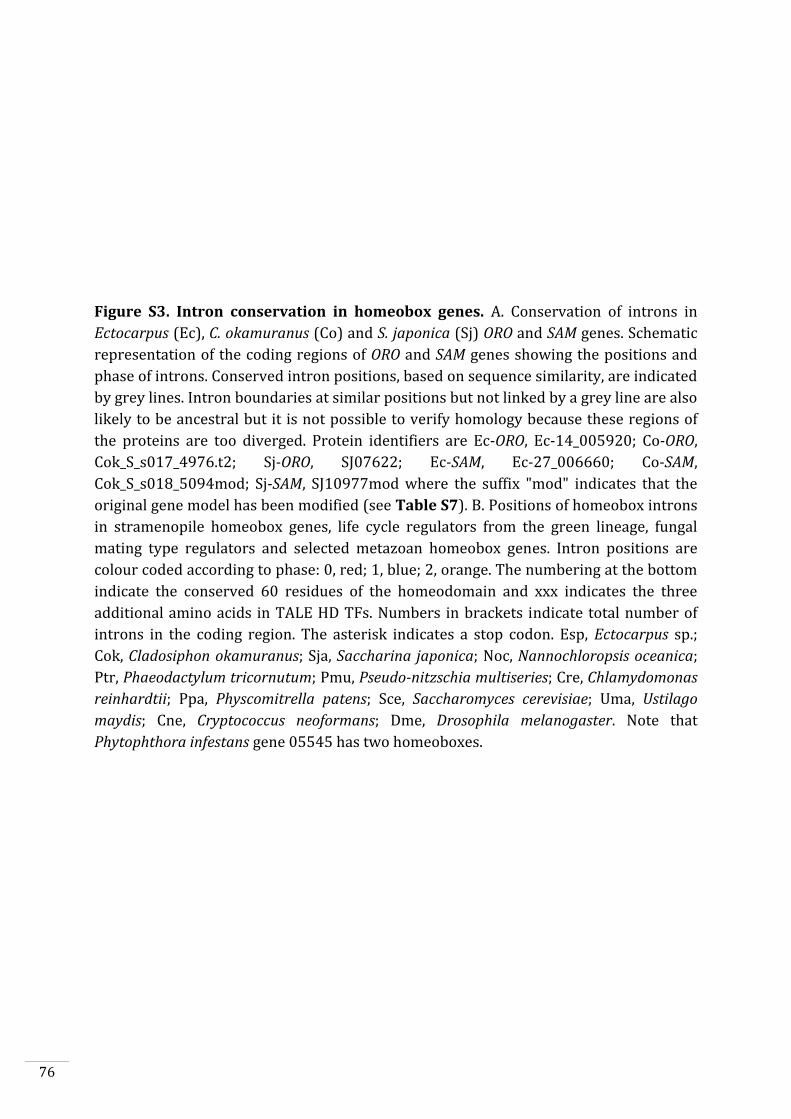
76
Figure S3. Intron conservation in homeobox genes. A. Conservation of introns in
Ectocarpus (Ec), C. okamuranus (Co) and S. japonica (Sj) ORO and SAM genes. Schematic
representation of the coding regions of ORO and SAM genes showing the positions and
phase of introns. Conserved intron positions, based on sequence similarity, are indicated
by grey lines. Intron boundaries at similar positions but not linked by a grey line are also
likely to be ancestral but it is not possible to verify homology because these regions of
the proteins are too diverged. Protein identifiers are Ec-ORO, Ec-14_005920; Co-ORO,
Cok_S_s017_4976.t2; Sj-ORO, SJ07622; Ec-SAM, Ec-27_006660; Co-SAM,
Cok_S_s018_5094mod; Sj-SAM, SJ10977mod where the suffix "mod" indicates that the
original gene model has been modified (see Table S7). B. Positions of homeobox introns
in stramenopile homeobox genes, life cycle regulators from the green lineage, fungal
mating type regulators and selected metazoan homeobox genes. Intron positions are
colour coded according to phase: 0, red; 1, blue; 2, orange. The numbering at the bottom
indicate the conserved 60 residues of the homeodomain and xxx indicates the three
additional amino acids in TALE HD TFs. Numbers in brackets indicate total number of
introns in the coding region. The asterisk indicates a stop codon. Esp, Ectocarpus sp.;
Cok, Cladosiphon okamuranus; Sja, Saccharina japonica; Noc, Nannochloropsis oceanica;
Ptr, Phaeodactylum tricornutum; Pmu, Pseudo-nitzschia multiseries; Cre, Chlamydomonas
reinhardtii; Ppa, Physcomitrella patens; Sce, Saccharomyces cerevisiae; Uma, Ustilago
maydis; Cne, Cryptococcus neoformans; Dme, Drosophila melanogaster. Note that
Phytophthora infestans gene 05545 has two homeoboxes.
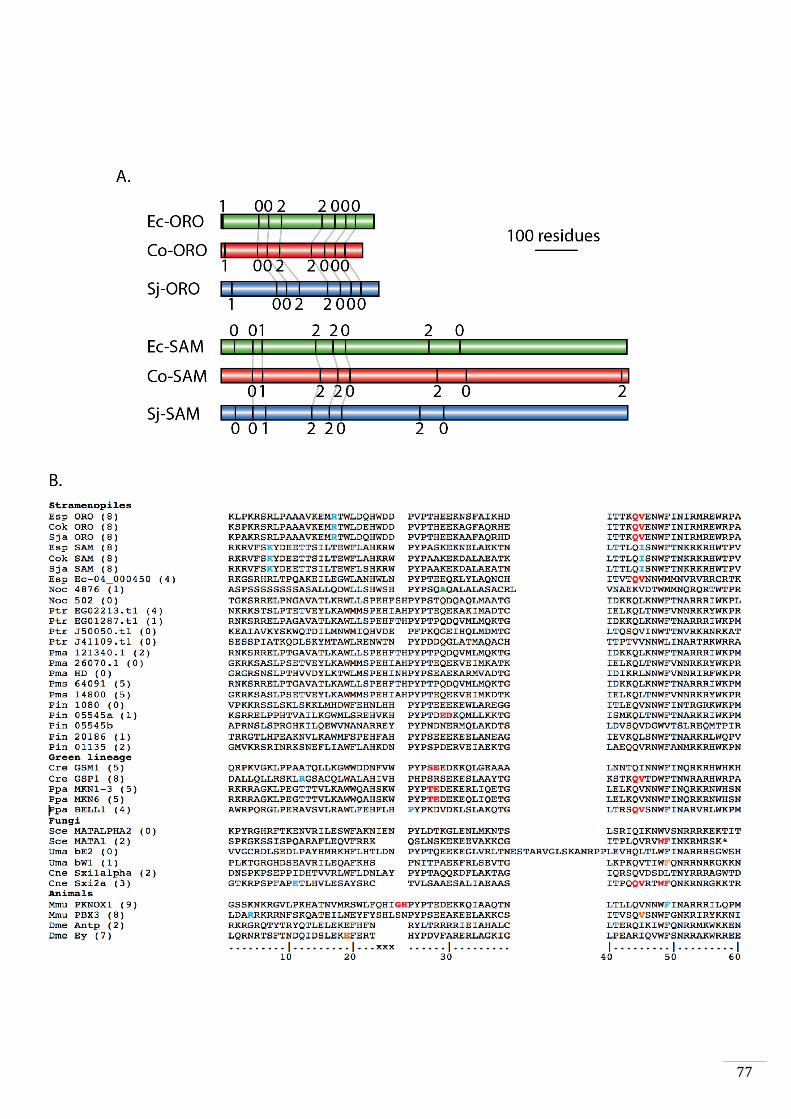
77

78
79
Chapter 3
Functional analysis of the Ectocarpus sp. life cycle regulators OUROBOROS and SAMSARA
This chapter presents an analysis of the in vitro DNA binding specificities of the TALE
homeodomain life cycle regulators OUROBOROS (ORO) and SAMSARA (SAM) and
describes the use of the yeast two-hybrid system to detect proteins that interact with
ORO and SAM. The results presented here will constitute a base for future work aimed at
further characterising the mode of action of ORO and SAM and linking the activity of
these two proteins to epigenetic modifications associated with life cycle progression.

80
81
INTRODUCTION
ORO and SAM, two TALE class homeodomain-containing transcription factors, are
master regulators of life-cycle progression in the brown alga Ectocarpus sp. Mutation of
either ORO or SAM leads to the development of a functional gametophyte instead of a
sporophyte (Coelho et al., 2011; Arun et al., unpublished, Chapter 2). This Chapter
focuses on analyses of the DNA binding preferences of ORO and SAM and on the
identification of proteins that associate with these two proteins and may therefore act as
cofactors to regulate gene expression.
Transcriptional regulation of developmental pathways depends on the specificity of
recognition of cis regulatory sequences by transcription factors (TFs). Distributed
throughout the genome, these short sequence motifs allow the TFs to bind to the genes
under their control. Specific binding occurs when TFs exhibit a high affinity for a
reduced repertoire of recognized sequences. In addition, TFs can bind with weak affinity
to variants of the bound sequence (Slattery et al., 2014). Weak affinity binding should
not be confused with non-specific binding (driven by electrostatic interactions between
negatively-charged DNA and positively-charged amino-acids) nor with non-consensus
binding (caused by the tendency for TFs to be attracted by repeated tracts of
nucleotides) (Slattery et al., 2014). TFs trigger gene expression by binding to cis
elements in their target genes. In general, binding of the TF to DNA is not sufficient to
initiate gene expression. TFs usually need to recruit other proteins or complexes such as
chromatin-remodelling factors and histone-modifier enzymes (methyltransferases and
acetyltransferases), which modify the local chromatin environment resulting in
nucleosome compaction and histone post-translational modifications in the vicinity of
transcription start sites (Kadonaga, 1998; Barrett and Wood, 2008; Voss and Hager,
2014). Transcription factors can also recruit, or be recruited by, others TFs to stabilise
their DNA accessibility and enhance their transcriptional activity.
In this chapter we aimed to both characterise the specificity of ORO and SAM binding to
target sequences in genomic DNA and to identify proteins that interact with these two
proteins. We used a range of approaches to assess and characterise the DNA binding
preferences of ORO and SAM and to identify the gene regulatory network involved in the
morphological transition between the gametophyte and sporophyte generations. These
included two in vitro approaches, protein binding microarrays (PBM, Berger and Bulyk,
82
2009) and DNA Affinity Purification (DAP-seq, O’Malley et al., 2016; Bartlett et al., 2017),
and an in vivo methodology, chromatin immunoprecipitation with nucleotide resolution
through exonuclease treatment, unique barcode and single ligation (ChIP-nexus, He et
al., 2015). A search for ORO and SAM interacting proteins was carried out using the
Yeast Two-Hybrid (Y2H) system and a cDNA library representing the sporophyte
proteome. Evidence that ORO and SAM interact to form a dimer in vitro was presented in
Chapter 2. Here, we focus on the identification of additional ORO/SAM interacting
proteins.
MATERIAL AND METHODS
1.1 Plasmid construction
All constructs were generated using the single-step directional cloning In-Fusion Cloning
system (Takara Bio/Clontech). First, the DNA fragment to be inserted was amplified by
PCR using the high fidelity CloneAmp HiFi PCR premix and oligonucleotides containing,
at the 5’ end, a minimum of 15 bases pairs which were homologous to the plasmid
region near the insertion site. Amplification products were purified on an agarose gel
and extracted using the NucleoSpin Gel and PCR clean-up kit (Macherey-Nagel). Then, in
vitro homology-based recombination was used to fuse the target linearized vector and
the DNA insert. Finally, recombination products were transformed into Escherichia coli
Stellar Cells (Clontech). In-frame ligation of each construct was confirmed by
sequencing.
Protein Binding Microarray, DAP-seq and epitope production
Fragments of the ORO (corresponding to amino acids 180-356) and SAM (corresponding
to amino acids 1-291) coding sequences were inserted into an EcoRI/BamHI-digested
pMAL-c2x plasmid (New England Biolabs) containing the Maltose Binding Protein
(MBP) gene from E. coli without its peptide signal (allowing the expressed MBP fusion
protein to be retained in the cytosol). The construct is under the control of the strong
and constitutive hybrid pTAC promoter and a lacI/lacO induction system.
83
Yeast Two-hybrid bait constructs
The full-length ORO and SAM coding sequences and various sub-fragments of these
sequences were inserted into an EcoRI/BamHI-digested pGBKT7 plasmid (Takara
Bio/Clontech). This plasmid encodes the DNA-binding domain of the Saccharomyces
cerevisiae GAL4 transcription factor following by a 34-aa linker containing a Myc tag
which allows production of a GAL4-DBD – Myc – Protein product (where DBD is the DNA
binding domain). The pCGAL-BK plasmid was engineered from the pGBK plasmid to
obtain a rearranged plasmid which allows the expression of a Myc – Protein – GAL4-DBD
construct (i.e. inversion of the two protein domains).
1.2 Yeast Two-Hybrid cDNA library
Total RNA was extracted from 200 mg of 3-week-old basal filaments of Ec32 partheno-
sporophytes using the RNeasy Plant Mini kit (Qiagen). cDNA library and plasmid
integration were carried out using 500 ng of total RNA with the high throughput Make
Your Own “Mate & Plate” Library System (Takara Bio/Clontech). cDNA first-strand
synthesis was performed using the SMART MMLV Reverse Transcriptase and the CDS III
oligonucleotide containing a poly-dT stretch. SMART III oligonucleotide was added to
the reverse transcription following manufacturer recommendations. Next, single-strand
cDNAs were amplified by long-distance PCR using the high fidelity Advantage2
Polymerase and primers which bind the CDS III and SMART III regions added during the
cDNA first-strand synthesis. Amplified double-strand cDNAs were purified on CHROMA
SPIN columns and the size range of the cDNA was checked on an agarose gel.
Purified cDNAs containing the flanking SMART III and CDS III sequences and the
linearized pGADT7-Rec plasmid were co-transformed into S. cerevisiae strain Y187 using
an optimized lithium acetate-mediated protocol available in the Yeastmaker Yeast
Transformation System (Takara Bio/Clontech). This co-transformation protocol uses the
homologous recombination machinery of the yeast cell to generate recombinant clones
between the target plasmid and the cDNA library via SMARTIII and CDS III sequences.
Transformants were grown on selective SD/-Leu agar plates and incubated at 30°C for 4
days. Then, transformants were harvested using YPDA + 25 % glycerol and frozen at -
80°C. These transformants contained at least one plasmid construction encoding
84
recombinants between the transcriptional activation domain (TAD) of GAL4 and a
random, nearly full length cDNA coding region.
1.3 Yeast Two-Hybrid Assay
Strain genotypes
The GAL4 system uses a combination of the DBD and TAD of the GAL4 protein to
activate reporter genes which complement allotrophic phenotypes or produce reporter
proteins. The Y2H Gold and Y187 strains are unable to grow in minimum medium that
lacks specific amino-acids or nucleic acid precursors such as leucine (leu2), tryptophane
(trp1), histidine (his3) and adenine (ade2). The specific requirements depend on the
genotype of each strain. Moreover, both strains carry deletions of the Gal4 and Gal80
(negative regulator of Gal4) genes. In addition, the Y2H Gold strain carries three
reporter constructs GAL2 – Ade2, LYS2:GAL1 – His3 and MEL1 – Aur1-C. The three
reporter constructs contain an upstream activating sequence that is recognised by the
GAL4-DBD. The coding regions of these reporter genes correspond to ADE2 and HIS3
which complement the ade2 and his3 genotypes and the AUR1-C gene, which confers
resistance to Aureobasidin A. As the Y2H Gold and Y187 strains are of opposite mating-
type, genetic crosses between a Y2H Gold clone and a Y187 clone are possible.
Selection of bait and prey combinations in yeast
Bait constructs (pGBKT7 plasmids) were individually transformed into the S. cerevisiae
Y2H Gold strain (Matchmaker Gold Yeast Two-Hybrid System from Takara
Bio/Clontech) and grown on selective SD/-Trp agar plates with autotrophy being
conferred by the TRP3 gene. Prey constructs (pGADT7-Rec plasmids) were transformed
into the Y187 strain and grown on selective SD/-Leu plates with autotrophy being
conferred by the LEU2 gene. Again, transformations were performed using the
Yeastmaker Yeast Transformation System.
Mating and screening for prey-bait interactions
An overnight culture of the bait construct was incubated in SD/-Trp liquid medium until
the optical density at 600 nm reached 0.8. Then, cells were pelleted and resuspended in
4 ml SD/-Trp. One millilitre of the prey library (from a -80°C stock) was combined with
85
the bait in 45 ml 2x YPDA. This mating culture was incubated for 24 hours at 30°C on an
orbital shaker.
The resulting diploid yeasts are capable of growing on selective SD/-Trp/-
Leu/+Aureobasidin A agar plates at 30°C for 3 days. This medium reduces the number of
diploid colonies by keeping only those with are resistant to the Aureobasidin A.
Screening for interaction between the prey and bait proteins was carried out by
transferring the diploid yeast colonies to a high stringency selective SD/-Trp/-Leu/-
Ade/-His medium.
Extraction and cloning of prey plasmids
Prey plasmids were extracted from positive diploid yeast colonies with the Easy Yeast
Plasmid Isolation kit (Takara Bio/Clontech). These plasmids were transformed into E.
coli Stellar Cells strain and selected on LB agar plates with ampicillin. Plasmids were
then extracted from propagated E. coli clones and sequenced. Sequences were blasted
against the Ectocarpus genome and transcript database. GAL4-TAD – protein fusion
constructs were sequenced to verify that they were in-frame and did not contain any
mutations.
Small-scale interaction screening
Purified plasmids containing strongly interacting candidates were independently
retransformed into strain Y187.
Colonies carrying bait constructs and prey candidates were selected from fresh agar
plates and mixed in 200 μl of YPDA in tubes with a screw cap. Mixed cultures were
incubated for 20 hours at 30°C on an orbital shaker. Tubes were incubated horizontally
to avoid cell sedimentation and improve mating.
Prey candidates were also tested against several sub-fragments and deletions of the bait
construct to determine which domain of the bait protein was responsible for the
interaction. Prey candidates were additionally tested against an empty bait construct
(pGBKT7 empty) as a control.
86
1.4 Protein Binding Microarray
Protein Binding Microarray (PBM) experiments were carried out in collaboration with
José Manuel Franco-Zorrilla (CSIC, Madrid). PBM analysis was based on Franco-Zorrilla
et al. (2014). Briefly, pMAL-c2x plasmids encoding MBP-ORO and MBP-SAM protein
fusions were transformed into E.coli BL21 strain for expression. Bacterial cultures were
induced at 18°C for 24 hours with 300 μM IPTG. Expression was assessed by SDS-PAGE
and Coomassie staining. Remaining cultures were pelleted, resuspended in 1 ml 1x
binding buffer and sonicated as described in Franco-Zorrilla et al. (2014) and Godoy et
al. (2011). Clear extracts were obtained by centrifugation. The binding mixture was
adjusted to contain 2% milk and 0.89 μg denatured salmon sperm. PBM11 contains all
possible double-stranded 11-mers, synthesized by Agilent Technologies. Arrays were
incubated with the binding mixture for 2.5h at room temperature and then washed
three time with 1% PBS-Tween 20, 0.01% PBS-Triton X-100. TF-bound arrays were
incubated with a rabbit polyclonal anti-MBP (Abcam) for 16 hours and then washed as
previously. A secondary goat anti-rabbit DyLight 549-conjugated antibody was used to
identify targeted probes using a microarray scanner. Arrays were scanned twice to
quantify the DNA and the DNA-protein complexes. Normalization of probe intensities
and calculation of the enrichment scores (also called E-scores) for each possible 8-mer
were carried out with the PBM Analysis Suite (Berger and Bulyk, 2009).
For each transcription factor, we selected the 8-mers with E-scores higher than 0.45 to
generate a high affinity primary motif. Position Weight Matrices (PWM) were built with
MEME (Bailey and Elkan, 1994; Bailey et al., 2009). In silico site-directed mutagenesis
analysis was carried out by sorting 8-mers containing the primary 6 bp motif modified
at a single base. Mutated 8-mers were retained as secondary 8-mers if their median
value was higher than 0.3. Cluster analysis to compare binding preferences of ORO and
SAM with KNAT3 and KNAT6 from Arabidopsis thaliana, CUP9 from Saccharomyces
cerevisiae and TGIF1 and MEIS1 from Homo sapiens was carried out using PBM data
available in the CIS-BP database (cisbp.ccbr.utoronto.ca/ ; Weirauch et al., 2014).
1.5 DAP-seq
DNA Affinity Purification (DAP) experiments were carried out following the protocol
from O’Malley et al. (2016) and Bartlett et al. (2017) with some modifications. Genomic
87
DNA for the Ectocarpus Ec32 strain was fragmented to a target size of 200 bp using a
Covaris M220 ultrasonicator. Fragmented DNA was purified and concentrated using
AMPure XP magnetic beads (Agencourt). Ten micrograms of blunt-ended, fragmented
DNA was obtained with the NEBNext End Repair Module (New England Biolabs) and
purified with the NucleoSpin Gel and PCR clean-up kit (Macherey-Nagel). Next,
desoxyribo-adenine was added to the blunt ends with the NEBNext dA-Tailing Module
(New England Biolabs) and the fragments were purified again with the NucleoSpin Gel
and PCR clean-up kit (Macherey-Nagel). Double-stranded adaptors were ligated to the
dA-tailed, fragmented DNA using the NEBNext Quick Ligation Module (New England
Biolabs), purified with AMPure XP magnetic beads (Agencourt) and eluted in 52 μl 10
mM Tris HCl pH 8. MBP-ORO and MBP-SAM constructs were produced under conditions
similar to those of the PBM experiments in the BL21 strain. Bacteria were mechanically
lysed in 1 ml of MBP Column Binding buffer (200 mM NaCl, 20 mM Tris-HCl pH 7.4, 1
mM EDTA, 1mM DTT) with cOmplete ULTRA antiproteases tablets (Roche).
Recombinant proteins were immobilized on amylose magnetic beads (New England
Biolabs) and washed three times with 1 ml of MBP Column Binding buffer. Ligated DNA
was mixed with amylose magnetic beads and incubated for one hour at room
temperature on a rotating agitator. The beads were then washed four times with MBP
Column Binding buffer and boiled for 10 minutes at 98°C in a thermal cycler. Free DAP-
DNA was amplified with the Illumina TruSeq Universal and Illumina TruSeq Index
primers to allow multiplexing. Sequencing was carried out on an Illumina MiSeq
platform with a v3 MiSeq Reagent Kit and pair-end sequencing primers over 75 cycles.
Reads were trimmed using Cutadapt v1.8.3 and mapped onto the Ectocarpus genome
v3.0 with Bowtie v1 using default parameters in pair-end mode. Peak calling was carried
out with the MACS2 (Zhang et al., 2008) callpeak module and a minimal FDR of 0.001 (-q
0.001) in pair-end mode (-f BAMPE) with removal of duplicates (--keep-dup 1). Fasta
sequences of bound regions were retrieved using the BedTools getfasta module. Motifs
were found with the MEME program set with any number of repetitions (-mod anr),
minimal motif size of 6 bp (-minw 6), maximal motif size of 10 bp (-maxw 10) for 30
motifs (-nmotifs 30) and reverse complement analysis (-revcomp) on the top 100 peaks
ranked by decreasing -log10FDR. De novo motif discovery was also performed using the
KMAC module of GEM peak caller software using all peaks or peaks that were not
localized in transposable elements (Guo et al., 2012; Guo et al., 2017).
88
1.6 Production of anti-ORO and anti-SAM antibodies
Recombinant proteins MBP – ORO (residues 180-356) and MBP – SAM (residues 1-291)
were produced. Two rabbits were immunized per recombinant protein following the
Speedy 28-Day program (Eurogentec). Pre-immune bleeds (hereafter called PPI) were
performed before the first injection. Then, 100 μg of purified protein were used per
rabbit and per injection. Three injections were performed at 0, 10 and 18 days. The final
bleed was carried out to sample serum containing antibodies (hereafter called SAB) at
the twenty-eighth day.
1.7 ChIP-nexus
The ChIP-nexus protocol for Ectocarpus combines the cross-linking, nuclei extraction
and immunoprecipitation protocols developed for the standard ChIP-seq protocol (see
Chapter 4) with an on-bead library preparation protocol developed by He et al. (2015).
ChIP-nexus is a derivative of the ChIP-exo protocol developed by in Rhee and Pugh
(2012). Two grams for each of the two replicates of fresh 3-week old Ectocarpus Ec32
strain partheno-sporophytes were crosslinked with 1% formaldehyde for 8 minutes.
The crosslinking reaction was quenched using 400 mM glycine in PBS for 5 minutes.
Partheno-sporophytes were washed twice with PBS and quickly frozen in liquid
nitrogen. Nuclei were isolated using an optimized Nuclei Isolation Buffer (see Chapter
4). Chromatin fragments were obtained by sonication of isolated nuclei with a Covaris
M220 in Nuclei Lysis Buffer (see Chapter 4). Five hundred microliter aliquots of tenfold
diluted sonicated chromatin were used per immunoprecipitation. Each aliquot
contained the equivalent of 200 mg of starting tissue. Rabbit polyclonal serum raised
against either ORO or SAM proteins or a rabbit pre-immune serum collected before
immunization, were used for each immunoprecipitation (10 μl). Sonicated chromatin
and serum were co-incubated on a rotating agitator at 4°C overnight. Chromatin-IgG
complexes were captured using 100 μl of a mix of Dynabeads Protein A and Protein G-
coupled magnetic beads (ratio 1:1) for 2 hours under gentle rotation. ChIP samples were
then washed with Wash buffers A to D and 10mM Tris pH 7.5 from the He et al. (2015)
protocol. The next steps were carried out on the chromatin-IgG complexes immobilized
on magnetic beads. First, the ChIP DNA was end repaired. Desoxyribo-adenine was then
added to DNA ends and Nexus adaptors were ligated with Quick Ligase (New England
Biolabs). Contrary to standard Illumina adaptors, Nexus adaptors contain a pair of head-
89
to-head sequences for library amplification separated by a BamHI site and a 5’ end
random barcode. After adaptor ligation, DNA was digested with λ-exonuclease from the
5’ to 3’ end until it encountered a crosslinked protein. Digested DNA was eluted at 65°C
and 1000 rpm for 20 minutes and reverse crosslinked for at least 6 hours in an
Eppendorf Thermomixer. The DNA was purified by carrying out an RNAse A digestion
(0.1 mg) followed by a Proteinase K digestion (0.2 mg) and then a phenol-chloroform-
isoamyl alcohol extraction. The DNA was precipitated using glycogen, 20 μl NaOAc and
500 μl ethanol and resuspended in 12 μl of Nuclease-Free water. Nexus samples were
denatured by incubating at 95°C for 5 minutes. Single-stranded DNA circularization was
performed using the CircLigase ssDNA Ligase (Epicentre). This step allows
circularisation of single-stranded DNA from denaturated samples. Intramolecular
ligation has a higher probability to occur than intermolecular ligation. Circular single-
stranded DNA is annealed with a cut oligonucleotide complementary to the head-to-
head adaptors separated by a BamHI site. Then, single-stranded DNA was digested with
FastDigest BamHI. This step allows the adaptors to be distributed to each end of the
DNA fragment. Illumina TruSeq Universal and Index sequencing adaptors were added by
PCR using Phusion High-Fidelity DNA Polymerase (New England Biolabs). Finally,
libraries were purified on an agarose gel, excised on a Dark Reader transilluminator
(Clare Chemical) and extracted with the MinElute Gel Extraction kit (Qiagen). Libraries
were sequenced on an Illumina HiSeq 4000 platform with single-end sequencing primer
over 50 cycles by the Swiss company Fasteris.
Sequencing read data were analyzed using the Q-nexus pipeline (Hansen et al., 2016).
The first program of this pipeline is Flexcat, which was set as follows: -tl5 –tt –t –ml 0 –
er 0.2 –ol 4 –app --ss. Flexcat allows adaptor trimming and transfer of the random
barcode in the header. Trimmed reads were mapped against the Ectocarpus genome
v3.0 using Bowtie v1 and the following parameters: -k 1 -m 1 --chunkmbs 512 --strata --
best -S. Then, mapped reads were filtered using Nexcat software, removing reads that
were mapped to the same position and had the same random barcode. This step allows
PCR duplicates to be removed whilst retaining real molecular duplicates. Finally, peaks
were called using the saturation-based method available in Q with the --nexus mode.
90
RESULTS
In vitro DNA-binding capacities of ORO and SAM
ORO and SAM are predicted to encode two TALE-HD TFs. A Protein Binding Microarray
(PBM) experiment was carried out to confirm that these proteins are able to interact
with DNA and to determine the DNA-binding specificities of the two factors. The PBM is
designed to present all possible double-stranded 11-mers (PBM11 design) to a test TF
(Godoy et al., 2011). PBM data are analysed using the PBM Analysis Suite and the non-
parametric enrichment score (E-score) is used to rank k-mers as a function of TF
affinity. E-scores range from -0.5 (lowest enrichment) to +0.5 (highest enrichment). 8-
mers with a E-score > 0.45 are considered to be high affinity sequences. Motifs with a
score greater than 0.3 (but lower than 0.45) are considered to represent weak affinity.
Analysis of high affinity 8-mers (E-score > 0.45), provide the TF binding motif.
ORO bound 58 8-mers at high affinity whereas SAM bound only 15 8-mers at high
affinity. The highest affinity 8-mer (TGACGTCA) recognized by both ORO and SAM was
ranked as the highest affinity 8-mer for ORO (E-score = 0.489) and the second highest
affinity 8-mer for SAM (E-score = 0.475). This 8-mer included a 4 bp TGAC motif, which
has been previously identified in the binding motifs of several other TALE homeodomain
TFs that contain a homeodomain with the “WFI50N” motif (Knoepfler et al., 1997; Krusell
et al., 1997; Bertolino et al., 1995). All of the high affinity 8-mers bound by SAM
contained the TGAC motif or the shorter sequence GAC. In contrast, a majority of the
high affinity 8-mers bound by ORO (77.6%) contained a TGATG motif suggesting that the
two transcription factors have different binding preferences. Primary position weight
matrix (PWMs) motifs were built for both ORO and SAM based on the frequency of each
nucleotide using the MEME software (Fig. 1).
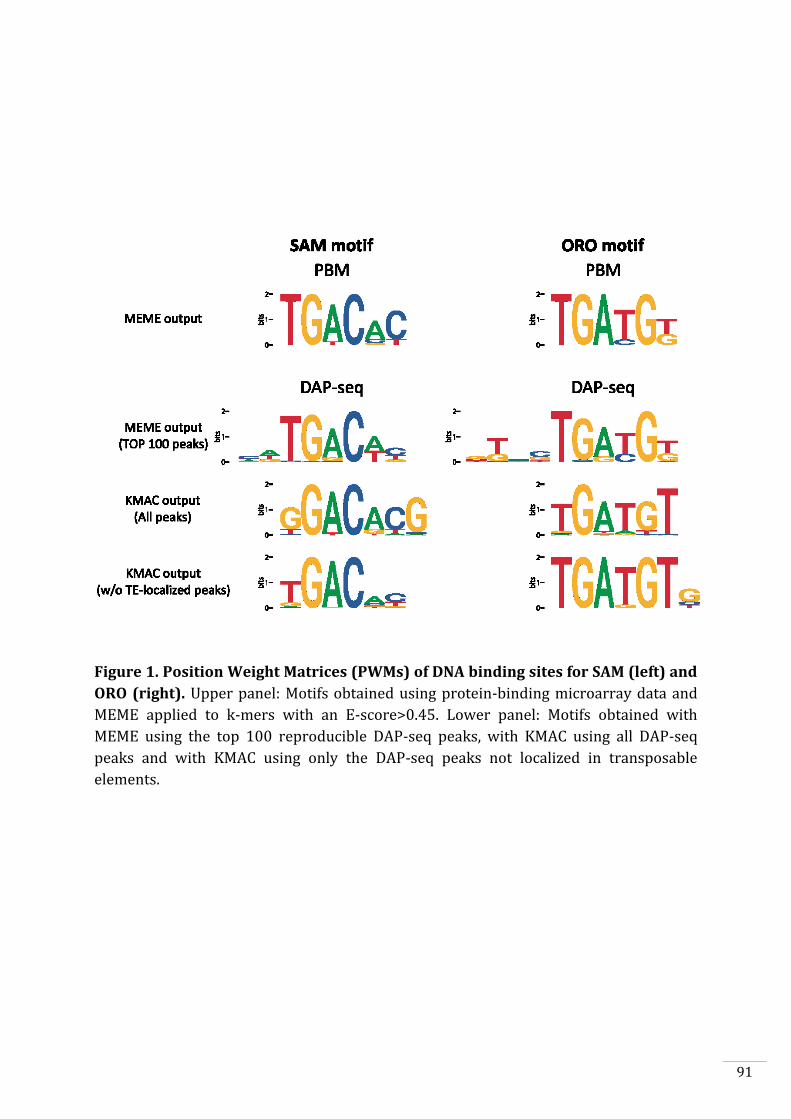
91
Figure 1. Position Weight Matrices (PWMs) of DNA binding sites for SAM (left) and
ORO (right). Upper panel: Motifs obtained using protein-binding microarray data and
MEME applied to k-mers with an E-score>0.45. Lower panel: Motifs obtained with
MEME using the top 100 reproducible DAP-seq peaks, with KMAC using all DAP-seq
peaks and with KMAC using only the DAP-seq peaks not localized in transposable
elements.
92
We evaluated the affinity of ORO and SAM for their primary motifs using in silico
directed mutagenesis (Fig. 2). The large number of probes on the PBM means that every
8-mer is represented, and any particular 6 bp sequence can be found in 48 different 8-
mers, allowing multiple testing of binding to any 6 bp motif. In silico mutagenesis of the
primary motif can be carried out by substituting individual nucleotides within the motif
with one of the three alternative nucleotides. Sequences recognised with very low or
zero affinity have a median E-score lower than 0.3, whereas median E-scores of between
0.3 and 0.45 correspond to weak affinity. As expected, the highest E-score distribution
was obtained for the 8-mers that contained 6 bp sequences corresponding to the PWMs
for both ORO and SAM (Fig. 2.A-B). For ORO, the mutated motif AGATGT (replacement
of the first thymine by an adenine) had E-scores between 0.12 and 0.41 (median 0.32)
and could be a weak affinity sequence (Fig. 2.A). Mutation of any other nucleotide
positions in the motif drastically affected the affinity for the ORO protein. These results
indicate that ORO binds a specific motif corresponding to the primary element 5’-
TGA[C/T]G[T/G]-3’. In contrast, SAM bound strongly to several additional 6 bp
sequences that did not contain its primary motif (Fig. 2.B). For SAM, therefore, it
appears that the first, fifth and sixth positions of the primary motif can be modified with
only minor effects on DNA binding activity. SAM therefore binds to the primary motif 5’-
TGAC[A/C/G][C/T]-3’ and exhibits a small repertoire of secondary motifs.
To summarise, ORO appears to bind its primary motif in a highly specific manner,
whereas SAM is more permissive. These results suggest that binding of an ORO/SAM
heterodimer to DNA would primarily be guided by ORO and that, in this situation, SAM
may able to bind to any sequence sufficiently similar to its primary motif.
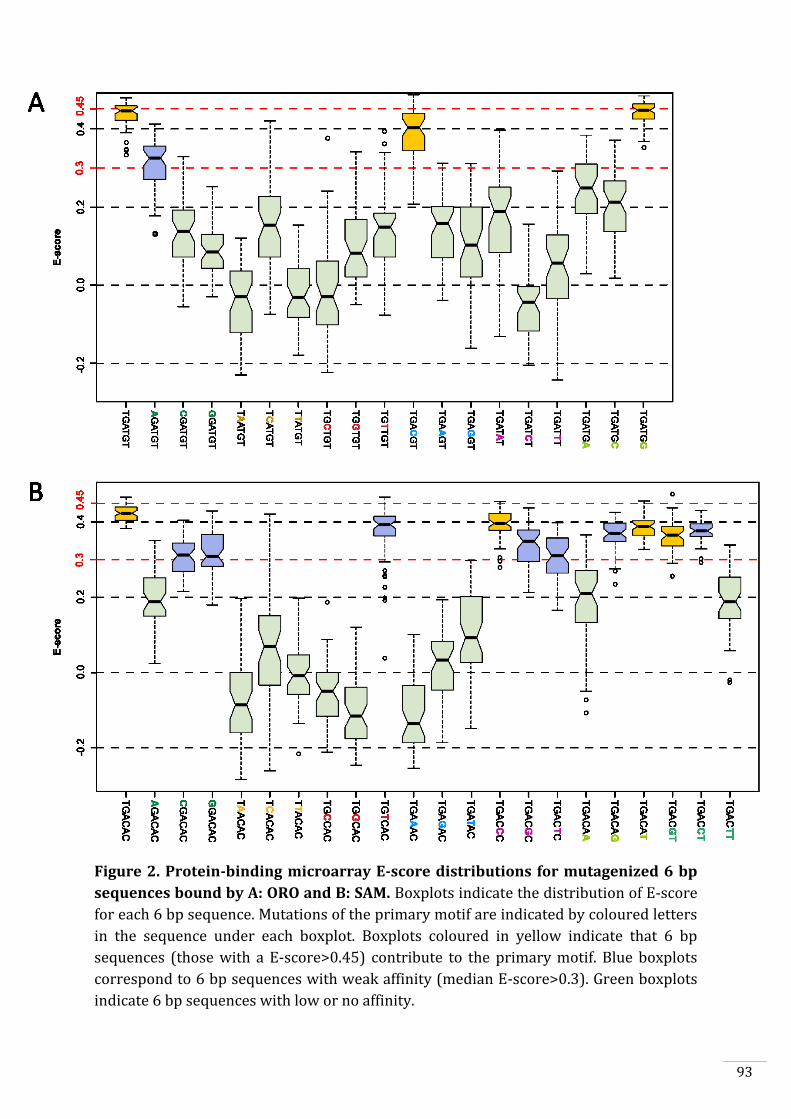
93
Figure 2. Protein-binding microarray E-score distributions for mutagenized 6 bp
sequences bound by A: ORO and B: SAM. Boxplots indicate the distribution of E-score
for each 6 bp sequence. Mutations of the primary motif are indicated by coloured letters
in the sequence under each boxplot. Boxplots coloured in yellow indicate that 6 bp
sequences (those with a E-score>0.45) contribute to the primary motif. Blue boxplots
correspond to 6 bp sequences with weak affinity (median E-score>0.3). Green boxplots
indicate 6 bp sequences with low or no affinity.
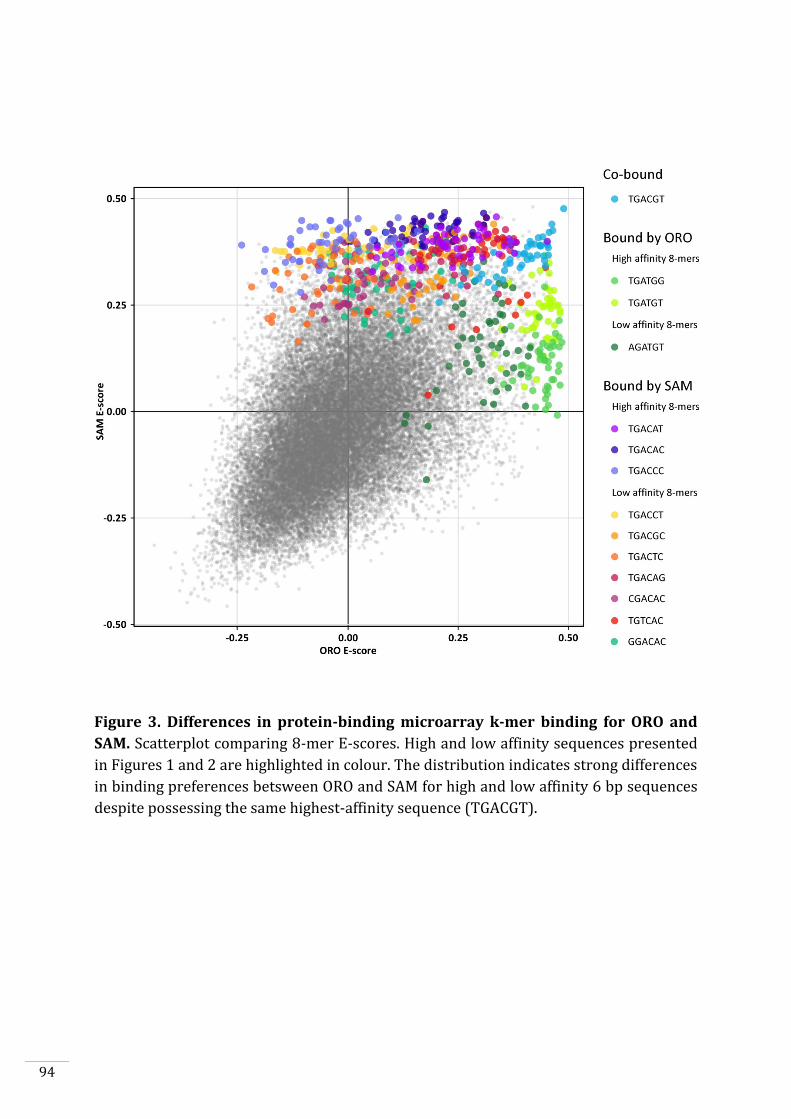
94
Figure 3. Differences in protein-binding microarray k-mer binding for ORO and
SAM. Scatterplot comparing 8-mer E-scores. High and low affinity sequences presented
in Figures 1 and 2 are highlighted in colour. The distribution indicates strong differences
in binding preferences betsween ORO and SAM for high and low affinity 6 bp sequences
despite possessing the same highest-affinity sequence (TGACGT).
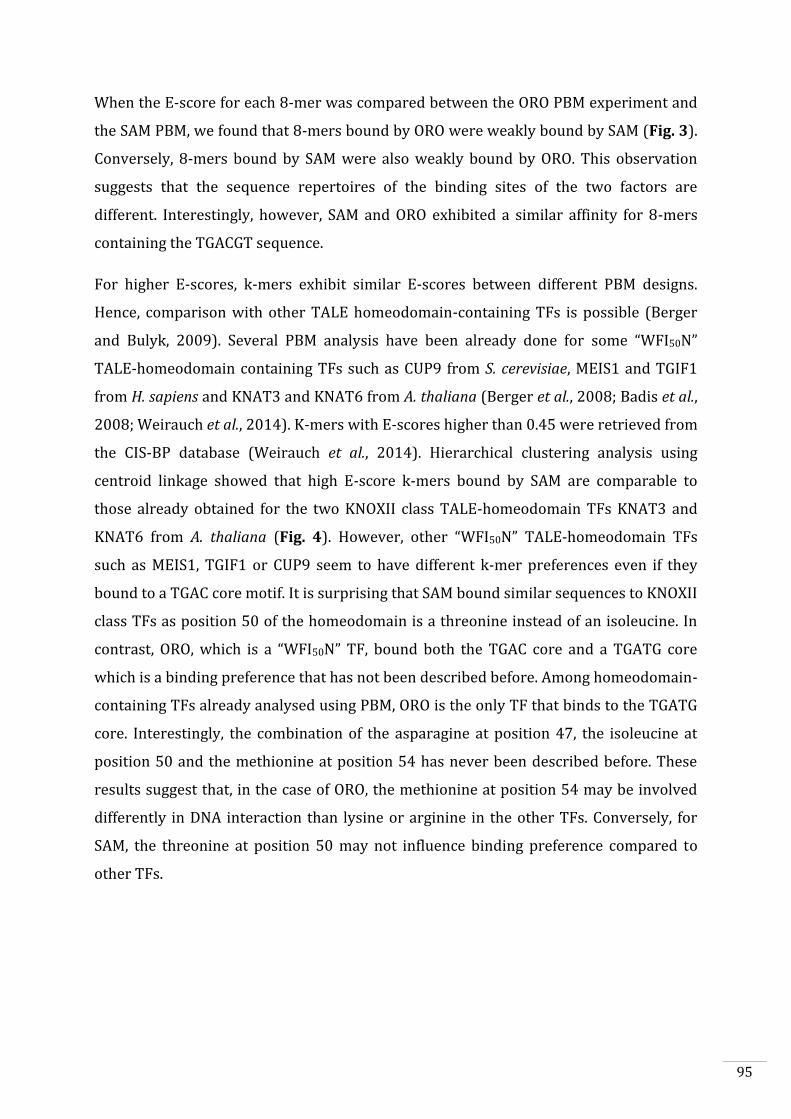
95
When the E-score for each 8-mer was compared between the ORO PBM experiment and
the SAM PBM, we found that 8-mers bound by ORO were weakly bound by SAM (Fig. 3).
Conversely, 8-mers bound by SAM were also weakly bound by ORO. This observation
suggests that the sequence repertoires of the binding sites of the two factors are
different. Interestingly, however, SAM and ORO exhibited a similar affinity for 8-mers
containing the TGACGT sequence.
For higher E-scores, k-mers exhibit similar E-scores between different PBM designs.
Hence, comparison with other TALE homeodomain-containing TFs is possible (Berger
and Bulyk, 2009). Several PBM analysis have been already done for some “WFI50N”
TALE-homeodomain containing TFs such as CUP9 from S. cerevisiae, MEIS1 and TGIF1
from H. sapiens and KNAT3 and KNAT6 from A. thaliana (Berger et al., 2008; Badis et al.,
2008; Weirauch et al., 2014). K-mers with E-scores higher than 0.45 were retrieved from
the CIS-BP database (Weirauch et al., 2014). Hierarchical clustering analysis using
centroid linkage showed that high E-score k-mers bound by SAM are comparable to
those already obtained for the two KNOXII class TALE-homeodomain TFs KNAT3 and
KNAT6 from A. thaliana (Fig. 4). However, other “WFI50N” TALE-homeodomain TFs
such as MEIS1, TGIF1 or CUP9 seem to have different k-mer preferences even if they
bound to a TGAC core motif. It is surprising that SAM bound similar sequences to KNOXII
class TFs as position 50 of the homeodomain is a threonine instead of an isoleucine. In
contrast, ORO, which is a “WFI50N” TF, bound both the TGAC core and a TGATG core
which is a binding preference that has not been described before. Among homeodomain-
containing TFs already analysed using PBM, ORO is the only TF that binds to the TGATG
core. Interestingly, the combination of the asparagine at position 47, the isoleucine at
position 50 and the methionine at position 54 has never been described before. These
results suggest that, in the case of ORO, the methionine at position 54 may be involved
differently in DNA interaction than lysine or arginine in the other TFs. Conversely, for
SAM, the threonine at position 50 may not influence binding preference compared to
other TFs.
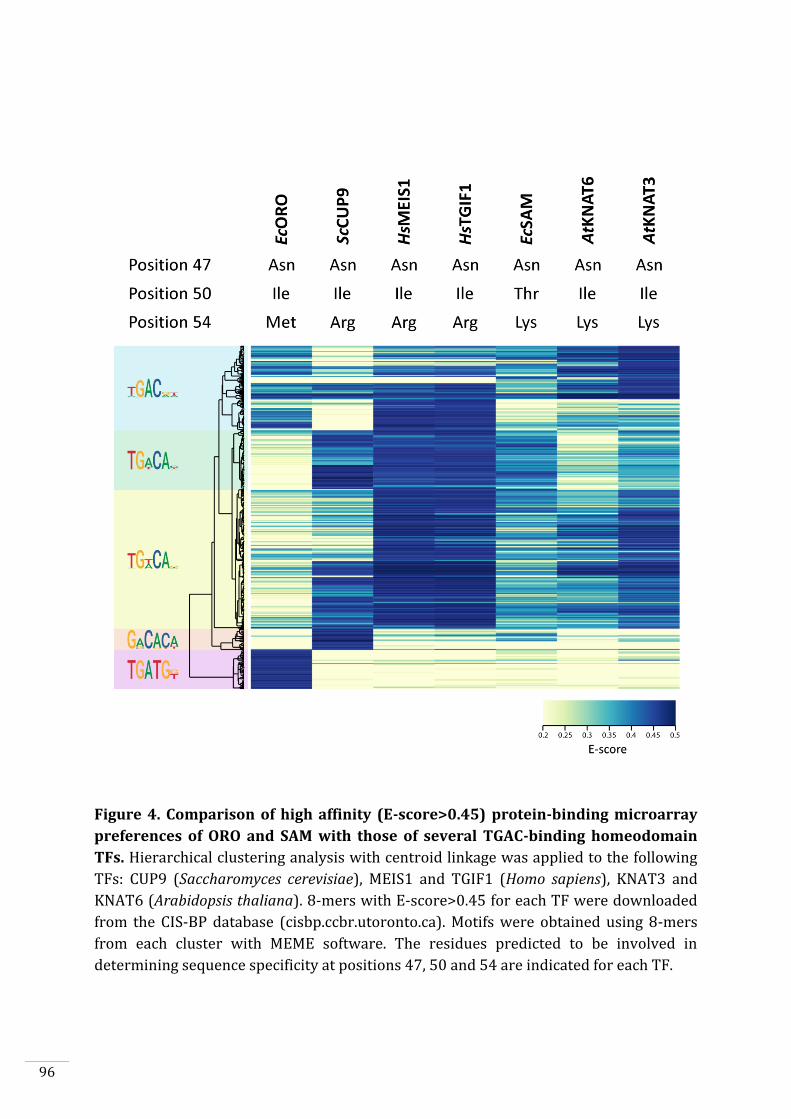
96
Figure 4. Comparison of high affinity (E-score>0.45) protein-binding microarray
preferences of ORO and SAM with those of several TGAC-binding homeodomain
TFs. Hierarchical clustering analysis with centroid linkage was applied to the following
TFs: CUP9 (Saccharomyces cerevisiae), MEIS1 and TGIF1 (Homo sapiens), KNAT3 and
KNAT6 (Arabidopsis thaliana). 8-mers with E-score>0.45 for each TF were downloaded
from the CIS-BP database (cisbp.ccbr.utoronto.ca). Motifs were obtained using 8-mers
from each cluster with MEME software. The residues predicted to be involved in
determining sequence specificity at positions 47, 50 and 54 are indicated for each TF.

97
98
Genome-wide identification of ORO and SAM binding sites in vivo
A ChIP-nexus approach was used to identify ORO and SAM binding sites in the genome of
Ectocarpus in vivo. Two independent batches of antibodies were raised for each
transcription factor in rabbits using MBP-ORO 180-356 and MBP-SAM 1-291
recombinant proteins as epitopes. For each batch, pre-immune serums were sampled
before the first immunisation. Cross-reaction and specificity of each antibody was
assessed by western blot against the full-length versions of the ORO protein (residues 1
to356), the SAM protein (residues 1 to 949) and of the third TALE homeodomain-
containing transcription factor encoded by the Ectocarpus genome (Locus ID Ec-
04_000450), together with the following truncated proteins: ORO 1-167, SAM 1-291. All
proteins were produced with a HA-tag using recombinant clones in pGADT7-AD and the
TNT Quick Coupled Transcription/Translation System (Promega). Expression of the HA-
tag proteins was verified using an anti-HA antibody. The two batches of anti-ORO
antibodies (SAB0339 and SAB0340) did not cross-react with HA-SAM nor with HA-Ec-
04_000450 (Fig. 5.A). Similarly, the anti-SAM antibodies (SAB1646 and SAB1647) did not
cross-react with HA-ORO nor HA-Ec-04_000450 (Fig. 5.B). Moreover, the anti-ORO
antibodies did not recognize the N-terminal domain of ORO (residues 1 to 167).
Background noise was relatively low and comparable to that of the respective pre-
immune-serums (PPI0339, PPI0340 and PPI1646, PPI1647).
The above experiments confirmed that the anti-ORO and anti-SAM antibodies specifically
detected their respective proteins, but we were unable to detect the ORO and SAM
proteins in total protein extracts from basal filaments of partheno-sporophytes.
Transcripts of the two genes are present at this stage (Chap. 2, Fig. 3A) but it is possible
that the proteins are not sufficiently abundant to be detected by western blot. We
nonetheless attempted to detect DNA-bound ORO and SAM proteins using the ChIP-nexus
approach and partheno-sporophyte tissue. ORO and SAM transcripts are more abundant
in gametes than in partheno-sporophytes (Chap. 2, Fig. 3A) but, since chromatin
immunoprecipitation methods require large amounts of tissue, it was not possible to
carry out ChIP experiments on isolated gametes. The experimental design consisted of
two independent antibodies batches per transcription factor and two biological
replicates. For each antibody or pre-immune serum, two immunoprecipitations were
performed per replicate and pooled. The objective, with this strategy was to only retain
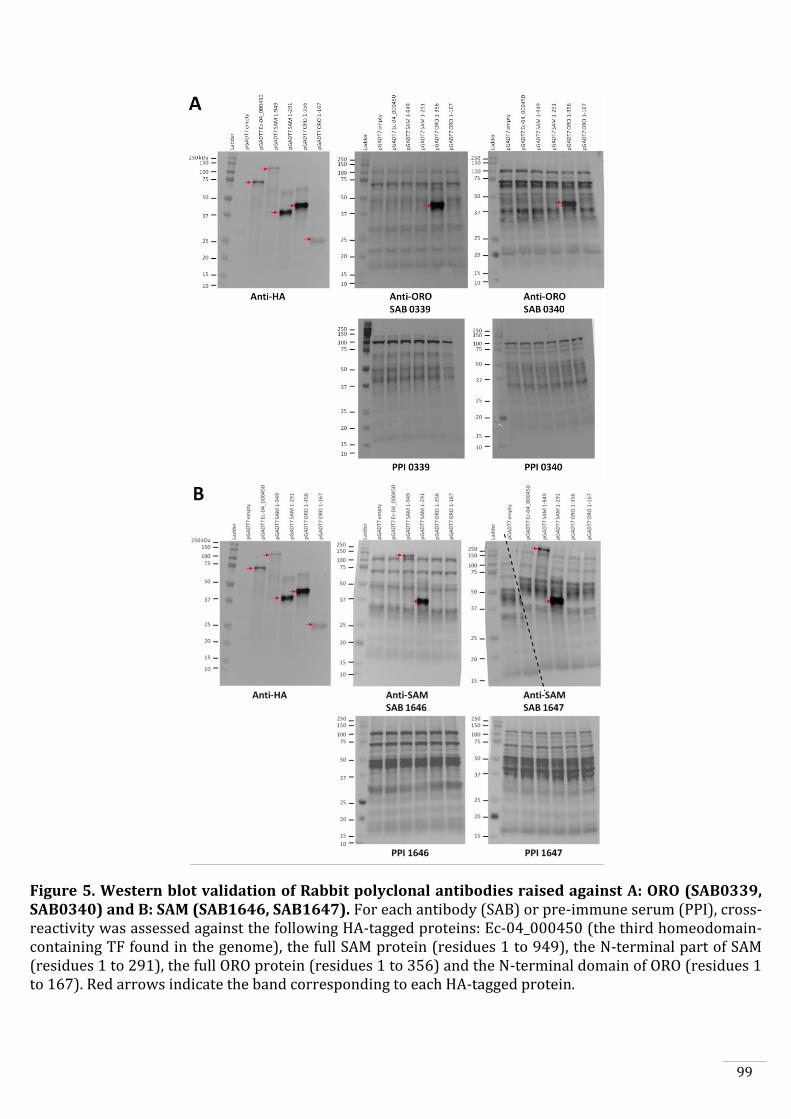
99
Figure 5. Western blot validation of Rabbit polyclonal antibodies raised against A: ORO (SAB0339, SAB0340) and B: SAM (SAB1646, SAB1647). For each antibody (SAB) or pre-immune serum (PPI), cross-reactivity was assessed against the following HA-tagged proteins: Ec-04_000450 (the third homeodomain-containing TF found in the genome), the full SAM protein (residues 1 to 949), the N-terminal part of SAM (residues 1 to 291), the full ORO protein (residues 1 to 356) and the N-terminal domain of ORO (residues 1 to 167). Red arrows indicate the band corresponding to each HA-tagged protein.
100
peaks that were detected with the anti-TF antibodies but not with their respective pre-
immune sera. The replicate antibodies would also have allowed us to only retain peaks
detected by the two antibodies raised independently against the same protein.
Unfortunately, no differential peaks were detected when we compared the
immunoprecipitation experiments using the anti-ORO and anti-SAM antibodies and their
respective pre-immune sera. There are several possible reasons why the ChIP-nexus
experiment was not successful. First, it is possible that the cross-linking time was not
sufficiently long and therefore that the transcription factors were detached from the
DNA during sonication. Also, it is possible that the partheno-sporophyte stage does not
express sufficient ORO and SAM proteins for successful ChIP experiments. Finally, the
antibodies we produced may not be suitable for chromatin immunoprecipitation
experiments as they were only tested on western blots and we do not know if they
function efficiently for immunoprecipitation.
In order to replace the ChIP-nexus experiment, we used the recently published method
called DAP-seq (O’Malley et al., 2016; Bartlett et al., 2017). The DAP-seq approach
investigates interactions between recombinant TFs and genomic DNA in vitro without
the need to develop antibodies or transgenic lines overexpressing the TF. In addition, as
genomic DNA is used, binding capacities which are genomic context-dependant can be
screened.
The number of peaks identified in the different replicates fluctuated between 588 and
1840 and seemed to depend on the depth of sequencing of the input sample. The
fraction of reads in the peaks was relatively low for all the samples (between 1.49% and
9.05%). Among peaks detected for each replicate, 274 and 410 peaks were found in the
two ORO and SAM replicates respectively. Ninety one percent and 87% of the peaks for
ORO and SAM respectively tended to be localized in genomic regions corresponding to
transposable elements.
We performed de novo motif discovery using MEME on the top 100 most reproducible
peaks and with KMAC on either all peaks or only on reproducible peaks that localised to
non TE regions. All analyses consistently retrieved motifs comparable with those
obtained using PBM (Fig. 1.). About 50% of the ORO peaks contained the TGA[T/C]GT
motif (therefore found using both PBM and DAP-seq). Similarly, approximately 58% of
SAM peaks exhibited the TGACAC motif (also obtained using PBM) while 70% of SAM
101
peaks possessed the GGACAC motif, which had also been found with KMAC in the DAP-
seq data. Surprisingly, the GGACAC motif corresponded to a secondary motif found by in
silico mutagenesis in PBM, suggesting that binding preferences of SAM are different
depending on the genomic context. Only 22 peaks colocalised in both the ORO and the
SAM datasets and possessed the two TF motifs.
However, although ORO and SAM bound motifs in the DAP-seq experiments that
corresponded to the motifs detected using PBM, we could retrieve no clear peaks located
in close proximity to genes exhibiting differential expression in the sporophyte and
gametophyte generations.
Identification of ORO-interacting proteins
The ability of ORO and SAM to interact with other proteins was assessed using a GAL4-
based Yeast Two-Hybrid (Y2H) assay. Unfortunately, SAM was poorly expressed and
poorly folded in Saccharomyces cerevisiae and therefore interactions with SAM could not
be analysed. The following section therefore focuses on the experiments carried out
with the ORO protein.
The Y2H assay is based on restoration of functionality to a split TF protein (in our case
the yeast TF GAL4) whose DNA Binding Domain (DBD) and the Transcriptional
Activation Domain (TAD) are each separately fused to a different protein (the prey and
bait proteins) to test for interaction between these two proteins. If the interaction
between the two proteins of interest occurs, the function of the split transcription factor
is restored triggering the expression of reporter genes. Plasmids containing the DBD-
fused and TAD-fused constructions can be introduced into yeast strains of opposite sex
so that mating can be used to screen for multiple combinations of prey and bait proteins.
Moreover, using the recombination machinery of S. cerevisiae, it is possible to rapidly
construct full-length transcript libraries with any mRNA source. We constructed a Y2H
GAL4-TAD recombinant library using mRNA extracted from Ec32 strain partheno-
sporophytes. The library contained about nine million independent clones with a mean
insert size about 2 kbp. Screening of 40 random clones showed that the library
contained about 99% recombinants. The full-length ORO coding region was fused to the
GAL4-DBD domain. High-throughput interaction analysis was carried out by mating the
102
strain expressing the GAL4-DBD – ORO fusion protein with the strain containing the
GAL4-TAD library.
ORO was found to interact with three different TFs, a putative basic leucine zipper-
containing TF (or bZIP, Ec-08_005050) and two Nuclear Factor YC TFs (or NF-YC)
corresponding to a gene duplication (Ec-26_004240 and Ec-26_004250). Full prey
clones were obtained for the genes Ec-26_004240 and Ec-26_004250 (Fig. 6.A) whereas
the clone obtained for Ec-08_005050 was partial. However, the structure of the Ec-
08_005050 gene is unclear because RNA-seq mapping and EST tag data do not strongly
support the predicted 3’end part of the coding region, which was absent from the yeast
two hybrid clone. Otherwise, the Ec-08_005050 clone does contain the putative bZIP
domain.
Figure 6. Yeast-two hybrid screen detection of interactions between the N-
terminal domain of ORO and three different TFs: two Nuclear Factor Y C subunits
(NF-YC) and a basic Leucine Zipper-containing TF (bZIP TF). A: Regions of the cDNA
sequences obtained in the Y2H clones for the bZIP TF (Ec-08_005050) and the two NF-
YCs (Ec-26_004240 and Ec-26_004250). B. Direct Y2H assay tests for interaction
between the three TFs and several fragments and deletion constructs of ORO. Left panel:
Growth on the SD/-Leu/-Trp/-Ade/-His indicates protein-protein interactions. Right
panel: Protein domain composition of each ORO construction. C: Sequence alignment of
the N-terminal domain of ORO proteins from diverse brown algae. Species and clades
are indicated at the beginning of each row. Highly conserved amino-acids are indicated
by a inverted triangle above the sequences. Amino-acids with similar chemical
properties at the same position are indicated by a dot. Residue position is given relative
to the Ectocarpus sp sequence. D: Helix wheel projection of residues 34 to 73, which are
involved in the interaction with the bZIP TF. Coloured circles indicate the hydrophilicity
of each amino acid (scale from green to red: green circles correspond to the most
hydrophilic residues while red circles correspond to the most hydrophobic residues).
Blue circles indicate amino acids with acidic lateral chains. Amino acids indicated in
deep blue are highly conserved in brown algae. Amino acids surrounded by a black circle
correspond the amino acids of the motif L-X7-L-X7-R-X7-LE-X6-F. (See opposite page).
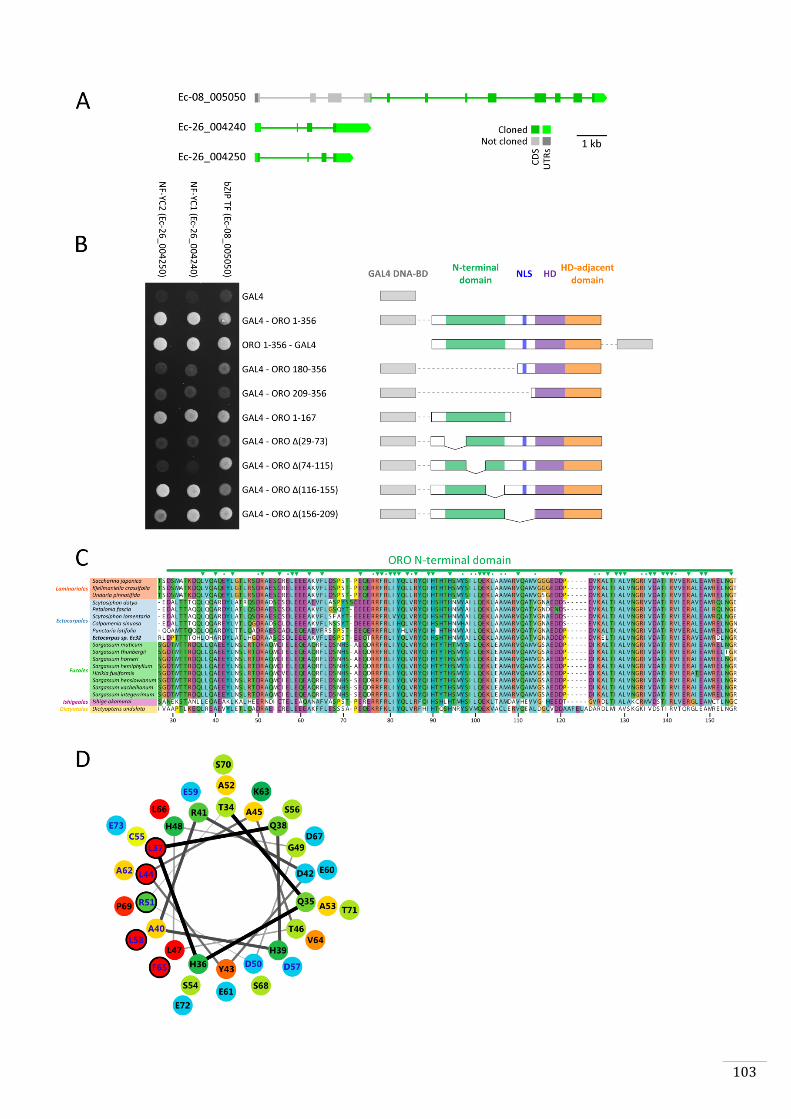
103
104
Deletion analysis was used to identify the domains of the ORO protein involved in the
interaction with the three partner TFs identified by Y2H (Fig. 6.B). First, absence of
interaction between the GAL4-TAD alone and the three partner TFs confirmed that none
of the three interactions was due to this part of the GAL4-TAD – ORO construction.
Moreover the three partner TFs interacted with both the GAL4-TAD – ORO construction
and an inverted ORO – GAL4-TAD construction, confirming that the interaction was not
due to new conformational modules that appeared in the GAL4-TAD – ORO recombinant
protein. Deletion analysis indicated that the three partner TFs interacted with the
conserved N-terminal domain of ORO. Indeed, the partner TFs interact with the N-
terminal domain alone, indicating that this domain is both necessary and sufficient.
Furthermore, the bZIP TF interacts specifically with a small segment of ORO, between
amino-acids 29 and 74. The two NF-YC TFs interact with a wider region of ORO, between
amino-acids 29 and 115. Deletions demonstrated that these regions were necessary for
the interaction.
The N-terminal domain of ORO is conserved in ORO proteins from multiple brown algal
species but corresponds to no other previously described domain and has not been
reported in other homeodomain TFs among the eukaryotes. A more in-depth analysis of
the amino-acid composition of the N-terminal domain suggested that it is bipartite. The
first part, from residues 29 to 74, consists of a motif L-X7-L-X7-R-X7-LE-X6-F that is
conserved across brown algal ORO proteins (Fig. 6.C-D). If this region forms an alpha
helix, as is predicted by PSIPRED, the conserved residues LLRLF would all be exposed in
the same face and could probably establish interactions in the same manner as a leucine
zipper (Fig. 6.D). The bZIP TF may interact with ORO via these five residues and this
interaction may involve the leucine zipper domain of the bZIP TF.
DISCUSSION
The DNA binding sites of ORO and SAM are related to those of other TALE
homeodomain TFs but exhibit some novel features
Structural data have shown that the primary binding specificity of homeodomain-
containing transcription factors is determined by specific amino-acids residues in the
third alpha helix of the homeodomain (at positions 47, 50 and 54). These residues
established hydrogen bonds with the major groove of the DNA (Wolberger et al., 1991;
105
Klemm et al., 1994; Li et al., 1995; Passner et al., 1999). DNA-binding specificities can
vary depending on the residue composition at the three positions (47, 50 and 54) and at
some additional positions in the N-terminal arm (Berger et al., 2008; Noyes et al., 2008).
Some other amino-acid residues, such as the PYP motif between the second and third
helices, may also be involved in interacting with DNA (Pelossof et al., 2015).
Homeodomain TFs belonging to the same family tend to exhibit similar preferred
recognition sites because of their similar amino acid composition (Noyes et al., 2008).
The involvement of multiple residues in DNA recognition could explain why SAM shows
similar binding preferences to AtKNAT3 and AtKNAT6 despite the presence of a
hydrophilic threonine instead a hydrophobic isoleucine at position 50 of the
homeodomain. It is possible that different homeodomain residue compositions can
result in similar binding preferences. KNAT TFs (KNOX2 TALE homeodomain TFs) in A.
thaliana are orthologous to GSM1 in C. reinhardtii and to MKN1 and MKN6 in P. patens.
In Chapter 2, we suggest that ORO and SAM have evolved from a common ancestor with
the KNOX2/BELL system. As SAM and KNAT TFs bind to a TGAC core, it is tempting to
imagine that this binding specificity was inherited from a common ancestor but this may
be an unwise assumption, given the differences at key residues and the influence that
modifications to single residues can have on binding specificity.
PBM data suggest that ORO binds to a new TGATG core motif and to the TGAC sequence
(Fig. 1.). Presumably, this recognition specificity is determined by the methionine at
position 54 but again, we cannot exclude that other residues are involved.
DAP-seq has been proposed as a simple and efficient alternative to more sophisticated
or technically difficult methods such as in vivo ChIP-seq or in vitro SELEX-seq (O’ Malley
et al., 2016; Bartlett et al., 2017). When applied to several A. thaliana TFs, DAP-seq
identified up to 80% of the peaks found using ChIP-seq but failed to find binding sites for
Arabidopsis TALE homeodomain-TFs.
DAP-seq is not the first method that has been used to effectively identify TF binding sites
in genomic DNA. PB-seq (Guertin et al., 2012), DIP-chip (Liu et al., 2005) and DAP-ChIP
(Rajeev et al., 2014) have already been used successfully. Also, genomic context PBM
(gcPBM) experiments have been used to decipher the binding preferences of two bHLH
TFs with similar binding preferences. This study indicated that sequence affinity must
be also influenced by the sequence surrounding the main recognition motif (Gordân et
106
al., 2013). The short motifs bound by TFs are found thousands of times in a genome but
not all these motifs are actually bound by TFs in in vitro experiments. Several authors
have suggested that DNA recognition involves a conjunction between sequence and
shape characteristics (Slattery et al., 2014). DNA shape, i.e. the structural features of
DNA such as minor groove width, roll, propeller twist, helix twist (Zhou et al., 2013), is
thought to be responsible for the biologically relevant results obtained in in vitro
experiments using methods such as gcPBM or DAP-seq (Gordân et al., 2013). Local DNA
shape for any base pair in the genome is dependent on the nucleic acid composition
within a window of generally less than 10 bp. Nucleic acid content in regions
surrounding the motif can also influenced the DNA shape.
DAP-seq data have confirmed that ORO and SAM bind to two different sequences motifs,
that were also detected using the PBM approach. However, on the whole, the DNA
fragments bound by ORO and SAM in the DAP-seq experiments did not appear to
correspond to gene promoter regions and these experiments therefore failed to provide
information about the genes that are directly controlled by ORO and SAM. It is possible
that, in vitro, ORO and SAM bind to sequences that do not correspond to their exact in
vivo binding sites because the DNA shape context or some other feature of the DNA is
different.
Another factor that could have influenced binding specificity is that the DAP-seq was
performed using TF monomers but we have shown that ORO and SAM are capable of
forming a heterodimer and the similar mutant phenotypes suggest that these proteins
may act as a heterodimer in vivo (Chapter 2). Slattery et al. (2011) showed using SELEX-
seq that the binding specificity of Drosophila Hox TFs was modified in vitro when they
formed heterodimers with the TALE TF Exd. New core binding site variants were
detected for each combination of Hox-Exd. In order to detect binding sites of the
ORO/SAM heterodimer, a protocol combining the pull-down assay used in Chapter 2 and
the DAP-seq method will be developed in the near future.
The gene regulatory networks under control of the homeodomain TF heterodimers
Sxi1α/Sxi2a from Cryptococcus neoformans and GSP1/GSM1 from Chlamydomonas
reinhardtii have been characterized (Mead et al., 2015; Hamaji et al., 2016; Joo et al.,
2017). Mead et al. (2015) identified Sxi1α/Sxi2a heterodimer target genes by combining
PBM data and transcriptome analysis from wild-type and mutant strains, based on the
107
assumption that Sxi1α/Sxi2a bound to the upstream region of a subset of differentially
expressed genes. For C. reinhardtii, the upstream regions of highly induced zygotic
genes, identified using a transcriptomic approach (Hamaji et al., 2016; Joo et al., 2017),
were analysed to identify a putative binding motif that shared similarity with motifs for
several other TALE TFs. For both species, a subset of the direct target genes was
subsequently validated by alternative methods such as the Yeast One-Hybrid assay or a
Luciferase expression assay. Unfortunately, we have not been able to apply these
approaches to validate putative ORO/SAM target genes in Ectocarpus. SAM seems to be
not correctly expressed in yeast. Moreover, we do not yet have a transformation
protocol for Ectocarpus that would allow in vivo interactions between promoters and
TFs to be assessed. To further investigate the gene regulatory network controlled by
ORO and SAM, we envision integrating transcriptome data from early zygotes with
heterodimer DAP-seq data.
ORO and SAM interacting proteins suggest a role for TF complexes and chromatin
modification in the gametophyte-to-sporophyte transition
The Y2H assay identified three Ectocarpus proteins that interacted with ORO, a bZIP TF
and two NF-YC TFs. The bZIP TF is a member of a stramenopile-specific subfamily and
no other members of this subfamily have been functionally characterized so far. We
hypothesise that ORO interacts with the bZIP protein in vivo as part of a complex
involved in deploying the sporophyte developmental program.
NF-Y TFs are a well-characterized and widespread family of TF in Eukaryotes. NF-Ys are
trimeric transcription factors consisting of one subunit each of NF-YA, NF-YB and NF-YC.
Interestingly, the NF-YB and NF-YC subunits have Histone Fold Domains (HFDs) similar
to those of histones H2B and H2A, respectively. NF-YB and NF-YC bind DNA through
these HFDs. NF-YA is not a histone-related protein but contributes to the sequence
specificity to the NF-Y complex by binding to the CCAAT box. The CCAAT box is present
in around 30% of the promoters in eukaryotes genomes (Dolfini et al., 2012). In
Ectocarpus, 32.1% of genes have at least one CCAAT box in the region 300 bp upstream
of the TSS.
108
The Ectocarpus genome encodes 3 NF-YB, 7 NF-YC and one NF-YA. These proteins
belong to different subclasses (Fig. 7.A). For example, one of the NF-YB proteins (Ec-
01_009630) is related to the Chromatin Accessibility Complex 14kD protein (ChrAC14)
from D. melanogaster. The two other NF-YB proteins (Ec-04_003050 and Ec-04_003060)
were generated by a gene duplication and can be considered to be the "canonical" NF-YB
coding genes. The Ectocarpus NF-YC family is more diverse. The two NF-YCs that
interact with ORO (Ec-26_004240 and Ec-26_004250) are "canonical" NF-YCs (Fig. 7.B)
and the genome contains a third gene of this subclass, Ec-16_003820. Two other NF-YCs
(Ec-11_002940 and Ec-03_001170) possess a high mobility group (HMG) domain in
addition to the NF-YC domain. One NF-YC (Ec-20_003590) is related to the Chromatin
Accessibility Complex 16kD protein (ChrAC16) from D. melanogaster. In D.
melanogaster, ChrAC14 and ChrAC16 form a molecular complex with ACF1 (ATP-
dependent Chromatin Assembly Factor large subunit) and ISWI (Imitation SWItch) an
ATPase of the SWI-SNF helicase superfamilly 2 (Corona et al., 2000; Yadon and
Tsukiyama, 2011). The Chromatin Accessibility Complex (CHRAC) is involved in
nucleosome positioning and has a role in the repression of chromatin inactivation by
maintaining the regularity of spacing of nucleosome arrays (Kukimoto et al., 2004;
Scacchetti et al., 2017).
Canonical NF-Y complexes are not known to interact with SWI-SNF-containing ATP-
dependant chromatin remodelling complexes, at least in well-established model
organisms. Rather, it has been suggested, from work on mouse embryonic stem cells for
example, that NF-Y complexes promote chromatin accessibility for master and pioneer
TFs. The density of DNA binding (based on ChIP-seq signal strength) of several pioneer
homeodomain-containing TFs such as the Oct4/Sox2 heterodimer has been shown to
increase at sites where they colocalize with NF-Y (Oldfield et al., 2014). Moreover,
Oldfield et al. (2014) showed that the NF-Y complex interacts directly with Oct4 through
its NF-YC subunit.
In Ectocarpus, ORO and SAM are required for the implementation an important
developmental switch, the transition from the gametophyte to the sporophyte
generation. To carry out this function, it is likely that ORO and SAM bind DNA as pioneer
TFs. Pioneer TFs tend to bind to nucleosome dense regions containing cell-specific and
developmentally up-regulated genes to trigger developmental switches (Zaret and
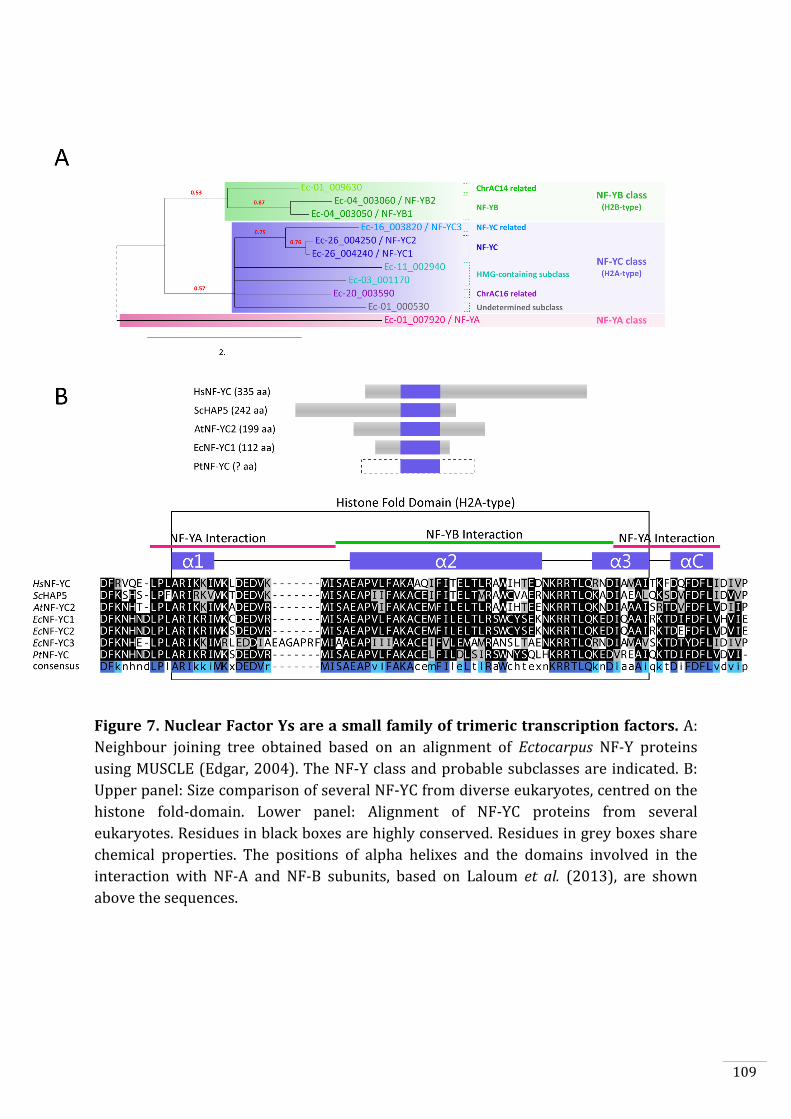
109
Figure 7. Nuclear Factor Ys are a small family of trimeric transcription factors. A:
Neighbour joining tree obtained based on an alignment of Ectocarpus NF-Y proteins
using MUSCLE (Edgar, 2004). The NF-Y class and probable subclasses are indicated. B:
Upper panel: Size comparison of several NF-YC from diverse eukaryotes, centred on the
histone fold-domain. Lower panel: Alignment of NF-YC proteins from several
eukaryotes. Residues in black boxes are highly conserved. Residues in grey boxes share
chemical properties. The positions of alpha helixes and the domains involved in the
interaction with NF-A and NF-B subunits, based on Laloum et al. (2013), are shown
above the sequences.
110
Carroll, 2011). It is tempting to speculate that ORO and SAM, probably acting as a
heterodimer, bind to NF-YB/NF-YC dimers in regions of the genome where the latter
have replaced, at least partially, true nucleosomes constituted of histones octamers. NF-
Y function is poorly understood, even in model organisms, but it is possible that NF-Y
mimics nucleosomes in this manner (Romier et al., 2003; Nardone et al., 2017). Initially,
NF-Y complexes alone (not associated with other TFs) may stabilize distal or proximal
enhancers (Oldfield et al., 2014). When associated with pioneer transcription factors, the
NF-Y complex could then operate as an easy-to-destabilize nucleosome, increasing DNA
accessibility and facilitating recruitment of pioneer transcription factors. The interaction
between ORO and the bZIP TF, if confirmed in vivo, may represent an example of an
interaction that is enabled through the action of NF-Y on the chromatin structure.
NF-Y complexes have been shown to influence chromatin structure in several ways, for
example by interacting with the acetyltransferase GCN5, by recruiting the
methyltransferase Ash2L, which trimethylates H3K4, (Currie, 1998; Fossati et al., 2011)
and by regulating H2A.Z deposition at cell cycle promoters in human cells (Gatta and
Mantovani, 2011). In Ectocarpus, ORO and SAM may direct chromatin reprogramming
through NF-Y-mediated interactions with histone modifiers as part of the program that
triggers the gametophyte-to-sporophyte transition.
It will be important in the future to confirm the interactions between ORO and both the
NF-YC and the bZIP proteins by an alternative method. The pull-down assay used to
confirm the interaction between ORO and SAM could be employed for this. It would also
be interesting to use an alternative method that tests for an interaction in a cellular
context, for example bimolecular fluorescence complementation (BiFC). However, at
present in vivo tests can only be done in heterologous cellular systems as a
transformation protocol does not exist for Ectocarpus. It would also be of interest to test
whether SAM can interact with NF-YC or other NF-Y members. Yeast Three-Hybrid
experiments would be of interest to test whether NF-Y enhances the interaction
between the bZIP TF and ORO.
To further study these interactions, it would be interesting to carry out chromatin
immunoprecipitation experiments using antibodies against NF-Y components. The
results could then be compared with the DAP-seq data already obtained for ORO and
SAM to determine whether binding sites co-localise on the genome. Finally, yeast one-

111
hybrid assays using artificial upstream activating sequences designed to contain both
CCAAT box and DNA-binding sites of ORO or SAM, could be informative for a binding
constraint analysis.

112
113
Chapter 4
An efficient chromatin immunoprecipitation protocol for characterizing histone modifications in
the brown alga Ectocarpus
This chapter presents a chromatin immunoprecipitation protocol for the brown alga
Ectocarpus. ChIP methodology has become widely used to investigate the interaction
between proteins and DNA in the cell. The protocol, which has been prepared in the form
of a manuscript that will be submitted for publication shortly, is the result of a series of
tests and optimisations that I carried out over a period of about six months. The
establishment of this protocol was one of the most important milestones of the thesis
work.

114
115
An efficient chromatin immunoprecipitation protocol for
characterizing histone modifications in the brown alga Ectocarpus
Simon Bourdareau1, Leila Tirichine2, Susana M. Coelho1, J. Mark Cock1,*
1Sorbonne Université, CNRS, Integrative Biology of Marine Models Laboratory, Algal Genetics
Group, Station Biologique de Roscoff, CS 90074, F-29688, Roscoff, France,
2Ecole Normale Supérieure, PSL Research University, Institut de Biologie de l’ENS, CNRS,
INSERM, Ecology and Evolutionary Biology Section, 46 rue d’Ulm, F-75005 Paris, France,
*Author for correspondence ([email protected])
INTRODUCTION
Brown algae are a group of photosynthetic eukaryotes that belong to the Stramenopile
supergroup. These organisms have evolved complex multicellularity independently from
land plants, animals and fungi. Distributed along coasts worldwide, brown algae exhibit
a broad range of life-cycles and morphologies. The small, filamentous brown alga
Ectocarpus has been established as a genetic model organism (Peters et al., 2004). This
alga has a haploid-diploid life cycle with two distinct multicellular generations: a haploid
gametophyte and a diploid sporophyte. Independent development of the two
generations provides facile access to both stages of the life cycle, making Ectocarpus an
amenable system to study the development of multicellular gametophytes and
sporophytes compared with more established model organisms such as Arabidopsis
thaliana, which has a reduced gametophyte generation that is highly dependent on the
sporophyte generation.
In Ectocarpus, as in many other brown algae and mosses (Mignerot & Coelho, 2016) sex
is determined during the haploid phase of the life cycle by a UV sex chromosome system
(Ahmed et al., 2014). The male and female sexes are established at meiosis, depending
on whether the cells inherit a male (V) or a female (U) chromosome. The male
developmental program is thought to be triggered by a factor located on the male sex-
determining region, whereas chromosome dosage experiments suggest that the female
116
developmental program may be a default program that occurs when the V chromosome
is absent.
The complete genome sequence for Ectocarpus strain Ec32 is publicly available at
http://bioinformatics.psb.ugent.be/orcae/overview/EctsiV2 (Cock et al., 2010; Cormier
et al., 2017). Ectocarpus has been used as a model in mutant approaches aimed at
characterising several life cycle and developmental processes (Peters et al., 2008; Coelho
et al., 2011; Godfroy et al., 2017; Macaisne et al., 2017) and for extensive transcriptome
analyses focused on different stages of its haploid-diploid life-cycle (Coelho et al., 2011;
Lipinska et al., 2015). For example, a large number of genes are differentially expressed
between male and female gametophytes (Lipinska et al., 2015) and several
developmental mutants have been shown to exhibit marked modifications on
transcription patterns (Godfroy et al., 2017; Macaisne et al., 2017). Environmental
factors such as abiotic stress can also induce profound changes in the transcriptome
(Dittami et al., 2009). At present, however, we remain largely ignorant about the
molecular mechanisms that underlie these marked changes in gene expression
associated with different aspects of Ectocarpus biology.
Chromatin refers to the genomic DNA within the cell together with associated molecules,
predominantly proteins. Specific modifications of the core components of chromatin
(DNA plus the associated histone molecules that form the nucleosomes) play an
important role in the control of gene expression. These modifications can include
methylation of the DNA sequence (although DNA methylation has not been detected in
Ectocarpus; Cock et al., 2010) and various post-translational modifications (e.g.
acetylation, methylation, ubiquitination) of histone proteins. These modifications can
lead to changes in DNA packing and influence gene expression. Analysis of such
epigenetic chromatin modifications is therefore expected to shed light on the
mechanisms involved in diverse processes including the initiation of developmental
stages, control of sexual differentiation and adaptation to stress.
Chromatin immunoprecipitation (ChIP) has become a widely used methodology to study
the proteins associated with genomic DNA. Combined with high-throughput sequencing,
ChIP allows the analysis of the genome-wide distribution of specific histone
modifications or to determine genome-wide binding patterns for transcription factors.
However, currently there is not a ChIP protocol available for the brown algae. Within the
117
Stramenopiles, a ChIP protocol is only available for the diatoms (Lin et al., 2012), which
are phylogenetically distant from the brown algae and exhibit marked morphological
and physiological differences. Here, we present an efficient ChIP protocol for the brown
alga Ectocarpus. This protocol includes several steps: an optimized cross-linking and
nuclei isolation step, an efficient chromatin sonication method that fragments chromatin
to a target size of 300 bp and, finally, immunoprecipitation, reverse crosslinking and
DNA extraction steps that are common to other protocols.
PROCEDURE
Culture of Ectocarpus tissues
Before beginning the ChIP. Initiate Ectocarpus cultures in transparent petri dishes
(diameter 140 mm) with 75 ml natural seawater enriched with Provasoli supplement
and grow at 13°C with a 12h day/12h night cycle and 20 µmol photons.m-2.s-1 irradiance
(Coelho et al., 2012). We recommend a culturing at least 1200 individual sporophytes or
gametophytes at a density of six individuals per petri dish.
After culture, carefully transfer the algae with dissection forceps into a sterile
Erlenmeyer containing 400 ml of sterile seawater. Two weeks of culture should produce
approximatively 4-5 grams (FW) of tissue.
Cross-linking
Step 1. Fix the culture with 400 ml of 2x Cross-linking buffer for exactly 5 minutes at
room temperature under a chemical hood. CAUTION: Formaldehyde is very toxic if
inhaled, ingested or absorbed through skin. Mix gently during the crosslinking.
2x Cross-linking Buffer:
Formaldehyde 2% (add 21.6 ml of Formaldehyde 37%)
Seawater 378.4 ml, keep sterile to avoid contamination
Step 2. Filter the tissue rapidly (15 seconds maximum) through a sterile piece of
Miracloth to eliminate the formaldehyde. Transfer the tissue to a new 50 ml tube with
50 ml of PBS-Quenching Buffer (1x PBS:2M Glycine in a 4:1 ratio, the final
concentration of glycine is 400 mM) for 5 minutes at room temperature. Mix gently
during quenching.
Centrifuge at 4200 rpm 4°C in an Eppendorf 5804R for 5 minutes for gametophytes or
for 10 min for sporophytes.
118
Step 3. Eliminate the buffer and re-suspend in 50 ml of 1x PBS to wash the tissue.
Centrifuge at 4200 rpm 4°C in a Eppendorf 5804R for 5 minutes for gametophytes or for
10 min for sporophytes.
Isolation of semi-pure nuclei
Step 4. Remove as much PBS as possible by pipetting the supernatant. You can invert
the tube onto a piece of Miracloth placed on paper. Measure the mass of tissue to adapt
the volume of Nuclei Isolation Buffer to be added in the following steps. Freeze quickly
in liquid nitrogen.
Step 5. Grind the tissue to a ultra fine powder under liquid nitrogen using prechilled
mortars and pestles and ensure that samples do not thaw during grinding. Do not use the
same mortar and pestle for the different experimental conditions to avoid cross-
contamination.
Step 6. Transfer the powder to a new tube. Add pre-chilled Nuclei Isolation Buffer with
Triton X-100, β-mercaptoethanol and Protease Inhibitor Cocktail. We recommend to add
approximatively 1 ml of buffer per 200 mg of tissue. Resuspend well by pipetting up and
down.
Nuclei Isolation Buffer:
Sorbitol 125 mM (2.277 g)
Potassium Citrate 20 mM (monohydrate 648.8 mg or anhydrous 612.8 mg)
MgCl2 30 mM (285.6 mg)
EDTA 5 mM (1 ml of a 0.5M pH 8.0 stock solution)
HEPES 55 mM (714.9 mg)
Adjust pH to 7.5
MilliQ Water adjust to 100 ml
Add to 10 ml of NIB:
Triton X-100 0.1% (10 µl, add Triton X-100 just before use in 10 ml of NIB)
β-mercaptoethanol 5mM (3.5 µl, add just before use in 10 ml of NIB) CAUTION:
very toxic if inhaled, ingested or absorbed through skin.
Protease Inhibitor 1 cOmplete ULTRA Tablet, EDTA-free, Roche (1 tablet for 50
ml)
Cocktail 50 ml or 200 µl of a tablet dissolved in 1 ml of MilliQ water for
10 ml of NIB)
119
Step 7. Transfer the mix into a 1 ml or a 7 ml Tenbroeck Potter (depending on the
volume of NIB added). Grind 10 times slowly. Do hemicircular movements of the potter
in the tube when you push and remove the potter. Don’t use the same Tenbroeck Potter
for different conditions to avoid cross-contamination.
Step 8. Incubate on ice for 20 minutes. Resuspend every 5 minutes.
Step 9. Filter the solution through 2 layers of Miracloth into a new 50 ml conical tube on
ice. The Miracloth layers should be rotated by 90° with respect to each other. Squeeze
the Miracloth well to avoid loss of liquid.
This step is recommended to eliminate the largest debris. There is no need to filter
extractions when using gametes or spores.
Step 10. Aliquot the mix into several 2 ml microtubes and spin the filtered solution for
20 minutes at 3000 g in a centrifuge at 4C.
Step 11. Remove the supernatant and gently combine the pellets from the same sample
in 1 ml of Nuclei Isolation Buffer with Triton X-100, β-mercaptoethanol and Protease
Inhibitor Cocktail. Spin the solution for 20 minutes at 3000 g in a centrifuge at 4C.
Step 12. Remove the supernatant and gently combine the pellets from the same sample
in 1 ml of Nuclei Isolation Buffer with β-mercaptoethanol and Protease Inhibitor
Cocktail but without Triton X-100.
Step 13. Transfer to a new 2 ml microtube and centrifuge at 3000 g for 20 minutes at
4C. Prepare the Nuclei Lysis Buffer and ChIP dilution buffer at this stage.
Step 14 [ OPTIONAL ]. Verify the release of the nuclei using microscopy. A small aliquot
should be stained with DAPI. Count the number of nuclei with a KOVA® Glasstic® Slide
10 with Grid Chamber. CAUTION: DAPI is toxic and a mutagen. Wear gloves while working
with DAPI.
Lysis of nuclei and sonication
Step 15. Remove the supernatant entirely and resuspend each sample in 200 µl to 1 ml
(depending on the quantity of starting tissue) of cold Nuclei Lysis Buffer. In general, we
recommend using 250 μl of Nuclei Lysis Buffer per 500 mg of tissue.
Nuclei Lysis Buffer:
EDTA 10 mM (200 µl EDTA 0.5 M pH 8)
SDS 1% (1 ml SDS 10%)
Tris-HCl pH 8 50 mM (500 µl Tris-HCl 1 M pH 8.0)
Protease Inhibitor 1 cOmplete ULTRA Tablet EDTA-free, Roche, diluted in 1 ml
Cocktail
MilliQ Water adjust to 10 ml (7.3 ml MilliQ Water)
120
Keep a 5 µl aliquot from each sample for the comparison of extracted chromatin with the
sonicated chromatin samples.
Step 16. Divide the samples into aliquots of 130 µl each in new, clean Covaris®
microTUBEs AFA Fiber Pre-Slit Snap-Cap 6x16 mm. It’s important to transfer exactly
130 µl into each microTUBE to avoid foam and to ensure complete fragmentation.
Step 17. Sonicate the chromatin solution with a Covaris® M220 Focused-
ultrasonicatorTM using the following parameters:
Duty: 25%
Peak Power: 75
Cycles/Burst: 200
Time Duration: 900 seconds
Set point Temperature: 6°C (range between 4°C and 7°C)
Step 18. Collect samples by combining the tubes. Spin the chromatin solution at 14000 g
for 5 minutes at 4°C to pellet the debris. Set aside the supernatant in a new 1.5 ml
microtube.
Keep 5 µl to run on a gel to check the sonication efficiency. A smear of sonicated
chromatin should be observed between 100 and 1000 bp (Fig. 1).
Step 19. Measure the remaining volume of sonicated chromatin and add ChIP dilution
buffer to dilute tenfold the 1% SDS to 0.1% SDS. It’s important for the following steps as
a high concentration of SDS interfere with epitope/antibody interaction.
ChIP Dilution Buffer:
Triton X-100 1% (100 µl Triton X-100 stock)
EDTA 1.2 mM (24 µl EDTA 0.5 M pH 8)
Tris-HCl pH 8.0 16.7 mM (167 µl Tris-HCl 1 M pH 8.0)
NaCl 167 mM (334 µl NaCl 5 M)
MilliQ Water adjust to 10 ml (9.375 µl MilliQ Water)
Following this step, the chromatin solution can be frozen at –20 or -80°C. For each
sample, keep 50 μl of sonicated chromatin as an input control. Aliquots of 500 μl of
diluted chromatin can be prepared in 1.5 ml Eppendorf DNA LoBind microtubes. Each
aliquot is the equivalent of 75-100 mg of starting tissue.
121
Immunoprepicipitation
Step 20. Transfer 500 µl of diluted sonicated chromatin into a new 1.5 ml Eppendorf®
DNA LoBind microtube. Add the recommended volume of your antibody. Concentrations
may vary between antibodies and should be determined empirically.
As a negative control, you can use a naïve antibody such as Normal Rabbit IgG CST
N°2729.
As a mock control, you can carry out a chromatin-IP without any antibody.
Co-incubate the sonicated chromatin and antibody overnight at 4°C with gentle rotation
(10 rpm).
Step 21.
Prior to use, resuspend DynaBeads Protein A and DynaBeads Protein G by vortexing.
Use only pre-equilibrated beads as follows:
Take 50 µl of DynaBeads for each sample in a new microtube, place in the magnet,
discard the supernatant and add 50 µl of ChIP dilution buffer, mix well by pipetting up
and down. Repeat twice and resuspend in 50 µl of ChIP dilution buffer.
Step 22. Mix DynaBeads Protein A and Dynabeads Protein G in an equal volume (ratio
1:1). For three immunoprecipitations, the volume should be 300 µl.
Step 23. Add 50 µl of pre-equilibrated beads to each 1.5 ml Eppendorf® DNA LoBind
microtube already containing your IgG-sample. Mix for 2 hours at 4°C with gentle
rotation (10 rpm).
Step 24. Separate the supernatant and Dynabeads on a magnet. Set aside the
supernatant and either go to Step 26 for the first capture or include the following steps
for subsequent captures.
Add 50 µl of pre-equilibrated beads to each tube containing the supernatant for a second
IgG capture during 2 hours at 4°C with gentle rotation (10 rpm).
Step 25. Prepare the following buffers before going to Step 26.
Note: Place all the wash solutions on ice prior to immune complex collection in step 27.
a) Low Salt Wash Buffer: 150 mM NaCl, 0.1% SDS, 1% Triton X-100, 2 mM EDTA, 20 mM
Tris-HCl (pH 8.0). Two washes: One rapid, the second for 5 minutes.
b) High Salt Wash Buffer: 500 mM NaCl, 0.1% SDS, 1% Triton X-100, 2mM EDTA, 20mM
Tris-HCl (pH 8.0). Two washes: One rapid, the second for 5 minutes.
c) LiCl Wash Buffer: 0.25 M LiCl, 1% NP40, 1% sodium deoxycholate, 1 mM EDTA, 10
mM Tris-HCl (pH 8.0). Two washes: One rapid, the second for 5 minutes.
d) TE Buffer: 10mM Tris-HCl (pH 8), 1 mM EDTA. Two washes: One rapid, the second for
5 minutes.
122
Prepare the Elution Buffer (1% SDS, 0.1 M NaHCO3). For 10 ml: 1 ml of 10% SDS, 84 mg
Sodium Bicarbonate, bring to final volume of 10 ml with distilled water.
Step 26. Carry out washing steps 26 and 27 in a cold room if possible, otherwise try to
keep your samples on ice. Collect immune complexes by placing the tubes in the magnet
for 2 minutes. Remove the supernatant.
Step 27. Wash the DynaBeads-IgG-antigen-chromatin complexes four times using the
sequence of buffers listed below. Use 1ml of each buffer and wash at 4°C with only a
brief and gentle hand inversion to resuspend the beads. Washing too long may result in
loss of sample. Each time place the tubes in the magnet for 2 minutes, discard the
supernatant and add the next buffer. Repeat the washing sequence once.
1) Low Salt Wash Buffer,
2) High Salt Wash Buffer,
3) LiCl Wash Buffer,
4) TE Buffer,
Step 28. Elute the immune complexes by adding 250 µl of Elution Buffer (made fresh at
step 25 and prewarmed at 65°C) to the washed beads. Vortex and incubate in a
Eppendorf Thermomixer at 65 degrees for 20 minutes at 1000 rpm. Put the tubes in the
magnet and carefully transfer the supernatant fraction (eluate) to another Eppendorf®
DNA LoBind tube and repeat the elution. Combine the two eluates.
At the same time, add 450 µl of Elution Buffer to 50 µl of the input control (positive
control).
Reverse cross-linking and RNA/protein digestion
Step 29. Add 20 µl 5 M NaCl to each tube and incubate at 65C for at least 12 hours or
overnight to reverse the cross-linking. Note: Do not forget to get your input control out
of the freezer and reverse cross-link along with the other samples.
Step 30. Add 10 µl of 0.5 M EDTA, 20 µl Tris-HCl 1 M (pH 6.5), 1 µl of 20 mg.ml-1
Proteinase K and 1 µl of 10 mg.ml-1 RNAse A to the eluate and incubate for 1.5 h at 45C.
DNA extraction and precipitation
Step 31. Add an equal volume (550 µl) of phenol/chloroform/isoamyl alcohol (25:24:1)
and vortex briefly.
Step 32. Centrifuge the samples in a microcentrifuge at 13800 g for 15 minutes at 4°C.
Transfer the supernatant to a new 2 ml Eppendorf® DNA LoBind microtube.
Step 33. Add the following solutions to each tube: 1.25 ml of 100% ethanol, 50 µl of 3M
sodium acetate (pH5.2), 4 µl glycogen (20 mg.ml-1) and incubate for 1 hour or overnight
at -80°C to precipitate the DNA.
Step 34. Centrifuge each sample at 13800 g for 15 minutes at 4°C.
123
Step 35. Discard the supernatant, wash the pellet with 500 µl of 70% (v/v) ethanol,
centrifuge again at 13800 g for 10 minutes at 4°C.
Step 36. Discard the supernatant and dry the pellet at room temperature.
Step 37. Resuspend the pellets in 30 µl of DEPC water, store the DNA at -80°C and use it
within 3 months.
DNA analysis
Step 38. DNA concentration and size range can be analysed using a Bioanalyser and a
High Sensitivity DNA Chip (Agilent). In addition, DNA concentration should be assessed
using a Qubit Fluorometer and a dsDNA HS Assay kit (ThermoFisher).
ANTICIPATED RESULTS
This protocol yield approximately 20-25 μg of chromatin per gram of tissue. DNA
fragment size should be between 150 and 1000 bp. To obtain strong enrichment, we
recommend using between 2 and 5 μg of antibody per IP. We also recommend using
approximately 1.5 μg of chromatin per IP. The number of IPs for each antibody should
be determined empirically. At least 5 ng (we recommend 20 ng) of DNA are necessary to
prepare sequencing libraries for Illumina platforms using the TruSeq ChIP Library
Preparation kit (Illumina). Often, DNA immunoprecipitated using a naive IgG is not
amplifiable as less than 1 ng can be collect by pooling 6 IPs. For the test samples, we
typically pool 4-5 samples per lane on an Illumina HiSeq 4000 aiming for 40-90 million
reads per sample in order to obtain strong signals. Inputs should be sequenced more
deeply, aiming for 100-110 millions reads to accurately model the background and limit
detection bias.
124
REFERENCES
Ahmed S, Cock JM, Pessia E, Luthringer R, Cormier A, Robuchon M, Sterck L, Peters
AF, Dittami SM, Corre E, et al. 2014. A haploid system of sex determination in the
brown alga Ectocarpus sp. Current Biology 24: 1945–57.
Cock JM, Sterck L, Rouzé P, Scornet D, Allen AE, Amoutzias G, Anthouard V,
Artiguenave F, Aury J-MM, Badger JH, et al. 2010. The Ectocarpus genome and the
independent evolution of multicellularity in brown algae. Nature 465: 617–21.
Coelho SM, Godfroy O, Arun A, Le Corguillé G, Peters AF, Cock JM. 2011.
OUROBOROS is a master regulator of the gametophyte to sporophyte life cycle transition
in the brown alga Ectocarpus. Proceedings of the National Academy of Sciences of the
United States of America 108: 11518–23.
Coelho SM, Scornet D, Rousvoal S, Peters NT, Dartevelle L, Peters AF, Cock JM.
2012. How to cultivate Ectocarpus. Cold Spring Harbor Protocols 2012: 258–61.
Cormier A, Avia K, Sterck L, Derrien T, Wucher V, Andres G, Monsoor M, Godfroy O,
Lipinska A, Perrineau M-M, et al. 2017. Re‐annotation, improved large‐scale assembly
and establishment of a catalogue of noncoding loci for the genome of the model brown
alga Ectocarpus. New Phytologist 214: 219–232.
Dittami SM, Scornet D, Petit J-L, Ségurens B, Da Silva C, Corre E, Dondrup M,
Glatting K-H, König R, Sterck L, et al. 2009. Global expression analysis of the brown
alga Ectocarpus siliculosus (Phaeophyceae) reveals large-scale reprogramming of the
transcriptome in response to abiotic stress. Genome Biology 10: R66.
Godfroy O, Uji T, Nagasato C, Lipinska AP, Scornet D, Peters AF, Avia K, Colin S,
Laure M, Motomura T, et al. 2017. DISTAG/TBCCd1 Is Required for Basal Cell Fate
Determination in Ectocarpus. The Plant Cell 29: 3102–22.
Lin X, Tirichine L, Bowler C. 2012. Protocol: Chromatin immunoprecipitation (ChIP)
methodology to investigate histone modifications in two model diatom species. Plant
Methods 8: 48.
Lipinska A, Cormier A, Luthringer R, Peters AF, Corre E, Gachon CMM, Cock JM,
Coelho SM. 2015. Sexual Dimorphism and the Evolution of Sex-Biased Gene Expression
in the Brown Alga Ectocarpus. Molecular Biology and Evolution 32: 1581–97.
Macaisne N, Liu F, Scornet D, Peters AF, Lipinska A, Perrineau M-M, Henry A,
Strittmatter M, Coelho SM, Cock MJ. 2017. The Ectocarpus IMMEDIATE UPRIGHT gene
encodes a member of a novel family of cysteine-rich proteins that have an unusual
distribution across the eukaryotes. Development 144: 409–18.

125
Mignerot L, Coelho S. 2016. The origin and evolution of the sexes: Novel insights from a
distant eukaryotic linage. Comptes Rendus Biologies 339: 252–257.
Peters AF, Marie D, Scornet D, Kloareg B, Cock JM. 2004. PROPOSAL OF ECTOCARPUS
SILICULOSUS (ECTOCARPALES, PHAEOPHYCEAE) AS A MODEL ORGANISM FOR BROWN
ALGAL GENETICS AND GENOMICS. Journal of Phycology 40: 1079–88.
Peters AF, Scornet D, Ratin M, Charrier B, Monnier A, Merrien Y, Corre E, Coelho
SM, Cock JM. 2008. Life-cycle-generation-specific developmental processes are
modified in the immediate upright mutant of the brown alga Ectocarpus siliculosus.
Development 135: 1503–12.
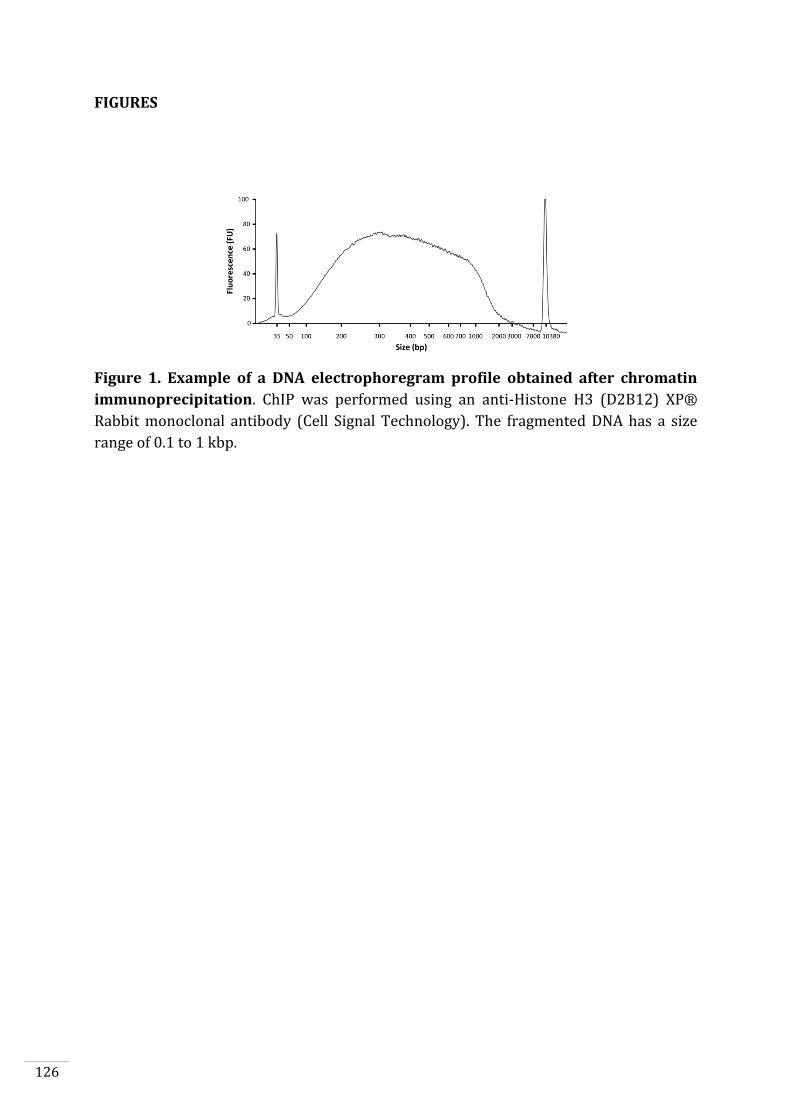
126
FIGURES
Figure 1. Example of a DNA electrophoregram profile obtained after chromatin
immunoprecipitation. ChIP was performed using an anti-Histone H3 (D2B12) XP®
Rabbit monoclonal antibody (Cell Signal Technology). The fragmented DNA has a size
range of 0.1 to 1 kbp.

127

128
129
Chapter 5
Epigenetic modifications associated with life cycle transitions in the brown alga Ectocarpus
Histones are small proteins associated with DNA in octamers called nucleosomes which
package DNA in 146 bp wrap. Octamers are constituted of two copies of each histone
H2A, H2B, H3 and H4 which are substrates for a diverse range of histones writers and
erasers (i.e. enzymes which graft chemical modifications). Histone modifications are
then read by transcription and chromatin remodelling machineries to control DNA
accessibility to transcription factors. Moreover, analysis of epigenetic modifications can
reveal chromatin dynamics underlying implementation of developmental programs.
This chapter presents an integrative analysis of histone post-translational modifications
in Ectocarpus sp. First, this work focuses on high accuracy mass spectrometry analyses
to describe the complexity of histone post-translational modifications in Ectocarpus sp.
Second, this chapter presents genome maps distribution for six histone modifications.
Finally, we document the dynamic of the chromatin code in developmental transition
between gametophyte and sporophyte generations. The chapter has been prepared in
the form of a manuscript that will be submitted for publication shortly. My contribution
to this work has consisted of both experiments and bioinformatics analyses.

130
131
Epigenetic modifications associated with life cycle transitions in the
brown alga Ectocarpus
Simon Bourdareau1, Leila Tirichine2, Damarys Loew3 rang re bar 3, Susana M.
Coelho1, J. Mark Cock1,*
1CNRS, Sorbonne Université, UPMC University Paris 06, Algal Genetics Group, UMR 8227,
Integrative Biology of Marine Models, Station Biologique de Roscoff, CS 90074, F-29688, Roscoff,
France, 2Ecology and Evolutionary Biology Section, Institut de Biologie de l’École Normale
Supérieure (IBENS), CNRS UMR8197 INSERM U1024, 46 rue d’Ulm, 75005 Paris, France, 3Institut Curie, PSL Research University, Centre de Recherche, Laboratoire de Spectrométrie de
Masse Protéomique, 26 rue d’Ulm, 75248 Cedex 05 Paris, France.
*Author for correspondence ([email protected])
INTRODUCTION
Epigenetic processes play an important role in the life histories of multicellular
organisms, allowing cells that carry the same genomic information to assume different
functions both spatially, within the multicellular bodyplan, and temporally, during the
progression of the life cycle. Brown algae are the third most developmentally complex
eukaryotic lineage after animals and land plants. This group not only includes some very
large organisms, such as Macrocystis which can reach up to 50 metres in length, but
many brown algae also have haploid-diploid life cycles involving an alternation between
two different organisms, the sporophyte and the gametophyte, often with very distinct
bodyplans (Cock et al., 2013). At present, very little is known about the role of epigenetic
processes in the regulation of developmental and life cycle processes in this group of
organisms.
The filamentous alga Ectocarpus is being used as a model system to investigate
developmental processes in the brown algae (Cock et al., 2011; Coelho et al., 2012a;
Macaisne et al., 2017; Godfroy et al., 2017). Ectocarpus has a haploid-diploid life cycle
involving an alternation between a gametophyte, which is usually haploid, and a
sporophyte, which is usually diploid. However, there is clear evidence that the identity
of each life cycle generation is not determined by its ploidy because haploid sporophytes
(partheno-sporophytes) can be produced by parthenogenetic development of haploid
gametes (Müller, 1967; Bothwell et al., 2010) and because diploid gametophytes can be
132
constructed using mutants that are unable to deploy the sporophyte developmental
pathway (Coelho et al., 2011). These observations imply an important role for epigenetic
processes during the Ectocarpus life cycle.
Chemical modification of chromatin plays a central role in the establishment and
maintenance of epigenetic states within the cell. Histones have been shown to undergo a
broad range of different post-translational modifications (PTMs) involving the addition
of various chemical moieties to multiple amino acid residues, particularly within the
unstructured N-terminal "tails" of these proteins (Lawrence et al., 2016). These
modifications affect chromatin function either by directly modifying interactions
between the different components of the nucleosome or via the action of proteins that
bind to specific histone modifications and effect specific tasks. In this manner, histone
PTMs act as a "histone code", mediating the establishment and maintenance of different
epigenetic states across the genome.
In this study, we have carried out a broad census of histone PTMs in Ectocarpus
chromatin and have developed a method to evaluate the genome-wide distribution of
specific marks. We show that modulation of the expression of sporophyte-biased genes
during the life cycle is correlated with marked changes in the pattern of three histone
PTMs. In contrast, the expression patterns of gametophyte-biased genes were not
correlated with modifications to the histone PTMs assayed, suggesting that
gametophyte-biased and sporophyte-biased gene expression are mediated by different
epigenetic processes.
RESULTS
Ectocarpus histones and histone modifier enzymes
Analysis of the Ectocarpus genome sequence (Cormier et al., 2017) identified 34 core
histone and nine H1 histone genes (Table S1). Four of the core histone genes are
predicted to encode variant forms, including probable CenH3, H2A.X and H2A.Z proteins.
All nine H1 histone genes appear to encode bona fide H1 proteins and not members of
related families such as the GH1-HMGA or GH1-Myb families in plants (Kotliński et al.,
2017). All but eight of the histone genes were located in three gene clusters on
chromosomes 7 and 26 and on an unmapped scaffold (sctg_442). The organisation of the
133
clusters suggests multiple duplication, rearrangement and fragmentation of an ancestral
cluster with the organisation H4, H1, H3, H2B, H2A (Fig. S1).
A search for genes encoding histone modifying enzymes identified both putative
histone acetyltransferases and methyltransferases, and predicted deacetylase and
demethylase enzymes (Table S2). Most of the acetyltransferases were sufficiently
similar to well-characterised homologues to allow prediction of their target residues but
the methyltransferases tended to be less conserved at the sequence level and, in many
cases, had novel domain structures. Direct functional information, for example based on
mutant analysis, will therefore be necessary to investigate the specificity of the
Ectocarpus methyltransferases.
Identification of histone PTMs in Ectocarpus
Histone PTMs were detected using mass spectrometry of enzyme-digested histone
preparations. In addition, a broad range of commercially available antibodies were
tested against Ectocarpus histone preparations on western blots to further confirm the
presence of a subset of the PTMs identified by mass spectrometry. A total of 45 PTMs of
core and variant histones were detected in Ectocarpus (Fig. 1). Five of these marks were
only detected by western blotting and should therefore be treated with caution (marked
with an asterisk in Table S3). Note that the marks H3K9me2 and H3K9me3 also occur in
Arabidopsis but were not detectable using mass spectrometry (Johnson et al., 2004;
Zhang et al., 2007). Most of the histone PTMs detected have been reported previously in
species from one or more of the land plant, animal or fungal lineages, either at exactly
the same position or at an equivalent position in the corresponding protein (Table S3).
However, a number of marks have only been described so far in stramenopiles. Of these,
some PTMs such as di- and trimethylation of lysine 79 of histone H4 and acetylation of
lysines nine and 15 of H2AZ were detected in both Ectocarpus and the diatom P.
tricornutum, whereas others were detected only in the diatoms (acetylation of lysine 59
on H4) or only in Ectocarpus (acetylation and methylation of lysine 20 and arginine 38,
respectively, on H2AZ).
Genome-wide distribution of selected histone PTMs
To investigate the functions of histone PTMs in Ectocarpus, we analysed the distribution
of six selected marks across the genome using ChIP-seq. The six selected PTMs included
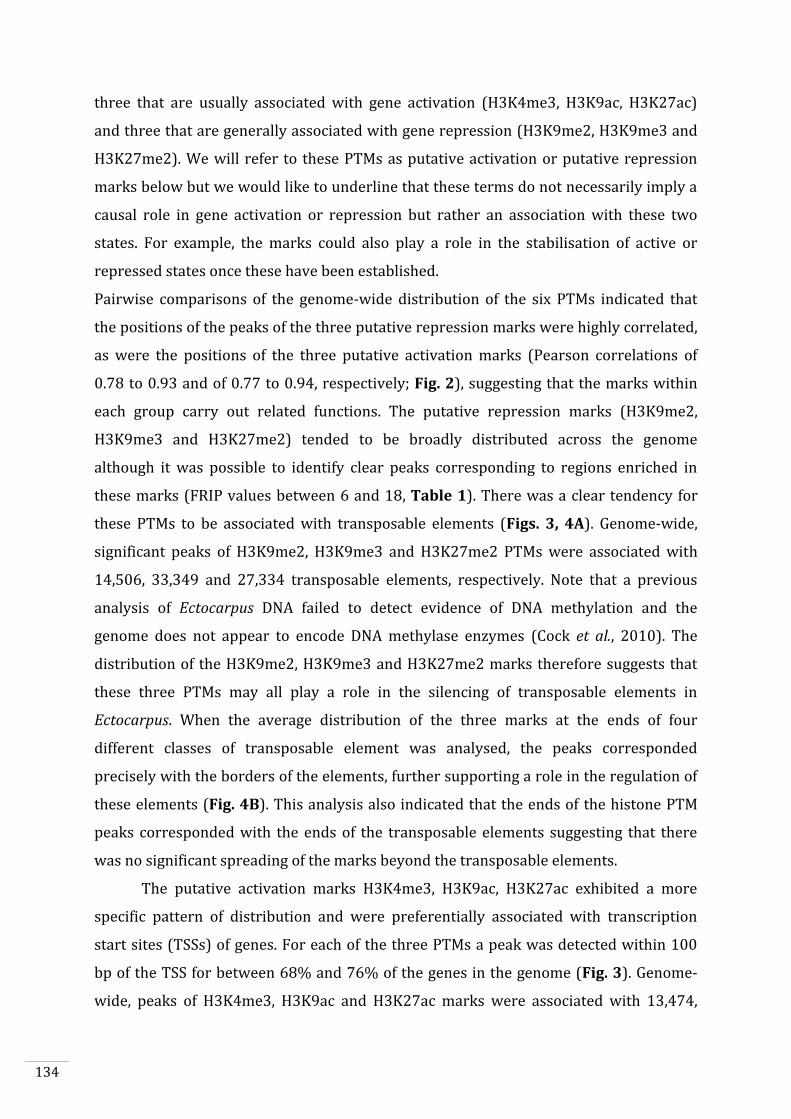
134
three that are usually associated with gene activation (H3K4me3, H3K9ac, H3K27ac)
and three that are generally associated with gene repression (H3K9me2, H3K9me3 and
H3K27me2). We will refer to these PTMs as putative activation or putative repression
marks below but we would like to underline that these terms do not necessarily imply a
causal role in gene activation or repression but rather an association with these two
states. For example, the marks could also play a role in the stabilisation of active or
repressed states once these have been established.
Pairwise comparisons of the genome-wide distribution of the six PTMs indicated that
the positions of the peaks of the three putative repression marks were highly correlated,
as were the positions of the three putative activation marks (Pearson correlations of
0.78 to 0.93 and of 0.77 to 0.94, respectively; Fig. 2), suggesting that the marks within
each group carry out related functions. The putative repression marks (H3K9me2,
H3K9me3 and H3K27me2) tended to be broadly distributed across the genome
although it was possible to identify clear peaks corresponding to regions enriched in
these marks (FRIP values between 6 and 18, Table 1). There was a clear tendency for
these PTMs to be associated with transposable elements (Figs. 3, 4A). Genome-wide,
significant peaks of H3K9me2, H3K9me3 and H3K27me2 PTMs were associated with
14,506, 33,349 and 27,334 transposable elements, respectively. Note that a previous
analysis of Ectocarpus DNA failed to detect evidence of DNA methylation and the
genome does not appear to encode DNA methylase enzymes (Cock et al., 2010). The
distribution of the H3K9me2, H3K9me3 and H3K27me2 marks therefore suggests that
these three PTMs may all play a role in the silencing of transposable elements in
Ectocarpus. When the average distribution of the three marks at the ends of four
different classes of transposable element was analysed, the peaks corresponded
precisely with the borders of the elements, further supporting a role in the regulation of
these elements (Fig. 4B). This analysis also indicated that the ends of the histone PTM
peaks corresponded with the ends of the transposable elements suggesting that there
was no significant spreading of the marks beyond the transposable elements.
The putative activation marks H3K4me3, H3K9ac, H3K27ac exhibited a more
specific pattern of distribution and were preferentially associated with transcription
start sites (TSSs) of genes. For each of the three PTMs a peak was detected within 100
bp of the TSS for between 68% and 76% of the genes in the genome (Fig. 3). Genome-
wide, peaks of H3K4me3, H3K9ac and H3K27ac marks were associated with 13,474,
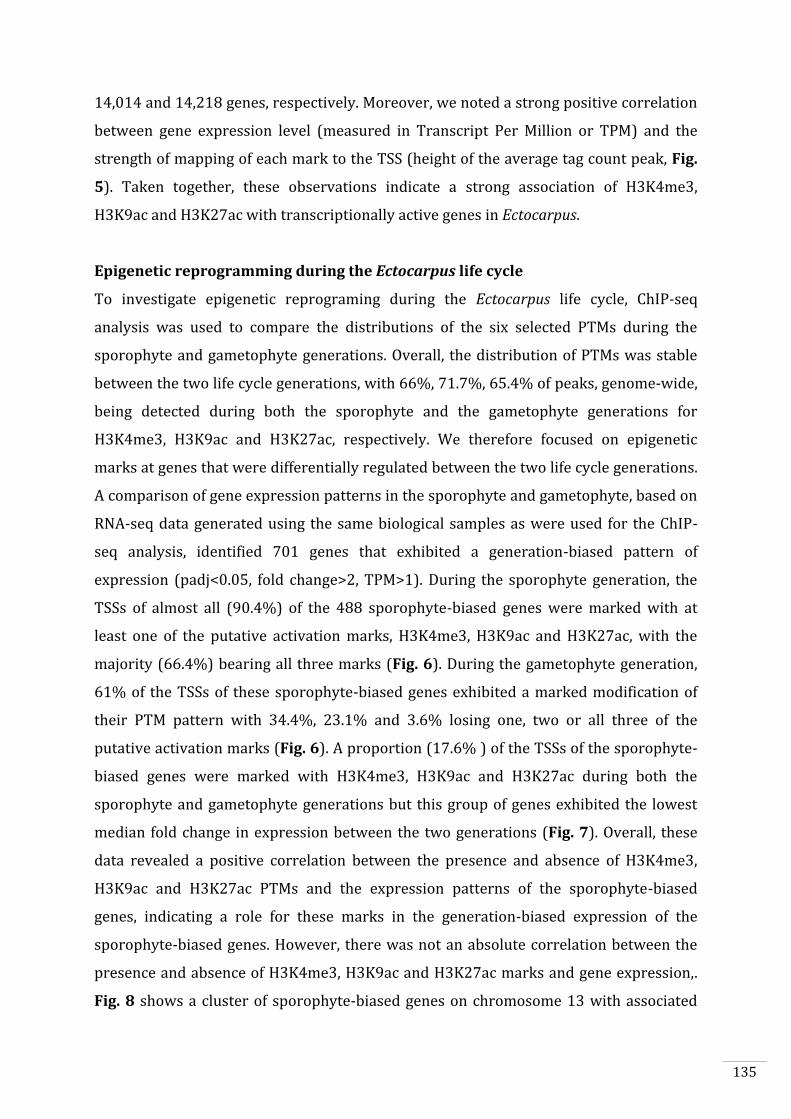
135
14,014 and 14,218 genes, respectively. Moreover, we noted a strong positive correlation
between gene expression level (measured in Transcript Per Million or TPM) and the
strength of mapping of each mark to the TSS (height of the average tag count peak, Fig.
5). Taken together, these observations indicate a strong association of H3K4me3,
H3K9ac and H3K27ac with transcriptionally active genes in Ectocarpus.
Epigenetic reprogramming during the Ectocarpus life cycle
To investigate epigenetic reprograming during the Ectocarpus life cycle, ChIP-seq
analysis was used to compare the distributions of the six selected PTMs during the
sporophyte and gametophyte generations. Overall, the distribution of PTMs was stable
between the two life cycle generations, with 66%, 71.7%, 65.4% of peaks, genome-wide,
being detected during both the sporophyte and the gametophyte generations for
H3K4me3, H3K9ac and H3K27ac, respectively. We therefore focused on epigenetic
marks at genes that were differentially regulated between the two life cycle generations.
A comparison of gene expression patterns in the sporophyte and gametophyte, based on
RNA-seq data generated using the same biological samples as were used for the ChIP-
seq analysis, identified 701 genes that exhibited a generation-biased pattern of
expression (padj<0.05, fold change>2, TPM>1). During the sporophyte generation, the
TSSs of almost all (90.4%) of the 488 sporophyte-biased genes were marked with at
least one of the putative activation marks, H3K4me3, H3K9ac and H3K27ac, with the
majority (66.4%) bearing all three marks (Fig. 6). During the gametophyte generation,
61% of the TSSs of these sporophyte-biased genes exhibited a marked modification of
their PTM pattern with 34.4%, 23.1% and 3.6% losing one, two or all three of the
putative activation marks (Fig. 6). A proportion (17.6% ) of the TSSs of the sporophyte-
biased genes were marked with H3K4me3, H3K9ac and H3K27ac during both the
sporophyte and gametophyte generations but this group of genes exhibited the lowest
median fold change in expression between the two generations (Fig. 7). Overall, these
data revealed a positive correlation between the presence and absence of H3K4me3,
H3K9ac and H3K27ac PTMs and the expression patterns of the sporophyte-biased
genes, indicating a role for these marks in the generation-biased expression of the
sporophyte-biased genes. However, there was not an absolute correlation between the
presence and absence of H3K4me3, H3K9ac and H3K27ac marks and gene expression,.
Fig. 8 shows a cluster of sporophyte-biased genes on chromosome 13 with associated
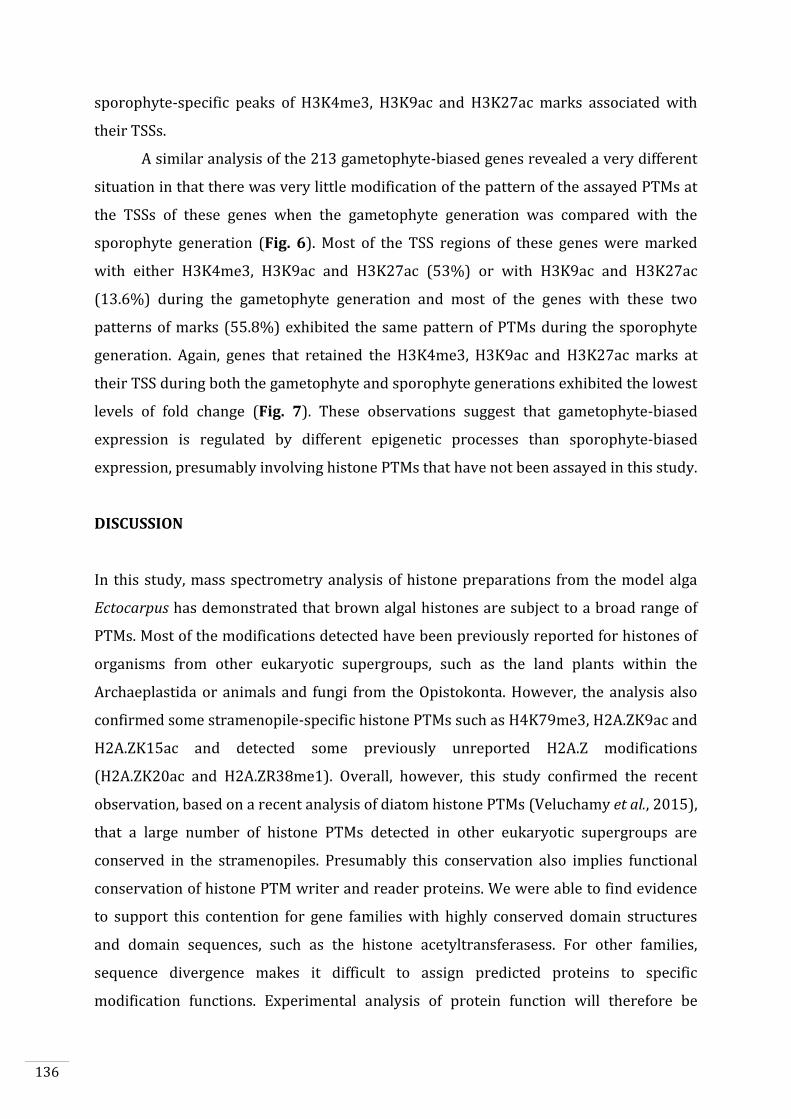
136
sporophyte-specific peaks of H3K4me3, H3K9ac and H3K27ac marks associated with
their TSSs.
A similar analysis of the 213 gametophyte-biased genes revealed a very different
situation in that there was very little modification of the pattern of the assayed PTMs at
the TSSs of these genes when the gametophyte generation was compared with the
sporophyte generation (Fig. 6). Most of the TSS regions of these genes were marked
with either H3K4me3, H3K9ac and H3K27ac (53%) or with H3K9ac and H3K27ac
(13.6%) during the gametophyte generation and most of the genes with these two
patterns of marks (55.8%) exhibited the same pattern of PTMs during the sporophyte
generation. Again, genes that retained the H3K4me3, H3K9ac and H3K27ac marks at
their TSS during both the gametophyte and sporophyte generations exhibited the lowest
levels of fold change (Fig. 7). These observations suggest that gametophyte-biased
expression is regulated by different epigenetic processes than sporophyte-biased
expression, presumably involving histone PTMs that have not been assayed in this study.
DISCUSSION
In this study, mass spectrometry analysis of histone preparations from the model alga
Ectocarpus has demonstrated that brown algal histones are subject to a broad range of
PTMs. Most of the modifications detected have been previously reported for histones of
organisms from other eukaryotic supergroups, such as the land plants within the
Archaeplastida or animals and fungi from the Opistokonta. However, the analysis also
confirmed some stramenopile-specific histone PTMs such as H4K79me3, H2A.ZK9ac and
H2A.ZK15ac and detected some previously unreported H2A.Z modifications
(H2A.ZK20ac and H2A.ZR38me1). Overall, however, this study confirmed the recent
observation, based on a recent analysis of diatom histone PTMs (Veluchamy et al., 2015),
that a large number of histone PTMs detected in other eukaryotic supergroups are
conserved in the stramenopiles. Presumably this conservation also implies functional
conservation of histone PTM writer and reader proteins. We were able to find evidence
to support this contention for gene families with highly conserved domain structures
and domain sequences, such as the histone acetyltransferasess. For other families,
sequence divergence makes it difficult to assign predicted proteins to specific
modification functions. Experimental analysis of protein function will therefore be
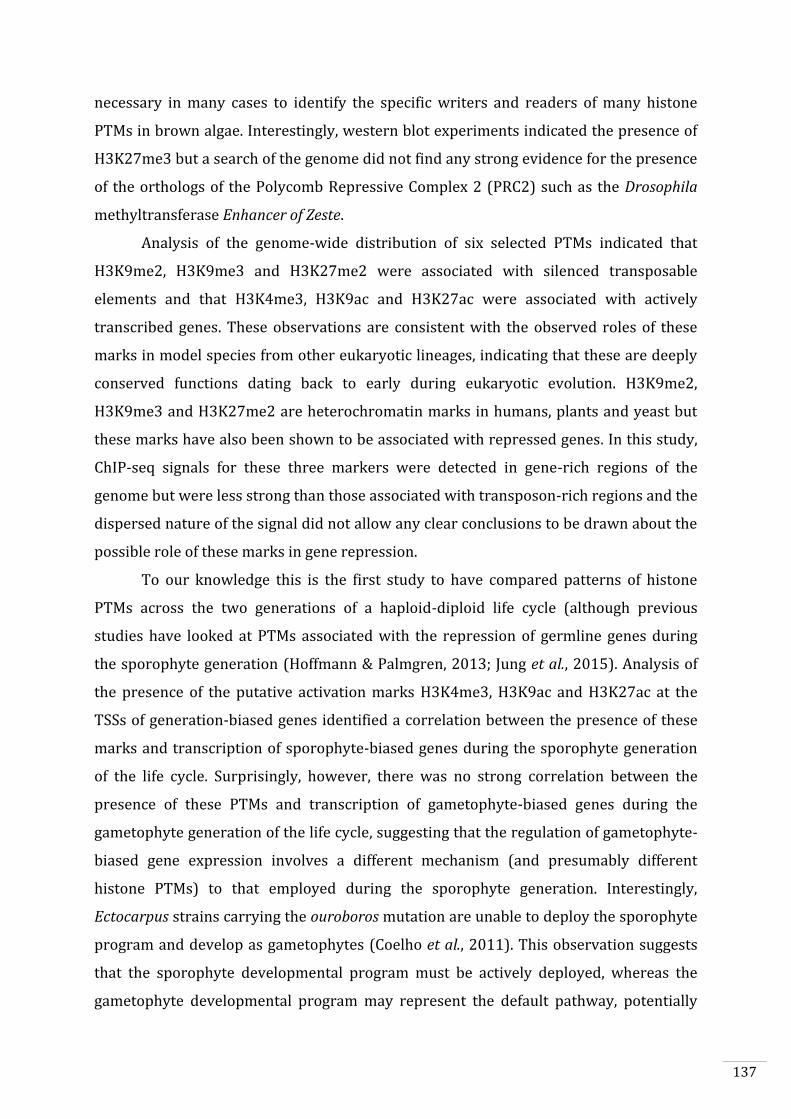
137
necessary in many cases to identify the specific writers and readers of many histone
PTMs in brown algae. Interestingly, western blot experiments indicated the presence of
H3K27me3 but a search of the genome did not find any strong evidence for the presence
of the orthologs of the Polycomb Repressive Complex 2 (PRC2) such as the Drosophila
methyltransferase Enhancer of Zeste.
Analysis of the genome-wide distribution of six selected PTMs indicated that
H3K9me2, H3K9me3 and H3K27me2 were associated with silenced transposable
elements and that H3K4me3, H3K9ac and H3K27ac were associated with actively
transcribed genes. These observations are consistent with the observed roles of these
marks in model species from other eukaryotic lineages, indicating that these are deeply
conserved functions dating back to early during eukaryotic evolution. H3K9me2,
H3K9me3 and H3K27me2 are heterochromatin marks in humans, plants and yeast but
these marks have also been shown to be associated with repressed genes. In this study,
ChIP-seq signals for these three markers were detected in gene-rich regions of the
genome but were less strong than those associated with transposon-rich regions and the
dispersed nature of the signal did not allow any clear conclusions to be drawn about the
possible role of these marks in gene repression.
To our knowledge this is the first study to have compared patterns of histone
PTMs across the two generations of a haploid-diploid life cycle (although previous
studies have looked at PTMs associated with the repression of germline genes during
the sporophyte generation (Hoffmann & Palmgren, 2013; Jung et al., 2015). Analysis of
the presence of the putative activation marks H3K4me3, H3K9ac and H3K27ac at the
TSSs of generation-biased genes identified a correlation between the presence of these
marks and transcription of sporophyte-biased genes during the sporophyte generation
of the life cycle. Surprisingly, however, there was no strong correlation between the
presence of these PTMs and transcription of gametophyte-biased genes during the
gametophyte generation of the life cycle, suggesting that the regulation of gametophyte-
biased gene expression involves a different mechanism (and presumably different
histone PTMs) to that employed during the sporophyte generation. Interestingly,
Ectocarpus strains carrying the ouroboros mutation are unable to deploy the sporophyte
program and develop as gametophytes (Coelho et al., 2011). This observation suggests
that the sporophyte developmental program must be actively deployed, whereas the
gametophyte developmental program may represent the default pathway, potentially
138
explaining the different epigenetic patterns associated with sporophyte- and
gametophyte-biased genes.
MATERIAL AND METHODS
Strains and growth conditions
The Ectocarpus sp. strain used in this study was Ec32 (Peters et al., 2008). Ectocarpus
was cultivated as described previously (Coelho et al., 2012b). Cultures were grown at
13°C with a 12h/12h day/night cycle and 20 (µmol photons).m-2.s-1 irradiance.
Detection of histone PTMs using mass spectrometry
Ectocarpus histone proteins were isolated using the method described by Tirichine et al.
(Tirichine et al., 2014). Briefly, histones were extracted from isolated nuclei in 1 M CaCl2,
20 mM Tris HCl pH 7.4 in the presence of a cocktail of protease inhibitors. After
precipitation of the acid-insoluble fraction in 0.3 M HCl, the histones were precipitated
by dropwise addition of TCA, centrifuged and the pellet washed with 20% TCA and 0.2%
HCl.
Gel purification and digestion of histones and mass spectrometry analysis were
carried out essentially as described by Veluchamy et al. (Veluchamy et al., 2015). Briefly,
histone proteins, excised from a 14% SDS-polyacryamide gel, were digested overnight
with endoproteinase (12.5 ng/μl), trypsin (Promega), chymotrypsin (12.5 ng/μl,
Promega), ArgC (12.5 ng/μl, Promega) or elastase (20 ng/μl Sigma-Aldrich). Peptides
were analysed using an Ultimate3000 nano-HPLC/MS/MS (Dionex S.A.) coupled to an
LTQ-Orbitrap mass spectrometer (Thermo Fisher Scientific, Bremen, Germany). Spectra
were generated using Xcalibur (version 2.0.7) and analysed with MascotTM (version 1.4,
Thermo Scientific) using an in-house database consisting of the complete Ectocarpus
proteome available at Orcae (Sterck et al., 2012). The spectrometry proteomic data has
been deposited in the PRIDE database (Vizcaíno et al., 2016) with identifier XXXXX.
Detection of histone PTMs using western blots
Commercially available antibodies (Table S4) for a broad range of histone PTMs were
tested against Ectocarpus histone preparations using western blots.
139
Genome-wide detection of histone PTMs
Ectocarpus tissue was fixed for five minutes in seawater containing 1% formaldehyde
and the formaldehyde eliminated by rapid filtering followed by incubation in PBS
containing 400 mM glycine. Nuclei were isolated by grinding in liquid nitrogen and in a
Tenbroeck Potter in nuclei isolation buffer (0.1% triton X-100, 125 mM sorbitol, 20 mM
potassium citrate, 30 mM MgCl2, 5 mM EDTA, 5 mM β-mercaptoethanol, 55 mM HEPES
at pH 7.5 with cOmplete ULTRA protease inhibitors), filtering through Miracloth and
then washing the precipitated nuclei in nuclei isolation buffer with and then without
triton X-100. Chromatin was fragmented by sonicating the purified nuclei in nuclei lysis
buffer (10 mM EDTA, 1% SDS, 50 mM Tris-HCl at pH 8 with complete ultra protease
inhibitors) in a Covaris M220 Focused-ultrasonicator (duty 25%, peak power 75,
cycles/burst 200, duration 900 sec at 6°C). The chromatin was incubated with an anti-
histone PTM antibody (Table S4) overnight at 4°C and the immunoprecipitation carried
out using Dynabeads protein A and Dynabeads protein G. Following
immunoprecipitation and washing, a reverse cross-linking step was carried out by
incubating for at least six hours at 65°C in 5 M NaCl and the samples were then digested
with Proteinase K and RNAse A. The purified DNA was then analysed on an Illumina
HiSeq 4000 platform with single-end sequencing primer over 50 cycles. At least 20
million reads were generated for each immunoprecipitation. The ChIP-seq dataset has
been deposited in the NCBI Gene Expression Omnibus database under the accession
number XXXXX.
Quality control of the sequence data was carried out using FASTQC (Andrews,
2016). Poor quality sequence was removed and the high quality sequence was trimmed
with Flexcat (Dodt et al., 2012; Hansen et al., 2016). Illumina reads were mapped onto
the Ectocarpus genome (Cormier et al., 2017) using Bowtie v1 (Kim et al., 2013). Peaks
corresponding to regions enriched in PTMs were identified using MACS2 (version 2.1.1)
callpeak module (minimum FDR of 0.01) and refined with MACS2 bdgpeakcall and
bdgbroadcall modules (Zhang et al., 2008). Colocalised peaks corresponding to regions
enriched in several PTMs were detected using MACS2 outputs in BedTools multiinter
(Quinlan & Hall, 2010). Heatmaps, average tag graphs and coverage tracks were plotted
using EaSeq software (Lerdrup et al., 2016). Circos graphs were generated using Circos
software (Krzywinski et al., 2009). The analysis was carried out for two biological
replicates for each PTM during both the sporophyte and gametophyte generations of the
140
life cycle. Pearson correlation analysis between replicates was performed with
DeepTools 2.5.4. Replicate samples were strongly correlated (Pearson correlations of
0.92 to 1.00).
Comparisons of sporophyte and gametophyte transcriptomes using RNA-seq
RNA for transcriptome analysis was extracted from the same duplicate sporophyte and
gametophyte cultures as were used for the ChIP-seq analysis using the Qiagen RNeasy
plant mini kit with an on-column Deoxyribonuclease I treatment. RNA quality and
concentration was then analysed on a Qubit® 2.0 Fluorometer using Qubit RNA BR assay
kit (Invitrogen, Life Technologies, Carlsbad, CA, USA). Between 49 and 107 million
sequence reads were generated for each sample on an Illumina HiSeq 4000 platform
with single-end sequencing primer over 150 cycles. Quality trimming of raw reads was
carried out with Flexcat (Dodt et al., 2012; Hansen et al., 2016) and reads of less than 50
nucleotides after trimming were removed. Tophat2 (Kim et al., 2013) was used to map
reads to the Ectocarpus reference genome (Cock et al., 2010); available at Orcae; (Sterck
et al., 2012) and the mapped sequencing data was processed with HTSeq (Anders et al.,
2014) to obtain counts for sequencing reads mapped to exons. Expression values were
represented as TPM. Differential expression was detected using the DESeq2 package
(Bioconductor; (Love et al., 2014) using an adjusted p-value cut-off of 0.05 and a
minimal fold-change of 2.
Searches for histone and histone modifying enzyme encoding genes in Ectocarpus
Histone and histone modifier genes were detected in the Ectocarpus genome (available
at Orcae; (Sterck et al., 2012) using Blast (Altschul et al., 1997) and manually
reannotated when necessary.
ACKNOWLEDGMENTS
This work was supported by the Centre National de la Recherche Scientifique, the
Sorbonne Université, the Agence Nationale de la Recherche project Idealg (ANR-10-
BTBR-04-01) and the European Research Council (grant agreement 638240).
141
REFERENCES
Altschul SF, Madden TL, Schaffer AA, Zhang J, Zhang Z, Miller W, Lipman DJ. 1997.
Gapped BLAST and PSI-BLAST: a new generation of protein database search programs.
Nucleic Acids Research 25: 3389–3402.
Anders S, Pyl ST, Huber W. 2014. HTSeq — A Python framework to work with high-
throughput sequencing data. bioRxiv preprint.
Andrews S. 2016. FastQC A Quality Control tool for High Throughput Sequence Data.
http://www.bioinformatics.babraham.ac.uk/projects/fastqc/.
Bolger AM, Lohse M, Usadel B. 2014. Trimmomatic: a flexible trimmer for Illumina
sequence data. Bioinformatics (Oxford, England) 30: 2114–2120.
Bothwell JH, Marie D, Peters AF, Cock JM, Coelho SM. 2010. Role of
endoreduplication and apomeiosis during parthenogenetic reproduction in the model
brown alga Ectocarpus. New Phytol 188: 111–21.
Cock JM, Godfroy O, Macaisne N, Peters AF, Coelho SM. 2013. Evolution and
regulation of complex life cycles: a brown algal perspective. Curr Opin Plant Biol 17: 1–6.
Cock JM, Peters AF, Coelho SM. 2011. Brown algae. Curr Biol 21: R573-5.
Cock JM, Sterck L, Rouzé P, Scornet D, Allen AE, Amoutzias G, Anthouard V,
Artiguenave F, Aury J, Badger J, et al. 2010. The Ectocarpus genome and the
independent evolution of multicellularity in brown algae. Nature 465: 617–621.
Coelho SM, Godfroy O, Arun A, Le Corguillé G, Peters AF, Cock JM. 2011. OUROBOROS
is a master regulator of the gametophyte to sporophyte life cycle transition in the brown
alga Ectocarpus. Proc Natl Acad Sci USA 108: 11518–11523.
Coelho SM, Scornet D, Rousvoal S, Peters N, Dartevelle L, Peters AF, Cock JM.
2012a. Ectocarpus: A model organism for the brown algae. Cold Spring Harbor Protoc
2012: 193–198.
Coelho SM, Scornet D, Rousvoal S, Peters NT, Dartevelle L, Peters AF, Cock JM.
2012b. How to cultivate Ectocarpus. Cold Spring Harb Protoc 2012: 258–261.
142
Cormier A, Avia K, Sterck L, Derrien T, Wucher V, Andres G, Monsoor M, Godfroy O,
Lipinska A, Perrineau M-M, et al. 2017. Re-annotation, improved large-scale assembly
and establishment of a catalogue of noncoding loci for the genome of the model brown
alga Ectocarpus. The New Phytologist 214: 219–232.
Dodt M, Roehr J, Ahmed R, Dieterich C. 2012. FLEXBAR—Flexible Barcode and
Adapter Processing for Next-Generation Sequencing Platforms. Biology 1: 895–905
Godfroy O, Uji T, Nagasato C, Lipinska AP, Scornet D, Peters AF, Avia K, Colin S,
Laure M, Motomura T, et al. 2017. DISTAG/TBCCd1 Is Required for Basal Cell Fate
Determination in Ectocarpus. The Plant Cell 29: 3102–3122.
Hansen P, Hecht J, Ibn-Salem J, Menkuec B, Roskosch S, Truss M, Robinson P. 2016.
Q-nexus: a comprehensive and efficient analysis pipeline designed for ChIP-nexus. BMC
Genomics 17: 873.
Hoffmann RD, Palmgren MG. 2013. Epigenetic repression of male gametophyte-
specific genes in the Arabidopsis sporophyte. Molecular Plant 6: 1176–1186.
Johnson L, Mollah S, Garcia BA, Muratore TL, Shabanowitz J, Hunt DF, Jacobsen SE.
2004. Mass spectrometry analysis of Arabidopsis histone H3 reveals distinct
combinations of post-translational modifications. Nucleic Acids Research 32: 6511–6518.
Jung CH O’ rien M Singh M halla P . 2015. Epigenetic landscape of germline
specific genes in the sporophyte cells of Arabidopsis thaliana. Frontiers in Plant Science
6: 328.
Kim D, Pertea G, Trapnell C, Pimentel H, Kelley R, Salzberg SL. 2013. TopHat2:
accurate alignment of transcriptomes in the presence of insertions, deletions and gene
fusions. Genome Biol 14: R36.
K tliński M Knizewski Muszewska A Rut wicz K irski M Sch i t A ar ux C
Ginalski K, Jerzmanowski A. 2017. Phylogeny-Based Systematization of Arabidopsis
Proteins with Histone H1 Globular Domain. Plant Physiology 174: 27–34.
Krzywinski M, Schein J, Birol I, Connors J, Gascoyne R, Horsman D, Jones SJ, Marra
MA. 2009. Circos: an information aesthetic for comparative genomics. Genome Research
19: 1639–1645.
143
Lawrence M, Daujat S, Schneider R. 2016. Lateral Thinking: How Histone
Modifications Regulate Gene Expression. Trends in Genetics 32: 42–56.
Lerdrup M, Johansen JV, Agrawal-Singh S, Hansen K. 2016. An interactive
environment for agile analysis and visualization of ChIP-sequencing data. Nature
Structural & Molecular Biology 23: 349–357.
Love MI, Huber W, Anders S. 2014. Moderated estimation of fold change and
dispersion for RNA-seq data with DESeq2. Genome Biol 15: 550.
Macaisne N, Liu F, Scornet D, Peters AF, Lipinska A, Perrineau M-M, Henry A,
Strittmatter M, Boo SM, Cock JM. 2017. The Ectocarpus IMMEDIATE UPRIGHT gene
encodes a member of a novel family of cysteine-rich proteins with an unusual
distribution across the eukaryotes. Development 144: 409–418.
Müller DG. 1967. Generationswechsel, Kernphasenwechsel und Sexualität der
Braunalge Ectocarpus siliculosus im Kulturversuch. Planta 75: 39–54.
Peters AF, Scornet D, Ratin M, Charrier B, Monnier A, Merrien Y, Corre E, Coelho
SM, Cock JM. 2008. Life-cycle-generation-specific developmental processes are
modified in the immediate upright mutant of the brown alga Ectocarpus siliculosus.
Development 135: 1503–1512.
Quinlan AR, Hall IM. 2010. BEDTools: a flexible suite of utilities for comparing genomic
features. Bioinformatics (Oxford, England) 26: 841–842.
Sterck L, Billiau K, Abeel T, Rouzé P, Van de Peer Y. 2012. ORCAE: online resource for
community annotation of eukaryotes. Nat Methods 9: 1041.
Tirichine L, Lin X, Thomas Y, Lombard B, Loew D, Bowler C. 2014. Histone extraction
protocol from the two model diatoms Phaeodactylum tricornutum and Thalassiosira
pseudonana. Mar Genomics 13: 21–5.
Veluchamy A, Rastogi A, Lin X, Lombard B, Murik O, Thomas Y, Dingli F, Rivarola M,
Ott S, Liu X, et al. 2015. An integrative analysis of post-translational histone
modifications in the marine diatom Phaeodactylum tricornutum. Genome Biol 16: 102.

144
Vizcaíno JA, Csordas A, del-Toro N, Dianes JA, Griss J, Lavidas I, Mayer G, Perez-
Riverol Y, Reisinger F, Ternent T, et al. 2016. 2016 update of the PRIDE database and
its related tools. Nucleic Acids Research 44: D447-456.
Zhang Y, Liu T, Meyer CA, Eeckhoute J, Johnson DS, Bernstein BE, Nusbaum C,
Myers RM, Brown M, Li W, et al. 2008. Model-based analysis of ChIP-Seq (MACS).
Genome Biology 9: R137.
Zhang K, Sridhar VV, Zhu J, Kapoor A, Zhu J-K. 2007. Distinctive core histone post-
translational modification patterns in Arabidopsis thaliana. PloS One 2: e1210.

145
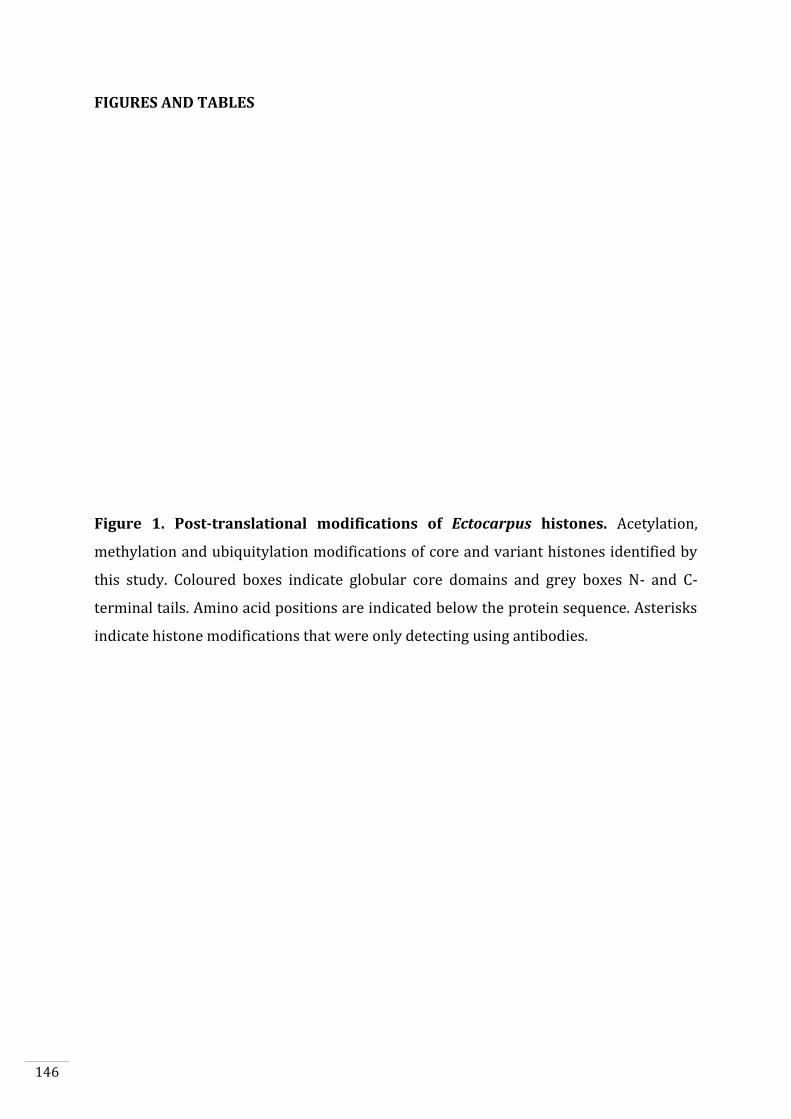
146
FIGURES AND TABLES
Figure 1. Post-translational modifications of Ectocarpus histones. Acetylation,
methylation and ubiquitylation modifications of core and variant histones identified by
this study. Coloured boxes indicate globular core domains and grey boxes N- and C-
terminal tails. Amino acid positions are indicated below the protein sequence. Asterisks
indicate histone modifications that were only detecting using antibodies.
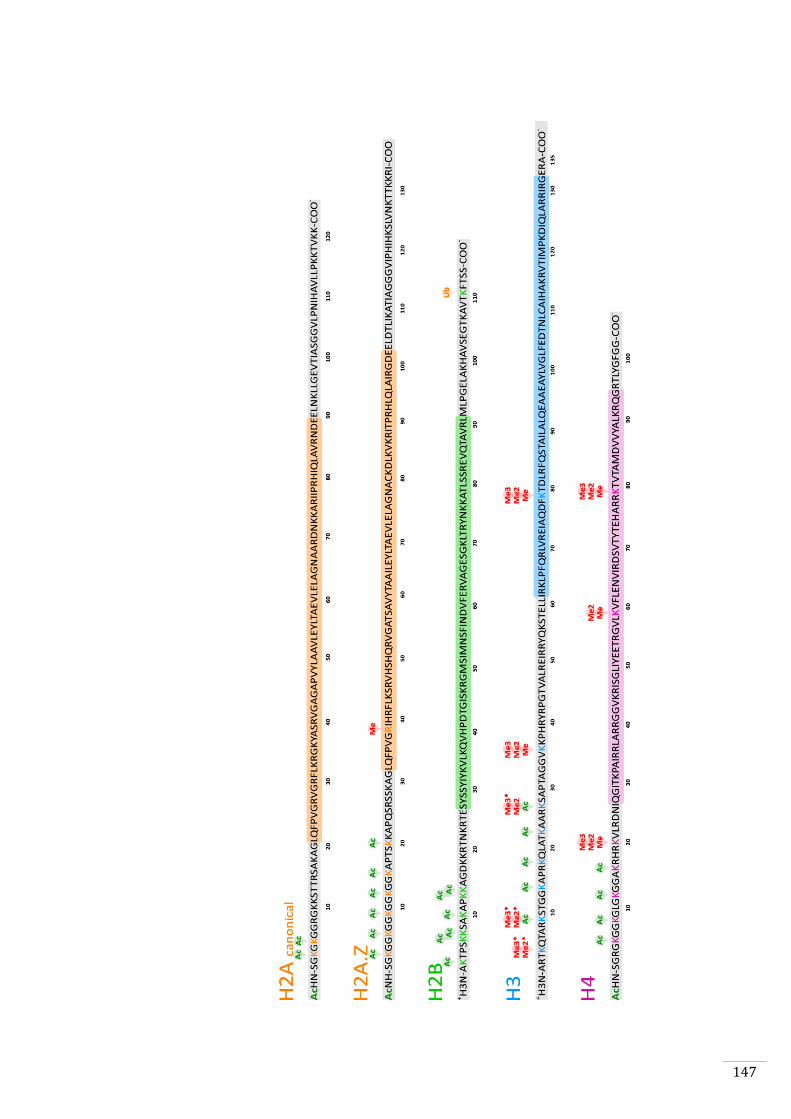
147
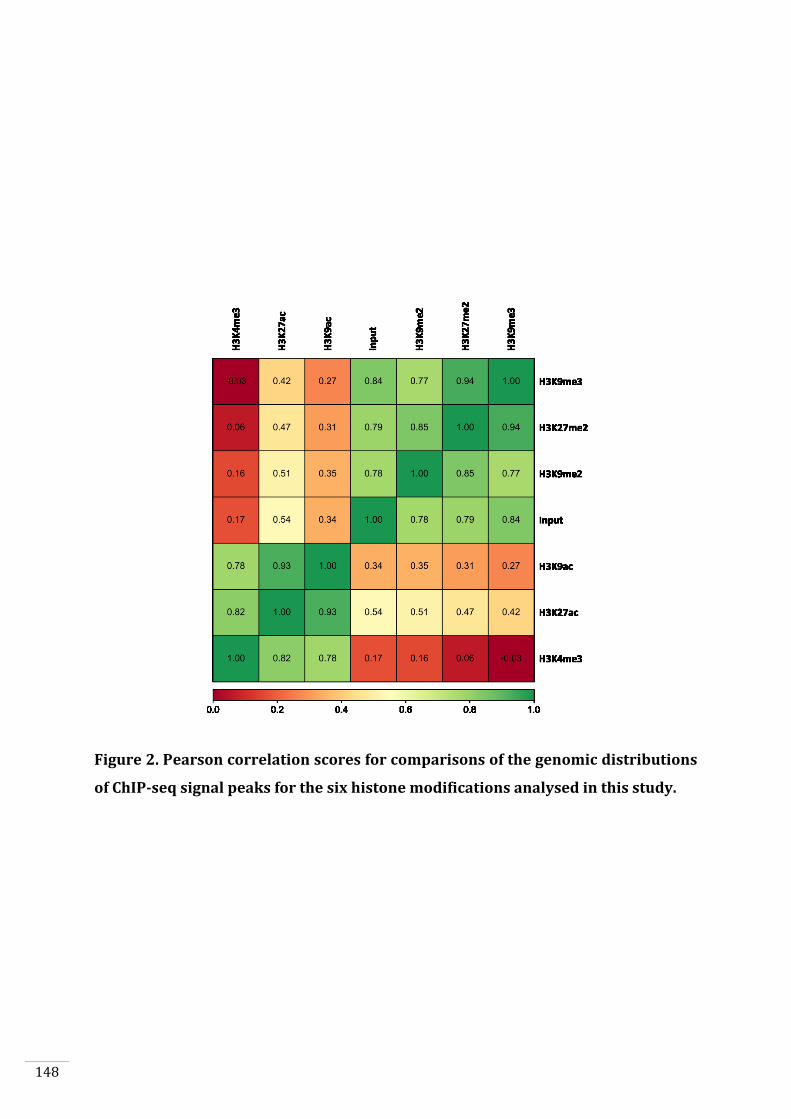
148
Figure 2. Pearson correlation scores for comparisons of the genomic distributions
of ChIP-seq signal peaks for the six histone modifications analysed in this study.
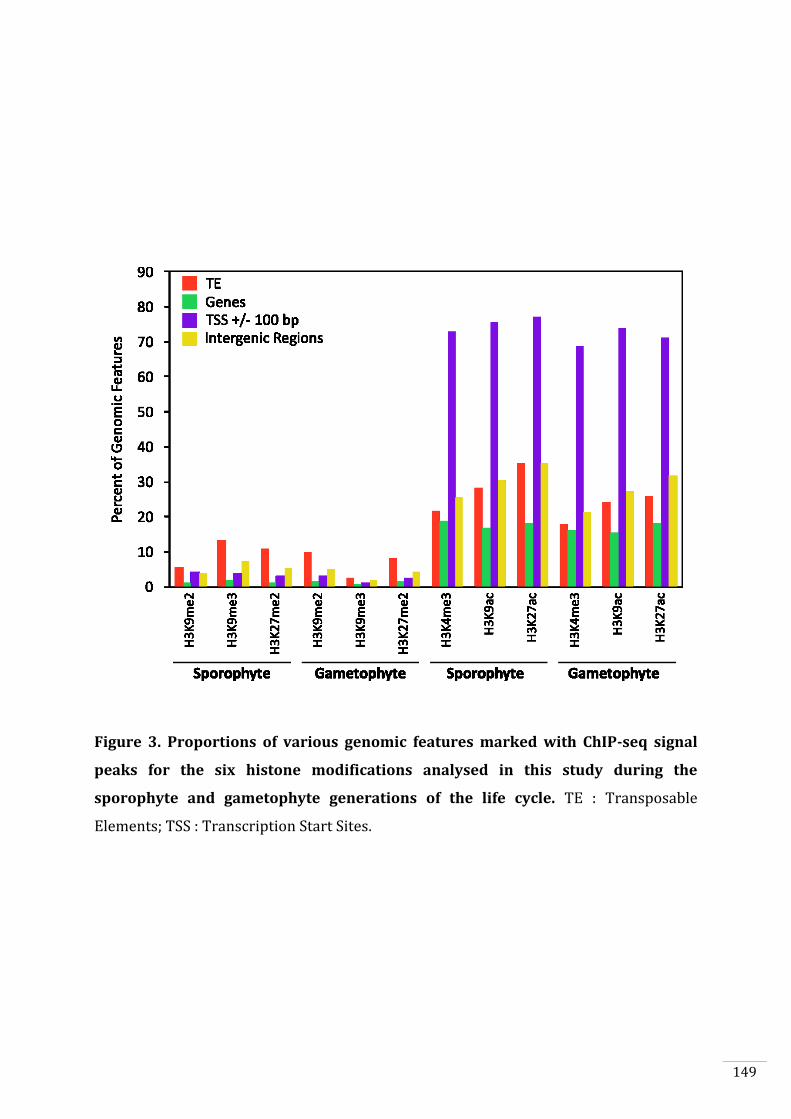
149
Figure 3. Proportions of various genomic features marked with ChIP-seq signal
peaks for the six histone modifications analysed in this study during the
sporophyte and gametophyte generations of the life cycle. TE : Transposable
Elements; TSS : Transcription Start Sites.
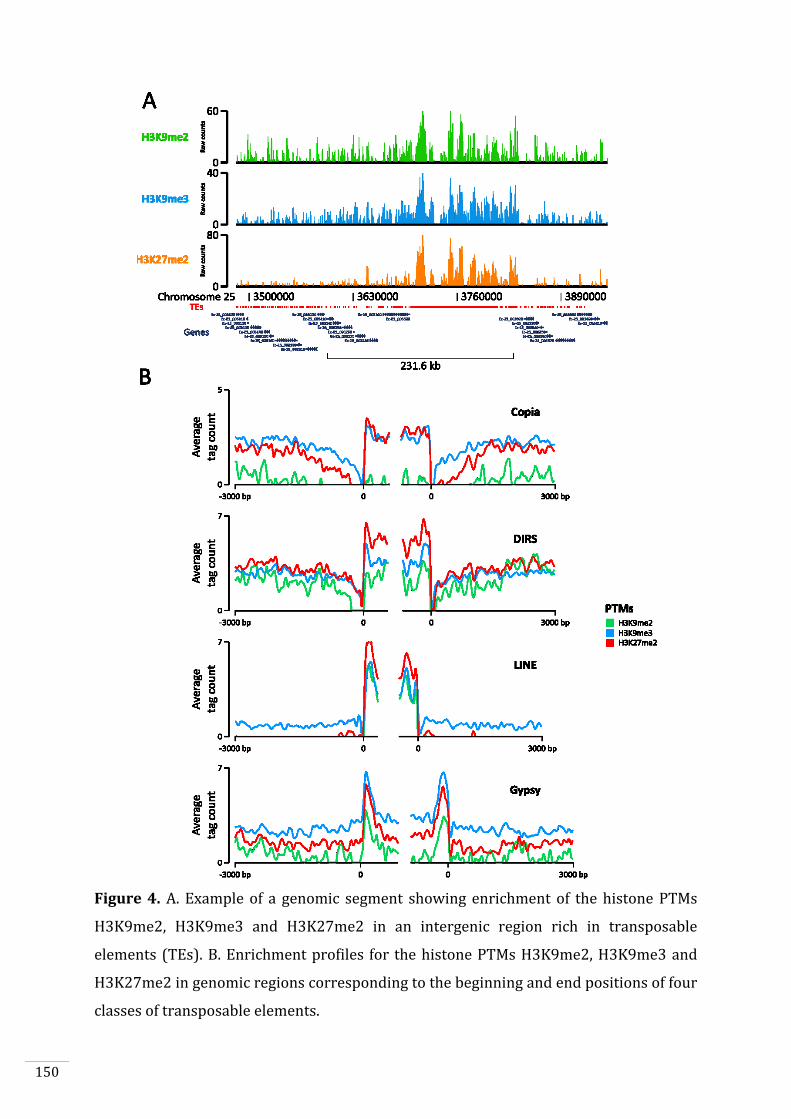
150
Figure 4. A. Example of a genomic segment showing enrichment of the histone PTMs
H3K9me2, H3K9me3 and H3K27me2 in an intergenic region rich in transposable
elements (TEs). B. Enrichment profiles for the histone PTMs H3K9me2, H3K9me3 and
H3K27me2 in genomic regions corresponding to the beginning and end positions of four
classes of transposable elements.
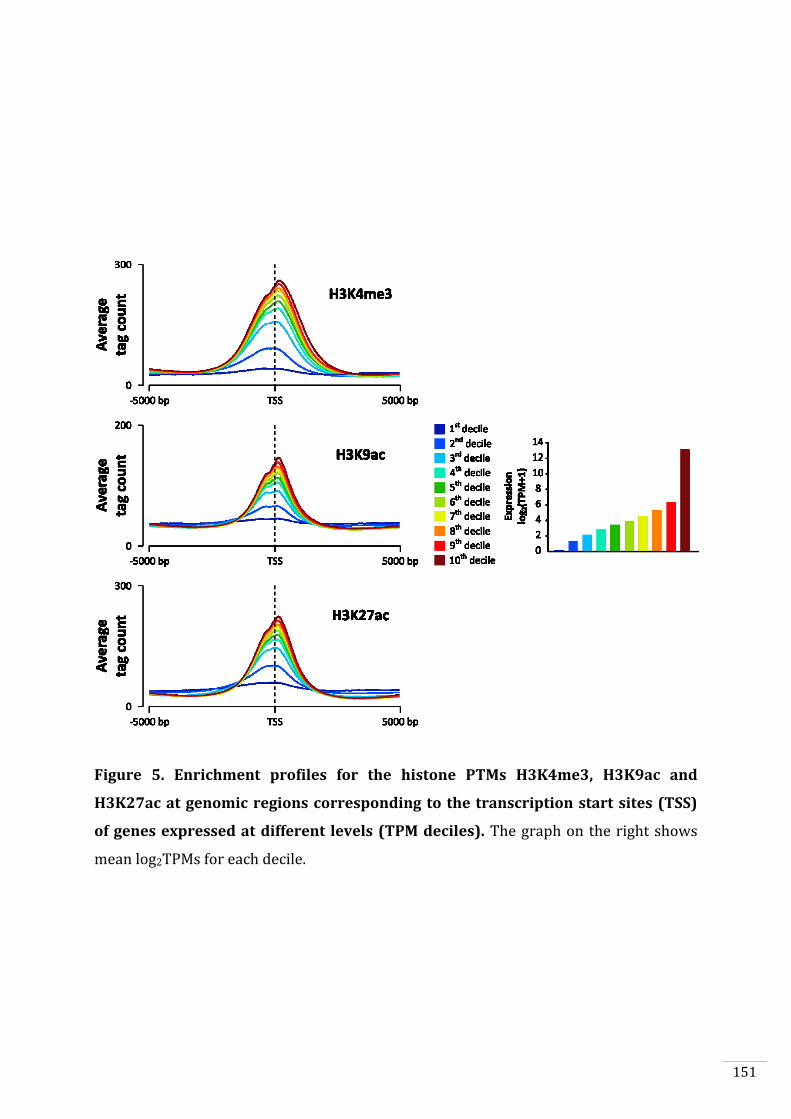
151
Figure 5. Enrichment profiles for the histone PTMs H3K4me3, H3K9ac and
H3K27ac at genomic regions corresponding to the transcription start sites (TSS)
of genes expressed at different levels (TPM deciles). The graph on the right shows
mean log2TPMs for each decile.
152
Figure 6. Alterations of histone PTM patterns at generation-biased genes during
the two generations of the life cycle. A. Circos plots comparing histone PTMs marks at
the transcription start sites (TSS) of sporophyte-biased (left) and gametophyte-biased
(left) genes in chromatin from the sporophyte (brown) and gametophyte (green)
generations of the life cycle. Colours correspond to states one to nine as indicated in the
key. B. Patterns of histone PTM over a region of 10 kbp surrounding the TSSs of
sporophyte-biased (upper panel) and gametophyte-biased (lower panel) genes during
the Sporophyte and gametophyte generations. Colour bands indicate chromatin states
one to nine. The heatmaps show transcript abundance during the two generations and
log2fold-change between generations. C1 to C12 indicate genes clusters that were
further analysed in figure 7.
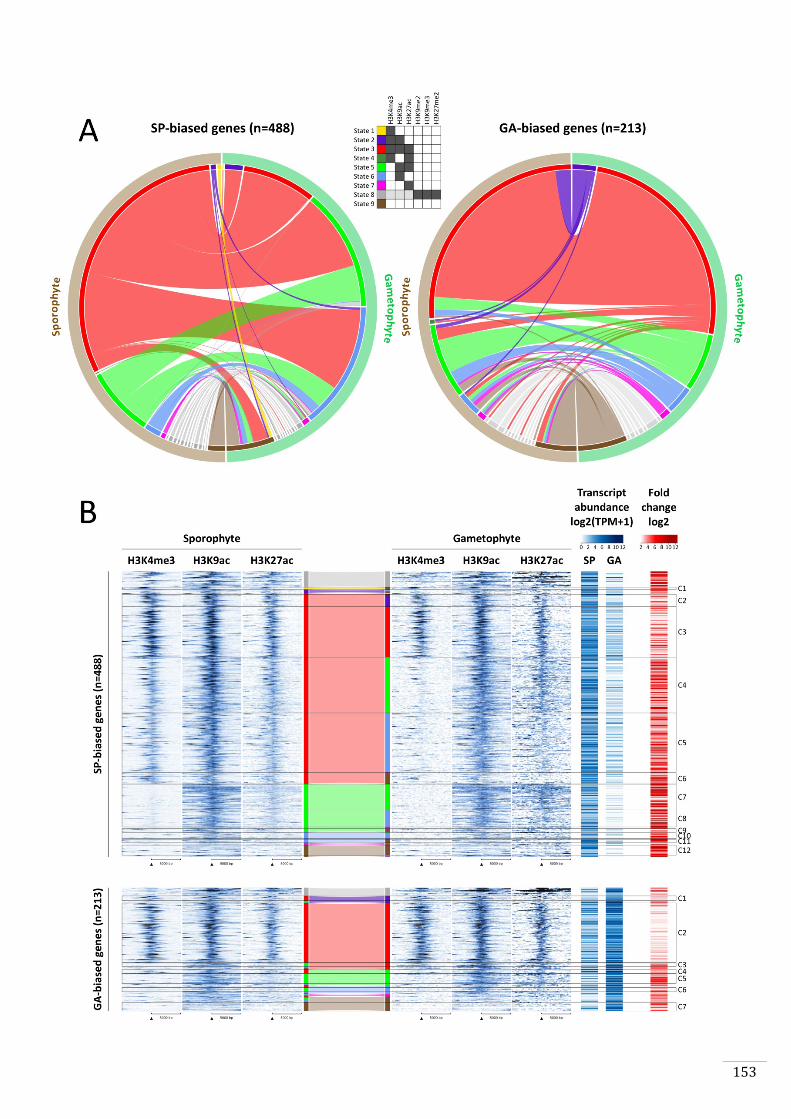
153
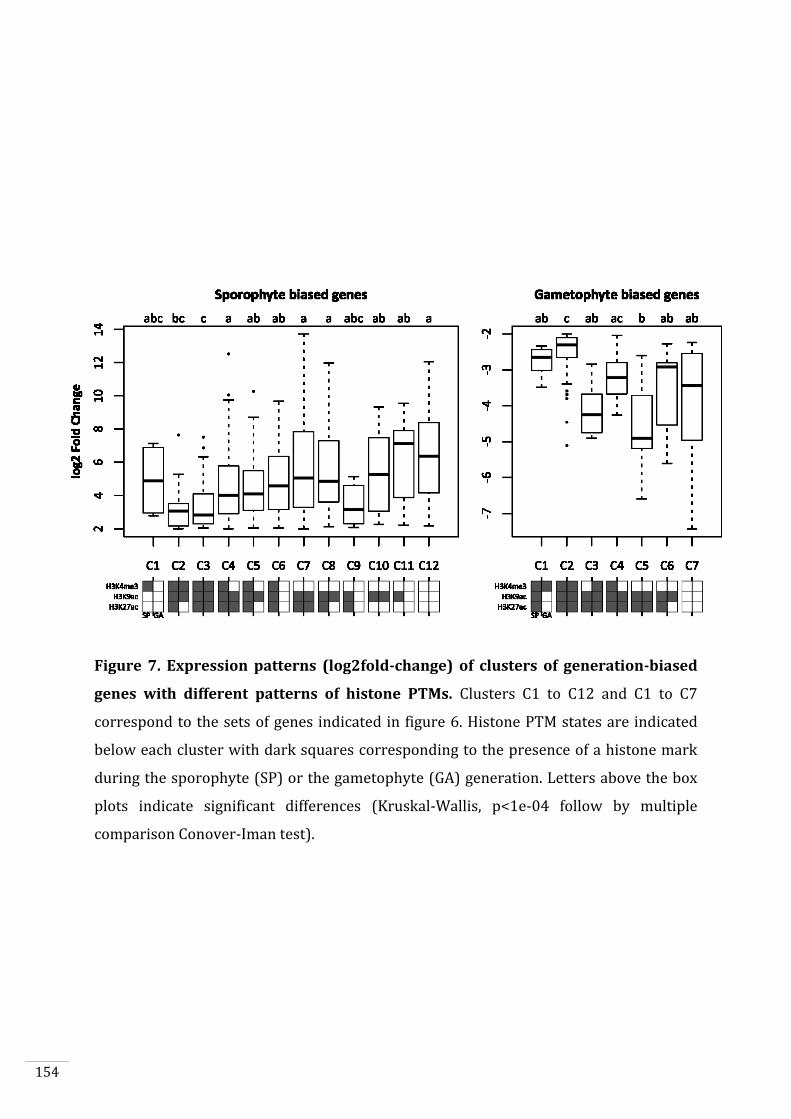
154
Figure 7. Expression patterns (log2fold-change) of clusters of generation-biased
genes with different patterns of histone PTMs. Clusters C1 to C12 and C1 to C7
correspond to the sets of genes indicated in figure 6. Histone PTM states are indicated
below each cluster with dark squares corresponding to the presence of a histone mark
during the sporophyte (SP) or the gametophyte (GA) generation. Letters above the box
plots indicate significant differences (Kruskal-Wallis, p<1e-04 follow by multiple
comparison Conover-Iman test).
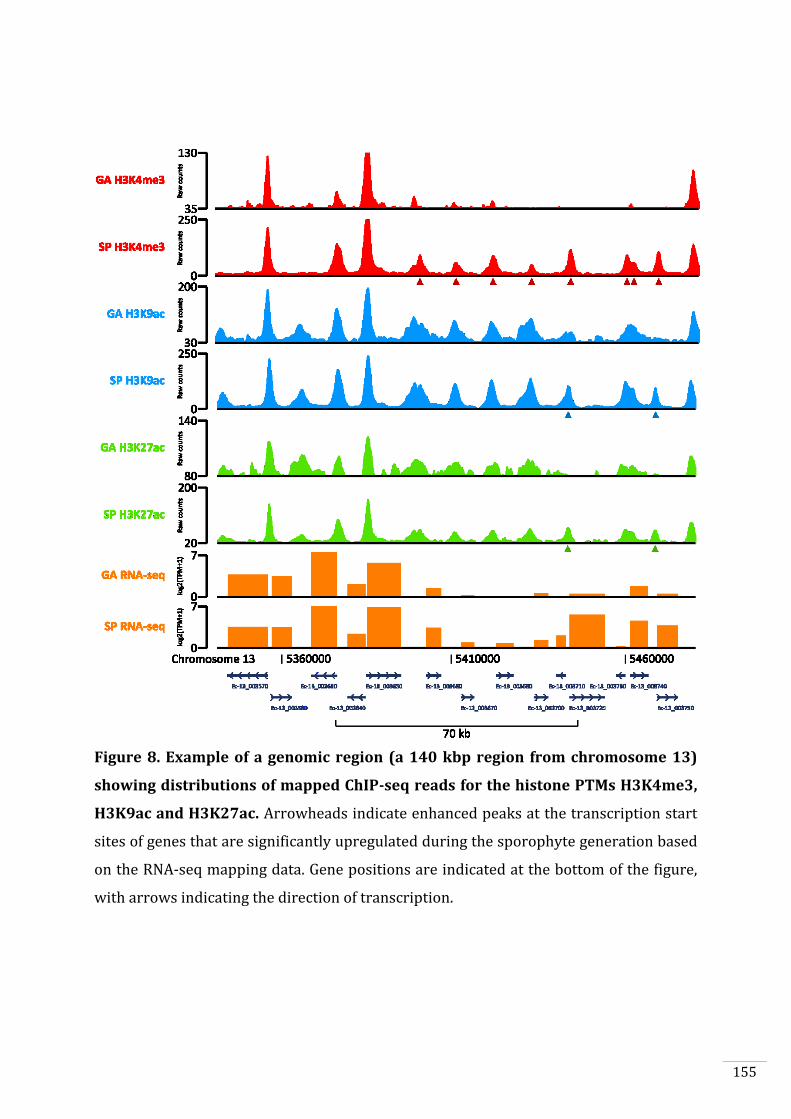
155
Figure 8. Example of a genomic region (a 140 kbp region from chromosome 13)
showing distributions of mapped ChIP-seq reads for the histone PTMs H3K4me3,
H3K9ac and H3K27ac. Arrowheads indicate enhanced peaks at the transcription start
sites of genes that are significantly upregulated during the sporophyte generation based
on the RNA-seq mapping data. Gene positions are indicated at the bottom of the figure,
with arrows indicating the direction of transcription.
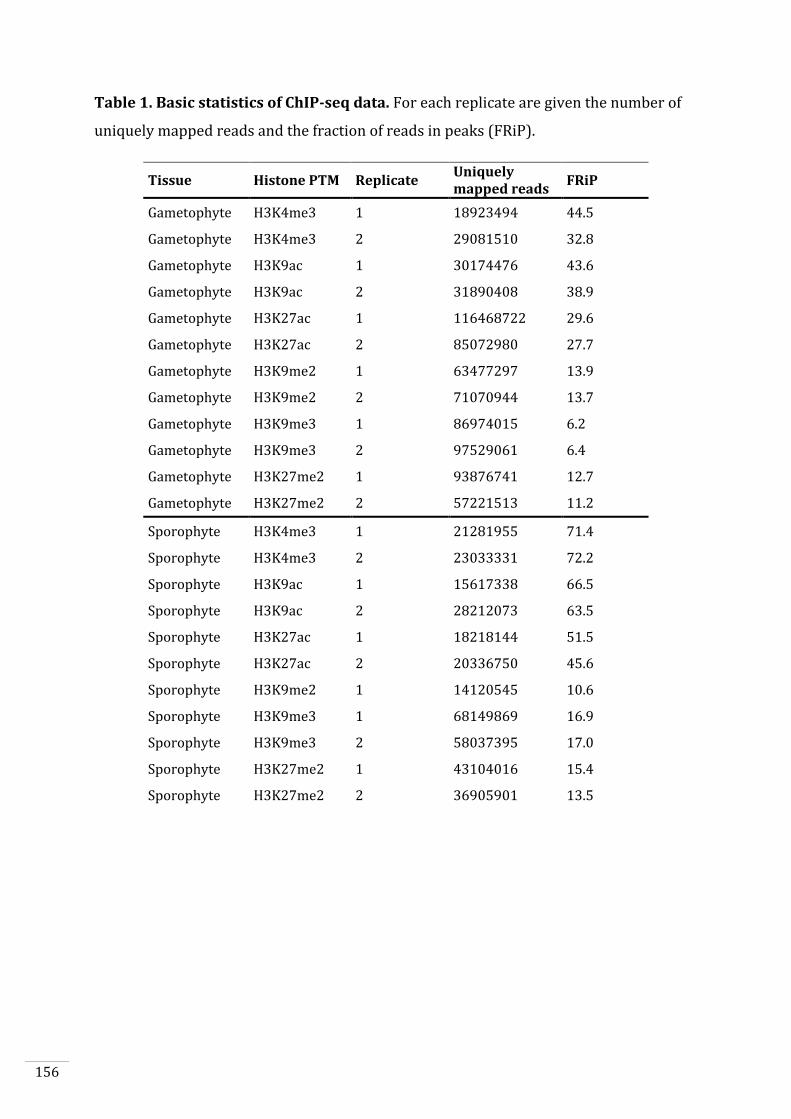
156
Table 1. Basic statistics of ChIP-seq data. For each replicate are given the number of
uniquely mapped reads and the fraction of reads in peaks (FRiP).
Tissue Histone PTM Replicate Uniquely mapped reads
FRiP
Gametophyte H3K4me3 1 18923494 44.5
Gametophyte H3K4me3 2 29081510 32.8
Gametophyte H3K9ac 1 30174476 43.6
Gametophyte H3K9ac 2 31890408 38.9
Gametophyte H3K27ac 1 116468722 29.6
Gametophyte H3K27ac 2 85072980 27.7
Gametophyte H3K9me2 1 63477297 13.9
Gametophyte H3K9me2 2 71070944 13.7
Gametophyte H3K9me3 1 86974015 6.2
Gametophyte H3K9me3 2 97529061 6.4
Gametophyte H3K27me2 1 93876741 12.7
Gametophyte H3K27me2 2 57221513 11.2
Sporophyte H3K4me3 1 21281955 71.4
Sporophyte H3K4me3 2 23033331 72.2
Sporophyte H3K9ac 1 15617338 66.5
Sporophyte H3K9ac 2 28212073 63.5
Sporophyte H3K27ac 1 18218144 51.5
Sporophyte H3K27ac 2 20336750 45.6
Sporophyte H3K9me2 1 14120545 10.6
Sporophyte H3K9me3 1 68149869 16.9
Sporophyte H3K9me3 2 58037395 17.0
Sporophyte H3K27me2 1 43104016 15.4
Sporophyte H3K27me2 2 36905901 13.5
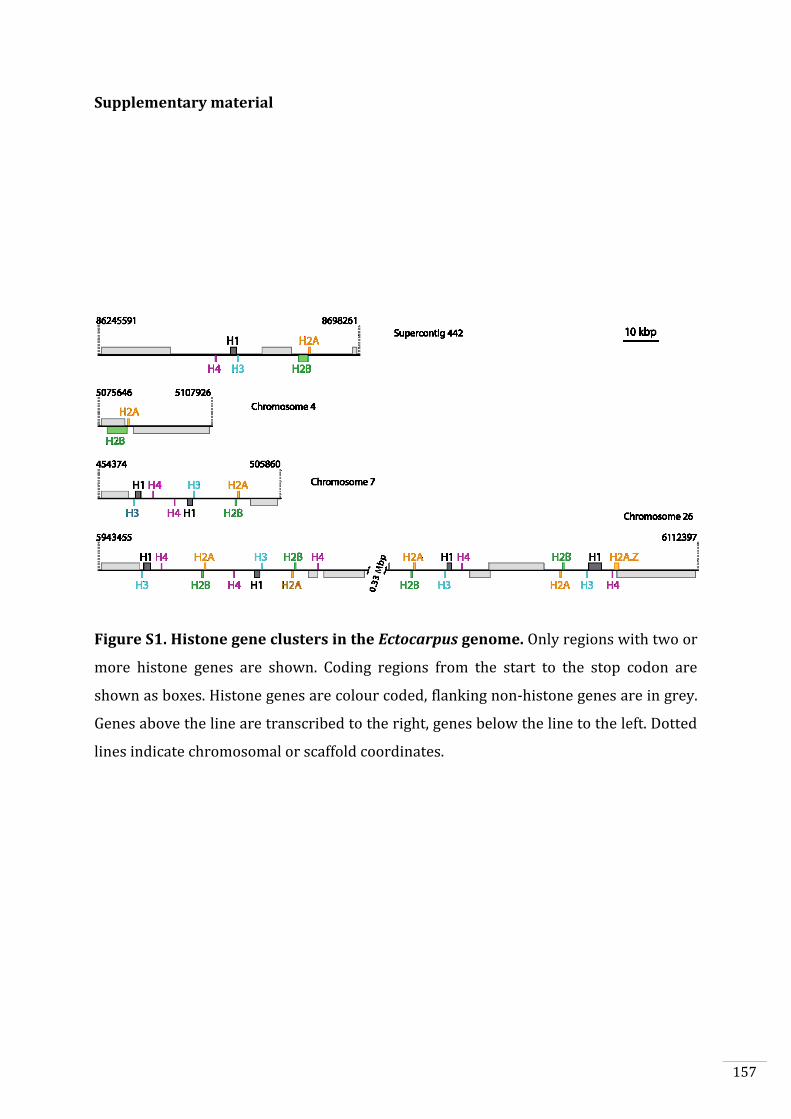
157
Supplementary material
Figure S1. Histone gene clusters in the Ectocarpus genome. Only regions with two or
more histone genes are shown. Coding regions from the start to the stop codon are
shown as boxes. Histone genes are colour coded, flanking non-histone genes are in grey.
Genes above the line are transcribed to the right, genes below the line to the left. Dotted
lines indicate chromosomal or scaffold coordinates.
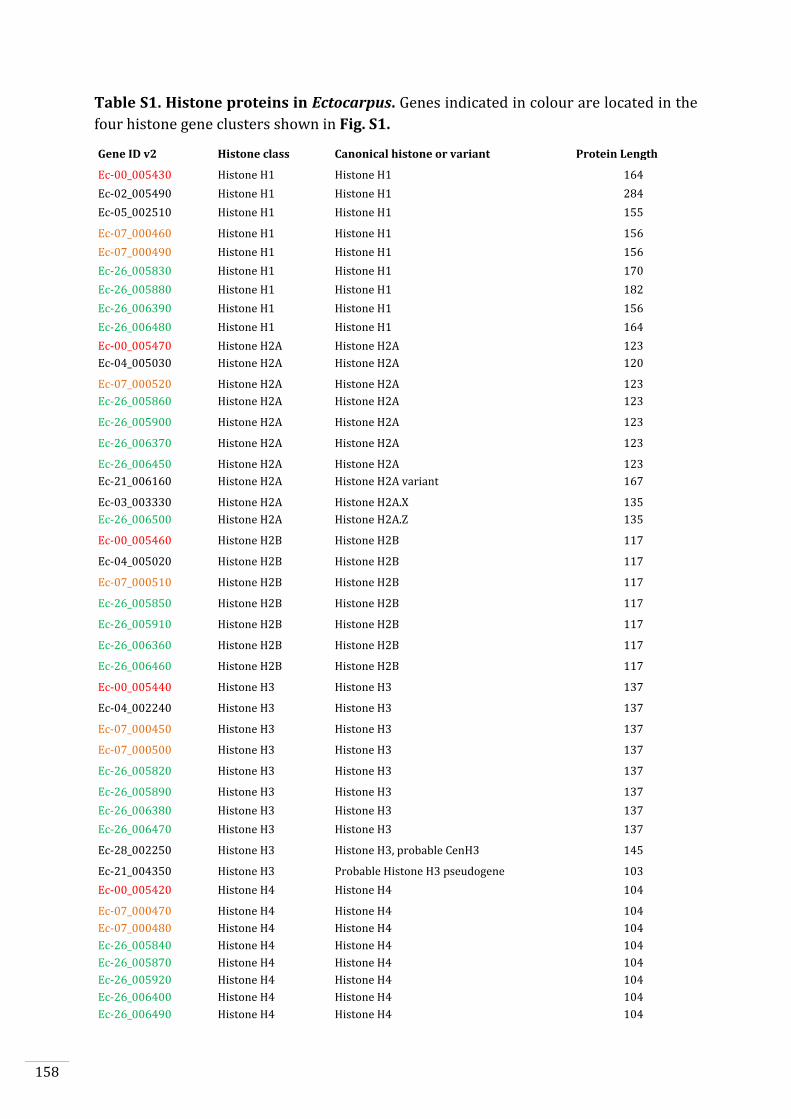
158
Table S1. Histone proteins in Ectocarpus. Genes indicated in colour are located in the
four histone gene clusters shown in Fig. S1.
Gene ID v2 Histone class Canonical histone or variant Protein Length
Ec-00_005430 Histone H1 Histone H1 164
Ec-02_005490 Histone H1 Histone H1 284
Ec-05_002510 Histone H1 Histone H1 155
Ec-07_000460 Histone H1 Histone H1 156
Ec-07_000490 Histone H1 Histone H1 156
Ec-26_005830 Histone H1 Histone H1 170
Ec-26_005880 Histone H1 Histone H1 182
Ec-26_006390 Histone H1 Histone H1 156
Ec-26_006480 Histone H1 Histone H1 164
Ec-00_005470 Histone H2A Histone H2A 123
Ec-04_005030 Histone H2A Histone H2A 120
Ec-07_000520 Histone H2A Histone H2A 123
Ec-26_005860 Histone H2A Histone H2A 123
Ec-26_005900 Histone H2A Histone H2A 123
Ec-26_006370 Histone H2A Histone H2A 123
Ec-26_006450 Histone H2A Histone H2A 123
Ec-21_006160 Histone H2A Histone H2A variant 167
Ec-03_003330 Histone H2A Histone H2A.X 135
Ec-26_006500 Histone H2A Histone H2A.Z 135
Ec-00_005460 Histone H2B Histone H2B 117
Ec-04_005020 Histone H2B Histone H2B 117
Ec-07_000510 Histone H2B Histone H2B 117
Ec-26_005850 Histone H2B Histone H2B 117
Ec-26_005910 Histone H2B Histone H2B 117
Ec-26_006360 Histone H2B Histone H2B 117
Ec-26_006460 Histone H2B Histone H2B 117
Ec-00_005440 Histone H3 Histone H3 137
Ec-04_002240 Histone H3 Histone H3 137
Ec-07_000450 Histone H3 Histone H3 137
Ec-07_000500 Histone H3 Histone H3 137
Ec-26_005820 Histone H3 Histone H3 137
Ec-26_005890 Histone H3 Histone H3 137
Ec-26_006380 Histone H3 Histone H3 137
Ec-26_006470 Histone H3 Histone H3 137
Ec-28_002250 Histone H3 Histone H3, probable CenH3 145
Ec-21_004350 Histone H3 Probable Histone H3 pseudogene 103
Ec-00_005420 Histone H4 Histone H4 104
Ec-07_000470 Histone H4 Histone H4 104
Ec-07_000480 Histone H4 Histone H4 104
Ec-26_005840 Histone H4 Histone H4 104
Ec-26_005870 Histone H4 Histone H4 104
Ec-26_005920 Histone H4 Histone H4 104
Ec-26_006400 Histone H4 Histone H4 104
Ec-26_006490 Histone H4 Histone H4 104
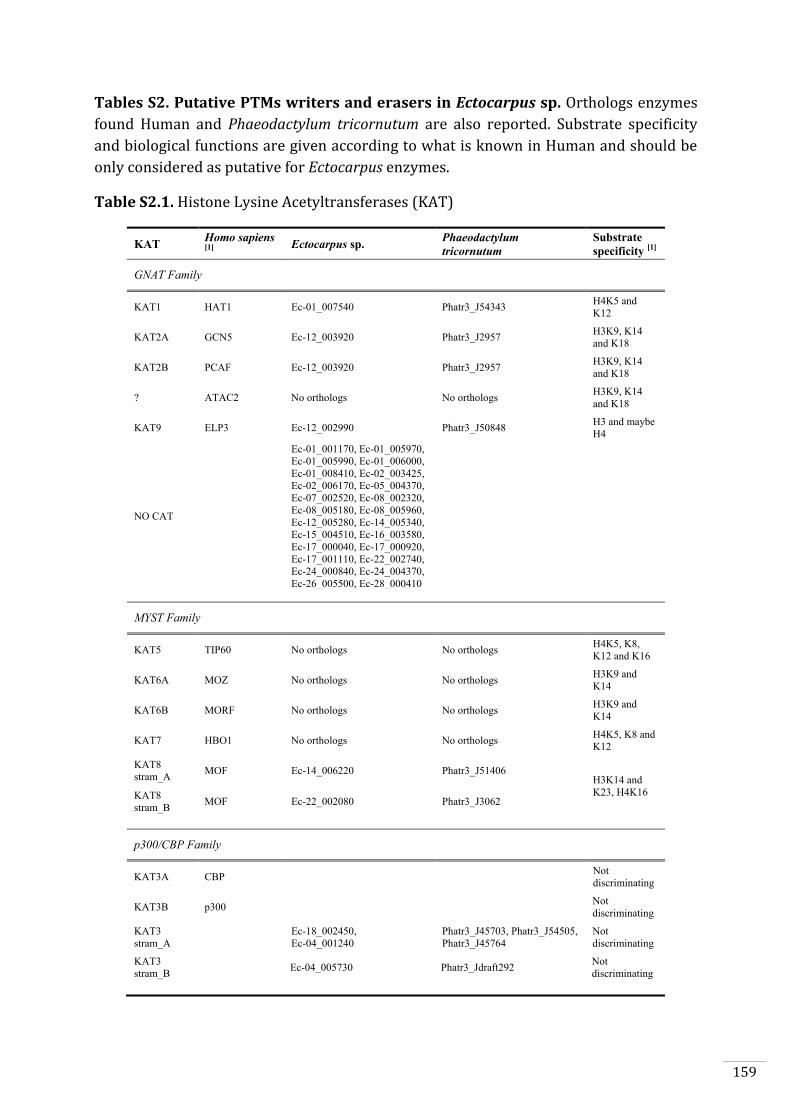
159
Tables S2. Putative PTMs writers and erasers in Ectocarpus sp. Orthologs enzymes
found Human and Phaeodactylum tricornutum are also reported. Substrate specificity
and biological functions are given according to what is known in Human and should be
only considered as putative for Ectocarpus enzymes.
Table S2.1. Histone Lysine Acetyltransferases (KAT)
KAT Homo sapiens [1]
Ectocarpus sp.
Phaeodactylum
tricornutum
Substrate
specificity [1]
GNAT Family
KAT1 HAT1 Ec-01_007540 Phatr3_J54343 H4K5 and
K12
KAT2A GCN5 Ec-12_003920 Phatr3_J2957 H3K9, K14
and K18
KAT2B PCAF Ec-12_003920 Phatr3_J2957 H3K9, K14
and K18
? ATAC2 No orthologs No orthologs H3K9, K14
and K18
KAT9 ELP3 Ec-12_002990 Phatr3_J50848 H3 and maybe
H4
NO CAT
Ec-01_001170, Ec-01_005970,
Ec-01_005990, Ec-01_006000,
Ec-01_008410, Ec-02_003425,
Ec-02_006170, Ec-05_004370,
Ec-07_002520, Ec-08_002320,
Ec-08_005180, Ec-08_005960,
Ec-12_005280, Ec-14_005340,
Ec-15_004510, Ec-16_003580,
Ec-17_000040, Ec-17_000920,
Ec-17_001110, Ec-22_002740,
Ec-24_000840, Ec-24_004370,
Ec-26_005500, Ec-28_000410
MYST Family
KAT5 TIP60 No orthologs No orthologs H4K5, K8,
K12 and K16
KAT6A MOZ No orthologs No orthologs H3K9 and
K14
KAT6B MORF No orthologs No orthologs H3K9 and
K14
KAT7 HBO1 No orthologs No orthologs H4K5, K8 and
K12
KAT8
stram_A MOF Ec-14_006220 Phatr3_J51406
H3K14 and
K23, H4K16 KAT8
stram_B MOF Ec-22_002080 Phatr3_J3062
p300/CBP Family
KAT3A CBP Not
discriminating
KAT3B p300 Not
discriminating
KAT3
stram_A
Ec-18_002450,
Ec-04_001240
Phatr3_J45703, Phatr3_J54505,
Phatr3_J45764
Not
discriminating
KAT3
stram_B Ec-04_005730 Phatr3_Jdraft292
Not
discriminating
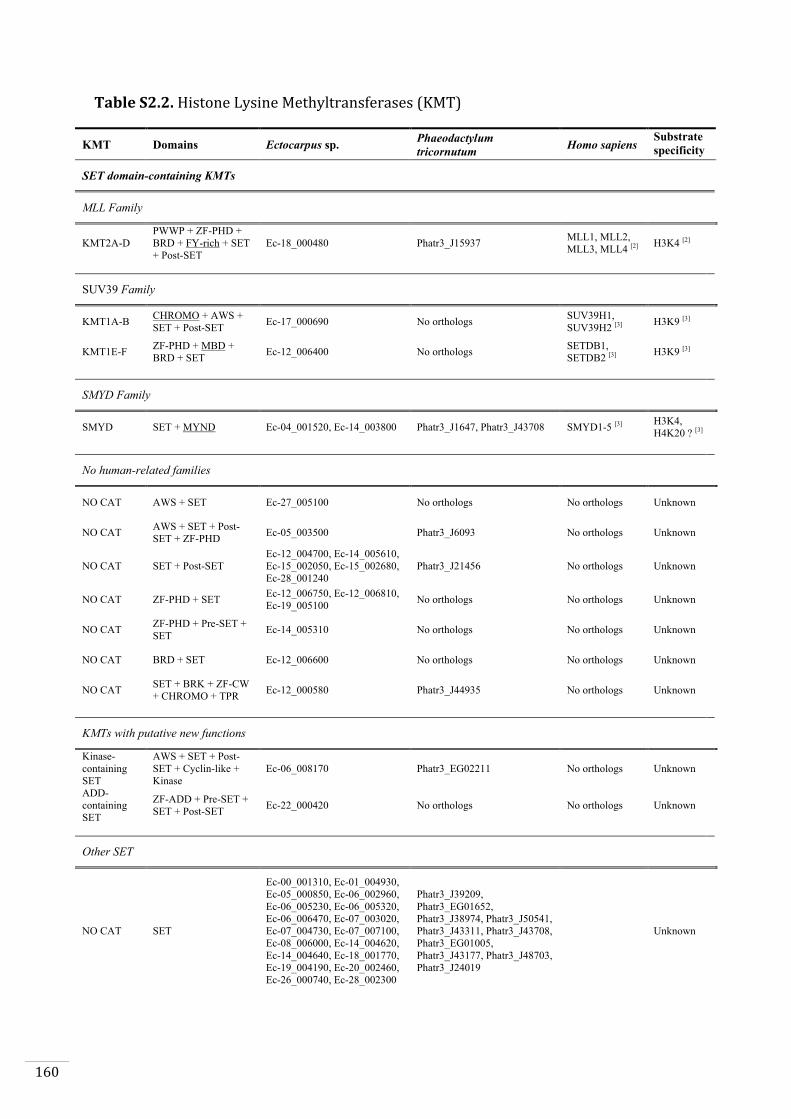
160
Table S2.2. Histone Lysine Methyltransferases (KMT)
KMT Domains Ectocarpus sp. Phaeodactylum
tricornutum Homo sapiens
Substrate
specificity
SET domain-containing KMTs
MLL Family
KMT2A-D
PWWP + ZF-PHD +
BRD + FY-rich + SET
+ Post-SET
Ec-18_000480 Phatr3_J15937 MLL1, MLL2,
MLL3, MLL4 [2] H3K4 [2]
SUV39 Family
KMT1A-B CHROMO + AWS +
SET + Post-SET Ec-17_000690 No orthologs
SUV39H1,
SUV39H2 [3] H3K9 [3]
KMT1E-F ZF-PHD + MBD +
BRD + SET Ec-12_006400 No orthologs
SETDB1,
SETDB2 [3] H3K9 [3]
SMYD Family
SMYD SET + MYND Ec-04_001520, Ec-14_003800 Phatr3_J1647, Phatr3_J43708 SMYD1-5 [3] H3K4,
H4K20 ? [3]
No human-related families
NO CAT AWS + SET Ec-27_005100 No orthologs No orthologs Unknown
NO CAT AWS + SET + Post-
SET + ZF-PHD Ec-05_003500 Phatr3_J6093 No orthologs Unknown
NO CAT SET + Post-SET
Ec-12_004700, Ec-14_005610,
Ec-15_002050, Ec-15_002680,
Ec-28_001240
Phatr3_J21456 No orthologs Unknown
NO CAT ZF-PHD + SET Ec-12_006750, Ec-12_006810,
Ec-19_005100 No orthologs No orthologs Unknown
NO CAT ZF-PHD + Pre-SET +
SET Ec-14_005310 No orthologs No orthologs Unknown
NO CAT BRD + SET Ec-12_006600 No orthologs No orthologs Unknown
NO CAT SET + BRK + ZF-CW
+ CHROMO + TPR Ec-12_000580 Phatr3_J44935 No orthologs Unknown
KMTs with putative new functions
Kinase-
containing
SET
AWS + SET + Post-
SET + Cyclin-like +
Kinase
Ec-06_008170 Phatr3_EG02211 No orthologs Unknown
ADD-
containing
SET
ZF-ADD + Pre-SET +
SET + Post-SET Ec-22_000420 No orthologs No orthologs Unknown
Other SET
NO CAT SET
Ec-00_001310, Ec-01_004930,
Ec-05_000850, Ec-06_002960,
Ec-06_005230, Ec-06_005320,
Ec-06_006470, Ec-07_003020,
Ec-07_004730, Ec-07_007100,
Ec-08_006000, Ec-14_004620,
Ec-14_004640, Ec-18_001770,
Ec-19_004190, Ec-20_002460,
Ec-26_000740, Ec-28_002300
Phatr3_J39209,
Phatr3_EG01652,
Phatr3_J38974, Phatr3_J50541,
Phatr3_J43311, Phatr3_J43708,
Phatr3_EG01005,
Phatr3_J43177, Phatr3_J48703,
Phatr3_J24019
Unknown

161
NO CAT SET + Rubisco LSMT
Ec-01_001070, Ec-06_004080,
Ec-11_003630, Ec-12_007560,
Ec-14_001980, Ec-14_003300,
Ec-20_001330
Phatr3_J43946,
Phatr3_J48815, Phatr3_J37749 Unknown
DOT1 domain-containing KMTs
KMT4 DOT1 Ec-06_007110, Ec-12_004580,
Ec-24_003550 Phatr3_J47512, Phatr3_J44757 DOT1 [4] H3K79 [4]
KMT4_ecto DOT1 + ZF-PHD Ec-25_003090 No orthologs No orthologs H3K79 [4]

162
Table S2.3. Histone Arginine Methyltransferases (PRMT)
RMT Ectocarpus sp. Phaeodactylum
tricornutum Homo sapiens
PRMT Family
NO CAT Ec-06_002620, Ec-14_006300,
Ec-27_000650, Ec-27_005280
Phatr3_J17184, Phatr3_J54710,
Phatr3_J44159, Phatr3_J45331,
Phatr3_EG02379
PRMT1-9
PRMT5 Ec-10_005680 Phatr3_J16141
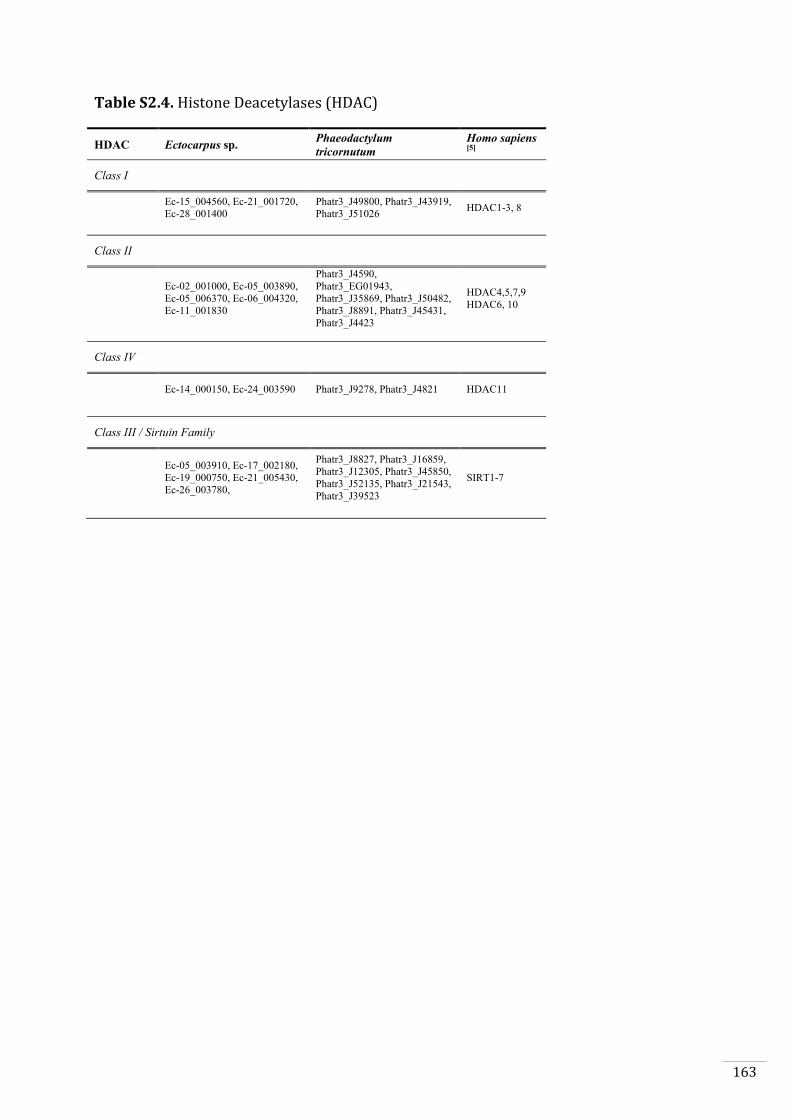
163
Table S2.4. Histone Deacetylases (HDAC)
HDAC Ectocarpus sp. Phaeodactylum
tricornutum
Homo sapiens [5]
Class I
Ec-15_004560, Ec-21_001720,
Ec-28_001400
Phatr3_J49800, Phatr3_J43919,
Phatr3_J51026 HDAC1-3, 8
Class II
Ec-02_001000, Ec-05_003890,
Ec-05_006370, Ec-06_004320,
Ec-11_001830
Phatr3_J4590,
Phatr3_EG01943,
Phatr3_J35869, Phatr3_J50482,
Phatr3_J8891, Phatr3_J45431,
Phatr3_J4423
HDAC4,5,7,9
HDAC6, 10
Class IV
Ec-14_000150, Ec-24_003590 Phatr3_J9278, Phatr3_J4821 HDAC11
Class III / Sirtuin Family
Ec-05_003910, Ec-17_002180,
Ec-19_000750, Ec-21_005430,
Ec-26_003780,
Phatr3_J8827, Phatr3_J16859,
Phatr3_J12305, Phatr3_J45850,
Phatr3_J52135, Phatr3_J21543,
Phatr3_J39523
SIRT1-7
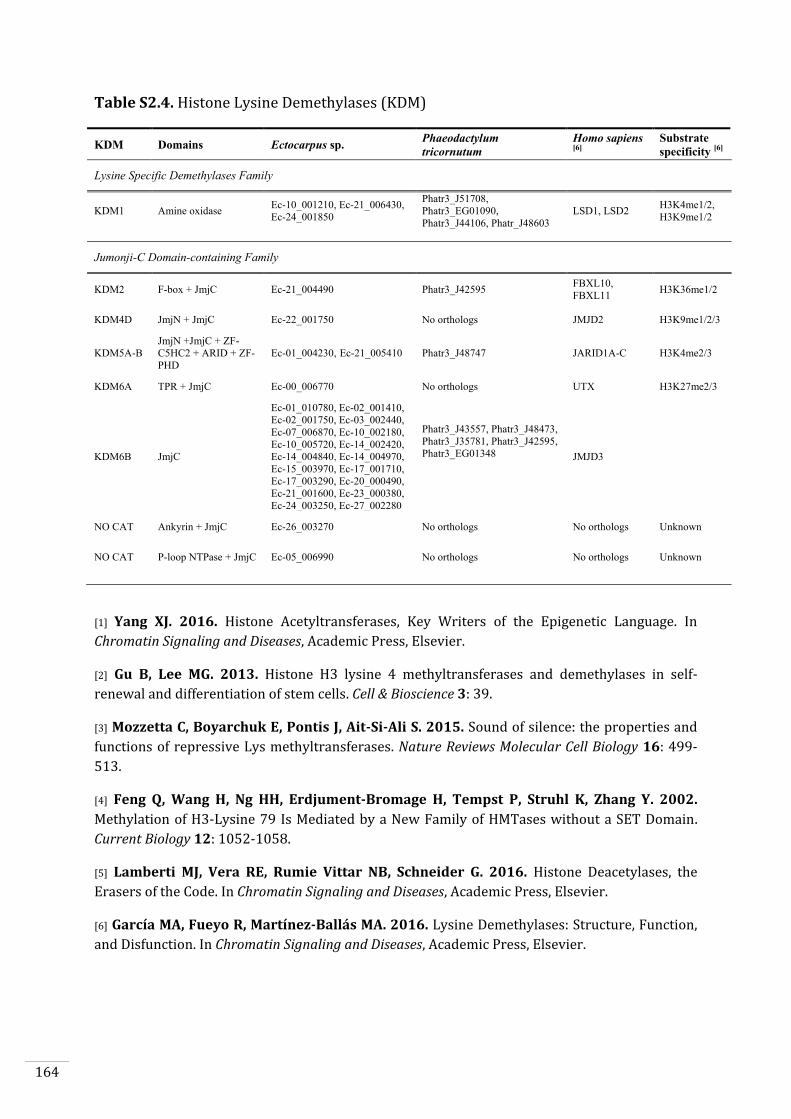
164
Table S2.4. Histone Lysine Demethylases (KDM)
KDM Domains Ectocarpus sp. Phaeodactylum
tricornutum
Homo sapiens [6]
Substrate
specificity [6]
Lysine Specific Demethylases Family
KDM1 Amine oxidase Ec-10_001210, Ec-21_006430,
Ec-24_001850
Phatr3_J51708,
Phatr3_EG01090,
Phatr3_J44106, Phatr_J48603
LSD1, LSD2 H3K4me1/2,
H3K9me1/2
Jumonji-C Domain-containing Family
KDM2 F-box + JmjC Ec-21_004490 Phatr3_J42595 FBXL10,
FBXL11 H3K36me1/2
KDM4D JmjN + JmjC Ec-22_001750 No orthologs JMJD2 H3K9me1/2/3
KDM5A-B
JmjN +JmjC + ZF-
C5HC2 + ARID + ZF-
PHD
Ec-01_004230, Ec-21_005410 Phatr3_J48747 JARID1A-C H3K4me2/3
KDM6A TPR + JmjC Ec-00_006770 No orthologs UTX H3K27me2/3
KDM6B JmjC
Ec-01_010780, Ec-02_001410,
Ec-02_001750, Ec-03_002440,
Ec-07_006870, Ec-10_002180,
Ec-10_005720, Ec-14_002420,
Ec-14_004840, Ec-14_004970,
Ec-15_003970, Ec-17_001710,
Ec-17_003290, Ec-20_000490,
Ec-21_001600, Ec-23_000380,
Ec-24_003250, Ec-27_002280
Phatr3_J43557, Phatr3_J48473,
Phatr3_J35781, Phatr3_J42595,
Phatr3_EG01348
JMJD3
NO CAT Ankyrin + JmjC Ec-26_003270 No orthologs No orthologs Unknown
NO CAT P-loop NTPase + JmjC Ec-05_006990 No orthologs No orthologs Unknown
[1] Yang XJ. 2016. Histone Acetyltransferases, Key Writers of the Epigenetic Language. In
Chromatin Signaling and Diseases, Academic Press, Elsevier.
[2] Gu B, Lee MG. 2013. Histone H3 lysine 4 methyltransferases and demethylases in self-
renewal and differentiation of stem cells. Cell & Bioscience 3: 39.
[3] Mozzetta C, Boyarchuk E, Pontis J, Ait-Si-Ali S. 2015. Sound of silence: the properties and
functions of repressive Lys methyltransferases. Nature Reviews Molecular Cell Biology 16: 499-
513.
[4] Feng Q, Wang H, Ng HH, Erdjument-Bromage H, Tempst P, Struhl K, Zhang Y. 2002.
Methylation of H3-Lysine 79 Is Mediated by a New Family of HMTases without a SET Domain.
Current Biology 12: 1052-1058.
[5] Lamberti MJ, Vera RE, Rumie Vittar NB, Schneider G. 2016. Histone Deacetylases, the
Erasers of the Code. In Chromatin Signaling and Diseases, Academic Press, Elsevier.
[6] García MA, Fueyo R, Martínez-Ballás MA. 2016. Lysine Demethylases: Structure, Function,
and Disfunction. In Chromatin Signaling and Diseases, Academic Press, Elsevier.
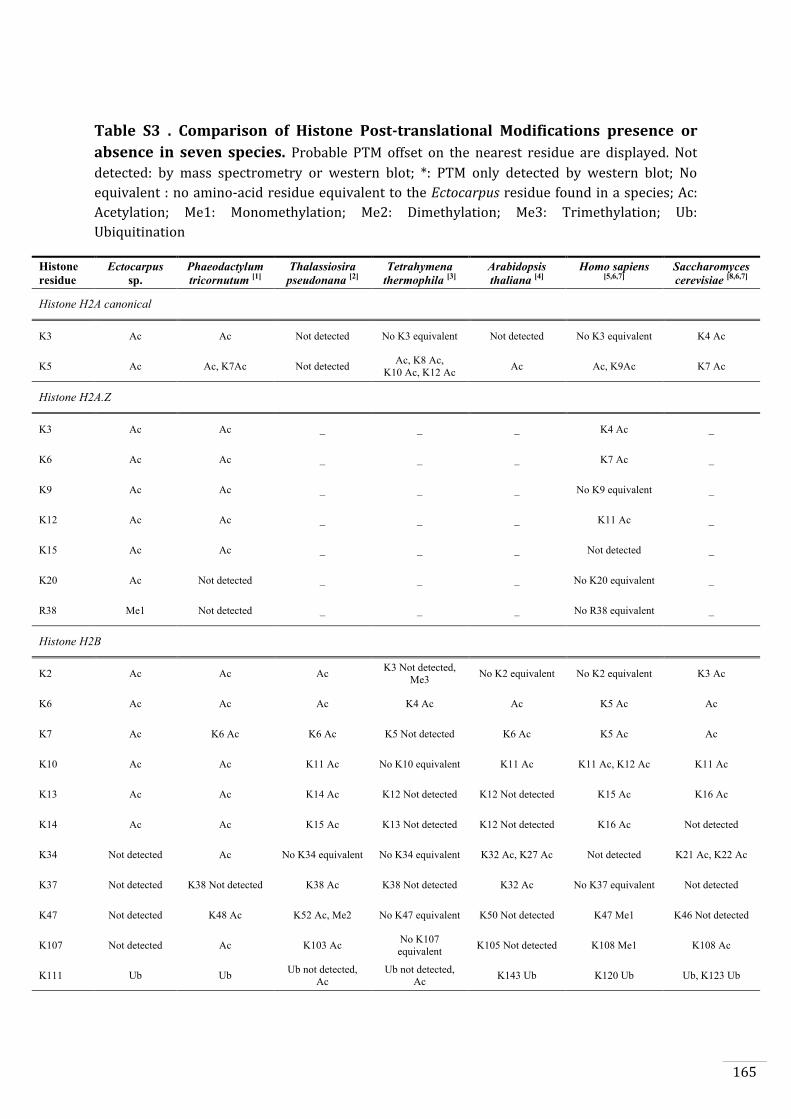
165
Table S3 . Comparison of Histone Post-translational Modifications presence or
absence in seven species. Probable PTM offset on the nearest residue are displayed. Not
detected: by mass spectrometry or western blot; *: PTM only detected by western blot; No
equivalent : no amino-acid residue equivalent to the Ectocarpus residue found in a species; Ac:
Acetylation; Me1: Monomethylation; Me2: Dimethylation; Me3: Trimethylation; Ub:
Ubiquitination
Histone
residue
Ectocarpus
sp.
Phaeodactylum
tricornutum [1]
Thalassiosira
pseudonana [2]
Tetrahymena
thermophila [3]
Arabidopsis
thaliana [4]
Homo sapiens [5,6,7]
Saccharomyces
cerevisiae [8,6,7]
Histone H2A canonical
K3 Ac Ac Not detected No K3 equivalent Not detected No K3 equivalent K4 Ac
K5 Ac Ac, K7Ac Not detected Ac, K8 Ac,
K10 Ac, K12 Ac Ac Ac, K9Ac K7 Ac
Histone H2A.Z
K3 Ac Ac _ _ _ K4 Ac _
K6 Ac Ac _ _ _ K7 Ac _
K9 Ac Ac _ _ _ No K9 equivalent _
K12 Ac Ac _ _ _ K11 Ac _
K15 Ac Ac _ _ _ Not detected _
K20 Ac Not detected _ _ _ No K20 equivalent _
R38 Me1 Not detected _ _ _ No R38 equivalent _
Histone H2B
K2 Ac Ac Ac K3 Not detected,
Me3 No K2 equivalent No K2 equivalent K3 Ac
K6 Ac Ac Ac K4 Ac Ac K5 Ac Ac
K7 Ac K6 Ac K6 Ac K5 Not detected K6 Ac K5 Ac Ac
K10 Ac Ac K11 Ac No K10 equivalent K11 Ac K11 Ac, K12 Ac K11 Ac
K13 Ac Ac K14 Ac K12 Not detected K12 Not detected K15 Ac K16 Ac
K14 Ac Ac K15 Ac K13 Not detected K12 Not detected K16 Ac Not detected
K34 Not detected Ac No K34 equivalent No K34 equivalent K32 Ac, K27 Ac Not detected K21 Ac, K22 Ac
K37 Not detected K38 Not detected K38 Ac K38 Not detected K32 Ac No K37 equivalent Not detected
K47 Not detected K48 Ac K52 Ac, Me2 No K47 equivalent K50 Not detected K47 Me1 K46 Not detected
K107 Not detected Ac K103 Ac No K107
equivalent K105 Not detected K108 Me1 K108 Ac
K111 Ub Ub Ub not detected,
Ac
Ub not detected,
Ac K143 Ub K120 Ub Ub, K123 Ub

166
Histone
residue
Ectocarpus
sp.
Phaeodactylum
tricornutum [1]
Thalassiosira
pseudonana [2]
Tetrahymena
thermophila [3,4]
Arabidopsis
thaliana [5,6,7]
Homo sapiens [8,9,10]
Saccharomyces
cerevisiae [11,10,4]
Histone H3
K4 Me2*, Me3* Me1, Me2, Me3 Not detected Not detected Me1, Me2, Me3 Me1, Me3 Me1, Me2, Me3,
Ac
K9 Ac Ac Ac Ac Ac Ac Ac
K9 Me2*, Me3* Me2*, Me3* Not detected Not detected Me1, Me2, Me3 Me1, Me2, Me3 Me2, Me3
K14 Ac Ac Ac Ac Ac Ac,
Me1
Ac,
Me2
K18 Ac Ac Ac Ac Ac Ac,
Me1
Ac,
Me1
K23 Ac Ac Ac Ac,
Me1 Ac
Ac,
Me1
Ac,
Me1
K27 Ac Ac Ac Ac Ac Ac Ac
K27 Me2, Me3* Me1, Me2, Me3 Me2 Me1, Me2, Me3 Me1, Me2, Me3 Me1, Me2, Me3 Me1, Me2, Me3
K36 Not detected Ac Ac Ac Ac Not detected Ac
K36 Me1, Me2,
Me3 Me1, Me2, Me3 Me1, Me2, Me3 Me1 Me1, Me2, Me3 Me1, Me2, Me3 Me1, Me2, Me3
K56 Not detected Ac Not detected Ac Not detected Ac,
Me1, Me3 Ac
K79 Not detected Ac Ac Not detected Not detected Ac Not detected
K79 Me1, Me2,
Me3 Me1, Me2 Me1, Me2, Me3 Me1 Not detected Me1, Me2, Me3 Me1, Me2, Me3
K122 Not detected Ac Ac Not detected Not detected Ac,
Me1 Not detected
Histone H4
K5 Ac Ac Ac K4 Ac Ac Ac,
Me1 Ac
K8 Ac Ac Ac K7 Ac Ac Ac Ac,
Me1
K12 Ac Ac Ac K11 Ac Ac Ac Ac,
Me1
K16 Ac Ac Ac K15 Ac Ac Ac Ac
K20 Me1, Me2,
Me3
Ac,
No methylation
detected
Ac,
No methylation
detected
Me1 Ac,
Me3 Me1, Me2 Me1, Me2
K31 Not detected Ac Not detected Not detected Not detected Me2 Ac
R55 Not detected Not detected Not detected Not detected Not detected Me1, Me2 Not detected
K59 Not detected Ac Ac Not detected Not detected Not detected Not detected
K59 Me1, Me2 Me1 Me1 Not detected Not detected Me1, Me2 Me1
K79 Me1, Me2,
Me3 Me1, Me2, Me3 Me1, Me2, Me3 R77 Me1 Not detected K77 Me1 K77 Me1
K91 Not detected Not detected Ac Not detected Not detected Ac Not detected
167
[1] Veluchamy A, Rastogi A, Lin X, Lombard B, Murik O, Thomas Y, Dingli F, Rivarola
M, Ott S, Liu X, Sun Y, Rabinowicz PD, McCarthy J, Allen AE, Loew D, Bowler C,
Tirichine L. 2015. An integrative analysis of post-translational histone modifications in
the marine diatom Phaeodactylum tricornutum. Genome Biology 16: 102.
[2] Rastogi A, Lin X, Lombard B, Loew D, Tirichine L. 2015. Probing the evolutionary
history of epigenetic mechanisms: what can we learn from marine diatoms. AIMS
Genetics 2: 173-191.
[3] Zhang C, Gao S, Molascon AJ, Wang Z, Gorovsky MA, Liu Y, Andrews PC. 2014.
Bioinformatic and Proteomic Analyses of Bulk Histones Reveals PTM Crosstalk and
Chromatin Features. Journal of Proteome Research 13: 3330-3337.
[4] Morris SA, Rao B, Garcia BA, Hake SB, Diaz RL, Shabanowitz J, Hunt DF, Allis CD,
Lieb JD, Strahl BD. 2007. Identification of Histone H3 Lysine 36 Acetylation as a Highly
Conserved Histone Modification. The Journal of Biological Chemistry 282: 7632-7640.
[5] Zhang K, Sridhar VV, Zhu J, Kapoor A, Zhu J-K. 2007. Distinctive Core Histone Post-
Translational Modification Patterns in Arabidopsis thaliana. PLoS ONE 2(11): e1210.
[6] Charron J-BF, He H, Elling AA, Deng XW. 2009. Dynamic Landscapes of Four
Histones Modifications during Deetiolation in Arabidopsis. The Plant Cell 21: 3732-3748.
[7] Mahrez W, Trejo Arellano MS, Moreno-Romero J, Nakamura M, Shu H, Nanni P,
Köhler C, Gruissem W, Hennig L. 2016. H3K36ac Is an Evolutionary Conserved Plant
Histone Modification That Marks Active Genes. Plant Physiology 170: 1566-1577.
[8] Beck HC, Nielsen EC, Matthiesen R, Jensen LH, Sehested M, Finn P, Grauslund M,
Hansen AM, Nørregaard Jensen O. 2006. Quantitative Proteomic Analysis of Post-
translational Modifications of Human Histones. Molecular & Cellular Proteomics 5: 1314-
1325.
[9] Tan M, Luo H, Lee S, Jin F, Soo Yang J, Montellier E, Buchou T, Cheng Z, Rousseaux
S, Rajagopal N, Lu Z, Ye Z, Zhu Q, Wysocka J, Ye Y, Khochbin S, Ren B, Zhao Y. 2011.
Identification of 67 Histone Marks and Histone Lysine Crotonylation as a New Type of
Histone Modification. Cell 146: 1016-1028.
[10] Zhao Y, Garcia BA. 2015. Comprehensive Catalog of Currently Documented Histone
Modifications. Cold Spring Harbor Perspectives in Biology 7: a025064.
[11] Valero ML, Sendra R, Pamblanco M. 2016. Tandem affinity purification of histones,
coupled to mass spectrometry, identifies associated proteins and new sites of post-
translational modification in Saccharomyces cerevisiae. Journal of Proteomics 136: 183-
192.
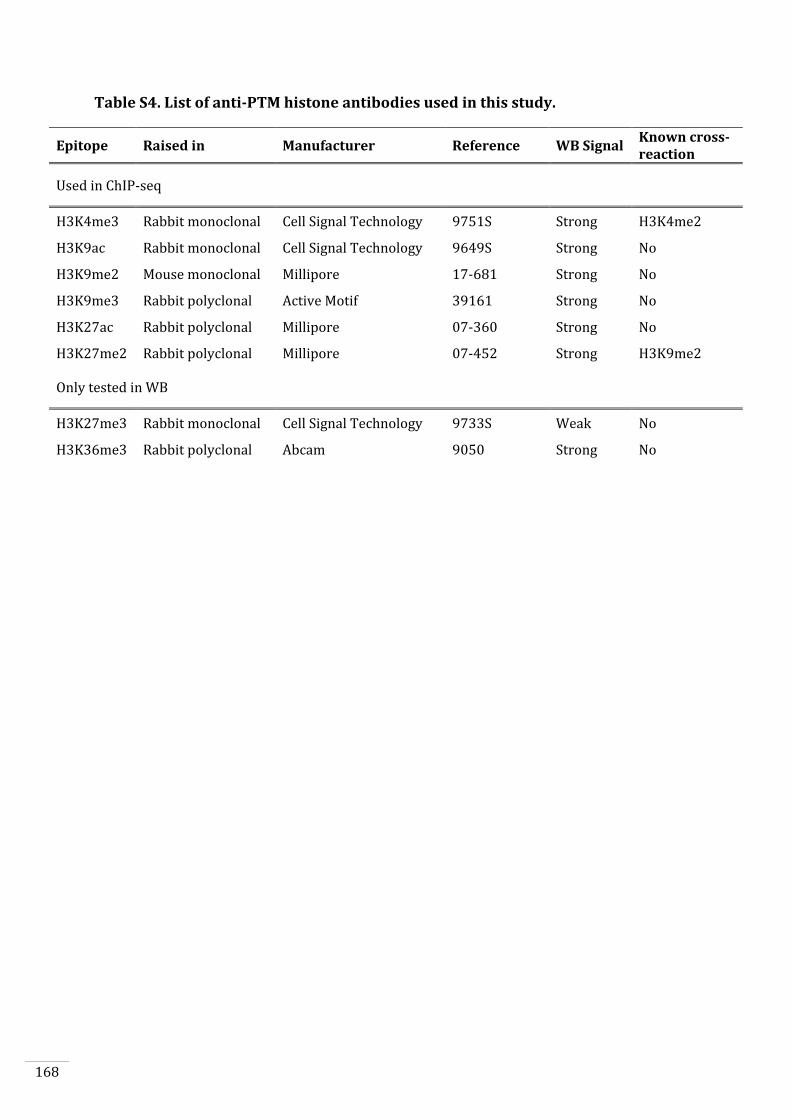
168
Table S4. List of anti-PTM histone antibodies used in this study.
Epitope Raised in Manufacturer Reference WB Signal Known cross-reaction
Used in ChIP-seq
H3K4me3 Rabbit monoclonal Cell Signal Technology 9751S Strong H3K4me2
H3K9ac Rabbit monoclonal Cell Signal Technology 9649S Strong No
H3K9me2 Mouse monoclonal Millipore 17-681 Strong No
H3K9me3 Rabbit polyclonal Active Motif 39161 Strong No
H3K27ac Rabbit polyclonal Millipore 07-360 Strong No
H3K27me2 Rabbit polyclonal Millipore 07-452 Strong H3K9me2
Only tested in WB
H3K27me3 Rabbit monoclonal Cell Signal Technology 9733S Weak No
H3K36me3 Rabbit polyclonal Abcam 9050 Strong No

169

170

171
Chapter 6
General Conclusions and Perspectives

172
173
Regulation of life cycle progression by the ORO and SAM proteins
This PhD thesis has made significant contributions to understanding the pathways
which control the coupling between generation and developmental program. The
mutants ouroboros (oro) and samsara (sam) exhibit a full functional conversion of the
sporophyte generation into a gametophyte, demonstrating that life cycle phase (ploidy)
and developmental program (life cycle generation) can be uncoupled. These mutants are
affected in two different TALE homeodomain-containing TFs. Interestingly, in several
organisms, distributed widely in the eukaryote tree, homeodomain-containing TFs are
also involved in the transition between haploid and diploid generations. In each case,
mutation of the homeodomain-containing TF genes leads to deployment of the wrong
life cycle program, i.e. switching between the programs associated with the haploid and
the diploid generations.
In Cryptococcus neoformans, SXI1α and SXI2a are expressed in α and a gametes,
respectively (Hull et al., 2005). Similarly, in the green alga Chlamydomonas reinhardtii,
GSP1 and GSM1 are separately expressed in plus and minus gametes, respectively (Lee et
al., 2008). Sex-biased, gamete-limited expression was also observed for the
homeodomain-like mating type TFs in the amoeba Dictyostelium discoideum
(Hedgethorne et al., 2017). In all these cases, the mating-type-specific expression
pattern is thought to allow the organism to detect the transition from haploidy to
diploidy, because TF dimerisation can only occur following the fusion of haploid gametes
to produce the diploid zygote. Analysis of ORO and SAM expression throughout the life
cycle indicated that these two genes are upregulated in gametes but we did not observe
sex-specific expression of the two genes. Transcripts for both genes were detected in
both male and female gametes. We do not know at present whether the transcripts are
translated into protein in all cases but it is therefore likely that both male and female
gametes contain both ORO and SAM protein. Therefore, although the mutant phenotypes
associated with ORO and SAM indicate that they act as master regulators of the
sporophyte program, it is not clear whether they also function as detectors of ploidy
change as proposed for the other systems described above. One possible explanation for
the co-expression of ORO and SAM in Ectocarpus gametes is that this may be linked to
the capacity of these cells for parthenogenetic development because parthenogenesis
leads to the deployment of the sporophyte program in a haploid context and presumably
174
requires the presence of both ORO and SAM. One possible scenario, therefore, is that the
ORO/SAM system has been modified during evolution so that dimerisation is no longer
the key activation step, allowing the deployment of the sporophyte program in a haploid
context.
Note that apogamy has been induced in several species as a result of ectopic expression
of homeodomain proteins involved in the haploid-to-diploid (gametophyte-to-
sporophyte) transition. In Chlamydomonas, for example, overexpression of GSM1, the
minus-specific TF, in plus gametes leads to initiation of the diploid specific program
during the haploid phase (Lee et al., 2008). A similar phenotype was observed when
Sxi2a was overexpressed in Cryptococcus α gametes (Hull et al., 2005). Moreover,
apogamous sporophytes developed from haploid caulonemal filaments in the moss
Physcomitrella patens when PpBELL1 was overexpressed during the gametophyte
generation (Horst et al., 2016).
ORO and SAM were shown to be capable of forming a heterodimer and in vitro pull-
down assays showed that they interacted through their respective homeodomains. In
Cryptococcus, Sxi2a interacts with Sxi1α through a small region that includes its
homeodomain (Hull et al., 2005). In Chlamydomonas, interaction occurs between the
Knox1/2 domain of GSM1 and a region consisting of the BELL domain and the
homeodomain of GSP1. Therefore, whilst there is not absolute conservation, it is striking
that molecular mechanisms that underly dimerisation are very similar in these very
distantly-related lineages.
Lee et al. (2008) used Bimolecular Fluorescence Complementation (BiFC) experiments
in Physcomitrella patens to show that Chlamydomonas GSP1 and GSM1 were
translocated to the nucleus after having formed a heterodimer. We have not been able to
investigate whether a similar process occurs in Ectocarpus as we do not have yet a
transformation protocol for this species. However, it could be interesting to assess the
interaction-dependant translocation of ORO and SAM into the nucleus using a
heterologous expression systems such as a diatom, for example. Diatoms are relatively
closely related to the brown algae phylogenetically and there are transformation
protocols available for these organisms (Siaut et al., 2007; Karas et al., 2015). If it could
be demonstrated that ORO and SAM translocate into the nucleus after forming a
heterodimer, this observation would further support the hypothesis that ORO and SAM
175
function in a similar manner to GSP1 and GSM1 in Chlamydomonas and the contention
that the homeodomain-based life cycle regulatory systems found in diverse eukaryotic
lineages are derived from an ancient, shared life cycle regulator.
RNA-seq data revealed that transcriptomes of oro and sam mutants were more similar to
the transcriptome of the gametophyte than to that of the sporophyte. It is likely that ORO
and SAM not only implement the sporophyte program but also downregulate the
gametophyte program. Genes which are differentially expressed between the two
generations are all potential targets of the ORO/SAM heterodimer. It is possible,
however, that ORO and SAM only target a limited number of genes if some of these genes
encode downstream regulators that each control a subprogram. During this thesis, we
have not been successful in identifying the direct targets of the ORO/SAM heterodimer
by combining DAP-seq and transcriptomic data. One possible reason for this is that, for
technical reasons, the transcriptome analyses used later stages of sporophyte
development whereas the key period of ORO and SAM action probably corresponds to
early zygote/sporophyte development. In the future, we plan to obtain RNA-seq data
from early zygotes (or from parthenogenetically developing gametes, which also initiate
the sporophyte program). This analysis, together with a planned analysis of DNA
binding sites for the ORO/SAM heterodimer using DAP-seq (O’Malley et al., 2016;
Bartlett et al., 2017) combined with the pull-down protocol, is expected to provide
improved resolution for the detection of direct targets, leading to the identification of
putative ORO/SAM binding motifs in the promoter regions of early zygote-specific
genes.
ORO and SAM binding preferences have been analyzed using protein binding
microarrays and DAP-seq experiments. ORO and SAM share some binding motifs, such
as TGACGT, but also show individual binding specificities. SAM and ORO exhibit different
motif repertoires which extend their binding potentials, particularly if they function as a
heterodimer. SAM binds the primary motif TGACA[C/T] while ORO binds primarily the
sequence TGA[T/C]G[T/G]. Thus, it is difficult to identify binding sites for the
heterodimer just by searching for co-localised primary motifs. Moreover, it cannot be
excluded that the ORO/SAM heterodimer shows latent binding preferences are not
simply a combination of individual binding preferences but rather a new binding
repertoire. If the heterodimer does exhibit novel binding specificity, this could explain
176
why monomer TF binding sites were not detected close to differentially expressed
genes. It could also explain that we did not observe enrichment of their individual ORO
and SAM binding motifs within gene bodies or upstream of differentially expressed
genes compare to a random set of non-differentially expressed genes.
ORO and SAM may act as pioneer TFs with a role in chromatin reprogramming. Yeast
two-hybrid screening has revealed that ORO is capable of interacting with the C subunit
of the NF-Y complex. NF-Ys are a small group of proteins in which NF-YB and NF-C
subunits exhibit histone-fold domain similar to those of H2A and H2B, respectively. The
NF-Y complex is able to interact with nucleosomes. NF-YB and NF-YC form a trimer with
the non-histone-fold domain protein NF-A. NF-YB and NF-YC subunits are also able to
interact with H3-H4 tetramers (Caretti et al., 1999). NF-Y strengthens TF binding to DNA
by promoting chromatin accessibility (Oldfield et al., 2014). NF-YB and NF-YC subunits
have been proposed to have a local nucleosome sliding activity (Oldfield et al., 2014). It
could be also conceivable that NF-YB and NF-YC subunits form hybrid nucleosomes with
H3-H4 dimers (Caretti et al., 1999; Nardone et al., 2017). In this later case, NF-YB and
NF-YC subunits could be considered as histones variants that destabilise the nucleosome
to increase accessibility to DNA. In animals, NF-Y binds both core promoters (regions
near the transcription start sites) and distal enhancers (Testa et al., 2005; Fleming et al.,
2013). It would be interesting to correlate genome-wide NF-Y binding site distribution
(determined using ChIP methodology) and DNA accessibility data (obtained using Assay
for Transposable-Accessible Chromatin (ATAC)-seq or Formaldehyde-Assisted Isolation
of Regulatory Elements (FAIRE)-seq) throughout the life cycle of Ectocarpus. These
analyses would provide valuable information about the role of DNA accessibility in the
chromatin reprogramming processes that occur during implementation of the
sporophyte program.
Chromatin modifications during the Ectocarpus life cycle
This thesis has also provided considerable advances for the study of epigenetic events in
the brown algae. We have established the first chromatin immunoprecipitation protocol
for seaweeds (i.e. multicellular marine algae). Moreover, the brown algae are only the
second lineage within the Stramenopile supergroup to have been studied in terms of the
epigenetic regulations of their chromatin, the first lineage being the diatoms (Veluchamy
et al. 2015; Lin et al. 2012). We also note that this is the first time that histone
177
modifications have been mapped genome-wide in both the gametophyte and sporophyte
generations for any organism, providing the first insights into epigenetic modifications
during a haploid-diploid life cycle.
We analysed six different histone post-translational modifications (H3K4me3, H3K9ac,
H3K27ac, H3K9me2, H3K9me3 and H3K27me2). Analysis of chromatin marks during
both the sporophyte and gametophyte generations of the life cycle indicated that the TSS
regions of most sporophyte-biased genes lost at least one of the three histone post-
translational modifications with a putative gene activating effect (H3K4me3, H3K9ac
and H3K27ac) during the gametophyte generation. These modifications are presumably
erased during meiosis and re-deposed following syngamy. In contrast, the majority of
the TSS regions of gametophyte-biased genes did not show any modification for these
histone PTMs during the sporophyte generation.
The three other histone modifications that were analysed (H3K9me2, H3K9me3 and
H3K27me2) are expected, based on their function in other species, to have a repressive
function (i.e. to be associated with heterochromatin). These marks tended to be
associated only with transposable elements and there was no evidence that they were
involved in repressing transcription of the gametophyte-biased genes during the
sporophyte generation. The stability of the histone PTMs at the TSSs of gametophyte-
biased genes during the sporophyte generation suggests that they are regulated in a
different manner to the sporophyte-biased genes. Indeed, it has been suggested, based
on microarray analysis of gene expression that the sporophyte program may involve
predominantly gene activation but the gametophyte program release from gene
repression (Coelho et al., 2011). The putative repressive histone marks analysed in our
study all appeared to be associated with transposon-rich, heterochromatic regions of the
genome. In the future, it would be interesting to analyse new histone modifications (or
histones variants) potentially involved in transcriptional repression such as H3K27me3
or H4K20me3 during the gametophyte-to-sporophyte transition. It would be also
interesting to correlate the distribution of histone modifications with binding sites of the
ORO/SAM heterodimer to evaluate the extent to which these TFs are involved in the
upregulation of sporophyte genes and the repression of gametophyte genes.
Several results suggest that the gametophyte program could be the default program in
Ectocarpus. These include lack of observed modifications to histone PTMs at the TSS
178
regions of gametophyte-biased genes discussed above, the indication from a
transcriptomic study that the gametophyte program is repressed during the sporophyte
generation rather than the converse (Coelho et al., 2011) and the observation that oro
and sam mutants not only failed to deploy the sporophyte program but also expressed
the gametophyte program in its place. A default gametophyte program would be
consistent with the hypothesis that the common ancestor of the eukaryotes would have
had a haploid life cycle. During the early period of eukaryote evolution, homeodomain-
containing TFs may have had a role in both gamete fusion and initiation of meiosis.
Following the evolution of multicellularity, the developmental programs for haploid and
diploid generation would have diverged to arrive at the situation observed in modern
eukaryotes groups (Bowman et al., 2016).
During this thesis, histone H3 ChIP-seq and FAIRE-seq data were also produced in
parallel with the histone PTM ChIP-seq analysis presented in Chapter 5. These data have
not been presented in the thesis because time has forced us to set aside the analyses.
However, these data merit further analysis as information about DNA accessibility and
nucleosome positioning could provide insights into the mechanisms controlling
gametophyte gene expression during sporophyte generation.
Finally, we also plan in future work to explore chromosomal conformation in relation to
the alternation of generations using Hi-C and Capture Hi-C (Belton et al., 2012; Mifsud et
al., 2015; Martin et al., 2015). These approaches should allow the identification of
topologically-associated genomic domains hosting loci enriched in sporophyte-biased or
gametophyte-biased genes. Capture Hi-C experiments trap genomic regions that interact
with regions of interest (DNA binding sites, promoters of differentially expressed genes
or putative distal enhancers). Capture Hi-C data should provide information about target
genes when ORO and SAM do not bind directly to their core promoter. Finally,
conformation data also provides information about loci that interact with differentially
expressed genes.
The application of high-throughput methodologies such as PBM, DAP-seq and ChIP-seq
during this thesis has provided new perspectives for the in-depth understanding of the
biology of the brown alga Ectocarpus. Despite the lack of key methodologies such as
genetic transformation, Ectocarpus is a particularly valuable model system to investigate
mechanisms involved in life cycle progression and multicellular development. The ease

179
with which we access to the different stages and generations make this model ideal for
mechanistic studies on a haploid-diploid multicellular organism

180
181
REFERENCES
Ahmed S, Cock JM, Pessia E, Luthringer R, Cormier A, Robuchon M, Sterck L, Peters
AF, Dittami SM, Corre E, et al. 2014. A haploid system of sex determination in the
brown alga Ectocarpus sp. Current Biology 24: 1945–57.
Arun A. 2012. Analyse génétique et moléculaire de la régulation du cycle de vie chez
l'algue brune Ectocarpus siliculosis. Thèse de doctorat, Université Pierre et Marie Curie.
Bailey T, Boden M, Buske F, Frith M, Grant C, Clementi L, Ren J, Li W, Noble W.
2009. MEME Suite: tools for motif discovery and searching. Nucleic Acids Research 37:
W202–W208.
Bailey, Elkan. 1994. Fitting a mixture model by expectation maximization to discover
motifs in biopolymers. Proceedings. International Conference on Intelligent Systems for
Molecular Biology 2: 28–36.
Bannister A, Kouzarides T. 2011. Regulation of chromatin by histone modifications.
Cell Research 21: 381–395.
artlett A O’Malley R Huang S Galli M Nery J Gallav tti A Ecker J. 2017. Mapping
genome-wide transcription-factor binding sites using DAP-seq. Nature Protocols 12:
1659–1672.
Belton J-M, McCord R, Gibcus J, Naumova N, Zhan Y, Dekker J. 2012. Hi–C: A
comprehensive technique to capture the conformation of genomes. Methods 58: 268–
276.
Berger MF, Badis G, Gehrke AR, Talukder S, Philippakis AA, Peña-Castillo L,
Alleyne TM, Mnaimneh S, Botvinnik OB, Chan ET, et al. 2008. Variation in
homeodomain DNA binding revealed by high-resolution analysis of sequence
preferences. Cell 133: 1266–76.
Berger M, Bulyk M. 2009. Universal protein-binding microarrays for the
comprehensive characterization of the DNA-binding specificities of transcription factors.
Nature Protocols 4: 393–411.
182
Bergerat A, de Massy B, Gadelle D, Varoutas P-C, Nicolas A, Forterre P. 1997. An
atypical topoisomerase II from archaea with implications for meiotic recombination.
Nature 386: 414–417.
Bolduc N, Yilmaz A, Mejia-Guerra MK M r hashi K O’C nn r D Gr tew l E Hake
S. 2012. Unraveling the KNOTTED1 regulatory network in maize meristems. Genes &
Development 26: 1685–1690.
Bowman G, Poirier M. 2015. Post-Translational Modifications of Histones That
Influence Nucleosome Dynamics. Chemical Reviews 115: 2274–2295.
Bowman J, Sakakibara K, Furumizu C, Dierschke T. 2015. Evolution in the Cycles of
Life. Annual Review of Genetics 50: 1–22.
Burki F, Kaplan M, Tikhonenkov D, Zlatogursky V, Minh B, Radaykina L, Smirnov A,
Mylnikov A, Keeling P. 2016. Untangling the early diversification of eukaryotes: a
phylogenomic study of the evolutionary origins of Centrohelida, Haptophyta and
Cryptista. Proc. R. Soc. B 283: 20152802.
Burki F, Shalchian-Tabrizi K, Minge M, Skjæveland Å, Nikolaev S, Jakobsen K,
Pawlowski J. 2007. Phylogenomics Reshuffles the Eukaryotic Supergroups. PLoS ONE 2:
e790.
Bürglin T. 1997. Analysis of TALE superclass homeobox genes (MEIS, PBC, KNOX,
Iroquois, TGIF) reveals a novel domain conserved between plants and animals. Nucleic
Acids Research 25: 4173–4180.
Caretti G, Motta M, Mantovani R. 1999. NF-Y Associates with H3-H4 Tetramers and
Octamers by Multiple Mechanisms. Molecular and Cellular Biology 19: 8591–8603.
Carrasco A, McGinnis W, Gehring W, Robertis E. 1984. Cloning of an X. laevis gene
expressed during early embryogenesis coding for a peptide region homologous to
Drosophila homeotic genes. Cell 37: 409–414.
Cavalier-Smith T, Chao E, Snell E, Berney C, Fiore-Donno A, Lewis R. 2014.
Multigene eukaryote phylogeny reveals the likely protozoan ancestors of opisthokonts
(animals, fungi, choanozoans) and Amoebozoa. Molecular Phylogenetics and Evolution.
183
Cavalier-Smith T, Fiore-Donno A, Chao E, Kudryavtsev A, Berney C, Snell E, Lewis R.
2015. Multigene phylogeny resolves deep branching of Amoebozoa. Molecular
Phylogenetics and Evolution 83: 293–304.
Chai M, Zhou C, Molina I, Fu C, Nakashima J, Li G, Zhang W, Park J, Tang Y, Jiang Q,
et al. 2016. A class II KNOX gene, KNOX4, controls seed physical dormancy. Proceedings
of the National Academy of Sciences 113: 6997–7002.
Cheng X, Zhang X. 2007. Structural dynamics of protein lysine methylation and
demethylation. Mutation Research/Fundamental and Molecular Mechanisms of
Mutagenesis 618: 102–115.
Cleveland LR. 1947. The Origin and Evolution of Meiosis. Science 105: 287–289.
Cock JM, Sterck L, Rouzé P, Scornet D, Allen AE, Amoutzias G, Anthouard V,
Artiguenave F, Aury J-MM, Badger JH, et al. 2010. The Ectocarpus genome and the
independent evolution of multicellularity in brown algae. Nature 465: 617–21.
Coelho SM, Peters AF, Charrier B, Roze D, Destombe C, Valero M, Cock JM. 2007.
Complex life cycles of multicellular eukaryotes: new approaches based on the use of
model organisms. Gene 406: 152–70.
Cormier A, Avia K, Sterck L, Derrien T, Wucher V, Andres G, Monsoor M, Godfroy O,
Lipinska A, Perrineau M-M, et al. 2017. Re‐annotation, improved large‐scale assembly
and establishment of a catalogue of noncoding loci for the genome of the model brown
alga Ectocarpus. New Phytologist 214: 219–232.
Corona D, Eberharter A, Budde A, Deuring R, Ferrari S, Varga‐Weisz P, Wilm M,
Tamkun J, Becker P. 2000. Two histone fold proteins, CHRAC‐14 and CHRAC‐16, are
developmentally regulated subunits of chromatin accessibility complex (CHRAC). The
EMBO Journal 19: 3049–3059.
Cowan C, Atienza J, Melton D, Eggan K. 2005. Nuclear Reprogramming of Somatic Cells
After Fusion with Human Embryonic Stem Cells. Science 309: 1369–1373.
Crow J, Kimura M. 1965. Evolution in Sexual and Asexual Populations. The American
Naturalist 99: 439–450.
184
Currie A. 1998. NF-Y Is Associated with the Histone Acetyltransferases GCN5 and
P/CAF. Journal of Biological Chemistry 273: 1430–1434.
Dacks J, Field M, Buick R, Eme L, Gribaldo S, Roger A, Brochier-Armanet C, Devos D.
2016. The changing view of eukaryogenesis – fossils, cells, lineages and how they all
come together. J Cell Sci 129: 3695–3703.
Deaton A, Bird A. 2011. CpG islands and the regulation of transcription. Genes &
Development 25: 1010–1022.
Derelle R, Lopez P, Guyader H, Manuel M. 2007. Homeodomain proteins belong to the
ancestral molecular toolkit of eukaryotes. Evolution & Development 9: 212–219.
Dittami SM, Scornet D, Petit J-L, Ségurens B, Da Silva C, Corre E, Dondrup M,
Glatting K-H, König R, Sterck L, et al. 2009. Global expression analysis of the brown
alga Ectocarpus siliculosus (Phaeophyceae) reveals large-scale reprogramming of the
transcriptome in response to abiotic stress. Genome Biology 10: R66.
Dolfini D, Gatta R, Mantovani R. 2012. NF-Y and the transcriptional activation of
CCAAT promoters. Critical Reviews in Biochemistry and Molecular Biology 47: 29–49.
Ebchuqin E, Yokota N, Yamada L, Yasuoka Y, Akasaka M, Arakawa M, Deguchi R,
Mori T, Sawada H. 2014. Evidence for participation of GCS1 in fertilization of the starlet
sea anemone Nematostella vectensis: Implication of a common mechanism of sperm–egg
fusion in plants and animals. Biochemical and Biophysical Research Communications 451:
522–528.
Edgar R. 2004. MUSCLE: multiple sequence alignment with high accuracy and high
throughput. Nucleic Acids Research 32: 1792–1797.
Ene I, Bennett R. 2014. The cryptic sexual strategies of human fungal pathogens.
Nature Reviews Microbiology 12.
Fehér A, Pasternak T, Dudits D. 2003. Transition of somatic plant cells to an
embryogenic state. Plant Cell, Tissue and Organ Culture 74: 201–228.
185
Feng Q, Wang H, Ng H, Erdjument-Bromage H, Tempst P, Struhl K, Zhang Y. 2002.
Methylation of H3-Lysine 79 Is Mediated by a New Family of HMTases without a SET
Domain. Current Biology 12: 1052–1058.
Ferrier D, Holland P. 2001. Ancient origin of the Hox gene cluster. Nature Reviews
Genetics 2: 35047605.
Flemming W. 1879. Ueber das Verhalten des Kerns bei der Zellteilung und über die
Bedeutung mehrkerniger Zellen. Archiv für Pathologische Anatomie 77: 1–28.
Fleming J, Pavesi G, Benatti P, Imbriano C, Mantovani R, Struhl K. 2013. NF-Y
coassociates with FOS at promoters, enhancers, repetitive elements, and inactive
chromatin regions, and is stereo-positioned with growth-controlling transcription
factors. Genome Research 23: 1195–1209.
Fossati A, Dolfini D, Donati G, Mantovani R. 2011. NF-Y Recruits Ash2L to Impart
H3K4 Trimethylation on CCAAT Promoters. PLoS ONE 6: e17220.
Fu Y, Luo G-Z, Chen K, Deng X, Yu M, Han D, Hao Z, Liu J, Lu X, Doré L, et al. 2015.
N6-Methyldeoxyadenosine Marks Active Transcription Start Sites in Chlamydomonas.
Cell 161: 879–892.
Furumizu C, Alvarez JP, Sakakibara K, Bowman JL. 2015. Antagonistic roles for
KNOX1 and KNOX2 genes in patterning the land plant body plan following an ancient
gene duplication. PLoS genetics 11: e1004980.
Fyodorov D, Zhou B-R, Skoultchi A, Bai Y. 2017. Emerging roles of linker histones in
regulating chromatin structure and function. Nature Reviews Molecular Cell Biology:
nrm.2017.94.
Fédry J, Liu Y, Péhau-Arnaudet G, Pei J, Li W, Tortorici A, Traincard F, Meola A,
Bricogne G, Grishin N, et al. 2017. The Ancient Gamete Fusogen HAP2 Is a Eukaryotic
Class II Fusion Protein. Cell 168: 904–915.e10
Garcia MA, Fueyo A, Martinéz-Balbas MA. 2016. Lysine Demethylases: Structure,
Function and Disfunction. In Chromatin Signaling and Diseases, Academic Press, Elsevier.
186
Gatta R, Mantovani R. 2011. NF-Y affects histone acetylation and H2A.Z deposition in
cell cycle promoters. Epigenetics 6: 526–534.
Gillissen B, Bergemann J, Sandmann C, Schroeer B, Bölker M, Kahmann R. 1992. A
two-component regulatory system for self/non-self recognition in Ustilago maydis. Cell
68: 647–657.
Godfroy O, Uji T, Nagasato C, Lipinska AP, Scornet D, Peters AF, Avia K, Colin S,
Laure M, Motomura T, et al. 2017. DISTAG/TBCCd1 Is Required for Basal Cell Fate
Determination in Ectocarpus. The Plant Cell 29: 3102–22.
Godoy M, Franco‐Zorrilla J, Pérez‐Pérez J, Oliveros J, Lorenzo Ó, Solano R. 2011.
Improved protein‐binding microarrays for the identification of DNA‐binding specificities
of transcription factors. The Plant Journal 66: 700–711.
Gordân R, Shen N, Dror I, Zhou T, Horton J, Rohs R, Bulyk M. 2013. Genomic Regions
Flanking E-Box Binding Sites Influence DNA Binding Specificity of bHLH Transcription
Factors through DNA Shape. Cell Reports 3: 1093–1104.
Goutte C, Johnson A. 1988. a1 Protein alters the dna binding specificity of α2 repressor.
Cell 52: 875–882.
Goutte-Gattat D, Shuaib M, Ouararhni K, Gautier T, Skoufias D, Hamiche A,
Dimitrov S. 2013. Phosphorylation of the CENP-A amino-terminus in mitotic
centromeric chromatin is required for kinetochore function. Proceedings of the National
Academy of Sciences 110: 8579–8584.
Grafi G. 2004. How cells dedifferentiate: a lesson from plants. Developmental Biology
268: 1–6.
Greer E, Blanco M, Gu L, Sendinc E, Liu J, Aristizábal-Corrales D, Hsu C-H, Aravind,
He C, Shi Y. 2015. DNA Methylation on N6-Adenine in C. elegans. Cell 161: 868–878.
Guertin M, Martins A, Siepel A, Lis J. 2012. Accurate Prediction of Inducible
Transcription Factor Binding Intensities In Vivo. PLoS Genetics 8: e1002610.
187
Guo Y, Mahony S, Gifford D. 2012. High Resolution Genome Wide Binding Event
Finding and Motif Discovery Reveals Transcription Factor Spatial Binding Constraints.
PLoS Computational Biology 8.
Guo Y, Tian K, Zeng H, Guo X, Gifford D. 2017. A novel k-mer set memory (KSM) motif
representation improves regulatory variant prediction. bioRxiv: 130815.
Hamaji T, Lopez D, Pellegrini M, Umen J. 2016. Identification and Characterization of
a cis-Regulatory Element for Zygotic Gene Expression in Chlamydomonas reinhardtii. G3
Genes|Genomes|Genetics 6: 1541–1548.
Hansen P, Hecht J, Ibn-Salem J, Menkuec B, Roskosch S, Truss M, Robinson P. 2016.
Q-nexus: a comprehensive and efficient analysis pipeline designed for ChIP-nexus. BMC
Genomics 17: 873.
He Q, Johnston J, Zeitlinger J. 2015. ChIP-nexus enables improved detection of in vivo
transcription factor binding footprints. Nature biotechnology 33: 395–401.
Hedgethorne K, Eustermann S, Yang J-C, Ogden T, Neuhaus D, Bloomfield G. 2017.
Homeodomain-like DNA binding proteins control the haploid-to-diploid transition in
Dictyostelium. Science Advances 3: e1602937.
Hickey D, Rose M. 1988. The role of gene transfer in the evolution of eukaryotic sex.
The evolution of sex.
Holland P, Booth A, Bruford E. 2007. Classification and nomenclature of all human
homeobox genes. BMC Biology 5: 1–28.
Horst N, Katz A, Pereman I, Decker E, Ohad N, Reski R. 2016. A single homeobox gene
triggers phase transition, embryogenesis and asexual reproduction. Nature Plants 2:
nplants2015209.
Hotchkiss RD. 1948. The quantitative separation of purines, pyrimidines, and
nucleosides by paper chromatography. Journal of Biological Chemistry 175: 315-332
Huang H, Sabari B, Garcia B, Allis D, Zhao Y. 2014. SnapShot: Histone Modifications.
Cell.
188
Hudry B, Thomas-Chollier M, Volovik Y, Duffraisse M, Dard A, Frank D, Technau U,
Merabet S. 2014. Molecular insights into the origin of the Hox-TALE patterning system.
eLife 3: e01939.
Hughes JS, Otto SP. 1999. Ecology and the Evolution of Biphasic Life Cycles. The
American Naturalist 154: 306.
Hull C, Boily M-J, Heitman J. 2005. Sex-Specific Homeodomain Proteins Sxi1α and
Sxi2a Coordinately Regulate Sexual Development in Cryptococcus neoformans.
Eukaryotic Cell 4: 526–535.
Iyer LM, Zhang D, Aravind L. 2016. Adenine methylation in eukaryotes: Apprehending
the complex evolutionary history and functional potential of an epigenetic modification.
BioEssays : news and reviews in molecular, cellular and developmental biology 38: 27–40.
Jiang D, Berger F. 2017. Histone variants in plant transcriptional regulation. Biochimica
et Biophysica Acta (BBA) - Gene Regulatory Mechanisms 1860: 123–130.
Jones R, Gelbart W. 1993. The Drosophila Polycomb-group gene Enhancer of zeste
contains a region with sequence similarity to trithorax. Molecular and Cellular Biology
13: 6357–6366.
Joo S, Nishimura Y, Cronmiller E, Hong R, Kariyawasam T, Wang M, Shao N, Akkad
S-E-D, Suzuki T, Higashiyama T, et al. 2017. Gene Regulatory Networks for the
Haploid-to-Diploid Transition of Chlamydomonas reinhardtii. Plant physiology 175: 314–
332.
Karas BJ, Diner RE, Lefebvre SC, McQuaid J, Phillips AP, Noddings CM, Brunson JK,
Valas RE, Deerinck TJ, Jablanovic J, et al. 2015. Designer diatom episomes delivered
by bacterial conjugation. Nature communications 6: 6925.
Keeling P. 2010. The endosymbiotic origin, diversification and fate of plastids.
Philosophical Transactions of the Royal Society B: Biological Sciences 365: 729–748.
Kissinger C, Liu B, Martin-Blanco E, Kornberg T, Pabo C. 1990. Crystal structure of an
engrailed homeodomain-DNA complex at 2.8 Å resolution: A framework for
understanding homeodomain-DNA interactions. Cell 63: 579–590.
189
Klemm J, Rould M, Aurora R, Herr W, Pabo C. 1994. Crystal structure of the Oct-1 POU
domain bound to an octamer site: DNA recognition with tethered DNA-binding modules.
Cell 77: 21–32.
Kondrashov A. 1988. Deleterious mutations and the evolution of sexual reproduction.
Nature 336: 435–440.
Kornberg R. 1974. Chromatin Structure: A Repeating Unit of Histones and DNA. Science
184: 868–871.
Koumandou L, Wickstead B, Ginger M, van der Giezen M, Dacks J, Field M. 2013.
Molecular paleontology and complexity in the last eukaryotic common ancestor. Critical
Reviews in Biochemistry and Molecular Biology 48: 373–396.
Kues, Richardson, Tymon, Mutasa, Gottgens, Gaubatz, Gregoriades, Casselton.
1992. The combination of dissimilar alleles of the A alpha and A beta gene complexes,
whose proteins contain homeo domain motifs, determines sexual development in the
mushroom Coprinus cinereus. Genes & Development.
Kukimoto I, Elderkin S, Grimaldi M, Oelgeschläger T, Varga-Weisz P. 2004. The
Histone-Fold Protein Complex CHRAC-15/17 Enhances Nucleosome Sliding and
Assembly Mediated by ACF. Molecular Cell 13: 265–277.
Kumar B, Parker H, Paulson A, Parrish M, Pushel I, Singh N, Zhang Y, Slaughter B,
Unruh J, Florens L, et al. 2017. HOXA1 and TALE proteins display cross-regulatory
interactions and form a combinatorial binding code on HOXA1 targets. Genome Research
27: 1501–1512.
Kutschera, Niklas. 2005. Endosymbiosis, cell evolution, and speciation. Theory in
Biosciences 124: 1–24.
Laloum T, De Mita S, Gamas P, Baudin M, Niebel A. 2013. CCAAT-box binding
transcription factors in plants: Y so many? Trends in Plant Science 18: 157–166.
Lawrence M, Daujat S, Schneider R. 2016. Lateral Thinking: How Histone
Modifications Regulate Gene Expression. Trends in Genetics 32: 42–56.
190
Lee J-H, Lin H, Joo S, Goodenough U. 2008. Early Sexual Origins of Homeoprotein
Heterodimerization and Evolution of the Plant KNOX/BELL Family. Cell 133.
Lee K, Workman J. 2007. Histone acetyltransferase complexes: one size doesn’t fit all.
Nature Reviews Molecular Cell Biology 8: 284–295.
Lenormand T, Engelstädter J, Johnston S, Wijnker E, Haag C. 2016. Evolutionary
mysteries in meiosis. Phil. Trans. R. Soc. B 371: 20160001.
Li, Stark, Johnson, Wolberger. 1995. Crystal structure of the MATa1/MATα2
homeodomain heterodimer bound to DNA.
Lin X, Tirichine L, Bowler C. 2012. Protocol: Chromatin immunoprecipitation (ChIP)
methodology to investigate histone modifications in two model diatom species. Plant
Methods 8: 48.
Lipinska A, Cormier A, Luthringer R, Peters AF, Corre E, Gachon CMM, Cock JM,
Coelho SM. 2015. Sexual Dimorphism and the Evolution of Sex-Biased Gene Expression
in the Brown Alga Ectocarpus. Molecular Biology and Evolution 32: 1581–97.
ipinska A D’h n t S, Damme E, Clerck O. 2013. Uncovering the genetic basis for
early isogamete differentiation: a case study of Ectocarpus siliculosus. BMC Genomics 14:
909.
Liu X, Noll D, Lieb J, Clarke N. 2005. DIP-chip: Rapid and accurate determination of
DNA-binding specificity. Genome Research 15: 421–427.
Loidl J. 2015. Conservation and Variability of Meiosis Across the Eukaryotes. Annual
Review of Genetics 50.
Luthringer R, Lipinska AP, Roze D, Cormier A, Macaisne N, Peters AF, Cock JM,
Coelho SM. 2015. The pseudoautosomal regions of the U/V sex chromosomes of the
brown alga Ectocarpus exhibit unusual features. Molecular biology and evolution.
Mable B, Otto S. 1998. The evolution of life cycles with haploid and diploid phases.
BioEssays 20: 453–462.
Martin P, McGovern A, Orozco G, Duffus K, Yarwood A, Schoenfelder S, Cooper N,
Barton A, Wallace C, Fraser P, et al. 2015. Capture Hi-C reveals novel candidate genes
191
and complex long-range interactions with related autoimmune risk loci. Nature
Communications 6: 10069.
McGinnis W, Garber R, Wirz J, Kuroiwa A, Gehring W. 1984a. A homologous protein-
coding sequence in Drosophila homeotic genes and its conservation in other metazoans.
Cell 37: 403408.
McGinnis, Levine, Hafen, Kuroiwa, Gehring. 1984b. A conserved DNA sequence in
homoeotic genes of the Drosophila Antennapedia and bithorax complexes. Nature 308:
428–433.
McGinty R, Tan S. 2014. Nucleosome structure and function. Chemical reviews 115:
2255–73.
Mead ME, Stanton BC, Kruzel EK, Hull CM. 2015. Targets of the Sex Inducer
homeodomain proteins are required for fungal development and virulence in
Cryptococcus neoformans. Molecular microbiology 95: 804–18.
Merabet S, Mann R. 2016. To Be Specific or Not: The Critical Relationship Between Hox
And TALE Proteins. Trends in Genetics 32: 334–347.
Mifsud B, Tavares-Cadete F, Young A, Sugar R, Schoenfelder S, Ferreira L, Wingett
S, Andrews S, Grey W, Ewels P, et al. 2015. Mapping long-range promoter contacts in
human cells with high-resolution capture Hi-C. Nature Genetics 47: ng.3286.
Morgan TH. 1911. An attempt to analyse the constitution of the chromosomes on the
basis of sex-limited unhritance in Drosophila. Journal of Experimental Zoology Part A
11: 365-413
Mori T, Kuroiwa H, Higashiyama T, Kuroiwa T. 2005. GENERATIVE CELL SPECIFIC 1
is essential for angiosperm fertilization. Nature Cell Biology 8: 64–71.
Moy, Mendoza, Schulz, Swanson, Glabe, Vacquier. 1996. The sea urchin sperm
receptor for egg jelly is a modular protein with extensive homology to the human
polycystic kidney disease protein, PKD1. The Journal of Cell Biology 133: 809–817.
192
Mukherjee K, Brocchieri L, Bürglin T. 2009. A Comprehensive Classification and
Evolutionary Analysis of Plant Homeobox Genes. Molecular Biology and Evolution 26:
2775–2794.
Nardone V, Chaves-Sanjuan A, Nardini M. 2016. Structural Determinants for NF-
Y/DNA Interaction at the CCAAT Box. Biochimica et Biophysica Acta (BBA) - Gene
Regulatory Mechanisms.
Ni M, Feretzaki M, Sun S, Wang X, Heitman J. 2011. Sex in Fungi. Genetics 45: 405–
430.
Nishimura Y, Shikanai T, Nakamura S, Kawai-Yamada M, Uchimiya H. 2012. Gsp1
triggers the sexual developmental program including inheritance of chloroplast DNA
and mitochondrial DNA in Chlamydomonas reinhardtii. The Plant cell 24: 2401–14.
Noyes M, Christensen R, Wakabayashi A, Stormo G, Brodsky M, Wolfe S. 2008.
Analysis of Homeodomain Specificities Allows the Family-wide Prediction of Preferred
Recognition Sites. Cell 133.
Okamoto M, Yamada L, Fujisaki Y, Bloomfield G, Yoshida K, Kuwayama H, Sawada
H, Mori T, Urushihara H. 2016. Two HAP2-GCS1 homologs responsible for gamete
interactions in the cellular slime mold with multiple mating types: Implication for
common mechanisms of sexual reproduction shared by plants and protozoa and for
male-female differentiation. Developmental Biology 415: 6–13.
Oldfield A, Yang P, Conway A, Cinghu S, Freudenberg J, Yellaboina S, Jothi R. 2014.
Histone-Fold Domain Protein NF-Y Promotes Chromatin Accessibility for Cell Type-
Specific Master Transcription Factors. Molecular Cell 55: 708–722.
Olins A, Olins D. 1974. Spheroid Chromatin Units (ν Bodies). Science 183: 330–332.
O’Malley R Huang S S ng ewsey M artlett A Nery J Galli M Gallav tti A
Ecker J. 2016. Cistrome and Epicistrome Features Shape the Regulatory DNA
Landscape. Cell 165: 1280–1292.
Parfrey L, Lahr D, Knoll A, Katz L. 2011. Estimating the timing of early eukaryotic
diversification with multigene molecular clocks. Proceedings of the National Academy of
Sciences 108: 13624–13629.
193
Passner J, Ryoo H, Shen L, Mann R, Aggarwal A. 1999. Structure of a DNA-bound
Ultrabithorax–Extradenticle homeodomain complex. Nature 397: 714–719.
Pelossof R, Singh I, Yang J, Weirauch M, Hughes T, Leslie C. 2015. Affinity regression
predicts the recognition code of nucleic acid–binding proteins. Nature Biotechnology 33:
nbt.3343.
Peters AF, Scornet D, Ratin M, Charrier B, Monnier A, Merrien Y, Corre E, Coelho
SM, Cock JM. 2008. Life-cycle-generation-specific developmental processes are
modified in the immediate upright mutant of the brown alga Ectocarpus siliculosus.
Development 135: 1503–12.
Pontecorvo. 1956. The Parasexual Cycle in Fungi. Annual Review of Microbiology 10:
393–400.
Rajeev L, Luning E, Mukhopadhyay A. 2014. DNA-affinity-purified chip (DAP-chip)
method to determine gene targets for bacterial two component regulatory systems.
Journal of visualized experiments : JoVE.
Renkawitz J, Lademann C, Kalocsay M, Jentsch S. 2013. Monitoring Homology Search
during DNA Double-Strand Break Repair In Vivo. Molecular Cell 50: 261–272.
Rescan M, Lenormand T, Roze D. 2016. Interactions between Genetic and Ecological
Effects on the Evolution of Life Cycles. The American Naturalist 187: 19–34.
Riggs AD, Porter TN. 1996. Overview of epigenetic mechanisms. Cold Spring Harbor
monograph series 32: 29-46.
Sakakibara K, Ando S, Yip H, Tamada Y, Hiwatashi Y, Murata T, Deguchi H, Hasebe
M, Bowman J. 2013. KNOX2 genes regulate the haploid-to-diploid morphological
transition in land plants. Science (New York, N.Y.) 339: 1067–70.
Scacchetti A, Brueckner L, Jain D, Schauer T, Zhang X, Schnorrer F, van Steensel B,
Straub T, Becker P. 2017. CHRAC/ACF Contribute to the Repressive Ground State of
Chromatin. bioRxiv: 218768.
194
Schmid C, Schroer N, Müller D. 1994. Female gamete membrane glycoproteins
potentially involved in gamete recognition in Ectocarpus siliculosus (Phaeophyceae).
Plant Science 102: 61–67.
Seike T, Nakamura T, Shimoda C. 2015. Molecular coevolution of a sex pheromone
and its receptor triggers reproductive isolation in Schizosaccharomyces pombe.
Proceedings of the National Academy of Sciences of the United States of America 112:
4405–10.
Shepherd J, McGinnis W, Carrasco A, Robertis E, Gehring W. 1984. Fly and frog
homoeo domains show homologies with yeast mating type regulatory proteins. Nature
310: 310070a0.
Siaut M, Heijde M, Mangogna M, Montsant A, Coesel S, Allen A, Manfredonia A,
Falciatore A, Bowler C. 2007. Molecular toolbox for studying diatom biology in
Phaeodactylum tricornutum. Gene 406: 23–35.
Simpson A, Inagaki Y, Roger A. 2006. Comprehensive Multigene Phylogenies of
Excavate Protists Reveal the Evolutionary Positions of ‘Primitive’ Eukaryotes. Molecular
Biology and Evolution 23: 615–625.
Slattery M, Riley T, Liu P, Abe N, Gomez-Alcala P, Dror I, Zhou T, Rohs R, Honig B,
Bussemaker H, et al. 2011. Cofactor Binding Evokes Latent Differences in DNA Binding
Specificity between Hox Proteins. Cell 147: 1270–1282.
Slattery M, Zhou T, Yang L, Machado A, Gordân R, Rohs R. 2014. Absence of a simple
code: how transcription factors read the genome. Trends in Biochemical Sciences 39:
381–399.
Smith LG, Greene B, Veit B, Hake S. 1992. A dominant mutation in the maize
homeobox gene, Knotted-1, causes its ectopic expression in leaf cells with altered fates.
Development 116: 21–30.
Steele R, Dana C. 2009. Evolutionary History of the HAP2/GCS1 Gene and Sexual
Reproduction in Metazoans. PLoS ONE 4: e7680.
Strahl B, Allis D. 2000. The language of covalent histone modifications. Nature 403: 41–
45.
195
Takatori N, Butts T, Candiani S, Pestarino M, Ferrier D, Saiga H, Holland P. 2008.
Comprehensive survey and classification of homeobox genes in the genome of
amphioxus, Branchiostoma floridae. Development Genes and Evolution 218: 579–590.
Talbert P, Henikoff S. 2010. Histone variants--ancient wrap artists of the epigenome.
Nature reviews. Molecular cell biology 11.
Testa A, Donati G, Yan P, Romani F, Huang T, Viganò A, Mantovani R. 2005.
Chromatin Immunoprecipitation (ChIP) on Chip Experiments Uncover a Widespread
Distribution of NF-Y Binding CCAAT Sites Outside of Core Promoters. Journal of
Biological Chemistry 280: 13606–13615.
Truernit E, Haseloff J. 2014. A Role for KNAT Class II Genes in Root Development. Plant
Signaling & Behavior 2: 10–12.
Umen JG. 2014. Green Algae and the Origins of Multicellularity in the Plant Kingdom.
Cold Spring Harbor perspectives in biology 6.
Veluchamy A, Rastogi A, Lin X, Lombard B, Murik O, Thomas Y, Dingli F, Rivarola M,
Ott S, Liu X, et al. 2015. An integrative analysis of post-translational histone
modifications in the marine diatom Phaeodactylum tricornutum. Genome biology 16:
102.
Waddington CH. 1942. The Epigenotype. Endeavour 1: 18.
Weirauch M, Yang A, Albu M, Cote A, Montenegro-Montero A, Drewe P, Najafabadi
H, Lambert S, Mann I, Cook K, et al. 2014. Determination and Inference of Eukaryotic
Transcription Factor Sequence Specificity. Cell 158: 1431–1443.
Watson JS, Crick FHC. 1953. Genetical implications of the structure of
desoxyribonucleic acid. Nature 171: 964-967.
Wolberger C, Vershon A, Liu B, Johnson A, Pabo C. 1991. Crystal structure of a
MATα2 homeodomain-operator complex suggests a general model for homeodomain-
DNA interactions. Cell 67: 517–528.
Yadon A, Tsukiyama T. 2011. SnapShot: Chromatin Remodeling: ISWI. Cell 144: 453–
453.e1.
196
Yang XJ. 2016. Histone Acetyltransferases, Key Writers of the Epigenetic Language. In
Chromatin Signaling and Diseases, Academic Press, Elsevier.
Yang X-J, Seto E. 2008. Lysine Acetylation: Codified Crosstalk with Other
Posttranslational Modifications. Molecular Cell 31: 449–461.
Yin Y, Morgunova E, Jolma A, Kaasinen E, Sahu B, Khund-Sayeed S, Das P, Kivioja T,
Dave K, Zhong F, et al. 2017. Impact of cytosine methylation on DNA binding
specificities of human transcription factors. Science 356: eaaj2239.
Yoon H, Hackett J, Ciniglia C, Pinto G, Bhattacharya D. 2004. A Molecular Timeline for
the Origin of Photosynthetic Eukaryotes. Molecular Biology and Evolution 21: 809–818.
Zaremba-Niedzwiedzka K, Caceres E, Saw J, Bäckström D, Juzokaite L, Vancaester
E, Seitz K, Anantharaman K, Starnawski P, Kjeldsen K, et al. 2017. Asgard archaea
illuminate the origin of eukaryotic cellular complexity. Nature 541: 353–358.
Zhang G, Huang H, Liu D, Cheng Y, Liu X, Zhang W, Yin R, Zhang D, Zhang P, Liu J, et
al. 2015. N6-Methyladenine DNA Modification in Drosophila. Cell 161: 893–906.
Zhang Y, Liu T, Meyer C, Eeckhoute J, Johnson D, Bernstein B, Nusbaum C, Myers R,
Brown M, Li W, et al. 2008. Model-based Analysis of ChIP-Seq (MACS). Genome Biology
9: 1–9.
Zhang Y, Reinberg D. 2001. Transcription regulation by histone methylation: interplay
between different covalent modifications of the core histone tails. Genes & Development
15: 2343–2360.
Zhou T, Yang L, Lu Y, Dror I, Dantas Machado AC, Ghane T, Di Felice R, Rohs R.
2013. DNAshape: a method for the high-throughput prediction of DNA structural
features on a genomic scale. Nucleic Acids Research 41: W56–62.
197
RESUME
Les processus moléculaires qui contrôlent le cycle de vie sont essentiels pour que divers processus biologiques, y compris le développement multicellulaire, soient correctement initiés. Le découplage entre les programmes de développement et le cycle de vie peut avoir des conséquences dramatiques sur l’organisme. L’algue brune filamenteuse Ectocarpus est d’un intérêt particulier pour analyser les processus moléculaires impliqués dans le développement et la progression du cycle de vie. Ectocarpus présente un cycle de vie haplo-diploïde avec l’alternance de deux générations multicellulaires : un gamétophyte haploïde et un sporophyte diploïde. Deux mutants présentent un changement homéotique entre les programmes de développement des générations sporophyte et gamétophyte. Les mutants réitèrent le programme de développement du gamétophyte à la place du sporophyte. Ces mutants, appelés ouroboros (oro) et samsara (sam), sont affectés dans deux gènes différents codant pour des facteurs de transcription à homéodomaine de classe TALE. Ma thèse porte sur la caractérisation des deux facteurs de transcription ORO et SAM ainsi que sur les dynamiques chromatiniennes sous-jacentes. Ainsi, cette thèse présente les phénotypes des deux mutants oro et sam ainsi qu’une comparaison du transcriptome des mutants avec celui des générations gamétophyte et sporophyte (Chapitre 2). L’interaction entre ORO et SAM a été également testée et a lieu au niveau de chaque homéodomaine (Chapitre 2). Les préférences de liaison à l’ADN des deux facteurs de transcription ont été évaluées in vitro en utilisant les techniques de Protein Binding Microarray et de DAP-seq (Chapitre 3). De plus, un criblage par double-hybride de levure a permis d’identifier deux sous-unités C de la famille de facteurs de transcription Nuclear Factor Y interagissant avec ORO (Chapitre 3). Cette thèse a également permis des avancées importantes dans l’étude de la régulation de la chromatine notamment en mettant au point un protocole d’immunoprecipitation de la chromatine (Chapitre 4). Ainsi, les profils de six modifications post-traductionnelles d’histones sur l’ensemble du génome ont été établis (Chapitre 5). ORO et SAM sont deux régulateurs majeurs de l’initiation du programme associé au sporophyte. Les résultats suggèrent également que ORO et SAM pourrait être impliqués directement dans la reprogrammation de la chromatine en s’associant avec le complexe NF-Y. Ce travail est pionner dans la compréhension de la reprogrammation de la chromatine et la régulation de voies de développement majeures chez les algues brunes. Mots-clés : Ectocarpus, Homéodomaine, Gamétophyte, Sporophyte, Epigénétique
ABSTRACT
The molecular processes that control the life cycle progression are fundamental for the correct initiation of developmental pathways. Uncoupling of development programs from life cycle processes can therefore have dramatic consequences for an organism. The brown alga Ectocarpus is a particularly interesting system to analyse the molecular processes involved in development and life cycle progression. Ectocarpus exhibits a haploid-diploid life cycle with an alternation between two multicellular generations: a haploid gametophyte and a diploid sporophyte. Two mutants exhibit homeotic switching between the sporophyte and gametophyte programs, reiterating the gametophyte program instead of switching to the sporophyte. These mutants, called ouroboros (oro) et samsara (sam), carry mutations into two different genes that code for TALE homeodomain transcription factors. This thesis aimed to characterize these two transcription factors and the chromatin dynamics associated with the alternation of generation in Ectocarpus. First, this thesis presents the characterisation of the oro and sam mutants and a transcriptomic comparison of the mutants with the sporophyte and gametophyte generations (Chapter 2). DNA-binding preferences of the two transcription factors were evaluated using two in vitro methods, Protein Binding Microarrays and DAP-seq (Chapter 3). ORO and SAM are able to heterodimerise via their respective homeodomains (Chapter 2) and a yeast two-hybrid screen showed that two C subunits of the Nuclear Factor Y family are able to interacting with ORO (Chapter 3). This thesis also presents major advances in the study of chromatin regulation in the brown alga. A chromatin immunoprecipitation protocol was established (Chapter 4) and used to obtain genome-wide profiles for six histone modifications (Chapter 5). Taken together, the data presented here suggests that ORO and SAM may be involved directly in chromatin reprogramming at generation-biased genes via an association with the NF-Y complex. The work presented represents a pioneer analysis of brown algal transcription factors and chromatin reprogramming events involved in the regulation of developmental pathways. Key-words: Ectocarpus, TALE homeodomain, Gametophyte, Sporophyte, Epigenetics
Copyright © 2022 FDOKUMEN