
General Information
315
About The Journal International Journal of Scientific Study (IJSS) is a monthly journal publishing research articles after full peer review and aims to publish scientifically sound research articles in across all science like Medicine, Dentistry, Genetics, Pharmacy, etc. Each article submitted to us would be undergoing review in three stages: Initial Review, Peer Review & Final Review. All rights are reserved with journal owner. Without the prior permission from Editor, no part of the publication can be reproduced, stored or transmitted in any form or by any means. Abstracting & Indexing Information Index Medicus (IMSEAR), Global Index Medicus, Index Copernicus, Directory of Open Access Journals(DOAJ), Google Scholar, WorldCat, SafetyLit, WHO Hinari, Genamics Journal Seek Ulrichsweb Serials Solutions , International Committee of Medical Journal Editors(ICJME) Geneva Foundation for Medical Education & Research(GFMER), Socolar, Bielefeld Academic Search Engine(BASE) , Research Bible , Academic Journals Database, J-Gate , Jour Informatics, Directory of Research Journal Indexing(DRJI), Scientific Indexing Services(SIS) Rubriq-Beta, SHERPA RoMEO, New Jour, EIJASR), IndianScience.in, CiteFactor , Scientific Journal Impact Factor (SJIF), Journal Index.net, ROAD, Global Impact Factor(GIF) , International Society for Research Activity (ISRA), Advanced Science Index, OpenAccessArticles.com, etc Information for Authors The authors should follow “Instructions to Authors” which is available on website http://www.ijss-sn. com/instructions-to-authors.html. Authors should fill the Copyright Transfer form & Conflict of Interest form. Manuscripts should be submitted directly to: [email protected]. Publication Charges International Journal of Scientific Study aims to encourage research among all the students, professionals, etc. But due to costs towards article processing, maintenance of paper in secured data storage system, databases and other financial constraints, authors are required to pay. However discount will be provided for the non-funding quality research work upon request. Details about publication charges are mentioned on journal website at: http://www.ijss-sn.com/publication-charges.html. Advertising Policy The journal accepts display and classified advertising Frequency discounts and special positions are available. Inquiries about advertising should be sent to [email protected]. Publishing Details Publisher Name: International Research Organization for Life & Health Sciences (IROLHS) Registered Office: L 214, Mega Center, Magarpatta, Pune - Solapur Road, Pune, Maharashtra, India – 411028. Contact Number: +919759370871. Designed by: Tulyasys Technologies (www.tulyasys.com) Disclaimer The views and opinions published in International Journal of Scientific Study (IJSS) are those of authors and do not necessarily reflect the policy or position of publisher, editors or members of editorial board. Though the every care has been taken to ensure the accuracy and authenticity of Information, IJSS is however not responsible for damages caused by misinterpretation of information expressed and implied within the pages of this issue. No part of this publication may be reproduced without the express written permission of the publisher. General Information International Journal of Scientific Study
-
Upload
khangminh22 -
Category
Documents
-
view
0 -
download
0
Transcript of General Information

About The JournalInternational Journal of Scientifi c Study (IJSS) is a monthly journal publishing research articles after full peer review and aims to publish scientifi cally sound research articles in across all science like Medicine, Dentistry, Genetics, Pharmacy, etc.
Each article submitted to us would be undergoing review in three stages: Initial Review, Peer Review & Final Review.
All rights are reserved with journal owner. Without the prior permission from Editor, no part of the publication can be reproduced, stored or transmitted in any form or by any means.
Abstracting & Indexing InformationIndex Medicus (IMSEAR), Global Index Medicus, Index Copernicus, Directory of Open Access Journals(DOAJ), Google Scholar, WorldCat, SafetyLit, WHO Hinari, Genamics Journal Seek Ulrichsweb Serials Solutions , International Committee of Medical Journal Editors(ICJME) Geneva Foundation for Medical Education & Research(GFMER), Socolar, Bielefeld Academic Search Engine(BASE) , Research Bible , Academic Journals Database, J-Gate , Jour Informatics, Directory of Research Journal Indexing(DRJI), Scientific Indexing Services(SIS)Rubriq-Beta, SHERPA RoMEO, New Jour, EIJASR), IndianScience.in, CiteFactor , Scientific Journal Impact Factor (SJIF), Journal Index.net, ROAD, Global Impact Factor(GIF) , International Society for Research Activity (ISRA), Advanced Science Index, OpenAccessArticles.com, etc
Information for AuthorsThe authors should follow “Instructions to Authors” which is available on website http://www.ijss-sn.com/instructions-to-authors.html. Authors should fi ll the Copyright Transfer form & Confl ict of Interest
form. Manuscripts should be submitted directly to: [email protected].
Publication ChargesInternational Journal of Scientifi c Study aims to encourage research among all the students, professionals, etc. But due to costs towards article processing, maintenance of paper in secured data storage system, databases and other fi nancial constraints, authors are required to pay. However discount will be provided for the non-funding quality research work upon request. Details about publication charges are mentioned on journal website at: http://www.ijss-sn.com/publication-charges.html.
Advertising PolicyThe journal accepts display and classifi ed advertising Frequency discounts and special positions are available. Inquiries about advertising should be sent to [email protected].
Publishing DetailsPublisher Name: International Research Organization for Life & Health Sciences (IROLHS)Registered Offi ce: L 214, Mega Center, Magarpatta, Pune - Solapur Road, Pune, Maharashtra, India – 411028. Contact Number: +919759370871.Designed by: Tulyasys Technologies (www.tulyasys.com)
DisclaimerThe views and opinions published in International Journal of Scientifi c Study (IJSS) are those of authors and do not necessarily refl ect the policy or position of publisher, editors or members of editorial board. Though the every care has been taken to ensure the accuracy and authenticity of Information, IJSS is however not responsible for damages caused by misinterpretation of information expressed and implied within the pages of this issue. No part of this publication may be reproduced without the express written permission of the publisher.
General Information
International Journal of Scientifi c Study

International Journal of Scientifi c Study
Dr. Swapnil S. Bumb – India (BDS, MDS, MPH, MSc, PGDHA, PDCR)
Assistant Professor, ACPM Dental College, Dhule, Maharashtra, India
Dr. Dhairya Lakhani, India
Founder & Editor In Chief
D Dh i L kh i I di
Founder Editor
Dr. Stephen Cohen – United States of America (MA, DDS, FACD, FICD)
Diplomate of the American Board of Endodontics Senior editor for nine Editions of the defi nitive Endodontics Textbook - Pathways of the Pulp, and a Co-editor of the renamed 10 edition
Cohen’s Pathways of the Pulp.
Dr. Abdel Latif Mohamed – Australia (MBBS, FRACP, MRCPCH, MPaeds, MPH, AFRACMA, MScEpi, MD)
Professor in Neonatology, The Clinical School, Australian National University Medical School, AustraliaOpen Researcher and Contributor ID (ORCID): 0000-0003-4306-2933, Scopus ID: 13610882200
Dr. Bipin N. Savani – United States of America (M.D)Professor of Medicine Director, Vanderbilt University Medical Center and Veterans Affairs Medical Center, Vanderbilt- Ingram
Cancer Center, Nashville, TN, USA.Associate Editor (previously co-editor) of the journal “Bone Marrow Transplantation” (offi cial journal of the European Group
for Blood and Marrow Transplantation- EBMT).Editorial advisory board: Biology of Blood and Marrow Transplantation (offi cial journal of the American Society of
Blood and Marrow Transplantation.
Dr. Yousef Saleh Khader Al-Gaud, Jordan – (BDS, MSc, MSPH, MHPE, FFPH, ScD) Professor (Full) - Department of Community Medicine
Jordan University of Science and Technology, Jordan, Irbid
Dr. P. Satyanarayana Murthy – India (MBBS, MS, DLO)Professor and Head, Department of ENT and Head & Neck Surgery, Dr.Pinnamaneni Siddhartha Institute of Medical Sciences and
Research Center, Chinnaautapalli, GannavaramEditor - Indian journal of Otolaryngology (1991),
Editorial Chairman, Indian Journal of Otolaryngology and Head & Neck Surgery 2006-2009 & 2009-2012Editor, International Journal of Phonosurgery and Laryngology
Editor in Chief designate, International Journal of Sleep Science and SurgeryEditor in Chief Designate, Journal of Inadian Academy of Otorhinolaryngology and Head & Neck Surgery
Dr. Sidakpal S. Panaich – United States of America (M.D)Interventional Cardiology Fellow, Department of Cardiology, Michigan State University/Borgess Medical CenterCardiology Fellow, Department of Internal Medicine/Cardiology, Wayne State University/Detroit Medical Center
Associate Editors
Dr. Silvana Beraj, Albania Dr. Mohannad Saleh Kiswani, JordanDr. João Malta Barbosa, United States of America Dr. Safalya Kadtane, India
Dr. Anastasia M. Ledyaeva, Russia Dr. Dorcas Naa Dedei Aryeetey, Kumasi, GhanaDr. Asfandyar Sheikh, Pakistan Dr. Animasahun Victor Jide, Sagamu, Nigeria
Dr. John Park, Scotland Dr. Hingi Marko C , Mwanza City, Tanzania
Senior Editorial Board Member
Editorial Board
International Journal of Scientifi c Study April 2016 • Vol 4 • Issue 1
Contents
ORIGINAL ARTICLES
Infl uence of Maternal Past Dental Experience and Child’s Temperamenton Behavior Management Problems in Dental Offi ceMadhushree Mukhopadhyay, Chitrita Gupta Mukherjee, Swati Sharma, Arvind Kumar, Swati Singh 1
Diagnostic Yield of Bronchoscopy in Lower Lung Field TuberculosisR B Parakh, M Dhananjaya, K A Meti 6
Evaluation of Palpable Breast Lumps under the Age of 35 Years withTriple AssessmentN Lingaraju, P Narashimhaswamy, R Murali Mohan, N Venkatesh 10
Hepatitis B- and Hepatitis C-infected Cases and Their Correlation withLiver Function Test in Teerthanker Mahaveer Medical College & Research Centre, Moradabad, Uttar Pradesh IndiaKomal Singh, Umar Farooq, Sudhir Singh, Amit Kumar Bharti, Navdeep Kaur, Mohd Shariq 16
Correlation between Deviated Nasal Septum and Sinusitis:A Clinical and Histopathological StudyMani Arora, Sadakat Ali, A K Choudhary, K Suchit, Chetan Bansal 21
Magnetic Resonance Imaging Lumbo Sacral Spine in Assessmentof Low Back Pain in Young AdultsShivali Pankaj Gaikwad, Varsha Rote-Kaginalkar, Pankaj Badarkhe-Patil 25
Perforated Appendix - Delay in Presentation Rather than Delay in theSurgical Intervention: Retrospective Database Analysis of 2573Saudi Arabian Patients in 10 YearsBader Hamza Shirah, Hamza Assad Shirah, Wael Awad Alhaidari 32
Gingival Enlargement and Seizure-related Oro-dental Injuries inPatients with EpilepsyY Shweta Somasundara, H L Jayakumar, G T Subhas, K P Suresh 37
International Journal of Scientifi c Study April 2016 • Vol 4 • Issue 1
Comparison of Clonidine and Dexmedetomidine on Cardiovascular Stability in Laparoscopic CholecystectomyDevang Bharti, Juhi Saran, Chetan Kumar, H S Nanda 43
Knowledge and Awareness Regarding Traumatic Dental Injuries in School Children among Physical Education Teachers in Patna: A Cross-Sectional StudyAbhishek Anand, Chitrita Gupta Mukherjee, Jeevendra Nath Shukla, Swati Sharma 51
Evaluation of the Post-operative Analgesia in Supraclavicular Brachial Plexus Block with 0.375% Plain Bupivacaine + 0.2 mmol Potassium Chloride (0.1 ml) as an AdjuvantNeeraj Solanki, Juhi Saran, Mahesh Kashyap, H S Nanda 55
Common Etiology of Acute Fever with Thrombocytopenia in a Tertiary Care Hospital, MysuruD K Suneetha, J Inbanathan, E Sahna, M S Shashank 61
Systemic Complication of Falciparum Malaria in Tertiary Care Hospital at Mysore: A Clinical StudyJ Inbanathan, D K Suneetha, G Harsha, Martin George, M S Shashank 65
Treatment of Displaced Supracondylar Fracture of Humerus in Children by Lateral Entry Pinning versus Cross Pinning(Maj Gen) V P Pathania, Nishant Dubey, Sanjay Gupta 70
Protective Effect of Oral N-acetyl Cysteine in Noise-induced Hearing Loss in Factory WorkersG D Mahajan, Devendra Marathe, Paresh Chavan, Saniya Khan, Yogesh Patil, Raphella Khan 75
Airtraq® Optical Laryngoscope versus Coopdech® Video Laryngoscope for Intubation Performance in the Pediatric Patients: A Randomized Single Hospital StudyRajib Hazarika, Tejwant Rajkhowa, Mridu Paban Nath, Samit Parua, Rupak Kundu 78
Extra-articular Manifestation of Rheumatoid ArthritisJ Inbanathan, D K Suneetha, G Harsha, Martin George, M S Shashank 81

International Journal of Scientifi c Study April 2016 • Vol 4 • Issue 1
Classical Single Patch Repair and Revascularization for Post-infarction Ventricular Septal Defect: A Follow-up Study from a Semi-urban Tertiary Care Centre in South IndiaJ Ravikrishnan, J Suresh Patel, Nibi Hassan 85
Awareness of Contact Lens Care among College Students in Saudi ArabiaAshjan Yousef Bamahfouz, Hanaa Nafady-Hego, Serene Jouhargy, Mohammed Abdul Qadir,Weam Nabeel Jameel Qutub, Khaled Mohammed Bahubaishi, Abdullah Atiah Al-ghamdi 90
Determinants of Utilization of Janani Suraksha Yojana among Mothers in Selected Communities of Aligarh: A Population-based Cross-sectional StudyNeha Priya, Samreen Khan, Zulfi a Khan 97
Hypoglycemic Effect of Tinospora cardifolia in Type II Diabetes MellitusRekha Kumari 103
Post-operative Nausea and Vomiting: Comparison of the Role of Ramosetron and OndansetronRakesh Kumar, Vishwanath Kumar, Neha Priya 106
Magnetic Resonance Imaging of Knee Joint: Diagnosis and Pitfalls Using Arthroscopy as Gold StandardShweta Gimhavanekar, Kadambari Suryavanshi, Jagannath Kaginalkar, Varsha Rote-Kaginalkar 110
Awareness of Diabetes Mellitus and its Complications among Patients at Tertiary Care HospitalAmbannagowda Durgad, R B Parakh, M Dhananjaya, K N Ramesh 117
Comparison of Submucosal Diathermy and Partial Inferior TurbinectomyM S Vishnu, K B Rajamma 120
Neurosonogram in Critically Ill Neonates in Neonatal Intensive Care UnitDinakara Prithviraj, Bharath Reddy, Radha Reddy, B Shruthi 124
Comparison of Transabdominal Preperitoneal and Total Extra Peritoneal: A Prospective StudyT Shivakumar, B M Pavan, C S Gurukiran, N Chandrashekar, N Satish Babu, Naveen H Mahadev, G B Chandan, G N Prabhakara 129
International Journal of Scientifi c Study April 2016 • Vol 4 • Issue 1
Severe Acute Maternal Morbidity (Near Miss) in a Tertiary Care Center in Maharashtra: A Prospective StudyAlka Patankar, Prashant Uikey, Neha Rawlani 134
Comparison of Effi cacy of One-minute Endoscopy Room Test and Giemsa Stain in Detecting Helicobacter Pylori in Chronic GastritisE Nidhya, S Sowmya 141
Susceptibility to Pulmonary Tuberculosis as a Function of ABO-Rh Blood Group AntigensGourahari Pradhan, Ansuman Sahu, Pradeep Kumar Giri, Jyotiranjan Sahoo 146
Expression of Human Epidermal Growth Factor Receptor 2/neu in Carcinoma Breast with Reference to Prognostic IndexS Shivakumar, Medha Shankarling, Jasneet Kaur Sandhu 150
Reduction in Corneal Diameter Following Cataract Surgery: A Comparison between Those Who Underwent Small Incision Cataract Surgery and Phacoemulsifi cation at a Tertiary Care Hospital in South IndiaAbraham Ipe, George Peter, Rohith Skariah 156
Total Thyroidectomy for Benign Thyroid Disease: A Prospective StudyBapurapu Raja Ram, Vallabdhas Srinivas Goud, Dodda Ramesh Kumar, Madipeddi Venkanna 161
Mastoiditis and Sinonasal Pathologies on Cranial Computed Tomography Imaging: A Correlative StudyRajesh Raman, Nagaraj Murthy, Shashidhar Galag, Shilpa Diwakar 165
Ultrasound-guided Percutaneous Aspiration of Breast Abscesses: An Outpatient ProcedureAnjali Pawar Dahiphale, Anita J Kandi, Prashant Titare, Varsha Rote Kaginalkar, Sarojini Jadhav 169
Analysis of Germ Cell Tumors of Ovary in a Tertiary Care Hospital: A Two Year Retrospective StudyMuktanjalee Deka, Chandan Jyoti Saikia, Rukmini Bezbaruah 173
Saliva as a Non-invasive Tool in Evaluation of Type 2 Diabetes MellitusP Sai Archana, K Saraswathi Gopal, B G Harsha Vardhan, P Mahesh Kumar 178

International Journal of Scientifi c Study April 2016 • Vol 4 • Issue 1
Evaluation of Results of Hip Arthroscopic Surgery for Femoroacetabular ImpingementPrasanta Kumar Saha 183
Levobupivacaine versus Ropivacaine: A Comparative Study of the Analgesic and Hemodynamic SpectrumAmartya Khan, H S Nanda, Richa Chandra 188
Submucosal Diathermy for Nasal Obstruction: A Case Study of 30 CasesM S Vishnu, A B Harikrishnan, K B Rajamma 194
Can Intercostal Nerve Blockade be an Effective Alternative to Thoracic Epidural Analgesia for Acute Post-thoracotomy Pain Relief ?Dipika Choudhury, Faiza Ahmed Talukdar, Rupak Kundu, Mridu Paban Nath, Samit Parua 199
Study of p53 in Cervical Intraepithelial Neoplasia and Carcinoma Cervix with Clinico-pathological CorrelationJasneet Kaur Sandhu, S Shivakumar 206
Incisal Show – A Decrease with an Increase in Lines of LifeS Padmasree, Bhanu Rekha, S Rajesh, A Ranukumari 213
Laboratory Findings and Clinical Correlation in Assessing the Severity of Perinatal AsphyxiaDinakara Prithviraj, Bharath Reddy, Deepthi, Abhijit Shetty 218
Intraocular Pressure Control in Post Trabeculectomy Patients with Pseudoexfoliation Syndrome: A Prospective StudyNusrat Shaheen, Wasim Rashid, Fozia Rasool, Adil Majeed Mir, Tahir Saleem, Aamir Rashid 226
Evaluation of Shade Differences between Natural Anterior Teeth in Patients of Different Age Groups, Skin Tone, and Gender: A Computerized Cross-sectional StudyS Bhanu Rekha, S Padmasree, N Aparna, Ranu Kumari 229
Comparative Study between Kocher’s Method and External Rotation Method in Acute Anterior Dislocations and Fracture-dislocations of ShoulderS Rajasekaran, B Jeyakumar 234

International Journal of Scientifi c Study April 2016 • Vol 4 • Issue 1
Role of Multiplanar Reconstruction Imaging and Three-dimensional Computed Tomography Imaging in Diagnosing Cranial and Facial FracturesAbdul Khader Farook, Gurubharath Ilangovan, Rajesh Ravi, Abubacker Sulaiman Farook, Praveen Kumar Magudeeswaran 237
Clinicopathological Study of Lichen Planus in a Tertiary Care CenterLakshmipriya Gurusamy, Uma Selvaraj 242
Comparative Study of Intrathecal Dexmedetomidine and Buprenorphine as Adjuvant to Bupivacaine in Spinal Anaesthesia: A Randomized Controlled TrailKannan Bojaraaj, S Vijayaragavan, S Senthilkumar, M A Mohammed Thaiyub Khan 246
Estimating the Height of an Individual from the Length of Ulna in Tamil Nadu Population and its Clinical Signifi canceA Anupriya, R Kalpana 252
Usefulness of Bolus Intravenous Sodium Bicarbonate in Prevention of Contrast-Induced Nephropathy in Patients Undergoing Percutaneous Cardiac InterventionsG Varghese, Sethu Babu, V Kiron, S S Iyengar 256
Enteropathogenic Infections in Human Immunodefi ciency Virus Positive Patients in a Tertiary Care Center: A Clinicomicrobial StudyLakshmipriya Gurusamy, Uma Selvaraj 261
Comparative Study of the Diagnostic Ability of Ultrasonography and Magnetic Resonance Imaging in the Evaluation of Chronic Shoulder PainSachin Khanduri, Anshul Raja, Tanvi Meha, Sumit Agrawal, Saurav Bhagat, Girjesh Jaiswal 264
Comparison of the Accuracy of Spot Urinary Protein/Creatinine Ratio and Urinary Dipstick with the 24-h Urine Protein Estimation in Children with Nephrotic SyndromeVidhyadeviAnanthakumar, Balasubramanian Marimuthu, Nandini Kuppusamy 271
Analysis of the Profi le and Outcome of Children those Received Oxygen Support through High-fl ow Nasal Cannula in a Rural Medical College HospitalBalasubramanian Marimuthu, Nandini Kuppusamy, M Krithiga 275
International Journal of Scientifi c Study April 2016 • Vol 4 • Issue 1
Serum Zinc Level in Children Admitted with Pneumonia at Tertiary Care Children’s HospitalReghupathy Panneerselam, Balasubranian Marimuthu 281
Magnitude of Preterm Admissions in Neonatal Intensive Care Unit of Rural Medical College HospitalNandini Kuppusamy, M Balasubramanian, M Krithiga 284
Hand Preference in Cerebral Palsy with Special Reference to PrematurityRajesh Bansal, Ashok Agarwal, Mahender Sharma 288
CASE REPORTS
Treatment of Multiple Impacted Canines - Maxillary Left Canine and Both Mandibular Canines: A Case ReportRanjit O Pawar, Sagar A Mapare 292
Pneumobilia with Cholangitic Abscess: A Case ReportGarima Singh, A Mukherji, H R Jain, P Smita 295
Synchronous Bilateral Breast Benign Phyllodes Tumors in an Adolescent Female along with Depression: A Case ReportSaswati Sucharita Pati, Tapan Kumar Sahoo 298
Giant Vesical Calculus: A Rare Case ReportS Joseph, Parth Nathwani, Rajpal Singh Lamba, Nitin Joshi, Nandan Pujari 302
CASE PICTORIAL
Laparoscopic Distal Pancreatectomy for Serous Cystadenoma with Anomalous VasculatureDilip George, S Saravanan, Asha Reddy, Narayanan Cunnigaiper Dhanasekhar 305
1 International Journal of Scientifi c Study | April 2016 | Vol 4 | Issue 1
Infl uence of Maternal Past Dental Experience and Child’s Temperament on Behavior Management Problems in Dental Offi ceMadhushree Mukhopadhyay1, Chitrita Gupta Mukherjee2, Swati Sharma3, Arvind Kumar4, Swati Singh1
1Postgraduate Student, Department of Pedodontics and Preventive Dentistry, Buddha Institute of Dental Sciences & Hospital, Patna, Bihar, India, 2Professor & Head, Department of Pedodontics and Preventive Dentistry, Buddha Institute of Dental Sciences & Hospital, Patna, Bihar, India, 3Reader, Department of Pedodontics and Preventive Dentistry, Buddha Institute of Dental Sciences & Hospital, Patna, Bihar, India, 4Professor, Department of Pedodontics and Preventive Dentistry, Buddha Institute of Dental Sciences & Hospital, Patna, Bihar, India
objective of which is to develop in a dental practitioner an understanding of the interpersonal social forces that infl uence a patient’s behavior.
Children are all unique and special in their own way, and as pediatric dentists, we recognize that children cannot all be treated the same. The initial consultation appointment allows the dental team to not only establish treatment needs but just as important, determine how to manage behavior. The child’s behavior on every dental visit depends on variables such as parental behavior, parental anxiety, past medical/dental history, the awareness of their dental problem, type of dental procedure, the behavior management, and the procedural techniques followed by
INTRODUCTION
The foundation of practicing dentistry on children is the ability to guide them through their dental experiences while instilling in them a positive attitude toward dentistry. Behavioral dentistry is an interdisciplinary science, the
Original Article
Abstract
Introduction: Children are all unique and special in their own way, and as pediatric dentists, we recognize that children cannot all be treated the same. The child’s behavior on every dental visit depends on variables such as parental behavior, parental anxiety, past medical/dental history, the awareness of their dental problem, type of dental procedure, the behavior management, and the procedural techniques followed by the dentist. The aim of the following study was to assess the following background variables with a view to estimate their infl uence on behavior management problems using a structured interview and analyzing their separate and combined predictive power: (1) Mother’s previous dental experience and (2) Child’s temperament.
Materials and Methods: A total of 100 children of the age group 6-8 years, who reported for their fi rst dental appointment with their mothers, were included in the study. An assessment of the behavior exhibited by each child was made using the four-point scale of Frankl, and their mothers were asked to rate their own past dental experiences. Children were also categorized according to temperament.
Results: Out of 13 children, whose mothers had a pleasant past dental experience, 11 children (84.62%) displayed positive behavior. On the contrary, only 4 children (28.57%) of mothers with unpleasant dental experience exhibited positive behavior, and this difference was statistically signifi cant (z = 2.9283, P = 0.0038). Furthermore, children with negative temperament generally exhibited negative dental behavior.
Conclusion: In this study, a correlation between maternal anxiety, child anxiety, and negative behavior in the dental offi ce was observed. Appropriate use of management techniques not only helps us to effi ciently perform dental treatment but also instills a positive dental attitude in the child, which ensures desired behavior even on successive visits.
Key words: Behavior management problem, Child emotionality, Maternal anxiety, Positive dental behavior, Temperament
Access this article online
www.ijss-sn.com
Month of Submission : 02-2016Month of Peer Review : 03-2016Month of Acceptance : 03-2016Month of Publishing : 04-2016
Corresponding Author: Madhushree Mukhopadhyay, Buddha Institute of Dental Sciences & Hospital, Patna, Bihar, India. Phone: +91-9771690616. E-mail: [email protected]
DOI: 10.17354/ijss/2016/177

Mukhopadhyay, et al.: Maternal Past Dental Experience, Child’s Temperament, and DBMP
2International Journal of Scientifi c Study | April 2016 | Vol 4 | Issue 1
the dentist.1 Furthermore, children’s developmental age and the corresponding level of cognition and emotionality play a prominent role in clinical behavior.2 Interwoven with these primal characteristics is the child’s temperament, broadly embraced and defi ned as how a child responds to novel environments and strangers.3 Temperament is thought to have a genetic basis, and some aspects of the temperament domain signifi cantly infl uence children’s behavior in clinical settings including dental offi ces. For example, shy or withdrawn, non-approachable, and moody children generally may not be cooperative for routine dental procedures.4
The issue of dental fear and anxiety has been studied extensively and presents a signifi cant problem to patients and dentists alike. It appears that a common method of anxiety assessment is for clinicians to use their clinical judgment and experience in determining anxiety levels. This is the method used by the majority of UK dental practitioners, and therefore, is highly relevant.5
The aim of the following study was to assess the following background variables with a view to estimate their infl uence on behavior management problems using a structured interview and analyzing their separate and combined predictive power:1. Mother’s previous dental experience2. Child’s temperament.
MATERIALS AND METHODS
The study was conducted in the Department of Pedodontics and Preventive Dentistry, Buddha Institute of Dental Sciences and Hospital, Patna, India. About 100 children of the age group 6-8 years, who reported for their fi rst dental appointment with their mothers, were included in the study. An assessment of the behavior exhibited by each child was made using the four-point scale of Frankl, which has been found reliable by various authors.
The criteria for scoring were as follows.Rating 1: Defi nitely negative: Refusal of treatment, crying
forcefully, fearful, or any overt evidence of extreme negativism.
Rating 2: Negative: Reluctant to accept treatment, some evidence of negative attitude but not pronounced.
Rating 3: Positive: Acceptance of treatment, at times cautious, willingness to comply with the dentist, at times with reservation but patiently follows cooperatively.
Rating 4: Definitely positive: Good rapport with the dentist, interested in the dental procedures, laughing and enjoying the situation.
In addition, the mothers were asked to rate their own past dental experiences as follows:Group A: Pleasant.Group B: Indifferent (neither pleasant nor unpleasant).Group C: Unpleasant.Group D: No prior dental exposure.
Children were categorized into following groups according to temperament (Thomas and Chess, 1977).6Group 1: Easy child (adaptable, playful, responsive to
adults).Group 2: Slow-to-warm-up child (slow adaptability, takes
longer to elicit positive behavior).Group 3: Diffi cult child (fussy, diffi cult to soothe, has
problems sleeping and eating).
Data were statistically analyzed, frequency tables of variables were generated, and cross tabulations were derived where necessary. The Chi-square test was employed to determine the association between variables.
RESULTS
The frequency distribution of the mother’s past dental experiences is shown in Table 1.
It was noted that quite a high percentage of the mothers had no prior dental experience.
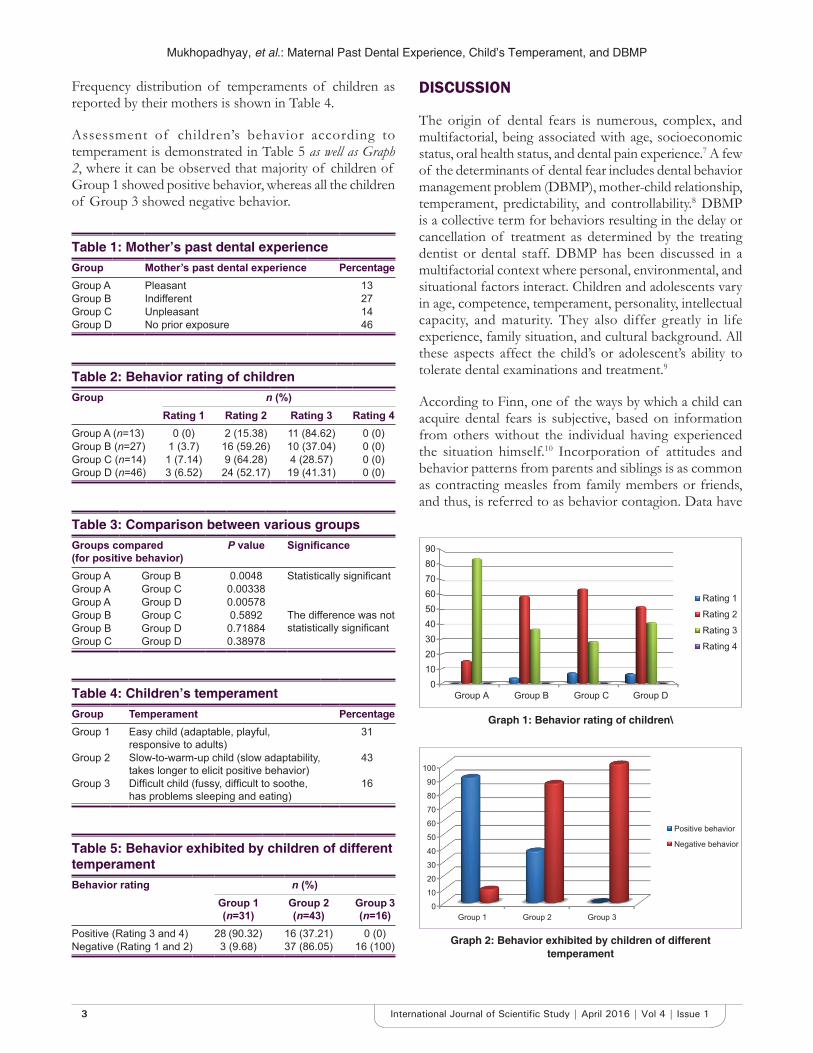
Out of 13 children, whose mothers had a pleasant past dental experience, 11 children (84.62%) displayed positive behavior. On the contrary, only 4 children (28.57%) of mothers with unpleasant dental experience exhibited positive behavior, and this difference was statistically signifi cant (z = 2.9283, P = 0.0038). 9 children (64.28%) exhibited negative behavior and 1 child (7.14%) showed signs of defi nitely negative behavior (Table 2).
Among mothers with indifferent experience, 16 children (59.26%) revealed negative behavior, 1 child (3.7%) exhibited defi nitely negative behavior, and 10 children (37.04%) showed positive behavior.
About 24 children (52.17%), whose mothers did not have any prior dental experience, exhibited positive behavior, 3 children (6.52%) children exhibited defi nitely negative behavior, and 19 children (41.31%) demonstrated the negative behavior (Graph 1).
From Table 3, it is safe to conclude that signifi cantly higher number of children, whose mothers had a pleasant past dental experience displayed positive behavior when compared with other groups.
Mukhopadhyay, et al.: Maternal Past Dental Experience, Child’s Temperament, and DBMP
3 International Journal of Scientifi c Study | April 2016 | Vol 4 | Issue 1
Frequency distribution of temperaments of children as reported by their mothers is shown in Table 4.
Assessment of children’s behavior according to temperament is demonstrated in Table 5 as well as Graph 2, where it can be observed that majority of children of Group 1 showed positive behavior, whereas all the children of Group 3 showed negative behavior.
DISCUSSION
The origin of dental fears is numerous, complex, and multifactorial, being associated with age, socioeconomic status, oral health status, and dental pain experience.7 A few of the determinants of dental fear includes dental behavior management problem (DBMP), mother-child relationship, temperament, predictability, and controllability.8 DBMP is a collective term for behaviors resulting in the delay or cancellation of treatment as determined by the treating dentist or dental staff. DBMP has been discussed in a multifactorial context where personal, environmental, and situational factors interact. Children and adolescents vary in age, competence, temperament, personality, intellectual capacity, and maturity. They also differ greatly in life experience, family situation, and cultural background. All these aspects affect the child’s or adolescent’s ability to tolerate dental examinations and treatment.9
According to Finn, one of the ways by which a child can acquire dental fears is subjective, based on information from others without the individual having experienced the situation himself.10 Incorporation of attitudes and behavior patterns from parents and siblings is as common as contracting measles from family members or friends, and thus, is referred to as behavior contagion. Data have
Table 1: Mother’s past dental experienceGroup Mother’s past dental experience PercentageGroup A Pleasant 13Group B Indifferent 27Group C Unpleasant 14Group D No prior exposure 46
Table 2: Behavior rating of childrenGroup n (%)
Rating 1 Rating 2 Rating 3 Rating 4Group A (n=13) 0 (0) 2 (15.38) 11 (84.62) 0 (0)Group B (n=27) 1 (3.7) 16 (59.26) 10 (37.04) 0 (0)Group C (n=14) 1 (7.14) 9 (64.28) 4 (28.57) 0 (0)Group D (n=46) 3 (6.52) 24 (52.17) 19 (41.31) 0 (0)
Table 3: Comparison between various groupsGroups compared(for positive behavior)
P value Signifi cance
Group A Group B 0.0048 Statistically signifi cantGroup A Group C 0.00338Group A Group D 0.00578Group B Group C 0.5892 The difference was not
statistically signifi cantGroup B Group D 0.71884Group C Group D 0.38978
Table 4: Children’s temperamentGroup Temperament PercentageGroup 1 Easy child (adaptable, playful,
responsive to adults)31
Group 2 Slow-to-warm-up child (slow adaptability, takes longer to elicit positive behavior)
43
Group 3 Diffi cult child (fussy, diffi cult to soothe, has problems sleeping and eating)
16
Table 5: Behavior exhibited by children of different temperamentBehavior rating n (%)
Group 1 (n=31)
Group 2 (n=43)
Group 3 (n=16)
Positive (Rating 3 and 4) 28 (90.32) 16 (37.21) 0 (0)Negative (Rating 1 and 2) 3 (9.68) 37 (86.05) 16 (100)
Graph 1: Behavior rating of children\
Graph 2: Behavior exhibited by children of different temperament

Mukhopadhyay, et al.: Maternal Past Dental Experience, Child’s Temperament, and DBMP
4International Journal of Scientifi c Study | April 2016 | Vol 4 | Issue 1
revealed that fearful dental patients come from families that have had previous unfavorable dental experiences and in particular where these attitudes are typically expressed.11
Hawley et al. (1974) reported that there was signifi cant negative behavior in children who had interacted with someone with an unpleasant dental experience. Similarly, frightening comments made by other children and adults have resulted in children reacting unfavorably at the dental clinic.12
Most of the characters of the child such as behavior, personality, anxiety, and reaction to stress are directly infl uenced by the parents’ characters. Both the parents play an important role in child’s psychological development, but more emphasis is placed on the mother, since mothers generally have more intimate contact with the child since prenatal period. The quality of maternal interactive behavior with infants infl uences the physiological and behavioral response to stress, including expression of fearfulness.11 This was in agreement with our study, where children whose mothers had unpleasant past dental experience also exhibited fearful behavior.
According to Hane,13 the function of maternal behavior was different across the two general trajectories (maternal positivity and negativity), and these influenced the development of social withdrawal in childhood. Maternal negativity is associated with poor social functioning in children who have an established history of social withdrawal, whereas maternal positivity is associated with better social outcome for preschoolers who are viewed as temperamentally shy.
Research on the role of parental fearfulness and modeling in children’s fear has revealed that children of fearful mothers who often expressed their fears were very fearful themselves. A mother who bears anxieties as a result of her own previous dental experience can transmit it to her offspring, and this may produce a phobia of dental treatment in the child with preconceived notions even before the actual visit.14
Bankole established that there exists a correlation between maternal anxiety, child anxiety, and negative behavior in the dental offi ce, which indicated a disruptive infl uence caused by an anxious mother,11 and this fi nding concurred with the results of the current study.
There is clear evidence of relationships between temperament and dental fear and anxiety. As with internalizing problems, it is more connected with temperamental traits such as shyness, inhibition, and negative emotionality.15 Temperament has become
an increasingly important concept in developmental psychology and psychopathology. With the growth of developmental psychopathology as a discipline, a renewed interest in the transaction between the child’s inborn tendencies (e.g. temperament, neurological vulnerability) and the caregiving environment has followed. Over the last decade, the interest in temperament in terms of reactivity (i.e. how quickly and intense, different parts of the nervous system reacts to external stimuli) has been supplemented with an interest in temperamental aspects of the regulation of affect and behavior (i.e. how well the child is able to regulate his or her activated nervous system).16
Although there is some evidence that temperament is stable over time, there are some factors that affect some types of temperament. Martin and Fox (2006) suggested that these factors include sex of the child (inhibited girls are more likely to change than inhibited boys), children’s participation in out-of-home care (children who receive outside child care become less inhibited over time), parental characteristics (over controlling parents have children who remain inhibited over time), sibling relationships, and stress.6
Negative emotionality, a tendency to become easily and intensely upset, especially when frustrated, may also infl uence children’s ability to cope with dental treatment, since it leads to aggressive and/or refusal behavior. This could be seen in our study as well, in cases of children of diffi cult temperament, who exhibited negative behavior in the dental offi ce.9
The association of dental anxiety with a history of dental pain in children less than fi ve years of age may be explained by the notion that dental fear is closely related to invasive procedures. This suggests that the fear of pain is a factor to be considered, investigated, and controlled in dental practice, particularly in pediatric dentistry, since it constitutes the fi rst experience of oral health care.17
CONCLUSION
Successful pediatric dentistry depends not only on technical skills but also on our ability to acquire and maintain a child’s cooperation. Proper assessment of children’s behavior helps the dentist to plan appointments and render effective and effi cient dental treatment. One of the most challenging aspects of dental practice is working with the diffi cult, challenging, or uncooperative children, whose primary emotions on entering a dental offi ce are anxiety and fear. It is during these times that the dentist’s clinical and patient management skills are most thoroughly tested, and success requires a personal knowledge of the patient and an

Mukhopadhyay, et al.: Maternal Past Dental Experience, Child’s Temperament, and DBMP
5 International Journal of Scientifi c Study | April 2016 | Vol 4 | Issue 1
understanding of human behavior and development. In this study, a correlation between maternal anxiety, child anxiety, and negative behavior in the dental offi ce was observed. Appropriate use of management techniques not only helps us to effi ciently perform dental treatment but also instills a positive dental attitude in the child, which ensures desired behavior even on successive visits.
REFERENCES
1. McDonald RE, Avery DR, Dean JA. Dentistry for Child and Adolescent. 8th ed. Missouri: Mosby: An Imprint of Elsevier; 2004. p. 45-6.
2. Pinkham JR. Pediatric Dentistry: Infancy through Adolescence. 4th ed. Philadelphia: Saunders; 2005.
3. Theall-Honey LA, Schmidt LA. Do temperamentally shy children process emotion differently than nonshy children? Behavioral, psychophysiological, and gender differences in reticent pre-schoolers. Dev Psychobiol 2006;48:187-96.
4. Arnrup K, Broberg AG, Berggren U, Bodin L. Temperamental reactivity and negative emotionality in uncooperative children referred to specialized paediatric dentistry compared to children in ordinary dental care. Int J Paediatr Dent 2007;17:419-29.
5. Holmes RD, Girdler NM. A study to assess the validity of clinical judgement in determining paediatric dental anxiety and related outcomes of management. Int J Paediatr Dent 2005;15:169-76.
6. Hooper SR, Umansky W. Young Children with Special Needs. Upper
Saddle River, NJ: Pearson Merrill Prentice Hall; 2009. p. 351.7. Baier K, Milgrom P, Russell S, Mancl L, Yoshida T. Children’s fear
and behavior in private pediatric dentistry practices. Pediatr Dent 2004;26:316-21.
8. Marwah N. Textbook of Pediatric Dentistry, 2009; 2nd edition. Jaypee Brothers Medical Publishers (P) Ltd.
9. Gustafsson A, Broberg A, Bodin L, Berggren U, Arnrup K. Dental behaviour management problems: The role of child personal characteristics. Int J Paediatr Dent 2010;20:242-53.
10. Finn S. Clinical Pedodontics. Philadelphia, London: W. B. Saunders Co.; 1957.
11. Popoola BO, Kolude B, Denloye OO. Parental attitudes to the care of the carious primary dentition experience from a Nigerian tertiary hospital. Afr J Med Med Sci 2013;42:65-71.
12. Hawley BP, McCorkle AD, Wittemann JK, Ostenberg PV. The fi rst dental visit for children from low socioeconomic families. ASDC J Dent Child 1974;41:376-81.
13. Hane AA, Fox NA. Ordinary variations in maternal caregiving infl uence human infants’ stress reactivity. Psychol Sci 2006;17:550-6.
14. Muris P, Steerneman P, Merckelbach H, Meesters C. The role of parental fearfulness and modelling in children’s fear. Behav Res Ther 1996;34:265-8.
15. Mathewson RJ, Primosch RE, Robertson D. Fundaments of Paediatric Dentistry. Chicago: Quintessence Publishing Co Inc.; 1987. p. 137-52.
16. Klingberg G, Broberg AG. Dental fear/anxiety and dental behaviour management problems in children and adolescents: A review of prevalence and concomitant psychological factors. Int J Paediatr Dent 2007;17:391-406.
17. Oliveira MM, Colares V. The relationship between dental anxiety and dental pain in children aged 18 to 59 months: A study in Recife, Pernambuco State, Brazil. Cad Saude Publica 2009;25:743-50.
How to cite this article: Mukhopadhyay M, Mukherjee CG, Sharma S, Kumar A, Singh S. Infl uence of Maternal Past Dental Experience and Child’s Temperament on Behavior Management Problems in Dental Offi ce. Int J Sci Stud 2016;4(1):1-5.
Source of Support: Nil, Confl ict of Interest: None declared.
6International Journal of Scientifi c Study | April 2016 | Vol 4 | Issue 1
Diagnostic Yield of Bronchoscopy in Lower Lung Field TuberculosisR B Parakh, M Dhananjaya, K A Meti
Assistant Professor, Department of Medicine, SDM College of Medical Sciences and Hospital, Sattur, Dharwad, Karnataka, India
increased the incidence of middle and lower lung fi eld TB (LLFTB)3 which is frequently associated with negative sputum smear due to lower bacillary load.4
Since Laennec’s era, lower lobe TB was a rare entity.5 In 1866, Kidd stated that “apex of lower lobe is very prone to tubercular disease and may be attacked before the apex of the upper lobe.”6 When TB affects lower lung fi elds, it confuses clinicians as pneumonia and hence delays accurate treatment and increases cost and hospital stay of patients. Therefore, a high index of suspicion is the key to the diagnosis of LLFTB.
LLFTB is defi ned as “TB disease found below an imaginary line traced across the hila and including the para-hilar regions on a standard posterior-anterior chest x-ray without the concomitant involvement of upper lobe.”7
Anatomically, this includes the right middle lobe and lingula, in addition to the lower lobes.
The proposed pathogenesis is the ulceration of a bronchus by a lymph node with spillage into the bronchus. Many
INTRODUCTION
An important preventable and treatable cause of death causing a major health problem worldwide is pulmonary tuberculosis (PTB). In the year 2011, there are 8.7 million new cases of TB (13% co-infected with HIV) and 1.4 million people died from TB including almost one million deaths among HIV-negative individuals and 430000 among people who were HIV-positive.1,2
PTB commonly affects upper lobe, however, lower lung fi eld cannot be ruled out easily. This often causes great confusion in the diagnosis, especially in non-resolving pneumonia. HIV/AIDS epidemic has considerably
Original Article
Abstract
Background: Pulmonary tuberculosis (PTB) in the adult may present with unusual X-ray patterns that may lead to diagnosis in the direction other than TB. When TB is confi ned to the lower lung fi elds, it often presents as pneumonia and the correct diagnosis gets delayed. Early diagnosis and treatment help in the prevention of complications and hospital stay. This 2 years prospective study was designed to study clinical profi le, outcome, and role of bronchoscopy in sputum negative cases.
Materials and Methods: All the patients of PTB with lesions below an imaginary line across the hila in the chest radiograph were included. HIV testing, sputum for acid-fast bacilli (AFB), blood sugar, and other relevant investigations were performed in each patient. The yield of bronchoscopy in bacteriologic diagnosis in sputum negative cases was noted.
Results: Out of 1811 cases of PTB patients, 42 cases had lower lung fi eld TB (LLFTB). It was more common in females 28 (66%). The majority of patients 27 (64%) were in the 16-40 years age group. Unilateral disease was more common 29 (69%) and the right side was more frequently affected 31 (73.8%). Consolidation 28 (66.6%), cavitation 9 (21.4%), and nodular opacities 5 (11.9%) were the main radiological fi ndings. Fiberoptic fl exible bronchoscopy yielded AFB in 18 (42.9%) cases.
Conclusion: Diagnosis requires a high index of suspicion. Diabetes mellitus, HIV, and lung cancer increase the risk of LLFTB. Fiberoptic fl exible bronchoscopy helps in diagnosis in sputum negative cases.
Key words: Fiberoptic fl exible bronchoscopy, HIV, Lower lung fi eld tuberculosis, Sputum negative pulmonary tuberculosis
Access this article online
www.ijss-sn.com
Month of Submission : 02-2016Month of Peer Review : 03-2016Month of Acceptance : 03-2016Month of Publishing : 04-2016
Corresponding Author: R B Parakh, Department of Medicine, SDM College of Medical Sciences and Hospital, Manjushree Nagar, Sattur, Dharwad - 580 009, Karnataka, India. E-mail: [email protected]
DOI: 10.17354/ijss/2016/178
Parakh, et al.: Diagnostic Yield of Bronchoscopy
7 International Journal of Scientifi c Study | April 2016 | Vol 4 | Issue 1
authors believe it may be a continuum of primary TB or soon after, in the post-primary phase.8
Detecting patients with active LLFTB help in giving early appropriate treatment and render these patients non-infectious. Under the World Health Organization (WHO)9 program, which implemented successfully in high burden countries including India’s Revised National TB Control Program (RNTCP),10 the diagnosis of PTB is based on sputum smear examination. Sputum microscopy is a highly specific test, a low-cost and appropriate technology and is an essential component of the directly observed treatment.
However, in patients with LLFTB sputum smears do not reveal acid-fast bacilli (AFB) in all patients. Mycobacterial cultures take at least 6-8 weeks’ time for confi rming the diagnosis and thereby a valuable time is lost. Sputum smear-negative (SSN) TB still remains a common problem faced by the clinicians. This is particularly true in the case of children, those with HIV, and diabetes patients.
Flex ib le f iberopt ic bronchoscopy (FOB) and bronchoalveolar lavage and sample for AFB staining have helped in early identifi cation with LLFTB. Since early diagnosis and treatment play an important role in the prevention of TB, therefore, a proper understanding about its clinical, radiological, and bacteriological presentations, as also the outcome of treatment is very essential.
MATERIALS AND METHODS
This study was conducted in tertiary care hospital from July 2012 to June 2014. There were a total of 1811 patients diagnosed as cases of PTB during the study period. Patients who had pulmonary, extra PTB, or both were considered as cases of PTB and included in this study. PTB was diagnosed by detailed history, clinical examination, chest radiograph, and sputum for AFB examination by Ziehl-Neelsen method and culture on LJ media. Those patients, whose sputum was negative for AFB by direct smear and by culture, were diagnosed as cases of sputum negative PTB (SSN-PTB). Defi nitive diagnosis was made by recovery of AFB in the sputum or fl exible FOB and bronchial lavage for AFB. Whenever the patient was sputum negative, FOB was done to make a defi nitive diagnosis. Informed consent was taken from all patients for the study and during the bronchoscopy procedure. After the procedure, the bronchoscope was properly checked according to guidelines for appropriate sterilization to avoid false positive cases.
An arbitrary horizontal line on chest radiograph postero-anterior view across the hila was taken as the
dividing line between upper and lower lung fi elds. A total of 42 patients had lower lung fi eld TB.
Exclusion criteria included patients with age <16 years, cases involving either ipsilateral or contralateral involvement of both upper and lower lung fi elds, pleural effusion, and thickening unless associated with parenchymal lesions in the area involved. HbA1C level, fasting and post-prandial blood sugar levels were used to diagnose diabetes. HIV testing was done according to the NACO guidelines.11 All patients were treated with short course chemotherapy according to the WHO guidelines.4
RESULTS
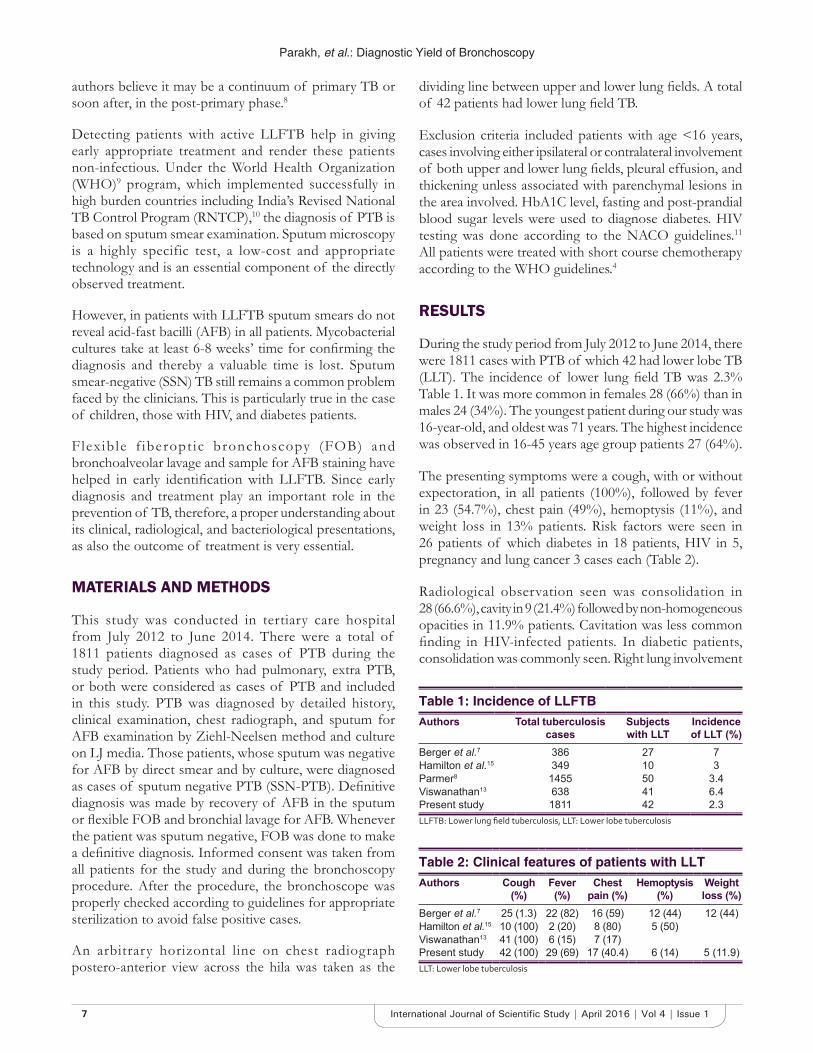
During the study period from July 2012 to June 2014, there were 1811 cases with PTB of which 42 had lower lobe TB (LLT). The incidence of lower lung fi eld TB was 2.3% Table 1. It was more common in females 28 (66%) than in males 24 (34%). The youngest patient during our study was 16-year-old, and oldest was 71 years. The highest incidence was observed in 16-45 years age group patients 27 (64%).
The presenting symptoms were a cough, with or without expectoration, in all patients (100%), followed by fever in 23 (54.7%), chest pain (49%), hemoptysis (11%), and weight loss in 13% patients. Risk factors were seen in 26 patients of which diabetes in 18 patients, HIV in 5, pregnancy and lung cancer 3 cases each (Table 2).
Radiological observation seen was consolidation in 28 (66.6%), cavity in 9 (21.4%) followed by non-homogeneous opacities in 11.9% patients. Cavitation was less common fi nding in HIV-infected patients. In diabetic patients, consolidation was commonly seen. Right lung involvement
Table 1: Incidence of LLFTBAuthors Total tuberculosis
casesSubjects with LLT
Incidence of LLT (%)
Berger et al.7 386 27 7Hamilton et al.15 349 10 3Parmer8 1455 50 3.4Viswanathan13 638 41 6.4Present study 1811 42 2.3LLFTB: Lower lung fi eld tuberculosis, LLT: Lower lobe tuberculosis
Table 2: Clinical features of patients with LLTAuthors Cough
(%)Fever (%)
Chest pain (%)
Hemoptysis (%)
Weight loss (%)
Berger et al.7 25 (1.3) 22 (82) 16 (59) 12 (44) 12 (44)Hamilton et al.15 10 (100) 2 (20) 8 (80) 5 (50)Viswanathan13 41 (100) 6 (15) 7 (17)Present study 42 (100) 29 (69) 17 (40.4) 6 (14) 5 (11.9)LLT: Lower lobe tuberculosis

Parakh, et al.: Diagnostic Yield of Bronchoscopy
8International Journal of Scientifi c Study | April 2016 | Vol 4 | Issue 1
was more frequently affected in 31 (73.8%) patients. Left lung was involved in 8 (19.1%) patients, and bilateral involvement was there in 3 (7.1%) patients. Sputum was positive for AFB in 24 (57.1%) patients. Fiberoptic fl exible bronchoscopy was used to diagnose when there was a strong suspicion of TB. Bronchoscopy washings yielded AFB in 18 (42.9%) cases.
DISCUSSION
Kidd fi rst reported the case of LLFTB in 1886. The incidence of LLFTB varies from reports from different parts of the world.12-14 It varies from 0.63%12 to 6.4%.13 In our study, we observed an incidence of 2.3%.
All studies, including our study except a few, showed female predominance.8,12 The probable explanation being that females have costal type of respiration resulting in poor ventilation of and hence higher chances of TB.13,14 In our study, the patients with LLFTB 27 (64%) were in the age group of 16-45 years. This was also found in other studies.15-17
About 5 of our patients had HIV with lower lobe TB. In HIV persons based on CDC counts presentation differs. With lower immune status, favors mid and lower lung zone TB3,4 and cavitation is less common. In a study by Purohit et al.18 had also reported mid and LLFTB in more than 50% cases. Diabetes mellitus was associated in 18 cases. Studies have shown15-17,19 higher incidence of LLFTB in diabetics.
The common symptoms were a cough (100%) followed by fever, hemoptysis, chest pain, and weight loss. This fi nding was also observed in other Indian studies.8,13,17 Weight loss was prominent in HIV patients. The right lung was more predominantly involved in 60% patients was also seen in other studies.8,13,15 The right side of the lung is more common than left due to anatomical factors. There is a higher incidence of right-sided hilar lymphadenopathy which may rupture through any bronchus and can cause lower zone infection.18
Microbiological study of sputum yielded AFB 24 (57.1%) and fl exible FOB in 18 (42.9%) cases whenever sputum was negative, and a high index of suspicion was present. Flexible FOB increases the recovery rate of AFB, and microscopic examinations of bronchoscopic specimens were found positive for AFB in 48-67%. A study by Wilcox and Wongthim showed bronchial washes increases the diagnostic yield in PTB.18,20
All the patients were treated according to the WHO Guidelines.4 Success was similar to that in classical upper lung fi eld TB. There were no deaths in our study.
CONCLUSION
LLFTB is frequently confused with the commonly seen pneumonias. TB has to be considered as one of the possible diagnosis especially in diabetics, elderly, HIV, immunocompromised and when the radiologic picture suggests unresolved lower lobe pneumonia or bronchiectasis. The early diagnosis helps in prevention of severe sequelae. Repeated and extensive investigations are necessary to look for non-resolving pneumonia and to confi rm the diagnosis in doubtful cases.
LLFTB is not uncommon fi nding in clinical practice. The absence of upper lobe involvement cannot rule out lower lobe TB and lack of symptoms, initial negative sputum smears, and culture for AFB and/or a negative initial tuberculin skin test do not entirely rule out the possibility of TB. The fl exible FOB has been a wonderful tool in obtaining secretions and tissue specimens for defi nite diagnosis but also in assessing the severity of the endobronchial lesions and as a guide for early surgical intervention. Performing FOB and subjecting the bronchoscopic secretions to conventional diagnostic methods of AFB smear, mycobacterial culture and histopathology appear to be helpful in the diagnosis of SSN-PTB. The FOB may also offer the additional advantage of the confi rmation of the diagnosis of several non-TB conditions that may mimic PTB as well.
In developed countries with no limitations on resources/diagnostic facilities, early use of FOB seems to be the best course of action in a patient with suspected SSN-PTB. Prognosis is similar to those cases involving upper lobe.
REFERENCES
1. World Health Organization. Global Tuberculosis Control. Geneva, Switzerland: WHO Report; 2011. Available from: http://www.who.int/tb/publications/global_report/gtbr12_executive summary. [Last accessed on 2016 Feb 01].
2. Dye C. Global epidemiology of tuberculosis. Lancet 2006;367:938-40.3. Elliott AM, Luo N, Tembo G, Halwiindi B, Steenbergen G, Machiels L,
et al. Impact of HIV on tuberculosis in Zambia: A cross sectional study. BMJ 1990;301:412-5.
4. WHO. Global Tuberculosis Control: Surveillance, Planning, Financing. Geneva: WHO Report;2007. p. 376. Available from: http://www.who.int/tb/publications/global_report/2007/en/index.html. [Last accessed on 2016 Feb 01].
5. Laennec RH. Treatise on the Diagnosis and Treatment of the Diseases of the Chest. New York: Hafner Publishing; 1962.
6. Kidd P. Basic tuberculosis phthisis. Lancet 1886;2:616.7. Berger HW, Granada MG. Lower lung fi eld tuberculosis. Chest
1974;65:522-6.8. Parmer MS. Lower lung fi eld tuberculosis. Am Rev Respir Dis 1967;96:310-3.9. World Health Organization. Stop TB Department. Treatment of
Tuberculosis: Guidelines for National Programmes; 3rd ed. Geneva: World Health Organization; 2003.
10. TB India 2007. RNTCP Status Report. Central TB Division, Directorate General of Health Services, Ministry of Health and Family Welfare.

Parakh, et al.: Diagnostic Yield of Bronchoscopy
9 International Journal of Scientifi c Study | April 2016 | Vol 4 | Issue 1
New Delhi: Government of India; 2007.11. National AIDS Control Organization. Specialist’s Training and Reference
Module. Lucknow: UP State AIDS Control Society; 1999. p. 67-80.12. Mathur KC, Tanwar KL, Razdan JN. Lower lung fi eld tuberculosis. Indian
J Chest Dis 1974;16:31-41.13. Viswanathan R. Tuberculosis of the lower lobe. Br Med J 1936;2:1300-2.14. Hamilton CE, Fredd H. Lower lobe tuberculosis: A review. JAMA
1935;105:427-30.15. Segarra F, Sherman DS, Rodriguez-Aguero J. lower lung fi eld tuberculosis.
Am Rev Respir Dis 1963;87:37-40.16. Chang SC, Lee PY, Perng RP. Lower lung fi eld tuberculosis. Chest
1987;91:230-2.17. Tripathy SN, Nanda CN. Lower lung fi eld tuberculosis in adults. J Assoc
Physicians India 1970;18:999-1008.18. Willcox PA, Benatar SR, Potgieter PD. Use of the fl exible fi breoptic
bronchoscope in diagnosis of sputum-negative pulmonary tuberculosis. Thorax 1982;37:598-601.
19. Purohit SD, Gupta RC, Bhatara VK. Pulmonary tuberculosis and human immunodefi ciency virus infection in Ajmer. Lung India 1996;3:113-20.
20. Wongthim S, Udompanich V, Limthongkul S, Charoenlap P, Nuchprayoon C. Fiberoptic bronchoscopy in diagnosis of patients with suspected active pulmonary tuberculosis. J Med Assoc Thai 1989;72:154-9.
How to cite this article: Parakh RB, Dhananjaya M, Meti KA. Diagnostic Yield of Bronchoscopy in Lower Lung Field Tuberculosis. Int J Sci Stud 2016;4(1):6-9.
Source of Support: Nil, Confl ict of Interest: None declared.
10International Journal of Scientifi c Study | April 2016 | Vol 4 | Issue 1
Evaluation of Palpable Breast Lumps under the Age of 35 Years with Triple AssessmentN Lingaraju1, P Narashimhaswamy2, R Murali Mohan1, N Venkatesh3
1Associate Professor, Department of Surgery, Mandya Institute of Medical Sciences, Mandya, Karnataka, India, 2Professor & Head, Department of Surgery, Mandya Institute of Medical Sciences, Mandya, Karnataka, India, 3Consultant Oncosurgeon, Mandya Institute of Medical Sciences, Mandya, Karnataka, India
its development and growth are under the control of numerous hormones.
Breast masses in young women are common and cause much anxiety. The majority of these lesions are benign. In the modern society, females as they are more educated with increased medical awareness, they are more worried about any physiological or pathological changes in the breast, which causes more psychological and emotional trauma to the patients, when the patient suspects it may be a malignancy.
A quick, reliable, non-invasive or minimally invasive means of diagnosis helps to lessen the anxiety and aids in instituting early defi nitive care. Triple assessment has been considered the best combination of tests.
INTRODUCTION
Mammary glands or breasts are a distinguishing future of mammals.1 Breast is an important feature of female anatomy and representing feminity. From puberty to death, the breast is subjected to constant physical and physiological alterations that relate to menses, pregnancy, gestation, lactation, and menopause. This is unique because
Original Article
Abstract
Introduction: Breast is an important feature of female anatomy and representing feminity. Breast complaints are one of the most common reasons for surgical consultation. A quick, reliable, non-invasive or minimally invasive means of diagnosis helps to lessen the anxiety and aids in instituting early defi nitive care. Triple assessment has been considered the best combination of tests.
Aims: To study the pattern of age, duration, and pathology, the mode of onset and clinical manifestations, and to identify - malignant disorders of palpable breast lumps using triple assessment.
Materials and Methods: It is an observational cross-sectional study conducted in Mandya Institute of Medical Sciences from March 2015 to March 2016. All female patients below 35 years presented to the surgical outpatient department (OPD) with palpable breast lumps are assessed by triple assessment.
Results: Total of 80 patients were included in the study, among which mean age of presentation is 26.62 with standard deviation of 6.09, 42 had lumps in right breast (52%), 36 patients in left breast (45%), 14 out of 80 patients had positive axilla with palpable lymph nodes. 6 out of 80 patients had signifi cant family history of breast carcinoma. The triple assessment was in favor of benign diagnosis in 41 (51.25%) patients while as the malignant diagnosis was made in 14 (17.5%) patients.
Conclusions: Triple assessment is a very useful diagnostic tool to evaluate patients with breast lumps and to detect patients with breast cancers with an overall accuracy of 99.3%. When the lumps are palpable clinically and of size more than 2 cm fi ne-needle aspiration cytology itself has a sensitivity of 100%. The triple assessment did not require hospitalization, can be performed on OPD basis, without any complications and it is the gold standard diagnostic tool for the palpable breast lumps in early detection of malignancy avoiding biopsies.
Key words: Palpable breast lump, Triple assessment, Ultrasonography of breast
Access this article online
www.ijss-sn.com
Month of Submission : 02-2016Month of Peer Review : 03-2016Month of Acceptance : 04-2016Month of Publishing : 04-2016
Corresponding Author: N Lingaraju, Department of Surgery, H.NO.704B, Doctors Quarters, Mandya Institute of Medical Sciences, Mandya - 571 401, Karnataka, India. Phone: +91-8147913484. E-mail: [email protected]
DOI: 10.17354/ijss/2016/179
Lingaraju, et al.: Palpable Breast Lumps under the Age of 35 Years
11 International Journal of Scientifi c Study | April 2016 | Vol 4 | Issue 1
The triple assessment is an evaluation of palpable breast masses by clinical breast examination (CBE), imaging and tissue sampling. Because of their mammographically dense breasts and the fear of exposing them to repeated radiation, ultrasonography (USG) is the fi rst choice imaging method in young women (<35 years) with palpable breast masses.
MATERIALS AND METHODS
It is an observational cross-sectional study conducted in Mandya Institute of Medical Sciences from March 2015 to March 2015. All female patients below 35 years presented to surgical/oncosurgery outpatient department (OPD) with palpable breast lumps are assessed taking a detailed history regarding lump, pain, nipple discharge, menstrual history, obstetric history, history of oral contraceptive pills. General physical examination done. A detailed local and systemic examination was carried out, and clinical diagnosis was made.
Patients were subjected to USG of breast and fi ne-needle aspiration cytology (FNAC)/core biopsy.
RESULTS
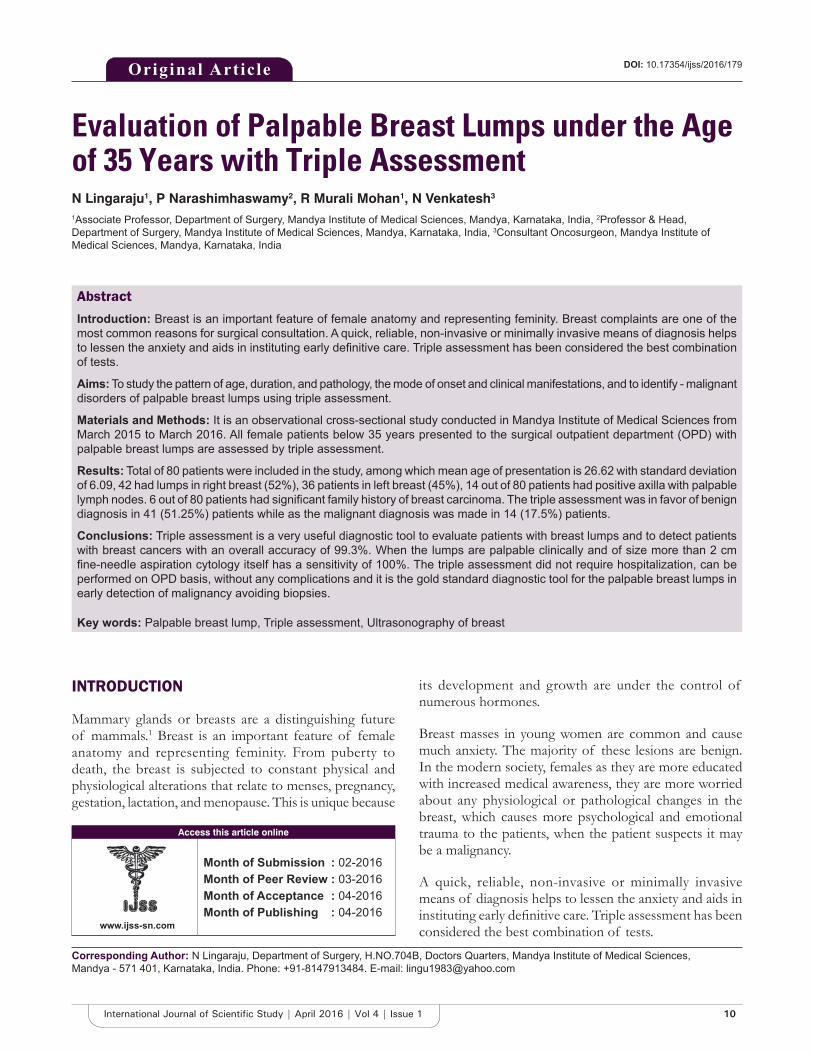
Figure 1 shows the mean age of presentation is 26.62 with a standard deviation of 6.09 with mean duration
Figure 1: Age
Figure 2: Site
Figure 3: Distribution
Figure 4: Skin changes
of complaints 3.79 months with standard deviation of 2.75 months.
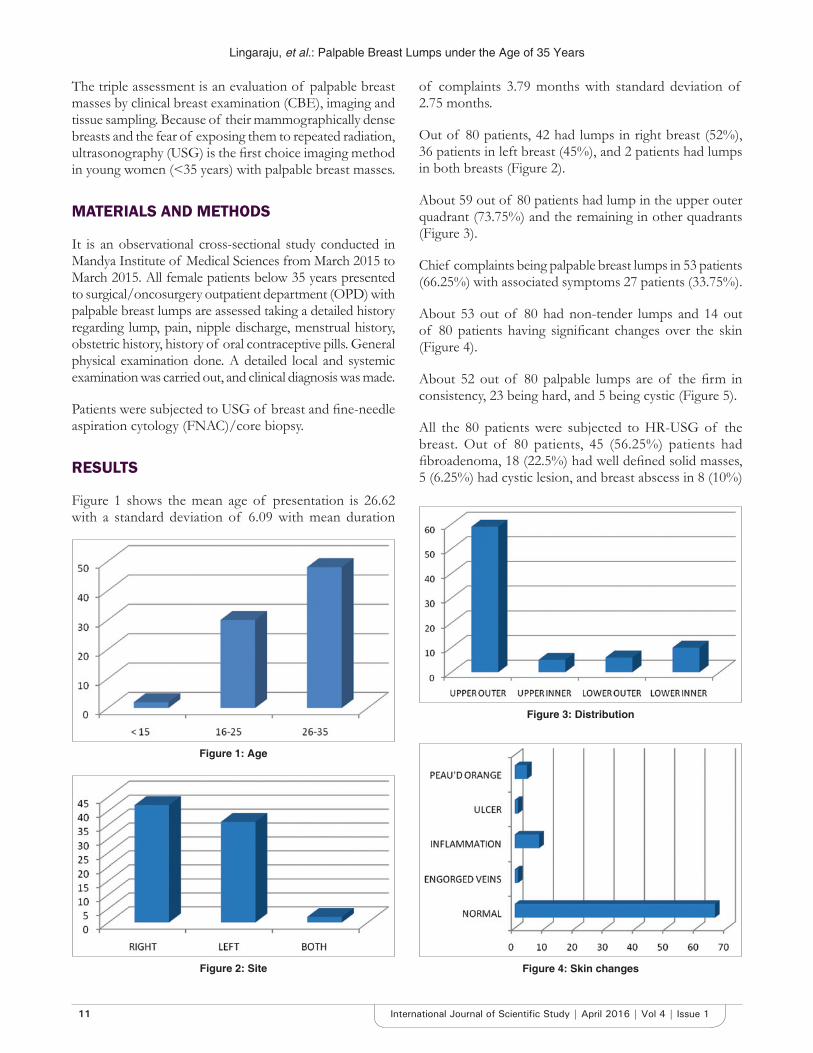
Out of 80 patients, 42 had lumps in right breast (52%), 36 patients in left breast (45%), and 2 patients had lumps in both breasts (Figure 2).
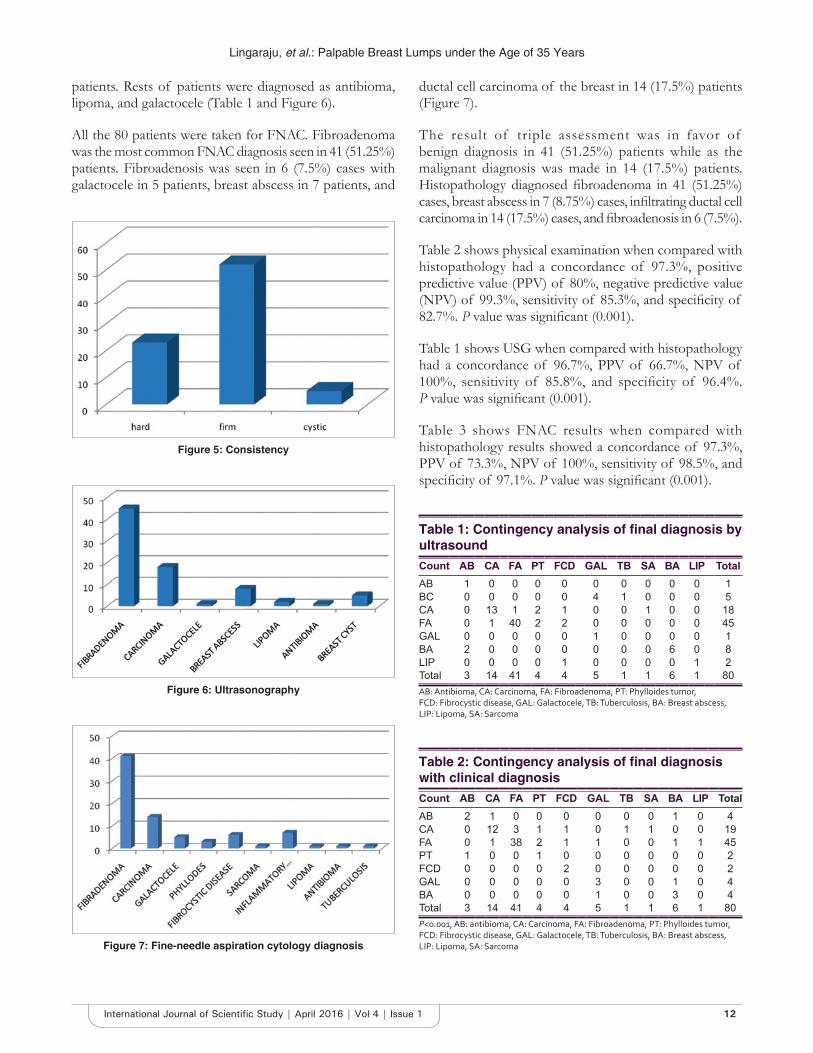
About 59 out of 80 patients had lump in the upper outer quadrant (73.75%) and the remaining in other quadrants (Figure 3).
Chief complaints being palpable breast lumps in 53 patients (66.25%) with associated symptoms 27 patients (33.75%).
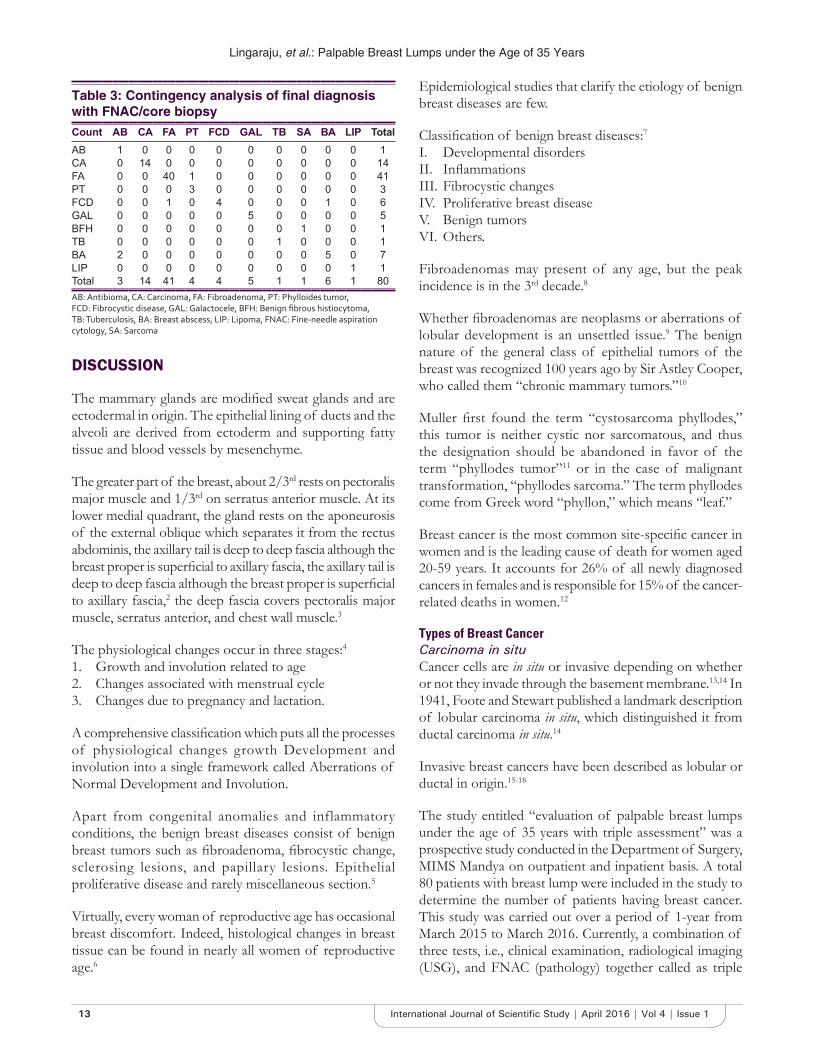
About 53 out of 80 had non-tender lumps and 14 out of 80 patients having signifi cant changes over the skin (Figure 4).
About 52 out of 80 palpable lumps are of the fi rm in consistency, 23 being hard, and 5 being cystic (Figure 5).
All the 80 patients were subjected to HR-USG of the breast. Out of 80 patients, 45 (56.25%) patients had fi broadenoma, 18 (22.5%) had well defi ned solid masses, 5 (6.25%) had cystic lesion, and breast abscess in 8 (10%)
Lingaraju, et al.: Palpable Breast Lumps under the Age of 35 Years
12International Journal of Scientifi c Study | April 2016 | Vol 4 | Issue 1
patients. Rests of patients were diagnosed as antibioma, lipoma, and galactocele (Table 1 and Figure 6).
All the 80 patients were taken for FNAC. Fibroadenoma was the most common FNAC diagnosis seen in 41 (51.25%) patients. Fibroadenosis was seen in 6 (7.5%) cases with galactocele in 5 patients, breast abscess in 7 patients, and
ductal cell carcinoma of the breast in 14 (17.5%) patients (Figure 7).
The result of triple assessment was in favor of benign diagnosis in 41 (51.25%) patients while as the malignant diagnosis was made in 14 (17.5%) patients. Histopathology diagnosed fi broadenoma in 41 (51.25%) cases, breast abscess in 7 (8.75%) cases, infi ltrating ductal cell carcinoma in 14 (17.5%) cases, and fi broadenosis in 6 (7.5%).
Table 2 shows physical examination when compared with histopathology had a concordance of 97.3%, positive predictive value (PPV) of 80%, negative predictive value (NPV) of 99.3%, sensitivity of 85.3%, and specifi city of 82.7%. P value was signifi cant (0.001).
Table 1 shows USG when compared with histopathology had a concordance of 96.7%, PPV of 66.7%, NPV of 100%, sensitivity of 85.8%, and specifi city of 96.4%. P value was signifi cant (0.001).
Table 3 shows FNAC results when compared with histopathology results showed a concordance of 97.3%, PPV of 73.3%, NPV of 100%, sensitivity of 98.5%, and specifi city of 97.1%. P value was signifi cant (0.001).
Figure 5: Consistency
Figure 6: Ultrasonography
Figure 7: Fine-needle aspiration cytology diagnosis
Table 1: Contingency analysis of fi nal diagnosis by ultrasoundCount AB CA FA PT FCD GAL TB SA BA LIP TotalAB 1 0 0 0 0 0 0 0 0 0 1BC 0 0 0 0 0 4 1 0 0 0 5CA 0 13 1 2 1 0 0 1 0 0 18FA 0 1 40 2 2 0 0 0 0 0 45GAL 0 0 0 0 0 1 0 0 0 0 1BA 2 0 0 0 0 0 0 0 6 0 8LIP 0 0 0 0 1 0 0 0 0 1 2Total 3 14 41 4 4 5 1 1 6 1 80AB: Antibioma, CA: Carcinoma, FA: Fibroadenoma, PT: Phylloides tumor, FCD: Fibrocystic disease, GAL: Galactocele, TB: Tuberculosis, BA: Breast abscess, LIP: Lipoma, SA: Sarcoma
Table 2: Contingency analysis of fi nal diagnosis with clinical diagnosisCount AB CA FA PT FCD GAL TB SA BA LIP TotalAB 2 1 0 0 0 0 0 0 1 0 4CA 0 12 3 1 1 0 1 1 0 0 19FA 0 1 38 2 1 1 0 0 1 1 45PT 1 0 0 1 0 0 0 0 0 0 2FCD 0 0 0 0 2 0 0 0 0 0 2GAL 0 0 0 0 0 3 0 0 1 0 4BA 0 0 0 0 0 1 0 0 3 0 4Total 3 14 41 4 4 5 1 1 6 1 80P<0.001, AB: antibioma, CA: Carcinoma, FA: Fibroadenoma, PT: Phylloides tumor, FCD: Fibrocystic disease, GAL: Galactocele, TB: Tuberculosis, BA: Breast abscess, LIP: Lipoma, SA: Sarcoma
Lingaraju, et al.: Palpable Breast Lumps under the Age of 35 Years
13 International Journal of Scientifi c Study | April 2016 | Vol 4 | Issue 1
DISCUSSION
The mammary glands are modifi ed sweat glands and are ectodermal in origin. The epithelial lining of ducts and the alveoli are derived from ectoderm and supporting fatty tissue and blood vessels by mesenchyme.
The greater part of the breast, about 2/3rd rests on pectoralis major muscle and 1/3rd on serratus anterior muscle. At its lower medial quadrant, the gland rests on the aponeurosis of the external oblique which separates it from the rectus abdominis, the axillary tail is deep to deep fascia although the breast proper is superfi cial to axillary fascia, the axillary tail is deep to deep fascia although the breast proper is superfi cial to axillary fascia,2 the deep fascia covers pectoralis major muscle, serratus anterior, and chest wall muscle.3
The physiological changes occur in three stages:41. Growth and involution related to age2. Changes associated with menstrual cycle3. Changes due to pregnancy and lactation.
A comprehensive classifi cation which puts all the processes of physiological changes growth Development and involution into a single framework called Aberrations of Normal Development and Involution.
Apart from congenital anomalies and inflammatory conditions, the benign breast diseases consist of benign breast tumors such as fi broadenoma, fi brocystic change, sclerosing lesions, and papillary lesions. Epithelial proliferative disease and rarely miscellaneous section.5
Virtually, every woman of reproductive age has occasional breast discomfort. Indeed, histological changes in breast tissue can be found in nearly all women of reproductive age.6
Epidemiological studies that clarify the etiology of benign breast diseases are few.
Classifi cation of benign breast diseases:7I. Developmental disordersII. Infl ammationsIII. Fibrocystic changesIV. Proliferative breast diseaseV. Benign tumorsVI. Others.
Fibroadenomas may present of any age, but the peak incidence is in the 3rd decade.8
Whether fi broadenomas are neoplasms or aberrations of lobular development is an unsettled issue.9 The benign nature of the general class of epithelial tumors of the breast was recognized 100 years ago by Sir Astley Cooper, who called them “chronic mammary tumors.”10
Muller fi rst found the term “cystosarcoma phyllodes,” this tumor is neither cystic nor sarcomatous, and thus the designation should be abandoned in favor of the term “phyllodes tumor”11 or in the case of malignant transformation, “phyllodes sarcoma.” The term phyllodes come from Greek word “phyllon,” which means “leaf.”
Breast cancer is the most common site-specifi c cancer in women and is the leading cause of death for women aged 20-59 years. It accounts for 26% of all newly diagnosed cancers in females and is responsible for 15% of the cancer-related deaths in women.12
Types of Breast Cancer Carcinoma in situCancer cells are in situ or invasive depending on whether or not they invade through the basement membrane.13,14 In 1941, Foote and Stewart published a landmark description of lobular carcinoma in situ, which distinguished it from ductal carcinoma in situ.14
Invasive breast cancers have been described as lobular or ductal in origin.15-18
The study entitled “evaluation of palpable breast lumps under the age of 35 years with triple assessment” was a prospective study conducted in the Department of Surgery, MIMS Mandya on outpatient and inpatient basis. A total 80 patients with breast lump were included in the study to determine the number of patients having breast cancer. This study was carried out over a period of 1-year from March 2015 to March 2016. Currently, a combination of three tests, i.e., clinical examination, radiological imaging (USG), and FNAC (pathology) together called as triple
Table 3: Contingency analysis of fi nal diagnosis with FNAC/core biopsyCount AB CA FA PT FCD GAL TB SA BA LIP TotalAB 1 0 0 0 0 0 0 0 0 0 1CA 0 14 0 0 0 0 0 0 0 0 14FA 0 0 40 1 0 0 0 0 0 0 41PT 0 0 0 3 0 0 0 0 0 0 3FCD 0 0 1 0 4 0 0 0 1 0 6GAL 0 0 0 0 0 5 0 0 0 0 5BFH 0 0 0 0 0 0 0 1 0 0 1TB 0 0 0 0 0 0 1 0 0 0 1BA 2 0 0 0 0 0 0 0 5 0 7LIP 0 0 0 0 0 0 0 0 0 1 1Total 3 14 41 4 4 5 1 1 6 1 80AB: Antibioma, CA: Carcinoma, FA: Fibroadenoma, PT: Phylloides tumor, FCD: Fibrocystic disease, GAL: Galactocele, BFH: Benign fi brous histiocytoma, TB: Tuberculosis, BA: Breast abscess, LIP: Lipoma, FNAC: Fine-needle aspiration cytology, SA: Sarcoma
Lingaraju, et al.: Palpable Breast Lumps under the Age of 35 Years
14International Journal of Scientifi c Study | April 2016 | Vol 4 | Issue 1
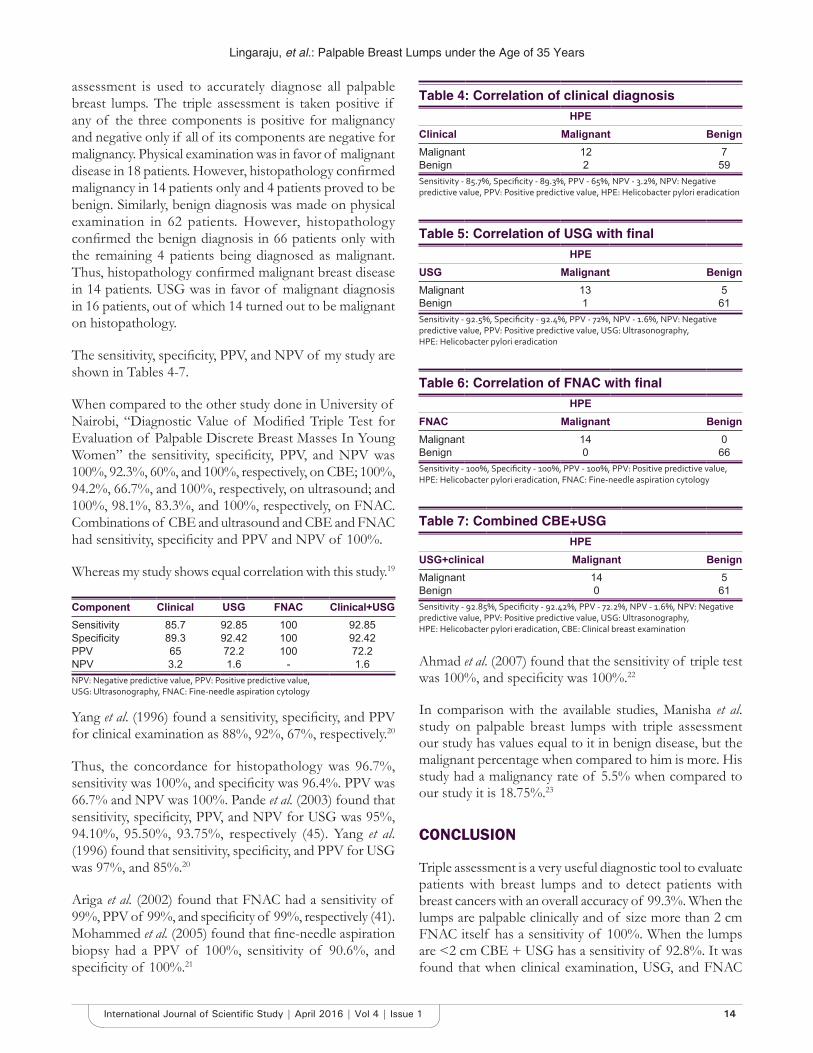
assessment is used to accurately diagnose all palpable breast lumps. The triple assessment is taken positive if any of the three components is positive for malignancy and negative only if all of its components are negative for malignancy. Physical examination was in favor of malignant disease in 18 patients. However, histopathology confi rmed malignancy in 14 patients only and 4 patients proved to be benign. Similarly, benign diagnosis was made on physical examination in 62 patients. However, histopathology confi rmed the benign diagnosis in 66 patients only with the remaining 4 patients being diagnosed as malignant. Thus, histopathology confi rmed malignant breast disease in 14 patients. USG was in favor of malignant diagnosis in 16 patients, out of which 14 turned out to be malignant on histopathology.
The sensitivity, specifi city, PPV, and NPV of my study are shown in Tables 4-7.
When compared to the other study done in University of Nairobi, “Diagnostic Value of Modifi ed Triple Test for Evaluation of Palpable Discrete Breast Masses In Young Women” the sensitivity, specifi city, PPV, and NPV was 100%, 92.3%, 60%, and 100%, respectively, on CBE; 100%, 94.2%, 66.7%, and 100%, respectively, on ultrasound; and 100%, 98.1%, 83.3%, and 100%, respectively, on FNAC. Combinations of CBE and ultrasound and CBE and FNAC had sensitivity, specifi city and PPV and NPV of 100%.
Whereas my study shows equal correlation with this study.19
Component Clinical USG FNAC Clinical+USGSensitivity 85.7 92.85 100 92.85Specifi city 89.3 92.42 100 92.42PPV 65 72.2 100 72.2NPV 3.2 1.6 - 1.6NPV: Negative predictive value, PPV: Positive predictive value, USG: Ultrasonography, FNAC: Fine-needle aspiration cytology
Yang et al. (1996) found a sensitivity, specifi city, and PPV for clinical examination as 88%, 92%, 67%, respectively.20
Thus, the concordance for histopathology was 96.7%, sensitivity was 100%, and specifi city was 96.4%. PPV was 66.7% and NPV was 100%. Pande et al. (2003) found that sensitivity, specifi city, PPV, and NPV for USG was 95%, 94.10%, 95.50%, 93.75%, respectively (45). Yang et al. (1996) found that sensitivity, specifi city, and PPV for USG was 97%, and 85%.20
Ariga et al. (2002) found that FNAC had a sensitivity of 99%, PPV of 99%, and specifi city of 99%, respectively (41). Mohammed et al. (2005) found that fi ne-needle aspiration biopsy had a PPV of 100%, sensitivity of 90.6%, and specifi city of 100%.21
Ahmad et al. (2007) found that the sensitivity of triple test was 100%, and specifi city was 100%.22
In comparison with the available studies, Manisha et al. study on palpable breast lumps with triple assessment our study has values equal to it in benign disease, but the malignant percentage when compared to him is more. His study had a malignancy rate of 5.5% when compared to our study it is 18.75%.23
CONCLUSION
Triple assessment is a very useful diagnostic tool to evaluate patients with breast lumps and to detect patients with breast cancers with an overall accuracy of 99.3%. When the lumps are palpable clinically and of size more than 2 cm FNAC itself has a sensitivity of 100%. When the lumps are <2 cm CBE + USG has a sensitivity of 92.8%. It was found that when clinical examination, USG, and FNAC
Table 4: Correlation of clinical diagnosisHPE
Clinical Malignant BenignMalignant 12 7Benign 2 59Sensitivity - 85.7%, Specifi city - 89.3%, PPV - 65%, NPV - 3.2%, NPV: Negative predictive value, PPV: Positive predictive value, HPE: Helicobacter pylori eradication
Table 5: Correlation of USG with fi nalHPE
USG Malignant BenignMalignant 13 5Benign 1 61Sensitivity - 92.5%, Specifi city - 92.4%, PPV - 72%, NPV - 1.6%, NPV: Negative predictive value, PPV: Positive predictive value, USG: Ultrasonography, HPE: Helicobacter pylori eradication
Table 6: Correlation of FNAC with fi nalHPE
FNAC Malignant BenignMalignant 14 0Benign 0 66Sensitivity - 100%, Specifi city - 100%, PPV - 100%, PPV: Positive predictive value, HPE: Helicobacter pylori eradication, FNAC: Fine-needle aspiration cytology
Table 7: Combined CBE+USGHPE
USG+clinical Malignant BenignMalignant 14 5Benign 0 61Sensitivity - 92.85%, Specifi city - 92.42%, PPV - 72.2%, NPV - 1.6%, NPV: Negative predictive value, PPV: Positive predictive value, USG: Ultrasonography, HPE: Helicobacter pylori eradication, CBE: Clinical breast examination
Lingaraju, et al.: Palpable Breast Lumps under the Age of 35 Years
15 International Journal of Scientifi c Study | April 2016 | Vol 4 | Issue 1
were all negative for malignancy in a patient with a breast lump, the patient can be safely observed, obviating the need for histology (surgical biopsies). Triple assessment did not require hospitalization, can be performed on OPD basis, without any complications and it is the gold standard diagnostic tool for the palpable breast lumps in early detection of malignancy avoiding biopsies.
REFERENCES
1. Wagner FB Jr, Martin RG Sr, Bland KI. History of the therapy of breast disease. In: Bland KI, Copeland EM 3rd, editors. The Breast: Comprehensive Management of Benign and Malignant Diseases. 2nd ed., Vol. 1. Ch. 1. Philadelphia, PA: W.B. Saunders Company; 1998. p. 1-18.
2. Romrell LJ, Bland KI. Anatomy of the breast, chest wall and related metastatic sites. In: Bland KI, Copeland EM 3rd, editors. The Breast: Comprehensive Management of Benign and Malignant Diseases. 2nd ed., Vol. 1. Ch. 2. Philadelphia, PA: W.B. Saunders Company; 1998. p. 19-37.
3. Haagensen CD, editor. Anatomy of the mammary gland. Diseases of the Breast. 2nd ed. Ch. I. Philadelphia, PA: W.B. Saunders Company; 1971. p. 1-54.
4. Haagensen CD, editor. The normal physiology of the breast. Diseases of the Breast. 2nd ed. Ch. 2. Philadelphia, PA: W.B. Saunders Company; 1971. p. 55-67.
5. Haagensen CD, editor. Nonepithelial neoplasms of the breast. Diseases of the Breast. 2nd ed. Ch. 15. Philadelphia, PA: W.B. Saunders Company; 1971. p. 292-325.
6. Sainsbury JR, Nicholson S, Needham GK, Wadehra V, Farndon JR. Natural history of the benign breast lump. Br J Surg 1988;75:1080-2.
7. Hughes LE, Mansel RE, Webster DJ. Aberrations of normal development and involution (ANDI): A new perspective on pathogenesis and nomenclature of benign breast disorders. Lancet 1987;2:1316-9.
8. Elston CW, Ellis IO. Fibroadenoma and related conditions. In: Elston CW, Ellis IO, editors. Symmer’s Systemic Pathology. 3rd ed., Vol. 13. Ch. 9. Edinburgh: Churchill Livingstone; 1998. p. 147-86.
9. Hughes LE, Mansel RE, Webster DJ. Fibroadenoma and related tumours. Benign Disorders and Diseases of the Breast Concepts and Clinical Management. London: Bailliere Tindall; 1989. p. 59-74.
10. Haagensen CD, editor. Adenofi broma of the breat. Diseases of the Breast. 2nd ed. Ch. 12. Philadelphia, PA: W.B. Saunders Company; 1971. p. 212-26.
11. Blan KI, Copeland EM 3rd. Management of Benign and Malignant Diseases. 2nd ed., Vol. I. Philadelphia, PA: W.B. Saunders Company; 1998. p. 233-46.
12. Jemal A, Siegel R, Ward E, Hao Y, Xu J, Murray T, et al. Cancer statistics, 2008. CA Cancer J Clin 2008;58:71-96.
13. Broders AC. Carcinoma in situ contrasted with benign penetrating epithelium. JAMA 1932;99:1670.
14. Foote FW, Stewart FW. Lobular carcinoma in situ: A rare form of mammary cancer. Am J Pathol 1941;17:491-6.
15. Devitt JE, Barr JR. The clinical recognition of cystic carcinoma of the breast. Surg Gynecol Obstet 1984;159:130-2.
16. Gallager HS, Martin JE. The study of mammary carcinoma by mammography and whole organ sectioning. Early observations. Cancer 1969;23:855-73.
17. Seth A, Kitching R, Landberg G, Xu J, Zubovits J, Burger AM. Gene expression profi ling of ductal carcinomas in situ and invasive breast tumors. Anticancer Res 2003;23:2043-51.
18. Simpson JF, Wilkinson EJ. Malignant neoplasia of the breast: Infi ltrating carcinomas. In: Bland KI, Copeland EM 3rd, editors. The Breast: Comprehensive Management of Benign and Malignant Diseases. Philadelphia, PA: W.B. Saunders; 1998. p. 285.
19. Ngotho J, Githaiga J, Kaisha W. Palpable discrete breast masses in young women: Two of the components of the modifi ed triple test may be adequate. S Afr J Surg 2013;51:58-60.
20. Yang WT, Mok CO, King W, Tang A, Metreweli C. Role of high frequency ultrasonography in the evaluation of palpable breast masses in Chinese women: Alternative to mammography? J Ultrasound Med 1996;15:637-44.
21. Mohammed AZ, Edino ST, Ochicha O, Alhassan SU. Value of fi ne needle aspiration biopsy in preoperative diagnosis of palpable breast lumps. In resource - Poor countries: A Nigerian experience Ann Afr Med 2005;4:19-22.
22. Ahmed I, Nazir R, Chaudhary MY, Kundi S. Triple assessment of breast lump. J Coll Physicians Surg Pak 2007;17:535-8.
23. Nigam M, Nigam B. Triple assessment of breast - Gold standard in mass screening for breast cancer diagnosis. IOSR J Dent Med Sci 2013;7:1-7.
How to cite this article: Lingaraju N, Narashimhaswamy P, Mohan RM, Venkatesh N. Evaluation of Palpable Breast Lumps under the Age of 35 Years with Triple Assessment. Int J Sci Stud 2016;4(1):10-15.
Source of Support: Nil, Confl ict of Interest: None declared.

16International Journal of Scientifi c Study | April 2016 | Vol 4 | Issue 1
Hepatitis B- and Hepatitis C-infected Cases and Their Correlation with Liver Function Test in Teerthanker Mahaveer Medical College & Research Centre, Moradabad, Uttar Pradesh IndiaKomal Singh1, Umar Farooq2, Sudhir Singh3, Amit Kumar Bharti1, Navdeep Kaur1, Mohd Shariq1
1PG Student, Department of Microbiology, Teerthanker Mahaveer Medical College & Research Centre, Moradabad, Uttar Pradesh, India, 2Professor and Head, Department of Microbiology, Teerthanker Mahaveer Medical College & Research Centre, Moradabad, Uttar Pradesh, India, 3Assistant Professor, Department of Microbiology, Teerthanker Mahaveer Medical College & Research Centre, Moradabad, Uttar Pradesh, India
worldwide chronic liver infection, approximately 300 million cases are infected with HBV and 50-70% of which end up with chronic liver disease.1 In worldwide, approximately 350 million people are infected with HBV and about 170 million people infected with HCV.2 The leading cases of hepatocellular carcinoma, liver pathologies, with a very broad clinical spectrum ranging from asymptomatic carrier state to cirrhosis are HBV and HCV.3
HBV is a member of Hepadnaviridae family, which is characterized by the presence of partially double-stranded
INTRODUCTION
In India, the etiological role of acute Hepatitis B virus (HBV) and Hepatitis C virus (HCV) is endemic,
Original Article
Abstract
Introduction: Hepatitis B and Hepatitis C are the major cause of infl ammation of the liver. Hepatitis B virus (HBV) belongs to the Hepadnaviridae family and has a circular, partially double-stranded DNA. HBV and Hepatitis C virus (HCV) are the most common cause of chronic liver diseases worldwide.
Materials and Method: It is a type of prospective study, and it was conducted in the Department of Microbiology. Among the patients suffering from HBV and HCV who visited Teerthanker Mahaveer Medical College and Hospital, Moradabad, from March 2015 to January 2016 after obtaining written and informed consent from each patient.
Result: In our study, the total number of 250 cases of Hepatitis B and Hepatitis C were taken. Out of them, the number of positive cases was 172 and negative cases was 78. In our study, among positive and negative cases of hepatitis, the male cases were 134 (53.60%) and 46 (58.97%), respectively, and the female cases were 116 (46.40%) and 32 (41.02%). According to this study, the mean total bilirubin levels of HBV, HCV, and both HBV and HCV were 3.50 ± 5.78, 3.32 ± 13.76, and 1.35 ± 0.75, respectively. The mean serum glutamic-pyruvic transaminase levels were 155.07 ± 192 in HBV, 103.71 ± 178.58 in HCV, and 117.50 ± 43.60 in both HBV and HCV. The mean serum glutamic-oxaloacetic transaminase levels of HBV, HCV, and both HBV and HCV were 332.85 ± 654.82, 119.40 ± 202.48, and 37.50 ± 49.80, respectively. The mean alanine phosphatase and total protein increased levels were found in patients of HBV (121.85 ± 99.72) and both HBV and HCV infection, respectively.
Conclusion: In our country, HBV and HCV are the common causes of liver dysfunction. According to our study, HBV is the major causative agent of liver dysfunction, followed by HCV. Therefore, all the patients of hepatitis must undergo screening of liver function tests.
Key words: Hepatitis B, Hepatitis C, Liver function tests
Access this article online
www.ijss-sn.com
Month of Submission : 02-2016Month of Peer Review : 03-2016Month of Acceptance : 04-2016Month of Publishing : 04-2016
Corresponding Author: Komal Singh, Department of Microbiology, Teerthanker Mahaveer Medical College & Research Centre, Moradabad, Uttar Pradesh, India. Phone: +91-9917413921. E-mail: [email protected]
DOI: 10.17354/ijss/2016/180
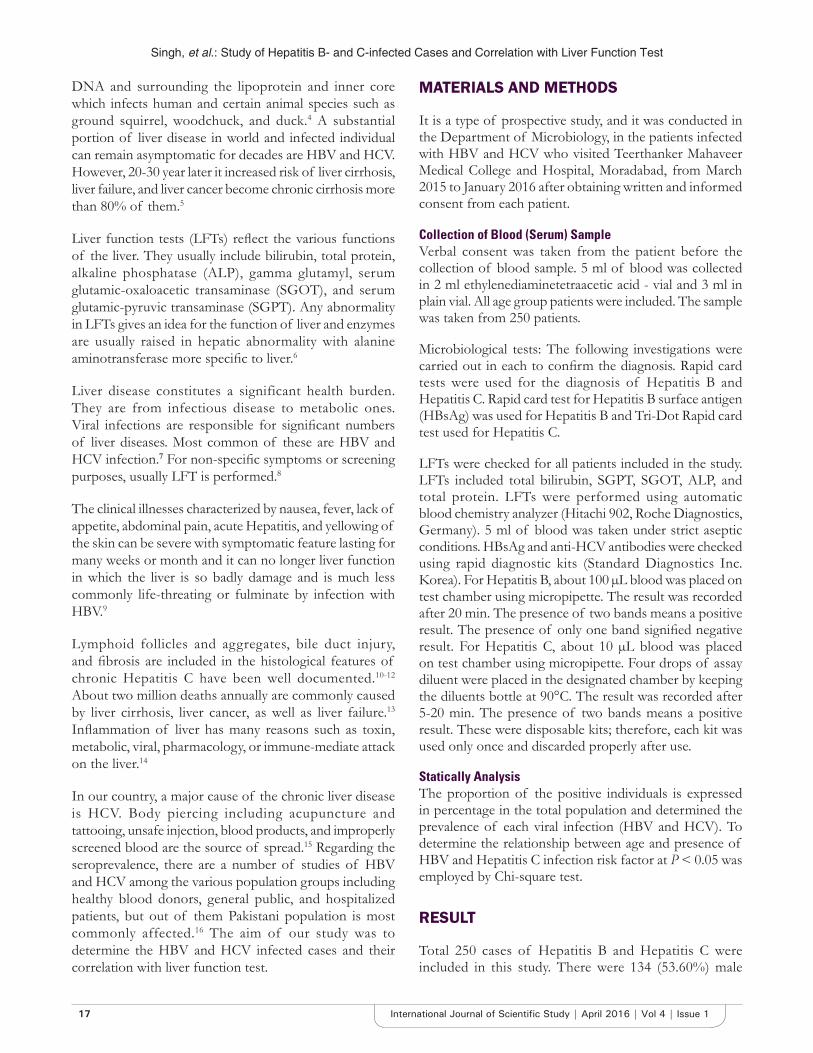
Singh, et al.: Study of Hepatitis B- and C-infected Cases and Correlation with Liver Function Test
17 International Journal of Scientifi c Study | April 2016 | Vol 4 | Issue 1
DNA and surrounding the lipoprotein and inner core which infects human and certain animal species such as ground squirrel, woodchuck, and duck.4 A substantial portion of liver disease in world and infected individual can remain asymptomatic for decades are HBV and HCV. However, 20-30 year later it increased risk of liver cirrhosis, liver failure, and liver cancer become chronic cirrhosis more than 80% of them.5
Liver function tests (LFTs) refl ect the various functions of the liver. They usually include bilirubin, total protein, alkaline phosphatase (ALP), gamma glutamyl, serum glutamic-oxaloacetic transaminase (SGOT), and serum glutamic-pyruvic transaminase (SGPT). Any abnormality in LFTs gives an idea for the function of liver and enzymes are usually raised in hepatic abnormality with alanine aminotransferase more specifi c to liver.6
Liver disease constitutes a significant health burden. They are from infectious disease to metabolic ones. Viral infections are responsible for signifi cant numbers of liver diseases. Most common of these are HBV and HCV infection.7 For non-specifi c symptoms or screening purposes, usually LFT is performed.8
The clinical illnesses characterized by nausea, fever, lack of appetite, abdominal pain, acute Hepatitis, and yellowing of the skin can be severe with symptomatic feature lasting for many weeks or month and it can no longer liver function in which the liver is so badly damage and is much less commonly life-threating or fulminate by infection with HBV.9
Lymphoid follicles and aggregates, bile duct injury, and fi brosis are included in the histological features of chronic Hepatitis C have been well documented.10-12 About two million deaths annually are commonly caused by liver cirrhosis, liver cancer, as well as liver failure.13 Infl ammation of liver has many reasons such as toxin, metabolic, viral, pharmacology, or immune-mediate attack on the liver.14
In our country, a major cause of the chronic liver disease is HCV. Body piercing including acupuncture and tattooing, unsafe injection, blood products, and improperly screened blood are the source of spread.15 Regarding the seroprevalence, there are a number of studies of HBV and HCV among the various population groups including healthy blood donors, general public, and hospitalized patients, but out of them Pakistani population is most commonly affected.16 The aim of our study was to determine the HBV and HCV infected cases and their correlation with liver function test.
MATERIALS AND METHODS
It is a type of prospective study, and it was conducted in the Department of Microbiology, in the patients infected with HBV and HCV who visited Teerthanker Mahaveer Medical College and Hospital, Moradabad, from March 2015 to January 2016 after obtaining written and informed consent from each patient.
Collection of Blood (Serum) SampleVerbal consent was taken from the patient before the collection of blood sample. 5 ml of blood was collected in 2 ml ethylenediaminetetraacetic acid - vial and 3 ml in plain vial. All age group patients were included. The sample was taken from 250 patients.
Microbiological tests: The following investigations were carried out in each to confi rm the diagnosis. Rapid card tests were used for the diagnosis of Hepatitis B and Hepatitis C. Rapid card test for Hepatitis B surface antigen (HBsAg) was used for Hepatitis B and Tri-Dot Rapid card test used for Hepatitis C.
LFTs were checked for all patients included in the study. LFTs included total bilirubin, SGPT, SGOT, ALP, and total protein. LFTs were performed using automatic blood chemistry analyzer (Hitachi 902, Roche Diagnostics, Germany). 5 ml of blood was taken under strict aseptic conditions. HBsAg and anti-HCV antibodies were checked using rapid diagnostic kits (Standard Diagnostics Inc. Korea). For Hepatitis B, about 100 μL blood was placed on test chamber using micropipette. The result was recorded after 20 min. The presence of two bands means a positive result. The presence of only one band signifi ed negative result. For Hepatitis C, about 10 μL blood was placed on test chamber using micropipette. Four drops of assay diluent were placed in the designated chamber by keeping the diluents bottle at 90°C. The result was recorded after 5-20 min. The presence of two bands means a positive result. These were disposable kits; therefore, each kit was used only once and discarded properly after use.
Statically AnalysisThe proportion of the positive individuals is expressed in percentage in the total population and determined the prevalence of each viral infection (HBV and HCV). To determine the relationship between age and presence of HBV and Hepatitis C infection risk factor at P < 0.05 was employed by Chi-square test.
RESULT
Total 250 cases of Hepatitis B and Hepatitis C were included in this study. There were 134 (53.60%) male
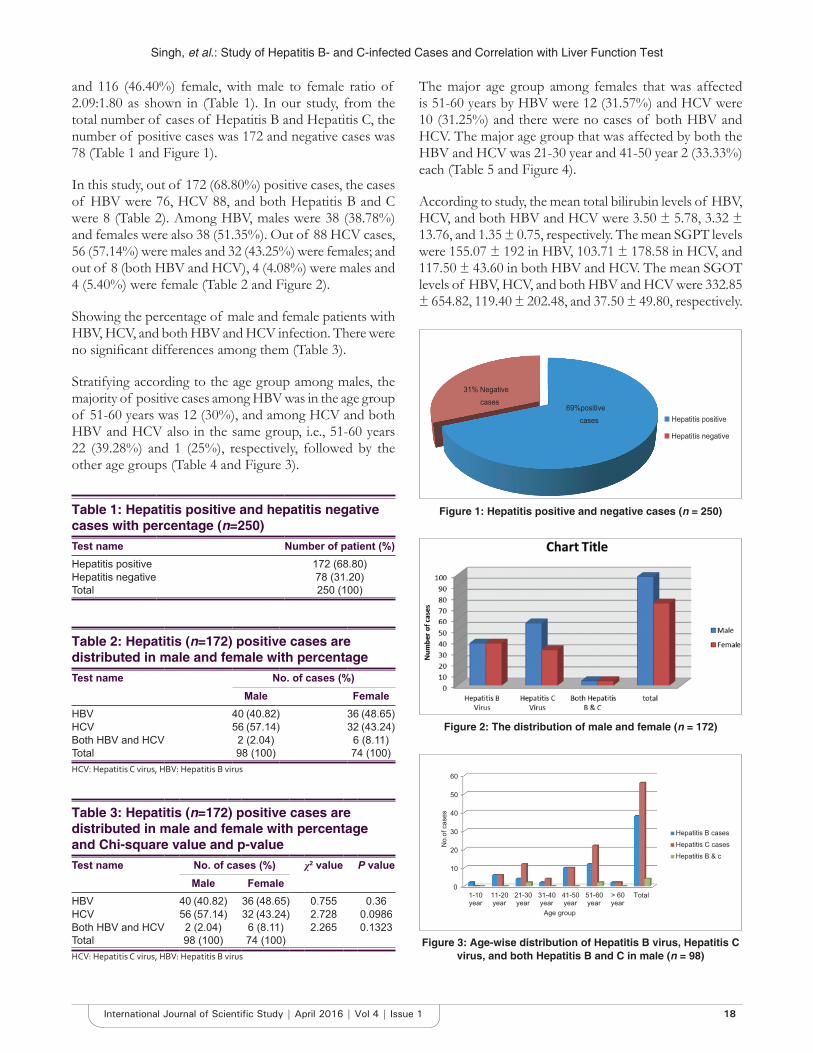
Singh, et al.: Study of Hepatitis B- and C-infected Cases and Correlation with Liver Function Test
18International Journal of Scientifi c Study | April 2016 | Vol 4 | Issue 1
and 116 (46.40%) female, with male to female ratio of 2.09:1.80 as shown in (Table 1). In our study, from the total number of cases of Hepatitis B and Hepatitis C, the number of positive cases was 172 and negative cases was 78 (Table 1 and Figure 1).
In this study, out of 172 (68.80%) positive cases, the cases of HBV were 76, HCV 88, and both Hepatitis B and C were 8 (Table 2). Among HBV, males were 38 (38.78%) and females were also 38 (51.35%). Out of 88 HCV cases, 56 (57.14%) were males and 32 (43.25%) were females; and out of 8 (both HBV and HCV), 4 (4.08%) were males and 4 (5.40%) were female (Table 2 and Figure 2).
Showing the percentage of male and female patients with HBV, HCV, and both HBV and HCV infection. There were no signifi cant differences among them (Table 3).
Stratifying according to the age group among males, the majority of positive cases among HBV was in the age group of 51-60 years was 12 (30%), and among HCV and both HBV and HCV also in the same group, i.e., 51-60 years 22 (39.28%) and 1 (25%), respectively, followed by the other age groups (Table 4 and Figure 3).
The major age group among females that was affected is 51-60 years by HBV were 12 (31.57%) and HCV were 10 (31.25%) and there were no cases of both HBV and HCV. The major age group that was affected by both the HBV and HCV was 21-30 year and 41-50 year 2 (33.33%) each (Table 5 and Figure 4).
According to study, the mean total bilirubin levels of HBV, HCV, and both HBV and HCV were 3.50 ± 5.78, 3.32 ± 13.76, and 1.35 ± 0.75, respectively. The mean SGPT levels were 155.07 ± 192 in HBV, 103.71 ± 178.58 in HCV, and 117.50 ± 43.60 in both HBV and HCV. The mean SGOT levels of HBV, HCV, and both HBV and HCV were 332.85 ± 654.82, 119.40 ± 202.48, and 37.50 ± 49.80, respectively.
Table 1: Hepatitis positive and hepatitis negative cases with percentage (n=250)Test name Number of patient (%)Hepatitis positive 172 (68.80)Hepatitis negative 78 (31.20)Total 250 (100)
Table 2: Hepatitis (n=172) positive cases are distributed in male and female with percentageTest name No. of cases (%)
Male FemaleHBV 40 (40.82) 36 (48.65)HCV 56 (57.14) 32 (43.24)Both HBV and HCV 2 (2.04) 6 (8.11)Total 98 (100) 74 (100)HCV: Hepatitis C virus, HBV: Hepatitis B virus
Table 3: Hepatitis (n=172) positive cases are distributed in male and female with percentage and Chi-square value and p-valueTest name No. of cases (%) χ2 value P value
Male FemaleHBV 40 (40.82) 36 (48.65) 0.755 0.36HCV 56 (57.14) 32 (43.24) 2.728 0.0986Both HBV and HCV 2 (2.04) 6 (8.11) 2.265 0.1323Total 98 (100) 74 (100)HCV: Hepatitis C virus, HBV: Hepatitis B virus
69%positive cases
31% Negative cases
Hepatitis positive
Hepatitis negative
Figure 1: Hepatitis positive and negative cases (n = 250)
Figure 2: The distribution of male and female (n = 172)
0
10
20
30
40
50
60
1-10year
11-20year
21-30year
31-40year
41-50year
51-60year
> 60year
Total
No.
of c
ases
Age group
Hepatitis B casesHepatitis C casesHepatitis B & c
Figure 3: Age-wise distribution of Hepatitis B virus, Hepatitis C virus, and both Hepatitis B and C in male (n = 98)

Singh, et al.: Study of Hepatitis B- and C-infected Cases and Correlation with Liver Function Test
19 International Journal of Scientifi c Study | April 2016 | Vol 4 | Issue 1
The mean ALP and total protein increased levels were found in patients with HBV (121.85 ± 99.72) and both HBV and HCV infection, respectively (Table 6; Figure 5).
The values of LFTs in Hepatitis B, Hepatitis C, and both Hepatitis B and C, male and female patients were given in Tables 7 and 8, respectively. The Tables 8 and 9 present the mean value of the given test in Hepatitis B and Hepatitis C patients.
DISCUSSION
In this study, HCV-infected male was more than the female patient. Our study is similar to the study of Adoga et al.17 Many diseases are caused by liver dysfunction, mostly HBV
Table 7: The mean value of biochemical parameter in male’s Hepatitis B and Hepatitis C patient (n=98)Parameters Group hepatitis patients Normal
valueHepatitis B (n=40)
Hepatitis C (n=56)
Both B and C (n=2)
Total bilirubin 3.50 3.32 1.35 0.2-1.0 mg/dlSGPT 155.07 103.71 117.5 5-45 mg/dlSGOT 332.85 119.40 37.50 5-40 mg/dlALP 121.85 116.42 83.0 20-140 IU/lTotal protein 12.38 9.93 36.25 6.0-8.3 mg/dlALP: Alkaline phosphatase, SGOT: Serum glutamic-oxaloacetic transaminase, SGPT: Serum glutamic-pyruvic transaminase
Table 8: The mean value of biochemical parameter in females Hepatitis B and Hepatitis C patients (n=74)Parameter Group hepatitis patients Normal
valueHepatitis B (n=36)
Hepatitis C (n=32)
Both B and C (n=6)
Total bilirubin 2.05 2.39 1.11 0.2-1.0 mg/dlSGPT 112.92 116.13 63.33 5-45 g/dlSGOT 126.42 122.45 68.35 5-40 mg/dlALP 135.14 111.0 101.67 20-140 IU/LTotal protein 6.26 9.11 8.88 6.0-8.3 g/dlALP: Alkaline phosphatase, SGOT: Serum glutamic-oxaloacetic transaminase, SGPT: Serum glutamic-pyruvic transaminase
Table 4: Age-wise distributions of Hepatitis B and C in male with percentage (n=98)Age of patients
HBV (%) HCV (%) Both HBV and HCV (%)
Total
1-10 4 (10) 0 (0) 0 (0) 411-20 6 (15) 6 (10.71) 0 (0) 1221-30 4 (10) 12 (21.42) 1 (25) 1731-40 2 (5) 4 (7.14) 0 (0) 641-50 10 (25) 10 (17.85) 0 (0) 2051-60 12 (30) 22 (39.28) 1 (25) 35>60 2 (5) 2 (3.57) 0 (0) 4Total 40 56 2 98HCV: Hepatitis C virus, HBV: Hepatitis B virus
Table 5: Age-wise distributions of HBV, HCV, and both HBV and HCV in female (n=74 cases) with percentageAge of patients
HBV (%) HCV (%) Both HBV and HCV (%)
Total
1-10 1 (2.63) 0 (0) 0 (0) 111-20 5 (15.79) 4 (12.5) 0 (0) 921-30 7 (21.05) 8 (25) 2 (33.33) 1731-40 4 (10.53) 2 (6.25) 0 (0) 641-50 5 (13.15) 6 (18.75) 2 (33.33) 1351-60 12 (31.57) 10 (31.25) 2 (33.33) 24+61 2 (5.26) 2 (6.25) 0 (0) 4Total 36 32 6 74HCV: Hepatitis C virus, HBV: Hepatitis B virus
Table 6: The mean value of biochemical parameter hepatitis correlation with liver function test (n=172)Parameters Group of hepatitis positive patients Normal
valueHepatitis B (n=40)
Hepatitis C (n=56)
Both B and C (n=2)
Total bilirubin 3.50 3.32 1.35 0.2-1.0 mg/dlSGPT 155.07 103.71 117.50 5-45 g/dlSGOT 332.85 119.40 37.50 5-40 g/dlALP 121.85 116.42 83.0 20-140 IU/lTotal protein 12.38 9.93 36.25 6.0-8.3 g/dlALP: Alkaline phosphatase, SGOT: Serum glutamic-oxaloacetic transaminase, SGPT: Serum glutamic-pyruvic transaminase
0
5
10
15
20
25
30
35
40
No.
of c
ases
Age groups
HBV cases
HCV cases
Both B& c
Figure 4: Age-wise distribution of Hepatitis B virus, Hepatitis C virus, and Both Hepatitis B and C virus in female (n = 74)
0
50
100
150
200
250
300
350
Totalbilirubin
SGPT SGOT ALP Total protein
HBV
HCV
Bth B & C
Normal value
Figure 5: Biochemical parameters mean value correlation with liver function test of infected Hepatitis positive
patients (n = 172)

Singh, et al.: Study of Hepatitis B- and C-infected Cases and Correlation with Liver Function Test
20International Journal of Scientifi c Study | April 2016 | Vol 4 | Issue 1
and HCV are the viruses that cause viral infection in the liver. HBV and HCV are the viruses among hepatitis viruses causes viral infection of the liver, it accounts for signifi cant amount of liver disease especially in South Asia.2
Hepatitis B and C infections are prevalent in different parts of the world from region to region and from one population to another in a country or region (Zali et al., 1996).18 According to our study, the prevalence among the patients HBV, HCV, and both HBV and HCV were 76 (41.18%), 88 (57.16%), and 8 (4.65%), respectively. Our study is comparable with the study of the Khan et al.19 According to that study, HBV, HCV, and both HBV and HCV were 75%, 23%, and 2%, respectively.
According to the gender, our study shows that among HBV, males were 38% and females were 51.35%, among HCV males were 57.14% and females were 43.25% while among both HBV and HCV males and females were 4.08% and 5.04%, respectively, which is comparable to the study of Tungtrongchitr et al.20 The major age group among male and female which caused by HBV, HCV, and both HBV and HCV were same that is 51-60 year and our study is comparable with the study of Zainal et al.21
In our study, all the biochemical parameters are highest among the HBV except total protein that is highest among both HBV and HCV patients, which is comparable with the study of Anjum et al.6
CONCLUSION
In our country, HBV and HCV are a common causative agent of dysfunction of liver. According to our study, HBV is the major causative agent of liver dysfunction, followed by HCV. Among Hepatitis patients, SGPT and SGOT are the LFTs, which are raised. Therefore, all the patients of Hepatitis must undergo screening of LFTs.
REFERENCES
1. Devi KS, Singh NB, Mara J. Seroprevalence of Hepatitis B virus and Hepatitis C virus among hepatic disorders and injecting drug users in
Manipur - A preliminary report. Indian J Med Microbiol 2004;22:136-7.2. Liu Z, Hou J. Hepatitis B virus (HBV) and Hepatitis C virus (HCV) dual
infection. Int J Med Sci 2006;3:57-62.3. Zhu R, Zhang HP, Yu H, Li H, ling YQ, Hu XQ, et al. Hepatitis B virus
mutations associated with in situ expression of Hepatitis B core antigen, viral load and prognosis in chronic Hepatitis B patients. Pathol Res Pract 2008;204:731-42.
4. Berenguer M, Wright TL. Viral Hepatitis. In: Sleisenger MH, Fortran JS, editors. Gastrointestinal and Liver Disease, Pathophysiology/Diagnosis/Management. 7th ed., Vol. 2. Philadelphia, PA: Saunders; 2002. p. 1285-9.
5. Volf V, Marx D, Pliskova L, Sümegh L, Celko A. A survey of Hepatitis B and C prevalence amongst the homeless community of Prague. Eur J Public Health 2008;18:44-7.
6. Limdi JK, Hyde GM. Evaluation of abnormal liver function tests. Postgrad Med J 2003;79:307-12.
7. Khattak A, Nawaz H, Khan J, Khan H. Frequency of Hepatitis B and C on screening in. Dera Ismail, Khan. Gomal J Med Sci 2012;10:84-6.
8. Radcke S, Dillon JF, Murray AL. A systematic review of the prevalence of mildly abnormal liver function tests and associated health outcomes. Eur J Gastroenterol Herpetol 2015;27:1-7.
9. Webster GJ, Reignal S, Maini MK, Whalley SA, Ogg GS, King A, et al. Incubation phase of acute Hepatitis B in man: Dynamic of cellular immune mechanisms. Hepatology 2000;32:1117-24.
10. Jármay K, Karácsony G, Ozsvár Z, Nagy I, Lonovics J, Schaff Z. Assessment of histological features in chronic Hepatitis C. Hepatogastroenterology 2002;49:239-43.
11. Scheuer PJ, Ashrafzadeh P, Sherlock S, Brown D, Dusheiko GM. The pathology of Hepatitis C. Hepatology 1992;15:567-71.
12. Hahm KB, Chon CY, Kim WH, Han KH, Chung JB, Lee SI, et al. Histologic study of chronic active Hepatitis C; Comparison with chronic active Hepatitis B. Korean J Intern Med 1992;7:102-10.
13. Clements CJ, Kane M, Hu DJ, Kim-Farley R. Hepatitis B vaccine joins the fi ght against pandemic disease. World Health Forum 1990;11:165-8.
14. Ansreole TE, Binjamin IJ, Griggs RC, Wing EJ. Andreoli and carpenter’s cecli essential of medicine. In: Kochar R, Sheikh MA, Fallon BM. Acute and Chronic Hepatitis. China: Saunders; 2010. p. 466.
15. Khokhar N. Menagement of chronic Hepatitis C. J Rawalpindi Med Coll 2001;5:104-6.
16. Khattak MN, Akhtar S, Mahmud S, Roshan TM. Factors infl uencing Hepatitis C virus sero-prevalence among blood donors in North West Pakistan. J Public Health Policy 2008;29:207-25.
17. Adoga MP, Gyar SD, Pechulano S, Bashayi OD, Emiasegen SE, Zungwe T, et al. Hepatitis B virus infections in apparently healthy urban Nigerians: Data from pre-vaccination tests. J Infect Dev Ctries 2010;4:397-400.
18. Zali R, Mohammad K, Farhadi A. Epidemiology of Hepatitis B in the Islamic Republic of Iran. East Mediterr Health J 1996;2:290-8.
19. Khan ZA, Shafi q M, Shahab F. Frequeay and risk factors of Hepatitis B & C in afghan patient presenting to tertiary care hospital in Peshawar. Pak Armed Forases Med J 2015;65:686-9.
20. Tungtrongchitr R, Treeprasertsuk S, Ei NN, Thepouyporn A, Phonrat B, Huntrup A. Serum leptin concentrations in chronic Hepatitis. J Med Assoc Thai 2006;89:490-9.
21. Koulentaki M, Ergazaki M, Moschandrea J, Spanoudakis S, Tzagarakis N, Drandakis PE, et al. Prevalence of Hepatitis B and C markers in high-risk hospitalised patients in Crete: A fi ve-year observational study. BMC Public Health 2001;1:17.
How to cite this article: Singh K, Farooq U, Singh S, Bharti AK, Kaur N, Shariq M. Hepatitis B- and Hepatitis C-infected Cases and Their Correlation with Liver Function Test in Teerthanker Mahaveer Medical College & Research Centre, Moradabad, Uttar Pradesh India. Int J Sci Stud 2016;4(1):16-20.
Source of Support: Nil, Confl ict of Interest: None declared.
21 International Journal of Scientifi c Study | April 2016 | Vol 4 | Issue 1
Correlation between Deviated Nasal Septum and Sinusitis: A Clinical and Histopathological StudyMani Arora1, Sadakat Ali2, A K Choudhary3, K Suchit3, Chetan Bansal4
1Associate Professor, Department of Anatomy, Sheikh-Ul-Hind Mahmood Mahmood Hasan Medical College, Saharanpur, Uttar Pradesh, India, 2Associate Professor, Department of Anatomy, Shri Guru Ram Rai Institute of Medical & Health Sciences, Dehradun, Uttarakhand, India, 3Assistant Professor, Department of Anatomy, Shri Guru Ram Rai Institute of Medical & Health Sciences, Dehradun, Uttarakhand, India, 4Assistant Professor, Department of ENT, Shri Guru Ram Rai Institute of Medical & Health Sciences, Dehradun, Uttarakhand, India
Severe obstruction may block these openings triggering chronic sinusitis. Tocík3 evaluated the relationship between deviation of the nasal septum and diseases of the paranasal sinuses. Aust et al.4 stated that if ostium size is <2.5 mm, it predisposes to the development of disease. Smith and Cable5 assessed maxillary antral mucosa in chronic sinusitis patients.
In our present study, we tried to analyze the role of deviated nasal septum in sinus pathology in patients.
MATERIALS AND METHODS
The present study was conducted in the Departments of Anatomy and E.N.T. at Himalayan Institute of Medical Sciences Dehradun and Shri Guru Ram Rai Institute of Medical and Health Sciences Dehradun. The study was divided into two groups (15 each).
Group - A (Control): It comprised of 15 patients with a midline nasal septum, with symptoms of rhinosinusitis.
INTRODUCTION
The nasal septum divides nasal cavity into the left and right halves both anatomically and physiologically. It is an accepted fact that some amount of deviation of nasal septum is common and having a perfectly straight septum is a rarity.1 Various reasons have been attributed to the occurrence of deviated nasal septum including racial factors, birth molding of septum during parturition trauma and developmental deformities of septum.2 Deviated nasal septum may cause nasal obstruction and symptoms of rhinosinusitis. Normally paranasal air sinuses drain the mucous and fl uid into the nose through various openings.
Abstract
Introduction: Deviated nasal septum is a frequently occurring condition which alters the normal air fl ow pattern making it turbulent, producing a nasal obstruction in an individual. It may result in permanent changes in the nasal and sinus mucosa. This study makes an attempt to evaluate the deviated nasal septum and associated sinus pathology.
Materials and Methods: Study was done in 30 patients of rhino-sinusitis, divided into 2 groups - control and study group of 15 each. Patients were then assessed clinically by using various parameters such as Patency test, Rhinoscopy, Nasal diagnostic endoscopy, X-ray peripheral nervous system, and computed tomography scan. Histopathological examination of mucosal biopsies from maxillary sinus of patients was also done.
Results: Incidences of symptoms and signs of acute and chronic infl ammation of nasal and sinus mucosa were high in the study group.
Conclusion: Our study shows that most common anatomical variant associated with chronic infl ammation of sinuses is deviated nasal septum.
Key words: Deviated nasal septum, Maxillary sinus, Sinusitis
Access this article online
www.ijss-sn.com
Month of Submission : 02-2016Month of Peer Review : 03-2016Month of Acceptance : 04-2016Month of Publishing : 04-2016
Corresponding Author: Sadakat Ali, Department of Anatomy, Shri Guru Ram Rai Institute of Medical & Health Sciences, Dehradun, Uttarakhand, India. Phone: +91-9634333944. E-mail: [email protected]
DOI: 10.17354/ijss/2016/181Original Article
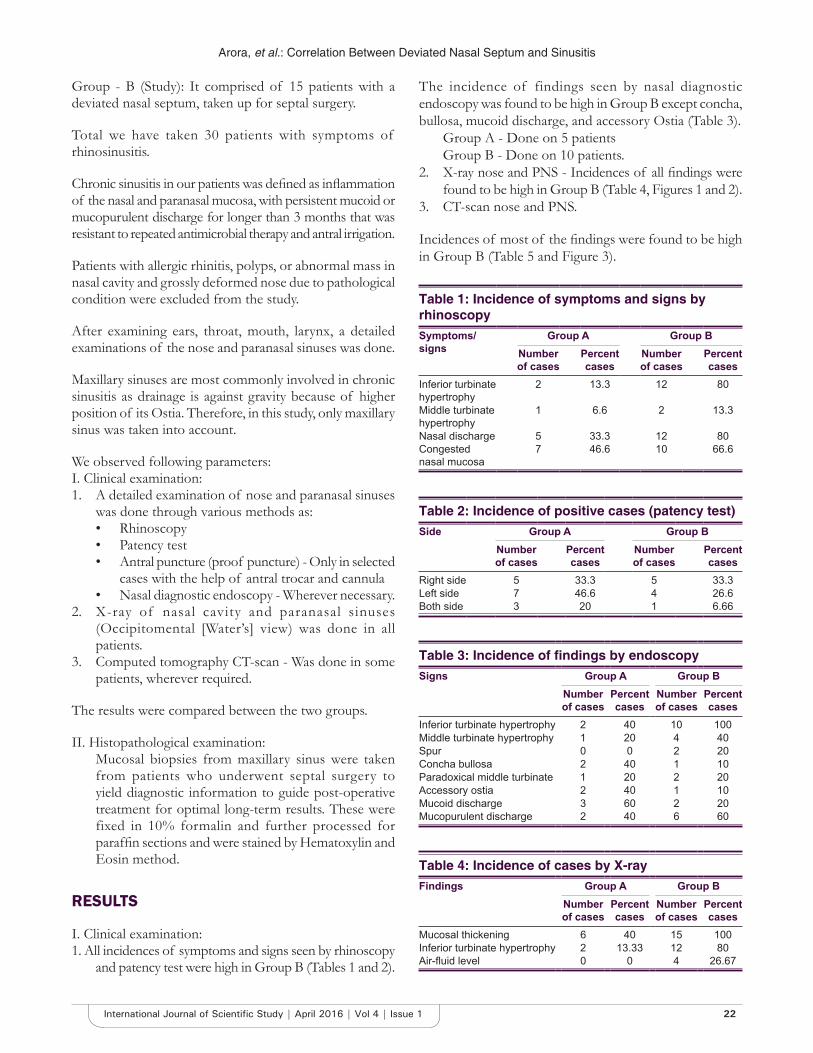
Arora, et al.: Correlation Between Deviated Nasal Septum and Sinusitis
22International Journal of Scientifi c Study | April 2016 | Vol 4 | Issue 1
Group - B (Study): It comprised of 15 patients with a deviated nasal septum, taken up for septal surgery.
Total we have taken 30 patients with symptoms of rhinosinusitis.
Chronic sinusitis in our patients was defi ned as infl ammation of the nasal and paranasal mucosa, with persistent mucoid or mucopurulent discharge for longer than 3 months that was resistant to repeated antimicrobial therapy and antral irrigation.
Patients with allergic rhinitis, polyps, or abnormal mass in nasal cavity and grossly deformed nose due to pathological condition were excluded from the study.
After examining ears, throat, mouth, larynx, a detailed examinations of the nose and paranasal sinuses was done.
Maxillary sinuses are most commonly involved in chronic sinusitis as drainage is against gravity because of higher position of its Ostia. Therefore, in this study, only maxillary sinus was taken into account.
We observed following parameters:I. Clinical examination:1. A detailed examination of nose and paranasal sinuses
was done through various methods as:• Rhinoscopy• Patency test• Antral puncture (proof puncture) - Only in selected
cases with the help of antral trocar and cannula• Nasal diagnostic endoscopy - Wherever necessary.
2. X-ray of nasal cavity and paranasal sinuses (Occipitomental [Water’s] view) was done in all patients.
3. Computed tomography CT-scan - Was done in some patients, wherever required.
The results were compared between the two groups.
II. Histopathological examination: Mucosal biopsies from maxillary sinus were taken
from patients who underwent septal surgery to yield diagnostic information to guide post-operative treatment for optimal long-term results. These were fixed in 10% formalin and further processed for paraffi n sections and were stained by Hematoxylin and Eosin method.
RESULTS
I. Clinical examination:1. All incidences of symptoms and signs seen by rhinoscopy
and patency test were high in Group B (Tables 1 and 2).
The incidence of findings seen by nasal diagnostic endoscopy was found to be high in Group B except concha, bullosa, mucoid discharge, and accessory Ostia (Table 3).
Group A - Done on 5 patientsGroup B - Done on 10 patients.
2. X-ray nose and PNS - Incidences of all fi ndings were found to be high in Group B (Table 4, Figures 1 and 2).
3. CT-scan nose and PNS.
Incidences of most of the fi ndings were found to be high in Group B (Table 5 and Figure 3).
Table 1: Incidence of symptoms and signs by rhinoscopySymptoms/signs
Group A Group BNumber of cases
Percent cases
Number of cases
Percent cases
Inferior turbinate hypertrophy
2 13.3 12 80
Middle turbinate hypertrophy
1 6.6 2 13.3
Nasal discharge 5 33.3 12 80Congested nasal mucosa
7 46.6 10 66.6
Table 3: Incidence of fi ndings by endoscopySigns Group A Group B
Number of cases
Percent cases
Number of cases
Percent cases
Inferior turbinate hypertrophy 2 40 10 100Middle turbinate hypertrophy 1 20 4 40Spur 0 0 2 20Concha bullosa 2 40 1 10Paradoxical middle turbinate 1 20 2 20Accessory ostia 2 40 1 10Mucoid discharge 3 60 2 20Mucopurulent discharge 2 40 6 60
Table 4: Incidence of cases by X-rayFindings Group A Group B
Number of cases
Percent cases
Number of cases
Percent cases
Mucosal thickening 6 40 15 100Inferior turbinate hypertrophy 2 13.33 12 80Air-fl uid level 0 0 4 26.67
Table 2: Incidence of positive cases (patency test)Side Group A Group B
Number of cases
Percent cases
Number of cases
Percent cases
Right side 5 33.3 5 33.3Left side 7 46.6 4 26.6Both side 3 20 1 6.66

Arora, et al.: Correlation Between Deviated Nasal Septum and Sinusitis
23 International Journal of Scientifi c Study | April 2016 | Vol 4 | Issue 1
Group A - Done on 2 patientsGroup B - Done on 7 patients.
II. Histopathological examination: On microscopic examination of mucosa, it was
observed that Findings suggestive of acute as well as chronic infl ammation were seen.• Acute infl ammation - There was hemorrhage in
lamina propria and submucosa with infi ltration of polymorphs (Figure 4)
• Chronic infl ammation - Epithelial erosion was seen along with edema in submucosa. Glands were exceedingly numerous and hyperplastic (Figure 5).
DISCUSSION
In the present study, we observed nasal septal deviation as one of the prime cause of chronic sinusitis.
In clinical study, incidence of all fi ndings in patients related with sinus disease was high in Group B in comparison to Group A. In patients with midline septum, few cases of chronic sinusitis were confi rmed with other pathological abnormalities in ostiomeatal area. To confi rm this and differentiate the pathogenesis of chronic sinusitis in both groups (Groups A and B), CT-scan was performed in few patients of both groups.
Histological fi ndings from mucosal biopsies correlated well with clinical fi ndings. There were marked changes in mucosa of maxillary sinus like acute as well as chronic infl ammation.
Table 5: Incidence of cases by CT-scanFindings Group A Group B
Number of cases
Percent cases
Number of cases
Percent cases
Mucosal thickening 1 50 7 100Air-fl uid level 1 50 4 57.14Inferior turbinate hypertrophy 1 50 3 42.85CT: Computed tomography
Figure 1: X-ray of patient having deviated septum showing mucosal thickening in maxillary sinus
Figure 2: X-ray of patient having deviated septum showing air-fl uid level in maxillary sinus
Figure 3: Coronal computed tomography-scan of a patient having deviated nasal septum showing bilateral hyper density
in maxillary sinuses
Figure 4: Sinus mucosa of patient having deviated septum showing acute infl ammation. Hemorrhage in lamina propria and submucosa is seen with infi ltration of polymorphs (H&E, ×200)
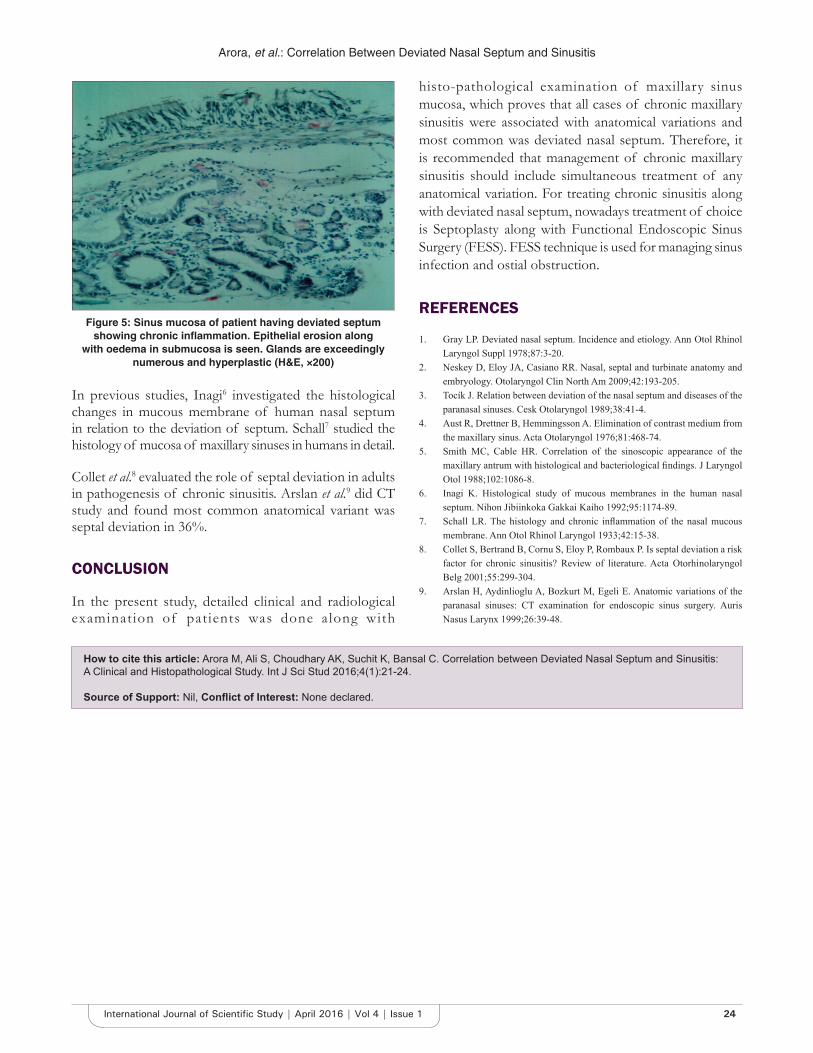
Arora, et al.: Correlation Between Deviated Nasal Septum and Sinusitis
24International Journal of Scientifi c Study | April 2016 | Vol 4 | Issue 1
In previous studies, Inagi6 investigated the histological changes in mucous membrane of human nasal septum in relation to the deviation of septum. Schall7 studied the histology of mucosa of maxillary sinuses in humans in detail.
Collet et al.8 evaluated the role of septal deviation in adults in pathogenesis of chronic sinusitis. Arslan et al.9 did CT study and found most common anatomical variant was septal deviation in 36%.
CONCLUSION
In the present study, detailed clinical and radiological examination of pat ients was done along with
histo-pathological examination of maxillary sinus mucosa, which proves that all cases of chronic maxillary sinusitis were associated with anatomical variations and most common was deviated nasal septum. Therefore, it is recommended that management of chronic maxillary sinusitis should include simultaneous treatment of any anatomical variation. For treating chronic sinusitis along with deviated nasal septum, nowadays treatment of choice is Septoplasty along with Functional Endoscopic Sinus Surgery (FESS). FESS technique is used for managing sinus infection and ostial obstruction .
REFERENCES
1. Gray LP. Deviated nasal septum. Incidence and etiology. Ann Otol Rhinol Laryngol Suppl 1978;87:3-20.
2. Neskey D, Eloy JA, Casiano RR. Nasal, septal and turbinate anatomy and embryology. Otolaryngol Clin North Am 2009;42:193-205.
3. Tocík J. Relation between deviation of the nasal septum and diseases of the paranasal sinuses. Cesk Otolaryngol 1989;38:41-4.
4. Aust R, Drettner B, Hemmingsson A. Elimination of contrast medium from the maxillary sinus. Acta Otolaryngol 1976;81:468-74.
5. Smith MC, Cable HR. Correlation of the sinoscopic appearance of the maxillary antrum with histological and bacteriological fi ndings. J Laryngol Otol 1988;102:1086-8.
6. Inagi K. Histological study of mucous membranes in the human nasal septum. Nihon Jibiinkoka Gakkai Kaiho 1992;95:1174-89.
7. Schall LR. The histology and chronic infl ammation of the nasal mucous membrane. Ann Otol Rhinol Laryngol 1933;42:15-38.
8. Collet S, Bertrand B, Cornu S, Eloy P, Rombaux P. Is septal deviation a risk factor for chronic sinusitis? Review of literature. Acta Otorhinolaryngol Belg 2001;55:299-304.
9. Arslan H, Aydinlioglu A, Bozkurt M, Egeli E. Anatomic variations of the paranasal sinuses: CT examination for endoscopic sinus surgery. Auris Nasus Larynx 1999;26:39-48 .
Figure 5: Sinus mucosa of patient having deviated septum showing chronic infl ammation. Epithelial erosion along
with oedema in submucosa is seen. Glands are exceedingly numerous and hyperplastic (H&E, ×200)
How to cite this article: Arora M, Ali S, Choudhary AK, Suchit K, Bansal C. Correlation between Deviated Nasal Septum and Sinusitis: A Clinical and Histopathological Study. Int J Sci Stud 2016;4(1):21-24.
Source of Support: Nil, Confl ict of Interest: None declared.
25 International Journal of Scientifi c Study | April 2016 | Vol 4 | Issue 1
Magnetic Resonance Imaging Lumbo Sacral Spine in Assessment of Low Back Pain in Young AdultsShivali Pankaj Gaikwad1, Varsha Rote-Kaginalkar2, Pankaj Badarkhe-Patil3
1Postgraduate Student, Department of Radio Diagnosis, Government Medical College and Hospital, Aurangabad, Maharashtra, India, 2Professor and Head, Department of Radio Diagnosis, Government Medical College and Hospital, Aurangabad, Maharashtra, India, 3Assistant Professor, Department of Radio Diagnosis, Government Medical College and Hospital, Aurangabad, Maharashtra, India
labor working days. About 40% of sick absences from work is because of LBP - making it the second most common cause of workplace absenteeism after the common cold.1
Occupation related factors are the most important risks associated with LBP.2 Modifi able factors are poor posturing, prolonged sitting, twisting, bending, stooping, and lifting of heavy loads.3
Need for the StudyThe association of lumbar disc disease with advancing age is well known and documented.4,5 However, an increasing incidence of lumbar disc disease in young adults and adolescents has also been reported by studies done in various populations world over.6-8
INTRODUCTION
Low back pain (LBP) or lumbago is one of the most common patient complaints encountered in clinical practice, having signifi cant economic consequences to the affected patient, especially young employed individuals thereby leading to loss of national economy by loss of
Original Article
Abstract
Introduction: Low back pain (LBP) is a common health problem in population worldwide leading to concomitant disability which has assumed a public health importance in our setting. While it is relatively common in elderly, the incidence of LBP in young adults was alarmingly increasing.
Purpose: To fi nd etiology of LBP in symptomatic young adults (10-35 years). Identifi cation of associated modifi able risk factors of LBP in young adults and accordingly enable successful implementation of prevention strategies.
Materials and Methods: This was a prospective study of 100 respondents. A questionnaire was used to obtain information on clinical symptoms, socio-demography, lifestyle, occupation, and other risk factors associated with LBP amongst clinically symptomatic young cases below 35 years attending magnetic resonance imaging (MRI) department in Government Medical College, Aurangabad.
Results: Of 100 cases, 54 were females and 46 males, 30 (65.21%) males and 35 (64.81%) females had abnormal MRI fi ndings. Most common etiology of LBP found was degenerative disc disease (76.92%) followed by trauma (7.69%), tumors (4.61%) and infective (4.61%), infl ammatory (3.07%) and least common etiologies being metabolic (1.53%) and developmental - Scheuermann s disease (1.53%). Among 50 cases showing positive disc degeneration fi ndings, 27 (54%) were involved in heavy physical activity, 21 (42%) in prolonged hours of sitting (>8 h), and rest 2 were involved in prolonged standing. Hence, we found that LBP incidence was associated with increased hours of heavy physical activity and prolonged hours of sitting.
Conclusion: The prevalence of LBP among young adult cases in our setting is high, with preventable and treatable predisposing factors. Cases should improve their physical fi tness, practice frequent breaks, and stretching during sitting. Public health efforts should be directed at educating people on occupational and lifestyle habits.
Key words: Astrocytoma, Discogenic, Hemangioma, Sacroiliitis, Scheuermann
Access this article online
www.ijss-sn.com
Month of Submission : 02-2016Month of Peer Review : 03-2016Month of Acceptance : 03-2016Month of Publishing : 04-2016
Corresponding Author: Shivali Pankaj Gaikwad, Room No 16, NRH Hostel, Government Medical College and Hospital, Aurangabad, Maharashtra, India. Phone: +91-9970164085. E-mail: [email protected]
DOI: 10.17354/ijss/2016/182

Shivali, et al.: Magnetic Resonance Imaging Lumbo Sacral Spine in Assessment of Low Back Pain in Young Adults
26International Journal of Scientifi c Study | April 2016 | Vol 4 | Issue 1
We noticed an alarming increase in number of young population between 15 and 35 years complaining of LBP, who were referred to The Department of Radiodiagnosis, Government Medical College Aurangabad for MRI Lumbosacral spine. Associated modifi able risk factors were faulty posturing, general health status, hours of physical activity, prolonged hours of sitting, computer usage.
Lumbar disc disease is an important cause of low back ache and describes L4-L5 as the most common site for degenerative disc disease.9
Variety of factors contributing to this degeneration are aging, axial loading of disc, abnormal posturing, vascular in growth, and abnormalities in collagen and proteoglycan all contribute to disc degeneration. Disc herniation with radiculopathy and chronic discogenic LBP are the result of this degenerative process.10
MRI has become the initial imaging technique of choice in evaluation of cases having lower back pain or radicular pain for demonstration of objective evidence of pathology in a location consistent with clinical fi ndings.11
MRI demonstrates the lumbar spine in multiple planes and extradural soft tissues (including intervertebral discs), paravertebral musculature, the exiting nerve roots and intradural structures (spinal cord, conus medullaris, and intrathecal roots).
The causes of LBP include:1. Degenerative: Intervertebral disc abnormalities,
lumbar canal stenosis associated nerve compression, spondylolisthesis, facetal arthropathy, Schmorl’s nodes
2. Infections: Tuberculosis (TB)3. Infl ammation: Sacroiliitis (young females)4. Developmental and congenital abnormalities:
Transition vertebra, scoliosis, Scheuermann’s disease12
5. Neoplastic: Primary/metastatic bone disease6. Lumbosacral muscle and soft tissue related disorders:
Muscle sprain and strains7. Misce l laneous : Osteopenia/Osteomalac ia/
Osteoporosis and non-spinal causes such as renal calculi, pancreatitis, abdominal aortic aneurysm, and gynecological disorders like endometriosis.
MATERIALS AND METHODS
MRI machine PHILIPS 1.5 Tesla, in Department of Radiodiagnosis, Government Medical College and hospital, Aurangabad was used for MRI scanning of lumbosacral spine.
MRI lumbosacral spine was done in all patients as described below:
The details of the procedure were explained to the patient and relatives. A written, informed, valid consent was taken from patient and relatives. Prior to scan detailed history of operations, pacemaker surgery, aneurysmal clip, otology implants, etc., was taken. Contrast study was done in very rare cases under anesthesia standby with all emergency drugs ready to manage the sensitivity reactions of contrast media.
Inclusion CriteriaAll cases (15-35 years) of low back ache referred to Government Medical College Aurangabad, Radiology department for MRI imaging, during the study period.
Exclusion CriteriaPregnant women, age > 35 years, <15 years, patients with metallic implants (cardiac pacemakers, cochlear implants, ocular prostheses, dental implants, and implantable cardiac defi brillators).
OBSERVATION AND RESULTS
MRI of the lumbosacral spine was performed on 100 cases in the age group of 10-35 years. There were 46 males and 54 females.
Among 46 males presenting with back pain 30 cases (65.21%) had abnormal MRI findings and among 54 females presenting with back pain 35 (64.81%) had abnormal MRI fi ndings (Table 1).
35 of the 100 cases in the study group had no abnormal MRI fi ndings (Table 1).
Most common etiology of LBP found in young adults was degenerative disc disease (76.92%) (Table 2).
Maximum number of cases affected by degenerative disc disease was noted in age group of 31-35 years (52%) (Table 3).
Out of total 50 cases showing disc degeneration, 84% patients showed the involvement of L4-L5 intervertebral disc level, followed by L5-S1 (44%) and L1-L2 (10%) was least commonly affected (Table 4).
27 (54%) were involved in heavy physical activity, and out of these, 12 were homemakers (Table 5).
21 (42%) cases were involved in prolonged hours of sitting, and out of these, 12 were involved in clerical jobs like bank employees, typist, young call center employees (Table 5).
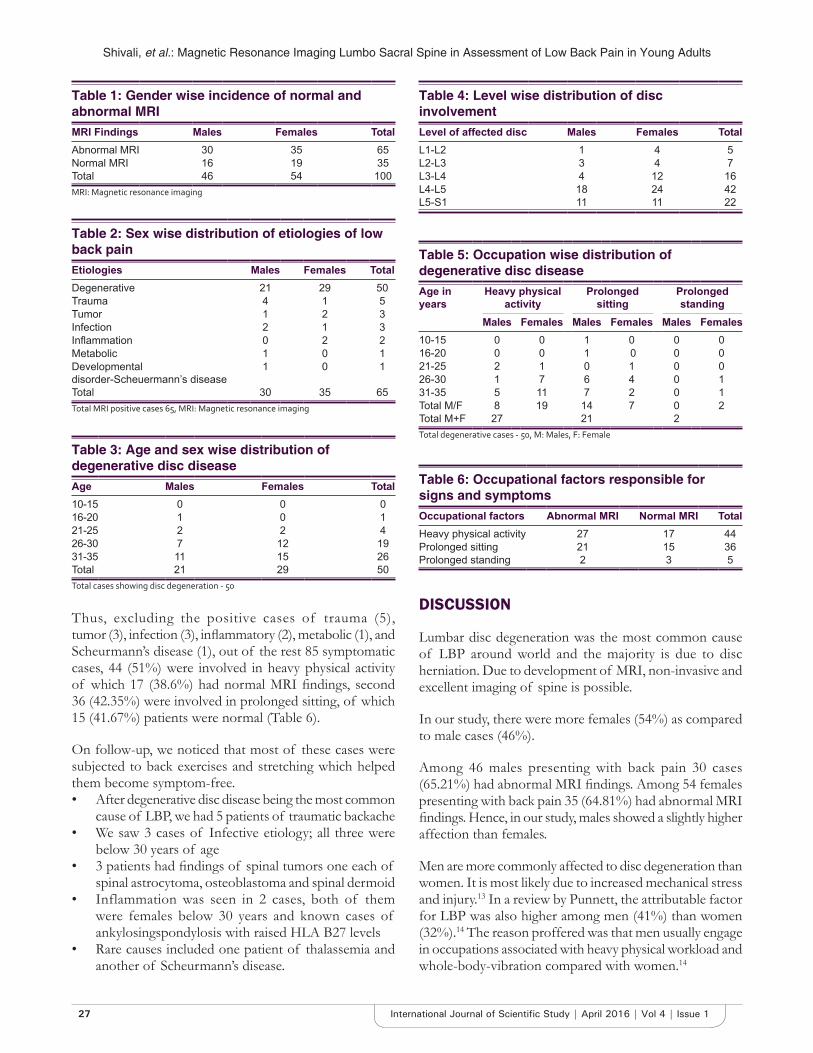
Shivali, et al.: Magnetic Resonance Imaging Lumbo Sacral Spine in Assessment of Low Back Pain in Young Adults
27 International Journal of Scientifi c Study | April 2016 | Vol 4 | Issue 1
Thus, excluding the positive cases of trauma (5), tumor (3), infection (3), infl ammatory (2), metabolic (1), and Scheurmann’s disease (1), out of the rest 85 symptomatic cases, 44 (51%) were involved in heavy physical activity of which 17 (38.6%) had normal MRI fi ndings, second 36 (42.35%) were involved in prolonged sitting, of which 15 (41.67%) patients were normal (Table 6).
On follow-up, we noticed that most of these cases were subjected to back exercises and stretching which helped them become symptom-free.• After degenerative disc disease being the most common
cause of LBP, we had 5 patients of traumatic backache• We saw 3 cases of Infective etiology; all three were
below 30 years of age• 3 patients had fi ndings of spinal tumors one each of
spinal astrocytoma, osteoblastoma and spinal dermoid• Inflammation was seen in 2 cases, both of them
were females below 30 years and known cases of ankylosingspondylosis with raised HLA B27 levels
• Rare causes included one patient of thalassemia and another of Scheurmann’s disease.
DISCUSSION
Lumbar disc degeneration was the most common cause of LBP around world and the majority is due to disc herniation. Due to development of MRI, non-invasive and excellent imaging of spine is possible.
In our study, there were more females (54%) as compared to male cases (46%).
Among 46 males presenting with back pain 30 cases (65.21%) had abnormal MRI fi ndings. Among 54 females presenting with back pain 35 (64.81%) had abnormal MRI fi ndings. Hence, in our study, males showed a slightly higher affection than females.
Men are more commonly affected to disc degeneration than women. It is most likely due to increased mechanical stress and injury.13 In a review by Punnett, the attributable factor for LBP was also higher among men (41%) than women (32%).14 The reason proffered was that men usually engage in occupations associated with heavy physical workload and whole-body-vibration compared with women.14
Table 2: Sex wise distribution of etiologies of low back painEtiologies Males Females TotalDegenerative 21 29 50Trauma 4 1 5Tumor 1 2 3Infection 2 1 3Infl ammation 0 2 2Metabolic 1 0 1Developmental disorder-Scheuermann’s disease
1 0 1
Total 30 35 65Total MRI positive cases 65, MRI: Magnetic resonance imaging
Table 3: Age and sex wise distribution of degenerative disc diseaseAge Males Females Total10-15 0 0 016-20 1 0 121-25 2 2 426-30 7 12 1931-35 11 15 26Total 21 29 50Total cases showing disc degeneration - 50
Table 4: Level wise distribution of disc involvementLevel of affected disc Males Females TotalL1-L2 1 4 5L2-L3 3 4 7L3-L4 4 12 16L4-L5 18 24 42L5-S1 11 11 22
Table 6: Occupational factors responsible for signs and symptomsOccupational factors Abnormal MRI Normal MRI TotalHeavy physical activity 27 17 44Prolonged sitting 21 15 36Prolonged standing 2 3 5
Table 1: Gender wise incidence of normal and abnormal MRIMRI Findings Males Females TotalAbnormal MRI 30 35 65Normal MRI 16 19 35Total 46 54 100MRI: Magnetic resonance imaging
Table 5: Occupation wise distribution of degenerative disc diseaseAge in years
Heavy physical activity
Prolonged sitting
Prolonged standing
Males Females Males Females Males Females10-15 0 0 1 0 0 016-20 0 0 1 0 0 021-25 2 1 0 1 0 026-30 1 7 6 4 0 131-35 5 11 7 2 0 1Total M/F 8 19 14 7 0 2Total M+F 27 21 2Total degenerative cases - 50, M: Males, F: Female

Shivali, et al.: Magnetic Resonance Imaging Lumbo Sacral Spine in Assessment of Low Back Pain in Young Adults
28International Journal of Scientifi c Study | April 2016 | Vol 4 | Issue 1
Females had a higher prevalence of LBP as compared to males (Schneider et al. 2006 total sample of 5315 persons, Wijnhoven et al. 2006).15,16 It has been associated with hormonal changes, irregular or prolonged menstrual cycle, different pain perception and recall of symptoms.16,17 In another study, female rice farmers in Thailand were more likely to develop LBP than males.18 Another study among staff in a rural hospital also found that female workers had a greater prevalence of LBP.19
Degenerative Disc DiseaseThe most common abnormality noted in our study was degenerative disc disease (76.92%). Most cases of disc degeneration were observed in age group of 31-35 years in our study.
Disc dessication is a common degenerative change of intervertebral discs. It results from replacement of the glycosaminoglycans within the nucleus pulposus with fi brocartilage which leads to reduced disc height due to reduction in nucleus pulposus volume.20
In study by Takatalo et al. (2011). Intervertebral disc degeneration was associated with low back symptom severity among young adults suggesting that the symptoms may have a discogenic origin at this age.21
In our study, we have found the majority of the disc lesions were at L4-5 (84%) followed by at the level L5-S1 (44%), least being at the level of L1-L2 (10%) which were consistent with fi ndings of other studies. Similar fi ndings were seen in a study conducted by Saleem et al. (2013) out of 163 cases; disc degeneration was most commonly present at the level of L4-L5 105 (64.4%).22
In our study, among 50 cases showing positive disc degeneration MRI findings, 27 cases (54%) were involved in heavy physical activity. In the world, 37% of LBP are attributed to occupation.23 Professionals who are exposed to vibrations or long-standing positions such as health-care workers, occupational drivers and construction workers are more prone to LBP. LBP is associated with working postures which included vigorous bending, bending and twisting simultaneously, a bent and twisted posture for long periods, and making repetitive movements with the trunk. This fi nding was consistent with other studies.14,24-27
In our study, 21 cases (42%) were involved in prolonged hours of sitting (> 8 h), of which 10 cases were involved in clerical jobs such as bank employees, typist, young call center employees and 2 cases (4%) were involved in jobs requiring prolonged standing hours such as teacher and salon worker.
Our fi ndings were comparable to many other previous studies, In 2007, Lis et al. concluded, that in working adults, prolonged sitting has been identifi ed as a risk factor for LBP.28 According to a study done by Callaghan and McGill in 2001, the reported consequences of prolonged sitting are increased spinal compression load29 and increased activity of paraspinal muscles.30 As a result, LBP can occur due to tissue microdamage and paraspinal muscle dysfunction.31
A total of 50 cases had degenerative disc degeneration fi ndings in lumbosacral spine of which 18 cases had affection at multiple contiguous sites, and 5 cases showed the involvement of multiple non-contiguous sites (Figure 1a and b) and rest 27 had affection of single intervertebral disc level (Figure 2a and b).
Other associated fi ndings were Schmorl’s nodes in 5 (10%) patients and endplate changes in 7 (14%) patients.
SacroiliitisTwo (3.07%) cases in our study showed evidence of sacroiliitis, and both were females. These were known cases of ankylosing spondylosis with raised HLA B27 levels, one
Figure 1: (a) Typical imaging fi ndings in degenerative disc disease - T2W sagittal image showing affection at multiple
contiguous intervertebral disc levels L1-2, L2-3, L4-5, (b) T2W axial image at the level of L4-5 intervertebral disc showing
postero and bilateral paracentral disc protrusion compressing traversing and bilateral exiting nerve roots
ba
Figure 2: (a) Typical imaging fi ndings in degenerative disc disease. T2W sagittal image showing affection at single
L5-S1 disc level, (b) T2W axial image at the level of L5-S1 intervertebral disc showing right paracentral disc protrusion
compressing right exiting nerve root
ba
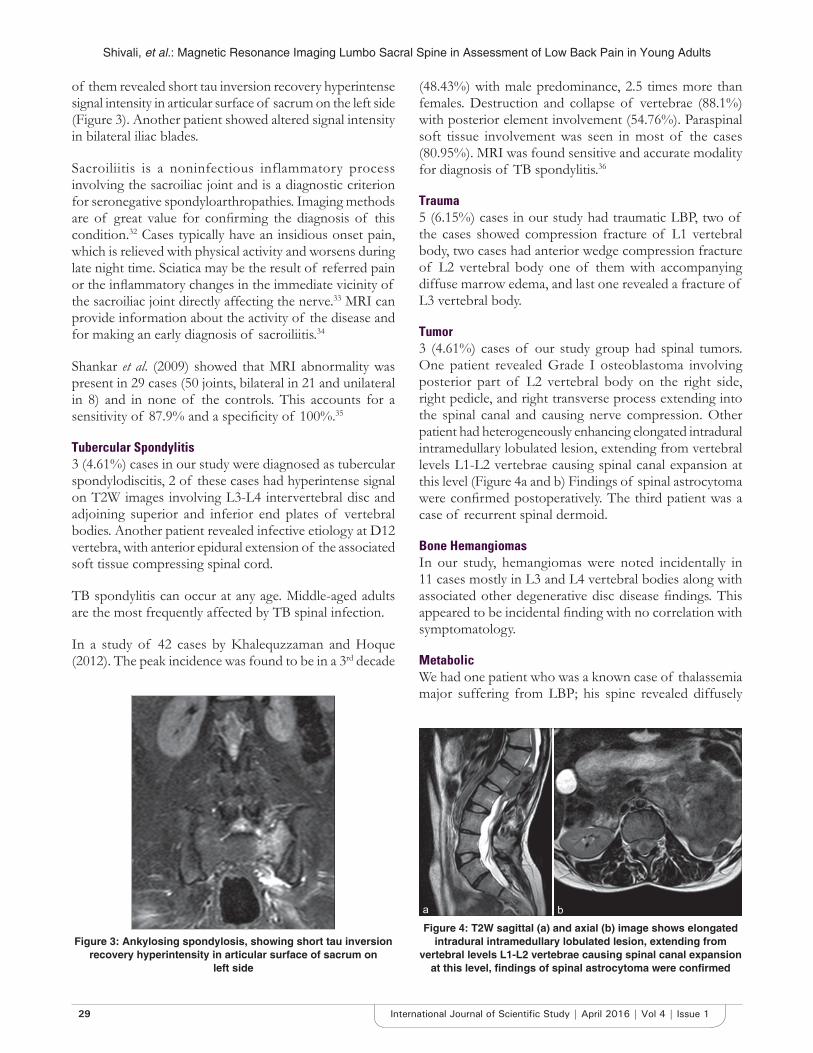
Shivali, et al.: Magnetic Resonance Imaging Lumbo Sacral Spine in Assessment of Low Back Pain in Young Adults
29 International Journal of Scientifi c Study | April 2016 | Vol 4 | Issue 1
of them revealed short tau inversion recovery hyperintense signal intensity in articular surface of sacrum on the left side (Figure 3). Another patient showed altered signal intensity in bilateral iliac blades.
Sacroiliitis is a noninfectious inflammatory process involving the sacroiliac joint and is a diagnostic criterion for seronegative spondyloarthropathies. Imaging methods are of great value for confi rming the diagnosis of this condition.32 Cases typically have an insidious onset pain, which is relieved with physical activity and worsens during late night time. Sciatica may be the result of referred pain or the infl ammatory changes in the immediate vicinity of the sacroiliac joint directly affecting the nerve.33 MRI can provide information about the activity of the disease and for making an early diagnosis of sacroiliitis.34
Shankar et al. (2009) showed that MRI abnormality was present in 29 cases (50 joints, bilateral in 21 and unilateral in 8) and in none of the controls. This accounts for a sensitivity of 87.9% and a specifi city of 100%.35
Tubercular Spondylitis3 (4.61%) cases in our study were diagnosed as tubercular spondylodiscitis, 2 of these cases had hyperintense signal on T2W images involving L3-L4 intervertebral disc and adjoining superior and inferior end plates of vertebral bodies. Another patient revealed infective etiology at D12 vertebra, with anterior epidural extension of the associated soft tissue compressing spinal cord.
TB spondylitis can occur at any age. Middle-aged adults are the most frequently affected by TB spinal infection.
In a study of 42 cases by Khalequzzaman and Hoque (2012). The peak incidence was found to be in a 3rd decade
(48.43%) with male predominance, 2.5 times more than females. Destruction and collapse of vertebrae (88.1%) with posterior element involvement (54.76%). Paraspinal soft tissue involvement was seen in most of the cases (80.95%). MRI was found sensitive and accurate modality for diagnosis of TB spondylitis.36
Trauma5 (6.15%) cases in our study had traumatic LBP, two of the cases showed compression fracture of L1 vertebral body, two cases had anterior wedge compression fracture of L2 vertebral body one of them with accompanying diffuse marrow edema, and last one revealed a fracture of L3 vertebral body.
Tumor3 (4.61%) cases of our study group had spinal tumors. One patient revealed Grade I osteoblastoma involving posterior part of L2 vertebral body on the right side, right pedicle, and right transverse process extending into the spinal canal and causing nerve compression. Other patient had heterogeneously enhancing elongated intradural intramedullary lobulated lesion, extending from vertebral levels L1-L2 vertebrae causing spinal canal expansion at this level (Figure 4a and b) Findings of spinal astrocytoma were confi rmed postoperatively. The third patient was a case of recurrent spinal dermoid.
Bone HemangiomasIn our study, hemangiomas were noted incidentally in 11 cases mostly in L3 and L4 vertebral bodies along with associated other degenerative disc disease fi ndings. This appeared to be incidental fi nding with no correlation with symptomatology.
MetabolicWe had one patient who was a known case of thalassemia major suffering from LBP; his spine revealed diffusely
Figure 3: Ankylosing spondylosis, showing short tau inversion recovery hyperintensity in articular surface of sacrum on
left side
Figure 4: T2W sagittal (a) and axial (b) image shows elongated intradural intramedullary lobulated lesion, extending from
vertebral levels L1-L2 vertebrae causing spinal canal expansion at this level, fi ndings of spinal astrocytoma were confi rmed
ba

Shivali, et al.: Magnetic Resonance Imaging Lumbo Sacral Spine in Assessment of Low Back Pain in Young Adults
30International Journal of Scientifi c Study | April 2016 | Vol 4 | Issue 1
decreased signal intensity (hypointense on all sequences) involving all vertebrae and their posterior elements, visualized calvaria and base of skull, s/o Hematopoietic marrow-marrow reconversion.
Scheuermann’s DiseaseWe had one patient of Scheuermann’s disease which revealed Schmorl’s nodes at superior end plate of D7, L2, L3, L4 vertebral bodies and inferior endplate of D5 vertebrae, with relatively narrowed L4-L5 intervertebral disc. Partial anterior fusion of D1, D2, D3, and D4-D5 and D7-D8 vertebral bodies was also seen (Figure 5).
Scheuermann Disease is a spinal disorder named after Dr. Holger Werfel Sheuermann who in 1921, fi rst described a structural thoracic kyphosis mainly affecting adolescents.37 Its classic diagnostic criterion was “3 or more consecutive wedged thoracic vertebrae,” proposed by Sorenson in 1964.38 However, this disease included pathological changes also like disc and endplate lesions, primarily Schmorl’s node, and irregular vertebral endplate.37,38 Therefore, the diagnosis of “atypical” Scheuermann disease was proposed for cases with only one or 2 wedged vertebrae and no notable kyphosis, but characteristic disc/endplate lesions including Schmorl’s node and endplate irregularity.39-42
CONCLUSION
MRI is the most comprehensive, non-invasive and safe imaging modality for diagnosis of LBP. The incidence of LBP is considerably high in young adults and more frequent in age group of 31-35 years. Most common etiology of LBP found in young adults is degenerative disc disease (76.92%) and the most commonly affected intervertebral
disc level is L4-L5 (84%), followed by L5-S1 (44%). Heavy physical activity (61.36%) is the most common occupational factor responsible for degenerative disc disease, followed by prolonged sitting (42%). Among symptomatic patients involved in prolonged sitting, 41.67% revealed no signs on MRI indicating the modifi able nature of degenerative disc disease in that group.
REFERENCES
1. Guo HR. Working hours spent on repeated activities and prevalence of back pain. Occup Environ Med 2002;59:680-8.
2. Vandergrift JL, Gold JE, Hanlon A, Punnett L. Physical and psychosocial ergonomic risk factors for low back pain in automobile manufacturing workers. Occup Environ Med 2012;69:29-34.
3. Vindigni D, Walker BF, Jamison JR, Da Costa C, Parkinson L, Blunden S. Low back pain risk factors in a large rural Australian Aboriginal community. An opportunity for managing co-morbidities? Chiropr Osteopat 2005;13:21.
4. Kjaer P, Leboeuf-Yde C, Korsholm L, Sorensen JS, Bendix T. Magnetic resonance imaging and low back pain in adults: A diagnostic imaging study of 40-year-old men and women. Spine (Phila Pa 1976) 2005;30:1173-80.
5. Kanayama M, Togawa D, Takahashi C, Terai T, Hashimoto T. Cross-sectional magnetic resonance imaging study of lumbar disc degeneration in 200 healthy individuals. J Neurosurg Spine 2009;11:501-7.
6. Cheung KM, Karppinen J, Chan D, Ho DW, Song YQ, Sham P, et al. Prevalence and pattern of lumbar magnetic resonance imaging changes in a population study of one thousand forty-three individuals. Spine (Phila Pa 1976) 2009;34:934-40.
7. Takatalo J, Karppinen J, Niinimäki J, Taimela S, Näyhä S, Järvelin MR, et al. Prevalence of degenerative imaging fi ndings in lumbar magnetic resonance imaging among young adults. Spine (Phila Pa 1976) 2009;34:1716-21.
8. Samartzis D, Karppinen J, Mok F, Fong DY, Luk KD, Cheung KM. A population-based study of juvenile disc degeneration and its association with overweight and obesity, low back pain, and diminished functional status. J Bone Joint Surg Am 2011;93:662-70.
9. Ly JQ. Systematic approach to interpretation of the lumbar spine MR imaging examination. Magn Reson Imaging Clin N Am 2007;15:155-66, v.
10. Martin MD, Boxell CM, Malone DG. Pathophysiology of lumbar disc degeneration: A review of the literature. Neurosurg Focus 2002;13:E1.
11. Feydy A, Pluot E, Guerini H, Drapé JL. Osteoarthritis of the wrist and hand, and spine. Radiol Clin North Am 2009;47:723-59.
12. Joshi M, Yadav S. Lumbosacral agenesis. Indian J Radiol Imaging 2005;15:251-4.
13. Wang YX, Griffi th JF. Effect of menopause on lumbar disk degeneration: Potential etiology. Radiology 2010;257:318-20.
14. Punnett L, Prüss-Utün A, Nelson DI, Fingerhut MA, Leigh J, Tak S, et al. Estimating the global burden of low back pain attributable to combined occupational exposures. Am J Ind Med 2005;48:459-69.
15. Schneider S, Randoll D, Buchner M. Why do women have back pain more than men? A representative prevalence study in the federal republic of Germany. Clin J Pain 2006;22:738-47.
16. Wijnhoven HA, de Vet HC, Picavet HS. Prevalence of musculoskeletal disorders is systematically higher in women than in men. Clin J Pain 2006;22:717-24.
17. Wedderkopp N, Andersen LB, Froberg K, Leboeuf-Yde C. Back pain reporting in young girls appears to be puberty-related. BMC Musculoskelet Disord 2005;6:52.
18. Taechasubamorn P, Nopkesorn T, Pannarunothai S. Prevalence of low back pain among rice farmers in a rural community in Thailand. J Med Assoc Thai 2011;94:616-21.
19. Omokhodion FO, Umar US, Ogunnowo BE. Prevalence of low back pain among staff in a rural hospital in Nigeria. Occup Med (Lond) 2000;50:107-10.
20. Lipson SJ, Muir H. Experimental intervertebral disc degeneration: Morphologic and proteoglycan changes over time. Arthritis Rheum 1981;24:12-21.
Figure 5: Scheuermann’s disease revealed multiple Schmorl’s nodes at superior endplate of D7, L2, L3, L4 and inferior
endplates of D5 vertebral body with narrowed L4-5 disc space. Partial fusion of D1, D2, D3, D4-D5 and D7-D8 vertebral bodies

Shivali, et al.: Magnetic Resonance Imaging Lumbo Sacral Spine in Assessment of Low Back Pain in Young Adults
31 International Journal of Scientifi c Study | April 2016 | Vol 4 | Issue 1
How to cite this article: Gaikwad SP, Rote-Kaginalkar V, Badarkhe-Patil P. Magnetic Resonance Imaging Lumbo Sacral Spine in Assessment of Low Back Pain in Young Adults. Int J Sci Stud 2016;4(1):25-31.
Source of Support: Nil, Confl ict of Interest: None declared.
21. Takatalo J, Karppinen J, Niinimaki J, Taimela S, Nayha S, Mutanen P, et al. Does lumbar disc degeneration on magnetic resonance imaging associate with low back symptom severity in young Finnish adults?. Spine (Phila Pa 1976) 2011;36:2180-9.
22. Saleem S, Aslam HM, Rehmani MA, Raees A, Alvi AA, Ashraf J. Lumbar disc degenerative disease: Disc degeneration symptoms and magnetic resonance image fi ndings. Asian Spine J 2013;7:322-34.
23. Ehrlich GE. Low back pain. Bull World Health Organ 2003;81:671-6.24. Airaksinen O, Brox JI, Cedraschi C, Hildebrandt J, Klaber-Moffett J,
Kovacs F, et al. European guidelines for the management of chronic nonspecifi c low back pain. Eur Spine J 2006;15:192-300.
25. Coeuret-Pellicer M, Descatha A, Leclerc A, Zins M Are tall people at higher risk of low back pain surgery? A discussion on the results of a multipurpose cohort. Arthritis Care Res (Hoboken) 2010;62:125-7.
26. Karacan I, Aydin T, Sahin Z, Cidem M, Koyuncu H, Aktas I, et al. Facet angles in lumbar disc herniation: Their relation to anthropometric features. Spine (Phila Pa 1976) 2004;29:1132-6.
27. Natarajan RN, Andersson GB. The infl uence of lumbar disc height and cross-sectional area on the mechanical response of the disc to physiologic loading. Spine (Phila Pa 1976) 1999;24:1873-81.
28. Lis AM, Black KM, Korn H, Nordin M. Association between sitting and occupational LBP. Eur Spine J 2007;16:283-98.
29. Callaghan JP, McGill SM. Low back joint loading and kinematics during standing and unsupported sitting. Ergonomics 2001;44:280-94.
30. Harrison DD, Harrison SO, Croft AC, Harrison DE, Troyanovich SJ. Sitting biomechanics part I: Review of the literature. J Manipulative Physiol Ther 1999;22:594-609.
31. Solomonow M, Bratta RV, Zhou BH, Burger E, Zieske A, Gedalia A. Muscular dysfunction elicited by creep of lumbar viscoelastic tissue. J Electromyogr Kinesiol 2003;13:381-96.
32. Montandon C, Costa MA, Carvalho TN, Montandon ME Jr, Teixeira KS. Sacroilitis: Imaging evaluation. Radiol Bras 2007;40:53-60.
33. Wong M, Vijayanathan S, Kirkham B. Sacroilitis presenting as sciatica. Rheumatology 2005;44:1323-4.
34. Bredella MA, Steinbach LS, Morgan S, Ward M, Davis JC. MRI of the sacroiliac joints in patients with moderate to severe ankylosing spondylitis. AJR Am J Roentgenol 2006;187:1420-6.
35. Shankar S Evaluation of magnetic resonance imaging and radionuclide bone scan in early spondyloarthropathy. Indian J Rheumatol 2009;4:142-8.
36. Khalequzzaman S, Hoque HW. Tuberculosis of spine Magnetic Resonance Imaging (MRI) evaluation of 42 cases. Med Today 2012;24:59-62.
37. Lowe TG. Scheuermann disease. J Bone Joint Surg Am 1990;72:940-5.38. Sorenson KH. Scheuermann’s Juvenile Kyphosis: Clinical Appearances,
Radiography, Aetiology, and Prognosis. Copenhagen, Denmark: Ejnar Munksgaard Forlag; 1964.
39. Blumenthal SL, Roach J, Herring JA. Lumbar Scheuermann’s. A clinical series and classifi cation. Spine (Phila Pa 1976) 1987;12:929-32.
40. Heithoff KB, Gundry CR, Burton CV, Winter RB. Juvenile discogenic disease. Spine (Phila Pa 1976) 1994;19:335-40.
41. Paajanen H, Alanen A, Erkintalo M, Salminen JJ, Katevuo K. Disc degeneration in Scheuermann disease. Skeletal Radiol 1989;18:523-6.
42. Greene TL, Hensinger RN, Hunter LY. Back pain and vertebral changes simulating Scheuermann’s disease. J Pediatr Orthop 1985;5:1- 7.
32International Journal of Scientifi c Study | April 2016 | Vol 4 | Issue 1
Perforated Appendix - Delay in Presentation Rather than Delay in the Surgical Intervention: Retrospective Database Analysis of 2573 Saudi Arabian Patients in 10 YearsBader Hamza Shirah1, Hamza Assad Shirah2, Wael Awad Alhaidari3
1College of Medicine, King Abdullah International Medical Research Center, King Saud Bin Abdulaziz University for Health Sciences, Jeddah, Saudi Arabia, 2Department of General Surgery, Al Ansar General Hospital, Medina, Saudi Arabia, 3Department of Accidents and Emergency, Al Ansar General Hospital, Medina, Saudi Arabia
A perforated appendix is a complication of untreated or delayed acute appendicitis. Ischemic necrosis of a portion of the appendiceal wall will lead to the perforation. Fecolith was found to be responsible for the perforation in about 90% of cases causing obstruction, increased pressure, and leading to ischemic necrosis. Other causes of luminal obstruction have also been reported such as fruit seeds and vegetables, lymphoid hyperplasia, intestinal worms (Ascaris), malignant tissues, and foreign bodies.2
Perforation of the appendix is reported to be more common in the elderly patients as a result of the late and atypical presentation, delay in the diagnosis, delay in the decision for surgery, and to the age acquired physiological changes. The mortality and morbidity rates had increased
INTRODUCTION
Acute appendicitis is the most common acute surgical abdominal emergency occurrence worldwide. It is most common between the ages of 10 and 20 years, but can affect any age. The male to female ratio is 1.4:1, and the lifetime risk is 8.6% for males and 6.7% for females.1
Original Article
Abstract
Background: Perforated appendicitis is the result of a delay in treating acute appendicitis either due to patient’s related factors, or misdiagnosis and delay of treatment.
Aim: The aim of this study to evaluate the effect of time on perforated appendicitis cases to determine whether the delay in presentation or the delay in treatment have a role in the progressing of acute appendicitis to perforation of the appendix.
Materials and Methods: A retrospective database analysis of 2573 Saudi Arabian patients treated surgically for acute appendicitis between January 2006 and December 2015 in a public health general hospital in Medina, Saudi Arabia was done. The inclusion criteria included adult patients, diagnosed initially as acute appendicitis, and proven to have had perforated appendix. Diagnostic temperature, complete blood count, ultrasound, operative diagnosis, duration of symptoms, duration of hospitalization, and complications were analyzed.
Results: A total of 363 patients (145 females and 218 males) were proven to have had a perforated appendix. The number was higher in males compared to females, and the difference was statistically signifi cant (P = 0.033). The mean age of the patients was 29.99 (median 26, range: 14-79). The duration of symptoms was signifi cantly longer (68.80 ± 12.40 h and P < 0.001), and it was statistically signifi cant for both males (P = 0.004) and females (P = 0.001).
Conclusion: To conclude that in our local community, the majority of perforated appendix cases were found to be associated with the delay in presentation rather than the delay in management.
Key words: Appendicitis, Complications, Perforated appendix, Peritonitis, Surgery
Access this article online
www.ijss-sn.com
Month of Submission : 02-2016Month of Peer Review : 03-2016Month of Acceptance : 04-2016Month of Publishing : 04-2016
Corresponding Author: Bader Hamza Shirah, King Abdullah International Medical Research Center, King Saud Bin Abdulaziz University for Health Sciences, P.O. Box: 65362, Jeddah - 21556, Saudi Arabia. E-mail: [email protected]
DOI: 10.17354/ijss/2016/183
Shirah, et al.: Perforated Appendix-Delayed Presentation not Delayed Intervention
33 International Journal of Scientifi c Study | April 2016 | Vol 4 | Issue 1
because the perforation could lead to prolonged and diffi cult treatment, convalescence, and could lead to death.3
The most recognized contributing factor in perforation of the appendix is the time factor in which the late presentation of the patients was reported to be a major cause, because when the delay in time between the onset of symptoms and the delivery of treatment increases, the probability of complications increase.4 The age was proven to be a substantial contributing risk factor, patients under l0 years and more than 40 years are at a signifi cant risk of increased morbidity and mortality.5 Co-morbid conditions, mainly diabetes mellitus were found to increase the mortality and morbidity in perforated appendix patients. The co-existence of pregnancy and acute appendicitis is reported to increase the morbidity and mortality in both the mother and fetus.6
The clinical presentation of appendicitis is infl uenced by various symptoms and signs with reported variations in about 20-30% of the patients who present with atypical symptoms, signs, or laboratory fi ndings. The patient-related factors are reported in many clinical studies to constitute the main reason for delays although physician-related diagnostic, and management delays have been also reported.7
Some clinical studies suggested a close relation between the level of infl ammation or perforation and duration of infl ammation;8 however, there have been a lack of evidence-based data on the progress of appendicitis in time, and it is not proven scientifi cally if the risk of perforation is related to the duration of infl ammation or it is because of the patient-related factors.9
Clinical studies had demonstrated that computed tomography provides a high degree of sensitivity (95%) and specifi city (95%) for diagnosing perforation. The reported specifi c fi ndings on a computed tomography (CT) scan that can lead to identifying a perforated appendix are: The presence of a localized the right iliac fossa abscess or phlegmon, a clear demonstrable defect in the appendiceal wall, an extra luminal air locules or free intraperitoneal air, the presence of appendicolith outside the appendix or within the right iliac fossa abscess, an intraperitoneal leak of rectal contrast, and the presence of multiple appendicoliths in association with thickened appendix, or peri-appendiceal infl ammation. Ultrasound is reported to be less reliable than a contrast enhanced CT.10
The management of perforated appendicitis is different than that of acute non-perforated disease. The patients who progress to perforated appendicitis will have a longer duration of symptoms, high fever, and a higher white
blood count (WBC). Most of these patients have an established peritonitis and should receive a broad-spectrum intravenous antibiotic therapy, which should start as soon as the diagnosis is established.11
Surgical management is through two possible approaches: An open laparotomy or laparoscopy, but controversy regarding the use of laparoscopy in patients with an advanced disease does exist because of the high incidence of postoperative intra-abdominal abscess formation.12
We aim in this study to evaluate the effect of time on perforated appendicitis cases to determine whether the delay in presentation or the delay in treatment have a role in the progressing of acute appendicitis to perforation of the appendix.
MATERIALS AND METHODS
A retrospective database analysis of the treatment outcome of 2573 Saudi Arabian patients treated surgically for acute appendicitis between January 2006 and December 2015 in a public health general hospital in Medina; Saudi Arabia was done.
The inclusion criteria included all adult patients age 12 years and above (according to the age classifi cations in hospitals of the Saudi Arabian ministry of health), all patients under 12-year-old were excluded due to unavailability of pediatric surgery unit in the hospital.
All patients who were diagnosed initially as acute appendicitis and proven to have had perforated appendix were selected, and random selection in regard to age, gender, and co-morbid conditions was done. All patients had the same diagnostic investigations (complete blood count, blood chemistry, chest X-ray, ultrasound abdomen, and electrocardiogram).
The diagnosis was made by the surgeon, who was on duty in the emergency surgery department, on the basis of the patient’s history, clinical fi ndings, laboratory, and radiology investigations. All appendectomy operations were performed as an emergency open procedure. All appendectomy samples were histologically evaluated.
Preoperative WBC count, body temperature, the ultrasound findings, and the diagnosis of a perforated appendix (preoperatively or intraoperatively) were analyzed for characteristics of the diagnosis. Age, gender, duration of symptoms before admission, duration of hospitalization, and mode of patient’s referral from other health facilities were recorded and analyzed.

Shirah, et al.: Perforated Appendix-Delayed Presentation not Delayed Intervention
34International Journal of Scientifi c Study | April 2016 | Vol 4 | Issue 1
RESULTS
A total of 2573 Saudi Arabian patients who were treated surgically for acute appendicitis between January 2003 and December 2012 were included, among them, 363 (14.11%) patients were proven to have had perforated appendix, of which 145 (39.9%) were females and 218 (60.1%) were males, male to female ratio of 1.5:1. The incidence rate of the perforated appendix in our study is 14.1%. The number of perforated cases was higher in males compared with females, and the difference was found to be statistically signifi cant (P = 0.033). The mean age of the patients was 35.76 years, (median 36.5, range: 14 - 61) (Table 1 and Figure 1).
The duration of symptoms in patients with perforated appendicitis was signifi cantly longer (68.80 ± 12.40 h and P < 0.001). This was found to be statistically signifi cant for both males (P = 0.004) and females (P = 0.001). Analysis of the data in perforated patients, based on the age and sex, showed that the duration of pre-operative symptoms was very long in females, compared with males. However, this is not statistically signifi cant (P = 0.486 and P > 0.05) (Table 2).
Body temperature as part of the vital signs did not show a statistical difference in perforated and non-perforated cases. In the comparison of white blood cells levels of the groups, high levels of WBC levels in patients with appendix perforation were statistically signifi cant (P < 0.05) (Table 3 and Figure 2).
It was statistically signifi cant that the time of hospitalization was increasing in accordance with the complicated acute appendicitis (perforated appendix). Comparison of the preoperative ultrasound fi ndings did not reveal a statistically signifi cant difference between the rates of consistency of ultrasound with pathology (P > 0.05). However, the highest rate of consistency between ultrasound and pathology was identifi ed in the perforated group (Tables 4 and 5).
The mortality rate was (0%) in all acute appendicitis patients including perforated and non-perforated appendix. The rates of postoperative morbidities were found as 2.5% in total of the non-perforated group (56 patients of 2210), and 17% in the perforated group (62 patients of 363) (Table 6).
MaleFemaleTotalPerforated appendix 218145363Non perforated appendix 13079032210
0
500
1000
1500
2000
2500
Patie
nts
No.
Figure 1: Patients gender of perforated and non-perforated appendix
Table 1: Demographic characteristics of the patients with perforated appendixAge group (years) Male (%) Female (%) Total (%)12-19 51 (63.0) 30 (37.0) 81 (100.0)20-49 143 (58.1) 103 (41.9) 246 (100.0)≥ 50 24 (66.7) 12 (33.3) 36 (100.0)Total 218 (60.1) 145 (39.9) 363 (100.0)
Table 2: Distribution of age, gender-stratifi ed mean, duration of pre-admission symptom according to level of infl ammation (perforated/non-perforated)Age group (years)
Non-perforated appendix
Perforatedappendix
Male (h) Female (h) Male (h) Female (h)12-19 32.0 (12) 35.2 (15) 160.0 (3) 74.6 (9)20-49 32.8 (46) 39.5 (48) 87.0 (8) 46.6 (18)≥ 50 36.0 (6) 33.6 (5) 56.0 (3) 60.0 (4)Total 33.0 (64) 38.1 (68) 56.5 (31) 96.0 (14)
Table 3: WBC count in perforated and non-perforated appendixWBC Non-perforated (%) Perforated (%)10-15 899 (40.7) 0 (0)15-20 847 (38.3) 85 (23.4)20-25 437 (19.8) 185 (50.9)25-30 27 (1.2) 93 (25.6)WBC (±SD) P<0.05 11.54 (±3.28) 15.49 (±3.75)WBC: White blood cells, SD: Standard deviation
Table 4: Distribution of mean duration of hospitalization according to the perforated and non-perforatedAppendicitis Average±SDNon-perforated 1.85±1.03Perforated 4.24±2.39SD: Standard deviation
Table 5: Distribution of pathology and ultrasound fi ndings in perforated and non-perforated appendixUltrasound fi nding Non-perforated (%) Perforated (%)Appendicitis (+) 44.7 57.8Appendicitis (-) 55.3 42.2P value 0.715

Shirah, et al.: Perforated Appendix-Delayed Presentation not Delayed Intervention
35 International Journal of Scientifi c Study | April 2016 | Vol 4 | Issue 1
DISCUSSION
The delay in the diagnosis and management of acute appendicitis is proved to occur in a group of patients who present with the atypical clinical picture including those who had received narcotics or other strong analgesic medications. The fact that despite recent advances in laboratory and radiographic diagnostic tools, a high rate of complicated, gangrenous, or perforated appendicitis is still encountered necessitated the review of cases of appendicitis in regard to the time events starting from the initial presentation to the defi nitive treatment. Several clinical studies proved that the high rate of complicated acute appendicitis and the increased morbidity and mortality rates were primarily the direct results of the patient delay.13-15
Several clinical studies pointed to the preadmission delay on the part of the patient and the post admission delay on the part of the surgeon.15-17 The major fi nding of our study was that the time between the onset of symptoms and the presentation to the emergency department was signifi cantly longer in patients with a perforated appendix in comparison to patients with non-perforated acute appendicitis. Perforation of the appendix was proven in some clinical studies to increases the risk of complications up to 39%, and if there is no perforation
during the operation, this rate is about 8%.12,18 That was in accordance with our study results where the complication rates were 17% and 2.5% in the groups with and without perforation, respectively. The duration of postoperative hospitalization in patients who had perforated appendix was signifi cantly higher compared with the non-perforated.
In the last years, there have been ongoing debates on whether the delay of diagnosis is patient-related or surgeon-related factors. Our fi ndings were consistent with the results of many studies which concluded that perforation of the appendix has mainly depended on the duration of the preadmission factors.10,19-21 On the other hand, some studies had emphasized the role of the surgeon-related delay of diagnosis and treatment as a cause of complicated appendicitis.8 The main factor was the diagnostic uncertainty for doubtful presentations of appendicitis patients. To overcome this dilemma, many surgeons adopted the policy that it is possible to avoid perforation by an earlier operation.20,21
Many clinical studies outlined the role of preoperative radiological investigations in confi rming the diagnosis either by ultrasound or CT.22,23 In our study, the results of ultrasound investigations showed that the association between the ultrasound fi ndings and the pathology was highest in the perforated appendix group, but statistically no signifi cant difference was found. We interpreted this fi nding to the usefulness of ultrasound as the second important preoperative factor to the clinical examination, which we believe is the fi rst.
An article published in 2003, a prospective randomized clinical study compared the value of the clinical examination compared to CT scan in the diagnosis of acute appendicitis concluded that CT scan did not increase the accuracy of the diagnosis.24 In our study, we did not rely on the CT scan method because most of the cases with perforation presented in the preadmission period, and the clinical diagnosis was most important factor in the decision-making to admit and operate.
Some clinical studies10,25-27 reported that perforated appendicitis presented with high incidence in patients over 50 years of age, but in our study, the duration of appendicitis before presentation in comparison to the age factor was not found to cause a delay in admission, and no statistically signifi cant difference was found in the mean duration of pain before the presentation when we compared the patients under and over 50-year-old. The duration of symptoms was relatively long in female patients who had perforated appendix compared to male patients, but it was not found to be statistically signifi cant.
Figure 2: Body temperature in perforated and non-perforated
Table 6: Postoperative complications in perforated and non-perforated appendicitis patientsData Non-perforated
appendix groupPerforated
appendix groupComplications patients no 56 62Total no of patients 2210 363Paralytic ileus 17 30Urinary tract infection 12 13Wound infection 3 6Fever (atelectasis) 16 10Chest infection 9 3
Shirah, et al.: Perforated Appendix-Delayed Presentation not Delayed Intervention
36International Journal of Scientifi c Study | April 2016 | Vol 4 | Issue 1
According to our results, the delay of presentation is the major factor leading to acute appendicitis complications in general and perforation in particular. The clinical picture of appendix perforation is not affected by age or gender in our local society. One of the limitations of this study was the exclusion of patients under the age of 12 years as they could not be operated due to the absence of pediatric surgery in the hospital where the study was conducted. Another limitation was the referral system between hospitals at night hours with all possible causes of delay in transferring the patients for available surgical service.
Diagnosis of perforated appendicitis may be a diffi cult task and remains a clinical challenge in the emergency departments. Despite technologic advances, the diagnosis is still based primarily on the patient’s history and the physical examination, thus, on the surgeon’s clinical judgment. Careful attention to the patient’s history, a thorough physical examination, and early clinical review will minimize the possibility of a delay in diagnosis of acute appendicitis and its complications including perforation.
The observation of the late presentation due to the limitations of the referral system should be strongly addressed as it had affected the progression of acute appendicitis to a perforated appendix, especially in patients referred from other faraway medical centers.
CONCLUSIONS
We conclude that in our local community, the majority of perforated appendix cases were found to be associated with the delay in presentation rather than the delay in management.
REFERENCES
1. Shirah BH, Shirah HA. Wound infection in non-perforated acute appendicitis - Single dose preoperative antibiotics vs. Prophylactic postoperative antibiotics: Does it make any difference? Int J Res Med Sci 2016;4:225-30.
2. Pinto Leite N, Pereira JM, Cunha R, Pinto P, Sirlin C. CT evaluation of appendicitis and its complications: Imaging techniques and key diagnostic fi ndings. AJR Am J Roentgenol 2005;185:406-17.
3. Omari AH, Khammash MR, Qasaimeh GR, Shammari AK, Yaseen MK, Hammori SK. Acute appendicitis in the elderly: Risk factors for perforation. World J Emerg Surg. 2014;9:6.
4. Ng CP, Chiu HS, Chung CH. Signifi cance of appendicoliths in abdominal
pain. J Emerg Med 2003;24:459-61.5. Gürleyik G, Gürleyik E. Age-related clinical features in older patients with
acute appendicitis. Eur J Emerg Med 2003;10:200-3.6. Somoye G, Downes E. Clinical challenges of diagnosing a perforated
appendix in pregnancy: Two illustrative cases. J Obstet Gynaecol 2004;24:576-8.
7. Von Titte SN, McCabe CJ, Ottinger LW. Delayed appendectomy for appendicitis: Causes and consequences. Am J Emerg Med 1996;14:620-2.
8. Humes DJ, Simpson J. Acute appendicitis. BMJ 2006;333:530-4.9. Körner H, Söndenaa K, Söreide JA, Andersen E, Nysted A, Lende TH, et al.
Incidence of acute nonperforated and perforated appendicitis: Age-specifi c and sex-specifi c analysis. World J Surg 1997;21:313-7.
10. Horrow MM, White DS, Horrow JC. Differentiation of perforated from nonperforated appendicitis at CT. Radiology 2003;227:46-51.
11. Körner H, Söndenaa K, Söreide JA. Perforated and non-perforated acute appendicitis - One disease or two entities? Eur J Surg 2001;167:525-30.
12. Velanovich V, Satava R. Balancing the normal appendectomy rate with the perforated appendicitis rate: Implications for quality assurance. Am Surg 1992;58:264-9.
13. Garfi eld JL, Birkhahn RH, Gaeta TJ, Briggs WM. Diagnostic pathways and delays on route to operative intervention in acute appendicitis. Am Surg 2004;70:1010-3.
14. Rusnak RA, Borer JM, Fastow JS. Misdiagnosis of acute appendicitis: Common features discovered in cases after litigation. Am J Emerg Med 1994;12:397-402.
15. Pittman-Waller VA, Myers JG, Stewart RM, Dent DL, Page CP, Gray GA, et al. Appendicitis: Why so complicated? Analysis of 5755 consecutive appendectomies. Am Surg 2000;66:548-54.
16. Althoubaity FK. Suspected acute appendicitis in female patients. Trends in diagnosis in emergency department in a University Hospital in Western region of Saudi Arabia. Saudi Med J 2006;27:1667-73.
17. Kraemer M, Franke C, Ohmann C, Yang Q; Acute Abdominal Pain Study Group. Acute appendicitis in late adulthood: Incidence, presentation, and outcome. Results of a prospective multicenter acute abdominal pain study and a review of the literature. Langenbecks Arch Surg 2000;385:470-81.
18. Calder JD, Gajraj H. Recent advances in the diagnosis and treatment of acute appendicitis. Br J Hosp Med 1995;54:129-33.
19. Temple CL, Huchcroft SA, Temple WJ. The natural history of appendicitis in adults. A prospective study. Ann Surg 1995;221:278-81.
20. Maroju NK, Robinson SS, Sistla SC, Narasimhan R, Sahai A. Delay in surgery for acute appendicitis. ANZ J Surg 2004;74:773-6.
21. Eldar S, Nash E, Sabo E, Matter I, Kunin J, Mogilner JG, et al. Delay of surgery in acute appendicitis. Am J Surg 1997;173:194-8.
22. Rao PM, Rhea JT, Novelline RA, Mostafavi AA, McCabe CJ. Effect of computed tomography of the appendix on treatment of patients and use of hospital resources. N Engl J Med 1998;338:141-6.
23. Poortman P, Lohle PN, Schoemaker CM, Oostvogel HJ, Teepen HJ, Zwinderman KA, et al. Comparison of CT and sonography in the diagnosis of acute appendicitis: A blinded prospective study. AJR Am J Roentgenol 2003;181:1355-9.
24. Hong JJ, Cohn SM, Ekeh AP, Newman M, Salama M, Leblang SD; Miami Appendicitis Group. A prospective randomized study of clinical assessment versus computed tomography for the diagnosis of acute appendicitis. Surg Infect (Larchmt) 2003;4:231-9.
25. Hale DA, Molloy M, Pearl RH, Schutt DC, Jaques DP. Appendectomy: A contemporary appraisal. Ann Surg 1997;225:252-61.
26. Moss JG, Barrie JL, Gunn AA. Delay in surgery for acute appendicitis. J R Coll Surg Edinb 1985;30:290-3.
27. Paajanen H, Kettunen J, Kostiainen S. Emergency appendectomies in patients over 80 years. Am Surg 1994;60:950-3.
How to cite this article: Shirah BH, Shirah HA, Alhaidari WA. Perforated Appendix - Delay in Presentation Rather Than Delay in the Surgical Intervention: Retrospective Database Analysis of 2573 Saudi Arabian Patients in 10 Years. Int J Sci Stud 2016;4(1):32-36.
Source of Support: Nil, Confl ict of Interest: None declared.
37 International Journal of Scientifi c Study | April 2016 | Vol 4 | Issue 1
Gingival Enlargement and Seizure-related Oro-dental Injuries in Patients with EpilepsyY Shweta Somasundara1, H L Jayakumar2, G T Subhas3, K P Suresh4
1Reader, Department of Public Health Dentistry, RajaRajeswari Dental College and Hospital, Bengaluru, Karnataka, India, 2Professor and HOD, Department of Preventive and Community Dentistry, AECS Maruti College of Dental Sciences and Research Centre, Bengaluru, Karnataka, India, 3Professor, Department of Neurology, Bengaluru Medical College and Research Institute, Special Offi cer, Pradhan Mantri Swasthya Suraksha Yojana Super-speciality Hospital Block of Victoria Hospital, Bengaluru, Karnataka, India, 4Sr. Scientist, National Institute of Veterinary Epidemiology and Disease Informatics (NIVEDI), Bengaluru, Karnataka, India
with PHT.2 Gingival enlargement is also a side effect of other antiepileptic drugs (AEDs) such as barbiturate, sodium valproate, carbamazepine, and vigabatrin therapy. Clinical manifestation of gingival enlargement frequently appears within 1-3 months after initiation of treatment with the associated medications. GO normally begins at the interdental papillae and is more frequently found in the anterior segment of the labial surfaces. Gradually, gingival lobulations are formed that may appear infl amed or more fi brotic in nature, depending on the degree of local factor-induced infl ammation.3 The fi brotic enlargement normally is confi ned to the attached gingiva but may extend coronally and interfere with esthetics, mastication, or speech. Disfi guring GO triggered by these medications is not only displeasing but often impairs nutrition and access for oral hygiene, resulting in retention of food
INTRODUCTION
Gingival overgrowth (GO) or gingival enlargement is one of the most frequent and troublesome adverse effects associated with the administration of the anticonvulsant drug phenytoin (PHT), calcium channel blockers such as nifedipine, and the immunosuppressant cyclosporine.1 It has been reported to occur in 16-94% of patients treated
Original Article
Abstract
Background: Patients living with epilepsy suffer from the adverse effects of antiepileptic medication such as gingival enlargement and traumatic injuries of the oral cavity related to the epileptic seizures. This study aimed to assess the prevalence of gingival enlargement and seizure-related oro-dental injuries among patients with epilepsy.
Materials and Methods: This descriptive cross-sectional study included 500 consecutive patients with epilepsy attending the Outpatient Department of Neurology at a tertiary care hospital in Bengaluru, India. Patients were categorized into four groups according to the dental risk factors and manageability.
Results: Gingival enlargement was observed in 59% of patients on phenytoin (PHT) therapy. Among them, 33% of patients were on PHT monotherapy and 67% were on PHT polytherapy. Of the 120 subjects with gingival enlargement, 49% had moderate enlargement while 10% had a severe enlargement. Oro-mucosal injuries were signifi cantly more in the study population as compared to injuries of the teeth and jaws. This comparison across the groups was statistically signifi cant (P < 0.03). Trauma to the tongue, cheek biting, lip injury, fracture and loss of teeth, and jaw fractures were seen only in patients with generalized tonic-clonic seizures (Groups II, III, and IV). Lip injury, cheek biting, trauma to tongue, loss of teeth, and jaw fracture were all signifi cantly associated (P < 0.05) with seizures occurring more than once a year.
Conclusions: The prevalence of gingival enlargement and seizure-related hard and soft tissue injuries of the oral cavity in patients with epilepsy supported the need for an interdisciplinary approach and targeted oral health promotion to ameliorate the oral health of these patients with epilepsy.
Key words: Antiepileptic drugs, Dental injury, Epilepsy, Fracture, Gingival enlargement, Seizure
Access this article online
www.ijss-sn.com
Month of Submission : 02-2016Month of Peer Review : 03-2016Month of Acceptance : 04-2016Month of Publishing : 04-2016
Corresponding Author: Y Shweta Somasundara, Department of Public Health Dentistry, RajaRajeswari Dental College and Hospital, No.14, Ramohalli Cross, Kumbalgodu, Mysore Road, Bengaluru - 560 074, Karnataka, India. Phone: +91-9980563543. E-mail: [email protected]
DOI: 10.17354/ijss/2016/184
Somasundara, et al.: Gingival Enlargement and Seizure-related Oro-dental Injuries
38International Journal of Scientifi c Study | April 2016 | Vol 4 | Issue 1
and debris, halitosis, an increased susceptibility to oral infections, caries, and periodontal diseases.3 The gingival tissue overgrowth may also lead to delayed eruption of the teeth and sometimes malalignment of teeth.4
Patients with epilepsy have increased the risk of dental and maxillofacial trauma. Falls during seizures can cause soft tissue lacerations, facial fractures, temporomandibular joint subluxation, and devitalization, fractures, and subluxation or avulsion of teeth.5 In a report, the proportion of people who sustained various injuries during a seizure and had at least one seizure during the previous year was: 24% sustained at least one head injury, 16% sustained a burn or scald, 10% a dental injury, and 6% some other fracture.6 Studies have shown an increased prevalence of traumatic anterior dental injuries in patients with epilepsy as compared with the prevalence reported for those without epilepsy.7 In patients with epilepsy and AEDs, the incidence of fractures is 2-6 times higher compared to the general population.8 Relatively, little has been reported in the literature about the incidence and nature of non-fatal seizure-related injuries of the craniofacial complex, especially the oro-dental injuries among the patients living with epilepsy in India.
This study was carried out to assess the oral health status and dental treatment needs and also the seizure-related injuries of the oral cavity, among patients living with epilepsy, who attended the Outpatient Department of Neurology at a tertiary care government teaching hospital in Bengaluru, Karnataka, India. The prevalence of gingival enlargement and seizure-related oro-dental injuries is reported in this paper; the oral health status and dental treatment needs will be described in a subsequent publication.
MATERIALS AND METHODS
This descriptive cross-sectional study was carried out on 500 consecutive epileptic patients visiting the Outpatient Department (OPD) of the Department of Neurology of a tertiary care Government teaching hospital in Bengaluru city, during 2008-2009. Patients fulfi lling the following eligibility criteria were included in the study: Persons aged above 5 years, diagnosed with epilepsy as per the case defi nition of epilepsy given by the Commission on Epidemiology and Prognosis, International League Against Epilepsy,9 who had been under treatment for at least six months duration (as per the patients’ case records) before the day of dental examination. Individuals who had only febrile seizures or only neonatal seizures, and those who were concurrently on other medications known to cause gingival enlargement and were not included in the study. Informed consent and ethical clearance were obtained.
The clinical and diagnostic features of the patient’s epilepsy were sought from the case records and from interviewing the patients if required. A specially designed proforma in a structured questionnaire format was used to collect information on patients’ demographic details, oral hygiene practices, epileptic history (age of onset, most recent occurrence of seizure, type and frequency of seizure, time of attacks, aura, involvement of masticatory system, AED therapy), including details of seizure-related injuries to the oral cavity, visits to dentist, and categorize patients into 4 groups according to the dental risk factors and manageability. Epileptic patients were categorized, with the help of the neurologist, into dental subgroups, as given in the classifi cation by Károlyházy et al.10
The oral examination of all patients was carried out in the Outpatient Department of the Department of Neurology, Victoria hospital, by a single investigator (S.S.Y) after calibration to limit intra-examiner variability. Information on gingival enlargement was recorded on the WHO oral health assessment form (1997),11 and the grading for gingival enlargement was done as follows: The dentition was divided into six sextants as used for the Community Periodontal index (CPI index).11 Probing depth (PD) measured by a CPI probe (Hu-Friedy) was used as a marker of the development and progression of gingival enlargement (none: PD ≤ 3 mm, moderate: PD 3-5 mm, and severe: >5 mm). The tooth with the most serious gingival condition in each sextant was selected as representative.1
The data were analyzed using SPSS 15.0 software package. Univariate and Bivariate frequency tables were generated with percentages for comparison of various categories between groups. Descriptive statistics were computed for continuous variables studied. Association for some key variables and groups were studied using Chi-square test statistic with appropriate degrees of freedom. Z-test for proportion based on binomial distribution has been used to fi nd the signifi cance of association of seizure-related injuries with the study characteristics. Any P < 0.05 was considered to be statistically signifi cant.
RESULTS
A total of 500 patients with epilepsy, in the age range of 5-85 years, were examined, out of which 302 (60.4%) were males (mean age 30.80 ± 14.18 years) and 198 (39.6%) were females (mean age 28.48 ± 11.57 years). As per the classifi cation of patients based on dental risk factors and manageability, the study subjects belonged to one of the 4 groups as follows: 8% (n = 40) were in Group I, 68.2% (n = 341) in Group II, 20.4% (n = 102) in Group III, and 3.4% (n = 17) in Group IV.
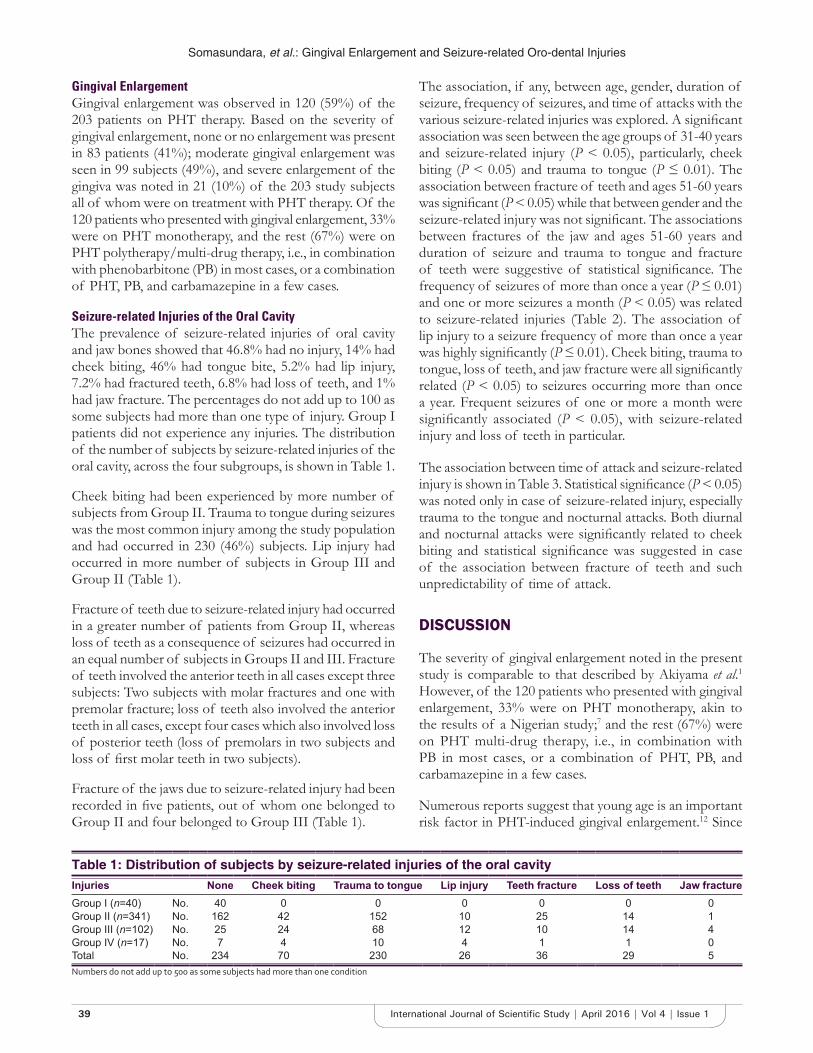
Somasundara, et al.: Gingival Enlargement and Seizure-related Oro-dental Injuries
39 International Journal of Scientifi c Study | April 2016 | Vol 4 | Issue 1
Gingival EnlargementGingival enlargement was observed in 120 (59%) of the 203 patients on PHT therapy. Based on the severity of gingival enlargement, none or no enlargement was present in 83 patients (41%); moderate gingival enlargement was seen in 99 subjects (49%), and severe enlargement of the gingiva was noted in 21 (10%) of the 203 study subjects all of whom were on treatment with PHT therapy. Of the 120 patients who presented with gingival enlargement, 33% were on PHT monotherapy, and the rest (67%) were on PHT polytherapy/multi-drug therapy, i.e., in combination with phenobarbitone (PB) in most cases, or a combination of PHT, PB, and carbamazepine in a few cases.
Seizure-related Injuries of the Oral CavityThe prevalence of seizure-related injuries of oral cavity and jaw bones showed that 46.8% had no injury, 14% had cheek biting, 46% had tongue bite, 5.2% had lip injury, 7.2% had fractured teeth, 6.8% had loss of teeth, and 1% had jaw fracture. The percentages do not add up to 100 as some subjects had more than one type of injury. Group I patients did not experience any injuries. The distribution of the number of subjects by seizure-related injuries of the oral cavity, across the four subgroups, is shown in Table 1.
Cheek biting had been experienced by more number of subjects from Group II. Trauma to tongue during seizures was the most common injury among the study population and had occurred in 230 (46%) subjects. Lip injury had occurred in more number of subjects in Group III and Group II (Table 1).
Fracture of teeth due to seizure-related injury had occurred in a greater number of patients from Group II, whereas loss of teeth as a consequence of seizures had occurred in an equal number of subjects in Groups II and III. Fracture of teeth involved the anterior teeth in all cases except three subjects: Two subjects with molar fractures and one with premolar fracture; loss of teeth also involved the anterior teeth in all cases, except four cases which also involved loss of posterior teeth (loss of premolars in two subjects and loss of fi rst molar teeth in two subjects).
Fracture of the jaws due to seizure-related injury had been recorded in fi ve patients, out of whom one belonged to Group II and four belonged to Group III (Table 1).
The association, if any, between age, gender, duration of seizure, frequency of seizures, and time of attacks with the various seizure-related injuries was explored. A signifi cant association was seen between the age groups of 31-40 years and seizure-related injury (P < 0.05), particularly, cheek biting (P < 0.05) and trauma to tongue (P ≤ 0.01). The association between fracture of teeth and ages 51-60 years was signifi cant (P < 0.05) while that between gender and the seizure-related injury was not signifi cant. The associations between fractures of the jaw and ages 51-60 years and duration of seizure and trauma to tongue and fracture of teeth were suggestive of statistical signifi cance. The frequency of seizures of more than once a year (P ≤ 0.01) and one or more seizures a month (P < 0.05) was related to seizure-related injuries (Table 2). The association of lip injury to a seizure frequency of more than once a year was highly signifi cantly (P ≤ 0.01). Cheek biting, trauma to tongue, loss of teeth, and jaw fracture were all signifi cantly related (P < 0.05) to seizures occurring more than once a year. Frequent seizures of one or more a month were signifi cantly associated (P < 0.05), with seizure-related injury and loss of teeth in particular.
The association between time of attack and seizure-related injury is shown in Table 3. Statistical signifi cance (P < 0.05) was noted only in case of seizure-related injury, especially trauma to the tongue and nocturnal attacks. Both diurnal and nocturnal attacks were signifi cantly related to cheek biting and statistical signifi cance was suggested in case of the association between fracture of teeth and such unpredictability of time of attack.
DISCUSSION
The severity of gingival enlargement noted in the present study is comparable to that described by Akiyama et al.1 However, of the 120 patients who presented with gingival enlargement, 33% were on PHT monotherapy, akin to the results of a Nigerian study;7 and the rest (67%) were on PHT multi-drug therapy, i.e., in combination with PB in most cases, or a combination of PHT, PB, and carbamazepine in a few cases.
Numerous reports suggest that young age is an important risk factor in PHT-induced gingival enlargement.12 Since
Table 1: Distribution of subjects by seizure-related injuries of the oral cavityInjuries None Cheek biting Trauma to tongue Lip injury Teeth fracture Loss of teeth Jaw fractureGroup I (n=40) No. 40 0 0 0 0 0 0Group II (n=341) No. 162 42 152 10 25 14 1Group III (n=102) No. 25 24 68 12 10 14 4Group IV (n=17) No. 7 4 10 4 1 1 0Total No. 234 70 230 26 36 29 5Numbers do not add up to 500 as some subjects had more than one condition
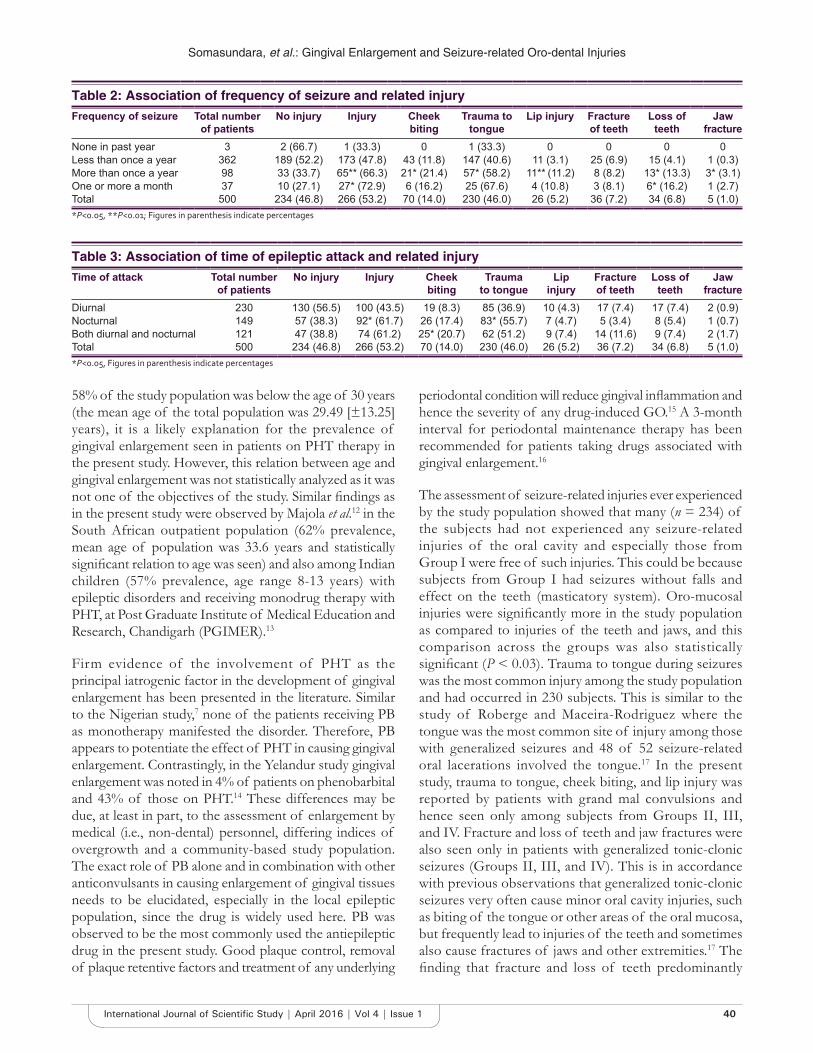
Somasundara, et al.: Gingival Enlargement and Seizure-related Oro-dental Injuries
40International Journal of Scientifi c Study | April 2016 | Vol 4 | Issue 1
58% of the study population was below the age of 30 years (the mean age of the total population was 29.49 [±13.25] years), it is a likely explanation for the prevalence of gingival enlargement seen in patients on PHT therapy in the present study. However, this relation between age and gingival enlargement was not statistically analyzed as it was not one of the objectives of the study. Similar fi ndings as in the present study were observed by Majola et al.12 in the South African outpatient population (62% prevalence, mean age of population was 33.6 years and statistically signifi cant relation to age was seen) and also among Indian children (57% prevalence, age range 8-13 years) with epileptic disorders and receiving monodrug therapy with PHT, at Post Graduate Institute of Medical Education and Research, Chandigarh (PGIMER).13
Firm evidence of the involvement of PHT as the principal iatrogenic factor in the development of gingival enlargement has been presented in the literature. Similar to the Nigerian study,7 none of the patients receiving PB as monotherapy manifested the disorder. Therefore, PB appears to potentiate the effect of PHT in causing gingival enlargement. Contrastingly, in the Yelandur study gingival enlargement was noted in 4% of patients on phenobarbital and 43% of those on PHT.14 These differences may be due, at least in part, to the assessment of enlargement by medical (i.e., non-dental) personnel, differing indices of overgrowth and a community-based study population. The exact role of PB alone and in combination with other anticonvulsants in causing enlargement of gingival tissues needs to be elucidated, especially in the local epileptic population, since the drug is widely used here. PB was observed to be the most commonly used the antiepileptic drug in the present study. Good plaque control, removal of plaque retentive factors and treatment of any underlying
periodontal condition will reduce gingival infl ammation and hence the severity of any drug-induced GO.15 A 3-month interval for periodontal maintenance therapy has been recommended for patients taking drugs associated with gingival enlargement.16
The assessment of seizure-related injuries ever experienced by the study population showed that many (n = 234) of the subjects had not experienced any seizure-related injuries of the oral cavity and especially those from Group I were free of such injuries. This could be because subjects from Group I had seizures without falls and effect on the teeth (masticatory system). Oro-mucosal injuries were signifi cantly more in the study population as compared to injuries of the teeth and jaws, and this comparison across the groups was also statistically signifi cant (P < 0.03). Trauma to tongue during seizures was the most common injury among the study population and had occurred in 230 subjects. This is similar to the study of Roberge and Maceira-Rodriguez where the tongue was the most common site of injury among those with generalized seizures and 48 of 52 seizure-related oral lacerations involved the tongue.17 In the present study, trauma to tongue, cheek biting, and lip injury was reported by patients with grand mal convulsions and hence seen only among subjects from Groups II, III, and IV. Fracture and loss of teeth and jaw fractures were also seen only in patients with generalized tonic-clonic seizures (Groups II, III, and IV). This is in accordance with previous observations that generalized tonic-clonic seizures very often cause minor oral cavity injuries, such as biting of the tongue or other areas of the oral mucosa, but frequently lead to injuries of the teeth and sometimes also cause fractures of jaws and other extremities.17 The fi nding that fracture and loss of teeth predominantly
Table 3: Association of time of epileptic attack and related injuryTime of attack Total number
of patientsNo injury Injury Cheek
bitingTrauma
to tongueLip
injuryFracture of teeth
Loss of teeth
Jaw fracture
Diurnal 230 130 (56.5) 100 (43.5) 19 (8.3) 85 (36.9) 10 (4.3) 17 (7.4) 17 (7.4) 2 (0.9)Nocturnal 149 57 (38.3) 92* (61.7) 26 (17.4) 83* (55.7) 7 (4.7) 5 (3.4) 8 (5.4) 1 (0.7)Both diurnal and nocturnal 121 47 (38.8) 74 (61.2) 25* (20.7) 62 (51.2) 9 (7.4) 14 (11.6) 9 (7.4) 2 (1.7)Total 500 234 (46.8) 266 (53.2) 70 (14.0) 230 (46.0) 26 (5.2) 36 (7.2) 34 (6.8) 5 (1.0)*P<0.05, Figures in parenthesis indicate percentages
Table 2: Association of frequency of seizure and related injuryFrequency of seizure Total number
of patientsNo injury Injury Cheek
bitingTrauma to
tongueLip injury Fracture
of teethLoss of
teethJaw
fractureNone in past year 3 2 (66.7) 1 (33.3) 0 1 (33.3) 0 0 0 0Less than once a year 362 189 (52.2) 173 (47.8) 43 (11.8) 147 (40.6) 11 (3.1) 25 (6.9) 15 (4.1) 1 (0.3)More than once a year 98 33 (33.7) 65** (66.3) 21* (21.4) 57* (58.2) 11** (11.2) 8 (8.2) 13* (13.3) 3* (3.1)One or more a month 37 10 (27.1) 27* (72.9) 6 (16.2) 25 (67.6) 4 (10.8) 3 (8.1) 6* (16.2) 1 (2.7)Total 500 234 (46.8) 266 (53.2) 70 (14.0) 230 (46.0) 26 (5.2) 36 (7.2) 34 (6.8) 5 (1.0)*P<0.05, **P<0.01; Figures in parenthesis indicate percentages

Somasundara, et al.: Gingival Enlargement and Seizure-related Oro-dental Injuries
41 International Journal of Scientifi c Study | April 2016 | Vol 4 | Issue 1
affected the anterior teeth in the present study is similar to that reported in the Nigerian study.7 In the study by Buck et al., 28 of 344 epilepsy patients had seizure-related tooth injuries within 1 year.6 These might occur as a result of the fall or of the forceful contraction of the masticatory muscles during both the tonic and clonic phases. Thus, the exertion and risk of injury of the teeth of patients with frequent generalized tonic-clonic seizures (Group III) are very much increased, contributing to the compromised dental health status.10
The association, if any, between age, gender, duration of seizure, frequency of seizures, and time of attacks with the various seizure-related injuries was explored. The association between fracture of teeth and ages 51-60 years was signifi cant (P < 0.05), whereas that between gender and the seizure-related injury was not signifi cant, which is in accordance with the study of Tiamkao and Shorvon.18 The frequency of seizures of more than once a year (P ≤ 0.01) and one or more seizures a month (P < 0.05) was defi nitely related to seizure-related injuries, and this finding is supported by other studies; the study by Buck et al. showed that seizure severity, type, and frequency were the best predictors of all types of injury (head injury, burns/scalds, dental injury including loss of teeth, jaw fracture, admission to hospital and major dental surgery, other fractures, and seizures while bathing/swimming) and having tonic-clonic seizures or the combination of tonic-clonic and other seizures and at least three drug-related adverse effects signifi cantly increased the chances of sustaining dental trauma.6 Lip injury, cheek biting, trauma to tongue, loss of teeth, and jaw fracture were all signifi cantly associated (P < 0.05) with seizures occurring more than once a year. Frequent seizures of one or more a month were signifi cantly associated (P < 0.05) with seizure-related injury and loss of teeth in particular. The study by Tiamkao and Shorvon also reported that signifi cant risk factors for injury were generalized tonic-clonic seizures, high frequency of seizures, and seizures with a fall.18
Thus, the classification of epileptic patients10 used in the present study makes it useful for the study of seizure-related injuries of the oral cavity. However, a prospective study, wherein patients or care givers could maintain a dairy recording the occurrence of seizures, and seizure-related injuries would reduce recall error, problems of inadequate medical documentation, especially of minor injuries and be better suited to elicit valid and reliable data on the seizure-related injuries of the oral cavity. The present study, being restricted to the hospital outpatients only, may not be adequately representative of all epileptic patients in the community. This limits the generalizability of the fi ndings.
This study is a foray into an area of oral health research that has barely been investigated in the Indian context. The data on seizure-related injuries of the oral cavity add to the sparse literature19 available in this regard.
CONCLUSION
Interdisciplinary collaboration, referral by the neurologist for preventive dental care including adequate dental plaque control measures as well as thorough examination of the injuries to the oral cavity to rule out occult maxillofacial trauma can help improve the overall health and quality of life of patients with epilepsy.
ACKNOWLEDGMENT
The authors thank Dr. Diwakar and Dr. Reddy, Department of Neurology, Victoria Hospital for their support during the data collection.
REFERENCES
1. Akiyama S, Amano A, Kato T, Takada Y, Kimura KR, Morisaki I. Relationship of periodontal bacteria and Porphyromonas gingivalis fi mA variations with phenytoin-induced gingival overgrowth. Oral Dis 2006;12:51-6.
2. Cornacchio AL, Burneo JG, Aragon CE. The effects of antiepileptic drugs on oral health. J Can Dent Assoc 2011;77:b140.
3. Dongari-Bagtzoglou A; Research, Science and Therapy Committee, American Academy of Periodontology. Drug-associated gingival enlargement. J Periodontol 2004;75:1424-31.
4. Sanders BJ, Weddell JA, Dodge NN. Managing patients who have seizure disorders: Dental and medical issues. J Am Dent Assoc 1995;126:1641-7.
5. Vorkas CK, Gopinathan MK, Singh A, Devinsky O, Lin LM, Rosenberg PA. Epilepsy and dental procedures. A review. N Y State Dent J 2008;74:39-43.
6. Buck D, Baker GA, Jacoby A, Smith DF, Chadwick DW. Patients’ experiences of injury as a result of epilepsy. Epilepsia 1997;38:439-44.
7. Ogunbodede EO, Adamolekun B, Akintomide AO. Oral health and dental treatment needs in Nigerian patients with epilepsy. Epilepsia 1998;39:590-4.
8. Beerhorst K, Schouwenaars FM, Tan IY, Aldenkamp AP. Epilepsy: Fractures and the role of cumulative antiepileptic drug load. Acta Neurol Scand 2012;125:54-9.
9. Guidelines for epidemiologic studies on epilepsy. Commission on Epidemiology and Prognosis, International League Against Epilepsy. Epilepsia 1993;34:592-6.
10. Károlyházy K, Kovács E, Kivovics P, Fejérdy P, Arányi Z. Dental status and oral health of patients with epilepsy: An epidemiologic study. Epilepsia 2003;44:1103-8.
11. World Health Organization. Oral Health Surveys : Basic Methods. 4th ed. Geneva: World Health Organization; 1997.
12. Majola MP, McFadyen ML, Connolly C, Nair YP, Govender M, Laher MH. Factors infl uencing phenytoin-induced gingival enlargement. J Clin Periodontol 2000;27:506-12.
13. Prasad VN, Chawla HS, Goyal A, Gauba K, Singhi P. Incidence of phenytoin induced gingival overgrowth in epileptic children: A six month evaluation. J Indian Soc Pedod Prev Dent 2002;20:73-80.
14. Mani KS, Rangan G, Srinivas HV, Srindharan VS, Subbakrishna DK. Epilepsy control with phenobarbital or phenytoin in rural south India: The Yelandur study. Lancet 2001;357:1316-20.
15. Seymour RA. Effects of medications on the periodontal tissues in health

Somasundara, et al.: Gingival Enlargement and Seizure-related Oro-dental Injuries
42International Journal of Scientifi c Study | April 2016 | Vol 4 | Issue 1
and disease. Periodontol 2000 2006;40:120-9.16. Hall EE. Prevention and treatment considerations in patients with
drug-induced gingival enlargement. Curr Opin Periodontol 1997;4:59-63.17. Roberge RJ, Maceira-Rodriguez L. Seizure-related oral lacerations:
Incidence and distribution. J Am Dent Assoc 1985;111:279-80.
18. Tiamkao S, Shorvon SD. Seizure-related injury in an adult tertiary epilepsy clinic. Hong Kong Med J 2006;12:260-3.
19. Ghafoor PA, Rafeeq M, Dubey A. Assessment of oral side effects of Antiepileptic drugs and traumatic oro-facial injuries encountered in Epileptic children. J Int Oral Health 2014;6:126-8.
How to cite this article: Somasundara YS, Jayakumar HL, Subhas GT, Suresh KP. Gingival Enlargement and Seizure-related Oro-dental Injuries in Patients with Epilepsy. Int J Sci Stud 2016;4(1):37-42.
Source of Support: Nil, Confl ict of Interest: None declared.
43 International Journal of Scientifi c Study | April 2016 | Vol 4 | Issue 1
Comparison of Clonidine and Dexmedetomidine on Cardiovascular Stability in Laparoscopic CholecystectomyDevang Bharti1, Juhi Saran2, Chetan Kumar3, H S Nanda4
1Post Graduate Trainee, Department of Anaesthesiology, Shri Ram Murti Smarak Institute of Medical Sciences, Bareilly, Uttar Pradesh, India, 2Professor, Department of Anaesthesiology, Shri Ram Murti Smarak Institute of Medical Sciences, Bareilly, Uttar Pradesh, India, 3Assistant Professor, Department of Anaesthesiology, Shri Ram Murti Smarak Institute of Medical Sciences, Bareilly, Uttar Pradesh, India, 4Professor and Head, Department of Anaesthesiology, Shri Ram Murti Smarak Institute of Medical Sciences, Bareilly, Uttar Pradesh, India
the gold standard for the treatment of cholelithiasis. Since the introduction of diagnostic laparoscopic procedures in early 1970’s and the fi rst laparoscopic cholecystectomy procedures in late 1980’s, laparoscopy has expanded impressively both in scope and volume. Increasing the success of laparoscopic surgery can be attributed to the fact that it results in multiple benefi ts compared with open procedures such as reduced trauma to the patient, disturbance of homeostasis, morbidity, mortality, recovery time, and hospital stay with a consequent reduction in healthcare costs.
Despite multiple benefi ts, all laparoscopic surgeries are challenging from an anesthesia point of view, mainly due to signifi cant alteration of hemodynamics, resulting
INTRODUCTION
Laparoscopic surgery is a modern surgical technique involving insufflation of gas (usually CO2) into the peritoneal cavity, under pressure, to separate the organs from the abdominal cavity.1 Laparoscopic cholecystectomy has revolutionized gall bladder surgeries and it has now become
Original Article
Abstract
Introduction: Laparoscopic cholecystectomy has revolutionized gall bladder surgeries and it has now become the gold standard for the treatment of cholelithiasis. Despite multiple benefi ts, all laparoscopic surgeries are challenging from an anesthesia point of view, mainly due to signifi cant alteration of hemodynamics. Numerous agents and combination of agents have been used in an effort to minimize the hemodynamic instability during this period, but search for an ideal agent to control this instability in hemodynamics is still on. In this study, it has been attempted to compare the benefi cial effect of the two α2 agonists, clonidine and dexmedetomidine, in maintaining perioperative parameters like mean arterial pressure (MAP) and heart rate (HR).
Purpose: To assess the effi cacies of clonidine and dexmedetomidine in maintaining hemodynamic stability during laparoscopic cholecystectomy.
Materials and Methods: Patients were randomly divided into three groups, who received 0.9% normal saline infusion, 3 mcg/kg/h of clonidine infusion, and 0.2 mcg/kg/h of dexmedetomidine infusion, intravenously. Intraoperative hemodynamic stability was assessed by monitoring HR, MAP and requirement of isofl urane in the three groups.
Results: Clonidine and dexmedetomidine caused signifi cant reductions in intraoperative HR, MAP and requirement of isofl urane when compared to the control (normal saline) group. Clonidine caused a signifi cant reduction in HR when compared to dexmedetomidine. No signifi cant differences were observed in MAP and requirement of isofl urane between the two drugs.
Conclusion: Both clonidine and dexmedetomidine favorably alter the intraoperative hemodynamics during laparoscopic cholecystectomy. Clonidine decreased intraoperative HR more than dexmedetomidine.
Key words: Clonidine, Dexmedetomidine, Hemodynamic stability, Inhalational agent sparing effect, Laparoscopic cholecystectomy
Access this article online
www.ijss-sn.com
Month of Submission : 02-2016Month of Peer Review : 03-2016Month of Acceptance : 04-2016Month of Publishing : 04-2016
Corresponding Author: Dr. Devang Bharti, Post Graduate Trainee, Department of Anaesthesiology, Shri Ram Murti Smarak Institute of Medical Sciences, Bareilly, Uttar Pradesh, India. Email id: [email protected]
DOI: 10.17354/ijss/2016/185
Bharti, et al.: Clonidine v/s Dexmedetomidine in Laparoscopic Cholecystectomy
44International Journal of Scientifi c Study | April 2016 | Vol 4 | Issue 1
from the combined effects of pneumoperitoneum, patient position, and hypercapnia from the absorbed CO2. Pneumoperitoneum creation raises the intra-abdominal pressure (IAP) and is immediately followed by an increased plasma renin activity and increase in plasma norepinephrine and epinephrine levels. There is also an increase in the circulating blood volume, which is due to the shifting of blood from the splanchnic capacitance blood vessels to the systemic circulation. All these changes collectively lead to an elevated arterial pressure, increased systemic and pulmonary vascular resistance, and decreased cardiac output. These hemodynamic responses are well tolerated in otherwise healthy individuals, but in patients with hypertension, coronary heart disease, cerebrovascular disease, and intracranial aneurysm; these transient changes can result in potentially deleterious effects such as left ventricular failure, pulmonary edema, myocardial ischemia, ventricular dysrhythmias, and cerebral hemorrhage.2,3
Numerous agents and combination of agents have been used in an effort to minimize the hemodynamic instability during this period. Volatile agents such as isoflurane and sevofl urane3 have been used with limited success in maintaining hemodynamic stability as volatile agents decrease surgical stimulus induced catecholamine secretion. Opioids have traditionally been used for blunting the perioperative stress response during general anesthesia. General anesthesia has been supplemented on occasions with intraoperative infusions of propofol, due to its intrinsic ability to inhibit catecholamine secretion, and infusions of nitroglycerine or beta blockers, to control perioperative stress. Combined general with epidural anesthesia4 is yet another strategy employed by anesthesiologists to control perioperative hemodynamic instability with limited success. But search for an ideal agent to control this instability in hemodynamics is still on.
α2 agonists produce diverse responses, including analgesia, anxiolysis, sedation, and sympatholysis, each of which has been reported to be useful in the treatment of patients with surgical and chronic pain. The Food and Drug Administration has approved two novel α2 adrenergic agonists, clonidine and dexmedetomidine, for intravenous administration.5
Clonidine, with elimination half-life of 6-10 h, is a centrally acting selective partial α2 agonist (220:1 α2 to α1). It is known to induce sedation, decrease anesthetic drug requirement and improve perioperative hemodynamics by attenuating blood pressure and heart rate (HR) responses to surgical stimulation, and protect against perioperative myocardial ischemia. It provides sympathoadrenal stability and suppresses renin-angiotensin activity. There are studies
indicating benefi ts of using clonidine for maintenance of hemodynamic stability in laparoscopic cholecystectomy.
Dexmedetomidine, with elimination half-life of 2-3 h, is a highly selective and potent α2 agonist (1620:1 α2 to α1), and is seven to ten times more selective for α2 receptors compared to clonidine, and has a shorter duration of action. Dexmedetomidine is considered full agonist at α2 receptors as compared to clonidine, which is considered a partial agonist. Similar to clonidine, dexmedetomidine, also attenuates the hemodynamic response to tracheal intubation, decreases plasma catecholamine concentration during anesthesia and decreases perioperative requirements of inhaled anesthetics.6
Laparoscopic cholecystectomy is a routinely performed surgery and it is desirable to have a stable intraoperative hemodynamic status. Hence, in this study, it has been attempted to compare the benefi cial effect of the two α2 agonists, clonidine and dexmedetomidine, in maintaining perioperative parameters like mean arterial pressure (MAP) and HR.
MATERIALS AND METHODS
The study entitled “Comparison of clonidine and dexmedetomidine on cardiovascular stability in laparoscopic cholecystectomy” was carried on 120 American Society of Anesthesiologists (ASA) Grades I and II patients of either sex with comparable characteristics in the Department of Anaesthesiology, Critical Care and Pain Management, Shri Ram Murti Smarak Institute of Medical Sciences, Bareilly, Uttar Pradesh, India.
The study was conducted after obtaining approval from the ethical, academic committee and a written, informed consent from the patients.
The study was conducted in three groups comprising 40 patients each.1. Group 1 (control group): Received 0.9% normal saline
infusion2. Group 2 (clonidine group): Received 3 mcg/kg/h of
clonidine in 0.9% normal saline3. Group 3 (dexmedetomidine group): Received
0.2 mcg/kg/h of dexmedetomidine in 0.9% normal saline.
Exclusion Criteria1. Patient refusal2. Patients with known hypersensitivity to the drugs used
in the study3. Patients less than 18 years or more than 60 years of
age
Bharti, et al.: Clonidine v/s Dexmedetomidine in Laparoscopic Cholecystectomy
45 International Journal of Scientifi c Study | April 2016 | Vol 4 | Issue 1
4. ASA Grades III and IV patients5. Patients with cardiac disorders6. Patients with hepatic dysfunction7. Patients with renal dysfunction8. Hypertensive patients9. Patients with basal HR less than 55 bpm10. Pregnant and lactating patients.
Furthermore, surgeries lasting for more than 120 min were not considered in the study.
The study drug was provided as prefilled and coded identical 20 mL syringes containing study drugs, as per the randomization protocol, in dilutions of:1. Normal saline 0.9% - 20 ml2. Clonidine - 20 ml (30 mcg/mL)3. Dexmedetomidine - 20 ml (2 mcg/mL).
The investigators involved in the study did not know about the content of the drug infusion syringes. Patients were explained about the study but did not know which drug was used. The study drug prefi lled and coded syringes were obtained on the day of the surgery from a third person not directly involved in the study. Randomization was ensured by picking up a chit from a pool of 120 chits to decide which drug to administer to a particular patient.
Preanesthetic check-up, comprising detailed history and thorough physical examination, of all the patients was done 1 day before the surgery. The following investigations were performed:• Hemoglobin, packed cell volume• Total leukocyte count, differential leukocyte count,
Erythrocyte sedimentation rate• Platelet count• Prothrombin time, partial thromboplastin time• Random blood sugar• Kidney function test • Liver function test• Serum electrolytes• Electrocardiogram (ECG)• Chest X-ray (posterioranterior view).
Two intravenous lines of 18 G and 20 G were secured on any two convenient veins on the left and the right hand, respectively. The 20 G line was used to administer the infusion of drugs under study, while the 18 G line was used to administer intravenous (IV) fl uids and all the other drugs.
The monitoring of the patient was started 15 min before the induction and was continued into the post-operative room until 15 min after the extubation. It comprised monitoring the HR, systolic and diastolic blood pressures, MAP, ECG, oxygen saturation and capnography.
After shifting to the operation theatre and attaching all the monitors, the patient was pre-medicated using injection ondansetron 0.08 mg/kg IV, injection glycopyrrolate 4 mcg/kg IV and injection fentanyl 1.5 mcg/kg IV. The anesthesia was induced using injection propofol 2 mg/kg IV. The trachea was then intubated using the appropriate sized cuffed oral endotracheal tube, facilitated with the help of injection vecuronium 0.08 mg/kg IV. The anesthesia was maintained on O2:N2O (50%:50%) and variable rate of isofl urane 0.2-0.4% v/v. Incremental dosage of injection vecuronium was used for muscle relaxation, as and when required. End-tidal carbon dioxide was monitored intraoperatively and kept between 25 and 30 mm of Hg.
The study drug infusion, in prefi lled coded 20 ml syringe, was started 10 min before creation of pneumoperitoneum, using infusion pump, at the rate of 0.1 mL/kg body weight/hour, and the code number of the study drug syringe was noted down in the proforma. The IAP was maintained at 14 mmHg. The drug infusion and was stopped when the pneumoperitoneum was resolved back to the status quo ante.
Throughout the procedure, any change in the MAP of over 20% of the basal value was countered by varying the rate of isofl urane. HR less than 50 beats per minute was treated by administering Injection Atropine 0.6 mg.
After the surgery, the residual neuromuscular blockade was reversed using injection neostigmine 0.05 mg/kg IV and injection glycopyrrolate 0.01 mg/kg IV. The trachea was extubated and patient shifted to the post-operative recovery room.
AssessmentThe following parameters were assessed in the case studies:• HR• MAP• ECG changes.
Additional parameters included:• Requirement of isofl urane• Requirement of atropine• Total surgery time• Total anesthesia time.
The MAP and HR were monitored at the following junctures:1. In the pre-operative room2. 5 min before induction3. Start of drug infusion4. Creation of pneumoperitoneum5. Thereafter every 5 min till the pneumoperitoneum is
resolved6. After reversal7. In the post-operative room.
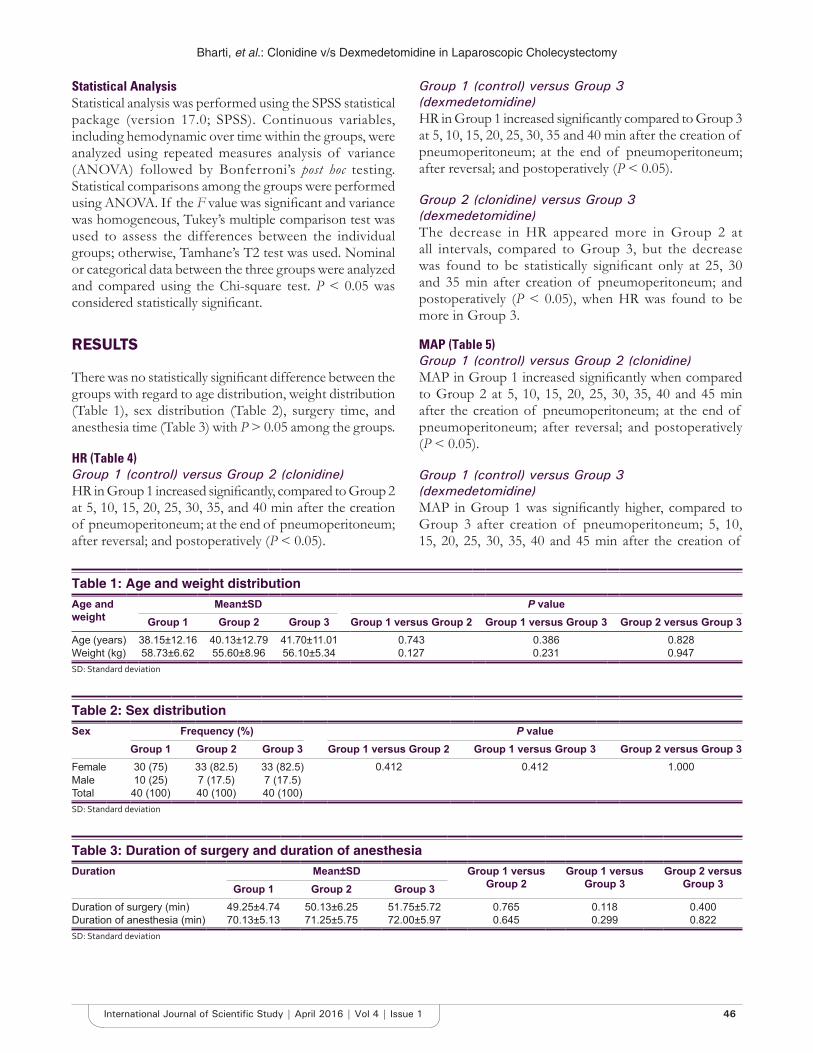
Bharti, et al.: Clonidine v/s Dexmedetomidine in Laparoscopic Cholecystectomy
46International Journal of Scientifi c Study | April 2016 | Vol 4 | Issue 1
Statistical AnalysisStatistical analysis was performed using the SPSS statistical package (version 17.0; SPSS). Continuous variables, including hemodynamic over time within the groups, were analyzed using repeated measures analysis of variance (ANOVA) followed by Bonferroni’s post hoc testing. Statistical comparisons among the groups were performed using ANOVA. If the F value was signifi cant and variance was homogeneous, Tukey’s multiple comparison test was used to assess the differences between the individual groups; otherwise, Tamhane’s T2 test was used. Nominal or categorical data between the three groups were analyzed and compared using the Chi-square test. P < 0.05 was considered statistically signifi cant.
RESULTS
There was no statistically signifi cant difference between the groups with regard to age distribution, weight distribution (Table 1), sex distribution (Table 2), surgery time, and anesthesia time (Table 3) with P > 0.05 among the groups.
HR (Table 4)Group 1 (control) versus Group 2 (clonidine)HR in Group 1 increased signifi cantly, compared to Group 2 at 5, 10, 15, 20, 25, 30, 35, and 40 min after the creation of pneumoperitoneum; at the end of pneumoperitoneum; after reversal; and postoperatively (P < 0.05).
Group 1 (control) versus Group 3 (dexmedetomidine)HR in Group 1 increased signifi cantly compared to Group 3 at 5, 10, 15, 20, 25, 30, 35 and 40 min after the creation of pneumoperitoneum; at the end of pneumoperitoneum; after reversal; and postoperatively (P < 0.05).
Group 2 (clonidine) versus Group 3 (dexmedetomidine)The decrease in HR appeared more in Group 2 at all intervals, compared to Group 3, but the decrease was found to be statistically signifi cant only at 25, 30 and 35 min after creation of pneumoperitoneum; and postoperatively (P < 0.05), when HR was found to be more in Group 3.
MAP (Table 5)Group 1 (control) versus Group 2 (clonidine)MAP in Group 1 increased signifi cantly when compared to Group 2 at 5, 10, 15, 20, 25, 30, 35, 40 and 45 min after the creation of pneumoperitoneum; at the end of pneumoperitoneum; after reversal; and postoperatively (P < 0.05).
Group 1 (control) versus Group 3 (dexmedetomidine)MAP in Group 1 was signifi cantly higher, compared to Group 3 after creation of pneumoperitoneum; 5, 10, 15, 20, 25, 30, 35, 40 and 45 min after the creation of
Table 1: Age and weight distributionAge and weight
Mean±SD P valueGroup 1 Group 2 Group 3 Group 1 versus Group 2 Group 1 versus Group 3 Group 2 versus Group 3
Age (years) 38.15±12.16 40.13±12.79 41.70±11.01 0.743 0.386 0.828Weight (kg) 58.73±6.62 55.60±8.96 56.10±5.34 0.127 0.231 0.947SD: Standard deviation
Table 2: Sex distributionSex Frequency (%) P value
Group 1 Group 2 Group 3 Group 1 versus Group 2 Group 1 versus Group 3 Group 2 versus Group 3Female 30 (75) 33 (82.5) 33 (82.5) 0.412 0.412 1.000Male 10 (25) 7 (17.5) 7 (17.5)Total 40 (100) 40 (100) 40 (100)SD: Standard deviation
Table 3: Duration of surgery and duration of anesthesiaDuration Mean±SD Group 1 versus
Group 2Group 1 versus
Group 3Group 2 versus
Group 3Group 1 Group 2 Group 3Duration of surgery (min) 49.25±4.74 50.13±6.25 51.75±5.72 0.765 0.118 0.400Duration of anesthesia (min) 70.13±5.13 71.25±5.75 72.00±5.97 0.645 0.299 0.822SD: Standard deviation

Bharti, et al.: Clonidine v/s Dexmedetomidine in Laparoscopic Cholecystectomy
47 International Journal of Scientifi c Study | April 2016 | Vol 4 | Issue 1
pneumoperitoneum; at the end of pneumoperitoneum; after reversal; and postoperatively (P < 0.05).
Group 2 (clonidine) versus Group 3 (dexmedetomidine)There was no statistically signifi cant difference in MAP between the two groups. MAP between the two groups was found to be comparable.
Requirement of Isofl urane (Table 6)All the patients in Group 1 (100%); 3 patients in Group 2 (7.5%); and 4 patients in Group 3 (10%) required isofl urane concentration of more than 1%, during the intraoperative period. Patients in Group 1 had signifi cantly
increased requirements, compared to Group 2 and Group 3 (P < 0.05).
Requirement of Atropine (Table 7 )None of the patients in Group 1 (0%); 5 patients in Group 2 (12.5%); and 3 patients in Group 3 (7.5%) required intraoperative Atropine for the treatment of Bradycardia. There was no statistically signifi cant difference in the requirement of Atropine among the three groups (P > 0.05).
Perioperative ECG ChangesNo perioperative ECG changes were seen in any of the patients included the study.
Table 4: HRHR Mean±SD P value
Group 1 Group 2 Group 3 Group 1 versus Group 2
Group 1 versus Group 3
Group 2 versus Group 3
Baseline 87.80±8.57 86.80±8.31 87.33±10.01 0.873 0.970 0.9635 min before induction 90.18±8.82 89.03±7.97 89.35±9.37 0.827 0.907 0.985Start of drug infusion 91.03±8.95 91.10±8.04 87.53±10.25 0.999 0.204 0.191Pneumoperitoneum 90.90±8.70 89.13±8.37 88.53±10.77 0.673 0.493 0.9565 min 95.20±9.48 85.88±8.06 89.10±10.44 <0.001 0.012 0.27710 min 99.88±10.45 81.35±8.03 83.15±9.90 <0.001 <0.001 0.67515 min 100.03±9.66 76.75±7.28 80.15±10.10 <0.001 <0.001 0.22120 min 98.25±9.24 75.23±8.35 79.18±11.07 <0.001 <0.001 0.16225 min 97.45±9.15 73.83±8.95 79.98±11.25 <0.001 <0.001 0.01730 min 96.63±9.35 72.06±9.86 79.75±11.67 <0.001 <0.001 0.00735 min 99.22±9.05 71.36±11.66 81±11.93 <0.001 <0.001 0.01040 min 98.78±10.39 73.00±9.85 82.67±10.50 <0.001 0.002 0.06045 min 103.50±6.36 80±11.04 83.50±11.57 0.067 0.113 0.86050 min 86.50±20.21 68.00±0End of pneumoperitoneum 92.90±9.07 78.38±10.75 81.73±9.14 <0.001 <0.001 0.273Reversal 98.68±9.23 92.83±9.29 93.18±9.57 0.017 0.026 0.985Post-operative 88.58±7.89 78.60±7.78 83.28±8.34 <0.001 0.010 0.027SD: Standard deviation, HR: Heart rate
Table 5: MAP
MAP Mean±SD P valueGroup 1 Group 2 Group 3 Group 1 versus
Group 2Group 1 versus
Group 3Group 2 versus
Group 3Baseline 73.73±5.15 94.08±5.68 93.80±6.05 0.958 0.998 0.9745 min before induction 97.05±4.74 96.25±4.81 96.68±5.70 0.764 0.942 0.927Start of drug infusion 96.86±4.54 94.50±5.19 94.60±6.03 0.117 0.138 0.996Pneumoperitoneum 99.80±4.92 97.38±5.20 96.93±5.69 0.104 0.043 0.9235 min 104.55±4.63 96.83±6.18 96.40±7.17 <0.001 <0.001 0.97810 min 110.50±5.43 91.90±9.00 92.98±9.19 <0.001 <0.001 0.82215 min 116.65±5.35 87.43±10.82 89.80±10.13 <0.001 <0.001 0.47520 min 113.28±5.17 88±11.49 90.53±10.62 <0.001 <0.001 0.46325 min 110.65±5.49 87.45±11.46 89.90±10.17 <0.001 <0.001 0.47630 min 107.91±5.77 85.59±10.17 88.53±9.01 <0.001 <0.001 0.32235 min 106.83±5.35 85±10.51 87.42±7.97 <0.001 <0.001 0.56440 min 106.11±5.37 83.55±7.62 84.40±14.63 <0.001 <0.001 0.97945 min 110±1.41 82.60±5.22 87.83±4.07 0.003 0.001 0.17250 min 0±0 86.50±0.71 91±0End of pneumoperitoneum 103.55±5.59 86.00±9.56 87.58±7.82 <0.001 <0.001 0.642Reversal 108.45±5.88 97.65±6.39 98.55±7.35 <0.001 <0.001 0.814Post-operative 93.93±5.34 89.71±5.15 91.22±5.88 0.002 0.042 0.438SD: Standard deviation, MAP: Mean arterial pressure
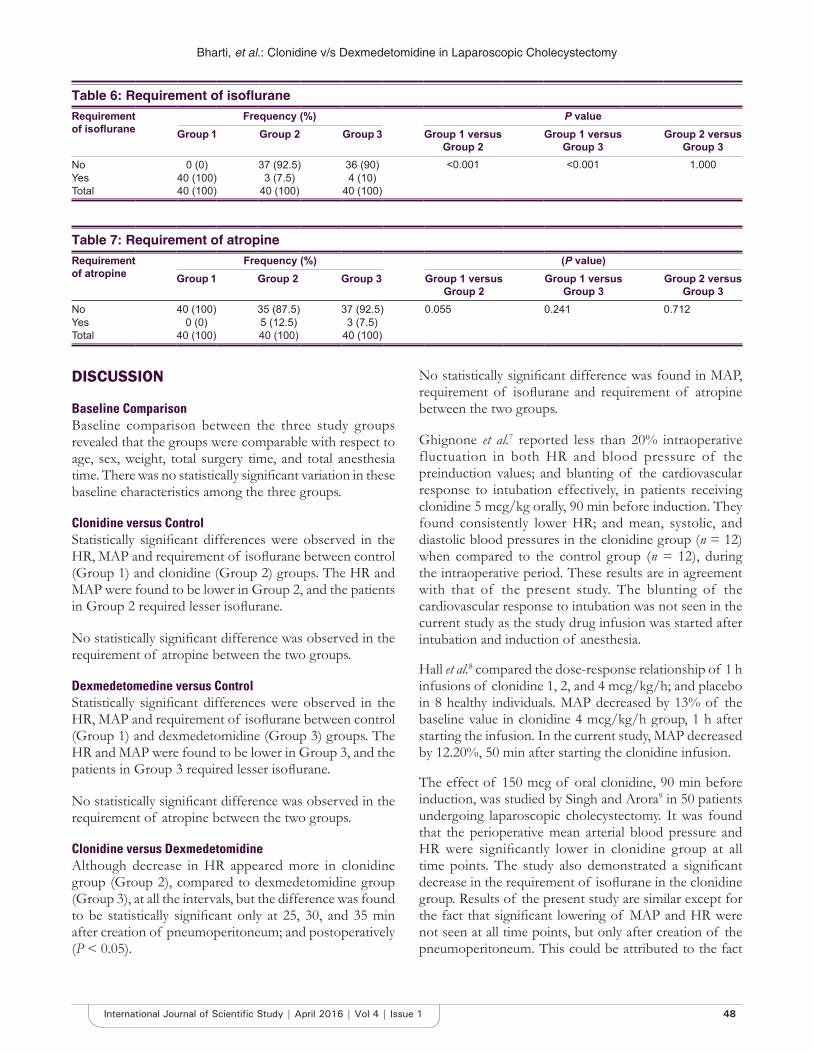
Bharti, et al.: Clonidine v/s Dexmedetomidine in Laparoscopic Cholecystectomy
48International Journal of Scientifi c Study | April 2016 | Vol 4 | Issue 1
DISCUSSION
Baseline ComparisonBaseline comparison between the three study groups revealed that the groups were comparable with respect to age, sex, weight, total surgery time, and total anesthesia time. There was no statistically signifi cant variation in these baseline characteristics among the three groups.
Clonidine versus ControlStatistically signifi cant differences were observed in the HR, MAP and requirement of isofl urane between control (Group 1) and clonidine (Group 2) groups. The HR and MAP were found to be lower in Group 2, and the patients in Group 2 required lesser isofl urane.
No statistically signifi cant difference was observed in the requirement of atropine between the two groups.
Dexmedetomedine versus ControlStatistically signifi cant differences were observed in the HR, MAP and requirement of isofl urane between control (Group 1) and dexmedetomidine (Group 3) groups. The HR and MAP were found to be lower in Group 3, and the patients in Group 3 required lesser isofl urane.
No statistically signifi cant difference was observed in the requirement of atropine between the two groups.
Clonidine versus DexmedetomidineAlthough decrease in HR appeared more in clonidine group (Group 2), compared to dexmedetomidine group (Group 3), at all the intervals, but the difference was found to be statistically signifi cant only at 25, 30, and 35 min after creation of pneumoperitoneum; and postoperatively (P < 0.05).
No statistically signifi cant difference was found in MAP, requirement of isofl urane and requirement of atropine between the two groups.
Ghignone et al.7 reported less than 20% intraoperative fluctuation in both HR and blood pressure of the preinduction values; and blunting of the cardiovascular response to intubation effectively, in patients receiving clonidine 5 mcg/kg orally, 90 min before induction. They found consistently lower HR; and mean, systolic, and diastolic blood pressures in the clonidine group (n = 12) when compared to the control group (n = 12), during the intraoperative period. These results are in agreement with that of the present study. The blunting of the cardiovascular response to intubation was not seen in the current study as the study drug infusion was started after intubation and induction of anesthesia.
Hall et al.8 compared the dose-response relationship of 1 h infusions of clonidine 1, 2, and 4 mcg/kg/h; and placebo in 8 healthy individuals. MAP decreased by 13% of the baseline value in clonidine 4 mcg/kg/h group, 1 h after starting the infusion. In the current study, MAP decreased by 12.20%, 50 min after starting the clonidine infusion.
The effect of 150 mcg of oral clonidine, 90 min before induction, was studied by Singh and Arora9 in 50 patients undergoing laparoscopic cholecystectomy. It was found that the perioperative mean arterial blood pressure and HR were signifi cantly lower in clonidine group at all time points. The study also demonstrated a signifi cant decrease in the requirement of isofl urane in the clonidine group. Results of the present study are similar except for the fact that signifi cant lowering of MAP and HR were not seen at all time points, but only after creation of the pneumoperitoneum. This could be attributed to the fact
Table 6: Requirement of isofl uraneRequirement of isofl urane
Frequency (%) P valueGroup 1 Group 2 Group 3 Group 1 versus
Group 2Group 1 versus
Group 3Group 2 versus
Group 3No 0 (0) 37 (92.5) 36 (90) <0.001 <0.001 1.000Yes 40 (100) 3 (7.5) 4 (10)Total 40 (100) 40 (100) 40 (100)
Table 7: Requirement of atropineRequirement of atropine
Frequency (%) (P value)Group 1 Group 2 Group 3 Group 1 versus
Group 2Group 1 versus
Group 3Group 2 versus
Group 3No 40 (100) 35 (87.5) 37 (92.5) 0.055 0.241 0.712Yes 0 (0) 5 (12.5) 3 (7.5)Total 40 (100) 40 (100) 40 (100)
Bharti, et al.: Clonidine v/s Dexmedetomidine in Laparoscopic Cholecystectomy
49 International Journal of Scientifi c Study | April 2016 | Vol 4 | Issue 1
that clonidine was administered 90 min before induction in the said study, while it was administered after induction in the present study. Isofl urane sparing effect of clonidine was also observed in the present study.
Aantaa et al.10 conducted a study, to defi ne the interaction between intravenous infusion of dexmedetomidine and isoflurane in 49 women undergoing abdominal hysterectomy using minimum alveolar concentration (MAC) of isofl urane as the measure of anesthetic potency. The study included 49 women, randomly allocated to receive either a placebo infusion (n = 16) or a two staged infusion of dexmedetomidine with target plasma concentration of 0.3 ng/mL (n = 17) or 0.6 ng/mL (n = 16). It was found that the MAC of isofl urane was 0.85% end tidal in the control group, 0.55% end tidal with the low-dose dexmedetomidine and 0.45% end tidal with high-dose dexmedetomidine. Similar results were observed regarding the isofl urane-sparing effect of dexmedetomidine in the current study.
Bhattacharjee et al.11 studied the effects of dexmedetomidine infusion (0.2 mcg/kg/h) for hemodynamic stability in 60 patients undergoing laparoscopic cholecystectomy and found that MAP and HR in dexmedetomidine group were signifi cantly less after intubation and throughout the period of pneumoperitoneum. Similar results were obtained in the present study.
Taittonen et al.12 administered clonidine 4 mcg/kg and dexmedetomidine 2.5 mcg/kg 40-50 min before the anticipated induction of anesthesia in 30 ASA I patients and observed that HR and MAP were lower in clonidine and dexmedetomidine groups when compared to placebo group. These results are comparable to those obtained in the current study.
CONCLUSION
Laparoscopic cholecystectomy is a routinely performed surgery and it is desirable to have a stable intraoperative hemodynamic status by avoiding hypertension, hypotension, or tachycardia. Opioids; volatile agents such as isofl urane and sevoflurane; nitroglycerine; beta blockers; etc., have been used to control perioperative stress during laparoscopy. However, the search for an ideal agent is still on. Of late, α2 adrenergic agonists have generated interest in this regard. Hence, the present study was conducted to establish and compare the benefi cial effect of two α2 agonists, clonidine and dexmedetomidine, in maintaining perioperative cardiovascular stability during laparoscopic cholecystectomy.
On the basis of observations made during study, following conclusions were drawn:1. Intraoperative HR was signifi cantly lower in clonidine
and dexmedetomidine groups, compared to the control group.
2. Intraoperative HR was signifi cantly lower in clonidine group, compared to dexmedetomidine group.
3. There was no statistically signifi cant difference in the requirement of atropine among the three groups, indicating that there was no signifi cant rise in the episodes of bradycardia associated with the use of either clonidine or dexmedetomidine.
4. Intraoperative blood pressure (MAP) was signifi cantly lower in clonidine and dexmedetomidine groups, compared to the control group.
5. There was no statistically significant difference in intraoperative blood pressure (MAP) between clonidine and dexmedetomidine groups.
6. Requirement of isofl urane was signifi cantly lower in clonidine and dexmedetomidine groups, compared to the control group, indicating the inhalational agent sparing effects of the two drugs.
7. There was no statistically signifi cant difference in the requirement of isofl urane between clonidine and dexmedetomidine groups.
8. There were no ECG changes associated with the use of the two study drugs.
9. Thus, both clonidine and dexmedetomidine favorably alter the intraoperative hemodynamics and maintain cardiovascular stability during laparoscopic cholecystectomy. In the doses used in the current study, clonidine decreased intraoperative HR more than dexmedeto midine.
REFERENCES
1. Dubois F, Icard P, Berthelot G, Levard H. Coelioscopic cholecystectomy. Preliminary report of 36 cases. Ann Surg 1990;211:60-2.
2. Joris JL, Noirot DP, Legrand MJ, Jacquet NJ, Lamy ML. Hemodynamic changes during laparoscopic cholecystectomy. Anesth Analg 1993;76:1067-71.
3. Lenz RJ, Thomas TA, Wilkins DG. Cardiovascular changes during laparoscopy. Studies of stroke volume and cardiac output using impedance cardiography. Anaesthesia 1976;31:4-12.
4. Luchetti M, Palomba R, Sica G, Massa G, Tufano R. Effectiveness and safety of combined epidural and general anesthesia for laparoscopic cholecystectomy. Reg Anesth 1996;21:465-9.
5. Kamibayashi T, Maze M. Clinical uses of alpha2 -adrenergic agonists. Anesthesiology 2000;93:1345-9.
6. Stoelting RK, Hiller SC. Pharmacology and Physiology in Anaesthetic Practice. 4th ed. Philadelphia, PA: Lippincott Williams & Wilkins; 2006.
7. Ghignone M, Quintin L, Duke PC, Kehler CH, Calvillo O. Effects of clonidine on narcotic requirements and hemodynamic response during induction of fentanyl anesthesia and endotracheal intubation. Anesthesiology 1986;64:36-42.
8. Hall JE, Uhrich TD, Ebert TJ. Sedative, analgesic and cognitive effects of clonidine infusions in humans. Br J Anaesth 2001;86:5-11.

Bharti, et al.: Clonidine v/s Dexmedetomidine in Laparoscopic Cholecystectomy
50International Journal of Scientifi c Study | April 2016 | Vol 4 | Issue 1
9. Singh S, Arora K. Effect of oral clonidine premedication on perioperative haemodynamic response and postoperative analgesic requirement for patients undergoing laparoscopic cholecystectomy. Indian J Anaesth 2011;55:26-30.
10. Aantaa R, Jaakola ML, Kallio A, Kanto J. Reduction of the minimum alveolar concentration of isofl urane by dexmedetomidine. Anesthesiology 1997;86:1055-60.
11. Bhattacharjee DP, Nayak SK, Dawn S, Bandopadhayay G, Gupta K. Effects of dexmedetomidine on haemodynamics in patients undergoing laparoscopic cholecystectomy - A comparative study. J Anaesth Clin Pharmacol 2010;26:45.
12. Taittonen MT, Kirvelä OA, Aantaa R, Kanto JH. Effect of clonidine and dexmedetomidine premedication on perioperative oxygen consumption and haemodynamic state. Br J Anaesth 1997;78:400-6.
How to cite this article: Bharti D, Saran J, Kumar C, Nanda HS. Comparison of Clonidine and Dexmedetomidine on Cardiovascular Stability in Laparoscopic Cholecystectomy. Int J Sci Stud 2016;4(1):43-50.
Source of Support: Nil, Confl ict of Interest: None declared.
51 International Journal of Scientifi c Study | April 2016 | Vol 4 | Issue 1
Knowledge and Awareness Regarding Traumatic Dental Injuries in School Children among Physical Education Teachers in Patna: A Cross-Sectional StudyAbhishek Anand1, Chitrita Gupta Mukherjee2, Jeevendra Nath Shukla3, Swati Sharma4
1Post Graduate Trainee, Department of Pedodontics & Preventive Dentistry, Buddha Institute of Dental Sciences & Hospital, Patna, Bihar, India, 2Professor & Head, Department of Pedodontics & Preventive Dentistry, Buddha Institute of Dental Sciences & Hospital, Patna, Bihar, India, 3Professor, Department of Pedodontics & Preventive Dentistry, Buddha Institute of Dental Sciences & Hospital, Patna, Bihar, India, 4Reader, Department of Pedodontics & Preventive Dentistry, Buddha Institute of Dental Sciences & Hospital, Patna, Bihar, India
affects the upper anterior which leads to the development of negative quality of life due to loss of function, psychological and social discomfort, lowered self-esteem and fi nancial burden over the parents.
Dental traumatic injuries can vary from simple concussions to extensive maxillofacial damage which involves periodontal structures and displacement or avulsion of teeth. The most frequent type of injury is crown fracture, comprising 26-76% of injuries to the permanent dentition. Luxation injuries comprise 30-44% of all the dental injuries. The complete detachment of tooth from the socket is known as avulsion, which is the most complicated and serious problems comprising 1-16% of dental injuries with peak incidence record in the 7-11 years old age group and the maxillary central incisors being the most affected. It was 75% more frequent in children under the age of 15.2
INTRODUCTION
Traumatic dental injury (TDI) is a developing and challenging public health problem to dental health professionals, nowadays, and it has been seriously neglected worldwide.1 Dental trauma refers to trauma (injury) to the teeth and/or periodontium (gums, periodontal ligament, and alveolar bone), and nearby soft tissues such as the lips and tongue and more than 20% of school-aged children reported to have been affected. Dental trauma mainly
Original Article
Abstract
Introduction: A major cause of morbidity in both developed and developing countries around the world is orofacial injuries. Traumatic dental injuries are caused by a complex array of social and environmental factors.
Aim: The aim of this study was to evaluate physical education teacher’s knowledge and awareness in Patna regarding traumatic dental injuries among school children.
Materials and Methods: The study was conducted among 60 physical education teachers from randomly selected schools in Patna using modifi ed questionnaire that was used in the study done by Randhawa et al.
Results: The study results showed that physical education teachers had completely inadequate knowledge regarding management of traumatic dental injuries among school children.
Conclusion: For the physical education teachers having a lack of knowledge regarding management of dental injuries, educational and motivational programs are necessary to improve their level of knowledge.
Key words: Dental injuries, Knowledge, Physical education
Access this article online
www.ijss-sn.com
Month of Submission : 02-2016Month of Peer Review : 03-2016Month of Acceptance : 03-2016Month of Publishing : 04-2016
Corresponding Author: Dr. Abhishek Anand, Department of Pedodontics & Preventive Dentistry, Buddha Institute of Dental Sciences & Hospital, West of TV Tower, Kankarbagh, Patna - 800 020, Bihar, India. Phone: +91-8084509217. E-mail: [email protected]
DOI: 10.17354/ijss/2016/186

Anand, et al.: Knowledge & Awareness Regarding Traumatic Dental Injuries among Physical Education Teachers
52International Journal of Scientifi c Study | April 2016 | Vol 4 | Issue 1
Schools are places where one can find a noticeable risk of traumatic dental injuries during playing activity. Knowledge and awareness of physical education teacher regarding emergency management of dental trauma is decisive for better prognosis. Many literatures around the world indicated the lack of knowledge of physical education teachers with regard to emergency management of traumatic dental injuries. However, no such studies related to knowledge and awareness of physical education teachers on dental trauma management have been done in Patna. The purpose of this study was to evaluate physical education teacher’s knowledge and awareness in Patna regarding traumatic dental injuries among school children.
MATERIALS AND METHODS
A modifi ed questionnaire that was used in the study done by Randhawa et al. which comprises demographic information including gender, age, teaching experience, fi rst aid training, dental trauma experience and multiple choice questions on subjective self-assessment of attitude and source of knowledge regarding management of traumatic dental injuries was used in the present study.
A total of 60 physical education teachers were enrolled in the study and it was conducted in 60 different schools of Patna over a period of 2-month from October to November 2015. The permission for the study was taken from the concerned authorities in the participating schools, and ethical clearance was obtained from institutional ethical clearance committee of Buddha Institute of Dental Sciences and Hospital, Patna. Questionnaires were personally handed over to all physical education teachers at school counters and collected after 2 days (Table 1).
RESULTS
A total of 60 physical education teachers completed the questionnaires provided to them and participated in the study. The respondents consisted of 30% were males and 70% were females. With the exception of 55 (91.6%), only 5 (8.3%) of them had received training regarding the fi rst aid. When they were asked regarding who all had come across dental trauma, only 16 (26.6%) had a positive response, 6 (10%) had come across broken tooth with bleeding, and 10 (16.6%) found tooth that had fallen off, whereas 2 (3.3%) had come across soft tissue injuries. When asked about the fi rst reaction on seeing the child with trauma, only 30 (50%) replied that they would contact parents and carry the child to the dentist nearby the school, while 20 (33.3%) replied that they would give child warm drink and call parents. When asked regarding the kind of fi rst aid they would provide to the students in the case of
Table 1: Knowledge, attitude and practice of physical education teachers regarding the traumatic tooth injuries in school childrenQuestions N (%)Do you have any formal training of fi rst aid?
Yes 5 (8.3)No 55 (91.6)
Have you ever come across dental trauma in your school?
Yes 16 (26.6)No 40 (66.6)- 4 (6.6)
What kind of trauma it was?Broken tooth without bleeding 5 (8.3)Broken tooth with bleeding 6 (10)Tooth that had fallen off 10 (16.6)Displaced tooth 2 (3.3)Soft tissue injuries 2 (3.3)Others 35 (58.3)
What would be your fi rst reaction when you see some child with trauma
Immediately contact the parents and call them for further action
5 (8.3)
Give child warm drink and call parents 20 (33.3)Contact parents and immediately carry child to the nearest dentist
30 (50)
None of the above 5 (8.3) What kind of fi rst aid would you give to your students in case of trauma?
Sideline injured subject and ask to bite on handkerchief
10 (16.6)
Wash the affected traumatic area and look for broken toothpiece if any and seek dentist opinion
30 (50)
None of the above 20 (33.3)Can a broken toothpiece be reattached?
Yes 10 (16.6)No 30 (50)Don’t know 20 (33.3)
Can a completely fallen off tooth be replanted back?Yes 15 (25)No 30 (50)Don’t know 15 (25)
What would you do if you see completely avulsed or fallen off tooth or piece of tooth
Wrap it in a clean cloth and carry to the dentist 5 (8.3)Wash under running tap water and wrap in a clean cloth and carry to the dentist
20 (33.3)
Wash under running tap water and carry in a milk container to the dentist
7 (11.6)
Wash under running tap water and ask child to keep in the mouth and carry to the dentist
10 (16.6)
Wash under running tap water and try to replant back in the socket and carry to the dentist
1 (1.6)
Don’t know 9 (15)Others 8 (13.3)
injury, 10 (16.6%) sideline injured subject and ask them to bite on the handkerchief. Whereas 30 (50%) participants responded that they would wash affected the traumatic area and look for broken tooth piece if any and seek dentist opinion. Regarding the knowledge about management of broken tooth piece 30 (50%) responded that broken tooth piece cannot be reattached. Moreover, regarding
Anand, et al.: Knowledge & Awareness Regarding Traumatic Dental Injuries among Physical Education Teachers
53 International Journal of Scientifi c Study | April 2016 | Vol 4 | Issue 1
the replantation of completely fallen off tooth, 30 (50%) replied that it is not possible to replant the tooth back into the socket once it has completely fallen off. Regarding the immediate management of completely fallen off tooth, 20 (33.3%) answered that they would wash it under running tap water, and wrap it in a clean cloth and carry to the dentist, whereas 8 (13.3%) had belief that once a tooth is completely fallen off, it is of no use, it should be dumped in the ground or thrown in the running Ganga water.
DISCUSSION
A major cause of morbidity in both developed and developing countries around the world is orofacial injuries. Traumatic dental injuries are caused by a complex array of social and environmental factors. Contact sports, violence, falls, traffi c accidents, and poor environments have all been implicated in injuries. Traumatic dental injuries are serious dental public health problem among children and adolescents causing both functional and esthetic problems, with possible impacts on the patient’s quality of life.1
Fractured teeth or its loss as a result of trauma may cause a negative impact on the physical appearance of individuals and society. According to American organization for the prevention of sports-related trauma, there are 10% chances of suffering an orofacial injury and 18.9% of 12-yea-old children have suffered TDI during leisure and sports activities. Traebert et al. reported that majority of the accidents occurred at home (60.4%) followed by school (18.6%) and outside in street (16%).3
The future course of an injured tooth will extremely rely on a suffi cient urgent administration of treatment. Physical education teachers were selected as the study group because a great deal of dental trauma may occur during sports activities in school premises. Among the 60 participants, only 5 (8.3%) respondents underwent fi rst aid training during the course. In the study conducted by Randhawa et al.,4 this percentage was almost same as in the present study.
When a question was asked regarding the action to be taken on seeing, a child with dental trauma, only 5 (8.3%) replied that they would contact parents and ask them to take further action, which was found to be slightly higher than reported by Randhawa et al.
Regarding the management of broken tooth piece or completely fallen off tooth, 30 (50%) replied that broken tooth piece cannot be reattached and 50% replied that completely avulsed tooth cannot be replanted back. This strongly refl ects the lack of knowledge about emergency
management of avulsed teeth among physical education teachers could be due to their lack of prior experience or information from other sources.
In response to the question, regarding, immediate management of completely fallen off tooth, the ideal treatment would be, to wash under running tap water and try to replant back in socket and carry to the dentist, but this study, only 20 (33.3%) participants opted for this option which was found to be higher than as reported by Randhawa et al. This could be explained by the abundant availability of private dental facilities and their idea that dental profession has a comparatively well knowledge of correct activities taken in case of tooth separation than the medical profession.
Based on this, it is of prime importance to introduce dental trauma management in physical education trainees’ curriculum, which is in agreement with Chan et al.5 The cooperative actions between dental and physical education teachers are needed to develop continued education programs, since physical education teachers are not adequately prepared to provide emergency care to dental trauma victims. From here to abstain this, it is inevitable to invest on preventive educational strategies to promote oral health, aiming to qualify these future professionals so that they are aware of their leading role when dealing with dental trauma. The results suggest that almost all of the physical education colleges have no contents regarding dental trauma in their curriculum, as is evident from their inadequate knowledge and awareness toward the matter which coincides with the results of the study conducted by Alencar et al.6
CONCLUSION
The study gave a clear picture that there were insuffi cient knowledge and awareness of physical education teachers in Patna in the management of traumatic dental injuries. Various protocols may be used to improve the knowledge of physical education teachers including educational and motivational programs, lectures, seminars and regular visit to the school dentist.
ACKNOWLEDGMENT
The authors wish to appreciate the constructive support from the head of the institution of all the schools of Patna for granting the permission throughout the investigation. Researchers also wish to thank all of the physical education teachers who participated in the present study for their warm cooperation.

Anand, et al.: Knowledge & Awareness Regarding Traumatic Dental Injuries among Physical Education Teachers
54International Journal of Scientifi c Study | April 2016 | Vol 4 | Issue 1
REFERENCES
1. Touré B, Benoist FL, Faye B, Kane A, Kaadioui S. Primary school teachers’ knowledge regarding emergency management of avulsed permanent incisors. J Dent (Tehran) 2011;8:117-22.
2. Bhat M, Li SH. Consumer product-related tooth injuries treated in hospital emergency rooms: United States, 1979-87. Community Dent Oral Epidemiol 1990;18:133-8.
3. Traebert J, Peres M, Blank V, Boell R, Pietruza J. Prevalence of traumatic dental injury and associated factors among 12-year-old school children in
Florianopolis, Brazil. Dent Traumatol 2003;19:15-8.4. Randhawa AK, Kaur K, Walia SS, Kaur G. Mangement of traumatic dental
injuries in school children: A questionnaire survey on the school teachers to assess their knowledge regarding the same. IJCDC 2015;5:514-17.
5. Chan AW, Wong TK, Cheung GS. Lay knowledge of physical education teachers about the emergency management of dental trauma in Hong Kong. Dent Traumatol 2001;17:77-85.
6. Alencar AH, Bruno KF, Freire MC, De Moraes MR, Queiroz LB. Knowledge and attitudes of physical education undergraduates regarding dental trauma. Dent Press Endod 2012;2:74-9.
How to cite this article: Anand A, Mukherjee CG, Shukla JN, Sharma S. Knowledge and Awareness Regarding Traumatic Dental Injuries in School Children among Physical Education Teachers in Patna: A Cross-Sectional Study. Int J Stud Sci 2016;4(1):51-54.
Source of Support: Nil, Confl ict of Interest: None declared.

55 International Journal of Scientifi c Study | April 2016 | Vol 4 | Issue 1
Evaluation of the Post-operative Analgesia in Supraclavicular Brachial Plexus Block with 0.375% Plain Bupivacaine + 0.2 mmol Potassium Chloride (0.1 ml) as an AdjuvantNeeraj Solanki1, Juhi Saran2, Mahesh Kashyap3, H S Nanda4
1Post Graduate Trainee, Department of Anaesthesiology, Shri Ram Murti Smarak Institute of Medical Sciences, Bareilly, Uttar Pradesh, India, 2Professor, Department of Anaesthesiology, Shri Ram Murti Smarak Institute of Medical Sciences, Bareilly, Uttar Pradesh, India,3Assistant Professor, Department of Anaesthesiology, Shri Ram Murti Smarak Institute of Medical Sciences, Bareilly, Uttar Pradesh, India, 4Professor and Head, Department of Anaesthesiology, Shri Ram Murti Smarak Institute of Medical Sciences, Bareilly, Uttar Pradesh, India
pain relief than neuraxial technique while also avoiding the side effects of systemic medications. Regional anesthesia of the extremities and the abdomen is a useful alternative to general anesthesia in many situations.3
Since the discovery of local anesthetic drugs, the anesthesiologists have become increasingly involved in the provision of post-operative analgesia; the need of pain relief during surgery without loss of consciousness which is appreciated more, both by anesthesiologists and surgeons.4,5
In the past two decades, two factors have brought about a reappraisal of regional techniques. First, a local block in combination with controllable sedation so that the patient stay awake during surgery, and second, realization has grown that excellent post-operative pain relief can be provided easily and in no time to the patient with an appropriate regional blockade.6
INTRODUCTION
The international association for the study of pain defi nes pain as “an unpleasant sensory and emotional experience associated with actual or potential tissue damage, or described in terms of such damage.”1,2
It is always a subjective experience. Pain has been a major concern of humankind, and it has been the object of ubiquitous efforts to understand and to control it. Peripheral nerve block provides longer and more localized
Original Article
Abstract
Introduction: The techniques of peripheral neural blockade were developed early in the history of anesthesia. It is approximately 130 years that brachial plexus block was fi rst attempted that is, in 1884, Halstead injected the roots of the brachial plexus under vision, less than a year after Koller demonstrated the anesthetic properties of cocaine.
Materials and Methods: Patients were assigned into two groups. Group I (n = 50) received 30 ml 0.375% bupivacaine + 0.2 mmol potassium chloride (0.1 ml) and Group II (n = 50) received 30 ml 0.375% bupivacaine + 0.1 ml normal saline.
Results: This observation shows that the duration of the requirement of post-operative analgesia is signifi cantly increased by the addition of 0.2 mmol of potassium chloride to 0.375% bupivacaine hydrochloride.
Conclusion: We conclude that potassium chloride when added to 0.375% bupivacaine for supraclavicular brachial plexus block increased the duration of post-operative analgesia.
Key words: Bupivacaine, Potassium chloride, Supraclavicular
Access this article online
www.ijss-sn.com
Month of Submission : 02-2016Month of Peer Review : 03-2016Month of Acceptance : 03-2016Month of Publishing : 04-2016
Corresponding Author: Dr. Neeraj Solanki, Department of Anaesthesiology, Shri Ram Murti Smarak Institute of Medical Sciences, Bareilly, Uttar Pradesh, India. Phone: +91-9458705963. E-mail: [email protected]
DOI: 10.17354/ijss/2016/187

Solanki, et al.: Potassium Chloride in Supraclavicular Brachial Plexus Block
56International Journal of Scientifi c Study | April 2016 | Vol 4 | Issue 1
The techniques of peripheral neural blockade were developed early in the history of anesthesia. It is approximately 130 years that brachial plexus block was fi rst attempted that is, in 1884, Halstead injected the roots of the brachial plexus under vision, less than a year after Koller demonstrated the anesthetic properties of cocaine. Later, studies revealed that the nerves supplying the arm and the forearm are geographically grouped closely together in the brachial plexus, and a single injection could provide analgesia for the whole limb.7-9
D. Kulenkampff introduced the technique of supraclavicular brachial plexus block a few months after Hirschel described the axillary approach.10 Early reports indicated a frequent incidence of success with this block, but other practitioners soon reported complications such as pneumothorax and mediastinal emphysema. Several modifi cations of the supraclavicular block have emerged in an effort to avoid pneumothorax.6
Regional techniques have become the preferred choice of anesthesiologists whenever possible, reasons being:7• Less interference with general body physiology.
Stress-induced changes in body metabolism and hormonal milieu is minimal
• Relatively simple to administer and preserves consciousness and protective refl exes
• Reduced post-operative nursing care• Mental function is preserved in an elderly patient• Lesser quantity of drugs used as compared to general
anesthesia, so fewer drug interactions and side effects• Prolonged post-operative analgesia• No risk of operation theater pollution as noted with
inhalational agents.
Now a days, the neural blockade has become widely accepted and reliable technique to achieve analgesia and anesthesia in the area supplied by brachial plexus. Different local anesthetics are used for this purpose. Most widely used and easily available among which is bupivacaine. Due to its wide use and easy availability, this drug naturally lends itself as the fi rst choice for study.11
Numerous routes to perform brachial plexus block have been described. They are:• Supraclavicular• Interscalene• Infraclavicular• Axillary.
The supraclavicular route was used in this study.12-14
The technique, however, is not without complications.
The limitations of local anesthetics are:• Slower onset of action• Shorter duration of action• Reduced motor and sensory blockade.
Therefore, different adjuncts have been tried to fill the lacunae created by the local anesthetics. Various workers have investigated adjuvants including opioids, clonidine, neostigmine, hyaluronidase, dexamethasone, and bicarbonate.15-19
Alpha 2-adrenoreceptor agonists have been used a number of times for their sedative, analgesic, perioperative sympatholytic, and cardiovascular stabilizing effects.20
Subsequently, Aldrete et al., in 1969, and Parris and Chambers, in 1986, also found some encouraging results using potassium with local anesthetics such as lignocaine and bupivacaine.21
Thus, we thought it worthwhile to try 0.2 mmol potassium chloride (0.1 ml) as an adjuvant with 0.375% bupivacaine (Group I) and its comparison with 0.375% bupivacaine (Group II) in supraclavicular brachial plexus block.
MATERIALS AND METHODS
• The study was conducted after obtaining approval from ethical, academic committee and a written informed consent from the patient.
The study will be conducted in two groups comprising of 50 patients in each group.• Group I: 0.375% plain bupivacaine (30 ml) + 0.2 mmol
potassium chloride (0.1 ml)• Group II: 0.375% plain bupivacaine (30 ml) + 0.9%
normal saline (0.1 ml).
The following group of patient will be excluded from the study:• Patient not willing to get enrolled, in the study• Age below 18 years or above 60 years• Infection at block site• Patient with clavicle fracture, bleeding disorder• Patient with torticollis, pre-existing peripheral
neuropathy• Patient with systemic diseases such as diabetes mellitus
and hypertension• Patient with hyperkalemia• Surgery duration >4-5 h.
Pre-operative PreparationAll the patients were visited and evaluated thoroughly on the day before the surgery. During the pre-anesthetic
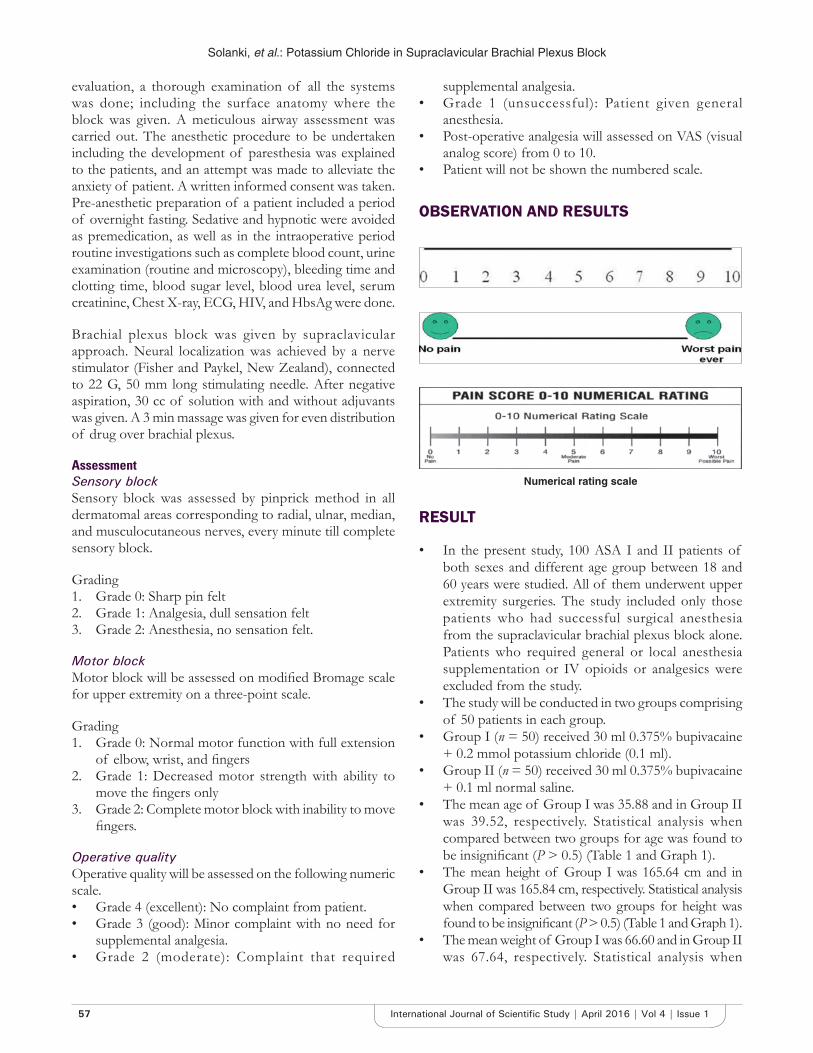
Solanki, et al.: Potassium Chloride in Supraclavicular Brachial Plexus Block
57 International Journal of Scientifi c Study | April 2016 | Vol 4 | Issue 1
evaluation, a thorough examination of all the systems was done; including the surface anatomy where the block was given. A meticulous airway assessment was carried out. The anesthetic procedure to be undertaken including the development of paresthesia was explained to the patients, and an attempt was made to alleviate the anxiety of patient. A written informed consent was taken. Pre-anesthetic preparation of a patient included a period of overnight fasting. Sedative and hypnotic were avoided as premedication, as well as in the intraoperative period routine investigations such as complete blood count, urine examination (routine and microscopy), bleeding time and clotting time, blood sugar level, blood urea level, serum creatinine, Chest X-ray, ECG, HIV, and HbsAg were done.
Brachial plexus block was given by supraclavicular approach. Neural localization was achieved by a nerve stimulator (Fisher and Paykel, New Zealand), connected to 22 G, 50 mm long stimulating needle. After negative aspiration, 30 cc of solution with and without adjuvants was given. A 3 min massage was given for even distribution of drug over brachial plexus.
AssessmentSensory blockSensory block was assessed by pinprick method in all dermatomal areas corresponding to radial, ulnar, median, and musculocutaneous nerves, every minute till complete sensory block.
Grading1. Grade 0: Sharp pin felt2. Grade 1: Analgesia, dull sensation felt3. Grade 2: Anesthesia, no sensation felt.
Motor blockMotor block will be assessed on modifi ed Bromage scale for upper extremity on a three-point scale.
Grading1. Grade 0: Normal motor function with full extension
of elbow, wrist, and fi ngers2. Grade 1: Decreased motor strength with ability to
move the fi ngers only3. Grade 2: Complete motor block with inability to move
fi ngers.
Operative qualityOperative quality will be assessed on the following numeric scale.• Grade 4 (excellent): No complaint from patient.• Grade 3 (good): Minor complaint with no need for
supplemental analgesia.• Grade 2 (moderate): Complaint that required
supplemental analgesia.• Grade 1 (unsuccessful): Patient given general
anesthesia.• Post-operative analgesia will assessed on VAS (visual
analog score) from 0 to 10.• Patient will not be shown the numbered scale.
OBSERVATION AND RESULTS
Numerical rating scale
RESULT
• In the present study, 100 ASA I and II patients of both sexes and different age group between 18 and 60 years were studied. All of them underwent upper extremity surgeries. The study included only those patients who had successful surgical anesthesia from the supraclavicular brachial plexus block alone. Patients who required general or local anesthesia supplementation or IV opioids or analgesics were excluded from the study.
• The study will be conducted in two groups comprising of 50 patients in each group.
• Group I (n = 50) received 30 ml 0.375% bupivacaine + 0.2 mmol potassium chloride (0.1 ml).
• Group II (n = 50) received 30 ml 0.375% bupivacaine + 0.1 ml normal saline.
• The mean age of Group I was 35.88 and in Group II was 39.52, respectively. Statistical analysis when compared between two groups for age was found to be insignifi cant (P > 0.5) (Table 1 and Graph 1).
• The mean height of Group I was 165.64 cm and in Group II was 165.84 cm, respectively. Statistical analysis when compared between two groups for height was found to be insignifi cant (P > 0.5) (Table 1 and Graph 1).
• The mean weight of Group I was 66.60 and in Group II was 67.64, respectively. Statistical analysis when

Solanki, et al.: Potassium Chloride in Supraclavicular Brachial Plexus Block
58International Journal of Scientifi c Study | April 2016 | Vol 4 | Issue 1
compared between two groups for weight was found to be insignifi cant (P > 0.5) (Table 1 and Graph 1).
• There were 9 female patients in Group I as compared to 11 female patients in Group II, and there were 41 male patients in Group I as compared to 39 female patients in Group II. Statistical analysis when compared between two groups for sex was found to be insignifi cant (P > 0.05).
• The mean heart rate of Group I was 78.32 and in Group II was 78.36, respectively. Statistical analysis when compared between two groups for age was found to be insignifi cant (P > 0.5).
• The mean systolic blood pressure of Group I was 126.70 and in Group II was 128.72, respectively. Statistical analysis when compared between two groups for systolic blood pressure was found to be insignifi cant (P > 0.5).
• The mean diastolic blood pressure of Group I was 72 and in Group II was 75.32, respectively. Statistical analysis when compared between two groups for diastolic blood pressure was found to be insignifi cant (P > 0.5).
• The time of requirement of post-operative analgesia in Group I was 512.04 ± 28.80 as compared to in Group II was 240.90 ± 19.42 (Table 2 and Graph 2).
• Statistical analysis when compared between two groups for the post of analgesia was found to be signifi cant (P < 0.001).
DISCUSSION
The present study entitled to evaluate the post-operative analgesia in supraclavicular brachial plexus block with 0.375% plain bupivacaine + 0.2 mmol potassium chloride (0.1 ml) as an adjuvant’ was undertaken on 100 patients of upper limb surgery to clinically assess the effects of adding small amounts (0.2 mmol) of potassium chloride to 0.375% bupivacaine hydrochloride on the onset, duration, and quality of supraclavicular brachial plexus block. Supraclavicular brachial plexus block was chosen because of its relative easiness and low incidence of serious complications.
Brachial plexus blockade provides ideal operating conditions for the surgeon with good analgesia and complete muscular relaxation and sympathetic block which reduces post-operative vasospasm, pain, and edema. Although bupivacaine has prolonged the duration of action its long latency makes it unsuitable for routine use in a busy clinical environment for giving brachial plexus block.
Potassium salts, as an adjuvant to local anesthetic, have been used with varying success for many years.22,23 Since then, many authors have studied their effects on the local
35.88
165.64
66.6
39.52
165.84
67.64
0
20
40
60
80
100
120
140
160
180
200
Age HEIGHT WEIGHT
Mea
n va
lues
Group I
Group II
Graph 1: Comparison of Demographic profi le of patients between Group I and Group II
512.04
240.9
0
100
200
300
400
500
600
Group I Group II
Mea
n va
lues
Graph 2: Comparison of post-operative analgesia between Group I and Group II
Table 1: Age, height, and weight distribution in two groupsVariables Mean±SD P value
Group I (n=50) Group II (n=50)Age (years) 35.88±8.63 39.52±10.73 0.065Height (cm) 165.64±5.20 165.84±7.10 0.873Weight (kg) 66.60±5.79 67.64±8.39 0.473
Table 2: Requirement of post-operative analgesiaVariables Mean±SD P value
Group I (n=50) Group II (n=50)Post-operative analgesia (min)
512.04±28.80 240.90±19.42 <0.001
anesthetic and reported some encouraging results. In their study on the extradural blockade, Bramage and Michael24 observed a shortened latency of spread, more intense quality of sensory block and increased the duration of block when 1% potassium chloride was added to 2% lignocaine. Parris and Chambers25 and Khosa et al.26 in
Solanki, et al.: Potassium Chloride in Supraclavicular Brachial Plexus Block
59 International Journal of Scientifi c Study | April 2016 | Vol 4 | Issue 1
their study on axillary and supraclavicular brachial plexus block, respectively, and also reported better results by the addition of potassium chloride to bupivacaine solutions.
Distribution of Patient According to Age, Sex, and WeightIn the present study, age, sex, and weight of the patients were comparable in both the groups. Statistical analysis of age, sex, and weight when compared between two groups was not signifi cant (P > 0.05).
Volume, Strength, and Dose of Bupivacaine UsedMean volume of bupivacaine hydrochloride injected was 30.1 ml in Group II as compared to 30.1 ml in Group II for supraclavicular brachial plexus block. In Group I, 0.2 mmol of potassium chloride (0.1 ml) was added to bupivacaine hydrochloride before making the block. In the present study, bupivacaine hydrochloride was used in the strength of 0.375% in both the groups.
Parris and Chambers25 used 40 ml of 0.25% bupivacaine solution irrespective of the weight of the patients with or without the addition of potassium chloride 0.2 mmol in their study on axillary brachial plexus block, whereas 30 ml of 0.37% bupivacaine irrespective of the weight of the patients with or without the addition of potassium chloride 0.2 mmol was used by Khosa et al.26 in supraclavicular brachial plexus block.
Duration of Post-operative AnalgesiaIn the present study, mean duration for post-operative analgesia was 512.04 ± 28.80 min in Group I as compared to 240.90 ± 19.42 min in Group II. On comparing the results between two groups, they found to be signifi cant statistically (P < 0).
This observation shows that the duration for post-operative analgesia is signifi cantly increased by the addition of 0.2 mmol of potassium chloride to 0.375% bupivacaine hydrochloride.
Our results are comparable with those of Swetha,27 who also reported an increase in duration of post-operative analgesia when 0.2 mmol potassium chloride was added to 0.375% bupivacaine for supraclavicular brachial plexus block.
Agarwal et al.28 had reported the duration of post-operative analgesia to be 241 ± 51.2 min with 0.325% bupivacaine.
Above observation suggests that the addition of potassium chloride to bupivacaine prolongs the post-operative analgesia requirement. Aldrete et al.21 attributed this delay in terms of the difference of potassium concentration, thus slowing the recovery of the resting potential. The local anesthetic
deposited prevents its depolarization rendering it impermeable to Na ions, but K ions are allowed to migrate, due to different gradient existing on both sides of the membrane. Exogenous potassium outside the nerve will prevent such movement which causes delay in the repolarization, and thus the duration of anesthesia is prolonged.
Cardiorespiratory ChangesIn the present study, cardiorespiratory changes were found to be minimal in most of the cases of both the groups. On statistical analysis, cardiorespiratory changes were found to be insignifi cant when compared between two groups.
No irregularities in pulse or blood pressure were recorded in any of the groups.
These observations suggest that the addition of small amounts of (0.2 mmol) of potassium chloride to 0.375% bupivacaine did not produce any significant cardiorespiratory changes. Other workers did not report any cardiorespiratory changes on brachial plexus block with the use of bupivacaine either alone or with potassium chloride.
ComplicationsNo complications were reported in both the groups. Addition of potassium chloride to bupivacaine also did not produce any complications.
Bramage and Michael reported a case of convulsions following inadvertent perforation of spinal dura while performing extradural blockade and thereby injecting large concentrations of potassium into the subarachnoid space.
In our study, we have given the fi xed dose of the study drugs irrespective of the patient’s age, weight, or body surface area.
CONCLUSION
• Supraclavicular brachial plexus block is a useful method of providing anesthesia for surgery of upper limb.
• The method of blocking the brachial plexus by injecting at the highest point and applying digital pressure for 10 min immediately after giving the block, results in high success rate and low incidence of inadequate block.
• Bupivacaine hydrochloride provides long duration of action, but the latency of blockade is also prolonged.
• The duration of post-operative analgesia requirement of bupivacaine hydrochloride is signifi cantly prolonged by the addition of 0.2 mmol of potassium chloride.
• Addition of 0.2 mmol of potassium chloride to 0.375%
Solanki, et al.: Potassium Chloride in Supraclavicular Brachial Plexus Block
60International Journal of Scientifi c Study | April 2016 | Vol 4 | Issue 1
bupivacaine hydrochloride does not have any effect on the quality of block.
• Cardiorespiratory changes are almost negligible with the use to 0.2 mmol of potassium chloride with bupivacaine h ydrochloride.
REFERENCES
1. Abram SE. Chronic pain management. In: Barash PG, Cullen BF, Stoelting RK, editors. Clinical Anaesthesia. 5th ed. Philadelphia, PA: Lippincott Williams and Wilkins; 2006. p. 1449.
2. Mersky H, Albe-Fessard DG, Bonica JJ. Pain terms: A list with defi nitions and notes on usage. Pain 1979;6:249-52.
3. Michael FM. Peripheral nerve blockade. In: Barash PG, Cullen BF, Stoelting RK, editors. Clinical Anaesthesia. 5th ed. Philadelphia, PA: Lippincott William and Wilkins; 2006. p. 718.
4. Burnham PJ. Simple regional nerve block for surgery of the hand and forearm. J Am Med Assoc 1959;169:941-3.
5. Raj PP. The problem of postoperative pain. In: Ferrente FM, editor. Postoperative Pain Management. 1st ed. New York: Churchill Livingstone; 1993. p. 1-4.
6. Miller RD. Miller’s Anaesthesia. 7th ed. Philadelphia, PA: Churchill-Livingstone Elsevier; 2010. p. 1-19.
7. Bazy L, Bluodin S. Local anaesthesia for brachial plexus. Anaesth Analg 1935;190.
8. Raj PP, Montgomery SJ, Nettles D, Jenkins MT. Infraclavicular brachial plexus block – a new approach. Anesth Analg 1973;52:897-904.
9. Thompson AM, Newman RJ, Semple JC. Brachial plexus anaesthesia for upper limb surgery: A review of eight years’ experience 1988;13:195-8.
10. Kulenkampff D. Anesthesia of the brachial plexus. Zentralbl Chir 1911;38:1337-40.
11. Lund PC, Cwik JC. Bupivacaine – A new long acting local anaesthetic agent: A preliminary clinical and laboratory report. Anaesth Analog 1970;49:103-13.
12. Braud L, Papper EM. A comparison of supraclavicular and axillary technique of brachial plexus block. Anaesthesiology 1961;22:226.
13. Mackintosh RR, Mushin NN. Local Anaesthesia: Brachial Plexus. Edinburgh: Blackwell; 1944.
14. Winnie AP. Interscalene brachial plexus block. Anesth Analg 1970;49:455-66.
15. Jarbo K, Batra YK, Panda NB. Brachial plexus block with midazolam and bupivacaine improves analgesia. Can J Anaesth 2005;52:822-6.
16. Bazin JE, Massoni C, Bruelle P, Fenies V, Groslier D, Schoeffl er P. The addition of opioids to local anaesthetics in brachial plexus block: The comparative effects of morphine, buprenorphine and sufentanil. Anaesthesia 1997;52:858-62.
17. Culebras X, Van Gessel E, Hoffmeyer P, Gamulin Z. Clonidine combined with a long acting local anesthetic does not prolong postoperative analgesia after brachial plexus block but does induce hemodynamic changes. Anesth Analg 2001;92:199-204.
18. Bone HG, Van Aken H, Booke M, Bürkle H. Enhancement of axillary brachial plexus block anesthesia by coadministration of neostigmine. Reg Anesth Pain Med 1999;24:405-10.
19. Keeler JF, Simpson KH, Ellis FR, Kay SP. Effect of addition of hyaluronidase to bupivacaine during axillary brachial plexus block. Br J Anaesth 1992;68:68-71.
20. Esmaoglu A, Yegenoglu F, Akin A, Turk CY. Dexmedetomidine added to levobupivacaine prolongs axillary brachial plexus block. Anesth Analg 2010;111;1548-51.
21. Aldrete JA, Barnes DR, Sidon MA, McMullen RB. Studies on effects of addition of potassium chloride to lidocaine. Anesth Analg 1969;48:269-76.
22. Hoffmann A, Kochmann M. Verminderung der novokainkonzentration durch kaliumsulfat bie der lokalanasthesie. Dtsch Med Wschr 1912;38:2264.
23. Meeker WR. The potentiaton of navocaine solutions. J Lab Clin Med 1925;11:139.
24. Bramage PR, Michael FB. Quality of epidural blockade II: Infl uence of physic-chemical factors; hyaluronidase and potassium. Br J Anaesth 1966;38:857-65.
25. Parris MR, Chambers WA. Effects of the addition of potassium to prilocaine or bupivacaine. Studies on brachial plexus blockade. Br J Anaesth 1986;58:297-300.
26. Khosa DS, Thind SS, Gupta HK, Jain S. Effects of adding potassium chloride to lignocaine and bupivacane solutions on the onset time and duration of brachial plexus block. Indian J Anaesth 1990;38:119-22.
27. Swetha HR. Comparative study on the effect of adition of potassium chloride to bupivacaine on the on the onset time and duration of brachial plexus block. J Evidence Based Med Healthc 2014;1:1989-2001.
28. Agarwal S, Ritu A, Gupta P. Dexmedetomidine prolongs the effect of bupivacaine in supraclavicular brachial plexus block. J Anaesthesiol Clin Pharmacol 2014;30:36-40.
How to cite this article: Solanki N, Saran J, Kashyap M, Nanda HS. Evaluation of the Post-operative Analgesia in Supraclavicular Brachial Plexus Block with 0.375% Plain Bupivacaine + 0.2 mmol Potassium Chloride (0.1 ml) as an Adjuvant. Int J Sci Stud 2016;4(1):55-60.
Source of Support: Nil, Confl ict of Interest: None declared.
61 International Journal of Scientifi c Study | April 2016 | Vol 4 | Issue 1
Common Etiology of Acute Fever with Thrombocytopenia in a Tertiary Care Hospital, MysuruD K Suneetha1, J Inbanathan1, E Sahna2, M S Shashank2
1Associate Professor, Department of Medicine, Mysore Medical College & Research Institute, Mysuru, Karnataka, India, 2Junior Resident, Department of Medicine, Mysore Medical College & Research Institute, Mysuru, Karnataka, India
Scrub typhus could be one of the important causes of acute febrile illness with multiorgan involvement. Many of the cases remain undiagnosed and therefore not treated resulting in high mortality.
Scrub typhus is grossly under-diagnosed in India due to its non-specifi c clinical presentation, limited awareness and low index of suspicion among clinicians, and lack of diagnostic facilities.3-5
The World Health Organization identifi es scrub typhus as a re-emerging disease in South-East Asia and the South-Western Pacifi c region with a case fatality rate of up to 30% in untreated cases and stresses the need for its surveillance.
Rickettsial diseases in India: Not as uncommon as believed. Even scrub typhus is common in the month of July to November when dengue, chikungunya, leptospira, malaria, etc., are also more in the same months.
INTRODUCTION
Acute fever with thrombocytopenia (platelet count less than 150,000) is a common clinical problem in our medical wards. Common causes include dengue, malaria, leptospirosis, chikungunya, enteric fever, rickettsial fever, and Japanese encephalitis.1,2
Fever with thrombocytopenia patients having multiorgan dysfunction is better evaluated for scrub typhus as the treatment is so simple with doxycycline and rewarding. Otherwise, they go for mortality and morbidity.
Original Article
Abstract
Background: Acute fever with thrombocytopenia is a common problem with increased mortality and morbidity if not diagnosed and treated properly in time. So, in addition to common causes such as dengue, malaria, chikungunya, enteric fever, and sepsis, it is wise to suspect rickettsial in patients with rash and multiorgan dysfunction syndrome (MODS) also as therapy is simple and results rewarding.
Materials and Methods: A total of 150 patients who were admitted to Krishna Rajendra Hospital, Mysuru, Karnataka, India during June 2014 to November 2015 were retrospectively studied.
Results: Most common cause was dengue and unspecifi ed fevers followed by sepsis. 6.6% cases had fever and rash and MODS raising a high degree of suspicion for rickettsial, and they responded well to Doxy. Only 6 patients had bleeding and it occurred only in patients with platelet count <20,000. In our study, mortality occurred in total 7 cases.
Conclusion: Fever with thrombocytopenia is a very common problem. Unspecifi ed fevers were the most common followed by dengue and sepsis and next most probably rickettsial. So, it is necessary to also keep rickettsial diagnosis in mind as we can reduce mortality and morbidity can be reduced with simple DOXY therapy. Further prospective studies are needed to uphold this.
Key words: Fever with thrombocytopenia, Multiorgan dysfunction syndrome, Rash, Rickettsial
Access this article online
www.ijss-sn.com
Month of Submission : 02-2016Month of Peer Review : 03-2016Month of Acceptance : 03-2016Month of Publishing : 04-2016
Corresponding Author: Dr. D K Suneetha, #52, “BHUVI”, 17th Main, Saraswathipuram, Mysuru - 570 009, Karnataka, India.Phone: +91-9845585413. E-mail: [email protected]
DOI: 10.17354/ijss/2016/188

Suneetha, et al.: Fever with Thrombocytopenia Causes
62International Journal of Scientifi c Study | April 2016 | Vol 4 | Issue 1
Scrub typhus is under-reported in our area, and it should be considered as an important differential diagnosis in febrile patients with thrombocytopenia, especially with multiorgan dysfunction syndrome (MODS).6-10
Early diagnosis and appropriate treatment is rewarding and prevents morbidity and mortality in rickettsial disease.
So, this study is intended to fi nd out the various causes of acute fever with thrombocytopenia in our patients and with special reference to rickettsial illness. Moreover to assess outcome associated with various etiology and to correlate the clinical features and other laboratory parameters.
Objectives of the Study1. To identify the various causes of fever with
thrombocytopenia with special reference to scrub typhus
2. To correlate clinical features and laboratory parameters3. To assess the complications associated with fever and
thrombocytopenia4. To assess the prognosis of the disease condition.
MATERIALS AND METHODS
The study was conducted on 150 subjects who were admitted to Krishna Rajendra Hospital, Mysuru during June 2014 to Nov 2015. Selection of patients done according to inclusion and exclusion criteria. Details will be entered according to prestructured proforma.
Inclusion CriteriaAll patients who were diagnosed with fever with thrombocytopenia, i.e., platelet count less than 1.5 laks at KRH between June 2014 and November 2015 were eligible for inclusion in this study.
Exclusion Criteria1. Patients with fever with thrombocytopenia other than
infective etiology like immune thrombocytopenia, drug-induced thrombocytopenia, hemolysis, elevated liver enzymes and low platelets, myeloproliferative diseases, disseminated intravascular coagulation of non-infective etiology (abruptio placentae, snake bite)
2. Patients with chronic liver disease3. Patients with autoimmune diseases.
This was a retrospective study analyzing the case sheet records to know various causes of acute fever with thrombocytopenia and how many had complications such as bleeding and multiorgan dysfunction.
Study DesignRetrospective study.
Statistical MethodsData collected will be analyzed by frequency, percentage, mean, standard deviation, and Chi-square test.
RESULTS
In our study, 150 patients were admitted with acute fever with thrombocytopenia due to various causes. 90 were males and 60 females (Figure 1).
Maximum number of patients were in the age group of 18-24 years followed by 25-34 years group (Figure 2).
Among cases of acute fever, majority were unspecifi ed fever who responded to our clinical judgment and empirical treatment even though they could not be evaluated for confi rmation of the diagnosis. Next, it was followed by dengue fever (20 cases NS 1 positive, 5 cases immunoglobulin M [IgM] positive, and 5 cases IgG positive). Moreover, 10 cases with MODS responded well to Doxy therapy. 12 cases of sepsis were having a focus of sepsis and high temperature and high leukocyte count and SIRS features. Among 3 cases of Malaria, 1 was Plasmodium
Male
Female
Figure 1: Sex wise distribution
0
5
10
15
20
25
30
35
18-24 25-34 35-49 50-75 >75
% Patients
% Patients
Figure 2: Age wise distribution of patients

Suneetha, et al.: Fever with Thrombocytopenia Causes
63 International Journal of Scientifi c Study | April 2016 | Vol 4 | Issue 1
vivax positive and 2 others even though smear negative responded to antimalarial therapy (Table 1).
Maximum number of patients had platelet count between 50,000-100,000 (Table 2).
In our study, only 6 patients had bleeding and it occurred only in patients with platelet count <20,000. All were managed successfully with platelet transfusion and other therapy (Table 3).
In our study, mortality occurred in total 7 cases. Out of that three cases with sepsis went into multiorgan dysfunction including acute respiratory distress syndrome, and acute kidney injury. In unspecifi ed fever group, 4 cases who were suspected of having? Leptospira succumbed with MODS (Table 4).
DISCUSSION
Acute fever with thrombocytopenia is a very common problem faced by all physicians day to day in medical wards. When diagnosis is made properly and treated, early results are good, and we can prevent mortality and morbidity. Even though the most common causes are dengue, malaria, leptospirosis, chikungunya, enteric fever, rickettsial fever also should be thought in the evaluation.
Rickettsia diseases are not as uncommon as believed in our population. Only, it needs a high degree of suspicion
that too a febrile patient having a rash, thrombocytopenia, and not responding to routine treatment and progressing to MODS. We should evaluate for scrub typhus and treat.
In our study, the majority had unspecifi ed (?viral) fevers (61.4%). The reason for this may be most of our patients are from poor background, and they could not get serology for dengue, chikungunya, leptospira, scrub typhus done from outside laboratory due to financial constraints. However, in this group also 35-40 cases were clinically looking like dengue. Other 20 cases had features suggestive of chikungunya, 10 cases we suspected leptospira (combination of raised bilirubin and raised creatinine), 10 cases malaria (spikes of high fever with chills and rigors), and 6 cases had rash and fever and responded to Doxy so mostly rickettsial.
Remaining cases looked like sepsis with high total leukocyte count but no demonstrable focus of sepsis.
In our study, dengue was the most common as we included IgM, IgG, and NS1 positive cases and those cases in the unspecifi ed group having dengue-like features (Table 5).
Table 1: Causes of acute fever with thrombocytopeniaDiagnosis Number of patients (%)Unspecifi ed fever 92 (61.4)Dengue 30 (20)Acute fever with MODS who responded to Doxy (?scrub typhus)
10 (6.6)
Sepsis 12 (8)Malaria 3 (2)Typhoid 3 (2)MODS: Multiorgan dysfunction syndrome
Table 2: Number of patients with various levels of thrombocytopenia Platelet count Number of cases (%)<10,000 1 (1.5)10,000-20,000 16 (24)20,000-30, 000 10 (15)30,000-50,000 30 (45)50,000-75,000 40 (60)75,000-1,00,000 30 (45)>1,00,000 23 (34.5)Total 150
Table 3: Patients showing different type of bleeding manifestationsType of bleeding Number of cases Platelet countGum bleeding 1 <10,000Petechiae 2 10,000-20,000Hematuria 1 10,000-20,000Menorrhagia 1 10,000-20,000Bleeding PR 1 10,000-20,000
Table 4: OutcomeDiagnosis Total number
of casesGood
recoveryMortality
Unspecifi ed fevers 92 88 4Dengue 30 30 0Acute fever with MODS who responded to Doxy(?scrub typhus)
10 10 0
Septicemia 12 9 3Malaria and typhoid 3
333
00
MODS: Multiorgan dysfunction syndrome
Table 5: Comparison of causes of fever with thrombocytopeniaDisease Present
study (%)Nair
et al. (%)Patil
et al. (%)Dash
et al. (%)Dengue 46.6 13.8 15 20Malaria 8.6 9.2 54 45Enteric fever 2 14.7 6 10Others 42.8 62.3 25 25
Suneetha, et al.: Fever with Thrombocytopenia Causes
64International Journal of Scientifi c Study | April 2016 | Vol 4 | Issue 1
Comparatively, enteric fevers were less in our study.
As we do not have facility of doing Weil–Felix test, we could not confi rm the diagnosis of scrub typhus. However, patients with fever rash thrombocytopenia with MODS, we empirically started Doxy after they failed to other therapy and they responded well. Hence, this group could be rickettsial?
CONCLUSION
Fever with thrombocytopenia is a very common problem. Unspecifi ed fevers were the most common followed by dengue and sepsis and next most probably rickettsial. So, it is necessary to also keep rickettsial diagnosis in mind as we can reduce mortality and morbidity can be reduced with simple DOXY therapy. Further prospective studies are needed to uphold this.
ACKNOWLEDGMENT
The authors would like to thank HOD of Medicine Department, Mysore Medical College & Research Institute, Mysuru, Karnataka, India, Scientifi c and Ethical committee for permitting us to conduct this study and the medical record section in KR Hospital, for giving all Fever
with thrombocytopenia case sheets for collecting data. Moreover, we also thank all our patients without whom study would have not been possible.
REFERENCES
1. Patil P, Solanke P, Harshe G. To study clinical evaluation and outcome of patients with febrile thrombocytopenia. Int J Sci Res Publ 2014;4:2-3.
2. Das D, Das B, Roy AD, Singh TS. Common infectious etiologies of acute febrile illness in a remote geographical location: Could scrub typhus be the most common cause? Br J Med Med Res 2015;10:1-10.
3. Kumar P, Chandra K. A clinical study of febrile thrombocytopenia: A hospital-based retrospective study. Indian J Clin Pract 2014;24:952-7.
4. Varghese GK. Rickettsial diseases in India: Not as uncommon as believed. J Assoc Physicians India 2014;62:9-10.
5. Jamil M, Lyngrah KG, Lyngdoh M, Hussain M. Clinical manifestations and complications of scrub typhus: A hospital based study from North Eastern India. J Assoc Physicians India 2014;62:19-23.
6. Sharma R, Krishna VP, Manjunath, Singh H, Shrivastava S, Singh V, et al. Analysis of two outbreaks of scrub typhus in Rajasthan: A clinico-epidemiological study. J Assoc Physicians India 2014;62:24-9.
7. Raikar RS, Kamdar KP, Dabhi SA. Clinical and laboratory evaluation of patients with fever with thrombocytopenia. Indian J Clin Pract 2013;24:360-3.
8. Varghese GM, Janardhanan J, Trowbridge P, Peter JV, Prakash JA, Sathyendra S, et al. Scrub typhus in South India: Clinical and laboratory manifestations, genetic variability, and outcome. Int J Infect Dis 2013;17:e981-7.
9. Dasari V, Kaur P, Murhekar VM. Rickettsial disease outbreaks in India: A review. Ann Trop Med Public Health 2014;7:249-54.
10. Kshirsagar P, Chauhan S, Samel D. Towards developing a scoring system for febrile thrombocytopenia. J Assoc Physicians India 2016;64:14-8.
How to cite this article: Suneetha DK, Inbanathan J, Sahna E, Shashank MS. Common Etiology of Acute Fever with Thrombocytopenia in a Tertiary Care Hospital, Mysuru. Int J Sci Stud 2016;4(1):61-64.
Source of Support: Nil, Confl ict of Interest: None declared.Nis est lant. Sequate mpercia velitintur apere ilit et moluptae modis et qui
65 International Journal of Scientifi c Study | April 2016 | Vol 4 | Issue 1
Systemic Complication of Falciparum Malaria in Tertiary Care Hospital at Mysore: A Clinical StudyJ Inbanathan1, D K Suneetha1, G Harsha2, Martin George2, M S Shashank2
1Associate Professor, Department of Medicine, Mysore Medical College & Research Institute, Mysore, Karnataka, India, 2Junior Resident, Department of Medicine, Mysore Medical College & Research Institute, Mysore, Karnataka, India
At present, about 100 countries in the world are considered endemic, almost half of which are in Sub-Saharan Africa. More than 2.4 million of world’s population is still at risk. Malaria is thought to kill between 1.1 and 7 million people worldwide each year. However, the problem is even more in rural and remote areas, where patients have restricted access to adequate treatment.4,5
In India, about 70% of the infections are reported to be due to Plasmodium vivax; 21-30% due to Plasmodium falciparum and 4-8% due to mixed infection. Plasmodium malariae infections are <1% and are reported from Tumkur and Hassan districts of Karnataka.6
EpidemiologyThe transmission of malaria requires interaction of epidemiological factors:1. The human host (intermediate host)2. Malarial parasite (agent)3. The anopheles mosquito (vector)4. Environment (physical, biological, and socioeconomic).
INTRODUCTION
Malaria is the most important parasitic disease of man. The human disease is a protozoan infection of red blood cells transmitted by the bite of a blood-feeding female anopheles mosquito. Malaria is one of the leading causes of morbidity and mortality worldwide, with over 100 million cases and at least a million deaths a year.1,2 Most of these deaths are in the poorest regions of the world. Because malaria is a highly complex disease caused by plasmodium species, the diversity of research to prevent and treat it is probably greater than for any other disease.3
Original Article
Abstract
Introduction: Malaria is the most important parasitic disease of man. The human disease is a protozoan infection of red blood cells transmitted by the bite of a blood-feeding female anopheles mosquito. Malaria is one of the leading causes of morbidity and mortality worldwide, with over 100 million cases and at least a million deaths a year. It is estimated that over 40% of all deaths from malaria in the country are due to Plasmodium falciparum infection.
Materials and Methods: It is a retrospective study conducted on patients admitted to K R Hospital, Mysore, was conducted in January 2013 to January 2015, a total of 50 patients were admitted during this period. As per inclusion criteria and exclusion criteria, cases are included and excluded and a pre-structured proforma was used and data were entered. The study is approved by the Institutional Ethical Committee.
Results: Most of the cases are young, males are more than female (2:1), and most cases were referred from endemic areas. Total case fatality rate is 14%. Cerebral malaria is the most common cause of death. Early diagnosis and prompt treatment will reduce the morbidity and mortality associated with falciparum malaria.
Conclusion: Community participation is the key for the success of any health program. It is necessary to involve the community at large and create awareness about the problems of falciparum malaria.
Key words: Cerebral malaria, Community participation, Health program, Falciparum malaria
Access this article online
www.ijss-sn.com
Month of Submission : 02-2016Month of Peer Review : 03-2016Month of Acceptance : 03-2016Month of Publishing : 04-2016
Corresponding Author: Dr. J Inbanathan, Department of Medicine, Mysore Medical College and Research Institute, Mysore - 570 001, Karnataka, India. Phone: +91-9448051826. E-mail: [email protected]
DOI: 10.17354/ijss/2016/189

Inbanathan, et al.: Systemic Complication of Falciparum Malaria
66International Journal of Scientifi c Study | April 2016 | Vol 4 | Issue 1
Life CycleThe malaria parasite undergoes 2 cycles of development.1. The human or asexual cycle (endogenous/schizogony)
a. Exoerythrocytic or hepatic phaseb. Erythrocytic phase.
2. The mosquito or sexual cycle (exogenous/sporogony). Man is the intermediate host, and mosquito is the
defi nitive host.
Clinical FeaturesIt varies from asymptomatic parasitemia to fulminant lethal malaria. The fi rst symptoms of malaria are non-specifi c and start with a headache, muscular ache, vague abdominal discomfort, lethargy, lassitude, and dysphoria often precede fever by up to 2 days. It is followed by chills, rigors, arthralgia, pain abdomen, diarrhea, cough, and cold in some cases. Other clinical features are jaundice, hepatomegaly, splenomegaly, and anemia.
The typical attack comprises of three stages:
Cold stage, hot stage, sweating stage.
The febrile paroxysm synchronizes with erythrocytic schizogony of the malarial parasite.
MATERIALS AND METHODS
All the cases of P. falciparum malaria, diagnosed either by peripheral smear or by quantitative buffy coat method, admitted to K R Hospital during the study period were screened thoroughly. Among them, 50 cases with systemic complications proposed by the WHO were taken for the study. Cases were selected on the basis of the simple random sampling method. A detailed history and thorough clinical examination was done as per the proforma and were investigated further.
Inclusion CriteriaAll cases of P. falciparum malaria, with following systemic complications as per WHO, were included in the study.1. Cerebral malaria2. Generalized convulsions3. Severe anemia4. Hypoglycemia5. Fluid and electrolyte disturbances6. Metabolic acidosis7. Jaundice8. Algid malaria9. Hemoglobinuria10. Acute respiratory distress syndrome11. Acute renal failure12. Abnormal spontaneous bleeding13. Hyperpyrexia.
Exclusion CriteriaPatients below 12 years of age were excluded.
RESULTS
In the present study total case fatality rate is 14%. The case fatality rate is highest in hemoglobinuria (100%) followed by 33.3% in algid malaria, 27.7% in cerebral malaria and 16.6% in jaundice. The majority of the deaths are males (71.4%) and between the age group of 31-40 years (42.8%).
The present study include more number of male subjects and are age between 21 and 40 years as shown in Table 1, and most cases between July to December as shown in Table 2. In present studymajority of subjects are presented to us with anemia, jaundice and cerebral malaria as shown in Table 3, all these are statistically signifi cant.
In present study showed case fatality is more for hemoglobinuria (100%) but most subjects presented with cerebral malaria having case fatality rate of 27.7% as shown in Table 4.
In present study majority subjects are between 21 and 40 year but case fatality is more for older (>50) year and younger (<20 year) subjects and also those with cerebral malaria has more chances of mortality. Mortality is more in male subjects and mortality increases as the length of hospital stay increase as shown in Table 5.
DISCUSSION
Malaria still continues to be a major health problem in this part of the state. Although there has been a decline in the
Table 1: The age and sex distribution of the casesAge group (years) Male (%) Female (%) Total (%)13-20 3 (9.1) 2 (11.8) 5 (10)21-30 13 (39.4) 4 (23.5) 17 (34)31-40 10 (30.3) 6 (35.3) 16 (32)41-50 4 (12.1) 2 (11.8) 6 (12)51-60 2 (6.1) 2 (11.8) 4 (8)>60 1 (3.0) 1 (5.8) 2 (4)Total 33 (100) 17 (100) 50 (100)Mean age=34.4 years; SD= ±13 years. SD: Standard deviation
Table 2: The seasonal occurrence of the casesMonth Number (%)January-March (I) 8 (16)April-June (II) 10 (20)July-September (III) 18 (36)October-December (IV) 14 (28)Total 50 (100)

Inbanathan, et al.: Systemic Complication of Falciparum Malaria
67 International Journal of Scientifi c Study | April 2016 | Vol 4 | Issue 1
Table 3: Various complicationsComplications Male (%) Female (%) Total (%) P value InferenceJaundice 13 (54.1) 11 (45.9) 24 (48) <0.05 SSevere anemia 15 (68.1) 7 (31.9) 22 (44) <0.05 SCerebral malaria 12 (66.6) 6 (33.4) 18 (36) <0.05 SAlgid malaria 2 (66.6) 1 (33:4) 3 (6) <0.05 SRenal failure 2 (100) 0 (0) 2 (4) <0.05 SHemoglobinuria 1 (100) 0 (0) 1 (2) <0.05 SHypoglycemia 3 (75) 1 (25) 4 (8) <0.05 SGeneralized convulsions 3 (100) 0 (0) 3 (6) <0.05 SS: Signifi cant
Table 4: The CFR of various complicationsComplications Cases Number of expired* CFR (%)Cerebral malaria 18 5 27.7Algid malaria 3 1 33.3Hemoglobinuria 1 1 100Jaundice 24 4 16.6Severe anemia 22 2 9*Intermixed, CFR: Case fatality rates
Table 5: The case fatality rates and percentage of total expired in various patient parametersParameters Recovered
n1=43Expired (%)
n2=7Totaln=50
CFR (%)
Age (years)13-20 4 1 (14.2) 5 2021-30 16 1 (14.2) 17 5.831-40 13 3 (42.8) 16 18.741-50 5 1 (14.2) 6 16.651-60 3 1 (14.2) 4 25>60 2 - 2 -
SexMale 28 5 (71.4) 33 15.1Female 15 2 (28.5) 17 11.7
Duration of symptoms (days)
1-5 25 - 25 -5-10 18 1 (14.3) 19 5.210-15 - 6 (85.7) 6 100
Complications*Jaundice 20 4 (57.1) 24 16.6Severe anemia 20 2 (28.5) 22 9Cerebral malaria 13 5 (71.4) 18 27.7Algid malaria 2 1 (14.2) 3 33.3Hemoglobinuria - 1 (14.2) 1 100
HyperbilirubinemiaConjugated 11 3 (42.8) 14 21.4Unconjugated 8 2 (28.5) 10 20
*Intermixed, CFR: Case fatality rates
Table 6: The comparison of clinical features in various studiesClinical features Present
study (%)Hazra
et al. (%)Chishti
et al. (%)Murthy
et al. (%)Fever 100 100 100 98.1Paroxysms 40 40 - -Headache 84 100 - -Bodyache 76 - - -Nausea/vomiting 52 60 - -Pallor 60 80 76.56 -Jaundice 48 40 29.6 27.21Hepatomegaly 40 80 37.5 -Splenomegaly 48 40 37.5 -Altered sensorium 36 8.33 59.38 48Abdominal pain 6 10 - -Loose stools 2 10 10.9 -Cough and cold 8 53.33 - -Respiratory distress - 6.6 6.25 -Convulsions 6 8.33 14.06 -Spontaneous bleeding - 3.33 12.5 4.43Decreased urine output 4 5 26.56 6.96Edema - - - -Black color urine 2 3.33 - -Hypotension 6 - - 18.35
total number of cases, P. falciparum has registered a signifi cant increase. It causes the most severe form of malaria and is known for its protean manifestations, variety of complications and high mortality. Development of complications is more common in patients suffering from P. falciparum.
In the present study, 50 cases of falciparum malaria with systemic complications were studied; the following data were compared with standard studies.
In the present study, age, sex distribution, and seasonal variation are comparable to Harris et al., Shukla et al., Chishti et al., and Murthy et al.
Clinical FeaturesIn the present study, fever was encountered in all the patients (100%). This was also the most common symptom observed in Chishti et al.(100%), Hazra et al. (100%), and Murthy et al. (98%). However, typical paroxysms were observed only in 40% cases, which is a deviation from the frequent description of common classical paroxysms. This fi nding is consistent with Hazra et al. where paroxysms were seen only in 40% of the cases (Table 6).
Jaundice was seen in 48% of the cases in the present study, as compared to 40% in Hazra et al., 29.6% in Chishti et al., and 27.2% in Murthy et al.
In the present study, generalized convulsions were seen in 6% of the cases as compared to 8.33% in Hazra et al. and 14.06% in Chishti et al.

Inbanathan, et al.: Systemic Complication of Falciparum Malaria
68International Journal of Scientifi c Study | April 2016 | Vol 4 | Issue 1
Altered sensorium was seen in 36% of the cases in the present study as compared to 8.33% in Hazra et al., 48% in Murthy et al., and 59.38% in Chishti et al. All the patients who presented with altered sensorium were found to have cerebral malaria.
In the present study, pallor was seen in 60% of the cases as compared to 76.56% in Chishti et al. and 80% in Hazra et al.
Hepatomegaly was seen in 40% of cases in the present study as compared to 37.5% in Chishti et al. and 80% in Hazra et al.
Splenomegaly was seen in only 48% of the cases in the present study in contradiction to the common description of splenomegaly in 85% to 100% of all malaria cases by Marshal et al. This fi nding, in the present study, is consistent with Hazra et al. where splenomegaly was found in only 40% of the cases.
ComplicationsIntravascular hemolysis of parasitized and non-parasitized red blood cells has been considered as an important factor for the causation of mild to moderate jaundice, which is predominantly unconjugated. Hemolysis alone can never cause severe jaundice or predominantly conjugated hyperbilirubinemia with an increase in liver enzyme levels (Table 7).
Case Fatality Rate (CFR)In the present study:• Total CFR was 14% as compared to 20.25% in Murthy
et al., 12.5% in Chishti et al., and 10% in Harris et al. (Table 8).
• The CFR was highest in hemoglobinuria (100%) followed by 33.3% in algid malaria, 27.7% in cerebral malaria, and 16.6% in jaundice.
• The majority of the deaths were contributed from males (71.4%) and between the age group of 31-40 years (42.8%).
• The mean duration of illness before admission among those who died was signifi cantly longer than that among who recovered. They constituted 85.7% of total deaths.
• CFR was high (28.5%) in patients with more than one complication, and they contributed to the majority (85.7%) of the deaths. Multiorgan dysfunction is a major cause of mortality in falciparum malaria.
• Conjugated hyperbilirubinemia constituted more (42.8%) for total deaths when compared to unconjugated hyperbilirubinemia (28.5%).
• The level of serum bilirubin, aspartate aminotransferase, alanine transaminase, mean duration of illness was signifi cantly higher in patients who died when compared to patients who recovered. Similar fi ndings were seen with Murthy et al. study.
• The level of Glasgow coma scale was signifi cantly lower in patients who died when compared to patients who recovered. Similar fi ndings were seen in Murthy et al. study.
CONCLUSION
Many cases of falciparum malaria were referred from endemic areas with protean manifestations and varied complications. The most common complication observed here was Jaundice, more commonly due to malarial hepatitis than hemolysis. The presence of hepatitis in falciparum malaria indicates more severe illness with a higher incidence of complications and poor prognosis (increased CFR).
Total CFR was 14%. It was directly proportional to the number of complications in a patient and duration of symptoms before admission. Cerebral malaria was
Table 7: Comparison of complications seen in various studiesComplications Present
study (2004)Murthy
et al. (2000)Chishti
et al. (2000)Harris
et al. (2001)Hazra
et al. (1998)Kochar
et al. (1997)Jaundice 48 40.5 29.69 41 40 11.47Cerebral malaria 36 48 59.38 30 8.33 25.75Severe anemia 44 74.68 76.56 33 - 5.83Acute renal failure 4 24.68 26.56 7 5 2.07Algid malaria 6 18.35 - - - 5.26Bleeding manifestations - 4.43 12.5 - 3.33 9.58ARDS - 11.39 6.25 - 6.6 -Hypoglycemia 8 8.22 - - - -Generalized convulsions 6 - 14.06 - 8.33 -Hemoglobinuria 2 - - - 3.33 7.89ARDS: Acute respiratory distress syndrome
Table 8: Case fatality rates in various studiesStudy CFR (%)Present study 14Murthy et al. 20.25Chishti et al. 12.5Harris et al. 10CFR: Case fatality rates
Inbanathan, et al.: Systemic Complication of Falciparum Malaria
69 International Journal of Scientifi c Study | April 2016 | Vol 4 | Issue 1
the most common cause of death. Early diagnosis and prompt treatment will reduce the morbidity and mortality associated with falciparum malaria.
There is a need to create more awareness about complications of falciparum malaria among doctors in peripheral health centers to institute prompt and early therapy. Proper preventive measures should be taken to contain the disease, mainly focusing on lower socioeconomic class and people involved with agricultural practices, during monsoon and post-monsoon season. Community participation is the key for the success of any health program. It is necessary to involve the community at large and create awareness about the problems of falciparum malaria.
ACKNOWLEDGMENT
The authors would like to thank HOD of Medicine Department, Mysore Medical College and Research
How to cite this article: Inbanathan J, Suneetha DK, Harsha G, George M, Shashank MS. Systemic Complication of Falciparum Malaria in Tertiary Care Hospital at Mysore: A Clinical Study. Int J Sci Stud 2016;4(1):65-69.
Source of Support: Nil, Confl ict of Interest: None declared.
Institute, Mysore, Karnataka, India, Scientifi c and Ethical Committee for permitting us to conduct this study and the medical record section in K R Hospital, for giving all poisoning case sheets for collecting data. Moreover, we also thank all our patients without whom study would have not been possibl e.
REFERENCES
1. D’Alessandro U. Treating severe and complicated malaria. BMJ 2004;328:155.
2. Anand K, Kant S, Kumar G, Kapoor SK. Clinical case defi nition of malaria at a secondary level hospital in northern India. Southeast Asian J Trop Med Public Health 1999;30:243-5.
3. Rajesh B, Laddha P, Gehlot RS. Liver involvement in Falciparum malaria – A histo-pathological analysis. JIACM 2003;4:34-8.
4. Beales PF. Severe Falciparum malaria. In: Warrell DA, Gilles HM, editors. Management of Severe Malaria. 2nd ed. Geneva: WHO; 2000. p. 1-84.
5. Breman JG, Kilamo WL. Rolling back malaria action or rhetoric? Bull WHO 2000;78:1450-5.
6. Charoenpan P, Indraprasit S, Kiatboonsri S, Suvachittanont O, Tanomsup S. Pulmonary edema in severe Falciparum malaria. Hemodynamic study and clinicophysiologic correlation. Chest 1990;97:1190-7.

70International Journal of Scientifi c Study | April 2016 | Vol 4 | Issue 1
Treatment of Displaced Supracondylar Fracture of Humerus in Children by Lateral Entry Pinning versus Cross Pinning(Maj Gen) V P Pathania1, Nishant Dubey2, Sanjay Gupta3
1Professor, Department of Orthopaedics, Shri Ram Murti Smarak Institute of Medical Sciences, Bhojipura, Bareilly, Uttar Pradesh, India,2Post Graduate Student, Department of Orthopaedics, Shri Ram Murti Smarak Institute of Medical Sciences, Bhojipura, Bareilly, Uttar Pradesh, India, 3Professor, Department of Orthopaedics, Shri Ram Murti Smarak Institute of Medical Sciences, Bhojipura, Bareilly, Uttar Pradesh, India
Decision to treat operatively depends on the quality of reduction, ability to maintain reduction, the degree of displacement, and fracture stability.
Many methods have been proposed for the treatment of supracondylar fractures of humerus in children:1. Manipulative reduction and immobilization in a plaster
cast with elbow fl exed,2. Axial skeletal traction on the ulna with the elbow fl exed,3. Dunlop’s skin traction,4. Closed reduction and percutaneous pinning and5. Open reduction and internal fi xation.2
Immobilization in a cast is generally accepted as the standard treatment for non-displaced fractures, but there is controversy as to the best treatment for displaced fractures.3 The routine non-operative management of type II and III supracondylar fracture of humerus with plaster cast after
INTRODUCTION
Supracondylar fractures of the humerus are the most common type of elbow fractures in children, accounting for 50-70% of all fractures about the elbow.
It is estimated that the extension-type represents approximately 96-98% of all pediatric supracondylar fractures of the humerus, whereas the flexion-type represents approximately 2-4%.1
Original Article
Abstract
Introduction: Displaced supracondylar fractures of humerus are one of the most common fractures in pediatric age group with preferred treatment being close reduction with percutaneous K-wire fi xation. This study compares whether lateral pin construct alone can provide same stability like cross (medial and lateral) pin fi xation, and prevent iatrogenic ulnar nerve injury.
Materials and Methods: We evaluated 30 cases of supracondylar fractures of the humerus in children in which 15 were of lateral and 15 of cross pinning group from January 2014 to June 2015 with minimum 4 months follow-up period. Mean age was 7.3 years for both lateral and cross pinning group. We studied the surgical complications in both groups and also compared functional and radiological result of both groups.
Results: Patients were assessed by Flynn’s criteria. Results were excellent in 66.7% and good in 33.3% of cross pinning group and for lateral pinning group, excellent in 73.3% and good in 26.6% cases which were not statistically signifi cant (P = 0.69).
Conclusion: With the use of the specifi c techniques employed in this study, both lateral entry pin fi xation and medial and lateral entry pin fi xation are effective in the treatment of completely displaced (type III) extension supracondylar fractures of the humerus in children.
Key words: Children, Cross pinning, Lateral pinning, Supracondylar fractures humerus
Access this article online
www.ijss-sn.com
Month of Submission : 02-2016Month of Peer Review : 03-2016Month of Acceptance : 04-2016Month of Publishing : 04-2016
Corresponding Author: Dr. Nishant Dubey, Department of Orthopaedics, Shri Ram Murti Smarak Institute of Medical Sciences, Bhojipura, Bareilly - 243 202, Uttar Pradesh, India. Phone: +91-9458705956. E-mail: [email protected]
DOI: 10.17354/ijss/2016/190
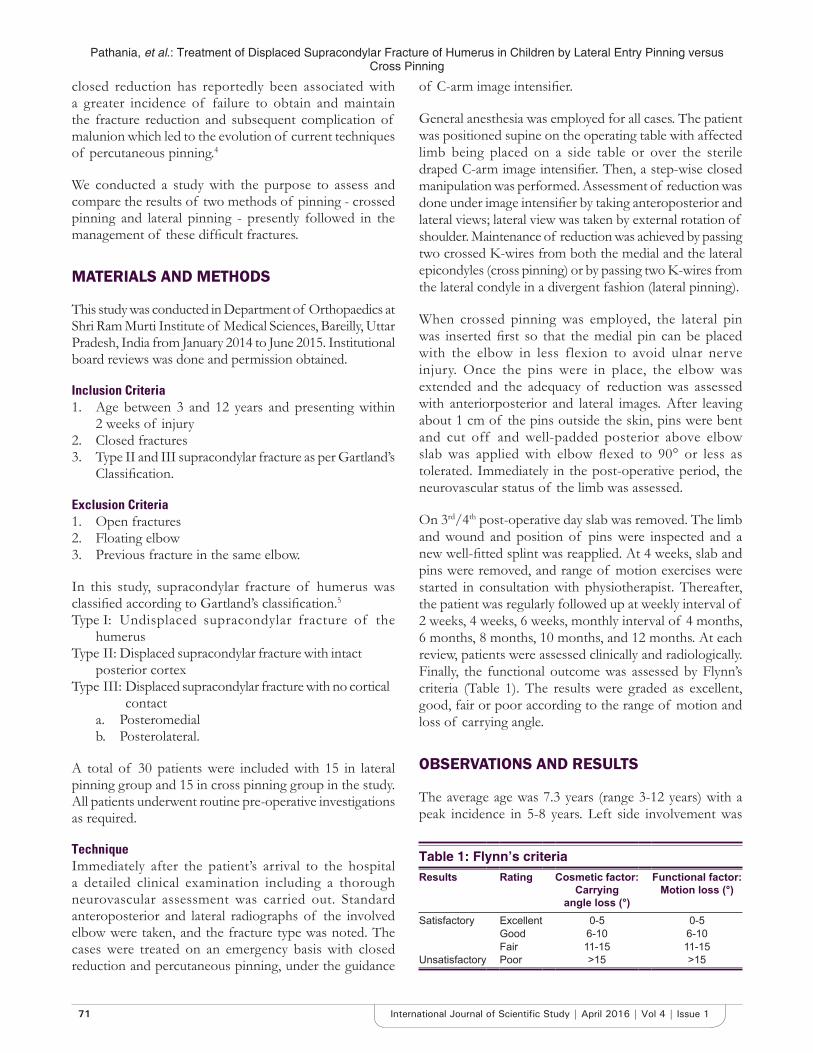
Pathania, et al.: Treatment of Displaced Supracondylar Fracture of Humerus in Children by Lateral Entry Pinning versus Cross Pinning
71 International Journal of Scientifi c Study | April 2016 | Vol 4 | Issue 1
closed reduction has reportedly been associated with a greater incidence of failure to obtain and maintain the fracture reduction and subsequent complication of malunion which led to the evolution of current techniques of percutaneous pinning.4
We conducted a study with the purpose to assess and compare the results of two methods of pinning - crossed pinning and lateral pinning - presently followed in the management of these diffi cult fractures.
MATERIALS AND METHODS
This study was conducted in Department of Orthopaedics at Shri Ram Murti Institute of Medical Sciences, Bareilly, Uttar Pradesh, India from January 2014 to June 2015. Institutional board reviews was done and permission obtained.
Inclusion Criteria1. Age between 3 and 12 years and presenting within
2 weeks of injury2. Closed fractures3. Type II and III supracondylar fracture as per Gartland’s
Classifi cation.
Exclusion Criteria1. Open fractures2. Floating elbow3. Previous fracture in the same elbow.
In this study, supracondylar fracture of humerus was classifi ed according to Gartland’s classifi cation.5Type I: Undisplaced supracondylar fracture of the
humerusType II: Displaced supracondylar fracture with intact
posterior cortexType III: Displaced supracondylar fracture with no cortical
contacta. Posteromedialb. Posterolateral.
A total of 30 patients were included with 15 in lateral pinning group and 15 in cross pinning group in the study. All patients underwent routine pre-operative investigations as required.
TechniqueImmediately after the patient’s arrival to the hospital a detailed clinical examination including a thorough neurovascular assessment was carried out. Standard anteroposterior and lateral radiographs of the involved elbow were taken, and the fracture type was noted. The cases were treated on an emergency basis with closed reduction and percutaneous pinning, under the guidance
of C-arm image intensifi er.
General anesthesia was employed for all cases. The patient was positioned supine on the operating table with affected limb being placed on a side table or over the sterile draped C-arm image intensifi er. Then, a step-wise closed manipulation was performed. Assessment of reduction was done under image intensifi er by taking anteroposterior and lateral views; lateral view was taken by external rotation of shoulder. Maintenance of reduction was achieved by passing two crossed K-wires from both the medial and the lateral epicondyles (cross pinning) or by passing two K-wires from the lateral condyle in a divergent fashion (lateral pinning).
When crossed pinning was employed, the lateral pin was inserted fi rst so that the medial pin can be placed with the elbow in less flexion to avoid ulnar nerve injury. Once the pins were in place, the elbow was extended and the adequacy of reduction was assessed with anteriorposterior and lateral images. After leaving about 1 cm of the pins outside the skin, pins were bent and cut off and well-padded posterior above elbow slab was applied with elbow fl exed to 90° or less as tolerated. Immediately in the post-operative period, the neurovascular status of the limb was assessed.
On 3rd/4th post-operative day slab was removed. The limb and wound and position of pins were inspected and a new well-fi tted splint was reapplied. At 4 weeks, slab and pins were removed, and range of motion exercises were started in consultation with physiotherapist. Thereafter, the patient was regularly followed up at weekly interval of 2 weeks, 4 weeks, 6 weeks, monthly interval of 4 months, 6 months, 8 months, 10 months, and 12 months. At each review, patients were assessed clinically and radiologically. Finally, the functional outcome was assessed by Flynn’s criteria (Table 1). The results were graded as excellent, good, fair or poor according to the range of motion and loss of carrying angle.
OBSERVATIONS AND RESULTS
The average age was 7.3 years (range 3-12 years) with a peak incidence in 5-8 years. Left side involvement was
Table 1: Flynn’s criteriaResults Rating Cosmetic factor:
Carry ingangle loss (°)
Functional factor: Motion loss (°)
Satisfactory Excellent 0-5 0-5Good 6-10 6-10Fair 11-15 11-15
Unsatisfactory Poor >15 >15

Pathania, et al.: Treatment of Displaced Supracondylar Fracture of Humerus in Children by Lateral Entry Pinning versus Cross Pinning
72International Journal of Scientifi c Study | April 2016 | Vol 4 | Issue 1
more as compared to right side. The most common mechanism of injury was fall on outstretched hand (96%). Posterio-medial displacement (51.9%) of distal fragment was more common. The average hospital stay for patients was 4.6 days. The average follow-up duration for patients was of 10.5 months.
The average time for radiological union was 7 weeks. The difference of Baumann’s angle between affected and unaffected fi nal follow-up X-ray was due to improper reduction as well as secondary displacement. The maximum number of cases with loss of Baumann’s angle of 5° was 40% in lateral pinning cases and 33% in cross pinning cases. The loss of Baumann’s angle is due to secondary displacement with a maximum number of cases with loss of Baumann’s angle of 2° was 46.7% in lateral pinning and 26.7% in cross pinning cases.
The average loss of carrying angle was 2.3° in lateral pinning group and 1.9° in cross pinning group which was statistically signifi cant. The signifi cantly higher change in carrying angle in lateral pinning group may be related to comparatively less stable construct with 2 lateral pins compared to 2 cross pins.
The average loss of range of motion was 4.86° in cross pinning group and 4.93° in lateral pinning group which was not statistically signifi cant. Functional outcome in terms of Flynn’s criteria was excellent in 66.7% and good in 33.3% of cross pinning group and for lateral pinning group, excellent in 73.3% and good in 26.6% cases which was not statistically signifi cant (0.69), but lateral pinning group defi nitely had higher number of excellent results (73.3%) as compared to cross pinning group (66.7%).
In terms of complications, pin tract infection was observed in 3 cases (10%). Temporary iatrogenic ulnar nerve injury was seen only in 1 case out of 13 and that too in the cross pinning group (Figures 1-4).
DISCUSSION
Supracondylar fractures of the humerus are the most common type of elbow fractures in children. It is a fracture that occurs at supracondylar area or metaphysis of distal humerus.5 Close reduction followed by two percutaneous Kirschner’s wire fi xation for supracondylar fracture of humerus in children offers simple, safe and affordable treatment option. Two confi guration of placement of K-wires exists. One is lateral pinning and the other is cross pinning. Lots of controversies exist in orthopedics literature regarding the best modality of pin confi guration.
Keeping these controversies in mind, we conducted a study comparing above two modalities of pin confi guration in the management of displaced, closed supracondylar fracture of humerus in children. In this study, 30 children with type II and III supracondylar fractures of humerus who were treated with close reduction and percutaneous pinning (cross or lateral pinning) method were evaluated and compared according to fi xed preset criteria.
In this study, the average age for supracondylar fracture of the humerus was 7.3 years (range 3-12 years) with apeak incidence in 5-8 years. The average incidence in other series, i.e., 7.0 in Ramsey and Griz,6 6.4 in Nacht et al.7 The incidence in male children was 83% and 17% in females. The male predominance was also noted in series of Fowles and Kassab8 (89%) Nacht et al.7 (50%). Left sided supracondylar fracture of humerus has outnumbered right sided fracture in this study.
Other studies in which left side was commonly involved are Fowles and Kassab8 (57%), Nacht et al.7 (55%). The common mechanism of injury in our series was fall on an outstretched hand (96%) which is same as that in series by Mostafavi and Spero.9 and Bhuyan10 In our series, there was 51.9% incidence of posterior-medial and 48.1% incidence of posterior-lateral displacements. The other series also
Figure 1: Lateral pinning
Figure 2: Cross pinning
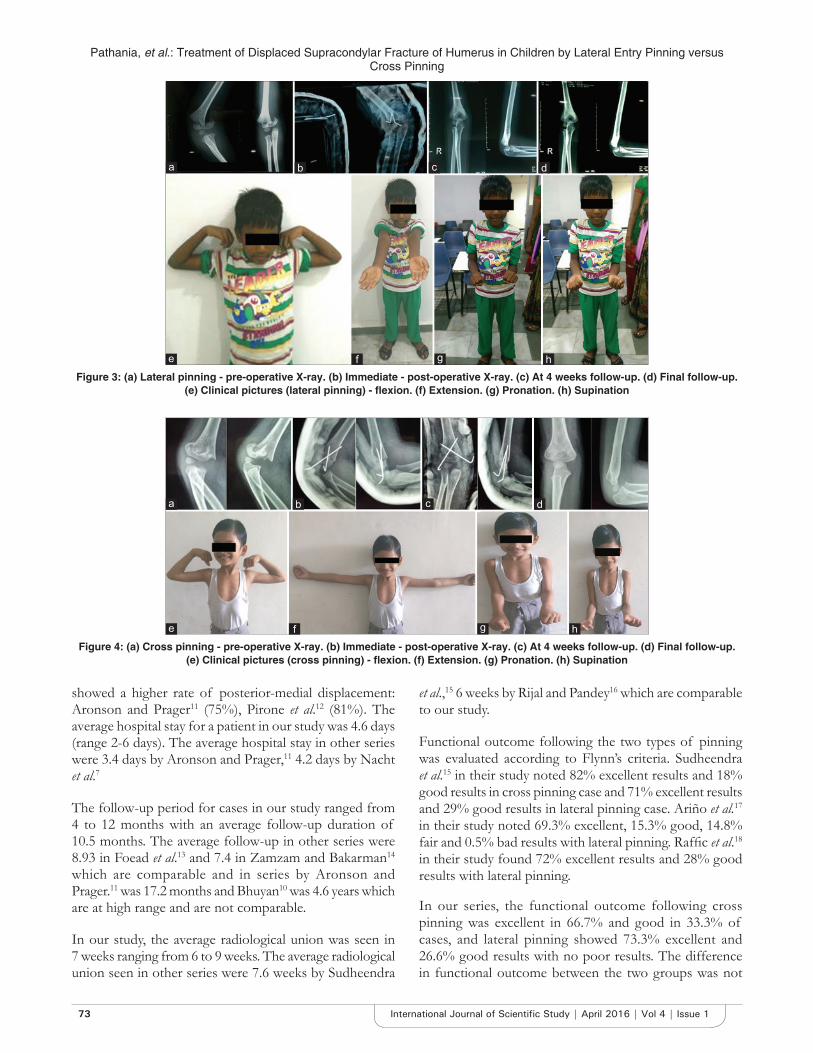
Pathania, et al.: Treatment of Displaced Supracondylar Fracture of Humerus in Children by Lateral Entry Pinning versus Cross Pinning
73 International Journal of Scientifi c Study | April 2016 | Vol 4 | Issue 1
showed a higher rate of posterior-medial displacement: Aronson and Prager11 (75%), Pirone et al.12 (81%). The average hospital stay for a patient in our study was 4.6 days (range 2-6 days). The average hospital stay in other series were 3.4 days by Aronson and Prager,11 4.2 days by Nacht et al.7
The follow-up period for cases in our study ranged from 4 to 12 months with an average follow-up duration of 10.5 months. The average follow-up in other series were 8.93 in Foead et al.13 and 7.4 in Zamzam and Bakarman14 which are comparable and in series by Aronson and Prager.11 was 17.2 months and Bhuyan10 was 4.6 years which are at high range and are not comparable.
In our study, the average radiological union was seen in 7 weeks ranging from 6 to 9 weeks. The average radiological union seen in other series were 7.6 weeks by Sudheendra
et al.,15 6 weeks by Rijal and Pandey16 which are comparable to our study.
Functional outcome following the two types of pinning was evaluated according to Flynn’s criteria. Sudheendra et al.15 in their study noted 82% excellent results and 18% good results in cross pinning case and 71% excellent results and 29% good results in lateral pinning case. Ariño et al.17 in their study noted 69.3% excellent, 15.3% good, 14.8% fair and 0.5% bad results with lateral pinning. Raffi c et al.18 in their study found 72% excellent results and 28% good results with lateral pinning.
In our series, the functional outcome following cross pinning was excellent in 66.7% and good in 33.3% of cases, and lateral pinning showed 73.3% excellent and 26.6% good results with no poor results. The difference in functional outcome between the two groups was not
Figure 3: (a) Lateral pinning - pre-operative X-ray. (b) Immediate - post-operative X-ray. (c) At 4 weeks follow-up. (d) Final follow-up. (e) Clinical pictures (lateral pinning) - fl exion. (f) Extension. (g) Pronation. (h) Supination
Figure 4: (a) Cross pinning - pre-operative X-ray. (b) Immediate - post-operative X-ray. (c) At 4 weeks follow-up. (d) Final follow-up. (e) Clinical pictures (cross pinning) - fl exion. (f) Extension. (g) Pronation. (h) Supination
d
h
c
g
b
f
a
e
d
h
c
g
b
f
a
e
Pathania, et al.: Treatment of Displaced Supracondylar Fracture of Humerus in Children by Lateral Entry Pinning versus Cross Pinning
74International Journal of Scientifi c Study | April 2016 | Vol 4 | Issue 1
statistically signifi cant (0.69). Pin tract infection occurred in 3 patients in our series (10%). In the series by Mostafavi and Spero,10 the incidence of pin tract infection was (5%) and (1%) in Pirone et al.12 which was found less compared to our studies.
CONCLUSION
We conclude that although fi xation of supracondylar humerus fracture of Gartland type II and III can be done by both ways either cross or lateral pinning but in view of ulnar nerve injury and extension lag which is more commonly associated with cross pinning, lateral pinning is comparatively safe and reliable for both types of supracondylar fractures of humerus in children. Hence, in our study, we found lateral pinning and cross pinning equally good in terms of safety and effi cacy.
REFERENCES
1. Babal JC, Mehlman CT, Klein G. Nerve injuries associated with pediatric supracondylar humeral fractures: A meta-analysis. J Pediatr Orthop 2010;30:253-63.
2. Yadav UB, Singhal R, Tonk G, Aggarwal T, Verma AN. Crossed pin fi xation in displaced supracondylar humerus fractures in children. Indian J Orthop 2004;38:166-9.
3. Mazda K, Boggione C, Fitoussi F, Penneçot GF. Systematic pinning of displaced extension-type supracondylar fractures of the humerus in children. A prospective study of 116 consecutive patients. J Bone Joint Surg Br 2001;83:888-93.
4. Sudheendra PR, Nazareth EL. A comparative study of outcome of percutaneous lateral and crossed pinning in the treatment of type III
supracondylar fractures of humerus in children. Sch J Appl Med Sci 2014;23:959-62.
5. Attenborough CG. Remodeling of the humerus after supracondylar fractures in childhood. J Bone Joint Surg Br 1953;35:386-95.
6. Ramsey RH, Griz J. Immediate open reduction and internal fi xation of severely displaced supracondylar fractures of the humerus in children. Clin Orthop Relat Res 1973;131-2.
7. Nacht JL, Ecker ML, Chung SM, Lotke PA, Das M. Supracondylar fractures of the humerus in children treated by closed reduction and percutaneous pinning. Clin Orthop Relat Res 1983;203-9.
8. Fowles JV, Kassab MT. Displaced supracondylar fractures of the elbow in children. A report on the fi xation of extension and fl exion fractures by two lateral percutaneous pins. J Bone Joint Surg Br 1974;56:490-500.
9. Mostafavi HR, Spero C. Crossed pin fi xation of displaced supracondylar humerus fractures in children. Clin Orthop Relat Res 2000;56-61.
10. Bhuyan BK. Close reduction and percutaneous pinning in displaced supracondylar humerus fractures in children. J Clin Orthop Trauma 2012;3:89-93.
11. Aronson DD, Prager BI. Supracondylar fractures of the humerus in children. A modifi ed technique for closed pinning. Clin Orthop Relat Res 1987;174-84.
12. Pirone AM, Graham HK, Krajbich JI. Management of displaced extension-type supracondylar fractures of the humerus in children. J Bone Joint Surg Am 1988;70:641-50.
13. Foead A, Penafort R, Saw A, Sengupta S. Comparison of two methods of percutaneous pin fi xation in displaced supracondylar fractures of the humerus in children. J Orthop Surg (Hong Kong) 2004;12:76-82.
14. Zamzam MM, Bakarman KA. Treatment of displaced supracondylar humerus fractures among children: Cross pinning vs. Lateral pinning. Int J Care Injured 2008;10:1-9.
15. Rijal KP, Pandey BK. Supracondylar extension type III fractures of humerus in children: Percutaneous cross-pinning. Kathmandu Univ Med J 2006;4:465-9.
16. Ariño VL, Lluch EE, Ramirez AM, Ferrer J, Rodriguez L, Baixauli F. Percutaneous fi xation of supracondylar fractures of the humerus in children. J Bone Joint Surg Am 1977;59:914-6.
17. Raffi c M, Muhammed Fazil VV. Percutaneoushin K-wire fi xation of supracondylar fractures in children. J Evid Based Med Healthc 2014;1:2349-562.
How to cite this article: Pathania VP, Dubey N, Gupta S. Treatment of Displaced Supracondylar Fracture of Humerus in Children by Lateral Entry Pinning versus Cross Pinning. Int J Sci Stud 2016;4(1):70-74.
Source of Support: Nil, Confl ict of Interest: None declared.
75 International Journal of Scientifi c Study | April 2016 | Vol 4 | Issue 1
Protective Effect of Oral N-acetyl Cysteine in Noise-induced Hearing Loss in Factory WorkersG D Mahajan1, Devendra Marathe2, Paresh Chavan2, Saniya Khan3, Yogesh Patil3, Raphella Khan3
1Senior Assistant Professor, Department of ENT, Dr. D Y Patil Medical College, Pimpri, Pune, Maharashtra, India, 2Assistant Professor, Department of ENT, Dr. D Y Patil Medical College, Pimpri, Pune, Maharashtra, India, 3Post Graduate Student, Department of ENT, Dr. D Y Patil Medical College, Pimpri, Pune, Maharashtra, India
and limit the hearing loss. Previous animal studies showed protective effects of antioxidant medicines against NIHL.3 It is unclear whether antioxidants would protect humans from NIHL. This study evaluates the protective effects of N-acetyl cysteine (NAC) in NIHL.
MATERIALS AND METHODS
In this study, 60 workers of local factory working with heavy machinery and ambient noise 85-90 dB were selected. All workers were healthy males between the age of 25-35 years with no pre-existing ear pathology.
The workers were divided into two groups randomly:Group A: Received a placeboGroup B: Received NAC 1200 mg/day for 15 days.
Both groups were subjected to a base pure-tone audiometry at the beginning of the 8 h shift duties and the again at the end of the duty and there hence after 15 days and 1-month interval.
INTRODUCTION
In modern times, noise-induced hearing loss (NIHL) has been seen in two settings. First, the occupational exposure as in factory workers or traffi c police offi cers, and second, the recreational exposure as in young population listening to loud music through headphones or people going to nightclubs.1 Research has shown that noise-induced cochlear damage is a result of oxidative stress in the inner ear. Approximately 5% of the population worldwide suffers from industrial, military, or recreational NIHL at a great economic cost and detriment to the quality of life of the affected individuals.2 A variety of antioxidants and other chemicals have been used to reduce this oxidative damage
Original Article
Abstract
Introduction: Noise-induced hearing loss (NIHL) is an important etiological factor for deafness. Occupational exposure to loud sounds has been brought under control through various new factory and labor laws and use of protective devices during work. Still, the incidence of hearing loss in factory workers is on rise.
Purpose: The purpose of this study was to evaluate the protective effects of oral N-acetyl cysteine (NAC) in NIHL in factory workers.
Materials and Methods: In this study, 60 workers of local factory working with heavy machinery and ambient noise 85-90 dB were selected. All workers were healthy males between the age of 25-35 years with no pre-existing ear pathology.
Results: Temporary threshold shift mainly in the three frequencies 2, 3, and 4 kHz. Hearing threshold was normal at 8 kHz which indicated that it’s not age related. Temporary threshold shift was similar in both right and left ears. Maximum threshold shift was observed at 4 kHz.
Conclusion: NAC use decreased the temporary threshold shifts in workers exposed to loud sounds.
Key words: Hearing loss, N-acetyl cysteine, Oxidative damage
Access this article online
www.ijss-sn.com
Month of Submission : 02-2016Month of Peer Review : 03-2016Month of Acceptance : 04-2016Month of Publishing : 04-2016
Corresponding Author: Dr. Devendra Marathe, A-7, Flat No. 9, Comfort Zone, Balewadi-Baner Road, Baner, Pune - 411 045, Maharashtra, India. E-mail: [email protected]
DOI: 10.17354/ijss/2016/191
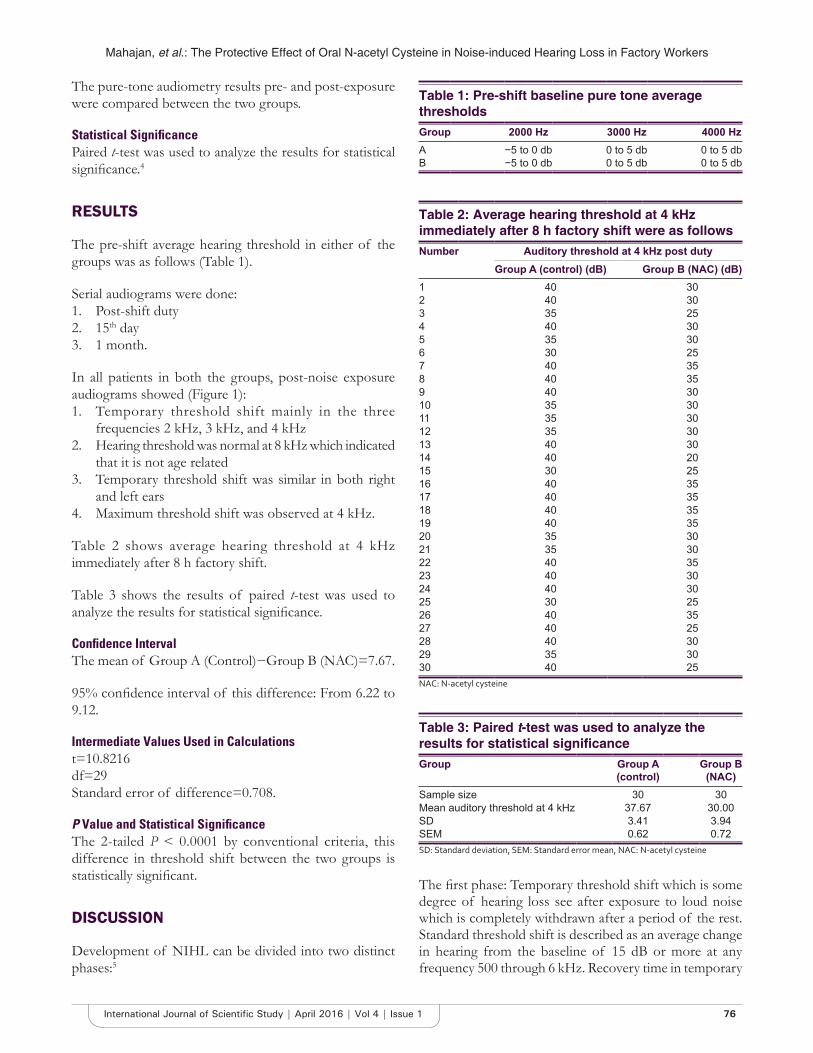
Mahajan, et al.: The Protective Effect of Oral N-acetyl Cysteine in Noise-induced Hearing Loss in Factory Workers
76International Journal of Scientifi c Study | April 2016 | Vol 4 | Issue 1
The pure-tone audiometry results pre- and post-exposure were compared between the two groups.
Statistical Signifi cancePaired t-test was used to analyze the results for statistical signifi cance.4
RESULTS
The pre-shift average hearing threshold in either of the groups was as follows (Table 1).
Serial audiograms were done:1. Post-shift duty2. 15th day3. 1 month.
In all patients in both the groups, post-noise exposure audiograms showed (Figure 1):1. Temporary threshold shift mainly in the three
frequencies 2 kHz, 3 kHz, and 4 kHz2. Hearing threshold was normal at 8 kHz which indicated
that it is not age related3. Temporary threshold shift was similar in both right
and left ears4. Maximum threshold shift was observed at 4 kHz.
Table 2 shows average hearing threshold at 4 kHz immediately after 8 h factory shift.
Table 3 shows the results of paired t-test was used to analyze the results for statistical signifi cance.
Confi dence IntervalThe mean of Group A (Control)−Group B (NAC)=7.67.
95% confi dence interval of this difference: From 6.22 to 9.12.
Intermediate Values Used in Calculationst=10.8216df=29Standard error of difference=0.708.
P Value and Statistical Signifi canceThe 2-tailed P < 0.0001 by conventional criteria, this difference in threshold shift between the two groups is statistically signifi cant.
DISCUSSION
Development of NIHL can be divided into two distinct phases:5
The fi rst phase: Temporary threshold shift which is some degree of hearing loss see after exposure to loud noise which is completely withdrawn after a period of the rest. Standard threshold shift is described as an average change in hearing from the baseline of 15 dB or more at any frequency 500 through 6 kHz. Recovery time in temporary
Table 1: Pre-shift baseline pure tone average thresholdsGroup 2000 Hz 3000 Hz 4000 HzA −5 to 0 db 0 to 5 db 0 to 5 dbB −5 to 0 db 0 to 5 db 0 to 5 db
Table 2: Average hearing threshold at 4 kHz immediately after 8 h factory shift were as followsNumber Auditory threshold at 4 kHz post duty
Group A (control) (dB) Group B (NAC) (dB)1 40 302 40 303 35 254 40 305 35 306 30 257 40 358 40 359 40 3010 35 3011 35 3012 35 3013 40 3014 40 2015 30 2516 40 3517 40 3518 40 3519 40 3520 35 3021 35 3022 40 3523 40 3024 40 3025 30 2526 40 3527 40 2528 40 3029 35 3030 40 25NAC: N-acetyl cysteine
Table 3: Paired t-test was used to analyze the results for statistical signifi canceGroup Group A
(control)Group B
(NAC)Sample size 30 30Mean auditory threshold at 4 kHz 37.67 30.00SD 3.41 3.94SEM 0.62 0.72SD: Standard deviation, SEM: Standard error mean, NAC: N-acetyl cysteine

Mahajan, et al.: The Protective Effect of Oral N-acetyl Cysteine in Noise-induced Hearing Loss in Factory Workers
77 International Journal of Scientifi c Study | April 2016 | Vol 4 | Issue 1
threshold shift ranges from 48 h to few days depending on the intensity of sound and period of exposure.
Second phase: Permanent threshold shift: Frequent exposure to noise capable of inducing temporary threshold shift after a prolonged period produces permanent threshold shift which does not revert to a normal threshold. The cellular mechanism in the noise-induced cochlear damage involves generation of reactive oxygen species. Thus, the use of agents such as NAC has shown
to produce statistically signifi cant reduction temporary threshold shift.
Less the temporary threshold shift produced, lesser are the chances of temporary threshold shift becoming into permanent threshold shift.
CONCLUSION
Use of NAC in factory workers exposed to loud sound (>85-90 dB) has shown a signifi cant decrease in temporary threshold shifts which has an overall protective effect in the long run.
REFERENCES
1. Coleman JK, Kopke RD, Liu J, Ge X, Harper EA, Jones GE, et al. Pharmacological rescue of noise induced hearing loss using N-acetylcysteine and acetyl-L-carnitine. Hear Res 2007;226:114-25.
2. Oishi N, Schacht J. Emerging treatments for noise-induced hearing loss. Expert Opin Emerg Drugs 2011;16:235-45.
3. Lin CY, Wu JL, Shih TS, Tsai PJ, Sun YM, Ma MC, et al. N-Acetyl-cysteine against noise-induced temporary threshold shift in male workers. Hear Res 2010;269:42-7.
4. Paried t-Test. Available from: http://www.Graphpad.com. [Last accessed on 2016 Jan 10].
5. Lindblad AC, Rosenhall U, Olofsson A, Hagerman B. The effi cacy of N-acetylcysteine to protect the human cochlea from subclinical hearing loss caused by impulse noise: A controlled trial. Noise Health 2011;13:392-401.
Figure 1: Temporary threshold shifts (TTS) at 2 kHz, 3 kHz & 4 kHz in control group & NAC group
How to cite this article: Mahajan GD, Marathe D, Chavan P, Khan S, Patil Y, Khan R. Protective Effect of Oral N-acetyl Cysteine in Noise-induced Hearing Loss in Factory Workers. Int J Sci Stud 2016;4(1):75-77.
Source of Support: Nil, Confl ict of Interest: None declared.

78International Journal of Scientifi c Study | April 2016 | Vol 4 | Issue 1
Airtraq® Optical Laryngoscope versus Coopdech® Video Laryngoscope for Intubation Performance in the Pediatric Patients: A Randomized Single Hospital StudyRajib Hazarika1, Tejwant Rajkhowa1, Mridu Paban Nath2, Samit Parua3, Rupak Kundu3
1Associate Professor, Department of Anaesthesiology and Critical Care, Gauhati Medical College and Hospital, Assam, India, 2Assistant Professor, Department of Anaesthesiology and Critical Care, Gauhati Medical College and Hospital, Assam, India, 3Post Graduate Trainee, Department of Anaesthesiology and Critical Care, Gauhati Medical College and Hospital, Assam, India
differences are there in the airway of pediatric subjects compared with adults. These differences are mainly due to the large head, high up larynx, large tongue, large epiglottis, anterior angulation of the vocal cords, and short jaw seen in pediatric subjects.1 In recent years, many new optical laryngoscopes have been developed for use in pediatric patients. The Airtraq™ (PRODOL, MEDITEC S.A.) is a disposable battery operated optical laryngoscope that allows high-quality viewing of the vocal cords and unlike conventional laryngoscope it does not require a straight line of sight up to the patient’s vocal cords.2 Use of the Airtraq does not require displacement of the tongue and forceful elevation of the epiglottis resulting in less application of
INTRODUCTION
Pediatric airway management is a critical intervention which requires experience, proper planning and in time management for emergent problems. Signifi cant
Abstract
Introduction: Airtraq® is an optical laryngoscope that allows visualization of the vocal cords without a direct line of sight. The Coopdech Video Laryngoscope® (CVL) allows a direct visualization of the vocal cords on a digital screen and is the world’s fi rst and only video laryngoscope with Miller, Macintosh, Bullard and J-shaped blades.
Aim: The aim of this study was to evaluate CVL and Airtraq optical laryngoscope (AOL) regarding intubation time, a number of attempts at intubation, need for optimization maneuvers and hemodynamic changes during intubation in pediatric patients.
Materials and Methods: A total of 100 children of American Society of Anesthesiologists Class I, aged 6-36 months, undergoing operative procedure under general anesthesia were inducted into this study and were further divided into 2 groups using computer generated tables. Inhalational induction with sevofl urane in oxygen was done after premedication. Atracurium was used to facilitate intubation. Patients were randomly allocated to be intubated with either airtraq pediatric size (AL group) or CVL (CL group) using Miller’s 0/1 or Machintosh 2 size blade and intubation time, a number of intubation attempts, optimization maneuvers and hemodynamic parameters were recorded. Data obtained was assessed using appropriate statistical methods using two-tailed t-test/Mann–Whitney U-test or Chi-square test as appropriate. Data were expressed as a mean and standard deviation, median and interquartile range. A P < 0.05 was considered statistically signifi cant.
Results: Group CL as compared to group AL, had signifi cantly longer intubation time (P < 0.05), more median number of intubation attempts. Compared to CVL, airtraq had shorter duration of intubation, lesser attempts at intubation with less number of optimization maneuvers.
Conclusion: AOL is better for pediatric intubations than CVL.
Key words: Airtraq optical laryngoscope, Coopdech video laryngoscope, Pediatric intubation
Access this article online
www.ijss-sn.com
Month of Submission : 02-2016Month of Peer Review : 03-2016Month of Acceptance : 03-2016Month of Publishing : 04-2016
Corresponding Author: Dr. Samit Parua, Room No. 112 PG Hostel, No 5 Gauhati Medical College, Bhangagarh, Guwahati, Assam -781 032. E-mail: [email protected]
DOI: 10.17354/ijss/2016/192Original Article

Hazarika, et al.: Airtraq Optical Laryngoscope versus Coopdech Video Laryngoscope
79 International Journal of Scientifi c Study | April 2016 | Vol 4 | Issue 1
force compared with the conventional direct laryngoscopy.3 The Coopdech Video Laryngoscope™ (DAIKEN MEDICAL) allows a direct visualization of the vocal cords on a digital screen and is the world’s fi rst and only video laryngoscope with Miller, Macintosh, Bullard and J-shaped blades. Both these variants of optical laryngoscope are easy to use and have a short learning curve. However, there are no studies comparing Airtraq™ with Coopdech Video Laryngoscope™ in pediatric population and controversy still remains regarding which optical laryngoscope is better for use in pediatric patient. Hence, we designed a randomized prospective study to compare both these laryngoscopes regarding the intubation time.
MATERIALS AND METHODS
After approval from Institutional Ethics Committee and departmental clearance this randomized, prospective, blinded study was conducted under the Department of Anesthesiology and Critical Care, Guwahati Medical College and Hospital from August 2015 to January 2016. Written parental informed consent was obtained for all the patients before inclusion in this study. About 100 children admitted under Pediatric Surgery Department of Gauhati Medical College with the following characteristics American Society of Anesthesiologists (ASA) Class I, boys and girls aged 6-36 months, undergoing elective operative procedure under general anesthesia were included into this study. Exclusion criteria being parental denial, patients with a history of or anticipated diffi cult airway and intubation, risk of gastric aspiration, cardiovascular, respiratory, metabolic disease, and central nervous system disease. Adequate pre-operative preparation was done in the form of solid food being withheld for 6 h preoperatively and only clear liquids were permitted up to 3 h before induction of anesthesia. Children were pre-medicated with nasal midazolam 0.3 mg/kg 30 min before the anticipated start of surgery. After arrival in the operating room standard, ASA monitors were attached and baseline hemodynamic data were recorded. Inhalational induction with sevofl urane in oxygen-air mixture was done. After induction an intravenous line was established, and fentanyl 2 μg/kg and atracurium 0.5 mg/kg were administered IV. Computer generated tables were used by the anesthesist before induction to randomize patients to undergo intubation with either Airtraq laryngoscope (AL group comprising of 50 patients) or coopdech laryngoscope (CL group comprising of 50 patients). The anesthesiologist participating in the study had more than 10 years of experience in pediatric anesthesia and was well trained with the proper use of Coopdech and Airtraq video laryngoscope for pediatric intubations. 2 sizes of pediatric Airtraq 0, 1 were used for this study one that accepts an endotracheal tube between 2.5-3.5 mm and another that
accepts 4.00-5.50 mm endotracheal tubes. For CL blades, Miller’s 0/1 or Machintosh 2 were used for laryngoscopy and intubation. The following parameters were noted Intubation time (primary outcome), number of intubation attempts, number of optimization maneuvers required (repositioning the head or the need for a second assistant to aid tracheal intubation), hemodynamic parameters before during and after intubation (at 1, 3, 5, 7 min). Intubation time was the period from termination of manual ventilation with afacemask to initiation of ventilation through the endotracheal tube. Any attempt at laryngoscopy greater than 120 s were considered as failed intubation.4 Complications if any were also noted. As there was no previous study comparing both these laryngoscopes so sample size calculation could not be done, we intend to use it as a pilot study based on which controlled trials could be conducted in the future. Data obtained from these patients was entered into Microsoft Excel spread sheet and assessed using (GrapPad InStat - version 3.0) appropriate statistical methods using two-tailed t-test/Mann–Whitney U-test or Chi-square test as appropriate. Data were expressed as a mean and standard deviation, median and interquartile range. P < 0.05 was considered statistically signifi cant.
RESULTS AND OBSERVATIONS
The age, height, weight, gender, and duration of anesthesia was found to be comparable between the group AL and group CL (Table 1).
There was asignifi cant increase in the intubation time in group CL (26.85±7.5 s) compared to group AL (21.75±5.8 s) (Figure 1).
Table 1: The demographic parameters between the 2 groups AL and CLParameters AL group (50) CL group (50)Age (months) 22±6.5 24±5.4Height (cm) 102±8.5 105±10.2Weight (kg) 12±5 11±6.5Gender (%)
Male 32 (64) 28 (56)Female 18 (36) 22 (44)
Duration of surgery (minutes) 68±20.8 72±16.4AL: Airtraq laryngoscope, CL: Coopdech laryngoscope
Table 2: Median attempts at intubation and number of optimization manaeuvers in both groups AL and CLParameters AL group (50) CL group (50) P valueNumbers of intubation attempts
1 (1-1) 2 (1-2) 0.001
Numbers of optimization maneuvers
0 (0-0) 1 (1-1) 0.001
AL: Airtraq laryngoscope, CL: Coopdech laryngoscope
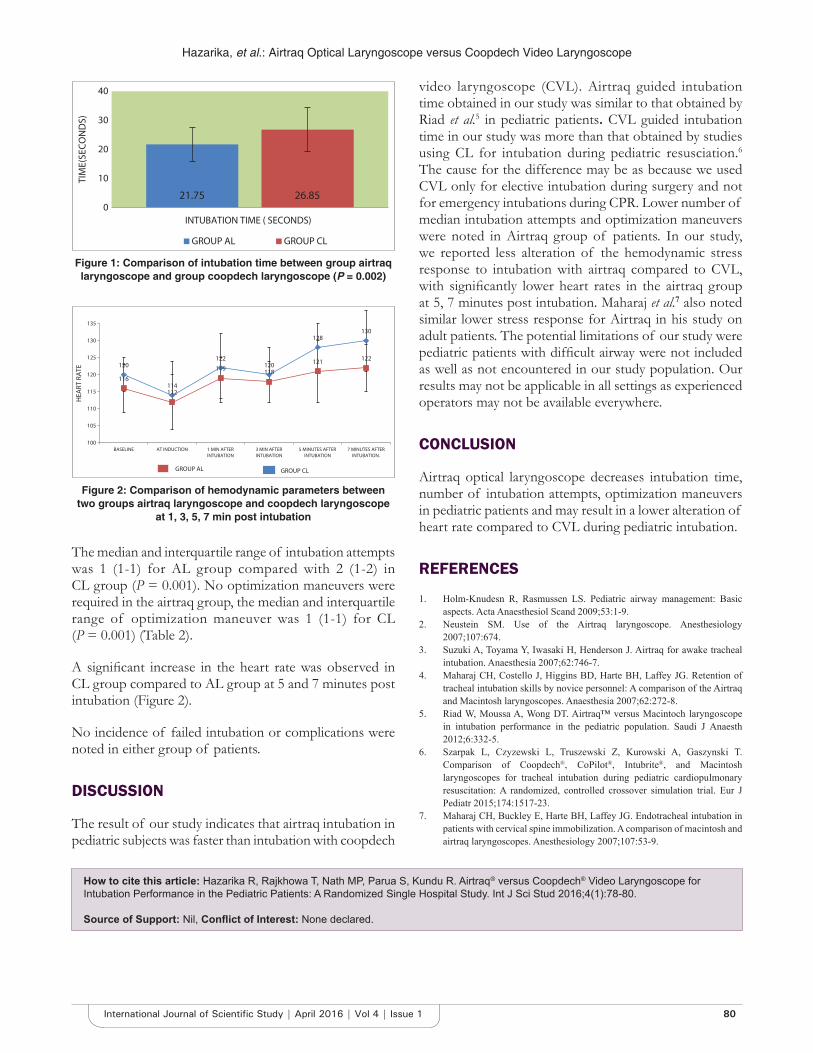
Hazarika, et al.: Airtraq Optical Laryngoscope versus Coopdech Video Laryngoscope
80International Journal of Scientifi c Study | April 2016 | Vol 4 | Issue 1
The median and interquartile range of intubation attempts was 1 (1-1) for AL group compared with 2 (1-2) in CL group (P = 0.001). No optimization maneuvers were required in the airtraq group, the median and interquartile range of optimization maneuver was 1 (1-1) for CL (P = 0.001) (Table 2).
A signifi cant increase in the heart rate was observed in CL group compared to AL group at 5 and 7 minutes post intubation (Figure 2).
No incidence of failed intubation or complications were noted in either group of patients.
DISCUSSION
The result of our study indicates that airtraq intubation in pediatric subjects was faster than intubation with coopdech
video laryngoscope (CVL). Airtraq guided intubation time obtained in our study was similar to that obtained by Riad et al.5 in pediatric patients. CVL guided intubation time in our study was more than that obtained by studies using CL for intubation during pediatric resusciation.6
The cause for the difference may be as because we used CVL only for elective intubation during surgery and not for emergency intubations during CPR. Lower number of median intubation attempts and optimization maneuvers were noted in Airtraq group of patients. In our study, we reported less alteration of the hemodynamic stress response to intubation with airtraq compared to CVL, with signifi cantly lower heart rates in the airtraq group at 5, 7 minutes post intubation. Maharaj et al.7 also noted similar lower stress response for Airtraq in his study on adult patients. The potential limitations of our study were pediatric patients with diffi cult airway were not included as well as not encountered in our study population. Our results may not be applicable in all settings as experienced operators may not be available everywhere.
CONCLUSION
Airtraq optical laryngoscope decreases intubation time, number of intubation attempts, optimization maneuvers in pediatric patients and may result in a lower alteration of heart rate compared to CVL during pediatric intubation.
REFERENCES
1. Holm-Knudesn R, Rasmussen LS. Pediatric airway management: Basic aspects. Acta Anaesthesiol Scand 2009;53:1-9.
2. Neustein SM. Use of the Airtraq laryngoscope. Anesthesiology 2007;107:674.
3. Suzuki A, Toyama Y, Iwasaki H, Henderson J. Airtraq for awake tracheal intubation. Anaesthesia 2007;62:746-7.
4. Maharaj CH, Costello J, Higgins BD, Harte BH, Laffey JG. Retention of tracheal intubation skills by novice personnel: A comparison of the Airtraq and Macintosh laryngoscopes. Anaesthesia 2007;62:272-8.
5. Riad W, Moussa A, Wong DT. Airtraq™ versus Macintoch laryngoscope in intubation performance in the pediatric population. Saudi J Anaesth 2012;6:332-5.
6. Szarpak L, Czyzewski L, Truszewski Z, Kurowski A, Gaszynski T. Comparison of Coopdech®, CoPilot®, Intubrite®, and Macintosh laryngoscopes for tracheal intubation during pediatric cardiopulmonary resuscitation: A randomized, controlled crossover simulation trial. Eur J Pediatr 2015;174:1517-23.
7. Maharaj CH, Buckley E, Harte BH, Laffey JG. Endotracheal intubation in patients with cervical spine immobilization. A comparison of macintosh and airtraq laryngoscopes. Anesthesiology 2007;107:53-9.
Figure 1: Comparison of intubation time between group airtraq laryngoscope and group coopdech laryngoscope (P = 0.002)
Figure 2: Comparison of hemodynamic parameters between two groups airtraq laryngoscope and coopdech laryngoscope
at 1, 3, 5, 7 min post intubation
How to cite this article: Hazarika R, Rajkhowa T, Nath MP, Parua S, Kundu R. Airtraq® versus Coopdech® Video Laryngoscope for Intubation Performance in the Pediatric Patients: A Randomized Single Hospital Study. Int J Sci Stud 2016;4(1):78-80.
Source of Support: Nil, Confl ict of Interest: None declared.

81 International Journal of Scientifi c Study | April 2016 | Vol 4 | Issue 1
Extra-articular Manifestation of Rheumatoid ArthritisJ Inbanathan1, D K Suneetha1, G Harsha2, Martin George2, M S Shashank2
1Associate Professor, Department of Medicine, Mysore Medical College & Research Institute, Mysore, Karnataka, India, 2Junior Resident, Department of Medicine, Mysore Medical College & Research Institute, Mysore, Karnataka, India
and hence an important cause of potentially preventable disability.2
RA is an autoimmune disorder of unknown etiology characterized by symmetric, erosive synovitis, and in some cases, extra-articular involvement. Most patients experience a chronic fl uctuating course despite therapy, may result in progressive joint destruction, deformity, disability, and even premature death.
EpidemiologyRA has been identifi ed in all parts of the world in every ethnic, racial group. Climate, geography, and altitude do not appear to affect the prevalence of the disease. However, climate does appear to infl uence the symptoms. Those with the disease reported increased discomfort in a wet or humid climate.3
The prevalence ranges from 0.1% to 5.3% in all population. The lowest is seen in South African population, and highest prevalence is noted in Chippewa Indians, USA and Pima-Indians, USA.
INTRODUCTION
Diseases of musculoskeletal system are among the most common human affl ictions. Their prevalence is highest among the elderly, but these conditions affect all age groups and are associated with disability, impairment, handicaps, and job loss.1
The impact of rheumatic diseases is enormous. They account for more impairment and functional limitation among middle age and older adults than any other disease category.
Rheumatoid arthritis (RA) is a chronic inflammatory arthropathy of unknown cause that can affect most joints,
Original Article
Abstract
Introduction: Rheumatoid arthritis is an autoimmune disorder of unknown etiology characterized by symmetric, erosive synovitis, and in some cases, extra-articular involvement. Most patients experience a chronic fl uctuating course despite therapy, may result in progressive joint destruction, deformity, disability, and even premature death.
Materials and Methods: It is a study conducted on patients admitted to K R Hospital, Mysore, from January 2013 to January 2015, a total of 50 patients were admitted during this period. As per inclusion criteria and exclusion criteria cases are included and excluded, and a pre-structured proforma was used and data were entered. The study is approved by the Institutional Ethical Committee.
Results: In the present study, the most common extra-articular manifestation was noted in the cardiovascular system (12%). Next, in the order of involvement were respiratory manifestations (8%) and lymphadenopathy (8%), followed by vasculitis (6%) and rheumatoid nodule (2%).
Conclusion: Our study showed male gender, older age group, longer duration of illness, severe degree of anemia, very high erythrocyte sedimentation rate, positive RA factor with higher titer values, all are suggestive of a higher incidence of extra-articular manifestation.
Key words: Anti-cyclic citrullinated peptides, Extra-articular manifestations, Rheumatoid arthritis, Rheumatoid arthritis factor
Access this article online
www.ijss-sn.com
Month of Submission : 02-2016Month of Peer Review : 03-2016Month of Acceptance : 03-2016Month of Publishing : 04-2016
Corresponding Author: Dr. J Inbanathan, Department of Medicine, Mysore Medical College and Research Institute, Mysore - 570 001, Karnataka, India. Phone: +91-9448051826. E-mail: [email protected]
DOI: 10.17354/ijss/2016/193
Inbanathan, et al.: A Study of Extra-articular Manifestation of Rheumatoid Arthritis
82International Journal of Scientifi c Study | April 2016 | Vol 4 | Issue 1
The low prevalence in certain developing countries is probably because of mortality associated with infections in RA.4
RA is two to three times more frequent in women compared to men. This has been noted in all population and all age groups studied. The prevalence of RA appears to increase in both males and females with age.5,6
Clinical ManifestationArticular manifestation:1. Hands
a. Joint involvementb. Tendon involvement.
Hasting’s classifi cation of rheumatoid hand:7
Joint involved
MCP Synovitis, passively correctable ulnar drift, fi xed volar subluxation, ulnar drift
PIP Synovitis, boutonniere deformity, fl ail IP joint
Thumb Flail IP joint, boutonniere deformity, duckbill thumb, dislocation
Wrist Synovitis, carpal supination, subluxation, radiocarpal dislocation
Tendon involvement
Flexor tendon disease
Loss of active fl exion, triggering, tendon rupture, median nerve involvement
Extensor tendon disease
Synovitis, dorsal mass, extensor tendon rupture, extensor tendon dislocation
MCP: Metacarpophalangeal, PIP: Proximal interphalangeal, IP: Interphalangeal
2. Other joints are an elbow, shoulder, temporomandibular, cricoarytenoid, sternoclavicular and manubriosternal, cervical spine, hip, knee, and ankle joint.
Extra-articular manifestations:a. Cardiac involvementb. Pulmonary involvementc. Ocular involvementd. Vasculitise. Skin involvementf. Hematological involvement.
MATERIALS AND METHODS
In this study, 50 cases of RA attending either the outpatient department or admitted to the wards of Krishnarajendra Hospital, and Princess Krishnajammanni Tuberculosis and Chest Diseases Hospital attached to Mysore Medical College were selected.
About 50 cases were selected on the basis of the simple random sampling, during the study period January 2013 to June 2015. The cases were diagnosed as RA using the “ACR and European league against rheumatism (EULAR) criteria 2010.”
The data were collected in a pretested questionnaire meeting the objective of the study. Analysis was made using the various statistical parameters such as the mean, standard deviation, standard error, t-test (unpaired), Chi-square test, and percentages.
Inclusion CriteriaSubjects fulfi lling the following criteria, the “American College of Rheumatism (ACR)” and the EULAR criteria 2010 for RA are as follows:
Joint involvement
1 large joint (knee, ankle, shoulder, elbow) 02-10 large joints 11-3 small joint (PIP, MCP, thumb IP, MTP, wrists) 24-10 small joints 3>10 joints (at least one small joint) 5
Serology Negative RF or negative ACPA 0Low positive RF or low positive anti-CCP antibodies (<3 times ULN)
2
High positive RF or high positive anti-CCP antibodies (>3 times ULN)
3
Acute phase reactants
Normal CRP and normal ESR 0Abnormal CRP or abnormal ESR 1
Duration of symptoms (weeks)
<6 0>6 1
PIP: Proximal interphalangeal joint, MCP: Metacarpophalangeal joint, IP: Interphalangeal joint, MTP: Metatarsophalangeal joint, RF: Rheumatoid factor, ACPA: Anti-citrullinated peptide antibodies, CCP: Cyclic citrullinated peptides, ULN: Upper limit of normal, CRP: C-reactive protein, ESR: Erythrocyte sediment rate
A score of >6 fulfi lls requirements for defi nitive of RA.
Exclusion CriteriaPatients presenting with polyarthritis but not satisfying the ACR and EULAR criteria 2010.
OBSERVATION AND RESULTS
Present study shows majority of patient shows 20 to 39 years (58%) as shown in Table 1, and in the extra-articular manifestation majority of patient are older (51.2 years) compared to articular manifestation (33 years) as shown in Table 2. This study also shows that majority are females as shown in Table 1.
In the present study, the most common extra-articular manifestation was noted in the cardiovascular system (12%). Next, in the order of involvement were respiratory manifestations (8%) and lymphadenopathy (8%), followed by vasculitis (6%) and rheumatoid nodule (2%) (Table 3).
The mean Hb was 10.24 ± 2.365 g/dl. The difference in the mean Hb between two groups was statistically signifi cant (P < 0.05) (Table 4).
RA factor was positive in 33 (66%) cases. RA titer ranged from 1:16 to 1:64. All the patients in EAG (100%) were rheumatoid factor positive (Table 5).

Inbanathan, et al.: A Study of Extra-articular Manifestation of Rheumatoid Arthritis
83 International Journal of Scientifi c Study | April 2016 | Vol 4 | Issue 1
DISCUSSION
The maximum incidence (58%) was observed in the age group of 20-39 years in the present study and is similar to the study of Banerjea (78% in 16-45 year).5
In the present study, the most common extra-articular manifestation observed was cardiac involvement (12%)
followed by pulmonary involvement and lymphadenopathy (8% each), vasculitis (6%) and subcutaneous nodule (2%).
In the present study, the incidence of extra-articular manifestations in 50 consecutive RA patients was studied.
In the EAG, all the 18 patients (100%) were RA factor positive, and majority had a higher titer as compared to the NEAG wherein 46.87% were RA factor positive.8-10
CONCLUSION
About 50 cases of RA fulfi lling the ARA and EULAR criteria of 2010 were evaluated clinically, bio-chemically, radiographically, echocardiographically and with pulmonary function tests for evidence of extra-articular manifestations.
The mean age was signifi cantly higher in the extra-articular group (EAG) as compared to the non-extra-articular group (NEAG).
The extra-articular manifestations were more common in males as compared to females.
The mean duration of illness was more in the EAG as compared to the NEAG.
There was not much difference in the mode of onset, clinical presentation, type of joint involvement, or the type of deformities between the two groups.
Male gender, older age group, longer duration of illness, severe degree of anemia, very high erythrocyte sedimentation rate, positive RA factor with higher titer values, all are suggestive of a higher incidence of extra-articular manifestations.
ACKNOWLEDGMENT
The authors would like to thank HOD of Medicine Department, MMC & RI, Mysore, Scientifi c and Ethical Committee for permitting us to conduct this study and the medical record section in KR Hospital, for giving all poisoning case sheets for collecting data. Moreover, we also thank all our patients without whom study would have not been possible.
REFERENCES
1. Agarwal A, Misra R, Dabadghao S, Pandey R. Rheumatoid vasculitis in India: A report of ten patients. J Assoc Physicians India 1995;43:500-4.
2. Franco AE, Levine HD, Hall AP. Rheumatoid pericarditis. Report of 17 cases diagnosed clinically. Ann Intern Med 1972;77:837-44.
Table 3: Extra-articular manifestationsExtra-articular manifestation Male Female Total (%)Cardiac involvement 4 2 6 (12)Pulmonary involvement 3 1 4 (8)Lymphadenopathy 1 3 4 (8)Vasculitis 1 2 3 (6)Rheumatoid nodule 1 0 1 (2)Total 10 8 18 (36)
Table 4: The mean Hb and SD (g/dl) of NEAG and EAGGroup Mean±SDNEAG 11.38±2.59EAG 9.11±2.14Total 10.24±2.365NEAG: Non-extra-articular group, EAG: Extra-articular group, SD: Standard deviation, Hb: Hemoglobin
Table 5: Rheumatoid factorRA titers NEAG EAG Total (%)1:16 5 3 8 (16)1:32 7 4 11 (22)1:64 3 11 14 (28)NEAG: Non-extra-articular group, EAG: Extra-articular group, RA: Rheumatoid arthritis
Table 1: The age and sex distribution of the casesAge group (in years)
NEAG EAG Total (%)Male Female Total Male Female Total
20-29 3 10 13 1 0 1 14 (28)30-39 3 9 12 1 2 3 15 (3040-49 1 4 5 1 2 3 8 (16)50-59 0 1 1 3 2 5 6 (12)>60 0 1 1 4 2 6 7 (14)NEAG: Non-extra-articular group, EAG: Extra-articular group
Table 2: The mean age and SD (years) of non-extra-articular group and extra-articular groupGroup Mean±SDNEAG 33.6±9.8EAG 51.2±12.5Total 42.4±11.15NEAG: Non-extra-articular group, EAG: Extra-articular group, SD: Standard deviation

Inbanathan, et al.: A Study of Extra-articular Manifestation of Rheumatoid Arthritis
84International Journal of Scientifi c Study | April 2016 | Vol 4 | Issue 1
3. Rosenberg A. Bones, joints and soft tissue tumours. In: Robbins Pathologic Basis of Disease. 6th ed. Philadelphia, PA: Robbins, Saunders; 1998. p. 1248-51.
4. Fauci AS, Haynes B, Katz P. The spectrum of vasculitis: Clinical, pathologic, immunologic and therapeutic considerations. Ann Intern Med 1978;89:660-76.
5. Banerjea JC. Some observations on rheumatoid arthritis with special reference to cardiovascular manifestations. J Assoc Physicians India 1965;13:251-60.
6. Seaton A, editor. Pulmonary manifestations of systemic disease. In: Crofton and Douglass Respiratory Diseases. 5th ed., Vol. 2. New York: Blackwell
Science; 2000. p. 1385-9.7. Arya SN. Emerging trends: In drug therapy of arthritides. In: Maj Gen
Venkataraman S, editor. Medicine Update. New Delhi: Association of Physicians of India; 2004. p. 537-41.
8. Paul BA. Extra-articular rheumatoid arthritis. In: Koopman WJ, editor. Arthritis and Allied Conditions. 13th ed. New York: Churchill-Livingstone; 1989. p. 1071-88.
9. Urs MB, Shankar PS. Rheumatoid arthritis – A clinical study. J Assoc Physicians India 1965;13:243-6.
10. Blake DR, Bacon PA. Serum ferritin and rheumatoid disease. Br Med J (Clin Res Ed) 1981;282:1273-4.
How to cite this article: Inbanathan J, Suneetha DK, Harsha G, George M, Shashank MS. Extra-articular Manifestation of Rheumatoid Arthritis. Int J Sci Stud 2016;4(1):81-84.
Source of Support: Nil, Confl ict of Interest: None declared.
85 International Journal of Scientifi c Study | April 2016 | Vol 4 | Issue 1
Classical Single Patch Repair and Revascularization for Post-infarction Ventricular Septal Defect: A Follow-up Study from a Semi-urban Tertiary Care Centre in South IndiaJ Ravikrishnan1, J Suresh Patel2, Nibi Hassan3
1Associate Professor, Department of Cardiothoracic and Vascular Surgery, Pushpagiri Institute of Medical Sciences and Research Centre, Thiruvalla, Kerala, India, 2Associate Professor, Department of Cardiovascular and Thoracic Surgery, S.B.K.S Medical College, Sumandeep Vidyapeeth, Waghidia, Piparia, Baroda, Gujarat, India, 3Resident, Department of General Surgery, Pushpagiri Institute of Medical Sciences and Research Centre, Thiruvalla, Kerala, India
Original Article
Abstract
Introduction: Rupture of ventricular septum is a rare complication of myocardial infarction and occurs in approximately 0.2% of the cases. Surgical management can reduce the chances of mortality in these cases from over 90% to less than 50%. The present study was aimed at fi nding out the short- and long-term outcomes of surgical management of post-infarction ventricular septal defect (VSD), using classical single patch repair and revascularization procedure.
Materials and Methods: A total of 46 patients who underwent surgical repair of post-infarction VSD at a tertiary care hospital in South India were included in the study. All of them had classical single Dacron patch repair and revascularization. The participants were followed up at the end of 2 months, 2 years, and 4 years using a 2D echocardiography, looking for the effi cacy of the Dacron patch and possible improvement in left ventricular function. The survival status of the participant and incidence of any new cardiac event was queried at the end of 2 and 4 years.
Results: The mean (standard deviation) ejection fraction went up from 26.52% (4.27) during pre-operative period to 33.08% (2.58) at the end of three months (P < 0.001). At the end of 2 months after surgery, 41 (89.1%) of the participants were alive. At the end of 2 and 4 years of follow-up, the survival status of the participants was similar, and 38 (82.6%) were alive. However, the short-term survival status was vastly different between those participants who underwent an emergency surgical correction and an elective procedure. 4 (50%) of the participants in the emergency group died in the fi rst 2 months following surgery, while only 1 (2.7%) died in the elective group.
Discussion and Conclusion: Our study has shown that post-infarction VSD can be successfully managed at semi-urban centers, with globally acceptable levels of mortality. Emergency surgical intervention for the management of post-infarction VSD was shown to result in high short-term mortality when compared to patients undergoing elective surgeries. Furthermore, single Dacron patch repair with concomitant revascularization was found to be a safe and effective procedure, for the management of the problem.
Key words: Low cardiac output, Post-infarct ventricular septal defect, Single Dacron patch repair
Access this article online
www.ijss-sn.com
Month of Submission : 02-2016Month of Peer Review : 03-2016Month of Acceptance : 03-2016Month of Publishing : 04-2016
Corresponding Author: Dr. J Ravikrishnan, Department of Cardiothoracic and Vascular Surgery, Pushpagiri Heart Institute,Pushpagiri Institute of Medical Sciences and Research Centre, Thiruvalla - 689 101, Kerala, India. Phone: +91-9446311999. E-mail: [email protected]
DOI: 10.17354/ijss/2016/194
INTRODUCTION
Cardiovascular diseases have become the leading cause of mortality and morbidity across the world. The incidence
of cardiovascular diseases in India is also on the rise and is now one of the top fi ve causes of death in the country.1 The incidence is predicted to rise manifold and India will be host to more than half of the patients suffering from cardiovascular diseases, by 2030.2 The Indian population and people of South Asian descent are also genetically susceptible for cardiovascular illnesses. Multiple studies have demonstrated a signifi cantly higher prevalence of cardiovascular risk factors and cardiovascular disease among Indian population, than Caucasians living in the same geographical areas.3 This warrants an increase

Ravikrishnan, et al.: Classical Single Patch Repair and Revascularization for Post-infarction Ventricular Septal Defect
86International Journal of Scientifi c Study | April 2016 | Vol 4 | Issue 1
in research into cardiovascular diseases, especially its epidemiology and intervention measures.
Rupture of ventricular septum is a rare complication of myocardial infarction and occurs in approximately 0.2% of the cases. It has a very high mortality, especially in patients who are medically managed or in whom it is not identifi ed. Surgical management can reduce the chances of mortality from over 90% to less than 50%.4 Certain studies have demonstrated even higher survival fi gures post-surgical management of these cases. A study from Hong Kong reported an overall survival of 68%, 55%, and 42% at 1, 5, and 10 years, respectively.5 Emergency surgeries and surgical intervention within three days of the event have been shown to increase short-term mortality, in the case of surgical management of post-infarction Ventricular septal defect (VSD).6 It has also been shown that the repair of post-infarction VSD along with a concomitant revascularization procedure can further improve the chances of survival. A systematic review found that out of the 18 papers evaluated for the review, 12 recommended a coronary artery bypass grafting (CABG) along with the repair of ventricular septum.7
The present study was aimed at fi nding out the short- and long-term outcomes of surgical management of post-infarction VSD, using classical single patch repair and revascularization procedure.
MATERIALS AND METHODS
About 46 patients who underwent surgical repair of post-infarction VSD at Sri Venkateswara Institute of Medical Sciences, Tirupati, India, were included in the study. All the participants underwent the procedure during the period 2005-2009, and all of them had classical single patch repair and revascularization. The study was cleared by the Institutional Ethics Committee.
The surgical approach was through a median sternotomy in all participants. Cannulation was done after heparinization (3 mg/kg). Aorto-bicaval cannulation, membrane oxygenators, and blood cardioplegia were used in all patients. Aortic cross-clamp time varied from 40 to 90 min and bypass time varied from 90 to 120 min. The VSD was approached through the infracted area. The size of the VSD ranged from 2 to 4 cm (2.59 ± 0.48). 14 of the defects were apical, and rest was apico-anterior. These defects were closed with a Dacron patch which was secured using double armed pre pledgeted 2/0 ethibond interrupted sutures, and the ventriculostomy was closed using 2/0 prolene continuous sutures with Tefl on felt reinforcement (Figures 1-5).
Figure 1: Post-infarct ventricular septal defect with ill-defi ned margins (emergency group)
Figure 2: Post-infarct ventricular septal defect with mature margins (elective group)
Figure 3: Pre pledgeted 2/0 ethibond stitches taken at ventricular septal defect margins for fi xing the Tefl on patch
Concomitant CABG with reversed saphenous vein graft was done in all the participants. Inotropic support with
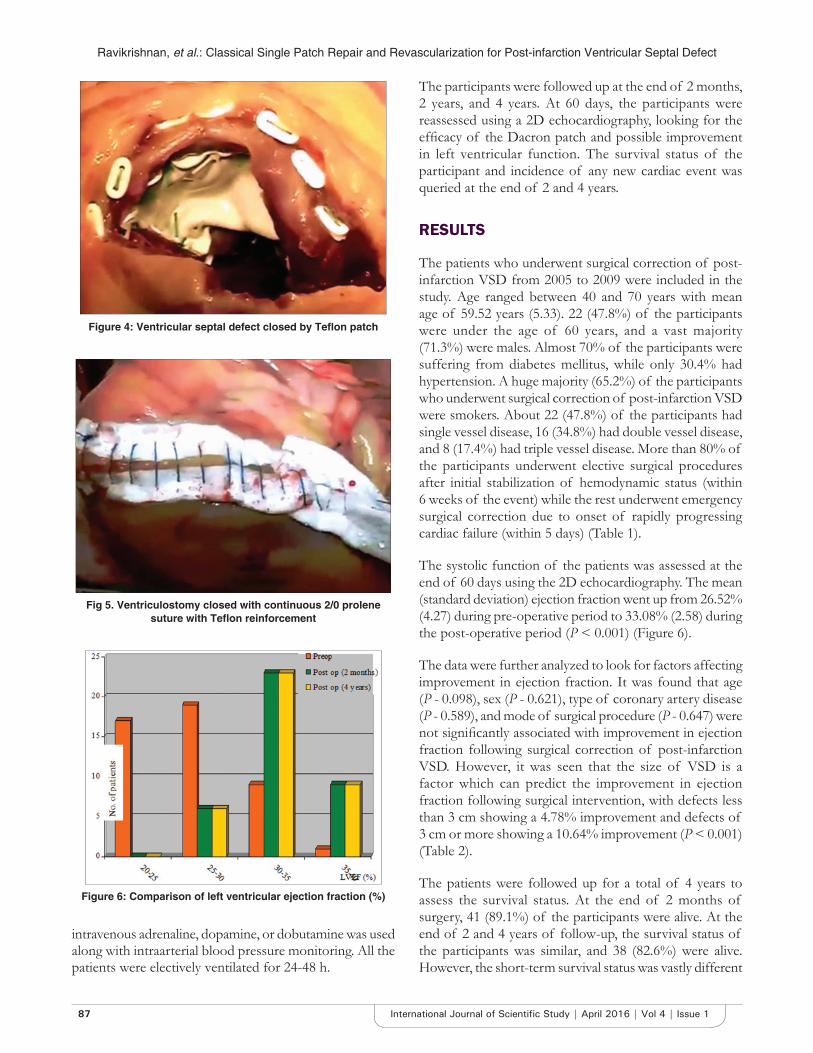
Ravikrishnan, et al.: Classical Single Patch Repair and Revascularization for Post-infarction Ventricular Septal Defect
87 International Journal of Scientifi c Study | April 2016 | Vol 4 | Issue 1
intravenous adrenaline, dopamine, or dobutamine was used along with intraarterial blood pressure monitoring. All the patients were electively ventilated for 24-48 h.
The participants were followed up at the end of 2 months, 2 years, and 4 years. At 60 days, the participants were reassessed using a 2D echocardiography, looking for the effi cacy of the Dacron patch and possible improvement in left ventricular function. The survival status of the participant and incidence of any new cardiac event was queried at the end of 2 and 4 years.
RESULTS
The patients who underwent surgical correction of post-infarction VSD from 2005 to 2009 were included in the study. Age ranged between 40 and 70 years with mean age of 59.52 years (5.33). 22 (47.8%) of the participants were under the age of 60 years, and a vast majority (71.3%) were males. Almost 70% of the participants were suffering from diabetes mellitus, while only 30.4% had hypertension. A huge majority (65.2%) of the participants who underwent surgical correction of post-infarction VSD were smokers. About 22 (47.8%) of the participants had single vessel disease, 16 (34.8%) had double vessel disease, and 8 (17.4%) had triple vessel disease. More than 80% of the participants underwent elective surgical procedures after initial stabilization of hemodynamic status (within 6 weeks of the event) while the rest underwent emergency surgical correction due to onset of rapidly progressing cardiac failure (within 5 days) (Table 1).
The systolic function of the patients was assessed at the end of 60 days using the 2D echocardiography. The mean (standard deviation) ejection fraction went up from 26.52% (4.27) during pre-operative period to 33.08% (2.58) during the post-operative period (P < 0.001) (Figure 6).
The data were further analyzed to look for factors affecting improvement in ejection fraction. It was found that age (P - 0.098), sex (P - 0.621), type of coronary artery disease (P - 0.589), and mode of surgical procedure (P - 0.647) were not signifi cantly associated with improvement in ejection fraction following surgical correction of post-infarction VSD. However, it was seen that the size of VSD is a factor which can predict the improvement in ejection fraction following surgical intervention, with defects less than 3 cm showing a 4.78% improvement and defects of 3 cm or more showing a 10.64% improvement (P < 0.001) (Table 2).
The patients were followed up for a total of 4 years to assess the survival status. At the end of 2 months of surgery, 41 (89.1%) of the participants were alive. At the end of 2 and 4 years of follow-up, the survival status of the participants was similar, and 38 (82.6%) were alive. However, the short-term survival status was vastly different
Figure 4: Ventricular septal defect closed by Tefl on patch
Fig 5. Ventriculostomy closed with continuous 2/0 prolene suture with Tefl on reinforcement
Figure 6: Comparison of left ventricular ejection fraction (%)
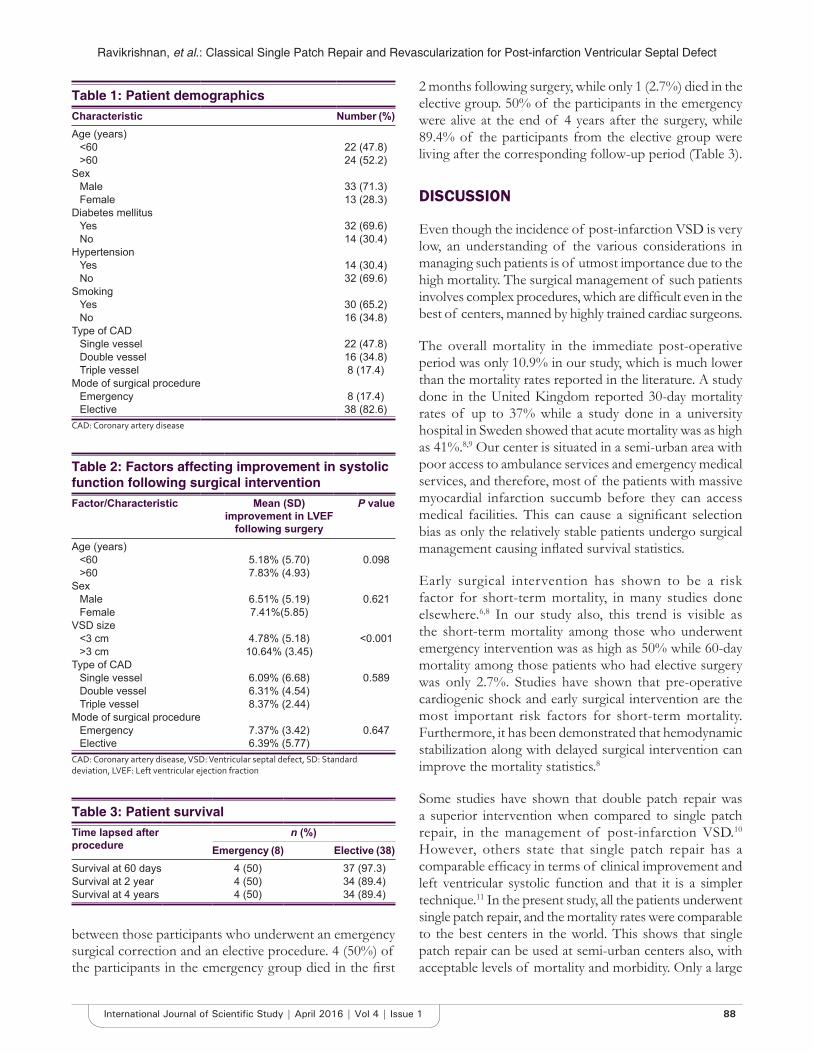
Ravikrishnan, et al.: Classical Single Patch Repair and Revascularization for Post-infarction Ventricular Septal Defect
88International Journal of Scientifi c Study | April 2016 | Vol 4 | Issue 1
2 months following surgery, while only 1 (2.7%) died in the elective group. 50% of the participants in the emergency were alive at the end of 4 years after the surgery, while 89.4% of the participants from the elective group were living after the corresponding follow-up period (Table 3).
DISCUSSION
Even though the incidence of post-infarction VSD is very low, an understanding of the various considerations in managing such patients is of utmost importance due to the high mortality. The surgical management of such patients involves complex procedures, which are diffi cult even in the best of centers, manned by highly trained cardiac surgeons.
The overall mortality in the immediate post-operative period was only 10.9% in our study, which is much lower than the mortality rates reported in the literature. A study done in the United Kingdom reported 30-day mortality rates of up to 37% while a study done in a university hospital in Sweden showed that acute mortality was as high as 41%.8,9 Our center is situated in a semi-urban area with poor access to ambulance services and emergency medical services, and therefore, most of the patients with massive myocardial infarction succumb before they can access medical facilities. This can cause a signifi cant selection bias as only the relatively stable patients undergo surgical management causing infl ated survival statistics.
Early surgical intervention has shown to be a risk factor for short-term mortality, in many studies done elsewhere.6,8 In our study also, this trend is visible as the short-term mortality among those who underwent emergency intervention was as high as 50% while 60-day mortality among those patients who had elective surgery was only 2.7%. Studies have shown that pre-operative cardiogenic shock and early surgical intervention are the most important risk factors for short-term mortality. Furthermore, it has been demonstrated that hemodynamic stabilization along with delayed surgical intervention can improve the mortality statistics.8
Some studies have shown that double patch repair was a superior intervention when compared to single patch repair, in the management of post-infarction VSD.10 However, others state that single patch repair has a comparable effi cacy in terms of clinical improvement and left ventricular systolic function and that it is a simpler technique.11 In the present study, all the patients underwent single patch repair, and the mortality rates were comparable to the best centers in the world. This shows that single patch repair can be used at semi-urban centers also, with acceptable levels of mortality and morbidity. Only a large
Table 1: Patient demographicsCharacteristic Number (%)Age (years)
<60 22 (47.8)>60 24 (52.2)
SexMale 33 (71.3)Female 13 (28.3)
Diabetes mellitusYes 32 (69.6)No 14 (30.4)
HypertensionYes 14 (30.4)No 32 (69.6)
SmokingYes 30 (65.2)No 16 (34.8)
Type of CADSingle vessel 22 (47.8)Double vessel 16 (34.8)Triple vessel 8 (17.4)
Mode of surgical procedureEmergency 8 (17.4)Elective 38 (82.6)
CAD: Coronary artery disease
Table 2: Factors affecting improvement in systolic function following surgical interventionFactor/Characteristic Mean (SD)
improvement in LVEF following surgery
P value
Age (years)<60 5.18% (5.70) 0.098>60 7.83% (4.93)
SexMale 6.51% (5.19) 0.621Female 7.41%(5.85)
VSD size<3 cm 4.78% (5.18) <0.001>3 cm 10.64% (3.45)
Type of CADSingle vessel 6.09% (6.68) 0.589Double vessel 6.31% (4.54)Triple vessel 8.37% (2.44)
Mode of surgical procedureEmergency 7.37% (3.42) 0.647Elective 6.39% (5.77)
CAD: Coronary artery disease, VSD: Ventricular septal defect, SD: Standard deviation, LVEF: Left ventricular ejection fraction
Table 3: Patient survivalTime lapsed after procedure
n (%)Emergency (8) Elective (38)
Survival at 60 days 4 (50) 37 (97.3)Survival at 2 year 4 (50) 34 (89.4)Survival at 4 years 4 (50) 34 (89.4)
between those participants who underwent an emergency surgical correction and an elective procedure. 4 (50%) of the participants in the emergency group died in the fi rst
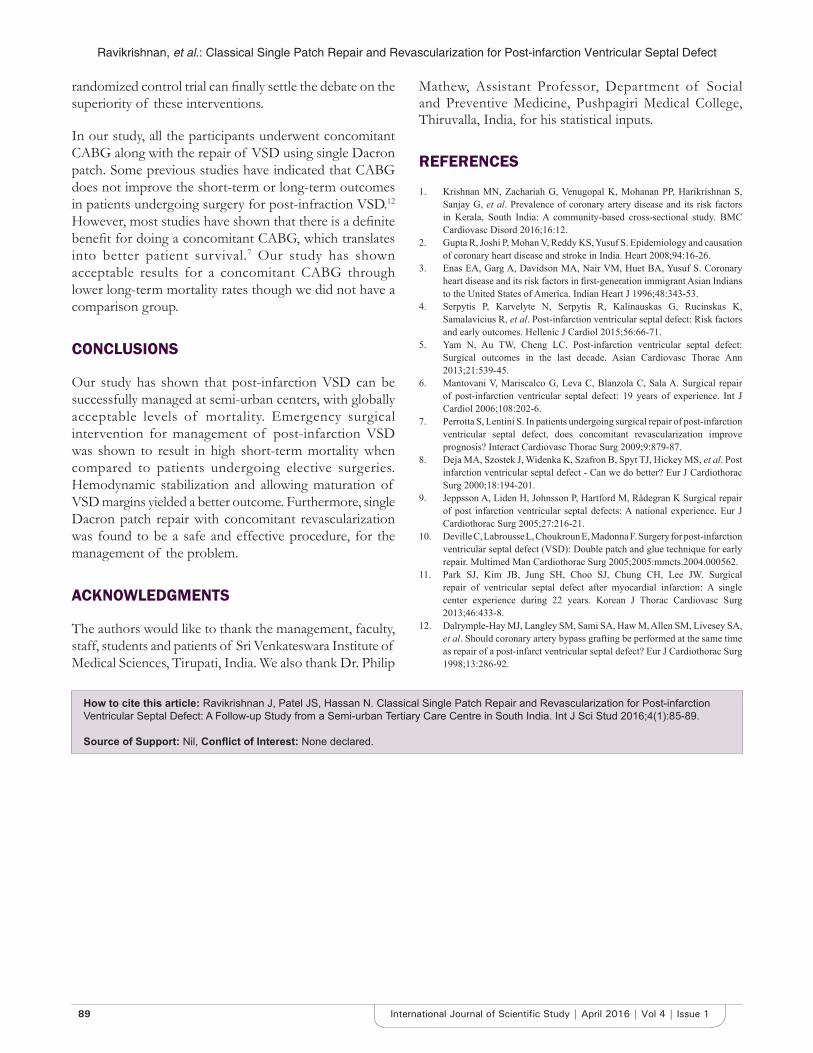
Ravikrishnan, et al.: Classical Single Patch Repair and Revascularization for Post-infarction Ventricular Septal Defect
89 International Journal of Scientifi c Study | April 2016 | Vol 4 | Issue 1
randomized control trial can fi nally settle the debate on the superiority of these interventions.
In our study, all the participants underwent concomitant CABG along with the repair of VSD using single Dacron patch. Some previous studies have indicated that CABG does not improve the short-term or long-term outcomes in patients undergoing surgery for post-infraction VSD.12 However, most studies have shown that there is a defi nite benefi t for doing a concomitant CABG, which translates into better patient survival.7 Our study has shown acceptable results for a concomitant CABG through lower long-term mortality rates though we did not have a comparison group.
CONCLUSIONS
Our study has shown that post-infarction VSD can be successfully managed at semi-urban centers, with globally acceptable levels of mortality. Emergency surgical intervention for management of post-infarction VSD was shown to result in high short-term mortality when compared to patients undergoing elective surgeries. Hemodynamic stabilization and allowing maturation of VSD margins yielded a better outcome. Furthermore, single Dacron patch repair with concomitant revascularization was found to be a safe and effective procedure, for the management of the problem.
ACKNOWLEDGMENTS
The authors would like to thank the management, faculty, staff, students and patients of Sri Venkateswara Institute of Medical Sciences, Tirupati, India. We also thank Dr. Philip
Mathew, Assistant Professor, Department of Social and Preventive Medicine, Pushpagiri Medical College, Thiruvalla, India, for his statistical inputs.
R EFERENCES
1. Krishnan MN, Zachariah G, Venugopal K, Mohanan PP, Harikrishnan S, Sanjay G, et al. Prevalence of coronary artery disease and its risk factors in Kerala, South India: A community-based cross-sectional study. BMC Cardiovasc Disord 2016;16:12.
2. Gupta R, Joshi P, Mohan V, Reddy KS, Yusuf S. Epidemiology and causation of coronary heart disease and stroke in India. Heart 2008;94:16-26.
3. Enas EA, Garg A, Davidson MA, Nair VM, Huet BA, Yusuf S. Coronary heart disease and its risk factors in fi rst-generation immigrant Asian Indians to the United States of America. Indian Heart J 1996;48:343-53.
4. Serpytis P, Karvelyte N, Serpytis R, Kalinauskas G, Rucinskas K, Samalavicius R, et al. Post-infarction ventricular septal defect: Risk factors and early outcomes. Hellenic J Cardiol 2015;56:66-71.
5. Yam N, Au TW, Cheng LC. Post-infarction ventricular septal defect: Surgical outcomes in the last decade. Asian Cardiovasc Thorac Ann 2013;21:539-45.
6. Mantovani V, Mariscalco G, Leva C, Blanzola C, Sala A. Surgical repair of post-infarction ventricular septal defect: 19 years of experience. Int J Cardiol 2006;108:202-6.
7. Perrotta S, Lentini S. In patients undergoing surgical repair of post-infarction ventricular septal defect, does concomitant revascularization improve prognosis? Interact Cardiovasc Thorac Surg 2009;9:879-87.
8. Deja MA, Szostek J, Widenka K, Szafron B, Spyt TJ, Hickey MS, et al. Post infarction ventricular septal defect - Can we do better? Eur J Cardiothorac Surg 2000;18:194-201.
9. Jeppsson A, Liden H, Johnsson P, Hartford M, Rådegran K Surgical repair of post infarction ventricular septal defects: A national experience. Eur J Cardiothorac Surg 2005;27:216-21.
10. Deville C, Labrousse L, Choukroun E, Madonna F. Surgery for post-infarction ventricular septal defect (VSD): Double patch and glue technique for early repair. Multimed Man Cardiothorac Surg 2005;2005:mmcts.2004.000562.
11. Park SJ, Kim JB, Jung SH, Choo SJ, Chung CH, Lee JW. Surgical repair of ventricular septal defect after myocardial infarction: A single center experience during 22 years. Korean J Thorac Cardiovasc Surg 2013;46:433-8.
12. Dalrymple-Hay MJ, Langley SM, Sami SA, Haw M, Allen SM, Livesey SA, et al. Should coronary artery bypass grafting be performed at the same time as repair of a post-infarct ventricular septal defect? Eur J Cardiothorac Surg 1998;13:286-92.
How to cite this article: Ravikrishnan J, Patel JS, Hassan N. Classical Single Patch Repair and Revascularization for Post-infarction Ventricular Septal Defect: A Follow-up Study from a Semi-urban Tertiary Care Centre in South India. Int J Sci Stud 2016;4(1):85-89.
Source of Support: Nil, Confl ict of Interest: None declared.
90International Journal of Scientifi c Study | April 2016 | Vol 4 | Issue 1
Awareness of Contact Lens Care among College Students in Saudi ArabiaAshjan Yousef Bamahfouz1,2, Hanaa Nafady-Hego3,4, Serene Jouhargy5, Mohammed Abdul Qadir6,Weam Nabeel Jameel Qutub7, Khaled Mohammed Bahubaishi8, Abdullah Atiah Al-ghamdi9
1Assistant Professor, Department of Ophthalmology, College of Medicine, Umm Al-Qura University, Makkah, Saudi Arabia, 2Consultant, King Abdullah Medical City, Makkah, Saudi Arabia, 3Lecturer, Department of Microbiology and Immunology, Faculty of Medicine, Assiut University, Assiut, Egypt, 4Assistant Professor, Department of Hematology and Immunology, College of Medicine, Makkah, Saudi Arabia, 5Chief, Department of Ophthalmology, King Abdullah Medical Complex, Jeddah, Saudi Arabia, 6Assistant Consultant, Department of Ophthalmology, King Abdullah Medical City, Makkah, Saudi Arabia, 7Resident, Department of Ophthalmology, King Abdullah Medical City, Makkah, Saudi Arabia, 8Intern, College of Medicine, King Abdulaziz University, Jeddah, Saudi Arabia, 9Assistant Professor, Department of Ophthalmology, Umm Al-Qura University, Makkah, Saudi Arabia
the continuous demand, CL-induced ocular complications induced by CL wear, especially corneal ulcer (CU) is still troublesome.1-5 The at-risk population being young adults, who are the main CL wearers, several studies were conducted among them to evaluate the risk factors for ocular complications. Many risk factors were identifi ed, including, sleeping while wearing CLs.6-11 The risk of microbial keratitis increased by about fi ve-fold among subject who wear their CLs during sleep.7 In yet another study, CL wearers who developed CUs were found to wear CLs overnight.11 Swimming with CL was reported in more than one-third of CL wearers who suffered with CU.11,12
INTRODUCTION
Although there are continuous breakthroughs in the contact lens (CL) industry, to provide safe CLs and to meet
Abstract
Introduction: Although there are continuous breakthroughs in the contact lens (CL) industry, to provide safe CLs and to meet the continuous demand, CL-induced ocular complications induced by CL wear, especially corneal ulcer (CU) is still troublesome.
Purpose: To evaluate the adherence to the guidelines of CL care practice among the students of Umm Al-Qura University in Makkah, Saudi Arabia.
Materials and Methods: A cross-sectional structured questionnaire survey of 31 elements was conducted electronically on 4462 college students from the preparatory year, in the Umm Al-Qura University to evaluate the general knowledge and practice of CL wear, care and its possible complications.
Results: A total of 543 (50.1%) students, out of 1074, wore CL. 335 (63.3%) female students used CL for cosmetic reasons which were signifi cantly high (P < 0.001). 148 (29.8%) students wore CLs for more than 3 years. Among these CL wearers, 66 (13.3%) students wore CLs for more than 8 h daily, 33.1% wore daily disposable CL, 7.9% wore weekly disposable CL, and 55% wore monthly disposable CL. 58 (11.6%) students slept with the CL. 73 (14.6%) and 34 (6.8%) students wore CL during shower and swimming, respectively. 33 (6.6%) students did not wash their hands before handling CL. 349 (70.4%) students did not rub their CL with fi ngers before soaking in the solution. 100 (20.1%) did not rinse their CL. About 253 (52.2%) students had ocular complaints. 260 (79.7%) students had some allergic reaction, dry eyes in 132 (40.2%) were advised to quit CL wear by doctors, corneal abrasions in 58 (17.4%), and CUs in 26 (8%). 53 (16.3%) students used CL for more than 3 years (P = 0. 043), frequent daily use of CL (P = 0.019), sleeping with CL (P <0.0001), and water activity as a shower (P = 0.002) or swimming (P = 0.016) were associated with CU.
Conclusion: More than half of our students experienced eye complications due to improper care of CL. Increasing awareness is crucial to avoid identifi ed risk factors for CU.
Key words: Contact lens disinfectant solutions, Contact lenses, Corneal ulcer, Keratitis
Access this article online
www.ijss-sn.com
Month of Submission : 02-2016Month of Peer Review : 03-2016Month of Acceptance : 04-2016Month of Publishing : 04-2016
Corresponding Author: Irshad A Subhan, King Abdullah Medical City, Makkah, Saudi Arabia. Tel.: +966543027674. E-mail: [email protected]
DOI: 10.17354/ijss/2016/195Original Article

Bamahfouz, et al.: Contact Lenses Practice among University Students
91 International Journal of Scientifi c Study | April 2016 | Vol 4 | Issue 1
Poor hygiene practices, and failure to follow the instruction of use, are major risk factors for corneal infl ammation among CL users.11 Many earlier reports showed that Pseudomonas aeruginosa and Staphylococcus aureus have been the most common frequently isolated organisms.4-6,11,13-15 Therefore, it is utmost important to increase awareness of prospective CL users on proper lens care, especially the use of well-fi tting daily-disposable lenses13,16 and regular after care.
MATERIALS AND METHODS
A cross-sectional structured questionnaire survey of 31 elements was conducted electronically on 4462 college students from the preparatory year, in the Umm Al-Qura University to evaluate the general knowledge and practice of CL wear, care and its possible complications. Any college student who has ever worn CL for whatever reason and for any period was enrolled in this study. The electronic structured questionnaire was distributed among the students from February 2015 to April 2015. All the questions were prepared in English and answers were also given in English by all the students. The questionnaire consisted of single-response questions and one multiple-response question. The following data were collected: Gender, age, use of CL, use of spectacles, type of CL, water activity, hygiene practice, and complication of CL use.
The nature of the study was explained to all the students at the beginning of the questionnaire. The study followed the tenets of the Declaration of Helsinki and was approved by the Umm Al-Qura University Ethics Committee.
Statistical AnalysisStatistical analyzes were performed using the Statistical Package for the Social Science (SPSS: An IBM Company, Version 16.0, IBM Corporation, Armonk, NY, USA). Data
are presented as mean ± standard deviations, median, range, or percentage where appropriate. One-way ANOVA test followed by post-hoc tests (Bonferroni test) or independent t-test for quantitative data or chi-square test for qualitative data were used to compare differences between subjects of study where appropriate. P < 0.05 was regarded as signifi cant.
RESULTS
General Characteristics of SubjectsAbout 4462 college students from the preparatory year, Umm Al-Qura University were invited to participate in this study. The response rate was 24.1% (1074/4462). Out of 1074, college students who responded to the questionnaire, 543 (50.1%) students had previous or current CL use, 393 (72.4%) students were currently wearing CL, and the remaining 150 (27.6%) had stopped wearing CL for variable reasons (Figure 1).
The reasons reported by students who stopped CL wearing were; loss of interest after cosmetic purpose use in 32 (26.4%), experiencing complications in 12 (9.9%), failure to keep up with the instructions in 7 (5.79%), discomfort in one (0.8%), no special reason in 38 (31.4%), and 31 (25.6%) did not mention any reason (Figure 2).
Demographic Characteristics of the Study GroupThe characteristics of the study group were listed in Table 1.
Of the total surveyed male students, 677 (63.7%) were 19-year-old. Out of which 349 and 328 were CL wearers and non-wearers, respectively. A total of 691 (65.1%) students were females, the majority of them were CL wearer (P < 0.001). CL preference versus glasses signifi cantly differs between CL wearer and non-wearer CL as 326 (60.7%) students of CL wearer were found to prefer CL (P < 0.0001). 237 (43.6%) students of CL wearer had
Total numbers of college students at the preparatory year at Umm Al Qura University: 4462
Total numbers of college students for analysis: 1074
Contact lens wearer: 543 Non-contact lens wearer: 531
Still wearing: 393 Stop wearing: 150
Figure 1: Characteristics of the study group

Bamahfouz, et al.: Contact Lenses Practice among University Students
92International Journal of Scientifi c Study | April 2016 | Vol 4 | Issue 1
spectacles compared to 138 (26%) students of the non-CL wearer (P < 0.0001).
Characteristics of CL WearerThe characteristics of CL wearer are listed in Table 2. The reasons for using CLs varied among students, it was found that 335 (63.3%) of the respondents used them for cosmetic reasons, and 194 (36.7%) students used them to correct vision. Moreover, types of CL varied among users. 7 (1.4%) students wore rigid gas permeable lenses. 491 (98.6%) students wore soft CLs, 69 (13.9%) students wore daily disposables, 39 (7.2%) students wore weekly disposables, 36 (7.8%) students wore monthly disposable, and 353 (71%) students wore conventional lenses.
Of the participants, 358 (70.2%) students had worn CLs for <3 years, and 148 (29.8%) students had worn CLs for more than 3 years. Thus, the minority of participants in this study was experienced wearers. For the daily wearing time, 66 (13.3%) students wore CLs for more than 8 h daily; furthermore, 58 (11.6%) students reported that they slept with their CLs.
Students also reported concomitant water activities and lens wear. 73 (14.6%) of CL wearer recalled that they had been taken shower, while wearing their CLs and 34 (6.8%) of participants reported they engaged in swimming activity while wearing their CLs.
Table 1: Demographic characteristic of the study groupsCharacteristics Contact
lens wearer (n=543)
Non-contact lens wearer
(n=531)
P value
Gender (male/female) 78/464 293/227 <0.0001Age/years 0.24
18 or below 92 9319 349 32820 60 7521 18 1522 9 423 or older 13 6
Had a pair of glasses 237 138 <0.0001Preference to wear CLs/glasses
326/211 120/348 <0.0001
CL: Contact lens
Indication and types of CLReason for CLs
Vision correction/cosmetic or fashion reason 194/335Type of used CLs
Soft/hard 491/7Type of used CLs
Disposable/extended wear 173/325CLs wear modality (%)
Duration of CLs use<6 months 110 (22.2)6 months-1 year 35 (7.1)1-2 years 103 (20.8)2-3 years 100 (20.2)More than 3 years 148 (29.8)
Frequency of CLs useDaily 69 (13.9)Weekly 39 (7.2)Monthly 36 (7.8)Only on special occasions or other events (cosmetically)
353 (71)
The daily wearing time/hours<6 h 142 (28)6-8 h 287 (58)12-24 h 52 (10.5)1-2 days 5 (1)More than 2 days 9 (1.8)
Frequency of sleeping with CLsEvery day 10 (2)1-2 days a week 13 (2.6)1-2 days a month 8 (1.6)Less than once per month 27 (5.4)Never 440 (88.4)
Water activities and CLs wear (%)Frequency of taking a shower with CLs
Every day 20 (4)1-2 days a week 12 (2.4)1-2 days a month 10 (2)Less than once per month 31 (6.2)Never 424 (85.3)
Frequency of swimming with CLsEvery day 7 (1.4)1-2 days a week 2 (0.4)1-2 days a month 4 (0.8)Less than once per month 21 (4.2)Never 464 (99.2)
CLs and lens case hygiene practices (%)Frequency of share of CLs
Every day 14 (2.8)1-2 days a week 9 (1.8)1-2 days a month 10 (2)Less than once per month 71 (14.4)Never 390 (78.9)
Frequency of hand wash before CLs useAlways 271 (54.5)Sometimes 152 (30.6)Rarely 41 (8.2)Never 33 (6.6)
Rubbing CLs with fi ngers before soaking them in the solution
No 280 (56.5)Yes 147 (29.6)Not applicable 69 (13.9)
Rinsing CLs caseNo 70 (14.1)Yes 398 (79.9)
Table 2: Characteristic of the CL wearer (n=543)
(Contd...)
Figure 2: Reasons for stopping contact lens wearing

Bamahfouz, et al.: Contact Lenses Practice among University Students
93 International Journal of Scientifi c Study | April 2016 | Vol 4 | Issue 1
Regarding CL hygiene, the majority of wearers reported that they did not share their CL with others (390 (78.9%) students). 271 (54.5%) students followed hand hygiene before handling CLs while 193 (38.8%) students reportedly rarely followed hand hygiene and 33 (6.6%) indicated that they never washed their hands before handling CLs. Furthermore, 147 (29.6%) students reported that they rubbed their CLs with fi ngers before soaking in the solution, while 349 (70.4%) replied in the negative. Furthermore, 398 (79.9%) students reported that they rinsed their CLs, while 100 (20.1%) students reported negatively. A changed CL solution occurred in 237 (47.9%) of wearers at least weekly, and the majority of wearers replaced their lens storage case at least once every 6 months, 193 (39.8%) of students replaced their lens storage case yearly.
A total of 151 (30.6%) students had their CL after specialist consultation. 64 (12.8%) students had at least aftercare every 6 months and 121 (24.3%) students consulted specialists for aftercare at least yearly. 313 (62.9%) of the participants did not request any specialist assistance.
Eye Complications Associated with CL useEye complications associated with CL use were listed in Figure 3. Among participants 253 (52.2%) students reported that they had at least one problem related to the use of CL. Out of which 260 (79.7%) of the students quoted allergy either to CL or its solution, followed by dry eyes in 132 (40.2%) students, corneal abrasions in 58 (17.4%) students, CU in 26 (8%) students, and 53 (16.3%) students were advised to quit CL use by their
doctor. 232 (47.8%) of the students faced no problems associated with the use of CL.
Factors Associated with Eye Complication Due to CL useFactors associated with Eye complications due to CL use were listed in Table 3. Among several factors studied, we found that CL wearer who had a pair of glasses had less complication (P = 0.007). In Addition, prolonged use of CL (P = 0.006) and frequent use of them per day (P = 0.024) were associated with complication. Sleeping with CL or taking shower reported to be associated with complication (P = 0. 018 and P = 0.004), respectively. CL users who did not rub their lenses with fi ngers before soaking them in the solution commonly experienced complications (P = 0.038).
Table 3: Risk factors for ocular complication among CLs usersFactors Complication
Yes No P valueHad a pair of glasses 126 92 0.007
Vision correction/cosmetic or fashion reason
98/155 74/156 0.079
Frequency of CLs use 0.006Daily 43 21Weekly 23 13Monthly 24 15Only on special occasions or other events (cosmetically)
162 180
The daily wearing time/hours 0.024<6 h 63 796-8 h 146 13112-24 h 33 161-2 days 4 1More than 2 days 6 2
Frequency of sleep with CLs 0.018Every day 6 21-2 days a week 12 11-2 days a month 5 2Less than once per month 15 12Never 215 213
Frequency of taking shower with CLs 0.004Every day 11 71-2 days a week 9 31-2 days a month 8 2Less than once per month 23 7Never 201 211
Rubbing CLs with fi ngers before soaking them in the solution
0.038
No 145 128Yes 80 61Not applicable 26 42
Ophthalmologist/optometrist/optician prescription for CLs
0.029
No/yes 165/88 170/61Ophthalmologists/optometrists/opticians visit for eye or CLs follow-up
0.035
Once every 2 weeks 4 23Once every 6 months 36Once a year 67 51Never 146 158
CL: Contact lens
Table 2: (Contd...)Not applicable 30 (6)
Frequency of change of CLs solutionDaily 57 (11.5)On alternate days 47 (9.5)Weekly 133 (26.9)Less often than weekly 202 (40.8)Not applicable 56 (11.3)
Frequency of replace of CLs with new onesDaily 22 (4.5)Weekly 19 (3.9)Every 2 weeks 21 (4.3)Monthly 94 (19.4)Every 6 months 136 (28)Yearly 193 (39.8)
CLs choose and follow-up schedule (%)Ophthalmologist/optometrist/optician prescription for CLs
No/yes 343/151Ophthalmologists/optometrists/opticians visit for eye or CLs follow-up
Once every 2 weeks 4 (0.8)Once every 6 months 60 (12)Once a year 121 (24.3)Never 313 (62.9)
CL: Contact lens
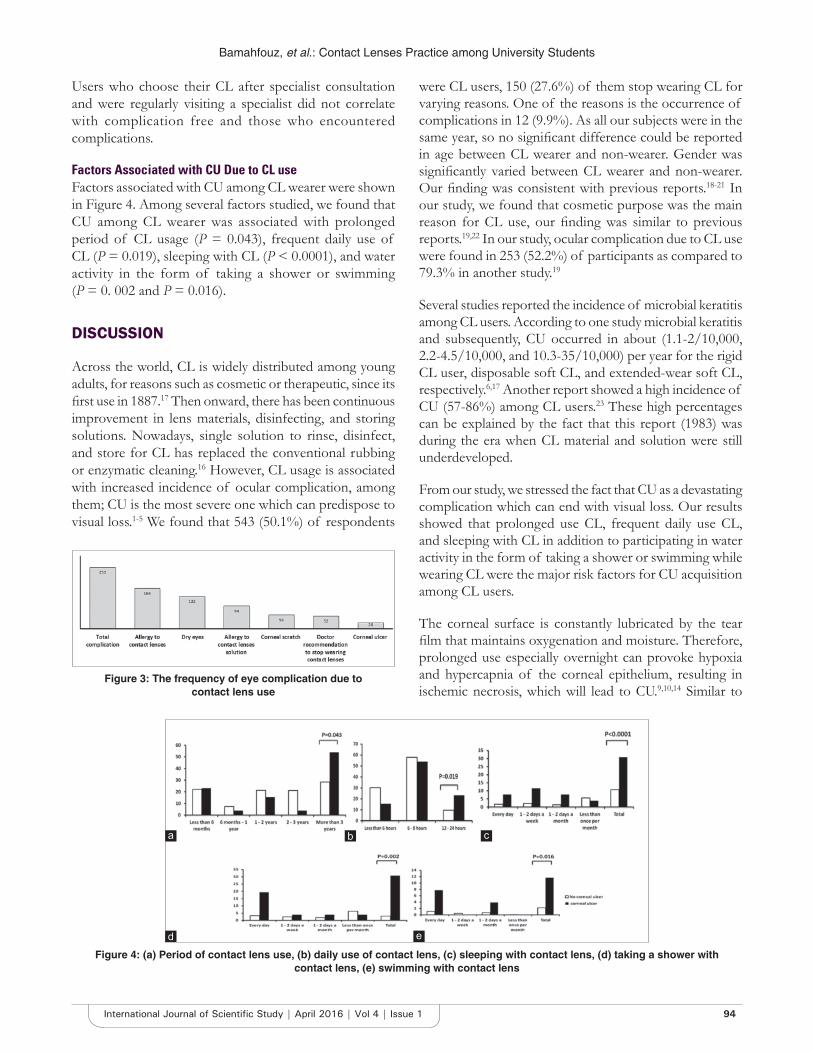
Bamahfouz, et al.: Contact Lenses Practice among University Students
94International Journal of Scientifi c Study | April 2016 | Vol 4 | Issue 1
Users who choose their CL after specialist consultation and were regularly visiting a specialist did not correlate with complication free and those who encountered complications.
Factors Associated with CU Due to CL useFactors associated with CU among CL wearer were shown in Figure 4. Among several factors studied, we found that CU among CL wearer was associated with prolonged period of CL usage (P = 0.043), frequent daily use of CL (P = 0.019), sleeping with CL (P < 0.0001), and water activity in the form of taking a shower or swimming (P = 0. 002 and P = 0.016).
DISCUSSION
Across the world, CL is widely distributed among young adults, for reasons such as cosmetic or therapeutic, since its fi rst use in 1887.17 Then onward, there has been continuous improvement in lens materials, disinfecting, and storing solutions. Nowadays, single solution to rinse, disinfect, and store for CL has replaced the conventional rubbing or enzymatic cleaning.16 However, CL usage is associated with increased incidence of ocular complication, among them; CU is the most severe one which can predispose to visual loss.1-5 We found that 543 (50.1%) of respondents
were CL users, 150 (27.6%) of them stop wearing CL for varying reasons. One of the reasons is the occurrence of complications in 12 (9.9%). As all our subjects were in the same year, so no signifi cant difference could be reported in age between CL wearer and non-wearer. Gender was signifi cantly varied between CL wearer and non-wearer. Our fi nding was consistent with previous reports.18-21 In our study, we found that cosmetic purpose was the main reason for CL use, our fi nding was similar to previous reports.19,22 In our study, ocular complication due to CL use were found in 253 (52.2%) of participants as compared to 79.3% in another study.19
Several studies reported the incidence of microbial keratitis among CL users. According to one study microbial keratitis and subsequently, CU occurred in about (1.1-2/10,000, 2.2-4.5/10,000, and 10.3-35/10,000) per year for the rigid CL user, disposable soft CL, and extended-wear soft CL, respectively.6,17 Another report showed a high incidence of CU (57-86%) among CL users.23 These high percentages can be explained by the fact that this report (1983) was during the era when CL material and solution were still underdeveloped.
From our study, we stressed the fact that CU as a devastating complication which can end with visual loss. Our results showed that prolonged use CL, frequent daily use CL, and sleeping with CL in addition to participating in water activity in the form of taking a shower or swimming while wearing CL were the major risk factors for CU acquisition among CL users.
The corneal surface is constantly lubricated by the tear fi lm that maintains oxygenation and moisture. Therefore, prolonged use especially overnight can provoke hypoxia and hypercapnia of the corneal epithelium, resulting in ischemic necrosis, which will lead to CU.9,10,14 Similar to
Figure 3: The frequency of eye complication due to contact lens use
Figure 4: (a) Period of contact lens use, (b) daily use of contact lens, (c) sleeping with contact lens, (d) taking a shower with contact lens, (e) swimming with contact lens
d
cba
e

Bamahfouz, et al.: Contact Lenses Practice among University Students
95 International Journal of Scientifi c Study | April 2016 | Vol 4 | Issue 1
our fi nding, prolonged use of CL were associated with eye problems.19 In addition, sleeping with CL was found to be a major risk factor for CU among CL users in several reports.6-11 Lam et al. reported a fi ve-fold increase in the risk of microbial keratitis among patients who wear their CLs overnight.7 In another study, more than half of CL wearer who had CU reported that they were sleeping with their CLs (11) and swimming (33%) with their CL and (26%) of them do not follow hand reported to be associated with infected keratitis.11,12 Failure to comply with instruction of use, poor hygiene are risk factor for CU in CL wearer in our study.22
Lack of hygiene and improper care of CL can predispose to the colonization of the CL surface with bacteria, leading to biofi lms formation, especially with P. aeruginosa.24,25 Previous reports showed that P. aeruginosa and S. aureus are the most common frequently isolated organism.4-6,11,13-15 In one study, pseudomonas account for 24% of organisms related to CL-induced ulcer.11
These microorganisms contain special structures known as pathogen-associated molecular patterns. These structures activate the innate immune response, mainly toll-like receptors (TLRs) that are expressed throughout the ocular tissue.26,27 This triggered innate immune response mediates further activation of adaptive immune response. All together develop a defense against microbes which can precipitate corneal infl ammation. Up-regulation of TLR was reported in patients with vernal keratoconjunctivitis.27,28
Our fi nding suggested that all the risk factors associated with eye complication among CL wearer are preventable. The prospective CL user must be educated and counseled regarding the proper lens care, duration of usage and hygiene practice while dealing with CL. Prolonged wear of CL, wearing it overnight and swimming or taking a shower while wearing CL must be avoided. CL must be bought from authorized eye care professionals, who can choose well-fi tting CL, and provide advice for regular after-care.13,16 Any individual with known risk factors of developing CU must be advised that if they experience any unexpected symptoms following CL use they must remove CL and seek medical advice as soon as possible for confi rmation and early management to prevent loss of vision. Thus, increasing public awareness of prospective CL users on proper lens care and wear duration is crucial.
CONCLUSION
With the widespread use of CL, CU associated with CL wear became more prevalent. Therefore, it is better to consider the identifi ed risk factors in this study in the care
of CL wearer, which can help to focus effective prevention and treatment strategies.
REFERENCES
1. Mah-Sadorra JH, Yavuz SG, Najjar DM, Laibson PR, Rapuano CJ, Cohen EJ. Trends in contact lens-related corneal ulcers. Cornea 2005;24:51-8.
2. Goh PP, Shamala R, Chandamalar S, Tai XY; National Eye Database Study Group. Contact lens-related corneal ulcer: A two-year review. Med J Malaysia 2010;65 Suppl A:120-3.
3. Moriyama AS, Hofl ing-Lima AL. Contact lens-associated microbial keratitis. Arq Bras Oftalmol 2008;71:32-6.
4. Bourcier T, Thomas F, Borderie V, Chaumeil C, Laroche L. Bacterial keratitis: Predisposing factors, clinical and microbiological review of 300 cases. Br J Ophthalmol 2003;87:834-8.
5. Yildiz EH, Airiani S, Hammersmith KM, Rapuano CJ, Laibson PR, Virdi AS, et al. Trends in contact lens-related corneal ulcers at a tertiary referral center. Cornea 2012;31:1097-102.
6. Cheng KH, Leung SL, Hoekman HW, Beekhuis WH, Mulder PG, Geerards AJ, et al. Incidence of contact-lens-associated microbial keratitis and its related morbidity. Lancet 1999;354:181-5.
7. Lam DS, Houang E, Fan DS, Lyon D, Seal D, Wong E; Hong Kong Microbial Keratitis Study Group. Incidence and risk factors for microbial keratitis in Hong Kong: Comparison with Europe and North America. Eye (Lond) 2002;16:608-18.
8. Stapleton F, Keay L, Edwards K, Naduvilath T, Dart JK, Brian G, et al. The incidence of contact lens-related microbial keratitis in Australia. Ophthalmology 2008;115:1655-62.
9. Dart JK, Radford CF, Minassian D, Verma S, Stapleton F. Risk factors for microbial keratitis with contemporary contact lenses: A case-control study. Ophthalmology 2008;115:1647-54, 1654.e1-3.
10. Efron N, Morgan PB. Rethinking contact lens associated keratitis. Clin Exp Optom 2006;89:280-98.
11. Lam JS, Tan G, Tan DT, Mehta JS. Demographics and behaviour of patients with contact lens-related infectious keratitis in Singapore. Ann Acad Med Singapore 2013;42:499-506.
12. Lelievre L, Borderie V, Garcia-Hermoso D, Brignier AC, Sterkers M, Chaumeil C, et al. Imported pythium insidiosum keratitis after a swim in Thailand by a contact lens-wearing traveler. Am J Trop Med Hyg 2015;92:270-3.
13. Morgan PB, Efron N, Hill EA, Raynor MK, Whiting MA, Tullo AB. Incidence of keratitis of varying severity among contact lens wearers. Br J Ophthalmol 2005;89:430-6.
14. Stapleton F, Keay LJ, Sanfi lippo PG, Katiyar S, Edwards KP, Naduvilath T. Relationship between climate, disease severity, and causative organism for contact lens-associated microbial keratitis in Australia. Am J Ophthalmol 2007;144:690-8.
15. Prokosch V, Gatzioufas Z, Thanos S, Stupp T. Microbiological fi ndings and predisposing risk factors in corneal ulcers. Graefes Arch Clin Exp Ophthalmol 2012;250:369-74.
16. Najjar DM, Aktan SG, Rapuano CJ, Laibson PR, Cohen EJ. Contact lens-related corneal ulcers in compliant patients. Am J Ophthalmol 2004;137:170-2.
17. Loh K, Agarwal P. Contact lens related corneal ulcer. Malays Fam Physician 2010;5:6-8.
18. Abbouda A, Restivo L, Bruscolini A, Pirraglia MP, De Marco F, La Cava M, et al. contact lens care among teenage students in Italy: A cross-sectional study. Semin Ophthalmol 2015:1-7.
19. Unnikrishnan B, Hussain S. Pattern of use of contact lens among college students: A cross-sectional study in coastal Karnataka. Indian J Ophthalmol 2009;57:467-9.
20. Lee YC, Lim CW, Saw SM, Koh D. The prevalence and pattern of contact lens use in a Singapore community. CLAO J 2000;26:21-5.
21. Riley C, Chalmers RL. Survey of contact lens-wearing habits and attitudes toward methods of refractive correction: 2002 versus 2004. Optom Vis Sci 2005;82:555-61.
22. Lembach RG. Use of contact lenses for management of keratoconus. Ophthalmol Clin North Am 2003;16:383-94.

Bamahfouz, et al.: Contact Lenses Practice among University Students
96International Journal of Scientifi c Study | April 2016 | Vol 4 | Issue 1
How to cite this article: Bamahfouz AY, Nafady-Hego H, Jouhargy S, Qadir MA, Qutub WNJ, Bahubaishi KM, Al-Ghamdi AA. Awareness of Contact Lens Care among College Students in Saudi Arabia. Int J Sci Stud 2016;4(1):90-96.
Source of Support: Nil, Confl ict of Interest: None declared.
23. Galentine PG, Cohen EJ, Laibson PR, Adams CP, Michaud R, Arentsen JJ. Corneal ulcers associated with contact lens wear. Arch Ophthalmol 1984;102:891-4.
24. Behlau I, Gilmore MS. Microbial biofi lms in ophthalmology and infectious disease. Arch Ophthalmol 2008;126:1572-81.
25. Toutain-Kidd CM, Kadivar SC, Bramante CT, Bobin SA, Zegans ME. Polysorbate 80 inhibition of Pseudomonas aeruginosa biofi lm formation and its cleavage by the secreted lipase LipA. Antimicrob Agents Chemother 2009;53:136-45.
26. Wilson RH, Maruoka S, Whitehead GS, Foley JF, Flake GP, Sever ML, et al. The Toll-like receptor 5 ligand fl agellin promotes asthma by priming allergic responses to indoor allergens. Nat Med 2012;18:1705-10.
27. Bonini S, Micera A, Iovieno A, Lambiase A, Bonini S. Expression of Toll-like receptors in healthy and allergic conjunctiva. Ophthalmology 2005;112:1528.
28. Chung SH, Nam KH, Kweon MN. Staphylococcus aureus accelerates an experimental allergic conjunctivitis by Toll-like receptor 2-dependent manner. Clin immunol 2009;131:170-7.

97 International Journal of Scientifi c Study | April 2016 | Vol 4 | Issue 1
Determinants of Utilization of Janani Suraksha Yojana among Mothers in Selected Communities of Aligarh: A Population-based Cross-sectional StudyNeha Priya1, Samreen Khan1, Zulfia Khan2
1Assistant Professor, Department of Community Medicine, Teerthanker Mahaveer Medical College, Moradabad, Uttar Pradesh, India, 2Ex-Professor & Head, Department of Community Medicine, J N Medical College Hospital, Aligarh, Uttar Pradesh, India
i.e., 53% in the African region and 25% in South-East Asia. The maternal mortality ratio in developing countries is 240 per 100000 births while in developed countries it is just 16 per 100000 live births. For an emerging global economic power famous for its medical prowess, India continues to have unacceptably high maternal mortality levels. India reported 212/100,000 live births. IMR stood at a high of 47/1000 birth with the majority of maternal and child deaths occurring in fi ve northern states of Bihar, Madhya Pradesh, Orissa, Rajasthan, and Uttar Pradesh (SRS-2011).3 Combined they accounted for about 55% of child mortality and 65% of maternal deaths in the country. As the risk of death is highest close to delivery and decreases in subsequent days, maximum benefi t can be achieved by focusing on this time. Skilled attendance at all births is considered to be the most critical intervention for ensuring safe motherhood.4,5 But now moving a step forward from training and equipping traditional birth attendants; to use of skilled birth attendant, we aim at achieving universalization of institutional delivery.
INTRODUCTION
Promotion and protection of maternal and child health has been one of the most important developmental goal in many countries across the globe still mothers continue to die. Worldwide, every day in 2010, about 800 women died during pregnancy and childbirth.1 More than 60% of mothers died during postpartum period. The risk of death was the highest close to birth and decreased in subsequent days and week.2 Almost all maternal deaths (99%) occurred in developing countries. More than three-fourth of maternal deaths were concentrated in just two regions of the world,
Original Article
Abstract
Background: Janani Suraksha Yojana (JSY), maternity benefi ts scheme launched by Government of India in April 2005 with the objective of reducing maternal and neonatal mortality by promoting institutional deliveries by providing cash incentive to benefi ciaries as well as promoter.
Materials and Methods: A cross-sectional study was conducted under Rural Health Training Centre and Urban Health Training Centre of the fi eld practice area of Department of Community Medicine, J N Medical College Hospital, Aligarh.
Results: A total of 300 RDWs (15-49 years) were interviewed out of which 120 (40%) were from urban slums and 180 (60%) from rural areas. The majority of deliveries were at government institution (51%), followed by home (26.3%) and (22.7%) at private hospitals.
Conclusion: The majority (73%) of females had institutional delivery. It was found that institutional delivery was infl uenced by women’s age, religion, caste, and educational status. The level of education and younger age was found to have a positive effect on utilization of JSY.
Key words: Janani Suraksha Yojana, Recently delivered women, Utilization
Access this article online
www.ijss-sn.com
Month of Submission : 02-2016Month of Peer Review : 03-2016Month of Acceptance : 03-2016Month of Publishing : 04-2016
Corresponding Author: Dr. Neha Priya, Department of Community Medicine, Teerthankar Mahaveer Medical College & Hospital, Teerthanker Mahaveer University, Moradabad - 244001, Uttar Pradesh, India. Phone: +91-7417142430. E-mail: [email protected]
DOI: 10.17354/ijss/2016/196
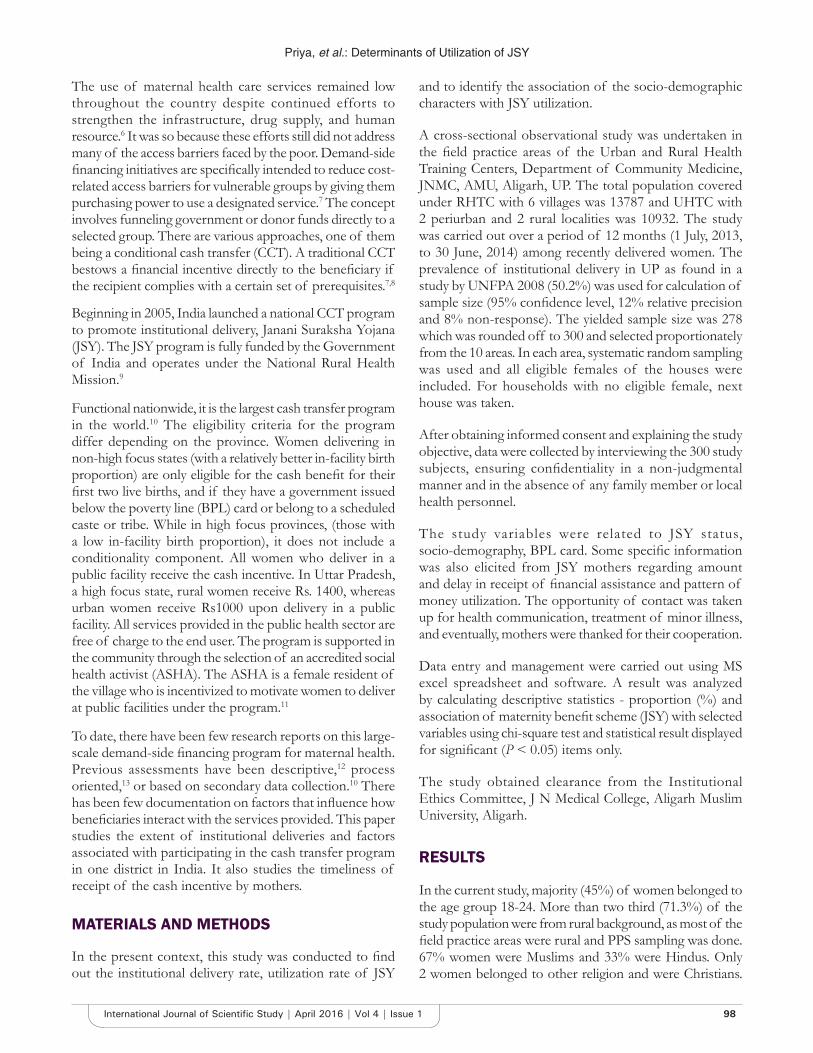
Priya, et al.: Determinants of Utilization of JSY
98International Journal of Scientifi c Study | April 2016 | Vol 4 | Issue 1
The use of maternal health care services remained low throughout the country despite continued efforts to strengthen the infrastructure, drug supply, and human resource.6 It was so because these efforts still did not address many of the access barriers faced by the poor. Demand-side fi nancing initiatives are specifi cally intended to reduce cost-related access barriers for vulnerable groups by giving them purchasing power to use a designated service.7 The concept involves funneling government or donor funds directly to a selected group. There are various approaches, one of them being a conditional cash transfer (CCT). A traditional CCT bestows a fi nancial incentive directly to the benefi ciary if the recipient complies with a certain set of prerequisites.7,8
Beginning in 2005, India launched a national CCT program to promote institutional delivery, Janani Suraksha Yojana (JSY). The JSY program is fully funded by the Government of India and operates under the National Rural Health Mission.9
Functional nationwide, it is the largest cash transfer program in the world.10 The eligibility criteria for the program differ depending on the province. Women delivering in non-high focus states (with a relatively better in-facility birth proportion) are only eligible for the cash benefi t for their fi rst two live births, and if they have a government issued below the poverty line (BPL) card or belong to a scheduled caste or tribe. While in high focus provinces, (those with a low in-facility birth proportion), it does not include a conditionality component. All women who deliver in a public facility receive the cash incentive. In Uttar Pradesh, a high focus state, rural women receive Rs. 1400, whereas urban women receive Rs1000 upon delivery in a public facility. All services provided in the public health sector are free of charge to the end user. The program is supported in the community through the selection of an accredited social health activist (ASHA). The ASHA is a female resident of the village who is incentivized to motivate women to deliver at public facilities under the program.11
To date, there have been few research reports on this large-scale demand-side fi nancing program for maternal health. Previous assessments have been descriptive,12 process oriented,13 or based on secondary data collection.10 There has been few documentation on factors that infl uence how benefi ciaries interact with the services provided. This paper studies the extent of institutional deliveries and factors associated with participating in the cash transfer program in one district in India. It also studies the timeliness of receipt of the cash incentive by mothers.
MATERIALS AND METHODS
In the present context, this study was conducted to fi nd out the institutional delivery rate, utilization rate of JSY
and to identify the association of the socio-demographic characters with JSY utilization.
A cross-sectional observational study was undertaken in the fi eld practice areas of the Urban and Rural Health Training Centers, Department of Community Medicine, JNMC, AMU, Aligarh, UP. The total population covered under RHTC with 6 villages was 13787 and UHTC with 2 periurban and 2 rural localities was 10932. The study was carried out over a period of 12 months (1 July, 2013, to 30 June, 2014) among recently delivered women. The prevalence of institutional delivery in UP as found in a study by UNFPA 2008 (50.2%) was used for calculation of sample size (95% confi dence level, 12% relative precision and 8% non-response). The yielded sample size was 278 which was rounded off to 300 and selected proportionately from the 10 areas. In each area, systematic random sampling was used and all eligible females of the houses were included. For households with no eligible female, next house was taken.
After obtaining informed consent and explaining the study objective, data were collected by interviewing the 300 study subjects, ensuring confi dentiality in a non-judgmental manner and in the absence of any family member or local health personnel.
The study variables were related to JSY status, socio-demography, BPL card. Some specifi c information was also elicited from JSY mothers regarding amount and delay in receipt of fi nancial assistance and pattern of money utilization. The opportunity of contact was taken up for health communication, treatment of minor illness, and eventually, mothers were thanked for their cooperation.
Data entry and management were carried out using MS excel spreadsheet and software. A result was analyzed by calculating descriptive statistics - proportion (%) and association of maternity benefi t scheme (JSY) with selected variables using chi-square test and statistical result displayed for signifi cant (P < 0.05) items only.
The study obtained clearance from the Institutional Ethics Committee, J N Medical College, Aligarh Muslim University, Aligarh.
RESULTS
In the current study, majority (45%) of women belonged to the age group 18-24. More than two third (71.3%) of the study population were from rural background, as most of the fi eld practice areas were rural and PPS sampling was done. 67% women were Muslims and 33% were Hindus. Only 2 women belonged to other religion and were Christians.
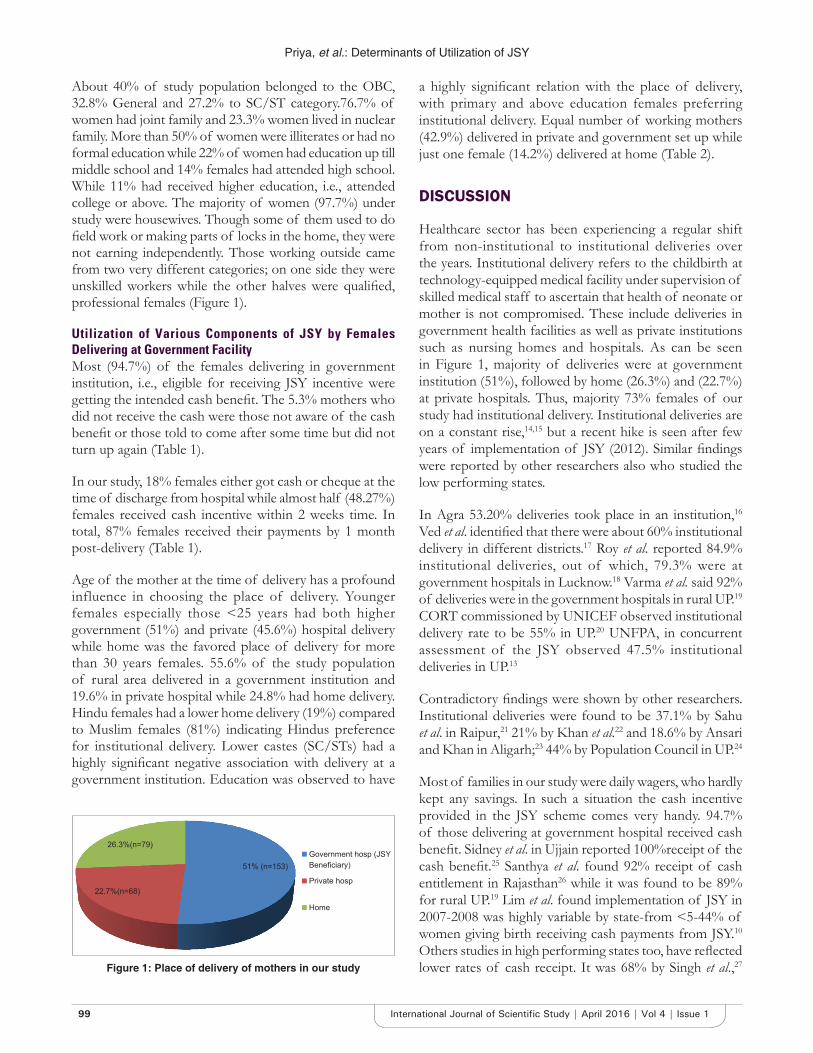
Priya, et al.: Determinants of Utilization of JSY
99 International Journal of Scientifi c Study | April 2016 | Vol 4 | Issue 1
About 40% of study population belonged to the OBC, 32.8% General and 27.2% to SC/ST category.76.7% of women had joint family and 23.3% women lived in nuclear family. More than 50% of women were illiterates or had no formal education while 22% of women had education up till middle school and 14% females had attended high school. While 11% had received higher education, i.e., attended college or above. The majority of women (97.7%) under study were housewives. Though some of them used to do fi eld work or making parts of locks in the home, they were not earning independently. Those working outside came from two very different categories; on one side they were unskilled workers while the other halves were qualifi ed, professional females (Figure 1).
Utilization of Various Components of JSY by Females Delivering at Government FacilityMost (94.7%) of the females delivering in government institution, i.e., eligible for receiving JSY incentive were getting the intended cash benefi t. The 5.3% mothers who did not receive the cash were those not aware of the cash benefi t or those told to come after some time but did not turn up again (Table 1).
In our study, 18% females either got cash or cheque at the time of discharge from hospital while almost half (48.27%) females received cash incentive within 2 weeks time. In total, 87% females received their payments by 1 month post-delivery (Table 1).
Age of the mother at the time of delivery has a profound influence in choosing the place of delivery. Younger females especially those <25 years had both higher government (51%) and private (45.6%) hospital delivery while home was the favored place of delivery for more than 30 years females. 55.6% of the study population of rural area delivered in a government institution and 19.6% in private hospital while 24.8% had home delivery. Hindu females had a lower home delivery (19%) compared to Muslim females (81%) indicating Hindus preference for institutional delivery. Lower castes (SC/STs) had a highly signifi cant negative association with delivery at a government institution. Education was observed to have
a highly signifi cant relation with the place of delivery, with primary and above education females preferring institutional delivery. Equal number of working mothers (42.9%) delivered in private and government set up while just one female (14.2%) delivered at home (Table 2).
DISCUSSION
Healthcare sector has been experiencing a regular shift from non-institutional to institutional deliveries over the years. Institutional delivery refers to the childbirth at technology-equipped medical facility under supervision of skilled medical staff to ascertain that health of neonate or mother is not compromised. These include deliveries in government health facilities as well as private institutions such as nursing homes and hospitals. As can be seen in Figure 1, majority of deliveries were at government institution (51%), followed by home (26.3%) and (22.7%) at private hospitals. Thus, majority 73% females of our study had institutional delivery. Institutional deliveries are on a constant rise,14,15 but a recent hike is seen after few years of implementation of JSY (2012). Similar fi ndings were reported by other researchers also who studied the low performing states.
In Agra 53.20% deliveries took place in an institution,16 Ved et al. identifi ed that there were about 60% institutional delivery in different districts.17 Roy et al. reported 84.9% institutional deliveries, out of which, 79.3% were at government hospitals in Lucknow.18 Varma et al. said 92% of deliveries were in the government hospitals in rural UP.19 CORT commissioned by UNICEF observed institutional delivery rate to be 55% in UP.20 UNFPA, in concurrent assessment of the JSY observed 47.5% institutional deliveries in UP.13
Contradictory fi ndings were shown by other researchers. Institutional deliveries were found to be 37.1% by Sahu et al. in Raipur,21 21% by Khan et al.22 and 18.6% by Ansari and Khan in Aligarh;23 44% by Population Council in UP.24
Most of families in our study were daily wagers, who hardly kept any savings. In such a situation the cash incentive provided in the JSY scheme comes very handy. 94.7% of those delivering at government hospital received cash benefi t. Sidney et al. in Ujjain reported 100%receipt of the cash benefi t.25 Santhya et al. found 92% receipt of cash entitlement in Rajasthan26 while it was found to be 89% for rural UP.19 Lim et al. found implementation of JSY in 2007-2008 was highly variable by state-from <5-44% of women giving birth receiving cash payments from JSY.10 Others studies in high performing states too, have refl ected lower rates of cash receipt. It was 68% by Singh et al.,27 Figure 1: Place of delivery of mothers in our study

Priya, et al.: Determinants of Utilization of JSY
100International Journal of Scientifi c Study | April 2016 | Vol 4 | Issue 1
53% by Lanjewar et al.,28 32.8% by Vishwanath et al.,29 48% by Malik et al. in Haryana30 and 27.3% by Vikram et al. in Delhi.31
The most judicious time for receipt of cash is before going for delivery so that payments for transport, medicine, etc. can be given. Nevertheless even after delivery, it should be given as soon as possible. Similar to our study, (66% of benefi ciaries got incentive within 2 weeks of delivery), in Ujjain too most benefi ciaries reported receiving the cash incentive by 2 weeks of delivery,25 in Rajasthan 50% by a week and 35% by 1 month,26 in Maharashtra 53% within 1 week of delivery28 in UP, only 64% received it within 1 month.19 In high performing states also, like Maharastra68% received JSY incentive at the time of discharge27 while 20.83% JSY mothers received money in
<1-month of delivery in Haryana.30 Thus, the cash receipt is highly variable across various states irrespective of them being high or low performing, depicting offi cial hurdles to be the same everywhere.
Age of the mother at the time of delivery has a profound infl uence in choosing the place of delivery. As shown in Table 2 deliveries at government health facility were found to be greatest in 18-24 year age group (51%), followed by 25-30 year age group (41.2%). The home was the favored place of delivery for more than 30 years females. Lim et al. found utilization rates steadily declined with age with the youngest women (aged 15-19 years) showing the highest uptake in different districts of India.10
While no signifi cant relation between delivery at government facilities and the age was reported by Roy et al. in Lucknow18 and Santhya et al. in Rajasthan.26
Rural population lag behind in the utilization of maternal and child services. However, better results were reported in rural areas under our study; this may be because most of the villages had good road connectivity to nearby CHC at Jawan.55.6 % of our study population of rural area delivered in a government institution and 19.6% in private hospital while 24.8% had home delivery. Belonging from a rural area was signifi cantly associated with institutional delivery. Similarly, Lanjewar et al. in Maharashtra observed that more women from rural area (85.29%) actually benefi tted.28
Contrary results were observed by Khan et al. in UP and Santhya et al. in Rajasthan where residence in remote
Table 2: Distribution of mothers according to area, religion, caste, age group and utilization of JSY (delivery at government facility)Socio demographic characteristics
Place of delivery Total (%) n=300
Chi-square P valueGovernment (n=153) Private (n=68) Home (n=79)
Age group18-24 78 (51) 31 (46) 27 (34) 136 (45) 11.29 (4) 0.02325-30 63 (41) 29 (42) 35 (44) 127 (42)>30 12 (8) 8 (12) 17 (22) 37 (13)
AreaRural 119 (78) 42 (62) 53 (67) 214 (71) 6.85 (2) 0.033Urban 34 (22) 26 (38) 26 (33) 86 (29)
ReligionHindu 61 (40) 23 (34) 15 (19) 99 (33) 10.30 (2) 0.006Muslim 92 (60) 45 (66) 64 (81) 201 (67)
CasteGeneral 56 (37) 32 (47) 10 (13) 98 (33) 32.71 (4) 0.000OBC 63 (41) 26 (28) 31 (39) 120 (40)SC/ST 34 (22) 10 (15) 38 (48) 82 (27)
Mother’s educationIlliterate 80 (52) 35 (51) 62 (79) 177 (59) 23.139 (4) 0.0001st-10th class 63 (41) 23 (34) 16 (20) 102 (34)Above 10th 10 (7) 10 (15) 1 (1) 21 (7)
Delivery at government institution was considered proxy for JSY utilization, as there were no accredited private institutions and none of the home delivered mothers received any cash benefi t, JSY: Janani Suraksha Yojana
Table 1: Components of JSY (cash receipt)Details of cash benefi t receipt n (%)Receipt of cash benefi ts by those having government facility delivery (n=153)
Yes 145 (94.7)No 8 (5.3)
Time of receipt of cash incentiveWithin 24 h 26 (17.9)24 h - 2 weeks 70 (48.3)2 weeks - 4 weeks 31 (21.4)>4 weeks of delivery 18 (12.4)
Cash incentive given byASHA 15 (9.8)Health institution staff 121 (79.1)Others 17 (11.1)Total 153 (100)
ASHA: Accredited social health activist, JSY: Janani Suraksha Yojana
Priya, et al.: Determinants of Utilization of JSY
101 International Journal of Scientifi c Study | April 2016 | Vol 4 | Issue 1
villages or hamlets of the large village was negatively associated with institutional delivery.22,26
Hindu females had a lower home delivery (19%) compared to Muslim females (81%) indicating Hindus preference for institutional delivery which was found to be statistically signifi cant also. Roy et al. from Lucknow, reported Hindus to be more likely to get their deliveries done at the government hospital.17 Santhya et al. found that women from religion other than Hinduism were less likely to get the cash benefi t (33-35% versus 49%) in Rajasthan.26 Lim et al. found that Muslims in both high-focus and non-high-focus states had lower odds of receiving JSY payments.10
In our study, lower castes (SC/STs) had a highly signifi cant negative association with delivery at a government institution. Scheduled castes/tribes were found to be negatively associated with institutional delivery by Khan et al. in Aligarh.22 On the other hand, Roy et al. and Lim et al. reported that SC/STs had higher preference to get their deliveries at government hospital.18,10
Education was observed to have a highly significant relation with the place of delivery, with primary and above education females preferring institutional delivery. Similar to our fi ndings Roy et al. also reported signifi cant relation between delivery at government facilities and education status of the RDWs of Lucknow.18 In Aligarh being non-literate was found to be negatively associated with institutional delivery.23
CONCLUSION
To conclude we can say that acceptance of institutional delivery care has improved a lot as compared to earlier studies in the same area. This is probably in response to JSY. Vertical transfer of cash assistance may result in interjection of new messages to targeted population, catalyzing critical mass movement and urging for behavior change but will only make a difference when health infrastructure is also improved to tackle the problem of overcrowding in hospitals, lack of trained staff at the health facility and uninterrupted supply of delivery kits, IFA tabs and other drugs.
Improvement in overall status of development of women in particular and society in general by ensuring equity in educational and economic opportunities is sure to bring about palpable results in improving service utilization and general health status of the people.
REFERENCES
1. WHO, Global Health Observatory, (GHO). Maternal and Reproductive Health: Maternal Mortality. WHO; 2014. Available from: http://www.who.
int/gho/maternal_health/en/. [Last accessed on 2014 Nov 25].2. WHO. WHO Fact Sheet, Maternal Mortality, 2012. World Health Statistics
2014. Geneva: World Health Organization; 2014.3. Sample registration system. SRS Statistical Report 2011. New Delhi:
Offi ce of the Registrar General and Census Commissioner, Ministry of Home Affairs; 2013. Available from:http://www.censusindia.gov.in/vital_statistics/SRS_Reports_2013.html[Accessed on Nov 25, 2014].
4. WHO. Making Pregnancy Safer: The Critical Role of the Skilled Attendant - A Joint Statement. Geneva: WHO, ICM, FIGO and World Health Organisation; 2014.
5. Graham W, Bell J, Bullough C. Can skilled attendance at delivery reduce maternal mortality in developing countries? Paper Presented at: European Commission Expert Meeting on Safer Motherhood, Brussels, Belgium, 27-28, November 2000.
6. McNamee P, Ternent L, Hussein J. Barriers in accessing maternal healthcare: Evidence from low-and middle-income countries. Expert Rev Pharmacoecon Outcomes Res 2009;9:41-8.
7. Ensor T. Consumer-led demand side fi nancing in health and education and its relevance for low and middle income countries. Int J Health Plann Manage 2004;19:267-85.
8. Borghi J, Ensor T, Somanathan A, Lissner C, Mills A; Lancet Maternal Survival Series Steering Group. Mobilising fi nancial resources for maternal health. Lancet 2006;368:1457-65.
9. WHO. Improving Maternal Newborn and Child Health India. Geneva: WHO; 2004.
10. Lim SS, Dandona L, Hoisington JA, James SL, Hogan MC, Gakidou E. India’s Janani Suraksha Yojana, a conditional cash transfer programme to increase births in health facilities: An impact evaluation. Lancet 2010;375:2009-23.
11. Government of India. Janani Suraksha Yojana: Features and Frequently Asked Questions and Answers. 2006.
12. Gupta SK, Pal DK, Tiwari R, Garg R, Sarawagi R, Kumar A. Assessment of Janani Suraksha Yojana (JSY) - In Jabalpur, Madhya Pradesh: Knowledge, attitude and utilization pattern of benefi ciaries: A descriptive study. Int J Curr Biol Med Sci 2011;1:6-11.
13. UNFPA. Concurrent Assessment of Janani Suraksha Yojana (JSY) Scheme in Selected States of India. New Delhi: UNFPA; 2009.
14. International Institute for Population Sciences, (IIPS). District Level Household and Facility Survey (DLHS-3), 2007-08. Uttar Pradesh, India, Mumbai: IIPS; 2010.
15. International Institute for Population Sciences, (IIPS). National Family Health Survey (NFHS-3), India, 2005-06. Uttar Pradesh, Mumbai: IIPS; 2008.
16. Kumar V, Kaushal SK, Misra SK, Gupta SC. Assessment of the impact of JSY on maternal health services in rural areas of Agra district. Indian J Community Med 2012;24:118-23.
17. Ved R, Sundararaman T, Gupta G, Rana G. Programme evaluation of the Janani Suraksha Yojana. BMC Proc 2012;6:015.
18. Roy MP, Mohan U, Singh SK, Singh VK, Srivastava AK. Factors associated with the preference for delivery at the government hospitals in rural areas of Lucknow district in Uttar Pradesh. Indian J Public Health 2013;57:268-71.
19. Varma DS, Khan ME, Hazra A. Increasing institutional delivery and access to emergency obstetric care services in rural Uttar Pradesh. J Fam Welf 2010;56:23-30.
20. Centre for Operations Research and Training, (CORT). Assessment of ASHA and Janani Suraksha Yojana in Uttar Pradesh. Available from: http://www.cortindia.com/UP/UP-2007-0306. [Last accessed on 2014 Nov 25].
21. Sahu D, Gandhi NK, Soni GP. Knowledge and utilization of Janani Suraksha Yojana (JSY): An epidemiological study. Indian J Mater Child Health 2012;14:1-7.
22. Khan Z, Mehnaz S, Ansari MA, Khalique N, Siddiqui AR. Existing practices and barriers to avail of maternal healthcare services in two slums of Aligarh. Health Popul Perspect Issues 2009;32:113-23.
23. Ansari MA, Khan Z. Antenatal care services in rural areas of Aligarh, India: A cross-sectional study. J Public Health Epidemiol 2011;3:210-6.
24. Population Council. Increasing Institutional Delivery and Access to Emergency Obstetric Care Services in Rural Uttar Pradesh: Implications for Behaviour Change Communication, Policy Brief No.1. New Delhi: Population Council; 2010.

Priya, et al.: Determinants of Utilization of JSY
102International Journal of Scientifi c Study | April 2016 | Vol 4 | Issue 1
25. Sidney K, Diwan V, El-Khatib Z, De Costa A. India’s JSY cash transfer program for maternal health: Who participates and who doesn’t - A report from Ujjain district. Reprod Health 2012;9:2.
26. Santhya KG, Jejeebhoy SJ, Acharya R, Zavier AJ. Effects of Janani Suraksha Yojna on Maternal and New born Care Practices: Women’s Experience in Rajasthan. New Delhi: Population Council 2011.
27. Singh HS, Tamulee P. Janani Surasksha Yojana: Impact on socio-economic conditions among benefi ciary families. Int J Sci Res Publ 2012;2:1-4.
28. Lanjewar S, Chaudhary S, Kubde S, Bhatkule P. Evaluation of Janani Suraksha Yojna (JSY) and Universal Immunization Programme (UIP) in
two districts of Maharashtra. Int J Sci Res 2013;2:97-9.29. Vishwanath WH, Jatti GM, Tannu U. Missed opportunities of Janani
Suraksha Yojana benefi ts among the benefi ciaries in slum areas. Natl J Community Med 2011;2:40-2.
30. Malik JS, Kalhan M, Punia A, Sachdeva S, Behera BK. Utilization of health services under Janani Suraksha Yojna in rural Haryana 2013. Int J Med Public Health 2013;3:176-9.
31. Vikram K, Sharma AK, Kannan AT. Benefi ciary level factors infl uencing Janani Suraksha Yojana utilization in urban slum population of trans - Yamuna area of Delhi. Indian J Med Res 2013;138:340-6.
How to cite this article: Priya N, Khan S, Khan Z. Determinants of Utilization of Janani Suraksha Yojana among Mothers in Selected Communities of Aligarh: A Population-based Cross-Sectional Study. Int J Sci Stud 2016;4(1):97-102.
Source of Support: Nil, Confl ict of Interest: None declared.
103 International Journal of Scientifi c Study | April 2016 | Vol 4 | Issue 1
Hypoglycemic Effect of Tinospora cardifolia in Type II Diabetes MellitusRekha Kumari
Associate professor, Department of Biochemistry, Katihar Medical College, Katihar, Bihar, India
and an inadequate compensatory insulin secretory response.
WHO diagonostic criteria for diabetes mellitus - plasma glucose level of 126 mg/dl or higher after an overnight fast on more than one occasion.
A value of 200 mg/dl or above within 2 h after 75 g of oral glucose is of diagonostic value in diagonosis of diabetes mellitus.
Role of Tinospora cardifolia as a hypoglycemic agent has been recognized since ancient times. It is a large glaborous decidous climbing shrub belonging to the family Menispermanceae which is distributed throughout tropical Indian subcontinent and China. It is widely used for its general tonic, antipyretic, antispasmotic, anti-infl ammatory, antiarthritic, antiallergic, and antidiabetic properties. A variety of constituents have been isolated from this plant and their structures elucidated. They belong to different classes such as alkaloid, diterpenoids, lactones, glycosides,
INTRODUCTION
Diabetes milletus is a heterogenous group of diseases with disorders metabolism and inappropriate hypoglycemic due to a defi ciency either of insulin secretion or to a combination of insulin resistance and inadequate insulin secretion to compensate. It is due to the diversity of etiological, environmental, and genetic factors acting together. It is broadly classifi ed into broad etiopathogenic categories.
Type I diabetes milletus - the cause is absolute defi ciency of insulin secretion and Type II diabetes mellitus - the cause is the combination of resistance to insulin action
Original Article
Abstract
Introduction: Aim of the present investigation is to evaluate the hypoglycemic effects of an alcohol extract of dried stem of Tinospora cardifolia, an indegenous plant used in Ayurvedic medicine in India.
Purpose: To establish the hypoglycemic effect of the drug. To evaluate if there are any renal or hepatic toxicity.
Materials and Methods: A total of 50 individuals, 15 normal and 35 diabetic in age group 35-65 were selected for study and extract of T. cardifolia in the dose 2 g and 4 g was administered for 2 weeks. Blood sugar was monitored after 1 week and 2 weeks of administration.
Results: Mean post prandial blood sugar after 1 h and 2 h was signifi cantly reduced at the end of 2 weeks. Furthermore, there were no signifi cant hepatic and renal toxicity.
Conclusion: The drug signifi cantly reduced the blood sugar levels at the end of 2 weeks in the dose of 2-4 g per day. The drug is free from any liver or renal toxicity.
Key words: Aliphatic compounds, Alkaloids, Diterpene, Glycosides, Hypoglycemic, Lactones, Liver function test, Phenolics, Polysaccharides, Sesquiterpenoids, Steroids, Tinospora cardifolia
Access this article online
www.ijss-sn.com
Month of Submission : 02-2016Month of Peer Review : 02-2016Month of Acceptance : 03-2016Month of Publishing : 04-2016
Corresponding Author: Rekha Kumari, Shiv Shakthi Clinic, No.4 Uday Kumar Building, SGR Dental College Road, Munnekolala, Marathalli, Bengaluru - 560 037, Karnataka, India. Phone: +91-9900070080. E-mail: [email protected]
DOI: 10.17354/ijss/2016/197
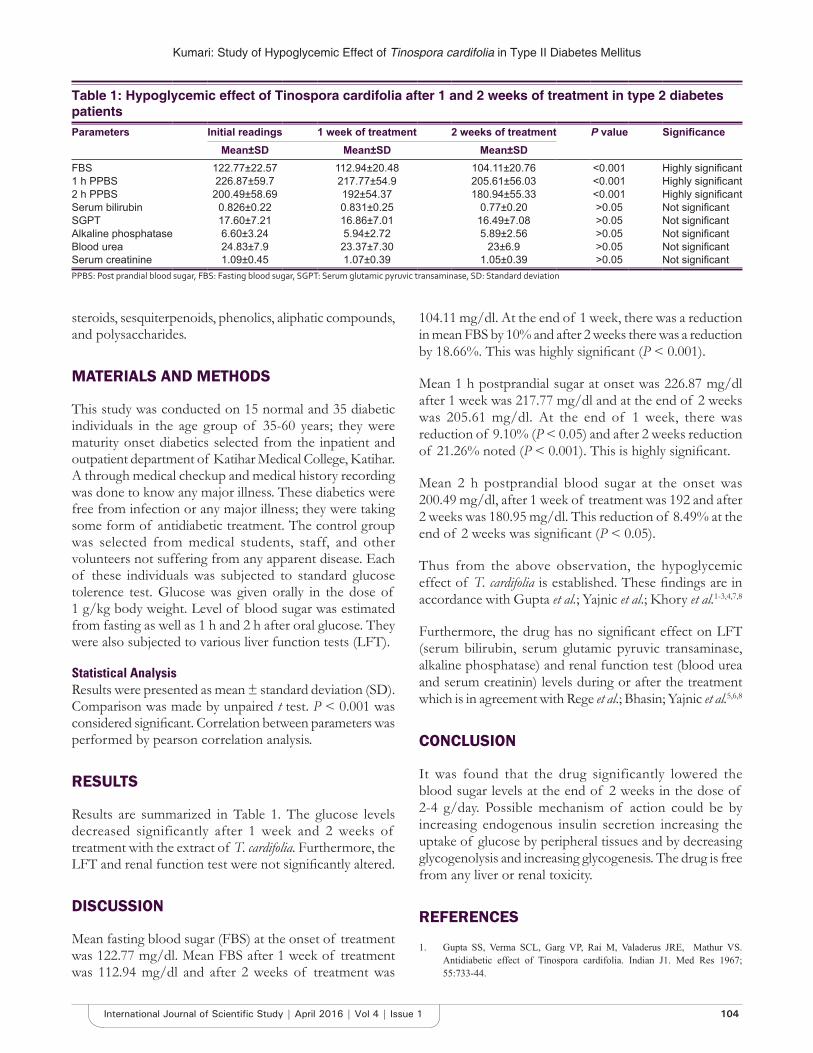
Kumari: Study of Hypoglycemic Effect of Tinospora cardifolia in Type II Diabetes Mellitus
104International Journal of Scientifi c Study | April 2016 | Vol 4 | Issue 1
steroids, sesquiterpenoids, phenolics, aliphatic compounds, and polysaccharides.
MATERIALS AND METHODS
This study was conducted on 15 normal and 35 diabetic individuals in the age group of 35-60 years; they were maturity onset diabetics selected from the inpatient and outpatient department of Katihar Medical College, Katihar. A through medical checkup and medical history recording was done to know any major illness. These diabetics were free from infection or any major illness; they were taking some form of antidiabetic treatment. The control group was selected from medical students, staff, and other volunteers not suffering from any apparent disease. Each of these individuals was subjected to standard glucose tolerence test. Glucose was given orally in the dose of 1 g/kg body weight. Level of blood sugar was estimated from fasting as well as 1 h and 2 h after oral glucose. They were also subjected to various liver function tests (LFT).
Statistical AnalysisResults were presented as mean ± standard deviation (SD). Comparison was made by unpaired t test. P < 0.001 was considered signifi cant. Correlation between parameters was performed by pearson correlation analysis.
RESULTS
Results are summarized in Table 1. The glucose levels decreased significantly after 1 week and 2 weeks of treatment with the extract of T. cardifolia. Furthermore, the LFT and renal function test were not signifi cantly altered.
DISCUSSION
Mean fasting blood sugar (FBS) at the onset of treatment was 122.77 mg/dl. Mean FBS after 1 week of treatment was 112.94 mg/dl and after 2 weeks of treatment was
104.11 mg/dl. At the end of 1 week, there was a reduction in mean FBS by 10% and after 2 weeks there was a reduction by 18.66%. This was highly signifi cant (P < 0.001).
Mean 1 h postprandial sugar at onset was 226.87 mg/dl after 1 week was 217.77 mg/dl and at the end of 2 weeks was 205.61 mg/dl. At the end of 1 week, there was reduction of 9.10% (P < 0.05) and after 2 weeks reduction of 21.26% noted (P < 0.001). This is highly signifi cant.
Mean 2 h postprandial blood sugar at the onset was 200.49 mg/dl, after 1 week of treatment was 192 and after 2 weeks was 180.95 mg/dl. This reduction of 8.49% at the end of 2 weeks was signifi cant (P < 0.05).
Thus from the above observation, the hypoglycemic effect of T. cardifolia is established. These fi ndings are in accordance with Gupta et al.; Yajnic et al.; Khory et al.1-3,4,7,8
Furthermore, the drug has no signifi cant effect on LFT (serum bilirubin, serum glutamic pyruvic transaminase, alkaline phosphatase) and renal function test (blood urea and serum creatinin) levels during or after the treatment which is in agreement with Rege et al.; Bhasin; Yajnic et al.5,6,8
CONCLUSION
It was found that the drug significantly lowered the blood sugar levels at the end of 2 weeks in the dose of 2-4 g/day. Possible mechanism of action could be by increasing endogenous insulin secretion increasing the uptake of glucose by peripheral tissues and by decreasing glycogenolysis and increasing glycogenesis. The drug is free from any liver or renal toxicity.
REFERENCES
1. Gupta SS, Verma SCL, Garg VP, Rai M, Valaderus JRE, Mathur VS. Antidiabetic effect of Tinospora cardifolia. Indian J1. Med Res 1967; 55:733-44.
Table 1: Hypoglycemic effect of Tinospora cardifolia after 1 and 2 weeks of treatment in type 2 diabetes patientsParameters Initial readings 1 week of treatment 2 weeks of treatment P value Signifi cance
Mean±SD Mean±SD Mean±SDFBS 122.77±22.57 112.94±20.48 104.11±20.76 <0.001 Highly signifi cant1 h PPBS 226.87±59.7 217.77±54.9 205.61±56.03 <0.001 Highly signifi cant2 h PPBS 200.49±58.69 192±54.37 180.94±55.33 <0.001 Highly signifi cantSerum bilirubin 0.826±0.22 0.831±0.25 0.77±0.20 >0.05 Not signifi cantSGPT 17.60±7.21 16.86±7.01 16.49±7.08 >0.05 Not signifi cantAlkaline phosphatase 6.60±3.24 5.94±2.72 5.89±2.56 >0.05 Not signifi cantBlood urea 24.83±7.9 23.37±7.30 23±6.9 >0.05 Not signifi cantSerum creatinine 1.09±0.45 1.07±0.39 1.05±0.39 >0.05 Not signifi cantPPBS: Post prandial blood sugar, FBS: Fasting blood sugar, SGPT: Serum glutamic pyruvic transaminase, SD: Standard deviation

Kumari: Study of Hypoglycemic Effect of Tinospora cardifolia in Type II Diabetes Mellitus
105 International Journal of Scientifi c Study | April 2016 | Vol 4 | Issue 1
2. Gupta SS, Verma SC, Gargh VP, Khandewal P. A few observation on anti-diabetic effect of Tinospora cardifolia and Casearia esculanta. Indian J Physiol Pharmacol 1965;9:9.
3. Rao RM, Salem FA, Gleason-Jordan I, Rao RM, Salem F, Gleason-Jordan I, et al. Anti-diabetic effects of dietary supplement “Pancreas tonic.” J Natl Med Assoc 1998;90:614-8.
4. Khory RN, Katrak NB. Materia Medica of India and thier Therapeutics. New Delhi: Komal Prakash; p. 31.
5. Bhasin RC. Clinical evaluation of “Septilin” in chronic bronchitis. Indian
Pract 1990;43:1, 83.6. Rege NN, Dahanukar SA, Karandikar SM. Hepatoprotective effect of
Tinospora cardifolia against CCl4 induced liver damage. Indian Drugs 1984;21:544-55.
7. Wealth of India. Tinospora cardifolia has 1/5th analgesic effect of sodium salicylate. Annual Report Indian Council of Medical Research, 1968-69.
8. Yajnic VH, Acharya HK, Vithlani MP, Yajnic NV, Shah MP, Verma SCL. Effi cacy and safety of D-400, in diabetic patients. Indian Pract 1993; XLVI:917-22.
How to cite this article: Kumari R. Hypoglycemic Effect of Tinospora cardifolia in Type II Diabetes Mellitus. Int J Sci Stud 2016;4(1):103-105.
Source of Support: Nil, Confl ict of Interest: None declared.
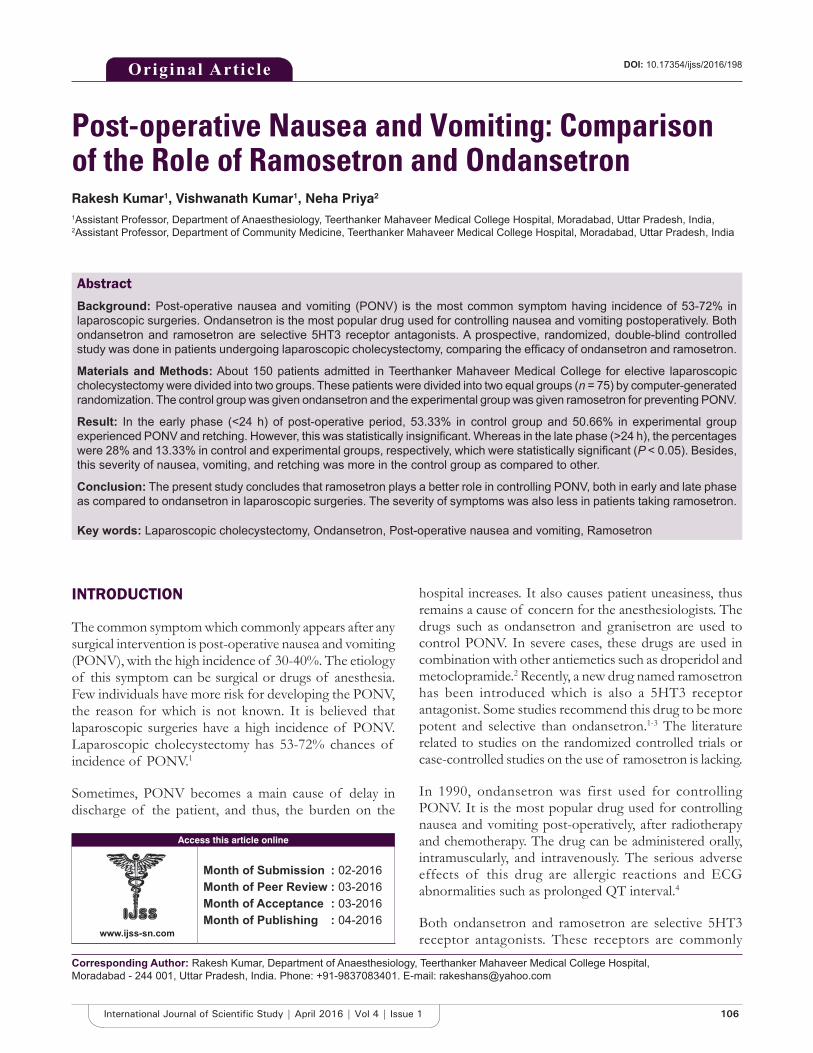
106International Journal of Scientifi c Study | April 2016 | Vol 4 | Issue 1
Post-operative Nausea and Vomiting: Comparison of the Role of Ramosetron and OndansetronRakesh Kumar1, Vishwanath Kumar1, Neha Priya2
1Assistant Professor, Department of Anaesthesiology, Teerthanker Mahaveer Medical College Hospital, Moradabad, Uttar Pradesh, India, 2Assistant Professor, Department of Community Medicine, Teerthanker Mahaveer Medical College Hospital, Moradabad, Uttar Pradesh, India
hospital increases. It also causes patient uneasiness, thus remains a cause of concern for the anesthesiologists. The drugs such as ondansetron and granisetron are used to control PONV. In severe cases, these drugs are used in combination with other antiemetics such as droperidol and metoclopramide.2 Recently, a new drug named ramosetron has been introduced which is also a 5HT3 receptor antagonist. Some studies recommend this drug to be more potent and selective than ondansetron.1-3 The literature related to studies on the randomized controlled trials or case-controlled studies on the use of ramosetron is lacking.
In 1990, ondansetron was first used for controlling PONV. It is the most popular drug used for controlling nausea and vomiting post-operatively, after radiotherapy and chemotherapy. The drug can be administered orally, intramuscularly, and intravenously. The serious adverse effects of this drug are allergic reactions and ECG abnormalities such as prolonged QT interval.4
Both ondansetron and ramosetron are selective 5HT3 receptor antagonists. These receptors are commonly
INTRODUCTION
The common symptom which commonly appears after any surgical intervention is post-operative nausea and vomiting (PONV), with the high incidence of 30-40%. The etiology of this symptom can be surgical or drugs of anesthesia. Few individuals have more risk for developing the PONV, the reason for which is not known. It is believed that laparoscopic surgeries have a high incidence of PONV. Laparoscopic cholecystectomy has 53-72% chances of incidence of PONV.1
Sometimes, PONV becomes a main cause of delay in discharge of the patient, and thus, the burden on the
Original Article
Abstract
Background: Post-operative nausea and vomiting (PONV) is the most common symptom having incidence of 53-72% in laparoscopic surgeries. Ondansetron is the most popular drug used for controlling nausea and vomiting postoperatively. Both ondansetron and ramosetron are selective 5HT3 receptor antagonists. A prospective, randomized, double-blind controlled study was done in patients undergoing laparoscopic cholecystectomy, comparing the effi cacy of ondansetron and ramosetron.
Materials and Methods: About 150 patients admitted in Teerthanker Mahaveer Medical College for elective laparoscopic cholecystectomy were divided into two groups. These patients were divided into two equal groups (n = 75) by computer-generated randomization. The control group was given ondansetron and the experimental group was given ramosetron for preventing PONV.
Result: In the early phase (<24 h) of post-operative period, 53.33% in control group and 50.66% in experimental group experienced PONV and retching. However, this was statistically insignifi cant. Whereas in the late phase (>24 h), the percentages were 28% and 13.33% in control and experimental groups, respectively, which were statistically signifi cant (P < 0.05). Besides, this severity of nausea, vomiting, and retching was more in the control group as compared to other.
Conclusion: The present study concludes that ramosetron plays a better role in controlling PONV, both in early and late phase as compared to ondansetron in laparoscopic surgeries. The severity of symptoms was also less in patients taking ramosetron.
Key words: Laparoscopic cholecystectomy, Ondansetron, Post-operative nausea and vomiting, Ramosetron
Access this article online
www.ijss-sn.com
Month of Submission : 02-2016Month of Peer Review : 03-2016Month of Acceptance : 03-2016Month of Publishing : 04-2016
Corresponding Author: Rakesh Kumar, Department of Anaesthesiology, Teerthanker Mahaveer Medical College Hospital, Moradabad - 244 001, Uttar Pradesh, India. Phone: +91-9837083401. E-mail: [email protected]
DOI: 10.17354/ijss/2016/198
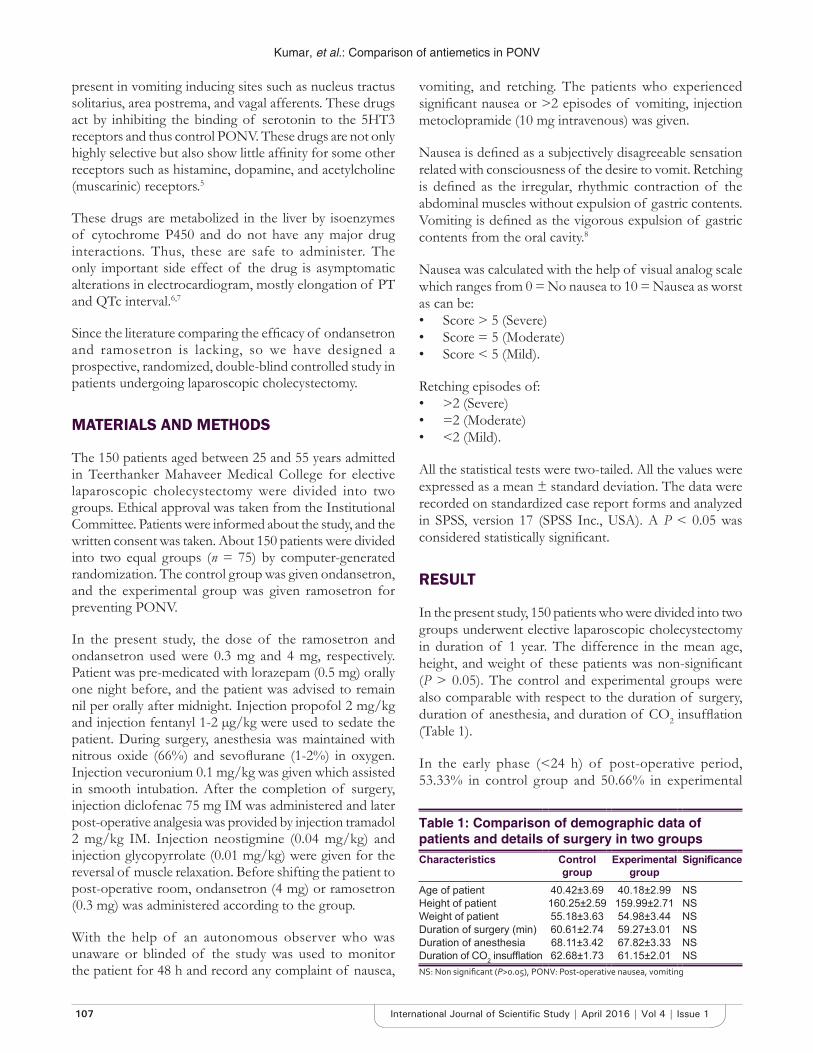
Kumar, et al.: Comparison of antiemetics in PONV
107 International Journal of Scientifi c Study | April 2016 | Vol 4 | Issue 1
present in vomiting inducing sites such as nucleus tractus solitarius, area postrema, and vagal afferents. These drugs act by inhibiting the binding of serotonin to the 5HT3 receptors and thus control PONV. These drugs are not only highly selective but also show little affi nity for some other receptors such as histamine, dopamine, and acetylcholine (muscarinic) receptors.5
These drugs are metabolized in the liver by isoenzymes of cytochrome P450 and do not have any major drug interactions. Thus, these are safe to administer. The only important side effect of the drug is asymptomatic alterations in electrocardiogram, mostly elongation of PT and QTc interval.6,7
Since the literature comparing the effi cacy of ondansetron and ramosetron is lacking, so we have designed a prospective, randomized, double-blind controlled study in patients undergoing laparoscopic cholecystectomy.
MATERIALS AND METHODS
The 150 patients aged between 25 and 55 years admitted in Teerthanker Mahaveer Medical College for elective laparoscopic cholecystectomy were divided into two groups. Ethical approval was taken from the Institutional Committee. Patients were informed about the study, and the written consent was taken. About 150 patients were divided into two equal groups (n = 75) by computer-generated randomization. The control group was given ondansetron, and the experimental group was given ramosetron for preventing PONV.
In the present study, the dose of the ramosetron and ondansetron used were 0.3 mg and 4 mg, respectively. Patient was pre-medicated with lorazepam (0.5 mg) orally one night before, and the patient was advised to remain nil per orally after midnight. Injection propofol 2 mg/kg and injection fentanyl 1-2 μg/kg were used to sedate the patient. During surgery, anesthesia was maintained with nitrous oxide (66%) and sevofl urane (1-2%) in oxygen. Injection vecuronium 0.1 mg/kg was given which assisted in smooth intubation. After the completion of surgery, injection diclofenac 75 mg IM was administered and later post-operative analgesia was provided by injection tramadol 2 mg/kg IM. Injection neostigmine (0.04 mg/kg) and injection glycopyrrolate (0.01 mg/kg) were given for the reversal of muscle relaxation. Before shifting the patient to post-operative room, ondansetron (4 mg) or ramosetron (0.3 mg) was administered according to the group.
With the help of an autonomous observer who was unaware or blinded of the study was used to monitor the patient for 48 h and record any complaint of nausea,
vomiting, and retching. The patients who experienced signifi cant nausea or >2 episodes of vomiting, injection metoclopramide (10 mg intravenous) was given.
Nausea is defi ned as a subjectively disagreeable sensation related with consciousness of the desire to vomit. Retching is defi ned as the irregular, rhythmic contraction of the abdominal muscles without expulsion of gastric contents. Vomiting is defi ned as the vigorous expulsion of gastric contents from the oral cavity.8
Nausea was calculated with the help of visual analog scale which ranges from 0 = No nausea to 10 = Nausea as worst as can be:• Score > 5 (Severe)• Score = 5 (Moderate)• Score < 5 (Mild).
Retching episodes of:• >2 (Severe)• =2 (Moderate)• <2 (Mild).
All the statistical tests were two-tailed. All the values were expressed as a mean ± standard deviation. The data were recorded on standardized case report forms and analyzed in SPSS, version 17 (SPSS Inc., USA). A P < 0.05 was considered statistically signifi cant.
RESULT
In the present study, 150 patients who were divided into two groups underwent elective laparoscopic cholecystectomy in duration of 1 year. The difference in the mean age, height, and weight of these patients was non-signifi cant (P > 0.05). The control and experimental groups were also comparable with respect to the duration of surgery, duration of anesthesia, and duration of CO2 insuffl ation (Table 1).
In the early phase (<24 h) of post-operative period, 53.33% in control group and 50.66% in experimental
Table 1: Comparison of demographic data of patients and details of surgery in two groupsCharacteristics Control
groupExperimental
groupSignifi cance
Age of patient 40.42±3.69 40.18±2.99 NSHeight of patient 160.25±2.59 159.99±2.71 NSWeight of patient 55.18±3.63 54.98±3.44 NSDuration of surgery (min) 60.61±2.74 59.27±3.01 NSDuration of anesthesia 68.11±3.42 67.82±3.33 NSDuration of CO2 insuffl ation 62.68±1.73 61.15±2.01 NSNS: Non signifi cant (P>0.05), PONV: Post-operative nausea, vomiting

Kumar, et al.: Comparison of antiemetics in PONV
108International Journal of Scientifi c Study | April 2016 | Vol 4 | Issue 1
group experienced PONV and retching. However, this was statistically insignifi cant. Whereas in the late phase (>24 h), the percentages were 28% and 13.33% in control and experimental groups, respectively, which were statistically signifi cant (P < 0.05) (Table 2 and Figure 1).
Severity ratings of nausea, vomiting, and retching observed in patients of the two groups are detailed in Tables 3 and 4; Figure 2.
DISCUSSION
Any surgical intervention can be followed by PONV, but it is found in more than 50% of the patients undergoing laparoscopic surgery. The most important pathway for PONV is the signals received from cerebrum, receptors of viscera, and chemoreceptor trigger zone (CTZ). Besides, this in laparoscopic surgeries, the CO2 insuffl ation also causes peritoneal distension which irritates the neurogenic pathway resulting in PONV.9
Various drugs such as anticholinergics, antiserotonins, benzamides, and dexamethasone have been used as prophylaxis or treatment of PONV. However, these drugs are associated with adverse effects such as low blood pressure, dryness in oral cavity, dizziness, and extrapyramidal symptoms. 5HT3 receptor antagonists are considered as drug of choice for PONV, and they
Table 2: Comparison of the incidence of PONV and retching in two groupsPONV and retching
Early phase (<24 h) Late phase (>24 h)Control Experimental P value Control Experimental P value
Present 40 38 >0.05 21 10 <0.05Absent 35 37 >0.05 54 65 <0.05P<0.05 - signifi cant, PONV: Post-operative nausea, vomiting
Table 3: Comparison of severity of nausea in two groupsPost-operative nausea
Early phase (<24 h) Late phase (>24 h)Control Experimental P value Control Experimental P value
Absent 35 37 >0.05 54 65 <0.05Mild 11 19 <0.05 10 7 >0.05Moderate 19 13 <0.05 6 2 <0.05Severe 10 6 >0.05 5 1 <0.05P<0.05 - signifi cant
Table 4: Comparison of severity of retching in two groupsPost-operative retching
Early phase (<24 h) Late phase (>24 h)Control Experimental P value Control Experimental P value
Absent 32 41 <0.05 39 53 <0.05Mild 13 12 >0.05 17 10 <0.05Moderate 18 10 <0.05 11 7 <0.05Severe 12 12 >0.05 8 5 >0.05
0
5
10
15
20
25
30
35
40
Control Experimental
Early
Late
Figure 1: Presence of post-operative nausea and vomiting in early and late phase in both the groups
0 10 20 30 40 50 60
Absent
<2
2 to 5
>5
Experimental
Control
Figure 2: Comparison of number of episodes of vomiting in two groups

Kumar, et al.: Comparison of antiemetics in PONV
109 International Journal of Scientifi c Study | April 2016 | Vol 4 | Issue 1
act by inhibiting CTZ and the vagal afferents in the gastrointestinal tract.7,10
Keeping the demographic profi le of the patients and conditions of surgery similar, the comparative study was done to observe the effect of ondansetron and ramosetron on PONV. Besides this, the side effects of these drugs were also studied and compared.
In the early phase of the post-operative period, no statistically signifi cant difference was found in effi cacy and side effects of the drugs (Tables 2-5). However, in the late phase of post-operative period, the statistically signifi cant difference was seen in the effi cacy of the two drugs. Similar fi ndings were present in the study of Rajeeva et al.,11 who also stated signifi cantly lower frequency of PONV in the ramosetron group when compared to the ondansetron group in the patients after laparoscopic cholecystectomy.
In this study, we also noted the incidence of adverse drug effects in both the groups. These effects were mild and momentary in nature and were statistically insignifi cant in between ramosetron and ondansetron groups. These fi ndings are supported by Fujii et al.12 in his study.
Some researchers9-13 believe that use of nitrous oxide during surgery also plays an emetogenic role. Ignoring nitrous oxide and using a continuous infusion of a short-acting opioid might have been a better choice, so the use of nitrous oxide is now controversial. Certain studies14-16 advocate the use of a combination of drugs in controlling PONV, especially in the patients who are more prone to develop it. Besides this, addition of dexamethasone to the newer 5HT3 receptor antagonists has been reported more effi cacious in patients undergoing laparoscopic cholecystectomy.
The only limitation of our study was that we did not include a placebo group, as this is unethical to expose the patient to distressing symptoms of post-operative period.
CONCLUSION
The present study concludes that ramosetron plays a better role in controlling PONV, both in early and late phase as compared to ondansetron in laparoscopic surgeries. The severity of symptoms was also less in patients taking ramosetron. Besides this, both the drugs cause lesser side effect s.
REFERENCES
1. Taylor E, Feinstein R, White PF, Soper N. Anesthesia for laparoscopic cholecystectomy. Is nitrous oxide contraindicated? Anesthesiology 1992;76:541-3.
2. Macario A, Weinger M, Carney S, Kim A. Which clinical anesthesia outcomes are important to avoid? The perspective of patients. Anesth Analg 1999;89:652-8.
3. Habib AS, Gan TJ. Evidence-based management of postoperative nausea and vomiting: A review. Can J Anaesth 2004;51:326-41.
4. Naguib M, el Bakry AK, Khoshim MH, Channa AB, el Gammal M, el Gammal K, et al. Prophylactic antiemetic therapy with ondansetron, tropisetron, granisetron and metoclopramide in patients undergoing laparoscopic cholecystectomy: A randomized, double-blind comparison with placebo. Can J Anaesth 1996;43:226-31.
5. Rabasseda X. Ramosetron, a 5-HT3 receptor antagonist for the control of nausea and vomiting. Drugs Today (Barc) 2002;38:75-89.
6. Cohen MM, Duncan PG, DeBoer DP, Tweed WA. The postoperative interview: Assessing risk factors for nausea and vomiting. Anesth Analg 1994;78:7-16.
7. Sinclair DR, Chung F, Mezei G. Can postoperative nausea and vomiting be predicted? Anesthesiology 1999;91:109-18.
8. Camu F, Lauwers MH, Verbessem D. Incidence and aetiology of postoperative nausea and vomiting. Eur J Anaesthesiol Suppl 1992;6:25-31.
9. Apfel CC, Läärä E, Koivuranta M, Greim CA, Roewer N. A simplifi ed risk score for predicting postoperative nausea and vomiting: Conclusions from cross-validations between two centers. Anesthesiology 1999;91:693-700.
10. Tang J, Wang B, White PF, Watcha MF, Qi J, Wender RH. The effect of timing of ondansetron administration on its effi cacy, cost-effectiveness, and cost-benefi t as a prophylactic antiemetic in the ambulatory setting. Anesth Analg 1998;86:274-82.
11. Rajeeva V, Bhardwaj N, Batra YK, Dhaliwal LK. Comparison of ondansetron with ondansetron and dexamethasone in prevention of PONV in diagnostic laparoscopy. Can J Anaesth 1999;46:40-4.
12. Fujii Y, Uemura A, Tanaka H. Prophylaxis of nausea and vomiting after laparoscopic cholecystectomy with ramosetron: Randomised controlled trial. Eur J Surg 2002;168:583-6.
13. Watcha MF, White PF. Postoperative nausea and vomiting. Its etiology, treatment, and prevention. Anesthesiology 1992;77:162-84.
14. McCracken G, Houston P, Lefebvre G; Society of Obstetricians and Gynecologists of Canada. Guideline for the management of postoperative nausea and vomiting. J Obstet Gynaecol Can 2008;30:600-16.
15. Ryu J, So YM, Hwang J, Do SH. Ramosetron versus ondansetron for the prevention of postoperative nausea and vomiting after laparoscopic cholecystectomy. Surg Endosc 2010;24:812-7.
16. Kawabata Y, Sakiyama H, Muto S. Clinical evaluation and pharmacokinetics of ramosetron against the nausea and vomiting induced by anticancer drugs. Nishinihon J Urol 1994;56:1445-56.
Table 5: The comparison of adverse effects of the drugs in two groupsSide effect Control
group (%)Experimental
group (%)P value
Sedation 5 (6.6) 2 (2.6) NSHeadache 3 (4) 1 (1.3) NSWeakness 2 (2.6) 1 (1.3) NSDyspepsia 3 (4) 1 (1.3) NSDryness in oral cavity 0 (0) 0 (0) -NS: Nonsignifi cant
How to cite this article: Kumar R, Kumar V, Priya N . Post-operative Nausea and Vomiting: Comparison of the Role of Ramosetron and Ondansetron. Int J Sci Stud 2016;4(1):106-109.
Source of Support: Nil, Confl ict of Interest: None declared.
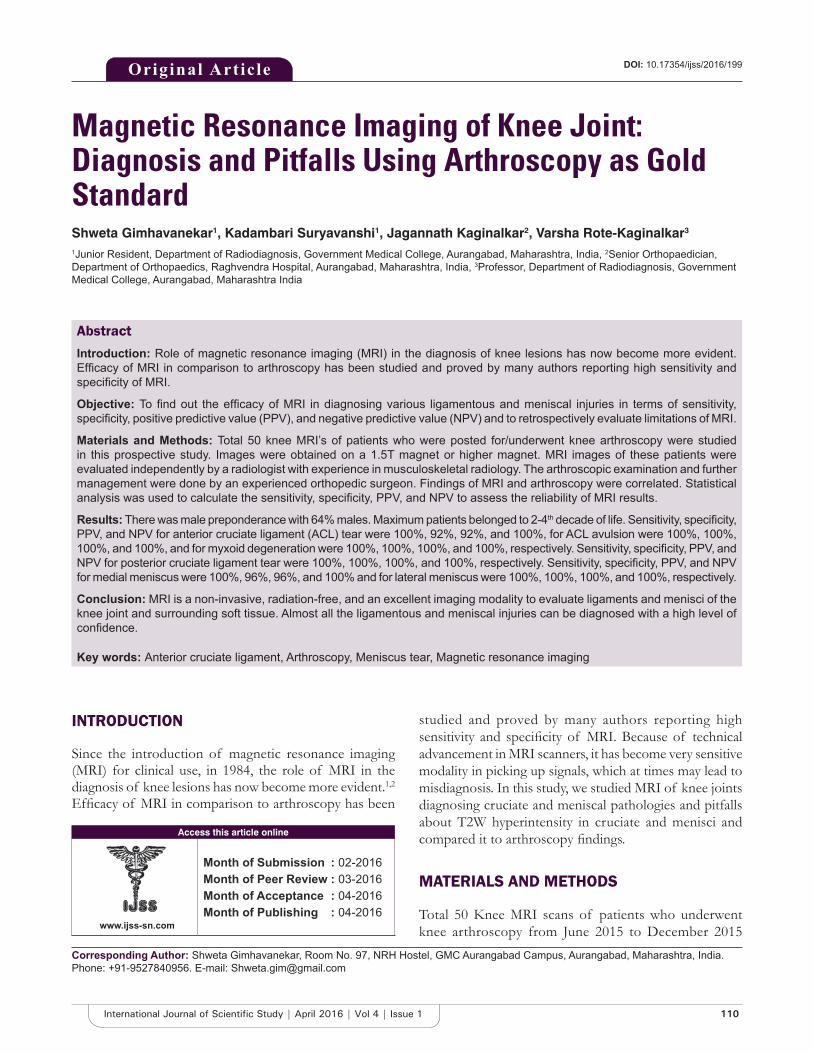
110International Journal of Scientifi c Study | April 2016 | Vol 4 | Issue 1
Magnetic Resonance Imaging of Knee Joint: Diagnosis and Pitfalls Using Arthroscopy as Gold StandardShweta Gimhavanekar1, Kadambari Suryavanshi1, Jagannath Kaginalkar2, Varsha Rote-Kaginalkar3
1Junior Resident, Department of Radiodiagnosis, Government Medical College, Aurangabad, Maharashtra, India, 2Senior Orthopaedician, Department of Orthopaedics, Raghvendra Hospital, Aurangabad, Maharashtra, India, 3Professor, Department of Radiodiagnosis, Government Medical College, Aurangabad, Maharashtra India
studied and proved by many authors reporting high sensitivity and specifi city of MRI. Because of technical advancement in MRI scanners, it has become very sensitive modality in picking up signals, which at times may lead to misdiagnosis. In this study, we studied MRI of knee joints diagnosing cruciate and meniscal pathologies and pitfalls about T2W hyperintensity in cruciate and menisci and compared it to arthroscopy fi ndings.
MATERIALS AND METHODS
Total 50 Knee MRI scans of patients who underwent knee arthroscopy from June 2015 to December 2015
INTRODUCTION
Since the introduction of magnetic resonance imaging (MRI) for clinical use, in 1984, the role of MRI in the diagnosis of knee lesions has now become more evident.1,2 Effi cacy of MRI in comparison to arthroscopy has been
Original Article
Abstract
Introduction: Role of magnetic resonance imaging (MRI) in the diagnosis of knee lesions has now become more evident. Effi cacy of MRI in comparison to arthroscopy has been studied and proved by many authors reporting high sensitivity and specifi city of MRI.
Objective: To fi nd out the effi cacy of MRI in diagnosing various ligamentous and meniscal injuries in terms of sensitivity, specifi city, positive predictive value (PPV), and negative predictive value (NPV) and to retrospectively evaluate limitations of MRI.
Materials and Methods: Total 50 knee MRI’s of patients who were posted for/underwent knee arthroscopy were studied in this prospective study. Images were obtained on a 1.5T magnet or higher magnet. MRI images of these patients were evaluated independently by a radiologist with experience in musculoskeletal radiology. The arthroscopic examination and further management were done by an experienced orthopedic surgeon. Findings of MRI and arthroscopy were correlated. Statistical analysis was used to calculate the sensitivity, specifi city, PPV, and NPV to assess the reliability of MRI results.
Results: There was male preponderance with 64% males. Maximum patients belonged to 2-4th decade of life. Sensitivity, specifi city, PPV, and NPV for anterior cruciate ligament (ACL) tear were 100%, 92%, 92%, and 100%, for ACL avulsion were 100%, 100%, 100%, and 100%, and for myxoid degeneration were 100%, 100%, 100%, and 100%, respectively. Sensitivity, specifi city, PPV, and NPV for posterior cruciate ligament tear were 100%, 100%, 100%, and 100%, respectively. Sensitivity, specifi city, PPV, and NPV for medial meniscus were 100%, 96%, 96%, and 100% and for lateral meniscus were 100%, 100%, 100%, and 100%, respectively.
Conclusion: MRI is a non-invasive, radiation-free, and an excellent imaging modality to evaluate ligaments and menisci of the knee joint and surrounding soft tissue. Almost all the ligamentous and meniscal injuries can be diagnosed with a high level of confi dence.
Key words: Anterior cruciate ligament, Arthroscopy, Meniscus tear, Magnetic resonance imaging
Access this article online
www.ijss-sn.com
Month of Submission : 02-2016Month of Peer Review : 03-2016Month of Acceptance : 04-2016Month of Publishing : 04-2016
Corresponding Author: Shweta Gimhavanekar, Room No. 97, NRH Hostel, GMC Aurangabad Campus, Aurangabad, Maharashtra, India. Phone: +91-9527840956. E-mail: [email protected]
DOI: 10.17354/ijss/2016/199
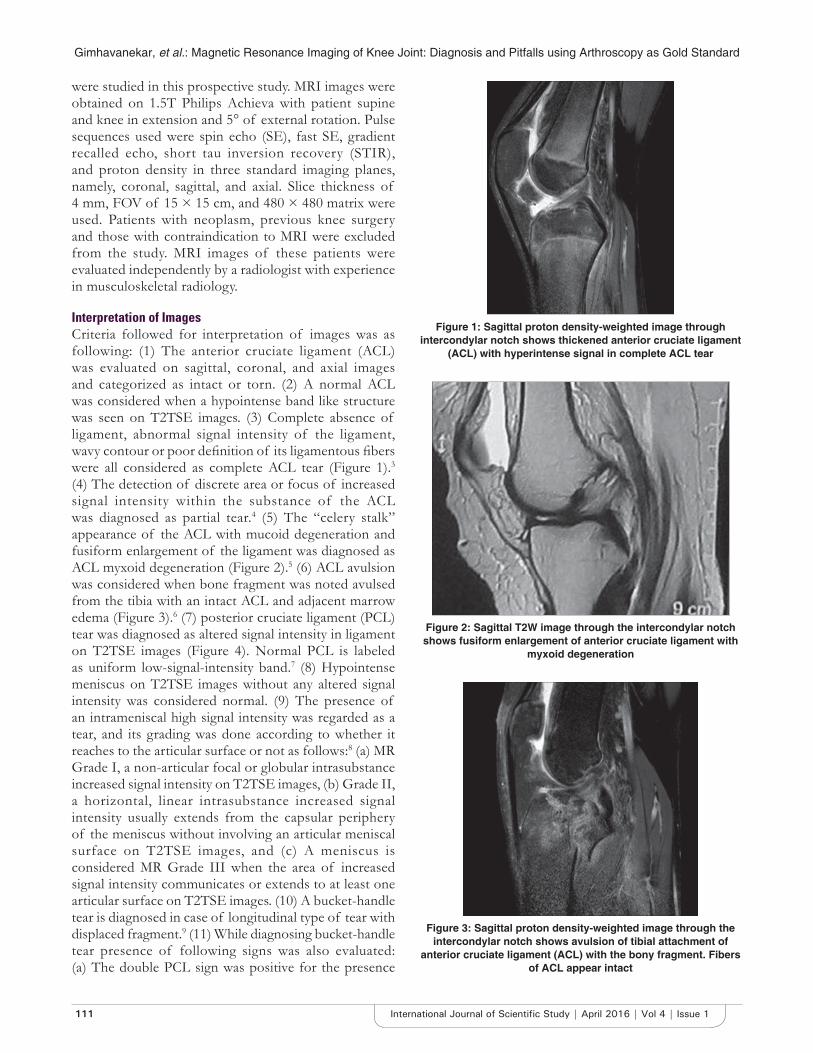
Gimhavanekar, et al.: Magnetic Resonance Imaging of Knee Joint: Diagnosis and Pitfalls using Arthroscopy as Gold Standard
111 International Journal of Scientifi c Study | April 2016 | Vol 4 | Issue 1
were studied in this prospective study. MRI images were obtained on 1.5T Philips Achieva with patient supine and knee in extension and 5° of external rotation. Pulse sequences used were spin echo (SE), fast SE, gradient recalled echo, short tau inversion recovery (STIR), and proton density in three standard imaging planes, namely, coronal, sagittal, and axial. Slice thickness of 4 mm, FOV of 15 × 15 cm, and 480 × 480 matrix were used. Patients with neoplasm, previous knee surgery and those with contraindication to MRI were excluded from the study. MRI images of these patients were evaluated independently by a radiologist with experience in musculoskeletal radiology.
Interpretation of ImagesCriteria followed for interpretation of images was as following: (1) The anterior cruciate ligament (ACL) was evaluated on sagittal, coronal, and axial images and categorized as intact or torn. (2) A normal ACL was considered when a hypointense band like structure was seen on T2TSE images. (3) Complete absence of ligament, abnormal signal intensity of the ligament, wavy contour or poor defi nition of its ligamentous fi bers were all considered as complete ACL tear (Figure 1).3 (4) The detection of discrete area or focus of increased signal intensity within the substance of the ACL was diagnosed as partial tear.4 (5) The “celery stalk” appearance of the ACL with mucoid degeneration and fusiform enlargement of the ligament was diagnosed as ACL myxoid degeneration (Figure 2).5 (6) ACL avulsion was considered when bone fragment was noted avulsed from the tibia with an intact ACL and adjacent marrow edema (Figure 3).6 (7) posterior cruciate ligament (PCL) tear was diagnosed as altered signal intensity in ligament on T2TSE images (Figure 4). Normal PCL is labeled as uniform low-signal-intensity band.7 (8) Hypointense meniscus on T2TSE images without any altered signal intensity was considered normal. (9) The presence of an intrameniscal high signal intensity was regarded as a tear, and its grading was done according to whether it reaches to the articular surface or not as follows:8 (a) MR Grade I, a non-articular focal or globular intrasubstance increased signal intensity on T2TSE images, (b) Grade II, a horizontal, linear intrasubstance increased signal intensity usually extends from the capsular periphery of the meniscus without involving an articular meniscal surface on T2TSE images, and (c) A meniscus is considered MR Grade III when the area of increased signal intensity communicates or extends to at least one articular surface on T2TSE images. (10) A bucket-handle tear is diagnosed in case of longitudinal type of tear with displaced fragment.9 (11) While diagnosing bucket-handle tear presence of following signs was also evaluated: (a) The double PCL sign was positive for the presence
Figure 1: Sagittal proton density-weighted image through intercondylar notch shows thickened anterior cruciate ligament
(ACL) with hyperintense signal in complete ACL tear
Figure 2: Sagittal T2W image through the intercondylar notch shows fusiform enlargement of anterior cruciate ligament with
myxoid degeneration
Figure 3: Sagittal proton density-weighted image through the intercondylar notch shows avulsion of tibial attachment of
anterior cruciate ligament (ACL) with the bony fragment. Fibers of ACL appear intact
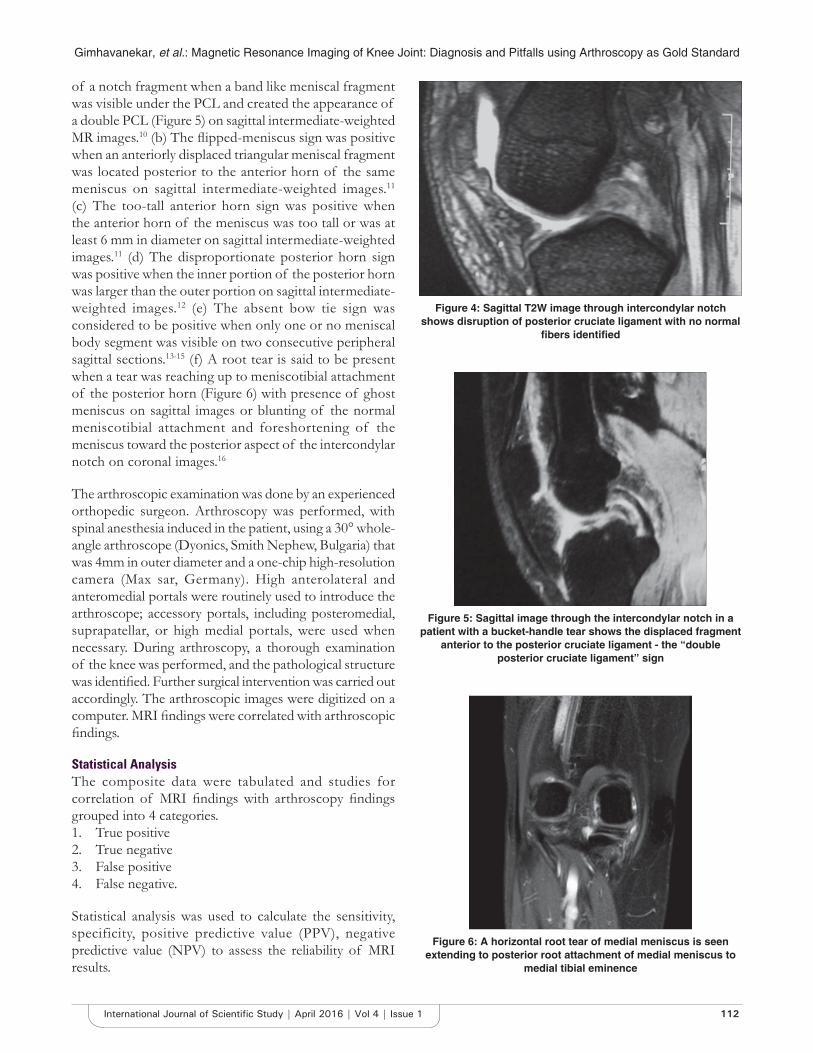
Gimhavanekar, et al.: Magnetic Resonance Imaging of Knee Joint: Diagnosis and Pitfalls using Arthroscopy as Gold Standard
112International Journal of Scientifi c Study | April 2016 | Vol 4 | Issue 1
of a notch fragment when a band like meniscal fragment was visible under the PCL and created the appearance of a double PCL (Figure 5) on sagittal intermediate-weighted MR images.10 (b) The fl ipped-meniscus sign was positive when an anteriorly displaced triangular meniscal fragment was located posterior to the anterior horn of the same meniscus on sagittal intermediate-weighted images.11 (c) The too-tall anterior horn sign was positive when the anterior horn of the meniscus was too tall or was at least 6 mm in diameter on sagittal intermediate-weighted images.11 (d) The disproportionate posterior horn sign was positive when the inner portion of the posterior horn was larger than the outer portion on sagittal intermediate-weighted images.12 (e) The absent bow tie sign was considered to be positive when only one or no meniscal body segment was visible on two consecutive peripheral sagittal sections.13-15 (f) A root tear is said to be present when a tear was reaching up to meniscotibial attachment of the posterior horn (Figure 6) with presence of ghost meniscus on sagittal images or blunting of the normal meniscotibial attachment and foreshortening of the meniscus toward the posterior aspect of the intercondylar notch on coronal images.16
The arthroscopic examination was done by an experienced orthopedic surgeon. Arthroscopy was performed, with spinal anesthesia induced in the patient, using a 30° whole-angle arthroscope (Dyonics, Smith Nephew, Bulgaria) that was 4mm in outer diameter and a one-chip high-resolution camera (Max sar, Germany). High anterolateral and anteromedial portals were routinely used to introduce the arthroscope; accessory portals, including posteromedial, suprapatellar, or high medial portals, were used when necessary. During arthroscopy, a thorough examination of the knee was performed, and the pathological structure was identifi ed. Further surgical intervention was carried out accordingly. The arthroscopic images were digitized on a computer. MRI fi ndings were correlated with arthroscopic fi ndings.
Statistical AnalysisThe composite data were tabulated and studies for correlation of MRI fi ndings with arthroscopy fi ndings grouped into 4 categories.1. True positive2. True negative3. False positive4. False negative.
Statistical analysis was used to calculate the sensitivity, specificity, positive predictive value (PPV), negative predictive value (NPV) to assess the reliability of MRI results.
Figure 4: Sagittal T2W image through intercondylar notch shows disruption of posterior cruciate ligament with no normal
fi bers identifi ed
Figure 5: Sagittal image through the intercondylar notch in a patient with a bucket-handle tear shows the displaced fragment
anterior to the posterior cruciate ligament - the “double posterior cruciate ligament” sign
Figure 6: A horizontal root tear of medial meniscus is seen extending to posterior root attachment of medial meniscus to
medial tibial eminence
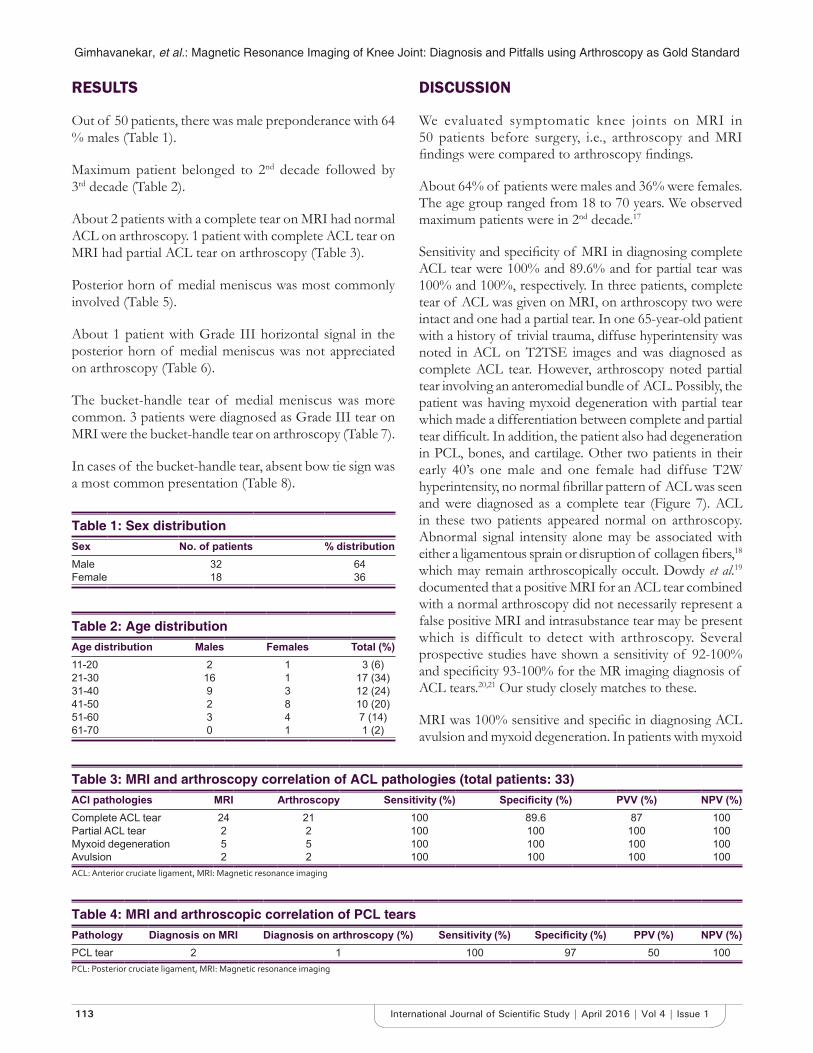
Gimhavanekar, et al.: Magnetic Resonance Imaging of Knee Joint: Diagnosis and Pitfalls using Arthroscopy as Gold Standard
113 International Journal of Scientifi c Study | April 2016 | Vol 4 | Issue 1
RESULTS
Out of 50 patients, there was male preponderance with 64 % males (Table 1).
Maximum patient belonged to 2nd decade followed by 3rd decade (Table 2).
About 2 patients with a complete tear on MRI had normal ACL on arthroscopy. 1 patient with complete ACL tear on MRI had partial ACL tear on arthroscopy (Table 3).
Posterior horn of medial meniscus was most commonly involved (Table 5).
About 1 patient with Grade III horizontal signal in the posterior horn of medial meniscus was not appreciated on arthroscopy (Table 6).
The bucket-handle tear of medial meniscus was more common. 3 patients were diagnosed as Grade III tear on MRI were the bucket-handle tear on arthroscopy (Table 7).
In cases of the bucket-handle tear, absent bow tie sign was a most common presentation (Table 8).
DISCUSSION
We evaluated symptomatic knee joints on MRI in 50 patients before surgery, i.e., arthroscopy and MRI fi ndings were compared to arthroscopy fi ndings.
About 64% of patients were males and 36% were females. The age group ranged from 18 to 70 years. We observed maximum patients were in 2nd decade.17
Sensitivity and specifi city of MRI in diagnosing complete ACL tear were 100% and 89.6% and for partial tear was 100% and 100%, respectively. In three patients, complete tear of ACL was given on MRI, on arthroscopy two were intact and one had a partial tear. In one 65-year-old patient with a history of trivial trauma, diffuse hyperintensity was noted in ACL on T2TSE images and was diagnosed as complete ACL tear. However, arthroscopy noted partial tear involving an anteromedial bundle of ACL. Possibly, the patient was having myxoid degeneration with partial tear which made a differentiation between complete and partial tear diffi cult. In addition, the patient also had degeneration in PCL, bones, and cartilage. Other two patients in their early 40’s one male and one female had diffuse T2W hyperintensity, no normal fi brillar pattern of ACL was seen and were diagnosed as a complete tear (Figure 7). ACL in these two patients appeared normal on arthroscopy. Abnormal signal intensity alone may be associated with either a ligamentous sprain or disruption of collagen fi bers,18 which may remain arthroscopically occult. Dowdy et al. 19 documented that a positive MRI for an ACL tear combined with a normal arthroscopy did not necessarily represent a false positive MRI and intrasubstance tear may be present which is difficult to detect with arthroscopy. Several prospective studies have shown a sensitivity of 92-100% and specifi city 93-100% for the MR imaging diagnosis of ACL tears.20,21 Our study closely matches to these.
MRI was 100% sensitive and specifi c in diagnosing ACL avulsion and myxoid degeneration. In patients with myxoid
Table 1: Sex distributionSex No. of patients % distributionMale 32 64Female 18 36
Table 2: Age distributionAge distribution Males Females Total (%)11-20 2 1 3 (6)21-30 16 1 17 (34)31-40 9 3 12 (24)41-50 2 8 10 (20)51-60 3 4 7 (14)61-70 0 1 1 (2)
Table 3: MRI and arthroscopy correlation of ACL pathologies (total patients: 33)ACl pathologies MRI Arthroscopy Sensitivity (%) Specifi city (%) PVV (%) NPV (%)Complete ACL tear 24 21 100 89.6 87 100Partial ACL tear 2 2 100 100 100 100Myxoid degeneration 5 5 100 100 100 100Avulsion 2 2 100 100 100 100ACL: Anterior cruciate ligament, MRI: Magnetic resonance imaging
Table 4: MRI and arthroscopic correlation of PCL tearsPathology Diagnosis on MRI Diagnosis on arthroscopy (%) Sensitivity (%) Specifi city (%) PPV (%) NPV (%)PCL tear 2 1 100 97 50 100PCL: Posterior cruciate ligament, MRI: Magnetic resonance imaging
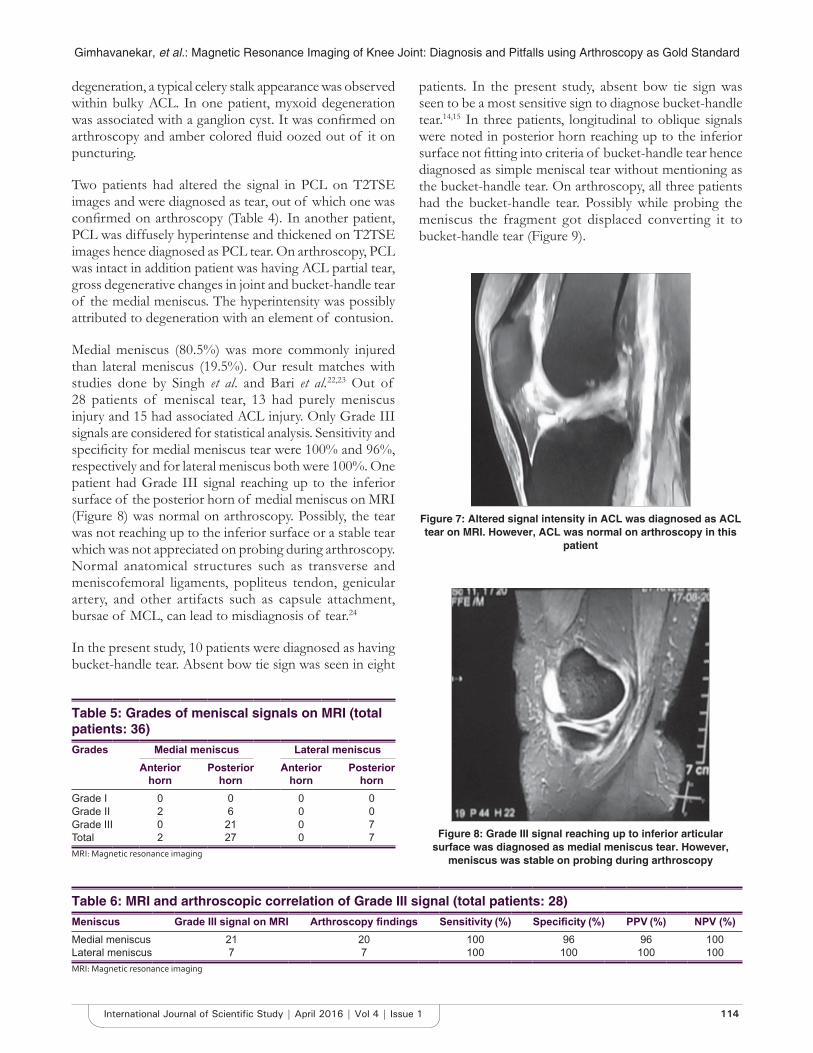
Gimhavanekar, et al.: Magnetic Resonance Imaging of Knee Joint: Diagnosis and Pitfalls using Arthroscopy as Gold Standard
114International Journal of Scientifi c Study | April 2016 | Vol 4 | Issue 1
degeneration, a typical celery stalk appearance was observed within bulky ACL. In one patient, myxoid degeneration was associated with a ganglion cyst. It was confi rmed on arthroscopy and amber colored fl uid oozed out of it on puncturing.
Two patients had altered the signal in PCL on T2TSE images and were diagnosed as tear, out of which one was confi rmed on arthroscopy (Table 4). In another patient, PCL was diffusely hyperintense and thickened on T2TSE images hence diagnosed as PCL tear. On arthroscopy, PCL was intact in addition patient was having ACL partial tear, gross degenerative changes in joint and bucket-handle tear of the medial meniscus. The hyperintensity was possibly attributed to degeneration with an element of contusion.
Medial meniscus (80.5%) was more commonly injured than lateral meniscus (19.5%). Our result matches with studies done by Singh et al. and Bari et al.22,23 Out of 28 patients of meniscal tear, 13 had purely meniscus injury and 15 had associated ACL injury. Only Grade III signals are considered for statistical analysis. Sensitivity and specifi city for medial meniscus tear were 100% and 96%, respectively and for lateral meniscus both were 100%. One patient had Grade III signal reaching up to the inferior surface of the posterior horn of medial meniscus on MRI (Figure 8) was normal on arthroscopy. Possibly, the tear was not reaching up to the inferior surface or a stable tear which was not appreciated on probing during arthroscopy. Normal anatomical structures such as transverse and meniscofemoral ligaments, popliteus tendon, genicular artery, and other artifacts such as capsule attachment, bursae of MCL, can lead to misdiagnosis of tear.24
In the present study, 10 patients were diagnosed as having bucket-handle tear. Absent bow tie sign was seen in eight
patients. In the present study, absent bow tie sign was seen to be a most sensitive sign to diagnose bucket-handle tear.14,15 In three patients, longitudinal to oblique signals were noted in posterior horn reaching up to the inferior surface not fi tting into criteria of bucket-handle tear hence diagnosed as simple meniscal tear without mentioning as the bucket-handle tear. On arthroscopy, all three patients had the bucket-handle tear. Possibly while probing the meniscus the fragment got displaced converting it to bucket-handle tear (Figure 9).
Table 5: Grades of meniscal signals on MRI (total patients: 36)Grades Medial meniscus Lateral meniscus
Anterior horn
Posterior horn
Anterior horn
Posterior horn
Grade I 0 0 0 0Grade II 2 6 0 0Grade III 0 21 0 7Total 2 27 0 7MRI: Magnetic resonance imaging
Table 6: MRI and arthroscopic correlation of Grade III signal (total patients: 28)Meniscus Grade III signal on MRI Arthroscopy fi ndings Sensitivity (%) Specifi city (%) PPV (%) NPV (%)Medial meniscus 21 20 100 96 96 100Lateral meniscus 7 7 100 100 100 100MRI: Magnetic resonance imaging
Figure 7: Altered signal intensity in ACL was diagnosed as ACL tear on MRI. However, ACL was normal on arthroscopy in this
patient
Figure 8: Grade III signal reaching up to inferior articular surface was diagnosed as medial meniscus tear. However,
meniscus was stable on probing during arthroscopy
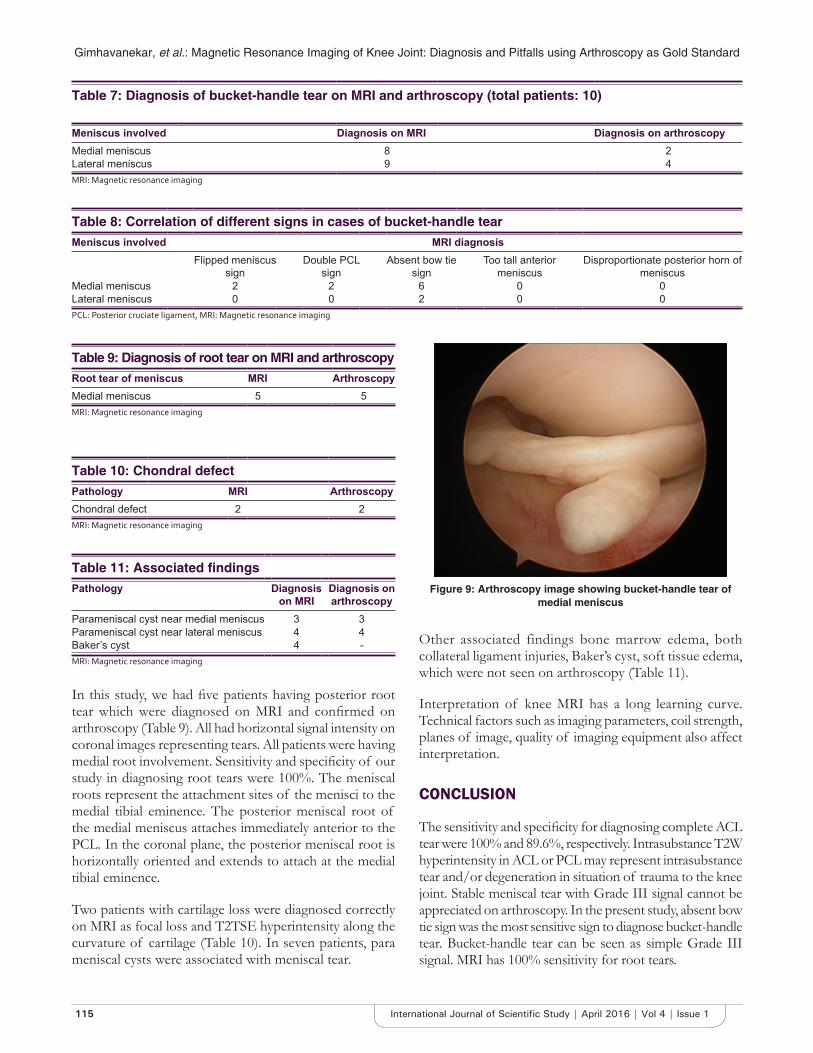
Gimhavanekar, et al.: Magnetic Resonance Imaging of Knee Joint: Diagnosis and Pitfalls using Arthroscopy as Gold Standard
115 International Journal of Scientifi c Study | April 2016 | Vol 4 | Issue 1
In this study, we had fi ve patients having posterior root tear which were diagnosed on MRI and confi rmed on arthroscopy (Table 9). All had horizontal signal intensity on coronal images representing tears. All patients were having medial root involvement. Sensitivity and specifi city of our study in diagnosing root tears were 100%. The meniscal roots represent the attachment sites of the menisci to the medial tibial eminence. The posterior meniscal root of the medial meniscus attaches immediately anterior to the PCL. In the coronal plane, the posterior meniscal root is horizontally oriented and extends to attach at the medial tibial eminence.
Two patients with cartilage loss were diagnosed correctly on MRI as focal loss and T2TSE hyperintensity along the curvature of cartilage (Table 10). In seven patients, para meniscal cysts were associated with meniscal tear.
Other associated findings bone marrow edema, both collateral ligament injuries, Baker’s cyst, soft tissue edema, which were not seen on arthroscopy (Table 11).
Interpretation of knee MRI has a long learning curve. Technical factors such as imaging parameters, coil strength, planes of image, quality of imaging equipment also affect interpretation.
CONCLUSION
The sensitivity and specifi city for diagnosing complete ACL tear were 100% and 89.6%, respectively. Intrasubstance T2W hyperintensity in ACL or PCL may represent intrasubstance tear and/or degeneration in situation of trauma to the knee joint. Stable meniscal tear with Grade III signal cannot be appreciated on arthroscopy. In the present study, absent bow tie sign was the most sensitive sign to diagnose bucket-handle tear. Bucket-handle tear can be seen as simple Grade III signal. MRI has 100% sensitivity for root tears.
Figure 9: Arthroscopy image showing bucket-handle tear of medial meniscus
Table 9: Diagnosis of root tear on MRI and arthroscopyRoot tear of meniscus MRI ArthroscopyMedial meniscus 5 5MRI: Magnetic resonance imaging
Table 11: Associated fi ndingsPathology Diagnosis
on MRIDiagnosis on arthroscopy
Parameniscal cyst near medial meniscus 3 3Parameniscal cyst near lateral meniscus 4 4Baker’s cyst 4 -MRI: Magnetic resonance imaging
Table 7: Diagnosis of bucket-handle tear on MRI and arthroscopy (total patients: 10)
Meniscus involved Diagnosis on MRI Diagnosis on arthroscopyMedial meniscus 8 2Lateral meniscus 9 4MRI: Magnetic resonance imaging
Table 10: Chondral defectPathology MRI ArthroscopyChondral defect 2 2MRI: Magnetic resonance imaging
Table 8: Correlation of different signs in cases of bucket-handle tearMeniscus involved MRI diagnosis
Flipped meniscus sign
Double PCL sign
Absent bow tie sign
Too tall anterior meniscus
Disproportionate posterior horn of meniscus
Medial meniscus 2 2 6 0 0Lateral meniscus 0 0 2 0 0PCL: Posterior cruciate ligament, MRI: Magnetic resonance imaging
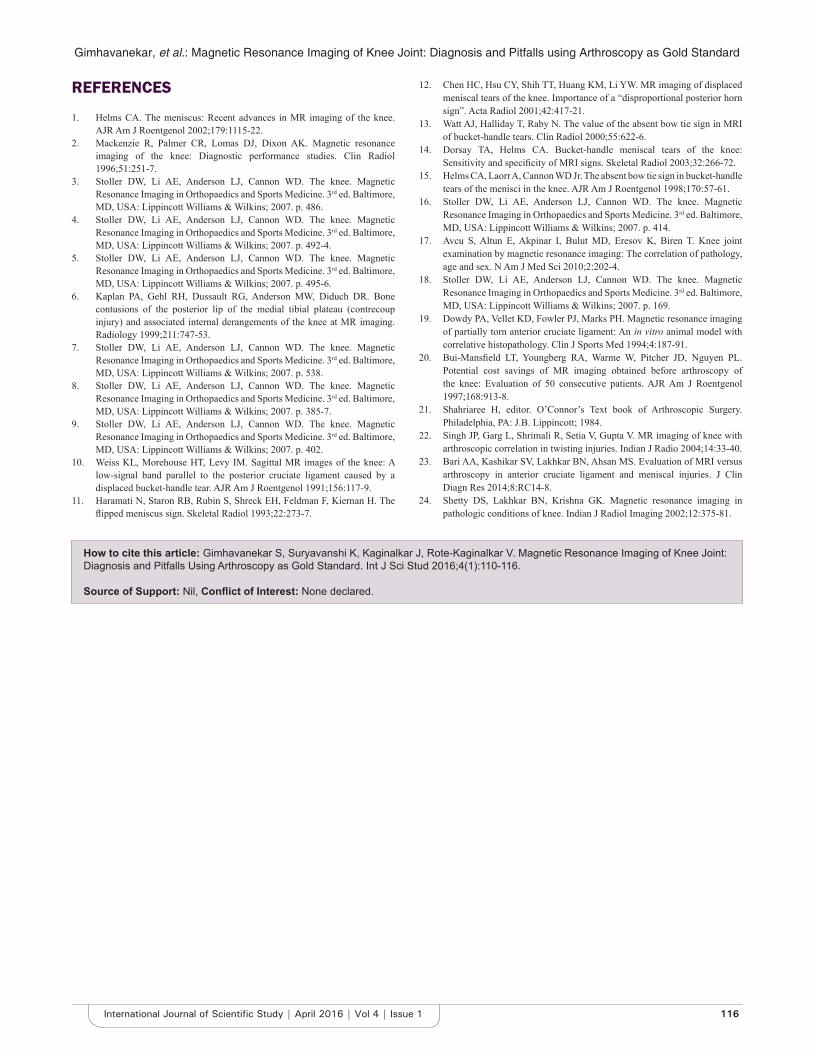
Gimhavanekar, et al.: Magnetic Resonance Imaging of Knee Joint: Diagnosis and Pitfalls using Arthroscopy as Gold Standard
116International Journal of Scientifi c Study | April 2016 | Vol 4 | Issue 1
REFERENCES
1. Helms CA. The meniscus: Recent advances in MR imaging of the knee. AJR Am J Roentgenol 2002;179:1115-22.
2. Mackenzie R, Palmer CR, Lomas DJ, Dixon AK. Magnetic resonance imaging of the knee: Diagnostic performance studies. Clin Radiol 1996;51:251-7.
3. Stoller DW, Li AE, Anderson LJ, Cannon WD. The knee. Magnetic Resonance Imaging in Orthopaedics and Sports Medicine. 3rd ed. Baltimore, MD, USA: Lippincott Williams & Wilkins; 2007. p. 486.
4. Stoller DW, Li AE, Anderson LJ, Cannon WD. The knee. Magnetic Resonance Imaging in Orthopaedics and Sports Medicine. 3rd ed. Baltimore, MD, USA: Lippincott Williams & Wilkins; 2007. p. 492-4.
5. Stoller DW, Li AE, Anderson LJ, Cannon WD. The knee. Magnetic Resonance Imaging in Orthopaedics and Sports Medicine. 3rd ed. Baltimore, MD, USA: Lippincott Williams & Wilkins; 2007. p. 495-6.
6. Kaplan PA, Gehl RH, Dussault RG, Anderson MW, Diduch DR. Bone contusions of the posterior lip of the medial tibial plateau (contrecoup injury) and associated internal derangements of the knee at MR imaging. Radiology 1999;211:747-53.
7. Stoller DW, Li AE, Anderson LJ, Cannon WD. The knee. Magnetic Resonance Imaging in Orthopaedics and Sports Medicine. 3rd ed. Baltimore, MD, USA: Lippincott Williams & Wilkins; 2007. p. 538.
8. Stoller DW, Li AE, Anderson LJ, Cannon WD. The knee. Magnetic Resonance Imaging in Orthopaedics and Sports Medicine. 3rd ed. Baltimore, MD, USA: Lippincott Williams & Wilkins; 2007. p. 385-7.
9. Stoller DW, Li AE, Anderson LJ, Cannon WD. The knee. Magnetic Resonance Imaging in Orthopaedics and Sports Medicine. 3rd ed. Baltimore, MD, USA: Lippincott Williams & Wilkins; 2007. p. 402.
10. Weiss KL, Morehouse HT, Levy IM. Sagittal MR images of the knee: A low-signal band parallel to the posterior cruciate ligament caused by a displaced bucket-handle tear. AJR Am J Roentgenol 1991;156:117-9.
11. Haramati N, Staron RB, Rubin S, Shreck EH, Feldman F, Kiernan H. The fl ipped meniscus sign. Skeletal Radiol 1993;22:273-7.
12. Chen HC, Hsu CY, Shih TT, Huang KM, Li YW. MR imaging of displaced meniscal tears of the knee. Importance of a “disproportional posterior horn sign”. Acta Radiol 2001;42:417-21.
13. Watt AJ, Halliday T, Raby N. The value of the absent bow tie sign in MRI of bucket-handle tears. Clin Radiol 2000;55:622-6.
14. Dorsay TA, Helms CA. Bucket-handle meniscal tears of the knee: Sensitivity and specifi city of MRI signs. Skeletal Radiol 2003;32:266-72.
15. Helms CA, Laorr A, Cannon WD Jr. The absent bow tie sign in bucket-handle tears of the menisci in the knee. AJR Am J Roentgenol 1998;170:57-61.
16. Stoller DW, Li AE, Anderson LJ, Cannon WD. The knee. Magnetic Resonance Imaging in Orthopaedics and Sports Medicine. 3rd ed. Baltimore, MD, USA: Lippincott Williams & Wilkins; 2007. p. 414.
17. Avcu S, Altun E, Akpinar I, Bulut MD, Eresov K, Biren T. Knee joint examination by magnetic resonance imaging: The correlation of pathology, age and sex. N Am J Med Sci 2010;2:202-4.
18. Stoller DW, Li AE, Anderson LJ, Cannon WD. The knee. Magnetic Resonance Imaging in Orthopaedics and Sports Medicine. 3rd ed. Baltimore, MD, USA: Lippincott Williams & Wilkins; 2007. p. 169.
19. Dowdy PA, Vellet KD, Fowler PJ, Marks PH. Magnetic resonance imaging of partially torn anterior cruciate ligament: An in vitro animal model with correlative histopathology. Clin J Sports Med 1994;4:187-91.
20. Bui-Mansfi eld LT, Youngberg RA, Warme W, Pitcher JD, Nguyen PL. Potential cost savings of MR imaging obtained before arthroscopy of the knee: Evaluation of 50 consecutive patients. AJR Am J Roentgenol 1997;168:913-8.
21. Shahriaree H, editor. O’Connor’s Text book of Arthroscopic Surgery. Philadelphia, PA: J.B. Lippincott; 1984.
22. Singh JP, Garg L, Shrimali R, Setia V, Gupta V. MR imaging of knee with arthroscopic correlation in twisting injuries. Indian J Radio 2004;14:33-40.
23. Bari AA, Kashikar SV, Lakhkar BN, Ahsan MS. Evaluation of MRI versus arthroscopy in anterior cruciate ligament and meniscal injuries. J Clin Diagn Res 2014;8:RC14-8.
24. Shetty DS, Lakhkar BN, Krishna GK. Magnetic resonance imaging in pathologic conditions of knee. Indian J Radiol Imaging 2002;12:375-81.
How to cite this article: Gimhavanekar S, Suryavanshi K, Kaginalkar J, Rote-Kaginalkar V. Magnetic Resonance Imaging of Knee Joint: Diagnosis and Pitfalls Using Arthroscopy as Gold Standard. Int J Sci Stud 2016;4(1):110-116.
Source of Support: Nil, Confl ict of Interest: None declared.

117 International Journal of Scientifi c Study | April 2016 | Vol 4 | Issue 1
Awareness of Diabetes Mellitus and its Complications among Patients at Tertiary Care HospitalAmbannagowda Durgad1, R B Parakh2, M Dhananjaya2, K N Ramesh3
1Assistant Professor, Department of Medicine, DR. B. R. Ambedkar Medical College and Research Hospital, Bengaluru, Karnataka, India, 2Assistant Professor, Department of Medicine, SDM College of Medical Sciences and Hospital, Dharwad, Karnataka, India, 3Professor, Department of Medicine, DR. B. R. Ambedkar Medical College and Research Hospital, Bengaluru, Karnataka, India
Nearly, 25% of Indian city dwellers have not even heard of diabetes according to a study. Screening of patients is necessary to reduce the burden of disease on individuals as well as community and nation.
Screening is defi ned as “A process of identifying those individuals who are at suffi ciently high risk of a specifi c disorder to warrant further investigation or direct action.” Types of screening are (a) entire population, (b) targeted screening, and (c) opportunistic screening.
Diabetes is part of a larger global epidemic of non-communicable diseases and a major public health challenge globally. This affects 6.6% (285 million people) of the world’s population in the 20-79 years age group.2 According to the International Diabetic Federation (IDF), this number might reach 380 million by 2025.3,4 The IDF in 2007, the country with the largest numbers of people with diabetes is India (40.9 million), followed by China (39.8 million), the United States (19.2 million), Russia.5,6
INTRODUCTION
India has dubious distinction of having the largest number of people with diabetes. India has around 50 million cases of diabetes, expected to be around 80 million by 2025. It is 15-20% of global burden, contributes 1% of world’s diabetes research.1 It is known as diabetes capital of the world. In India, it is no longer a disease of rich and affl uent man disease. It is becoming a problem in middle-income group and poor sections of society. Poor diabetic subjects are more prone to complications and morbidity. Till date, no national awareness program has been performed.
Original Article
Abstract
Aim: To study the awareness of diabetes and its complications among the patients in tertiary care hospital.
Objectives: India is one of the fastest growing countries in the world. The initiative is taken to fi nd out the awareness and to fi nd out how aware our patients are about their diabetes and also to fi nd out about advice given by the treating doctor (general practitioner/specialist). All the information is based on a questionnaire.
Materials and Methods: All diabetes mellitus Type 2 patients admitted toward and those visiting the outpatient at our center are included in the study. 500 patients were included in this prospective study.
Results: In our study, 48% had familial history, 47% did not know the frequency of blood sugar check-up, amazingly 55% did not know the complications, 45% of patient were not aware of insulin and 40% of the patients did not know names of the tablet of their own treatment.
Conclusion: The potential benefi ts of early detection are improved quality of life, decreased hospitalizations. Screening of diabetes is important as it not only detects new cases but identifi cation of many impaired glucose tolerance and impaired fasting glucose pre-diabetes states. Public health policy should be aimed at the aspects. Clinical practitioners should aim at regular health campaigns in community to identify these hidden cases.
Key words: Awareness, Diabetes mellitus, Impaired glucose tolerance and impaired fasting glucose
Access this article online
www.ijss-sn.com
Month of Submission : 02-2016Month of Peer Review : 03-2016Month of Acceptance : 03-2016Month of Publishing : 04-2016
Corresponding Author: Dr. R B Parakh, Department of Medicine, SDM College of Medical Sciences and Hospital, Manjushree Nagar, Sattur, Dharwad - 580 009, Karnataka, India. E-mail: [email protected]
DOI: 10.17354/ijss/2016/200
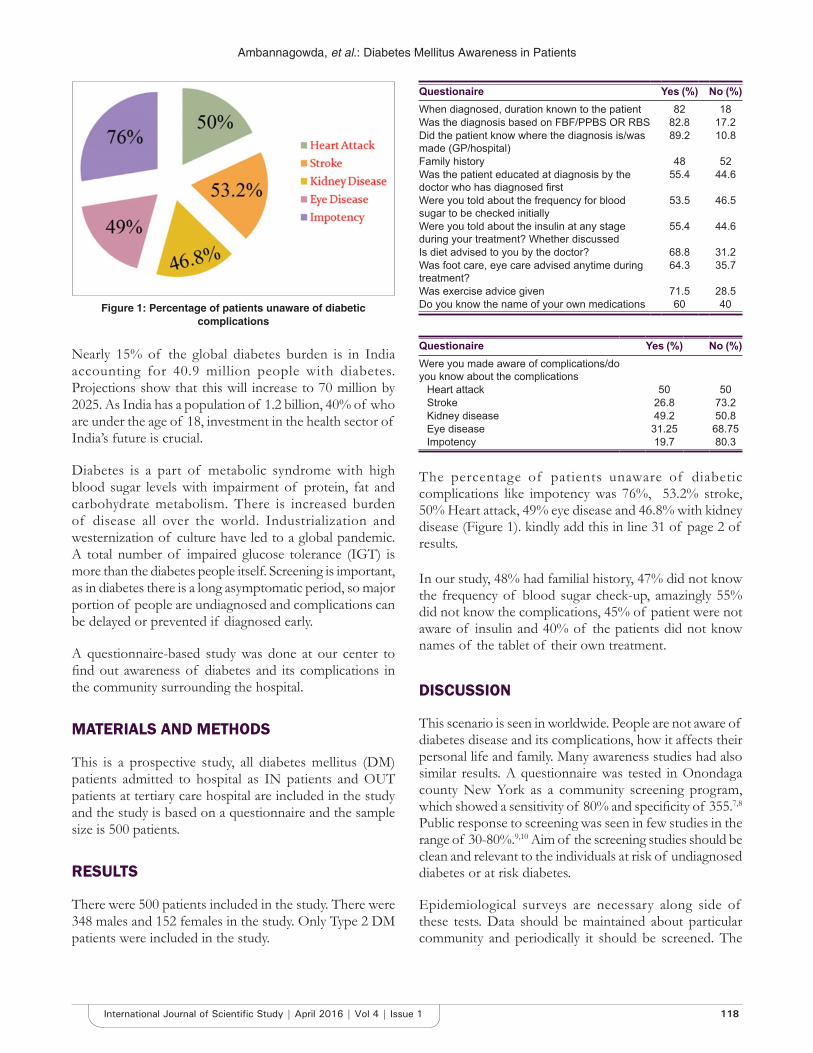
Ambannagowda, et al.: Diabetes Mellitus Awareness in Patients
118International Journal of Scientifi c Study | April 2016 | Vol 4 | Issue 1
Nearly 15% of the global diabetes burden is in India accounting for 40.9 million people with diabetes. Projections show that this will increase to 70 million by 2025. As India has a population of 1.2 billion, 40% of who are under the age of 18, investment in the health sector of India’s future is crucial.
Diabetes is a part of metabolic syndrome with high blood sugar levels with impairment of protein, fat and carbohydrate metabolism. There is increased burden of disease all over the world. Industrialization and westernization of culture have led to a global pandemic. A total number of impaired glucose tolerance (IGT) is more than the diabetes people itself. Screening is important, as in diabetes there is a long asymptomatic period, so major portion of people are undiagnosed and complications can be delayed or prevented if diagnosed early.
A questionnaire-based study was done at our center to fi nd out awareness of diabetes and its complications in the community surrounding the hospital.
MATERIALS AND METHODS
This is a prospective study, all diabetes mellitus (DM) patients admitted to hospital as IN patients and OUT patients at tertiary care hospital are included in the study and the study is based on a questionnaire and the sample size is 500 patients.
RESULTS
There were 500 patients included in the study. There were 348 males and 152 females in the study. Only Type 2 DM patients were included in the study.
Questionaire Yes (%) No (%)When diagnosed, duration known to the patient 82 18Was the diagnosis based on FBF/PPBS OR RBS 82.8 17.2Did the patient know where the diagnosis is/was made (GP/hospital)
89.2 10.8
Family history 48 52Was the patient educated at diagnosis by the doctor who has diagnosed fi rst
55.4 44.6
Were you told about the frequency for blood sugar to be checked initially
53.5 46.5
Were you told about the insulin at any stage during your treatment? Whether discussed
55.4 44.6
Is diet advised to you by the doctor? 68.8 31.2Was foot care, eye care advised anytime during treatment?
64.3 35.7
Was exercise advice given 71.5 28.5Do you know the name of your own medications 60 40
Questionaire Yes (%) No (%)Were you made aware of complications/do you know about the complications
Heart attack 50 50Stroke 26.8 73.2Kidney disease 49.2 50.8Eye disease 31.25 68.75Impotency 19.7 80.3
The percentage of patients unaware of diabetic complications like impotency was 76%, 53.2% stroke, 50% Heart attack, 49% eye disease and 46.8% with kidney disease (Figure 1). kindly add this in line 31 of page 2 of results.
In our study, 48% had familial history, 47% did not know the frequency of blood sugar check-up, amazingly 55% did not know the complications, 45% of patient were not aware of insulin and 40% of the patients did not know names of the tablet of their own treatment.
DISCUSSION
This scenario is seen in worldwide. People are not aware of diabetes disease and its complications, how it affects their personal life and family. Many awareness studies had also similar results. A questionnaire was tested in Onondaga county New York as a community screening program, which showed a sensitivity of 80% and specifi city of 355.7,8 Public response to screening was seen in few studies in the range of 30-80%.9,10 Aim of the screening studies should be clean and relevant to the individuals at risk of undiagnosed diabetes or at risk diabetes.
Epidemiological surveys are necessary along side of these tests. Data should be maintained about particular community and periodically it should be screened. The
Figure 1: Percentage of patients unaware of diabetic complications
Ambannagowda, et al.: Diabetes Mellitus Awareness in Patients
119 International Journal of Scientifi c Study | April 2016 | Vol 4 | Issue 1
cost of screening can be reduced if screening data is linked to other programs which are done like cardiovascular screening should be linked to glucose and lipid testing’s. National diabetic programs, media awareness programs on television, advertisements of screening program are done all worlds over. RCT’S and observational studies have been done in countries to maintain the data of diabetes patients in their registry.11
CONCLUSION
The potential benefi ts of early detection are improved quality of life, decreased hospitalizations. Screening of diabetes is important as it not only detects new cases but identifi cation of many IGT and impaired fasting glucose pre-diabetes states. Public health policy should be aimed at the aspects. Clinical practioners should aim at regular health campaigns in community to identify these hidden cases.
In view of above results, authors like to conclude that greater effort is needed to create awareness regarding diabetes disease burden and its complications related to it can be reduced.
REFERENCES
1. World Health Organization. Diet, Nutrition and the Prevention of Chronic Diseases. Technical Report Series. Vol. 916. Geneva: World Health Organization; 2003. p. 1-v111, 1-149.
2. International Diabetes Federation. The IDF Diabetes Atlas. 5th ed. Brussels, Belgium: International Diabetes Federation; 2011.
3. King H, Aubert RE, Herman WH. Global burden of diabetes, 1995-2025: Prevalence, numerical estimates, and projections. Diabetes Care 1998;21:1414-31.
4. Ramachandran A, Snehalatha C, Baskar AD, Mary S, Kumar CK, Selvam S, et al. Temporal changes in prevalence of diabetes and impaired glucose tolerance associated with lifestyle transition occurring in the rural population in India. Diabetologia 2004;47:860-5.
5. Wild S, Roglic G, Green A, Sicree R, King H. Global prevalence of diabetes: Estimates for the year 2000 and projections for 2030. Diabetes Care 2004;27:1047-53.
6. Shaw JE, Sicree RA, Zimmet PZ. Global estimates of the prevalence of diabetes for 2010 and 2030. Diabetes Res Clin Pract 2010;87:4-14.
7. Knudson PE, Turner KJ, Sedore A, Weinstock RS. Utility of the American Diabetes Association risk test in a community screening program. Diabetes Care 1998;21:1029-31.
8. Herman WH, Smith PJ, Thompson TJ, Engelgau MM, Aubert RE. A new and simple questionnaire to identify people at increased risk for undiagnosed diabetes. Diabetes Care 1995;18:382-7.
9. Davies M, Day J. Screening for diabetes. BMJ 1994;308:1160-1.10. Davies MJ, Ammari F, Sherriff C, Burden ML, Gujral J, Burden AC.
Screening for Type 2 diabetes mellitus in the UK Indo-Asian population. Diabet Med 1999;16:131-7.
11. Verma R, Khanna P, Mehta B. National programme on prevention and control of diabetes in India: Need to focus. Australas Med J 2012;5:310-5.
How to cite this article: Drugad A, Parakh RB, Dhananjaya M, Ramesh KN. Awareness of Diabetes Mellitus and its Complications among Patients at Tertiary Care Hospital. Int J Sci Stud 2016;4(1):117-119.
Source of Support: Nil, Confl ict of Interest: None declared.
120International Journal of Scientifi c Study | April 2016 | Vol 4 | Issue 1
Comparison of Submucosal Diathermy and Partial Inferior TurbinectomyM S Vishnu1, K B Rajamma2
1Resident, Department of ENT, Sree Gokulam Medical College & Research Foundation, Trivandrum, Kerala, India, 2Professor and Head, Department of ENT, Sree Gokulam Medical College & Research Foundation, Trivandrum, Kerala, India
turbinectomy, laser cautery, silver nitrate cautery, electrocautery, submucosal resection with or without lateral displacement, cryotherapy.1 There is no general agreement about the best modality of treatment. partial inferior turbinectomy (PIT) and submucosal diathermy (SMD) are two popular methods among the various techniques of inferior turbinate reduction. This study aims to compare the results between SMD and PIT in terms of post-operative bleeding, nasal crust formation, vestibular skin burn, pain, synechiae formation, and atrophic rhinitis.
MATERIALS AND METHODS
A prospective observational study of 60 patients, who attended the ENT OPD with complaints of nasal obstruction due to inferior turbinate hypertrophy was
INTRODUCTION
One of the common presenting symptoms to ENT Department is a nasal obstruction, which can be due to deviated septum, nasal polyposis, hypertrophied inferior turbinate, vasomotor or perennial rhinitis. Inferior turbinate hypertrophy is a common entity which sometimes do not respond to medical treatment and requires surgery. A minimum of 13 different surgical techniques have been introduced which include
Abstract
Introduction: Nasal obstruction is one among the most common presenting complaints of patients. The most common etiology for nasal obstruction is hypertrophy of the inferior turbinates due to allergic rhinitis or vasomotor rhinitis. The hypertrophy is almost always due to dilatation of the venous sinusoids resulting in swelling of the submucosal layer.
Objectives: To compare the results between submucosal diathermy (SMD) and partial inferior turbinectomy (PIT) in terms of post-operative bleeding, nasal crust formation, vestibular skin burn, pain, synechiae formation, and atrophic rhinitis.
Materials and Methods: A prospective observational study involving 60 patients with inferior turbinate hypertrophy was done at Sree Gokulam Medical College, TVM from January 2014 to June 2015. Patients were randomly divided into two groups; Group A, underwent SMD and Group B underwent PIT. Post-operative follow-up done at day 1, 1 week, 1 month and 3 months.
Results: Occurrence of post-operative reactionary hemorrhage on day 1 was 43.3% in PIT, whereas it was only 10% in SMD. Nasal crust formation was 6.7% in PIT at the end of 3 months while none who underwent SMD had crust formation at the end of 3 months. Vestibular skin burn was observed in 3.3% of SMD patients. 6.7% had nasal pain following PIT while none of the SMD patients had the same. Remote complications such as synechiae and atrophic rhinitis were not reported in either PIT or SMD during the assessment time period.
Conclusion: SMD is relatively safe and less invasive than PIT but its effectiveness compared to PIT is short lived. In the long run, PIT was found to be more effective.
Key words: Inferior turbinate hypertrophy, Partial inferior turbinectomy, Submucosal diathermy
Access this article online
www.ijss-sn.com
Month of Submission : 02-2016Month of Peer Review : 03-2016Month of Acceptance : 03-2016Month of Publishing : 04-2016
Corresponding Author: M S Vishnu, Department of ENT, Sree Gokulam Medical College & Research Foundation, Trivandrum, Kerala, India. E-mail: [email protected]
DOI: 10.17354/ijss/2016/201Original ArticleOriginal Article
Vishnu and Rajamma: Comparison of Submucosal Diathermy and Partial Inferior Turbinectomy
121 International Journal of Scientifi c Study | April 2016 | Vol 4 | Issue 1
done, in the Department of ENT Sree Gokulam Medical College from January 2014 to June 2015. The patients were divided into two Groups A and B of 30 each using table of randomization. Group A patients SMD and Group B underwent PIT.
A thorough history and detailed examination of ear nose and throat were conducted by anterior rhinoscopy, diagnostic nasal endoscopy, and radiologically by sinus X-ray. Routine pre-operative investigations were done or every patient.
Size of inferior turbinate was classifi ed into three grades:Grade 1: Normal size inferior turbinate, atrophic without
any nasal obstructionGrade 2: Moderate sized inferior turbinate, touching the
septum with nasal obstruction, not responding to local decongestant
Grade 3: Large mulberry turbinate touching the septum with nasal obstruction, not responding to local decongestant.
The procedures were done for both Grades 2 and 3 patients.
Both procedures were done under general anesthesia, with the patient in reclining position and head end of the table raised. Nasal cavity was packed with two cotton pledgets soaked in oxymetazoline and adrenaline.
For SMD, after decongestion the diathermy needle was inserted into the anterior end of inferior turbinate, which was advanced submucosally till the posterior end of the inferior turbinate was reached. The needle was then withdrawn slightly and a current of 50 joules was applied in a triangular fashion at 3 points (superior, medial and inferior).
For PIT, the inferior turbinate was infiltrated with 2% xylocaine + adrenaline up to the posterior end. Using turbinectomy scissors, the medial one-third of the anterior end of the inferior turbinate was resected without any trauma to the bony inferior concha.
Following the procedure, anterior nasal packing was done with antibiotic ointment (soframycin + metrogyl). All patients were given parenteral antibiotics, analgesics, and nasal drops for 7-10 days postoperatively.
Post-operative follow-up was done on day 1 for assessing reactionary hemorrhage. Nasal crust formation was evaluated at 1 week, 1 month and 3 months postoperatively. Vestibular skin burn was assessed on day 1. Assessment of nasal pain was done on post-operative day 1 and day 7. Synechiae formation and atrophic rhinitis were evaluated at 1 month and 3 months.
RESULTS
Out of the 60 patients recruited for the study, in Group A 12 were males and 18 were females. In Group B, 20 were males and 10 females, with mean age of 27.2 in Group A and 27.8 in Group B.
On the fi rst post-operative day, reactionary hemorrhage was observed in 13 (43.3%) patients who underwent PIT, whereas only 3 (10%) patients who underwent SMD had the same (Figure 1).
Nasal crust formation evaluated at the end of the 1st week demonstrated crust formation in 46.7% of patients who underwent PIT and only in 16.7% of patients who underwent SMD. Follow-up at the end of 1 month revealed crust formation in 26.7% of PIT patients and only in 6.7% of SMD patients. Follow-up at the end of the 3rd month demonstrated crust formation in 6.7% of PIT patients whereas none of the patients who underwent SMD had crust formation (Figure 2).
Vestibular skin burn assessed on post-operative day 1 was observed only in 1 (3.3%) patient who underwent SMD. As cautery was not used in PIT vestibular skin burn was not observed in Group B (Figure 3).
The nasal pain was present in 11 (36.7%) patients who underwent PIT and in 4 (13.3%) of patients who underwent SMD on day 1. At the end of the 1st week, 6.7% of PIT patients had mild nasal pain, whereas none of the patients who underwent SMD had the same (Figure 4).
Synechiae formation and atrophic rhinitis were evaluated at 1 month and 3 months postoperatively and none of the patients in both groups had the same.
DISCUSSION
Nasal obstruction is one among the most common presenting complaints of patients attending the ENT OPD. One of the most common etiology for nasal obstruction is hypertrophy of the inferior turbinates due to allergic rhinitis or vasomotor rhinitis.2 The hypertrophy is almost always due to dilatation of the venous sinusoids resulting in swelling of the submucosal layer. The majority of the patients responds to antihistamines or local decongestants. Occasionally submucous fibrosis may render the turbinates incapable of decongestion and in such cases surgical management becomes necessary.3 Even though multiple treatment options are available, there is considerable controversy over the merits of the various techniques.

Vishnu and Rajamma: Comparison of Submucosal Diathermy and Partial Inferior Turbinectomy
122International Journal of Scientifi c Study | April 2016 | Vol 4 | Issue 1
This study is done to evaluate and analyze the impact of partial turbinectomy and SMD on nasal obstruction and to compare the results of either procedures in respect of safety and effi cacy. Anterior rhinoscopy and radiological investigations (X-ray PNS) were done. Rhinomanometry was not done due to lack of availability in our institute.
In a study conducted by Thahir et al., bleeding was seen in patients who underwent PIT and anterior nasal packing was required for 48 h. In a study conducted by Imad et al.,4 in 2010 it was found that 40% of patients who underwent PIT had moderate bleeding while only 3% who underwent SMD had minimal bleeding. The studies done by Al-Baldawi5 revealed that the incidence of reactionary hemorrhage was 12.5% in patients who underwent PIT, whereas none of the patients who underwent SMD had a reactionary hemorrhage. In our study, the reactionary hemorrhage was evaluated on post-operative day 1 which was 43.3% in patients who underwent PIT. Only 10% of the patients who underwent SMD had developed reactionary hemorrhage.
The study conducted by Imad et al.,4 in 2010 revealed that 20% of patients who underwent PIT had crusting at the
end of 2 weeks while none of the patients who underwent SMD had crusting. Incidence of crusting was also reported by Nousheen6 in her study conducted in 2006. Maskel et al., conducted a study in 2007 and reported that 29.5% of patients who underwent laser turbinectomy had crusting within fi rst 2 weeks.7 About 5% of those who underwent PIT had developed nasal crust formation and none of the patients who underwent SMD had developed nasal crust formation according to the study by Al-Baldawi.5 In this study, the incidence of nasal crust formation was assessed at various time intervals in both groups. About 46.7% had developed nasal crust at the end of 1 week in patients who underwent PIT which was further reduced to 26.7% after 1 month. By the end of 3 months, only 6.7% of patients who underwent PIT had nasal crust formation. In those who underwent SMD, the incidence of nasal crust formation was 16.7% after 1 week which further reduced to 6.7% after 1 month. At the end of 3 months, none of the patients who underwent SMD had nasal crust formation.
According to study conducted by Al-Baldawi,5 2009 the incidence of vestibular skin burn in patients who underwent PIT was nil whereas those who underwent SMD 2.5% had skin burn. In our study the incidence of
Figure 1: Comparison of reactionary hemorrhage (day 1) between both groups
Figure 2: Comparison of nasal crust formation of between two groups
Figure 3: Incidence of vestibular skin burn (post-operative day 1)
Figure 4: Comparison of nasal pain of both groups

Vishnu and Rajamma: Comparison of Submucosal Diathermy and Partial Inferior Turbinectomy
123 International Journal of Scientifi c Study | April 2016 | Vol 4 | Issue 1
vestibular skin burn was evaluated on post-operative day 1. None of the patients who underwent PIT had vestibular skin burn as no cautery was used, whereas 3.3% of patients who underwent SMD had developed vestibular skin burn which was mild.
According to study by Maskel et al.,7 less pain was reported with laser inferior turbinectomy. In study conducted by Imad et al.,4 in 2010, in Peshawar 32% of patient who underwent PIT had moderate pain whereas 44% of patients who underwent SMD had moderate pain. In a study conducted in Iraq by Al-Baldawi,5 the occurrence of nasal pain and headache was 12.5% in those who underwent PIT and only 5% of patients who underwent SMD had developed a headache. According to study by Gomma et al, incidence of nasal pain was less in SMD patients during 2 week and 1 month follow up, compared to patients who under went PIT.8 Our study also assessed the incidence of headache and nasal pain in both groups. At post-operative day 1 about 36.7% of patients who underwent PIT had headache and nasal pain which was further reduced to 6.7% at the end of 1 week. The incidence of headache and nasal pain in patients who underwent SMD was 13.3% at post-operative day 1 and none of the patients had headache and nasal pain at the end of 1 week.
Nasal synechiae/adhesions were not observed in both groups of patients who underwent PIT or SMD in a study conducted by Al-Baldawi5 in 2009. The occurrence of synechiae formation was assessed in our study at 1 month and 3 months postoperatively. In those patients who underwent PIT at the end of 1 month and 3 months none had synechiae formation. Similar results also were observed in patients who underwent SMD.
Study done by Al-Baldawi,5 2009 revealed that none of the patients had atrophic rhinitis irrespective of the whether they underwent PIT/SMD. In our study, we also assessed the incidence of atrophic rhinitis in both groups at time intervals of 1 month and 3 months. Neither the patients
who underwent PIT nor those who underwent SMD had developed atrophic rhinitis at both time intervals.
CONCLUSION
This study showed that the Reactionary hemorrhage was more in those who underwent PIT than in those who underwent SMD. Even though the incidence of nasal crust formation was more and was statistically signifi cant during early follow ups in those who underwent PIT, at the end of 3 months it became insignifi cant. There was a statistically signifi cant occurrence of headache and nasal pain in those who underwent PIT during early post-operative period, but this difference became insignifi cant when assessed later. Remote sequelae like atrophic rhinitis or nasal synechiae were not observed in any of these groups. Even though the incidence of short-term complications is more with PIT, in the long run it is found to be more effective than SMD.
REFERENCES
1. Hol MK, Huizing EH. Treatment of inferior turbinate pathology: A review and critical evaluation of the different techniques. Rhinology 2000;38:157-66.
2. Okhakhu A, Ogisi F. Submucosal diathermy in inferior turbinate hypertrophy: Review of 12 cases in Benin City. Sahel Med J 2015;18:71.
3. Anil HT, Mahjabeen B. Comparative study between partial inferior turbinectomy and submucosal diathermy in the management of inferior turbinate hypertrophy. IJS 2014;3:323-5.
4. Imad, Javed, Sanaullah. Comparison of submucosal diathermy with partial inferior turbinectomy: A fi fty case study. J Postgrad Med Inst Peshawar Pak 2011;26:91-5.
5. Al-Baldawi MH. Management of inferior turbinate hypertrophy: A comparaytive study between partial inferior turbinectomy and submucosal diathermy. Iraqi J Community Med 2009:22;264-7.
6. Hashmi ZA, Bashir G, Shah SA. Tramadol hydrochloride versus diclofenac sodium for early post-operative pain control. J Rawal Med Coll December 2006;10:70-2.
7. Maskel S, Eze N, Patel P. Hosni A. Laser inferior turbinectomy under local anaesthetic: A well tolerated out-patient procedure. J Laryngol Otol 2007;121:957-61.
8. Gomaa MAn Abdel Nabi OG, Abdel Kerim ARA, Aly A. Comparative Study between Partial Surgical Inferior Turbinectomy and Sub-mucosal Diathermy of Inferior Turbinate for Treatment of Inferior Turbinate Hypertrophy. Otolaryngology 2015;2015:5-6.
How to cite this article: Vishnu MS, Rajamma KB. Comparison of Submucosal Diathermy and Partial Inferior Turbinectomy. Int J Sci Stud 2016;4(1):120-123.
Source of Support: Nil, Confl ict of Interest: None declared.

124International Journal of Scientifi c Study | April 2016 | Vol 4 | Issue 1
Neurosonogram in Critically Ill Neonates in Neonatal Intensive Care UnitDinakara Prithviraj1, Bharath Reddy2, Radha Reddy3, B Shruthi3
1Associate Professor, Department of Pediatrics, Vydehi Institute of Medical Sciences, Bengaluru, Karnataka, India, 2Assistant Professor, Department of Pediatrics, Vydehi Institute of Medical Sciences, Bengaluru, Karnataka, India, 3Junior Resident, Department of Pediatrics, Vydehi Institute of Medical Sciences, Bengaluru, Karnataka, India
repeated whenever needed, enabling visualization of ongoing brain maturation and the evolution of lesions.1
Ultrasound is the most widely used cranial imaging modality in the neonatal intensive care unit (NICU). Ultrasound machines are portable, the images can be acquired at bedside conveniently in the NICU, which meets the definition of point-of-care testing. The cumbersome transport of the neonates to the computerized tomography (CT) or the magnetic resonance imaging (MRI) suite is avoided. In addition, ultrasound is cost-effective and considered a safer modality in the pediatric population due to the lack of harming effect of ionizing radiation, as in CT,
INTRODUCTION
Cranial ultrasonography (cUS) is the preferred modality to image the neonatal brain. The advantages of cUS are numerous: It can be performed at the bedside with little disturbance to the infant, it is relatively safe, and can be
Original Article
Abstract
Aim: Neonates born prematurely and sick full-term neonates are at risk of brain injury. Although advances in neonatal intensive care have greatly improved the survival and outcome of these vulnerable patients, brain injury remains of major concern. Early diagnosis is important for prognostication, optimal treatment, and predicting the neurological outcome.
Objective: This study was done to describe the pattern of cranial ultrasound abnormalities in preterm and term critically ill neonates in neonatal intensive care unit (NICU).
Materials and Methods: This prospective observational clinical study was done in Vydehi Institute of Medical Sciences Hospital and Research Centre, Bengaluru between January 2014 and July 2015. After obtaining informed consent 100 critically ill neonates admitted to our NICU were included in this study. History and clinical examination followed by appropriate investigations were done. These critically ill neonates were subjected to neurosonography on selected days as per as protocol and different patterns of morphology abnormalities were noted. Clinical correlation with neurosonogram fi ndings was observed and if found abnormal follow-up neurosonogram were done.
Results: The incidence of neurosonographic abnormalities in high-risk neonates is 31% in the present study. Of these 41% of these had evidence of intracranial bleed, 25% had cerebral edema, 6% periventricular leukomalacia, 16% hyperechogenic thalami, and one had ventriculomegaly. Of the 31% of neonates with abnormal fi ndings on neurosonogram, 22% had hypoxic-ischemic encephalopathy as per Apgar scoring, 25% had features of sepsis. One neonates with intraventricular bleed on regular follow-up of neurosonogram developed ventriculomegaly.
Conclusion: This study signifi es the importance of neurosonogram in critically ill neonates as diagnostic tool and as screening modality in NICU. It also emphasizes its use as a screening modality for preterm and birth asphyxia neonates infl uencing their neurodevelopmental outcome. Neurosonogram is critical as an investigatory modality in NICU for early, safe and easy diagnostic tool for predicting the neurological damage for management in NICU and predicting outcome.
Key words: Birth asphyxia, Neonatal intensive care unit, Neurosonogram, Preterm
Access this article online
www.ijss-sn.com
Month of Submission : 02-2016Month of Peer Review : 03-2016Month of Acceptance : 03-2016Month of Publishing : 04-2016
Corresponding Author: Dr. Dinakara Prithviraj, Department of Pediatrics, Vydehi Institute of Medical Sciences, Bengaluru, Karnataka, India. Phone: +91-9742274849. E-mail: [email protected]
DOI: 10.17354/ijss/2016/202

Prithviraj, et al.: Neurosonogram in Critically Ill Neonate
125 International Journal of Scientifi c Study | April 2016 | Vol 4 | Issue 1
as well as avoiding the need for sedation required for MRI. Ultrasound is the least costly of all modalities for cranial imaging and is readily available in all intensive care units. In the neonate, many sutures and fontanels are still open and these can be used as acoustic windows to “look” into the brain. The modality is operator-dependent and should be performed by an experienced sonographer, neonatologist, or radiologist. In many cases, a fi nal diagnosis and treatment guidance can be achieved with neurosonography, such as in neonatal germinal matrix hemorrhages, neonatal malformations.2,3
Any neonate, regardless of birth weight, size, or gestational age, who has a greater than average chance of morbidity or mortality, due to fetal, maternal or placental anomalies or an otherwise compromised pregnancy, especially within the fi rst 28 days of life is categorized as critically ill neonate. Neurosonogram plays an important role in assessing neurological prognosis of these high-risk infants.2,4
Modern machines, with a variety of acoustic windows and sequential scanning giving high-quality images has increased the recognition of features suggestive of developmental, metabolic and infectious disorders.
It detects most of the hemorrhagic, ischemic and cystic brain lesions as well as calcifi cations, cerebral infections, and major structural abnormalities in critically ill neonates. It is also very helpful in the early diagnosis of the many etiologies of neonatal encephalopathy and seizures in the term infant and the subsequent monitoring of progress of hypoxic-ischemic brain injury.
Most newborn intensive care unit centers perform serial cUS evaluations early in the course of hospitalization for premature infants and often, a follow-up examination is done at a later age. These evaluations are done to document the presence of intracranial hemorrhage, to guide choice of therapies that may exacerbate the risk of further hemorrhage, and to counsel families about neurodevelopment outcomes.5,7
Neurosonogram is also very helpful in assessing severity and neurodevelopment outcome in infants with hypoxic-ischemic encephalopathy (HIE) and in seriously ill neonates with cerebral abnormalities, either congenital or acquired, it plays a role in decision making on continuation or withdrawal of intensive treatment.10
The quality of neurosonography and its diagnostic accuracy depends on the ultrasound machine and also expertise of the examiner. When performed as per protocol, it is reliable investigation for commonly occurring neonatal events. Neurosonogram can be initiated even immediately after
birth and hence suitable for screening and can be repeated as often as possible without any adverse- affects and hence helps in proper follow-up of babies with neurological problems. In this review, we discuss the applications and indications of neonatal cUS.12
We list the most frequently occurring abnormalities of the neonatal brain, as seen on cUS in preterm and sick full-term neonates However, cUS also has several limitations: Quality of imaging depends on the skills and experience of the ultrasonographer, some areas of the brain is diffi cult to visualize, and several abnormalities remain beyond its scope.2
MATERIALS AND METHODS
This study was conducted in Vydehi Institute of Medical Sciences Hospital and Research Centre, Bengaluru between January 2014 and July 2015. A total of 100 neonates admitted to our NICU who were critically ill were included in the study.
All critically ill neonates admitted to NICU were selected as per the inclusion criteria on non-randomized manner and were subjected to neurosonography on selected days. If neurosonogram revealed any abnormal fi ndings, they were followed up for any sequelae.
All neonates admitted to NICU with prematurity, birth asphyxia, HIE, neonatal convulsions, neonatal sepsis, neonate with traumatic/instrumental delivery, respiratory distress, congenital malformation of central nervous system, and neural tube defects were included in the study.
After obtaining the informed consent from the parents/guardians neonates are included in the study. Factors that identify the neonate as “critically ill” were assessed by taking detailed maternal history looking into perinatal and antenatal records. Clinical examination and in detail neurological system was done.
All routine investigations were done for all babies and neurosonogram of the high-risk neonate fulfi lling the inclusion criteria was performed. Follow-up cUS was done in the case of presence of any fi ndings and for preterm neonates. Morphology of cUS fi ndings was studied and recorded and clinical correlation with various fi ndings on neurosonogram was done. Neonates were followed till recovery and discharge from NICU.
The sonograms were performed on a Philips HD 11 XE machine using a multi-frequency high-density
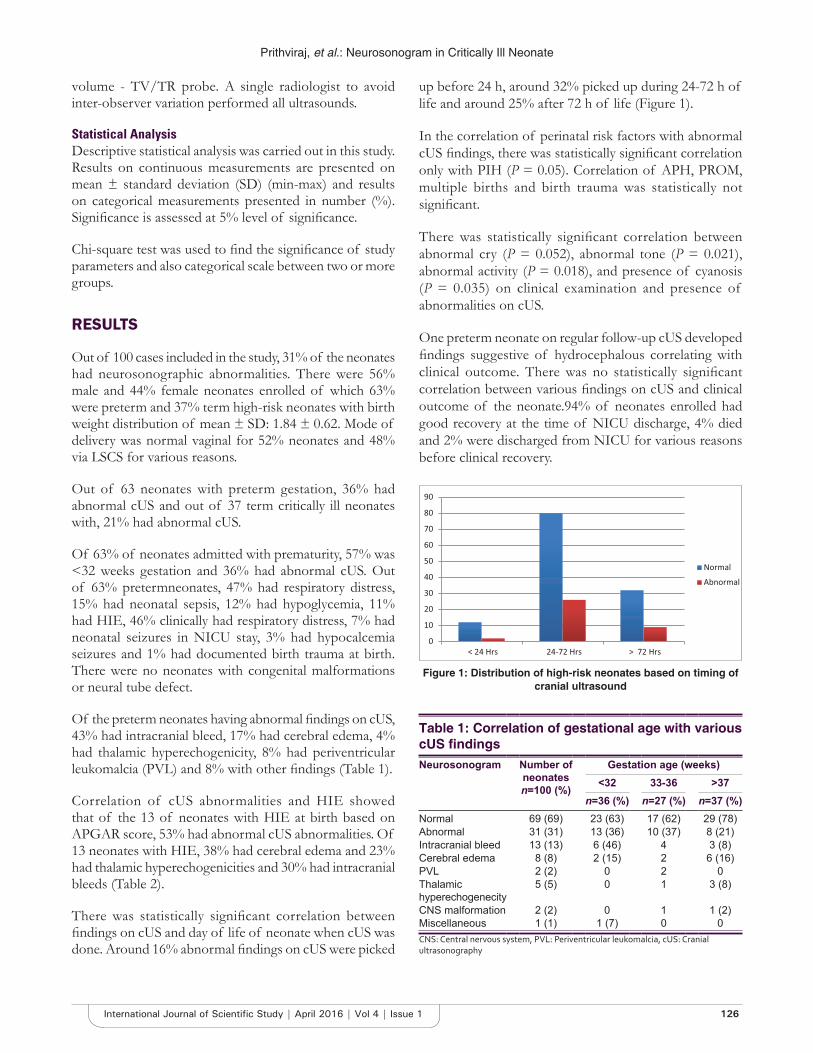
Prithviraj, et al.: Neurosonogram in Critically Ill Neonate
126International Journal of Scientifi c Study | April 2016 | Vol 4 | Issue 1
volume - TV/TR probe. A single radiologist to avoid inter-observer variation performed all ultrasounds.
Statistical AnalysisDescriptive statistical analysis was carried out in this study. Results on continuous measurements are presented on mean ± standard deviation (SD) (min-max) and results on categorical measurements presented in number (%). Signifi cance is assessed at 5% level of signifi cance.
Chi-square test was used to fi nd the signifi cance of study parameters and also categorical scale between two or more groups.
RESULTS
Out of 100 cases included in the study, 31% of the neonates had neurosonographic abnormalities. There were 56% male and 44% female neonates enrolled of which 63% were preterm and 37% term high-risk neonates with birth weight distribution of mean ± SD: 1.84 ± 0.62. Mode of delivery was normal vaginal for 52% neonates and 48% via LSCS for various reasons.
Out of 63 neonates with preterm gestation, 36% had abnormal cUS and out of 37 term critically ill neonates with, 21% had abnormal cUS.
Of 63% of neonates admitted with prematurity, 57% was <32 weeks gestation and 36% had abnormal cUS. Out of 63% pretermneonates, 47% had respiratory distress, 15% had neonatal sepsis, 12% had hypoglycemia, 11% had HIE, 46% clinically had respiratory distress, 7% had neonatal seizures in NICU stay, 3% had hypocalcemia seizures and 1% had documented birth trauma at birth. There were no neonates with congenital malformations or neural tube defect.
Of the preterm neonates having abnormal fi ndings on cUS, 43% had intracranial bleed, 17% had cerebral edema, 4% had thalamic hyperechogenicity, 8% had periventricular leukomalcia (PVL) and 8% with other fi ndings (Table 1).
Correlation of cUS abnormalities and HIE showed that of the 13 of neonates with HIE at birth based on APGAR score, 53% had abnormal cUS abnormalities. Of 13 neonates with HIE, 38% had cerebral edema and 23% had thalamic hyperechogenicities and 30% had intracranial bleeds (Table 2).
There was statistically signifi cant correlation between fi ndings on cUS and day of life of neonate when cUS was done. Around 16% abnormal fi ndings on cUS were picked
up before 24 h, around 32% picked up during 24-72 h of life and around 25% after 72 h of life (Figure 1).
In the correlation of perinatal risk factors with abnormal cUS fi ndings, there was statistically signifi cant correlation only with PIH (P = 0.05). Correlation of APH, PROM, multiple births and birth trauma was statistically not signifi cant.
There was statistically signifi cant correlation between abnormal cry (P = 0.052), abnormal tone (P = 0.021), abnormal activity (P = 0.018), and presence of cyanosis (P = 0.035) on clinical examination and presence of abnormalities on cUS.
One preterm neonate on regular follow-up cUS developed fi ndings suggestive of hydrocephalous correlating with clinical outcome. There was no statistically signifi cant correlation between various fi ndings on cUS and clinical outcome of the neonate.94% of neonates enrolled had good recovery at the time of NICU discharge, 4% died and 2% were discharged from NICU for various reasons before clinical recovery.
Table 1: Correlation of gestational age with various cUS fi ndingsNeurosonogram Number of
neonates n=100 (%)
Gestation age (weeks)<32 33-36 >37
n=36 (%) n=27 (%) n=37 (%)Normal 69 (69) 23 (63) 17 (62) 29 (78)Abnormal 31 (31) 13 (36) 10 (37) 8 (21)Intracranial bleed 13 (13) 6 (46) 4 3 (8)Cerebral edema 8 (8) 2 (15) 2 6 (16)PVL 2 (2) 0 2 0Thalamic hyperechogenecity
5 (5) 0 1 3 (8)
CNS malformation 2 (2) 0 1 1 (2)Miscellaneous 1 (1) 1 (7) 0 0CNS: Central nervous system, PVL: Periventricular leukomalcia, cUS: Cranial ultrasonography
0
10
20
30
40
50
60
70
80
90
< 24 Hrs 24-72 Hrs > 72 Hrs
NormalAbnormal
Figure 1: Distribution of high-risk neonates based on timing of cranial ultrasound
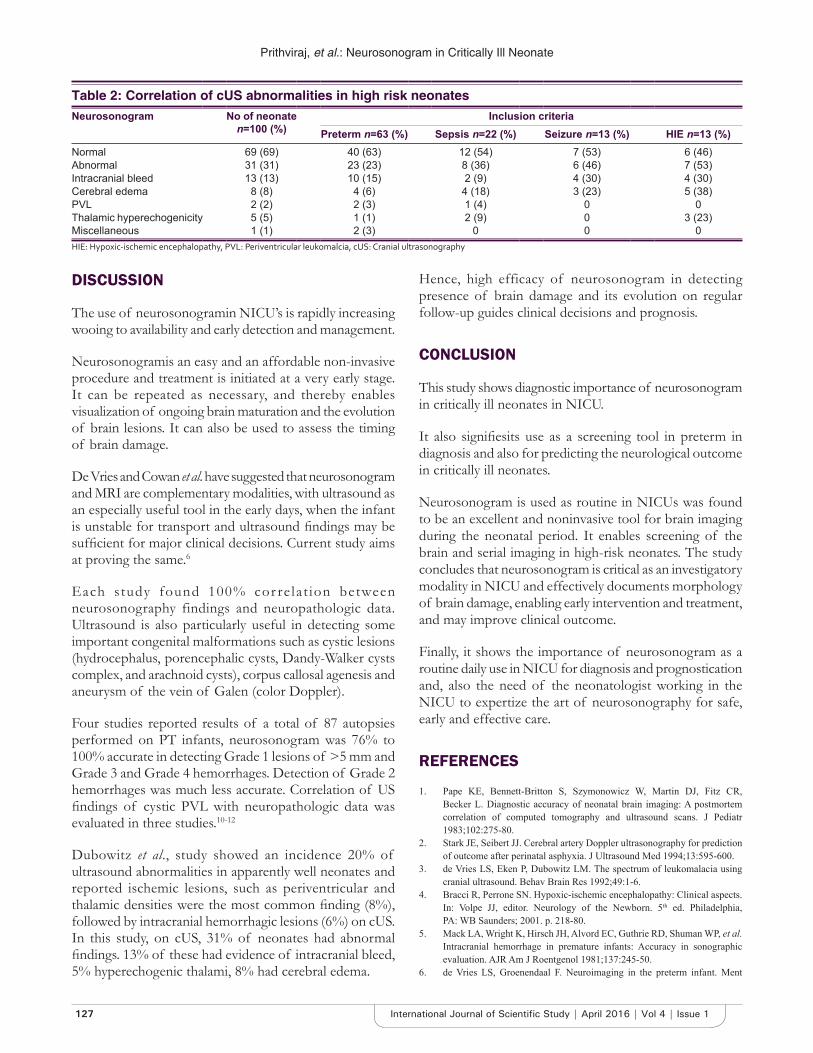
Prithviraj, et al.: Neurosonogram in Critically Ill Neonate
127 International Journal of Scientifi c Study | April 2016 | Vol 4 | Issue 1
DISCUSSION
The use of neurosonogramin NICU’s is rapidly increasing wooing to availability and early detection and management.
Neurosonogramis an easy and an affordable non-invasive procedure and treatment is initiated at a very early stage. It can be repeated as necessary, and thereby enables visualization of ongoing brain maturation and the evolution of brain lesions. It can also be used to assess the timing of brain damage.
De Vries and Cowan et al. have suggested that neurosonogram and MRI are complementary modalities, with ultrasound as an especially useful tool in the early days, when the infant is unstable for transport and ultrasound fi ndings may be suffi cient for major clinical decisions. Current study aims at proving the same.6
Each study found 100% cor re lat ion between neurosonography findings and neuropathologic data. Ultrasound is also particularly useful in detecting some important congenital malformations such as cystic lesions (hydrocephalus, porencephalic cysts, Dandy-Walker cysts complex, and arachnoid cysts), corpus callosal agenesis and aneurysm of the vein of Galen (color Doppler).
Four studies reported results of a total of 87 autopsies performed on PT infants, neurosonogram was 76% to 100% accurate in detecting Grade 1 lesions of >5 mm and Grade 3 and Grade 4 hemorrhages. Detection of Grade 2 hemorrhages was much less accurate. Correlation of US fi ndings of cystic PVL with neuropathologic data was evaluated in three studies.10-12
Dubowitz et al., study showed an incidence 20% of ultrasound abnormalities in apparently well neonates and reported ischemic lesions, such as periventricular and thalamic densities were the most common fi nding (8%), followed by intracranial hemorrhagic lesions (6%) on cUS. In this study, on cUS, 31% of neonates had abnormal fi ndings. 13% of these had evidence of intracranial bleed, 5% hyperechogenic thalami, 8% had cerebral edema.
Hence, high efficacy of neurosonogram in detecting presence of brain damage and its evolution on regular follow-up guides clinical decisions and prognosis.
CONCLUSION
This study shows diagnostic importance of neurosonogram in critically ill neonates in NICU.
It also signifi esits use as a screening tool in preterm in diagnosis and also for predicting the neurological outcome in critically ill neonates.
Neurosonogram is used as routine in NICUs was found to be an excellent and noninvasive tool for brain imaging during the neonatal period. It enables screening of the brain and serial imaging in high-risk neonates. The study concludes that neurosonogram is critical as an investigatory modality in NICU and effectively documents morphology of brain damage, enabling early intervention and treatment, and may improve clinical outcome.
Finally, it shows the importance of neurosonogram as a routine daily use in NICU for diagnosis and prognostication and, also the need of the neonatologist working in the NICU to expertize the art of neurosonography for safe, early and effective care.
REFERENCES
1. Pape KE, Bennett-Britton S, Szymonowicz W, Martin DJ, Fitz CR, Becker L. Diagnostic accuracy of neonatal brain imaging: A postmortem correlation of computed tomography and ultrasound scans. J Pediatr 1983;102:275-80.
2. Stark JE, Seibert JJ. Cerebral artery Doppler ultrasonography for prediction of outcome after perinatal asphyxia. J Ultrasound Med 1994;13:595-600.
3. de Vries LS, Eken P, Dubowitz LM. The spectrum of leukomalacia using cranial ultrasound. Behav Brain Res 1992;49:1-6.
4. Bracci R, Perrone SN. Hypoxic-ischemic encephalopathy: Clinical aspects. In: Volpe JJ, editor. Neurology of the Newborn. 5th ed. Philadelphia, PA: WB Saunders; 2001. p. 218-80.
5. Mack LA, Wright K, Hirsch JH, Alvord EC, Guthrie RD, Shuman WP, et al. Intracranial hemorrhage in premature infants: Accuracy in sonographic evaluation. AJR Am J Roentgenol 1981;137:245-50.
6. de Vries LS, Groenendaal F. Neuroimaging in the preterm infant. Ment
Table 2: Correlation of cUS abnormalities in high risk neonatesNeurosonogram No of neonate
n=100 (%)Inclusion criteria
Preterm n=63 (%) Sepsis n=22 (%) Seizure n=13 (%) HIE n=13 (%)Normal 69 (69) 40 (63) 12 (54) 7 (53) 6 (46)Abnormal 31 (31) 23 (23) 8 (36) 6 (46) 7 (53)Intracranial bleed 13 (13) 10 (15) 2 (9) 4 (30) 4 (30)Cerebral edema 8 (8) 4 (6) 4 (18) 3 (23) 5 (38)PVL 2 (2) 2 (3) 1 (4) 0 0Thalamic hyperechogenicity 5 (5) 1 (1) 2 (9) 0 3 (23)Miscellaneous 1 (1) 2 (3) 0 0 0HIE: Hypoxic-ischemic encephalopathy, PVL: Periventricular leukomalcia, cUS: Cranial ultrasonography

Prithviraj, et al.: Neurosonogram in Critically Ill Neonate
128International Journal of Scientifi c Study | April 2016 | Vol 4 | Issue 1
Retard Dev Disabil Res Rev 2002;8:273-80.7. Levene MI. Measurement of the growth of the lateral ventricles in preterm
infants with real-time ultrasound. Arch Dis Child 1981;56:900-4.8. Virkola K. The Lateral Ventricle in Early Infancy. Thesis, Helsinki; 1988.9. Van Wezel-Meijler G. Cranial Ultrasonography: Advantages and Aims.
Part 1, Neonatal Cranial Ultrasonography. 1st ed. Berlin: Springer;
2007. p. 3-4.10. de Vries LS, Cowan FM. Should cranial MRI screening of preterm infants
become routine? Nat Clin Pract Neurol 2007;3:532-3.11. Mosby. Mosby’s Medical Dictionary. 8th ed. London: Elsevier; 2009.12. Shankar P, Nithya S. Role of cranial ultrasound in high risk neonates in
NICU. J Evol Med Dent Sci 2014;3:3070-6.
How to cite this article: Prithviraj D, Reddy B, Reddy R, Shruthi B. Neurosonogram in Critically Ill Neonates in Neonatal Intensive Care Unit. Int J Sci Stud 2016;4(1):124-128.
Source of Support: Nil, Confl ict of Interest: None declared.
129 International Journal of Scientifi c Study | April 2016 | Vol 4 | Issue 1
Comparison of Transabdominal Preperitoneal and Total Extra Peritoneal: A Prospective StudyT Shivakumar1, B M Pavan1, C S Gurukiran2, N Chandrashekar2, N Satish Babu3, Naveen H Mahadev1, G B Chandan3, G N Prabhakara2
1Associate Professor, Department of General Surgery, Sri Siddhartha Medical College, Tumkur, Karnataka, India, 2Professor, Department of General Surgery, Sri Siddhartha Medical College, Tumkur, Karnataka, India, 3Assistant Professor, Department of General Surgery, Sri Siddhartha Medical College, Tumkur, Karnataka, India
Since Bassini published his landmark paper on the technique of tissue repair4 in 1887, numerous modifi cations have been proposed. There has been a revolution in surgical procedures for groin hernia repairs after the introduction of prosthetic material by Usher5 in 1958.
Ger reported the fi rst laparoscopic hernia repair in 1982 by approximating the internal ring with stainless steel clips.6 The laparoscopic transabdominal preperitoneal (TAPP) repair was a revolutionary concept in the hernia surgery and was introduced by Arregui et al.,7 and Dion and Morin8 in the early 1990s. Laparoscopic groin hernia repair can be done by TAPP approach and also by total extra peritoneal (TEP) approach.9
The learning curve of laparoscopic repair of inguinal hernia has been made all the more steep because of lack of documentation of results with regard to patient satisfaction, post-operative pain, duration of stay in the hospital, complications and recurrence of hernia, hence making stratifi cation of patients for either TEP or TAPP repair diffi cult.
INTRODUCTION
No disease of human body, belonging to the province of the surgeon, requires in its treatment a better combination of accurate, anatomical knowledge with surgical skill than hernia in all its varieties.1
Sir Astley Paston Cooper’s statement in 1804 still reverberates in the minds of surgeons. Groin hernias are the most common conditions referred to surgeons all over the world and over fi ve lakh hernia repairs are performed annually.2 The lifetime risk for men is 27% and for women is 3%.3
Original Article
Abstract
Background: Groin hernia surgeries have come a long way since knowledge of modern surgery. Among them, laparoscopic hernia repair is the advanced and better method in terms of cosmesis, bilateral repair, recurrent hernias.
Aims and Objectives: To compare operative time and post-operative pain in transabdominal preperitoneal (TAPP) and total extra peritoneal (TEP).
Materials and Methods: A total of 40 cases of groin hernia admitted in Sri Siddhartha Medical College, Tumkur, Karnataka, India, between 2013 and 2015 randomly picked for TAPP and TEP surgeries, assigning 20 for each, prospective analysis made results compared and evaluated using FISCHERS test and Chi-square test.
Results: Comparatively TEP repair took more time and TAPP repair had more pain.
Conclusion: No major complications in both procedures, laparoscopy repair has long learning curve which demands skills, TEP takes more time, and TAPP has more pain.
Key words: Duration, Pain, Total extraperitoneal, Transabdominal preperitoneal
Access this article online
www.ijss-sn.com
Month of Submission : 02-2016Month of Peer Review : 03-2016Month of Acceptance : 03-2016Month of Publishing : 04-2016
Corresponding Author: Dr. B M Pavan, Sambrama, Near Varadaraja Degree College, Jayanagara South, Shettihally Ring Road, Tumkur, Karnataka, India. Phone:+91-9880376716. E-mail: [email protected]
DOI: 10.17354/ijss/2016/203

Shivakumar, et al.: A Prospective Study: Comparision of TAPP and TEP
130International Journal of Scientifi c Study | April 2016 | Vol 4 | Issue 1
Our purpose in this study is to compare the results of laparoscopic hernioplasty by TEP technique and laparoscopic TAPP technique, and determine if the relative advantages achieved could be put in practice in large scale and also identify criteria which may help stratify the patient to a particular type of repair to obtain encouraging results for that particular patient. The aim of our study is to compare and assess the outcome between laparoscopic TAPP repair and TEP repair of inguinal hernia in terms of duration taken for procedures and post-operative pain.
MATERIALS AND METHODS
This was a prospective study. This study consisted of 40 patients of inguinal hernia treated with laparoscopic hernia repair, 20 of whom were treated by laparoscopic TAPP mesh repair and the remaining 20 cases treated by TEP mesh repair of inguinal hernia in Sri Siddhartha Medical College and Hospital from October 2013 to March 2015 which included a minimum of 1 year of follow-up.
Inclusion Criteria1. Male Patients above 18 years of age2. Unilateral inguinal hernia (proven by clinical
examination and abdominal ultrasound3. Patients fi t for laparoscopic hernia repair under general
anesthesia.
Exclusion CriteriaPatients with the following conditions are excluded from this study:1. Female patients2. Patients with recurrent hernia3. Patients with bilateral hernia4. Patients unfi t for general anesthesia5. Hernia with complications (irreducible hernia and
strangulated hernia).
All the patients were admitted, and a detailed history and clinical examination was carried out as per written Performa. Preoperatively the patients were be offered options of either laparoscopic TEP or laparoscopic TAPP repair for inguinal hernia, and will be educated about the advantages, disadvantages, type of anesthesia, and also the approximate cost of each of the procedure.
After taking consent for the procedure, the patient is investigated thoroughly. Once the patient is deemed fi t for surgery. A dose of prophylactic antibiotic was given 30 min before surgery. A Foleys catheter was inserted. Postoperatively the patients were kept nil by mouth and advised complete bed rest until the effect of anesthesia is completely worn out, until then they are given supportive
maintenance intravenous fl uids. Foley’s catheter is removed once the patient becomes ambulatory, usually on the fi rst post-operative day. Patients were advised and encouraged to ambulate and start their activities of daily life as early as possible.
Analgesics were given at 12 h interval for a period of 3-5 days, shifted on to oral tablets as early as possible. Patients were observed for any complications such as subcutaneous emphysema, mediastinitis, CO2 narcosis in the immediate post-operative period and hematoma, seroma, wound sepsis during their stay in the hospital and also assessed for post-operative pain and its severity.
Patients were discharged once free of complications and once they resumed their activities of daily normal life. Patients were discharged within the next day or within 48 h. At discharge, they were advised to come for stitch removal after 7-8 days (1st follow-up), and then after 1 week (2nd follow-up), and then after 1 month of surgery, (3rd follow-up). Later on after 3 months of surgery (4th follow-up) and after 6 months after surgery (5th follow-up) and at 1 year (6th follow-up).
Statistical MethodsDescriptive statistical analysis has been carried out in the present study. Results on continuous measurements are presented on mean ± standard deviation (min-max) and results on categorical measurements are presented in number (%). A signifi cance is assessed at 5% level of signifi cance. Student’s t-test (two-tailed, independent) has been used to fi nd the signifi cance of study parameters on continuous scale between two groups Chi-square/Fisher Exact test has been used to fi nd the signifi cance of study parameters on a categorical scale between two or more groups.
RESULTS
Study DesignThis prospective study consisted of 40 patients with diagnosis of inguinal hernia who were admitted to the surgical inpatient ward in Sri Siddhartha Hospital and Medical College, Tumkur and underwent laparoscopic hernioplasty during October 2013 to March 2015.Total number of cases - 40Number of laparoscopic (TEP) hernioplasty - 20Number of laparoscopic (TAPP) hernioplasty - 20.
All cases underwent detailed pre-operative assessment and their pre-operative findings and post-operative complications were meticulously recorded as per protocol. The fi ndings were tabulated and the following observations were made.

Shivakumar, et al.: A Prospective Study: Comparision of TAPP and TEP
131 International Journal of Scientifi c Study | April 2016 | Vol 4 | Issue 1
This comparative study with 20 patients undergoing laparoscopic TEP procedure and 20 patients undergoing laparoscopic TAPP procedure is undertaken to study the effi cacy based on the duration of operation, and post-operative pain. Descriptive statistical analysis has been carried out in the present study.
Table 1 shows patients were aged between 20 and 60 years in laparoscopic TEP group with the mean age being 41.6 ± 10.2 years.
Patients were aged between 20 and 60 years (in laparoscopic TAPP group, with the mean age being 41.13 ± 9.6 years.
In TEP mesh repair group, as shown in Table 2:• 10 (50%) right sided hernias• 10 (50%) left side hernias.
And in laparoscopic TAPP mesh repair group there were as follows:• 9 (45%) right sided hernias• 11 (55%) left sided hernias.
Table 3 shows the mean operative time was 110 min for laparoscopic TAPP hernia repair and 125 min for laparoscopic TEP hernia repair.
Hence, the overall mean operative time was signifi cantly less in laparoscopic TAPP repair than in laparoscopic TEP repair.
Table 4 shows a comparison of post-operative pain between laparoscopic TEP and laparoscopic TAPP hernia repair.
Post-operative pain was assessed using visual analog scale (score 1-10).
Pain score in laparoscopic TAPP group:• 6 patients (30%) with a score of <3 (mild pain)• 10 patients (50%) with a score of 3-6 (discomforting) and• 4 Patients (20%) with a score of >6 (distressing).
Pain score in laparoscopic TEP group:• 12 patients (60%) with a score of <3 (mild pain)• 8 patients (40%) with a score of 3-6 (discomforting)• No distressing pain seen in TEP group.
The difference between the two groups was statistically signifi cant. TEP group has less pain compared to TAPP group.
There were no major complications, but we had 12 patients with MINOR complications in our study.
There were 5 patients with minor complications in laparoscopic TEP group (25%).
There were 7 patients with minor complications in laparoscopic TAPP group (35%).
The complications observed in our study were as follows:1. Hematoma - 4 cases2. Seroma - 7cases.
Patients in laparoscopic TEP group has post-operative stay 4.4 days, when compared to laparoscopic TAPP group who took 4.65 days, with P = 0.7 which is statistically insignifi cant.
DISCUSSION
All the patients in our study were males. 55% of the population in the TEP group and 65% in the TAPP group,
Table 1: Age distribution of patients studiedAge group TAPP TEP Total20-30 5 2 730-40 6 6 1240-50 4 9 1350-60 5 3 8Total 20 20 40Chi-square: 3.71, P=0.29, Interpretation: Not signifi cant, TAPP: Transabdominal preperitoneal, TEP: Total extra peritoneal
Table 2: DiagnosisDiagnosis TAPP TEP TotalRight direct hernia 0 5 5Left direct hernia 0 3 3Right indirect hernia 9 5 14Left indirect hernia 11 7 18Total 20 20 40TAPP: Transabdominal preperitoneal, TEP: Total extra peritoneal
Table 3: Operative timeDuration of surgery (min) TAPP TEP Total80-100 5 0 5100-120 10 6 16120-140 5 14 19Total 20 20 40Mean±SD 110.90±12.02 125.50±7.46 P<0.0001SD: Standard deviation, TAPP: Transabdominal preperitoneal, TEP: Total extra peritoneal
Table 4: Post-operative painPost-operative pain (visual analog score)
TAPP TEP Total
<3 6 12 183-6 10 8 18>6 4 0 4Total 20 20 40Mean±SD 4.45±1.7 3.3±0.98 P=0.01SD: Standard deviation, TAPP: Transabdominal preperitoneal, TEP: Total extra peritoneal
Shivakumar, et al.: A Prospective Study: Comparision of TAPP and TEP
132International Journal of Scientifi c Study | April 2016 | Vol 4 | Issue 1
which shows skilled people preferred laparoscopic repair of inguinal hernia than open with an average of 60% of total study population.
In our study, the mean operative time was 110 min for laparoscopic TAPP hernia repair and 125 min for laparoscopic TEP hernia repair.
Hence, the overall mean operative time was signifi cantly less in laparoscopic TAPP repair than in laparoscopic TEP repair (Figure 1).
The operative time in various studies for laparoscopic TEP and laparoscopic TAPP repair is shown in Table 5.
The study by Hamaza et al., has similar results to our study as long duration in TEP group when compared to TAPP group.
Pain score in laparoscopic TAPP group, 6 patients (30%) with a score of <3 (mild pain), 10 patients (50%) with a score of 3-6 (discomforting) and 4 patients (20%) with a score of >6 (distressing).
Pain score in laparoscopic TEP group, 12 patients (60%) with a score of <3 (mild pain), 8 patients (40%) with a score of 3-6 (discomforting) and no distressing pain in TEP group.
The difference between the two groups was statistically signifi cant. TEP group has less pain compared to TAPP group (Figure 2).
The study conducted by Bansal et al.,13 shows similar results.
There were NO MAJOR complications, but we had 12 patients with MINOR complications in our study. 5 patients in TEP (25%) and 7 patients in TAPP (35%).
CONCLUSION
This study supports the view that laparoscopic TEP and TAPP mesh repair for inguinal hernia are safe and efficacious, as we did not encounter any major complications, which demanded conversion. However, comparatively TEP group showed superiority with respect to post-operative pain and early return to normal work. Although the duration of surgery (TEP) lasted little longer, still a long-term randomized control trials with enhanced sample size and reduced confounding factors are required to establish the absolute superiority of one technique over the other.
REFEREN CES
1. Nyhus LM. The Anatomy of Inguinal Region and its Relation to Groin Hernia. 4th ed. Hernia. Philadelphia: Lippincott; 1995. p. 16.
2. Swanstrom LL. Laparoscopic herniorrhaphy. Surg Clin North Am 1996;76:483-91.
3. Primatesta P, Goldacre MJ. Inguinal hernia repair: Incidence of elective and emergency surgery, readmission and mortality. Int J Epidemiol 1996;25:835-9.
4. Bassini E. Sulla cura redicala dell’ernia inguinale. Arch Soc Ital Chir 1887;4:380-8.
5. Usher F, Cogan J, Lowry T. A new technique for the repair of inguinal and incisional hernias. Arch Surg 1960;81:187-94.
6. Ger R. The management of certain abdominal herniae by intra-abdominal closure of the neck of the sac. Preliminary communication. Ann R Coll Surg Engl 1982;64:342-4.
7. Arregui ME, Davis CJ, Yucel O, Nagan RF. Laparoscopic mesh repair of inguinal hernia using a preperitoneal approach: A preliminary report. Surg Laparosc Endosc 1992;2:53-8.
8. Dion YM, Morin J. Laparoscopic inguinal herniorrhaphy. Can J Surg 1992;35:209-12.
9. McKernan B. Laparoscopic pre-peritoneal prosthetic repair of inguinal hernias. Surg Rounds 1992;7:579-610.
10. Leibl BJ, Jäger C, Kraft B, Kraft K, Schwarz J, Ulrich M, et al. Laparoscopic
Table 5: Operative time of different studiesStudy Laparoscopic TEP
hernia repair (in min)Laparoscopic TAPP
hernia repair (in min)Leibl et al.10 56 66Swanstorm, et al.11 (n=158) 57 (n=158) 92Hamaza, et al.12 (n=25) 96.12 (n=25) 77.4TAPP: Transabdominal preperitoneal, TEP: Total extra peritoneal
0
5
10
15
80-100 100-120 120-140
5
10
5
0
6
14
TAPP TEP
Figure 1: Duration for performing procedures
0
2
4
6
8
10
12
<3 3 to 6 >6
6
10
4
12
8
0
TAPP TEP
Figure 2: Post-operative pain

Shivakumar, et al.: A Prospective Study: Comparision of TAPP and TEP
133 International Journal of Scientifi c Study | April 2016 | Vol 4 | Issue 1
hernia repair – TAPP or/and TEP. Langenbeck’s Arch Surg 2005;390:77-82.11. Swanstorm LL. Laparoscopic herniorrhaphy Surg Clin North Am
1996;76:489.12. Hamaza Y, Gabr E, Hammadi H, Khalil R. Four arm RCT comparing open
and laparoscopic hernia repairs. Egypt J Surg 2009;28:110-7.
13. Bansal VK, Misra MC, Babu D, Victor J, Kumar S, Sagar R, et al. A prospective, randomized comparison of long-term outcomes: Chronic groin pain and quality of life following totally extraperitoneal (TEP) and transabdominal preperitoneal (TAPP) laparoscopic inguinal hernia repair. Surg Endosc 2013;27:2373-82.
How to cite this article: Shivakumar T, Pavan BM, Gurukiran CS, Chandrashekar N, Babu NS, Mahadev NH, Chandan GB, Prabhakara GN. Comparison of Transabdominal Preperitoneal and Total Extra Peritoneal: A Prospective Study. Int J Sci Stud 2016;4(1):129-133.
Source of Support: Nil, Confl ict of Interest: None declared.
134International Journal of Scientifi c Study | April 2016 | Vol 4 | Issue 1
Severe Acute Maternal Morbidity (Near Miss) in a Tertiary Care Center in Maharashtra: A Prospective StudyAlka Patankar1, Prashant Uikey2, Neha Rawlani3
1Associate Professor, Department of Obstetrics and Gynecology, Indira Gandhi Government Medical College, Nagpur, Maharashtra, India, 2Professor and Head, Department of Obstetrics and Gynecology, Indira Gandhi Government Medical College, Nagpur, Maharashtra, India, 3Post-graduate Resident, Department of Obstetrics and Gynecology, Indira Gandhi Government Medical College, Nagpur, Maharashtra, India
goals (MDG), MDG 5 with Target 5 A that calls for the reduction of maternal mortality ratio by three quarters between 1990 and 2015.1
Maternal near miss (MNM) case is defi ned as “a woman who nearly died but survived a complication that occurred during pregnancy, childbirth, or within 42 days of termination of pregnancy.”
Maternal mortality is frequently described as “just the tip of the iceberg” indicating that there is a vast base to the iceberg in the form of MNM, i.e., maternal morbidity which has remained largely undescribed.
INTRODUCTION
Maternal mortality is one of the important indicators used for the measurement of maternal health. Improvement of maternal health is one of the millennium development
Original Article
Abstract
Introduction: Maternal near miss (MNM) has emerged as an adjunct to the investigation of maternal deaths as the two represent similar pathological and circumstantial factors leading to severe maternal outcome.
Materials and Methods: A prospective observational study, conducted in Indira Gandhi Government Medical College and Hospital, a tertiary care center, from July 2014 to June 2015. The patients were classifi ed as near miss based on disease specifi c, organ system dysfunction, and management criteria.
Results: The total number of near miss cases was 98. The prevalence of MNM was 2.19%. The mean ± standard deviation of age in the present study was 27.84 ± 3.43 years. Majority of cases were nullipara, i.e., 33.68%. Most of the cases were of rural area 63.26%, had received only primary education at 62.25%, were of lower socio-economic status at 66.33%, were unbooked at 80.62%, and 69 cases were referred from periphery. In the present study, out of 98 cases, 88 were antenatal, of which 52 were above 37 weeks of gestation. Majority of cases were delivered by cesarean section, i.e., 46.93%. Hypertensive disorder of pregnancy was the most common factor causing near miss at 51.02%, others were obstetric hemorrhage at 43.87%, maternal medical disease at 13.26%, and obstetric sepsis at 3.06%. Vascular and coagulation system dysfunction was the most common, i.e., 28.57% followed by cardiac, 21.42%; respiratory, 19.38%; immunological, 12.24%; hepatic, 8.16%; cerebral, 6.1%; and renal dysfunction, 5.1%. About 64.28% patients required intensive care unit admission. Multiple management strategies including platelet and blood transfusions, vasopressors, furosemide, mechanical ventilation, dialysis, and hysterectomy were required.
Conclusion: MNM is associated with low level of education, low socio-economic status, rural population, low parity, referred cases, and unbooked cases. Hypertensive disorders are still the most common cause of MNM. A multidisciplinary approach is the need of the hour to tackle the problem of MNM.
Key words: Maternal morbidity, Maternal near miss, Tertiary care center
Access this article online
www.ijss-sn.com
Month of Submission : 02-2016Month of Peer Review : 03-2016Month of Acceptance : 04-2016Month of Publishing : 04-2016
Corresponding Author: Dr. Neha Rawlani, 21 Central Avenue, Darodkar Chowk, Multani Hospital, Nagpur - 440 002, Maharashtra, India. Phone: +91-7774047894. Tel.: 0712 - 2766060/0712 - 2764060. E-mail: [email protected]
DOI: 10.17354/ijss/2016/204
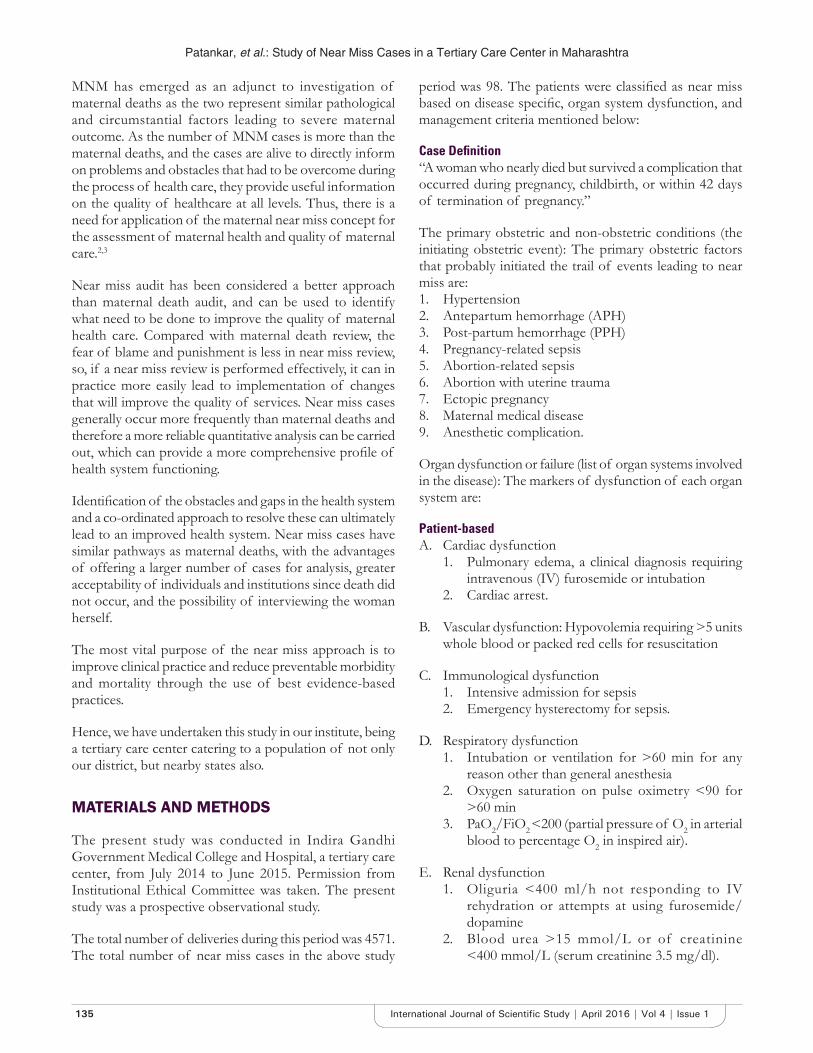
Patankar, et al.: Study of Near Miss Cases in a Tertiary Care Center in Maharashtra
135 International Journal of Scientifi c Study | April 2016 | Vol 4 | Issue 1
MNM has emerged as an adjunct to investigation of maternal deaths as the two represent similar pathological and circumstantial factors leading to severe maternal outcome. As the number of MNM cases is more than the maternal deaths, and the cases are alive to directly inform on problems and obstacles that had to be overcome during the process of health care, they provide useful information on the quality of healthcare at all levels. Thus, there is a need for application of the maternal near miss concept for the assessment of maternal health and quality of maternal care.2,3
Near miss audit has been considered a better approach than maternal death audit, and can be used to identify what need to be done to improve the quality of maternal health care. Compared with maternal death review, the fear of blame and punishment is less in near miss review, so, if a near miss review is performed effectively, it can in practice more easily lead to implementation of changes that will improve the quality of services. Near miss cases generally occur more frequently than maternal deaths and therefore a more reliable quantitative analysis can be carried out, which can provide a more comprehensive profi le of health system functioning.
Identifi cation of the obstacles and gaps in the health system and a co-ordinated approach to resolve these can ultimately lead to an improved health system. Near miss cases have similar pathways as maternal deaths, with the advantages of offering a larger number of cases for analysis, greater acceptability of individuals and institutions since death did not occur, and the possibility of interviewing the woman herself.
The most vital purpose of the near miss approach is to improve clinical practice and reduce preventable morbidity and mortality through the use of best evidence-based practices.
Hence, we have undertaken this study in our institute, being a tertiary care center catering to a population of not only our district, but nearby states also.
MATERIALS AND METHODS
The present study was conducted in Indira Gandhi Government Medical College and Hospital, a tertiary care center, from July 2014 to June 2015. Permission from Institutional Ethical Committee was taken. The present study was a prospective observational study.
The total number of deliveries during this period was 4571. The total number of near miss cases in the above study
period was 98. The patients were classifi ed as near miss based on disease specifi c, organ system dysfunction, and management criteria mentioned below:
Case Defi nition“A woman who nearly died but survived a complication that occurred during pregnancy, childbirth, or within 42 days of termination of pregnancy.”
The primary obstetric and non-obstetric conditions (the initiating obstetric event): The primary obstetric factors that probably initiated the trail of events leading to near miss are:1. Hypertension2. Antepartum hemorrhage (APH)3. Post-partum hemorrhage (PPH)4. Pregnancy-related sepsis5. Abortion-related sepsis6. Abortion with uterine trauma7. Ectopic pregnancy8. Maternal medical disease9. Anesthetic complication.
Organ dysfunction or failure (list of organ systems involved in the disease): The markers of dysfunction of each organ system are:
Patient-basedA. Cardiac dysfunction
1. Pulmonary edema, a clinical diagnosis requiring intravenous (IV) furosemide or intubation
2. Cardiac arrest.
B. Vascular dysfunction: Hypovolemia requiring >5 units whole blood or packed red cells for resuscitation
C. Immunological dysfunction1. Intensive admission for sepsis2. Emergency hysterectomy for sepsis.
D. Respiratory dysfunction1. Intubation or ventilation for >60 min for any
reason other than general anesthesia2. Oxygen saturation on pulse oximetry <90 for
>60 min3. PaO2/FiO2 <200 (partial pressure of O2 in arterial
blood to percentage O2 in inspired air).
E. Renal dysfunction1. Oliguria <400 ml/h not responding to IV
rehydration or attempts at using furosemide/dopamine
2. Blood urea >15 mmol/L or of creatinine <400 mmol/L (serum creatinine 3.5 mg/dl).

Patankar, et al.: Study of Near Miss Cases in a Tertiary Care Center in Maharashtra
136International Journal of Scientifi c Study | April 2016 | Vol 4 | Issue 1
F. Liver dysfunction1. Jaundice in the presence of pre-eclampsia (140/90
with >1 + proteinuria).
G. Metabolic dysfunction1. Diabetic ketoacidosis (DKA)2. Thyroid crisis.
H. Coagulation dysfunction: Acute thrombocytopenia requiring platelet transfusion
I. Cerebral dysfunction1. Coma >12 h2. Sub-arachnoid hemor rhage/intracrania l
hemorrhage.
Management-basedA. Intensive care admission; for any reasonB. Emergency hysterectomy; for any reasonC. Anesthetic accidentsD. Severe hypotension with spinal/epidural anesthesia
(<90 for 60 min)E. Failed tracheal intubation requiring anesthetic reversal.
RESULTS
The present study was conducted in a tertiary care center from July 2014 to June 2015. The total number of deliveries during this period was 4571. The total number of near miss cases in the above study period was 98. The patients were classifi ed as near miss based on disease specifi c, organ system dysfunction, and management criteria. The prevalence of MNM cases reported in this study was 2.19%.
Mean ± standard deviation (SD) of age in the present study is 27.84 ± 3.43 years. Majority of the cases were nullipara, 33 cases (33.68%); 26 cases (26.54%) were primipara, followed by 39 (39.78%) cases who were multipara. Most of the cases, in this study, 62 (63.26%) were from rural area, while 36 patients (36.73%) were from urban area. In this study, majority of patients, i.e., 61 cases (62.25%) had received their primary education followed by 16 cases (16.32%) who had received secondary education, and only 4 cases (4.08%) who had received higher secondary education and above. There were 17 (17.34%) patients who were illiterate. In the present study, 36 cases (36.74%) belonged to urban area and were classifi ed according to Kuppuswamy (1976) classifi cation, 19 out of 36 cases who belonged to urban area were of middle socio-economic class and 17 of 36 cases belonged to lower socio-economic class. About 62 from 98 cases (63.26%) belonged to rural area and were classifi ed according to Prasad classifi cation. Majority of the rural population, i.e., 48 cases (48.98%) belonged to lower
socio-economic class and the rest of the 14 cases (14.28%) belonged to middle socio-economic class. None of them were in upper socio-economic class. In the present study, out of 98 cases, antepartum admissions were 88 (89.8%), post-partum cases were 8 (8.16%), and post-abortion cases were 2 (2.04%). In the present study, 52 (59.09%) of 88 antenatal patients were beyond 37 weeks, 31 (35.32%) cases were between 33 and 36 weeks, 4 (4.55%) patients were between 29 and 32 weeks, while in 1 (1.14%) patient who belonged to <28 weeks group, the gestational age was 14 weeks. Majority of the cases were unbooked, 79 (80.62%) cases in the present study. Out of 98 cases, 69 cases were referred to our institute. Remaining 29 cases were admitted in our institute directly. Out of 29 cases, 28 were unbooked whereas 1 case was booked in our institute. Out of 69 referred cases, 18 cases were booked and 51 cases were unbooked. Majority of the cases, i.e., 42 (60.87%) were referred from district hospital, out of which 32 cases were unbooked amounting to 46.38%, followed by 15 cases (21.74%) which were referred from rural hospital, booked being 10 (14.49%). Next in order of frequency was referral from primary health center, i.e., 10 cases (14.5%), 7 being unbooked (10.15%). Only 2 cases (2.89%) were referred from private hospital which were unbooked. In the present study, maximum number of cases (46) was delivered by cesarean section amounting to 46.93%. Next in order of frequency were patients who delivered vaginally, that is, 44 (44.89%). 3 patients had abortion, one aborted in our institute while 2 had undergone abortion in rural health center and were referred as post-abortal sepsis. And, the remaining 5 cases were undelivered amounting to 5.12% (Table 1).
In the present study, more than two obstetric events occurred concurrently in the same patient. Hypertensive disorder of pregnancy was a major obstetric factor, that is, 50 patients (51.02%), out of these, 29 (29.59%) had severe pre-eclampsia, 16 (16.32%) had eclampsia, and 5 (5.1%) had HELLP. Next in order of frequency were cases of obstetric hemorrhage, total being 43 (43.87%), out of 43 patients, 12 had APH amounting to 12.24%, 28 (28.57%) had PPH, and 3 cases (3.06%) were of rupture uterus. There were 3 cases of obstetric sepsis. Among nonobstetric conditions, one MNM case suffered from complicated malaria. There were 2 cases of viral hepatitis with hyperbilirubinemia. There were 3 MNM cases who suffered from dengue, 3 MNM cases who had H1N1 infl uenza, and 4 cases of sickle-cell disease in crisis (Table 2).
In our study, majority of near miss cases, i.e., 28 of 98 (28.57%) had vascular dysfunction and coagulation dysfunction. The treatment modalities adopted for the management of vascular dysfunction were massive blood transfusion in 19 cases and obstetric hysterectomy was done in 9 cases to control the bleeding. Out of 28 cases,
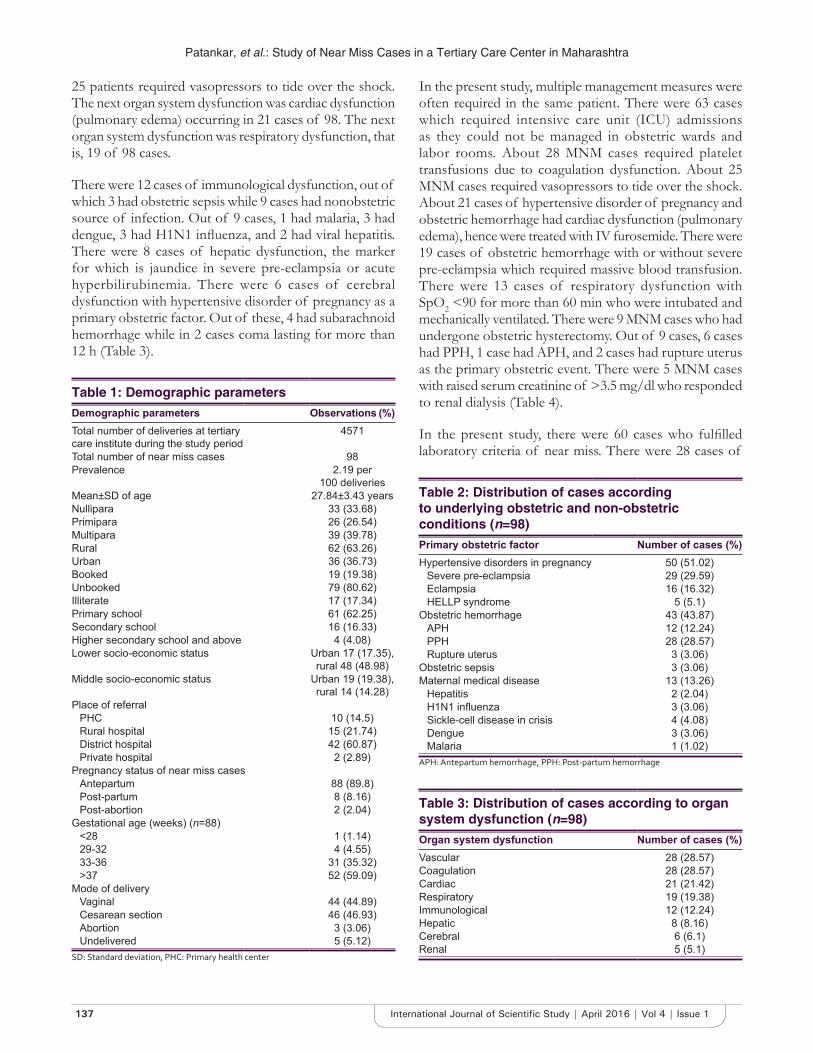
Patankar, et al.: Study of Near Miss Cases in a Tertiary Care Center in Maharashtra
137 International Journal of Scientifi c Study | April 2016 | Vol 4 | Issue 1
25 patients required vasopressors to tide over the shock. The next organ system dysfunction was cardiac dysfunction (pulmonary edema) occurring in 21 cases of 98. The next organ system dysfunction was respiratory dysfunction, that is, 19 of 98 cases.
There were 12 cases of immunological dysfunction, out of which 3 had obstetric sepsis while 9 cases had nonobstetric source of infection. Out of 9 cases, 1 had malaria, 3 had dengue, 3 had H1N1 infl uenza, and 2 had viral hepatitis. There were 8 cases of hepatic dysfunction, the marker for which is jaundice in severe pre-eclampsia or acute hyperbilirubinemia. There were 6 cases of cerebral dysfunction with hypertensive disorder of pregnancy as a primary obstetric factor. Out of these, 4 had subarachnoid hemorrhage while in 2 cases coma lasting for more than 12 h (Table 3).
In the present study, multiple management measures were often required in the same patient. There were 63 cases which required intensive care unit (ICU) admissions as they could not be managed in obstetric wards and labor rooms. About 28 MNM cases required platelet transfusions due to coagulation dysfunction. About 25 MNM cases required vasopressors to tide over the shock. About 21 cases of hypertensive disorder of pregnancy and obstetric hemorrhage had cardiac dysfunction (pulmonary edema), hence were treated with IV furosemide. There were 19 cases of obstetric hemorrhage with or without severe pre-eclampsia which required massive blood transfusion. There were 13 cases of respiratory dysfunction with SpO2 <90 for more than 60 min who were intubated and mechanically ventilated. There were 9 MNM cases who had undergone obstetric hysterectomy. Out of 9 cases, 6 cases had PPH, 1 case had APH, and 2 cases had rupture uterus as the primary obstetric event. There were 5 MNM cases with raised serum creatinine of >3.5 mg/dl who responded to renal dialysis (Table 4).
In the present study, there were 60 cases who fulfi lled laboratory criteria of near miss. There were 28 cases of
Table 1: Demographic parametersDemographic parameters Observations (%)Total number of deliveries at tertiary care institute during the study period
4571
Total number of near miss cases 98Prevalence 2.19 per
100 deliveriesMean±SD of age 27.84±3.43 yearsNullipara 33 (33.68)Primipara 26 (26.54)Multipara 39 (39.78)Rural 62 (63.26)Urban 36 (36.73)Booked 19 (19.38)Unbooked 79 (80.62)Illiterate 17 (17.34)Primary school 61 (62.25)Secondary school 16 (16.33)Higher secondary school and above 4 (4.08)Lower socio-economic status Urban 17 (17.35),
rural 48 (48.98)Middle socio-economic status Urban 19 (19.38),
rural 14 (14.28)Place of referral
PHC 10 (14.5)Rural hospital 15 (21.74)District hospital 42 (60.87)Private hospital 2 (2.89)
Pregnancy status of near miss casesAntepartum 88 (89.8)Post-partum 8 (8.16)Post-abortion 2 (2.04)
Gestational age (weeks) (n=88)<28 1 (1.14)29-32 4 (4.55)33-36 31 (35.32)>37 52 (59.09)
Mode of deliveryVaginal 44 (44.89)Cesarean section 46 (46.93)Abortion 3 (3.06)Undelivered 5 (5.12)
SD: Standard deviation, PHC: Primary health center
Table 2: Distribution of cases according to underlying obstetric and non-obstetric conditions (n=98)Primary obstetric factor Number of cases (%)Hypertensive disorders in pregnancy 50 (51.02)
Severe pre-eclampsia 29 (29.59)Eclampsia 16 (16.32)HELLP syndrome 5 (5.1)
Obstetric hemorrhage 43 (43.87)APH 12 (12.24)PPH 28 (28.57)Rupture uterus 3 (3.06)
Obstetric sepsis 3 (3.06)Maternal medical disease 13 (13.26)
Hepatitis 2 (2.04)H1N1 infl uenza 3 (3.06)Sickle-cell disease in crisis 4 (4.08)Dengue 3 (3.06)Malaria 1 (1.02)
APH: Antepartum hemorrhage, PPH: Post-partum hemorrhage
Table 3: Distribution of cases according to organ system dysfunction (n=98)Organ system dysfunction Number of cases (%)Vascular 28 (28.57)Coagulation 28 (28.57)Cardiac 21 (21.42)Respiratory 19 (19.38)Immunological 12 (12.24)Hepatic 8 (8.16)Cerebral 6 (6.1)Renal 5 (5.1)
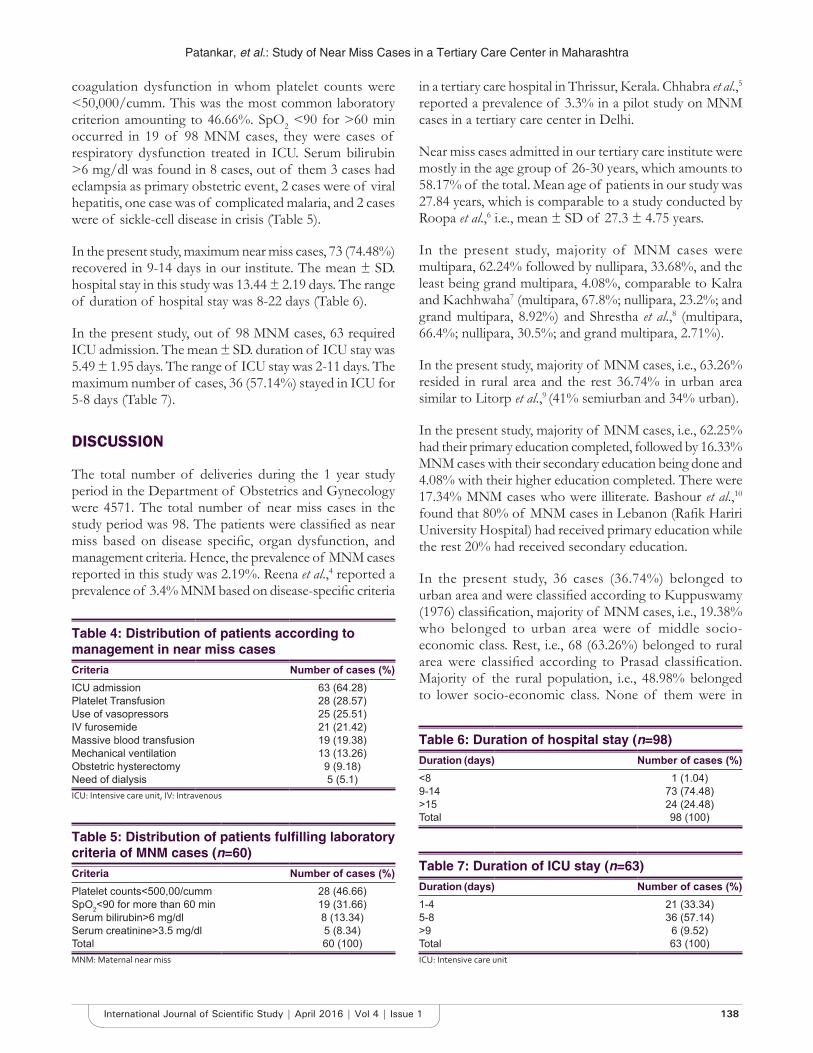
Patankar, et al.: Study of Near Miss Cases in a Tertiary Care Center in Maharashtra
138International Journal of Scientifi c Study | April 2016 | Vol 4 | Issue 1
coagulation dysfunction in whom platelet counts were <50,000/cumm. This was the most common laboratory criterion amounting to 46.66%. SpO2 <90 for >60 min occurred in 19 of 98 MNM cases, they were cases of respiratory dysfunction treated in ICU. Serum bilirubin >6 mg/dl was found in 8 cases, out of them 3 cases had eclampsia as primary obstetric event, 2 cases were of viral hepatitis, one case was of complicated malaria, and 2 cases were of sickle-cell disease in crisis (Table 5).
In the present study, maximum near miss cases, 73 (74.48%) recovered in 9-14 days in our institute. The mean ± SD. hospital stay in this study was 13.44 ± 2.19 days. The range of duration of hospital stay was 8-22 days (Table 6).
In the present study, out of 98 MNM cases, 63 required ICU admission. The mean ± SD. duration of ICU stay was 5.49 ± 1.95 days. The range of ICU stay was 2-11 days. The maximum number of cases, 36 (57.14%) stayed in ICU for 5-8 days (Table 7).
DISCUSSION
The total number of deliveries during the 1 year study period in the Department of Obstetrics and Gynecology were 4571. The total number of near miss cases in the study period was 98. The patients were classifi ed as near miss based on disease specifi c, organ dysfunction, and management criteria. Hence, the prevalence of MNM cases reported in this study was 2.19%. Reena et al.,4 reported a prevalence of 3.4% MNM based on disease-specifi c criteria
in a tertiary care hospital in Thrissur, Kerala. Chhabra et al.,5 reported a prevalence of 3.3% in a pilot study on MNM cases in a tertiary care center in Delhi.
Near miss cases admitted in our tertiary care institute were mostly in the age group of 26-30 years, which amounts to 58.17% of the total. Mean age of patients in our study was 27.84 years, which is comparable to a study conducted by Roopa et al.,6 i.e., mean ± SD of 27.3 ± 4.75 years.
In the present study, majority of MNM cases were multipara, 62.24% followed by nullipara, 33.68%, and the least being grand multipara, 4.08%, comparable to Kalra and Kachhwaha7 (multipara, 67.8%; nullipara, 23.2%; and grand multipara, 8.92%) and Shrestha et al.,8 (multipara, 66.4%; nullipara, 30.5%; and grand multipara, 2.71%).
In the present study, majority of MNM cases, i.e., 63.26% resided in rural area and the rest 36.74% in urban area similar to Litorp et al.,9 (41% semiurban and 34% urban).
In the present study, majority of MNM cases, i.e., 62.25% had their primary education completed, followed by 16.33% MNM cases with their secondary education being done and 4.08% with their higher education completed. There were 17.34% MNM cases who were illiterate. Bashour et al.,10 found that 80% of MNM cases in Lebanon (Rafi k Hariri University Hospital) had received primary education while the rest 20% had received secondary education.
In the present study, 36 cases (36.74%) belonged to urban area and were classifi ed according to Kuppuswamy (1976) classifi cation, majority of MNM cases, i.e., 19.38% who belonged to urban area were of middle socio-economic class. Rest, i.e., 68 (63.26%) belonged to rural area were classifi ed according to Prasad classifi cation. Majority of the rural population, i.e., 48.98% belonged to lower socio-economic class. None of them were in
Table 4: Distribution of patients according to management in near miss casesCriteria Number of cases (%)ICU admission 63 (64.28)Platelet Transfusion 28 (28.57)Use of vasopressors 25 (25.51)IV furosemide 21 (21.42)Massive blood transfusion 19 (19.38)Mechanical ventilation 13 (13.26)Obstetric hysterectomy 9 (9.18)Need of dialysis 5 (5.1)ICU: Intensive care unit, IV: Intravenous
Table 5: Distribution of patients fulfi lling laboratory criteria of MNM cases (n=60)Criteria Number of cases (%)Platelet counts<500,00/cumm 28 (46.66)SpO2<90 for more than 60 min 19 (31.66)Serum bilirubin>6 mg/dl 8 (13.34)Serum creatinine>3.5 mg/dl 5 (8.34)Total 60 (100)MNM: Maternal near miss
Table 6: Duration of hospital stay (n=98)Duration (days) Number of cases (%)<8 1 (1.04)9-14 73 (74.48)>15 24 (24.48)Total 98 (100)
Table 7: Duration of ICU stay (n=63)Duration (days) Number of cases (%)1-4 21 (33.34)5-8 36 (57.14)>9 6 (9.52)Total 63 (100)ICU: Intensive care unit
Patankar, et al.: Study of Near Miss Cases in a Tertiary Care Center in Maharashtra
139 International Journal of Scientifi c Study | April 2016 | Vol 4 | Issue 1
upper socio-economic class. Reena et al.,4 conducted a cross-sectional study in which the subjects were divided as below: Poverty line and above poverty line according to the ration card issued to them by the state government. The subjects with below poverty line ration cards were considered as having low income. Majority of women (53.3%) with severe obstetric morbidity came from families classifi ed as living below poverty line.
In the present study, 80.62% of MNM cases were unbooked, which was comparable in a study conducted by Shrestha et al.,8 and Roopa et al.,6 in which unbooked cases were 70% and 96.18 %, respectively. In the present study, 70% cases were referral cases, which is comparable to a study conducted by Kalra and Kachhwaha7 (64.2%) and Purandare11 (66.9%).
In the present study, 89.8% cases were antenatal, 8.16% cases were post-natal, and the rest 2.04% were post-abortion, which were comparable to the study conducted by Purandare et al.,12 (antenatal care [ANC], 665.22%; post-natal care, 24.6%; abortion, 5.3%; and post-abortion, 1.5%) and Roopa et al.,6 (ANC 74.9%, rest post-natal).
In the present study, majority of near miss cases were above 37 weeks gestation, which is comparable to the study conducted by Kalra and Kachhwaha7 (50% cases above 29 weeks) and Roopa et al.,6 (81.13 % cases above 29 weeks).
In the present study, 46.93% of MNM cases had cesarean section while 44.89% delivered vaginally, which is comparable to a study done by Almerie et al.,13 (lower segment cesarean section 54.3%, vaginal 45.7%).
In the present study, the major primary obstetric factor was hypertensive disorder of pregnancy amounting to 51.02%, similar to Almerie et al.,13 (52%), followed by obstetric hemorrhage, which amounted to 43.87%, similar to Roopa et al.,6 (44.2%), followed by maternal medical disease, 13.26% (malaria - 1.02%, H1N1 - 3.06%, hepatitis - 2.04%, dengue - 3.06%, and sickle-cell disease in crisis - 4.08%) and the least being obstetric sepsis amounting to 3.06% similar to Purandare et al., (3.8%).12
In the present study, majority of near miss cases had vascular dysfunction and coagulation dysfunction, that is, in 28.57% similar to Shrestha et al.,8 (vascular 14% and coagulation 8%), followed by cardiac in 21.42% cases similar to Mantel et al.,3 (20%), respiratory dysfunction in 19.38% cases, immunological dysfunction in 12.24% cases similar to Mantel et al., (18%),3 hepatic in 8.16% cases similar to Taly et al.,14 (9%), cerebral in 6.1% cases similar to Mantel et al., (5%),3 and renal in 5.1% cases similar to Shrestha et al., (5%).8
In the present study, 64.28% of MNM cases were admitted in ICU which is comparable to a study conducted by Roopa et al.,6 in which 62.6% of patients required ICU admission. In a study conducted by Lotufo et al.,15 39.6% of cases required massive blood transfusion, while in our institute, 19.38% of patients received massive blood transfusion. About 13.26% of patients required intubation with mechanical ventilation in our ICU, which is comparable to the results of Purandare et al.,12 where 11.7% of MNM cases required intubation with mechanical ventilation. In the present study, 9.18% of patients required obstetric hysterectomy, while in a study conducted by Purandare et al.,12 14.8% of cases had undergone obstetric hysterectomy.
In the present study, the most common laboratory criteria identifi ed was acute thrombocytopenia (<50,000 platelets) in 46.66 % cases, O2 saturation <90% for more than 60 min in 31.66% cases, total serum bilirubin >6 mg/dl in 13.34% cases, and serum creatinine >3.5 mg/dl in 8.34% cases. Oliveira and da Costa16 had 255 MNM cases in their study. They found that platelets were <50,000 in 32.5% cases, serum creatinine was >3.5 mg/dl in 16.1% cases, SpO2 <90% was in 10.6% cases, serum bilirubin was >6 mg/dl in 7.5% cases, PaO2/FiO2 <200 in 7.1% cases, DKA was present in 3.1% cases, and pH was <7.1 in 2.7% cases.
In the present study, the mean duration of hospital stay was 13.44 ± 2.19 days (range 8-22 days), which was comparable to a study conducted by Souza et al.,17 (mean hospital stay of 10.3 days, range: 13-24 days).
In the present study, the mean ICU stay was 5.49 ± 1.95 (range 2-11 days), which was comparable to a study conducted by Lotufo et al.,15 and Almerie et al.13
CONCLUSION
This study showed that among patients with MNM, there is a high frequency of women who have a low level of education, who are primiparous and who have had cesarean section. In addition, our study revealed that hypertensive disorder of pregnancy is still the most frequent underlying condition among such cases.
Maternal death and MNM cases are the indicators of the quality of health care provided. Obstetric ICU set up with a team approach consisting of treatment by obstetricians, intensive care specialists, and anesthesiologists are essential to save a maternal life. In our study, 63 cases were managed by multidisciplinary approach. The most vital purpose of the near miss approach is to improve clinical practice and reduce preventable morbidity and mortality through the use of best evidence-based practice.
Patankar, et al.: Study of Near Miss Cases in a Tertiary Care Center in Maharashtra
140International Journal of Scientifi c Study | April 2016 | Vol 4 | Issue 1
The most important factor associated with MNM found in our study was the referral status of women. All women need access to quality maternal health services that can diagnose and manage life-threatening complications. Many of the cases were unbooked, belonging to low socio-economic status. The emergency obstetric care and Janani Suraksha Yojna are already implemented, but from our study, it appears that the patients and their relatives have failed to avail them. Hence, there is a need to take steps to sensitize the population where literacy is poor and who hail from the rural areas about these facilities. It will help in improving maternal health in long run and even reduce the MNM cases.
The study has tried to understand the social causes responsible for maternal morbidity. Major initiatives are needed within the health system to improve the overall wellbeing of the community. What we need is a multi-disciplinary approach aimed at cutting each thread of the web of causation of mortality and morbidity in pregnancy among near-miss women.
REF ERENCES
1. World Health Organization, WHO. Trends in Maternal Mortality: 1990 to 2010. WHO, UNICEF, UNFPA, and the World Bank Estimates. Geneva, Switzerland: WHO; 2012. Available from: https://www.unfpa.org/sites/default/files/pub-pdf/Trends_in_maternal_mortality_A4-1.pdf.[Last accessed 2016 Jan 12].
2. Jayaratnam S, de Costa C, Howat P. Developing an assessment tool for maternal morbidity “near-miss”-a prospective study in a large Australian regional hospital. Aust N Z J Obstet Gynaecol 2011;51:421-5.
3. Mantel DG, Buchman E, Rees H, Pattinson RC. Severe acute maternal morbidity: A pilot study of a defi nition of a near-miss. Br J Obstet Gynaecol
1998;105:985-90.4. Reena RP, Umadevi N, Ajitha BK. Severe obstetric morbidity: Prevalence,
risk factors and outcome. Natl J Community Med 2015;6:33-5.5. Chhabra P, Guleria K, Saini NK, Anjur KT, Vaid NB. Pattern of severe
maternal morbidity in a tertiary hospital of Delhi, India: A pilot study. Trop Doct 2008;38:201-4.
6. Roopa PS, Shailja V, Lavanya R, Pratap K, Murlidhar VP, Jyothi S. Near Miss obstetric events and maternal deaths in a tertiary care hospital: An audit. J Pregnancy 2013;2013:5.
7. Kalra P, Kachhwaha CP. Obstetric near miss morbidity and maternal mortality in a Tertiary Care Centre in Western Rajasthan. Indian J Public Health 2014;58:199-201.
8. Shrestha NS, Saha R, Karki C. Near miss maternal morbidity and maternal mortality at Kathmandu Medical College Teaching Hospital. Kathmandu Univ Med J 2010;8:222-6.
9. Litorp H, Kidanto HL, Rööst M, Abeid M, Nyström L, Essén B. Maternal near-miss and death and their association with caesarean section complications: A cross-sectional study at a university hospital and a regional hospital in Tanzania. BMC Pregnancy Childbirth 2014;14:244.
10. Bashour H, Saad-Haddad G, DeJong J, Ramadan MC, Hassan S, Breebaart M, et al. A cross sectional study of maternal ‘near-miss’ cases in major public hospitals in Egypt, Lebanon, Palestine and Syria. BMC Pregnancy Childbirth 2015;15:296.
11. Purandare CN. Maternal near miss review: A way forward. J Obstet Gynaecol India 2013;63:213-5.
12. Purandare C, Bhardwaj A, Malhotra M, Bhushan H, Chhabra S, Shivkumar P. Maternal near-miss reviews: Lessons from a pilot programme in India. BJOG 2014;121 Suppl 4:105-11.
13. Almerie Y, Almerie MQ, Matar HE, Shahrour Y, Al Chamat AA, Abdulsalam A. Obstetric near-miss and maternal mortality in maternity university hospital, Damascus, Syria: A retrospective study. BMC Pregnancy Childbirth 2010;10:2-7.
14. Taly A, Gupta S, Iain N. Maternal intensive care and “near miss” mortality in obstetrics. J Obstet Gynecol India 2004;54:478-82.
15. Lotufo FA, Parpinelli MA, Haddad SM, Surita FG, Cecatti JG. Applying the new concept of maternal near-miss in an intensive care unit. Clinics (Sao Paulo) 2012;67:225-30.
16. Oliveira LC, da Costa AA. Maternal near miss in the intensive care unit: Clinical and epidemiological aspects. Rev Bras Ter Intensiva 2015;27:220-7.
17. Souza JP, Cecatti JG, Parpinelli MA, Serruya SJ, Amaral E. Appropriate criteria for identifi cation of near-miss maternal morbidity in tertiary care facilities: A cross sectional study. BMC Pregnancy Childbirth 2007;7:20.
How to cite this article: Patankar A, Uikey P, Rawlani N. Severe Acute Maternal Morbidity (Near Miss) in a Tertiary Care Center in Maharashtra: A Prospective Study. Int J Sci Stud 2016;4(1):134-140.
Source of Support: Nil, Confl ict of Interest: None declared.
141 International Journal of Scientifi c Study | April 2016 | Vol 4 | Issue 1
Comparison of Effi cacy of One-minute Endoscopy Room Test and Giemsa Stain in Detecting Helicobacter Pylori in Chronic GastritisE Nidhya1, S Sowmya2
1Post-graduate Student, Department of Pathology, Sri Manakula Vinayagar Medical College and Hospital, Puducherry, India, 2Professor and Head, Department of Pathology, Sri Manakula Vinayagar Medical College and Hospital, Puducherry, India
and endoscopy. Most of the gastritis was deemed idiopathic, until the discovery of Helicobacter pylori.1-3
The most common cause of gastritis is H. pylori. It has been linked with benign, premalignant, and malignant lesions of digestive system including chronic gastritis, intestinal metaplasia, adenocarcinomas of the distal part of stomach, and lymphomas of mucosa-associated lymphoid tissue.4,5
Marshall and Warren discovered H. Pylori, in 1983, using Warthin-Starry silver stain.1 Various stains including hematoxylin and eosin (H and E), Giemsa, toluidine blue, and genta have been used in detecting H. pylori.6
INTRODUCTION
Gastritis is defi ned as infl ammation of the gastric mucosa and is the most common non-functional cause for dyspepsia. There are various classifi cations of gastritis taking into account morphology, topography, epidemiology,
Original Article
Abstract
Background: Helicobacter pylori is the most common cause for gastritis in patients with dyspepsia where gastric mucosal biopsies are indicated to identify different forms of gastritis. The most commonly used classifi cation of gastritis is updated Sydney system. This study was done to fi nd the effi cacy of two tests - one-minute endoscopy room test (OMERT) and Giemsa stain for the identifi cation of H. pylori in biopsies with chronic gastritis.
Objectives: To detect the effi cacy of OMERT and Giemsa stain in the identifi cation of H. pylori infection in patients undergoing endoscopy with histopathological diagnosis of chronic gastritis.
Materials and Methods: The endoscopic biopsies from November 2013 to May 2015 were included for the study. One of the biopsied tissues was directly immersed in OMERT solution and remaining were fi xed in 10% formalin and processed and stained with hematoxylin and eosin, and Giemsa stain. The sensitivity and specifi city of H. pylori detection by OMERT and Giemsa stain in histopathologically diagnosed cases of chronic gastritis were compared. In-situ and invasive carcinomas, polyps, and gastroesophageal junction biopsies were excluded from the study.
Results: Out of 53 cases studied, chronic non-specifi c gastritis was the most common type accounting for 21 cases, followed by 12 cases of chronic superfi cial gastritis, 10 cases of H. pylori gastritis, 9 cases of chronic active gastritis, and 1 case of chronic atrophic gastritis. H. pylori was positive in 13 (24.5%) cases by OMERT and 10 (18.9%) cases were positive by Giemsa stain. Both the techniques showed similar accuracy (83%).
Conclusion: In the present study, both OMERT and Giemsa stain were found to be having similar accuracy (83%). The sensitivity of OMERT was higher (78%), whereas Giemsa stain showed more specifi city (92%). To avoid diagnostic pitfalls, the combination of two techniques is preferable rather than a single technique.
Key words: Chronic gastritis, Giemsa stain, Helicobacter pylori, Histopathology, One-minute endoscopy room test
Access this article online
www.ijss-sn.com
Month of Submission : 02-2016Month of Peer Review : 03-2016Month of Acceptance : 03-2016Month of Publishing : 04-2016
Corresponding Author: Dr. E Nidhya, 9/11A, Thulasidhasar Street, Bharathipuram, Papampatti Pirivu, Coimbatore - 641 103, Tamil Nadu, India. Phone: +91-9787857909. E-mail: [email protected]
DOI: 10.17354/ijss/2016/205

Nidhya and Sowmya: Comparison of Effi cacy of One-minute Endoscopy Room Test and Giemsa Stain in Detecting Helicobacter Pylori in Chronic Gastritis
142International Journal of Scientifi c Study | April 2016 | Vol 4 | Issue 1
The histological method was considered as the “gold standard” for demonstrating H. pylori in endoscopic biopsies. A heavy bacterial load is apparent on routine H and E stained sections but a low density of organisms, requires special staining techniques.7
H. pylori can be easily identifi ed as a purple curve shaped microorganism against a blue background on Giemsa stain.6
One-minute endoscopy room test (OMERT) is an invasive endoscopy test, which does not need complex procedures and stains. The presence of H. pylori can be diagnosed within maximum of 5 min, which helps in immediate initiation of treatment and it has a high sensitivity.8
Since H. pylori is one among the treatable causes of gastritis, and it is a part of the etiological classifi cation of chronic gastritis in updated Sydney system, it is mandatory to document whether H. pylori is present or absent in a given gastric biopsy.9 Hence, the present study was conducted to compare the accuracy of Giemsa stain and OMERT test to identify the bacilli in chronic gastritis.
MATERIALS AND METHODS
This study was undertaken in the Department of Pathology, Sri Manakula Vinayagar Medical College and Hospital, Puducherry. The study was conducted from November 2013 to April 2015 for 18-month after obtaining clearance from the Ethical Committee. Clinical details including age, gender, clinical diagnosis and endoscopy fi ndings were noted on histopathologically diagnosed cases of gastritis.
Inclusion of SamplesThe gastric biopsy specimens, taken from antrum, fundus, corpus, and incisura angularis of the stomach, received in the Department of Pathology were included.
Collection of SpecimenBiopsies were taken with a fl exible fi beroptic gastroscope OLYMPUS.
One of the bits was immersed in urea solution for OMERT. This test utilizes 10% urea solution at pH 6.8 and addition of 1% freshly prepared phenol. The presence of H. pylori is indicated by the change of color of the solution from yellow to pink within 5 min (Figure 1).8
Remaining tissue bits were fixed in 10% buffered formalin and were taken for conventional processing. After processing, tissues were embedded in paraffi n wax. Sections were cut serially at a thickness of 4-5 μ. Multiple sections were taken from each block and were stained for hematoxylin and eosin (H and E) and Giemsa.
The H and E stained slides were analyzed, and the samples which were histopathologically diagnosed as chronic gastritis only were included for the study. The classifi cation was based on Sydney system.
Exclusion CriteriaThe biopsies with in-situ or invasive carcinoma on histopathologic examination were excluded from the study. Furthermore, the biopsies taken from the esophagogastric junction, inadequate biopsies, and gastric polyps were excluded.
RESULTS
A total of 53 endoscopic gastric biopsy specimens diagnosed as gastritis of any type across all ages were taken for the study over a period of 18-month. Of the total 53 cases, 21 cases were diagnosed as chronic non-specifi c gastritis, 12 cases were chronic superfi cial gastritis, 10 cases of chronic H. pylori gastritis, 9 cases of chronic active gastritis, and a single case diagnosed as chronic atrophic gastritis.
Among these 53 cases, H. pylori was positive in 13 cases by OMERT and 10 cases were positive on Giemsa stain (Figure 2).
In comparison to Giemsa stain, OMERT showed more number of positive cases (24.5%) (Table 1).
Among the two techniques used in the study, OMERT was more sensitive (70%) while Giemsa stain was more specifi c with 92% specifi city. However, the accuracy level of both the tests was equal (83%) (Table 2).
In 70% of the H. pylori positive cases, the mucinous epithelium was found to be intact with signifi cant P value (Table 3 and Figure 3).
Both H. pylori and non - H. pylori gastritis showed mild degree of vascularity with moderate degree of infl ammation. Moderate activity was seen in H. pylori gastritis, whereas in non-H. pylori gastritis, majority showed nil activity. Intestinal metaplasia was more frequently seen
Table 1: H. pylori positivity on OMERT and Giemsa stainH. pylori n (%)
OMERT GiemsaPositive 13 (24.5) 10 (18.9)Negative 40 (75.5) 43 (81.1)Total 53 (100) 53 (100)H. pylori: Helicobacter pylori, OMERT: One-minute endoscopy room test

Nidhya and Sowmya: Comparison of Effi cacy of One-minute Endoscopy Room Test and Giemsa Stain in Detecting Helicobacter Pylori in Chronic Gastritis
143 International Journal of Scientifi c Study | April 2016 | Vol 4 | Issue 1
in non-H. pylori gastritis. No dysplasia was seen in H. pylori positive gastritis (Table 4).
DISCUSSION
In our study, 53 patients with dyspepsia were evaluated on gastric endoscopic biopsies for histopathological gastric mucosal changes and H. pylori positivity over a period of 18-month.
The biopsies taken from the esophagogastric junction, gastric polyps, carcinoma, and inadequate biopsies were excluded from the study.
In 1984, Marshall and Warren, in their study showed that among 20 cases of chronic gastritis, 12 were positive for H. pylori (60%).2 Our study showed a lesser positivity which can be attributed to the following reasons.
The environmental factors in the population under study may be a factor. Furthermore, in many of the previous studies, culture also was used which was highly sensitive and capable of demonstrating the organism even when the load was less (Tables 5 and 6). Among the 53 cases in our study, 26 cases showed intestinal metaplasia and 31 cases had mucosal ulceration. Both these changes are known to alter the pH of gastric mucosa, and render it unfavorable for the growth of H. pylori which requires a slightly alkaline pH.13
Misra et al., in their study showed that the numbers of H. pylori positive cases were increased with the increasing grades of gastritis, and the association was found to be statistically signifi cant.14 In our study, the number of cases of H. pylori was seen more with moderate severity of
Table 2: Level of accuracy of OMERT in comparison with GiemsaTechnique Positive Negative Sensitivity (%) Specifi city (%) PPV (%) NPV (%) Accuracy (%)OMERT 13 40 70 86.05 53.85 92.5 83.02Giemsa 10 43 53 92 70 86 83OMERT: One-minute endoscopy room test, PPV: Positive predictive value, NPV: Negative predictive value
Table 3: Nature of epithelium in relation to H. pylori statusH. Pylori on Giemsa
Mucinous epithelium Statisticsn (%)
Intact Ulcer TotalPositive 7 (70.0) 3 (30.0) 10 (100) χ2=4.121
df=1P=0.042
Negative 15 (34.9) 28 (65.1) 43 (100)
Total 22 (41.5) 31 (58.5) 53 (100)H. pylori: Helicobacter pylori
Table 4: Comparison of morphological parameters with H. pylori statusH. pylori n (%) Statistics
Positive (n=10) Negative (n=43)Infl ammation
Mild 2 (20) 8 (18.6) χ2=1.792df=2
P=0.4082Moderate 7 (70) 22 (51.2)Severe 1 (10) 13 (24.5)
ActivityMild 3 (30) 6 (14.0) χ2=3.502
df=2P=0.1736
Moderate 5 (50) 3 (7.0)Severe 2 (20) 1 (2.3)
VascularityMild 6 (60) 22 (51.2) χ2=0.6099
df=2P=0.7372
Moderate 2 (20) 14 (26.4)Severe 2 (20) 7 (16.3)
MetaplasiaMild 2 (20) 17 (39.5) χ2=0.3041
df=2P=0.8589
Moderate 1 (10) 5 (11.6)Severe 0 (0) 1 (2.3)
DysplasiaNil 10 (100) 40 (93.0) χ2=0.7395
df=1P=0.3898
Severe 0 (0) 3 (7.0)
H. pylori: Helicobacter pylori
Table 5: Comparison of H. pylori positivity with previous studiesStudy Country Positivity for
H. pylori (%)Method used for identifi cation
Rokkas et al.10 England 45 HistopathologyPettross et al.11 USA 43 Culture, Silver stainAbdulla et al.12 Indonesia 68 Culture, Silver stain,
Rapid urease testPresent study India 18.9 Giemsa stain
24.5 OMERTH. pylori: Helicobacter pylori, OMERT: One-minute endoscopy room test
Table 6: Comparison of H. pylori detection by OMERT and Giemsa stain with previous studyTechnique Jeelani Romshoo et al.8 (%) Present study (%)OMERT
Sensitivity 80 70Specifi city 92.86 86.05
GiemsaSensitivity 74 53Specifi city 78.57 92
H. pylori: Helicobacter pylori, OMERT: One-minute endoscopy room test
True positive: 7 False positive: 3True negative: 37 False negative: 6

Nidhya and Sowmya: Comparison of Effi cacy of One-minute Endoscopy Room Test and Giemsa Stain in Detecting Helicobacter Pylori in Chronic Gastritis
144International Journal of Scientifi c Study | April 2016 | Vol 4 | Issue 1
infl ammation and was found to be statistically insignifi cant (Figure 4).
Although both the tests had good sensitivity and specifi city with same accuracy level (83%), we encountered a few minor pitfalls.
Pitfalls in OMERTOMERT showed false positivity in three cases. This may be due to immersing the endoscopic biopsy forceps into the container containing the solution thereby rendering the solution alkaline, which causes color change to pink, the criteria for positivity. Hence, the biopsy bit to be immersed should be taken by a sterile needle from the scopy forceps and then placed in the solution.
Pitfalls in Giemsa StainGiemsa stained sections, in few cases showed stain particles or other non-metachromatic bacteria which caused
diffi culty in identifying the H. pylori. However, H. pylori was identifi ed only based on the curved architecture and metachromatic staining characteristic which made this method very specifi c.
In the present study, H. pylori was found in 18.9% and was associated with moderate infl ammation and activity. Both Giemsa stain and OMERT were having similar accuracy levels (83%); however, OMERT was more sensitive, and Giemsa stain was more specifi c.
CONCLUSION
The present study had 53 cases of histopathologically diagnosed gastritis for 18-month, and histopathological parameters were analyzed along with H. pylori status in all these patients by two methods (OMERT and Giemsa stain).
Among the 53 cases, H. pylori was positive in 13 (24.5%) cases by OMERT and 10 (18.9%) cases were positive by
Figure 1: One-minute endoscopy room test: Positive (pink); negative (light yellow)
Figure 2: Helicobacter pylori, curved metachromatic bacilli (arrow) - Giemsa, ×100
Figure 3: Mucosa with intact surface epithelium, regular glands, mild infl ammation and hemorrhage in the lamina propria,
hematoxylin, and eosin, ×10
Figure 4: Dense infl ammation in the lamina propria, hematoxylin and eosin, ×10

Nidhya and Sowmya: Comparison of Effi cacy of One-minute Endoscopy Room Test and Giemsa Stain in Detecting Helicobacter Pylori in Chronic Gastritis
145 International Journal of Scientifi c Study | April 2016 | Vol 4 | Issue 1
Giemsa stain. OMERT test showed higher sensitivity (70%), whereas Giemsa stain showed higher specifi city (92%). However, the accuracy levels of both techniques were similar (83%).The presence of H. pylori is directly proportionate to the degree of infl ammation and activity in chronic gastritis.
Non-invasive tests for detection of H. pylori may be preferred choice for clinicians, but histopathological demonstration of the organism has the advantage of accuracy. Furthermore, it gives us a chance to study the associated histopathological changes which may be of prognostic value.
In view of avoiding, the pitfalls of each technique and to avail the advantage of morphological correlation, the combination of both techniques will be benefi cial.
REFERENCES
1. Unidentifi ed curved bacilli on gastric epithelium in active chronic gastritis. Lancet 1983;1:1273-5.
2. Marshall BJ, Warren JR. Unidentifi ed curved bacilli in the stomach of patients with gastritis and peptic ulceration. Lancet 1984;1:1311-5.
3. Goodwin CS, Armstrong JA, Marshall BJ. Campylobacter pyloridis, gastritis and peptic ulceration. J Clin Pathol 1986;39:153-65.
4. Cheng ML, Lewin KJ. Understanding Helicobacter pylori. Hum Pathol 2001;32:247-9.
5. D’Elios MM. Helicobacter pylori, the story so far. Med Secoli 2007;19:641-5.
6. Bancroft JD, Stevens A, Turner DR. Theory and Practice of Histological Techniques. 4th ed. New York: Churchill Livingstone; 1996.
7. Toulaymat M, Marconi S, Garb J, Otis C, Nash S. Endoscopic biopsy pathology of Helicobacter pylori gastritis. Comparison of bacterial detection by immunohistochemistry and Genta stain. Arch Pathol Lab Med 1999;123:778-81.
8. Jeelani Romshoo GH, Malik GM, Youssuf Bhat M, Rashid Rather AB, Basu JA, Qureshi KA. Helicobacter pylori associated antral gastritis in peptic ulcer disease patients and normal healthy population of Kashmir, India. Diagn Ther Endosc 1997;4:4135-9.
9. Dixon MF, Genta RM, Yardley JH, Correa P. Classifi cation and grading of gastritis. The updated Sydney System. International Workshop on the histopathology of gastritis, Houston 1994. Am J Surg Pathol 1996;20:1161-81.
10. Rokkas T, Pursey C, Uzoechina E, Dorrington L, Simmons NA, Filipe MI, et al. Campylobacter pylori and non-ulcer dyspepsia. Am J Gastroenterol 1987;82:1149-52.
11. Pettross CW, Appleman MD, Cohen H, Valenzuela JE, Chandrasoma P, Laine LA. Prevalence of Campylobacter pylori and association with antral mucosal histology in subjects with and without upper gastrointestinal symptoms. Dig Dis Sci 1988;33:649-53.
12. Abdullah M, Ohtsuka H, Rani AA, Sato T, Syam AF, Fujino MA. Helicobacter pylori infection and gastropathy: A comparison between Indonesian and Japanese patients. World J Gastroenterol 2009;15:4928-31.
13. Harris AW, Misiewicz JJ. Helicobacter Pylori. 12th ed. London: Blackwell Healthcare Communications Ltd.; 1996.
14. Misra V, Misra SP, Singh MK, Singh PA, Dwivedi M. Prevalence of H. pylori in patients with gastric cancer. Indian J Pathol Microbiol 2007;50:702-7.
How to cite this article: Nidhya E, Sowmya S. Comparison of Effi cacy of One-minute Endoscopy Room Test and Giemsa Stain in Detecting Helicobacter Pylori in Chronic Gastritis. Int J Sci Stud 2016;4(1):141-145.
Source of Support: Nil, Confl ict of Interest: None declared.
146International Journal of Scientifi c Study | April 2016 | Vol 4 | Issue 1
Susceptibility to Pulmonary Tuberculosis as a Function of ABO-Rh Blood Group AntigensGourahari Pradhan1, Ansuman Sahu2, Pradeep Kumar Giri3, Jyotiranjan Sahoo4
1Senior Resident, Department of Pulmonary Medicine, All India Institute of Medical Sciences, Sijua, Bhubaneswar, Odisha, India, 2Senior Resident, Department of Transfusion Medicine, M.K.C.G. Medical College, Berhampur, Odisha, India, 3Senior Resident, Department of Pulmonary Medicine, Sriram Chandra Bhanja Medical College, Cuttack, Odisha, India, 4Senior Resident, Department of Community and Family Medicine, All India Institute of Medical Sciences, Bhubaneswar, Odisha, India
coughing, sneezing, and speaking. Identifi ed risk factors for TB are overcrowding, poor ventilation, young age, low socioeconomic status, addictions such as alcohol and smoking, occupational risk such as health care workers, human immunodefi ciency virus infection (HIV), diabetes, and malnutrition.3 Apart from these well-established factors other markers or individual trait increasing the incidence and prevalence of TB has been debated in view of geographical and ethnic. One of such debated factor is relation blood group and TB.
Landsteiner, in the year 1901, discovered ABO blood group system and marked the era of safe blood transfusion.4 It also provided a strong factor contributing to identity and individuality of people. Since then, the association of ABO blood groups with various diseases has intrigued many researchers. Susceptibility to TB as a function of blood group has been studied previously, and the results were variable. We conducted this study to look for association
INTRODUCTION
More than 130 years have passed since Sir Robert Koch fi rst discovered the causative agent of tuberculosis (TB), i.e., Mycobacterium tuberculosis1 but it still remains a major health problem globally. According to the World Health Organization Global TB Report 2015, 9.6 million people fell ill, and 1.2 million people died of TB in the year 2014.2 TB is an infectious disease transmitted most commonly through droplet nuclei released into the atmosphere by people suffering from pulmonary TB (PTB) through
Original Article
Abstract
Background: Earlier studies have proved a strong correlation between ABO blood groups and specifi c diseases, but for pulmonary tuberculosis (PTB) no consensus has been reached as the study results have been variable.
Aims: This study was done to establish any possible correlation between ABO blood groups/Rh D status and sputum acid-fast bacillus positive PTB and also to fi nd out the frequency distribution of ABO blood groups in a population of Odisha, an eastern state of India.
Materials and Methods: Blood grouping was done for 122 smear positive PTB cases (study group) during the study period of September 2010 - August 2012. During the same period, blood group data of 2842 healthy blood donors (control group) were collected. This data were analyzed using Chi-square test to establish any possible correlation.
Results: Blood Groups “A” and “B” have a signifi cant association with sputum smear positive PTB (P = 0.005 and 0.0002, respectively). Rh D status has no correlation with sputum positive PTB (P = 0.073). Most common blood groups among residents of the coastal belt of Odisha are blood Group “O” (36.6%) and “B” (33.3%).
Conclusions: Individuals having blood Group “A” or “B” are more likely to suffer from tuberculosis compared to blood Group “O” and “AB” in Eastern India. The reason for this vulnerability is not known.
Key words: ABO blood group, Acid-fast bacillus, Pulmonary tuberculosis, Rh D status, Sputum
Access this article online
www.ijss-sn.com
Month of Submission : 02-2016Month of Peer Review : 03-2016Month of Acceptance : 03-2016Month of Publishing : 04-2016
Corresponding Author: Dr. Gourahari Pradhan, Senior Resident, Department of Pulmonary Medicine, All India Institute of Medical Sciences, Sijua, Bhubaneswar - 751 019, Odisha, India. Phone: +91-8895394499. E-mail: [email protected]
DOI: 10.17354/ijss/2016/206

Pradhan, et al.: Association of PTB and ABO Blood Groups
147 International Journal of Scientifi c Study | April 2016 | Vol 4 | Issue 1
of ABO and Rh typing with sputum positive PTB and also to fi nd out frequency distribution of blood groups in healthy adults in Odisha, India.
MATERIALS AND METHODS
The study was conducted from September 2010 to August 2012 in the Sriram Chandra Bhanja Medical College and Hospital, a Tertiary Care Hospital catering to the coastal area of Odisha and parts of West Bengal from September 2010 to August 2012.
In patients (TB ward) of the Department of Pulmonary Medicine who were sputum smear positive for acid-fast bacillus (AFB) in microscopy were recruited into the study and formed the “Study group.” The sputum AFB microscopy was done according to the standard Revised National TB Control Program protocol in the designated microscopy center of the hospital. During the same period, blood group data of healthy subjects coming to the blood bank as donors were collected and they formed the “control group.” Study subjects in both the groups were explained about the nature and objective of the study in their own language and consent was taken. Those who agreed to participate in the study were subjected to blood grouping test by standard tube agglutination reaction in the blood bank in the Department of Transfusion Medicine. The Institutional Ethical Committee clearance was taken beforehand, and data were kept confi dential.
Data were entered and analyzed in Epi-info Version 2007. Categorical variables were expressed regarding numbers and proportions. Chi-square test was used for showing an association. P < 0.05 was considered signifi cant.
RESULTS
A total number of study participants in the study group were 122 and in the control group were 2842. Frequency distribution of ABO blood groups among cases and controls is summarized in Table 1. A total number of subjects having blood Group A were 624 (21.95%) and 40 (32.8%) in control and study group, respectively, which showed a statistically signifi cant difference (P = 0.005).
The proportion of subjects with blood Group B in the study group was (18%) and was less as compared to control group (34.06%). This difference was statistically signifi cant (P < 0.001). Although percentages of study subjects having blood Groups “O” and “AB” were more in the study group compared to the control group, it did not show any statistical signifi cance. Analysis of Rh D typing as a separate predictor for TB did not show any statistical signifi cance (P = 0.073) (Table 2). Rh D status within individual blood groups also did not show any signifi cant associations with sputum positive PTB patients as shown in Table 3. Most common blood group among the healthy control group was “O Rh+” (36.6%) closely followed by B Rh+ (33.3%). In the study group of AFB positive PTB cases, blood Group “O Rh+” was most common (39.3%) followed by “A Rh+” (32.8%).
DISCUSSION
The antigens of the ABO blood group system (A, B, and H determinants, respectively) are complex carbohydrate molecules expressed on the surface of RBC membranes.5 They are also present on the surface of a variety of human cells and tissues, including the epithelium, sensory neurons, platelets, and the vascular endothelium,6 due to their extensive distribution in human body association of these blood group antigens with various cardiological, oncological, and other diseases were suspected, studied, and proved,7,8 Individuals with blood Group O are more prone to develop peptic ulcer disease and those with blood Group A are more prone to have gastric carcinoma. Carcinoma cervix and pernicious anemia are found more often in persons with blood Group A.9 Blood Group O individuals are less susceptible to rheumatic heart disease,10 and there is some association between blood Group O and HIV infection.11
Many studies with similar intent were conducted earlier. Viskum,12 suggested blood Groups O and AB individuals are more susceptible to TB. However, a study by Rao et al., concluded that blood Groups O and A were the most common blood groups associated with PTB.13 A study in Gujarat, a signifi cant association was discovered between blood Group AB and pulmonary TB.14 Similarly, Jain15 had
Table 1: Distribution of ABO blood groups in sputum positive PTB cases (study group) and healthy adults (control group)Blood group Study group n (%) Control group n (%) Total n (%) OR 95% CI P-valueA 40 (32.8) 624 (21.95) 664 (22.4) 1.73 1.17-2.55 0.005B 22 (18) 968 (34.06) 990 (33.4) 0.42 0.27-0.68 0.0002AB 12 (9.8) 183 (6.43) 195 (6.58) 1.58 0.86-2.93 0.138O 48 (39.3) 1067 (37.54) 1115 (37.62) 1.08 0.74-1.56 0.688Total 122 2842 2964OR: Odds ratio, CI: Confi dence interval, P<0.05 considered signifi cant, PTB: Pulmonary tuberculosis

Pradhan, et al.: Association of PTB and ABO Blood Groups
148International Journal of Scientifi c Study | April 2016 | Vol 4 | Issue 1
similar observations for AB blood group and pulmonary TB. People with blood Group O showed protection from TB in a Chinese population.16
Some of the studies also reported no association between TB and ABO blood groups. Buchannan and Hingley17 in their study with 2,446 subjects concluded that there was no relation between blood groups and any disease. Shenoy and Daftary18 too ruled out any such correlation between TB and blood groups. Reddy and Reddy19 Reddy and Usha20 and co-workers conducted two different studies in Chittoor district of Andhra Pradesh and Warangal district of Telangana region found no association between ABO-Rh and PTB.
Some studies found Rh D positivity increases risk of TB,13 some studies observed Rh D negativity renders individuals more susceptible.21 However, there are studies which fi nd no such associations.22,18 The present study did not show any correlation between Rh D status and TB.
Most common blood group among Punjabis23 and Bengalis24 was blood Group “B.” Blood Group “O” was commonly observed in people of Kashmir and South Rajasthan15 and North Rajasthan.25 According to previously published data,26 most common blood group in Odisha is blood Group “O” followed by blood Group “B.” The present study is in agreement with this data, blood Group O and “B” being the two most common blood groups.
LimitationsThe limitations of study are:1. Small number of subjects in study group2. It was not a multicenter study.
CONCLUSION
In the present study, it was found that individuals are having blood Groups “A” and “B” are more likely to suffer from TB compared to those with blood Group “O” and “AB.” The reason for this vulnerability is not known. Rh D status has no effect on susceptibility to TB. To confi rm or negate the fi ndings of this study large multicenter randomized controlled trial should be done.
REFERENCES
1. Historical perspectives contennial: Koch's discovery of tubercle bacillus. 1982;31:121-3. Available from: http://www.cdc.gov/mmwr/preview/mmwrhtml/00000222.htm. [Last cited on 2016 Feb 02].
2. World Health Organization. Global Tuberculosis Report; 2015. Available from: http://www.who.int/tb/publications/global_report/en/. [Last accessed on 2016 Feb 01].
3. Narasimhan P, Wood J, MacIntyre CR, Mathai D. Risk factors for tuberculosis. Pulm Med 2013;2013:11. Available from: http://www.hindawi.com/journals/pm/2013/828939/. [Last accessed on 2016 Feb 01].
4. Waters AH. Red cell blood-group antigens and antibodies. In: Watres AH, Dacie JV, editors. Lewis-Practical Haematology. 8th ed. London: ELBS; 1994. p. 446-50.
5. Storry JR, Olsson ML. The ABO blood group system revisited: A review and update. Immunohematology 2009;25:48-59.
6. Eastlund T. The histo-blood group ABO system and tissue transplantation. Transfusion 1998;38:975-88.
7. Franchini M, Capra F, Targher G, Montagnana M, Lippi G. Relationship between ABO blood group and von Willebrand factor levels: From biology to clinical implications. Thromb J 2007;5:14.
8. Franchini M, Favaloro EJ, Targher G, Lippi G. ABO blood group, hypercoagulability, and cardiovascular and cancer risk. Crit Rev Clin Lab Sci 2012;49:137-49.
9. Del Valle J. Peptic ulcer disease and related disorders. In: Del Valle J, Fauci A, Braunwald E, Kasper D, Hauser S, Longo D, editors. Harrison Principles of Internal Medicine. 17th ed., Vol. II. New York: McGraw Hill Inc.; 2008. p. 1855-60.
10. Park K. Genetics and health. In: Preventive and Social Medicine. 20th ed. Jabalpur, Madhypradesh, India: Banarsidas Bhanot Publishers; 2009. p. 724-33.
11. Sayal SK, Das AL, Nema SK. Study of blood groups in HIV seropositive patients. Indian J Dermatol Venereol Leprol 1996;62:295-7.
12. Viskum K. The ABO and Rh blood groups in patients with pulmonary tuberculosis. Tubercle 1975;54:329-33.
13. Rao BN, Reddy VD, Sahu PS, Veerendra Kumar A, David MA, Yugandhar P, et al. The ABO blood group distribution and pulmonary tuberculosis. J Clin Diagn Res 2012;6:943-6.
14. Gondaliya ST, Makwana HH, Lakum NR, Agnihotri AS. Pulmonary tuberculosis and blood groups: Any association? Gujarat Med J 2012;67:39-41.
15. Jain RC. ABO blood groups in relation to breast cancer. Curr Med Pract 1968;12:498.
16. Saha N, Banerjee B. Incidence of ABO and RH blood groups in pulmonary tuberculosis in different ethnic groups. J Med Genet 1968;5:306-7.
17. Buchannan JA, Hingley ET. The relationship of blood group to disease. Br J Exp Pathol 1921;2:247.
18. Shenoy MA, Daftary VG. ABO blood groups and pulmonary tuberculosis. Indian J Med Sci 1962;16:493-8.
19. Reddy VD, Reddy M. Pulmonary tuberculosis and the ABO and the Rh blood groups in Chittoor district of Rayalaseema in Andhra Pradesh. J NTR Univ Health Sci 1998;3:19-22.
20. Reddy VD, Usha T. ABO blood groups and pulmonary tuberculosis in Warangal district of Telangana region. J Indian Med Assoc 1990;88:337-8.
21. Tonbridge GF. Blood Groups in Tuberculosis. MD Thesis. Birmingham:
Table 2: Distribution of Rh D antigen type in sputum positive PTB (cases) and healthy adults (controls)Rh type Study group Control group P-valuePositive 122 2767 0.073Negative 0 75P<0.05 considered signifi cant. PTB: Pulmonary tuberculosis
Table 3: Association of Rh D status within individual blood group with sputum positive PTBBlood group Study group n (%) Control group n (%) P-valueA Rh D+ 40 (32.8) 602 (21.18) 0.636Rh D− 0 22 (0.78)B Rh D+ 22 (18) 946 (33.29) 1.0Rh D− 0 22 (0.77)AB Rh D+ 12 (9.8) 179 (6.29) 1.0Rh D− 0 4 (0.14)O Rh D+ 48 (39.3) 1040 (36.59) 0.625Rh D− 0 27 (0.95)P<0.05 considered signifi cant. PTB: Pulmonary tuberculosis

Pradhan, et al.: Association of PTB and ABO Blood Groups
149 International Journal of Scientifi c Study | April 2016 | Vol 4 | Issue 1
University of Birmingham; 1956.22. Lewis JG, Woods AC. The ABO and Rhesus blood groups in patients with
respiratory disease. Tubercle 1961;42:362-5.23. Talwar CL, Sawhney CP. ABO and AB blood groups in Punjab. Indian J
Med Sci 1958;12:942-4.24. Sen NN, Mukerjee CL, Aikat BK. Incidence of ABO and Rh (D) among
Bengalis. J Indian Med Assoc 1959;33:210.
25. Thamaria JP, Mathur KC, Husain SA. Frequency distribution of ABO blood groups among general population of northern Rajasthan and among sputum positive pulmonary tuberculosis cases with particular reference to rate of inactivation of isoniazid. Indian J Tuberc 1972;19:1.
26. Mahapatra S, Sahoo D, Patjoshi S, Sahu A, Parida P, Mishra S. Distribution and prevalence of ABO and Rh phenotype blood groups in Eastern India. J Pharm Biomed Sci 2014;04:712-4.
How to cite this article: Pradhan G, Sahu A, Giri PK, Sahoo J. Susceptibility to Pulmonary Tuberculosis as a Function of ABO-Rh Blood Group Antigens. Int J Sci Stud 2016;4(1):146-149.
Source of Support: Nil, Confl ict of Interest: None declared.
150International Journal of Scientifi c Study | April 2016 | Vol 4 | Issue 1
Expression of Human Epidermal Growth Factor Receptor 2/neu in Carcinoma Breast with Reference to Prognostic IndexS Shivakumar1, Medha Shankarling2, Jasneet Kaur Sandhu3
1Professor and Head, Department of Pathology, Mandya Institute of Medical Sciences, Mandya, Karnataka, India, 2Assistant Professor, Department of Pathology, Srinivas Institute of Medical Sciences and Research Centre, Mangalore, Karnataka, India, 3Tutor, Department of Pathology, Mandya Institute of Medical Sciences, Mandya, Karnataka, India
most of the patients present with palpable mass with 50% having lymph node metastasis at the time of their fi rst visit.2
Stratifi cation of patients after taking into consideration of various prognostic parameters has assumed a great therapeutic importance.1 As a result, there have been outstanding advances in breast cancer management with the development of more effective treatments leading to a signifi cant decline in breast cancer deaths and improved outcome in women living with breast disease over the last few decades.3
Many prognostic and predictive factors have been identifi ed by the College of American Pathologists to guide the clinical
INTRODUCTION
Breast carcinoma is the most common malignant tumor worldwide and is the second-leading cause of death in women due to cancer.1 In India, breast carcinoma is the second most common cancer in women after carcinoma cervix. In India,
Original Article
Abstract
Introduction: In India, breast carcinoma is the second most common cause of death even though it arises in an exposed organ which is readily accessible for self-examination and diagnosis. A better understanding of various prognostic parameters has assumed a great therapeutic importance.
Aim: The aim of the study was to investigate the correlation of human epidermal growth factor receptor 2 (HER2)/neu status with important clinicopathologic prognostic parameters of carcinoma breast in particular with Nottingham prognostic index (NPI).
Methodology: Immunohistochemical techniques were used to evaluate HER2/neu in paraffi n-embedded tissue specimens of 50 cases of carcinoma breast. The patients’ age and the size of the tumor were noted. The histologic subtype, Nottingham modifi cation of Scarff Bloom Richardson (NSBR) grade, lymph node staging, and NPI groups were assessed.
Results: Of the 50 cases of carcinoma breast, 17 (34%) were HER2/neu positive. The HER2/neu positivity increased with age (62.5% in patients of the 7th and 8th decades) and was statistically signifi cant (P = 0.05). The HER2/neu positivity increased with tumor size, with positivity of 0% in <2 cm and 40% in >2 cm tumor but was not statistically signifi cant (P = 0.149). The HER2/neu positivity was more in invasive duct carcinoma (IDC), not otherwise specifi ed (NOS) type (100%), higher NSBR grade (94.1% in Grades 2 and 3), higher score of lymph node staging (82.4% in score 2 and 3), and in poorer NPI prognostic groups (87.2%) but were not statistically signifi cant (P = 0.681, 0.102, 0.139, 0.177, respectively).
Conclusion: The HER2/neu expression was more frequent in tumor >2 cm, in IDC, NOS type, in higher NSBR grade, carcinoma breast with lymph node metastasis, and in poorer NPI prognostic groups indicating that HER2/neu may be a powerful predictor for poor prognosis.
Key words: Carcinoma breast, Human epidermal growth factor receptor 2/neu, Immunohistochemistry, Nottingham modifi cation of Scarff Bloom Richardson grade, Nottingham prognostic index prognostic groups
Access this article online
www.ijss-sn.com
Month of Submission : 02-2016Month of Peer Review : 03-2016Month of Acceptance : 03-2016Month of Publishing : 04-2016
Corresponding Author: S Shivakumar, Department of Pathology, Mandya Institute of Medical Sciences, Mandya, India.Phone: +91-9449622449. E-mail: [email protected]
DOI: 10.17354/ijss/2016/207

Shivakumar, et al.: HER2/neu Expression in Carcinoma Breast Correlating Prognostic Index
151 International Journal of Scientifi c Study | April 2016 | Vol 4 | Issue 1
management of women with breast cancer. The prognostic factors include invasive carcinoma or in-situ carcinoma, distant metastasis, lymph node metastasis, tumor size, locally advanced disease, histological grade, histological subtype, inflammatory carcinoma, estrogen receptor (ER)/progesterone receptor (PR) status, and overexpression of human epidermal growth factor receptor (HER2)/neu.4
In the current management guidelines, ER/PR status and overexpression of HER2/neu are the most useful predictive factors for response to specifi c therapeutic agents.2
HER2/neu, otherwise known as neu or c-erbB-2, is a product of an oncogene. Presently, immunohistochemistry (IHC) is the center stage in the demonstration of monoclonal antibodies for evaluating HER2/neu protein expression in breast carcinoma.5 HER2/neu expression is an independent prognostic factor in patients with breast carcinoma and has greater prognostic value than most currently used prognostic factors including ER, PR status.6 HER2/neu positive cancer patients exhibit resistance to tamoxifen but not to aromatase inhibitors or ovarian ablation.7
The presence of HER2/neu is related to a high-grade tumor and poorer prognosis but the favorable response to monoclonal antibody therapy and disease survival.8 Therefore, there is a growing clinical demand for analysis of the HER2/neu status of current and archived breast cancer specimens.9
METHODOLOGY
A total of 50 cases of mastectomy specimens of carcinoma breast with axillary clearance received in the Department of Pathology, MIMS, Mandya, during the study period from January 2010 to October 2012 were evaluated.
The study was approved by the Institutional Ethical Committee. On arrival to the department, the specimens were subjected to adequate fi xation using 10% neutral buffer formalin. After examination of the specimen for gross details, representative bits were subjected to routine processing for paraffi n embedding. From the paraffi n-embedded blocks, 4-5 μ thick section were taken and stained with hematoxylin and eosin (H and E) stain.
According to the WHO classifi cation system, the tumors were histologically typed. The Nottingham modifi cation of Scarff Bloom Richardson (NSBR) grading system10 was used for grading (Table 1) which is based on the architecture pattern, nuclear atypia, and mitotic rate of the tumor.
The combined score of architecture, nuclear atypia, and mitotic fi gures/10 high power fi eld is added to get a total score. Grade 1 breast carcinomas include scores of 3-5, Grade 2 includes score of 6-7, and Grade 3 includes score of 8-9.
Each case was assessed considering important prognostic parameters such as size of tumor, histological grade, and metastasis to axillary lymph nodes to calculate the Nottingham prognostic index (NPI)11 which is as follows: NPI = score of lymph node stage [1-3] + score of histological grade as NSBR system (1-3) + maximum diameter in centimeters ×0.2. The scoring of the lymph node is as follows: Score 1 - No lymph node metastasis; score 2 - Metastasis to 1-3 lymph nodes; and score 3 - Metastasis to >4 lymph nodes.
After calculation of the NPI score, all the 50 cases of carcinoma breast were divided into 6 prognostic groups (Table 2).11
Sections of 3-4 μ thickness on silane-coated slides from the representative areas of all the 50 cases were subjected to IHC study for HER2/neu. The polymer-based IHC kit of BioGenex RTU (ready to use) was used. The cell membrane of tumor cells was stained in various intensities when there was overexpression of HER2/neu protein. The HER2/neu positivity was assessed by a semi-quantitative method based on the number of tumor cells showing positivity and the staining intensity. A score of 2+ and 3+ HER2/neu expressions (Figures 1 and 2) was considered as positive for immunostaining (Table 3).
Correlation of HER2/neu expression with important prognostic parameters such as patient’s age, size of tumor,
Table 1: Histological grade using NSBR system10
Score Architecture (%) Nuclear atypia MF/HPF1 >75 tubule formation Mild 0-52 10-75 tubule formation Moderate 6-103 <10 tubule formation Severe >10MF/HPF: Mitotic fi gures/high power fi eld, NSBR: Nottingham modifi cation of Scarff Bloom Richardson
Table 2: NPI prognostic groups11
Prognostic group NPI scoreEPG 2.08-2.4GPG 2.42-3.4MPG I 3.42-4.4MPG II 4.42-5.4PPG 5.42-6.4VPPG 6.42-6.4EPG: Excellent prognostic group, GPG: Good prognostic group, MPG: Moderate prognostic group, PPG: Poor prognostic group, VPPG: Very poor prognostic group, NPI: Nottingham prognostic index
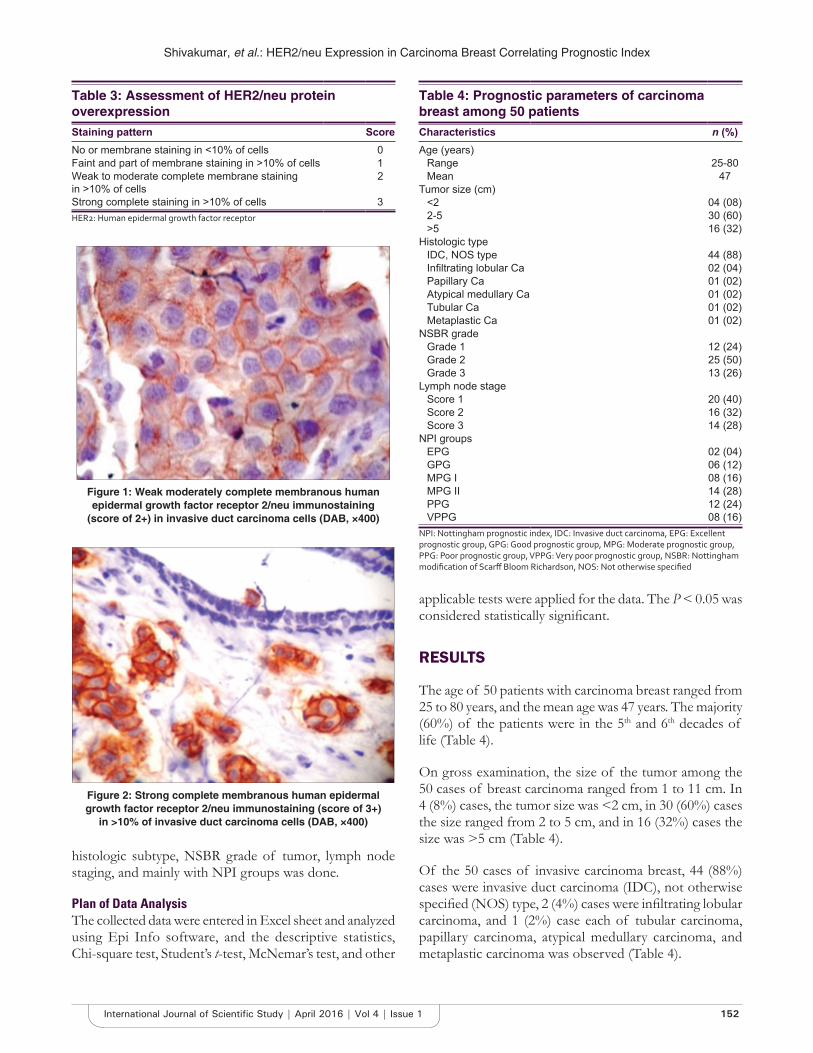
Shivakumar, et al.: HER2/neu Expression in Carcinoma Breast Correlating Prognostic Index
152International Journal of Scientifi c Study | April 2016 | Vol 4 | Issue 1
histologic subtype, NSBR grade of tumor, lymph node staging, and mainly with NPI groups was done.
Plan of Data AnalysisThe collected data were entered in Excel sheet and analyzed using Epi Info software, and the descriptive statistics, Chi-square test, Student’s t-test, McNemar’s test, and other
applicable tests were applied for the data. The P < 0.05 was considered statistically signifi cant.
RESULTS
The age of 50 patients with carcinoma breast ranged from 25 to 80 years, and the mean age was 47 years. The majority (60%) of the patients were in the 5th and 6th decades of life (Table 4).
On gross examination, the size of the tumor among the 50 cases of breast carcinoma ranged from 1 to 11 cm. In 4 (8%) cases, the tumor size was <2 cm, in 30 (60%) cases the size ranged from 2 to 5 cm, and in 16 (32%) cases the size was >5 cm (Table 4).
Of the 50 cases of invasive carcinoma breast, 44 (88%) cases were invasive duct carcinoma (IDC), not otherwise specifi ed (NOS) type, 2 (4%) cases were infi ltrating lobular carcinoma, and 1 (2%) case each of tubular carcinoma, papillary carcinoma, atypical medullary carcinoma, and metaplastic carcinoma was observed (Table 4).
Table 3: Assessment of HER2/neu protein overexpressionStaining pattern ScoreNo or membrane staining in <10% of cells 0Faint and part of membrane staining in >10% of cells 1Weak to moderate complete membrane staining in >10% of cells
2
Strong complete staining in >10% of cells 3HER2: Human epidermal growth factor receptor
Table 4: Prognostic parameters of carcinoma breast among 50 patientsCharacteristics n (%)Age (years)
Range 25-80Mean 47
Tumor size (cm)<2 04 (08)2-5 30 (60)>5 16 (32)
Histologic typeIDC, NOS type 44 (88)Infi ltrating lobular Ca 02 (04)Papillary Ca 01 (02)Atypical medullary Ca 01 (02)Tubular Ca 01 (02)Metaplastic Ca 01 (02)
NSBR gradeGrade 1 12 (24)Grade 2 25 (50)Grade 3 13 (26)
Lymph node stageScore 1 20 (40)Score 2 16 (32)Score 3 14 (28)
NPI groupsEPG 02 (04)GPG 06 (12)MPG I 08 (16)MPG II 14 (28)PPG 12 (24)VPPG 08 (16)
NPI: Nottingham prognostic index, IDC: Invasive duct carcinoma, EPG: Excellent prognostic group, GPG: Good prognostic group, MPG: Moderate prognostic group, PPG: Poor prognostic group, VPPG: Very poor prognostic group, NSBR: Nottingham modifi cation of Scarff Bloom Richardson, NOS: Not otherwise specifi ed
Figure 2: Strong complete membranous human epidermal growth factor receptor 2/neu immunostaining (score of 3+)
in >10% of invasive duct carcinoma cells (DAB, ×400)
Figure 1: Weak moderately complete membranous human epidermal growth factor receptor 2/neu immunostaining
(score of 2+) in invasive duct carcinoma cells (DAB, ×400)
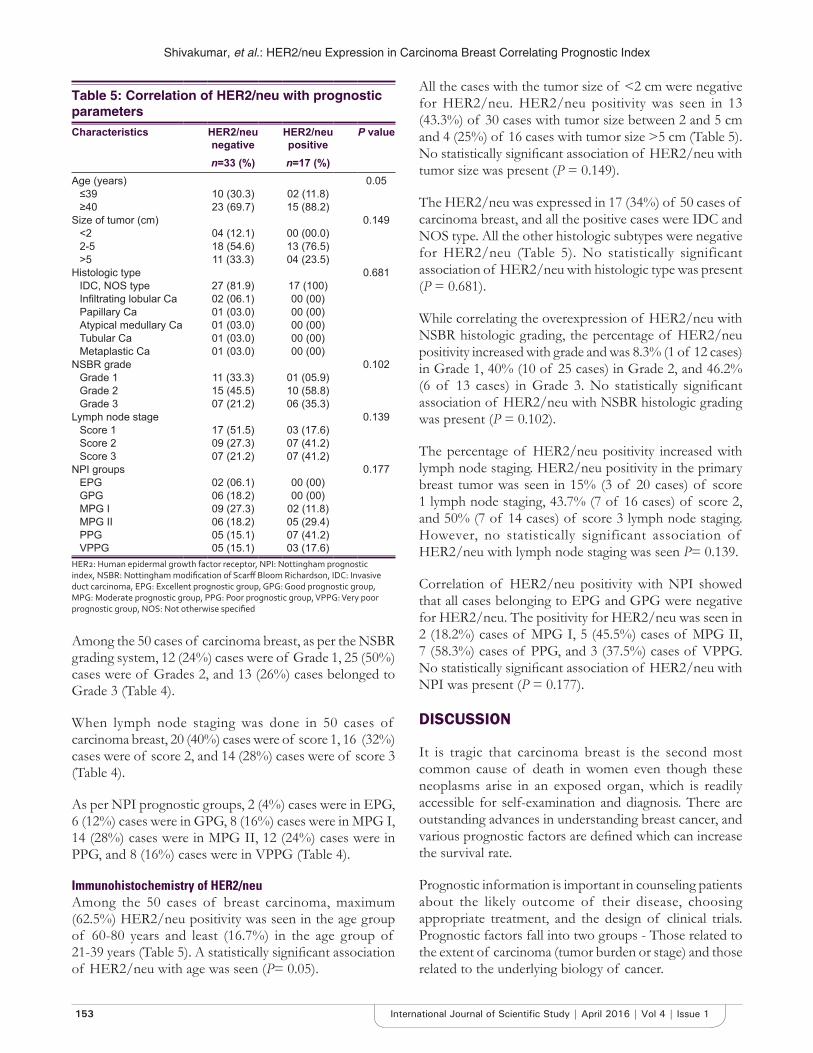
Shivakumar, et al.: HER2/neu Expression in Carcinoma Breast Correlating Prognostic Index
153 International Journal of Scientifi c Study | April 2016 | Vol 4 | Issue 1
Among the 50 cases of carcinoma breast, as per the NSBR grading system, 12 (24%) cases were of Grade 1, 25 (50%) cases were of Grades 2, and 13 (26%) cases belonged to Grade 3 (Table 4).
When lymph node staging was done in 50 cases of carcinoma breast, 20 (40%) cases were of score 1, 16 (32%) cases were of score 2, and 14 (28%) cases were of score 3 (Table 4).
As per NPI prognostic groups, 2 (4%) cases were in EPG, 6 (12%) cases were in GPG, 8 (16%) cases were in MPG I, 14 (28%) cases were in MPG II, 12 (24%) cases were in PPG, and 8 (16%) cases were in VPPG (Table 4).
Immunohistochemistry of HER2/neuAmong the 50 cases of breast carcinoma, maximum (62.5%) HER2/neu positivity was seen in the age group of 60-80 years and least (16.7%) in the age group of 21-39 years (Table 5). A statistically signifi cant association of HER2/neu with age was seen (P= 0.05).
All the cases with the tumor size of <2 cm were negative for HER2/neu. HER2/neu positivity was seen in 13 (43.3%) of 30 cases with tumor size between 2 and 5 cm and 4 (25%) of 16 cases with tumor size >5 cm (Table 5). No statistically signifi cant association of HER2/neu with tumor size was present (P = 0.149).
The HER2/neu was expressed in 17 (34%) of 50 cases of carcinoma breast, and all the positive cases were IDC and NOS type. All the other histologic subtypes were negative for HER2/neu (Table 5). No statistically significant association of HER2/neu with histologic type was present (P = 0.681).
While correlating the overexpression of HER2/neu with NSBR histologic grading, the percentage of HER2/neu positivity increased with grade and was 8.3% (1 of 12 cases) in Grade 1, 40% (10 of 25 cases) in Grade 2, and 46.2% (6 of 13 cases) in Grade 3. No statistically signifi cant association of HER2/neu with NSBR histologic grading was present (P = 0.102).
The percentage of HER2/neu positivity increased with lymph node staging. HER2/neu positivity in the primary breast tumor was seen in 15% (3 of 20 cases) of score 1 lymph node staging, 43.7% (7 of 16 cases) of score 2, and 50% (7 of 14 cases) of score 3 lymph node staging. However, no statistically significant association of HER2/neu with lymph node staging was seen P= 0.139.
Correlation of HER2/neu positivity with NPI showed that all cases belonging to EPG and GPG were negative for HER2/neu. The positivity for HER2/neu was seen in 2 (18.2%) cases of MPG I, 5 (45.5%) cases of MPG II, 7 (58.3%) cases of PPG, and 3 (37.5%) cases of VPPG. No statistically signifi cant association of HER2/neu with NPI was present (P = 0.177).
DISCUSSION
It is tragic that carcinoma breast is the second most common cause of death in women even though these neoplasms arise in an exposed organ, which is readily accessible for self-examination and diagnosis. There are outstanding advances in understanding breast cancer, and various prognostic factors are defi ned which can increase the survival rate.
Prognostic information is important in counseling patients about the likely outcome of their disease, choosing appropriate treatment, and the design of clinical trials. Prognostic factors fall into two groups - Those related to the extent of carcinoma (tumor burden or stage) and those related to the underlying biology of cancer.
Table 5: Correlation of HER2/neu with prognostic parametersCharacteristics HER2/neu
negativeHER2/neu positive
P value
n=33 (%) n=17 (%)Age (years) 0.05
≤39 10 (30.3) 02 (11.8)≥40 23 (69.7) 15 (88.2)
Size of tumor (cm) 0.149<2 04 (12.1) 00 (00.0)2-5 18 (54.6) 13 (76.5)>5 11 (33.3) 04 (23.5)
Histologic type 0.681IDC, NOS type 27 (81.9) 17 (100)Infi ltrating lobular Ca 02 (06.1) 00 (00)Papillary Ca 01 (03.0) 00 (00)Atypical medullary Ca 01 (03.0) 00 (00)Tubular Ca 01 (03.0) 00 (00)Metaplastic Ca 01 (03.0) 00 (00)
NSBR grade 0.102Grade 1 11 (33.3) 01 (05.9)Grade 2 15 (45.5) 10 (58.8)Grade 3 07 (21.2) 06 (35.3)
Lymph node stage 0.139Score 1 17 (51.5) 03 (17.6)Score 2 09 (27.3) 07 (41.2)Score 3 07 (21.2) 07 (41.2)
NPI groups 0.177EPG 02 (06.1) 00 (00)GPG 06 (18.2) 00 (00)MPG I 09 (27.3) 02 (11.8)MPG II 06 (18.2) 05 (29.4)PPG 05 (15.1) 07 (41.2)VPPG 05 (15.1) 03 (17.6)
HER2: Human epidermal growth factor receptor, NPI: Nottingham prognostic index, NSBR: Nottingham modifi cation of Scarff Bloom Richardson, IDC: Invasive duct carcinoma, EPG: Excellent prognostic group, GPG: Good prognostic group, MPG: Moderate prognostic group, PPG: Poor prognostic group, VPPG: Very poor prognostic group, NOS: Not otherwise specifi ed

Shivakumar, et al.: HER2/neu Expression in Carcinoma Breast Correlating Prognostic Index
154International Journal of Scientifi c Study | April 2016 | Vol 4 | Issue 1
The present study investigated the correlation of expression of HER2/neu with important clinicopathologic prognostic parameters of carcinoma breast.
In the present study, the mean age of 50 patients with carcinoma breast was 47.2 years and was similar to studies of Ayadi et al.,12 (51.5 years), Azizun-Nisa et al.,13 (48.3 years), Moradi-Marjaneh et al.,14 (47.4 years), and Al-Moundhri et al.,15 (49.6 years). The HER2/neu expression increased with age and positivity of 16.7% was seen in 21-39 year age group patients who increased to 62.5% in patients of 60-80 year age group. Similar results were seen in a study done by Al-Moundhri et al.,15 where 12 out of 13 patients above 40 years of age were positive for HER2/neu. This may be related to the accumulation of somatic mutations with age.16
The results of HER2/neu positivity were relatively different in diverse studies. We found HER2/neu expression of 34% in the present study. Literature reports positive results ranging from 15 to 93.4%.12-14,17-19 Possible sources of this variation may be attributed to different tissue fi xation procedures, properties of different antibodies, scoring methods applied for HER2/neu positivity, the different stains used for staining, and microwave procedure of the tissue during antigen retrieval of IHC staining process (Table 6).
Tumor size is one of the most useful predictors of behavior in breast carcinoma. None of tumors <2 cm were positive for HER2/neu and 36.9% of tumors >2 cm showed HER2/neu positivity. Similarly, other studies17,14,18-20 also showed a higher rate of HER2/neu expression in larger tumor with the statistically signifi cant association (Table 7).
In the present study, all the HER2/neu positive cases were seen in infi ltrating duct carcinoma, NOS type. Similarly, in the study by Saleh and Abdeen19 and Naeem et al.,20 71.7% and 90.9% of infi ltrating duct carcinoma, NOS type cases showed HER2/neu positivity. This suggests that HER2/neu positivity is common in infi ltrating duct carcinoma, NOS type. In contrast, Ayadi et al.,12 reported 16.8% and 25% HER2/neu positivity in ductal and non-ductal carcinomas, respectively.
An increasing percentage of HER2/neu positivity was seen with increasing NSBR histologic grade in studies done by Moradi-Marjaneh et al.,14 Ivkovic17 Lovekin et al.,18 Saleh and Abdeen,19 Naeem et al.,20 and also in the present study (Table 8).
An increased expression of HER2/neu in cases of carcinoma breast with lymph node metastases was seen in studies by Azizun-Nisa et al.,13 (89.3%), Moradi-Marjaneh
et al.,14 (76.9%), Ivkovic17 (52.2%), and Naeem et al.,20 (91.0%). Similarly, the present study also showed an 85% of HER2/neu positivity in cases of carcinoma with lymph node metastasis suggesting that HER2/neu positivity increases the risk of metastasis.
Lovekin et al.,18 in 1991, found that HER2/neu positivity is associated with poorer prognosis while following up 782 patients of carcinoma breast and concluded that HER2/neu is an independent predictive factor for the shorter survival rate in invasive carcinoma of breast. The NPI is a well-established and widely used method of predicting survival of operable primary breast carcinoma. The NPI is compiled from tumor grade, tumor size, and lymph node status of the primary tumor. No studies correlating the NPI and HER2/neu status with the best of our knowledge have been done so far. In the present study, most of the positive cases were seen in very poor (37.5%),
Table 6: Incidence of HER2/neu expression in various studiesStudy Incidence positive/total (%)Ayadi et al.12 28/155 (18.1)Azizun-Nisa et al.13 56/150 (37.4)Moradi-Marjaneh et al.14 165/319 (51.7)Tatjana et al.17 23/120 (20.0)Lovekin et al.18 70/480 (15.0)Saleh and Abdeen19 155/166 (93.4)Present study 17/50 (33.0)HER2: Human epidermal growth factor receptor
Table 7: Correlation of HER2/neu positivity with tumor sizeStudy Tumor size P value
<2 cm 2-5 cm >5 cmMoradi-Marjaneh et al.14 46.0 46.0 62.0 0.016Tatjana et al.17 0.0 18.1 47.6 <0.0001Lovekin et al.18 3.0 11.0 21.0 <0.0001Saleh and Abdeen.19 5.9 92.9 87.7 <0.005Naeem et al.20 0.0 18.2 81.8 >0.05Present study 8.3 40.0 46.2 0.102HER2: Human epidermal growth factor receptor
Table 8: Correlation of HER2/neu positivity with NSBR histologic gradesStudy NSBR histologic grades (%) P value
Grade 1 Grade 2 Grade 3Moradi-Marjaneh et al.14 46.0 46.0 62.0 0.016Tatjana et al.17 0.0 18.1 47.6 <0.0001Lovekin et al.18 3.0 11.0 21.0 <0.0001Saleh and Abdeen19 5.9 92.9 87.7 <0.005Naeem et al.20 0.0 18.2 81.8 >0.05Present study 8.3 40.0 46.2 0.102HER2: Human epidermal growth factor receptor, NSBR: Nottingham modifi cation of Scarff Bloom Richardson

Shivakumar, et al.: HER2/neu Expression in Carcinoma Breast Correlating Prognostic Index
155 International Journal of Scientifi c Study | April 2016 | Vol 4 | Issue 1
poor (58.3%), and moderate prognostic Group II (45.5%). None of the cases in excellent and good prognostic groups were positive for HER2/neu.
CONCLUSION
The aim of this study was to determine the frequency of expression of HER2/neu with various prognostic indices in carcinoma breast, particularly to NPI, which has been aptly brought out in this study. The HER2/neu positivity rate was high in patients of the 5th and 6th decades and was statistically signifi cant.
Although there is no statistical association of HER2/neu with tumor size, histologic subtype, NSBR histologic grade, lymph node status, and NPI, its expression was more frequent in cases with tumor size >2 cm, infi ltrating duct carcinoma, NOS type, higher NSBR grade, carcinoma breast with lymph node metastases, and higher NPI score indicating that HER2/neu may be a powerful predictor for poor prognosis.
Further studies have to be done to determine the signifi cance of correlation of HER2/neu with NPI and to fi nd if this correlation has an advantage over NPI alone in predicting the survival rate of breast carcinoma patients.
REFERENCES
1. Rosai J. Breast. Rosai and Ackerman’s Surgical Pathology. 9th ed. Missouri: Elsevier; 2004. p. 1763-827.
2. Lester SC. The breast. In: Kumar V, Abbas AK, Fausto N, Aster JC, editors. Robbins and Cotran Pathologic Basis of Disease. 8th ed. Philadelphia, PA: Elsevier; 2010. p. 1073-90.
3. Guidelines for Management of Breast Cancer. WHO Regional Offi ce for the Eastern Mediterranean: EMRO Technical Publications Series; 31. Geneva: WHO; 2006.
4. Kyle Bradley T. Prognostic and Predictive Markers in Breast Carcinoma. Bellingham: CAP Cancer Committee; 2007.
5. Almasri NM, Al Hamad M. Immunohistochemical evaluation of human
epidermal growth factor receptor 2 and Estrogen and progesterone receptors in breast carcinoma in Jordan. Breast Cancer Res 2005;7:R598-604.
6. Slamon DJ, Clark GM, Wong SG, Levin WJ, Ullrich A, McGuire WL. Human breast cancer: Correlation of relapse and survival with amplifi cation of the HER-2/neu oncogene. Science 1987;235:177-82.
7. James R, Thriveni K, Krishnamoorty L, Deshmane V, Bapsy PP, Ramaswamy G. Clinical outcome of adjuvant endocrine treatment according to Her2/neu status in breast cancer. Indian J Med Res 2011;133:70-5.
8. Wolff AC, Elizabeth M, Hammond H, Schwartz JN, Hagerty KL, Allred DC. Recommendations for human epidermal growth factor receptor 2 testing in breast cancer-College of American Pathologists and American Society of Clinical Oncology 2006. Arch Pathol Lab Med 2007;131:18-43.
9. Jacobs TW, Gown AM, Yaziji H, Barnes MJ, Schnitt SJ. HER-2/neu protein expression in breast cancer evaluated by immunohistochemistry. A study of interlaboratory agreement. Am J Clin Pathol 2000;113:251-8.
10. Page DL, Ellis IO, Elston CW. Histologic grading of breast cancer. Let’s do it. Am J Clin Pathol 1995;103:123-4.
11. Blamey RW, Ellis IO, Pinder SE, Lee AH, Macmillan RD, Morgan DA, et al. Survival of invasive breast cancer according to the Nottingham prognostic index in cases diagnosed in 1990-1999. Eur J Cancer 2007;43:1548-55.
12. Ayadi L, Khabir A, Amouri H, Karray S, Dammak A, Guermazi M, et al. Correlation of HER-2 over-expression with clinico-pathological parameters in Tunisian breast carcinoma. World J Surg Oncol 2008;6:112.
13. Azizun-Nisa, Bhurgri Y, Raza F, Kayani N. Comparison of ER, PR and HER-2/neu (C-erb B 2) reactivity pattern with histologic grade, tumor size and lymph node status in breast cancer. Asian Pac J Cancer Prev 2008;9:553-6.
14. Moradi-Marjaneh M, Homaei-Shandiz F, Shamsian SA, Eftekhar-Zadeh Mashhadi I, Hedayati-Moghadam MR. Correlation of HER2/neu over expression, p53 protein accumulation and steroid receptor status with tumour characteristics: An Iranian study of breast cancer patients. Iran J Publ Health 2008;37:19-28.
15. Al-Moundhri M, Nirmala V, Al-Mawaly K, Ganguly S, Burney I, Rizvi A, et al. Signifi cance of p53, Bcl-2, and HER-2/neu protein expression in Omani Arab females with breast cancer. Pathol Oncol Res 2003;9:226-31.
16. Hamdi EA, Saleem SH. P53 expression in ovarian tumours: An immunohistochemical study. Ann Coll Med 2012;38:73-9.
17. Ivkovic T. Correlation of Her2/neuprotein overexpression with other prognostic and predictive factors in invasive ductal breast cancer. Anticancer Res 2007;21:673-8.
18. Lovekin C, Ellis IO, Locker A, Robertson JF, Bell J, Nicholson R, et al. C-erbB-2 oncoprotein expression in primary and advanced breast cancer. Br J Cancer 1991;63:439-43.
19. Saleh F, Abdeen S. Pathobiological features of breast tumours in the State of Kuwait: A comprehensive analysis. J Carcinog 2007;6:12.
20. Naeem M, Nasir A, Aman Z, Ahmad T, Samad A. Frequency of Her2/neureceptor positivity and its association with other features of breast cancer. J Ayub Med Coll Abbottabad 2008;20:23-6.
How to cite this article: Shivakumar S, Shankarling M, Sandhu JK. Expression of Human Epidermal Growth Factor Receptor 2/neu in Carcinoma Breast with Reference to Prognostic Index. Int J Sci Stud 2016;4(1):150-155.
Source of Support: Nil, Confl ict of Interest: None declared.Gendita dolorrora nam ut ut evenihi ctotaqui apedi que mos auda con est
156International Journal of Scientifi c Study | April 2016 | Vol 4 | Issue 1
Reduction in Corneal Diameter Following Cataract Surgery: A Comparison between Those Who Underwent Small Incision Cataract Surgery and Phacoemulsifi cation at a Tertiary Care Hospital in South IndiaAbraham Ipe1, George Peter2, Rohith Skariah3
1Associate Professor, Department of Ophthalmology, Pushpagiri Institute of Medical Sciences and Research Centre, Tiruvalla, Kerala, India, 2Professor and Head, Department of Ophthalmology, Pushpagiri Institute of Medical Sciences and Research Centre, Tiruvalla, Kerala, India, 3Intern, Department of Ophthalmology, Pushpagiri Institute of Medical Sciences and Research Centre, Tiruvalla, Kerala, India
INTRODUCTION
Cataract is the most common cause of blindness in India, with almost 75% of a total load of blindness due to this condition. The prevalence of blindness in the country has progressively come down over the last three decades due to a dramatic increase in the number of cataract
Original Article
Abstract
Introduction: The prevalence of blindness in the country has progressively come down over the last three decades due to a dramatic increase in the number of cataract surgeries performed. However, surgically induced astigmatism (SIA) is one of the complications of cataract surgery and can cause residual vision problems to those undergoing the procedure. Those undergoing manual small incision cataract surgery (MSICS) are considered as more at risk for developing astigmatism than patients undergoing phacoemulsifi cation (PE).
Materials and Methods: Patients diagnosed to have age-related cataract and undergoing surgical intervention through MSICS or PE at Pushpagiri Medical College Hospital were included in the study. Visual acuity and corneal diameters were assessed before and 30 days after the surgical intervention.
Results: A total of 61 participants were included in the study, 33 of them underwent MSICS and 28 had a PE procedure. The mean change in K1 corneal diameter was signifi cantly lower in the case of MSICS than PE (P = 0.035) while the mean change in K2 diameter was comparable between the groups (P = 0.452). The changes in K1 corneal diameter was not affected by other factors like age, sex, or presence of comorbidities. In addition, the changes in K2 corneal diameter were not affected by any factors such as the type of surgery, age, sex, or presence of comorbidity.
Conclusion: The study has shown that there is a signifi cant change in corneal diameter in those patients undergoing surgical management of cataract. These changes in corneal diameter may be responsible for the rising incidence of SIA, and it is important to document these measurements. We need bigger studies with large sample sizes to establish the causal association between changes in corneal diameter and SIA.
Key words: Aphakia, Cataract extraction, Cornea/abnormalities, Microsurgery/methods, Phacoemulsifi cation/methods, Postcataract/pathology
Access this article online
www.ijss-sn.com
Month of Submission : 02-2016Month of Peer Review : 03-2016Month of Acceptance : 03-2016Month of Publishing : 04-2016
Corresponding Author: Abraham Ipe, Department of Ophthalmology, Pushpagiri Institute of Medical Sciences and Research Centre, Tiruvalla, Kerala, India. Phone: +91-8129844932. Tel.: 0469-2700755. E-mail: [email protected]
DOI: 10.17354/ijss/2016/208

Ipe, et al.: Reduction in Corneal Diameter following MSICS and Phacoemulsifi cation
157 International Journal of Scientifi c Study | April 2016 | Vol 4 | Issue 1
surgeries performed. However, even then, the absolute number of blind persons in the country has increased, due to an increase in the proportion of people above the age of 50 years.1 The Indian government is a signatory to the World Health Organization convention by the name Vision 2020, which aims to reduce the prevalence of avoidable blindness by as much as 95% by the year 2020. The National Programme for Control of Blindness (NPCB), which was launched as a centrally sponsored scheme in 1976, had an ambitious target to reduce the prevalence of blindness to <0.3% by 2000, but the data from various community surveys have shown that it has failed miserably.2 Certain studies have shown that the prevalence of blindness (vision of <6/60 in the better eye) is as high as 1.84% and the total number of blind in the country may be 18 million. Furthermore, these studies show that more than 60% of the blindness is due to treatable causes such as cataract and refractive errors.3 Subsequently, the NPCB has revamped itself to counter the challenge of blindness in the country. The program which used to be cataract-centric has now expanded to include refractive errors, glaucoma, diabetic retinopathy, ocular trauma, etc. The government has built more than 300 eye surgery suites and has trained over 2000 ophthalmic surgeons through the program. Ophthalmic units and dedicated eye wards have been established at district and sub-district levels. Now, more than 95% of the cataract surgeries involve intraocular lens (IOL) implantation, up from <10% in 1995.4
The IOL revolution has transformed the surgical management of cataract, through improvements in visual acuity following surgery and reduced complication rates. Extracapsular cataract extraction (ECCE) followed by posterior chamber IOL insertion was the most popular method for a long period. However, the advent of technological innovations such as foldable intraocular lens and phacoemulsifi cation (PE) equipment decreased the popularity of ECCE.5 Techniques like PE and Manual Small Incision Cataract Surgery (MSICS) are the most popular among the different cataract surgery methods. Certain studies have shown that both these techniques are comparable in terms of improvement in visual acuity and incidence of complications and that there is a cost advantage for MSICS over PE.6 However, a systematic review done by the Cochrane collaboration shows that the short term uncorrected visual acuity is better in patients who undergo PE. There was no concrete evidence on long-term visual acuity and the differences in complications were not signifi cant between the procedures. The review goes on to recommend MSICS for centers with high volumes as a priority, due to better cost-effectiveness offered by the procedure over PE.7
Surgically induced astigmatism (SIA) is one of the complications of cataract surgery and can cause residual vision problems to those undergoing the procedure. Those undergoing MSICS is considered as more at risk for developing astigmatism than patients undergoing PE.8 Studies have indicated that corneal diameter can be a factor which can predict the incidence of astigmatism in patients who undergo cataract surgery. It was shown that those patients with a higher white to white corneal diameter was less at risk of developing corneal astigmatism as compared to patients with lesser diameter.9 Shorter axial length, shallow anterior chamber, lower intraocular pressure and advancing age, has been shown as risk factors for SIA, in those undergoing cataract surgeries.10 Even though SIA is a problem with signifi cant morbidity, the literature available on the problem and its possible risk factors are very few. In this study, we aim to study the changes in corneal diameter, which is considered as a risk factor for astigmatism, among patients undergoing cataract surgery using PE or MSICS techniques.
MATERIALS AND METHODS
The study was conducted at the Department of Ophthalmology of Pushpagiri Medical Hospital, Tiruvalla, Kerala, India. The study was planned during the period August to September 2015, and the data collection was done during October to December 2015.
Patients diagnosed to have age-related cataract and undergoing surgical intervention at Pushpagiri Medical College Hospital were included in the study. The patients having congenital or pediatric cataract and those with secondary cataracts due to any cause were excluded from the study. Those patients who were not willing for a 30 days follow-up after surgical intervention were also excluded. Written informed consent was obtained from the participants 1 day before the surgery.
The demographic and clinical characteristics of the participants like age, sex, and presence of comorbidity were found out before the surgery. Prior to the surgical intervention, the visual acuity of the participants was tested using a Snellen’s chart, by the ophthalmic surgeon concerned. The Vertical and Horizontal corneal diameters were found out using a standardized keratometer (Model: KMS 6, manufactured by Appasamy Associates, Chennai, India).
All the patients underwent PE or MSICS. The methods were decided after taking into account the choice and fi nancial status of the patient, and also clinical considerations. The investigators had no role in infl uencing the patient
Ipe, et al.: Reduction in Corneal Diameter following MSICS and Phacoemulsifi cation
158International Journal of Scientifi c Study | April 2016 | Vol 4 | Issue 1
regarding the choice of surgical technique, or in deciding the course of clinical management of the problem. The surgical interventions were performed by ophthalmic surgeons with considerable experience in performing these procedures. Both the surgical procedures were performed on an in-patient basis, even though some centers prefer to perform PE as a day care procedure. The participants were followed up on an out-patient basis, looking for any complications because of the surgical procedure. Visual acuity and corneal diameters were found out at the end of 1 month of follow-up.
The data collection was done using a structured questionnaire and was digitized using Epi-Data, which is a free data entry software for epidemiological studies. The data were analyzed using Epi-Info 7.0; a free statistical package brought out by Centres for Disease Control, USA.
RESULTS
A total of 61 participants were included in the study, 33 of them underwent MSICS and 28 had a PE procedure. A majority of the participants were above 60 years of age, and more than 60% were females. 52% of those undergoing surgery had diabetes mellitus, and 40.9% was on treatment for hypertension. More than 60% of the participants were having immature cataracts, and the rest had mature cataracts. None of the participants were in the stage of hypermaturity. The baseline clinical and demographic correlates were comparable between the participants undergoing MSICS and PE (Table 1).
The mean K1 diameter fell from 44.50 to 44.01 in case of patients undergoing MSICS, and from 44.59 to 43.48 in
patients undergoing PE. The mean K2 diameter was also reduced after the participants underwent cataract surgery, from 44.81 to 44.28 in the case of MSICS and from 44.27 to 44.01 in PE. The mean change in K1 diameter was signifi cantly lower in the case of MSICS than PE (P = 0.035) while the mean change in K2 diameter was comparable between the groups (P = 0.452) (Table 2).
The data were further analyzed to look for possible factors which will affect the changes in corneal diameter. The mean reduction in K1 corneal diameter was signifi cantly affected by the choice of surgery, with those undergoing PE having a larger reduction in diameter (P = 0.035). The changes in K1 corneal diameter was not affected by other factors like age, sex or presence of comorbidities. Furthermore, the changes in K2 corneal diameter were not affected by any factors such as type of surgery, age, sex, or presence of comorbidity (Tables 3 and 4).
DISCUSSION
A vast majority of the patients undergoing surgery for cataract was aged above 60 years, and this refl ects
Table 1: Baseline clinical and demographic correlatesCharacteristic MSICS
(n=33) (%)Phacoemulsifi cation
(n=28) (%)Age
Up to 59 5 (15.2) 1 (3.6)60 and above 28 (84.8) 27 (96.4)
SexMale 10 (30.3) 14 (50)Female 23 (69.7) 14 (50)
DiabetesYes 14 (42.4) 18 (64.3)No 19 (57.6) 10 (35.7)
HypertensionYes 10 (30.3) 15 (53.6)No 23 (69.7) 13 (46.4)
Stage of cataractImmature 20 (60.6) 17 (60.7)Mature 13 (39.4) 11 (39.3)Hypermature 0 0
MSICS: Manual small incision cataract surgery
Table 2: Changes in corneal diameter following cataract surgeryCorneal diameter Mean (SD)
MSICS (n=33) PE (n=28)Pre-op K1 44.50 (1.55) 44.59 (1.39)Pre-op K2 44.81 (1.58) 44.27 (1.53)Post-op K1 44.01 (1.62) 43.48 (1.38)Post-op K2 44.28 (1.69) 44.01 (1.52)Change in K1 0.500 (1.14) 1.109 (1.03)Change in K2 0.529 (1.47) 0.267 (1.16)SD: Standard deviation, MSICS: Manual small incision cataract surgery, PE: Phacoemulsifi cation
Table 3: Factors affecting changes in corneal diameter (K1)Characteristic Mean (SD) change in corneal diameter P valueType of surgery
MSICS 0.500 (1.14) 0.035#
PE 1.109 (1.03)Age
Up to 59 0.358 (0.65) 0.34260 and above 0.825 (1.16)
SexMale 1.021 (0.79) 0.183Female 0.623 (1.29)
DiabetesYes 0.768 (1.26) 0.939No 0.791 (0.99)
HypertensionYes 0.748 (1.27) 0.858No 0.801 (1.04)
#Statistically signifi cant, SD: Standard deviation, MSICS: Manual small incision cataract surgery, PE: Phacoemulsifi cation

Ipe, et al.: Reduction in Corneal Diameter following MSICS and Phacoemulsifi cation
159 International Journal of Scientifi c Study | April 2016 | Vol 4 | Issue 1
the nature of the problem whereby the prevalence of age-related cataract goes up exponentially with age.11 The very high prevalence of diabetes mellitus and hypertension among the study participants concurs with the statistics available from other parts of Kerala which shows that the state is fast becoming the capital of metabolic diseases in the country.12 Furthermore, it is important to note that majority of the participants were undergoing surgery for the problem at a relatively early stage (immature), and this may be due to the advancement of medical facilities in the state of Kerala. The state of Kerala has been at the forefront of medical revolution in India, with easily accessible and decentralized facilities available at government subsidized rates and this has massively improved the health coverage in case of common problems like cataract.13
In a time when SIA has been recognized as a major complication of cataract surgery, the study of corneal diameter is important. Multiple studies have showed an association between SIA and corneal diameter, and these studies go on to recommend routine measurement of corneal diameters before the patient undergoes surgical management of cataract.9 In our study, it was found that the reduction in corneal diameter K1 was signifi cantly lower in case of patients undergoing MSICS, when compared to the patients who had PE. This result contradicts studies done previously, which shows that patients undergoing MSICS are more at risk for developing SIA, though we are unsure of the exact correlation between changes in corneal diameter and incidence of astigmatism.8 Many review articles also suggest that the incidence of SIA is signifi cantly lower in case of PE, when compared to patients undergoing MSICS.14 Therefore, the contradictory result in our study
may have been due to the fact that the sample size of the study was low, and that MSICS is performed in our center by more experienced ophthalmic surgeons with considerable operating experience.
CONCLUSION
The study has shown that there is a signifi cant change in corneal diameter in those patients undergoing surgical management of cataract. These changes in corneal diameter may be responsible for the rising incidence of SIA, and it is important to document these measurements. A large study with a longer follow-up period is warranted, to fi nd out the association between changes in corneal diameter and visual acuity. Furthermore, we need bigger studies with large sample sizes to establish the causal association between corneal diameter and SIA.
ACKNOWLEDGMENTS
The authors would like to thank the students, faculty, management and patients of Pushpagiri Medical College Hospital, Tiruvalla, for their immense help and support.
REFERENCES
1. Murthy G, Gupta SK, John N, Vashist P. Current status of cataract blindness and Vision 2020: The right to sight initiative in India. Indian J Ophthalmol 2008;56:489-94.
2. Dandona L, Dandona R, John RK. Estimation of blindness in India from 2000 through 2020: Implications for the blindness control policy. Natl Med J India 2001;14:327-34.
3. Dandona L, Dandona R, Srinivas M, Giridhar P, Vilas K, Prasad MN, et al. Blindness in the Indian state of Andhra Pradesh. Invest Ophthalmol Vis Sci 2001;42:908-16.
4. Verma R, Khanna P, Prinja S, Rajput M, Arora V. The national programme for control of blindness in India. Australas Med J 2011;4:1-3.
5. Minassian DC, Rosen P, Dart JK, Reidy A, Desai P, Sidhu M, et al. Extracapsular cataract extraction compared with small incision surgery by phacoemulsifi cation: A randomised trial. Br J Ophthalmol 2001;85:822-9.
6. Gogate P, Optom JJ, Deshpande S, Naidoo K. Meta-analysis to compare the safety and effi cacy of manual small incision cataract surgery and phacoemulsifi cation. Middle East Afr J Ophthalmol 2015;22:362-9.
7. Riaz Y, de Silva SR, Evans JR. Manual small incision cataract surgery (MSICS) with posterior chamber intraocular lens versus phacoemulsifi cation with posterior chamber intraocular lens for age-related cataract. Cochrane Database Syst Rev 2013;10:CD008813.
8. Haldipurkar SS, Shikari HT, Gokhale V. Wound construction in manual small incision cataract surgery. Indian J Ophthalmol 2009;57:9-13.
9. Theodoulidou S, Asproudis I, Kalogeropoulos C, Athanasiadis A, Aspiotis M. Corneal diameter as a factor infl uencing corneal astigmatism after cataract surgery. Cornea 2016;35:132-6.
10. Chang SW, Su TY, Chen YL. Infl uence of ocular features and incision width on surgically induced astigmatism after cataract surgery. J Refract Surg 2015;31:82-8.
11. Vashist P, Talwar B, Gogoi M, Maraini G, Camparini M, Ravindran RD, et al. Prevalence of cataract in an older population in India: The India study of age-related eye disease. Ophthalmology 2011;118:272-8.e1-2.
12. Raman Kutty V, Joseph A, Soman CR. High prevalence of Type 2 diabetes
Table 4: Factors affecting changes in corneal diameter (K2)Characteristic Mean (SD) change in corneal diameter P valueType of surgery
MSICS 0.528 (1.47) 0.452PE 0.267 (1.16)
AgeUp to 59 0.475 (1.42) 0.34260 and above 0.401 (1.33)
SexMale 0.108 (1.17) 0.183Female 0.604 (1.41)
DiabetesYes 0.507 (1.42) 0.939No 0.300 (1.24)
HypertensionYes 0.346 (1.39) 0.858No 0.452 (1.31)
SD: Standard deviation, MSICS: Manual small incision cataract surgery, PE: Phacoemulsifi cation

Ipe, et al.: Reduction in Corneal Diameter following MSICS and Phacoemulsifi cation
160International Journal of Scientifi c Study | April 2016 | Vol 4 | Issue 1
in an urban settlement in Kerala, India. Ethn Health 1999;4:231-9.13. Sasikumar S, Naved M, Saikumar SJ. Cataract surgical coverage in
Kolenchery, Kerala, India. Community Eye Health 1998;11:7.
14. Gogate P, Optom JJ, Deshpande S, Naidoo K. Meta-analysis to compare the safety and effi cacy of manual small incision cataract surgery and phacoemulsifi cation. Middle East Afr J Ophthalmol 2015;22:362-9.
How to cite this article: Ipe A, Peter G, Skariah R. Reduction in Corneal Diameter Following Cataract Surgery: A Comparison between Those Who Underwent Small Incision Cataract Surgery and Phacoemulsifi cation at a Tertiary Care Hospital in South India. Int J Sci Stud 2016;4(1):156-160.
Source of Support: Nil, Confl ict of Interest: None declared.

161 International Journal of Scientifi c Study | April 2016 | Vol 4 | Issue 1
Total Thyroidectomy for Benign Thyroid Disease: A Prospective StudyBapurapu Raja Ram1, Vallabdhas Srinivas Goud1, Dodda Ramesh Kumar2, Madipeddi Venkanna3
1Associate Professor, Department of General Surgery, Mahatma Gandhi Memorial Hospital, Kakatiya Medical College, Warangal, Telangana, India, 2Professor, Department of General Surgery, Mahatma Gandhi Memorial Hospital, Kakatiya Medical College, Warangal, Telangana, India, 3Assistant Professor, Department of General Surgery, Mahatma Gandhi Memorial Hospital, Kakatiya Medical College, Warangal, Telangana, India
initially called these operations “fool hardly performances.” A magnificent surgeon “Theoder Kocher” reduced mortality of thyroid gland surgeries from 50% to <4.5%, and he advocated methodical surgical dissection of the thyroid gland. Theoretically, total thyroidectomy is a logical and optimal surgical procedure for benign thyroid disease affecting the entire thyroid gland as it has the advantage of immediate and permanent cure with no recurrence. Practically, surgeons choose to avoid it and stick on to subtotal thyroidectomy due to the risk of damage to surrounding vital structures. Now, there is a change in a surgical practice from sub-total thyroidectomy to total thyroidectomy for benign thyroid disease.1 It was increasingly being done almost all over the world almost for the past 40 years.2 The effi cacy of total thyroidectomy being measured in terms of permanent complications,
INTRODUCTION
Thyroid surgery is the one of the common endocrine surgeries performed today. The thyroid gland is situated in a critical area in the neck surrounded by many vital structures (parathyroids and recurrent laryngeal nerve [RLN]). The complications related to the surgery were very high in the olden days. Hence, Germans and French
Original Article
Abstract
Background: The extent of thyroidectomy (subtotal to total) for benign thyroid disease was controversial till recent times. Theoretically, total thyroidectomy is a logical and optimal surgical procedure for benign thyroid disease affecting the entire thyroid gland as it has the advantage of immediate and permanent cure with no recurrence. Total thyroidectomy is currently the preferred treatment for benign thyroid disease. However, practically surgeons choose to avoid it and stick on to subtotal thyroidectomy due to the risk of damage to surrounding vital structures (parathyroids and recurrent laryngeal nerve [RLN]).
Aim of the Study: To evaluate the effi cacy and safety of total thyroidectomy in the management of benign thyroid disease in terms of permanent complications, i.e., Hypoparathyroidism and RLN palsy.
Methodology: This prospective study was conducted on 236 patients in surgical unit of Mahatma Gandhi Memorial Hospital, Kakatiya Medical Collage, Warangal, Telangana, India, from October 2010 to November 2015. Patients with benign thyroid disease were operated with total thyroidectomy and results were analyzed.
Results: About 222 patients were without any post-operative complications (94.06%), and 15 patients were with different post-operative complications (6.35%). Six patients presented with post-operative transient hypocalcemia (2.54%). One patient remained as permanent hypoparathyroidism (0.42%). Two patients developed permanent unilateral RLN palsy (0.84%). One Patient developed hematoma due to reactionary hemorrhage (0.42%). No patient developed permanent bilateral RLN palsy (0%) and there was no mortality (0%).
Conclusion: Total thyroidectomy if performed by experienced surgeons is quite safe and preferred option for management of benign thyroid disease to avoid future re-occurrences.
Key words: Benign thyroid disease, Hypoparathyroidism, Recurrent laryngeal nerve palsy, Total thyroidectomy
Access this article online
www.ijss-sn.com
Month of Submission : 02-2016Month of Peer Review : 03-2016Month of Acceptance : 03-2016Month of Publishing : 04-2016
Corresponding Author: Bapurapu Raja Ram, H. No: 2-2-23/B2 Heritage Residency, Behind Rang Restaurant, Nayeem Nagar, Vidyaranyapuri, Hanamkonda, Warangal - 506 001, Telangana, India. Phone: +91-9440828988. E-mail: [email protected]
DOI: 10.17354/ijss/2016/209

Ram, et al.: Total Thyroidectomy for Benign Thyroid Disease
162International Journal of Scientifi c Study | April 2016 | Vol 4 | Issue 1
i.e., hypoparathyroidism and RLN Palsy. Currently, RLN palsy and hypoparathyroidism rates are evaluated in the literature between 1% and 4%, i.e., RLN palsy (1%) and permanent hypoparathyroidism (1-4%).
METHODOLOGY
Inclusion CriteriaPatients with benign thyroid disease (toxic and non-toxic multinodular goiters, large diffuse colloid goiters, Grave’s disease)
Exclusion CriteriaPatients with malignant thyroid disease, patients with RLN palsy, patients with hypoparathyroidism, and patients with recurrent thyroid disease.
A total number of samplings (236 patients) were included in the study.
All the patients (n = 236) selected as per criteria from October 2010 to November 2015 were admitted in surgical unit-2 of Mahatma Gandhi Memorial Hospital, Kakatiya Medical College, Warangal, Telangana State, India, after Ethical Committee Approval and patient consent. All the patients were underwent pre-operative preparation including biochemical (T3, T4, and thyroid-stimulating hormone serum calcium), pathological (fine-needle aspiration cytology), radiological (ultrasonography and X-ray neck AP, lateral), ENT (indirect laryngoscopy [IDL]) and antithyroid drugs for toxic goiters. All the cases were operated with the procedure of total thyroidectomy by different surgeons of our team by collar incision and following standard methodological thyroid dissection as mentioned in the literature. Parathyroids identifi ed and taken care of its blood supply (Figure 1). Recurrent laryngeal nerve and superior laryngeal nerve were safeguarded (Figure 2). Perfect hemostasis secured with care. Wound closed in layers after keeping suction drain. The immediate and delayed post-operative complications of all cases were recorded and analyzed.
RESULTS
About 236 (n = 236) patients were operated with the procedure of total thyroidectomy for benign thyroid disease. Out of 236 patients, 198 patients were females (83.89%) and 38 patients were males (16.10%). The age range was from 23 to 64 years with median age of 41 years. The operative procedure of total thyroidectomy was done for different types of benign thyroid diseases after necessary pre-operative preparation. 148 patients were with non-toxic multinodular goiters (62.71%), 50 patients were with large
discomfort diffuse colloid goiters (21.18%), 22 patients were with toxic multi-nodular goiters (MNG) (9.32%), and 16 patients were with primary thyrotoxicosis (Grave’s disease) (6.77%). All the patients were operated and observed for post-operative complications. 222 patients were without any post-operative complications (94.06%), and 15 patients were with different post-operative complications (6.35%). 6 patients developed transient hypocalcemia (2.54%) which were treated immediately with intravenous calcium gluconate and followed by serial serum calcium levels and one patient remained as persistent hypoparathyroidism (0.42%), which was confi rmed by serum parathormone levels. 4 patients had post-operative hoarseness of voice (1.69%), and they were followed by IDL. 2 patients recovered and another 2 patients remained as persistent unilateral vocal cord paralysis (0.84%). One patient developed a hematoma (0.42%), in which the patient had a history of trauma at thyroid region and profused bleeding during surgery due to the abnormal vasculature. The patient was treated with re-exploration and ligation of the bleeding vessel. No patient with bilateral vocal cord paralysis (0%), no patient with airway obstruction (0%), and no mortality (0%). Hypoparathyroidism and RLN palsy occurred in one single patient of huge thyroid (MNG) which was refused by all other surgical units of our hospital. Another RLN injury occurred while attempting the control of bleeding (Tables 1-3).
Figure 1: Parathyroid safeguarded
Figure 2: Recurrent laryngeal nerve safeguarded
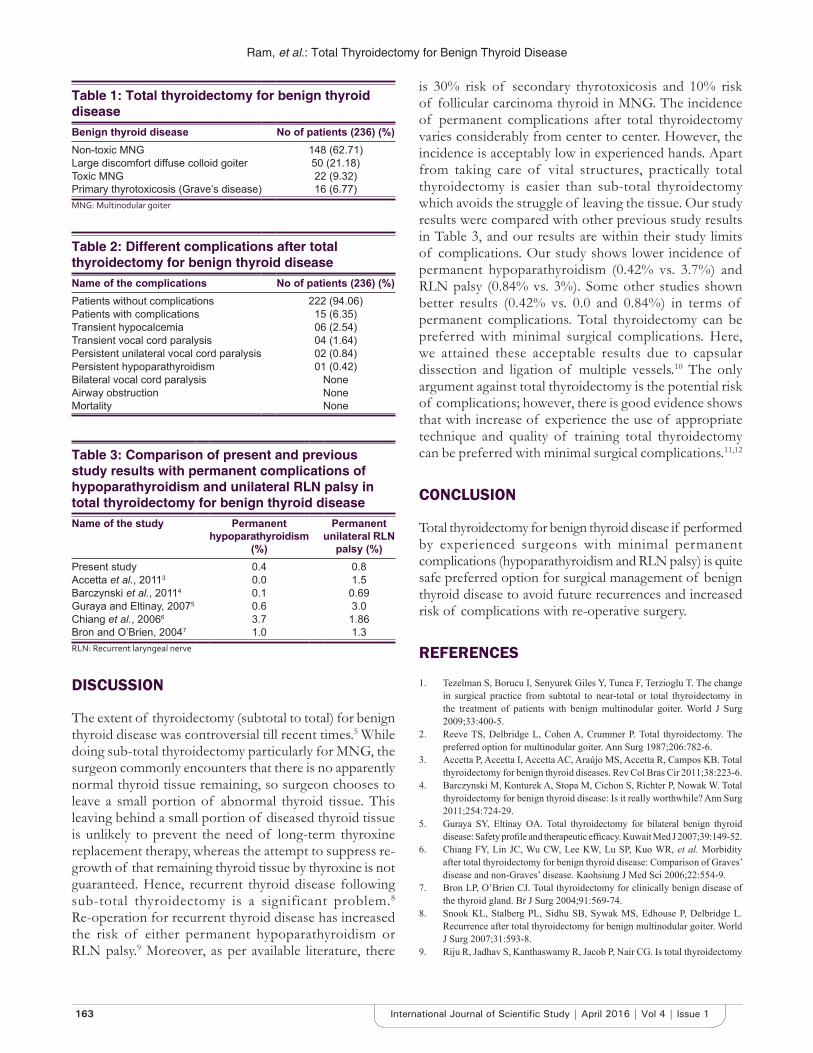
Ram, et al.: Total Thyroidectomy for Benign Thyroid Disease
163 International Journal of Scientifi c Study | April 2016 | Vol 4 | Issue 1
DISCUSSION
The extent of thyroidectomy (subtotal to total) for benign thyroid disease was controversial till recent times.5 While doing sub-total thyroidectomy particularly for MNG, the surgeon commonly encounters that there is no apparently normal thyroid tissue remaining, so surgeon chooses to leave a small portion of abnormal thyroid tissue. This leaving behind a small portion of diseased thyroid tissue is unlikely to prevent the need of long-term thyroxine replacement therapy, whereas the attempt to suppress re-growth of that remaining thyroid tissue by thyroxine is not guaranteed. Hence, recurrent thyroid disease following sub-total thyroidectomy is a significant problem.8 Re-operation for recurrent thyroid disease has increased the risk of either permanent hypoparathyroidism or RLN palsy.9 Moreover, as per available literature, there
is 30% risk of secondary thyrotoxicosis and 10% risk of follicular carcinoma thyroid in MNG. The incidence of permanent complications after total thyroidectomy varies considerably from center to center. However, the incidence is acceptably low in experienced hands. Apart from taking care of vital structures, practically total thyroidectomy is easier than sub-total thyroidectomy which avoids the struggle of leaving the tissue. Our study results were compared with other previous study results in Table 3, and our results are within their study limits of complications. Our study shows lower incidence of permanent hypoparathyroidism (0.42% vs. 3.7%) and RLN palsy (0.84% vs. 3%). Some other studies shown better results (0.42% vs. 0.0 and 0.84%) in terms of permanent complications. Total thyroidectomy can be preferred with minimal surgical complications. Here, we attained these acceptable results due to capsular dissection and ligation of multiple vessels.10 The only argument against total thyroidectomy is the potential risk of complications; however, there is good evidence shows that with increase of experience the use of appropriate technique and quality of training total thyroidectomy can be preferred with minimal surgical complications.11,12
CONCLUSION
Total thyroidectomy for benign thyroid disease if performed by experienced surgeons with minimal permanent complications (hypoparathyroidism and RLN palsy) is quite safe preferred option for surgical management of benign thyroid disease to avoid future recurrences and increased risk of complications with re-operative surgery.
REFERENCES
1. Tezelman S, Borucu I, Senyurek Giles Y, Tunca F, Terzioglu T. The change in surgical practice from subtotal to near-total or total thyroidectomy in the treatment of patients with benign multinodular goiter. World J Surg 2009;33:400-5.
2. Reeve TS, Delbridge L, Cohen A, Crummer P. Total thyroidectomy. The preferred option for multinodular goiter. Ann Surg 1987;206:782-6.
3. Accetta P, Accetta I, Accetta AC, Araújo MS, Accetta R, Campos KB. Total thyroidectomy for benign thyroid diseases. Rev Col Bras Cir 2011;38:223-6.
4. Barczynski M, Konturek A, Stopa M, Cichon S, Richter P, Nowak W. Total thyroidectomy for benign thyroid disease: Is it really worthwhile? Ann Surg 2011;254:724-29.
5. Guraya SY, Eltinay OA. Total thyroidectomy for bilateral benign thyroid disease: Safety profi le and therapeutic effi cacy. Kuwait Med J 2007;39:149-52.
6. Chiang FY, Lin JC, Wu CW, Lee KW, Lu SP, Kuo WR, et al. Morbidity after total thyroidectomy for benign thyroid disease: Comparison of Graves’ disease and non-Graves’ disease. Kaohsiung J Med Sci 2006;22:554-9.
7. Bron LP, O’Brien CJ. Total thyroidectomy for clinically benign disease of the thyroid gland. Br J Surg 2004;91:569-74.
8. Snook KL, Stalberg PL, Sidhu SB, Sywak MS, Edhouse P, Delbridge L. Recurrence after total thyroidectomy for benign multinodular goiter. World J Surg 2007;31:593-8.
9. Riju R, Jadhav S, Kanthaswamy R, Jacob P, Nair CG. Is total thyroidectomy
Table 3: Comparison of present and previous study results with permanent complications of hypoparathyroidism and unilateral RLN palsy in total thyroidectomy for benign thyroid diseaseName of the study Permanent
hypoparathyroidism (%)
Permanent unilateral RLN
palsy (%)Present study 0.4 0.8Accetta et al., 20113 0.0 1.5Barczynski et al., 20114 0.1 0.69Guraya and Eltinay, 20075 0.6 3.0Chiang et al., 20066 3.7 1.86Bron and O’Brien, 20047 1.0 1.3RLN: Recurrent laryngeal nerve
Table 1: Total thyroidectomy for benign thyroid diseaseBenign thyroid disease No of patients (236) (%)Non-toxic MNG 148 (62.71)Large discomfort diffuse colloid goiter 50 (21.18)Toxic MNG 22 (9.32)Primary thyrotoxicosis (Grave’s disease) 16 (6.77)MNG: Multinodular goiter
Table 2: Different complications after total thyroidectomy for benign thyroid diseaseName of the complications No of patients (236) (%)Patients without complications 222 (94.06)Patients with complications 15 (6.35)Transient hypocalcemia 06 (2.54)Transient vocal cord paralysis 04 (1.64)Persistent unilateral vocal cord paralysis 02 (0.84)Persistent hypoparathyroidism 01 (0.42)Bilateral vocal cord paralysis NoneAirway obstruction NoneMortality None

Ram, et al.: Total Thyroidectomy for Benign Thyroid Disease
164International Journal of Scientifi c Study | April 2016 | Vol 4 | Issue 1
justifi ed in multinodular goitre. J Indian Med Assoc 2009;107:223-5.10. Delbridge L, Reeve TS, Khadra M, Poole AG. Total thyroidectomy: The
technique of capsular dissection. Aust N Z J Surg 1992;62:96-9.11. Khadra M, Delbridge L, Reeve TS, Poole AG, Crummer P. Total
thyroidectomy: Its role in the management of thyroid disease. Aust N Z J Surg 1992;62:91-5.
12. Gough IR. Total thyroidectomy: Indications, technique and training. Aust N Z J Surg 1992;62:87-9.
How to cite this article: Ram BR, Goud VS, Kumar DR, Venkanna M. Total Thyroidectomy for Benign Thyroid Disease: A Prospective Study. Int J Sci Stud 2016;4(1):161-164.
Source of Support: Nil, Confl ict of Interest: None declared.
165 International Journal of Scientifi c Study | April 2016 | Vol 4 | Issue 1
Mastoiditis and Sinonasal Pathologies on Cranial Computed Tomography Imaging: A Correlative StudyRajesh Raman1, Nagaraj Murthy2, Shashidhar Galag3, Shilpa Diwakar3
1Associate Professor, Department of Radiodiagnosis, JSS Medical College Hospital, JSS University, Mysuru, Karnataka, India, 2Professor, Department of Radiodiagnosis, JSS Medical College Hospital, JSS University, Mysuru, Karnataka, India, 3Junior Resident, Department of Radiodiagnosis, JSS Medical College Hospital, JSS University, Mysuru, Karnataka, India,
computed tomography (MDCT) imaging of the cranium, temporal bone, and paranasal sinuses (PNS) offers precise information regarding the anatomy and variations in these regions and confi rms the presence of infection in the middle ear cavity. High-resolution CT of the temporal bone is very useful as a surgical guide map to the operating surgeon.4
This study was designed to evaluate the statistical association of occurrence of sinonasal pathologies in patients with mastoiditis and compare them with that of the general population without mastoiditis.
MATERIALS AND METHODS
A retrospective review of the imaging findings of 77 patients aged between 4 and 88 years with CT features of acute or chronic mastoiditis during from January 2016
INTRODUCTION
The middle ear or the tympanic cavity is an air-containing space within the temporal bone, which communicates with the nasopharynx via the eustachian tube and with the mastoid air cells via the mastoid aditus. It constitutes an extension of the upper respiratory tract and is subject to viral and bacterial invasion by the way of the Eustachian tube.1-3 Certain anatomic variations are thought to be predisposing factors for the development of sinus diseases, and thus may lead to mastoid infections. Multidetector
Original Article
Abstract
Background: Sinonasal pathologies are commonly found in the general population on routine computed tomography (CT) examinations of the brain and paranasal sinuses (PNS). Many of these patients have associated mastoiditis.
Objectives: This study was performed to evaluate the association between sinonasal pathologies and occurrence of mastoiditis.
Materials and Methods: This retrospective case-control study was carried out on 77 consecutive patients (Male: 50, Female: 27; age group 4-88 years). The CT images of brain and PNS were reviewed to evaluate for mastoiditis and associated sinonasal pathologies. An equal number of age- and sex-matched controls without mastoiditis was randomly chosen from the cranial CT studies of the general population. The presence of sinonasal pathologies in the mastoiditis group (cases) was compared with those in non-mastoiditis group (controls).
Results: Out of the 77 patients with signs of mastoiditis, 50 were males (64.9%) and 27 were females (35.1%). Among the 77 cases with mastoiditis, 75 had deviated nasal septum (DNS). The cases with right mastoiditis had right sided DNS in 67.4%. Similarly, the cases with left mastoiditis had leftward DNS in 71%. Bilateral mastoiditis was found in 35.1%. S-shaped DNS was found in 4 cases, and all of them had bilateral mastoiditis. An interesting fi nding in our study was a strong association of septal spur with mastoiditis on the same side (about 54-57%). All the patients (n = 4) with adenoid hypertrophy had mastoiditis. Concha bullosa, agger nasi cells, Haller cells, and ethmoid bulla did not show a signifi cant statistical association. Comparatively, the control subjects had much lesser abnormalities in the PNS in all the age groups.
Conclusion: Mastoiditis is signifi cantly associated with sinonasal pathologies.
Key words: Deviated nasal septum, Mastoiditis, Spur, Sinonasal
Access this article online
www.ijss-sn.com
Month of Submission : 02-2016Month of Peer Review : 03-2016Month of Acceptance : 03-2016Month of Publishing : 04-2016
Corresponding Author: Rajesh Raman, Department of Radiodiagnosis, JSS Medical College Hospital, JSS University, Mysuru - 570 004, Karnataka, India. Phone: +91-9481822984. E-mail: [email protected]
DOI: 10.17354/ijss/2016/210
Raman, et al.: Mastoiditis and Sinonasal Pathologies on Cranial CT
166International Journal of Scientifi c Study | April 2016 | Vol 4 | Issue 1
to March 2016 was performed. All the patients who underwent volume CT study of temporal bones, PNS, or cranium with coverage of PNS and mastoids were incorporated in the study. On the basis of the CT fi ndings of existing mastoiditis, images were evaluated for any abnormalities in the PNS. Those patients with evidence of sinonasal surgery on CT images were excluded from the study. Age- and sex-adjusted controls without mastoiditis were chosen randomly from the CT scans of the general population performed during the same study period.
CT-scan ProtocolThe study was performed on a 128 slice Philips Ingenuity CT scanner. No consent was obtained from the patients as the study is retrospective in nature.
The study protocol included cranial CT with the acquisition of contiguous axial sections of 0.6 mm thickness. The sections were reformatted to the coronal plane using a high-resolution bone algorithm. The images were reformatted and viewed on Philips ingenuity workstation.
RESULTS
The study population consisted of 77 cases and 77 controls out of which 50 were males (64.9%) and 27 were females (35.1%). The cases had mastoiditis and the controls did not.
Age of the case and control population ranged between 4 and 88 years with a mean age of 43.4 years for the cases and 44 years for the controls.
Right sided mastoiditis was seen in 39% of the cases. Left sided mastoiditis was found in 26% of the cases. 35% of the cases had bilateral mastoiditis. Out of these 77 subjects, 75 had DNS (97.4%).
Rightward DNS was seen in 43 subjects and right mastoiditis was found in 29 of these subjects (67.4%). Spur toward right side was seen in 16 subjects and 9 out of them had ipsilateral mastoiditis (56.2%).
Leftward DNS was seen in 28 subjects, out of which 20 patients had left mastoiditis (71%). Spur toward left side was seen in 11 subjects and ipsilateral mastoiditis was found in 6 of them (54.5%). S-shaped DNS was found in 4 subjects, and all of them had bilateral mastoiditis (100%).
In the control population, 21 out of 77 patients had DNS accounting for about 27.3%. Out of them, 11 had rightward DNS, 9 patients had leftward DNS, and 1 had S-shaped DNS. Nasal turbinate hypertrophy was observed in 60 of the cases and only 10 of the controls.
Adenoid hypertrophy was observed in 4 cases, and all of them had bilateral mastoiditis. None of the controls had adenoid hypertrophy. Bilateral concha bullosa was observed in 11 cases, and all of them had bilateral mastoiditis. Left concha bullosa was seen in 1 case along with ipsilateral mastoiditis. In comparison, concha bullosa was observed in only 3 of the control group.
The involvement of PNS was also found to be considerably less in the control cohort than the cases. Frontal sinusitis was found in 9 cases and 5 controls; ethmoid sinusitis was found in 11 cases and 2 controls and maxillary sinusitis was found in 33 cases and 5 controls. Sphenoid sinusitis was found in 3 of the cases and 4 of the controls. Infected right sided Agger nasi cells were found in 2 cases with rightward DNS and ipsilateral frontal sinusitis. There was ipsilateral mastoiditis in both these cases.
Prominent infraorbital ethmoid air cells were seen in 2 cases with leftward DNS and ipsilateral maxillary sinusitis. There was associated ipsilateral mastoiditis in both of them.
The mastoiditis cohort had a higher prevalence of sinonasal pathologies than the control group.
DISCUSSION
PNS are the air-containing spaces in the skull. Abnormalities of PNS such as deviated nasal septum, hypertrophy of turbinates, concha bullosa, and adenoid hypertrophy, can predispose the individuals for sinus infection and in turn increase the chances of middle ear infections.5
The association between sinus diseases and middle ear infections was studied very early, way back in 1934 by Cullom.6 He compared the X-ray prevalence of sinusitis and mastoiditis and found a very high association between sinus pathologies and mastoiditis. Almost all the patients of mastoiditis in his study had ipsilateral sinusitis. However, as our study is performed on cranial CT images with scope for more objective evaluation of images, the association between mastoiditis and sinonasal pathologies is found to be high but not absolutely as seen in Cullom’s study.
In a study of 100 patients with DNS and PNS, Moorthy et al.7 found that about 35 patients had signifi cant sinusitis on CT scans of the PNS, and 20 of these patients had ear complaints and tubotympanic type of CSOM. In our study, rightward DNS was seen in 43 subjects and right mastoiditis was found in 29 of them. Leftward DNS was observed in 28 subjects, out of which 20 had left mastoiditis. There is a strong association of septal spur and ipsilateral mastoiditis in our study (54-56%).

Raman, et al.: Mastoiditis and Sinonasal Pathologies on Cranial CT
167 International Journal of Scientifi c Study | April 2016 | Vol 4 | Issue 1
Gencer et al.8 studied the possible associations of DNS on mastoid pneumatization and chronic otitis. They found that the mastoids on the ipsilateral side of severe DNS were smaller than the contralateral side and thus predisposed to infection. In our study, mastoiditis was predominantly found on the ipsilateral side of the DNS. It was especially associated when spur was there toward the same side.
Rao et al.9 classifi ed the septal deviations into 7 types and studied the relation between deviation and sinus pathology. According to them, Type I: DNS referred to midline septum or mild deviations in vertical or horizontal plane, without extension throughout the vertical length of the septum; Type II: Anterior vertical deviation; Type III: Posterior vertical deviation (Osteomeatal and middle turbinate area); Type IV: S-shaped DNS - posterior to one side and anterior to the other side; Type V: Horizontal spur on one side with or without high deviation to the opposite side; Type VI: Type V with a deep groove on the concave side; Type VII: Combination of more than one types.
They found that mild deviations (Types I and II) did not result in significant sinusitis. In our study also, the controls that had nasal septal deviation without signifi cant sinus/mastoid pathology had milder deviations. The presence of septal spur was classifi ed as Type V in their study and was associated with signifi cant sinus pathology.
In our study also, the septal spur was associated with ipsilateral sinusitis as well as mastoiditis. The association between the spur and ipsilateral mastoiditis in our study was about 54-56%.
The prevalence of sinonasal pathologies between the males and females did not have any differences as per the study of Polat et al.3 In our study also, there was no signifi cant gender difference in sinonasal as well as mastoid pathologies. Hence, sex may not play any signifi cant role in the causation of sinusitis/mastoiditis.
Sinonasal diseases as well as mastoiditis may occasionally present with severe complications such as brain abscess or lateral sinus thrombosis. Fink et al.4 observed the association between thrombosed lateral venous sinuses and mastoiditis and found that 39% of the patients with thrombosis of lateral venous sinus had ipsilateral mastoiditis. However, in our study, lateral venous sinus thrombosis/brain abscess or intracranial complications were not observed in any of the patients.
In our study, concha bullosa, agger nasi cells, Haller cells, and ethmoidal bulla did not show statistically signifi cant association with mastoiditis. Comparatively, the control subjects had much lesser abnormalities in the PNS in all the age groups as compared to the mastoiditis group.
CONCLUSION
Sinonasal pathologies and mastoid infections have close association. Sinus pathologies and DNS are commonly found in patients with mastoiditis.10 Many patients with mastoiditis may also have ipsilateral nasal septal spur. Not many imaging studies are available to evaluate the association between sinonasal pathologies and mastoiditis. Larger studies are required to further our knowledge on the exact causal association.
REFERENCES
1. Mafee MF, Singleton EL, Valvassori GE, Espinosa GA, Kumar A, Aimi K. Acute otomastoiditis and its complications: Role of CT. Radiology 1985;155:391-7.
2. Dobben GD, Raofi B, Mafee MF, Kamel A, Mercurio S. Otogenic intracranial infl ammations: Role of magnetic resonance imaging. Top Magn Reson Imaging 2000;11:76-86.
3. Polat C, Baykara M, Yuce S, Uysal IO, Dooan M. Prevalence of sinusitis and mastoiditis in head ache. J Med Updates 2013;3:146-9.
4. Fink JN, McAuley DL. Mastoid air sinus abnormalities associated with lateral venous sinus thrombosis: Cause or consequence? Stroke 2002;33:290-2.
5. Beale TJ, Madani G, Morley SJ. Imaging of the paranasal sinuses and nasal cavity: Normal anatomy and clinically relevant anatomical variants. Semin Ultrasound CT MR 2009;30:2-16.
6. Cullom MM. The association of sinus disease and middle ear infection. JAMA 1934;103:1695-700.
7. Moorthy PN, Kolloju S, Madhira S, Jowkar AB. Clinical study on deviated
Figure 1: Coronal CT image of the Mastoid aircells showing soft tissue attenuation (Black arrow) in the right mastoid.
AQ1
Figure 2: Axial CT image of the same patient showing rightward DNS (Black arrow).
AQ1

Raman, et al.: Mastoiditis and Sinonasal Pathologies on Cranial CT
168International Journal of Scientifi c Study | April 2016 | Vol 4 | Issue 1
nasal septum and its associated pathology. Int J Otolaryngol Head Neck Surg 2014;3:75-81.
8. Gencer ZK, Özkiris M, Okur A, Karaçavus S, Saydam L. The possible associations of septal deviation on mastoid pneumatization and chronic otitis. Otol Neurotol 2013;34:1052-7.
How to cite this article: Raman R, Murthy N, Galag S, Diwakar S. Mastoiditis and Sinonasal Pathologies on Cranial Computed Tomography Imaging: A Correlative Study. Int J Sci Stud 2016;4(1):165-168.
Source of Support: Nil, Confl ict of Interest: None declared.
9. Rao JJ, Vinay Kumar EC, Babu KR, Chowdary VS, Singh J, Rangamani SV. Classifi cation of nasal septal deviations - Relation to sinonasal pathology. Indian J Otolaryngol Head Neck Surg 2005;57:199-201.
10. Lemmerling MM, De Foer B, VandeVyver V, Vercruysse JP, Verstraete KL. Imaging of the opacifi ed middle ear. Eur J Radiol 2008;66:363-71.
Author Queries???AQ1: Kindly provide citation in text part for two fi gures

169 International Journal of Scientifi c Study | April 2016 | Vol 4 | Issue 1
Ultrasound-guided Percutaneous Aspiration of Breast Abscesses: An Outpatient ProcedureAnjali Pawar Dahiphale1, Anita J Kandi2, Prashant Titare1, Varsha Rote Kaginalkar3, Sarojini Jadhav4
1Associate Professor, Department of Radiodiagnosis, Government Medical College, Aurangabad, Maharashtra, India, 2Associate Professor, Department of Surgery, Government Medical College, Aurangabad, Maharashtra, India, 3Professor and Head, Department of Radiodiagnosis, Government Medical College, Aurangabad, Maharashtra, India, 4Professor and Head, Department of Surgery, Government Medical College, Aurangabad, Maharashtra, India
India, generally related to poor nutrition, standard of living. Non-lactating breast abscess is not as common in India as in the western countries. The conventional treatment of breast abscess is by surgical incision and drainage. This often requires hospitalization, general anesthesia, and regular post-operative dressing.2 It is most expensive and placement of surgical drains are unpleasant.3 In the era of cosmesis, minimally invasive, less painful, more conservative approach in the management of breast abscess by ultrasonography (USG)-guided percutaneous needle aspiration with antibiotic coverage is very feasible.1,3-5
Aim and ObjectiveTo assess the effi cacy of ultrasound-guided percutaneous aspiration of breast abscess as an outpatient procedure.
MATERIALS AND METHODS
In our prospective study, population analyzed was presented with mastitis who were referred to our
INTRODUCTION
Mastitis is the infl ammation of breast tissue. Most breast abscesses occur as a complication of mastitis. Mastitis usually affects lactating women, but it can also occur in non-lactating women. A breast abscess is defi ned as localized infection with a collection of pus in the breast parenchyma. Bacteria can enter through a crack in the skin of the breast or a cracked nipple. Despite breast abscess becoming less common in developed countries, it has remained one of the leading cause of morbidity in women in developing countries.1 The frequency of breast abscess is quite high in
Original Article
Abstract
Introduction: Most breast abscesses occur as a complication of mastitis secondary to bacterial infection. Mastitis usually affects lactating women, but it can also occur in non-lactating women. Ultrasound-guided percutaneous aspiration of breast abscess is minimally invasive and dynamic procedure.
Aim and Objective: To evaluate the effi cacy of ultrasound-guided percutaneous aspiration in treating breast abscess as an outpatient procedure.
Materials and Methods: Ultrasound-guided percutaneous aspiration of breast abscess done in our radiology department on Aloka prosound alpha 7 ultrasound scanner and clinical and ultrasound follow-up done. Repeat aspiration done if abscess present on follow-up. Data were statistically analyzed.
Results: Most common diameter was 3-5 cm and amount of pus aspirated was 41-70 ml. Maximum 2 aspirations were required. In our study, 90% patients were cured by ultrasound-guided needle aspiration. Treatment failure was reported in 10% cases.
Conclusion: Ultrasound-guided needle aspiration of breast abscess is safe, effective, easily available, patient-friendly outpatient procedure without the development of any cosmetic issue.
Key words: Breast abscess, Percutaneous needle aspiration, Ultrasonography
Access this article online
www.ijss-sn.com
Month of Submission : 02-2016Month of Peer Review : 03-2016Month of Acceptance : 03-2016Month of Publishing : 04-2016
Corresponding Author: Dr. Anjali Pawar Dahiphale, Department of Radiodiagnosis, Government Medical College, Aurangabad, Maharashtra, India. Phone: +91-9325790053. E-mail: [email protected]
DOI: 10.17354/ijss/2016/211

Dahiphale, et al.: Ultrasound-guided Percutaneous Aspiration of Breast Abscesses: An Outpatient Procedure
170International Journal of Scientifi c Study | April 2016 | Vol 4 | Issue 1
department for sonography with clinical suspicion of breast abscess. There were 30 patients with breast abscesses randomized for USG-guided percutaneous aspiration on an outpatient basis with antibiotic coverage and repeat aspiration if necessary during the period from March 2012 to December 2015. All patients were from the outpatient department. A detailed history was taken and clinical examination was done. Characteristic of breast swelling, size of swelling, duration, history of fever, past history, and current lactation history were noted. All the necessary investigations were done accordingly.
The procedure of ultrasound-guided percutaneous aspiration was explained in detail to the patient. Informed written consent was taken in every patient. Ultrasound imaging features of the lesion like the initial size with long axis diameter was taken. Whether the lesion was uniloculated or multiloculated with internal septation and echoes was noted. All breast abscesses smaller than 7 cm in diameter were managed by ultrasound-guided percutaneous aspiration with all aseptic precaution under local anesthesia of 2 ml 2% lignocaine. On USG, abscesses were round to oval or irregular predominantly anechoic lesions with internal echoes (Figure 1). They were either uniloculated or multiloculated with internal septations. Ultrasound-guided needle aspiration was performed using 18 G needle and 20 ml disposable syringe in each case (Figure 2) pus aspirated till the abscess cavity was collapsed (Figure 3). Amount of pus aspirated was recorded, and some aspirate was sent for culture and sensitivity. These patients were given oral amoxicillin and clavulanic acid 625 mg BD daily for 7 days. Follow-up ultrasound examination done in all cases USG-guided aspiration was repeated on third and consecutively on the 7th day if required and again follow-up was done on the 14th day. At every follow-up, a clinical assessment with USG was done to assess complete resolution of the abscess. If the abscess persisted after three aspirations till 14th day, it was considered as treatment failure and hence incision and drainage were advised.
The following information was recorded in the database for each patient, viz., age, parity, lactational status, ultrasound measurement and features, pus volume removed, number of aspirations required, pus culture, and healing time. Lactating patients were encouraged to continue breastfeeding from the affected and unaffected breast.
RESULTS
Distribution of patients according to signs and symptoms were done. All the patients were presented with painful swelling (100%). Only 14 patients were presented with fever (46.66%). Axillary lymphadenopathy was present in
5 (16.66%) patients. 15 patients (50%) were presented with the cracked nipple. Out of 30 patients, 27 were lactating (90%) and remaining 3 (10%) were non-lactating. There were 24 (80%) primigravida patients.
Failure was seen in three patients as two out of them developed skin changes and repeated collection even after 3 aspirations, and they had multiloculated abscesses.
Figure 1: Image showing anechoic loculated collection with internal echoes in the breast
Figure 2: Ultrasound images showing breast abscesses with internal echoes and septations. Percutaneous aspiration needle
is seen in the cavity of breast abscesses
Figure 3: Ultrasound image showing collapsed abscess cavity after aspiration procedure
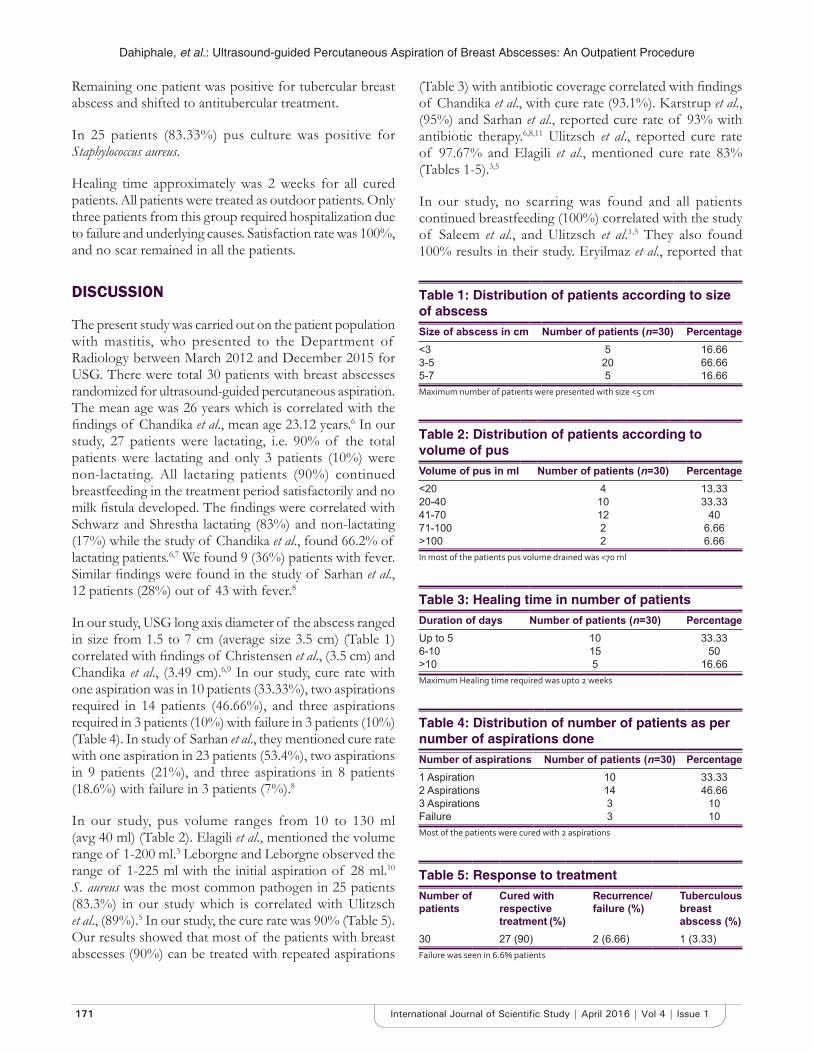
Dahiphale, et al.: Ultrasound-guided Percutaneous Aspiration of Breast Abscesses: An Outpatient Procedure
171 International Journal of Scientifi c Study | April 2016 | Vol 4 | Issue 1
Remaining one patient was positive for tubercular breast abscess and shifted to antitubercular treatment.
In 25 patients (83.33%) pus culture was positive for Staphylococcus aureus.
Healing time approximately was 2 weeks for all cured patients. All patients were treated as outdoor patients. Only three patients from this group required hospitalization due to failure and underlying causes. Satisfaction rate was 100%, and no scar remained in all the patients.
DISCUSSION
The present study was carried out on the patient population with mastitis, who presented to the Department of Radiology between March 2012 and December 2015 for USG. There were total 30 patients with breast abscesses randomized for ultrasound-guided percutaneous aspiration. The mean age was 26 years which is correlated with the fi ndings of Chandika et al., mean age 23.12 years.6 In our study, 27 patients were lactating, i.e. 90% of the total patients were lactating and only 3 patients (10%) were non-lactating. All lactating patients (90%) continued breastfeeding in the treatment period satisfactorily and no milk fi stula developed. The fi ndings were correlated with Schwarz and Shrestha lactating (83%) and non-lactating (17%) while the study of Chandika et al., found 66.2% of lactating patients.6,7 We found 9 (36%) patients with fever. Similar fi ndings were found in the study of Sarhan et al., 12 patients (28%) out of 43 with fever.8
In our study, USG long axis diameter of the abscess ranged in size from 1.5 to 7 cm (average size 3.5 cm) (Table 1) correlated with fi ndings of Christensen et al., (3.5 cm) and Chandika et al., (3.49 cm).6,9 In our study, cure rate with one aspiration was in 10 patients (33.33%), two aspirations required in 14 patients (46.66%), and three aspirations required in 3 patients (10%) with failure in 3 patients (10%) (Table 4). In study of Sarhan et al., they mentioned cure rate with one aspiration in 23 patients (53.4%), two aspirations in 9 patients (21%), and three aspirations in 8 patients (18.6%) with failure in 3 patients (7%).8
In our study, pus volume ranges from 10 to 130 ml (avg 40 ml) (Table 2). Elagili et al., mentioned the volume range of 1-200 ml.3 Leborgne and Leborgne observed the range of 1-225 ml with the initial aspiration of 28 ml.10 S. aureus was the most common pathogen in 25 patients (83.3%) in our study which is correlated with Ulitzsch et al., (89%).5 In our study, the cure rate was 90% (Table 5). Our results showed that most of the patients with breast abscesses (90%) can be treated with repeated aspirations
(Table 3) with antibiotic coverage correlated with fi ndings of Chandika et al., with cure rate (93.1%). Karstrup et al., (95%) and Sarhan et al., reported cure rate of 93% with antibiotic therapy.6,8,11 Ulitzsch et al., reported cure rate of 97.67% and Elagili et al., mentioned cure rate 83% (Tables 1-5).3,5
In our study, no scarring was found and all patients continued breastfeeding (100%) correlated with the study of Saleem et al., and Ulitzsch et al.1,5 They also found 100% results in their study. Eryilmaz et al., reported that
Table 1: Distribution of patients according to size of abscessSize of abscess in cm Number of patients (n=30) Percentage<3 5 16.663-5 20 66.665-7 5 16.66Maximum number of patients were presented with size <5 cm
Table 2: Distribution of patients according to volume of pusVolume of pus in ml Number of patients (n=30) Percentage<20 4 13.3320-40 10 33.3341-70 12 4071-100 2 6.66>100 2 6.66In most of the patients pus volume drained was <70 ml
Table 3: Healing time in number of patientsDuration of days Number of patients (n=30) PercentageUp to 5 10 33.336-10 15 50>10 5 16.66Maximum Healing time required was upto 2 weeks
Table 4: Distribution of number of patients as per number of aspirations doneNumber of aspirations Number of patients (n=30) Percentage1 Aspiration 10 33.332 Aspirations 14 46.663 Aspirations 3 10Failure 3 10Most of the patients were cured with 2 aspirations
Table 5: Response to treatmentNumber of patients
Cured with respective treatment (%)
Recurrence/failure (%)
Tuberculous breast abscess (%)
30 27 (90) 2 (6.66) 1 (3.33)Failure was seen in 6.6% patients
Dahiphale, et al.: Ultrasound-guided Percutaneous Aspiration of Breast Abscesses: An Outpatient Procedure
172International Journal of Scientifi c Study | April 2016 | Vol 4 | Issue 1
the risk factor for failure of needle aspiration of breast abscess was abscess size more than 5 cm.12 We also found failure in 2 (6.66%) patients with abscess size >5 cm with multiloculation. One patient was positive for tuberculous breast abscess was shifted to antituberculous treatment. Healing time was 2 weeks consistent with fi nding of Chandika et al., and Strauss et al.6,13 All 27 patients (90%) in our study treated on outpatient basis consistent with study of Christensens et al., 77 patients (87%).9 USG-guided aspiration of breast abscess is very cost effective treatment as it is outpatient procedure without hospitalization and no general anesthesia and repeated dressing required consistent with fi ndings of Chandika et al., (93.11%).6 No breast abscess recurrence was observed in all cured patients. The procedure is highly accepted by all the patients with 100% satisfaction consistent with study of Ulitzsch et al., and Christensen et al.5,9
CONCLUSION
USG-guided percutaneous aspiration of breast abscess represented a minimally invasive, simple outpatient department procedure without the need of general anesthesia with superior cosmetic results, high satisfaction rate in lactating, and non-lactating women. It is very promising, feasible, and effi cient alternative method of treatment to conventional incision and drainage in properly selected patients.
REFERENCES
1. Saleem S. Puerperal breast abscesses: Percutaneous ultrasound guided drainage compared with conventional incision and drainage (18). Prof Med J 2005;15:431-6.
2. Dixon JM. Repeated aspiration of breast abscesses in lactating women. BMJ 1988;297:1517-8.
3. Elagili F, Abdullah N, Fong L, Pri T. Aspiration of breast abscess under ultrasonographic guidance. Outcome obtained and factors affecting success. Asian J Surg 2007;30:40-4.
4. Imperiale A, Zandrino F, Calabrese M, Parodi G, Massa T. Abscesses of the breast. US-guided serial percutaneous aspiration and local antibiotic therapy after unsuccessful systemic antibiotic therapy. Acta Radiol 2001;42:161-5.
5. Ulitzsch D, Nyman MK, Carlson RA. Breast abscess in lactating women: US-guided treatment. Radiology 2004;232:904-9.
6. Chandika AB, Gakwaya AM, Malwadde EK, Chalya PL. Ultrasound guided needle aspiration verses surgical drainage in the management of breast abscesses: A Ugandan experience. BMC Res Notes 2012;5:12.
7. Schwarz RJ, Shrestha R. Needle aspiration of breast abscesses. Am J Surg 2001;182:117-9.
8. Sarhan HH, Ibraheem OM. Percutaneous needle aspiration of breast abscess. Fac Med Baghdad 2012;54:118-121.
9. Christensen AF, Al-Suliman N, Nielsen KR, Vejborg I, Severinsen N, Christensen H, et al. Ultrasound-guided drainage of breast abscesses: Results in 151 patients. Br J Radiol 2005;78:186-8.
10. Leborgne F, Leborgne F. Treatment of breast abscesses with sonographically guided aspiration, irrigation, and instillation of antibiotics. AJR Am J Roentgenol 2003;181:1089-91.
11. Karstrup S, Solving J, Nolsoe CP, Brabrand K, Neilsen KR. Acute puerperal breast abscesses: US guided percutaneous drainage of breast abscesses. Acta Radiol 1990;31:157-9.
12. Eryilmaz R, Sahin M, Hakan Tekelioglu M, Daldal E. Management of lactational breast abscesses. Breast 2005;14:375-9.
13. Strauss A, Middendorf K, Müller-Egloff S, Heer IM, Untch M, Bauerfeind I. Sonographically guided percutaneous needle aspiration of breast abscesses - A minimal-invasive alternative to surgical incision. Ultraschall Med 2003;24:393-8.
How to cite this article: Pawar Dahiphale A, Kandi AJ, Titare P, Kaginalkar Rote V, Jadhav S. Ultrasound-guided Percutaneous Aspiration of Breast Abscesses: An Outpatient Procedure. Int J Sci Stud 2016;4(1):169-172.
Source of Support: Nil, Confl ict of Interest: None declared.

173 International Journal of Scientifi c Study | April 2016 | Vol 4 | Issue 1
Analysis of Germ Cell Tumors of Ovary in a Tertiary Care Hospital: A Two Year Retrospective StudyMuktanjalee Deka1, Chandan Jyoti Saikia2, Rukmini Bezbaruah3
1Associate Professor, Department of Pathology, Gauhati Medical College & Hospital, Guwahati, Assam, India, 2Demonstrator, Department of Pathology, Gauhati Medical College & Hospital, Guwahati, Assam, India, 3Post-graduate Trainee, Department of Pathology, Gauhati Medical College & Hospital, Guwahati, Assam, India
Most subtypes occur in pure form, but approximately 10% are composed of two or more subtypes. Most malignant germ cell tumors are composed of premature elements; however, in the case of adults, they almost always develop in dermoid cysts and are encountered in older women. In the present study, we analyzed the germ cell tumors reported in our institute.
MATERIALS AND METHODS
The study was a hospital-based retrospective study carried out in the Department of Pathology, Gauhati Medical College & Hospital. All cases of ovarian tumors during the period from May 2013 to June 2015 were retrieved from the record fi les and analyzed. The study focuses on clinical presentation with respect to age, presenting complaints, gross features, and histologic types. The tissues were routinely fi xed with 10% formalin, and the slides were stained with hematoxylin and eosin stain and also with special stains whenever required.
INTRODUCTION
Ovarian cancers are common among females comprising 30% of cancers of the female genital tract and 6% of all cancers in females.1,2 Germ cell tumors constitute 15-20% of all ovarian tumors. 95% of germ cell tumors are dermoid cysts (mature cystic teratomas), and most of the remainder are malignant.3 In children and adolescents, more than 60% of ovarian neoplasms are of germ cell origin and one-third are malignant.4 Germ cell tumors comprise 23% of ovarian tumors in East India.5 They account for two-thirds of the ovarian cancers during the fi rst two decades of life.
Original Article
Abstract
Background: Germ cell tumors of the ovary are a rare and complex group of heterogeneous neoplasm that comprises both benign and malignant histologies. A mixture of histologic subtypes may be present within any single germ cell tumor.
Aim: Aim of this study was to evaluate germ cell tumors in our institution.
Materials and Methods: All cases of ovarian tumors during the period from May 2013 to June 2015 were retrieved from the record fi les of the Department and germ cell tumors were selected for analysis.
Results: A total of 110 patients were included with a mean age of 28 years. Teratomas were most frequently found (mature: 98 cases, immature: 01 case), followed by dysgerminoma (05 cases), yolk sac tumor (02 cases), embryonal carcinoma (01 case), squamous carcinoma arising in mature teratoma (01 case), and mixed germ cell tumor (01 case). Abdominal mass (58 cases) and abdominal pain (35 cases) were most common presenting symptoms.
Conclusion: Mature teratoma is the most common germ cell tumor, most commonly occurring in the 3rd decade. Dysgerminoma is the most common malignant germ cell tumor occurring in the 11-20 years age group.
Key words: Dysgerminoma, Germ cell, Ovary, Teratoma
Access this article online
www.ijss-sn.com
Month of Submission : 02-2016Month of Peer Review : 03-2016Month of Acceptance : 03-2016Month of Publishing : 04-2016
Corresponding Author: Dr. Chandan Jyoti Saikia, House No: 06, Ward No: 25, Near Rupnagar M.E. School, Rupnagar, Guwahati - 781 032. Phone: +91-9864285984. E-mail: [email protected]
DOI: 10.17354/ijss/2016/212

Deka, et al.: Analysis of Germ Cell Tumors of Ovary
174International Journal of Scientifi c Study | April 2016 | Vol 4 | Issue 1
RESULTS
A total of 365 cases of ovarian tumors have been reported in the same period and among them, 110 cases (30%) were germ cell origin. The age distribution has been calculated in Table 1. The age range in our series was 08-58 years with a mean age of 28 years. The most common age group affected was 21-30 years. Most of the malignant cases (11/12, 91.3%) were in women of <30 years. The most common presenting complaint was abdominal mass (58/110, 52.7%), followed by abdominal pain (35/110, 31.8%) (Table 2 and Figure 1). Out of 110 cases, all were unilateral except 02 cases of mature cystic teratoma. The size of the tumors ranged from 07 to 25 cm with an average size of 15.5 cm. All the malignant tumors were more than 12 cm in size.
Grossly, majority cases were cystic (65/110, 59.09%) followed by solid/cystic (35/110, 31.8%) and least frequent being solid tumors (Table 3 and Figure 2). Both sided ovaries were equally involved. The number and percentage of different types of germ cell tumors are shown in Tables 4 and 5. The most common germ cell tumor was mature cystic teratoma (98/110 cases) comprising 88.18% of all germ cell tumors. Malignant germ cell tumors comprised 10.9% of the cases (12/110). The most common malignant germ cell tumor was dysgerminoma (06/12). Others were yolk sac tumor (02 cases), one each of immature teratoma, embryonal carcinoma, squamous carcinoma arising in mature teratoma, and mixed germ cell tumors (mature teratoma + embryonal carcinoma).
DISCUSSION
Germ cell tumors are a heterogeneous group, majority originating at different stages of development of germ
cells.1 Some are composed of undifferentiated cells (dysgerminoma, embryonal carcinoma) while in others there is differentiation toward embryonic (teratoma) or extraembryonic (choriocarcinoma, yolk sac tumor)
Table 1: Age distribution of the casesAge (years) Number of cases (110) Percentage1-10 1 0.911-20 18 16.3621-30 52 47.2731-40 22 2041-50 11 1051-60 6 5.45
Table 2: Presenting complaints in order of frequency and their percentageClinical symptom Number of cases PercentageAbdominal mass 58 52.72Abdominal pain 35 31.8Irregular menstruation 5 4.54GI disturbance 3 2.72Urinary symptoms 4 3.64Incidental fi ndings 5 4.54GI: Gastrointestinal
Table 3: Gross appearance of the tumorsGross Number of cases PercentageCystic 65 59.09Solid/cystic 35 31.8Solid 10 9.09Total 110 100
Table 4: Frequency and percentage of benign and malignant germ cell tumorsTumors Number of cases PercentageBenign 98 89Malignant 12 11Total 110 100
Table 5: Frequency and percentage of different types
Germ cell tumor Incidence PercentageBenign 98 89.09Mature cystic teratoma 98 89.09Malignant 12 10.9Dysgerminoma 6 8.18Yolk sac tumor 2 1.81Immature teratoma 1 0.9Embryonal carcinoma 1 0.9Squamous carcinoma arising in mature teratoma
1 0.9
Mixed germ cell tumor (mature teratoma+embryonal carcinoma)
1 0.9
53%32%
4% 3% 4% 4%
ABDOMINAL MASSABDOMINAL PAINIRREGULAR MENSTRUATIONGI DISTURBANCEURINARY SYMPTOMINCIDENTAL FINDINGS
Figure 1: Presenting complaints in order of frequency and their percentage

Deka, et al.: Analysis of Germ Cell Tumors of Ovary
175 International Journal of Scientifi c Study | April 2016 | Vol 4 | Issue 1
structures.6 They account for 30% of all ovarian tumors.5,7 In the current study, they constituted 30% of all ovarian tumors.
Benign Germ Cell TumorsMature cystic teratoma is the most common germ cell tumor comprising more than 95% of all germ cell tumors.1 Mondal et al., and Jha and Karki have reported 68.9% and 95% of all germ cell tumors.4,8 In our study, (98/110, 89.09%) was mature cystic teratoma. Grossly, the tumors were unilocular cysts fi lled with hair and cheesy material. Microscopically, tumors showed a predominance of skin and its appendages. Glial tissue was seen in 04 cases. Choroid plexus was seen in one case and respiratory epithelium noted in 15 cases (Figures 3 and 4).
The majority of mature cystic teratomas are known to occur in <50 years with a peak incidence between 20 and 29 years.1,6 In our series, the majority were below 50 years of age (Figure 5).
All the cases were unilateral except 02 cases which showed the bilateral involvement of the ovaries. The size ranged from 07 to 25 cm with an average size of 12.5 cm.
In contrast to primitive germ cell tumors, which are almost always encountered in girls and women of reproductive age group. The dermoid cyst is occasionally encountered in postmenopausal women, where ovaries no longer contain recognizable germ cells. This can be interpreted as indicative of leisurely growth of a tumor that originated years earlier.9
Malignant Germ Cell TumorImmature teratoma represents 03% of teratomas, 01% of all ovarian cancers, and 20% of malignant ovarian germ cell tumors.1 They occur predominantly in children and young women, the average age at presentation being 20 yrs (Figure 5) . In our study, one case of immature teratoma was seen in an 18 years female. A mixture of mature and immature components was seen including immature cartilage, immature mesenchyme, and primitive neuroepithelium. Based on the amount of neuroectodermal component, it was assigned as Grade 2 (Figures 6 and 7).
Approximately, 02% of dermoid cysts contain adult type malignant tumors, 80% of which are squamous cell carcinomas9 and are typically seen in postmenopausal women. In a study of 87 ovarian teratomas, Papadis et al., reported 05% cases with malignant changes.10 We found one case of squamous cell carcinoma arising in a mature teratoma which comprised 0.9% of germ cell tumors of ovaries in our study.
BENIGN MALIGNANT
1 012 6
47
521
111 6
(1-10) (11-20) (21-30)
(31-40) (41-50) (51-60)
Figure 5: Age incidence in benign and malignant germ cell tumors
Cystic
59%
Solid/Cysti
c
32%
Solid
9%
Figure 2 : Macroscopic/gross fi nding of the tumors
Figure 3: Lower power view of mature teratoma showing different elements derived from three germ layers
Figure 4: Low power view of mature teratoma showing glial tissue and choroid plexus
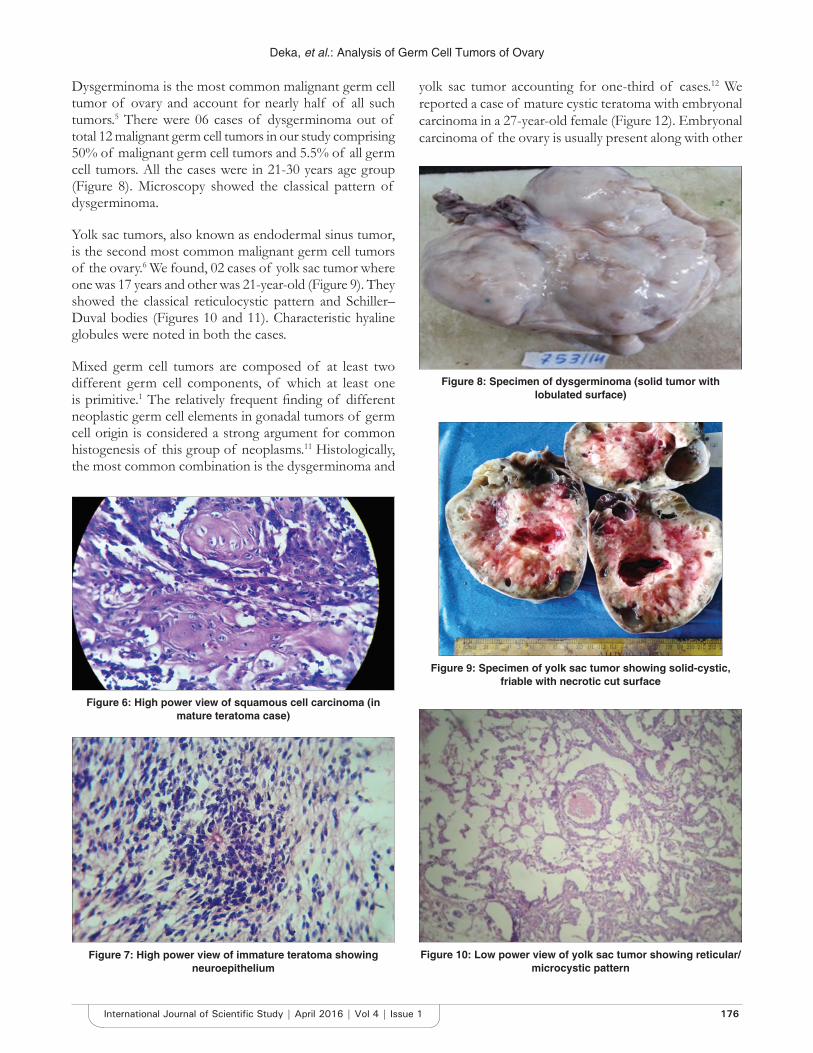
Deka, et al.: Analysis of Germ Cell Tumors of Ovary
176International Journal of Scientifi c Study | April 2016 | Vol 4 | Issue 1
Dysgerminoma is the most common malignant germ cell tumor of ovary and account for nearly half of all such tumors.5 There were 06 cases of dysgerminoma out of total 12 malignant germ cell tumors in our study comprising 50% of malignant germ cell tumors and 5.5% of all germ cell tumors. All the cases were in 21-30 years age group (Figure 8). Microscopy showed the classical pattern of dysgerminoma.
Yolk sac tumors, also known as endodermal sinus tumor, is the second most common malignant germ cell tumors of the ovary.6 We found, 02 cases of yolk sac tumor where one was 17 years and other was 21-year-old (Figure 9). They showed the classical reticulocystic pattern and Schiller–Duval bodies (Figures 10 and 11). Characteristic hyaline globules were noted in both the cases.
Mixed germ cell tumors are composed of at least two different germ cell components, of which at least one is primitive.1 The relatively frequent fi nding of different neoplastic germ cell elements in gonadal tumors of germ cell origin is considered a strong argument for common histogenesis of this group of neoplasms.11 Histologically, the most common combination is the dysgerminoma and
yolk sac tumor accounting for one-third of cases.12 We reported a case of mature cystic teratoma with embryonal carcinoma in a 27-year-old female (Figure 12). Embryonal carcinoma of the ovary is usually present along with other
Figure 6: High power view of squamous cell carcinoma (in mature teratoma case)
Figure 10: Low power view of yolk sac tumor showing reticular/microcystic pattern
Figure 7: High power view of immature teratoma showing neuroepithelium
Figure 8: Specimen of dysgerminoma (solid tumor with lobulated surface)
Figure 9: Specimen of yolk sac tumor showing solid-cystic, friable with necrotic cut surface
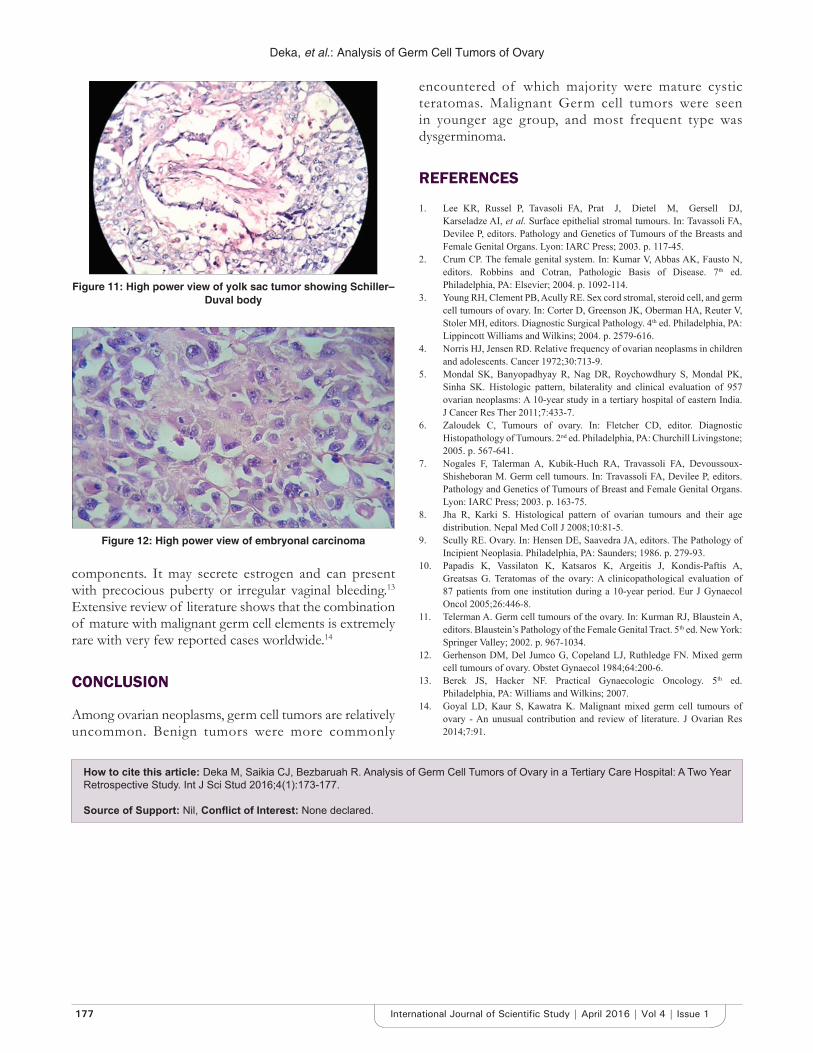
Deka, et al.: Analysis of Germ Cell Tumors of Ovary
177 International Journal of Scientifi c Study | April 2016 | Vol 4 | Issue 1
components. It may secrete estrogen and can present with precocious puberty or irregular vaginal bleeding.13 Extensive review of literature shows that the combination of mature with malignant germ cell elements is extremely rare with very few reported cases worldwide.14
CONCLUSION
Among ovarian neoplasms, germ cell tumors are relatively uncommon. Benign tumors were more commonly
Figure 11: High power view of yolk sac tumor showing Schiller–Duval body
Figure 12: High power view of embryonal carcinoma
encountered of which majority were mature cystic teratomas. Malignant Germ cell tumors were seen in younger age group, and most frequent type was dysgerminoma.
REFERENCES
1. Lee KR, Russel P, Tavasoli FA, Prat J, Dietel M, Gersell DJ, Karseladze AI, et al. Surface epithelial stromal tumours. In: Tavassoli FA, Devilee P, editors. Pathology and Genetics of Tumours of the Breasts and Female Genital Organs. Lyon: IARC Press; 2003. p. 117-45.
2. Crum CP. The female genital system. In: Kumar V, Abbas AK, Fausto N, editors. Robbins and Cotran, Pathologic Basis of Disease. 7th ed. Philadelphia, PA: Elsevier; 2004. p. 1092-114.
3. Young RH, Clement PB, Acully RE. Sex cord stromal, steroid cell, and germ cell tumours of ovary. In: Corter D, Greenson JK, Oberman HA, Reuter V, Stoler MH, editors. Diagnostic Surgical Pathology. 4th ed. Philadelphia, PA: Lippincott Williams and Wilkins; 2004. p. 2579-616.
4. Norris HJ, Jensen RD. Relative frequency of ovarian neoplasms in children and adolescents. Cancer 1972;30:713-9.
5. Mondal SK, Banyopadhyay R, Nag DR, Roychowdhury S, Mondal PK, Sinha SK. Histologic pattern, bilaterality and clinical evaluation of 957 ovarian neoplasms: A 10-year study in a tertiary hospital of eastern India. J Cancer Res Ther 2011;7:433-7.
6. Zaloudek C, Tumours of ovary. In: Fletcher CD, editor. Diagnostic Histopathology of Tumours. 2nd ed. Philadelphia, PA: Churchill Livingstone; 2005. p. 567-641.
7. Nogales F, Talerman A, Kubik-Huch RA, Travassoli FA, Devoussoux-Shisheboran M. Germ cell tumours. In: Travassoli FA, Devilee P, editors. Pathology and Genetics of Tumours of Breast and Female Genital Organs. Lyon: IARC Press; 2003. p. 163-75.
8. Jha R, Karki S. Histological pattern of ovarian tumours and their age distribution. Nepal Med Coll J 2008;10:81-5.
9. Scully RE. Ovary. In: Hensen DE, Saavedra JA, editors. The Pathology of Incipient Neoplasia. Philadelphia, PA: Saunders; 1986. p. 279-93.
10. Papadis K, Vassilaton K, Katsaros K, Argeitis J, Kondis-Paftis A, Greatsas G. Teratomas of the ovary: A clinicopathological evaluation of 87 patients from one institution during a 10-year period. Eur J Gynaecol Oncol 2005;26:446-8.
11. Telerman A. Germ cell tumours of the ovary. In: Kurman RJ, Blaustein A, editors. Blaustein’s Pathology of the Female Genital Tract. 5th ed. New York: Springer Valley; 2002. p. 967-1034.
12. Gerhenson DM, Del Jumco G, Copeland LJ, Ruthledge FN. Mixed germ cell tumours of ovary. Obstet Gynaecol 1984;64:200-6.
13. Berek JS, Hacker NF. Practical Gynaecologic Oncology. 5th ed. Philadelphia, PA: Williams and Wilkins; 2007.
14. Goyal LD, Kaur S, Kawatra K. Malignant mixed germ cell tumours of ovary - An unusual contribution and review of literature. J Ovarian Res 2014;7:91.
How to cite this article: Deka M, Saikia CJ, Bezbaruah R. Analysis of Germ Cell Tumors of Ovary in a Tertiary Care Hospital: A Two Year Retrospective Study. Int J Sci Stud 2016;4(1):173-177.
Source of Support: Nil, Confl ict of Interest: None declared.
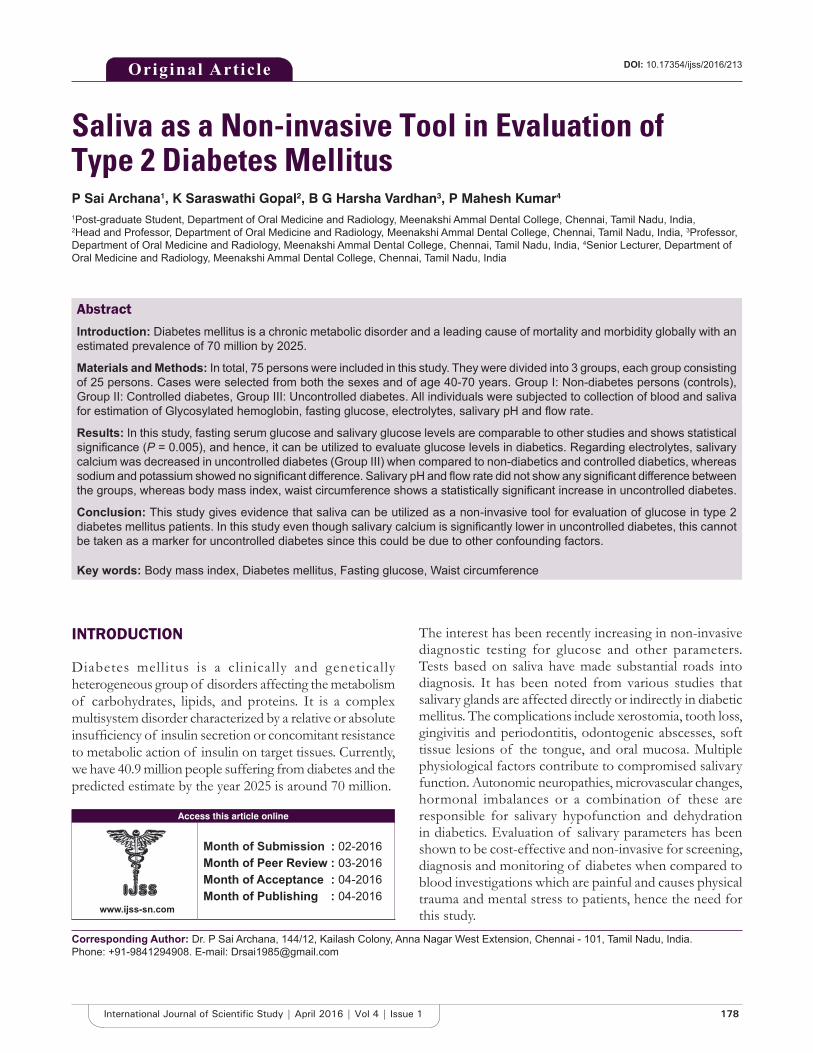
178International Journal of Scientifi c Study | April 2016 | Vol 4 | Issue 1
Saliva as a Non-invasive Tool in Evaluation of Type 2 Diabetes MellitusP Sai Archana1, K Saraswathi Gopal2, B G Harsha Vardhan3, P Mahesh Kumar4
1Post-graduate Student, Department of Oral Medicine and Radiology, Meenakshi Ammal Dental College, Chennai, Tamil Nadu, India,2Head and Professor, Department of Oral Medicine and Radiology, Meenakshi Ammal Dental College, Chennai, Tamil Nadu, India, 3Professor, Department of Oral Medicine and Radiology, Meenakshi Ammal Dental College, Chennai, Tamil Nadu, India, 4Senior Lecturer, Department of Oral Medicine and Radiology, Meenakshi Ammal Dental College, Chennai, Tamil Nadu, India
The interest has been recently increasing in non-invasive diagnostic testing for glucose and other parameters. Tests based on saliva have made substantial roads into diagnosis. It has been noted from various studies that salivary glands are affected directly or indirectly in diabetic mellitus. The complications include xerostomia, tooth loss, gingivitis and periodontitis, odontogenic abscesses, soft tissue lesions of the tongue, and oral mucosa. Multiple physiological factors contribute to compromised salivary function. Autonomic neuropathies, microvascular changes, hormonal imbalances or a combination of these are responsible for salivary hypofunction and dehydration in diabetics. Evaluation of salivary parameters has been shown to be cost-effective and non-invasive for screening, diagnosis and monitoring of diabetes when compared to blood investigations which are painful and causes physical trauma and mental stress to patients, hence the need for this study.
INTRODUCTION
Diabetes mellitus is a clinically and genetically heterogeneous group of disorders affecting the metabolism of carbohydrates, lipids, and proteins. It is a complex multisystem disorder characterized by a relative or absolute insuffi ciency of insulin secretion or concomitant resistance to metabolic action of insulin on target tissues. Currently, we have 40.9 million people suffering from diabetes and the predicted estimate by the year 2025 is around 70 million.
Original Article
Abstract
Introduction: Diabetes mellitus is a chronic metabolic disorder and a leading cause of mortality and morbidity globally with an estimated prevalence of 70 million by 2025.
Materials and Methods: In total, 75 persons were included in this study. They were divided into 3 groups, each group consisting of 25 persons. Cases were selected from both the sexes and of age 40-70 years. Group I: Non-diabetes persons (controls), Group II: Controlled diabetes, Group III: Uncontrolled diabetes. All individuals were subjected to collection of blood and saliva for estimation of Glycosylated hemoglobin, fasting glucose, electrolytes, salivary pH and fl ow rate.
Results: In this study, fasting serum glucose and salivary glucose levels are comparable to other studies and shows statistical signifi cance (P = 0.005), and hence, it can be utilized to evaluate glucose levels in diabetics. Regarding electrolytes, salivary calcium was decreased in uncontrolled diabetes (Group III) when compared to non-diabetics and controlled diabetics, whereas sodium and potassium showed no signifi cant difference. Salivary pH and fl ow rate did not show any signifi cant difference between the groups, whereas body mass index, waist circumference shows a statistically signifi cant increase in uncontrolled diabetes.
Conclusion: This study gives evidence that saliva can be utilized as a non-invasive tool for evaluation of glucose in type 2 diabetes mellitus patients. In this study even though salivary calcium is signifi cantly lower in uncontrolled diabetes, this cannot be taken as a marker for uncontrolled diabetes since this could be due to other confounding factors.
Key words: Body mass index, Diabetes mellitus, Fasting glucose, Waist circumference
Access this article online
www.ijss-sn.com
Month of Submission : 02-2016Month of Peer Review : 03-2016Month of Acceptance : 04-2016Month of Publishing : 04-2016
Corresponding Author: Dr. P Sai Archana, 144/12, Kailash Colony, Anna Nagar West Extension, Chennai - 101, Tamil Nadu, India. Phone: +91-9841294908. E-mail: [email protected]
DOI: 10.17354/ijss/2016/213

Archana, et al.: Saliva as a Non-invasive Tool in Evaluation of DM
179 International Journal of Scientifi c Study | April 2016 | Vol 4 | Issue 1
MATERIALS AND METHODS
This is a prospective, randomized, cross-sectional study. The study was conducted in Meenakshi Ammal Dental College and Hospital, Chennai and Ethical Clearance was obtained for the same. A total no of 75 patients were included in this study, in which 50 patients were suffering from type 2 diabetes mellitus (which included both controlled and uncontrolled diabetics) and 25 non-diabetes persons (controls). The study population included both the genders, with an age range of 40-70 years.
The study population will be divided into 3 groups:Group 1: Non-diabetics (control)Group II: Controlled diabetic patientsGroup III: Uncontrolled diabetic patients.
Inclusion Criteria• Voluntary participation,• Age inclusion: 40-75 years, and• Sex included both the genders.
Exclusion Criteria• Patients suffering from type 1 diabetes mellitus,
pregnancy, physically and mentally challenged patients, chronic renal failure, hyperthyroidism, pancreatitis and pancreatic cancer, hypercholesterolemia. Medications, such as steroids, tricyclic antidepressants, epinephrine, diuretics, estrogen, lithium, and salicylates, were also excluded.
All patients were explained in detail about this study, and informed consent was obtained in their native languages to prevent language bias and later was subjected to collection of saliva and blood examination.
• Unstimulated saliva of 2 ml for 5 min will be collected and salivary fl ow rate and pH, levels of glucose, sodium, potassium, and calcium levels will be evaluated.
• 8 ml of venous blood will be collected and subjected to fasting glucose estimation, glycosylated hemoglobin (HbA1C), sodium, potassium, and calcium.
The testing of both salivary and serum samples was done in aseptic conditions. After 8 ml of venous blood sample was obtained from each subject, blood was immediately transferred into vacutainers and processed. The unstimulated saliva of 2 ml was collected for about 5 min immediately after blood collection in pre-weighed containers and estimated for same parameters with salivary fl ow rate and pH in subjects from all the groups. pH was estimated through salivary digital pH meter model no 111, which gave accurate data. The specimens were analyzed in room temperature and were fed into automated analyzer for
interpretation of the following parameters. Fasting blood glucose in serum and saliva, HbA1c was measured through the following methods: Electrochemical colorimeter using a glucosymeter (Freestyle Precision - Abbots Diabetes Care Inc.), yielding blood glucose in milligrams per deciliter (mg/dL), HbA1c: High-pressure liquid chromatography (D-10 hemoglobin testing system - Bio-Rad Inc.), which gives the % of HbA1c fraction. Electrolytes levels of sodium and potassium in both serum and saliva were measured by Roche 9180 electrolyte analyzer, whereas for salivary and serum calcium estimation Optima 1 from Labindia manufacturers was done and described in Meq/l.
The results thus got were tabulated, and statistical analysis was done with statistical methods such as scatter plot and ANOVA.
RESULTS
In this study, fasting serum glucose and salivary glucose levels are comparable to other studies and shows statistical signifi cance (P = 0.005) and hence it can be utilized to evaluate glucose levels in diabetics (Figures 1 and 2). Regarding electrolytes, salivary calcium was decreased in uncontrolled diabetes (Group III) when compared
0
5
10
15
20
25
SalivaFastingGlucose
SalivaSodium
SalivaPotassium
SalivaCalcium
NormalControlled DiabeticUncontrolled Diabetic
Figure 1: Salivary parameters in all groups
0
1
2
3
4
5
6
7
8
9
10
HbA1C
Normal
Controlled Diabetes
Uncontrolled Diabetes
Figure 2: Glycosylated hemoglobin in serumin all groups
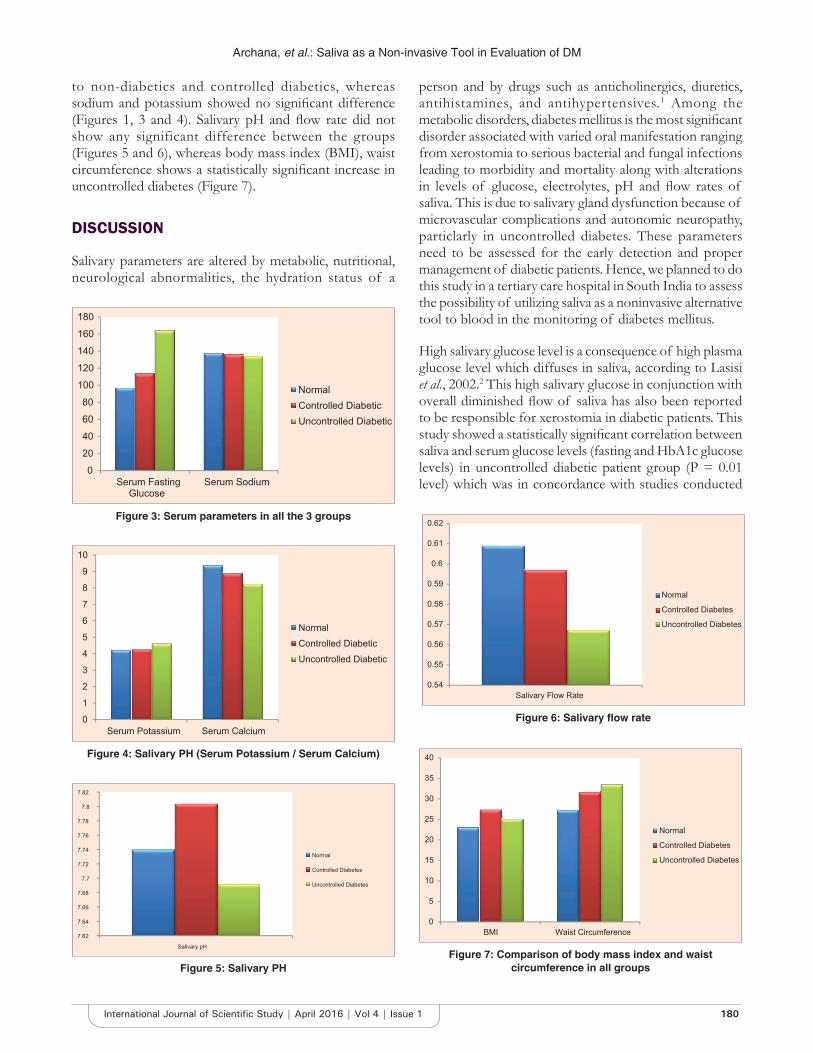
Archana, et al.: Saliva as a Non-invasive Tool in Evaluation of DM
180International Journal of Scientifi c Study | April 2016 | Vol 4 | Issue 1
to non-diabetics and controlled diabetics, whereas sodium and potassium showed no signifi cant difference (Figures 1, 3 and 4). Salivary pH and fl ow rate did not show any significant difference between the groups (Figures 5 and 6), whereas body mass index (BMI), waist circumference shows a statistically signifi cant increase in uncontrolled diabetes (Figure 7).
DISCUSSION
Salivary parameters are altered by metabolic, nutritional, neurological abnormalities, the hydration status of a
person and by drugs such as anticholinergics, diuretics, antihistamines, and antihypertensives.1 Among the metabolic disorders, diabetes mellitus is the most signifi cant disorder associated with varied oral manifestation ranging from xerostomia to serious bacterial and fungal infections leading to morbidity and mortality along with alterations in levels of glucose, electrolytes, pH and fl ow rates of saliva. This is due to salivary gland dysfunction because of microvascular complications and autonomic neuropathy, particlarly in uncontrolled diabetes. These parameters need to be assessed for the early detection and proper management of diabetic patients. Hence, we planned to do this study in a tertiary care hospital in South India to assess the possibility of utilizing saliva as a noninvasive alternative tool to blood in the monitoring of diabetes mellitus.
High salivary glucose level is a consequence of high plasma glucose level which diffuses in saliva, according to Lasisi et al., 2002.2 This high salivary glucose in conjunction with overall diminished fl ow of saliva has also been reported to be responsible for xerostomia in diabetic patients. This study showed a statistically signifi cant correlation between saliva and serum glucose levels (fasting and HbA1c glucose levels) in uncontrolled diabetic patient group (P = 0.01 level) which was in concordance with studies conducted
0
20
40
60
80
100
120
140
160
180
Serum FastingGlucose
Serum Sodium
NormalControlled DiabeticUncontrolled Diabetic
Figure 3: Serum parameters in all the 3 groups
0
1
2
3
4
5
6
7
8
9
10
Serum Potassium Serum Calcium
NormalControlled DiabeticUncontrolled Diabetic
Figure 4: Salivary PH (Serum Potassium / Serum Calcium)
7.62
7.64
7.66
7.68
7.7
7.72
7.74
7.76
7.78
7.8
7.82
Salivary pH
Normal
Controlled Diabetes
Uncontrolled Diabetes
Figure 5: Salivary PH
0.54
0.55
0.56
0.57
0.58
0.59
0.6
0.61
0.62
Salivary Flow Rate
Normal
Controlled Diabetes
Uncontrolled Diabetes
Figure 6: Salivary fl ow rate
0
5
10
15
20
25
30
35
40
BMI Waist Circumference
Normal
Controlled Diabetes
Uncontrolled Diabetes
Figure 7: Comparison of body mass index and waist circumference in all groups
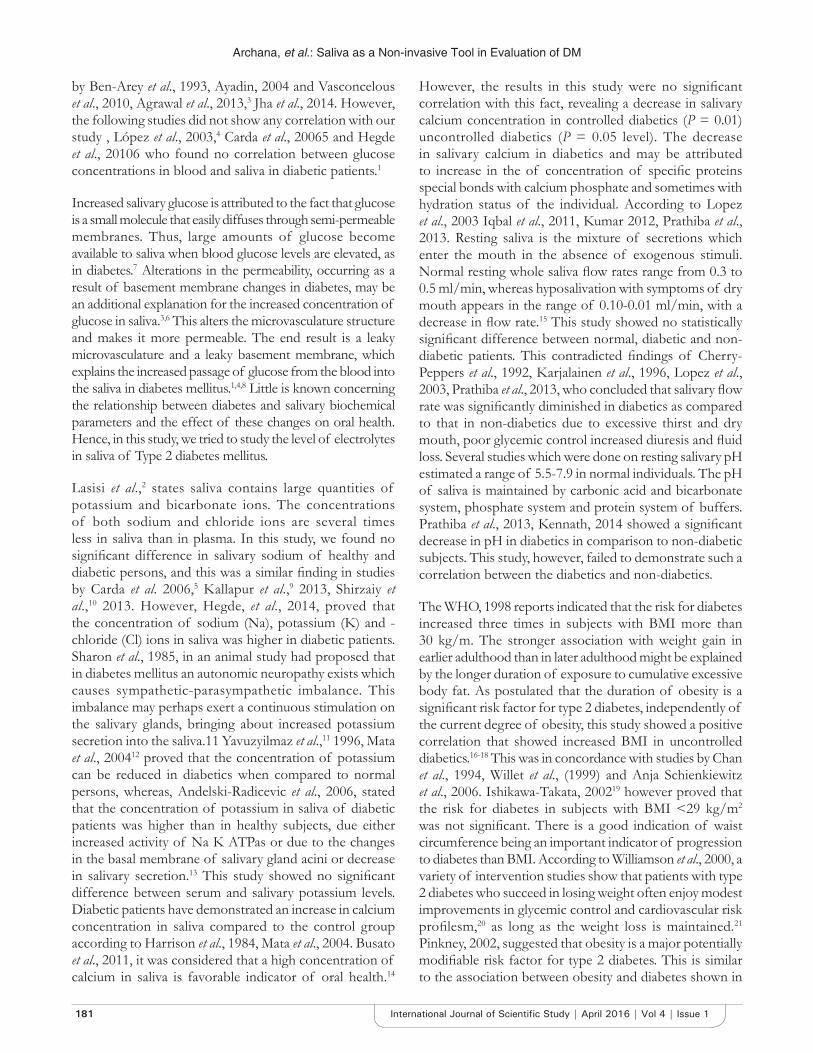
Archana, et al.: Saliva as a Non-invasive Tool in Evaluation of DM
181 International Journal of Scientifi c Study | April 2016 | Vol 4 | Issue 1
by Ben-Arey et al., 1993, Ayadin, 2004 and Vasconcelous et al., 2010, Agrawal et al., 2013,3 Jha et al., 2014. However, the following studies did not show any correlation with our study , López et al., 2003,4 Carda et al., 20065 and Hegde et al., 20106 who found no correlation between glucose concentrations in blood and saliva in diabetic patients.1
Increased salivary glucose is attributed to the fact that glucose is a small molecule that easily diffuses through semi-permeable membranes. Thus, large amounts of glucose become available to saliva when blood glucose levels are elevated, as in diabetes.7 Alterations in the permeability, occurring as a result of basement membrane changes in diabetes, may be an additional explanation for the increased concentration of glucose in saliva.3,6 This alters the microvasculature structure and makes it more permeable. The end result is a leaky microvasculature and a leaky basement membrane, which explains the increased passage of glucose from the blood into the saliva in diabetes mellitus.1,4,8 Little is known concerning the relationship between diabetes and salivary biochemical parameters and the effect of these changes on oral health. Hence, in this study, we tried to study the level of electrolytes in saliva of Type 2 diabetes mellitus.
Lasisi et al.,2 states saliva contains large quantities of potassium and bicarbonate ions. The concentrations of both sodium and chloride ions are several times less in saliva than in plasma. In this study, we found no signifi cant difference in salivary sodium of healthy and diabetic persons, and this was a similar fi nding in studies by Carda et al. 2006,5 Kallapur et al.,9 2013, Shirzaiy et al.,10 2013. However, Hegde, et al., 2014, proved that the concentration of sodium (Na), potassium (K) and - chloride (Cl) ions in saliva was higher in diabetic patients. Sharon et al., 1985, in an animal study had proposed that in diabetes mellitus an autonomic neuropathy exists which causes sympathetic-parasympathetic imbalance. This imbalance may perhaps exert a continuous stimulation on the salivary glands, bringing about increased potassium secretion into the saliva.11 Yavuzyilmaz et al.,11 1996, Mata et al., 200412 proved that the concentration of potassium can be reduced in diabetics when compared to normal persons, whereas, Andelski-Radicevic et al., 2006, stated that the concentration of potassium in saliva of diabetic patients was higher than in healthy subjects, due either increased activity of Na K ATPas or due to the changes in the basal membrane of salivary gland acini or decrease in salivary secretion.13 This study showed no signifi cant difference between serum and salivary potassium levels. Diabetic patients have demonstrated an increase in calcium concentration in saliva compared to the control group according to Harrison et al., 1984, Mata et al., 2004. Busato et al., 2011, it was considered that a high concentration of calcium in saliva is favorable indicator of oral health.14
However, the results in this study were no signifi cant correlation with this fact, revealing a decrease in salivary calcium concentration in controlled diabetics (P = 0.01) uncontrolled diabetics (P = 0.05 level). The decrease in salivary calcium in diabetics and may be attributed to increase in the of concentration of specifi c proteins special bonds with calcium phosphate and sometimes with hydration status of the individual. According to Lopez et al., 2003 Iqbal et al., 2011, Kumar 2012, Prathiba et al., 2013. Resting saliva is the mixture of secretions which enter the mouth in the absence of exogenous stimuli. Normal resting whole saliva fl ow rates range from 0.3 to 0.5 ml/min, whereas hyposalivation with symptoms of dry mouth appears in the range of 0.10-0.01 ml/min, with a decrease in fl ow rate.15 This study showed no statistically signifi cant difference between normal, diabetic and non-diabetic patients. This contradicted fi ndings of Cherry-Peppers et al., 1992, Karjalainen et al., 1996, Lopez et al., 2003, Prathiba et al., 2013, who concluded that salivary fl ow rate was signifi cantly diminished in diabetics as compared to that in non-diabetics due to excessive thirst and dry mouth, poor glycemic control increased diuresis and fl uid loss. Several studies which were done on resting salivary pH estimated a range of 5.5-7.9 in normal individuals. The pH of saliva is maintained by carbonic acid and bicarbonate system, phosphate system and protein system of buffers. Prathiba et al., 2013, Kennath, 2014 showed a signifi cant decrease in pH in diabetics in comparison to non-diabetic subjects. This study, however, failed to demonstrate such a correlation between the diabetics and non-diabetics.
The WHO, 1998 reports indicated that the risk for diabetes increased three times in subjects with BMI more than 30 kg/m. The stronger association with weight gain in earlier adulthood than in later adulthood might be explained by the longer duration of exposure to cumulative excessive body fat. As postulated that the duration of obesity is a signifi cant risk factor for type 2 diabetes, independently of the current degree of obesity, this study showed a positive correlation that showed increased BMI in uncontrolled diabetics.16-18 This was in concordance with studies by Chan et al., 1994, Willet et al., (1999) and Anja Schienkiewitz et al., 2006. Ishikawa-Takata, 200219 however proved that the risk for diabetes in subjects with BMI <29 kg/m2 was not signifi cant. There is a good indication of waist circumference being an important indicator of progression to diabetes than BMI. According to Williamson et al., 2000, a variety of intervention studies show that patients with type 2 diabetes who succeed in losing weight often enjoy modest improvements in glycemic control and cardiovascular risk profi lesm,20 as long as the weight loss is maintained.21 Pinkney, 2002, suggested that obesity is a major potentially modifi able risk factor for type 2 diabetes. This is similar to the association between obesity and diabetes shown in

Archana, et al.: Saliva as a Non-invasive Tool in Evaluation of DM
182International Journal of Scientifi c Study | April 2016 | Vol 4 | Issue 1
other studies in uncontrolled diabetes patients (P = 0.000) present study also showed a signifi cant correlation between waist circumference and uncontrolled diabetes. Henry et al., 2004, states that weight loss in overweight patients with type 2 diabetes rapidly reverses the state of insulin resistance and can restore normal blood glucose concentrations. Hence, there is a strong scope of waist circumference being an important indicator of progression to diabetes. This is due to a hypothesis that waist circumference relates to that, central obesity has been associated with decreased glucose tolerance, alterations in glucose-insulin homeostasis, reduced metabolic clearance of insulin, and decreased insulin-stimulated glucose disposal.22
CONCLUSION
This study along with many other studies indicates that saliva may be utilized as a non-invasive tool for evaluation of type 2 diabetes mellitus. Further research on larger samples with more clinical trials and in depth analysis for the imbalance of electrolytes which varies from one study to another should be done. This should be correlated with oral manifestations and other comorbidities to make saliva as a reliable tool.
ACKNOWLEDGMENT
I would like to express my deep sense of gratitude to Dr. Jagadeeshwari, Professor in Biochemistry for being my being my pillar of support wherever I had clarifi cations regarding my laboratory procedures in my thesis. I would be failing in duty if i do not thank my CDRL Team Mr. Robert and Mrs. Ishwarya, who were very instrumental in fi nishing my thesis. I would like extend my humble thanks to Dr. Shanmugam, PhD, Proprietor of Regenix labs who made this lab procedures convenient and helped my thesis fi nish on tim e.
REFERENCES
1. Prathibha KM, Johnson P, Ganesh M, Subhashini AS. Evaluation of salivary profi le among adult Type 2 diabetes mellitus patients in South India. J Clin Diagn Res 2013;7:1592-5.
2. Lasisi TJ, Fasanmade AA. Comparative analysis of salivary glucose and electrolytes in diabetic individuals with periodontitis. Ann Ib Postgrad Med 2012;10:25-30.
3. Agrawal RP, Sharma N. Noninvasive method for glucose level estimation by saliva. J Diabetes Metab 2013;4:266.
4. López ME, Colloca ME, Páez RG, Schallmach JN, Koss MA, Chervonagura A. Salivary characteristics of diabetic children. Braz Dent J 2003;14:26-31.
5. Carda C, Mosquera-Lloreda N, Salom L, Gomez de Ferraris ME, Peydró A. Structural and functional salivary disorders in type 2 diabetic patients. Med Oral Patol Oral Cir Bucal 2006;11:E309-14.
6. Hegde A, Shenoy R, D’Mello P, Smith A, Tintu A, Manjrekar P. Alternatives markers of glycemic status in diabetes mellitus. Biomed Res 2010;21:252-6.
7. Abikshyeet P, Ramesh V, Oza N. Glucose estimation in the salivary secretion of diabetes mellitus patients. Diabetes Metab Syndr Obes 2012;5:149-54.
8. Guyton AC. Textbook of Physiology. 11th ed. New Delhi: Elsevier India Private Limited; 2006.
9. Kallapur B. Quantitative estimation of sodium, potassium and total protein in saliva of diabetic smokers and nonsmokers: A novel study. J Nat Sci Biol Med 2013;4:341-5.
10. Angelic-Radicevic B, Dozic R, Todorović T, Dožić I. Biochemical markers in saliva of patients with diabetes mellitus. Serbian Dent J 2012;59:198-204.
11. Yavuzyilmaz E, Yumak O, Akdoganli T, Yamalik N, Ozer N, Ersoy F, et al. The alterations of whole saliva constituents in patients with diabetes mellitus. Aust Dent J 1996;41:193-7.
12. Mata AD, Marques D, Rocha S, Francisco H, Santos C, Mesquita MF, et al. Effects of diabetes mellitus on salivary secretion and its composition in the human. Mol Cell Biochem 2004;261:137-42.
13. Al-Maroof RH. Alteration of saliva in insulin dependent diabetic patients and its relation to their periodontal status. Al-Rafi dain Dent J 2010;10:102-9.
14. Iqbal S, Kazmi F, Asad S, Mumtaz M, Khan AA. Dental caries and diagnosis of diabetes mellitus. Pak Oral Dent J 2011;31:60-3.
15. Mamta S, Udita S, Bhasin GK, Rajesh P, Aggarwal SK. Oral fl uid: Biochemical compositions and functions: A review. J Pharm Biomed Sci 2013;37:1932-41.
16. Kaur J. A comprehensive review on metabolic syndrome. Cardiol Res Pract 2014;2014:943162.
17. Ashok K. Prevalence of glycemic status, obesity & waist circumference in Punjabi Type 2 diabetics. J Exerc Sci Physiother 2013;9:1-5.
18. Daousi C, Casson IF, Gill GV, MacFarlane IA, Wilding JP, Pinkney JH. Prevalence of obesity in type 2 diabetes in secondary care: Association with cardiovascular risk factors. Postgrad Med J 2006;82:280-4.
19. Ishikawa-Takata K, Ohta T, Moritaki K, Gotou T, Inoue S. Obesity, weight change and risks for hypertension, diabetes and hypercholesterolemia in Japanese men. Eur J Clin Nutr 2002;56:601-7.
20. Kamath A, Shivaprakash G. Body mass index and Waist circumference in Type 2 diabetes mellitus patients attending a diabetes clinic. Int J Biol Med Res 2011;2:636-8.
21. Tran TV, Nguyen TH, Wang K, Phan P. Comparing traditional body mass index and Joslin diabetes center’s Asian body mass index in predicting self - Report Type 2 diabetes. Int J Soc Sci Stud 2014;2:55-60.
22. Steinberger J, Daniels SR. Obesity, insulin resistance, diabetes, and cardiovascular risk in children. An American Heart Association scientifi c statement from the Atherosclerosis, Hypertension, and Obesity in the Young Committee (Council on Cardiovascular Disease in the Young) and the Diabetes Committee (Council on Nutrition, Physical Activity, and Metabolism). Circulation 2003;107:1448-53.
How to cite this article: Archana PS, Gopal KS, Vardhan BGH, Kumar PM. Saliva as a Non-invasive Tool in Evaluation of Type 2 Diabetes Mellitus. Int J Sci Stud 2016;4(1):178-182.
Source of Support: Nil, Confl ict of Interest: None declared.
183 International Journal of Scientifi c Study | April 2016 | Vol 4 | Issue 1
Evaluation of Results of Hip Arthroscopic Surgery for Femoroacetabular ImpingementPrasanta Kumar Saha
Associate Professor, Department of Orthopaedics, Calcutta National Medical College Hospital, Kolkata, West Bengal, India
patients with non-dysplastic hips. It is considered as a major factor in the development of osteoarthritis.1
The aim of surgical treatment is to reshape cam deformities that cause bony contact during normal hip motion and repair of associated labral and acetabular cartilage pathology.2,3 Ganz et al.4 described surgical hip dislocation technique. It has the advantage of complete visualization of the proximal femur and acetabulum without compromising the femoral head vasculature. Several investigators who have used this open technique have reported good early and midterm clinical success with minimal complications.5-11 However, this is a major surgery, which necessitates the use of a trochanteric osteotomy and hip-joint dislocation with a high chance of injury to vascular supply of femoral head.
With the advancement of arthroscopy technique and a better understanding of hip pathology, hip arthroscopy is a new modality in treating FAI. This is a minimally
INTRODUCTION
Femoroacetabular impingement (FAI) is an increasingly recognized disorder. FAI is described as the abnormal contact between the anterior acetabular rim and femoral neck. There are two primary mechanisms of FAI: Cam and pincer impingement. Cam impingement defi ned as an abnormally shaped femoral head-neck junction converging into the acetabular rim. Pincer impingement described as acetabular over coverage of the femur. FAI has been identifi ed as a common cause of hip pain in young, active
Original Article
Abstract
Background: Femoroacetabular impingement (FAI) is an increasingly recognized disorder. FAI is the result of abnormal contact between the proximal femur and acetabulum and can result in intra-articular pathology and eventual osteoarthritis. Open surgical hip dislocation procedure described by Ganz is gold standard. Recently, arthroscopic-based treatment has been developed. Our study aims to present clinical outcome in a single-center cohort of patients treated arthroscopically for hip-related pain due to FAI.
Materials and Methods: A total of 55 patients from 2013 to 2016 were included in this prospective case series (50 male; mean age 35 years; [range: 15-50]). The indication for arthroscopic treatment of hip-related pain was mechanical hip symptoms and radiological fi ndings of FAI. To evaluate hip function and pain level at 1-year follow-up by modifi ed Harris Hip Score (mHHS), hip outcome score (HOS), and a numeric rating scale (NRS) pain score.
Results: Radiologically, 45 patients had both cam and pincer lesion. After 1 year, the impingement test was negative or mildly positive in 91% cases. mHHS, HOS, and NRS pain score signifi cantly improved from previous status (P < 0.001). There was a signifi cant reduction of the alpha angle from the pre-operative value (P < 0.001). Total hip replacement was done in three patients, and two patients were scheduled for replacement after the follow-up period.
Conclusions: Although our study has several limitations such as lack of control group, small sample. We have found there was a signifi cant statistical improvement by arthroscopic treatment of FAI. Further studies are needed to determine failure rates and risk factors.
Key words: Arthroscopy, Femoroacetabular impingement, Hip, Labral tear
Access this article online
www.ijss-sn.com
Month of Submission : 02-2016Month of Peer Review : 03-2016Month of Acceptance : 03-2016Month of Publishing : 04-2016
Corresponding Author: Dr. Prasanta Kumar Saha, Golden View Apartment, 2nd Floor, Room No - 305, T. N. Mukherjee Road, Monoharpur, (Near HDFC Bank), Dankuni, Hooghly - 712 311, West Bengal, India. Phone: +91-9903151908. E-mail: [email protected]
DOI: 10.17354/ijss/2016/214
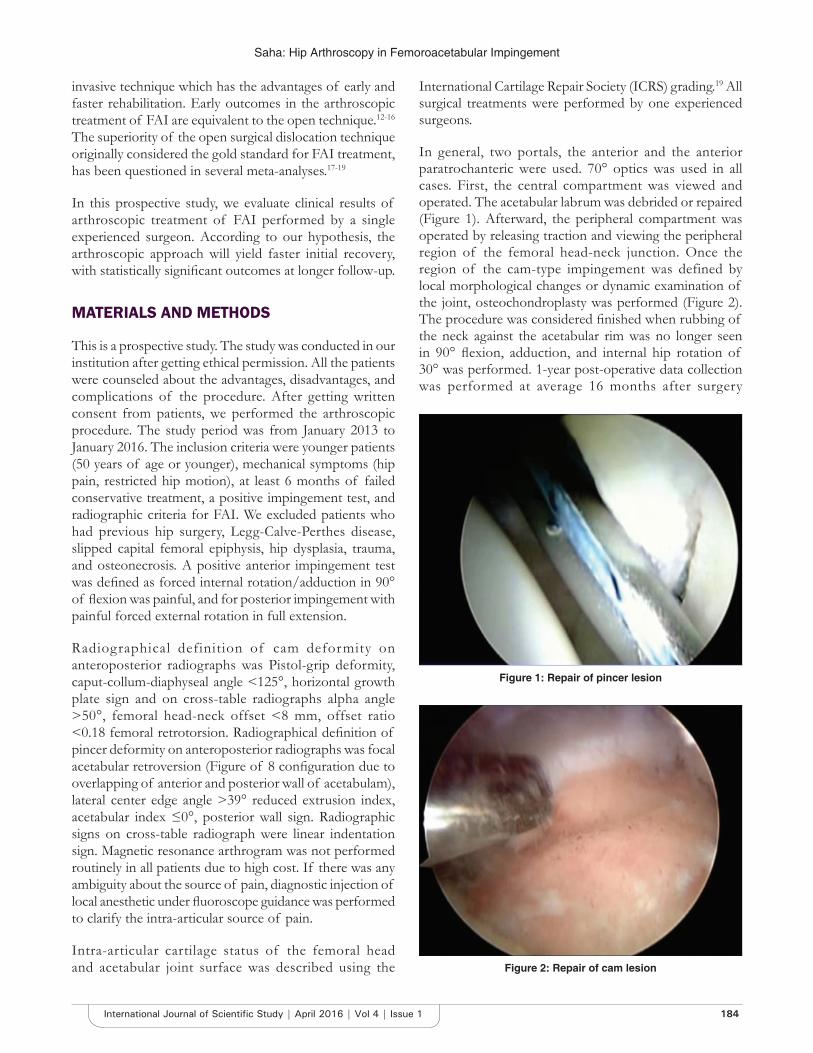
Saha: Hip Arthroscopy in Femoroacetabular Impingement
184International Journal of Scientifi c Study | April 2016 | Vol 4 | Issue 1
invasive technique which has the advantages of early and faster rehabilitation. Early outcomes in the arthroscopic treatment of FAI are equivalent to the open technique.12-16 The superiority of the open surgical dislocation technique originally considered the gold standard for FAI treatment, has been questioned in several meta-analyses.17-19
In this prospective study, we evaluate clinical results of arthroscopic treatment of FAI performed by a single experienced surgeon. According to our hypothesis, the arthroscopic approach will yield faster initial recovery, with statistically signifi cant outcomes at longer follow-up.
MATERIALS AND METHODS
This is a prospective study. The study was conducted in our institution after getting ethical permission. All the patients were counseled about the advantages, disadvantages, and complications of the procedure. After getting written consent from patients, we performed the arthroscopic procedure. The study period was from January 2013 to January 2016. The inclusion criteria were younger patients (50 years of age or younger), mechanical symptoms (hip pain, restricted hip motion), at least 6 months of failed conservative treatment, a positive impingement test, and radiographic criteria for FAI. We excluded patients who had previous hip surgery, Legg-Calve-Perthes disease, slipped capital femoral epiphysis, hip dysplasia, trauma, and osteonecrosis. A positive anterior impingement test was defi ned as forced internal rotation/adduction in 90° of fl exion was painful, and for posterior impingement with painful forced external rotation in full extension.
Radiographical definition of cam deformity on anteroposterior radiographs was Pistol-grip deformity, caput-collum-diaphyseal angle <125°, horizontal growth plate sign and on cross-table radiographs alpha angle >50°, femoral head-neck offset <8 mm, offset ratio <0.18 femoral retrotorsion. Radiographical defi nition of pincer deformity on anteroposterior radiographs was focal acetabular retroversion (Figure of 8 confi guration due to overlapping of anterior and posterior wall of acetabulam), lateral center edge angle >39° reduced extrusion index, acetabular index ≤0°, posterior wall sign. Radiographic signs on cross-table radiograph were linear indentation sign. Magnetic resonance arthrogram was not performed routinely in all patients due to high cost. If there was any ambiguity about the source of pain, diagnostic injection of local anesthetic under fl uoroscope guidance was performed to clarify the intra-articular source of pain.
Intra-articular cartilage status of the femoral head and acetabular joint surface was described using the
International Cartilage Repair Society (ICRS) grading.19 All surgical treatments were performed by one experienced surgeons.
In general, two portals, the anterior and the anterior paratrochanteric were used. 70° optics was used in all cases. First, the central compartment was viewed and operated. The acetabular labrum was debrided or repaired (Figure 1). Afterward, the peripheral compartment was operated by releasing traction and viewing the peripheral region of the femoral head-neck junction. Once the region of the cam-type impingement was defined by local morphological changes or dynamic examination of the joint, osteochondroplasty was performed (Figure 2). The procedure was considered fi nished when rubbing of the neck against the acetabular rim was no longer seen in 90° fl exion, adduction, and internal hip rotation of 30° was performed. 1-year post-operative data collection was performed at average 16 months after surgery
Figure 1: Repair of pincer lesion
Figure 2: Repair of cam lesion

Saha: Hip Arthroscopy in Femoroacetabular Impingement
185 International Journal of Scientifi c Study | April 2016 | Vol 4 | Issue 1
(range: 12-22). The difference between pre-operative and post-operative values was analyzed using the Student’s t-test. P values below 0.05 were considered to be statistically signifi cant.
RESULTS
A total of 55 patients were treated by hip arthroscopy procedure. Among them, 50 patients were male and 5 were female. The average age of patients was 35 years. Most of them were associated with sports activity. Only one patient had radiologically cam deformity and nine patients had isolated pincer deformity. The remaining 45 patients have both cam and pincer lesion (Table 1). On arthroscopic examination, 91% cases labral lesion was found. According to ICRS classifi cation, the cartilage status of acetabulum, Grade 0: 8%; Grade 1: 20%; Grade 2: 43%; Grade 3: 19%; Grade 4: 10% were found. On 78% cases, labral reattachment was done. CAM and pincer deformity resection were done in 96% and 92% cases, respectively.
Al patients were treated arthroscopically. We had found signifi cant improvement from their previous status. All the patients had positive impingement test before surgery. In a follow-up at least 1 year after, 91% cases impingement test was negative or mildly positive and only in 9% cases it was positive(P < 0.001). Modifi ed Harris Hip Score (mHHS), hip outcome score (HOS), numeric rating scale (NRS) pain score signifi cantly improved from previous status (Table 2). According to mHHS at minimum 1 year follow-up, excellent result (>90) was found in 29 patients (52.72%) good result (80-89) found in 9 patients (16.36%), fair result (70-79) found in 12 patients (21.81%), and poor (<70) found in 5 patients (9.11%). There was a signifi cant reduction of the alpha angle from the pre-operative value (P < 0.001) (Figure 3). We observe during analysis of mHHS, HOS, NRS pain score that signifi cant improvement occurred
during fi rst three months postoperatively (Figures 4-6). No signifi cant difference in 1-year follow-up between labral fi xation and labral resection was found. The average traction time during surgery was 52.3 ± 14.5 min (median = 45).
One patient had partial sciatic nerve neuropraxia which was improved completely. There was no post-operative femoral neck fracture, infection, or osteonecrosis.
01020304050607080
Preoperative Postoperative
Alpha angle
Alpha angle
Figure 3: Preoperative and postoperative angles as measured on cross-table lateral radiographs for hips with cam
impingement revealed signifi cant improvements
0102030405060708090
Modified Harris Hip Scores
Modified Harris HipScores
Figure 4: Progressive analysis of modifi ed Harris hip score revealed statistically signifi cant improvement postoperatively
without further signifi cant improvement after 3 months
0102030405060708090
Hip Outcome Scores
Hip Outcome Scores
Figure 5: Progressive analysis of hip outcome score revealed statistically signifi cant improvement postoperatively without
further signifi cant improvement after 3 months
Table 1: Radiological parameters of hip jointParameters Mean±SDAlpha angle 74.9±8.7CE angle (center edge angle) 31.6±6.3JSW (mm) 3.4±0.3JSW: Joint space width
Table 2: Patient reported outcome scoresParameters Mean±SD P value
Preoperatively PostoperativelymHHS 69.34±16.8 85.3±17.1 <0.001HOS 68.27±17.0 86.1±17.4 <0.001NRS 6.74±2.7 2.5±1.2 <0.001mHHS: Modifi ed hip score, HOS: Hip outcome score, NRS: Numeric rating scale

Saha: Hip Arthroscopy in Femoroacetabular Impingement
186International Journal of Scientifi c Study | April 2016 | Vol 4 | Issue 1
The failure case was defi ned as 10 point drop in mHHS and HOS, respectively, from pre-operative to follow-up. According to this, 9.5% cases were failure. Total hip replacement (THR) was done in three patients. Two patients were operated for THR after the follow-up period. All these patients mean age was 47 years, and they had cartilage injury ICRS Grade 4 at the acetabular rim and ICRS Grade 3 on the femoral head.
DISCUSSION
The goal of surgical management of FAI is removal or reorientation of acetabular over coverage by labral repair/refi xation or labral debridement and is reshaping of the proximal femur. This concept has been pioneered by Ganz. The procedure has been traditionally done with surgical hip dislocation doing a trochanteric osteotomy. Beck et al.10 published that excellent results were found in 13 patients among 19 patients on 4.7 years follow-up. Peters and Erickson5 reviewed 30 hips undergoing open reconstruction. Their observation that signifi cant improvement of mHHS from a mean of 70 preoperatively to 87. Four hips required total hip arthroplasty because of progressive osteoarthritis and pain. Espinosa et al.2 compared the effect of labral debridement versus repair/refi xation and found better outcomes at 2 years’ follow-up in the labral repair group with respect to pain and progression of osteoarthritis. Overall, the results of open management have been promising in the absence of signifi cant chondral damage at the time of surgery.
Although there is increasing interest in arthroscopic management of FAI.20-28 A systemic review of 45 elite athletes with FAI treated arthroscopically, concluded that all patients had symptomatic relief and returned to their sport.20,25 In another review of over 320 patients treated arthroscopically, 90% had the elimination of the impingement sign and were reportedly satisfi ed with their
results.28 Our study showed signifi cant improvement of patients in respect of the impingement test, mHHS, HOS score, and NRS pain score at early follow-up. With up to 3 years’ follow-up, the scores have remained relatively stable. Total hip arthroplasty had been required and performed in 3 patients and scheduled in 2 patients.
Several studies have found a correlation between chondral damage in FAI patients and subjective outcome. Haviv et al.29 examined the impact of cartilage injury on clinical outcome of cartilage damage in FAI patients. They found no difference in improvement of mHHS improvement between different degrees of cartilage injury. Philippon et al.16 found that poor cartilage status leads to a poor subjective outcome. The present study did not fi nd any difference in mHHS outcome between cartilage injuries ICRS Grades 1-2 (16 patients) and Grades 3-4 (35 patients). The mHHS was 82.5 and 85.0, respectively. However, all failures that had THR reoperation had severe cartilage injuries Grade 4.
A total of 78% of the patients had a labral refi xation after removal of acetabular bone tissue. The patients with labral refi xation did not have poorer subjective outcome than patients without this procedure. Larson and Giveans30 demonstrated that labrum refi xation led to improved subjective outcome compared to labral resection in two patient cohorts with labral damage. Another prospective randomized study by Krych et al.31 showed the same improvement of outcome scores.
The THR reoperation rate in the present study is similar to other published studies. In 96 patients, Larson and Giveans found a 3% THR reoperation rate.15 All had Grade 4 acetabular chondral lesions with delamination of cartilage from the subchondral bone. Overall higher age, higher degree of cartilage injury and/or osteoarthritis is predictors for THR reoperations.16,29
The present study has several limitations. One of the most important is the lack of control group consisting of non-operated/conservatively treated FAI patients. There are several strengths in this present study. This study is a consecutive, prospective case series including a relatively large cohort of 55 patients. The study had excellent completeness with 100% and 75% at 1 year and longtime follow-up, respectively.
CONCLUSION
Arthroscopic management of patients with pain related to mechanical hip symptoms and radiological fi ndings of FAI will benefi t from hip arthroscopy with resection of
01234567
Pre op Post op6 wks
Post op3
months
Post op6
months
Post op1 yr
Numeric Rating Scale - Pain Scores
Numeric Rating Scale -Pain Scores
Figure 6: Progressive analysis of numeric rating scale - pain score revealed statistically signifi cant improvement
postoperatively without further signifi cant improvement after 3 months
Saha: Hip Arthroscopy in Femoroacetabular Impingement
187 International Journal of Scientifi c Study | April 2016 | Vol 4 | Issue 1
cam and pincer bony deformities. Signifi cant improvement in outcomes measures, with good to excellent results, is being observed in 75% of hips at a minimum follow-up of 1 year. Alteration in the natural progression to osteoarthritis and sustained pain relief as a result of arthroscopic management of FAI remain to be seen. In conclusion patients with their functional level will increase and their pain level will decrease signifi cantly. Further studies are needed to determine failure rates and outcome risk factors.
REFERENCES
1. Ganz R, Parvizi J, Beck M, Leunig M, Nötzli H, Siebenrock KA. Femoroacetabular impingement: A cause for osteoarthritis of the hip. Clin Orthop Relat Res 2003;112-20.
2. Ng VY, Arora N, Best TM, Pan X, Ellis TJ. Effi cacy of surgery for femoroacetabular impingement: A systematic review. Am J Sports Med 2010;38:2337-45.
3. Clohisy JC, St John LC, Schutz AL. Surgical treatment of femoroacetabular impingement: A systematic review of the literature. Clin Orthop Relat Res 2010;468:555-64.
4. Ganz R, Gill TJ, Gautier E, Ganz K, Krügel N, Berlemann U. Surgical dislocation of the adult hip a technique with full access to the femoral head and acetabulum without the risk of avascular necrosis. J Bone Joint Surg Br 2001;83:1119-24.
5. Peters CL, Erickson JA. Treatment of femoro-acetabular impingement with surgical dislocation and débridement in young adults. J Bone Joint Surg Am 2006;88:1735-41.
6. Murphy S, Tannast M, Kim YJ, Buly R, Millis MB. Debridement of the adult hip for femoroacetabular impingement: Indications and preliminary clinical results. Clin Orthop Relat Res 2004;178-81.
7. Jäger M, Wild A, Westhoff B, Krauspe R. Femoroacetabular impingement caused by a femoral osseous head-neck bump deformity: Clinical, radiological, and experimental results. J Orthop Sci 2004;9:256-63.
8. Graves ML, Mast JW. Femoroacetabular impingement: Do outcomes reliably improve with surgical dislocations? Clin Orthop Relat Res 2009;467:717-23.
9. Beaulé PE, Le Duff MJ, Zaragoza E. Quality of life following femoral head-neck osteochondroplasty for femoroacetabular impingement. J Bone Joint Surg Am 2007;89:773-9.
10. Beck M, Leunig M, Parvizi J, Boutier V, Wyss D, Ganz R. Anterior femoroacetabular impingement: Part II. Midterm results of surgical treatment. Clin Orthop Relat Res 2004;67-73.
11. Peters CL, Schabel K, Anderson L, Erickson J. Open treatment of femoroacetabular impingement is associated with clinical improvement and low complication rate at short-term followup. Clin Orthop Relat Res 2010;468:504-10.
12. Byrd JW, Jones KS. Arthroscopic femoroplasty in the management of cam-type femoroacetabular impingement. Clin Orthop Relat Res 2009;467:739-46.
13. Bardakos NV, Vasconcelos JC, Villar RN. Early outcome of hip arthroscopy for femoroacetabular impingement: The role of femoral osteoplasty in symptomatic improvement. J Bone Joint Surg Br 2008;90:1570-5.
14. Ilizaliturri VM Jr, Orozco-Rodriguez L, Acosta-Rodríguez E, Camacho-Galindo J. Arthroscopic treatment of cam-type femoroacetabular impingement: Preliminary report at 2 years minimum follow-up. J Arthroplasty 2008;23:226-34.
15. Larson CM, Giveans MR. Arthroscopic management of femoroacetabular impingement: Early outcomes measures. Arthroscopy 2008;24:540-6.
16. Philippon MJ, Briggs KK, Yen YM, Kuppersmith DA. Outcomes following hip arthroscopy for femoroacetabular impingement with associated chondrolabral dysfunction: Minimum two-year follow-up. J Bone Joint Surg Br 2009;91:16-23.
17. Bedi A, Chen N, Robertson W, Kelly BT. The management of labral tears and femoroacetabular impingement of the hip in the young, active patient. Arthroscopy 2008;24:1135-45.
18. Botser IB, Smith TW Jr, Nasser R, Domb BG. Open surgical dislocation versus arthroscopy for femoroacetabular impingement: A comparison of clinical outcomes. Arthroscopy 2011;27:270-8.
19. Brittberg M, Winalski CS. Evaluation of cartilage injuries and repair. J Bone Joint Surg Am 2003;85-A Suppl 2:58-69.
20. Philippon MJ, Schenker ML. Arthroscopy for the treatment of femoroacetabular impingement in the athlete. Clin Sports Med 2006;25:299-308, ix.
21. Sampson TG, Glick JM. Hip arthroscopy. Presented at the Annual Meeting of the American Academy of Orthopaedic Surgeons, Chicago, IL; 2006.
22. Guanche CA, Bare AA. Arthroscopic treatment of femoroacetabular impingement. Arthroscopy 2006;22:95-106.
23. Philippon MJ, Schenker ML, Briggs KK, Kuppersmith DA, Maxwell RB, Stubbs AJ. Revision hip arthroscopy. Am J Sports Med 2007;35:1918-21.
24. Philippon M, Schenker M, Briggs K, Kuppersmith D. Femoroacetabular impingement in 45 professional athletes: Associated pathologies and return to sport following arthroscopic decompression. Knee Surg Sports Traumatol Arthrosc 2007;15:908-14.
25. Philippon MJ, Schenker ML. A new method for acetabular rim trimming and labral repair. Clin Sports Med 2006;25:293-7, ix.
26. Sampson TG. Arthroscopic treatment of femoroacetabular impingement: A proposed technique with clinical experience. Instr Course Lect 2006;55:337-46.
27. Wettstein M, Dienst M. Hip arthroscopy for femoroacetabular impingement. Orthopade 2006;35:85-93.
28. Philippon MJ, Stubbs AJ, Schenker ML, Maxwell RB, Ganz R, Leunig M. Arthroscopic management of femoroacetabular impingement: Osteoplasty technique and literature review. Am J Sports Med 2007;35:1571-80.
29. Haviv B, Singh PJ, Takla A, O’Donnell J. Arthroscopic femoral osteochondroplasty for cam lesions with isolated acetabular chondral damage. J Bone Joint Surg Br 2010;92:629-33.
30. Larson CM, Giveans MR. Arthroscopic debridement versus refi xation of the acetabular labrum associated with femoroacetabular impingement. Arthroscopy 2009;25:369-76.
31. Krych AJ, Thompson M, Knutson Z, Scoon J, Coleman SH. Arthroscopic labral repair versus selective labral debridement in female patients with femoroacetabular impingement: A prospective randomized study. Arthroscopy 2013;29:46-53.
How to cite this article: Saha PK. Evaluation of Results of Hip Arthroscopic Surgery for Femoroacetabular Impingement. Int J Sci Stud 2016;4(1):183-187.
Source of Support: Nil, Confl ict of Interest: None declared.
188International Journal of Scientifi c Study | April 2016 | Vol 4 | Issue 1
Levobupivacaine versus Ropivacaine: A Comparative Study of the Analgesic and Hemodynamic SpectrumAmartya Khan1, H S Nanda2, Richa Chandra3
1Post Graduate Student, Department of Anesthesiology, Shri Ram Murti Smarak Institute of Medical Sciences, Bareilly, Uttar Pradesh, India, 2Professor and Head, Department of Anesthesiology, Shri Ram Murti Smarak Institute of Medical Sciences, Bareilly, Uttar Pradesh, India, 3Associate Professor, Department of Anesthesiology, Shri Ram Murti Smarak Institute of Medical Sciences, Bareilly, Uttar Pradesh, India
for the regional, intrathecal, and epidural block by most anesthetists. However, in the early 1970s, the recognition of acute life-threatening cardiotoxicity of bupivacaine led to the search for a local anesthetic agent comparable with bupivacaine but with lower cardiotoxicity resulting in development of a relatively new amide, ropivacaine, registered for use in 1996, but introduced in India only in 2009.2,3
Ropivacaine is produced as pure “S” enantiomer with lower lipid solubility, easier reversibility after inadvertent intravascular injection, signifi cant reduction in central nervous system toxicity, lesser motor block and greater differentiation of sensory and motor block.
In equal concentrations, ropivacaine and bupivacaine produced similar sensory and motor block after epidural administration with slightly longer block duration with
INTRODUCTION
The search for an ideal local anesthetic agent has been long and arduous. The drug with the perfect balance of sensory and motor block durations with minimal cardiovascular, neural, and other systemic changes has always eluded researchers.1
The past millennium has exclusively been dominated by bupivacaine as the fi rst line choice of local anesthetic agent
Original Article
Abstract
Introduction: Levobupivacaine and ropivacaine are both newer long-acting local anesthetic drugs increasing the spectrum of local anesthetic armamentarium that were developed following reports of bupivacaine-related severe toxicity.
Materials and Methods: After taking permission from the Ethical Committee and proper informed consent from the patients, a comparative study between 0.5% levobupivacaine and 0.75% ropivacaine was carried out over 90 American Society of Anesthesiologists I (ASA Ι) and ASA ΙΙ patients appearing for lower limb surgeries in Shri Ram Murti Smarak Institute of Medical Science hospital in Bareilly. A bolus of 20 ml of both the drugs was given via epidural route to both the groups comprising 45 patients each who were randomly selected by closed envelope method.
Results: Both the drugs are found to be equally potent in terms of analgesic and hemodynamic parameters. Both the drugs have near equal sensory onset (L = 9.6 s and R = 9.48 s, P > 0.05), and complete sensory regression taking place nearly 190 min for both the drugs. The duration of analgesia for both the drugs was around 175 min with no statistical difference. Both the drugs exhibited comparable hemodynamic response with heart rate, systolic and diastolic blood pressure being stable and comparable without any statistical difference.
Conclusion: It is concluded that both 0.5% levobupivacaine and 0.75% ropivacaine are potent enough to carry out lower limb surgeries with stable hemodynamic parameters.
Key words: Hemodynamic, Levobupivacaine, Ropivacaine
Access this article online
www.ijss-sn.com
Month of Submission : 02-2016Month of Peer Review : 03-2016Month of Acceptance : 04-2016Month of Publishing : 04-2016
Corresponding Author: Dr. Richa Chandra, Department of Anesthesiology, Shri Ram Murti Smarak, Institute of Medical Sciences, Bareilly, Uttar Pradesh, India. E-mail: [email protected]
DOI: 10.17354/ijss/2016/215
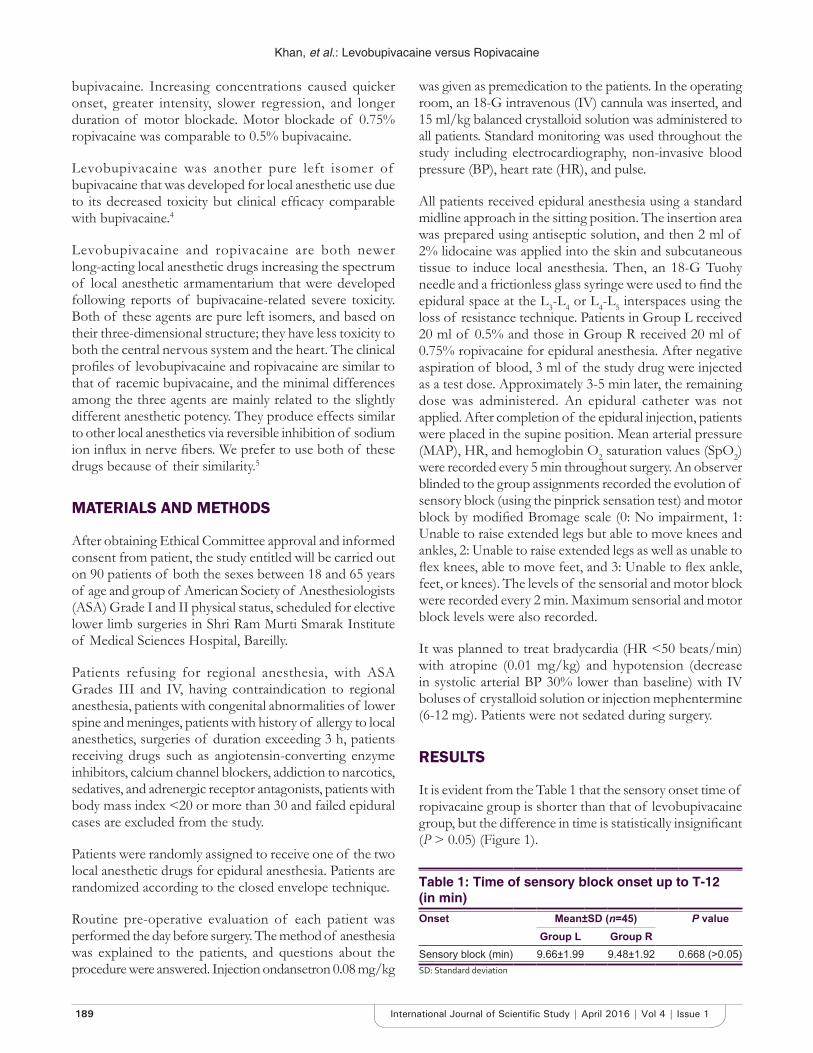
Khan, et al.: Levobupivacaine versus Ropivacaine
189 International Journal of Scientifi c Study | April 2016 | Vol 4 | Issue 1
bupivacaine. Increasing concentrations caused quicker onset, greater intensity, slower regression, and longer duration of motor blockade. Motor blockade of 0.75% ropivacaine was comparable to 0.5% bupivacaine.
Levobupivacaine was another pure left isomer of bupivacaine that was developed for local anesthetic use due to its decreased toxicity but clinical effi cacy comparable with bupivacaine.4
Levobupivacaine and ropivacaine are both newer long-acting local anesthetic drugs increasing the spectrum of local anesthetic armamentarium that were developed following reports of bupivacaine-related severe toxicity. Both of these agents are pure left isomers, and based on their three-dimensional structure; they have less toxicity to both the central nervous system and the heart. The clinical profi les of levobupivacaine and ropivacaine are similar to that of racemic bupivacaine, and the minimal differences among the three agents are mainly related to the slightly different anesthetic potency. They produce effects similar to other local anesthetics via reversible inhibition of sodium ion infl ux in nerve fi bers. We prefer to use both of these drugs because of their similarity.5
MATERIALS AND METHODS
After obtaining Ethical Committee approval and informed consent from patient, the study entitled will be carried out on 90 patients of both the sexes between 18 and 65 years of age and group of American Society of Anesthesiologists (ASA) Grade Ι and ΙΙ physical status, scheduled for elective lower limb surgeries in Shri Ram Murti Smarak Institute of Medical Sciences Hospital, Bareilly.
Patients refusing for regional anesthesia, with ASA Grades III and IV, having contraindication to regional anesthesia, patients with congenital abnormalities of lower spine and meninges, patients with history of allergy to local anesthetics, surgeries of duration exceeding 3 h, patients receiving drugs such as angiotensin-converting enzyme inhibitors, calcium channel blockers, addiction to narcotics, sedatives, and adrenergic receptor antagonists, patients with body mass index <20 or more than 30 and failed epidural cases are excluded from the study.
Patients were randomly assigned to receive one of the two local anesthetic drugs for epidural anesthesia. Patients are randomized according to the closed envelope technique.
Routine pre-operative evaluation of each patient was performed the day before surgery. The method of anesthesia was explained to the patients, and questions about the procedure were answered. Injection ondansetron 0.08 mg/kg
was given as premedication to the patients. In the operating room, an 18-G intravenous (IV) cannula was inserted, and 15 ml/kg balanced crystalloid solution was administered to all patients. Standard monitoring was used throughout the study including electrocardiography, non-invasive blood pressure (BP), heart rate (HR), and pulse.
All patients received epidural anesthesia using a standard midline approach in the sitting position. The insertion area was prepared using antiseptic solution, and then 2 ml of 2% lidocaine was applied into the skin and subcutaneous tissue to induce local anesthesia. Then, an 18-G Tuohy needle and a frictionless glass syringe were used to fi nd the epidural space at the L3-L4 or L4-L5 interspaces using the loss of resistance technique. Patients in Group L received 20 ml of 0.5% and those in Group R received 20 ml of 0.75% ropivacaine for epidural anesthesia. After negative aspiration of blood, 3 ml of the study drug were injected as a test dose. Approximately 3-5 min later, the remaining dose was administered. An epidural catheter was not applied. After completion of the epidural injection, patients were placed in the supine position. Mean arterial pressure (MAP), HR, and hemoglobin O2 saturation values (SpO2) were recorded every 5 min throughout surgery. An observer blinded to the group assignments recorded the evolution of sensory block (using the pinprick sensation test) and motor block by modifi ed Bromage scale (0: No impairment, 1: Unable to raise extended legs but able to move knees and ankles, 2: Unable to raise extended legs as well as unable to fl ex knees, able to move feet, and 3: Unable to fl ex ankle, feet, or knees). The levels of the sensorial and motor block were recorded every 2 min. Maximum sensorial and motor block levels were also recorded.
It was planned to treat bradycardia (HR <50 beats/min) with atropine (0.01 mg/kg) and hypotension (decrease in systolic arterial BP 30% lower than baseline) with IV boluses of crystalloid solution or injection mephentermine (6-12 mg). Patients were not sedated during surgery.
RESULTS
It is evident from the Table 1 that the sensory onset time of ropivacaine group is shorter than that of levobupivacaine group, but the difference in time is statistically insignifi cant (P > 0.05) (Figure 1).
Table 1: Time of sensory block onset up to T-12 (in min)Onset Mean±SD (n=45) P value
Group L Group RSensory block (min) 9.66±1.99 9.48±1.92 0.668 (>0.05)SD: Standard deviation
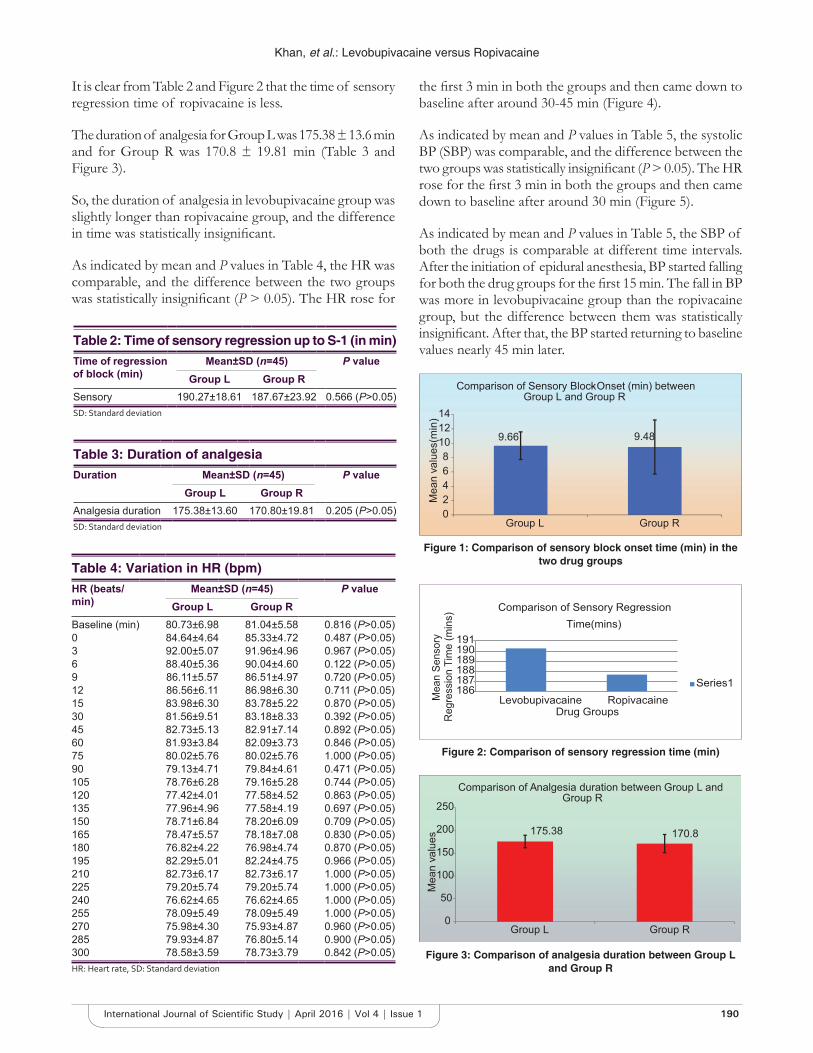
Khan, et al.: Levobupivacaine versus Ropivacaine
190International Journal of Scientifi c Study | April 2016 | Vol 4 | Issue 1
It is clear from Table 2 and Figure 2 that the time of sensory regression time of ropivacaine is less.
The duration of analgesia for Group L was 175.38 ± 13.6 min and for Group R was 170.8 ± 19.81 min (Table 3 and Figure 3).
So, the duration of analgesia in levobupivacaine group was slightly longer than ropivacaine group, and the difference in time was statistically insignifi cant.
As indicated by mean and P values in Table 4, the HR was comparable, and the difference between the two groups was statistically insignifi cant (P > 0.05). The HR rose for
the fi rst 3 min in both the groups and then came down to baseline after around 30-45 min (Figure 4).
As indicated by mean and P values in Table 5, the systolic BP (SBP) was comparable, and the difference between the two groups was statistically insignifi cant (P > 0.05). The HR rose for the fi rst 3 min in both the groups and then came down to baseline after around 30 min (Figure 5).
As indicated by mean and P values in Table 5, the SBP of both the drugs is comparable at different time intervals. After the initiation of epidural anesthesia, BP started falling for both the drug groups for the fi rst 15 min. The fall in BP was more in levobupivacaine group than the ropivacaine group, but the difference between them was statistically insignifi cant. After that, the BP started returning to baseline values nearly 45 min later.Table 2: Time of sensory regression up to S-1 (in min)
Time of regression of block (min)
Mean±SD (n=45) P valueGroup L Group R
Sensory 190.27±18.61 187.67±23.92 0.566 (P>0.05)SD: Standard deviation
Table 3: Duration of analgesiaDuration Mean±SD (n=45) P value
Group L Group RAnalgesia duration 175.38±13.60 170.80±19.81 0.205 (P>0.05)SD: Standard deviation
Table 4: Variation in HR (bpm)HR (beats/min)
Mean±SD (n=45) P valueGroup L Group R
Baseline (min) 80.73±6.98 81.04±5.58 0.816 (P>0.05)0 84.64±4.64 85.33±4.72 0.487 (P>0.05)3 92.00±5.07 91.96±4.96 0.967 (P>0.05)6 88.40±5.36 90.04±4.60 0.122 (P>0.05)9 86.11±5.57 86.51±4.97 0.720 (P>0.05)12 86.56±6.11 86.98±6.30 0.711 (P>0.05)15 83.98±6.30 83.78±5.22 0.870 (P>0.05)30 81.56±9.51 83.18±8.33 0.392 (P>0.05)45 82.73±5.13 82.91±7.14 0.892 (P>0.05)60 81.93±3.84 82.09±3.73 0.846 (P>0.05)75 80.02±5.76 80.02±5.76 1.000 (P>0.05)90 79.13±4.71 79.84±4.61 0.471 (P>0.05)105 78.76±6.28 79.16±5.28 0.744 (P>0.05)120 77.42±4.01 77.58±4.52 0.863 (P>0.05)135 77.96±4.96 77.58±4.19 0.697 (P>0.05)150 78.71±6.84 78.20±6.09 0.709 (P>0.05)165 78.47±5.57 78.18±7.08 0.830 (P>0.05)180 76.82±4.22 76.98±4.74 0.870 (P>0.05)195 82.29±5.01 82.24±4.75 0.966 (P>0.05)210 82.73±6.17 82.73±6.17 1.000 (P>0.05)225 79.20±5.74 79.20±5.74 1.000 (P>0.05)240 76.62±4.65 76.62±4.65 1.000 (P>0.05)255 78.09±5.49 78.09±5.49 1.000 (P>0.05)270 75.98±4.30 75.93±4.87 0.960 (P>0.05)285 79.93±4.87 76.80±5.14 0.900 (P>0.05)300 78.58±3.59 78.73±3.79 0.842 (P>0.05)HR: Heart rate, SD: Standard deviation
9.66 9.48
02468
101214
Group L Group R
Mea
n va
lues
(min
)
Comparison of Sensory Block- Onset (min) between Group L and Group R
Figure 1: Comparison of sensory block onset time (min) in the two drug groups
Figure 2: Comparison of sensory regression time (min)
186187188189190191
Levobupivacaine RopivacaineMea
n Se
nsor
y
Reg
ress
ion
Tim
e (m
ins)
Drug Groups
Comparison of Sensory Regression Time(mins)
Series1
Figure 3: Comparison of analgesia duration between Group L and Group R
175.38 170.8
0
50
100
150
200
250
Group L Group R
Mea
n va
lues
Comparison of Analgesia duration between Group L and Group R

Khan, et al.: Levobupivacaine versus Ropivacaine
191 International Journal of Scientifi c Study | April 2016 | Vol 4 | Issue 1
As indicated by mean and P values in Table 6, the diastolic BP of both the drugs is comparable at different time intervals. After the initiation of epidural anesthesia, BP started falling for both the drug groups for the fi rst 30 min. The difference between them is statistically insignifi cant (Figure 6).
DISCUSSION
The property of isomerism occurs when two or more compounds have the same molecular composition, but a different structure which often results in different
Table 6: Variation i n DBP (mmHg)DBP Mean±SD (n=45) P value
Group L Group R Baseline (min) 78.93±5.36 78.63±5.45 0.876 (P>0.05)0 82.29±5.21 82.44±5.42 0.890 (P>0.05)3 77.82±5.47 78.07±5.69 0.836 (P>0.05)6 73.56±5.25 73.64±5.41 0.937 (P>0.05)9 70.44±5.34 70.47±5.73 0.985 (P>0.05)12 67.80±5.51 67.80±5.88 1.000 (P>0.05)15 66.18±6.42 65.51±6.47 0.625 (P>0.05)30 64.33±6.35 64.51±6.31 0.894 (P>0.05)45 64.36±7.71 64.44±7.66 0.956 (P>0.05)60 65.80±7.38 65.71±7.40 0.955 (P>0.05)75 68.40±5.83 68.42±5.78 0.986 (P>0.05)90 71.33±5.56 71.44±5.65 0.925 (P>0.05)105 73.49±5.36 73.60±5.55 0.923 (P>0.05)120 75.22±5.57 75.13±5.90 0.942 (P>0.05)135 72.49±5.73 72.53±6.01 0.971 (P>0.05)150 68.69±6.01 68.91±6.00 0.861 (P>0.05)165 65.98±5.88 66.13±5.84 0.900 (P>0.05)180 64.49±4.89 64.84±4.95 0.881 (P>0.05)195 65.02±5.31 65.13±5.34 0.921 (P>0.05)210 65.87±6.33 65.91±6.41 0.974 (P>0.05)225 68.04±6.84 68.07±7.00 0.988 (P>0.05)240 70.69±7.68 70.73±7.74 0.978 (P>0.05)255 72.18±7.54 72.36±7.51 0.911 (P>0.05)270 72.51±7.22 72.62±7.40 0.943 (P>0.05)285 74.87±7.47 74.87±7.80 1.000 (P>0.05)300 76.62±6.77 76.73±6.92 0.939 (P>0.05)SD: Standard deviation, DBP: Diastolic blood pressure
Figure 4: Comparison of heart rate between Group L and Group R
50
60
70
80
90
100
Mea
n va
lues
Comparison of Heart Rate between Group L and Group R
GroupL
Figure 5: Comparison of systolic blood pressure between Group L and Group R
90
100
110
120
130
140
Mea
n va
lues
Comparison of SBP between Group L and Group R
GroupL
Figure 6: Comparison of diastolic blood pressure between Group L and Group R
40
50
60
70
80
90
Mea
n va
lues
Comparison of DBP between Group L and Group RGroupL
Table 5: Variation in SBP (mmHg)SBP Mean±SD (n=45) P value
Group L Group RBaseline (min) 123.91±7.08 124.42±6.54 0.723 (P>0.05)0 130.18±5.41 130.71±4.94 0.627 (P>0.05)3 127.44±5.44 126.53±5.32 0.424 (P>0.05)6 122.53±4.93 123.04±7.60 0.706 (P>0.05)9 118.49±5.99 120.44±6.92 0.155 (P>0.05)12 115.51±6.86 116.29±7.59 0.611 (P>0.05)15 112.38±9.77 114.20±8.32 0.344 (P>0.05)30 115.27±9.33 117.80±4.58 0.105 (P>0.05)45 119.36±6.72 118.89±5.25 0.714 (P>0.05)60 121.51±7.36 121.51±7.36 1.000 (P>0.05)75 122.84±7.63 123.96±7.56 0.489 (P>0.05)90 124.38±6.68 124.91±7.04 0.713 (P>0.05)105 124.11±5.66 124.64±5.72 0.658 (P>0.05)120 124.38±4.51 124.60±4.83 0.822 (P>0.05)135 124.82±4.41 125.16±4.37 0.720 (P>0.05)150 126.16±4.19 126.80±4.08 0.462 (P>0.05)165 125.60±3.38 126.02±4.07 0.594 (P>0.05)180 127.16±4.68 127.24±3.91 0.922 (P>0.05)195 128.40±4.75 128.44±4.62 0.964 (P>0.05)210 122.47±6.74 123.09±6.87 0.666 (P>0.05)225 123.42±7.65 123.96±7.18 0.734 (P>0.05)240 125.58±6.99 126.31±6.65 0.611 (P>0.05)255 127.80±5.80 128.98±6.35 0.361 (P>0.05)270 126.29±7.85 126±8.49 0.867 (P>0.05)285 124.24±6.44 124.67±5.84 0.745 (P>0.05)300 125.31±7.21 126.98±5.80 0.230 (P>0.05)SD: Standard deviation, SBP: Systolic blood pressure

Khan, et al.: Levobupivacaine versus Ropivacaine
192International Journal of Scientifi c Study | April 2016 | Vol 4 | Issue 1
properties. There are two types of isomerism - structural and stereoisomersim.6
Stereoisomerism describes those compounds which have the same molecular formula and chemical structure, but the atoms are orientated in a different direction. There are two isomers, each a mirror image of the other, called enantiomers. They are also called optical isomers because they rotate the plane of polarized light either to the right referred to as +, dextro, d or D isomer, or to the left referred to as -, laevo (levo), l or L isomer. More recently, this classifi cation has been replaced by the R-/S- notation, which describes the arrangement of the molecules around the chiral center (R is for rectus the Latin for right, and S for sinister, left). The R enantiomer rotates light to the right and the S enantiomer to the left. As with other isomers, they can have different properties.
The molecule of bupivacaine, a long-acting local anesthetic, has an asymmetric carbon atom. For this reason, with this asymmetric carbon as a chiral center, bupivacaine exhibits this phenomenon. In the commercial presentation of this local anesthetic, there is a 50:50 proportion: Levobupivacaine, L (-) isomer, and dextro bupivacaine D (+) isomer. This preparation which contains both enantiomers is called a racemic mixture.7,8
Local anesthetics inhibit the sodium channels on neural membranes. Therefore, they cause a loss of conduction on neural structure and a loss of sensorial innervation. Systemic toxicity results from excessive blood levels of local anesthetics in central nerve system and cardiovascular system when they are injected IV by mistake. They cause directly negative introphy, myocardial conduction abnormalities, and arrhythmias. Arrhythmogenic effects of these drugs are related with repolarization of potassium, sodium, and calcium channels. Consequently with this mechanism, cardiac impulse conduction slows down, QRS complex widens, PR distance gets longer, atrioventricular block occurs, and fatal ventricular arrhythmias such as ventricular tachycardia or ventricular fi brillation occur.
Levobupivacaine and ropivacaine, two new long-acting local anesthetics, have been developed as an alternative to bupivacaine, after the evidence of its severe toxicity. Both of these agents are pure left isomers and, due to their three-dimensional structure, seem to have less toxic effects on the central nervous system and the cardiovascular system. Many clinical studies have investigated their toxicology and clinical profi les: Theoretically and experimentally, some differences have been observed, but the effects of these properties on clinical practice have not been shown. By examining randomized, controlled trials that have compared these three local agents, this review supports the evidence that both levobupivacaine and ropivacaine have a clinical profi le
similar to that of racemic bupivacaine and that the minimal differences reported between the three anesthetics are mainly related to the slightly different anesthetic potency, with racemic bupivacaine > levobupivacaine > ropivacaine. However, the reduced toxic potential of the two pure left isomers suggests their use in the clinical situations in which the risk of systemic toxicity related to either overdosing or unintended intravascular injection is high such as during epidural or peripheral nerve blocks.5,6
Age, sex, psychological, or pharmacological factors effect the post-operative pain scores. The type of surgery plays also an important role. The pain therapy after abdominal and thoracal surgeries is adequately successful using epidural patient-controlled analgesia. There are several agents in this area but on the other side, the hemodynamic and cardiac side effects restrict their use. Bupivacaine is a long-acting amide and widely used as a local anesthetic for epidural anesthesia. It has a benefi cial ratio of sensory to motor block in epidural anesthesia. This agent provides also high-quality analgesia in the post-operative period. However, bupivacaine-induced cardiotoxicity in patients following accidental intravascular injection limits its use. It has also potential for neurotoxicity. Sudden cardiac arrests and a high proportion of maternal deaths were reported. Therefore, a local anesthetic which has similar effects as bupivacaine but has less side effects on cardiovascular system was needed. Bupivacaine is used as a racemic mixture of equimolar amounts of R(+)- and S(-)- bupivacaine. R(+)- bupivacaine is found more toxic to both the central nervous system and the cardiovascular system. Levobupivacaine (S-1-butyl-2-piperidylformo-2’, 6’-xylidide hydrochloride) is the pure S(-)-enantiomer of racemic bupivacaine. Preclinical animal and volunteer studies showed less cardiac toxicity than bupivacaine. It seems to be an alternative local anesthetic agent in epidural anesthesia.9
About 0.5% levobupivacaine and 0.75% ropivacaine both have nearly equal onset and duration of the sensory block. Both the drugs had sensory onset below 10 min. The sensory regression of both the drugs is around 190 min. The difference between their sensory onset and regression time of the two drugs are statistically insignifi cant. Both the drugs are equianalgesic, and although levobupivacaine was found to have a little longer duration of analgesia, the difference in time was statistically insignifi cant. So, both the newer local anesthetic drugs are equianalgesic and show stable cardiovascular profi les, which are effective and potent enough to carry out any infraumbilical surgeries.10
CONCLUSION
Hemodynamically, both the drug groups showed comparable and stable results. None of the patients needed any intraoperative analgesic top ups, and HR, MAP, SpO2
Khan, et al.: Levobupivacaine versus Ropivacaine
193 International Journal of Scientifi c Study | April 2016 | Vol 4 | Issue 1
in both the groups were stable. Few patients whose SBP dipped below 90 mmHg, they were treated with injection ephedrine and injection atropine 0.6 mg was given whose HR fell below 50 bpm. Oxygen saturation was comparable in both the groups, and no incidence of hypoxemia was observed during the study.
From the above-mentioned observations, we conclude that both 0.5% levobupivacaine and 0.75% ropivacaine can be successfully used in lower limb surgeries, and both the drugs in their respective concentrations are equally potent. The side effects are minimal in both the drug groups and both the drugs exhibited stable and comparable hemodynamic profi le. While ropivacaine might have an edge over levobupivacaine as previously various animal and human volunteer studies have shown that ropivacaine is potentially less toxic than levobupivacaine.
REFERENCES
1. Avery P, Redon D, Schaenzer G, Rusy B. The infl uence of serum potassium on cerebral and cardiac toxicity of bupivacaine and lidocaine.
Anesthesiology 1984;61:134-8.2. Gonzalez T, Arias C, Caballero R, Moreno I, Delpon E, Tamargo J, et al.
Effects of levobupivacaine, ropivacaine and bupivacaine on HERG channels: Stereoselective bupivacaine block. Br J Pharmacol 2002;137:1269-79.
3. Chang DH, Ladd LA, Copeland S, Iglesias MA, Plummer JL, Mather LE. Direct cardiac effects of intracoronary bupivacaine, levobupivacaine, and ropivacaine in sheep. Br J Pharmacol 2001;132:649-58.
4. Agarwal A, Verma RK, Srinivasta S. Ropivacaine - The latest local anaesthetic in the Indian market. J Anaesth Clin Pharmacol 2010;26:223-8.
5. Bajwa SJ, Kaur J. Clinical profi le of levobupivacaine in regional anesthesia: A systematic review. J Anaesthesiol Clin Pharmacol 2013;29:530-9.
6. Peduto VA, Baroncini S, Montanini S, Proietti R, Rosignoli L, Tufano R, et al. A prospective, randomized, double blind comparison of epidural levobupivacaine 0.5% with epidural ropivacaine 0.75% for lower limb procedures. Eur J Anaesthesiol 2003;20:979-83.
7. Koch T, Fichtner A, Schwemmer U, Standl T, Volk T, Engelhard K, et al. Levobupivacaine for epidural anaesthesia and postoperative analgesia in hip surgery: A multi-center effi cacy and safety equivalence study with bupivacaine and ropivacaine. Anaesthesist 2008;57:475-82.
8. Yang CW, Jung SM, Kwan HU, Kung PS, Ryu SH. Comparison of epidural anesthesiology with 0.5% levobupivacaine and 0.5% ropivacaine for cesarean section. Korean J Anesthesiol 2007;52:284-90.
9. Kountoudi M, Papadaki E, Pandazi A, Theohari E, Kouroukli I, Georgiou L. A comparison of epidural levobupivacaine 0.5% with ropivacaine 0.5% for inguinal hernia repair procedure: Blood pressure and heart rate alterations. Local Reg Anesth 2004;21:103-104.
10. Salvi L, Sisillo E, Rondello N. Thoracic epidural analgesia. Eur J Anaesthesiol 2005;22:723-4.
How to cite this article: Khan A, Nanda HS, Chandra R. Levobupivacaine versus Ropivacaine: A Comparative Study of the Analgesic and Hemodynamic Spectrum. Int J Sci Stud 2016;4(1):188-193.
Source of Support: Nil, Confl ict of Interest: None declared.

194International Journal of Scientifi c Study | April 2016 | Vol 4 | Issue 1
Submucosal Diathermy for Nasal Obstruction: A Case Study of 30 CasesM S Vishnu1, A B Harikrishnan1, K B Rajamma2
1Resident, Department of ENT, Sree Gokulam Medical College & Research Foundation, Trivandrum, Kerala, India, 2Professor and Head, Department of ENT, Sree Gokulam Medical College & Research Foundation, Trivandrum, Kerala, India
which may sometimes respond to medical management by topical decongestants. Physiological functions of inferior turbinate include resistor function, diffusor, and protective function. Disorders affecting inferior turbinate include compensatory hypertrophy, protrusion of the os turbinate, hyperplasia of the end of the turbinate.2 Severe cases of inferior turbinate hypertrophy do not respond to medical treatment and requires surgery. Multiple surgical techniques have been made available for the management of the same.3 Some of them are turbinectomy, laser cautery, radioablation, turbinoplasty, cryosurgery, electrocautery, submucosal diathermy (SMD), and submucosal resection with or without lateral displacement. Surgeons are still under dispute regarding which surgical technique serves the best in treating the hypertrophy.1 This study aims to
INTRODUCTION
Nasal obstruction is one of the common presenting complaints to an ENT OPD.1 Major etiologies include deviated septum, nasal polyposis, hypertrophied inferior turbinate, vasomotor, or perennial rhinitis. Out of which inferior turbinate hypertrophy is a common cause,
Original Article
Abstract
Introduction: Most common etiology for nasal obstruction is hypertrophy of the inferior turbinates due to allergic rhinitis or vasomotor rhinitis.
Objectives: To compare the pre-operative and post-operative subjective, objective parameters, and post-operative complications of 30 patients with nasal obstruction due to inferior turbinate hypertrophy following submucosal diathermy (SMD).
Materials and Methods: A prospective observational study involving 30 patients with nasal obstruction due to inferior turbinate hypertrophy was done at Sree Gokulam Medical College, TVM from January 2014 to June 2015. Patients were evaluated preoperatively and postoperatively based on subjective and objective parameters. Post-operative evaluation was done at day 1, 1 week, 1 month, and 3 months based on subjective and objective parameters and post-operative complications.
Results: Snoring among the study population decreased from 23.3% to 13.3% at the end of 1 month and was further reduced 6.7% at the end of 3 months. Feeling of nasal obstruction, present in all patients was reduced to 43.3%, 33.3%, and 20% at the end of 1 week, 1 month, and 3 months postoperatively. Among pre-operative objective parameters, cold spatula test that was showing decreased fogging for all patients initially showed increased fogging in 66.7%, 76.7%, and 86.7% at the end of 1 week, 1 month, and 3 months postoperatively. Anterior rhinoscopy showing large turbinate in all patients preoperatively and showed a reduction in turbinate size in 63.3%, 73.3%, and 83.3% at the end of 1 week, 1 month, and 3 months, respectively. Radiological evidence of enlarged inferior turbinate present in all patients was reduced to 16.7% at the end of 3 months. The occurrence of post-operative reactionary hemorrhage on day 1 was 10%. Nasal crust formation was not seen in any of the patients. Vestibular skin burn was observed in 3.3% of patients. None of the patients had nasal pain. Remote sequelae, such as synechiae and atrophic rhinitis, were not reported in any of the patients during the assessment period.
Conclusion: SMD is an effective, safer, and less invasive technique in the management of inferior turbinate hypertrophy with less bleeding, pain, and crusting.
Key words: Inferior turbinate hypertrophy, Nasal obstruction, Submucosal diathermy
Access this article online
www.ijss-sn.com
Month of Submission : 02-2016Month of Peer Review : 03-2016Month of Acceptance : 03-2016Month of Publishing : 04-2016
Corresponding Author: M S Vishnu, Department of ENT, Sree Gokulam Medical College & Research Foundation, Trivandrum, Kerala, India. E-mail: [email protected]
DOI: 10.17354/ijss/2016/216

Vishnu, et al.: Submucosal Diathermy for Nasal Obstruction
195 International Journal of Scientifi c Study | April 2016 | Vol 4 | Issue 1
compare the pre-operative and post-operative subjective, objective parameters, and post-operative complications following SMD.
MATERIALS AND METHODS
A prospective observational study of 30 patients who attended the ENT OPD with complaints of nasal obstruction due to inferior turbinate hypertrophy was done in the Department of ENT Sree Gokulam Medical College from January 2014 to June 2015.
A thorough history and detailed examination of ear nose and throat were conducted by anterior rhinoscopy, DNE, and radiologically by sinus X-ray. Routine pre-operative investigations were done for every patient.
Size of inferior turbinate was classifi ed into three grades:4Grade 1: Normal size inferior turbinate, not atrophic
without any nasal obstructionGrade 2: Moderate sized inferior turbinate, touching the
septum with nasal obstruction, responding to local decongestant
Grade 3: Large mulberry turbinate touching the septum with nasal obstruction, not responding to local decongestant.
The procedure was done for both Grades 2 and 3 patients.
Pre-operative subjective parameters assessed were the presence of snoring and feeling of nasal obstruction. Pre-operative objective parameters assessed were cold spatula test showing a decreased fogging, anterior rhinoscopy showing enlarged inferior turbinate and X-ray paranasal sinuses (PNS) showing large sized turbinate.
The procedure was done under general anesthesia, with the patient in reclining position and the head end of the table raised. Nasal cavity was packed with two cotton pledgets soaked in oxymetazoline and adrenaline. After decongestion, the diathermy needle was inserted into the anterior end of the inferior turbinate, which was advanced submucosally till the posterior end of the inferior turbinate was reached. The needle was then withdrawn slightly, and a current of 50 joules was applied in a triangular fashion at 3 points (superior, medial, and inferior).
Following the procedure, anterior nasal packing was done with antibiotic ointment (soframycin+metrogyl). All patients were given parenteral antibiotics, analgesics, and nasal drops for 7-10 days postoperatively.
Postoperatively, subjective parameters such as persistence of snoring and relief of nasal obstruction were assessed.
Post-operative objective parameters that were assessed include cold spatula test showing increased fogging, anterior rhinoscopy showing reduced turbinate size, and X-ray PNS showing persistent large sized turbinate. In addition, the occurrence of post-operative complications such as reactionary hemorrhage, nasal crust formation, vestibular skin burn, headache and nasal pain, synechiae formation, and atrophic rhinitis were also assessed. Post-operative assessment of persistent snoring was done at 1 month and 3 months. Nasal obstruction was evaluated at 1 week, 1 month, and 3 months postoperatively. Cold spatula test and anterior rhinoscopy were done at 1 week, 1 month, and 3 months postoperatively. X-ray PNS for the evaluation of the persistent large sized turbinate was done postoperatively at the end of 3 months. Follow-up was done on day 1 for assessing reactionary hemorrhage. Nasal crust formation was evaluated at 1 week, 1 month, and 3 months postoperatively. Vestibular skin burn was assessed on day 1. Assessment of nasal pain was done on a post-operative day 1 and day 7. Synechiae formation and atrophic rhinitis were evaluated at 1 month and 3 months.
RESULTS
Out of the 30 patients recruited for the study, 12 were males and 18 were females, with a mean age of 27.2 (Figure 1).
Preoperatively, 23.3% of patients suffered from snoring. Postoperatively, snoring was reduced to 13.3% after 1 month and by the end of 3 months, it was 6.7%. All patients complaint of nasal obstruction preoperatively. Following the procedure, the feeling of nasal obstruction was reduced to 56.7% by the end of 1 week and was further reduced to 66.7% at the end of 1 month. 80% of the patients were relived of nasal obstruction by the end of 3rd month postoperatively (Figure 2).
Figure 1: Percentage distribution of sample in group according to sex
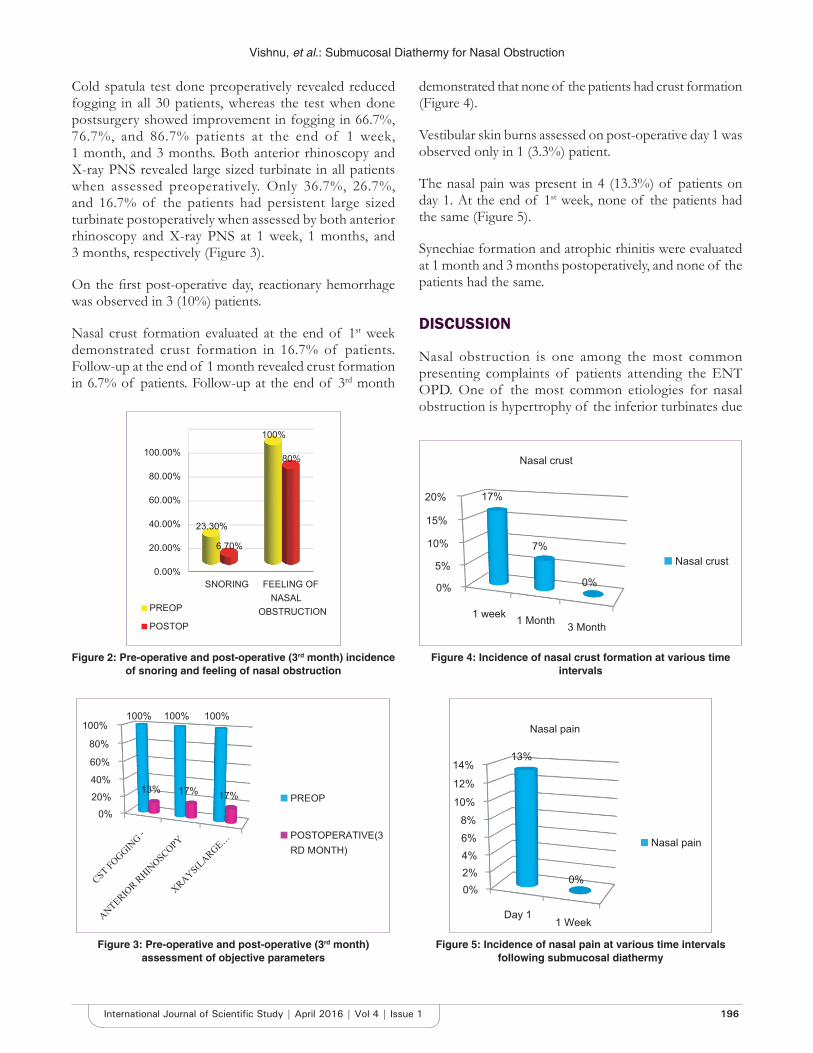
Vishnu, et al.: Submucosal Diathermy for Nasal Obstruction
196International Journal of Scientifi c Study | April 2016 | Vol 4 | Issue 1
Cold spatula test done preoperatively revealed reduced fogging in all 30 patients, whereas the test when done postsurgery showed improvement in fogging in 66.7%, 76.7%, and 86.7% patients at the end of 1 week, 1 month, and 3 months. Both anterior rhinoscopy and X-ray PNS revealed large sized turbinate in all patients when assessed preoperatively. Only 36.7%, 26.7%, and 16.7% of the patients had persistent large sized turbinate postoperatively when assessed by both anterior rhinoscopy and X-ray PNS at 1 week, 1 months, and 3 months, respectively (Figure 3).
On the fi rst post-operative day, reactionary hemorrhage was observed in 3 (10%) patients.
Nasal crust formation evaluated at the end of 1st week demonstrated crust formation in 16.7% of patients. Follow-up at the end of 1 month revealed crust formation in 6.7% of patients. Follow-up at the end of 3rd month
demonstrated that none of the patients had crust formation (Figure 4).
Vestibular skin burns assessed on post-operative day 1 was observed only in 1 (3.3%) patient.
The nasal pain was present in 4 (13.3%) of patients on day 1. At the end of 1st week, none of the patients had the same (Figure 5).
Synechiae formation and atrophic rhinitis were evaluated at 1 month and 3 months postoperatively, and none of the patients had the same.
DISCUSSION
Nasal obstruction is one among the most common presenting complaints of patients attending the ENT OPD. One of the most common etiologies for nasal obstruction is hypertrophy of the inferior turbinates due
Figure 2: Pre-operative and post-operative (3rd month) incidence of snoring and feeling of nasal obstruction
Figure 3: Pre-operative and post-operative (3rd month) assessment of objective parameters
Figure 4: Incidence of nasal crust formation at various time intervals
Figure 5: Incidence of nasal pain at various time intervals following submucosal diathermy

Vishnu, et al.: Submucosal Diathermy for Nasal Obstruction
197 International Journal of Scientifi c Study | April 2016 | Vol 4 | Issue 1
to allergic rhinitis or vasomotor rhinitis. The hypertrophy is almost always due to dilatation of the venous sinusoids resulting in swelling of the submucosal layer.5 The majority of the patients responds to antihistamines or local decongestants. Occasionally, sub mucous fi brosis may render the turbinates incapable of decongestion and in such cases surgical management becomes necessary.5 Even though multiple treatment options are available, there is considerable controversy over the merits of the various techniques.
This study is done to compare the pre-operative and post-operative subjective, objective parameters, and post-operative complications of 30 patients with nasal obstruction due to inferior turbinate hypertrophy following SMD. Cold spatula test, anterior rhinoscopy, and radiological investigations (X-ray PNS) were done. Rhinomanometry was not done due to lack of availability in our institute.
In a study conducted by Al-Baldawi,4 in 2009, about 90% of patients had the disappearance of snoring on the side were SMD was performed. In a study conducted Anil and Mahjabeen et al., in 2013,6 80% patient had the disappearance of snoring who underwent SMD. In our study, disappearance of snoring was observed in 86.7% after 1 month 93.3% of patients at the end of 3 months in those who underwent SMD.
A study done by Al-Baldawi,4 in 2009, demonstrated an improvement in feeling of nasal obstruction in 82.5% of patients, who underwent SMD. In a study conducted by Luczaj and Rogowski (Polland)7 demonstrated an improvement in nasal obstruction for 98% of the patients. Fradis et al.,8 2000 (U.S.A) demonstrated an improvement in nasal obstruction in 76% of the patients. Warwick-Brown and Marks9 1987 (U.K) demonstrated an improvement in 60% of the patients following SMD. Our study showed an improvement in the nasal airway for 80% of the patients who underwent SMD.
Improvement of fogging in cold spatula test was observed in 87.5% of patients who underwent SMD in a study conducted by Al-Baldawi4 in 2009. In our study, it was observed that the improvement in fogging was 66.7%, 76.7%, and 86.7% at the end of 1 week, 1 month, and 3 months, respectively, and these results were similar to that observed in other studies.
A study done by Al-Baldawi,4 2009 (Iraq) showed a reduction in the size of the turbinates in 85% of the patients who underwent SMD. The anterior rhinoscopic examination was done postoperatively at different time intervals for assessing decrease in the size of the turbinates.
At the end 1-week, anterior rhinoscopic examination revealed reduced size turbinates in 63.3% of patients and by the end of 1st month, 73.3% of patients had reduced turbinates. The anterior rhinoscopic picture after 3 months showed reduced turbinates in 83.3% of patients who underwent SMD. Radiological examination (X-ray PNS) which was done after 3 months showed reduced 83.3% patients.
In a study conducted by Imad et al.,10 in 2010, it was found that only 3% who underwent SMD had minimal bleeding. The studies done by Al-Baldawi4 revealed that the incidence of reactionary hemorrhage was none of the patients who underwent SMD had a reactionary hemorrhage. In our study, the reactionary hemorrhage was evaluated on post-operative day 1 which was 10%.
A study conducted by Imad et al.,10 in 2010, revealed that at the end of 2 weeks none of the patients who underwent SMD had crusting. None of the patients who underwent SMD had developed nasal crust formation according to the study by Al-Baldawi4 In this study, the incidence of nasal crust formation was assessed at various time intervals. The incidence of nasal crust formation was 16.7% after 1 week which further reduced to 6.7% after 1 month. At the end of 3 months, none of the patients who underwent SMD had nasal crust formation.
According to a study conducted by Al-Baldawi,4 2009 the incidence of vestibular skin burn in patients who underwent SMD was 2.5%. In our study, the incidence of vestibular skin burn was evaluated on post-operative day 1. 3.3% of patients who underwent SMD had developed vestibular skin burn which was mild.
In a study conducted by Imad et al.,10 in 2010, in Peshawar, 44% of patients who underwent SMD had moderate pain. In a study conducted in Iraq by Al-Baldawi,4 the occurrence of nasal pain and headache was only 5% of patients who underwent SMD. Our study also assessed the incidence of a headache and nasal pain. At post-operative day 1, the incidence of nasal pain in patients was 13.3% at post-operative day 1, and none of the patients had nasal pain at the end of 1 week.
Nasal synechiae/adhesions were not observed in patients who underwent SMD in a study conducted by Al-Baldawi4 in 2009. The occurrence of synechiae formation was assessed in our study at 1 month and 3 months postoperatively. None had synechiae formation at the end of 1 month and 3 months.
A study done by Al-Baldawi,4 2009 (Iraq) revealed that none of the patients who underwent SMD had atrophic rhinitis.
Vishnu, et al.: Submucosal Diathermy for Nasal Obstruction
198International Journal of Scientifi c Study | April 2016 | Vol 4 | Issue 1
In our study, we also assessed the incidence of atrophic rhinitis at time intervals of 1 month and 3 months. None of the patients had the same.
CONCLUSION
This study showed the following results:• Improvement in airfl ow postoperatively 80% of the
patients who underwent SMD.• The relief from snoring postoperatively was seen
93.3% of the patients who underwent SMD.• By the end of 3 months, the there was an improvement
in fogging in 86.7% of cases as seen in cold spatula test.
• The anterior rhinoscopic examination was conducted postoperatively by the end of the 3rd month showed that 83.3% of patients who underwent SMD had reduced turbinates.
• The radiological examination (X-ray PNS) taken postoperatively at 3 months revealed reduced turbinate sin 83.3% patients.
• This study showed that the incidence in reactionary hemorrhage was 10%.
• Only 3.3% patients had vestibular skin burn.• None of the patients had nasal crust formation,
headache, nasal pain synechiae, and atrophic rhinitis by the end of the assessment peri od.
REFERENCES
1. Mathai J. Inferior turbinectomy for nasal obstruction review of 75 cases. Indian J Otolaryngol Head Neck Surg 2004;56:23-6.
2. Tsakiropoulou E, Vital V, Constantinidis J, Kekes G. Nasal air-conditioning after partial turbinectomy: Myths versus facts. Am J Rhinol Allergy 2015;29:e59-62.
3. Hol MK, Huizing EH. Treatment of inferior turbinate pathology: A review and critical evaluation of the different techniques. Rhinology 2000;38:157-66.
4. Al-Baldawi MH. Management of inferior turbinate hypertrophy: A comparaytive study between partial inferior turbinectomy and submucosal diathermy. Iraqi J Community Med 2009;22:264-7.
5. Christmas DA, Mirante JP, Yanagisawa E. Endoscopic view of a concha bullosa of the inferior nasal turbinate. Ear Nose Throat J 2014;93:140.
6. Anil HT, Mahjabeen B. Comparative study between partial inferior turbinectomy and submucosal diathermy in the management of inferior turbinate hypertrophy. IJSR 2014;3:323-5.
7. Luczaj J, Rogowski M. Submucosal bipolar radiofrequency therapy for treatment of turbinate hypertrophy. Otolaryngol Pol 2007;61:290-4.
8. Fradis M, Golz A, Danino J, Gershinski M, Goldsher M, Gaitini L, et al. Inferior turbinectomy versus submucosal diathermy for inferior turbinate hypertrophy. Ann Otol Rhinol Laryngol 2000;109:1040-5.
9. Warwick-Brown NP, Marks NJ. Turbinate surgery: How effective is it? A long-term assessment. ORL J Otorhinolaryngol Relat Spec 1987;49:314-20.
10. Imad H, Javad K, Ullah S. Comparison of submucosal diathermy with partial inferior turbinectomy: A fi fty case study. J Postgrad Med Inst 2012;6:91-5.
How to cite this article: Vishnu MS, Harikrishnan AB, Rajamma KB. Submucosal Diathermy for Nasal Obstruction: A Case Study of 30 Cases. Int J Sci Stud 2016;4(1):194-198.
Source of Support: Nil, Confl ict of Interest: None declared.
199 International Journal of Scientifi c Study | April 2016 | Vol 4 | Issue 1
Can Intercostal Nerve Blockade be an Effective Alternative to Thoracic Epidural Analgesia for Acute Post-thoracotomy Pain Relief?Dipika Choudhury1, Faiza Ahmed Talukdar2, Rupak Kundu3, Mridu Paban Nath4, Samit Parua3
1Professor and Head, Department of Anaesthesiology and Critical Care, Gauhati Medical College and Hospital, Guwahati, Assam, India, 2Professor, Department of Anaesthesiology and Critical Care, Gauhati Medical College and Hospital, Guwahati, Assam, India, 3Post-graduate Trainee, Department of Anaesthesiology and Critical Care, Gauhati Medical College and Hospital, Guwahati, Assam, India, 4Assistant Professor, Department of Anaesthesiology and Critical Care, Gauhati Medical College and Hospital, Guwahati, Assam, India
important not only to keep the patient comfortable but also to minimize pulmonary complications.1 Suboptimal pain relief not only will lead to increased patient suffering but also to increased morbidity after operation. In particular, poor cough and clearance of secretions may lead to atelectasis and pneumonia, which additionally prolongs immobility, and may lead to complications such as deep vein thrombosis and pulmonary embolism.1 Poorly treated acute post-thoracotomy pain may lead to chronic post-thoracotomy pain syndrome.2
Many methods of acute post-thoracotomy pain management have been tried with varied success, for example Intercostal nerve block, intrapleural analgesia, cry analgesia, lumbar epidural, thoracic epidural, paravertebral block, intravenous (IV) narcotics, intrathecal or epidural narcotics, non-steroidal anti-infl ammatory drugs (NSAIDs), and transcutaneous nerve stimulation.3,4
INTRODUCTION
Post-thoracotomy pain is very severe, probably the most severe pain experienced after surgery. Acute post-thoracotomy pain is due to skin and muscle injury, retraction, resection, or fracture of ribs, dislocation of costovertebral and costochondral joints, injury of intercostal nerves and further irritation of the pleura by chest tubes.1 Treatment of acute post-thoracotomy pain is particularly
Original Article
Abstract
Introduction: The pain that occurs the following a thoracotomy procedure, which is also known as post-thoracotomy pain, is quite commonly very severe and a major source of concern in the post-operative period. This study was designed to evaluate the effectiveness of intercostal nerve blockade as compared to thoracic epidural analgesia to alleviate acute post-thoracotomy pain.
Materials and Methods: A total of 60 patients undergoing elective pulmonary resection through a posterolateral thoracotomy were randomly allocated to receive either single-dose epidural analgesia using 0.2% ropivacaine (Group E, n = 30) or temporary intercostal nerve blockade using 0.2% ropivacaine (Group I, n = 30). Adequacy of analgesia was assessed in post-operative period using a visual analog score at 30 min interval.
Results and Observation: Duration of static analgesia (analgesia at rest) in Group E was 214 ± 10.2 min and in Group I was 210 ± 8.35 min, but the difference is statistically insignifi cant (P = 0.1019). Duration of dynamic analgesia (analgesia at coughing) in Group E was 200 ± 17.89 min and in Group I was 193 ± 16.76 min, but the difference is statistically insignifi cant (P - 0.1233).
Conclusion: A value of 10 ml of 0.2% ropivacaine in thoracic epidural route provides almost equal (P > 0.05) duration of post-operative static and dynamic analgesia as compared to 20 ml of 0.2% ropivacaine in intercostal nerve blockade in post-thoracotomy patients in early post-operative period.
Key words: Intercostal nerve blockade, Post-thoracotomy pain, Ropivacaine, Thoracic epidural analgesia, Visual analog score
Access this article online
www.ijss-sn.com
Month of Submission : 02-2016Month of Peer Review : 03-2016Month of Acceptance : 03-2016Month of Publishing : 04-2016
Corresponding Author: Dr. Rupak Kundu, Room No. 112, PG Boys Hostel No. 5, Gauhati Medical College and Hospital, Guwahati - 781 032, Assam, India. E-mail: [email protected]
DOI: 10.17354/ijss/2016/217
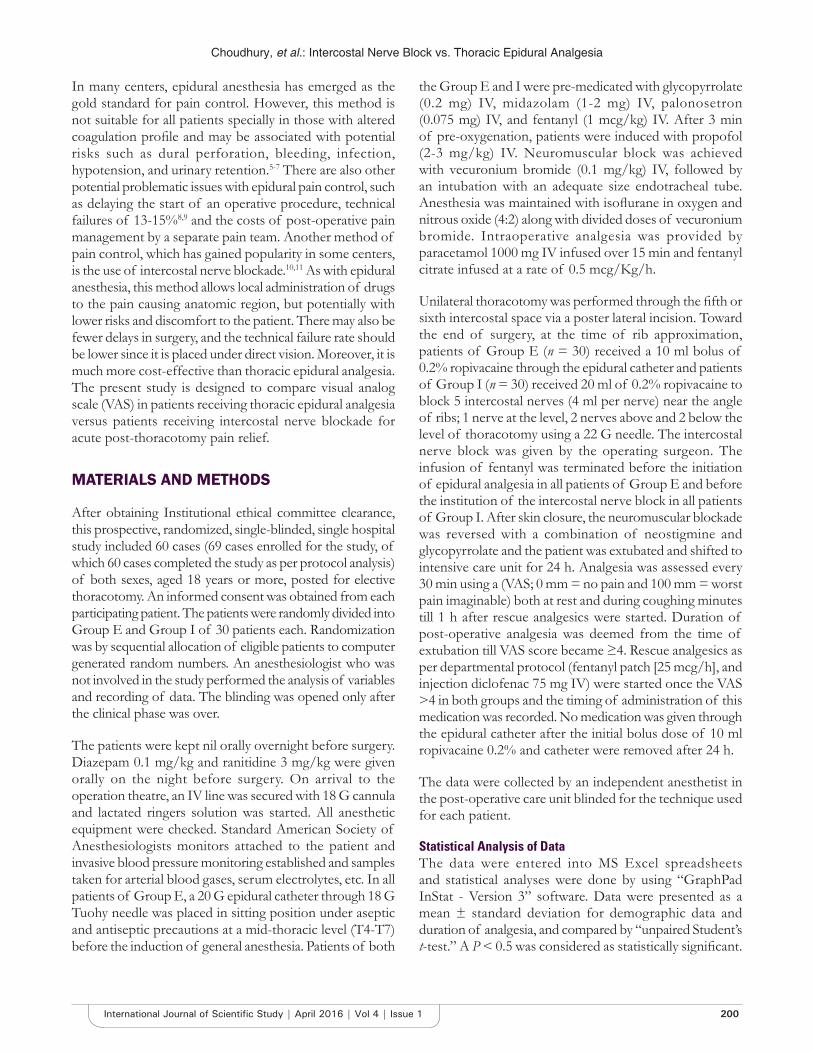
Choudhury, et al.: Intercostal Nerve Block vs. Thoracic Epidural Analgesia
200International Journal of Scientifi c Study | April 2016 | Vol 4 | Issue 1
In many centers, epidural anesthesia has emerged as the gold standard for pain control. However, this method is not suitable for all patients specially in those with altered coagulation profi le and may be associated with potential risks such as dural perforation, bleeding, infection, hypotension, and urinary retention.5-7 There are also other potential problematic issues with epidural pain control, such as delaying the start of an operative procedure, technical failures of 13-15%8,9 and the costs of post-operative pain management by a separate pain team. Another method of pain control, which has gained popularity in some centers, is the use of intercostal nerve blockade.10,11 As with epidural anesthesia, this method allows local administration of drugs to the pain causing anatomic region, but potentially with lower risks and discomfort to the patient. There may also be fewer delays in surgery, and the technical failure rate should be lower since it is placed under direct vision. Moreover, it is much more cost-effective than thoracic epidural analgesia. The present study is designed to compare visual analog scale (VAS) in patients receiving thoracic epidural analgesia versus patients receiving intercostal nerve blockade for acute post-thoracotomy pain relief.
MATERIALS AND METHODS
After obtaining Institutional ethical committee clearance, this prospective, randomized, single-blinded, single hospital study included 60 cases (69 cases enrolled for the study, of which 60 cases completed the study as per protocol analysis) of both sexes, aged 18 years or more, posted for elective thoracotomy. An informed consent was obtained from each participating patient. The patients were randomly divided into Group E and Group I of 30 patients each. Randomization was by sequential allocation of eligible patients to computer generated random numbers. An anesthesiologist who was not involved in the study performed the analysis of variables and recording of data. The blinding was opened only after the clinical phase was over.
The patients were kept nil orally overnight before surgery. Diazepam 0.1 mg/kg and ranitidine 3 mg/kg were given orally on the night before surgery. On arrival to the operation theatre, an IV line was secured with 18 G cannula and lactated ringers solution was started. All anesthetic equipment were checked. Standard American Society of Anesthesiologists monitors attached to the patient and invasive blood pressure monitoring established and samples taken for arterial blood gases, serum electrolytes, etc. In all patients of Group E, a 20 G epidural catheter through 18 G Tuohy needle was placed in sitting position under aseptic and antiseptic precautions at a mid-thoracic level (T4-T7) before the induction of general anesthesia. Patients of both
the Group E and I were pre-medicated with glycopyrrolate (0.2 mg) IV, midazolam (1-2 mg) IV, palonosetron (0.075 mg) IV, and fentanyl (1 mcg/kg) IV. After 3 min of pre-oxygenation, patients were induced with propofol (2-3 mg/kg) IV. Neuromuscular block was achieved with vecuronium bromide (0.1 mg/kg) IV, followed by an intubation with an adequate size endotracheal tube. Anesthesia was maintained with isofl urane in oxygen and nitrous oxide (4:2) along with divided doses of vecuronium bromide. Intraoperative analgesia was provided by paracetamol 1000 mg IV infused over 15 min and fentanyl citrate infused at a rate of 0.5 mcg/Kg/h.
Unilateral thoracotomy was performed through the fi fth or sixth intercostal space via a poster lateral incision. Toward the end of surgery, at the time of rib approximation, patients of Group E (n = 30) received a 10 ml bolus of 0.2% ropivacaine through the epidural catheter and patients of Group I (n = 30) received 20 ml of 0.2% ropivacaine to block 5 intercostal nerves (4 ml per nerve) near the angle of ribs; 1 nerve at the level, 2 nerves above and 2 below the level of thoracotomy using a 22 G needle. The intercostal nerve block was given by the operating surgeon. The infusion of fentanyl was terminated before the initiation of epidural analgesia in all patients of Group E and before the institution of the intercostal nerve block in all patients of Group I. After skin closure, the neuromuscular blockade was reversed with a combination of neostigmine and glycopyrrolate and the patient was extubated and shifted to intensive care unit for 24 h. Analgesia was assessed every 30 min using a (VAS; 0 mm = no pain and 100 mm = worst pain imaginable) both at rest and during coughing minutes till 1 h after rescue analgesics were started. Duration of post-operative analgesia was deemed from the time of extubation till VAS score became ≥4. Rescue analgesics as per departmental protocol (fentanyl patch [25 mcg/h], and injection diclofenac 75 mg IV) were started once the VAS >4 in both groups and the timing of administration of this medication was recorded. No medication was given through the epidural catheter after the initial bolus dose of 10 ml ropivacaine 0.2% and catheter were removed after 24 h.
The data were collected by an independent anesthetist in the post-operative care unit blinded for the technique used for each patient.
Statistical Analysis of DataThe data were entered into MS Excel spreadsheets and statistical analyses were done by using “GraphPad InStat - Version 3” software. Data were presented as a mean ± standard deviation for demographic data and duration of analgesia, and compared by “unpaired Student’s t-test.” A P < 0.5 was considered as statistically signifi cant.
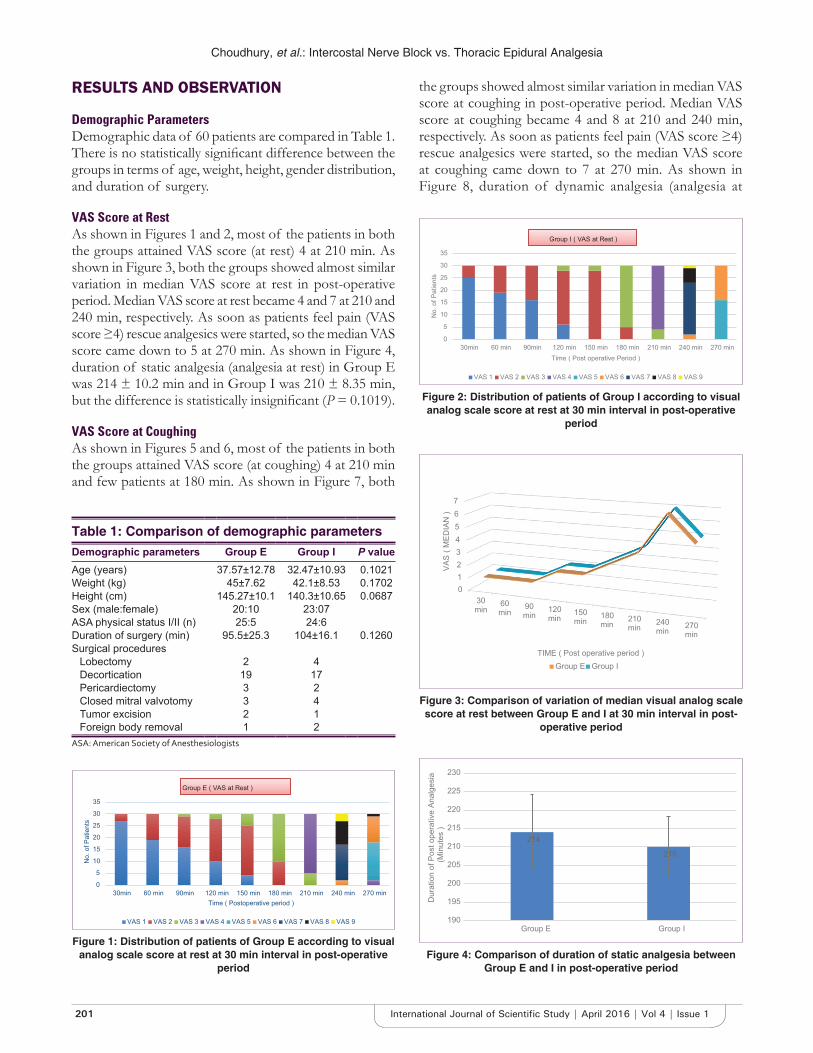
Choudhury, et al.: Intercostal Nerve Block vs. Thoracic Epidural Analgesia
201 International Journal of Scientifi c Study | April 2016 | Vol 4 | Issue 1
RESULTS AND OBSERVATION
Demographic ParametersDemographic data of 60 patients are compared in Table 1. There is no statistically signifi cant difference between the groups in terms of age, weight, height, gender distribution, and duration of surgery.
VAS Score at RestAs shown in Figures 1 and 2, most of the patients in both the groups attained VAS score (at rest) 4 at 210 min. As shown in Figure 3, both the groups showed almost similar variation in median VAS score at rest in post-operative period. Median VAS score at rest became 4 and 7 at 210 and 240 min, respectively. As soon as patients feel pain (VAS score ≥4) rescue analgesics were started, so the median VAS score came down to 5 at 270 min. As shown in Figure 4, duration of static analgesia (analgesia at rest) in Group E was 214 ± 10.2 min and in Group I was 210 ± 8.35 min, but the difference is statistically insignifi cant (P = 0.1019).
VAS Score at CoughingAs shown in Figures 5 and 6, most of the patients in both the groups attained VAS score (at coughing) 4 at 210 min and few patients at 180 min. As shown in Figure 7, both
the groups showed almost similar variation in median VAS score at coughing in post-operative period. Median VAS score at coughing became 4 and 8 at 210 and 240 min, respectively. As soon as patients feel pain (VAS score ≥4) rescue analgesics were started, so the median VAS score at coughing came down to 7 at 270 min. As shown in Figure 8, duration of dynamic analgesia (analgesia at
0
5
10
15
20
25
30
35
30min 60 min 90min 120 min 150 min 180 min 210 min 240 min 270 min
No.
of P
atie
nts
Time ( Postoperative period )
Group E ( VAS at Rest )
VAS 1 VAS 2 VAS 3 VAS 4 VAS 5 VAS 6 VAS 7 VAS 8 VAS 9
Figure 1: Distribution of patients of Group E according to visual analog scale score at rest at 30 min interval in post-operative
period
0
5
10
15
20
25
30
35
30min 60 min 90min 120 min 150 min 180 min 210 min 240 min 270 min
No.
of P
atie
nts
Time ( Post operative Period )
Group I ( VAS at Rest )
VAS 1 VAS 2 VAS 3 VAS 4 VAS 5 VAS 6 VAS 7 VAS 8 VAS 9
Figure 2: Distribution of patients of Group I according to visual analog scale score at rest at 30 min interval in post-operative
period
01234567
30min
60min
90min
120min
150min
180min
210min
240min
270min
VAS
( MED
IAN
)
TIME ( Post operative period )Group E Group I
Figure 3: Comparison of variation of median visual analog scale score at rest between Group E and I at 30 min interval in post-
operative period
214
210
190
195
200
205
210
215
220
225
230
Group E Group I
Dur
atio
n of
Pos
t ope
rativ
e An
alge
sia
(Min
utes
)
Figure 4: Comparison of duration of static analgesia between Group E and I in post-operative period
Table 1: Comparison of demographic parametersDemographic parameters Group E Group I P valueAge (years) 37.57±12.78 32.47±10.93 0.1021Weight (kg) 45±7.62 42.1±8.53 0.1702Height (cm) 145.27±10.1 140.3±10.65 0.0687Sex (male:female) 20:10 23:07ASA physical status I/II (n) 25:5 24:6Duration of surgery (min) 95.5±25.3 104±16.1 0.1260Surgical procedures
Lobectomy 2 4Decortication 19 17Pericardiectomy 3 2Closed mitral valvotomy 3 4Tumor excision 2 1Foreign body removal 1 2
ASA: American Society of Anesthesiologists
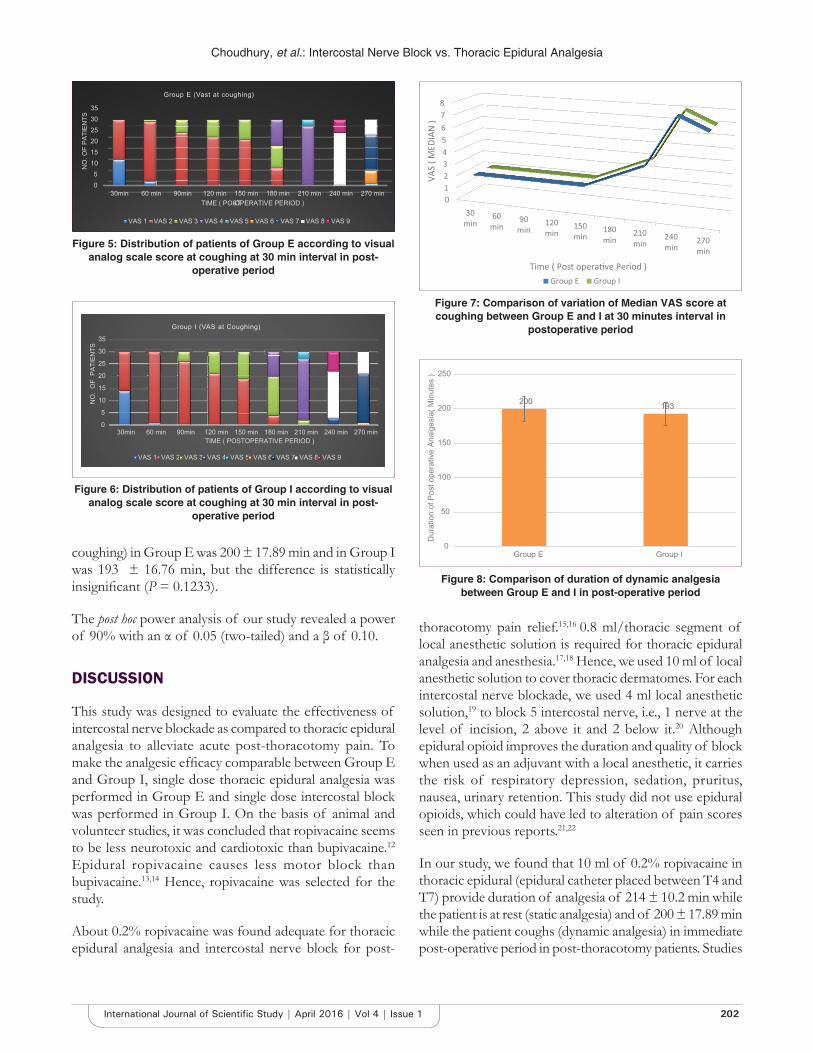
Choudhury, et al.: Intercostal Nerve Block vs. Thoracic Epidural Analgesia
202International Journal of Scientifi c Study | April 2016 | Vol 4 | Issue 1
coughing) in Group E was 200 ± 17.89 min and in Group I was 193 ± 16.76 min, but the difference is statistically insignifi cant (P = 0.1233).
The post hoc power analysis of our study revealed a power of 90% with an α of 0.05 (two-tailed) and a β of 0.10.
DISCUSSION
This study was designed to evaluate the effectiveness of intercostal nerve blockade as compared to thoracic epidural analgesia to alleviate acute post-thoracotomy pain. To make the analgesic effi cacy comparable between Group E and Group I, single dose thoracic epidural analgesia was performed in Group E and single dose intercostal block was performed in Group I. On the basis of animal and volunteer studies, it was concluded that ropivacaine seems to be less neurotoxic and cardiotoxic than bupivacaine.12 Epidural ropivacaine causes less motor block than bupivacaine.13,14 Hence, ropivacaine was selected for the study.
About 0.2% ropivacaine was found adequate for thoracic epidural analgesia and intercostal nerve block for post-
thoracotomy pain relief.15,16 0.8 ml/thoracic segment of local anesthetic solution is required for thoracic epidural analgesia and anesthesia.17,18 Hence, we used 10 ml of local anesthetic solution to cover thoracic dermatomes. For each intercostal nerve blockade, we used 4 ml local anesthetic solution,19 to block 5 intercostal nerve, i.e., 1 nerve at the level of incision, 2 above it and 2 below it.20 Although epidural opioid improves the duration and quality of block when used as an adjuvant with a local anesthetic, it carries the risk of respiratory depression, sedation, pruritus, nausea, urinary retention. This study did not use epidural opioids, which could have led to alteration of pain scores seen in previous reports.21,22
In our study, we found that 10 ml of 0.2% ropivacaine in thoracic epidural (epidural catheter placed between T4 and T7) provide duration of analgesia of 214 ± 10.2 min while the patient is at rest (static analgesia) and of 200 ± 17.89 min while the patient coughs (dynamic analgesia) in immediate post-operative period in post-thoracotomy patients. Studies
200 193
0
50
100
150
200
250
Group E Group I
Dur
atio
n of
Pos
t ope
rativ
e An
alge
sia(
Min
utes
)
Figure 8: Comparison of duration of dynamic analgesia between Group E and I in post-operative period
05
101520253035
30min 60 min 90min 120 min 150 min 180 min 210 min 240 min 270 min
NO
. OF
PATI
ENTS
TIME ( POST-OPERATIVE PERIOD )
Group E (Vast at coughing)
VAS 1 VAS 2 VAS 3 VAS 4 VAS 5 VAS 6 VAS 7 VAS 8 VAS 9
Figure 5: Distribution of patients of Group E according to visual analog scale score at coughing at 30 min interval in post-
operative period
0
5
10
15
20
25
30
35
30min 60 min 90min 120 min 150 min 180 min 210 min 240 min 270 min
NO
. O
F P
ATIE
NTS
TIME ( POSTOPERATIVE PERIOD )
Group I (VAS at Coughing)
VAS 1 VAS 22 VAS 3333333 VAS 444444 VAS 5555555555 VAS 66666666 VAS 7777777 VAS 8888888 VAS 9
Figure 6: Distribution of patients of Group I according to visual analog scale score at coughing at 30 min interval in post-
operative period
Figure 7: Comparison of variation of Median VAS score at coughing between Group E and I at 30 minutes interval in
postoperative period
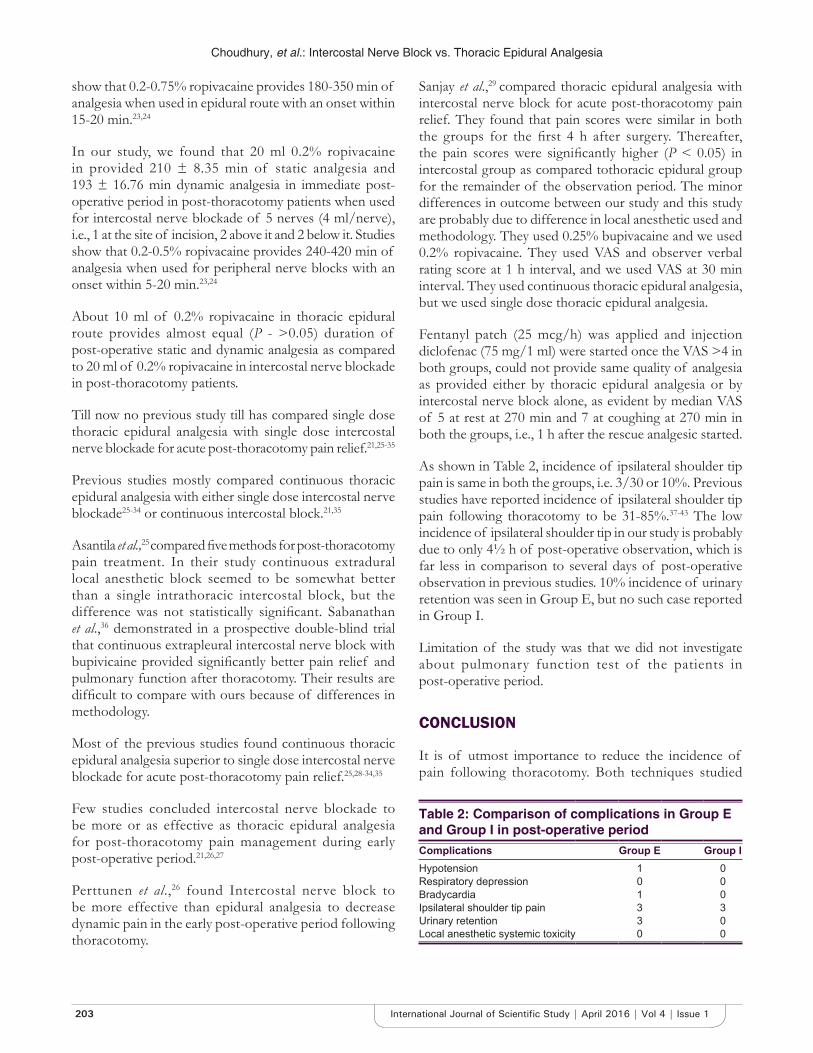
Choudhury, et al.: Intercostal Nerve Block vs. Thoracic Epidural Analgesia
203 International Journal of Scientifi c Study | April 2016 | Vol 4 | Issue 1
show that 0.2-0.75% ropivacaine provides 180-350 min of analgesia when used in epidural route with an onset within 15-20 min.23,24
In our study, we found that 20 ml 0.2% ropivacaine in provided 210 ± 8.35 min of static analgesia and 193 ± 16.76 min dynamic analgesia in immediate post-operative period in post-thoracotomy patients when used for intercostal nerve blockade of 5 nerves (4 ml/nerve), i.e., 1 at the site of incision, 2 above it and 2 below it. Studies show that 0.2-0.5% ropivacaine provides 240-420 min of analgesia when used for peripheral nerve blocks with an onset within 5-20 min.23,24
About 10 ml of 0.2% ropivacaine in thoracic epidural route provides almost equal (P - >0.05) duration of post-operative static and dynamic analgesia as compared to 20 ml of 0.2% ropivacaine in intercostal nerve blockade in post-thoracotomy patients.
Till now no previous study till has compared single dose thoracic epidural analgesia with single dose intercostal nerve blockade for acute post-thoracotomy pain relief.21,25-35
Previous studies mostly compared continuous thoracic epidural analgesia with either single dose intercostal nerve blockade25-34 or continuous intercostal block.21,35
Asantila et al.,25 compared fi ve methods for post-thoracotomy pain treatment. In their study continuous extradural local anesthetic block seemed to be somewhat better than a single intrathoracic intercostal block, but the difference was not statistically signifi cant. Sabanathan et al.,36 demonstrated in a prospective double-blind trial that continuous extrapleural intercostal nerve block with bupivicaine provided signifi cantly better pain relief and pulmonary function after thoracotomy. Their results are diffi cult to compare with ours because of differences in methodology.
Most of the previous studies found continuous thoracic epidural analgesia superior to single dose intercostal nerve blockade for acute post-thoracotomy pain relief.25,28-34,35
Few studies concluded intercostal nerve blockade to be more or as effective as thoracic epidural analgesia for post-thoracotomy pain management during early post-operative period.21,26,27
Perttunen et al.,26 found Intercostal nerve block to be more effective than epidural analgesia to decrease dynamic pain in the early post-operative period following thoracotomy.
Sanjay et al.,29 compared thoracic epidural analgesia with intercostal nerve block for acute post-thoracotomy pain relief. They found that pain scores were similar in both the groups for the fi rst 4 h after surgery. Thereafter, the pain scores were signifi cantly higher (P < 0.05) in intercostal group as compared tothoracic epidural group for the remainder of the observation period. The minor differences in outcome between our study and this study are probably due to difference in local anesthetic used and methodology. They used 0.25% bupivacaine and we used 0.2% ropivacaine. They used VAS and observer verbal rating score at 1 h interval, and we used VAS at 30 min interval. They used continuous thoracic epidural analgesia, but we used single dose thoracic epidural analgesia.
Fentanyl patch (25 mcg/h) was applied and injection diclofenac (75 mg/1 ml) were started once the VAS >4 in both groups, could not provide same quality of analgesia as provided either by thoracic epidural analgesia or by intercostal nerve block alone, as evident by median VAS of 5 at rest at 270 min and 7 at coughing at 270 min in both the groups, i.e., 1 h after the rescue analgesic started.
As shown in Table 2, incidence of ipsilateral shoulder tip pain is same in both the groups, i.e. 3/30 or 10%. Previous studies have reported incidence of ipsilateral shoulder tip pain following thoracotomy to be 31-85%.37-43 The low incidence of ipsilateral shoulder tip in our study is probably due to only 4½ h of post-operative observation, which is far less in comparison to several days of post-operative observation in previous studies. 10% incidence of urinary retention was seen in Group E, but no such case reported in Group I.
Limitation of the study was that we did not investigate about pulmonary function test of the patients in post-operative period.
CONCLUSION
It is of utmost importance to reduce the incidence of pain following thoracotomy. Both techniques studied
Table 2: Comparison of complications in Group E and Group I in post-operative period
Complications Group E Group IHypotension 1 0Respiratory depression 0 0Bradycardia 1 0Ipsilateral shoulder tip pain 3 3Urinary retention 3 0Local anesthetic systemic toxicity 0 0
Choudhury, et al.: Intercostal Nerve Block vs. Thoracic Epidural Analgesia
204International Journal of Scientifi c Study | April 2016 | Vol 4 | Issue 1
by us provide equal duration and quality analgesia in the immediate post-operative period and either technique is superior to parenteral analgesia by opioids and NSAIDs. Hence, it can be recommended that intercostal nerve block is an effective alternative to thoracic epidural analgesia for acute post-thoracotomy pain relief in the early post-operative period, for those patients who do not qualify for epidural analgesia due to technical failures or contraindications.
REFERENCES
1. Craig DB. Post-operative recovery of pulmonary function. Anesth Analg 1981;60:46-52.
2. Joseph RA, Puttappa A, Harney D. Post-thoracotomy pain syndrome, topics In: Cardoso P, editor. Thoracic Surgery. InTech; 2012. Available from: http:// www.intechopen.com/books/topics-in-thoracic surgery/postthoracotomypain- syndrome-2. [Last accessed 2016 Jan 10].
3. Luketich JD, Schauer P, Landreneau R, Nguyen N, Urso K, Ferson P, et al. Minimally invasive surgical staging is superior to endoscopic ultrasound in detecting lymph node metastases in esophageal cancer. J Thorac Cardiovasc Surg 1997;114:817-21.
4. Nomori H, Horio H, Naruke T, Suemasu K. What is the advantage of a thoracoscopic lobectomy over a limited thoracotomy procedure for lung cancer surgery? Ann Thorac Surg 2001;72:879-84.
5. Liu S, Carpenter RL, Neal JM. Epidural anesthesia and analgesia. Their role in postoperative outcome. Anesthesiology 1995;82:1474-506.
6. Li WW, Lee RL, Lee TW, Ng CS, Sihoe AD, Wan IY, et al. The impact of thoracic surgical access on early shoulder function: Video-assisted thoracic surgery versus posterolateral thoracotomy. Eur J Cardiothorac Surg 2003;23:390-6.
7. Landreneau RJ, Pigula F, Luketich JD, Keenan RJ, Bartley S, Fetterman LS, et al. Acute and chronic morbidity differences between muscle-sparing and differences between muscle-sparing and standard lateral thoracotomies. J Thorac Cardiovasc Surg 1996;112:1346-50.
8. McLeod G, Davies H, Munnoch N, Bannister J, MacRae W. Postoperative pain relief using thoracic epidural analgesia: Outstanding success and disappointing failures. Anaesthesia 2001;56:75-81.
9. Davies RG, Myles PS, Graham JM. A comparison of the analgesic effi cacy and side-effects of paravertebral vs epidural blockade for thoracotomy - A systematic review and meta-analysis of randomized trials. Br J Anaesth 2006;96:418-26.
10. Dahl JB, Kehlet H. Non-steroidal anti-infl ammatory drugs: Rationale for use in severe postoperative pain. Br J Anaesth 1991;66:703-12.
11. James EC, Kolberg HL, Iwen GW, Gellatly TA. Epidural analgesia for post-thoracotomy patients. J Thorac Cardiovasc Surg 1981;82:898-903.
12. Kuthiala G, Chaudhary G. Ropivacaine: A review of its pharmacology and clinical use. Indian J Anaesth 2011;55:104-10.
13. Meister GC, D’Angelo R, Owen M, Nelson KE, Gaver R. A comparison of epidural analgesia with 0.125% ropivacaine with fentanyl versus 0.125% bupivacaine with fentanyl during labor. Anesth Analg 2000;90:632-7.
14. Cekmen N, Arslan M. Comparison of effect of single dose epidural ropivacaine and bupivacaine in arthroscopic operations. Res J Med Sci 2008;2:109-15.
15. Brown DL. Atlas of Regional Anaesthesia. 4th ed. Philadelphia, PA: Saunders-Elsevier; 2010. p. 286.
16. Brown DL. Atlas of Regional Anaesthesia. 4th ed. Philadelphia: Saunders-Elsevier; 2010. p. 222.
17. Danilo J. Regional Nerve Blocks and Infi ltration Therapy Textbook and Color Atlas. 3rd ed. Berlin: Blackwell publishing Ltd.; 2004. p. 327.
18. John NJ, Plaus KL. Nurse Anesthesia. 4th ed., Ch. 45. St. Louis: Saunders-Elsevier; 2010.
19. Brown DL. Atlas of Regional Anaesthesia. 4th ed. Philadelphia, PA: Saunders-Elsevier; 2010. p. 225.
20. Gerner P. Postthoracotomy pain management problems. Anesthesiol Clin 2008;26:355-67.
21. Kaiser AM, Zollinger A, De Lorenzi D, Largiadèr F, Weder W. Prospective, randomized comparison of extrapleural versus epidural analgesia for postthoracotomy pain. Ann Thorac Surg 1998;66:367-72.
22. Deneuville M, Bisserier A, Regnard JF, Chevalier M, Levasseur P, Hervé P. Continuous intercostal analgesia with 0.5% bupivacaine after thoracotomy: A randomized study. Ann Thorac Surg 1993;55:381-5.
23. Berde CB, Srichartz GR. Local anesthetics. Miller’s Anesthesia. 8th ed. Philadelphia, PA: Saunders-Elsevier; 2015. p. 1028-52.
24. Suzuki S, Gerner P. Local anesthetics. Hemmings Pharmacology and Physiology for Anaesthetist. Philadelphia, PA: Saunders-Elsevier; 2013. p. 302.
25. Asantila R, Rosenberg PH, Scheinin B. Comparison of different methods of postoperative analgesia after thoracotomy. Acta Anaesthesiol Scand 1986;30:421-5.
26. Perttunen K, Nilsson E, Heinonen J, Hirvisalo EL, Salo JA, Kalso E. Extradural, paravertebral and intercostal nerve blocks for post-thoracotomy pain. Br J Anaesth 1995;75:541-7.
27. Wurnig PN, Lackner H, Teiner C, Hollaus PH, Pospisil M, Fohsl-Grande B, et al. Is intercostal block for pain management in thoracic surgery more successful than epidural anaesthesia? Eur J Cardiothorac Surg 2002;21:1115-9.
28. Takamori S, Yoshida S, Hayshi A, Matsuo T, Mitsuoka M, Shirouzu K. Inraoperative intercostal nerve blockade for post thoracotomy pain. Ann Thorac Surg 2002;74:338-41.
29. Sanjay OP, Prashanth P, Tauro DI. Intercostal nerve blockade versus thoracic epidural analgesia for post thoracotomy pain relief. Indian J Thorac Cardiovasc Surg 2003;19:141-4.
30. Concha M, Dagnino J, Cariaga M, Aguilera J, Aparicio R, Guerrero M. Analgesia after thoracotomy: Epidural fentanyl/bupivacaine compared with intercostal nerve block plus intravenous morphine. J Cardiothorac Vasc Anesth 2004;18:322-6.
31. Miliauskas P, Cicenas S, Tikuisis R, Zurauskas A, Piscikas D, Ostapenko V, et al. Intercostal nerve blockade with alcohol during operation for postthoracotomy pain. Medicina (Kaunas) 2004;40 Suppl 1:127-30.
32. Gorsewski G, Hock D, Eva B, Stefan K, Rainer M. Analgesia after thoracotomy: Is an intercostal nerve block plus intravenous patient-controlled analgesia with morphine as effective as patient - Controlled epidural anaesthesia with sufentanil/ropivacaine? A prospective randomized clinical study. Eur J Anaesthesiol 2008;25:116.
33. Meierhenrich R, Hock D, Kühn S, Baltes E, Muehling B, Muche R, et al. Analgesia and pulmonary function after lung surgery: Is a single intercostal nerve block plus patient-controlled intravenous morphine as effective as patient-controlled epidural anaesthesia? A randomized non-inferiority clinical trial. Br J Anaesth 2011;106:580-9.
34. Rice DC, Cata JP, Mena GE, Rodriguez-Restrepo A, Correa AM, Mehran RJ. Posterior intercostal nerve block with liposomal bupivacaine: An alternative to thoracic epidural analgesia. Ann Thorac Surg 2015;99:1953-60.
35. Debreceni G, Molnár Z, Szélig L, Molnár TF. Continuous epidural or intercostal analgesia following thoracotomy: A prospective randomized double-blind clinical trial. Acta Anaesthesiol Scand 2003;47:1091-5.
36. Sabanathan S, Smith PJ, Pradhan GN, Hashimi H, Eng JB, Mearns AJ. Continuous intercostal nerve block for pain relief after thoracotomy. Ann Thorac Surg 1988;46:425-6.
37. Barak M, Iaroshevski D, Poppa E, Ben-Nun A, Katz Y. Low-volume interscalene brachial plexus block for post-thoracotomy shoulder pain. J Cardiothorac Vasc Anesth 2007;21:554-7.
38. Barak M, Ziser A, Katz Y. Thoracic epidural local anesthetics are ineffective in alleviating post-thoracotomy ipsilateral shoulder pain. J Cardiothorac Vasc Anesth 2004;18:458-60.
39. Danelli G, Berti M, Casati A, Bobbio A, Ghisi D, Mele R, et al. Ipsilateral shoulder pain after thoracotomy surgery: A prospective, randomized, double-blind, placebocontrolled evaluation of the effi cacy of infi ltrating the phrenic nerve with 0.2%wt/vol ropivacaine. Eur J Anaesthesiol 2007;24:596-601.
40. Martinez-Barenys C, Busquets J, de Castro PE, Garcia-Guasch R, Perez J, Fernandez E, et al. Randomized double-blind comparison of phrenic nerve infi ltration and suprascapular nerve block for ipsilateral shoulder pain after

Choudhury, et al.: Intercostal Nerve Block vs. Thoracic Epidural Analgesia
205 International Journal of Scientifi c Study | April 2016 | Vol 4 | Issue 1
How to cite this article: Choudhury D, Talukdar FA, Kundu R, Nath MP, Parua S. Can Intercostal Nerve Blockade be an Effective Alternative to Thoracic Epidural Analgesia for Acute Post-thoracotomy Pain Relief? Int J Sci Stud 2016;4(1):199-205.
Source of Support: Nil, Confl ict of Interest: None declared.
thoracic surgery. Eur J Cardiothorac Surg 2011;40:106-12.41. Pennefather SH, Akrofi ME, Kendall JB, Russell GN, Scawn ND.
Double-blind comparison of intrapleural saline and 0.25% bupivacaine for ipsilateral shoulder pain after thoracotomy in patients receiving thoracic epidural analgesia. Br J Anaesth 2005;94:234-8.
42. Saha S, Brish EL, Lowry AM, Boddu K. In select patients, ipsilateral
post-thoracotomy shoulder pain relieved by suprascapular nerve block. Am J Ther 2011;18:309-12.
43. Tan N, Agnew NM, Scawn ND, Pennefather SH, Chester M, Russell GN. Suprascapular nerve block for ipsilateral shoulder pain after thoracotomy with thoracic epidural analgesia: A double-blind comparison of 0.5% bupivacaine and 0.9% saline. Anesth Analg 2002;94:199-202.
206International Journal of Scientifi c Study | April 2016 | Vol 4 | Issue 1
Study of p53 in Cervical Intraepithelial Neoplasia and Carcinoma Cervix with Clinico-pathological CorrelationJasneet Kaur Sandhu1, S Shivakumar2
1Tutor, Department of Pathology, Mandya Institute of Medical Sciences, Mandya, Karnataka, India, 2Professor and Head, Department of Pathology, Mandya Institute of Medical Sciences, Mandya, Karnataka, India
examination of Pap smears, visual inspection techniques, and primary biomarkers such as human papillomavirus (HPV) DNA and secondary biomarkers such as p53, p50, and c-fos.1 The p53 was discovered, in 1979, using serologic and virologic approaches by various authors such as Chang et al., Kress et al., Lane and Crawford, Linzer and Levine, Meleo et al., and DeLeo et al. Normally, p53 is expressed in small amounts with a short half-life, and it controls the outgrowth of genetically damaged potentially neoplastic cells, either by causing pause in the cell cycle or by promoting apoptosis.2 The immunohistochemical (IHC) detection of p53 protein in cervical carcinoma may be caused due to p53 mutation or abnormal accumulation of inactivated p53 protein in the absence of gene mutation.3 Inactivation of p53 either by complexing with high-risk HPV E6 protein
INTRODUCTION
Cervical carcinoma is the second most common cancer in Indian women. Screening has been used as an effective method for identifying pre-neoplastic lesions early, thereby reducing mortality. The various strategies evaluated for the screening of cervical carcinoma are a cytological
Original Article
Abstract
Introduction: Cervical carcinomas are the third leading cause of mortality in women in developing countries. Various clinical, pathological, and molecular-based screening methodologies have been developed for early detection of cervical carcinoma.
Aim: The aim of this study was to determine the frequency and pattern of p53 expression in normal, cervical intraepithelial neoplasia (CIN), and invasive carcinoma with clinico-pathological correlation.
Methodology: A total of 30 cases of cervical biopsy/hysterectomy specimens of carcinoma cervix and 30 cases of hysterectomy specimens for other gynecologic causes received at the Department of Pathology, from January to December 2012 were examined for gross and microscopic features. Immunohistochemistry was used to study the p53 expression in normal and neoplastic cervical epithelium. The p53 expression was correlated with various clinico-pathological prognostic parameters.
Results: Of the 30 cases of carcinoma cervix, 86.7% of the cases showed p53 positivity. The normal cervical epithelium in 90% cases was p53 negative and other 10% showed basal layer positivity. The single case of CIN III showed p53 positive cells in all the layers of squamous epithelium. The p53 positivity showed a statistically signifi cant association with squamous cell carcinoma (SCC) histologic type (P = 0.044). One of the adenosquamous carcinoma and single adenocarcinoma case were p53 negative. Large cell keratinizing subtype of SCC showed higher p53 positivity than large cell non-keratinizing with no statistical signifi cance. The p53 positivity increased with the age, parity, clinical stage, and grade of the disease with no statistical signifi cance.
Conclusion: Our study indicates that p53 may be a used as an adjunct in differentiating CIN from invasive carcinoma. The p53 may be a predictor for poor prognosis as its expression increased with prognostic parameters such as histologic type, grade, and stage of carcinoma cervix.
Key words: Cervical carcinoma, Clinico-pathological prognostic parameters, Immunohistochemistry, p53
Access this article online
www.ijss-sn.com
Month of Submission : 02-2016Month of Peer Review : 03-2016Month of Acceptance : 03-2016Month of Publishing : 04-2016
Corresponding Author: Dr. Jasneet Kaur Sandhu, Department of Pathology, Mandya Institute of Medical Sciences, Mandya, Karnataka, India. Phone: +91-8123049947. E-mail: [email protected]
DOI: 10.17354/ijss/2016/218

Sandhu and Shivakumar: Frequency of p53 Expression in Cervical Carcinoma
207 International Journal of Scientifi c Study | April 2016 | Vol 4 | Issue 1
(in HPV-positive tumors) or mutation (in HPV-negative tumors) represents a key step in cervical carcinogenesis.4
An association between p53 protein accumulation and aggressive behavior of cervical carcinoma including a genetic propensity toward metastasis, and recurrence has been observed.5 It has also been suggested that p53 increased proportionally to the grade of intraepithelial neoplasia and invasive cervical carcinoma,6 thereby, played a role in the progression of the disease. Chemotherapeutic drugs may also be more effective against high-stage, p53-mutated cancers than earlier stage cancers.7
Gene sequencing, IHC analysis, and functional tests have been used to assess p53 function in human tissues. However, nuclear positivity of p53 by IHC is a rapid preliminary indicator of p53 status in tumors.
This study was undertaken to assess the presence and pattern of p53 immunoreactivity in normal cervical epithelium, intraepithelial cervical neoplasia, and invasive cervical carcinoma. We also explored the role of p53 as a potential biomarker by correlating p53 expression with clinico-pathological parameters.
METHODOLOGY
A prospective study was conducted from January 2012 to December 2012 in the Department of Pathology of a teaching hospital after taking permission from the Institutional Ethical Committee. It included a total of 60 cases, of which, 30 cases were cervical biopsy/hysterectomy specimens with the clinical diagnosis of cervical malignancy. The other 30 were hysterectomies done for non-neoplastic gynecologic reasons used to study normal cervical epithelium. Details of presenting complaints and FIGO staging were obtained from the patient records. The specimens were adequately fi xed in 10% neutral buffered formalin. Gross examination of the neoplastic specimens was done as per the protocol offered by Royal College of Pathologist dataset. The non-neoplastic hysterectomies were grossed using routine histopathology protocol. Representative bits were taken, routinely processed and paraffi n embedded. Sections of 5-6 μ thickness were stained with hematoxylin and eosin. The cases were evaluated for the presence of malignancy and the histologic subtype of the tumor as per the WHO classifi cation. The tumors were graded using modifi ed Broder’s grading,8 which is based on differentiation, nuclear pleomorphism, and mitotic fi gures. Squamous cell carcinoma was further subtyped according to Wentz and Reagen classifi cation into large cell non-keratinizing (LCNK), large cell keratinizing (LCK), and small cell type.8
All the 60 cases were subjected to IHC study for p53 using polymer based ready to use IHC kit of Biogenex. The p53 antibody was applied on 3-μ thick sections. Heat-induced epitope retrieval was performed using trisodium citrate buffer at pH of 6-6.2 followed by peroxidase block, incubation with primary antibody for 120 min and secondary antibody for 30 min. Diaminobenzidine was then added, and fi nally, slides were counterstained with hematoxylin. Positive and negative controls were used. Uterine cervix in non-neoplastic hysterectomies was used to study the expression of p53 in normal cervical epithelium.
Method of Assessment of p53 ExpressionNuclear staining either as coarse or fi ne granular brown dots was considered positive. The intensity of staining and p53 grade was assessed by semi-quantitative method (Tables 1 and 2).
The p53 score was obtained as the sum of intensity and grade of p53 positivity. The correlation of p53 expression with clinico-pathological parameters was done.
Plan of Statistical AnalysisThe collected data were entered into Excel sheet and analyzed using Epi Info software. Descriptive and analytical statistics (using Chi-square test) were applied to the data. The P < 0.05 was considered statistically signifi cant.
RESULTS
Among the 30 cases of neoplastic lesions, the patients’ age ranged from 31 to 70 years with a mean age of 48.4 years. All women in our study were married and had experienced childbirth. The mean parity was 3.5 with most (53.3%) women having parity of 3-5. There was equal
Table 1: Intensity of p53 staining9
Staining pattern IntensityAbsent 0Mild 1+Moderate 2+Severe 3+
Table 2: Grading of p53 staining9
Percentage of positive tumor cells in 10 HPF Grade1-5 16-25 226-50 351-75 4>75 5
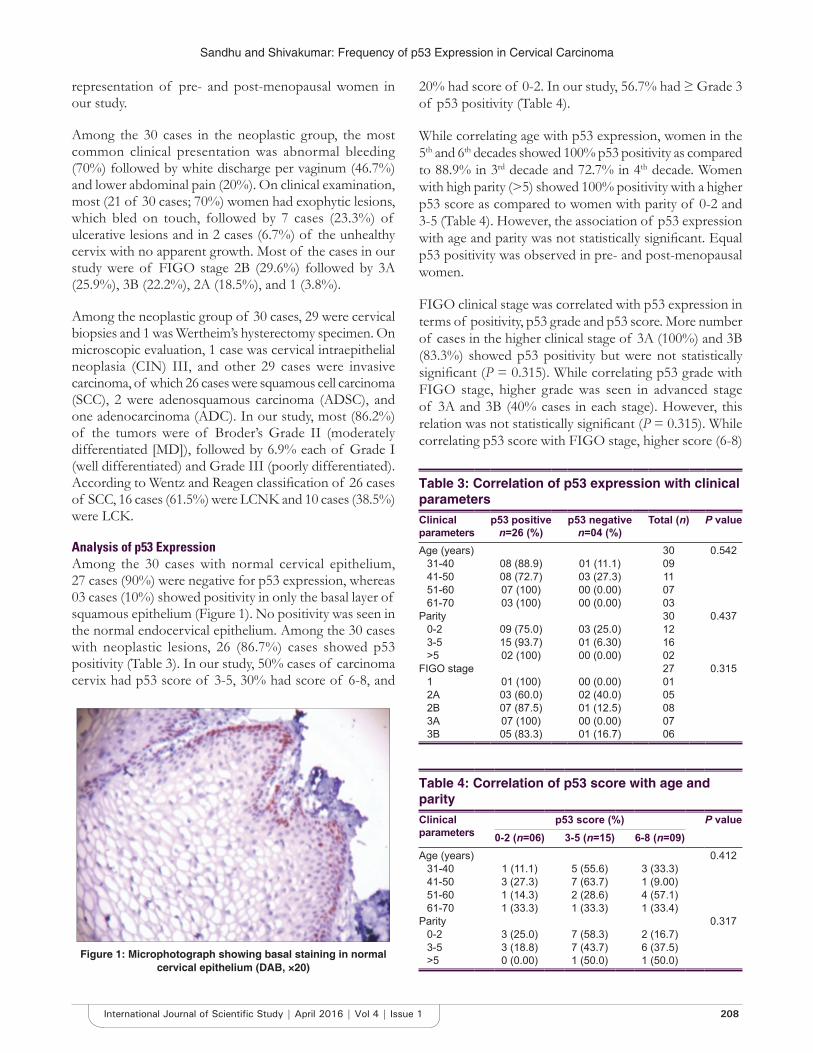
Sandhu and Shivakumar: Frequency of p53 Expression in Cervical Carcinoma
208International Journal of Scientifi c Study | April 2016 | Vol 4 | Issue 1
representation of pre- and post-menopausal women in our study.
Among the 30 cases in the neoplastic group, the most common clinical presentation was abnormal bleeding (70%) followed by white discharge per vaginum (46.7%) and lower abdominal pain (20%). On clinical examination, most (21 of 30 cases; 70%) women had exophytic lesions, which bled on touch, followed by 7 cases (23.3%) of ulcerative lesions and in 2 cases (6.7%) of the unhealthy cervix with no apparent growth. Most of the cases in our study were of FIGO stage 2B (29.6%) followed by 3A (25.9%), 3B (22.2%), 2A (18.5%), and 1 (3.8%).
Among the neoplastic group of 30 cases, 29 were cervical biopsies and 1 was Wertheim’s hysterectomy specimen. On microscopic evaluation, 1 case was cervical intraepithelial neoplasia (CIN) III, and other 29 cases were invasive carcinoma, of which 26 cases were squamous cell carcinoma (SCC), 2 were adenosquamous carcinoma (ADSC), and one adenocarcinoma (ADC). In our study, most (86.2%) of the tumors were of Broder’s Grade II (moderately differentiated [MD]), followed by 6.9% each of Grade I (well differentiated) and Grade III (poorly differentiated). According to Wentz and Reagen classifi cation of 26 cases of SCC, 16 cases (61.5%) were LCNK and 10 cases (38.5%) were LCK.
Analysis of p53 ExpressionAmong the 30 cases with normal cervical epithelium, 27 cases (90%) were negative for p53 expression, whereas 03 cases (10%) showed positivity in only the basal layer of squamous epithelium (Figure 1). No positivity was seen in the normal endocervical epithelium. Among the 30 cases with neoplastic lesions, 26 (86.7%) cases showed p53 positivity (Table 3). In our study, 50% cases of carcinoma cervix had p53 score of 3-5, 30% had score of 6-8, and
20% had score of 0-2. In our study, 56.7% had ≥ Grade 3 of p53 positivity (Table 4).
While correlating age with p53 expression, women in the 5th and 6th decades showed 100% p53 positivity as compared to 88.9% in 3rd decade and 72.7% in 4th decade. Women with high parity (>5) showed 100% positivity with a higher p53 score as compared to women with parity of 0-2 and 3-5 (Table 4). However, the association of p53 expression with age and parity was not statistically signifi cant. Equal p53 positivity was observed in pre- and post-menopausal women.
FIGO clinical stage was correlated with p53 expression in terms of positivity, p53 grade and p53 score. More number of cases in the higher clinical stage of 3A (100%) and 3B (83.3%) showed p53 positivity but were not statistically signifi cant (P = 0.315). While correlating p53 grade with FIGO stage, higher grade was seen in advanced stage of 3A and 3B (40% cases in each stage). However, this relation was not statistically signifi cant (P = 0.315). While correlating p53 score with FIGO stage, higher score (6-8)
Table 3: Correlation of p53 expression with clinical parametersClinical parameters
p53 positive n=26 (%)
p53 negative n=04 (%)
Total (n) P value
Age (years) 30 0.54231-40 08 (88.9) 01 (11.1) 0941-50 08 (72.7) 03 (27.3) 1151-60 07 (100) 00 (0.00) 0761-70 03 (100) 00 (0.00) 03
Parity 30 0.4370-2 09 (75.0) 03 (25.0) 123-5 15 (93.7) 01 (6.30) 16>5 02 (100) 00 (0.00) 02
FIGO stage 27 0.3151 01 (100) 00 (0.00) 012A 03 (60.0) 02 (40.0) 052B 07 (87.5) 01 (12.5) 083A 07 (100) 00 (0.00) 073B 05 (83.3) 01 (16.7) 06
Table 4: Correlation of p53 score with age and parityClinical parameters
p53 score (%) P value0-2 (n=06) 3-5 (n=15) 6-8 (n=09)
Age (years) 0.41231-40 1 (11.1) 5 (55.6) 3 (33.3)41-50 3 (27.3) 7 (63.7) 1 (9.00)51-60 1 (14.3) 2 (28.6) 4 (57.1)61-70 1 (33.3) 1 (33.3) 1 (33.4)
Parity 0.3170-2 3 (25.0) 7 (58.3) 2 (16.7)3-5 3 (18.8) 7 (43.7) 6 (37.5)>5 0 (0.00) 1 (50.0) 1 (50.0)Figure 1: Microphotograph showing basal staining in normal
cervical epithelium (DAB, ×20)
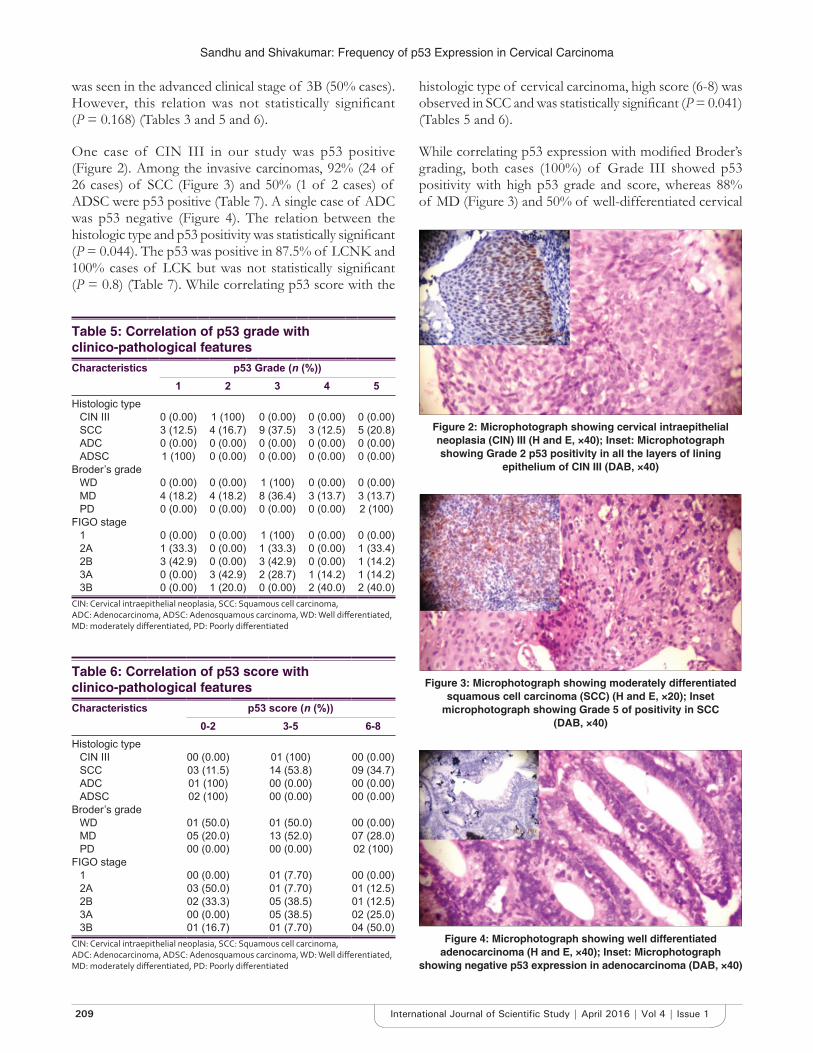
Sandhu and Shivakumar: Frequency of p53 Expression in Cervical Carcinoma
209 International Journal of Scientifi c Study | April 2016 | Vol 4 | Issue 1
was seen in the advanced clinical stage of 3B (50% cases). However, this relation was not statistically signifi cant (P = 0.168) (Tables 3 and 5 and 6).
One case of CIN III in our study was p53 positive (Figure 2). Among the invasive carcinomas, 92% (24 of 26 cases) of SCC (Figure 3) and 50% (1 of 2 cases) of ADSC were p53 positive (Table 7). A single case of ADC was p53 negative (Figure 4). The relation between the histologic type and p53 positivity was statistically signifi cant (P = 0.044). The p53 was positive in 87.5% of LCNK and 100% cases of LCK but was not statistically signifi cant (P = 0.8) (Table 7). While correlating p53 score with the
histologic type of cervical carcinoma, high score (6-8) was observed in SCC and was statistically signifi cant (P = 0.041) (Tables 5 and 6).
While correlating p53 expression with modifi ed Broder’s grading, both cases (100%) of Grade III showed p53 positivity with high p53 grade and score, whereas 88% of MD (Figure 3) and 50% of well-differentiated cervical
Table 5: Correlation of p53 grade with clinico-pathological featuresCharacteristics p53 Grade (n (%))
1 2 3 4 5 Histologic type
CIN III 0 (0.00) 1 (100) 0 (0.00) 0 (0.00) 0 (0.00)SCC 3 (12.5) 4 (16.7) 9 (37.5) 3 (12.5) 5 (20.8)ADC 0 (0.00) 0 (0.00) 0 (0.00) 0 (0.00) 0 (0.00)ADSC 1 (100) 0 (0.00) 0 (0.00) 0 (0.00) 0 (0.00)
Broder’s gradeWD 0 (0.00) 0 (0.00) 1 (100) 0 (0.00) 0 (0.00)MD 4 (18.2) 4 (18.2) 8 (36.4) 3 (13.7) 3 (13.7)PD 0 (0.00) 0 (0.00) 0 (0.00) 0 (0.00) 2 (100)
FIGO stage1 0 (0.00) 0 (0.00) 1 (100) 0 (0.00) 0 (0.00)2A 1 (33.3) 0 (0.00) 1 (33.3) 0 (0.00) 1 (33.4)2B 3 (42.9) 0 (0.00) 3 (42.9) 0 (0.00) 1 (14.2)3A 0 (0.00) 3 (42.9) 2 (28.7) 1 (14.2) 1 (14.2)3B 0 (0.00) 1 (20.0) 0 (0.00) 2 (40.0) 2 (40.0)
CIN: Cervical intraepithelial neoplasia, SCC: Squamous cell carcinoma, ADC: Adenocarcinoma, ADSC: Adenosquamous carcinoma, WD: Well diff erentiated, MD: moderately diff erentiated, PD: Poorly diff erentiated
Table 6: Correlation of p53 score with clinico-pathological featuresCharacteristics p53 score (n (%))
0-2 3-5 6-8Histologic type
CIN III 00 (0.00) 01 (100) 00 (0.00)SCC 03 (11.5) 14 (53.8) 09 (34.7)ADC 01 (100) 00 (0.00) 00 (0.00)ADSC 02 (100) 00 (0.00) 00 (0.00)
Broder’s gradeWD 01 (50.0) 01 (50.0) 00 (0.00)MD 05 (20.0) 13 (52.0) 07 (28.0)PD 00 (0.00) 00 (0.00) 02 (100)
FIGO stage1 00 (0.00) 01 (7.70) 00 (0.00)2A 03 (50.0) 01 (7.70) 01 (12.5)2B 02 (33.3) 05 (38.5) 01 (12.5)3A 00 (0.00) 05 (38.5) 02 (25.0)3B 01 (16.7) 01 (7.70) 04 (50.0)
CIN: Cervical intraepithelial neoplasia, SCC: Squamous cell carcinoma, ADC: Adenocarcinoma, ADSC: Adenosquamous carcinoma, WD: Well diff erentiated, MD: moderately diff erentiated, PD: Poorly diff erentiated
Figure 2: Microphotograph showing cervical intraepithelial neoplasia (CIN) III (H and E, ×40); Inset: Microphotograph showing Grade 2 p53 positivity in all the layers of lining
epithelium of CIN III (DAB, ×40)
Figure 3: Microphotograph showing moderately differentiated squamous cell carcinoma (SCC) (H and E, ×20); Inset
microphotograph showing Grade 5 of positivity in SCC (DAB, ×40)
Figure 4: Microphotograph showing well differentiated adenocarcinoma (H and E, ×40); Inset: Microphotograph
showing negative p53 expression in adenocarcinoma (DAB, ×40)

Sandhu and Shivakumar: Frequency of p53 Expression in Cervical Carcinoma
210International Journal of Scientifi c Study | April 2016 | Vol 4 | Issue 1
cancers showed p53 positivity (Tables 5-7). However, the relation between modifi ed Broder’s grade and p53 positivity (P = 0.419), p53 grade (P = 0.237), and p53 score (P = 0.301) was not statistically signifi cant.
DISCUSSION
Cervical carcinoma was the third leading cause of death in developing countries, with India accounting for 25% of these deaths in 2012.1 The expression of p53 may be combined with cervical cytology as a screening measure to detect precancerous lesions and reduce the mortality from cervical cancer.
In our study of 30 cases of cervical carcinoma, most were observed in elderly women with a mean age of 48.4 years. This fi nding was similar to studies done by Rajaram et al.9 (52.1 years), Tjalma et al.10 (52 years), Tan et al.11 (51.1 years), and Tan et al.12 (50.3 years). In our study, cervical carcinoma was seen in women with high parity with a mean of 3.5, similar to a study done by Rajaram et al.9 (5.23) in Delhi suggesting that in India, cervical carcinoma occurred in women with high parity. However, in the study done by Lindström et al.13 in Sweden, most of the cervical cancer patients had parity of 2.7. This difference could be attributed to the different sociodemographic profi le of the two populations. In our study, most (70%) patients presented with abnormal bleeding and on examination had exophytic growth (70%), similar to the study done by Rajaram et al.9 In the present study, most patients presented at a later stage of the disease, which has been the scenario in various other studies.10,13-15 SCC was the most common histologic type of cervical cancer encountered in our study, with most tumors being MD. These fi ndings were in concordance with study done by Win et al. (72.5%).14
The pathogenesis of cervical cancer is thought to occur through a multistep process involving HPV infection in more than 95% of the cases.9 The viral proteins E6/E7 of HPV functionally interfere with cell cycle control by inactivating tumor suppressor gene p53 and the retinoblastoma protein.16 Positive staining for p53 protein by IHC is considered to be abnormal and felt to be a poor prognostic predictor in many types of malignancies, although confl icting results are available in literature.3
In our study, 90% of the cases with normal squamous epithelium were negative for p53 similar to other studies.10,16,17 In the remaining 10% cases, the p53 positive nuclei were restricted to the basal layer only, similar to studies done by Vasilescu et al.16 and Hunt et al.18
In the present study, the incidence of p53 positivity in neoplastic lesions was 86.7%. In various studies, the range of nuclear p53 positivity in cervical carcinoma was observed to be 25.2-85.7%. Few studies12,14,19,20 have showed high p53 positivity similar to our study, whereas others21,22 have showed a lower positivity of p53 in cervical cancer (Table 8). The varying range in different studies could be attributed to the composition of the study population, different specimen fi xation techniques, and antigen retrieval methods.
The p53 expression increased with advancing age (88.9% in 3rd decade and 100% in 5th and 6th decade), similar to study done by Madhumati et al.6 Increased p53 positivity was seen in women with high parity (93.7% in parity of 3-5 and 100% in parity of >5); however, it was not statistically signifi cant (Table 3). Grade of p53 positivity increased with advancing clinical stage with Grade 5 positivity in 4 of 5 cases of 3B (Table 5), similar to study done by Bahnassy.23 This increase may be due to increased abnormality in control of p53 expression or degradation or as a result of increased incidence of p53 mutation in later clinical stages.11
Table 7: p53 expression in various histologic types of cervical carcinomaHistopathological Characteristic
Number of cases
p53 positive (%)
p53 negative (%)
P value
Microscopic type n=30 n=26 n=04CIN III 01 01 (100) 00 (0.00) 0.044SCC 26 24 (92.3) 02 (7.70)ADSC 02 01 (50.0) 01 (50.0)ADC 01 00 (0.00) 01 (100)
Broder’s grade n=29 n=25 n=04I 02 01 (50.0) 01 (50.0) 0.419II 25 22 (88.0) 03 (12.0)III 02 02 (100) 00 (0.00)
Subtypes of SCC n=26 n=24 n=02LCNK 16 14 (87.5) 02 (12.5) 0.884LCK 10 10 (100) 00 (0.00)Small cell 00 00 (0.00) 00 (0.00)
CIN: Cervical intraepithelial neoplasia, SCC: Squamous cell carcinoma, ADC: Adenocarcinoma, ADSC: Adenosquamous carcinoma, LCK: Large cell keratinizing, LCNK: large cell non-keratinizing
Table 8: p53 incidence in various studiesStudy (year) p53 incidence (%)Oka et al.21 52.1Haenrgen et al.19 85.7Ngan et al.22 (2001) 25.2Tjalma et al.10 42.0Win et al.14 80.0Tan et al.12 76.0Tan et al.11 85.2Madhumati et al.6 45.5Baskaran et al.20 83.0Present study (2013) 86.7

Sandhu and Shivakumar: Frequency of p53 Expression in Cervical Carcinoma
211 International Journal of Scientifi c Study | April 2016 | Vol 4 | Issue 1
Bahnassy et al.23 in their study of 110 cases of SCC and CIN concluded that aberrations of p27, cyclin E, CDK4, and p16INK4A are early events in HPV 16 and 18 associated cervical carcinoma, whereas cyclin D1 and p53 pathway abnormalities are considered as late events. In contrast, Tjalma et al.10 observed higher p53 positivity in Stage 1A, 1B, and 2B, and Ikuta et al.17 observed that p53 expression was an indicator of unfavorable prognosis in Stage 1B of SCC. Vasilescu et al. in their study concluded that p53 was a prognostic factor for the aggressiveness of tumor when more that 30% positivity was seen in tumor nuclei.16
Our study had a single case of CIN III, which was p53 positive. Unlike normal cervical epithelium where p53 positivity was observed in the basal layer, in CIN III, the p53 positivity was present in all the layers of squamous epithelium (Figure 2). Jeffers et al.24 and Hunt et al.18 observed similar patterns in their studies. Tan et al. have observed similar fi ndings.11 In the studies done by Baskaran et al.20 and Bahnassy et al.,23 a gradual increase in p53 positivity was observed as the lesion progressed from CIN to ISCC. This fi nding was utilized by Singh et al.25 in cytology smears where they found that abnormal expression of p53 was noted in cervical dysplasia, and it increased with higher cytological grades. Madhumati et al.6 concluded in their study that p53 could be used as an important marker for low-grade CIN lesions showing high proliferative index and that p53 overexpression can be utilized as a marker to differentiate diffi cult cases of CIN III from microinvasive SCC.
While correlating histologic type with the p53 score (Table 6) and p53 positivity (Table 7), a statistically signifi cant association was observed in our study indicating that p53 positivity (92.3%) was predominantly seen in SCC. A similar pattern was observed in other studies.9,10,14 In our study, p53 positivity increased in grade and intensity with the increase in pleomorphism of the nuclei. In the present study, of the 26 cases of SCC, all cases of LCK and 87.5% of LCNK were p53 positive, similar to the study done by Carrilho et al.15 However, this was not statistically signifi cant. In a study done by Jiko et al., p53 mutations were seen in 32% ADC and the incidence of these mutations was higher in cases at advanced clinical stages and with high grades of nuclear and structural atypia.26 We had a single case of ADC cervix, and it was p53 negative (Figure 4). Although, in various studies low positivity has been seen in ADC, it is diffi cult for us to comment on p53 positivity pattern in ADC due to fewer cases of this histologic type in our study. In our study, p53 positivity increased as the Broder’s grade worsened (Tables 6 and 7), similar to various other studies.10,16 However, this was not statistically signifi cant (P = 0.419) (Table 7).
The aim of this study was to evaluate p53 as a potential biological marker that has been previously investigated for prognostic information in cervical cancer, and it covers a variety of major functions in cervical carcinogenesis. The positive correlation of p53 expression with well-established prognostic factors such as lymphovascular invasion and FIGO stage in cervical cancer has been demonstrated in various studies in the past.23 Few studies have also showed that p53 accumulation in the tumor was associated with shorter overall patient survival.10 In our study, p53 positivity increased with age, clinical stage, SCC histologic type, and higher tumor grade. The pattern of positivity was different in normal cervical epithelium, CIN, and invasive SCC with increase in p53 grade and score. This observation could be used to advocate the use of p53 as a screening and prognostic biomarker in cervical carcinoma.
In future, studies with a larger sample size representative of all histologic categories could be performed to evaluate the correlation of p53 positivity with clinico-pathological parameters, prognosis and response to therapy in Indian patients with CIN and invasive cervical carcinomas.
CONCLUSION
In our study, we observed that p53 expression was associated with SCC in statistically signifi cant manner. Owing to its different pattern of positivity in normal and pre-neoplastic cervical epithelium, p53 could be used as a diagnostic biomarker to correctly diagnose and categorize CIN lesions. The p53 expression could also be used to differentiate CIN III from SCC in diffi cult situations. Furthermore, p53 grade and p53 score could be used as an adjunct to histological prognostic parameters in assessing the degree of pleomorphism and thus, biological behavior of the tumor.
REFERENCES
1. American Cancer Society. Global Cancer Facts & Figures. 3rd ed. Atlanta: American Cancer Society; 2015.
2. Soussi T. The TP53 2016. Available from: http://www.p53.free.fr/index.html. [Last accessed on 2016 Feb 27].
3. Khunamornpong S, Siriaunkgul S, Manusirivithaya S, Settakorn J, Srisomboon J, Ponjaroen J, et al. Prognostic value of p53 expression in early stage cervical carcinoma treated by surgery. Asian Pac J Cancer Prev 2008;9:48-52.
4. Anwar K, Nakakuki K, Imai H, Shiraishi T, Inuzuka M. Infection of human papillomavirus (HPV) and p53 over-expression in human female genital tract carcinoma. J Pak Med Assoc 1996;46:220-4.
5. Ishikawa H, Mitsuhashi N, Sakurai H, Maebayashi K, Niibe H. The effects of p53 status and human papillomavirus infection on the clinical outcome of patients with stage IIIB cervical carcinoma treated with radiation therapy alone. Cancer 2001;91:80-9.
6. Madhumati G, Kavita S, Anju M, Uma S, Raj M. Immunohistochemical Expression of Cell Proliferating Nuclear Antigen (PCNA) and p53 Protein in Cervical Cancer. J Obstet Gynaecol India 2012;62:557-61.
Sandhu and Shivakumar: Frequency of p53 Expression in Cervical Carcinoma
212International Journal of Scientifi c Study | April 2016 | Vol 4 | Issue 1
How to cite this article: Sandhu JK, Shivakumar S. Study of p53 in Cervical Intraepithelial Neoplasia and Carcinoma Cervix with Clinico-pathological Correlation. Int J Sci Stud 2016;4(1):206-212.
Source of Support: Nil, Confl ict of Interest: None declared.
7. Koivusalo R, Hietanen S. The cytotoxicity of chemotherapy drugs varies in cervical cancer cells depending on the p53 status. Cancer Biol Ther 2004;3:1177-83.
8. Ng AB, Atkin NB. Histological cell type and DNA value in the prognosis of squamous cell cancer of uterine cervix. Br J Cancer 1973;28:322-31.
9. Rajaram S, Gupta G, Agarwal S, Goel N, Singh KC. High-risk human papillomavirus, tumour suppressor protein p53 and mitomycin-c in invasive squamous cell carcinoma cervix. Indian J Cancer 2006;43:156.
10. Tjalma WA, Weyler JJ, Bogers JJ, Pollefl iet C, Baay M, Goovaerts GC, et al. The importance of biological factors (bcl-2, bax, p53, PCNA, MI, HPV and angiogenesis) in invasive cervical cancer. Eur J Obstet Gynecol Reprod Biol 2001;97:223-30.
11. Tan GC, Sharifah NA, Shiran MS, Salwati S, Hatta AZ, Paul-Ng HO. Utility of Ki-67 and p53 in distinguishing cervical intraepithelial neoplasia 3 from squamous cell carcinoma of the cervix. Asian Pac J Cancer Prev 2008;9:781-4.
12. Tan GC, Sharifah NA, Salwati S, Shiran MS, Hattaa AZ, Ng HO. Immunohistochemical study of p53 expression in premalignant and malignant cervical neoplasms. Med Health 2007;2:125-32.
13. Lindström AK, Tot T, Stendahl U, Syrjänen S, Syrjänen K, Hellberg D. Discrepancies in expression and prognostic value of tumor markers in adenocarcinoma and squamous cell carcinoma in cervical cancer. Anticancer Res 2009;29:2577-8.
14. Win N, Thu TM, Tun AN, Aye TT, Soe S, Nyunt K, et al. p53 expression in carcinoma cervix. Myanmar Med J 2004;48:1-4.
15. Carrilho C, Gouveia P, Cantel M, Alberto M, Buane L, David L. Characterization of human papillomavirus infection, P53 and Ki-67 expression in cervix cancer of Mozambican women. Pathol Res Pract 2003;199:303-11.
16. Vasilescu F, Ceausu M, Tanase C, Stanculescu R, Vladescu T, Ceausu Z. P53, p63 and Ki-67 assessment in HPV-induced cervical neoplasia. Rom J Morphol Embryol 2009;50:357-61.
17. Ikuta A, Saito J, Mizokami T, Nakamoto T, Yasuhara M, Nagata F, et al.
Correlation p53 expression and human papilloma virus deoxyribonucleic acid with clinical outcome in early uterine cervical carcinoma. Cancer Detect Prev 2005;29:528-36.
18. Hunt CR, Hale RJ, Buckley CH, Hunt J. p53 expression in carcinoma of the cervix. J Clin Pathol 1996;49:971-4.
19. Haenrgen G, Krause U, Becker A, Stadler P, Lantenschlarger C, Wohlrab W, et al. Tumour hypoxia, p53 and prognosis in cervical carcinoma. Int J Radiat Oncol Biol Phys 2001;50:865-72.
20. Baskaran K, Karunanithi S, Sivakamasundari I, Sundresh NJ, Thamaraiselvi B, Swaruparani S. Overexpression of p53 and its role as early biomarker in carcinoma of uterine cervix. Int J Res Pharm Sci 2013;4:198-202.
21. Oka K, Suzuki Y, Nakano T. Expression of p27 and p53 in cervical squamous cell carcinoma patients treated with radiotherapy alone: Radiotherapeutic effect and prognosis. Cancer 2000;88:2766-73.
22. Ngan HY, Cheung AN, Liu SS, Cheng DK, Ng TY, Wong LC. Abnormal expression of pan-ras, c-myc and tp53 in squamous cell carcinoma of cervix: Correlation with HPV and prognosis. Oncol Rep 2001;8:557-61.
23. Bahnassy AA, Zekri AR, Saleh M, Lotayef M, Moneir M, Shawki O. The possible role of cell cycle regulators in multistep process of HPV-associated cervical carcinoma. BMC Clin Pathol 2007;7:4.
24. Jeffers MD, Richmond J, Farquharson M, McNicol AM. p53 immunoreactivity in cervical intraepithelial neoplasia and non-neoplastic cervical squamous epithelium. J Clin Pathol 1994;47:1073-6.
25. Singh M, Srivastava S, Singh U, Mathur N, Shukla Y. Coexpression of p53 and Bcl-2 proteins in human papilloma virus-induced premalignant lesions of the uterine cervix: Correlation with progression to malignancy. Tumour Biol 2009;30:276-85.
26. Jiko K, Tsuda H, Sato S, Hirohashi S. Pathogenetic signifi cance of p53 and c-Ki-ras gene mutations and human papillomavirus DNA integration in adenocarcinoma of the uterine cervix and uterine isthmus. Int J Cancer 1994;59:601-6.

213 International Journal of Scientifi c Study | April 2016 | Vol 4 | Issue 1
Incisal Show – A Decrease with an Increase in Lines of LifeS Padmasree1, Bhanu Rekha1, S Rajesh2, A Ranukumari3
1Post-graduate Student, Department of Prosthodontics and Implantology, Mahatma Gandhi Postgraduate Institute of Dental Sciences, Puducherry, India, 2Assistant Professor, Department of Prosthodontics and Implantology, Mahatma Gandhi Postgraduate Institute of Dental Sciences, Puducherry, India, 3Professor, Head of Department, Department of Prosthodontics and Implantology, Mahatma Gandhi Postgraduate Institute of Dental Sciences, Puducherry, India
to the curvature of the lower lip. These factors are quite important in dentures. Tooth placement is very likely the greatest contributor to the denture look. The denture look is “that typical facial appearance common to most denture wearers.”2,3
Pound advices placing the teeth back in the original position from which they arose. A great many others have accepted this philosophy, and it is widely advocated in the modern prosthodontic literature. Prothero, Nicholas, Sears, Landa, Schlosser and Gehl and Allen instructed to position the upper central incisor vertically so that 0-2 mm of the incisal edge is visible below the upper lip. However, an attempt to create a more youthful appearance will appear inharmonious with the skin and facial structures for variations in age and will produce a displacing factor in that the denture will be out of balance between the tongue and labial musculature.4,5
INTRODUCTION
Facial appearance is an important factor in many cultures, and the mouth and teeth in particular are major factors determining our perceptions of emotion and facial attractiveness.1 According to Sarver, the smile arc is defi ned as the relationship of the curvature of the incisal edges of the maxillary incisors and canines to the curvature of the lower lip in the posed smile. The ideal smile arc has the maxillary incisal edge curvature parallel
Original Article
Abstract
Introduction: Older subjects usually show less of their upper incisors and more of their lower incisors than younger subjects.
Objective: To determine upper and lower central incisor crowns visibility with variability in age and length of lips at rest in Pondicherry subjects.
Materials and Methods: A total of 96 random voluntary subjects were chosen and divided into 3 groups. Group 1, 20-40 years of age; Group 2, 41-60 years of age; Group 3, 61 years of age and older. Each group contained 32 subjects. The vertical display of the incisors was measured in millimeters from the midpoints of the incisal edges of the upper and lower central incisors to the borders of the upper and lower lips, respectively, by two methods – manual measurement using vernier caliper and the other using standardized photographic method.
Results: The mean maxillary incisor display of Group 1 was 3.33 mm, Group 2 was 2.83 mm, and Group 3 was 1.21 mm and that for mandibular central incisor visibility for Group 1 was 0.17 mm, Group 2 was 0.25 mm, and Group 3 was 1.63 mm. For an increase in lip length from 19 to 22 mm, there was an average decrease of maxillary incisal visibility by 0.2 mm.
Conclusions: There was a decrease in the maxillary and an increase in mandibular incisor visibility as the age progresses. Maxillary incisor visibility also decreased as there was an increase in the lip length. No signifi cant difference was there according to sex.
Key words: Lip length, Mandibular incisal visibility, Maxillary incisal visibility, Photographs, Vernier caliper
Access this article online
www.ijss-sn.com
Month of Submission : 02-2016Month of Peer Review : 03-2016Month of Acceptance : 04-2016Month of Publishing : 04-2016
Corresponding Author: Dr. S Padmasree, Department of Prosthodontics and Implantology, Mahatma Gandhi Postgraduate Institute of Dental Sciences, Puducherry, India. Phone: +91-9629536395. E-mail: [email protected]
DOI: 10.17354/ijss/2016/219

Padmasree, et al.: Incisal Show
214International Journal of Scientifi c Study | April 2016 | Vol 4 | Issue 1
Esthetics has become increasingly important in the practice of modern dentistry and is synonymous with a natural harmonious appearance. Esthetics or display zone according to Sachdeva et al. is composed of the size, shape, position, and color of the displayed tooth, gingival contour, buccal corridor, and framing of the lips. Lip position and the amount of tooth display during smile and speech are important in prosthodontics. Therefore, the study was done to evaluate the age-related changes of maxillary and mandibular incisor display related to upper lip length at rest.6
The aim of the study was to investigate the degree of visibility of maxillary and mandibular central incisor according to age and lip length. The objective was to study the incisal display and lip length.
• By direct manual methods using a vernier caliper (Figure 1).
• By photographs using J-ruler software (Figure 2).
MATERIALS AND METHODS
This study was conducted in the Department of Prosthodontics, Mahatma Gandhi Postgraduate Institute of Dental Sciences, Puducherry. A sample size of 96 was used for different age groups (Table 1).
Exclusion Criteria• Missing anterior teeth• Traumatized lips
• Extreme attrition• Mobile or extruded anterior teeth• Prosthetic anterior teeth replacements• Uncooperative individuals.
Measurements of incisor display were obtained with the lips at rest and mandibular posture unstrained. The following procedure was used: Subjects were asked to sit in front of the examiner in an upright posture with their heads in the natural head position or the esthetic position. The natural head position is defi ned “as the position of the head in a standing up or an erect sitting individual, with his visual axis oriented horizontally.”7
The patients were then instructed to wet their lips with their tongues, open their mouths gently, swallow and articulate the word “Emma.” Each subject’s posture was checked twice to ensure that the lips were at rest and the teeth slightly apart. The amounts of upper and lower central incisor crowns displayed were then measured with a vernier caliper from the midpoints of the incisal edges of right upper central incisors to the lower border of the upper lip and from the midpoints of both lower central incisors to the upper border of the lower lip (Figures 3 and 4). When an incisor could not be seen, the measurement was considered to be zero.
For the photographic method, photographs were taken with the patient in the same position using a single lens refl ex camera (Camera Details - Canon 5D Mark II of 24 pixel resolution and with a lens zoom of 24-105 mm using two photopro 23 photographic umbrella lights with 500 W) (Figure 5).
Methods of Standardization• Distance from the camera to eye level of the patient
is standardized to 5 ft• All patients were made to sit with the natural head
position
Figure 1: Vernier caliper Figure 2: Photographic set up
Table 1: Sample sizeAge group Sample size20-40 years 3241-60 years 32>60 years 32Total sample size 96
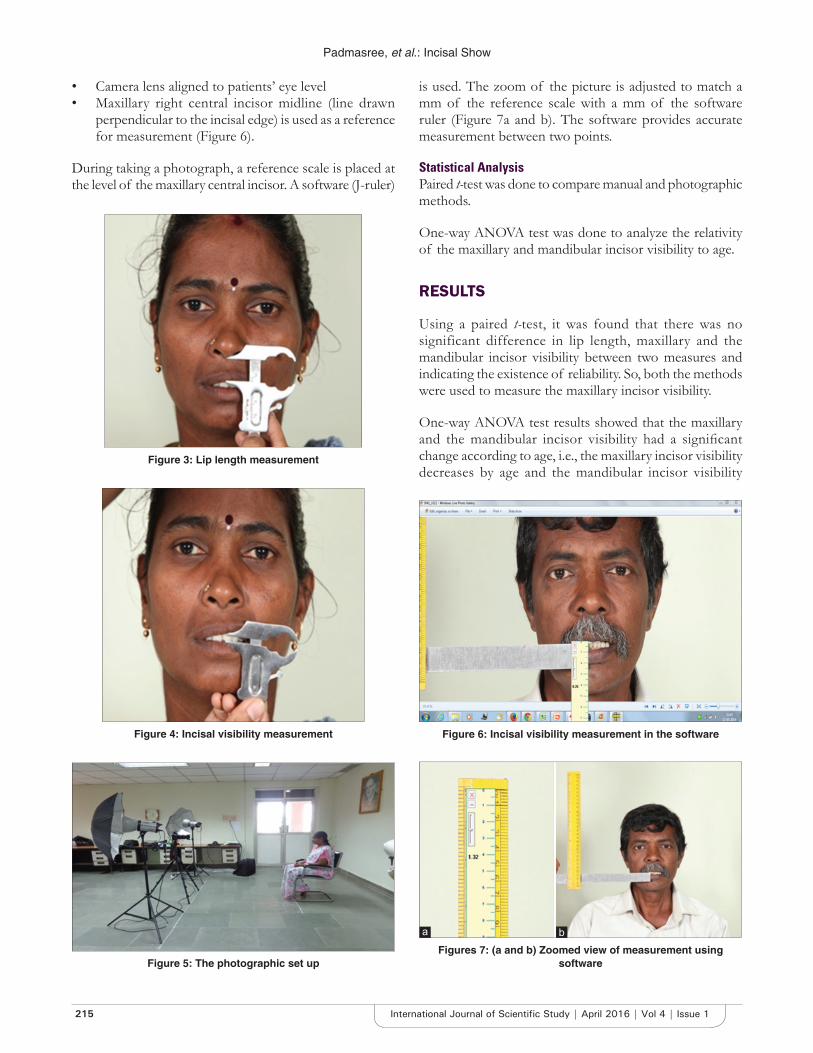
Padmasree, et al.: Incisal Show
215 International Journal of Scientifi c Study | April 2016 | Vol 4 | Issue 1
• Camera lens aligned to patients’ eye level• Maxillary right central incisor midline (line drawn
perpendicular to the incisal edge) is used as a reference for measurement (Figure 6).
During taking a photograph, a reference scale is placed at the level of the maxillary central incisor. A software (J-ruler)
is used. The zoom of the picture is adjusted to match a mm of the reference scale with a mm of the software ruler (Figure 7a and b). The software provides accurate measurement between two points.
Statistical AnalysisPaired t-test was done to compare manual and photographic methods.
One-way ANOVA test was done to analyze the relativity of the maxillary and mandibular incisor visibility to age.
RESULTS
Using a paired t-test, it was found that there was no significant difference in lip length, maxillary and the mandibular incisor visibility between two measures and indicating the existence of reliability. So, both the methods were used to measure the maxillary incisor visibility.
One-way ANOVA test results showed that the maxillary and the mandibular incisor visibility had a signifi cant change according to age, i.e., the maxillary incisor visibility decreases by age and the mandibular incisor visibility
Figure 3: Lip length measurement
Figure 4: Incisal visibility measurement
Figure 5: The photographic set up
Figure 6: Incisal visibility measurement in the software
Figures 7: (a and b) Zoomed view of measurement using software
ba
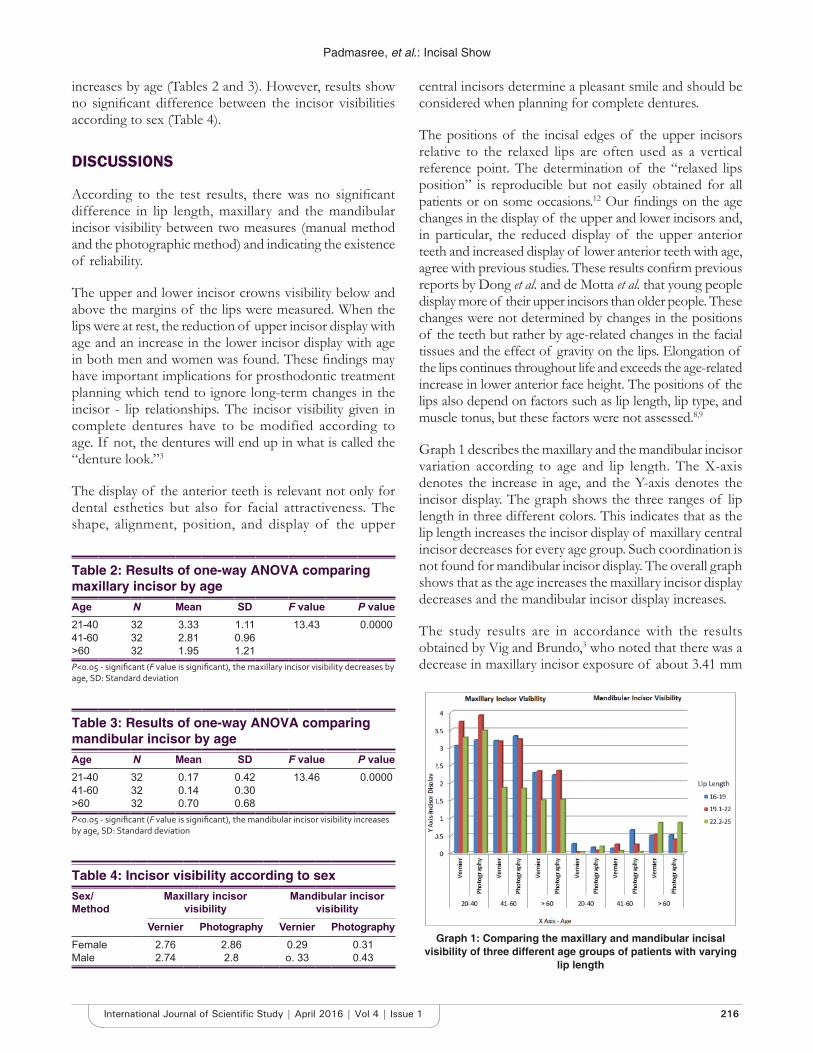
Padmasree, et al.: Incisal Show
216International Journal of Scientifi c Study | April 2016 | Vol 4 | Issue 1
increases by age (Tables 2 and 3). However, results show no signifi cant difference between the incisor visibilities according to sex (Table 4).
DISCUSSIONS
According to the test results, there was no signifi cant difference in lip length, maxillary and the mandibular incisor visibility between two measures (manual method and the photographic method) and indicating the existence of reliability.
The upper and lower incisor crowns visibility below and above the margins of the lips were measured. When the lips were at rest, the reduction of upper incisor display with age and an increase in the lower incisor display with age in both men and women was found. These fi ndings may have important implications for prosthodontic treatment planning which tend to ignore long-term changes in the incisor - lip relationships. The incisor visibility given in complete dentures have to be modified according to age. If not, the dentures will end up in what is called the “denture look.”3
The display of the anterior teeth is relevant not only for dental esthetics but also for facial attractiveness. The shape, alignment, position, and display of the upper
central incisors determine a pleasant smile and should be considered when planning for complete dentures.
The positions of the incisal edges of the upper incisors relative to the relaxed lips are often used as a vertical reference point. The determination of the “relaxed lips position” is reproducible but not easily obtained for all patients or on some occasions.12 Our fi ndings on the age changes in the display of the upper and lower incisors and, in particular, the reduced display of the upper anterior teeth and increased display of lower anterior teeth with age, agree with previous studies. These results confi rm previous reports by Dong et al. and de Motta et al. that young people display more of their upper incisors than older people. These changes were not determined by changes in the positions of the teeth but rather by age-related changes in the facial tissues and the effect of gravity on the lips. Elongation of the lips continues throughout life and exceeds the age-related increase in lower anterior face height. The positions of the lips also depend on factors such as lip length, lip type, and muscle tonus, but these factors were not assessed.8,9
Graph 1 describes the maxillary and the mandibular incisor variation according to age and lip length. The X-axis denotes the increase in age, and the Y-axis denotes the incisor display. The graph shows the three ranges of lip length in three different colors. This indicates that as the lip length increases the incisor display of maxillary central incisor decreases for every age group. Such coordination is not found for mandibular incisor display. The overall graph shows that as the age increases the maxillary incisor display decreases and the mandibular incisor display increases.
The study results are in accordance with the results obtained by Vig and Brundo,3 who noted that there was a decrease in maxillary incisor exposure of about 3.41 mm
Table 2: Results of one-way ANOVA comparing maxillary incisor by ageAge N Mean SD F value P value21-40 32 3.33 1.11 13.43 0.000041-60 32 2.81 0.96>60 32 1.95 1.21P<0.05 - signifi cant (F value is signifi cant), the maxillary incisor visibility decreases by age, SD: Standard deviation
Table 3: Results of one-way ANOVA comparing mandibular incisor by ageAge N Mean SD F value P value21-40 32 0.17 0.42 13.46 0.000041-60 32 0.14 0.30>60 32 0.70 0.68P<0.05 - signifi cant (F value is signifi cant), the mandibular incisor visibility increases by age, SD: Standard deviation
Graph 1: Comparing the maxillary and mandibular incisal visibility of three different age groups of patients with varying
lip length
Table 4: Incisor visibility according to sexSex/Method
Maxillary incisor visibility
Mandibular incisor visibility
Vernier Photography Vernier PhotographyFemale 2.76 2.86 0.29 0.31Male 2.74 2.8 o. 33 0.43
Padmasree, et al.: Incisal Show
217 International Journal of Scientifi c Study | April 2016 | Vol 4 | Issue 1
when compared with people of age group from 29 years to above 60 years. The fi ndings of Dong et al.8 were that there was a maxillary incisor display of about 2.5 mm at rest and 2 mm at smile when people of 20-29 and above 60 years are compared.
Age-related changes in incisor display can be underestimated if the sample includes subjects from a narrow age band. Subjects between 20 and 60+ years were used. It is important that incisor display is appropriate for the age of the patient. The prosthodontic literature typically recommends that artifi cial teeth are set up so that 2 mm of the central incisor crowns is visible when the lips are at rest, but patients who want a more youthful appearance will often ask for more of their incisor crowns to be visible.10 When the display of the anterior teeth is more in older individuals, artifi cial look is provided. To increase a natural appearance for the patients of age above 60 years, the maxillary incisal visibility can be reduced and mandibular incisal visibility can be increased, thus aiding in a better esthetics for the elderly.
The limitations of this study include the manual errors in making the measurements. To minimize these errors, two techniques of measuring the visibility is followed and both the techniques are found to give the same results. The study helps as a guide to determine the positioning of the incisors in cervico incisal direction. Any guidelines regarding the labiolingual positioning are not provided.
CONCLUSIONS
1. With increasing age, both genders showed less of their upper incisors and more of their lower incisors
2. No signifi cant difference in visibility according to gender
3. Signifi cant decrease in visibility according to lip length.
The present study concludes that the range of central incisor visibility varies according to age and lip length, and average values cannot be used as a guide for all cases in clinical practice. The average mandibular incisor visibility increases from 0.1 to 0.58 mm as age increases and maxillary incisor visibility decreases to less than 2 from 3.5 mm as age increases.
This study would guide in proper positioning of the incisors considering the age and lip length of the patients. The consequences of incorrect positioning of the maxillary central incisors in relation to the maxillary lip line include both obvious esthetic consequences and other more subtle problems including improper plane of occlusion and occlusal vertical dimension. The result of the present study can be used as a reference according to age, sex, and lip length of the patients to correctly position the maxillary and the mandibular anterior teeth in complete denture, removable and fi xed partial and implant supported prosthesis.11,13
ACKNOWLEDGMENTS
The authors would like to thank Mr Raja Chozhan, MPR stills for his technical sup port.
REFER ENCES
1. Rufenacht CR. Fundamentals of Esthetics. Chicago, IL: Quintessence Publication Co. Inc.; 1990. p. 73.
2. Frush JP, Fisher RD. How dentogenics interprets the personality factor. J Prosthet Dent 1965;67:441-9.
3. Al Wazzan KA. The visible portion of anterior teeth at rest. J Contemp Dent Pract 2004;5:53-62.
4. Vig RG, Brundo GC. The kinetics of anterior tooth display. J Prosthet Dent 1978;39:502-4.
5. Mack MR. Perspective of facial esthetics in dental treatment planning. J Prosthet Dent 1996;75:169-76.
6. Sachdeva K, Singla A, Mahajan V, Jaj HS, Negi A. Esthetic and smile characteristics at rest and during smiling. J Indian Orthod Soc 2012;46:17-25.
7. Silver C, Ferreira P. Frankfort plane vs. Natural head position in cephalometric diagnosis. Dent Med Probl 2003;40:129-34.
8. Dong JK, Jin TH, Cho HW, Oh SC. The esthetics of the smile: A review of some recent studies. Int J Prosthodont 1999;12:9-19.
9. da Motta AF, de Souza MM, Bolognese AM, Guerra CJ, Mucha JN. Display of the incisors as functions of age and gender. Aust Orthod J 2010;26:27-32.
10. Heartwell CM Jr, Rahn AO. Syllabus of Complete Denture. 4th ed. Philadelphia, Pennsylvania: Lea & Febiger; 1986.
11. Zarp GA, Bolender CL, Carlsson GE. Boucher’s Prosthodontic Treatment for Edentulous Patients. 11th ed. St. Louis, Missouri: Mosby; 1997.
12. Patel JR, Prajapati P, Sethuraman R, Naveen YG. A comparative evaluation of effect of upper lip length, age and sex on amount of exposure of maxillary anterior teeth. J Contemp Dent Pract 2011;12:24-9.
13. Al-Habahbeh R, Al-Shammout R, Al-Jabrah O, Al-Omari F. Tooth and gingival display in the anterior region at rest and during smiling of different age groups: A comparative study. J R Med Serv 2013;20:32.
How to cite this article: Padmasree S, Ranukumari A, Rajesh S. Incisal Show – A Decrease with an Increase in Lines of Life. Int J Sci Stud 2016;4(1):213-217.
Source of Support: Nil, Confl ict of Interest: None declared.
218International Journal of Scientifi c Study | April 2016 | Vol 4 | Issue 1
Laboratory Findings and Clinical Correlation in Assessing the Severity of Perinatal AsphyxiaDinakara Prithviraj1, Bharath Reddy2, Deepthi3, Abhijit Shetty3
1Associate Professor, Department of Pediatrics, Vydehi Institute of Medical Sciences, Bengaluru, Karnataka, India, 2Assistant Professor, Department of Pediatrics, Vydehi Institute of Medical Sciences, Bengaluru, Karnataka, India, 3Junior Resident, Department of Pediatrics, Vydehi Institute of Medical Sciences, Bengaluru, Karnataka, India
is a third most common cause of neonatal death (23%) after preterm birth (28%) and sepsis (26%). The asphyxial injury may involve virtually every organ system of the body, but hypoxic-ischemic encephalopathy (HIE) is the most common sequelae.1
HIE characterized mainly by abnormal muscle tone and refl exes, an altered level of consciousness, and commonly by convulsions is an outcome of perinatal asphyxia.2 HIE is a cause of death in newborns, and who survive are prone to serious neurological disorders such as cerebral palsy.2
Clinical ManifestationsNeonatal encephalopathy is defi ned as “A clinically defi ned syndrome of disturbed neurological function in the earliest
INTRODUCTION
Perinatal asphyxia is a condition wherein there is an impairment of transfer of the respiratory gasses resulting in hypoxemia and hypercapnia, accompanied by metabolic acidosis. The WHO defi nes perinatal asphyxia as “Failure to initiate or sustain breathing at birth.”1 Perinatal asphyxia
Original Article
Abstract
Introduction: Perinatal asphyxia contributes signifi cantly to neonatal morbidity and mortality.
Objective: The study was to done to investigate the predictive values of various biochemical markers, neurosonographic, and echocardiographic fi ndings in assessing the severity of perinatal asphyxia.
Materials and Methods: A prospective observational study conducted on babies admitted to the neonatal intensive care unit (NICU) during the period of January 2012 to January 2016 in Vydehi Institute of Medical Sciences and Research Centre, Bengaluru, Karnataka, India with perinatal asphyxia. About 80 babies were included in the study with perinatal asphyxia. The clinical and neurological examination was done for all the neonates included in the study. Blood samples for different systemic biomarkers were taken from all the babies within 15 min following their admission, then at 48 h and at 72 h of admission to the NICU. The patients with hypoxic-ischemic encephalopathy (HIE) were divided into three groups (Stage 1: Mild, Stage 2: Moderate, and Stage 3: Severe) according to the Sarnat and Sarnat staging system. The predictive values of these biochemical markers in determining the stage of HIE were assessed.
Results: Out of 80 babies included in the study 57.5% were male babies. The mean gestational age and birth weight were 39± 2.0 weeks and 2907 ± 420 g, respectively. The cesarean section rate was 38.75%. According to the classifi cation of Sarnat and Sarnat, 37 (46.25%) patients had Stage 1, 23 (28.75%) had Stage 2, and 20 (25%) had Stage 3 HIE. About 10 babies died during and after the study period. There was statistically signifi cant increase in cardiac markers (creatine kinase BB [CK-BB], troponin I, CK-BB), hepatic markers (alanine aminotransferase, prothrombin time/international normalized ratio) and increase in lactate in the cases of severe HIE stage.
Conclusion: HIE is the most severe manifestation of perinatal asphyxia which can be predicted by early laboratory evaluation of biomarkers so as that early treatment can be initiated.
Key words: Hypoxic-ischemic encephalopathy, Perinatal asphyxia, Sarnat and Sarnat staging
Access this article online
www.ijss-sn.com
Month of Submission : 02-2016Month of Peer Review : 03-2016Month of Acceptance : 03-2016Month of Publishing : 04-2016
Corresponding Author: Dr. Dinakara Prithviraj, Department of Pediatrics, Vydehi Institute of Medical Sciences, Bengaluru - 560 066, Karnataka, India. Phone: +91-9742274849. E-mail: [email protected]
DOI: 10.17354/ijss/2016/220

Prithviraj, et al.: Perinatal Asphyxia Laboratory and Clinical Correlation
219 International Journal of Scientifi c Study | April 2016 | Vol 4 | Issue 1
days of life in the term infant, manifested by diffi culty with initiating and maintaining respiration, depression of tone and refl exes, subnormal level of consciousness, and often by seizures.”3
Sarnat and Sarnat classified HIE into three clinical stages: Mild (Stage 1), moderate (Stage 2), and severe (Stage 3) encephalopathy. HIE infants have various levels of consciousness and the behavioral changes ranging from irritability to stupor or coma.4 In most cases, systemic hypoxia-ischemia results in multiorgan dysfunction. The lungs of asphyxiated newborns can be injured by hypoxia, as a result of inhaled meconium, secondary to cardiac dysfunction, or compromised due to pulmonary hypertension. Accordingly, gas exchange is impaired and assisted ventilation may be needed.4
The Apgar score is used to describe the newborn’s physical condition at birth. Any hypoxic insult may cause depression of the Apgar score. A prolonged depression of the Apgar score is associated with death or severe neurodevelopmental outcome.3 Hypoxia-ischemia causes direct damage to the myocardium reacted by the increase of cardiac enzymes.4 The other multisystem effects regard kidneys, liver, and bone marrow. Fluid retention and hyponatremia may occur due to inappropriate secretion of antidiuretic hormone.5 Bone marrow depression causes an increase in release of nucleated red blood cells (NRBC) and thrombocytopenia. Alteration in blood glucose levels may be observed, hypoglycemia being most common.4
DiagnosisClinical evaluation and laboratory values are used to assess and manage the asphyxiated babies. The best indicator for intrapartum asphyxia is severe metabolic acidosis (pH <7.0 and base defi cit ≥12 mmol/L) in umbilical cord arterial blood at delivery.6 Cranial and doppler ultrasonography, computerized tomography, and magnetic resonance imaging are the most used brain imaging techniques.
Biochemical MarkersNeonatal asphyxia causes multiorgan failure involving mainly the kidney, liver, brain, and heart which is associated with poor prognosis.6 The kidney is one of the most important organs commonly involved in the multiple organ dysfunction caused by perinatal asphyxia. Evaluations of blood urea and serum creatinine levels are the tests most frequently used to assess renal injury caused by perinatal asphyxia.6 Accordingly, markers of tubular dysfunction, such as urinary β2 microglobulin, have been found to be better indicators of early renal injury.8 Myocardial injury normally develops when this compensation
mechanism fails. Electrocardiogram, echocardiography, and measurement of cardiac enzymes are used to assess myocardial dysfunction.7
MATERIALS AND METHODS
A prospective observational study was conducted on babies admitted to the neonatal intensive care unit (NICU) from Vydehi Institute of Medical Sciences and Research Centre, Bengaluru, from January 2012 to January 2016 with perinatal asphyxia. During this 4-year period, we analyzed about 97 cases and as per our inclusion criteria of which 17 cases were excluded for various reasons. 80 neonates fulfi lling the following criteria were fi nally analyzed after approval from the Ethical Committee for the study and written consent from the parents.
Inclusion Criteria1. All newborns with perinatal asphyxia were included if at least one of the three were present:A. Intrapartum signs of fetal distress, as indicated by non-
reassuring non-stress test on continuous electronic fetal monitoring and by meconium staining of the amniotic fl uid
B. Apgar score of <1 at 1 min or <7 at 5 min of lifeC. The requirement of positive pressure ventilationD. Profound metabolic or mixed acidemia (pH < 7.10)
in an umbilical artery blood sample, if obtainedE. Mild, moderate, or severe HIE, as defi ned by Sarnat
and Sarnat staging.5
Exclusion Criteria1. Preterms with gestation <36 weeks or weight less than
1800 g,2. Major congenital malformation, chromosomal
abnormalities, or any metabolic disorders,3. Birth trauma,4. Septic shock,5. Neonates born to mothers who have received
magnesium sulfate or opioids within 4 h before delivery.
Babies included in the study as per criteria were studied for demographic details, such as gestational age, birth weight, and risk factors for perinatal asphyxia, were also recorded. Gestational age was assessed from last menstrual period and New Ballard score. Arterial blood gas (ABG) analysis was done from the umbilical arterial blood. Thorough clinical and neurological examination was done for all the neonates included in the study. Blood samples are taken from all the patients in these three groups within 15 min following their admission, then at 48 h and at 72 h of admission to the NICU. Blood samples are analyzed for
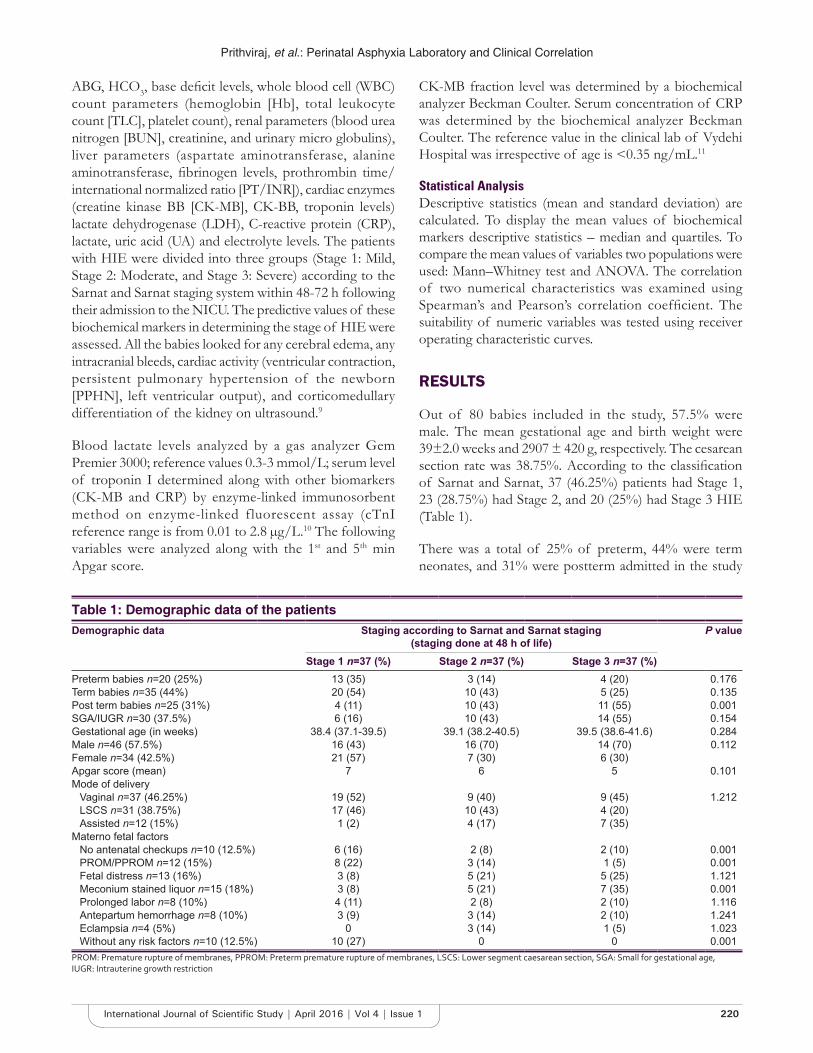
Prithviraj, et al.: Perinatal Asphyxia Laboratory and Clinical Correlation
220International Journal of Scientifi c Study | April 2016 | Vol 4 | Issue 1
ABG, HCO3, base defi cit levels, whole blood cell (WBC) count parameters (hemoglobin [Hb], total leukocyte count [TLC], platelet count), renal parameters (blood urea nitrogen [BUN], creatinine, and urinary micro globulins), liver parameters (aspartate aminotransferase, alanine aminotransferase, fi brinogen levels, prothrombin time/international normalized ratio [PT/INR]), cardiac enzymes (creatine kinase BB [CK-MB], CK-BB, troponin levels) lactate dehydrogenase (LDH), C-reactive protein (CRP), lactate, uric acid (UA) and electrolyte levels. The patients with HIE were divided into three groups (Stage 1: Mild, Stage 2: Moderate, and Stage 3: Severe) according to the Sarnat and Sarnat staging system within 48-72 h following their admission to the NICU. The predictive values of these biochemical markers in determining the stage of HIE were assessed. All the babies looked for any cerebral edema, any intracranial bleeds, cardiac activity (ventricular contraction, persistent pulmonary hypertension of the newborn [PPHN], left ventricular output), and corticomedullary differentiation of the kidney on ultrasound.9
Blood lactate levels analyzed by a gas analyzer Gem Premier 3000; reference values 0.3-3 mmol/L; serum level of troponin I determined along with other biomarkers (CK-MB and CRP) by enzyme-linked immunosorbent method on enzyme-linked fluorescent assay (cTnI reference range is from 0.01 to 2.8 μg/L.10 The following variables were analyzed along with the 1st and 5th min Apgar score.
CK-MB fraction level was determined by a biochemical analyzer Beckman Coulter. Serum concentration of CRP was determined by the biochemical analyzer Beckman Coulter. The reference value in the clinical lab of Vydehi Hospital was irrespective of age is <0.35 ng/mL.11
Statistical AnalysisDescriptive statistics (mean and standard deviation) are calculated. To display the mean values of biochemical markers descriptive statistics – median and quartiles. To compare the mean values of variables two populations were used: Mann–Whitney test and ANOVA. The correlation of two numerical characteristics was examined using Spearman’s and Pearson’s correlation coeffi cient. The suitability of numeric variables was tested using receiver operating characteristic curves.
RESULTS
Out of 80 babies included in the study, 57.5% were male. The mean gestational age and birth weight were 39±2.0 weeks and 2907 ± 420 g, respectively. The cesarean section rate was 38.75%. According to the classifi cation of Sarnat and Sarnat, 37 (46.25%) patients had Stage 1, 23 (28.75%) had Stage 2, and 20 (25%) had Stage 3 HIE (Table 1).
There was a total of 25% of preterm, 44% were term neonates, and 31% were postterm admitted in the study
Table 1: Demographic data of the patientsDemographic data Staging according to Sarnat and Sarnat staging
(staging done at 48 h of life)P value
Stage 1 n=37 (%) Stage 2 n=37 (%) Stage 3 n=37 (%)Preterm babies n=20 (25%) 13 (35) 3 (14) 4 (20) 0.176Term babies n=35 (44%) 20 (54) 10 (43) 5 (25) 0.135Post term babies n=25 (31%) 4 (11) 10 (43) 11 (55) 0.001SGA/IUGR n=30 (37.5%) 6 (16) 10 (43) 14 (55) 0.154Gestational age (in weeks) 38.4 (37.1-39.5) 39.1 (38.2-40.5) 39.5 (38.6-41.6) 0.284Male n=46 (57.5%) 16 (43) 16 (70) 14 (70) 0.112Female n=34 (42.5%) 21 (57) 7 (30) 6 (30)Apgar score (mean) 7 6 5 0.101Mode of delivery
Vaginal n=37 (46.25%) 19 (52) 9 (40) 9 (45) 1.212LSCS n=31 (38.75%) 17 (46) 10 (43) 4 (20)Assisted n=12 (15%) 1 (2) 4 (17) 7 (35)
Materno fetal factorsNo antenatal checkups n=10 (12.5%) 6 (16) 2 (8) 2 (10) 0.001PROM/PPROM n=12 (15%) 8 (22) 3 (14) 1 (5) 0.001Fetal distress n=13 (16%) 3 (8) 5 (21) 5 (25) 1.121Meconium stained liquor n=15 (18%) 3 (8) 5 (21) 7 (35) 0.001Prolonged labor n=8 (10%) 4 (11) 2 (8) 2 (10) 1.116Antepartum hemorrhage n=8 (10%) 3 (9) 3 (14) 2 (10) 1.241Eclampsia n=4 (5%) 0 3 (14) 1 (5) 1.023Without any risk factors n=10 (12.5%) 10 (27) 0 0 0.001
PROM: Premature rupture of membranes, PPROM: Preterm premature rupture of membranes, LSCS: Lower segment caesarean section, SGA: Small for gestational age, IUGR: Intrauterine growth restriction
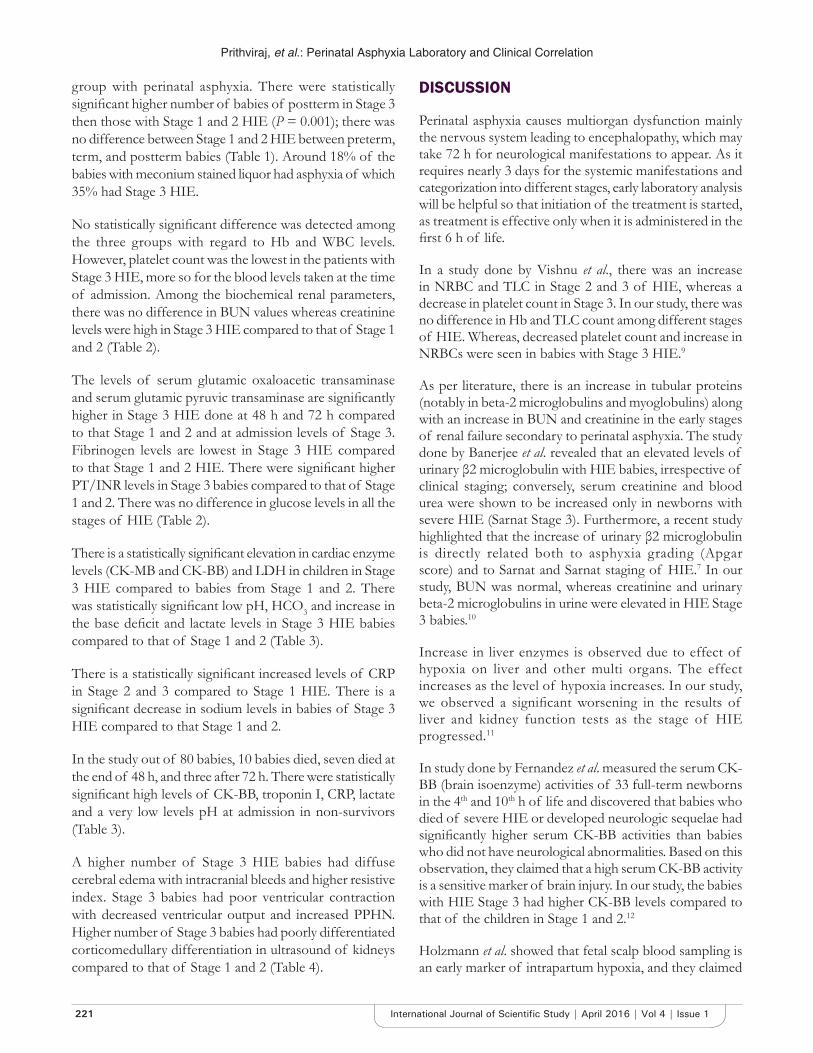
Prithviraj, et al.: Perinatal Asphyxia Laboratory and Clinical Correlation
221 International Journal of Scientifi c Study | April 2016 | Vol 4 | Issue 1
group with perinatal asphyxia. There were statistically signifi cant higher number of babies of postterm in Stage 3 then those with Stage 1 and 2 HIE (P = 0.001); there was no difference between Stage 1 and 2 HIE between preterm, term, and postterm babies (Table 1). Around 18% of the babies with meconium stained liquor had asphyxia of which 35% had Stage 3 HIE.
No statistically signifi cant difference was detected among the three groups with regard to Hb and WBC levels. However, platelet count was the lowest in the patients with Stage 3 HIE, more so for the blood levels taken at the time of admission. Among the biochemical renal parameters, there was no difference in BUN values whereas creatinine levels were high in Stage 3 HIE compared to that of Stage 1 and 2 (Table 2).
The levels of serum glutamic oxaloacetic transaminase and serum glutamic pyruvic transaminase are signifi cantly higher in Stage 3 HIE done at 48 h and 72 h compared to that Stage 1 and 2 and at admission levels of Stage 3. Fibrinogen levels are lowest in Stage 3 HIE compared to that Stage 1 and 2 HIE. There were signifi cant higher PT/INR levels in Stage 3 babies compared to that of Stage 1 and 2. There was no difference in glucose levels in all the stages of HIE (Table 2).
There is a statistically signifi cant elevation in cardiac enzyme levels (CK-MB and CK-BB) and LDH in children in Stage 3 HIE compared to babies from Stage 1 and 2. There was statistically signifi cant low pH, HCO3 and increase in the base defi cit and lactate levels in Stage 3 HIE babies compared to that of Stage 1 and 2 (Table 3).
There is a statistically signifi cant increased levels of CRP in Stage 2 and 3 compared to Stage 1 HIE. There is a signifi cant decrease in sodium levels in babies of Stage 3 HIE compared to that Stage 1 and 2.
In the study out of 80 babies, 10 babies died, seven died at the end of 48 h, and three after 72 h. There were statistically signifi cant high levels of CK-BB, troponin I, CRP, lactate and a very low levels pH at admission in non-survivors (Table 3).
A higher number of Stage 3 HIE babies had diffuse cerebral edema with intracranial bleeds and higher resistive index. Stage 3 babies had poor ventricular contraction with decreased ventricular output and increased PPHN. Higher number of Stage 3 babies had poorly differentiated corticomedullary differentiation in ultrasound of kidneys compared to that of Stage 1 and 2 (Table 4).
DISCUSSION
Perinatal asphyxia causes multiorgan dysfunction mainly the nervous system leading to encephalopathy, which may take 72 h for neurological manifestations to appear. As it requires nearly 3 days for the systemic manifestations and categorization into different stages, early laboratory analysis will be helpful so that initiation of the treatment is started, as treatment is effective only when it is administered in the fi rst 6 h of life.
In a study done by Vishnu et al., there was an increase in NRBC and TLC in Stage 2 and 3 of HIE, whereas a decrease in platelet count in Stage 3. In our study, there was no difference in Hb and TLC count among different stages of HIE. Whereas, decreased platelet count and increase in NRBCs were seen in babies with Stage 3 HIE.9
As per literature, there is an increase in tubular proteins (notably in beta-2 microglobulins and myoglobulins) along with an increase in BUN and creatinine in the early stages of renal failure secondary to perinatal asphyxia. The study done by Banerjee et al. revealed that an elevated levels of urinary β2 microglobulin with HIE babies, irrespective of clinical staging; conversely, serum creatinine and blood urea were shown to be increased only in newborns with severe HIE (Sarnat Stage 3). Furthermore, a recent study highlighted that the increase of urinary β2 microglobulin is directly related both to asphyxia grading (Apgar score) and to Sarnat and Sarnat staging of HIE.7 In our study, BUN was normal, whereas creatinine and urinary beta-2 microglobulins in urine were elevated in HIE Stage 3 babies.10
Increase in liver enzymes is observed due to effect of hypoxia on liver and other multi organs. The effect increases as the level of hypoxia increases. In our study, we observed a signifi cant worsening in the results of liver and kidney function tests as the stage of HIE progressed.11
In study done by Fernandez et al. measured the serum CK-BB (brain isoenzyme) activities of 33 full-term newborns in the 4th and 10th h of life and discovered that babies who died of severe HIE or developed neurologic sequelae had signifi cantly higher serum CK-BB activities than babies who did not have neurological abnormalities. Based on this observation, they claimed that a high serum CK-BB activity is a sensitive marker of brain injury. In our study, the babies with HIE Stage 3 had higher CK-BB levels compared to that of the children in Stage 1 and 2.12
Holzmann et al. showed that fetal scalp blood sampling is an early marker of intrapartum hypoxia, and they claimed

Prithviraj, et al.: Perinatal Asphyxia Laboratory and Clinical Correlation
222International Journal of Scientifi c Study | April 2016 | Vol 4 | Issue 1
Labo
rato
ry
data
Stag
e 1
Stag
e 2
Stag
e 3
P va
lue
(with
in
grou
ps)
P va
lue
(Bet
gr
oups
)A
t adm
itted
48 h
72 h
At a
dmitt
ed48
h72
hA
t adm
itted
48 h
72 h
Hb
17.2
±2.8
16.8
±2.6
16.6
±2.2
16.8
±2.6
16.7
±2.1
18.2
±3.2
17.9
±2.9
17.2
±2.2
18.2
±3.2
0.52
4P1
-2: 0
.621
P2-3
: 0.5
46P3
-1: 0
.462
WBC
cou
nt22
608±
4408
1920
1±33
2418
213±
2126
2621
2±62
1822
163±
4312
2312
1±51
2026
149±
6129
2512
9±61
4524
121±
8120
0.34
2P1
-2: 0
.254
P2-3
: 0.1
26P3
-1: 0
.193
Plat
elet
cou
nt28
6012
±441
2326
1212
±361
4525
4162
±321
3219
2183
±524
1218
4782
±481
4914
1213
±461
2111
2141
±361
2910
8941
±492
1314
1213
±461
210.
001
P1-2
: 0.3
26P2
-3: 0
.001
P3-1
: 0.0
01BU
N18
±317
±418
±218
±317
±417
±522
±421
±317
±50.
632
P1-2
: 0.7
64P2
-3: 0
.675
P3-1
: 0.3
65C
r0.
5±2
0.4±
10.
4±1
0.5±
20.
6±1
0.6±
10.
9±3
0.8±
20.
8±1
0.00
1P1
-2: 0
.231
P2-3
: 0.0
01P3
-1: 0
.001
UA
6.8±
0.4
6.7±
0.3
6.7±
0.2
6.8±
0.4
6.7±
0.3
8.4±
0.2
9.2±
0.3
10.4
±0.3
9.6±
0.2
0.00
1P1
-2: 0
.321
P2-3
: 0.0
01P3
-1: 0
.001
Urin
ary
mac
rogl
obul
in1.
81±0
.21
1.73
±0.1
51.
69±0
.19
2.9±
0.21
3.1±
0.1
22.
8±0.
204.
2±0.
194.
4±0.
244.
8±0.
230.
001
P1-2
: 0.6
21P2
-3: 0
.001
P3-1
: 0.0
01SG
OT
6264
6262
6476
8410
212
10.
001
P1-2
: 0.4
53P2
-3: 0
.001
P3-1
: 0.0
01SG
PT44
4241
4442
7289
9672
0.00
1P1
-2: 0
.367
P2-3
: 0.0
01P3
-1: 0
.001
Fibr
inog
en19
618
418
119
618
415
414
213
814
40.
001
P1-2
: 0.5
31P2
-3: 0
.001
P3-1
: 0.0
01PT
1.2
1.15
1.12
1.32
1.28
2.2
2.4
2.6
2.2
0.00
1P1
-2: 0
.219
P2-3
: 0.0
01P3
-1: 0
.001
Glu
cose
56±1
064
±666
±852
±861
±462
±561
±464
±566
±30.
543
P1-2
: 0.4
53P2
-3: 0
.001
P3-1
: 0.0
01C
PK-M
B34
0±12
641
2±18
442
2±18
261
8±21
812
12±1
3611
80±1
4828
12±4
6426
12±5
1221
82±4
120.
001
P1-2
: 0.4
53P2
-3: 0
.001
P3-1
:0.0
01
(Con
td).
..
Tab
le 2
: L
abo
rato
ry d
ata
of
the
case
s as
per
sta
ges
of
HIE
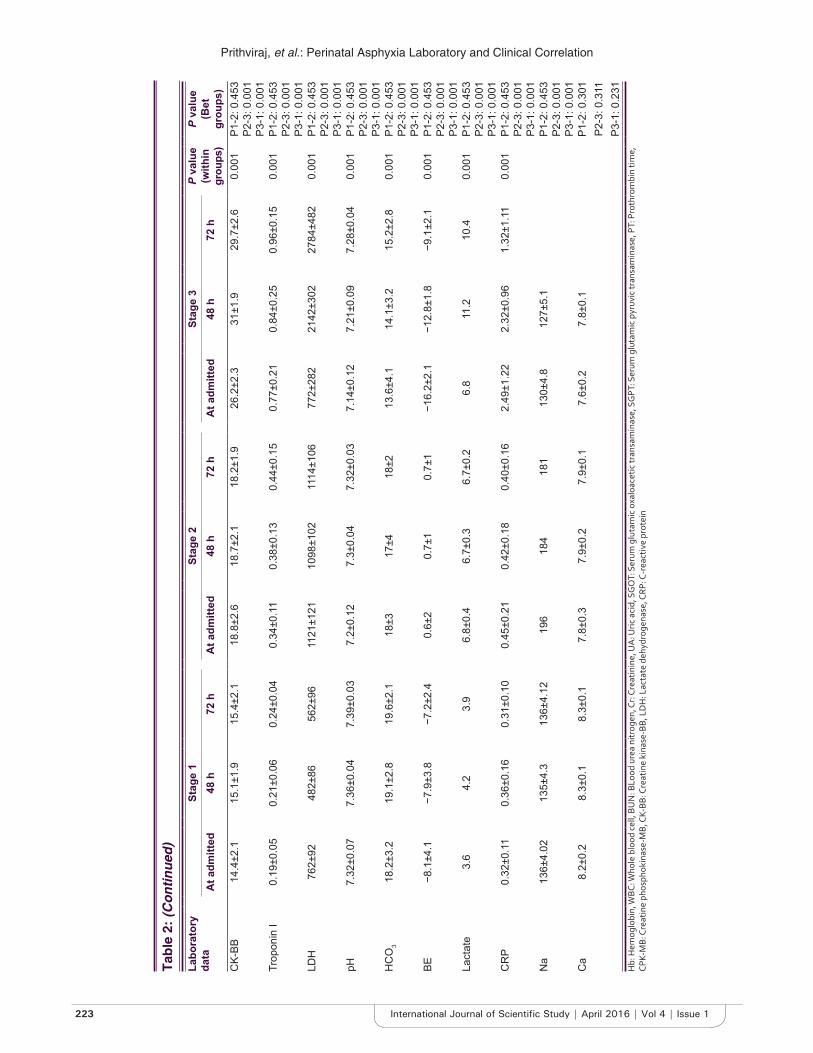
Prithviraj, et al.: Perinatal Asphyxia Laboratory and Clinical Correlation
223 International Journal of Scientifi c Study | April 2016 | Vol 4 | Issue 1
Labo
rato
ry
data
Stag
e 1
Stag
e 2
Stag
e 3
P va
lue
(with
in
grou
ps)
P va
lue
(Bet
gr
oups
)A
t adm
itted
48 h
72 h
At a
dmitt
ed48
h72
hA
t adm
itted
48 h
72 h
CK-
BB14
.4±2
.115
.1±1
.915
.4±2
.118
.8±2
.618
.7±2
.118
.2±1
.926
.2±2
.331
±1.9
29.7
±2.6
0.00
1P1
-2: 0
.453
P2-3
: 0.0
01P3
-1: 0
.001
Trop
onin
I0.
19±0
.05
0.21
±0.0
60.
24±0
.04
0.34
±0.1
10.
38±0
.13
0.44
±0.1
50.
77±0
.21
0.84
±0.2
50.
96±0
.15
0.00
1P1
-2: 0
.453
P2-3
: 0.0
01P3
-1: 0
.001
LDH
762±
9248
2±86
562±
9611
21±1
2110
98±1
0211
14±1
0677
2±28
221
42±3
0227
84±4
820.
001
P1-2
: 0.4
53P2
-3: 0
.001
P3-1
: 0.0
01pH
7.32
±0.0
77.
36±0
.04
7.39
±0.0
37.
2±0.
127.
3±0.
047.
32±0
.03
7.14
±0.1
27.
21±0
.09
7.28
±0.0
40.
001
P1-2
: 0.4
53P2
-3: 0
.001
P3-1
: 0.0
01H
CO
318
.2±3
.219
.1±2
.819
.6±2
.118
±317
±418
±213
.6±4
.114
.1±3
.215
.2±2
.80.
001
P1-2
: 0.4
53P2
-3: 0
.001
P3-1
: 0.0
01BE
−8.1
±4.1
−7.9
±3.8
−7.2
±2.4
0.6±
20.
7±1
0.7±
1−1
6.2±
2.1
−12.
8±1.
8−9
.1±2
.10.
001
P1-2
: 0.4
53P2
-3: 0
.001
P3-1
: 0.0
01La
ctat
e3.
64.
23.
96.
8±0.
46.
7±0.
36.
7±0.
26.
811
.210
.40.
001
P1-2
: 0.4
53P2
-3: 0
.001
P3-1
: 0.0
01C
RP
0.32
±0.1
10.
36±0
.16
0.31
±0.1
00.
45±0
.21
0.42
±0.1
80.
40±0
.16
2.49
±1.2
22.
32±0
.96
1.32
±1.1
10.
001
P1-2
: 0.4
53P2
-3: 0
.001
P3-1
: 0.0
01N
a13
6±4.
0213
5±4.
313
6±4.
1219
618
418
113
0±4.
812
7±5.
1P1
-2: 0
.453
P2-3
: 0.0
01P3
-1: 0
.001
Ca
8.2±
0.2
8.3±
0.1
8.3±
0.1
7.8±
0.3
7.9±
0.2
7.9±
0.1
7.6±
0.2
7.8±
0.1
P1-2
: 0.3
01P2
-3: 0
.311
P3-1
: 0.2
31H
b: H
emog
lobi
n, W
BC: W
hole
blo
od c
ell,
BUN
: BLo
od u
rea
nitr
ogen
, Cr:
Cre
atin
ine,
UA
: Uric
aci
d, S
GO
T: S
erum
glu
tam
ic o
xalo
acet
ic tr
ansa
min
ase,
SG
PT: S
erum
glu
tam
ic p
yruv
ic tr
ansa
min
ase,
PT:
Pro
thro
mbi
n tim
e,
CPK-
MB:
Cre
atin
e ph
osph
okin
ase-
MB,
CK-
BB: C
reat
ine
kina
se-B
B, L
DH
: Lac
tate
deh
ydro
gena
se, C
RP: C
-rea
ctiv
e pr
otei
n
Tab
le 2
: (C
on
tin
ued
)
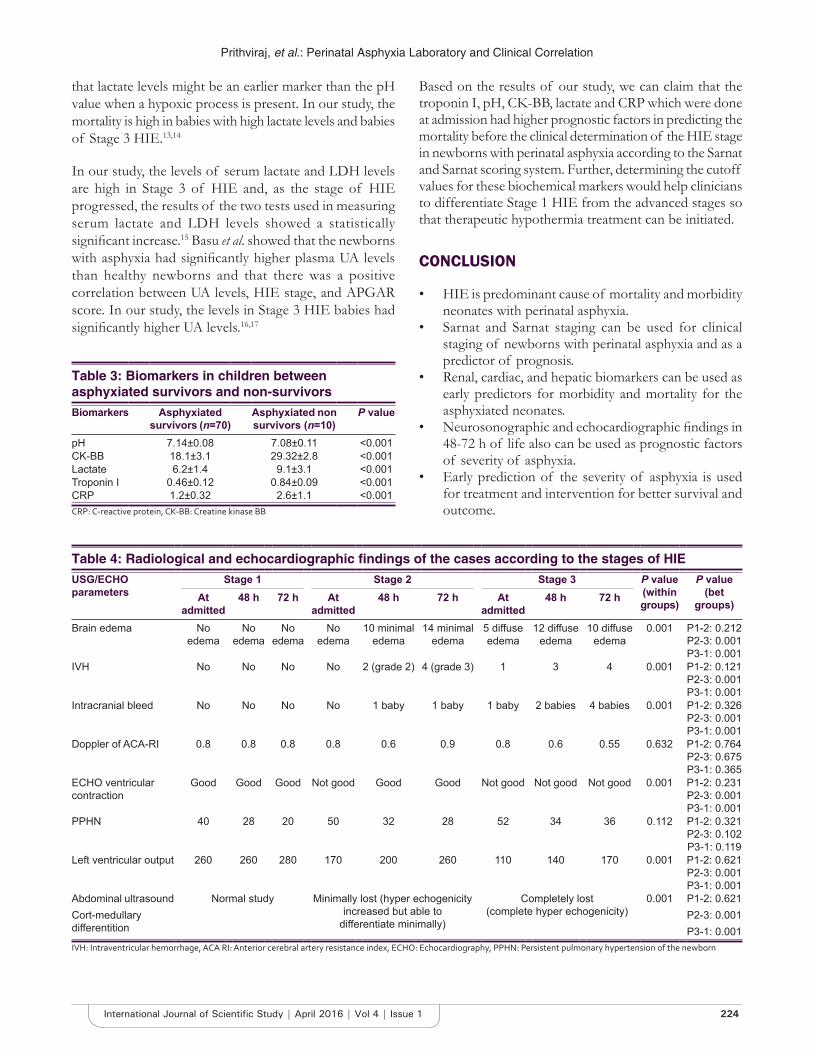
Prithviraj, et al.: Perinatal Asphyxia Laboratory and Clinical Correlation
224International Journal of Scientifi c Study | April 2016 | Vol 4 | Issue 1
that lactate levels might be an earlier marker than the pH value when a hypoxic process is present. In our study, the mortality is high in babies with high lactate levels and babies of Stage 3 HIE.13,14
In our study, the levels of serum lactate and LDH levels are high in Stage 3 of HIE and, as the stage of HIE progressed, the results of the two tests used in measuring serum lactate and LDH levels showed a statistically signifi cant increase.15 Basu et al. showed that the newborns with asphyxia had signifi cantly higher plasma UA levels than healthy newborns and that there was a positive correlation between UA levels, HIE stage, and APGAR score. In our study, the levels in Stage 3 HIE babies had signifi cantly higher UA levels.16,17
Based on the results of our study, we can claim that the troponin I, pH, CK-BB, lactate and CRP which were done at admission had higher prognostic factors in predicting the mortality before the clinical determination of the HIE stage in newborns with perinatal asphyxia according to the Sarnat and Sarnat scoring system. Further, determining the cutoff values for these biochemical markers would help clinicians to differentiate Stage 1 HIE from the advanced stages so that therapeutic hypothermia treatment can be initiated.
CONCLUSION
• HIE is predominant cause of mortality and morbidity neonates with perinatal asphyxia.
• Sarnat and Sarnat staging can be used for clinical staging of newborns with perinatal asphyxia and as a predictor of prognosis.
• Renal, cardiac, and hepatic biomarkers can be used as early predictors for morbidity and mortality for the asphyxiated neonates.
• Neurosonographic and echocardiographic fi ndings in 48-72 h of life also can be used as prognostic factors of severity of asphyxia.
• Early prediction of the severity of asphyxia is used for treatment and intervention for better survival and outcome.
Table 3: Biomarkers in children between asphyxiated survivors and non-survivorsBiomarkers Asphyxiated
survivors (n=70)Asphyxiated non survivors (n=10)
P value
pH 7.14±0.08 7.08±0.11 <0.001CK-BB 18.1±3.1 29.32±2.8 <0.001Lactate 6.2±1.4 9.1±3.1 <0.001Troponin I 0.46±0.12 0.84±0.09 <0.001CRP 1.2±0.32 2.6±1.1 <0.001CRP: C-reactive protein, CK-BB: Creatine kinase BB
Table 4: Radiological and echocardiographic fi ndings of the cases according to the stages of HIEUSG/ECHO parameters
Stage 1 Stage 2 Stage 3 P value (within groups)
P value (bet
groups)At admitted
48 h 72 h At admitted
48 h 72 h At admitted
48 h 72 h
Brain edema No edema
No edema
No edema
No edema
10 minimal edema
14 minimal edema
5 diffuse edema
12 diffuse edema
10 diffuse edema
0.001 P1-2: 0.212P2-3: 0.001P3-1: 0.001
IVH No No No No 2 (grade 2) 4 (grade 3) 1 3 4 0.001 P1-2: 0.121P2-3: 0.001P3-1: 0.001
Intracranial bleed No No No No 1 baby 1 baby 1 baby 2 babies 4 babies 0.001 P1-2: 0.326P2-3: 0.001P3-1: 0.001
Doppler of ACA-RI 0.8 0.8 0.8 0.8 0.6 0.9 0.8 0.6 0.55 0.632 P1-2: 0.764P2-3: 0.675P3-1: 0.365
ECHO ventricular contraction
Good Good Good Not good Good Good Not good Not good Not good 0.001 P1-2: 0.231P2-3: 0.001P3-1: 0.001
PPHN 40 28 20 50 32 28 52 34 36 0.112 P1-2: 0.321P2-3: 0.102P3-1: 0.119
Left ventricular output 260 260 280 170 200 260 110 140 170 0.001 P1-2: 0.621P2-3: 0.001P3-1: 0.001
Abdominal ultrasoundCort-medullary differentition
Normal study Minimally lost (hyper echogenicity increased but able to
differentiate minimally)
Completely lost(complete hyper echogenicity)
0.001 P1-2: 0.621P2-3: 0.001P3-1: 0.001
IVH: Intraventricular hemorrhage, ACA RI: Anterior cerebral artery resistance index, ECHO: Echocardiography, PPHN: Persistent pulmonary hypertension of the newborn

Prithviraj, et al.: Perinatal Asphyxia Laboratory and Clinical Correlation
225 International Journal of Scientifi c Study | April 2016 | Vol 4 | Issue 1
REFERENCES
1. Sarnat HB, Sarnat MS. Neonatal encephalopathy following fetal distress. A clinical and electroencephalographic study. Arch Neurol 1976;33:696-705.
2. van de Riet JE, Vandenbussche FP, Le Cessie S, Keirse MJ. Newborn assessment and long-term adverse outcome: A systematic review. Am J Obstet Gynecol 1999;180:1024-9.
3. Committee on Obstetric Practice, American College of Obstetricians and Gynecologists. ACOG Committee Opinion. Number 326, December 2005. Inappropriate use of the terms fetal distress and birth asphyxia. Obstet Gynecol 2005;106:1469-70.
4. Ferriero DM. Neonatal brain injury. N Engl J Med 2004;351:1985-95.5. Rennie JM, Hagmann CF, Robertson NJ. Outcome after intrapartum
hypoxic ischaemia at term. Semin Fetal Neonatal Med 2007;12:398-407.6. Massaro AN, Chang T, Kadom N, Tsuchida T, Scafi di J, Glass P, et al.
Biomarkers of brain injury in neonatal encephalopathy treated with hypothermia. J Pediatr 2012;161:434-40.
7. Wiberg N, Källén K, Herbst A, Olofsson P. Relation between umbilical cord blood pH, base defi cit, lactate, 5-minute Apgar score and development of hypoxic ischemic encephalopathy. Acta Obstet Gynecol Scand 2010;89:1263-9.
8. Sarnat HB, Sarnat MS. Neonatal encephalopathy following fetal distress. A clinical and electroencephalographic study. Arch Neurol 1976;33:696-705.
How to cite this article: Prithviraj D, Reddy B, Deepthi, Abhijit. Laboratory Findings and Clinical Correlation in Assessing the Severity of Perinatal Asphyxia. Int J Sci Stud 2016;4(1):218-225.
Source of Support: Nil, Confl ict of Interest: None declared.
9. Milutinovic S, Karadzic R, Pavlovic M, Tomasevic M, Stankovic A. Biochemical cardiac markers application in cardiology. Apoll Med Aesculap 2006;4:16-22.
10. Volpe JJ. Neurology of the Newborn. 4th ed. Philadelphia: WB Saunders Company; 2001. p. 217-76.
11. Vannucci RC. Hypoxic-ischemic encephalopathy: Clinical aspects. In: Fanaroff AA, Martin RJ, editors. Neonatal-Perinatal Medicine. IVth ed. Philadelphia, PA: Mosby-Yearbook, Inc.; 1997. p. 877-91.
12. Hansen AR, Soul JS. Perinatal asphyxia and hypoxic - Ischaemic encephalopathy. In: Cloherty JP, Eichenwald EC, Hansen AR, Stark AR, editors. Manual of Neonatal Care. 7th ed. Philadelphia: Lippincott Williams and Wilkins, a Walters Kluwer Business; 2012. p. 711-28.
13. Ferriero DM. Neonatal brain injury. N Engl J Med 2004;351:1985-95.14. Beken S, Aydin B, Dilli D, Erol S, Zenciroglu A, Okumus N. Can biochemical
markers predict the severity of hypoxic-ischemic encephalopathy? Turk J Pediatr 2014;56:62-8.
15. Antonelli M, Azoulay E, Bonten M, Chastre J, Citerio G, Conti G, et al. Year in review in intensive care medicine 2010: I. Acute renal failure, outcome, risk assessment and ICU performance, sepsis, neuro intensive care and experimentals. Intensive Care Med 2011;37:19-34.
16. Basu P, Som S, Choudhuri N, Das H. Contribution of the blood glucose level in perinatal asphyxia. Eur J Pediatr 2009;168:833-8.
17. Banupriya C, Ratnakar, Doureradjou P, Mondal N, Vishnu B, Koner BC. Can urinary excretion rate of malondialdehyde, uric acid and protein predict the severity and impending death in perinatal asphyxia? Clin Biochem 2008;41:968-73.
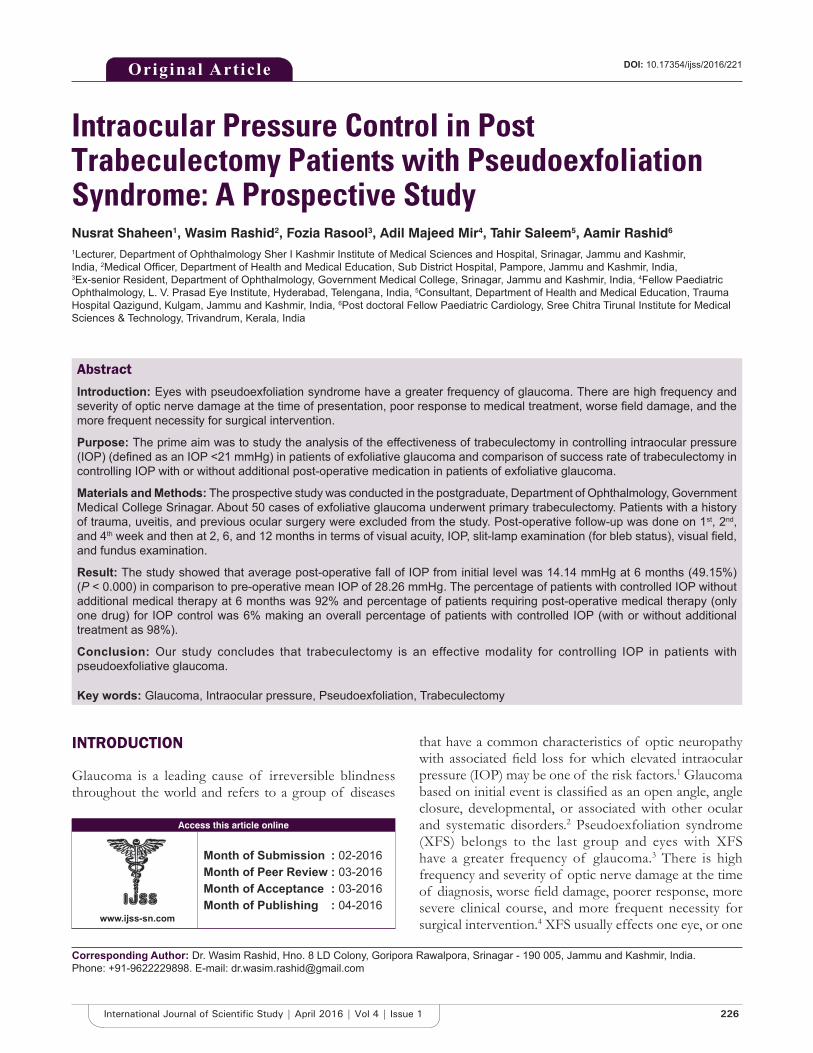
226International Journal of Scientifi c Study | April 2016 | Vol 4 | Issue 1
Intraocular Pressure Control in Post Trabeculectomy Patients with Pseudoexfoliation Syndrome: A Prospective StudyNusrat Shaheen1, Wasim Rashid2, Fozia Rasool3, Adil Majeed Mir4, Tahir Saleem5, Aamir Rashid6
1Lecturer, Department of Ophthalmology Sher I Kashmir Institute of Medical Sciences and Hospital, Srinagar, Jammu and Kashmir, India, 2Medical Offi cer, Department of Health and Medical Education, Sub District Hospital, Pampore, Jammu and Kashmir, India, 3Ex-senior Resident, Department of Ophthalmology, Government Medical College, Srinagar, Jammu and Kashmir, India, 4Fellow Paediatric Ophthalmology, L. V. Prasad Eye Institute, Hyderabad, Telengana, India, 5Consultant, Department of Health and Medical Education, Trauma Hospital Qazigund, Kulgam, Jammu and Kashmir, India, 6Post doctoral Fellow Paediatric Cardiology, Sree Chitra Tirunal Institute for Medical Sciences & Technology, Trivandrum, Kerala, India
that have a common characteristics of optic neuropathy with associated fi eld loss for which elevated intraocular pressure (IOP) may be one of the risk factors.1 Glaucoma based on initial event is classifi ed as an open angle, angle closure, developmental, or associated with other ocular and systematic disorders.2 Pseudoexfoliation syndrome (XFS) belongs to the last group and eyes with XFS have a greater frequency of glaucoma.3 There is high frequency and severity of optic nerve damage at the time of diagnosis, worse fi eld damage, poorer response, more severe clinical course, and more frequent necessity for surgical intervention.4 XFS usually effects one eye, or one
INTRODUCTION
Glaucoma is a leading cause of irreversible blindness throughout the world and refers to a group of diseases
Original Article
Abstract
Introduction: Eyes with pseudoexfoliation syndrome have a greater frequency of glaucoma. There are high frequency and severity of optic nerve damage at the time of presentation, poor response to medical treatment, worse fi eld damage, and the more frequent necessity for surgical intervention.
Purpose: The prime aim was to study the analysis of the effectiveness of trabeculectomy in controlling intraocular pressure (IOP) (defi ned as an IOP <21 mmHg) in patients of exfoliative glaucoma and comparison of success rate of trabeculectomy in controlling IOP with or without additional post-operative medication in patients of exfoliative glaucoma.
Materials and Methods: The prospective study was conducted in the postgraduate, Department of Ophthalmology, Government Medical College Srinagar. About 50 cases of exfoliative glaucoma underwent primary trabeculectomy. Patients with a history of trauma, uveitis, and previous ocular surgery were excluded from the study. Post-operative follow-up was done on 1st, 2nd, and 4th week and then at 2, 6, and 12 months in terms of visual acuity, IOP, slit-lamp examination (for bleb status), visual fi eld, and fundus examination.
Result: The study showed that average post-operative fall of IOP from initial level was 14.14 mmHg at 6 months (49.15%) (P < 0.000) in comparison to pre-operative mean IOP of 28.26 mmHg. The percentage of patients with controlled IOP without additional medical therapy at 6 months was 92% and percentage of patients requiring post-operative medical therapy (only one drug) for IOP control was 6% making an overall percentage of patients with controlled IOP (with or without additional treatment as 98%).
Conclusion: Our study concludes that trabeculectomy is an effective modality for controlling IOP in patients with pseudoexfoliative glaucoma.
Key words: Glaucoma, Intraocular pressure, Pseudoexfoliation, Trabeculectomy
Access this article online
www.ijss-sn.com
Month of Submission : 02-2016Month of Peer Review : 03-2016Month of Acceptance : 03-2016Month of Publishing : 04-2016
Corresponding Author: Dr. Wasim Rashid, Hno. 8 LD Colony, Goripora Rawalpora, Srinagar - 190 005, Jammu and Kashmir, India. Phone: +91-9622229898. E-mail: [email protected]
DOI: 10.17354/ijss/2016/221

Shaheen, et al.: Post Trabeculectomy IOP Control in Pseudo Exfoliation Syndrome
227 International Journal of Scientifi c Study | April 2016 | Vol 4 | Issue 1
eye in advance and usually involves age more than 50 years. Deposits of white material (exfoliation) can be seen on lens (three zones), iris, cornea (Sampaolesi’s line), ciliary processes, zonules, and above all trabecular meshwork.5 Exfoliation glaucoma has to be treated even in absence of fi eld damage, if left untreated can lead to it. Glaucoma in XFS is to be treated on same lines as primary open angle (POAG) but it responds less than POAG but it responds well to fi ltering surgery (trabeculectomy) than POAG.6
MATERIALS AND METHODS
This study was conducted in 50 diagnosed cases of exfoliative glaucoma who were operated with primary trabeculectomy and followed up for 6 months to 1 year (in some cases). Indications for trabeculectomy were uncontrolled IOP despite maximum tolerated medication and disease progression. Criteria for inclusion was patients with exfoliation, 6 months F/U minimum, if both eyes were involved fi rst eye was taken and no surgery being done before trabeculectomy. Pre-operative assessment included visual acuity, slit-lamp examination (SLE), gonioscopy, fundus examination, and visual fi eld assessment. Patients were operated by the senior staff of the Department of Ophthalmology for trabeculectomy. Post-operative F/U was done on 1st, 2nd, and 4th week and then after 3rd, 6th and if possible 12 months postoperatively in terms of visual acuity, IOP, SLE (for status of bleb), fundus and fi eld of vision.
OBSERVATIONS
The study revealed demographic data about age in years - 60.26 ± 7.38 and about gender male:female (32:18). The observations that were made from the study as shown in Tables 1-7.
Post-operative cup disc ratio remained same in 84% of cases, whereas it deteriorated in 16% of cases and improved in none.
Post-operative visual field status at 6 months when compared with pre-operative visual field showed same status in 84% of cases, improvement in 2% and deterioration in 14%.
DISCUSSION
Trabeculectomy has proved itself a safe and simple fi ltering procedure.7 As per our study, its pressure reducing effect in exfoliative glaucoma is striking (92% without medication) and 98% with medication, as far as can be judged (6 months mainly). The results are close to results published by Jerndal and Kriisa (96%).8 The mean IOP of all cases in our study
was 14.12 ± 3.19 mmHg at 6 months which is close to results given by Popovic and Sjöstrand in whose study the mean post-operative IOP at last F/U visit (46.2 months) was 15.3 (5.1) in exfoliation glaucoma.6 Our mean pre-operative IOP was 28.26 ± 8.72 mmHg which is in accordance with study conducted by Popovic and Sjöstrand were mean IOP at operation was 28.2 mmHg in exfoliation glaucoma.6 The mean age of the patients in our study is 60.26 years for both males and females, and this coincides with the mean
Table 1: Pre-operative visual acuity (Snellen chart)Visual acuity (Snellen chart) Number of cases (%)6/12 or better 7 (14)6/18 to 6/36 19 (38)6/60 or less 24 (50)Total 50 (100)
Table 2: Pre-operative IOP (applanation tonometry)IOP (mmHg) Number of cases (%)>15-20 12 (24)21-30 20 (40)31-40 14 (28)41-50 3 (6)51-60 1 (2)Total 50 (100)
Table 3: Distribution of cases according to post-operative IOPIOP(mmHg)
Number of cases1st week 1st month 3 months 6 months
>21 2 (4) 1 (2) 3 (6) 1 (2)10-20 44 (88) 48 (96) 46 (92) 49 (98)<10 4 (8) 1 (2) 1 (2) 0 (0)Total 50 (100) 50 (100) 50 (100) 50 (100)IOP: Intraocular pressure
Table 4: Success of trabeculectomy in relations to post-operative IOP at 6 monthsPost-operative IOP Number of cases (%)Control without treatment 46 (92)Control with additional treatment 3 (6)Total controlled with and without additional treatment
49 (98)
Failure (IOP not controlled) 1 (2)IOP controlled=IOP<21 mmHg at 6 months, IOP: Intraocular pressure
Table 5: Changes in mean IOP from pre-operative level at different follow-up of all casesMean pre-operative IOP
Mean post-operative IOP1st week 1st month 3 months 6 months
28.26±8.72 14.10±3.59 13.68±3.11 13.95±3.52 14.12±3.19IOP: Intraocular pressure
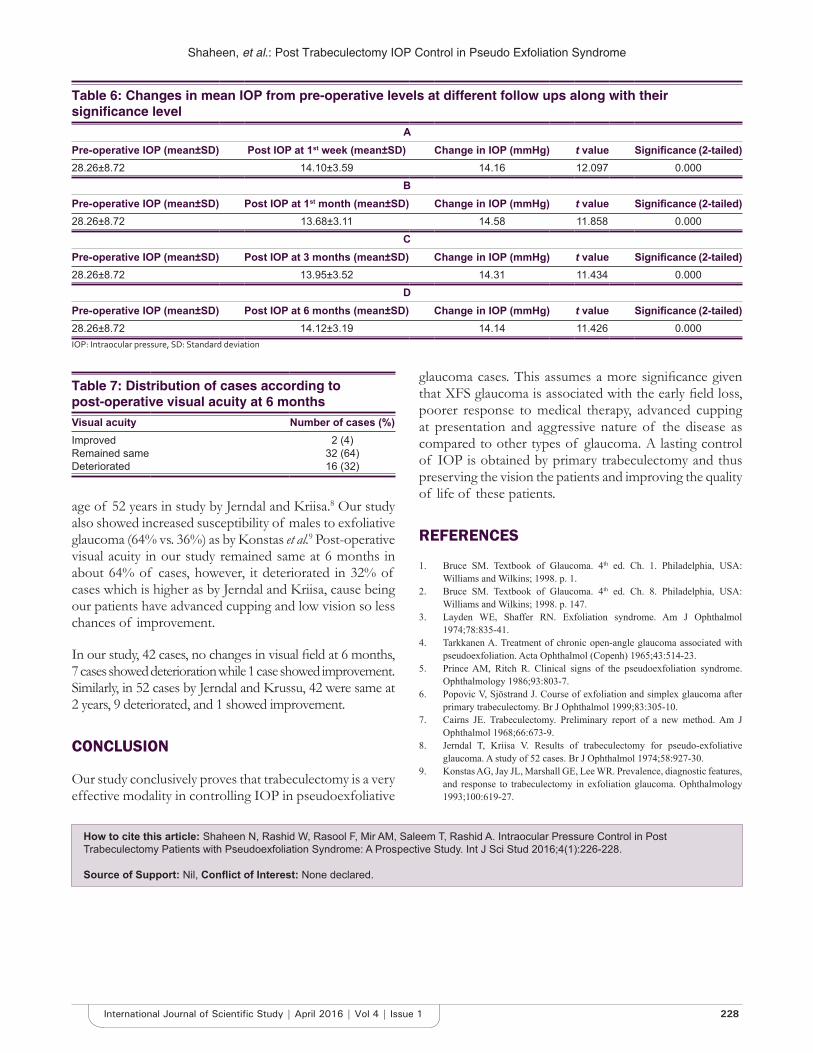
Shaheen, et al.: Post Trabeculectomy IOP Control in Pseudo Exfoliation Syndrome
228International Journal of Scientifi c Study | April 2016 | Vol 4 | Issue 1
age of 52 years in study by Jerndal and Kriisa.8 Our study also showed increased susceptibility of males to exfoliative glaucoma (64% vs. 36%) as by Konstas et al.9 Post-operative visual acuity in our study remained same at 6 months in about 64% of cases, however, it deteriorated in 32% of cases which is higher as by Jerndal and Kriisa, cause being our patients have advanced cupping and low vision so less chances of improvement.
In our study, 42 cases, no changes in visual fi eld at 6 months, 7 cases showed deterioration while 1 case showed improvement. Similarly, in 52 cases by Jerndal and Krussu, 42 were same at 2 years, 9 deteriorated, and 1 showed improvement.
CONCLUSION
Our study conclusively proves that trabeculectomy is a very effective modality in controlling IOP in pseudoexfoliative
glaucoma cases. This assumes a more signifi cance given that XFS glaucoma is associated with the early fi eld loss, poorer response to medical therapy, advanced cupping at presentation and aggressive nature of the disease as compared to other types of glaucoma. A lasting control of IOP is obtained by primary trabeculectomy and thus preserving the vision the patients and improving the quality of life of these patients.
REFERENCES
1. Bruce SM. Textbook of Glaucoma. 4th ed. Ch. 1. Philadelphia, USA: Williams and Wilkins; 1998. p. 1.
2. Bruce SM. Textbook of Glaucoma. 4th ed. Ch. 8. Philadelphia, USA: Williams and Wilkins; 1998. p. 147.
3. Layden WE, Shaffer RN. Exfoliation syndrome. Am J Ophthalmol 1974;78:835-41.
4. Tarkkanen A. Treatment of chronic open-angle glaucoma associated with pseudoexfoliation. Acta Ophthalmol (Copenh) 1965;43:514-23.
5. Prince AM, Ritch R. Clinical signs of the pseudoexfoliation syndrome. Ophthalmology 1986;93:803-7.
6. Popovic V, Sjöstrand J. Course of exfoliation and simplex glaucoma after primary trabeculectomy. Br J Ophthalmol 1999;83:305-10.
7. Cairns JE. Trabeculectomy. Preliminary report of a new method. Am J Ophthalmol 1968;66:673-9.
8. Jerndal T, Kriisa V. Results of trabeculectomy for pseudo-exfoliative glaucoma. A study of 52 cases. Br J Ophthalmol 1974;58:927-30.
9. Konstas AG, Jay JL, Marshall GE, Lee WR. Prevalence, diagnostic features, and response to trabeculectomy in exfoliation glaucoma. Ophthalmology 1993;100:619-27.
How to cite this article: Shaheen N, Rashid W, Rasool F, Mir AM, Saleem T, Rashid A. Intraocular Pressure Control in Post Trabeculectomy Patients with Pseudoexfoliation Syndrome: A Prospective Study. Int J Sci Stud 2016;4(1):226-228.
Source of Support: Nil, Confl ict of Interest: None declared.
Table 6: Changes in mean IOP from pre-operative levels at different follow ups along with their signifi cance level
APre-operative IOP (mean±SD) Post IOP at 1st week (mean±SD) Change in IOP (mmHg) t value Signifi cance (2-tailed)28.26±8.72 14.10±3.59 14.16 12.097 0.000
BPre-operative IOP (mean±SD) Post IOP at 1st month (mean±SD) Change in IOP (mmHg) t value Signifi cance (2-tailed)28.26±8.72 13.68±3.11 14.58 11.858 0.000
CPre-operative IOP (mean±SD) Post IOP at 3 months (mean±SD) Change in IOP (mmHg) t value Signifi cance (2-tailed)28.26±8.72 13.95±3.52 14.31 11.434 0.000
DPre-operative IOP (mean±SD) Post IOP at 6 months (mean±SD) Change in IOP (mmHg) t value Signifi cance (2-tailed)28.26±8.72 14.12±3.19 14.14 11.426 0.000IOP: Intraocular pressure, SD: Standard deviation
Table 7: Distribution of cases according to post-operative visual acuity at 6 monthsVisual acuity Number of cases (%)Improved 2 (4)Remained same 32 (64)Deteriorated 16 (32)

229 International Journal of Scientifi c Study | April 2016 | Vol 4 | Issue 1
Evaluation of Shade Differences between Natural Anterior Teeth in Patients of Different Age Groups, Skin Tone, and Gender: A Computerized Cross-sectional StudyS Bhanu Rekha1, S Padmasree1, N Aparna2, Ranu Kumari3
1Post-graduate Student, Department of Prosthodontics and Implantology, Mahatma Gandhi Post Graduate Institute of Dental Sciences, Puducherry, India, 2Assistant Professor, Department of Prosthodontics and Implantology, Mahatma Gandhi Post Graduate Institute of Dental Sciences, Puducherry, India, 3Professor and Head, Department of Prosthodontics and Implantology, Mahatma Gandhi Post Graduate Institute of Dental Sciences, Puducherry, India
fully edentulous patients. They suggest that the color of the teeth must harmonize with the surrounding environment such as skin, hair, eye color, and age all with the aim of enhancing facial esthetics. It is also suggested that the hue of artifi cial teeth should harmonize with the patient’s complexion (Boucher et al, 1975; Winkler, 1979). These authors also advocated the use of the color of the facial skin as one basic guide in selecting color for artifi cial teeth in Caucasians. The knowledge of human tooth color and its distribution are a very important in understanding of matching in esthetic dentistry (O’Brien et al., 1997). He also
INTRODUCTION
Prosthodontists have always been faced with the challenge of harmonizing tooth shade with a facial appearance in
Original Article
Abstract
Introduction: Tooth shade is one of the most signifi cant factors affecting esthetics. It is general misconception in people that white bright teeth are more attractive than yellow teeth. However, we as dentists are aware of the fact that teeth shade vary with skin color, age, and gender.
Purpose: The purpose of this scientifi c paper is to evaluate shade differences between natural anterior teeth in patients of different age groups, gender and skin tone of Puducherry population using a digital camera and to subsequently feed the data into software to determine the shade.
Materials and Methods: A total of 100 individuals aged above 16 years were divided into four age groups: Group 1 - 16-25 years; Group 2 - 26-35 years; Group 3 - 36-45 years; Group 4 - >46 years participated in this study. Photographs of all the individuals were taken using Canon 5D Mark II camera of 24 pixel resolution with lens zoom of 24-105 mm using two Photopro 23 photographic umbrella lights with 500 W under standardized conditions. Later, they were fed into Adobe Photoshop software to obtain the values of hue, saturation, and brightness of the middle third of maxillary central incisor. Tooth shades were divided into four categories according to value, and skin tones were divided into three categories (fair, medium, and dark) using Revlon makeup shades as a guide. These data were analyzed using Kruskal–Wallis ANOVA H value test.
Results: Signifi cant tooth shade differences were discovered among the subjects with skin colors (P < 0.001). Persons with medium to dark skin tones were more likely to have teeth with higher values (lighter), whereas with lighter skin tones have lower values (darker). A higher incidence of males with darker teeth as compared to females was evident, and signifi cant darkening of teeth was found to occur with advancing age irrespective of gender predilection.
Conclusion: Within the limitation of the study, tooth shade value, skin color, gender, and age were signifi cantly correlated.
Key words: Age, Digital camera, Gender, Skin color, Tooth color
Access this article online
www.ijss-sn.com
Month of Submission : 02-2016Month of Peer Review : 03-2016Month of Acceptance : 03-2016Month of Publishing : 04-2016
Corresponding Author: Dr. S Bhanu Rekha, Department of Prosthodontics and Implantology, Mahatma Gandhi Post Graduate Institute of Dental Sciences, Puducherry, India. Phone: +91-9894359632. E-mail: [email protected]
DOI: 10.17354/ijss/2016/222

Rekha, et al.: Shade Differences between Natural Anterior Teeth
230International Journal of Scientifi c Study | April 2016 | Vol 4 | Issue 1
reported statistically signifi cant color difference between the gingival to the incisal regions of teeth and that these differences are clinically signifi cant. The illusion of greater contrast between skin color and tooth shade explains the perception among prosthodontists and restorative dentists that individuals with darker skin colors have lighter shades of teeth (Richardson, 2001).
A smile is the most visible record of a dentist’s care. The signifi cance of tooth shade in one’s perception of smile attractiveness cannot be underestimated. In today’s beauty conscious society, the demand for esthetic dentistry has increased a lot in last few years. Tooth shade is one of the most signifi cant factors affecting esthetics.1 It is general misconception in people that white bright teeth are more attractive than yellow teeth. However, we as dentists are aware of the fact that teeth shade vary with skin color, age, and gender. Tooth color has a strong correlation with age, generally becoming darker and yellower with time. As the age advances, the pulp chamber which is large during young age becomes smaller as a result of deposition of secondary dentin, making tooth more opaque. Many studies have shown that women have lighter and less yellow teeth than men. The color of the facial skin serves as the basic guides to tooth shade. The face is the frame into which the portrait (the teeth) will fi t. Therefore, the shade of the teeth should harmonize with the color of the skin of the face.2
In past, various studies and surveys were conducted investigating the relationship of skin color to tooth shade. Some of these found inverse relationship between skin color and tooth shade while others found no relationship. These varying results can be attributed to the differences in the ethnic origin of the population studied. Bearing this view in mind, a study was planned to evaluate the shade differences of the natural anterior teeth in different skin color, age groups, and gender using digital method.3
MATERIALS AND METHODS
This study was conducted to investigate the relationship between tooth shade value, age, gender, and skin color in the population of Puducherry, India. A total of 100 subjects belonging to different age groups, of equal distribution visiting the Department of Prosthodontics and Implantology, Mahatma Gandhi Post Graduate Institute of Dental Sciences, Puducherry were selected. In this study, subjects with a full complement of maxillary and mandibular anterior teeth without any endodontic therapy or restorations, developmental defects or disease were selected, to determine the skin color and shade of teeth.
Subjects who had a history of bleaching procedures, intrinsic, extrinsic or tetracycline staining, xerostomia, radiation therapy, smoking, or abnormalities in tooth development were excluded. Female subjects were specially asked not to wear any make-up, lipstick, or lip gloss.
Determination of Shade of TeethThe subject was positioned upright with the mouth at the camera lens level and the camera’s position at four feet distance from the subject (Figure 1). The camera used was Canon 5D Mark II of 24 pixel resolution with lens zoom of 24-105 mm using two Photopro 23 photographic umbrella lights with 500 W (Figure 2). Clinicians were screened for color vision defi ciency with Ishihara test for color blindness, and no color vision defi ciencies were found. Photographs were clicked and were fed into Adobe Photoshop software to obtain the values of hue, saturation, and brightness of the middle third of maxillary central incisor which was matched to the nearest values of Vita 3D master guide to obtain the tooth shade (Figure 3).
Figure 1: Standardization of lighting conditions and patient position
Figure 2: Canon 5D Mark II
Rekha, et al.: Shade Differences between Natural Anterior Teeth
231 International Journal of Scientifi c Study | April 2016 | Vol 4 | Issue 1
Determination of Skin ColorSkin tones were divided into three categories: Shade 1, fair; Shade 2, medium; Shade 3, dark with the use of Revlon foundation makeup shade guide. The vanilla, shell and nude shade groups of the Revlon compacts corresponded to the fair skin group; the natural beige, medium beige, and cool beige shades of the compact corresponded to the medium skin group, and the golden beige, rich ginger shades of the compact corresponded to the dark skin group. Shades beyond the deeper shades of the compact were categorized in the dark skin group (Figure 4).
RESULTS
Variations in shades of permanent maxillary central incisor were determined in relation to gender, age and
Figure 3: Tooth shade matching using Adobe Photoshop software
Figure 4: Revlon makeup shade guide for skin tone categorization

Rekha, et al.: Shade Differences between Natural Anterior Teeth
232International Journal of Scientifi c Study | April 2016 | Vol 4 | Issue 1
also on the basis of skin tone, by applying Kruskal–Wallis ANOVA H value test. Our study comprised 100 patients, out of which 65 were males and 35 were females. They were equally distributed into four age groups of 25 each on the basis of chronological age (Table 1). A total of 26 different shades are represented in Vita 3D Master shade guide. Out of these, only 15 shades were recorded in our study sample. Overall, the most common shade recorded was 2R1.5 (14.0%) followed by 2R2.5 (12%), and 1M2 (12%) and LR1.5 (9.0%) (Table 2). In comparison to females, males had higher values (darker) (Table 3). When considering the value groups of the shade guide in relation to age groups, interesting results were found (Table 4). In Groups I and II, “Value 2” shades were the most common, whereas in Groups III and IV, “Value 3” shades were the most common. Relation to gender, the “medium” skin tone was most common among males, whereas the “light” skin tone was most common among females. When considering these skin tones in relation to the value groups, similar trends regarding tooth shades were seen in both “light” and “medium” skin tones, whereby “Value 2” shades were most common.
DISCUSSION
This study tried to establish a relationship between shades of teeth and skin color of the individuals according to their age and gender. The importance of esthetics in dentistry has shown marked increase owing to new interest and public awareness. Tooth color was found to be one of the important factors affecting esthetics. Color is complex and encompasses both subjective and objective phenomena. The most popular method for describing color was the Munsell system (3,11-13).4 It had been widely used in dentistry. The three attributes of color in this system were hue, value, and chroma. Hue was defi ned as the particular variety of a color, shade, or tint produced by a specifi c wavelength of light acting on the retina. Chroma was defi ned as the intensity of a hue that is amount of color saturating per unit area of an object. The value was defi ned as the relative lightness or darkness of a color or the brightness of an object. Value is considered to be of greater importance.
For tooth shade determination, we used the middle third site of the tooth because there was a color gradation in natural teeth from the incisal to the cervical areas. The middle site of the teeth was said to be best representative of its color because the incisal site was most often translucent and was affected by its background while the cervical color was modifi ed by scattered light from the gingiva.
The color of the facial skin served as basic guide in shade selection of teeth. Specifi cally, it is suggested that the value
of the teeth must correspond to darkness or lightness of the facial skin tone. Persons with medium and dark skin were more likely to have teeth in high-value category than
Table 1: Distribution of patient’s by age and genderAge n (%)
Male Female Total16-25 16 (24.6) 9 (25.7) 25 (25.0)26-35 16 (24.6) 8 (22.9) 25 (25.0)36-45 17 (26.2) 9 (25.7) 25 (25.0)≥46 16 (24.6) 9 (25.7) 25 (25.0)Total 65 (65.0) 35 (35.0) 100 (100.0)
Table 2: Distribution of patient’s by shade selected and genderShade selected
n (%)Male Female Total
1M1 1 (1.5) 1 (2.9) 2 (2.0)1M2 6 (9.2) 6 (17.1) 12 (12.0)2L1.5 7 (10.8) 3 (8.6) 10 (10.0)2L2.5 1 (1.5) 0 (0.0) 1 (1.0)2M1 4 (6.2) 6 (17.1) 10 (10.0)2M2 4 (6.2) 4 (11.4) 8 (8.0)2R1.5 8 (12.3) 6 (17.1) 14 (14.0)2R2.5 9 (13.9) 3 (8.6) 12 (12.0)3L1.5 5 (7.7) 1 (2.9) 6 (6.0)3L2.5 7 (10.8) 2 (5.7) 9 (9.0)3M1 3 (4.6) 0 (0.0) 3 (3.0)3M2 6 (9.2) 3 (8.6) 9 (9.0)3R1.5 1 (1.5) 0 (0.0) 1 (1.0)4L2.5 1 (1.5) 0 (0.0) 1 (1.0)4M2 2 (3.1) 0 (0.0) 2 (2.0)Total 65 (65.0) 35 (35.0) 100 (100.0)Kruskal–Wallis ANOVA H value=5.19, P=0.0228, P<0.05 (Signifi cant at 5% level)
Table 3: Distribution of patient’s by value group and genderValue group
n (%)Male Female Total
Value 1 7 (10.8) 7 (20.0) 14 (14.0)Value 2 33 (50.8) 22 (62.9) 55 (55.0)Value 3 22 (33.9) 6 (17.1) 28 (28.0)Value 3 3 (4.6) 0 (0.0) 3 (3.0)Total 65 (65.0) 35 (35.0) 100 (100.0)Kruskal–Wallis ANOVA H value=5.14, P=0.0198, P<0.05 (Signifi cant at 5% level)
Table 4: Distribution of patient’s by value group and skin toneValue group
Skin tone, n (%) Totaln (%)Light Medium Dark
Value 1 6 (14.0) 6 (12.8) 2 (20.0) 14 (14)Value 2 23 (53.5) 27 (57.5) 5 (50.0) 55 (55)Value 3 13 (30.2) 12 (25.5) 3 (30.0) 28 (28)Value 3 1 (2.3) 2 (4.3) 0 (0.0) 3 (3)Total 43 (43.0) 47 (47.0) 10 (10.0) 100 (100)

Rekha, et al.: Shade Differences between Natural Anterior Teeth
233 International Journal of Scientifi c Study | April 2016 | Vol 4 | Issue 1
persons with fair skin color. These results are similar to the fi ndings of Jahangiri et al.5 who found inverse relationship between tooth shade and skin color in their study on multiracial population.
The results of this study showed that there was a signifi cant relationship between shades of teeth and the age-groups selected. It was noted that with increasing age, there was a tendency for the teeth to be of darker shades, which was in accordance with other studies on the subject. In his study conducted in Baghdad, Hassan et al.6 found that the number of patients exhibiting colors of gray and red-gray increased with increasing age and thereby supporting the fi ndings of our study on the whole.
When considering the shades of teeth in relation to gender, we found that males exhibited darker shades than females of the same age group. This fi nding was supported by studies conducted by Esan et al.7 and Guo et al. Their studies have found that gender was signifi cantly associated with tooth shades, in that men were more likely to present with darker tooth shades, whereas women of the same age group were more likely to show lighter tooth shades.
In light of our fi ndings, it is suggested that when dealing with the task of fabricating a complete denture, certain factors must always be borne in mind while selecting a suitable shade for use in their prostheses. The parameters included were age, gender and skin complexion of the patient. Thus, it is our impression that if all details are considered during tooth shade selection, a more life-like prosthesis can be provided to the patient.8
CONCLUSION
Within the limitations of this study, the following conclusions were drawn:1. Tooth shade is signifi cantly associated with age of the
How to cite this article: Rekha SB, Padmasree S, Aparna N, Kumari R. Evaluation of Shade Differences Between Natural Anterior Teeth in Patients of Different Age Groups, Skin Tone and Gender: A Computerized Cross-sectional Study. Int J Sci Stud 2016;4(1):229-233.
Source of Support: Nil, Confl ict of Interest: None declared.
individuals, in that teeth tend to darken in color with advancing age which happens due to enamel wear and subsequent dentin exposure.
2. Tooth shade is also signifi cantly associated with gender, in that males have relatively darker shade than females of the same age group.
3. Tooth shade is also signifi cantly associated with color of the skin, in that people with lighter skin tones tend to have teeth with darker colors while those with darker skin tones possess teeth of lighter colors.9
ACKNOWLEDGMENTS
The authors would like to thank Mr. Raja Raja Chozhan, MPR stills for his technical support.
REFERENCES
1. Rufenacht CR. Fundamentals of Esthetics. 4th ed. Chicago, Illinois: Quintessence Publication Co. Inc.; 1990.
2. Azad AA, Ahmad S, Zia M, Sharif M. Relationship of age, gender and skin tone to shades of permanent maxillary central incisors. Pak Oral Dent J 2012;27:119-25.
3. Rosensteil SF, Land MF, Fujimoto J. Contemporary Fixed Prosthodontics. 4th ed. St. Louis: Mosby; 1988. p. 709-39.
4. Sharma V, Punia V, Khandelwal M, Punia S, Lakshmana RB. A study of relationship between skin color and tooth shade value in population of Udaipur, Rajasthan. Int J Dent Clin 2010;2(4):26-29.
5. Jahangiri L, Reinhardt SB, Mehra RV, Matheson PB. Relationship between tooth shade value and skin color: An observational study. J Prosthet Dent 2002;87:149-52.
6. Hassel AJ, Nitschke I, Dreyhaupt J, Wegener I, Rammelsberg P, Hassel JC. Predicting tooth color from facial features and gender: Results from a white elderly cohort. J Prosthet Dent 2008;99:101-6.
7. Esan TA, Olusile AO, Akeredolu PA. Factors infl uencing tooth shade selection for completely edentulous patients. J Contemp Dent Pract 2006;7:80-7.
8. Rodrigues S, Shetty SR, Prithviraj DR. An evaluation of shade differences between natural anterior teeth in different age groups and gender using commercially available shade guides. J Indian Prosthodont Soc 2012;12:222-30.
9. Chu SJ, Trushkowsky RD, Paravina RD. Dental color matching instruments and systems. Review of clinical and research aspects. J Dent 2010;38 Suppl 2:e2-16.
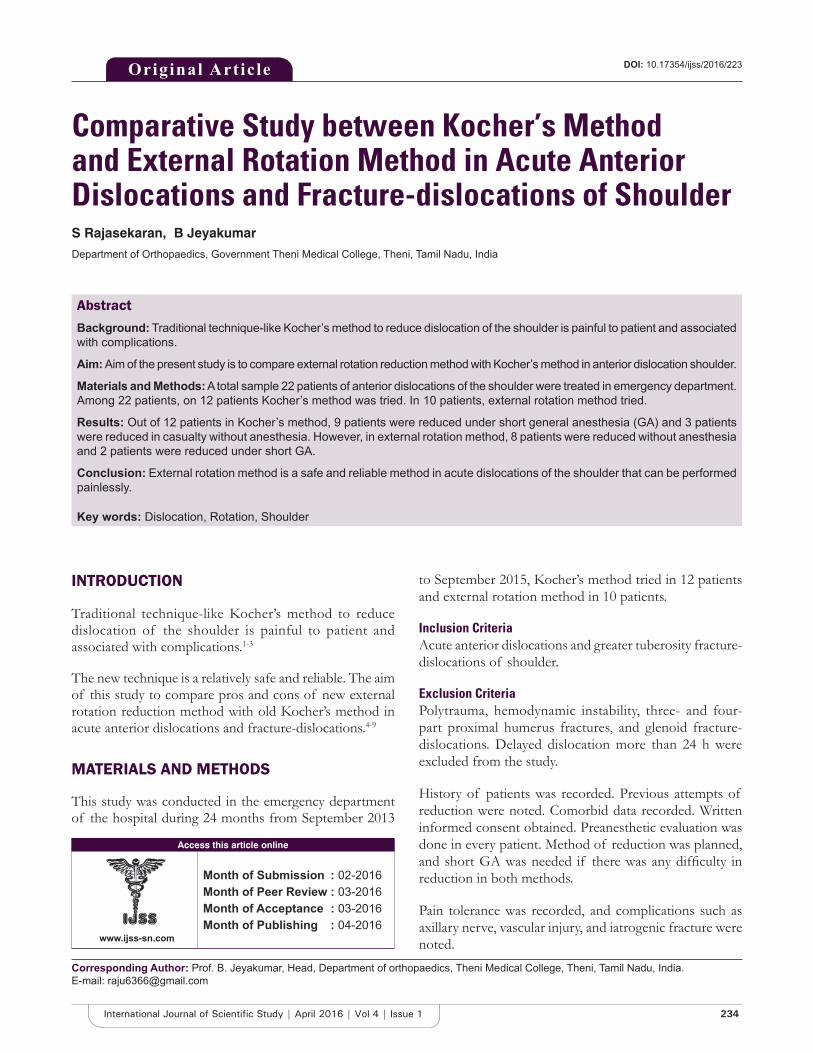
234International Journal of Scientifi c Study | April 2016 | Vol 4 | Issue 1
Comparative Study between Kocher’s Method and External Rotation Method in Acute Anterior Dislocations and Fracture-dislocations of ShoulderS Rajasekaran, B Jeyakumar
Department of Orthopaedics, Government Theni Medical College, Theni, Tamil Nadu, India
to September 2015, Kocher’s method tried in 12 patients and external rotation method in 10 patients.
Inclusion CriteriaAcute anterior dislocations and greater tuberosity fracture-dislocations of shoulder.
Exclusion CriteriaPolytrauma, hemodynamic instability, three- and four-part proximal humerus fractures, and glenoid fracture-dislocations. Delayed dislocation more than 24 h were excluded from the study.
History of patients was recorded. Previous attempts of reduction were noted. Comorbid data recorded. Written informed consent obtained. Preanesthetic evaluation was done in every patient. Method of reduction was planned, and short GA was needed if there was any diffi culty in reduction in both methods.
Pain tolerance was recorded, and complications such as axillary nerve, vascular injury, and iatrogenic fracture were noted.
INTRODUCTION
Traditional technique-like Kocher’s method to reduce dislocation of the shoulder is painful to patient and associated with complications.1-3
The new technique is a relatively safe and reliable. The aim of this study to compare pros and cons of new external rotation reduction method with old Kocher’s method in acute anterior dislocations and fracture-dislocations.4-9
MATERIALS AND METHODS
This study was conducted in the emergency department of the hospital during 24 months from September 2013
Original Article
Abstract
Background: Traditional technique-like Kocher’s method to reduce dislocation of the shoulder is painful to patient and associated with complications.
Aim: Aim of the present study is to compare external rotation reduction method with Kocher’s method in anterior dislocation shoulder.
Materials and Methods: A total sample 22 patients of anterior dislocations of the shoulder were treated in emergency department. Among 22 patients, on 12 patients Kocher’s method was tried. In 10 patients, external rotation method tried.
Results: Out of 12 patients in Kocher’s method, 9 patients were reduced under short general anesthesia (GA) and 3 patients were reduced in casualty without anesthesia. However, in external rotation method, 8 patients were reduced without anesthesia and 2 patients were reduced under short GA.
Conclusion: External rotation method is a safe and reliable method in acute dislocations of the shoulder that can be performed painlessly.
Key words: Dislocation, Rotation, Shoulder
Access this article online
www.ijss-sn.com
Month of Submission : 02-2016Month of Peer Review : 03-2016Month of Acceptance : 03-2016Month of Publishing : 04-2016
Corresponding Author: Prof. B. Jeyakumar, Head, Department of orthopaedics, Theni Medical College, Theni, Tamil Nadu, India.E-mail: [email protected]
DOI: 10.17354/ijss/2016/223

Rajasekaran and Jeyakumar: Comparative Study Between Old and New Method in Shoulder Dislocation
235 International Journal of Scientifi c Study | April 2016 | Vol 4 | Issue 1
TechniqueThe diagnosis was confi rmed by clinical examination and radiographic evaluation.
External Rotation MethodIn supine patient, without any traction, the elbow was fl exed 90° and arm was abducted to side of the chest. With shoulder in 10-20° forward fl exion with grasped wrist, the shoulder was rotated externally until forearm in coronal plane.
Minimal force was given. Patients were given injection diclofenac 3 cc intramuscularly. Once reduced the arm rotated internally and kept across the chest.
Kocher’s MethodIn supine patients, the arm was abducted and externally rotated. Traction was given. Once reduced arm was rotated internally and kept across the shoulder.
If reduction was diffi cult, short GA was administered in both methods.
Reduction was checked in post-reduction X-ray. Patients were immobilized in arm sling.10-11
RESULTS
About 22 patients were treated in period of 24 months from September 2013 to September 2015 in the emergency department.
Among 22, 12 patients were reduced using Kocher’s method, and 10 patients were reduced using external rotation method (Table 1).
Among 22 patients, 18 patients were male and 4 patients were female.
The case sheets of 22 patients who were treated with either of these two methods in the period between September 2013 and September 2015 were evaluated. The mechanism of injury was a simple fall, a fall from height, and road traffi c accident. There were 18 male and 4 female patients. The mean age was 40 years (range, 20-60 years). 12 right shoulders and 10 left shoulders were involved. Among 22, in 20 patients, this was fi rst dislocation of affected shoulder. Greater tuberosity fracture was associated with dislocation in 6 patients.
Closed reduction was achieved with the use of Kocher’s method in 12 patients (10 male + 2 female), and external rotation method in 10 patients (8 male + 2 female).
In Kocher’s method, 9 among 12 dislocations were reduced under short GA.
In external rotation method, 2 among 10 patients needed anesthesia for reduction. Totally, 5 patients had moderate pain.
Two patients had a history of recurrent dislocation of the shoulder which was reduced using Kocher’s method. The mean duration of hospitalization of 22 patients was
Table 1: Patients details using Kocher’s method or external rotation methodName Age/sex Diagnosis Anesthesia Method Admission datePankajam 76/F Anterior Dislocation With# No Kocher’s 17/9/13Subburam 49/M Anterior Dislocation GA Kocher’s 20/9/13Anwartheen 25/M Anterior Dislocation GA Kocher’s 31/3/14Indhrani 65/F Anterior Dislocation With# GA ER 18/4/13Karuvammal 40/F Anterior Dislocation No ER 14/5/14Senthilkumar 20/M Anterior Dislocation No ER 29/5/14Manikalai 32/M Anterior Dislocation GA Kocher’s 12/6/14Kaliappan 36/M Anterior Dislocation No ER 19/7/14Pradeep 29/M Anterior Dislocation No ER 28/7/14Sundarapandi 23/M Anterior Dislocation GA Kocher’s 14/8/14Subramani 66/M Anterior Dislocation With# No ER 22/9/14Perisamy 31/M Anterior Dislocation No ER 28/9/14Saraswathy 45/F Anterior Dislocation No Kocher’s 31/10/14Sreenivasan 46/M Anterior Dislocation GA Kocher’s 13/11/14Suresh 21/M Anterior Dislocation With# GA Kocher’s 30/11/14Tamilselvam 23/M Anterior Dislocation No ER 22/12/14Karnan 40/M Anterior Dislocation With# No ER 12/1/15Sankaran 46/M Anterior Dislocation GA Kocher’s 28/1/15Subramani 57/M Anterior Dislocation GA ER 20/2/15Chitra 34/F Anterior Dislocation GA Kocher’s 12/3/15Mohammed 54/M Anterior Dislocation With# GA Kocher’s 24/5/15Marimuthu 38/M Anterior Dislocation GA Kocher’s 22/6/15GA: General anesthesia

Rajasekaran and Jeyakumar: Comparative Study Between Old and New Method in Shoulder Dislocation
236International Journal of Scientifi c Study | April 2016 | Vol 4 | Issue 1
2 days. No short-term complications were noted in this study.
DISCUSSION
This study demonstrated the advantage of external rotation method of reduction in acute shoulder dislocation. This is reliable and safe while causing minimum patient discomfort and not requiring anesthesia in most of the patients. In Kocher’s method, the used traction increased muscle spasm and made reduction diffi cult without anesthesia.
So, this external rotation method is a rational, simple, and relatively pain-free method to reduce an anterior dislocation of the shoulder when compared to Kocher’s method.12-16
CONCLUSION
External rotation method is a safe and reliable method in acute dislocations of the shoulder that can be performed painlessly.
REFERENCES
1. Beattie TF, Steedman DJ, McGowan A, Robertson CE. A comparison of the Milch and Kocher techniques for acute anterior dislocation of the shoulder. Injury 1986;17:349-52.
2. Janecki CJ, Shahcheragh GH. The forward elevation maneuver for reduction of anterior dislocations of the shoulder. Clin Orthop Relat Res 1982;164:177-80.
3. Manes HR. A new method of shoulder reduction in the elderly. Clin Orthop Relat Res 1980;147:200-2.
4. Plummer D, Clinton J. The external rotation method for reduction of acute anterior shoulder dislocation. Emerg Med Clin North Am 1989;7:165-75.
5. Mirick MJ, Clinton JE, Ruiz E. External rotation method of shoulder dislocation reduction. JACEP 1979;8:528-31.
6. Neer CS 2nd. Displaced proximal humeral fractures: PART I. Classifi cation and evaluation. J Bone Joint Surg Am 1970;52:1077-89.
7. Ideberg R. Fractures of the scapula involving the Glenoid fossa. In: Bateman JE, Walsh RP, editors. Surgery of the Shoulder. Philadelphia, PA: BC Decker; 1984. p. 63-6.
8. Matsen FA, Thomas SC, Rockwood CA, Wirth MA. Glenohumeral instability. In: Rockwood CA, Matsen FA, editors. The Shoulder. 2nd ed., Vol. 2. Philadelphia, PA: WB Saunders; 1998. p. 611-54.
9. Poulsen SR. Reduction of acute shoulder dislocations using the Eskimo technique: A study of 23 consecutive cases. J Trauma 1988;28:1382-3.
10. Kocher T. Kocherʼs method in shoulder dislocation. Berlin Klinewelsch 1870;7:101-5.
11. Leidelmeyer R. Reduced! A shoulder, subtly and painlessly. Emerg Med 1977;9:233-4.
12. Zahiri CA, Zahiri H, Tehrany F. Anterior shoulder dislocation reduction technique – Revisited. Orthopedics 1997;20:515-21.
13. Uglow MG. Kocher’s painless reduction of anterior dislocation of the shoulder: A prospective randomised trial. Injury 1998;29:135-7.
14. Canales Cortés V, García-Dihinx Checa L, Rodriguez Vela J. Reduction of acute anterior dislocations of the shoulder without anaesthesia in the position of maximum muscular relaxation. Int Orthop 1989;13:259-62.
15. Garnavos C. Technical note: Modifi cations and improvements of the Milch technique for the reduction of anterior dislocation of the shoulder without premedication. J Trauma 1992;32:801-3.
16. Ceroni D, Sadri H, Leuenberger A. Radiographic evaluation of anterior dislocation of the shoulder. Acta Radiol 2000;41:658-61.
How to cite this article: Rajasekaran S, Jeyakumar. Comparative Study between Kocher’s Method and External Rotation Method in Acute Anterior Dislocations and Fracture-dislocations of Shoulder. Int J Sci Stud 2016;4(1):234-236.
Source of Support: Nil, Confl ict of Interest: None declared.

237 International Journal of Scientifi c Study | April 2016 | Vol 4 | Issue 1
Role of Multiplanar Reconstruction Imaging and Three-dimensional Computed Tomography Imaging in Diagnosing Cranial and Facial FracturesAbdul Khader Farook1, Gurubharath Ilangovan2, Rajesh Ravi3, Abubacker Sulaiman Farook4, Praveen Kumar Magudeeswaran3
1Assistant Professor, Department of Orthopaedics, Shri Sathya Sai Medical College and Research Institute, Thiruporur, Ammapettai, Chengalpet, Kanchipuram, Tamil Nadu, India, 2Associate Professor, Department of Radiology and Imaging Sciences, Shri Sathya Sai Medical College and Research Institute, Thiruporur, Ammapettai, Chengalpet, Kanchipuram, Tamil Nadu, India, 3Post Graduate, Department of Radiology and Imaging Sciences, Chettinad Hospital and Research Institute, Kelambakkam, Kanchipuram, Tamil Nadu, India, 4Associate Professor, Department of Radiology and Imaging Sciences, Chettinad Hospital and Research Institute, Kelambakkam, Kanchipuram, Tamil Nadu, India
swelling, lacerations, and pain.1 Skull fractures (also known as cranial fractures) can occur in road traffi c accidents, assaults, sports, and any other injuries. Fractures to the skull can occur in any region on the skull. All brain injuries including traumatic brain injury, subdural hematoma, epidural or extradural hematoma or traumatic intracerebral hematoma/contusion.2,3 The role of plain radiographs in assessing facial traumas has declined over the years since X-rays are sensitive to cranial vault fractures but in sensitive to skull base fractures as it does not provide suffi cient information regarding the anatomic details.4,5 The role of magnetic resonance imaging (MRI) in trauma is to assess soft tissue injuries since it has good soft tissue contrast, and it also aids in assessing patients with neurological
INTRODUCTION
The various injuries that are caused by ferocity lead to the head and facial regions being most commonly affected. Involvement of these regions may lead to life-threatening situations, which include profuse blood loss, soft tissue
Original Article
Abstract
Introduction: Skull fractures can occur in road traffi c accidents, assaults, sports, and any other injuries. Fractures to the skull can occur in any region of the skull. The role of plain radiographs in assessing facial traumas has declined over the years. The use of multiplanar reconstruction (MPR) and three-dimensional (3D) recon images of multiple detector computed tomography (MDCT) in the musculoskeletal system is of tremendous advantage in traumatic injuries when the results of plain radiography fail to answer the doubts of the surgeons regarding satisfactory alignment of complex fractures.
Objective: To assess the accuracy of MDCT with MPR and 3D reconstruction sequences in imaging cranial and facial fractures.
Materials and Methods: A total of 100 patients fulfi lling the criteria were included in the study, the average age taken was from 22 to 44 with appropriate brain and facial protocols with bone and soft tissue reconstruction. Inclusion criteria: Traumatic cranial and facial fractures. Exclusion criteria: Pregnant and lactating women. Nontraumatic.
Results: The results of the present study revealed that compared to the four types of fractures, simple undisplaced was found to be the most frequently occurring one, wherein MPR technique was found to be more detective for fractures compared to MRP and 3D, MPR, axial and 3D, MPR and axial.
Conclusions: Thus, this study has high lightened the usefulness of MPR technique as an imaging tool in enabling accurate localization of free bone fragments and assessing the degree of their displacement, thus helping reduce recurrent exposures.
Key words: Cranial, Fractures, Reconstruction
Access this article online
www.ijss-sn.com
Month of Submission : 02-2016Month of Peer Review : 03-2016Month of Acceptance : 03-2016Month of Publishing : 04-2016
Corresponding Author: Dr. Abubacker Sulaiman Farook, Department of Radiology and Imaging Sciences, Chettinad Hospital and Research Institute, Kelambakkam, Kanchipuram - 603 103, Tamil Nadu, India. Phone: +91-9710754999. E-mail: [email protected]
DOI: 10.17354/ijss/2016/224
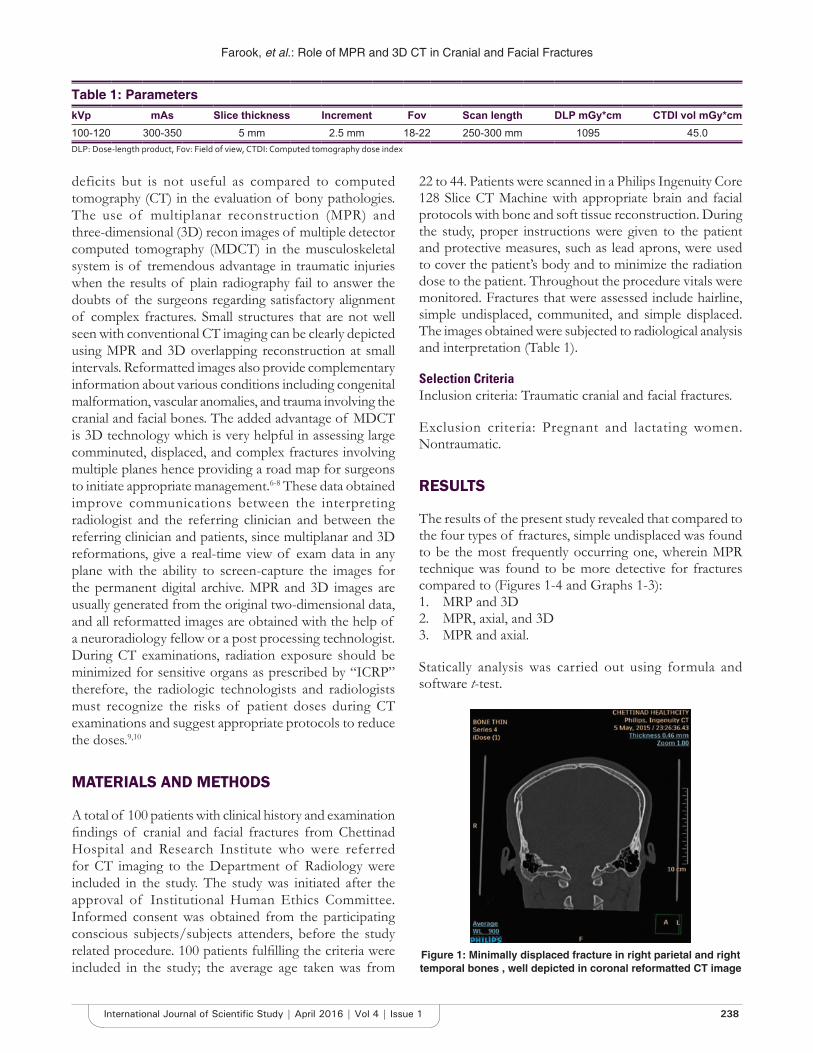
Farook, et al.: Role of MPR and 3D CT in Cranial and Facial Fractures
238International Journal of Scientifi c Study | April 2016 | Vol 4 | Issue 1
deficits but is not useful as compared to computed tomography (CT) in the evaluation of bony pathologies. The use of multiplanar reconstruction (MPR) and three-dimensional (3D) recon images of multiple detector computed tomography (MDCT) in the musculoskeletal system is of tremendous advantage in traumatic injuries when the results of plain radiography fail to answer the doubts of the surgeons regarding satisfactory alignment of complex fractures. Small structures that are not well seen with conventional CT imaging can be clearly depicted using MPR and 3D overlapping reconstruction at small intervals. Reformatted images also provide complementary information about various conditions including congenital malformation, vascular anomalies, and trauma involving the cranial and facial bones. The added advantage of MDCT is 3D technology which is very helpful in assessing large comminuted, displaced, and complex fractures involving multiple planes hence providing a road map for surgeons to initiate appropriate management.6-8 These data obtained improve communications between the interpreting radiologist and the referring clinician and between the referring clinician and patients, since multiplanar and 3D reformations, give a real-time view of exam data in any plane with the ability to screen-capture the images for the permanent digital archive. MPR and 3D images are usually generated from the original two-dimensional data, and all reformatted images are obtained with the help of a neuroradiology fellow or a post processing technologist. During CT examinations, radiation exposure should be minimized for sensitive organs as prescribed by “ICRP” therefore, the radiologic technologists and radiologists must recognize the risks of patient doses during CT examinations and suggest appropriate protocols to reduce the doses.9,10
MATERIALS AND METHODS
A total of 100 patients with clinical history and examination fi ndings of cranial and facial fractures from Chettinad Hospital and Research Institute who were referred for CT imaging to the Department of Radiology were included in the study. The study was initiated after the approval of Institutional Human Ethics Committee. Informed consent was obtained from the participating conscious subjects/subjects attenders, before the study related procedure. 100 patients fulfi lling the criteria were included in the study; the average age taken was from
22 to 44. Patients were scanned in a Philips Ingenuity Core 128 Slice CT Machine with appropriate brain and facial protocols with bone and soft tissue reconstruction. During the study, proper instructions were given to the patient and protective measures, such as lead aprons, were used to cover the patient’s body and to minimize the radiation dose to the patient. Throughout the procedure vitals were monitored. Fractures that were assessed include hairline, simple undisplaced, communited, and simple displaced. The images obtained were subjected to radiological analysis and interpretation (Table 1).
Selection CriteriaInclusion criteria: Traumatic cranial and facial fractures.
Exclusion criteria: Pregnant and lactating women. Nontraumatic.
RESULTS
The results of the present study revealed that compared to the four types of fractures, simple undisplaced was found to be the most frequently occurring one, wherein MPR technique was found to be more detective for fractures compared to (Figures 1-4 and Graphs 1-3):1. MRP and 3D2. MPR, axial, and 3D3. MPR and axial.
Statically analysis was carried out using formula and software t-test.
Table 1: ParameterskVp mAs Slice thickness Increment Fov Scan length DLP mGy*cm CTDI vol mGy*cm100-120 300-350 5 mm 2.5 mm 18-22 250-300 mm 1095 45.0DLP: Dose-length product, Fov: Field of view, CTDI: Computed tomography dose index
Figure 1: Minimally displaced fracture in right parietal and right temporal bones , well depicted in coronal reformatted CT image
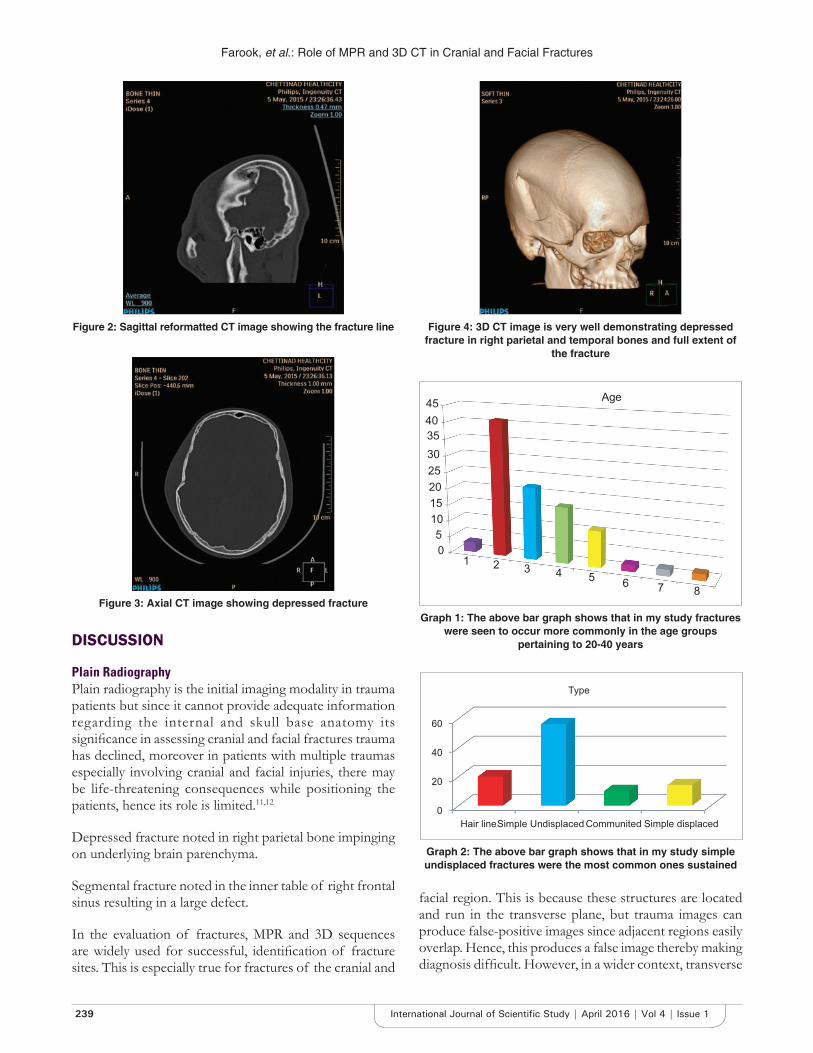
Farook, et al.: Role of MPR and 3D CT in Cranial and Facial Fractures
239 International Journal of Scientifi c Study | April 2016 | Vol 4 | Issue 1
facial region. This is because these structures are located and run in the transverse plane, but trauma images can produce false-positive images since adjacent regions easily overlap. Hence, this produces a false image thereby making diagnosis diffi cult. However, in a wider context, transverse
Figure 2: Sagittal reformatted CT image showing the fracture line
Figure 3: Axial CT image showing depressed fracture
Figure 4: 3D CT image is very well demonstrating depressed fracture in right parietal and temporal bones and full extent of
the fracture
DISCUSSION
Plain RadiographyPlain radiography is the initial imaging modality in trauma patients but since it cannot provide adequate information regarding the internal and skull base anatomy its signifi cance in assessing cranial and facial fractures trauma has declined, moreover in patients with multiple traumas especially involving cranial and facial injuries, there may be life-threatening consequences while positioning the patients, hence its role is limited.11,12
Depressed fracture noted in right parietal bone impinging on underlying brain parenchyma.
Segmental fracture noted in the inner table of right frontal sinus resulting in a large defect.
In the evaluation of fractures, MPR and 3D sequences are widely used for successful, identifi cation of fracture sites. This is especially true for fractures of the cranial and
05
1015202530354045
1 2 3 4 5 6 7 8
Age
Graph 1: The above bar graph shows that in my study fractures were seen to occur more commonly in the age groups
pertaining to 20-40 years
Graph 2: The above bar graph shows that in my study simple undisplaced fractures were the most common ones sustained
0
20
40
60
Hair lineSimple Undisplaced Communited Simple displaced
Type
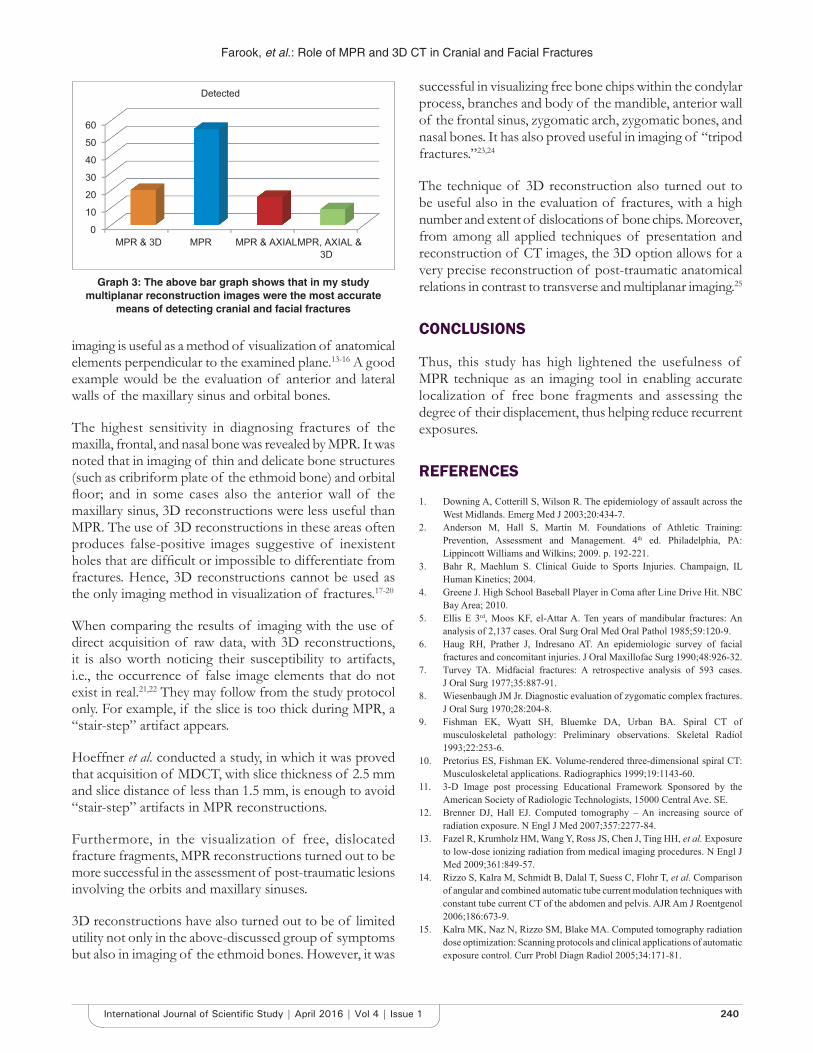
Farook, et al.: Role of MPR and 3D CT in Cranial and Facial Fractures
240International Journal of Scientifi c Study | April 2016 | Vol 4 | Issue 1
imaging is useful as a method of visualization of anatomical elements perpendicular to the examined plane.13-16 A good example would be the evaluation of anterior and lateral walls of the maxillary sinus and orbital bones.
The highest sensitivity in diagnosing fractures of the maxilla, frontal, and nasal bone was revealed by MPR. It was noted that in imaging of thin and delicate bone structures (such as cribriform plate of the ethmoid bone) and orbital fl oor; and in some cases also the anterior wall of the maxillary sinus, 3D reconstructions were less useful than MPR. The use of 3D reconstructions in these areas often produces false-positive images suggestive of inexistent holes that are diffi cult or impossible to differentiate from fractures. Hence, 3D reconstructions cannot be used as the only imaging method in visualization of fractures.17-20
When comparing the results of imaging with the use of direct acquisition of raw data, with 3D reconstructions, it is also worth noticing their susceptibility to artifacts, i.e., the occurrence of false image elements that do not exist in real.21,22 They may follow from the study protocol only. For example, if the slice is too thick during MPR, a “stair-step” artifact appears.
Hoeffner et al. conducted a study, in which it was proved that acquisition of MDCT, with slice thickness of 2.5 mm and slice distance of less than 1.5 mm, is enough to avoid “stair-step” artifacts in MPR reconstructions.
Furthermore, in the visualization of free, dislocated fracture fragments, MPR reconstructions turned out to be more successful in the assessment of post-traumatic lesions involving the orbits and maxillary sinuses.
3D reconstructions have also turned out to be of limited utility not only in the above-discussed group of symptoms but also in imaging of the ethmoid bones. However, it was
successful in visualizing free bone chips within the condylar process, branches and body of the mandible, anterior wall of the frontal sinus, zygomatic arch, zygomatic bones, and nasal bones. It has also proved useful in imaging of “tripod fractures.”23,24
The technique of 3D reconstruction also turned out to be useful also in the evaluation of fractures, with a high number and extent of dislocations of bone chips. Moreover, from among all applied techniques of presentation and reconstruction of CT images, the 3D option allows for a very precise reconstruction of post-traumatic anatomical relations in contrast to transverse and multiplanar imaging.25
CONCLUSIONS
Thus, this study has high lightened the usefulness of MPR technique as an imaging tool in enabling accurate localization of free bone fragments and assessing the degree of their displacement, thus helping reduce recurrent exposures.
REFERENCES
1. Downing A, Cotterill S, Wilson R. The epidemiology of assault across the West Midlands. Emerg Med J 2003;20:434-7.
2. Anderson M, Hall S, Martin M. Foundations of Athletic Training: Prevention, Assessment and Management. 4th ed. Philadelphia, PA: Lippincott Williams and Wilkins; 2009. p. 192-221.
3. Bahr R, Maehlum S. Clinical Guide to Sports Injuries. Champaign, IL Human Kinetics; 2004.
4. Greene J. High School Baseball Player in Coma after Line Drive Hit. NBC Bay Area; 2010.
5. Ellis E 3rd, Moos KF, el-Attar A. Ten years of mandibular fractures: An analysis of 2,137 cases. Oral Surg Oral Med Oral Pathol 1985;59:120-9.
6. Haug RH, Prather J, Indresano AT. An epidemiologic survey of facial fractures and concomitant injuries. J Oral Maxillofac Surg 1990;48:926-32.
7. Turvey TA. Midfacial fractures: A retrospective analysis of 593 cases. J Oral Surg 1977;35:887-91.
8. Wiesenbaugh JM Jr. Diagnostic evaluation of zygomatic complex fractures. J Oral Surg 1970;28:204-8.
9. Fishman EK, Wyatt SH, Bluemke DA, Urban BA. Spiral CT of musculoskeletal pathology: Preliminary observations. Skeletal Radiol 1993;22:253-6.
10. Pretorius ES, Fishman EK. Volume-rendered three-dimensional spiral CT: Musculoskeletal applications. Radiographics 1999;19:1143-60.
11. 3-D Image post processing Educational Framework Sponsored by the American Society of Radiologic Technologists, 15000 Central Ave. SE.
12. Brenner DJ, Hall EJ. Computed tomography – An increasing source of radiation exposure. N Engl J Med 2007;357:2277-84.
13. Fazel R, Krumholz HM, Wang Y, Ross JS, Chen J, Ting HH, et al. Exposure to low-dose ionizing radiation from medical imaging procedures. N Engl J Med 2009;361:849-57.
14. Rizzo S, Kalra M, Schmidt B, Dalal T, Suess C, Flohr T, et al. Comparison of angular and combined automatic tube current modulation techniques with constant tube current CT of the abdomen and pelvis. AJR Am J Roentgenol 2006;186:673-9.
15. Kalra MK, Naz N, Rizzo SM, Blake MA. Computed tomography radiation dose optimization: Scanning protocols and clinical applications of automatic exposure control. Curr Probl Diagn Radiol 2005;34:171-81.
Graph 3: The above bar graph shows that in my study multiplanar reconstruction images were the most accurate
means of detecting cranial and facial fractures
0
10
20
30
40
50
60
MPR & 3D MPR MPR & AXIALMPR, AXIAL &3D
Detected

Farook, et al.: Role of MPR and 3D CT in Cranial and Facial Fractures
241 International Journal of Scientifi c Study | April 2016 | Vol 4 | Issue 1
16. Fishman EK, Ney DR. Advanced computer applications in radiology: Clinical applications. Radiographics 1993;13:463-75.
17. Hoeffner EG, Quint DJ, Peterson B, Rosenthal E, Goodsitt M. Development of a protocol for coronal reconstruction of the maxillofacial region from axial helical CT data. Br J Radiol 2001;74:323-7.
18. Sanderov B, Viccellio P. Fractures of the medial orbital wall. Ann Emerg Med 1988;17:973-6.
19. Olszycki M, Kozakiewicz M, Arkuszewski P. Wtórne rekonstrukcje obrazowe TK i MR zmian pourazowych części twarzowej czaszki. Pol J Radiol 2004;69:94-9.
20. Rózylo-Kalinowska I. The infl uence of application of 3D CT reconstructions on classifi cation of maxillofacial fractures. Ann Univ Mariae Curie Sklodowska Med 2002;57:549-55.
21. Bernhardt TM, Rapp-Bernhardt U, Fessel A, Ludwig K, Reichel G,
Grote R. CT scanning of the paranasal sinuses: Axial helical CT with reconstruction in the coronal direction versus coronal helical CT. Br J Radiol 1998;71:846-51.
22. Abrahams JJ. Dental CT imagnig: A look at the jaw. Radiology 2001;219:334-45.
23. Daly BD, Russell JL, Davidson MJ, Lamb JT. Thin section computed tomography in the evaluation of naso-ethmoidal trauma. Clin Radiol 1990;41:272-5.
24. Pogorzelska-Stronczak B, Koszowski R, Lelek P. Zastosowanie TK z rekonstrukcją MRP i 3D w diagnostyce schorzeń części twarzowej czaszki. Przegl Lek 2002;59:4.
25. Rózylo-Kalinowska I, Rózylo TK. Diagnostic algorithm in high (cranial) maxillofacial fractures. Ann Univ Mariae Curie Sklodowska Med 2000;55:309-17.
How to cite this article: Farook AK, Ilangovan G, Ravi R, Farook AS, Magudeeswaran PK. Role of Multiplanar Reconstruction Imaging and Three-dimensional Computed Tomography Imaging in Diagnosing Cranial and Facial Fractures. Int J Sci Stud 2016;4(1):237-241.
Source of Support: Nil, Confl ict of Interest: None declared.
242International Journal of Scientifi c Study | April 2016 | Vol 4 | Issue 1
Clinicopathological Study of Lichen Planus in a Tertiary Care CenterLakshmipriya Gurusamy1, Uma Selvaraj2
1Assistant Professor, Department of Dermatology, Saveetha Medical College Hospital, Thandalam, Kancheepuram, Tamil Nadu, India,2Senior Assistant Professor, Department of Dermatology, Government Theni Medical College Hospital, Theni, Tamil Nadu, India
racial predilection has been noted. Exact etiology is not known. It is considered to be due to the cell-mediated immune response to an epidermal antigen in genetically predisposed persons.3 Infections, drugs, dental amalgam materials, and stress are known to be triggering factors. The classical lesions of cutaneous LP are violaceous, polygonal fl at-topped papules and plaques associated with intense itching. The sites of predilection are fl exor surface of wrists, trunk, and thighs. Lesions can appear along sites of trauma. This is known as Koebner’s phenomenon. This study was done to document and analyze the clinicopathological profi le of LP in Indian population.
MATERIALS AND METHODS
The study was conducted in the Department of Dermatology, Government Rajaji Hospital, Madurai, Tamil Nadu, India. A total of 90 patients clinically
INTRODUCTION
Lichen planus (LP) is an idiopathic papulosquamous disease of the skin, mucous membranes, and nails. The exact incidence and prevalence of LP are unknown, but the overall prevalence is believed to be less than 1% of the general population.1 LP commonly affects middle-aged adults though any age can be affected. About 2/3rd cases occur between 30 and 60 years of age.2 A slight female preponderance has been reported. Males have an earlier age of onset (4th decade) than females (5th decade). No
Original Article
Abstract
Background: Lichen planus (LP) is an idiopathic papulosquamous disease of the skin and mucous membranes. The classical lesions are violaceous, fl at-topped polygonal papules associated with intense itching. It is worldwide in distribution with a variable incidence between 0.14% and 0.80%.
Aims: The objective of the study was to fi nd out the clinicopathological profi le of LP cases seen among patients attending the dermatology out-patient department in a tertiary care center.
Materials and Methods: A total of 90 patients were clinically diagnosed as LP during the study period. A detailed clinical history was elicited, and clinical examination was done for all the patients, and the fi ndings were meticulously recorded. Relevant lab investigations and skin biopsy of the lesional sites were done.
Results: LP constituted 0.16% of the total patients diagnosed during the period of study. 51% of patients were between 31 and 50 years of age. Papules were present in 79%, and plaques were present in 14% of the patients. 21% of patients had oral mucosal involvement, and nail involvement was seen in 17%. The diseases, which were found to be associated with LP, were diabetes mellitus, hypertension, hypothyroidism, vitiligo, and alopecia areata. The malignant change was observed in a case of long-standing hypertrophic LP.
Conclusion: In our study, the majority of patients fall in the 31-50 years age group. Various studies show that childhood involvement is uncommon. In our study, childhood LP accounted for about 9% of cases. There was a complete correlation between clinical types and histopathological features in all the patients.
Key words: Lichen planus, Papulosquamous, Violaceous
Access this article online
www.ijss-sn.com
Month of Submission : 02-2016Month of Peer Review : 03-2016Month of Acceptance : 03-2016Month of Publishing : 04-2016
Corresponding Author: Dr. Uma Selvaraj, 15/1/38A, Arjun Illam, Sivanantha Nagar, P.C. Patty, Theni - 625 531, Tamil Nadu, India. E-mail: [email protected]
DOI: 10.17354/ijss/2016/225

Gurusamy and Selvaraj: A Clinicopathological Study of Lichen Planus
243 International Journal of Scientifi c Study | April 2016 | Vol 4 | Issue 1
diagnosed as LP during a study period of one year were taken for the study. A detailed clinical history, including duration, site of onset, symptoms, drug history, and family history, was elicited. A complete general examination, systemic examination, and dermatological examination were made. Digital photographs were taken. The morphology and distribution of skin lesions, presence of any other associated diseases were noted. The concomitant affection of mucosa, hair, nails, palms, soles, and genital involvement was recorded. Laboratory investigations such as urine examination, blood sugar, liver function tests, blood venereal disease research laboratory, and complete hemogram were done. Skin biopsy was done in all the patients after obtaining informed consent. Sections stained with hematoxylin and eosin was used to study the histological features of LP.
OBSERVATIONS AND RESULTS
The following observations were made from the study. Out of 90 cases of LP studied, 60 (66.66%) were of LP classical type. Other types of LP encountered were hypertrophic, eruptive, linear, annular, follicular, actinic, LP pigmentosus, lupus erythematosus (LE)/LP overlap, and isolated oral LP (Table 1). The majority of patients were in the age group of 31-50 years (Table 2).
About 46/90 patients were females and 44/90 were males (Table 3). The initial site of onset was limbs in 63% (Figure 1), trunk in 21%, face in 8%, oral mucosa in 6%, and genital mucosa in 2%. Papules were seen in 79%, and plaques were seen in 14% of the patients. Koebner’s phenomenon was seen in 33% of the patients. The presenting symptoms of the patients were itching in 73% and pain in 7% and 20% were asymptomatic. Childhood LP was seen in 9% (8 patients). Oral mucosal involvement was noted in 19 patients. Reticular, plaque type, and erosive patterns were seen in oral lesions of 11, 5, and 3 patients, respectively. Genital lesions were observed in 9 male patients (10%). Nail changes were seen in 16 patients (18%). Pterygium was found in 3 of the patients. Other nail changes noted were longitudinal ridging, onychomadesis, trachyonychia, nail plate thinning, longitudinal melanonychia, onychoschizia, and punctate leukonychia. Palmoplantar lesions were associated in 20% of cases. Mucosal and palmoplantar involvement were not seen in children. The diseases which were found in the association were diabetes mellitus in 6 patients (6.6%), hypertension in 2 patients, and hypothyroidism in 2 patients. Vitiligo was seen in a patient and alopecia areata was observed in a patient. Squamous cell carcinoma was found in a case of long-standing hypertrophic LP.
Table 1: Clinical types of LPClinical types of LP Number of patients (%)Classical 60 (66.66)Hypertrophic 10 (11.11)Linear 5 (5.55)Eruptive 4 (4.44)LP pigmentosus 3 (3.33)Oral 2 (2.22)Annular 2 (2.22)Follicular 2 (2.22)Actinic 1 (1.11)LE/LP overlap 1 (1.11)LP: Lichen planus, LE: Lupus eythematosus
Table 2: Age distributionAge group in years Number of patients (%)0-10 6 (6.67)11-20 8 (8.88)21-30 16 (17.77)31-40 24 (26.66)41-50 22 (24.44)51-60 10 (11.11)61-70 4 (4.44)
Table 3: Sex distributionClinical type of LP
Number of male patients
Number of female patients
Classical 27 33Eruptive 3 1LP pigmentosus 1 2Oral LP - 2Annular 2 -Hypertrophic 7 3Linear 3 2Actinic - 1Follicular 1 1LE/LP overlap - 1LP: Lichen planus, LE: Lupus eythematosus
Figure 1: Violaceous papules of lichen planus
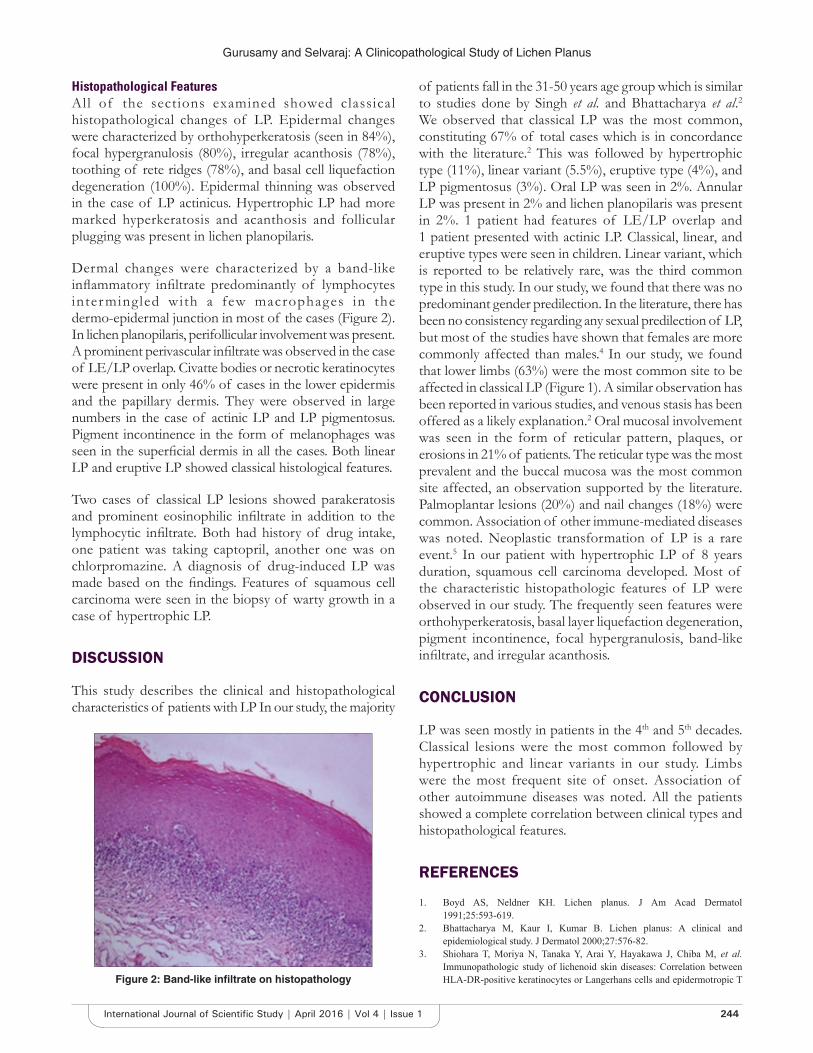
Gurusamy and Selvaraj: A Clinicopathological Study of Lichen Planus
244International Journal of Scientifi c Study | April 2016 | Vol 4 | Issue 1
Histopathological FeaturesAll of the sections examined showed classical histopathological changes of LP. Epidermal changes were characterized by orthohyperkeratosis (seen in 84%), focal hypergranulosis (80%), irregular acanthosis (78%), toothing of rete ridges (78%), and basal cell liquefaction degeneration (100%). Epidermal thinning was observed in the case of LP actinicus. Hypertrophic LP had more marked hyperkeratosis and acanthosis and follicular plugging was present in lichen planopilaris.
Dermal changes were characterized by a band-like infl ammatory infi ltrate predominantly of lymphocytes inter mingled with a few macrophages in the dermo-epidermal junction in most of the cases (Figure 2). In lichen planopilaris, perifollicular involvement was present. A prominent perivascular infi ltrate was observed in the case of LE/LP overlap. Civatte bodies or necrotic keratinocytes were present in only 46% of cases in the lower epidermis and the papillary dermis. They were observed in large numbers in the case of actinic LP and LP pigmentosus. Pigment incontinence in the form of melanophages was seen in the superfi cial dermis in all the cases. Both linear LP and eruptive LP showed classical histological features.
Two cases of classical LP lesions showed parakeratosis and prominent eosinophilic infi ltrate in addition to the lymphocytic infi ltrate. Both had history of drug intake, one patient was taking captopril, another one was on chlorpromazine. A diagnosis of drug-induced LP was made based on the fi ndings. Features of squamous cell carcinoma were seen in the biopsy of warty growth in a case of hypertrophic LP.
DISCUSSION
This study describes the clinical and histopathological characteristics of patients with LP In our study, the majority
of patients fall in the 31-50 years age group which is similar to studies done by Singh et al. and Bhattacharya et al.2 We observed that classical LP was the most common, constituting 67% of total cases which is in concordance with the literature.2 This was followed by hypertrophic type (11%), linear variant (5.5%), eruptive type (4%), and LP pigmentosus (3%). Oral LP was seen in 2%. Annular LP was present in 2% and lichen planopilaris was present in 2%. 1 patient had features of LE/LP overlap and 1 patient presented with actinic LP. Classical, linear, and eruptive types were seen in children. Linear variant, which is reported to be relatively rare, was the third common type in this study. In our study, we found that there was no predominant gender predilection. In the literature, there has been no consistency regarding any sexual predilection of LP, but most of the studies have shown that females are more commonly affected than males.4 In our study, we found that lower limbs (63%) were the most common site to be affected in classical LP (Figure 1). A similar observation has been reported in various studies, and venous stasis has been offered as a likely explanation.2 Oral mucosal involvement was seen in the form of reticular pattern, plaques, or erosions in 21% of patients. The reticular type was the most prevalent and the buccal mucosa was the most common site affected, an observation supported by the literature. Palmoplantar lesions (20%) and nail changes (18%) were common. Association of other immune-mediated diseases was noted. Neoplastic transformation of LP is a rare event.5 In our patient with hypertrophic LP of 8 years duration, squamous cell carcinoma developed. Most of the characteristic histopathologic features of LP were observed in our study. The frequently seen features were orthohyperkeratosis, basal layer liquefaction degeneration, pigment incontinence, focal hypergranulosis, band-like infi ltrate, and irregular acanthosis.
CONCLUSION
LP was seen mostly in patients in the 4th and 5th decades. Classical lesions were the most common followed by hypertrophic and linear variants in our study. Limbs were the most frequent site of onset. Association of other autoimmune diseases was noted. All the patients showed a complete correlation between clinical types and histopathological features.
REFERENCES
1. Boyd AS, Neldner KH. Lichen planus. J Am Acad Dermatol 1991;25:593-619.
2. Bhattacharya M, Kaur I, Kumar B. Lichen planus: A clinical and epidemiological study. J Dermatol 2000;27:576-82.
3. Shiohara T, Moriya N, Tanaka Y, Arai Y, Hayakawa J, Chiba M, et al. Immunopathologic study of lichenoid skin diseases: Correlation between HLA-DR-positive keratinocytes or Langerhans cells and epidermotropic T Figure 2: Band-like infi ltrate on histopathology

Gurusamy and Selvaraj: A Clinicopathological Study of Lichen Planus
245 International Journal of Scientifi c Study | April 2016 | Vol 4 | Issue 1
cells. J Am Acad Dermatol 1988;18:67-74.4. Altman J, Perry HO. The variations and course of lichen planus. Arch
Dermatol 1961;84:179-91.
5. Castaño E, López-Ríos F, Alvarez-Fernández JG, Rodríguez-Peralto JL, Iglesias L. Verrucous carcinoma in association with hypertrophic lichen planus. Clin Exp Dermatol 1997;22:23-5.
How to cite this article: Gurusamy L, Selvaraj U. Clinicopathological Study of Lichen Planus in a Tertiary Care Center. Int J Sci Stud 2016;4(1):242-245.
Source of Support: Nil, Confl ict of Interest: None declared.
246International Journal of Scientifi c Study | April 2016 | Vol 4 | Issue 1
Comparative Study of Intrathecal Dexmedetomidine and Buprenorphine as Adjuvant to Bupivacaine in Spinal Anaesthesia: A Randomized Controlled TrailKannan Bojaraaj1, S Vijayaragavan1, S Senthilkumar1, M A Mohammed Thaiyub Khan2
1Associate Professor, Department of Anaesthesiology, Government Thoothukudi Medical College, Thoothukudi, Tamil Nadu, India, 2Assistant Professor, Department of Anaesthesiology, Government Thoothukudi Medical College, Thoothukudi, Tamil Nadu, India
duration of anesthesia and analgesia, and decrease the dose of local anesthetics.1 Dexmedetomidine is a highly selective α2 agonist and introduced in clinical practice in 1999.
The food and dr ug adminis t ra t ion approved dexmedetomidine use for short-term sedation and analgesia in intensive care unit. Although Food and Drug Administration has not approved dexmedetomidine as an adjuvant in neuraxial blocks. In neuraxial anesthesia, dexmedetomidine mediates its analgesia effects via spinal α2 receptors by depressing the release of C-fi ber neurotransmitters and hyperpolarization of post-synaptic dorsal neuron.2 Buprenorphine is an opioid used frequently
INTRODUCTION
In subarachnoid blocks, local anesthetics are widely used in combination with adjuvants nowadays to shorten the onset of action, increase the quality of block, increase the
Original Article
Abstract
Background: Various adjuvants were used with local anesthetic in subarachnoid blocks to improve the quality and effi cacy. Nowadays, non-opioids like dexmedetomidine had also been introduced in neuraxial blocks and to be investigated as a useful and effective adjuvant.
Aim: The aim of this study is to evaluate and compare intrathecal dexmedetomidine and intrathecal buprenorphine as an adjuvant to 0.5% hyperbaric bupivacaine for lower abdominal surgeries with respect to sensory and motor blockade, hemodynamic changes, and adverse effects.
Materials and Methods: This prospective, randomized, double-blind study was conducted on 60 adult patients of ASA physical status 1 and 2 in the age group of 18-60 years, posted for elective lower abdominal surgeries. The patients were randomly allocated into two groups, namely, Group BB and Group BD of 30 each. Patients in Group BB received 75 mcg of buprenorphine with 0.5% hyperbaric bupivacaine 15 mg intrathecally. Patient in Group BD received 5 mcg of dexmedetomidine with 0.5% bupivacaine 15 mg intrathecally. The following parameters observed were onset and duration of sensory and motor block, time for sensory regression to S1, degree of sedation, hemodynamic stability, and any side effects associated with these drugs. Collected data were analyzed using appropriate statistics.
Results: There was no signifi cant difference between groups regarding demographic characteristics and type of surgery. The onsets of sensory and motor blockades were not statistically signifi cant. The duration of sensory blockade was prolonged in dexmedetomidine group (51%) compared to buprenorphine group. Sensory regression to S1 was also got prolonged in dexmedetomidine group. The sedation level was higher in Group BD (dexmedetomidine) compared to Group BB (buprenorphine).
Conclusion: Dexmedetomidine as an intrathecal adjuvant with 0.5% hyperbaric bupivacaine prolong the sensory and motor blockade with fewer side effects, and the degree of sedation is better.
Key words: α2 adrenergic agonist, Buprenorphine, Dexmedetomidine, Lower abdominal surgery
Access this article online
www.ijss-sn.com
Month of Submission : 02-2016Month of Peer Review : 03-2016Month of Acceptance : 03-2016Month of Publishing : 04-2016
Corresponding Author: Dr. Kannan Bojaraaj, Department of Anaesthesiology, Government Thoothukudi Medical College, Thoothukudi, Tamil Nadu, India. E-mail: [email protected]
DOI: 10.17354/ijss/2016/226

Bojaraaj, et al.: Intrathecal Dexmedetomidine as Adjuvant in Spinal Anaesthesia
247 International Journal of Scientifi c Study | April 2016 | Vol 4 | Issue 1
as an adjuvant in spinal anesthesia for post-operative pain relief.3-5 It exhibits analgesic property both at spinal and supraspinal levels.6,7 It has been used for various surgeries at different doses for the past decades. It has consistently proven to prolong the duration of anesthesia.3,4,8
The aim of this study is to evaluate and compare intrathecal dexmedetomidine and intrathecal buprenorphine as an adjuvant to 0.5% hyperbaric bupivacaine for lower abdominal surgeries with respect to sensory and motor blockade, hemodynamic changes, and adverse effects.
MATERIALS AND METHODS
After approved by the Institutional and Ethical Committee, this study was conducted in 60 ASA I and II patients undergoing elective lower abdominal surgeries under subarachnoid block, and all patients are explained about the procedure and written informed consent was obtained in the age group of 18-60 years.
The detailed pre-anesthetic check-up was done on all patients and relevant hematological, biochemical, and radiological investigations were carried out for all patients as per surgical requirements. Patients with known contraindication for spinal anesthesia or with coagulation disorders or on anticoagulation therapy or with cardiac illness were excluded from this study.
The patients were randomly allocated into two groups to each using closed cover technique. BD group patient received 3 ml 0.5% bupivacaine (15 mg) and dexmedetomidine (5 μg) in 0.5 ml normal saline. BB group patient received 3 ml or 0.5% bupivacaine (15 mg) and 0.5 ml by buprenorphine (75 μg). A total volume of the injected solution was 3.5 ml in both groups.
Anesthetic ProceduresIn the operating room, appropriate equipment for the airway management and emergency drugs were kept ready. Non-invasive blood pressure monitor, pulse oximeter, and electrocardiogram (ECG) leads were connected to the patient. Pre-operative baseline systolic and diastolic blood pressure recorded and intravenous line were secured. Patients are preloaded with 10 ml/kg of ringer lactate infusion 10 min before the subarachnoid block.
On sitting position, the skin over the back was prepared with antiseptic solution and draped with sterile towel. After skin infi ltration lignocaine 2%, 26G Quinke needle was inserted at L3-4 intervertebral space after confi rmation of free fl ow of cerebrospinal fl uid, the prepared solution was injected. The patients were made lie after the injection immediately and time was noted.
The follow-up parameters noted are as follows: (a) Time of injection of subarachnoid block, (b) time of onset and duration of the block, (c) time of onset and duration of motor block, (d) degree of sedation, (e) time for surgery regression to S1 dermatome and (f) duration of surgical procedure, and (g) systolic and diastolic blood pressure, mean arterial blood pressure, pulse rate and oxygen saturation were recorded at 0, 3, and 5 min and there after every 5 min up to 45 min of the procedure.
Adverse Effects1. Hypotension was said to have occurred mean arterial
pressure fell less than 60 mmHg2. Bradycardia was defi ned if heart rate <50/min3. Respiratory depression if respiratory rate <8/min or
SpO2 <90%4. Any discomfort such as nausea, vomiting shivering,
pruritus, and ECG changes was noted5. Vomiting was planned to manage with ondansetron
4 mg intravenously6. Ramsay sedation score was used to assess the degree
sedation7. In completion of surgery patient was shifted to
post-anesthesia care unit for observation8. Injection diclofenac sodium 75 mg was given as
rescue analgesic when patient complained of pain in post-operative period.
RESULTS
Patient demographic data that includes age, sex and duration of surgery between groups were comparable (Tables 1 and 2, Graphs 1 and 2). The time of onset of surgery block was slower in group PB (3.47 ± 0.507) when compared with Group BD (2.57 ± 0.504), and the p value was statistically not signifi cant (0.629 > 0.05) (Table 3 and Graph 3). The average time taken for the onset of motor block was 3.38 min in Group BB and 4.13 min in Group BD. It was statistically not signifi cant (P = 0.775 > 0.05) (Table 4 and Graph 4).
The mean duration of sensory block was shorter in Group BB (332 ± 18.81 min) when compared with Group BD (502.13 ± 12.27 min) and statistically signifi cant (P < 0.05). The mean duration of sensory block in Group BD is 51% longer than Group BB (Table 5 and Graph 5). The mean duration of motor block was shorter in Group BB (298.63 ± 35.79 min) when compared with Group BD (432.33 ± 12.74 min) and statistically signifi cant (P < 0.05). The mean duration of motor block in Group BD is about approximately 44% longer than Group BB (Table 6 and Graph 6). The time of surgery regression to S1 was shorter in Group BB (272.27 ± 15.39 min) when compared

Bojaraaj, et al.: Intrathecal Dexmedetomidine as Adjuvant in Spinal Anaesthesia
248International Journal of Scientifi c Study | April 2016 | Vol 4 | Issue 1
Table 1: Age distributionAge group N (%)
Group BB Group BDAge in years
Below 30 6 (20) 8 (26.7)31-40 9 (30) 6 (20)41-50 6 (20) 9 (30)Above 50 9 (30) 7 (23.3)Total 30 (100) 30 (100)
Range 19-60 years 18-60 yearsMean±SD 42.33±12.88 40.57±13.22P value 0.875 not signifi cantSD: Standard deviation
Table 2: Sex distributionSex N (%)
Group BB Group BDMale 25 (83.3) 23 (76.7)Female 5 (16.7) 7 (23.3)Total 30 (100) 30 (100)P value 0.752 not signifi cant
Table 3: Time of onset of sensory blockParameter Time of on set of sensory block
(in minutes)Group BB Group BD
Range 3-4 2-3Mean±SD 3.47±0.507 2.57±0.504P value 0.629 not Signifi cantSD: Standard deviation
Table 4: Time of onset of motor blockParameter Time of onset of motor block
(in minutes)Group BB Group BD
Range 3-5 3-5Mean±SD 3.83±0.817 4.13±0.78P value 0.775 not signifi cantSD: Standard deviation
Table 5: Duration of sensory blockParameter Duration of sensory block (in minutes)
Group BB Group BDRange 303-360 480-520Mean±SD 332±18.81 502.13±12.27P value 0.005 signifi cantSD: Standard deviation
Graph 1: Age distribution
Graph 2: Sex distribution
Graph 3: Onset of sensory block
to with Group BD (398.1 ± 6.50 min) and statistically signifi cant (P < 0.05) (Table 7 and Graph 7).
The mean arterial pressure was monitored from preoperative basal to 45 min of procedure (11 intervals) none of the
intervals had statistically signifi cant (Table 8 and Graph 8). Heart rate was recorded in 11 intervals out of which only 2 intervals (0 and 3rd min) was statistically signifi cant (Table 9 and Graph 9). The degree of sedation by using Ramsay sedation scale, better in Group BD when compared to Group BB (Table 10).
DISCUSSION
It has been found recently that prolonged duration of action of buprenorphine is due to its local anesthetic action.9 The lesser side effects in the post-operative period were due to its high lipid solubility.10
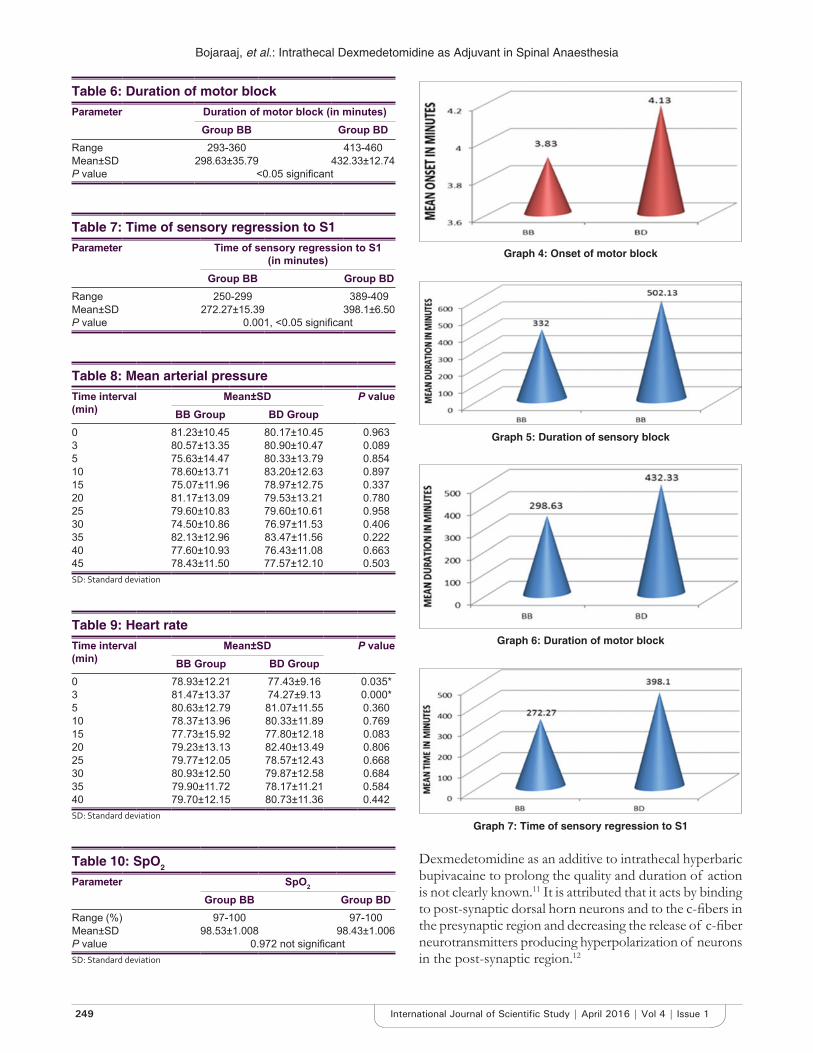
Bojaraaj, et al.: Intrathecal Dexmedetomidine as Adjuvant in Spinal Anaesthesia
249 International Journal of Scientifi c Study | April 2016 | Vol 4 | Issue 1
Table 6: Duration of motor blockParameter Duration of motor block (in minutes)
Group BB Group BDRange 293-360 413-460Mean±SD 298.63±35.79 432.33±12.74P value <0.05 signifi cant
Table 7: Time of sensory regression to S1Parameter Time of sensory regression to S1
(in minutes)Group BB Group BD
Range 250-299 389-409Mean±SD 272.27±15.39 398.1±6.50P value 0.001, <0.05 signifi cant
Table 8: Mean arterial pressureTime interval (min)
Mean±SD P valueBB Group BD Group
0 81.23±10.45 80.17±10.45 0.9633 80.57±13.35 80.90±10.47 0.0895 75.63±14.47 80.33±13.79 0.85410 78.60±13.71 83.20±12.63 0.89715 75.07±11.96 78.97±12.75 0.33720 81.17±13.09 79.53±13.21 0.78025 79.60±10.83 79.60±10.61 0.95830 74.50±10.86 76.97±11.53 0.40635 82.13±12.96 83.47±11.56 0.22240 77.60±10.93 76.43±11.08 0.66345 78.43±11.50 77.57±12.10 0.503SD: Standard deviation
Table 9: Heart rateTime interval (min)
Mean±SD P valueBB Group BD Group
0 78.93±12.21 77.43±9.16 0.035*3 81.47±13.37 74.27±9.13 0.000*5 80.63±12.79 81.07±11.55 0.36010 78.37±13.96 80.33±11.89 0.76915 77.73±15.92 77.80±12.18 0.08320 79.23±13.13 82.40±13.49 0.80625 79.77±12.05 78.57±12.43 0.66830 80.93±12.50 79.87±12.58 0.68435 79.90±11.72 78.17±11.21 0.58440 79.70±12.15 80.73±11.36 0.442SD: Standard deviation
Table 10: SpO2
Parameter SpO2
Group BB Group BDRange (%) 97-100 97-100Mean±SD 98.53±1.008 98.43±1.006P value 0.972 not signifi cantSD: Standard deviation
Graph 4: Onset of motor block
Graph 5: Duration of sensory block
Graph 6: Duration of motor block
Graph 7: Time of sensory regression to S1
Dexmedetomidine as an additive to intrathecal hyperbaric bupivacaine to prolong the quality and duration of action is not clearly known.11 It is attributed that it acts by binding to post-synaptic dorsal horn neurons and to the c-fi bers in the presynaptic region and decreasing the release of c-fi ber neurotransmitters producing hyperpolarization of neurons in the post-synaptic region.12

Bojaraaj, et al.: Intrathecal Dexmedetomidine as Adjuvant in Spinal Anaesthesia
250International Journal of Scientifi c Study | April 2016 | Vol 4 | Issue 1
Graph 8: Comparison of mean arterial pressure
Graph 9: Comparison of heart rate
Kanazi et al.13 have used 3 mg of dexmedetomidine and said to have equipotent effect with clonidine. Eid et al.14 studied the effects of dexmedetomidine on dose related manner (10 mcg and 15 mcg) and confi rmed the prolongation of duration of analgesia. Many studies have chosen 5 mg of dexmedetomidine as an additive to buprenorphine and proven effi ciency.15 Hence, in our study, we choose 5 μg dexmedetomidine as an additive.
In this study, dexmedetomidine group prolonged duration of analgesia compared to buprenorphine group which has 51% higher than later. Gupta et al.16 had shown similar results. In our study itself, motor blockade in dexmedetomidine group was about 45% prolonged and this could be explained by increased dosage used comparing with Gupta et al.,16 study.
It was noted that 2 cases of bradycardia and nil cases of hypotension in dexmedetomidine group where on 6 cases of bradycardia and 8 cases of hypotension in buprenorphine group and they were managed successfully with the use of atropine 0.6 mg intravenously and
ephedrine in incremental doses of 6 mg. Gupta et al.16 study, the incidence of bradycardia was more in dexmedetomidine group. Dexmedetomidine causes bradycardia but the effect is more prominent when administered intravenously with higher doses.17 The sedation score (Ramsay sedation scale) was higher in patients belonging to dexmedetomidine group as compared to buprenorphine group and it is statistically signifi cant.
LIMITATION
The absence of control group to compare the effect of drugs separately is lacking in our study.
CONCLUSION
Dexmedetomidine as intrathecal adjuvant with 0.5% hyperbaric bupivacaine prolong the sensory and motor blockade with fewer side effects and the degree of sedation is better.
REFERENCES
1. Solanki SL, Goyal VK. Neuraxial dexmedetomidine: Wonder drug or simply harmful. Anesth Pain Med 2015;5:e22651.
2. Solanki SL, Bharathi N, Batray K, Jain A, Kumar P, Nijjar SA. The analgesic effect of intrathecal dexmedetomidine or clonidine with bupivacaine in trauma patients undergoing lowerlimb surgery. A randomised, double blind study. Anaesth Intensive Care 2013;41:51-6.
3. Shaikh SI, Kiran M. Intrathecal buprenorphine for postoperative analgesia. A prospective randomized double blinded study. J Anaesth Clin Pharmacol 2010;26:35-8.
4. Dixit S. Postoperative analgesia after caesarean section and experience with buprenorphine. Indian J Anaesth 2007;51:515-8.
5. Capogna G, Celleno D, Tagariello V, Loffreda-Mancinelli C. Intrathecal buprenorphine for postoperative analgesia in the elderly patient. Anaesthesia 1988;43:128-30.
6. Gupta R, Bogra J, Verma R, Kohli M, Kushwaha JK, Kumar S. Dexmedetomidine as an intrathecal adjuvant for postoperative analgesia. Indian J Anaesth 2011;55:347-51.
7. Ding Z, Raffa RB. Identifi cation of an additional supraspinal component to the analgesic mechanism of action of buprenorphine. Br J Pharmacol 2009;157:831-43.
8. Gupta R, Verma R, Bogra J, Kohli M, Raman R, Kushwaha JK. A Comparative study of intrathecal dexmedetomidine and fentanyl as adjuvants to Bupivacaine. J Anaesthesiol Clin Pharmacol 2011;27:339-43.
9. Leffl er A, Frank G, Kistner K, Niedermirtl F, Koppert W, Reeh PW, et al. Local anesthetic-like inhibition of voltage-gated Na() channels by the partial μ-opioid receptor agonist buprenorphine. Anesthesiology 2012;116:1335-46.
10. Moore RA, Bullingham RE, McQuay HJ, Hand CW, Aspel JB, Allen MC, et al. Dural permeability to narcotics: In vitro determination and application to extradural administration. Br J Anaesth 1982;54:1117-28.
11. Shah A, Patel I, Gandhi R. Hemodynamic effects of intrathecal dexmedetomidine added to ropivacaine intraoperatively and for postoperative analgesia. Int J Basic Clin Pharmacol 2013;2:26-9.
12. Eisenach JC, De Kock M, Klimscha W. Alpha(2)-adrenergic agonists for regional anesthesia. A clinical review of clonidine (1984-1995). Anesthesiology 1996;85:655-74.
13. Kanazi GE, Aouad MT, Jabbour-Khoury SI, Al Jazzar MD, Alameddine MM, Al-Yaman R, et al. Effect of low-dose dexmedetomidine or clonidine on
Bojaraaj, et al.: Intrathecal Dexmedetomidine as Adjuvant in Spinal Anaesthesia
251 International Journal of Scientifi c Study | April 2016 | Vol 4 | Issue 1
the characteristics of bupivacaine spinal block. Acta Anaesthesiol Scand 2006;50:222-7.
14. Eid HE, Shafi e MA, Youssef H. Dose related effect of intrathecal dexmedetomidine with hyperbaric bupivacaine - A prospective randomized double blind study. Ain Shams J Anesthesiol 2011;4:83-95.
15. Al-Mustafa MM, Abu-Halaweh SA, Aloweidi AS, Murshidi MM, Ammari BA, Awwad ZM, et al. Effect of dexmedetomidine added to spinal
bupivacaine for urological procedures. Saudi Med J 2009;30:365-70.16. Gupta M, Shailaja S, Hegde KS. Comparison of intrathecal dexmedetomidine
with buprenorphine as adjuvant to bupivacaine in spinal asnaesthesia. J Clin Diagn Res 2014;8:114-7.
17. Fukushima K, Nishimi Y, Mori K, Takeda J. Effect of epidurally administered dexmedetomidine on sympathetic activity and postoperative pain in man. Anesth Analg 1996;82:121.
How to cite this article: Bojaraaj K, Vijayaragavan S, Senthilkumar S, Khan MAM. Comparative Study of Intrathecal Dexmedetomidine and Buprenorphine as Adjuvant to Bupivacaine in Spinal Anesthesia: A Randomized Controlled Trail. Int J Sci Stud 2016;4(1):246-251.
Source of Support: Nil, Confl ict of Interest: None declared.
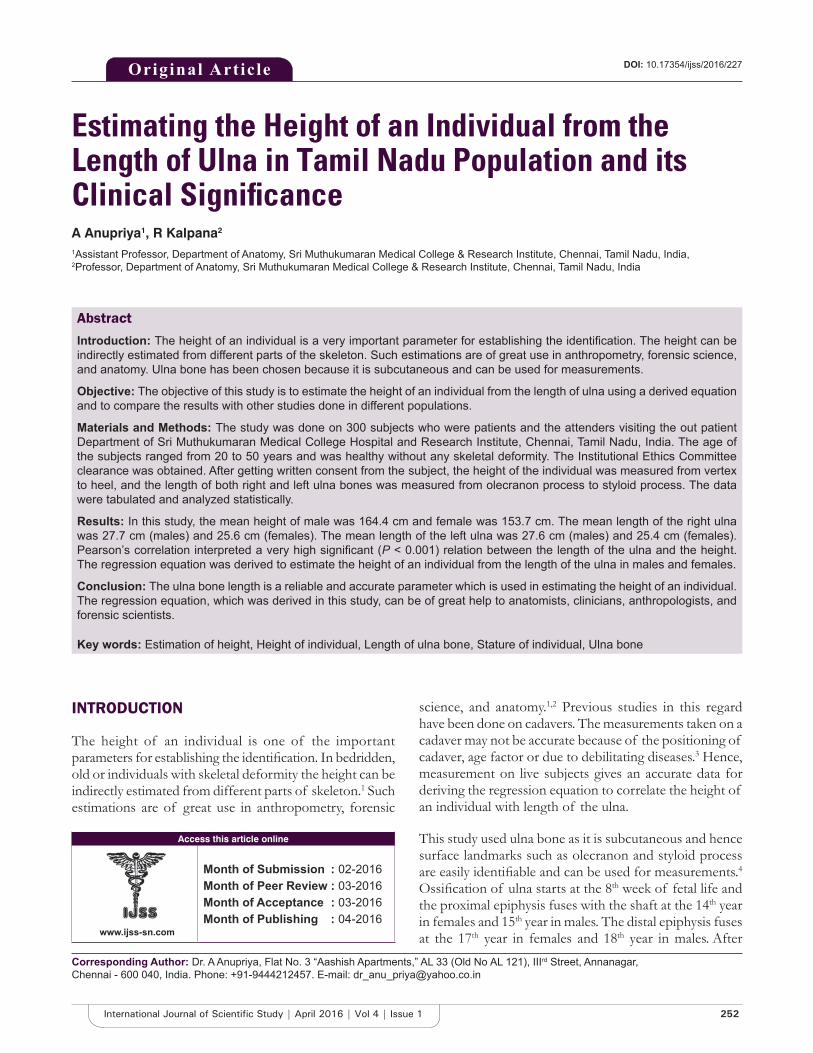
252International Journal of Scientifi c Study | April 2016 | Vol 4 | Issue 1
Estimating the Height of an Individual from the Length of Ulna in Tamil Nadu Population and its Clinical Signifi canceA Anupriya1, R Kalpana2
1Assistant Professor, Department of Anatomy, Sri Muthukumaran Medical College & Research Institute, Chennai, Tamil Nadu, India, 2Professor, Department of Anatomy, Sri Muthukumaran Medical College & Research Institute, Chennai, Tamil Nadu, India
science, and anatomy.1,2 Previous studies in this regard have been done on cadavers. The measurements taken on a cadaver may not be accurate because of the positioning of cadaver, age factor or due to debilitating diseases.3 Hence, measurement on live subjects gives an accurate data for deriving the regression equation to correlate the height of an individual with length of the ulna.
This study used ulna bone as it is subcutaneous and hence surface landmarks such as olecranon and styloid process are easily identifi able and can be used for measurements.4 Ossifi cation of ulna starts at the 8th week of fetal life and the proximal epiphysis fuses with the shaft at the 14th year in females and 15th year in males. The distal epiphysis fuses at the 17th year in females and 18th year in males. After
INTRODUCTION
The height of an individual is one of the important parameters for establishing the identifi cation. In bedridden, old or individuals with skeletal deformity the height can be indirectly estimated from different parts of skeleton.1 Such estimations are of great use in anthropometry, forensic
Original Article
Abstract
Introduction: The height of an individual is a very important parameter for establishing the identifi cation. The height can be indirectly estimated from different parts of the skeleton. Such estimations are of great use in anthropometry, forensic science, and anatomy. Ulna bone has been chosen because it is subcutaneous and can be used for measurements.
Objective: The objective of this study is to estimate the height of an individual from the length of ulna using a derived equation and to compare the results with other studies done in different populations.
Materials and Methods: The study was done on 300 subjects who were patients and the attenders visiting the out patient Department of Sri Muthukumaran Medical College Hospital and Research Institute, Chennai, Tamil Nadu, India. The age of the subjects ranged from 20 to 50 years and was healthy without any skeletal deformity. The Institutional Ethics Committee clearance was obtained. After getting written consent from the subject, the height of the individual was measured from vertex to heel, and the length of both right and left ulna bones was measured from olecranon process to styloid process. The data were tabulated and analyzed statistically.
Results: In this study, the mean height of male was 164.4 cm and female was 153.7 cm. The mean length of the right ulna was 27.7 cm (males) and 25.6 cm (females). The mean length of the left ulna was 27.6 cm (males) and 25.4 cm (females). Pearson’s correlation interpreted a very high signifi cant (P < 0.001) relation between the length of the ulna and the height. The regression equation was derived to estimate the height of an individual from the length of the ulna in males and females.
Conclusion: The ulna bone length is a reliable and accurate parameter which is used in estimating the height of an individual. The regression equation, which was derived in this study, can be of great help to anatomists, clinicians, anthropologists, and forensic scientists.
Key words: Estimation of height, Height of individual, Length of ulna bone, Stature of individual, Ulna bone
Access this article online
www.ijss-sn.com
Month of Submission : 02-2016Month of Peer Review : 03-2016Month of Acceptance : 03-2016Month of Publishing : 04-2016
Corresponding Author: Dr. A Anupriya, Flat No. 3 “Aashish Apartments,” AL 33 (Old No AL 121), IIIrd Street, Annanagar, Chennai - 600 040, India. Phone: +91-9444212457. E-mail: [email protected]
DOI: 10.17354/ijss/2016/227

Anupriya and Kalpana: Estimating the Height of an Individual from the Length of Ulna
253 International Journal of Scientifi c Study | April 2016 | Vol 4 | Issue 1
50 years, there will be some degenerative changes in joints and cartilages and also spinal cord shrinkage affecting the height of an individual.4 Hence, the age group considered for the study ranged from 20 and 50 years.
Factors, such as race, gender, and nutrition, determine the height of an individual. Hence, a population and gender specifi c formula are necessary for estimating the height of an individual. The objective of this study is to estimate the height of an individual from the length of ulna using a derived equation for Tamil Nadu population and to compare the results of our study with other studies done in different populations.
MATERIALS AND METHODS
This study was done on 300 subjects (119 males and 181 females) who were the patients and the attenders visiting the Outpatient Department of General Medicine of Sri Muthukumaran Medical College Hospital and Research Institute, Chennai, Tamil Nadu, India. The Institutional Ethics Committee clearance was obtained. Subject information sheet was given to the patients and written informed consent was obtained from them. Following are the inclusion criteria for the study: (1) The age of the subjects ranged from 20 to 50 years and (2) The subjects were healthy without any skeletal deformity. The exclusion criteria for the study were: (1) Bedridden patients and (2) Patients who did not know their age.
The subjects were made to stand erect in anatomical position. The height of the individual subject was measured from vertex to heel in centimeters using a standard height measuring scale. The subjects were asked to fully fl ex the elbow with palms spread over opposite shoulder. The length of both right and left ulna bone was measured in centimeters from tip of olecranon process to tip of styloid process using a measuring tape. The data thus obtained were tabulated separately for male and female and were analyzed statistically.
Statistical AnalysisIBM SPSS Statistics Version 20 was used. Mean, standard deviation, and range were calculated for height of the subjects and length of the ulna bone (on both sides
separately). The above statistics were interpreted by Student’s t-test.
Pearson’s correlation was used for comparing the relationship between the height of the individual and length of the ulna bone of the study subjects. Simple regression equation was derived for both sides in male and female separately. P values (P ≤ 0.05) were treated as statistically signifi cant.
RESULTS
The study subjects were analyzed according to their height and length of ulna as follows Table 1.
In Table 1, the comparison between the height of the individual and length of ulna of male and female has been done. The mean height of male was 164.4 ± 6.4 cm (range: 147.4-179 cm) and female was 153.7 ± 7.0 cm (range: 138.7-173 cm). The difference between the mean heights of male and female was statistically very highly signifi cant (P < 0.001). The mean length of right ulna bone in male was 27.7 ± 1.3 cm (range: 24.4-31 cm) and in female was 25.6 ± 1.3 cm (range: 23-29.5 cm). The difference between the mean length of the right ulna of male and female was statistically very highly signifi cant (P < 0.001). The mean length of left ulna bone in male was 27.6 ± 1.4 cm (range: 24-31 cm) and in female was 25.4 ± 1.3 cm (range: 22.9-29.4 cm). The difference between the mean length of left ulna of male and female was statistically very highly signifi cant (P < 0.001).
The mean length of the right ulna was 27.7 ± 1.3 cm and left ulna was 27.6 ± 1.3 cm in males. In females, the mean length of the right ulna was 25.6 ± 1.3 cm, and left ulna was 25.4 ± 1.3 cm. The difference between the mean length of right and left ulna was not statistically signifi cant in both male and female as per Student’s t-test interpretation (P > 0.05) as shown in Table 2.
Pearson’s correlation was used to interpret the relationship between the length of ulna and height of the individual. In this study, the coeffi cient correlation (r) was 0.754 (right ulna) and 0.745 (left ulna) in males; 0.691 (right ulna) and 0.701 (left ulna)
Table 1: Comparison of height of the individual and ulna bone length between the male and femaleVariable Mean±SD Difference
between the mean
t d.f Signifi canceMale
n=119Femalen=181
Height (cm) 164.4±6.4 153.7±7.0 10.7 13.293 298 P<0.001Right ulna (cm) 27.7±1.3 25.6±1.3 2.1 13.525 298 P<0.001Left ulna (cm) 27.6±1.4 25.4±1.3 2.2 14.243 298 P<0.001SD: Standard deviation
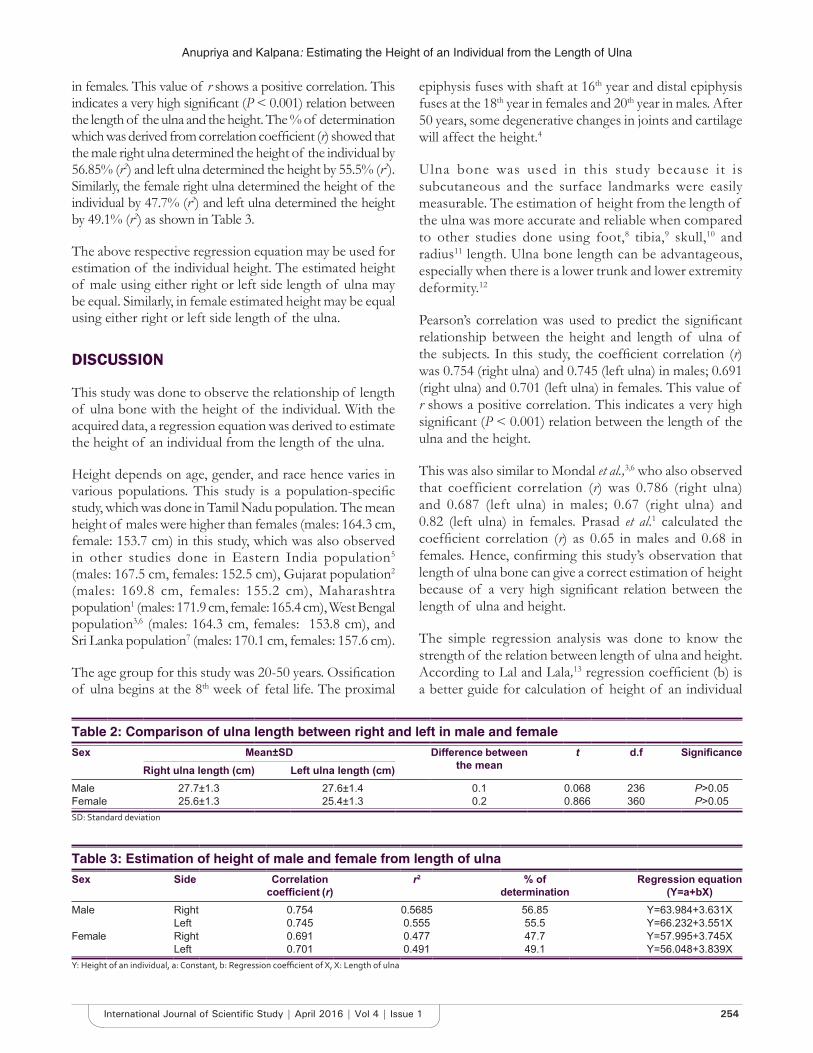
Anupriya and Kalpana: Estimating the Height of an Individual from the Length of Ulna
254International Journal of Scientifi c Study | April 2016 | Vol 4 | Issue 1
in females. This value of r shows a positive correlation. This indicates a very high signifi cant (P < 0.001) relation between the length of the ulna and the height. The % of determination which was derived from correlation coeffi cient (r) showed that the male right ulna determined the height of the individual by 56.85% (r2) and left ulna determined the height by 55.5% (r2). Similarly, the female right ulna determined the height of the individual by 47.7% (r2) and left ulna determined the height by 49.1% (r2) as shown in Table 3.
The above respective regression equation may be used for estimation of the individual height. The estimated height of male using either right or left side length of ulna may be equal. Similarly, in female estimated height may be equal using either right or left side length of the ulna.
DISCUSSION
This study was done to observe the relationship of length of ulna bone with the height of the individual. With the acquired data, a regression equation was derived to estimate the height of an individual from the length of the ulna.
Height depends on age, gender, and race hence varies in various populations. This study is a population-specifi c study, which was done in Tamil Nadu population. The mean height of males were higher than females (males: 164.3 cm, female: 153.7 cm) in this study, which was also observed in other studies done in Eastern India population5 (males: 167.5 cm, females: 152.5 cm), Gujarat population2 (males: 169.8 cm, females: 155.2 cm), Maharashtra population1 (males: 171.9 cm, female: 165.4 cm), West Bengal population3,6 (males: 164.3 cm, females: 153.8 cm), and Sri Lanka population7 (males: 170.1 cm, females: 157.6 cm).
The age group for this study was 20-50 years. Ossifi cation of ulna begins at the 8th week of fetal life. The proximal
epiphysis fuses with shaft at 16th year and distal epiphysis fuses at the 18th year in females and 20th year in males. After 50 years, some degenerative changes in joints and cartilage will affect the height.4
Ulna bone was used in this study because it is subcutaneous and the surface landmarks were easily measurable. The estimation of height from the length of the ulna was more accurate and reliable when compared to other studies done using foot,8 tibia,9 skull,10 and radius11 length. Ulna bone length can be advantageous, especially when there is a lower trunk and lower extremity deformity.12
Pearson’s correlation was used to predict the signifi cant relationship between the height and length of ulna of the subjects. In this study, the coeffi cient correlation (r) was 0.754 (right ulna) and 0.745 (left ulna) in males; 0.691 (right ulna) and 0.701 (left ulna) in females. This value of r shows a positive correlation. This indicates a very high signifi cant (P < 0.001) relation between the length of the ulna and the height.
This was also similar to Mondal et al.,3,6 who also observed that coefficient correlation (r) was 0.786 (right ulna) and 0.687 (left ulna) in males; 0.67 (right ulna) and 0.82 (left ulna) in females. Prasad et al.1 calculated the coeffi cient correlation (r) as 0.65 in males and 0.68 in females. Hence, confi rming this study’s observation that length of ulna bone can give a correct estimation of height because of a very high signifi cant relation between the length of ulna and height.
The simple regression analysis was done to know the strength of the relation between length of ulna and height. According to Lal and Lala,13 regression coeffi cient (b) is a better guide for calculation of height of an individual
Table 2: Comparison of ulna length between right and left in male and femaleSex Mean±SD Difference between
the meant d.f Signifi cance
Right ulna length (cm) Left ulna length (cm)Male 27.7±1.3 27.6±1.4 0.1 0.068 236 P>0.05Female 25.6±1.3 25.4±1.3 0.2 0.866 360 P>0.05SD: Standard deviation
Table 3: Estimation of height of male and female from length of ulnaSex Side Correlation
coeffi cient (r)r2 % of
determinationRegression equation
(Y=a+bX)Male Right 0.754 0.5685 56.85 Y=63.984+3.631X
Left 0.745 0.555 55.5 Y=66.232+3.551XFemale Right 0.691 0.477 47.7 Y=57.995+3.745X
Left 0.701 0.491 49.1 Y=56.048+3.839XY: Height of an individual, a: Constant, b: Regression coeffi cient of X, X: Length of ulna
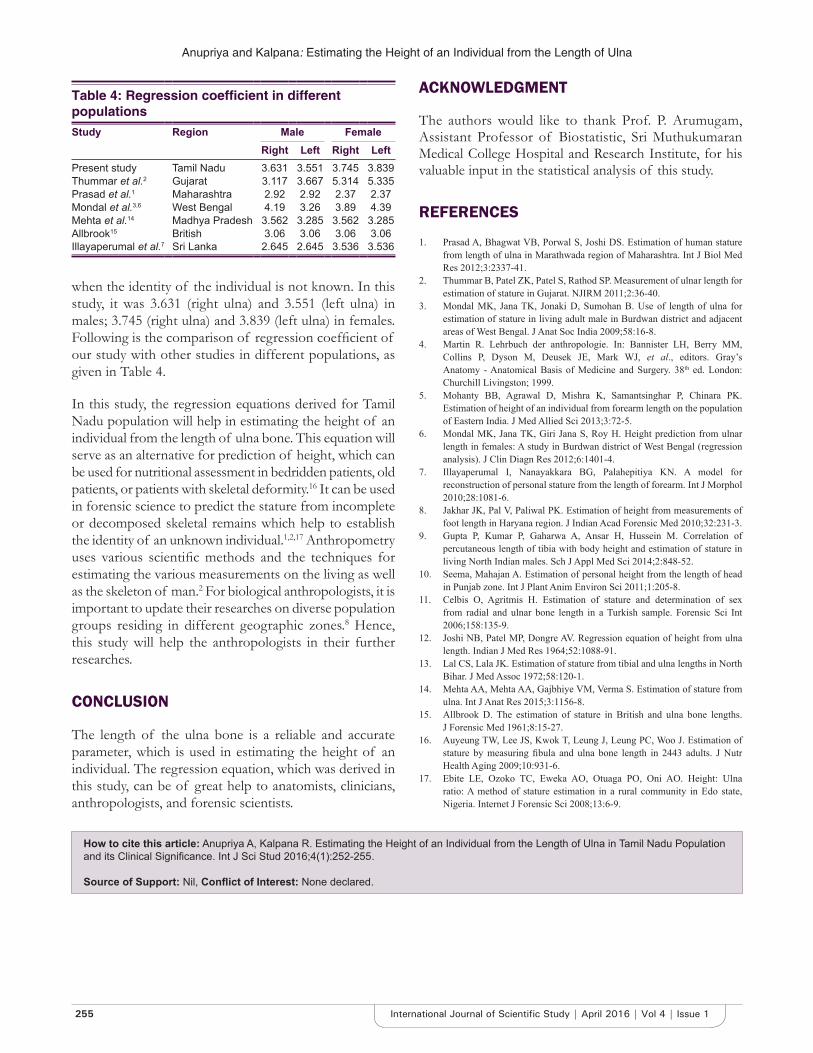
Anupriya and Kalpana: Estimating the Height of an Individual from the Length of Ulna
255 International Journal of Scientifi c Study | April 2016 | Vol 4 | Issue 1
when the identity of the individual is not known. In this study, it was 3.631 (right ulna) and 3.551 (left ulna) in males; 3.745 (right ulna) and 3.839 (left ulna) in females. Following is the comparison of regression coeffi cient of our study with other studies in different populations, as given in Table 4.
In this study, the regression equations derived for Tamil Nadu population will help in estimating the height of an individual from the length of ulna bone. This equation will serve as an alternative for prediction of height, which can be used for nutritional assessment in bedridden patients, old patients, or patients with skeletal deformity.16 It can be used in forensic science to predict the stature from incomplete or decomposed skeletal remains which help to establish the identity of an unknown individual.1,2,17 Anthropometry uses various scientifi c methods and the techniques for estimating the various measurements on the living as well as the skeleton of man.2 For biological anthropologists, it is important to update their researches on diverse population groups residing in different geographic zones.8 Hence, this study will help the anthropologists in their further researches.
CONCLUSION
The length of the ulna bone is a reliable and accurate parameter, which is used in estimating the height of an individual. The regression equation, which was derived in this study, can be of great help to anatomists, clinicians, anthropologists, and forensic scientists.
ACKNOWLEDGMENT
The authors would like to thank Prof. P. Arumugam, Assistant Professor of Biostatistic, Sri Muthukumaran Medical College Hospital and Research Institute, for his valuable input in the statistical analysis of this study.
REFERENCES
1. Prasad A, Bhagwat VB, Porwal S, Joshi DS. Estimation of human stature from length of ulna in Marathwada region of Maharashtra. Int J Biol Med Res 2012;3:2337-41.
2. Thummar B, Patel ZK, Patel S, Rathod SP. Measurement of ulnar length for estimation of stature in Gujarat. NJIRM 2011;2:36-40.
3. Mondal MK, Jana TK, Jonaki D, Sumohan B. Use of length of ulna for estimation of stature in living adult male in Burdwan district and adjacent areas of West Bengal. J Anat Soc India 2009;58:16-8.
4. Martin R. Lehrbuch der anthropologie. In: Bannister LH, Berry MM, Collins P, Dyson M, Deusek JE, Mark WJ, et al., editors. Gray’s Anatomy - Anatomical Basis of Medicine and Surgery. 38th ed. London: Churchill Livingston; 1999.
5. Mohanty BB, Agrawal D, Mishra K, Samantsinghar P, Chinara PK. Estimation of height of an individual from forearm length on the population of Eastern India. J Med Allied Sci 2013;3:72-5.
6. Mondal MK, Jana TK, Giri Jana S, Roy H. Height prediction from ulnar length in females: A study in Burdwan district of West Bengal (regression analysis). J Clin Diagn Res 2012;6:1401-4.
7. Illayaperumal I, Nanayakkara BG, Palahepitiya KN. A model for reconstruction of personal stature from the length of forearm. Int J Morphol 2010;28:1081-6.
8. Jakhar JK, Pal V, Paliwal PK. Estimation of height from measurements of foot length in Haryana region. J Indian Acad Forensic Med 2010;32:231-3.
9. Gupta P, Kumar P, Gaharwa A, Ansar H, Hussein M. Correlation of percutaneous length of tibia with body height and estimation of stature in living North Indian males. Sch J Appl Med Sci 2014;2:848-52.
10. Seema, Mahajan A. Estimation of personal height from the length of head in Punjab zone. Int J Plant Anim Environ Sci 2011;1:205-8.
11. Celbis O, Agritmis H. Estimation of stature and determination of sex from radial and ulnar bone length in a Turkish sample. Forensic Sci Int 2006;158:135-9.
12. Joshi NB, Patel MP, Dongre AV. Regression equation of height from ulna length. Indian J Med Res 1964;52:1088-91.
13. Lal CS, Lala JK. Estimation of stature from tibial and ulna lengths in North Bihar. J Med Assoc 1972;58:120-1.
14. Mehta AA, Mehta AA, Gajbhiye VM, Verma S. Estimation of stature from ulna. Int J Anat Res 2015;3:1156-8.
15. Allbrook D. The estimation of stature in British and ulna bone lengths. J Forensic Med 1961;8:15-27.
16. Auyeung TW, Lee JS, Kwok T, Leung J, Leung PC, Woo J. Estimation of stature by measuring fi bula and ulna bone length in 2443 adults. J Nutr Health Aging 2009;10:931-6.
17. Ebite LE, Ozoko TC, Eweka AO, Otuaga PO, Oni AO. Height: Ulna ratio: A method of stature estimation in a rural community in Edo state, Nigeria. Internet J Forensic Sci 2008;13:6-9.
Table 4: Regression coeffi cient in different populationsStudy Region Male Female
Right Left Right LeftPresent study Tamil Nadu 3.631 3.551 3.745 3.839Thummar et al.2 Gujarat 3.117 3.667 5.314 5.335Prasad et al.1 Maharashtra 2.92 2.92 2.37 2.37Mondal et al.3,6 West Bengal 4.19 3.26 3.89 4.39Mehta et al.14 Madhya Pradesh 3.562 3.285 3.562 3.285Allbrook15 British 3.06 3.06 3.06 3.06Illayaperumal et al.7 Sri Lanka 2.645 2.645 3.536 3.536
How to cite this article: Anupriya A, Kalpana R. Estimating the Height of an Individual from the Length of Ulna in Tamil Nadu Population and its Clinical Signifi cance. Int J Sci Stud 2016;4(1):252-255.
Source of Support: Nil, Confl ict of Interest: None declared.
256International Journal of Scientifi c Study | April 2016 | Vol 4 | Issue 1
Usefulness of Bolus Intravenous Sodium Bicarbonate in Prevention of Contrast-Induced Nephropathy in Patients Undergoing Percutaneous Cardiac InterventionsG Varghese1, Sethu Babu2, V Kiron3, S S Iyengar4
1Assistant Professor, Department of Cardiology, Pushpagiri Medical College, Thiruvalla, Kerala, India, 2Associate Professor, Department of Critical Care, Pushpagiri Medical College, Thiruvalla, Kerala, India, 3Professor and Head, Department of Cardiology, St. Johns Medical College, Bengaluru, Karnataka, India, 4Senior Consultant, Department of Cardiology, Manipal Hospitals, Bengaluru, Karnataka, India
than plain hydration alone in the prevention of CIN. This fi nding has to be validated in the South Indian population and compared with the previous data from studies done in other populations.
Aim and Objectives1. To estimate the burden of CIN in South Indian
population undergoing cardiac interventions2. To compare the effi cacy of IV sodium bicarbonate
with isotonic saline and NAC versus isotonic saline and NAC to prevent CIN in patients with renal dysfunction undergoing cardiac interventions.
MATERIALS AND METHODS
Patients with mild to moderate renal dysfunction undergoing cath procedures were randomised to test and control groups according to randomisation table. 105
INTRODUCTION
Contrast-induced nephropathy (CIN) is estimated to occur in up to 13-20% of patients with chronic renal impairment undergoing cardiac catheterization. 0.5-12% of these patients require hemodialysis and longer hospita lization. Therapeutic measures available for decreasing CIN includes (1) Hydration with saline, (2) N-acetyl cysteine (NAC), and (3) intravenous (IV) sodium bicarbonate. Recent studies have suggested that a single bolus IV administration of sodium bicarbonate is more protective
Original Article
Abstract
Introduction: Contrast-induced nephropathy (CIN) is the third most common cause for acute kidney injury and occurs in 13-2s0% of patients undergoing catheter procedures.
Materials and Methods: A study was conducted to assess the effectiveness of an additional intravenous bolus soda bicarbonate to the standard regimen which was followed in our institution (i.e., 12 h hydration and 3 days of N-acetyl cysteine).
Results: In this study of 185 patients, the incidence of CIN was not statistically different, but there was a trend toward lower serum creatinine levels and higher estimated glomerular fi ltration rate (eGFR) in the test group which could suggest a lower incidence of CIN if the sample size was larger.
Conclusion: Signifi cant improvement in eGFR was seen in patients who received sodium bicarbonate in addition to the standard treatment.
Key words: Contrast induced nephropathy, Estimated glomerular fi ltration rate, Intravenous sodium bicarbonate, N acetyl cysteine
Access this article online
www.ijss-sn.com
Month of Submission : 03-2016Month of Peer Review : 03-2016Month of Acceptance : 04-2016Month of Publishing : 04-2016
Corresponding Author: Dr Varghese George, Assistant Professor, Department of Cardiology, Pushpagiri Heart Institute, Thiruvalla - 689101, Kerala, India. Email: [email protected]
DOI: 10.17354/ijss/2016/228
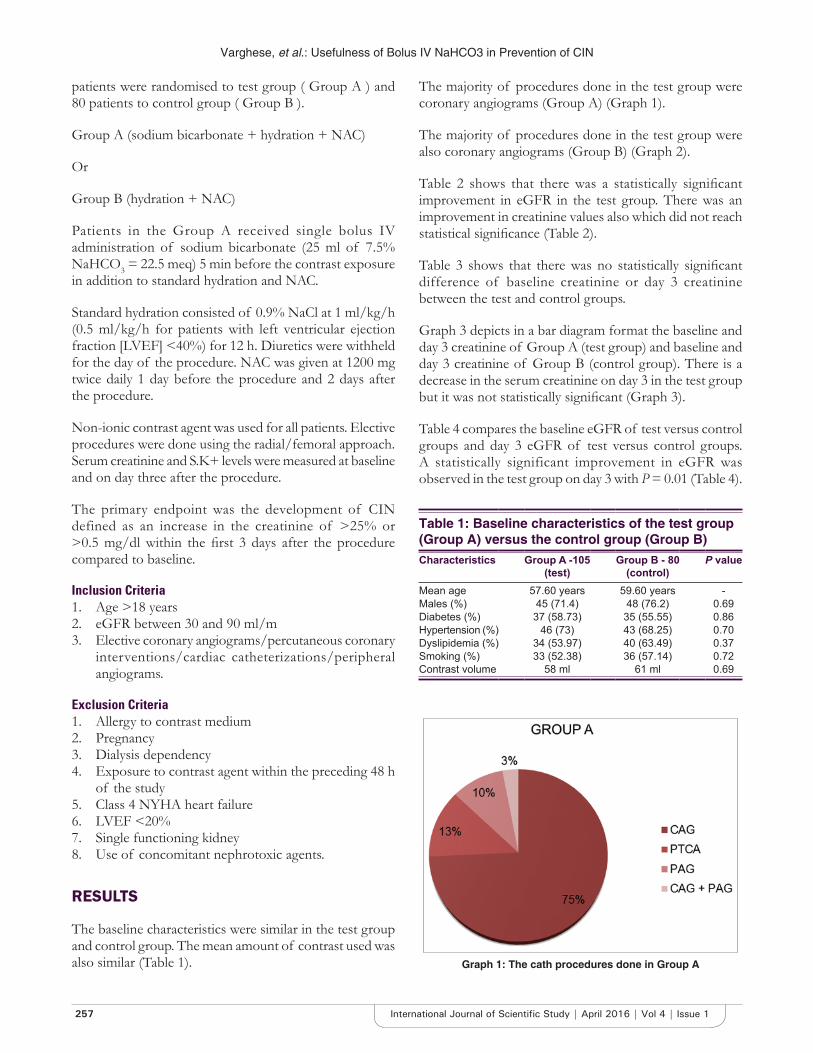
Varghese, et al.: Usefulness of Bolus IV NaHCO3 in Prevention of CIN
257 International Journal of Scientifi c Study | April 2016 | Vol 4 | Issue 1
patients were randomised to test group ( Group A ) and 80 patients to control group ( Group B ).
Group A (sodium bicarbonate + hydration + NAC)
Or
Group B (hydration + NAC)
Patients in the Group A received single bolus IV administration of sodium bicarbonate (25 ml of 7.5% NaHCO3 = 22.5 meq) 5 min before the contrast exposure in addition to standard hydration and NAC.
Standard hydration consisted of 0.9% NaCl at 1 ml/kg/h (0.5 ml/kg/h for patients with left ventricular ejection fraction [LVEF] <40%) for 12 h. Diuretics were withheld for the day of the procedure. NAC was given at 1200 mg twice daily 1 day before the procedure and 2 days after the procedure.
Non-ionic contrast agent was used for all patients. Elective procedures were done using the radial/femoral approach. Serum creatinine and S.K+ levels were measured at baseline and on day three after the procedure.
The primary endpoint was the development of CIN defined as an increase in the creatinine of >25% or >0.5 mg/dl within the fi rst 3 days after the procedure compared to baseline.
Inclusion Criteria1. Age >18 years2. eGFR between 30 and 90 ml/m3. Elective coronary angiograms/percutaneous coronary
interventions/cardiac catheterizations/peripheral angiograms.
Exclusion Criteria1. Allergy to contrast medium2. Pregnancy3. Dialysis dependency4. Exposure to contrast agent within the preceding 48 h
of the study5. Class 4 NYHA heart failure6. LVEF <20%7. Single functioning kidney8. Use of concomitant nephrotoxic agents.
RESULTS
The baseline characteristics were similar in the test group and control group. The mean amount of contrast used was also similar (Table 1).
Table 1: Baseline characteristics of the test group (Group A) versus the control group (Group B)Characteristics Group A -105
(test)Group B - 80
(control)P value
Mean age 57.60 years 59.60 years -Males (%) 45 (71.4) 48 (76.2) 0.69Diabetes (%) 37 (58.73) 35 (55.55) 0.86Hypertension (%) 46 (73) 43 (68.25) 0.70Dyslipidemia (%) 34 (53.97) 40 (63.49) 0.37Smoking (%) 33 (52.38) 36 (57.14) 0.72Contrast volume 58 ml 61 ml 0.69
Graph 1: The cath procedures done in Group A
The majority of procedures done in the test group were coronary angiograms (Group A) (Graph 1).
The majority of procedures done in the test group were also coronary angiograms (Group B) (Graph 2).
Table 2 shows that there was a statistically signifi cant improvement in eGFR in the test group. There was an improvement in creatinine values also which did not reach statistical signifi cance (Table 2).
Table 3 shows that there was no statistically signifi cant difference of baseline creatinine or day 3 creatinine between the test and control groups.
Graph 3 depicts in a bar diagram format the baseline and day 3 creatinine of Group A (test group) and baseline and day 3 creatinine of Group B (control group). There is a decrease in the serum creatinine on day 3 in the test group but it was not statistically signifi cant (Graph 3).
Table 4 compares the baseline eGFR of test versus control groups and day 3 eGFR of test versus control groups. A statistically significant improvement in eGFR was observed in the test group on day 3 with P = 0.01 (Table 4).

Varghese, et al.: Usefulness of Bolus IV NaHCO3 in Prevention of CIN
258International Journal of Scientifi c Study | April 2016 | Vol 4 | Issue 1
Graph 4 depicts in a bar diagram format the baseline and day 3 eGFR of Group A (test group) and baseline and day 3 eGFR of Group B (control group). There is an increase in the eGFR on day 3 in the test group, whereas in the control group there was a decrease of eGFR (Graph 4).
The incidence of primary endpoint – CIN was 3.78% (7 patients) in the study 3.81% (4 patients) in the Group A and 4.76% (3 patients) in the Group B (P – 0.65). There was no statistically signifi cant difference in the primary endpoint CIN between the test and control groups. The majority of patients who developed CIN had a percutaneous transluminal coronary angioplasty as the cath procedure, which may be due to the higher amount of contrast used (Graph 5).
DISCUSSION
CIN occurs in 13-20% patients following IV contact administration. It is defined as an increase in serum
Table 2: A comparison of baseline creatinine versus day 3 creatinine and baseline eGFR versus day 3 eGFR in Group A and BGroups P valueGroup A
Creat baseline versus creat D3 (1.26 vs. 1.21) 0.11eGFR baseline versus eGFR D3 (58.19 vs. 62.49) 0.02
Group BCreat baseline versus creat D3 (1.26 vs. 1.29) 0.17eGFR baseline versus eGFR D3 (56.37 vs. 54.86) 0.19
Group A versus Group BCreat baseline Group A versus Group B (1.257 vs. 1.263) 0.87Creat D3 Group A versus Group B (1.211 vs. 1.294) 0.12
eGFR: Estimated glomerular fi ltration rate
Table 3: A comparison of baseline creatinine values of test and control group and day 3 creatinine values of test and control group
Group A versus Group B P valueCreat baselineGroup A versus Group B (1.257 vs. 1.263)
0.87
Creat D3Group A versus Group B (1.211 vs. 1.294)
0.12
Graph 2: The cath procedures done in Group B
Table 4: A comparison of baseline eGFR values of test versus control group and day 3 eGFR values of test versus control groupGroup A versus Group B P valueeGFR baseline Group A versus Group B 0.40eGFR D3 Group A versus Group B 0.01eGFR: Estimated glomerular fi ltration rate
Graph 3: A graph comparing baseline creatinine values of test and control group and day 3 creatinine values of test and
control group
Graph 4: A graph comparing baseline estimated glomerular fi ltration rate (eGFR) values of test and control group and day 3
eGFR values of test and control group
creatinine by 25% from baseline or an increase in absolute value by 0.5 mg/dl within 48-72 h of exposure to contrast material. The incidence is more in patients with prior kidney disease, diabetes mellitus, dehydration, congestive heart failure, larger volumes of contrast used, and in patients with recent exposure to contrast material (<48 h).1

Varghese, et al.: Usefulness of Bolus IV NaHCO3 in Prevention of CIN
259 International Journal of Scientifi c Study | April 2016 | Vol 4 | Issue 1
There are various mechanisms by which contrast agents cause kidney damage. They are:1. Direct cytotoxic effect on the renal proximal tubular
cells2. Increased cellular damage by reactive O2 species3. Increased resistance to blood fl ow4. Renal vasoconstriction particularly in deeper portions
of outer medulla:a. By direct action on V.S.M.Cb. From metabolites such as adenosine and
endothelianc. Osmotic contrast agents decrease water
reabsorption leading to increased interstitial pressures:
• Decreases GFR and causes local compression of vasa recta.
5. Contrast agents increase resistance to blood fl ow by increasing blood viscosity and increasing red cell deformability:• This sludging generates local ischemia• Activate reactive oxygen species that result in
tubular damage at a cellular level.2,3
The cornerstone for prevention of CIN is hydration. The renal blood fl ow is compromised for about 20 h following a contrast administration. Intravascular volume expansion maintains renal blood fl ow, preserves NO production, prevents hypoxemia, and increases contrast elimination.4-7
A number of other strategies are also investigated including statins, IV soda bicarbonate, NAC, vitamin C, theophylline, aminophylline, and even hemodialysis.
IV sodium bicarbonate has many proposed mechanisms of action.8,9 NaHCO3 makes urine more alkaline and thus increases free radical and peroxide-mediated injury as they are generated more in an acidic environment.10
Most of the previous systematic reviews and relevant meta-analyses demonstrated that IV NaHCO3 could decrease the incidence of CIN.11-21 However, secondary endpoints like RRT and mortality were not improved with soda bicarbonate therapy. The result of this study did not show any signifi cant differences in the incidence of CIN among patients who received IV saline plus NAC versus those who received additional NaHCO3 as a single IV bolus. The overall incidence of CIN was very low which was probably due to the aggressive hydration protocol. There was even one study from Mayo clinic wherein they found that NaHCO3 was associated with an increase in incidence of CIN.22
Although it was not statistically signifi cant, there was a trend which could suggest an added benefi t of NaHCO3 and NAC, when the changes in creatinine values were analyzed. The reason for not reaching a statistically meaning conclusion may be the smaller size of the study group. With more patients trend might have reached statistical signifi cance. The patients needed for a statistically significant study was much higher than our initial calculation. The remedial trial, with a much larger sample size, was an adequately powered study and it demonstrated a signifi cant benefi t from addition of IV NaHCO3 to the existing therapies.23
A number of trials and meta-analyses have found that a combination of NAC and NaHCO3 is superior to either agent used alone in the prevention of CIN. Three studies on patients who got NAC in both groups and additional NaHCO3 for the test group favored the NaHCO3 group.23-25
In a study hydration with NaHCO3 in addition to NAC high dose was associated with lesser incidence of CIN in the setting of urgent percutaneous coronary intervention for ST-elevation myocardial infarction.26 However, in studies done by Yang et al. and Thayssen et al., they could not derive any additional benefi t by addition of IV NaHCO3.
27,28 Our study was in mild to moderate renal dysfunction patients and probably the incidence of CIN was too low in this group of patients with intense hydration. Hence, a large-scale well designed randomized controlled trials is required to determine whether NaHCO3 in addition to hydration and NAC is more useful.
CONCLUSIONS
1. Intensive hydration is the cornerstone for prevention of CIN and it can reduce the incidence of CIN to very low levels
2. Addition of sodium bicarbonate was not more effective to reduce the incidence of CIN in our patients with mild to moderate renal dysfunction
Graph 5: The procedures done for 7 patients who developed contrast induced nephropathy expressed in percentage
Varghese, et al.: Usefulness of Bolus IV NaHCO3 in Prevention of CIN
260International Journal of Scientifi c Study | April 2016 | Vol 4 | Issue 1
3. Signifi cant improvement in eGFR was seen in patients who received sodium bicarbonate in addition to the standard treatment.
LIMITATIONS
The incidence of primary endpoint was very low in the study. Studies in larger subset of patients will be required to derive a conclusion.
REFERENCES
1. Caixeta A, Nikolsky E, Mehran R. Prevention and treatment of contrast-associated nephropathy in interventional cardiology. Curr Cardiol Rep 2009;11:377-83.
2. Lameire NH. Contrast-induced nephropathy – Prevention and risk reduction. Nephrol Dial Transplant 2006;21:i11-23.
3. (Guideline) Department of Veteran Affairs Department of Defense. VA/DOD Clinical Practice Guideline for Management of Chronic Kidney Disease in Primary Care December 2014. Available from: http://www.guideline.gov/content.aspx?Id=48951. [Last accessed on 2016 Apr 5].
4. Solomon R. Radiocontrast-induced nephropathy. Semin Nephrol 1998;18:551-7.
5. Mueller C. Prevention of contrast-induced nephropathy with volume supplementation. Kidney Int Suppl 2006:S16-9.
6. Pannu N, Wiebe N, Tonelli M; Alberta Kidney Disease Network. Prophylaxis strategies for contrast-induced nephropathy. JAMA 2006;295:2765-79.
7. Friedewald VE, Goldfarb S, Laskey WK, McCullough PA, Roberts WC. The editor’s roundtable: Contrast-induced nephropathy. Am J Cardiol 2007;100:544-51.
8. Atkins JL. Effect of sodium bicarbonate preloading on ischemic renal failure. Nephron 1986;44:70-4.
9. McCullough PA, Adam A, Becker CR, Davidson C, Lameire N, Stacul F, et al. Risk prediction of contrast-induced nephropathy. Am J Cardiol 2006 18;98:27K-36.
10. Burgess WP, Walker PJ. Mechanisms of contrast-induced nephropathy reduction for saline (NaCl) and sodium bicarbonate (NaHCO3). Biomed Res Int 2014;2014:510385.
11. Meier P, Ko DT, Tamura A, Tamhane U, Gurm HS. Sodium bicarbonate-based hydration prevents contrast-induced nephropathy: A meta-analysis. BMC Med 2009;7:23.
12. Trivedi H, Nadella R, Szabo A. Hydration with sodium bicarbonate for the prevention of contrast-induced nephropathy: A meta-analysis of randomized controlled trials. Clin Nephrol 2010;74:288-96.
13. Hogan SE, L’Allier P, Chetcuti S, Grossman PM, Nallamothu BK, Duvernoy C, et al. Current role of sodium bicarbonate-based preprocedural hydration for the prevention of contrast-induced acute kidney injury: A meta-analysis. Am Heart J 2008;156:414-21.
14. Joannidis M, Schmid M, Wiedermann CJ. Prevention of contrast media-
induced nephropathy by isotonic sodium bicarbonate: A meta-analysis. Wien Klin Wochenschr 2008;120:742-8.
15. Ho KM, Morgan DJ. Use of isotonic sodium bicarbonate to prevent radiocontrast nephropathy in patients with mild pre-existing renal impairment: A meta-analysis. Anaesth Intensive Care 2008;36:646-53.
16. Navaneethan SD, Singh S, Appasamy S, Wing RE, Sehgal AR. Sodium bicarbonate therapy for prevention of contrast-induced nephropathy: A systematic review and meta-analysis. Am J Kidney Dis 2009;53:617-27.
17. Brar SS, Hiremath S, Dangas G, Mehran R, Brar SK, Leon MB. Sodium bicarbonate for the prevention of contrast induced-acute kidney injury: A systematic review and meta-analysis. Clin J Am Soc Nephrol 2009;4:1584-92.
18. Kanbay M, Covic A, Coca SG, Turgut F, Akcay A, Parikh CR. Sodium bicarbonate for the prevention of contrast-induced nephropathy: A meta-analysis of 17 randomized trials. Int Urol Nephrol 2009;41:617-27.
19. Hoste EA, De Waele JJ, Gevaert SA, Uchino S, Kellum JA. Sodium bicarbonate for prevention of contrast-induced acute kidney injury: A systematic review and meta-analysis. Nephrol Dial Transplant 2010;25:747-58.
20. Kunadian V, Zaman A, Spyridopoulos I, Qiu W. Sodium bicarbonate for the prevention of contrast induced nephropathy: A meta-analysis of published clinical trials. Eur J Radiol 2011;79:48-55.
21. Jang JS, Jin HY, Seo JS, Yang TH, Kim DK, Kim TH, et al. Sodium bicarbonate therapy for the prevention of contrast-induced acute kidney injury – A systematic review and meta-analysis. Circ J 2012;76:2255-65.
22. From AM, Bartholmai BJ, Williams AW, Cha SS, Pfl ueger A, McDonald FS. Sodium bicarbonate is associated with an increased incidence of contrast nephropathy: A retrospective cohort study of 7977 patients at mayo clinic. Clin J Am Soc Nephrol 2008;3:10-8.
23. Briguori C, Airoldi F, D’ Andrea D, Bonizzoni E, Morici N, Focaccio A, et al. Renal insuffi ciency following contract media administration trial (REMEDIAL): A randomized comparison of 3 preventive strategies. Circulation 2007;115:1211-7.
24. Recio-Mayoral A, Chaparro M, Prado B, Cózar R, Méndez I, Banerjee D, et al. The reno-protective effect of hydration with sodium bicarbonate plus N-acetylcystine in patients undergoing emergency percutanous coronary intervention: The Reno study. J Am Coll Cardiol 2007;49:1283-8.
25. Mahmoodi K, Sohrabi B, IIkhchooyi F, Malaki M, Khaniani ME, Hemmati M, et al. The effi cacy of hydration with normal saline versus hydration with sodium bicarbonate in the prevention of contrast-induced nephropathy. Heart Views 2014;15:33.
26. Leone AM, De Caterina AR, Sciahbasi A, Aurelio A, Basile E, Porto I, et al. Sodium bicarbonate plus N-acetylcysteine to prevent contrast-induced nephropathy in primary and rescue percutaneous coronary interventions: The BINARIO (BIcarbonato e N-Acetil-cisteina nell’infaRto mIocardico acutO) study. EuroIntervention 2012;8:839-47.
27. Yang K, Liu W, Ren W, Lv S. Different interventions in preventing contrast-induced nephropathy after percutaneous coronary intervention. Int Urol Nephrol 2014;46:1801-7.
28. Thayssen P, Lassen JF, Jensen SE, Hansen KN, Hansen HS, Christiansen EH, et al. Prevention of contrast-induced nephropathy with N-acetylcysteine or sodium bicarbonate in patients with ST-segment-myocardial infarction: A prospective, randomized, open-labeled trial. Circ Cardiovasc Interv 2014;7:216-24.
How to cite this article: Varghese G, Babu S, Kiron V, Iyengar SS. Usefulness of Bolus Intravenous Sodium Bicarbonate in Prevention of Contrast Induced Nephropathy in Patients Undergoing Percutaneous Cardiac Interventions. Int J Sci Stud 2016;4(1):256-260.
Source of Support: Nil, Confl ict of Interest: None declared.
261 International Journal of Scientifi c Study | April 2016 | Vol 4 | Issue 1
Enteropathogenic Infections in Human Immunodefi ciency Virus Positive Patients in a Tertiary Care Center: A Clinicomicrobial StudyLakshmipriya Gurusamy1, Uma Selvaraj2
1Assistant Professor, Department of Dermatology, Saveetha Medical College Hospital, Thandalam, Kanchipuram, Tamil Nadu, 2Senior Assistant Professor, Department of Dermatology, Government Theni Medical College Hospital, Theni, Tamil Nadu, India
patients suffer from various opportunistic infections, most commonly encountered being tuberculosis, candidiasis, Pneumocystis jiroveci pneumonia, and diarrhea due to various pathogens.1 Studies indicate that diarrhea due to enteropathogenic infections occurs in 30-60% of HIV/acquired immune defi ciency syndrome (AIDS) patients. Chronic diarrhea is responsible for considerable morbidity and mortality in such patients. Only few studies regarding the prevalence of intestinal opportunistic infections in HIV-infected patients are done in South India. This study was done to evaluate the prevalence of such infections in HIV patients in our setup and to ascertain the importance of stool examination for the detection of enteropathogens
INTRODUCTION
Human immunodefi ciency virus (HIV) infection is a major threat to the human population across the world though the incidence of HIV infection is falling globally. These
Original Article
Abstract
Background: Since the beginning of the human immunodefi ciency virus (HIV) epidemic, opportunistic infections have been recognized as common complications of HIV infection. Intestinal opportunistic infections present commonly as diarrhea. Several species of protozoa and other bacterial infections have been associated with acute and chronic diarrhea in HIV-infected patients.
Aims: The objective of this study was to fi nd out the prevalence and presentation of enteropathogenic infections in HIV-positive patients and to study the correlation between CD4 cell count and the prevalence of intestinal parasites.
Materials and Methods: A total of 100 consecutive HIV-positive patients were included in the study. All patients above 15 years of age who were positive for HIV by two rapid tests and ELISA were taken for the study. Stool samples were sent for the evaluation of parasites using wet saline method, wet iodine method, fl oatation technique, sedimentation technique, modifi ed acid-fast staining, and stool culture.
Results: Out of 100 HIV positive cases, 72% were below the age group of 40. The age range varied from 25 to 55 years. Enteric pathogens were recovered from 65% of patients. Cryptosporidium was the most common pathogen isolated which was found in 50.76% of the patients. The other pathogens isolated were Isospora belli (4.62%), Microsporidia (1.54%), Entamoeba histolytica (4.62%), Ancylostoma duodenale, and Escherichia coli seen in 1.54% each. Mixed infections were seen in 35.38% of the patients. The prevalence of infections was high in patients with CD4 count <200/mm3. Most of the patients with a lower CD4 count were symptomatic.
Conclusion: In our study, coccidian parasites were the most common gastrointestinal pathogens isolated. About 80% of the patients who harbored enteropathogens were symptomatic. Mixed infections were commonly seen in profoundly immunosuppressed patients. Patients with advanced illness were more symptomatic than those in the early stages.
Key words: Cryptosporidium, Enteropathogens, Human immunodefi ciency virus
Corresponding Author: Uma Selvaraj, 15/1/38A, Arjun Illam, Sivanantha Nagar, P.C. Patty, Theni - 625 531, Tamil Nadu, India.E-mail: [email protected]
DOI: 10.17354/ijss/2016/229
Access this article online
www.ijss-sn.com
Month of Submission : 02-2016Month of Peer Review : 03-2016Month of Acceptance : 04-2016Month of Publishing : 04-2016
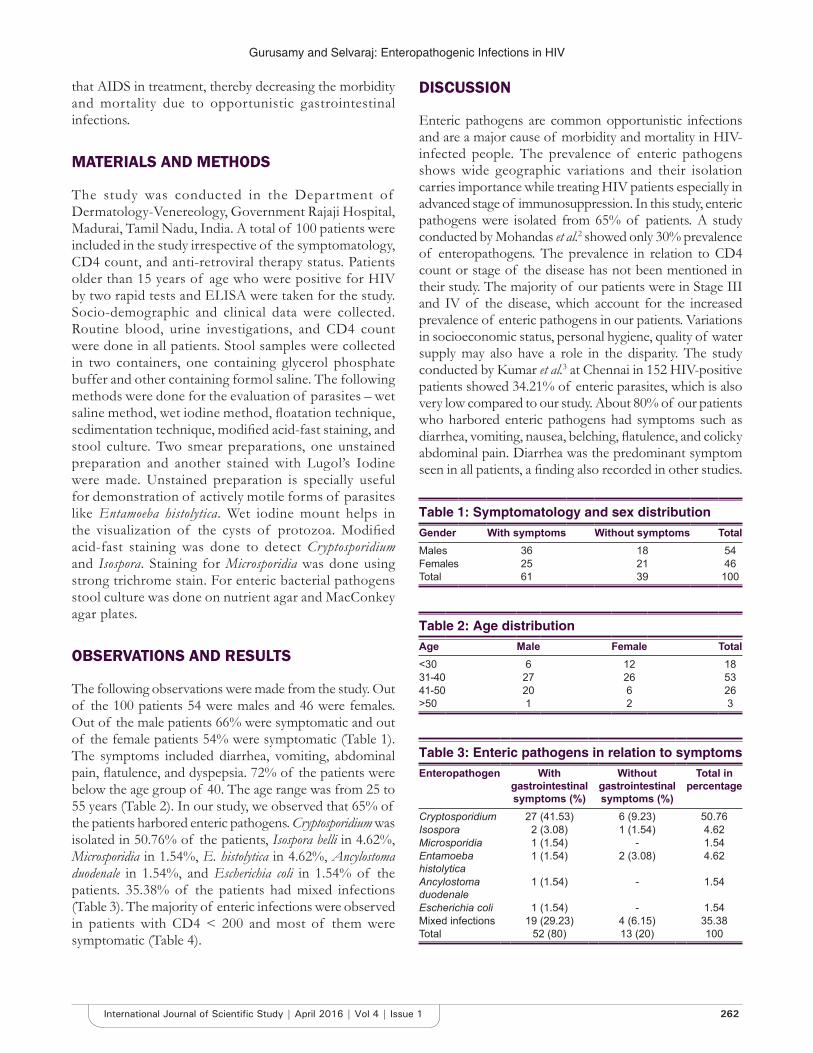
Gurusamy and Selvaraj: Enteropathogenic Infections in HIV
262International Journal of Scientifi c Study | April 2016 | Vol 4 | Issue 1
that AIDS in treatment, thereby decreasing the morbidity and mortality due to opportunistic gastrointestinal infections.
MATERIALS AND METHODS
The study was conducted in the Department of Dermatology-Venereology, Government Rajaji Hospital, Madurai, Tamil Nadu, India. A total of 100 patients were included in the study irrespective of the symptomatology, CD4 count, and anti-retroviral therapy status. Patients older than 15 years of age who were positive for HIV by two rapid tests and ELISA were taken for the study. Socio-demographic and clinical data were collected. Routine blood, urine investigations, and CD4 count were done in all patients. Stool samples were collected in two containers, one containing glycerol phosphate buffer and other containing formol saline. The following methods were done for the evaluation of parasites – wet saline method, wet iodine method, fl oatation technique, sedimentation technique, modifi ed acid-fast staining, and stool culture. Two smear preparations, one unstained preparation and another stained with Lugol’s Iodine were made. Unstained preparation is specially useful for demonstration of actively motile forms of parasites like Entamoeba histolytica. Wet iodine mount helps in the visualization of the cysts of protozoa. Modifi ed acid-fast staining was done to detect Cryptosporidium and Isospora. Staining for Microsporidia was done using strong trichrome stain. For enteric bacterial pathogens stool culture was done on nutrient agar and MacConkey agar plates.
OBSERVATIONS AND RESULTS
The following observations were made from the study. Out of the 100 patients 54 were males and 46 were females. Out of the male patients 66% were symptomatic and out of the female patients 54% were symptomatic (Table 1). The symptoms included diarrhea, vomiting, abdominal pain, fl atulence, and dyspepsia. 72% of the patients were below the age group of 40. The age range was from 25 to 55 years (Table 2). In our study, we observed that 65% of the patients harbored enteric pathogens. Cryptosporidium was isolated in 50.76% of the patients, Isospora belli in 4.62%, Microsporidia in 1.54%, E. histolytica in 4.62%, Ancylostoma duodenale in 1.54%, and Escherichia coli in 1.54% of the patients. 35.38% of the patients had mixed infections (Table 3). The majority of enteric infections were observed in patients with CD4 < 200 and most of them were symptomatic (Table 4).
DISCUSSION
Enteric pathogens are common opportunistic infections and are a major cause of morbidity and mortality in HIV-infected people. The prevalence of enteric pathogens shows wide geographic variations and their isolation carries importance while treating HIV patients especially in advanced stage of immunosuppression. In this study, enteric pathogens were isolated from 65% of patients. A study conducted by Mohandas et al.2 showed only 30% prevalence of enteropathogens. The prevalence in relation to CD4 count or stage of the disease has not been mentioned in their study. The majority of our patients were in Stage III and IV of the disease, which account for the increased prevalence of enteric pathogens in our patients. Variations in socioeconomic status, personal hygiene, quality of water supply may also have a role in the disparity. The study conducted by Kumar et al.3 at Chennai in 152 HIV-positive patients showed 34.21% of enteric parasites, which is also very low compared to our study. About 80% of our patients who harbored enteric pathogens had symptoms such as diarrhea, vomiting, nausea, belching, fl atulence, and colicky abdominal pain. Diarrhea was the predominant symptom seen in all patients, a fi nding also recorded in other studies.
Table 1: Symptomatology and sex distributionGender With symptoms Without symptoms TotalMales 36 18 54Females 25 21 46Total 61 39 100
Table 2: Age distributionAge Male Female Total<30 6 12 1831-40 27 26 5341-50 20 6 26>50 1 2 3
Table 3: Enteric pathogens in relation to symptoms
Enteropathogen With gastrointestinal symptoms (%)
Without gastrointestinal symptoms (%)
Total in percentage
Cryptosporidium 27 (41.53) 6 (9.23) 50.76Isospora 2 (3.08) 1 (1.54) 4.62Microsporidia 1 (1.54) - 1.54Entamoeba histolytica
1 (1.54) 2 (3.08) 4.62
Ancylostoma duodenale
1 (1.54) - 1.54
Escherichia coli 1 (1.54) - 1.54Mixed infections 19 (29.23) 4 (6.15) 35.38Total 52 (80) 13 (20) 100

Gurusamy and Selvaraj: Enteropathogenic Infections in HIV
263 International Journal of Scientifi c Study | April 2016 | Vol 4 | Issue 1
Gupta et al. showed in their study that 55.8% of patients were symptomatic, comparatively lower than that in our study. Out of the 100 patients screened, Cryptosporidium was the sole pathogen isolated in 33 patients, and in 21 patients, it was seen as a mixed infection. The prevalence as a sole isolate was 50.76%. The study done by Chakraborty et al.4 showed a prevalence of 43% of cryptosporidial diarrhea in a sample size of 125. Isospora was found in only 4.62% of the patients, comparable with Mohandas et al. study but study done by Kumar et al. revealed a higher percentage (13.7%).3 E. coli was the most common bacterial isolate and Klebsiella was seen in 2 patients of mixed infection. Mixed infections were noted in 23 (35.38%) patients. Cryptosporidium was the predominant pathogen isolated in the mixed infections. Out of these 23 patients, 18 (78.2%) had CD4 count <200. 82.6% of patients with mixed infections were symptomatic. These features signify the importance of immune system in clearing the enteric infections and that advanced immunosuppression provides a favorable environment for mixed infections. The majority of enteric infections were observed in patients with CD4 <200 and most of them were symptomatic.
CONCLUSION
There are wide geographic variations in the prevalence of enteropathogenic infections in HIV-infected people due to variations in socioeconomic conditions, literacy rates, hygiene practices, and availability of safe drinking water. In our study, 65% of our study population harbored an enteropathogen and coccidian parasites were the most common pathogens isolated.
REFERENCES
1. Vajpayee M, Kanswal S, Seth P, Wig N. Spectrum of opportunistic infections and profi le of CD4 counts among AIDS patients in North India. Infection 2003;31:336-40.
2. Mohandas, Sehgal R, Sud A, Malla N. Prevalence of intestinal parasitic pathogens in HIV-seropositive individuals in Northern India. Jpn J Infect Dis 2002;55:83-4.
3. Kumar SS, Ananthan S, Saravanan P. Role of coccidian parasites in causation of diarrhoea in HIV infected patients in Chennai. Indian J Med Res 2002;116:85-9.
4. Chakraborty N, Mukherjee A, Santra S, Sarkar RN, Banerjee D, Guha SK, et al. Current trends of opportunistic infections among HIV-seropositive patients from Eastern India. Jpn J Infect Dis 2008;61:49-53.
Table 4: Enteropathogens in relation to CD4 countPathogen CD4<200 CD4=201-499 CD4>500
Symptomatic (%) Asymptomatic (%) Symptomatic (%) Asymptomatic (%) Symptomatic (%) Asymptomatic (%)Cryptosporidium 25 (38.45) 1 (1.54) 1 (1.54) 5 (7.69) - 1 (1.54)Isospora 2 (3.08) - - 1 (1.54) - -Microsporidia 1 (1.54) - - - - -Entamoeba histolytica 1 (1.54) 1 (1.54) - - - 1 (1.54)Ancylostoma duodenale 1 (1.54) - - - - -Escherichia coli 1 (1.54) - - - - -Mixed infections 17 (26.14) 1 (1.54) 2 (3.08) - - 3 (4.62)
How to cite this article: Gurusamy L, Selvaraj U. Enteropathogenic Infections in Human Immunodefi ciency Virus Positive Patients in a Tertiary Care Center: A Clinicomicrobial Study. Int J Sci Stud 2016;4(1):261-263.
Source of Support: Nil, Confl ict of Interest: None declared.

264International Journal of Scientifi c Study | April 2016 | Vol 4 | Issue 1
Comparative Study of the Diagnostic Ability of Ultrasonography and Magnetic Resonance Imaging in the Evaluation of Chronic Shoulder PainSachin Khanduri1, Anshul Raja2, Tanvi Meha3, Sumit Agrawal2, Saurav Bhagat2, Girjesh Jaiswal2
1Professor and Head, Department of Radiodiagnosis, Era’s Lucknow Medical College & Hospital, Lucknow, Uttar Pradesh, India, 2Post-graduate Student, Department of Radiodiagnosis, Era’s Lucknow Medical College & Hospital, Lucknow, Uttar Pradesh, India, 3Post-graduate Student, Department of Pediatrics, Patna Medical College and Hospital, Patna, Bihar, India
Shoulder pain is defi ned as chronic when it has been present for longer than 6 months. Compromised shoulder movement due to pain, stiffness, or weakness can cause substantial disability and affect a person’s ability to carry out daily activities (eating, dressing, personal hygiene) and work.
Thus, it is a severe disability and results in a heavy loss of working days and disability. Shoulder complaints may have an unfavorable outcome, with only about 50% of all new episodes of shoulder complaints presenting in medical practice showing a complete recovery within 6 months.1,2 After 1 year, this proportion increases to 60%.2
Although community data on shoulder pain is limited, the prevalence of shoulder pain among in urban and rural
INTRODUCTION
Shoulder pain is recognized as a disabling problem and is one of the most common reasons for visit to a general practitioner with nearly 1% of the adult population reporting with new episodes of shoulder pain.1
Original Article
Abstract
Introduction: Shoulder pain is recognized as a disabling problem. The most common causes of shoulder pain in primary care are reported to be rotator cuff disorders, acromioclavicular joint diseases, and glenohumeral joint disorders. The fi nal diagnosis in case of chronic shoulder pain is based on a collective clinical as well as radiological evaluation which includes radiographs, ultrasonography (USG), and magnetic resonance imaging (MRI).
Materials and Methods: After obtaining ethical clearance, 85 cases of chronic shoulder pain were enrolled for the study. A detailed history with clinical examination was done. Patients were subjected to X-ray anterior-posterior and axial as initial investigation. On viewing, the X-ray next modality was decided. All those cases where no obvious bony lesion was seen were further evaluated by USG and MRI. The diagnosis was confi rmed by arthroscopy.
Result: For partial thickness tear of supraspinatus, USG had a sensitivity, specifi city, positive predictive value (PPV), negative predictive value (NPV), and accuracy of 60%, 97.6%, 95.5%, 74.1%, and 80.3%, respectively, as compared to 88.6%, 96.0%, 93.9%, 92.3%, and 92.9%, respectively, for the same parameters on MRI. For full thickness tear of supraspinatus, USG had a sensitivity, specifi city, PPV, NPV, and accuracy of 95.2%, 90.6%, 76.9%, 98.3%, and 91.8%, respectively, as compared to 95.2%, 98.4%, 95.2%, 98.4%, and 97.6%, respectively, for the same parameters on MRI.
Conclusion: As far as comparative evaluation of USG and MRI, except for full thickness tear where both the modalities had equal sensitivity, for all the other diagnoses MRI showed a higher sensitivity. However, for partial thickness tear, USG had a higher specifi city as compared to MRI; for all the other diagnoses, MRI showed a higher specifi city. In terms of overall accuracy, MRI had a higher accuracy as compared to USG, for all the diagnoses except for full thickness tears.
Key words: Arthroscopy, Chronic shoulder pain, Full thickness tear, Partial thickness tear, Tendinosis, Ultrasonography
Access this article online
www.ijss-sn.com
Month of Submission : 02-2016Month of Peer Review : 03-2016Month of Acceptance : 03-2016Month of Publishing : 04-2016
Corresponding Author: Dr. Anshul Raja, 2/7, Vijayant Khand, Gomtinagar, Lucknow, Uttar Pradesh, India. Phone: +91-9936122943.E-mail: [email protected]
DOI: 10.17354/ijss/2016/230

Khanduri, et al.: USG versus MRI in Chronic Shoulder Pain Evaluation
265 International Journal of Scientifi c Study | April 2016 | Vol 4 | Issue 1
populations of India has been reported to be 2% and 7.4%, respectively.3,4
The most common causes of shoulder pain in primary care are reported to be rotator cuff disorders, acromioclavicular joint disease, and glenohumeral joint disorders,5 with classifi cation of these disorders based primarily on results of clinical tests.6-9 However, inconsistent diagnostic terminology,10 lack of universally accepted diagnostic classifi cation criteria,11,12 and poor specifi city of many physical examination tests,13,14 hamper confidence in classifi cation systems that use clinical test criteria alone.
The fi nal diagnosis in case of chronic shoulder pain is based on a collective clinical as well as radiological evaluation. The clinical evaluation includes both medical history as well as physical assessment. The role of occupational history in the causation of chronic shoulder pain is also important and makes an essential part of history taking. Diagnostic imaging remains to be the next in the algorithm of achieving a fi nal diagnosis. These include radiographs, magnetic resonance imaging (MRI), arthrography, computed tomography, and ultrasonography (USG). However, use of appropriate imaging technique depends mainly on the fi ndings of clinical evaluation and suspected pathology. For example, for suspected diagnosis of rotator cuff disorders, MRI is preferred; whereas for suspected labral pathology, MRI arthrography is suggested.15 Each of these diagnostic modalities has its own economic and fi nancial implications as well as limitation of accuracy. Techniques such as USG are cost-effective, yet they are highly technician dependent and, therefore, have not yet gained widespread acceptance.15 The vast differences in the responsible pathologies of chronic shoulder pain make it diffi cult to adopt a single, cost-effective diagnostic test for the fi nal diagnosis. Thus, the diagnostic process often becomes prolonged and leads to prolongation of the quality of life of affected patient which has physical, fi nancial, social, and psychological repercussions too.
In this research study, we made an attempt to carry out a clinico-radiological evaluation of chronic shoulder pain and comparing the diagnostic fi ndings of two different modalities USG and MRI with arthroscopically/surgically confi rmed the diagnosis to come up with a more valuable and clinically relevant algorithm for the effi cient diagnosis of chronic shoulder pain.
MATERIALS AND METHODS
Study DesignThe present study was carried out as a prospective observational study.
SettingsThe study was carried out at the Department of Radiodiagnosis, Era’s Lucknow Medical College, Lucknow, Uttar Pradesh, India.
Duration of StudyAbout 18 months starting from January 2014 to June 2015.
Sampling FramePatients presenting with the complaints of shoulder pain were selected for the purpose of the study. The sampling frame of the study was bound by the following inclusion and exclusion criteria:
Inclusion criteria:• Either gender, aged 21-60 years• Presenting with shoulder pain for last 6 months or
more.
Exclusion criteria:• Patients not providing consent to participate in the
study• Having shoulder pain for less than 6 months• History of any congenital deformity of shoulder• Contraindication of MRI: Pacemakers and metallic
implants.
Clearance and ApprovalsClearance for carrying out the study was obtained from the Institutional Ethical Committee, Era’s Lucknow Medical College, Lucknow, Uttar Pradesh, India. Informed consent was obtained from all the patients.
Sample SizeSample size is 85.
MethodologyAll the patients falling in the sampling frame were invited to participate in the study.
After obtaining informed consent, demographic information was noted. An elaborate history was taken from all the patients which was followed by a thorough clinical evaluation, in which duration of symptoms, affected side, dominant hand, range of movement was noted. A thorough medical history, nature of complaints, symptoms, and signs were noted. In case of an injury being the cause of shoulder pain, cause of injury was also noted.
Patients were subjected to X-ray anterior-posterior (AP) and axial as initial investigation. On viewing, the X-ray next modality was decided. All those cases where no obvious bony lesion was seen were further evaluated by USG and MRI. The diagnosis was confi rmed by arthroscopy.
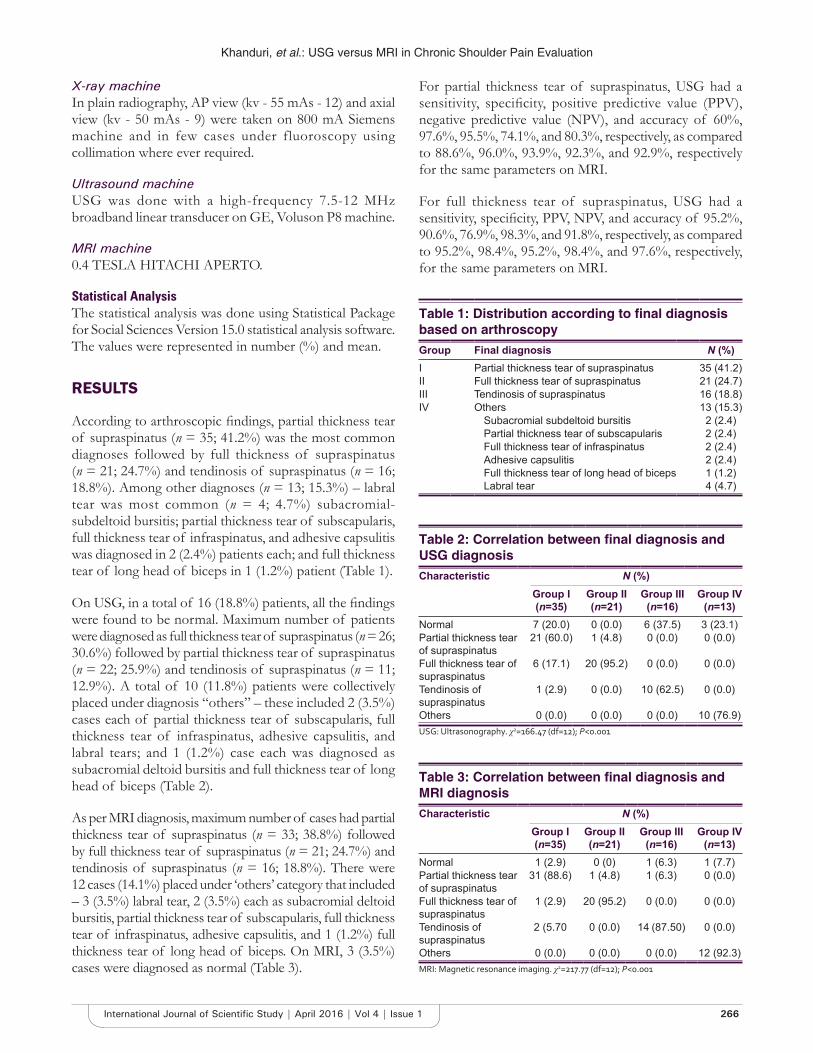
Khanduri, et al.: USG versus MRI in Chronic Shoulder Pain Evaluation
266International Journal of Scientifi c Study | April 2016 | Vol 4 | Issue 1
X-ray machineIn plain radiography, AP view (kv - 55 mAs - 12) and axial view (kv - 50 mAs - 9) were taken on 800 mA Siemens machine and in few cases under fluoroscopy using collimation where ever required.
Ultrasound machineUSG was done with a high-frequency 7.5-12 MHz broadband linear transducer on GE, Voluson P8 machine.
MRI machine0.4 TESLA HITACHI APERTO.
Statistical AnalysisThe statistical analysis was done using Statistical Package for Social Sciences Version 15.0 statistical analysis software. The values were represented in number (%) and mean.
RESULTS
According to arthroscopic fi ndings, partial thickness tear of supraspinatus (n = 35; 41.2%) was the most common diagnoses followed by full thickness of supraspinatus (n = 21; 24.7%) and tendinosis of supraspinatus (n = 16; 18.8%). Among other diagnoses (n = 13; 15.3%) – labral tear was most common (n = 4; 4.7%) subacromial-subdeltoid bursitis; partial thickness tear of subscapularis, full thickness tear of infraspinatus, and adhesive capsulitis was diagnosed in 2 (2.4%) patients each; and full thickness tear of long head of biceps in 1 (1.2%) patient (Table 1).
On USG, in a total of 16 (18.8%) patients, all the fi ndings were found to be normal. Maximum number of patients were diagnosed as full thickness tear of supraspinatus (n = 26; 30.6%) followed by partial thickness tear of supraspinatus (n = 22; 25.9%) and tendinosis of supraspinatus (n = 11; 12.9%). A total of 10 (11.8%) patients were collectively placed under diagnosis “others” – these included 2 (3.5%) cases each of partial thickness tear of subscapularis, full thickness tear of infraspinatus, adhesive capsulitis, and labral tears; and 1 (1.2%) case each was diagnosed as subacromial deltoid bursitis and full thickness tear of long head of biceps (Table 2).
As per MRI diagnosis, maximum number of cases had partial thickness tear of supraspinatus (n = 33; 38.8%) followed by full thickness tear of supraspinatus (n = 21; 24.7%) and tendinosis of supraspinatus (n = 16; 18.8%). There were 12 cases (14.1%) placed under ‘others’ category that included – 3 (3.5%) labral tear, 2 (3.5%) each as subacromial deltoid bursitis, partial thickness tear of subscapularis, full thickness tear of infraspinatus, adhesive capsulitis, and 1 (1.2%) full thickness tear of long head of biceps. On MRI, 3 (3.5%) cases were diagnosed as normal (Table 3).
For partial thickness tear of supraspinatus, USG had a sensitivity, specifi city, positive predictive value (PPV), negative predictive value (NPV), and accuracy of 60%, 97.6%, 95.5%, 74.1%, and 80.3%, respectively, as compared to 88.6%, 96.0%, 93.9%, 92.3%, and 92.9%, respectively for the same parameters on MRI.
For full thickness tear of supraspinatus, USG had a sensitivity, specifi city, PPV, NPV, and accuracy of 95.2%, 90.6%, 76.9%, 98.3%, and 91.8%, respectively, as compared to 95.2%, 98.4%, 95.2%, 98.4%, and 97.6%, respectively, for the same parameters on MRI.
Table 1: Distribution according to fi nal diagnosis based on arthroscopyGroup Final diagnosis N (%)I Partial thickness tear of supraspinatus 35 (41.2)II Full thickness tear of supraspinatus 21 (24.7)III Tendinosis of supraspinatus 16 (18.8)IV Others 13 (15.3)
Subacromial subdeltoid bursitis 2 (2.4)Partial thickness tear of subscapularis 2 (2.4)Full thickness tear of infraspinatus 2 (2.4)Adhesive capsulitis 2 (2.4)Full thickness tear of long head of biceps 1 (1.2)Labral tear 4 (4.7)
Table 2: Correlation between fi nal diagnosis and USG diagnosisCharacteristic N (%)
Group I (n=35)
Group II (n=21)
Group III (n=16)
Group IV (n=13)
Normal 7 (20.0) 0 (0.0) 6 (37.5) 3 (23.1)Partial thickness tear of supraspinatus
21 (60.0) 1 (4.8) 0 (0.0) 0 (0.0)
Full thickness tear of supraspinatus
6 (17.1) 20 (95.2) 0 (0.0) 0 (0.0)
Tendinosis of supraspinatus
1 (2.9) 0 (0.0) 10 (62.5) 0 (0.0)
Others 0 (0.0) 0 (0.0) 0 (0.0) 10 (76.9)USG: Ultrasonography. χ2=166.47 (df=12); P<0.001
Table 3: Correlation between fi nal diagnosis and MRI diagnosisCharacteristic N (%)
Group I (n=35)
Group II (n=21)
Group III (n=16)
Group IV (n=13)
Normal 1 (2.9) 0 (0) 1 (6.3) 1 (7.7)Partial thickness tear of supraspinatus
31 (88.6) 1 (4.8) 1 (6.3) 0 (0.0)
Full thickness tear of supraspinatus
1 (2.9) 20 (95.2) 0 (0.0) 0 (0.0)
Tendinosis of supraspinatus
2 (5.70 0 (0.0) 14 (87.50) 0 (0.0)
Others 0 (0.0) 0 (0.0) 0 (0.0) 12 (92.3)MRI: Magnetic resonance imaging. χ2=217.77 (df=12); P<0.001

Khanduri, et al.: USG versus MRI in Chronic Shoulder Pain Evaluation
267 International Journal of Scientifi c Study | April 2016 | Vol 4 | Issue 1
For tendinosis of supraspinatus, USG had a sensitivity, specifi city, PPV, NPV, and accuracy of 62.5%, 91.3%, 62.5%, 91.3%, and 85.9%, respectively, as compared to 87.5%, 97.1%, 87.5%, 97.1%, and 95.3%, respectively, for the same parameters on MRI.
For “other” diagnoses, USG had a sensitivity, specifi city, PPV, NPV, and accuracy of 76.9%, 100%, 100%, 96.0%, and 96.5%, respectively, as compared to 100%, 100%, 100%, 100%, and 100%, respectively, for the same parameters on MRI (Table 4).
DISCUSSION
In this study, an attempt was made to compare the role of high-resolution USG and magnetic resonance imaging in the evaluation of chronic shoulder pain with follow-up to ascertain the accuracy of clinical and radiological fi ndings.
For this purpose, a total of 85 patients with complaints of chronic shoulder pain were enrolled in the study. The mean age of patients was 45.21 years, majority of them were males. Similar to results of present study Shrestha and Alam16 and Vijayvargiya et al.17
In this study, chronic shoulder pain was defi ned as the presence of shoulder pain for more than 6 months and majority of patients had shoulder pain over 6-9 months (56.5%). There were 32 (37.6%) with shoulder pain over 9-12 months and 5 (5.9%) with shoulder pain for more than a year. This study showed a high predominance of the right side (76.5%) as compared to the left side (23.5%). In this study, a total of 17 (20%) cases had a history of diabetes.
History of trauma was reported in 48 (56.5%) cases. This is in consistence with the observation of Donovan and Paulos,18 who observed that overuse and traumatic injuries make up most of the causes features such as tenderness (34.1%) and complaints such as night pain (65.9%) were also common. As far as range of motion was concerned, it was normal to >45° in 50/85 (58.8%) patients, thus indicating that in general the patients were able to perform
their routine tasks – and this might be the reason for the chronic condition. In resource-poor settings such as our people often tend to ignore their medical needs until it leads to restriction of their routine functions which leads to the development of a chronic condition.
In this study, clinically a total of 56 (65.9%) were diagnosed as rotator cuff-tear followed by supraspinatus impingement (n = 15; 17.6%), calcifi c tendinitis (n = 8; 9.4%), subacromial-subdeltoid bursitis (n = 4; 4.7%), and adhesive capsulitis (n = 2; 2.4%), respectively. Clinical diagnosis is often based on the outcome of a host of clinical tests which have a varying effi cacy.19,20
The final diagnosis was based on the arthroscopic evaluation. Partial thickness tear of supraspinatus (n = 35; 41.2%) was the most common diagnoses followed by full thickness of supraspinatus (n = 21; 24.7%) and tendinosis of supraspinatus (n = 16; 18.8%). Among other diagnoses (n = 13; 15.3%) – labral tear was most common (n = 4; 4.7%) subacromial-subdeltoid bursitis, partial thickness tear of subscapularis, full thickness tear of infraspinatus, and adhesive capsulitis was diagnosed in 2 (2.4%) patients each, and full thickness tear of long head of biceps in 1 (1.2%) patient.
The arthroscopic fi ndings, in turn, showed the varying underlying pathologies for different clinical diagnoses and as indicated above showed the need of inclusion of more refi ned diagnostic modalities to avoid chronicity.
On correlating the clinical fi ndings with arthroscopic fi ndings, it was seen that for almost all the arthroscopic diagnoses majority number of patients showed rotator cuff tear as the clinical diagnosis. Similarly, clinical diagnosis of supraspinatus impingement coincided with a large proportion of patients with varying arthroscopic fi ndings. The arthroscopic fi ndings in such a condition provide a much better pathological condition than the generalized clinical diagnosis vis-à-vis a generalized rehabilitation/treatment approach which failed to provide a substantial clinical improvement and in turn resulted in the evolution of a chronic condition.
Table 4: Comparative evaluation of diagnostic effi cacy of USG and MRI for different causes of chronic shoulder painConfi rmed cause USG MRI
Sensitivity Specifi city PPV NPV Accuracy Sensitivity Specifi city PPV NPV AccuracyPartial thickness tear of supraspinatus 60.0 97.6 95.5 74.1 80.3 88.6 96.0 93.9 92.3 92.9Full thickness tear of supraspinatus 95.2 90.6 76.9 98.3 91.8 95.2 98.4 95.2 98.4 97.6Tendinosis of supraspinatus 62.5 91.3 62.5 91.3 85.9 87.5 97.1 87.5 97.1 95.3Others 76.9 100.0 100.0 96.0 96.5 92.7 100.0 100.0 98.6 98.8PPV: Positive predictive value, NPV: Negative predictive value, USG: Ultrasonography, MRI: Magnetic resonance imaging
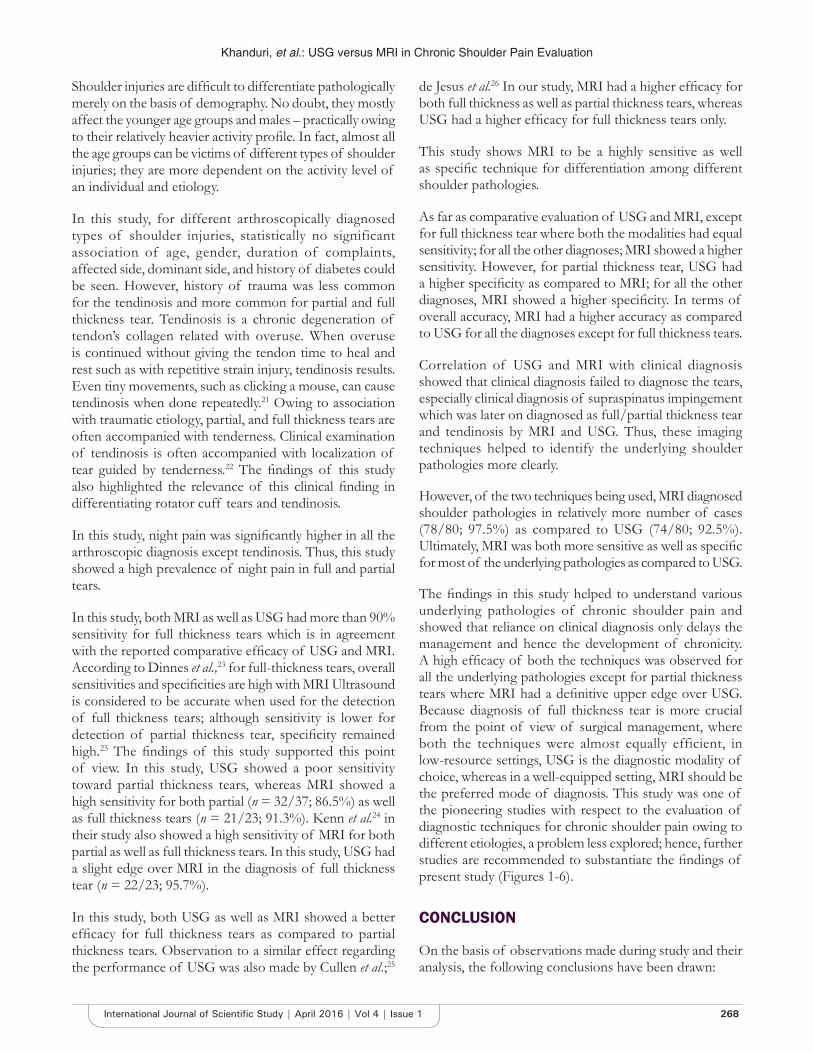
Khanduri, et al.: USG versus MRI in Chronic Shoulder Pain Evaluation
268International Journal of Scientifi c Study | April 2016 | Vol 4 | Issue 1
Shoulder injuries are diffi cult to differentiate pathologically merely on the basis of demography. No doubt, they mostly affect the younger age groups and males – practically owing to their relatively heavier activity profi le. In fact, almost all the age groups can be victims of different types of shoulder injuries; they are more dependent on the activity level of an individual and etiology.
In this study, for different arthroscopically diagnosed types of shoulder injuries, statistically no significant association of age, gender, duration of complaints, affected side, dominant side, and history of diabetes could be seen. However, history of trauma was less common for the tendinosis and more common for partial and full thickness tear. Tendinosis is a chronic degeneration of tendon’s collagen related with overuse. When overuse is continued without giving the tendon time to heal and rest such as with repetitive strain injury, tendinosis results. Even tiny movements, such as clicking a mouse, can cause tendinosis when done repeatedly.21 Owing to association with traumatic etiology, partial, and full thickness tears are often accompanied with tenderness. Clinical examination of tendinosis is often accompanied with localization of tear guided by tenderness.22 The fi ndings of this study also highlighted the relevance of this clinical fi nding in differentiating rotator cuff tears and tendinosis.
In this study, night pain was signifi cantly higher in all the arthroscopic diagnosis except tendinosis. Thus, this study showed a high prevalence of night pain in full and partial tears.
In this study, both MRI as well as USG had more than 90% sensitivity for full thickness tears which is in agreement with the reported comparative effi cacy of USG and MRI. According to Dinnes et al.,23 for full-thickness tears, overall sensitivities and specifi cities are high with MRI Ultrasound is considered to be accurate when used for the detection of full thickness tears; although sensitivity is lower for detection of partial thickness tear, specifi city remained high.23 The fi ndings of this study supported this point of view. In this study, USG showed a poor sensitivity toward partial thickness tears, whereas MRI showed a high sensitivity for both partial (n = 32/37; 86.5%) as well as full thickness tears (n = 21/23; 91.3%). Kenn et al.24 in their study also showed a high sensitivity of MRI for both partial as well as full thickness tears. In this study, USG had a slight edge over MRI in the diagnosis of full thickness tear (n = 22/23; 95.7%).
In this study, both USG as well as MRI showed a better effi cacy for full thickness tears as compared to partial thickness tears. Observation to a similar effect regarding the performance of USG was also made by Cullen et al.;25
de Jesus et al.26 In our study, MRI had a higher effi cacy for both full thickness as well as partial thickness tears, whereas USG had a higher effi cacy for full thickness tears only.
This study shows MRI to be a highly sensitive as well as specifi c technique for differentiation among different shoulder pathologies.
As far as comparative evaluation of USG and MRI, except for full thickness tear where both the modalities had equal sensitivity; for all the other diagnoses; MRI showed a higher sensitivity. However, for partial thickness tear, USG had a higher specifi city as compared to MRI; for all the other diagnoses, MRI showed a higher specifi city. In terms of overall accuracy, MRI had a higher accuracy as compared to USG for all the diagnoses except for full thickness tears.
Correlation of USG and MRI with clinical diagnosis showed that clinical diagnosis failed to diagnose the tears, especially clinical diagnosis of supraspinatus impingement which was later on diagnosed as full/partial thickness tear and tendinosis by MRI and USG. Thus, these imaging techniques helped to identify the underlying shoulder pathologies more clearly.
However, of the two techniques being used, MRI diagnosed shoulder pathologies in relatively more number of cases (78/80; 97.5%) as compared to USG (74/80; 92.5%). Ultimately, MRI was both more sensitive as well as specifi c for most of the underlying pathologies as compared to USG.
The fi ndings in this study helped to understand various underlying pathologies of chronic shoulder pain and showed that reliance on clinical diagnosis only delays the management and hence the development of chronicity. A high effi cacy of both the techniques was observed for all the underlying pathologies except for partial thickness tears where MRI had a defi nitive upper edge over USG. Because diagnosis of full thickness tear is more crucial from the point of view of surgical management, where both the techniques were almost equally efficient, in low-resource settings, USG is the diagnostic modality of choice, whereas in a well-equipped setting, MRI should be the preferred mode of diagnosis. This study was one of the pioneering studies with respect to the evaluation of diagnostic techniques for chronic shoulder pain owing to different etiologies, a problem less explored; hence, further studies are recommended to substantiate the fi ndings of present study (Figures 1-6).
CONCLUSION
On the basis of observations made during study and their analysis, the following conclusions have been drawn:
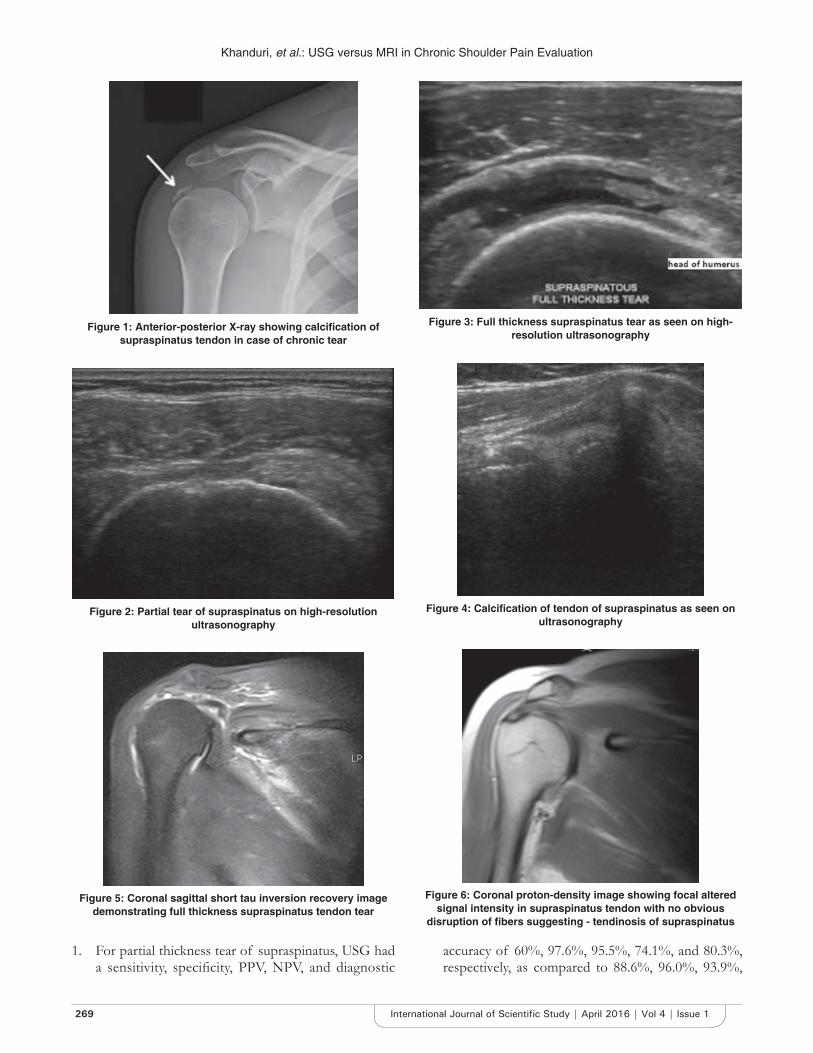
Khanduri, et al.: USG versus MRI in Chronic Shoulder Pain Evaluation
269 International Journal of Scientifi c Study | April 2016 | Vol 4 | Issue 1
1. For partial thickness tear of supraspinatus, USG had a sensitivity, specifi city, PPV, NPV, and diagnostic
accuracy of 60%, 97.6%, 95.5%, 74.1%, and 80.3%, respectively, as compared to 88.6%, 96.0%, 93.9%,
Figure 1: Anterior-posterior X-ray showing calcifi cation of supraspinatus tendon in case of chronic tear
Figure 2: Partial tear of supraspinatus on high-resolution ultrasonography
Figure 3: Full thickness supraspinatus tear as seen on high-resolution ultrasonography
Figure 4: Calcifi cation of tendon of supraspinatus as seen on ultrasonography
Figure 5: Coronal sagittal short tau inversion recovery image demonstrating full thickness supraspinatus tendon tear
Figure 6: Coronal proton-density image showing focal altered signal intensity in supraspinatus tendon with no obvious
disruption of fi bers suggesting - tendinosis of supraspinatus
Khanduri, et al.: USG versus MRI in Chronic Shoulder Pain Evaluation
270International Journal of Scientifi c Study | April 2016 | Vol 4 | Issue 1
92.3%, and 92.9%, respectively, for the same parameters on MRI.
2. For full thickness tear of supraspinatus, USG had a sensitivity, specifi city, PPV, NPV, and diagnostic accuracy of 95.2%, 90.6%, 76.9%, 98.3%, and 91.8%, respectively, as compared to 95.2%, 98.4%, 95.2%, 98.4%, and 97.6%, respectively, for the same parameters on MRI.
3. For tendinosis of supraspinatus, USG had a sensitivity, specifi city, PPV, NPV, and diagnostic accuracy of 62.5%, 91.3%, 62.5%, 91.3%, and 85.9%, respectively, as compared to 87.5%, 97.1%, 87.5%, 97.1%, and 95.3%, respectively, for the same parameters on MRI.
4. For other diagnoses, USG had a sensitivity, specifi city, PPV, NPV, and diagnostic accuracy of 76.9%, 100%, 100%, 96.0%, and 96.5%, respectively, as compared to 92.3%, 100%, 100%, 98.6%, and 98.8%, respectively, for the same parameters on MRI.
5. In others, category labral tear was the most common (n = 4; 4.7%); however, it was diagnosed correctly only in 2 cases on USG and in 3 cases in MRI. Subacromial-subdeltoid bursitis, partial thickness tear of the subscapularis, full thickness tear of infraspinatus, and adhesive capsulitis were seen in 2 (2.4%) cases each, among these subacromial-subdeltoid bursitis was missed in 1 case on USG however in MRI all these were matched accurately. Full thickness tear of the long head of biceps was seen in 1 (1.2%) and both the techniques detected it accurately.
6. Confi rmation of cause of chronic pain was more precise in MRI as compared to USG. Considering the diagnostic supremacy of MRI, it is therefore recommended to be used as a non-invasive diagnostic tool of choice as an aid to clinical assessment.
REFERENC ES
1. Pope DP, Croft PR, Pritchard CM, Silman AJ. Prevalence of shoulder pain in the community: The infl uence of case defi nition. Ann Rheum Dis 1997;56:308-12.
2. van der Windt DA, Koes BW, Boeke AJ, Devillé W, De Jong BA, Bouter LM. Shoulder disorders in general practice: Prognostic indicators of outcome. Br J Gen Pract 1996;46:519-23.
3. Chopra A, Saluja M, Patil J, Tandale HS. Pain and disability, perceptions and beliefs of a rural Indian population: A WHO-ILAR COPCORD study. WHO-international league of associations for rheumatology. Community oriented program for control of rheumatic diseases. J Rheumatol 2002;29:614-21.
4. Joshi VL, Chopra A. Is there an urban-rural divide? Population surveys of rheumatic musculoskeletal disorders in the Pune region of India using the COPCORD Bhigwan model. J Rheumatol 2009;36:614-22.
5. Mitchell C, Adebajo A, Hay E, Carr A. Shoulder pain: Diagnosis and management in primary care. BMJ 2005;331:1124-8.
6. Chakravarty KK, Webley M. Disorders of the shoulder: An often unrecognised cause of disability in elderly people. BMJ 1990;300:848-9.
7. Chard MD, Hazleman R, Hazleman BL, King RH, Reiss BB. Shoulder disorders in the elderly: A community survey. Arthritis Rheum 1991;34:766-9.
8. Bot SD, van der Waal JM, Terwee CB, van der Windt DA, Schellevis FG, Bouter LM, et al. Incidence and prevalence of complaints of the neck and upper extremity in general practice. Ann Rheum Dis 2005;64:118-23.
9. Feleus A, Bierma-Zeinstra SM, Miedema HS, Bernsen RM, Verhaar JA, Koes BW. Incidence of non-traumatic complaints of arm, neck and shoulder in general practice. Man Ther 2008;13:426-33.
10. Schellingerhout JM, Verhagen AP, Thomas S, Koes BW. Lack of uniformity in diagnostic labeling of shoulder pain: Time for a different approach. Man Ther 2008;13:478-83.
11. Buchbinder R, Goel V, Bombardier C, Hogg-Johnson S. Classifi cation systems of soft tissue disorders of the neck and upper limb: Do they satisfy methodological guidelines? J Clin Epidemiol 1996;49:141-9.
12. Boocock MG, Collier JM, McNair PJ, Simmonds M, Larmer PJ, Armstrong BA. Framework for the classifi cation and diagnosis of work-related upper extremity conditions: Systematic review. Semin arthritis rheum 2009;38:296-311.
13. Hegedus EJ, Goode A, Campbell S, Morin A, Tamaddoni M, Moorman CT 3rd, et al. Physical examination tests of the shoulder: A systematic review with meta-analysis of individual tests. Br J Sports Med 2008;42:80-92.
14. Hegedus EJ, Goode AP, Cook CE, Michener L, Myer CA, Myer DM, et al. Which physical examination tests provide clinicians with the most value when examining the shoulder? Update of a systematic review with meta-analysis of individual tests. Br J Sports Med 2012;46:964-78.
15. Burbank KM, Stevenson JH, Czarnecki GR, Dorfman J. Chronic shoulder pain: Part I. Evaluation and diagnosis. Am Fam Physician 2008;77:453-60.
16. Shrestha MS, Alam A. Comparative evaluation of rotator cuff injuries of the shoulder joint using high resolution ultrasound and magnetic resonance imaging. Med J Shree Birendra Hosp 2011;10:9-14.
17. Vijayvargiya R, Atram S, Daftary J. Role of MRI in rotator cuff injury & comparing its diagnostic accuracy with USG. Natl J Med Dent Res 2014;3:38-43.
18. Donovan PJ, Paulos LE. Common injuries of the shoulder. Diagnosis and treatment. West J Med 1995;163:351-9.
19. Nygren A, Berglund A, von Koch M. Neck-and-shoulder pain, an increasing problem. Strategies for using insurance material to follow trends. Scand J Rehabil Med Suppl 1995;32:107-12.
20. Sher JS, Uribe JW, Posada A, Murphy BJ, Zlatkin MB. Abnormal fi ndings on magnetic resonance images of asymptomatic shoulders. J Bone Joint Surg Am 1995;77:10-5.
21. de Jesus JO, Parker L, Frangos AJ, Nazarian LN. Accuracy of MRI, MR arthrography, and ultrasound in the diagnosis of rotator cuff tears: A meta-analysis. AJR Am J Roentgenol 2009;192:1701-7.
22. Bass E. Tendinopathy: Why the difference between tendinitis and tendinosis matters. Int J Ther Massage Bodywork 2012;5:14-7.
23. Dinnes J, Loveman E, McIntyre L, Waugh N. The effectiveness of diagnostic tests for the assessment of shoulder pain due to soft tissue disorders: A systematic review. Health Technol Assess 2003;7:iii, 1-166.
24. Kenn W, Hufnagel P, Müller T, Gohlke F, Böhm D, Kellner M, et al. Arthrography, ultrasound and MRI in rotator cuff lesions: A comparison of methods in partial lesions and small complete ruptures. Rofo 2000;172:260-6.
25. Cullen DM, Breidahl WH, Janes GC. Diagnostic accuracy of shoulder ultrasound performed by a single operator. Australas Radiol 2007;51:226-9.
26. Jain NB, Wilcox RB 3rd, Katz JN, Higgins LD. Clinical examination of the rotator cuff. PM R 2013;5:45-56.
How to cite this article: Khanduri S, Raja A, Meha T, Agrawal S, Bhagat S, Jaiswal G. Comparative Study of the Diagnostic Ability ofUltrasonography and Magnetic Resonance Imaging in the Evaluation of Chronic Shoulder Pain. Int J Sci Stud 2016;4(1):264-270.
sSource of Support: Nil, Confl ict of Interest: None declared.

271 International Journal of Scientifi c Study | April 2016 | Vol 4 | Issue 1
Comparison of the Accuracy of Spot Urinary Protein/Creatinine Ratio and Urinary Dipstick with the 24-h Urine Protein Estimation in Children with Nephrotic SyndromeVidhyadevi Ananthakumar1, Balasubramanian Marimuthu2, Nandini Kuppusamy3
1Assistant Professor, Department of Paediatrics, Government Theni Medical College, Theni, Tamil Nadu, India, 2Associate Professor, Department of Paediatrics, Government Theni Medical College, Theni, Tamil Nadu, India, 3Professor, Department of Paediatrics, Government Theni Medical College, Theni, Tamil Nadu, India
Recent studies have shown that the correlation between spot urinary protein/creatinine ratio (UPr:UCr), urinary dipstick, and 24-HUP estimation was statistically highly signifi cant for all levels of proteinuria.
The most widely used screening test is urine dipstick test.1 It is usually highly specifi c, but sensitivity is not always high enough as in quantitative methods. False positive and false negative results may occur in some situations. A simple, convenient and accurate method is crucial for proteinuria detection.4-6
This study is done to compare the accuracy of spot UPr:UCr and urinary dipstick method with the 24-h protein estimation in children with nephrotic syndrome.
INTRODUCTION
In Nephrotic syndrome, proteinuria detection is used diagnostically. A common accepted method for quantifi cation of proteinuria is 24-h urinary protein (HUP) excretion. However, it is time consuming, cumbersome, and imprecise due to collection error. A spot urine examination would be more acceptable and less time consuming.1-3
Original Article
Abstract
Introduction: Nephrotic syndrome is a common renal disease. 24-h urinary protein (HUP) excretion, which is commonly accepted method for quantifi cation of proteinuria, is time-consuming and inconvenient. A spot urine examination would be more acceptable and less time consuming. A simple, easy and precise method is necessary for proteinuria detection.
Aim: To compare the accuracy of spot urinary protein/creatinine ratio and urinary dipstick with the 24-HUP estimation in children with nephrotic syndrome.
Materials and Methods: An observational study was conducted on 102 children with all types of nephrotic syndrome under the age of 12 years in the Government Madurai Medical College Hospital, Madurai, for 1 year.
Results: The correlation between spot protein creatinine ratio (PCR) and 24-h proteinuria is statistically signifi cant irrespective of the degree of proteinuria (P ≤ 0.001). Dipstick correlates well with 24-HUP in all ranges of proteinuria (P ≤ 0.001).
Conclusion: Spot PCR can be used as a reliable test to detect proteinuria even on an outpatient basis. The dipstick can be used to give an instant reliable test for proteinuria detection. Nephrotic syndrome is a chronic disease and having multiple relapses. Parents can be trained for earlier detection of proteinuria using the dipstick, so it can be helpful in management.
Key words: 24-h urine protein, Dipstick, Nephrotic syndrome, Proteinuria, Spot protein/creatinine ratio
Access this article online
www.ijss-sn.com
Month of Submission : 02-2016Month of Peer Review : 03-2016Month of Acceptance : 04-2016Month of Publishing : 04-2016
Corresponding Author: Dr. Vidhyadevi Ananthakumar, Assistant Professor, Department of Paediatrics, Government Theni Medical College, Theni, Tamil Nadu, India. Phone: +91-9994657757. E-mail: [email protected]
DOI: 10.17354/ijss/2016/231

Ananthakumar, et al.: Comparison of Spot PCR and Dipstick with the 24-HUP in Nephrotic Children
272International Journal of Scientifi c Study | April 2016 | Vol 4 | Issue 1
MATERIALS AND METHODS
This is an observational study conducted in the Government Madurai Medical College Hospital, Madurai, for 1 year. The study population includes children with all types of nephrotic syndrome under age of 12 years. The study excludes proteinuria with alkaline urine (pH>8), diluted urine (specifi c gravity <1.002), gross hematuria, and pyuria since it may give false positive or false negative results with dipstick.
Informed consent was obtained from the parent/guardian for the study. Data were collected about the age and sex. Height and weight were measured. Body surface area was arrived using Mosteller formula. Patients were asked to collect urine for 24 h. Collection time starts from 7.00 am on the 1st day and completed by 7.00 am the next day. The 24-HUP was determined. The next random urine sample should be subjected to spot protein creatinine ratio (PCR) and dipstick tests. The results of the spot PCR, dipstick, and 24-HUP were recorded as normal, abnormal, and nephrotic proteinuria. The accuracy of spot UPr:UCr and urinary dipstick were compared with the 24-HUP estimation. For the determination of 24-HUP excretion, measure the urine volume and calculate the result as follows:
24 h urine protein =
Urine protein in mg/dl × totalvolume of urine excreeted in 24 h
100Result reported as2 normal range of proteinuria - <4 mg/m2/h, abnormal proteinuria - 4-40 mg/m2/h, nephrotic proteinuria - >40 mg/m2/h.
The next random urine sample should be subjected to following tests.
Spot UPr:UCrUPr can be estimated by the sulfosalicylic acid method. UCr can be estimated by the Jaffe’s method (picric acid method).4,5
Spot UPr:UCr is arrived by dividing UPr concentration (mg/dl) by UCr concentration (mg/dl).
Results reported as• Normal protein excretion - <0.5 in children <2 years
of age• <0.2 in children ≥2 years of age• Abnormal proteinuria - 0.5-2 in children <2 years of
age• 0.2-2 in children ≥2 years of age• Nephrotic proteinuria - >2.
Dipstick TestUsing DIP ‘N’ READ, a 10 reagent strip, proteinuria was measured. 5-10 ml of urine was taken in a test tube. The strip was immersed completely in the urine and withdrawn immediately. Prolonged immersion will produce a false positive result due to leak of buffer. Specifi c gravity, pH, leukocytes, and blood were also determined using this A-10 reagent strip. The study excludes proteinuria with alkaline urine (pH>8) since it may give false positive results; diluted urine (specifi c gravity >1.010)3 since it may give false negative. Gross hematuria was excluded by detecting red blood cells in the dipstick. By detecting leukocytes, pyuria was excluded.
The result was reported as2,3 negative no protein, trace - 10-20 mg/dl, 1±30 mg/dl, 2±100 mg/dl, 3±300 mg/dl, 4±1000-2000 mg/dl.
The results of the spot PCR, dipstick, and 24-HUP were depicted as normal, abnormal, and nephrotic proteinuria, respectively (Table 1).
RESULTS
In this study, 1% of the case was an infant, 46.1% of cases belonged to 6-12 years age group, and 52.9% of cases belonged to children more than 6 years. Mean age is 6.87 years. Standard deviation is −3.4418. Out of the 102 cases, 61 cases (59.8%) were males and 41 cases (40.2%) were females (Table 2).
Results of dipstick are shown in Table 3. Out of the 102 cases, 29.4% of spot PCR results were <0.5/<0.2 in children <2 years or more than 2 years, respectively. 33.3% were 0.5-2/0.2-2 in children <2 years of age or more than 2 years of age, respectively. 37.3% of spot PCR results were >2 (Table 4).
Out of the 102 cases, 29.4% of 24-HUP results were <4 mg/m2/h. 35.3% were 4-40 mg/m2/h. 35.3% of 24-HUP results were <4 mg/m2/h (Table 5).
Comparison between the Three GroupsThe following comparisons were done• Comparison between urine spot protein/creatinine
ratio and 24-HUP• Comparison between urine dipstick and 24-HUP.
Comparison of Spot PCR and 24-HUP (Table 6)When spot PCR was compared with 24-HUP, 86.7% (26/30) of samples with spot PCR <0.5/<0.2 had a protein excretion of <4 mg/m2/h. 82.4% (28/34) of samples with spot PCR 0.5-2/0.2-2 had a protein excretion of 4-40 mg/m2/h.
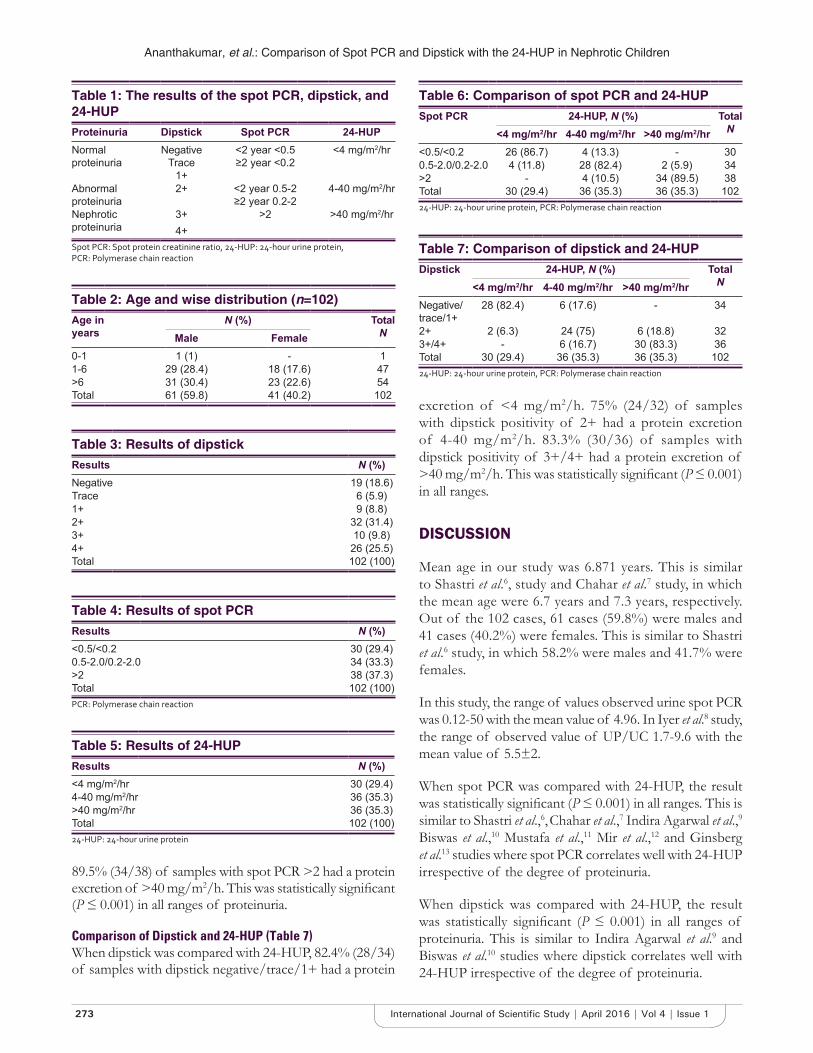
Ananthakumar, et al.: Comparison of Spot PCR and Dipstick with the 24-HUP in Nephrotic Children
273 International Journal of Scientifi c Study | April 2016 | Vol 4 | Issue 1
excretion of <4 mg/m2/h. 75% (24/32) of samples with dipstick positivity of 2+ had a protein excretion of 4-40 mg/m2/h. 83.3% (30/36) of samples with dipstick positivity of 3+/4+ had a protein excretion of >40 mg/m2/h. This was statistically signifi cant (P ≤ 0.001) in all ranges.
DISCUSSION
Mean age in our study was 6.871 years. This is similar to Shastri et al.6, study and Chahar et al.7 study, in which the mean age were 6.7 years and 7.3 years, respectively. Out of the 102 cases, 61 cases (59.8%) were males and 41 cases (40.2%) were females. This is similar to Shastri et al.6 study, in which 58.2% were males and 41.7% were females.
In this study, the range of values observed urine spot PCR was 0.12-50 with the mean value of 4.96. In Iyer et al.8 study, the range of observed value of UP/UC 1.7-9.6 with the mean value of 5.5±2.
When spot PCR was compared with 24-HUP, the result was statistically signifi cant (P ≤ 0.001) in all ranges. This is similar to Shastri et al.,6, Chahar et al.,7 Indira Agarwal et al.,9 Biswas et al.,10 Mustafa et al.,11 Mir et al.,12 and Ginsberg et al.13 studies where spot PCR correlates well with 24-HUP irrespective of the degree of proteinuria.
When dipstick was compared with 24-HUP, the result was statistically signifi cant (P ≤ 0.001) in all ranges of proteinuria. This is similar to Indira Agarwal et al.9 and Biswas et al.10 studies where dipstick correlates well with 24-HUP irrespective of the degree of proteinuria.
Table 1: The results of the spot PCR, dipstick, and 24-HUPProteinuria Dipstick Spot PCR 24-HUPNormal proteinuria
NegativeTrace
1+
<2 year <0.5≥2 year <0.2
<4 mg/m2/hr
Abnormal proteinuria
2+ <2 year 0.5-2≥2 year 0.2-2
4-40 mg/m2/hr
Nephrotic proteinuria
3+4+
>2 >40 mg/m2/hr
Spot PCR: Spot protein creatinine ratio, 24-HUP: 24-hour urine protein, PCR: Polymerase chain reaction
Table 2: Age and wise distribution (n=102)Age in years
N (%) TotalNMale Female
0-1 1 (1) - 11-6 29 (28.4) 18 (17.6) 47>6 31 (30.4) 23 (22.6) 54Total 61 (59.8) 41 (40.2) 102
Table 3: Results of dipstickResults N (%)Negative 19 (18.6)Trace 6 (5.9)1+ 9 (8.8)2+ 32 (31.4)3+ 10 (9.8)4+ 26 (25.5)Total 102 (100)
Table 4: Results of spot PCRResults N (%)<0.5/<0.2 30 (29.4)0.5-2.0/0.2-2.0 34 (33.3)>2 38 (37.3)Total 102 (100)PCR: Polymerase chain reaction
Table 5: Results of 24-HUPResults N (%)<4 mg/m2/hr 30 (29.4)4-40 mg/m2/hr 36 (35.3)>40 mg/m2/hr 36 (35.3)Total 102 (100)24-HUP: 24-hour urine protein
89.5% (34/38) of samples with spot PCR >2 had a protein excretion of >40 mg/m2/h. This was statistically signifi cant (P ≤ 0.001) in all ranges of proteinuria.
Comparison of Dipstick and 24-HUP (Table 7)When dipstick was compared with 24-HUP, 82.4% (28/34) of samples with dipstick negative/trace/1+ had a protein
Table 6: Comparison of spot PCR and 24-HUPSpot PCR 24-HUP, N (%) Total
N<4 mg/m2/hr 4-40 mg/m2/hr >40 mg/m2/hr<0.5/<0.2 26 (86.7) 4 (13.3) - 300.5-2.0/0.2-2.0 4 (11.8) 28 (82.4) 2 (5.9) 34>2 - 4 (10.5) 34 (89.5) 38Total 30 (29.4) 36 (35.3) 36 (35.3) 10224-HUP: 24-hour urine protein, PCR: Polymerase chain reaction
Table 7: Comparison of dipstick and 24-HUPDipstick 24-HUP, N (%) Total
N<4 mg/m2/hr 4-40 mg/m2/hr >40 mg/m2/hrNegative/trace/1+
28 (82.4) 6 (17.6) - 34
2+ 2 (6.3) 24 (75) 6 (18.8) 323+/4+ - 6 (16.7) 30 (83.3) 36Total 30 (29.4) 36 (35.3) 36 (35.3) 10224-HUP: 24-hour urine protein, PCR: Polymerase chain reaction
Ananthakumar, et al.: Comparison of Spot PCR and Dipstick with the 24-HUP in Nephrotic Children
274International Journal of Scientifi c Study | April 2016 | Vol 4 | Issue 1
CONCLUSION
• Nephrotic syndrome is more common in males than females
• There is statistically signifi cant correlation between spot PCR and 24-h proteinuria irrespective of the degree of proteinuria. So, spot PCR, which is a quantitative method can be used as a reliable test to detect proteinuria even on outpatient basis
• Dipstick correlates well with 24-HUP. So, dipstick can be used to give an instant reliable test for proteinuria detection.
Nephrotic syndrome is a chronic disease and having multiple relapses. Since earlier detection prevents relapse, parents can be trained for earlier detection of proteinuria using the dipstick.
REFERENCES
1. Kashif W, Siddiqi N, Dincer AP, Dincer HE, Hirsch S. Proteinuria: How to evaluate an important fi nding. Cleve Clin J Med 2003;70:535-7, 541-4, 546-7.
2. Behrman RE, Kleiman RM, Jenson HB. The nephrotic syndrome. Nelson Textbook of Pediatrics. 19th ed. New Delhi: Elsevier India Private Limited; 2011. p. 1799-807.
3. Leung AK, Wong AH. Proteinuria in children. Am Fam Physician. 2010;82:645-51.
4. Godkar PB, Godkar DP. Textbook of Medical Laboratory Technology. 2nd ed. Mumbai: Bhalani Publishing House; 2003. p. 243, 887-9.
5. Varley H. Practical Clinical Biochemistry. 4th ed. London: Interscience Book; 1988. p. 484-8, 605-7.
6. Shastri NJ, Shendurnikar N, Nayak U, Kotecha PV. Quantifi cation of proteinuria by urine protein/creatinine ratio. Indian Pediatr 1994;31:334-7.
7. Chahar OP, Bundella B, Chahar CK, Purohit M. Quantitation of proteinuria by use of single random spot urine collection. J Indian Med Assoc 1993;91:86-7.
8. Iyer RS, Shailaja SN, Bhaskaranand N, Baliga M, Venkatesh A. Quantitation of proteinuria using protein-creatinine ratio in random urine samples. Indian Pediatr 1991;28:463-7.
9. Agarwal I, Kirubakaran C, Markandeyulu, Selvakumar. Quantitation of proteinuria by spot urine sampling. Indian J Clin Biochem 2004;19:45-7.
10. Biswas A, Kumar R, Chaterjee A, Ghosh JK, Basu K. Quantitation of proteinuria in nephrotic syndrome by spot urine protein creatinine ratio estimation in children. Mymensingh Med J 2009;18:67-71.
11. Mustafa G, Khan PA, Iqbal I, Hussain Z, Iqbal MM. Simplifi ed quantifi cation of urinary protein excretion in children with nephrotic syndrome. J Coll Physicians Surg Pak 2007;17:615-8.
12. Mir S, Kütükçüler N, Cura A. Use of single voided urine samples to estimate quantitative proteinuria in children. Turk J Pediatr 1992;34:219-24.
13. Ginsberg JM, Chang BS, Matarese RA, Garella S. Use of single voided urine samples to estimate quantitative proteinuria. N Engl J Med 1983;309:1543-6.
How to cite this article: Ananthakumar V, Marimuthu B, Kuppusamy N. Comparison of the Accuracy of Spot Urinary Protein/Creatinine Ratio and Urinary Dipstick with the 24-h Urine Protein Estimation in Children with Nephrotic Syndrome. Int J Sci Stud 2016;4(1):271-274.
Source of Support: Nil, Confl ict of Interest: None declared.
275 International Journal of Scientifi c Study | April 2016 | Vol 4 | Issue 1
Analysis of the Profi le and Outcome of Children those Received Oxygen Support through High-fl ow Nasal Cannula in a Rural Medical College HospitalBalasubramanian Marimuthu1, Nandini Kuppusamy2, M Krithiga3
1Associate Professor, Department of Paediatrics, Government Theni Medical College Hospital, Kanavilakku, Theni, Tamil Nadu, India, 2Professor, Department of Paediatrics, Government Theni Medical College Hospital, Kanavilakku, Theni, Tamil Nadu, India, 3Senior Resident, Department of Paediatrics, Government Theni Medical College Hospital, Kanavilakku, Theni, Tamil Nadu, India
delivered has traditionally been limited by poor tolerance of fl ow rates >2 L/min in children. The heating (to body temperature) and humidifi cation (to >99% relative humidity) of oxygen and air mixtures allow comfortable delivery at fl ow rates which match or exceed the patient’s inspiratory fl ow rate, thus limiting entrainment of room air. This is known as heated humidifi ed high-fl ow nasal cannula (HHHFNC) therapy.
In addition to improving oxygenation, HHHFNC therapy may improve the effi ciency of ventilation, reduce work of breathing, and avoid the need for intubation.1-3 Furthermore, the inspired oxygen concentration can be titrated to the patient’s need; anecdotally, it is better
INTRODUCTION
Administration of supplementary oxygen forms an essential part of the management of respiratory distress. Nasal cannulae are a well-established mode of delivery of oxygen therapy, but the amount of oxygen that can be
Original Article
Abstract
Background: Oxygen therapy remains the fi rst-line intervention for children admitted with respiratory distress. Heated humidifi ed high-fl ow nasal cannula (HHHFNC) oxygen therapy represents a new alternative to conventional oxygen therapy. HFNC generates fl ows up to 60 L/min, yet using a nasal cannula as an interface to the patient. Heating and humidifi cation of gas mixtures allow comfortable delivery of fl ow rates that match or exceed the patient’s inspiratory fl ow rate.
Materials and Methods: Children with moderate to severe respiratory distress admitted over a period of 1-year from January 2014 to December 2014.
Results: Out of 52 children, who received humidifi ed high-fl ow oxygen therapy, 40 (76.92%) were infants below 1 year of age. 31 (59.62%) children were males. The major cause for respiratory distress needing initiation of oxygen therapy with high-fl ow nasal cannula is respiratory cause contributing to 69.23% followed by cardiac causes which contribute 13.46% of cases who received humidifi ed high-fl ow nasal oxygen. Among the respiratory system diseases, bronchopneumonia is the leading cause which makes 52.78%. Moreover, 28 children (53.85%) received humidifi ed high-fl ow nasal oxygen therapy for a total duration of 1-4 days. 40 (76.92%) children recovered completely and did not need any further intervention in the form of ventilation or referral to higher center. 9 (17.31) failed therapy and required intubation.
Conclusion: Use of HHHFNC for oxygen administration is feasible for infants with moderate-severe bronchiolitis in a general pediatric ward. HHHFNC therapy provided effi cient respiratory support and oxygen delivery in infants with respiratory distress in our Paediatric Intensive Care Unit, and its introduction coincided with a signifi cant reduction in the need for intubation of infants with viral bronchiolitis.
Key words: Children, Heated humidifi ed high-fl ow nasal cannula, Oxygen, Respiratory distress, Rural medical college hospital
Access this article online
www.ijss-sn.com
Month of Submission : 02-2016Month of Peer Review : 03-2016Month of Acceptance : 04-2016Month of Publishing : 04-2016
DOI: 10.17354/ijss/2016/232
Corresponding Author: Dr. Balasubramanian Marimuthu, Department of Paediatrics, Keerthi Hospitals, DSP Nagar, Bypass Road, Madurai - 625 016, Tamil Nadu, India. Phone: +91-9443860550. E-mail: [email protected]

Marimuthu, et al.: High-fl ow Nasal Oxygen Therapy in Children
276International Journal of Scientifi c Study | April 2016 | Vol 4 | Issue 1
tolerated by the patient; and potentially, continuous positive airway pressure can be delivered.1,4-6
There is currently no single, simple defi nition of high fl ow. In infants, it usually refers to the delivery of oxygen or an oxygen/room air blend at fl ow rates >2 L/min.7 Some authors adjust the fl ow rates on body weight and recommend using 2 L/kg/min, which provides a degree of distending pressure8-10 and reduces the work of breathing.11 In children, fl ow rates >6 L/min are generally considered high fl ow.12 High fl ow presents several advantages over conventional “low-flow” oxygen therapy in terms of humidifi cation, oxygenation, gas exchange, and breathing pattern.
It is proposed that HHHFNC therapy reduces work of breathing and improves effi ciency of ventilation through several mechanisms as follows:1• Washout of nasopharyngeal dead space leading to
improved alveolar ventilation• Reduction in the inspiratory resistance associated with
the nasopharynx• Improvement in conductance and pulmonary
compliance by supplying adequately warmed and humidifi ed gas
• Reduction in metabolic work associated with gas conditioning
• May provide positive distending pressure for lung recruitment.
Despite the advantages of this technique, the quality of the literature dealing with a pediatric population remains poor. The Cochrane Library deemed that no study was able to provide indications and guidelines for HHHFNC therapy in pediatric patients with a high level of evidence.8 Similar conclusions were expressed about the use of HHHFNC in the specific situation of infants with acute viral bronchiolitis.13 In 2014, recommendations are still based on extrapolations from observational or physiological studies but not on evidence. For clinical practice, HHHFNC seems feasible in most of the populations currently managed with noninvasive ventilation, and sometimes, it appears to be better tolerated.
The objective of this study was to analyze the profi le and outcome of children who were given high-fl ow humidifi ed oxygen therapy as the fi rst line therapy in a rural medical college hospital.
MATERIALS AND METHODS
Study CenterThis study was conducted in the Paediatric Intensive Care Unit (PICU) of a Rural Medical College Hospital, which
is equipped with a high-fl ow heated humidifi ed nasal cannula machine and 2 ventilators with 24 h monitoring by 1 Assistant Professor, 1 Senior Resident, 1 Junior Resident, and 2 Staff Nurses.
SamplingThis was a retrospective study conducted for 1-year from January 2014 to December 2014. The data were compiled from the information entered in the high-fl ow nasal cannula utility register and nominal registers. All the children who were given initiation of oxygen therapy with humidifi ed high-fl ow nasal cannula for moderate to severe respiratory distress were included in the study. The method of assessment of severity of respiratory distress was adapted from the World Health Organization management of acute respiratory tract infections in children (Table 1). The parameters analyzed were age and sex of the children who received HHHFNC therapy, etiology of respiratory distress, duration of oxygen therapy through high-fl ow nasal cannula, and outcome of the intervention. The results were analyzed by tabular columns.
RESULTS
A total of 52 children had received humidifi ed high-fl ow nasal oxygen therapy as the initial method of oxygen supplement for treating respiratory distress during the study period of 1-year. Out of them, 40 were infants that make 76.92% and 12% children were more than or equal to 1 year of age making 23.08% of the children received HHHFNC therapy (Table 2).
Among these 52 children, 31 were males and 21 were females contributing 59.62 and 40.38, respectively (Table 3).
On analyzing the etiology for the respiratory distress, we found 36, out of 52 cases, were respiratory system disorders. So, 69.23% of the cases received HHHFNC therapy because of respiratory system pathologies. 7 cases (13.46%) were having cardiac diseases. 6 babies with neurologic diseases and 3 cases of miscellaneous causes received HHHFNC oxygen therapy contributing to 11.54% and 5.77% of the total recipients (Table 4).
The leading respiratory system cause was bronchopneumonia. 22 children had bronchopneumonia that made 61.12% of the respiratory causes and 42.31% of the total cases with the need for HHHFNC therapy. Out of 22 children with bronchopneumonia, 1 had associated parapharyngeal abscess and 2 had associated stridor. The second common respiratory cause was bronchiolitis (n = 8) which contributed to 22.22% of the respiratory causes and 15.38% of total cases. Then, 2 children had empyema which was 5.56% of respiratory causes. Rest of the respiratory system disorders treated with
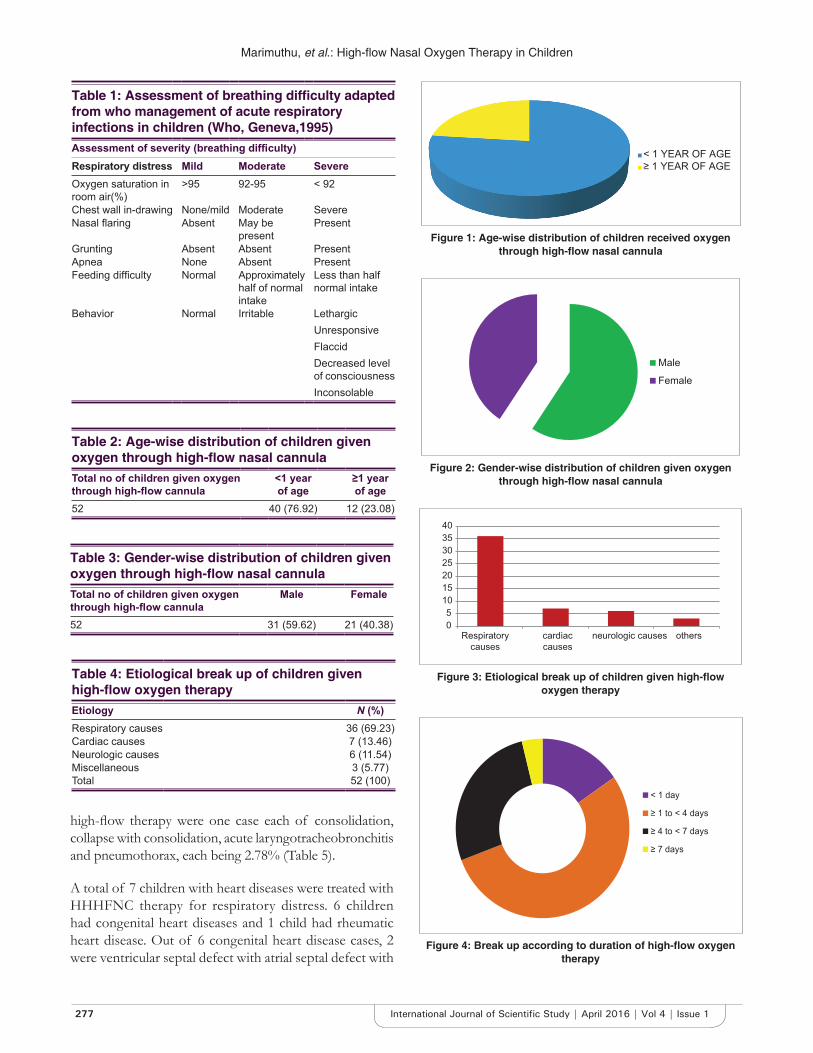
Marimuthu, et al.: High-fl ow Nasal Oxygen Therapy in Children
277 International Journal of Scientifi c Study | April 2016 | Vol 4 | Issue 1
Table 2: Age-wise distribution of children given oxygen through high-fl ow nasal cannulaTotal no of children given oxygen through high-fl ow cannula
<1 year of age
≥1 year of age
52 40 (76.92) 12 (23.08)
Table 4: Etiological break up of children given high-fl ow oxygen therapyEtiology N (%)Respiratory causes 36 (69.23)Cardiac causes 7 (13.46)Neurologic causes 6 (11.54)Miscellaneous 3 (5.77)Total 52 (100)
Table 3: Gender-wise distribution of children given oxygen through high-fl ow nasal cannulaTotal no of children given oxygen through high-fl ow cannula
Male Female
52 31 (59.62) 21 (40.38)
high-fl ow therapy were one case each of consolidation, collapse with consolidation, acute laryngotracheobronchitis and pneumothorax, each being 2.78% (Table 5).
A total of 7 children with heart diseases were treated with HHHFNC therapy for respiratory distress. 6 children had congenital heart diseases and 1 child had rheumatic heart disease. Out of 6 congenital heart disease cases, 2 were ventricular septal defect with atrial septal defect with
< 1 YEAR OF AGE≥ 1 YEAR OF AGE
Figure 1: Age-wise distribution of children received oxygen through high-fl ow nasal cannula
Male
Female
Figure 2: Gender-wise distribution of children given oxygen through high-fl ow nasal cannula
05
10152025303540
Respiratorycauses
cardiaccauses
neurologic causes others
Figure 3: Etiological break up of children given high-fl ow oxygen therapy
Table 1: Assessment of breathing diffi culty adapted from who management of acute respiratory infections in children (Who, Geneva,1995)Assessment of severity (breathing diffi culty)Respiratory distress Mild Moderate Severe Oxygen saturation in room air(%)
>95 92-95 < 92
Chest wall in-drawing None/mild Moderate Severe Nasal fl aring Absent May be
presentPresent
Grunting Absent Absent Present Apnea None Absent Present Feeding diffi culty Normal Approximately
half of normal intake
Less than half normal intake
Behavior Normal Irritable LethargicUnresponsiveFlaccidDecreased level of consciousnessInconsolable
< 1 day
≥ 1 to < 4 days
≥ 4 to < 7 days
≥ 7 days
Figure 4: Break up according to duration of high-fl ow oxygen therapy
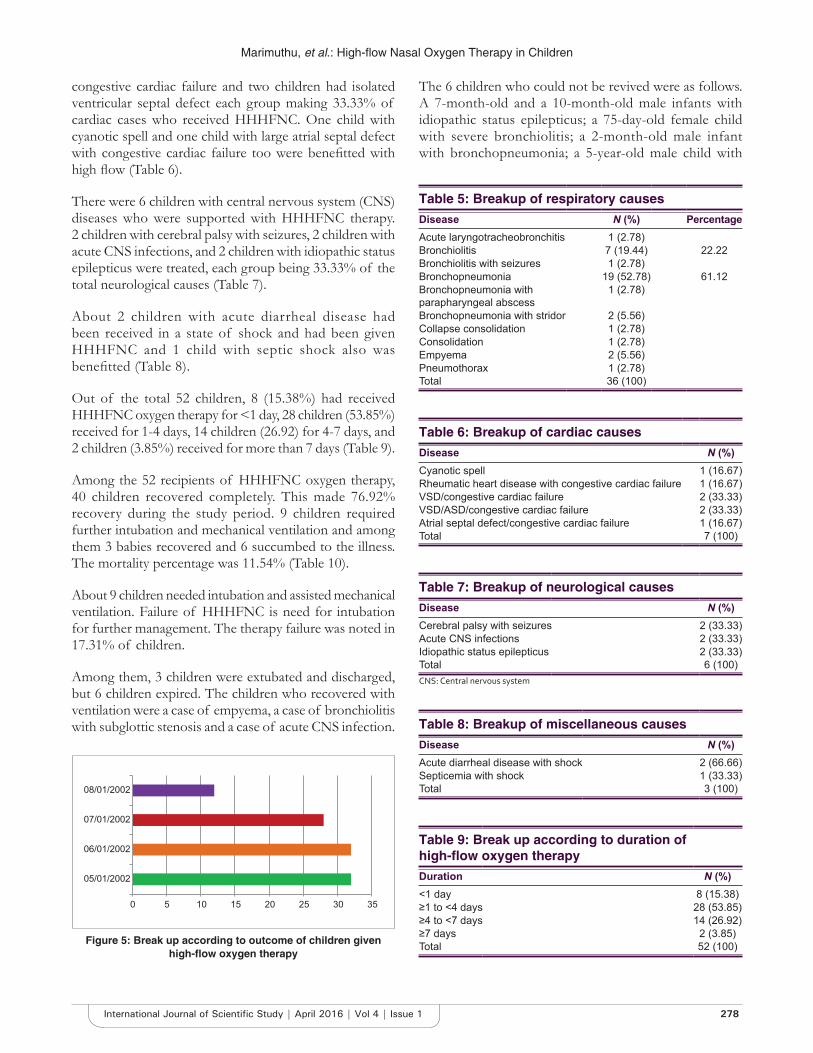
Marimuthu, et al.: High-fl ow Nasal Oxygen Therapy in Children
278International Journal of Scientifi c Study | April 2016 | Vol 4 | Issue 1
congestive cardiac failure and two children had isolated ventricular septal defect each group making 33.33% of cardiac cases who received HHHFNC. One child with cyanotic spell and one child with large atrial septal defect with congestive cardiac failure too were benefi tted with high fl ow (Table 6).
There were 6 children with central nervous system (CNS) diseases who were supported with HHHFNC therapy. 2 children with cerebral palsy with seizures, 2 children with acute CNS infections, and 2 children with idiopathic status epilepticus were treated, each group being 33.33% of the total neurological causes (Table 7).
About 2 children with acute diarrheal disease had been received in a state of shock and had been given HHHFNC and 1 child with septic shock also was benefi tted (Table 8).
Out of the total 52 children, 8 (15.38%) had received HHHFNC oxygen therapy for <1 day, 28 children (53.85%) received for 1-4 days, 14 children (26.92) for 4-7 days, and 2 children (3.85%) received for more than 7 days (Table 9).
Among the 52 recipients of HHHFNC oxygen therapy, 40 children recovered completely. This made 76.92% recovery during the study period. 9 children required further intubation and mechanical ventilation and among them 3 babies recovered and 6 succumbed to the illness. The mortality percentage was 11.54% (Table 10).
About 9 children needed intubation and assisted mechanical ventilation. Failure of HHHFNC is need for intubation for further management. The therapy failure was noted in 17.31% of children.
Among them, 3 children were extubated and discharged, but 6 children expired. The children who recovered with ventilation were a case of empyema, a case of bronchiolitis with subglottic stenosis and a case of acute CNS infection.
0 5 10 15 20 25 30 35
05/01/2002
06/01/2002
07/01/2002
08/01/2002
Figure 5: Break up according to outcome of children given high-fl ow oxygen therapy
Table 5: Breakup of respiratory causesDisease N (%) PercentageAcute laryngotracheobronchitis 1 (2.78)Bronchiolitis 7 (19.44) 22.22Bronchiolitis with seizures 1 (2.78)Bronchopneumonia 19 (52.78) 61.12Bronchopneumonia with parapharyngeal abscess
1 (2.78)
Bronchopneumonia with stridor 2 (5.56)Collapse consolidation 1 (2.78)Consolidation 1 (2.78)Empyema 2 (5.56)Pneumothorax 1 (2.78)Total 36 (100)
Table 6: Breakup of cardiac causesDisease N (%)Cyanotic spell 1 (16.67)Rheumatic heart disease with congestive cardiac failure 1 (16.67)VSD/congestive cardiac failure 2 (33.33)VSD/ASD/congestive cardiac failure 2 (33.33)Atrial septal defect/congestive cardiac failure 1 (16.67)Total 7 (100)
Table 7: Breakup of neurological causesDisease N (%)Cerebral palsy with seizures 2 (33.33)Acute CNS infections 2 (33.33)Idiopathic status epilepticus 2 (33.33)Total 6 (100)CNS: Central nervous system
Table 8: Breakup of miscellaneous causesDisease N (%)Acute diarrheal disease with shock 2 (66.66)Septicemia with shock 1 (33.33)Total 3 (100)
Table 9: Break up according to duration of high-fl ow oxygen therapyDuration N (%)<1 day 8 (15.38)≥1 to <4 days 28 (53.85)≥4 to <7 days 14 (26.92)≥7 days 2 (3.85)Total 52 (100)
The 6 children who could not be revived were as follows. A 7-month-old and a 10-month-old male infants with idiopathic status epilepticus; a 75-day-old female child with severe bronchiolitis; a 2-month-old male infant with bronchopneumonia; a 5-year-old male child with

Marimuthu, et al.: High-fl ow Nasal Oxygen Therapy in Children
279 International Journal of Scientifi c Study | April 2016 | Vol 4 | Issue 1
consolidation who was a known case of Type I diabetes mellitus; and a 7-year-old female child with acute rheumatic carditis with congestive cardiac failure.
Out of the 3 children who were referred to the higher center for further expert management, 2 had septicemia with shock, and one child had empyema. They all survived (Figures 1-5).
DISCUSSION
In our study, the most common final diagnosis was bronchopneumonia (n = 22, 42.31) and the second common being bronchiolitis (n = 8, 15.38%).
Kelly et al. reported a similar case study, which included 498 cases. The most common final diagnosis was acute bronchiolitis (n = 231, 46%), followed by pneumonia (n = 138, 28%) and asthma (n = 38, 8%).14
Two observational studies have shown improvement in physiological parameters in children receiving HHHFNC therapy. Respiratory distress scores signifi cantly improved as HHHFNC therapy flow rates increased in infants with bronchiolitis and older children requiring oxygen therapy.6,8 In another cohort of pediatric patients (median age 6.5 months) receiving HHHFNC therapy on a PICU, measured work of breathing signifi cantly decreased as HHHFNC therapy increased from 2 to 8 L/min.15
In the study by Schibler et al., out of the 298 cases, the most common diagnosis was bronchiolitis (n = 167). 11 cases were cardiac cases, and 7 were neurometabolic cases. All were given HHHFNC therapy as the initial mode of oxygen support.3
In our study, the failure rate was 17.31% (n = 9). Out of 52 children, 9 needed escalation to invasive ventilation.
In the study by Kelly et al., of the 498 patients, 42 (8%) of patients failed therapy and required intubation following HFNC trial.14
Schibler et al. reported that, overall, 56 (19%) infants receiving HHHFNC therapy needed escalation to other noninvasive and 36 (12%) to invasive ventilation.3
In our study, the common cause for escalation to invasive ventilation was respiratory system disorder (n = 5), followed by neurological cause (n = 3) 55.56% and 50%, respectively. 2 out of 8 cases of bronchiolitis required ventilator support. Therefore, 25% of bronchiolitis cases required ventilatory support in our study.
Kelly et al. conclude that a fi nal diagnosis of bronchiolitis was observed to be protective with respect to intubation (odds ratio, 0.40; 95% confi dence interval, 0.17–0.96).14
In the study by Schibler et al., of the infants with a primary diagnosis of viral bronchiolitis, only 6 (4%) required escalation to invasive ventilation. There was a signifi cantly greater incidence of invasive ventilation in the cardiac (n = 12, 50%) and other (n = 7, 41%) groups compared with the bronchiolitis (n = 6, 4%) and lung disease without peripheral airway obstruction (n = 8, 12%) groups (P = 0.05). Most of the cardiac infants needed intubation for a cardiac surgical procedure or cardiac failure.3
Bressan et al. reported that out of 27 infants with bronchiolitis who were included in the study no escalation to other forms of respiratory support was recorded.16
CONCLUSION
Use of HHHFNC for oxygen administration is feasible for infants with moderate-severe bronchiolitis in a general pediatric ward. HHHFNC therapy provided efficient respiratory support and oxygen delivery in infants with respiratory distress in our PICU, and its introduction coincided with a signifi cant reduction in the need for intubation of infants with viral bronchiolitis. Further, research is required to establish safety and effi cacy of HHHFNC defi nitivel y.
REFERENCES
1. Dysart K, Miller TL, Wolfson MR, Shaffer TH. Research in high fl ow therapy: Mechanisms of action. Respir Med 2009;103:1400-5.
2. McKiernan C, Chua LC, Visintainer PF, Allen H. High fl ow nasal cannulae therapy in infants with bronchiolitis. J Pediatr 2010;156:634-8.
3. Schibler A, Pham TM, Dunster KR, Foster K, Barlow A, Gibbons K, et al. Reduced intubation rates for infants after introduction of high-fl ow nasal prong oxygen delivery. Intensive Care Med 2011;37:847-52.
4. Spence KL, Murphy D, Kilian C, McGonigle R, Kilani RA. High-fl ow nasal cannula as a device to provide continuous positive airway pressure in infants. J Perinatol 2007;27:772-5.
5. Wilkinson DJ, Andersen CC, Smith K, Holberton J. Pharyngeal pressure with high-fl ow nasal cannulae in premature infants. J Perinatol 2008;28:42-7.
6. Spentzas T, Minarik M, Patters AB, Vinson B, Stidham G. Children with respiratory distress treated with high-fl ow nasal cannula. J Intensive Care Med 2009;24:323-8.
7. Mayfi eld S, Jauncey-Cooke J, Hough JL, Schibler A, Gibbons K,
Table 10: Break up according to outcome of children given high-fl ow oxygen therapyOutcome N (%) PercentageRecovered 40 (76.92)Ventilated and recovered 3 (5.77) 17.31Ventilated and expired 6 (11.54)Referred to higher center 3 (5.77)Total 52 (100)
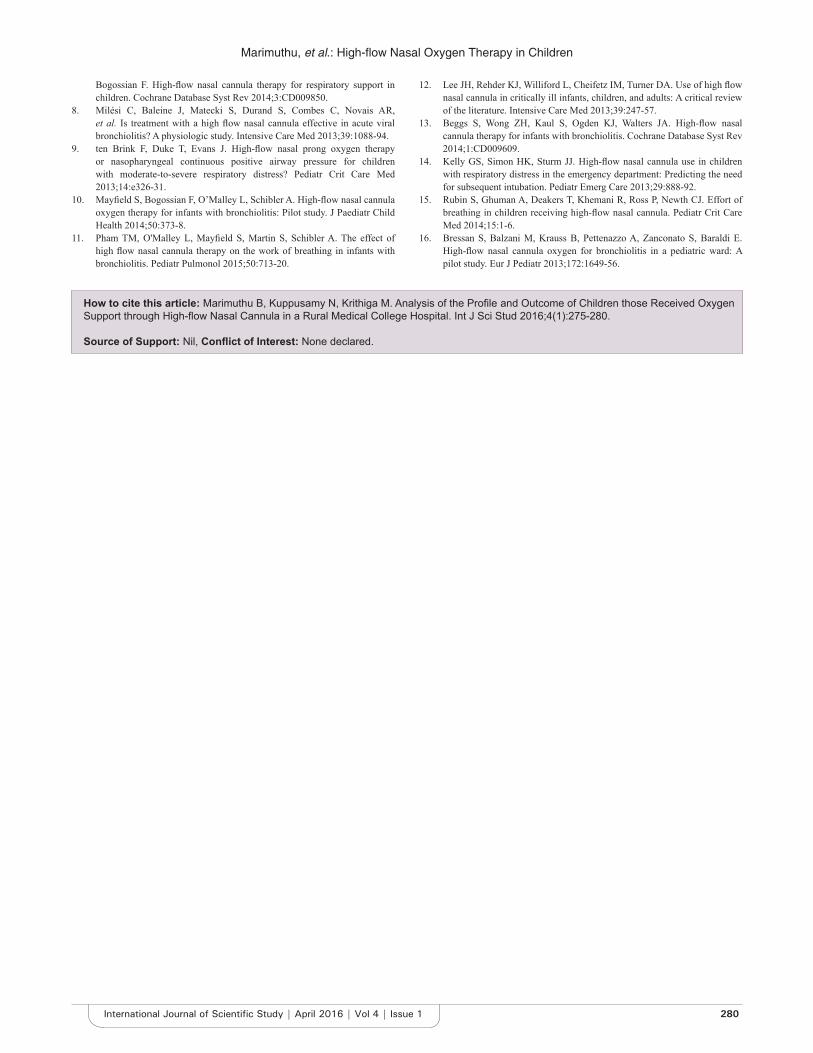
Marimuthu, et al.: High-fl ow Nasal Oxygen Therapy in Children
280International Journal of Scientifi c Study | April 2016 | Vol 4 | Issue 1
Bogossian F. High-fl ow nasal cannula therapy for respiratory support in children. Cochrane Database Syst Rev 2014;3:CD009850.
8. Milési C, Baleine J, Matecki S, Durand S, Combes C, Novais AR, et al. Is treatment with a high fl ow nasal cannula effective in acute viral bronchiolitis? A physiologic study. Intensive Care Med 2013;39:1088-94.
9. ten Brink F, Duke T, Evans J. High-fl ow nasal prong oxygen therapy or nasopharyngeal continuous positive airway pressure for children with moderate-to-severe respiratory distress? Pediatr Crit Care Med 2013;14:e326-31.
10. Mayfi eld S, Bogossian F, O’Malley L, Schibler A. High-fl ow nasal cannula oxygen therapy for infants with bronchiolitis: Pilot study. J Paediatr Child Health 2014;50:373-8.
11. Pham TM, O'Malley L, Mayfi eld S, Martin S, Schibler A. The effect of high fl ow nasal cannula therapy on the work of breathing in infants with bronchiolitis. Pediatr Pulmonol 2015;50:713-20.
12. Lee JH, Rehder KJ, Williford L, Cheifetz IM, Turner DA. Use of high fl ow nasal cannula in critically ill infants, children, and adults: A critical review of the literature. Intensive Care Med 2013;39:247-57.
13. Beggs S, Wong ZH, Kaul S, Ogden KJ, Walters JA. High-fl ow nasal cannula therapy for infants with bronchiolitis. Cochrane Database Syst Rev 2014;1:CD009609.
14. Kelly GS, Simon HK, Sturm JJ. High-fl ow nasal cannula use in children with respiratory distress in the emergency department: Predicting the need for subsequent intubation. Pediatr Emerg Care 2013;29:888-92.
15. Rubin S, Ghuman A, Deakers T, Khemani R, Ross P, Newth CJ. Effort of breathing in children receiving high-fl ow nasal cannula. Pediatr Crit Care Med 2014;15:1-6.
16. Bressan S, Balzani M, Krauss B, Pettenazzo A, Zanconato S, Baraldi E. High-fl ow nasal cannula oxygen for bronchiolitis in a pediatric ward: A pilot study. Eur J Pediatr 2013;172:1649-56.
How to cite this article: Marimuthu B, Kuppusamy N, Krithiga M. Analysis of the Profi le and Outcome of Children those Received Oxygen Support through High-fl ow Nasal Cannula in a Rural Medical College Hospital. Int J Sci Stud 2016;4(1):275-280.
Source of Support: Nil, Confl ict of Interest: None declared.

281 International Journal of Scientifi c Study | April 2016 | Vol 4 | Issue 1
Serum Zinc Level in Children Admitted with Pneumonia at Tertiary Care Children’s HospitalReghupathy Panneerselam1, Balasubranian Marimuthu2
1Assistant Professor, Department of Paediatrics, Government Theni Medical College, Theni, Tamil Nadu, India, 2 Associate Professor, Department of Paediatrics, Government Theni Medical College, Theni, Tamil Nadu, India
Zinc also prevents the recruitment of white blood cells and release of cytokines from them and effectiveness of zinc said to increase with increase in the severity of pneumonia.9
Studies suggest that there is greater risk of diarrhea, pneumonia, and growth failure in zinc-deficient population.10-12 The effectiveness of zinc supplementation in early recovery and reduction of severity of pneumonia has been shown by a number of studies. Effectiveness of zinc supplementation in early recovery and reduction of severity of pneumonia has been shown by number of studies.13,14
Although zinc supplementation is specifi cally recommended for developing countries,3 there is no study available demonstrating the serum zinc level in children with pneumonia in South India. There is a need to demonstrate the zinc level in children with pneumonia for further recommendations. This study is designed to compare the serum zinc level in children admitted with pneumonia to the matched controls.
INTRODUCTION
Zinc is a n essential micronutrient in humans. In human being, zinc is 2nd only to iron in quantity.1-3 There are more than 70 zinc-containing enzymes in human being. Zinc is critical for functioning of biomembranes. Zinc protects from the oxidative damage by competing for binding sites with redox metals. Zinc has both acute and chronic antioxidant action.4-7 Zinc is needed for thymulin, and it is possible zinc is involved in the genesis of hematopoietic stem cells in the thymus microenvironment. Zinc deficiency increasing the infl ammatory pathology in the respiratory tract with increasing damage to the cells is a proposed mechanism.8
Original Research
Abstract
Introduction: Zinc is an essential micronutrient in humans. Worldwide, pneumonia accounts for 18% of under-fi ve mortality and it is the leading infectious cause of childhood mortality. There is greater risk of diarrhea, pneumonia, and growth failure in zinc-defi cient population.
Purpose: The purpose of this study is to compare serum zinc level in children with severe pneumonia with age, sex, and nutritional matched controls.
Materials and Methods: Serum zinc level in 50 children admitted with severe pneumonia was compared with the matched controls.
Results: The mean serum zinc level in children with pneumonia (60.98) is signifi cantly lower than that of controls (73.124) with (P = 0.001).
Conclusion: Serum zinc levels are signifi cantly low in children with severe pneumonia compared with age, sex, and nutritionally matched controls.
Key words: Children, Micronutrient, Pneumonia, Under-fi ve, Zinc
Access this article online
www.ijss-sn.com
Month of Submission : 02-2016Month of Peer Review : 03-2016Month of Acceptance : 04-2016Month of Publishing : 04-2016
Corresponding Author: Dr. Reghupathy Panneerselam, Plot No. 14, New Sriram Nagar, Theni - 625 531, Tamil Nadu, India. Phone: +91-9750691938. E-mail: [email protected]
DOI: 10.17354/ijss/2016/233

Panneerselam and Marimuthu: Serum Zinc Level in Children Admitted with Pneumonia
282International Journal of Scientifi c Study | April 2016 | Vol 4 | Issue 1
MATERIALS AND METHODS
This study was done at a tertiary care children’s hospital in South India. The study population included children admitted with severe pneumonia according to the World Health Organization (WHO) classifi cation clinically and showing radiological evidence of pneumonia. The age group included was between 3 months and 5 years. Any child on zinc supplementation, children with aspiration pneumonia, chemical pneumonia, persistent pneumonia, severe acute malnutrition, and coexisting illness were excluded.
All children admitted with pneumonia are examined and recruited as per inclusion and exclusion criteria. 50 such children were recruited to the study after obtaining informed consent from the parents. Weight for length/weight for height was calculated. According to the WHO chart, the nutritional status classifi ed. Children having Z-score between −3 and −2 were classifi ed as moderate acute malnutrition and having Z-score more than −2 were classifi ed as normal nutrition.
Controls with similar age (adjusted for 2 months), sex, and nutritional status were recruited equal number for cases.
For both cases and control group, 2 ml of blood drawn. Serum separated after centrifuging the clotted sample. In the separated serum, zinc level is obtained using photometry. The mean serum zinc between two groups is compared using independent t-test.
RESULTS
The study population consists of 100 children with 50 cases and 50 controls. The age distribution was as per Table 1. Of the 50 children recruited with pneumonia, there are 36 male children and 24 female children. Nutritional status in the total study group is given in Table 2. Mean serum zinc level in children with pneumonia is compared with that of the control group. There is a signifi cant difference between children with pneumonia and controls in serum zinc levels. Mean serum zinc level in children with pneumonia is 60.982 mg/dl. The mean serum zinc level in age, sex, and nutrition matched controls is 73.124 mg/dl. Mean serum zinc level is signifi cantly lower in children with pneumonia than their matched controls (P = 0.001) Table 3.
DISCUSSION
There is no signifi cant difference between the mean serum zinc levels between the different age groups of children admitted with pneumonia (P = 0.826). Studies done in
serum zinc level in pneumonia, diarrhea showed similar results that age is not a confounding factor in serum zinc in pneumonia.15,16 Comparison of mean serum zinc level between male and female children recruited in this study does not show any signifi cant difference like other published data.15-17 Analysis within pneumonia group also shows that the mean serum zinc level in children with moderate acute malnutrition is significantly low than children with normal nutrition (P = 0.02). Low mean serum zinc level in children in moderate acute malnutrition may be due to poor intake leading to zinc defi ciency associated with other micronutrient defi ciency. Similar fi nding was found in study done by Kumar et al.15
Mean serum zinc level is signifi cantly lower in children with severe pneumonia than the matched controls (P = 0.001). This is similar to the fi nding of the Kumar et al.,15 Arıca et al.,16 and Pushpa and Memon.17 Main proposed cause for having low mean serum zinc level is already existing zinc defi ciency which increases the susceptibility of the child to get pneumonia by impairing child’s immunity.18 Other explanation for low serum zinc level is a shift of zinc from plasma to liver.
Defi ciency of zinc, due to inadequate intake of food-containing zinc or decreased absorption, is more commonly seen in developing countries.19 It is one of the 10 important factors leading to increased illness in children in developing countries.20
Supplementation of zinc in children decreasing the morbidity and fatality in infections was shown by trials.9,13
Table 1: Age distributionAge Case Control Total frequency≤12 months 18 18 3613-24 months 20 20 4025-60 months 12 12 24Total 50 50 100
Table 3: Zinc level in cases and controlType N Mean zinc level* Standard deviation P valueCase 50 60.982 18.8926 0.001Control 50 73.124 17.1420*Mean serum zinc level expressed in mg/dl
Table 2: Nutritional statusStatus Case Control Frequency Percent Valid
percentCumulative
percentNormal 34 34 68 68.0 68.0 68.0MAM* 16 16 32 32.0 32.0 100.0Total 50 50 100 100.0 100.0*MAM: Moderate acute malnutrition
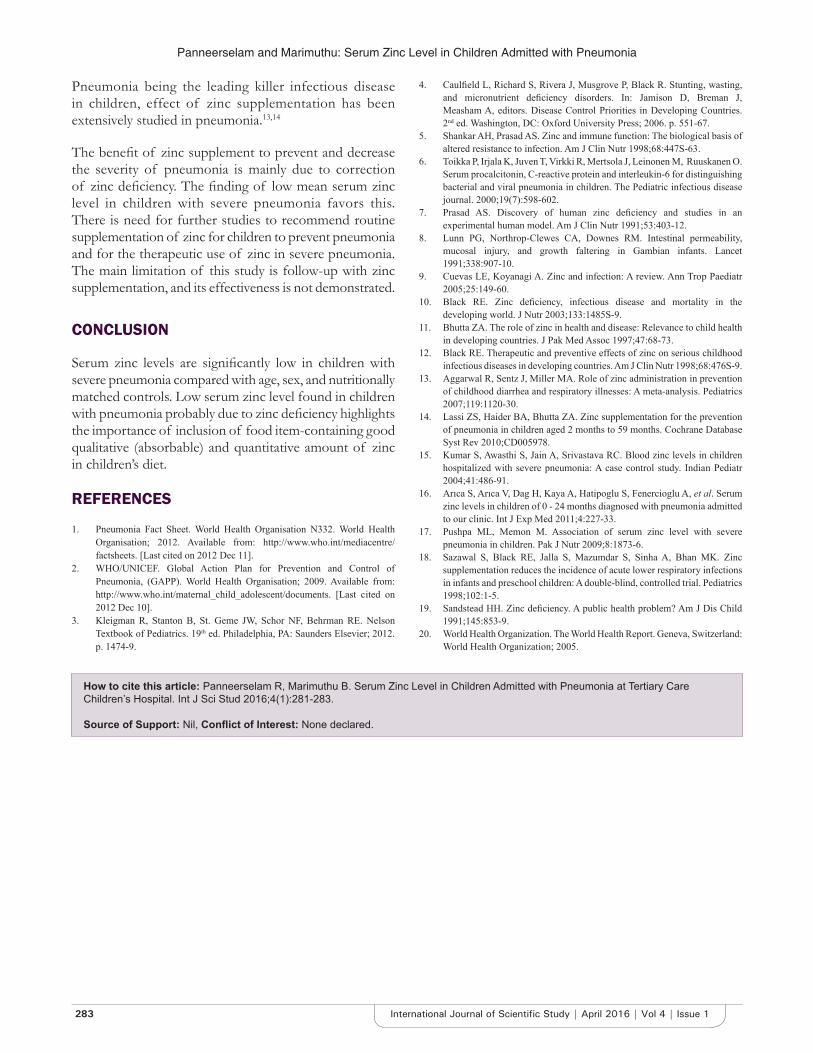
Panneerselam and Marimuthu: Serum Zinc Level in Children Admitted with Pneumonia
283 International Journal of Scientifi c Study | April 2016 | Vol 4 | Issue 1
Pneumonia being the leading killer infectious disease in children, effect of zinc supplementation has been extensively studied in pneumonia.13,14
The benefi t of zinc supplement to prevent and decrease the severity of pneumonia is mainly due to correction of zinc defi ciency. The fi nding of low mean serum zinc level in children with severe pneumonia favors this. There is need for further studies to recommend routine supplementation of zinc for children to prevent pneumonia and for the therapeutic use of zinc in severe pneumonia. The main limitation of this study is follow-up with zinc supplementation, and its effectiveness is not demonstrated.
CONCLUSION
Serum zinc levels are signifi cantly low in children with severe pneumonia compared with age, sex, and nutritionally matched controls. Low serum zinc level found in children with pneumonia probably due to zinc defi ciency highlights the importance of inclusion of food item-containing good qualitative (absorbable) and quantitative amount of zinc in children’s diet.
REFERENCES
1. Pneumonia Fact Sheet. World Health Organisation N332. World Health Organisation; 2012. Available from: http://www.who.int/mediacentre/factsheets. [Last cited on 2012 Dec 11].
2. WHO/UNICEF. Global Action Plan for Prevention and Control of Pneumonia, (GAPP). World Health Organisation; 2009. Available from: http://www.who.int/maternal_child_adolescent/documents. [Last cited on 2012 Dec 10].
3. Kleigman R, Stanton B, St. Geme JW, Schor NF, Behrman RE. Nelson Textbook of Pediatrics. 19th ed. Philadelphia, PA: Saunders Elsevier; 2012. p. 1474-9.
4. Caulfi eld L, Richard S, Rivera J, Musgrove P, Black R. Stunting, wasting, and micronutrient defi ciency disorders. In: Jamison D, Breman J, Measham A, editors. Disease Control Priorities in Developing Countries. 2nd ed. Washington, DC: Oxford University Press; 2006. p. 551-67.
5. Shankar AH, Prasad AS. Zinc and immune function: The biological basis of altered resistance to infection. Am J Clin Nutr 1998;68:447S-63.
6. Toikka P, Irjala K, Juven T, Virkki R, Mertsola J, Leinonen M, Ruuskanen O. Serum procalcitonin, C-reactive protein and interleukin-6 for distinguishing bacterial and viral pneumonia in children. The Pediatric infectious disease journal. 2000;19(7):598-602.
7. Prasad AS. Discovery of human zinc defi ciency and studies in an experimental human model. Am J Clin Nutr 1991;53:403-12.
8. Lunn PG, Northrop-Clewes CA, Downes RM. Intestinal permeability, mucosal injury, and growth faltering in Gambian infants. Lancet 1991;338:907-10.
9. Cuevas LE, Koyanagi A. Zinc and infection: A review. Ann Trop Paediatr 2005;25:149-60.
10. Black RE. Zinc defi ciency, infectious disease and mortality in the developing world. J Nutr 2003;133:1485S-9.
11. Bhutta ZA. The role of zinc in health and disease: Relevance to child health in developing countries. J Pak Med Assoc 1997;47:68-73.
12. Black RE. Therapeutic and preventive effects of zinc on serious childhood infectious diseases in developing countries. Am J Clin Nutr 1998;68:476S-9.
13. Aggarwal R, Sentz J, Miller MA. Role of zinc administration in prevention of childhood diarrhea and respiratory illnesses: A meta-analysis. Pediatrics 2007;119:1120-30.
14. Lassi ZS, Haider BA, Bhutta ZA. Zinc supplementation for the prevention of pneumonia in children aged 2 months to 59 months. Cochrane Database Syst Rev 2010;CD005978.
15. Kumar S, Awasthi S, Jain A, Srivastava RC. Blood zinc levels in children hospitalized with severe pneumonia: A case control study. Indian Pediatr 2004;41:486-91.
16. Arıca S, Arıca V, Dag H, Kaya A, Hatipoglu S, Fenercioglu A, et al. Serum zinc levels in children of 0 - 24 months diagnosed with pneumonia admitted to our clinic. Int J Exp Med 2011;4:227-33.
17. Pushpa ML, Memon M. Association of serum zinc level with severe pneumonia in children. Pak J Nutr 2009;8:1873-6.
18. Sazawal S, Black RE, Jalla S, Mazumdar S, Sinha A, Bhan MK. Zinc supplementation reduces the incidence of acute lower respiratory infections in infants and preschool children: A double-blind, controlled trial. Pediatrics 1998;102:1-5.
19. Sandstead HH. Zinc defi ciency. A public health problem? Am J Dis Child 1991;145:853-9.
20. World Health Organization. The World Health Report. Geneva, Switzerland: World Health Organization; 2005.
How to cite this article: Panneerselam R, Marimuthu B. Serum Zinc Level in Children Admitted with Pneumonia at Tertiary Care Children’s Hospital. Int J Sci Stud 2016;4(1):281-283.
Source of Support: Nil, Confl ict of Interest: None declared.

284International Journal of Scientifi c Study | April 2016 | Vol 4 | Issue 1
Magnitude of Preterm Admissions in Neonatal Intensive Care Unit of Rural Medical College HospitalNandini Kuppusamy1, M Balasubramanian2, M Krithiga3
1Professor, Department of Paediatrics, Government Theni Medical College Hospital, Kanavilakku, Theni, Tamil Nadu, India, 2Associate Professor, Department of Paediatrics, Government Theni Medical College Hospital, Kanavilakku, Theni, Tamil Nadu, India, 3Senior Resident, Department of Paediatrics, Government Theni Medical College Hospital, Kanavilakku, Theni, Tamil Nadu, India
Common causes of preterm birth include multiple pregnancies, infections, and chronic conditions such as diabetes and high blood pressure; however, often no cause is identifi ed. There could also be a genetic infl uence. A better understanding of the causes and mechanisms will advance the development of solutions to prevent preterm birth.
Recent global estimates suggest that more than 1 in 10 or estimated 15 million babies born in 2010 were preterm, of which more than 1 million died as a result of preterm birth and related complications.1 Although neonatal mortality rates (NMRs) have fallen globally between 1990 and 2009,2 the absolute numbers and rates of preterm birth have increased during this period.3 More than 1 million infants die every year because they are born preterm, according to the report. Those who survive have an increased risk of morbidities such as cerebral palsy, blindness, and hearing loss.
INTRODUCTION
Preterm birth has been defi ned by the World Health Organization (WHO) as any live birth before 37 completed weeks of gestation or fewer than 259 days since the 1st day of a woman’s last menstrual period.
Preterm birth occurs for a variety of reasons. Most preterm births happen spontaneously, but some are due to early induction of labor or cesarean birth, whether for medical or non-medical reasons.
Original Research
Abstract
Introduction: Of late, the incidence of preterm births is increasing worldwide, and Asia and Africa are the major contributors of global preterm burden. Preterm babies have increased the risk of morbidity and mortality which is inversely related to both gestational age and birth weight. In spite of the advancements in therapeutics and improvements in the infrastructure and manpower, if preterm births are increasing, goal of reducing infant mortality rate (IMR) will be more diffi cult.
Objectives: To determine the magnitude of preterm admissions in a special care baby unit of a rural medical college hospital.
Materials and Methods: All preterm admissions admitted from January 2015 to December 2015 were retrospectively studied.
Results: Preterm babies contribute 31.06% of the total admissions, 10.18% of the total admissions were preterm babies <34 weeks of gestational age, and 20.88% of total admissions were preterm babies of gestational age between 34 and 37 weeks.
Conclusions: Preterm babies contribute a signifi cant percentage of the total newborn admissions in a tertiary care center of a rural medical college hospital. Without improving the preterm care reduction of neonatal mortality rate and thereby IMR will be a dream unaccomplished.
Key words: Admissions, Magnitude, Preterm, Rural medical college hospital
Access this article online
www.ijss-sn.com
Month of Submission : 02-2016Month of Peer Review : 03-2016Month of Acceptance : 04-2016Month of Publishing : 04-2016
Corresponding Author: Dr. Nandini Kuppusamy, Department of Paediatrics, D/O Dr. P. Kuppusamy, 12 C, Sahaya Madha Street, Gnanaolipuram, AA Road, Madurai - 625 016, Tamil Nadu, India. Phone: +91-9865718504. E-mail: [email protected]
DOI: 10.17354/ijss/2016/234
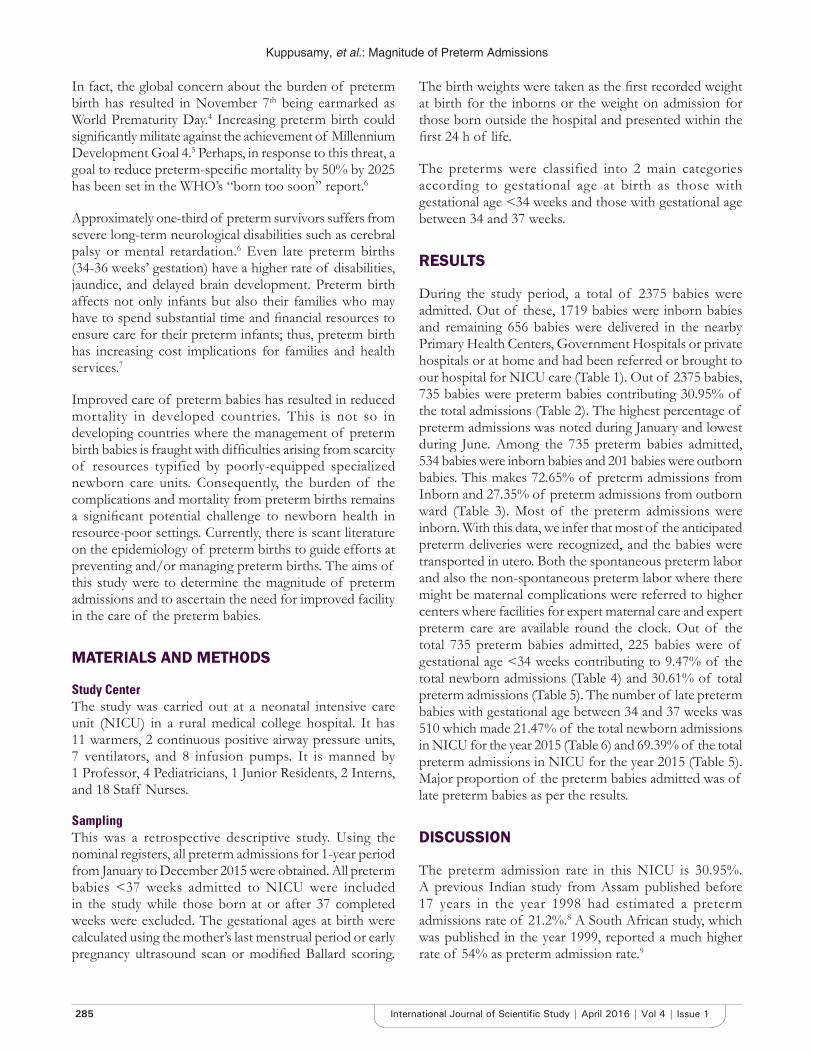
Kuppusamy, et al.: Magnitude of Preterm Admissions
285 International Journal of Scientifi c Study | April 2016 | Vol 4 | Issue 1
In fact, the global concern about the burden of preterm birth has resulted in November 7th being earmarked as World Prematurity Day.4 Increasing preterm birth could signifi cantly militate against the achievement of Millennium Development Goal 4.5 Perhaps, in response to this threat, a goal to reduce preterm-specifi c mortality by 50% by 2025 has been set in the WHO’s “born too soon” report.6
Approximately one-third of preterm survivors suffers from severe long-term neurological disabilities such as cerebral palsy or mental retardation.6 Even late preterm births (34-36 weeks’ gestation) have a higher rate of disabilities, jaundice, and delayed brain development. Preterm birth affects not only infants but also their families who may have to spend substantial time and fi nancial resources to ensure care for their preterm infants; thus, preterm birth has increasing cost implications for families and health services.7
Improved care of preterm babies has resulted in reduced mortality in developed countries. This is not so in developing countries where the management of preterm birth babies is fraught with diffi culties arising from scarcity of resources typified by poorly-equipped specialized newborn care units. Consequently, the burden of the complications and mortality from preterm births remains a signifi cant potential challenge to newborn health in resource-poor settings. Currently, there is scant literature on the epidemiology of preterm births to guide efforts at preventing and/or managing preterm births. The aims of this study were to determine the magnitude of preterm admissions and to ascertain the need for improved facility in the care of the preterm babies.
MATERIALS AND METHODS
Study CenterThe study was carried out at a neonatal intensive care unit (NICU) in a rural medical college hospital. It has 11 warmers, 2 continuous positive airway pressure units, 7 ventilators, and 8 infusion pumps. It is manned by 1 Professor, 4 Pediatricians, 1 Junior Residents, 2 Interns, and 18 Staff Nurses.
SamplingThis was a retrospective descriptive study. Using the nominal registers, all preterm admissions for 1-year period from January to December 2015 were obtained. All preterm babies <37 weeks admitted to NICU were included in the study while those born at or after 37 completed weeks were excluded. The gestational ages at birth were calculated using the mother’s last menstrual period or early pregnancy ultrasound scan or modifi ed Ballard scoring.
The birth weights were taken as the fi rst recorded weight at birth for the inborns or the weight on admission for those born outside the hospital and presented within the fi rst 24 h of life.
The preterms were classified into 2 main categories according to gestational age at birth as those with gestational age <34 weeks and those with gestational age between 34 and 37 weeks.
RESULTS
During the study period, a total of 2375 babies were admitted. Out of these, 1719 babies were inborn babies and remaining 656 babies were delivered in the nearby Primary Health Centers, Government Hospitals or private hospitals or at home and had been referred or brought to our hospital for NICU care (Table 1). Out of 2375 babies, 735 babies were preterm babies contributing 30.95% of the total admissions (Table 2). The highest percentage of preterm admissions was noted during January and lowest during June. Among the 735 preterm babies admitted, 534 babies were inborn babies and 201 babies were outborn babies. This makes 72.65% of preterm admissions from Inborn and 27.35% of preterm admissions from outborn ward (Table 3). Most of the preterm admissions were inborn. With this data, we infer that most of the anticipated preterm deliveries were recognized, and the babies were transported in utero. Both the spontaneous preterm labor and also the non-spontaneous preterm labor where there might be maternal complications were referred to higher centers where facilities for expert maternal care and expert preterm care are available round the clock. Out of the total 735 preterm babies admitted, 225 babies were of gestational age <34 weeks contributing to 9.47% of the total newborn admissions (Table 4) and 30.61% of total preterm admissions (Table 5). The number of late preterm babies with gestational age between 34 and 37 weeks was 510 which made 21.47% of the total newborn admissions in NICU for the year 2015 (Table 6) and 69.39% of the total preterm admissions in NICU for the year 2015 (Table 5). Major proportion of the preterm babies admitted was of late preterm babies as per the results.
DISCUSSION
The preterm admission rate in this NICU is 30.95%. A previous Indian study from Assam published before 17 years in the year 1998 had estimated a preterm admissions rate of 21.2%.8 A South African study, which was published in the year 1999, reported a much higher rate of 54% as preterm admission rate.9
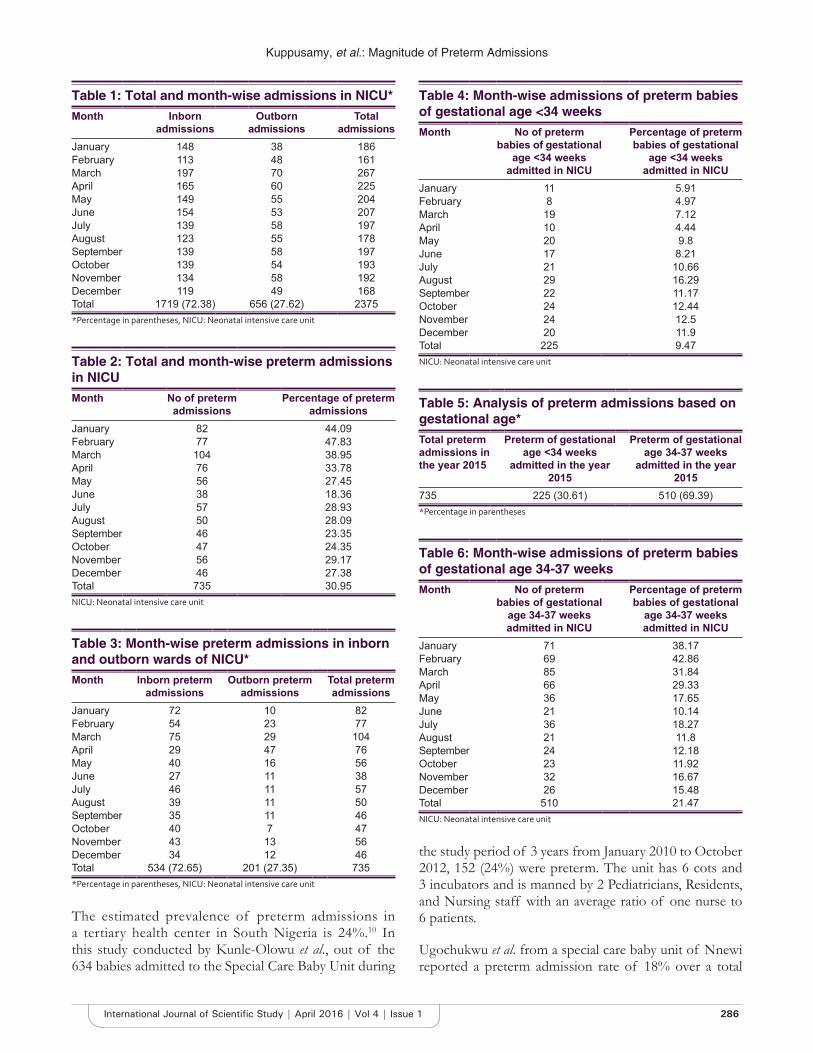
Kuppusamy, et al.: Magnitude of Preterm Admissions
286International Journal of Scientifi c Study | April 2016 | Vol 4 | Issue 1
Table 1: Total and month-wise admissions in NICU*Month Inborn
admissionsOutborn
admissionsTotal
admissionsJanuary 148 38 186February 113 48 161March 197 70 267April 165 60 225May 149 55 204June 154 53 207July 139 58 197August 123 55 178September 139 58 197October 139 54 193November 134 58 192December 119 49 168Total 1719 (72.38) 656 (27.62) 2375*Percentage in parentheses, NICU: Neonatal intensive care unit
Table 2: Total and month-wise preterm admissions in NICUMonth No of preterm
admissionsPercentage of preterm
admissionsJanuary 82 44.09February 77 47.83March 104 38.95April 76 33.78May 56 27.45June 38 18.36July 57 28.93August 50 28.09September 46 23.35October 47 24.35November 56 29.17December 46 27.38Total 735 30.95NICU: Neonatal intensive care unit
Table 3: Month-wise preterm admissions in inborn and outborn wards of NICU*Month Inborn preterm
admissionsOutborn preterm
admissionsTotal preterm admissions
January 72 10 82February 54 23 77March 75 29 104April 29 47 76May 40 16 56June 27 11 38July 46 11 57August 39 11 50September 35 11 46October 40 7 47November 43 13 56December 34 12 46Total 534 (72.65) 201 (27.35) 735*Percentage in parentheses, NICU: Neonatal intensive care unit
The estimated prevalence of preterm admissions in a tertiary health center in South Nigeria is 24%.10 In this study conducted by Kunle-Olowu et al., out of the 634 babies admitted to the Special Care Baby Unit during
Table 4: Month-wise admissions of preterm babies of gestational age <34 weeksMonth No of preterm
babies of gestational age <34 weeks
admitted in NICU
Percentage of preterm babies of gestational
age <34 weeks admitted in NICU
January 11 5.91February 8 4.97March 19 7.12April 10 4.44May 20 9.8June 17 8.21July 21 10.66August 29 16.29September 22 11.17October 24 12.44November 24 12.5December 20 11.9Total 225 9.47NICU: Neonatal intensive care unit
Table 5: Analysis of preterm admissions based on gestational age*Total preterm admissions in the year 2015
Preterm of gestational age <34 weeks
admitted in the year 2015
Preterm of gestational age 34-37 weeks
admitted in the year 2015
735 225 (30.61) 510 (69.39)*Percentage in parentheses
Table 6: Month-wise admissions of preterm babies of gestational age 34-37 weeksMonth No of preterm
babies of gestational age 34-37 weeks admitted in NICU
Percentage of preterm babies of gestational
age 34-37 weeks admitted in NICU
January 71 38.17February 69 42.86March 85 31.84April 66 29.33May 36 17.65June 21 10.14July 36 18.27August 21 11.8September 24 12.18October 23 11.92November 32 16.67December 26 15.48Total 510 21.47NICU: Neonatal intensive care unit
the study period of 3 years from January 2010 to October 2012, 152 (24%) were preterm. The unit has 6 cots and 3 incubators and is manned by 2 Pediatricians, Residents, and Nursing staff with an average ratio of one nurse to 6 patients.
Ugochukwu et al. from a special care baby unit of Nnewi reported a preterm admission rate of 18% over a total
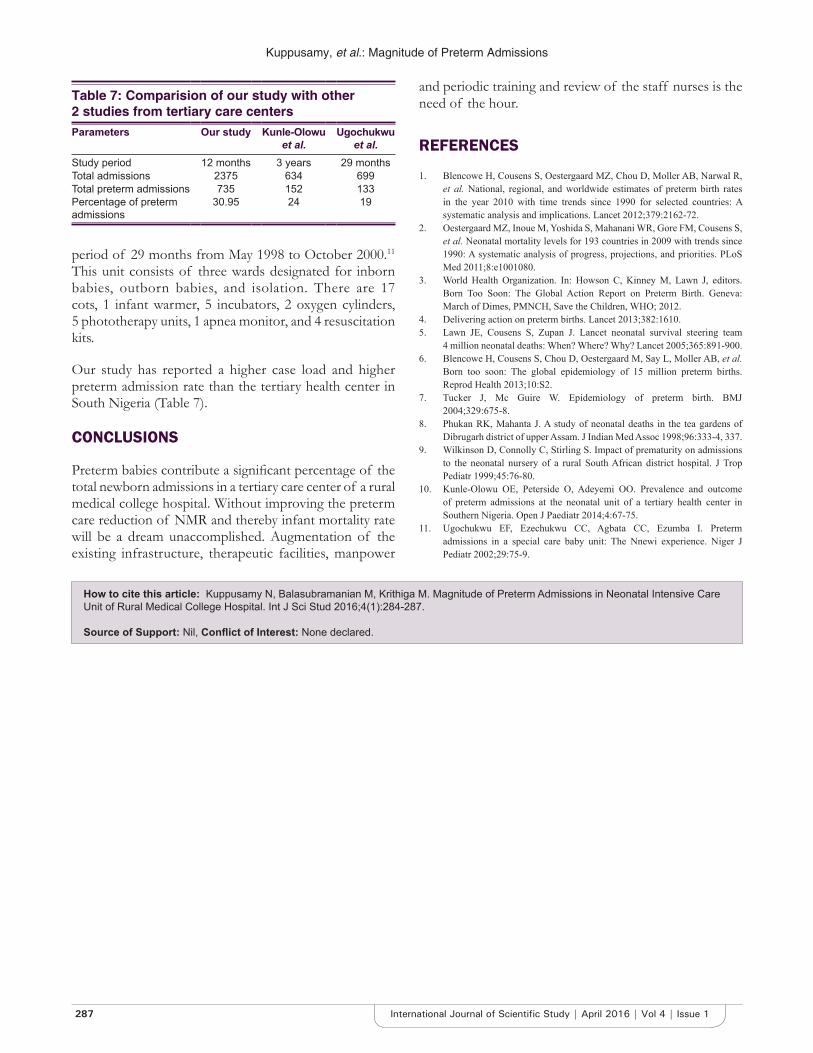
Kuppusamy, et al.: Magnitude of Preterm Admissions
287 International Journal of Scientifi c Study | April 2016 | Vol 4 | Issue 1
period of 29 months from May 1998 to October 2000.11 This unit consists of three wards designated for inborn babies, outborn babies, and isolation. There are 17 cots, 1 infant warmer, 5 incubators, 2 oxygen cylinders, 5 phototherapy units, 1 apnea monitor, and 4 resuscitation kits.
Our study has reported a higher case load and higher preterm admission rate than the tertiary health center in South Nigeria (Table 7).
CONCLUSIONS
Preterm babies contribute a signifi cant percentage of the total newborn admissions in a tertiary care center of a rural medical college hospital. Without improving the preterm care reduction of NMR and thereby infant mortality rate will be a dream unaccomplished. Augmentation of the existing infrastructure, therapeutic facilities, manpower
and periodic training and review of the staff nurses is the need of the hour.
REFERENCES
1. Blencowe H, Cousens S, Oestergaard MZ, Chou D, Moller AB, Narwal R, et al. National, regional, and worldwide estimates of preterm birth rates in the year 2010 with time trends since 1990 for selected countries: A systematic analysis and implications. Lancet 2012;379:2162-72.
2. Oestergaard MZ, Inoue M, Yoshida S, Mahanani WR, Gore FM, Cousens S, et al. Neonatal mortality levels for 193 countries in 2009 with trends since 1990: A systematic analysis of progress, projections, and priorities. PLoS Med 2011;8:e1001080.
3. World Health Organization. In: Howson C, Kinney M, Lawn J, editors. Born Too Soon: The Global Action Report on Preterm Birth. Geneva: March of Dimes, PMNCH, Save the Children, WHO; 2012.
4. Delivering action on preterm births. Lancet 2013;382:1610.5. Lawn JE, Cousens S, Zupan J. Lancet neonatal survival steering team
4 million neonatal deaths: When? Where? Why? Lancet 2005;365:891-900.6. Blencowe H, Cousens S, Chou D, Oestergaard M, Say L, Moller AB, et al.
Born too soon: The global epidemiology of 15 million preterm births. Reprod Health 2013;10:S2.
7. Tucker J, Mc Guire W. Epidemiology of preterm birth. BMJ 2004;329:675-8.
8. Phukan RK, Mahanta J. A study of neonatal deaths in the tea gardens of Dibrugarh district of upper Assam. J Indian Med Assoc 1998;96:333-4, 337.
9. Wilkinson D, Connolly C, Stirling S. Impact of prematurity on admissions to the neonatal nursery of a rural South African district hospital. J Trop Pediatr 1999;45:76-80.
10. Kunle-Olowu OE, Peterside O, Adeyemi OO. Prevalence and outcome of preterm admissions at the neonatal unit of a tertiary health center in Southern Nigeria. Open J Paediatr 2014;4:67-75.
11. Ugochukwu EF, Ezechukwu CC, Agbata CC, Ezumba I. Preterm admissions in a special care baby unit: The Nnewi experience. Niger J Pediatr 2002;29:75-9.
Table 7: Comparision of our study with other 2 studies from tertiary care centersParameters Our study Kunle-Olowu
et al.Ugochukwu
et al.Study period 12 months 3 years 29 monthsTotal admissions 2375 634 699Total preterm admissions 735 152 133Percentage of preterm admissions
30.95 24 19
How to cite this article: Kuppusamy N, Balasubramanian M, Krithiga M. Magnitude of Preterm Admissions in Neonatal Intensive Care Unit of Rural Medical College Hospital. Int J Sci Stud 2016;4(1):284-287.
Source of Support: Nil, Confl ict of Interest: None declared.

288International Journal of Scientifi c Study | April 2016 | Vol 4 | Issue 1
Hand Preference in Cerebral Palsy with Special Reference to PrematurityRajesh Bansal1, Ashok Agarwal1, Mahender Sharma2
1Professor, Department of Pediatrics, Rohilkhand Medical College & Hospital, Bareilly, Uttar Pradesh, India, 2Statistician cum Lecturer, Department of Community Medicine, Rohilkhand Medical College & Hospital, Bareilly, Uttar Pradesh, India
Spastic diplegia is bilateral spasticity of lower extremity which is greater than the upper extremity. Periventricular leukomalacia (PVL) and prematurity are the most common associations with spastic diplegia.2
Handedness may be defi ned as preferential use of one hand for performing uni-manual tasks.3 About 90% of humans are right handed.4 Most left-handers are males.5-7 Prematurity has been associated with left handedness.8 Normally, infants do not show hand preference. Babies with hemiparetic CP may develop hand preference, using the unaffected arm to reach out for toys even when they are closure to the opposite affected hand. Even though, there is no clear-cut consensus as to the age at which adult-like handedness is achieved, it is only after age of 6 years that a clear hand preference can be observed.9
INTRODUCTION
Cerebral palsy (CP) is a static encephalopathy and comprises a heterogeneous group of non-progressive motor impairment syndromes primarily causing impairment of movement and of posture. The cause is a brain insult occurring either prenatally, perinatally or postnatally and affecting areas of the brain which control muscle tone, power and coordination.1
Original Article
Abstract
Introduction: Cerebral palsy (CP) is a static encephalopathy primarily causing impairment of movement and of posture. Handedness may be defi ned as the preferential use of one hand for performing unimanual tasks. Patients with CP develop early hand preference.
Purpose: To determine if the incidence of left handedness is high in children with CP and to investigate the association between prematurity, CP and hand preference.
Design: Case-control study.
Materials and Methods: A total of 129 children aged 6-15 years with CP and 516 age and gender matched controls were enrolled for the study. The handedness was assessed based on responses to questions on hand preference for writing/drawing, feeding, and throwing a ball. The data were analyzed by conditional logistical regression and calculating the odds ratio (OR) and 95% confi dence intervals (CI) for left handedness.
Result: The mean age of cases was 9.1 years (standard deviation [SD] = 2.58) and that of controls was 9.6 years (SD = 2.72). Male female ratio was 1.22:1 for cases and 1.3:1 for controls. Spastic diplegia (79.07%) was the most common type of CP followed by hemiplegia (13.18%), quadriplegia (6.97%), and extrapyramidal CP (0.77%). Of the 129 children with CP, 49 (37.98%) were left-handed, while 21 (4.06%) of the 516 normal controls were left handed. The OR for left handedness in children with CP as compared with normal children was 14.43 (95% CI = 8.22-25.35). Nearly one-fi fth (20.16%) of the study cases were preterm and out of these 57.69% cases were found to have left hand preference (P = 0.0204).
Conclusion: The study shows that left handedness is very frequently encountered in children with CP. A signifi cant association exists between preterm CP children and left handedness.
Key words: Cerebral palsy, Left handedness, Preterm
Access this article online
www.ijss-sn.com
Month of Submission : 11-2015Month of Peer Review : 12-2015Month of Acceptance : 02-2016Month of Publishing : 04-2016
Corresponding Author: Dr. Rajesh Bansal, Flat No B/8, Rohilkhand Medical College Campus, Pilibhit Bypass Road, Bareilly - 243 006, Uttar Pradesh, India. Phone: +91-9837235064/9927107555. E-mail: [email protected]
DOI: 10.17354/ijss/2016/235
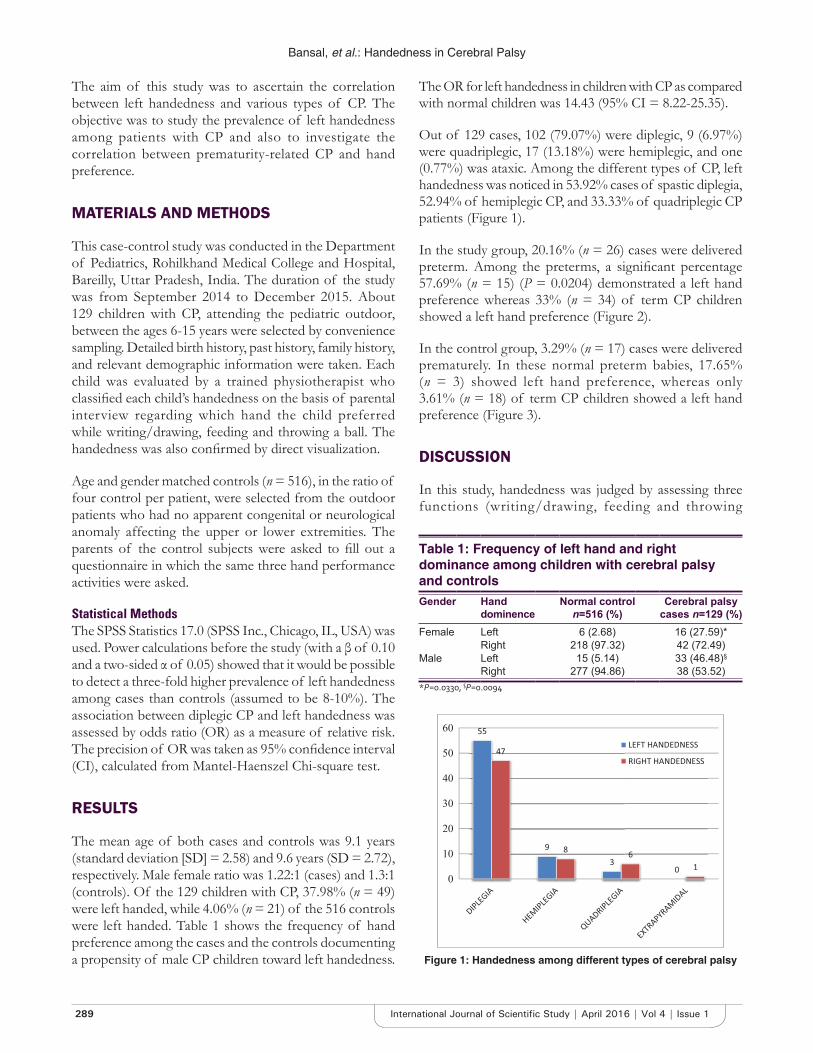
Bansal, et al.: Handedness in Cerebral Palsy
289 International Journal of Scientifi c Study | April 2016 | Vol 4 | Issue 1
The aim of this study was to ascertain the correlation between left handedness and various types of CP. The objective was to study the prevalence of left handedness among patients with CP and also to investigate the correlation between prematurity-related CP and hand preference.
MATERIALS AND METHODS
This case-control study was conducted in the Department of Pediatrics, Rohilkhand Medical College and Hospital, Bareilly, Uttar Pradesh, India. The duration of the study was from September 2014 to December 2015. About 129 children with CP, attending the pediatric outdoor, between the ages 6-15 years were selected by convenience sampling. Detailed birth history, past history, family history, and relevant demographic information were taken. Each child was evaluated by a trained physiotherapist who classifi ed each child’s handedness on the basis of parental interview regarding which hand the child preferred while writing/drawing, feeding and throwing a ball. The handedness was also confi rmed by direct visualization.
Age and gender matched controls (n = 516), in the ratio of four control per patient, were selected from the outdoor patients who had no apparent congenital or neurological anomaly affecting the upper or lower extremities. The parents of the control subjects were asked to fi ll out a questionnaire in which the same three hand performance activities were asked.
Statistical MethodsThe SPSS Statistics 17.0 (SPSS Inc., Chicago, IL, USA) was used. Power calculations before the study (with a β of 0.10 and a two-sided α of 0.05) showed that it would be possible to detect a three-fold higher prevalence of left handedness among cases than controls (assumed to be 8-10%). The association between diplegic CP and left handedness was assessed by odds ratio (OR) as a measure of relative risk. The precision of OR was taken as 95% confi dence interval (CI), calculated from Mantel-Haenszel Chi-square test.
RESULTS
The mean age of both cases and controls was 9.1 years (standard deviation [SD] = 2.58) and 9.6 years (SD = 2.72), respectively. Male female ratio was 1.22:1 (cases) and 1.3:1 (controls). Of the 129 children with CP, 37.98% (n = 49) were left handed, while 4.06% (n = 21) of the 516 controls were left handed. Table 1 shows the frequency of hand preference among the cases and the controls documenting a propensity of male CP children toward left handedness.
The OR for left handedness in children with CP as compared with normal children was 14.43 (95% CI = 8.22-25.35).
Out of 129 cases, 102 (79.07%) were diplegic, 9 (6.97%) were quadriplegic, 17 (13.18%) were hemiplegic, and one (0.77%) was ataxic. Among the different types of CP, left handedness was noticed in 53.92% cases of spastic diplegia, 52.94% of hemiplegic CP, and 33.33% of quadriplegic CP patients (Figure 1).
In the study group, 20.16% (n = 26) cases were delivered preterm. Among the preterms, a signifi cant percentage 57.69% (n = 15) (P = 0.0204) demonstrated a left hand preference whereas 33% (n = 34) of term CP children showed a left hand preference (Figure 2).
In the control group, 3.29% (n = 17) cases were delivered prematurely. In these normal preterm babies, 17.65% (n = 3) showed left hand preference, whereas only 3.61% (n = 18) of term CP children showed a left hand preference (Figure 3).
DISCUSSION
In this study, handedness was judged by assessing three functions (writing/drawing, feeding and throwing
Table 1: Frequency of left hand and right dominance among children with cerebral palsy and controlsGender Hand
dominenceNormal control
n=516 (%)Cerebral palsy
cases n=129 (%)Female Left 6 (2.68) 16 (27.59)*
Right 218 (97.32) 42 (72.49)Male Left 15 (5.14) 33 (46.48)§
Right 277 (94.86) 38 (53.52)*P=0.0330, §P=0.0094
Figure 1: Handedness among different types of cerebral palsy
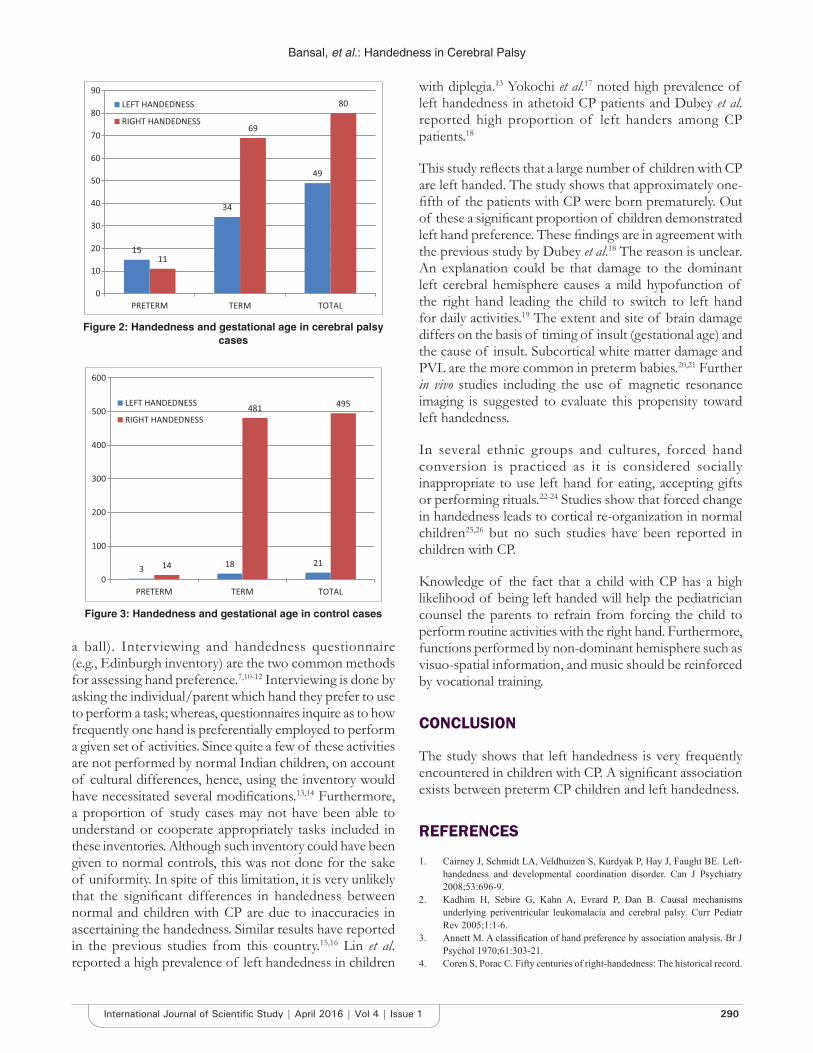
Bansal, et al.: Handedness in Cerebral Palsy
290International Journal of Scientifi c Study | April 2016 | Vol 4 | Issue 1
a ball). Interviewing and handedness questionnaire (e.g., Edinburgh inventory) are the two common methods for assessing hand preference.7,10-12 Interviewing is done by asking the individual/parent which hand they prefer to use to perform a task; whereas, questionnaires inquire as to how frequently one hand is preferentially employed to perform a given set of activities. Since quite a few of these activities are not performed by normal Indian children, on account of cultural differences, hence, using the inventory would have necessitated several modifi cations.13,14 Furthermore, a proportion of study cases may not have been able to understand or cooperate appropriately tasks included in these inventories. Although such inventory could have been given to normal controls, this was not done for the sake of uniformity. In spite of this limitation, it is very unlikely that the signifi cant differences in handedness between normal and children with CP are due to inaccuracies in ascertaining the handedness. Similar results have reported in the previous studies from this country.15,16 Lin et al. reported a high prevalence of left handedness in children
with diplegia.13 Yokochi et al.17 noted high prevalence of left handedness in athetoid CP patients and Dubey et al. reported high proportion of left handers among CP patients.18
This study refl ects that a large number of children with CP are left handed. The study shows that approximately one-fi fth of the patients with CP were born prematurely. Out of these a signifi cant proportion of children demonstrated left hand preference. These fi ndings are in agreement with the previous study by Dubey et al.18 The reason is unclear. An explanation could be that damage to the dominant left cerebral hemisphere causes a mild hypofunction of the right hand leading the child to switch to left hand for daily activities.19 The extent and site of brain damage differs on the basis of timing of insult (gestational age) and the cause of insult. Subcortical white matter damage and PVL are the more common in preterm babies.20,21 Further in vivo studies including the use of magnetic resonance imaging is suggested to evaluate this propensity toward left handedness.
In several ethnic groups and cultures, forced hand conversion is practiced as it is considered socially inappropriate to use left hand for eating, accepting gifts or performing rituals.22-24 Studies show that forced change in handedness leads to cortical re-organization in normal children25,26 but no such studies have been reported in children with CP.
Knowledge of the fact that a child with CP has a high likelihood of being left handed will help the pediatrician counsel the parents to refrain from forcing the child to perform routine activities with the right hand. Furthermore, functions performed by non-dominant hemisphere such as visuo-spatial information, and music should be reinforced by vocational training.
CONCLUSION
The study shows that left handedness is very frequently encountered in children with CP. A signifi cant association exists between preterm CP children and left handedness.
REFERENCES
1. Cairney J, Schmidt LA, Veldhuizen S, Kurdyak P, Hay J, Faught BE. Left-handedness and developmental coordination disorder. Can J Psychiatry 2008;53:696-9.
2. Kadhim H, Sebire G, Kahn A, Evrard P, Dan B. Causal mechanisms underlying periventricular leukomalacia and cerebral palsy. Curr Pediatr Rev 2005;1:1-6.
3. Annett M. A classifi cation of hand preference by association analysis. Br J Psychol 1970;61:303-21.
4. Coren S, Porac C. Fifty centuries of right-handedness: The historical record.
Figure 2: Handedness and gestational age in cerebral palsy cases
Figure 3: Handedness and gestational age in control cases
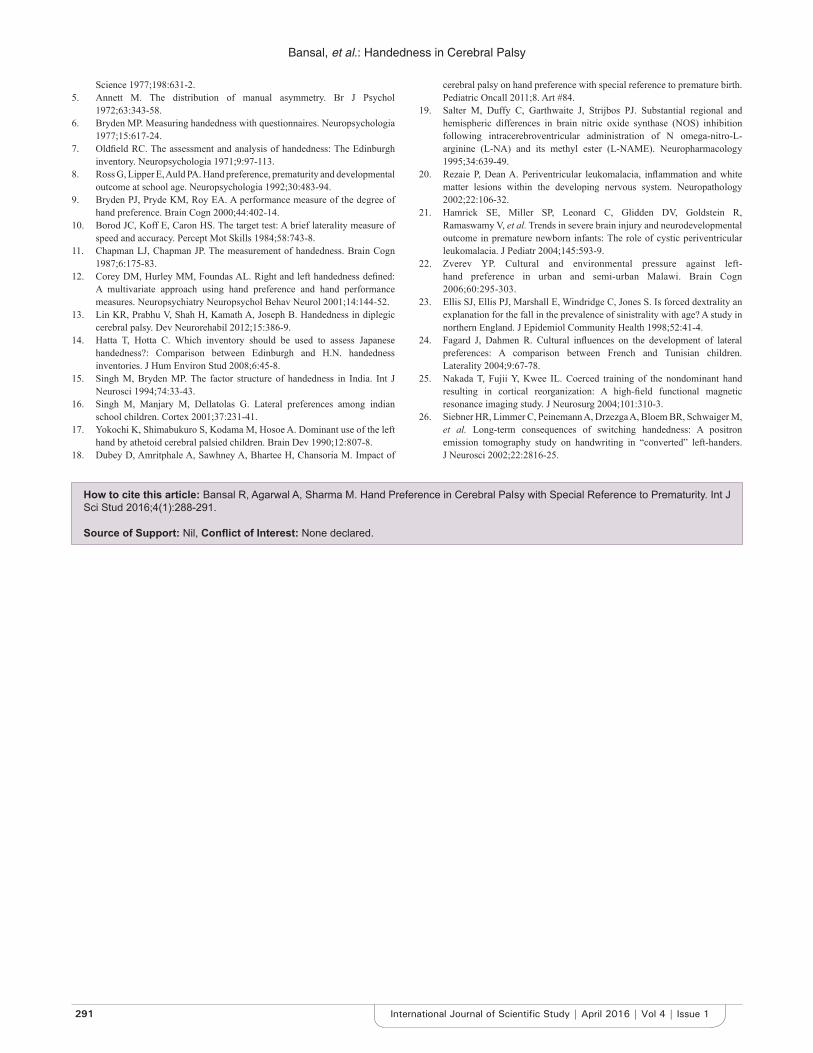
Bansal, et al.: Handedness in Cerebral Palsy
291 International Journal of Scientifi c Study | April 2016 | Vol 4 | Issue 1
Science 1977;198:631-2.5. Annett M. The distribution of manual asymmetry. Br J Psychol
1972;63:343-58.6. Bryden MP. Measuring handedness with questionnaires. Neuropsychologia
1977;15:617-24.7. Oldfi eld RC. The assessment and analysis of handedness: The Edinburgh
inventory. Neuropsychologia 1971;9:97-113.8. Ross G, Lipper E, Auld PA. Hand preference, prematurity and developmental
outcome at school age. Neuropsychologia 1992;30:483-94.9. Bryden PJ, Pryde KM, Roy EA. A performance measure of the degree of
hand preference. Brain Cogn 2000;44:402-14.10. Borod JC, Koff E, Caron HS. The target test: A brief laterality measure of
speed and accuracy. Percept Mot Skills 1984;58:743-8.11. Chapman LJ, Chapman JP. The measurement of handedness. Brain Cogn
1987;6:175-83.12. Corey DM, Hurley MM, Foundas AL. Right and left handedness defi ned:
A multivariate approach using hand preference and hand performance measures. Neuropsychiatry Neuropsychol Behav Neurol 2001;14:144-52.
13. Lin KR, Prabhu V, Shah H, Kamath A, Joseph B. Handedness in diplegic cerebral palsy. Dev Neurorehabil 2012;15:386-9.
14. Hatta T, Hotta C. Which inventory should be used to assess Japanese handedness?: Comparison between Edinburgh and H.N. handedness inventories. J Hum Environ Stud 2008;6:45-8.
15. Singh M, Bryden MP. The factor structure of handedness in India. Int J Neurosci 1994;74:33-43.
16. Singh M, Manjary M, Dellatolas G. Lateral preferences among indian school children. Cortex 2001;37:231-41.
17. Yokochi K, Shimabukuro S, Kodama M, Hosoe A. Dominant use of the left hand by athetoid cerebral palsied children. Brain Dev 1990;12:807-8.
18. Dubey D, Amritphale A, Sawhney A, Bhartee H, Chansoria M. Impact of
cerebral palsy on hand preference with special reference to premature birth. Pediatric Oncall 2011;8. Art #84.
19. Salter M, Duffy C, Garthwaite J, Strijbos PJ. Substantial regional and hemispheric differences in brain nitric oxide synthase (NOS) inhibition following intracerebroventricular administration of N omega-nitro-L-arginine (L-NA) and its methyl ester (L-NAME). Neuropharmacology 1995;34:639-49.
20. Rezaie P, Dean A. Periventricular leukomalacia, infl ammation and white matter lesions within the developing nervous system. Neuropathology 2002;22:106-32.
21. Hamrick SE, Miller SP, Leonard C, Glidden DV, Goldstein R, Ramaswamy V, et al. Trends in severe brain injury and neurodevelopmental outcome in premature newborn infants: The role of cystic periventricular leukomalacia. J Pediatr 2004;145:593-9.
22. Zverev YP. Cultural and environmental pressure against left-hand preference in urban and semi-urban Malawi. Brain Cogn 2006;60:295-303.
23. Ellis SJ, Ellis PJ, Marshall E, Windridge C, Jones S. Is forced dextrality an explanation for the fall in the prevalence of sinistrality with age? A study in northern England. J Epidemiol Community Health 1998;52:41-4.
24. Fagard J, Dahmen R. Cultural infl uences on the development of lateral preferences: A comparison between French and Tunisian children. Laterality 2004;9:67-78.
25. Nakada T, Fujii Y, Kwee IL. Coerced training of the nondominant hand resulting in cortical reorganization: A high-fi eld functional magnetic resonance imaging study. J Neurosurg 2004;101:310-3.
26. Siebner HR, Limmer C, Peinemann A, Drzezga A, Bloem BR, Schwaiger M, et al. Long-term consequences of switching handedness: A positron emission tomography study on handwriting in “converted” left-handers. J Neurosci 2002;22:2816-25.
How to cite this article: Bansal R, Agarwal A, Sharma M. Hand Preference in Cerebral Palsy with Special Reference to Prematurity. Int J Sci Stud 2016;4(1):288-291.
Source of Support: Nil, Confl ict of Interest: None declared.
292International Journal of Scientifi c Study | April 2016 | Vol 4 | Issue 1
Treatment of Multiple Impacted Canines - Maxillary Left Canine and Both Mandibular Canines: A Case ReportRanjit O Pawar1, Sagar A Mapare2
1Reader, Department of Orthodontics, Dr. HSRSM Dental College and Hospital, Hingoli, Maharashtra, India, 2Professor and Head, Department of Orthodontics, Dr. HSRSM Dental College and Hospital, Hingoli, Maharashtra, India
This case report describes the sequential management of 3 impacted canines (one maxillary and two mandibular). Treatment is done with an interdisciplinary approach, in which an orthodontist and an oral surgeon were involved. The treatment success was the result of the combined efforts of the orthodontist, the oral surgeon, and the patient.
CASE REPORT
An 18-year-old girl came to the Department of Orthodontics at Nair Hospital Dental College, Mumbai, Maharashtra, India, with a chief complaint of an unesthetic smile due to missing teeth in maxillary and mandibular anterior region. The patient was physically healthy and had no history of medical or dental trauma. No signs or symptoms of temporomandibular joint dysfunction were noted at the initial examination.
The extra-oral examination showed a convex profi le due to the retrusive chin. The intra-oral examination showed an Angle’s class I malocclusion with spacing in upper left and lower right and left canine region and partially erupted
INTRODUCTION
Impaction is the total or partial lack of eruption of a tooth well after the normal age of eruption. The most commonly impacted maxillary tooth is the canine, occurring in less than 2% of the general population,1 followed by the central incisor with a frequency of 0.06-0.2%.2 According to Kokich and Mathews,3 the cause of labial impaction of canines probably is related to either a retained deciduous tooth, diversion of canine tooth bud, or idiopathic failure of eruption of unknown origin. The labial impaction of a maxillary central incisor can occur because of an unerupted mesiodens or supernumerary tooth.4 In the mandibular arch, the canine impaction can occur due to over-retained deciduous tooth or crowding in the anterior region because of the arch length-tooth material discrepancy.
Case Report
Abstract
Impaction is the total or partial lack of eruption of a tooth well after the normal age of eruption. In the mandibular arch, the canine impaction can occur due to over-retained deciduous tooth or crowding in the anterior region because of the arch length-tooth material discrepancy. This case report describes the orthodontic treatment of an 18-year-old girl, who had 3 impacted canines (maxillary left and both mandibular canines). The treatment protocol involved leveling and alignment of both upper and lower arches followed by sequential traction of the 3 impacted canines. All the impacted canines were brought to their correct position in maxillary and mandibular arch. The patients smile dramatically improved after orthodontic treatment. A stable occlusion was achieved.
Key words: Extrusion, Guidance of impacted teeth, Impaction, Mesiodens, Mucoperiosteal fl ap, Over-retained deciduous teeth, Periodontium, Supernumerary teeth
Access this article online
www.ijss-sn.com
Month of Submission : 02-2016Month of Peer Review : 03-2016Month of Acceptance : 03-2016Month of Publishing : 04-2016
Corresponding Author: Dr. Ranjit O Pawar, Department of Orthodontics, Dr. HSRSM Dental College and Hospital, Basamba Phata, Akola Road, Hingoli - 431 513, Maharashtra, India. Phone: +91-8806596699/9850350539. E-mail: [email protected]
DOI: 10.17354/ijss/2016/236
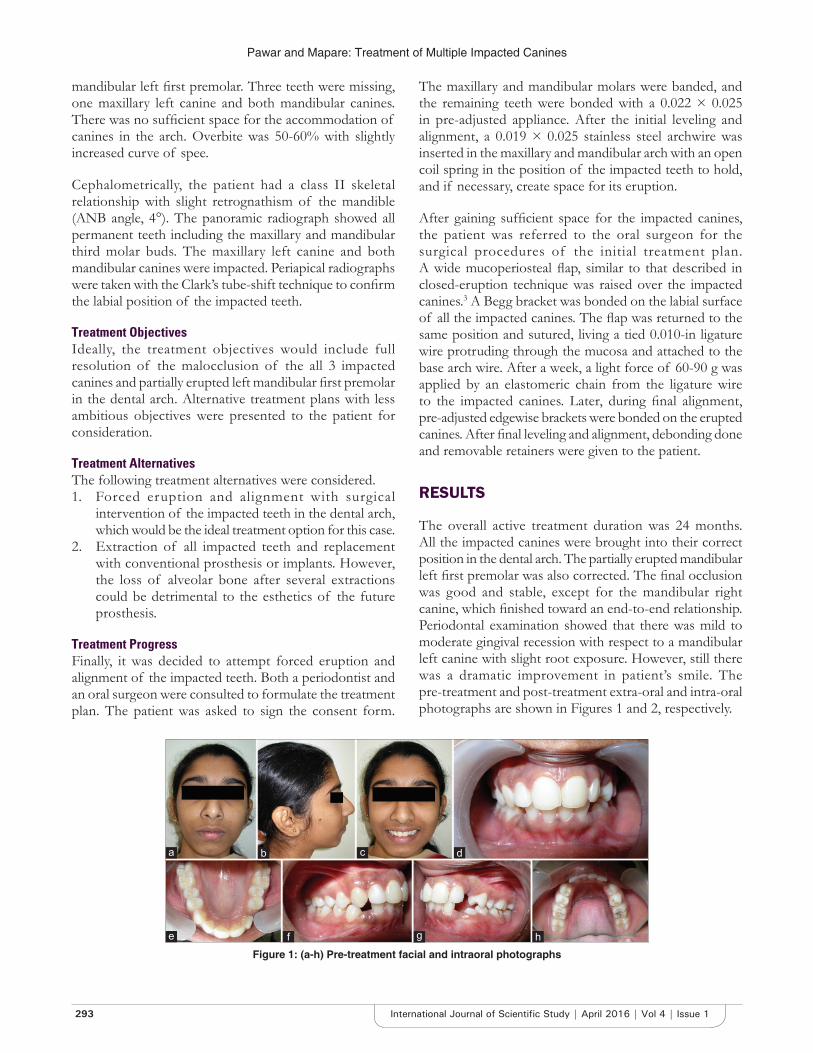
Pawar and Mapare: Treatment of Multiple Impacted Canines
293 International Journal of Scientifi c Study | April 2016 | Vol 4 | Issue 1
mandibular left fi rst premolar. Three teeth were missing, one maxillary left canine and both mandibular canines. There was no suffi cient space for the accommodation of canines in the arch. Overbite was 50-60% with slightly increased curve of spee.
Cephalometrically, the patient had a class II skeletal relationship with slight retrognathism of the mandible (ANB angle, 4°). The panoramic radiograph showed all permanent teeth including the maxillary and mandibular third molar buds. The maxillary left canine and both mandibular canines were impacted. Periapical radiographs were taken with the Clark’s tube-shift technique to confi rm the labial position of the impacted teeth.
Treatment ObjectivesIdeally, the treatment objectives would include full resolution of the malocclusion of the all 3 impacted canines and partially erupted left mandibular fi rst premolar in the dental arch. Alternative treatment plans with less ambitious objectives were presented to the patient for consideration.
Treatment AlternativesThe following treatment alternatives were considered.1. Forced eruption and alignment with surgical
intervention of the impacted teeth in the dental arch, which would be the ideal treatment option for this case.
2. Extraction of all impacted teeth and replacement with conventional prosthesis or implants. However, the loss of alveolar bone after several extractions could be detrimental to the esthetics of the future prosthesis.
Treatment ProgressFinally, it was decided to attempt forced eruption and alignment of the impacted teeth. Both a periodontist and an oral surgeon were consulted to formulate the treatment plan. The patient was asked to sign the consent form.
The maxillary and mandibular molars were banded, and the remaining teeth were bonded with a 0.022 × 0.025 in pre-adjusted appliance. After the initial leveling and alignment, a 0.019 × 0.025 stainless steel archwire was inserted in the maxillary and mandibular arch with an open coil spring in the position of the impacted teeth to hold, and if necessary, create space for its eruption.
After gaining suffi cient space for the impacted canines, the patient was referred to the oral surgeon for the surgical procedures of the initial treatment plan. A wide mucoperiosteal fl ap, similar to that described in closed-eruption technique was raised over the impacted canines.3 A Begg bracket was bonded on the labial surface of all the impacted canines. The fl ap was returned to the same position and sutured, living a tied 0.010-in ligature wire protruding through the mucosa and attached to the base arch wire. After a week, a light force of 60-90 g was applied by an elastomeric chain from the ligature wire to the impacted canines. Later, during fi nal alignment, pre-adjusted edgewise brackets were bonded on the erupted canines. After fi nal leveling and alignment, debonding done and removable retainers were given to the patient.
RESULTS
The overall active treatment duration was 24 months. All the impacted canines were brought into their correct position in the dental arch. The partially erupted mandibular left fi rst premolar was also corrected. The fi nal occlusion was good and stable, except for the mandibular right canine, which fi nished toward an end-to-end relationship. Periodontal examination showed that there was mild to moderate gingival recession with respect to a mandibular left canine with slight root exposure. However, still there was a dramatic improvement in patient’s smile. The pre-treatment and post-treatment extra-oral and intra-oral photographs are shown in Figures 1 and 2, respectively.
Figure 1: (a-h) Pre-treatment facial and intraoral photographs
d
h
c
g
b
f
a
e
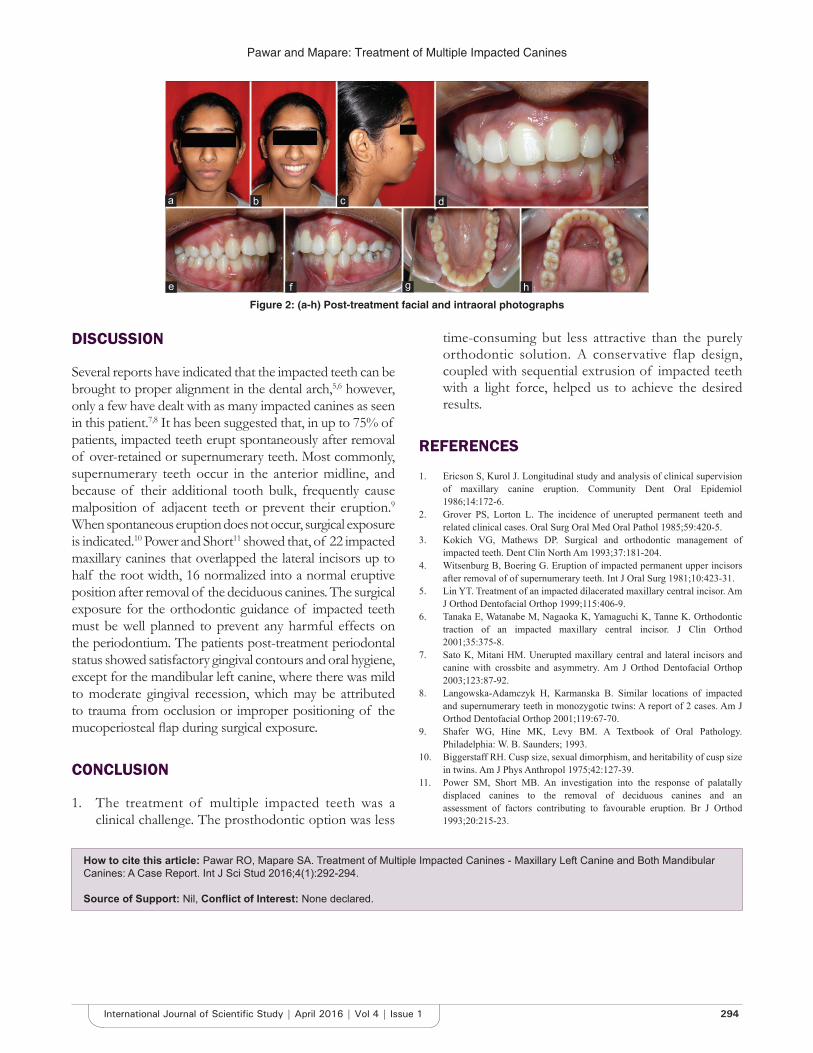
Pawar and Mapare: Treatment of Multiple Impacted Canines
294International Journal of Scientifi c Study | April 2016 | Vol 4 | Issue 1
DISCUSSION
Several reports have indicated that the impacted teeth can be brought to proper alignment in the dental arch,5,6 however, only a few have dealt with as many impacted canines as seen in this patient.7,8 It has been suggested that, in up to 75% of patients, impacted teeth erupt spontaneously after removal of over-retained or supernumerary teeth. Most commonly, supernumerary teeth occur in the anterior midline, and because of their additional tooth bulk, frequently cause malposition of adjacent teeth or prevent their eruption.9 When spontaneous eruption does not occur, surgical exposure is indicated.10 Power and Short11 showed that, of 22 impacted maxillary canines that overlapped the lateral incisors up to half the root width, 16 normalized into a normal eruptive position after removal of the deciduous canines. The surgical exposure for the orthodontic guidance of impacted teeth must be well planned to prevent any harmful effects on the periodontium. The patients post-treatment periodontal status showed satisfactory gingival contours and oral hygiene, except for the mandibular left canine, where there was mild to moderate gingival recession, which may be attributed to trauma from occlusion or improper positioning of the mucoperiosteal fl ap during surgical exposure.
CONCLUSION
1. The treatment of multiple impacted teeth was a clinical challenge. The prosthodontic option was less
time-consuming but less attractive than the purely orthodontic solution. A conservative flap design, coupled with sequential extrusion of impacted teeth with a light force, helped us to achieve the desired results.
REFERENCES
1. Ericson S, Kurol J. Longitudinal study and analysis of clinical supervision of maxillary canine eruption. Community Dent Oral Epidemiol 1986;14:172-6.
2. Grover PS, Lorton L. The incidence of unerupted permanent teeth and related clinical cases. Oral Surg Oral Med Oral Pathol 1985;59:420-5.
3. Kokich VG, Mathews DP. Surgical and orthodontic management of impacted teeth. Dent Clin North Am 1993;37:181-204.
4. Witsenburg B, Boering G. Eruption of impacted permanent upper incisors after removal of of supernumerary teeth. Int J Oral Surg 1981;10:423-31.
5. Lin YT. Treatment of an impacted dilacerated maxillary central incisor. Am J Orthod Dentofacial Orthop 1999;115:406-9.
6. Tanaka E, Watanabe M, Nagaoka K, Yamaguchi K, Tanne K. Orthodontic traction of an impacted maxillary central incisor. J Clin Orthod 2001;35:375-8.
7. Sato K, Mitani HM. Unerupted maxillary central and lateral incisors and canine with crossbite and asymmetry. Am J Orthod Dentofacial Orthop 2003;123:87-92.
8. Langowska-Adamczyk H, Karmanska B. Similar locations of impacted and supernumerary teeth in monozygotic twins: A report of 2 cases. Am J Orthod Dentofacial Orthop 2001;119:67-70.
9. Shafer WG, Hine MK, Levy BM. A Textbook of Oral Pathology. Philadelphia: W. B. Saunders; 1993.
10. Biggerstaff RH. Cusp size, sexual dimorphism, and heritability of cusp size in twins. Am J Phys Anthropol 1975;42:127-39.
11. Power SM, Short MB. An investigation into the response of palatally displaced canines to the removal of deciduous canines and an assessment of factors contributing to favourable eruption. Br J Orthod 1993;20:215-23.
Figure 2: (a-h) Post-treatment facial and intraoral photographs
How to cite this article: Pawar RO, Mapare SA. Treatment of Multiple Impacted Canines - Maxillary Left Canine and Both Mandibular Canines: A Case Report. Int J Sci Stud 2016;4(1):292-294.
Source of Support: Nil, Confl ict of Interest: None declared.
d
h
c
g
b
f
a
e
295 International Journal of Scientifi c Study | April 2016 | Vol 4 | Issue 1
Pneumobilia with Cholangitic Abscess: A Case ReportGarima Singh1, A Mukherji2, H R Jain1, P Smita2
1Postgraduate Student, Department of Medicine, Padmashree Dr. D.Y. Patil Medical College, Navi Mumbai, Maharashtra, India,2Professor, Department of Medicine, Padmashree Dr. D.Y. Patil Medical College, Navi Mumbai, Maharashtra, India
had undergone cholecystectomy 20 years back in view of congenital choledochal cyst of the common biliary duct (CBD); the post-operative period until now was uneventful. No other signifi cant past medical/surgical history was elicited. Her abdominal examination revealed severe tenderness in the right hypochondriac region. Other systemic examination revealed no abnormality.
Abdominal ultrasound showed mild fullness of intrahepatic biliary radicals (IHBR) in the right lobe of the liver with few echogenic foci within. Computed tomography scan of the abdomen was performed which showed dilatation of the central and peripheral IHBR with pneumobilia, and multiple calculi in these IHBR. Few round cystic lesions, likely cholangitic abscesses, could be seen in the peripheral aspects of segment VII of the right lobe of liver communicating with the biliary radicals. Eosophagogastroduodenoscopy (OGDscopy) showed multiple fi stulous openings at D1-D2 junction, considered to be choledochoduodenal fi stulas. Magnetic resonance cholangiopancreatography (MRCP) was advised for further confi rmation. The MRCP confi rmed the presence of air foci in the proximal CBD, representing choledochoduodenal fi stula, with dilatation of central and peripheral IHBR, with pneumobilia, with multiple calculi in the dilated IHBR (Figures 1-4).
ManagementThe patients’ blood was investigated and revealed her hemoglobin (Hb) to be 10.8 mg/dl, total leukocyte count - 14000/μl, and platelets of 314×103/μl.
INTRODUCTION
Pneumobilia or aerobilia is an accumulation of air in the biliary tree.1 The most common conditions associated with pneumobilia include: (1) A biliary-enteric surgical anastomosis, (2) an incompetent sphincter of Oddi, or (3) a spontaneous biliary-enteric fi stula, and rarely. (4) Biliary bronchopleural fi stula.2 Most cases of pneumobilia are related to gallstone disease. Pneumobilia is considered as a serious pathology, requiring urgent surgical intervention.
We report here a case of 32-year-old woman presenting with high fever and abdominal pain with air in the biliary tree and cholangitic abscess.
CASE REPORT
The 32-year-old woman was brought by her husband with a history of fever, bilious vomiting, and mild abdominal pain since 5 days. Fever was high grade associated with chills. The patient had also had nausea with 2-3 episodes of bilious vomiting, and mild abdominal pain. The patient
Abstract
Pneumobilia or aerobilia is an accumulation of air in the biliary tree. Pneumobilia is considered as a serious pathology, requiring urgent surgical intervention. Most cases are iatrogenic in origin, occurring post-surgeries for sphincterotomy or hepaticojejunostomy, or choledochojejunostomy. We report here a case of 32-year-old woman presenting with high fever and abdominal pain with air in the biliary tree and cholangitic abscess, which did not subside in-spite of being on full dose higher antibiotics. Eosophagogastroduodenoscopy revealed multiple choledochoduodenal fi stulas. Magnetic resonance cholangiopancreatography confi rmed pneumobilia. The patient was advised 4-weeks rest, after which surgical intervention would be contemplated and followed up with ultrasonography scan weekly.
Key words: Aerobilia, Biliary tree, Cholangitic abscess, Choledochoduodenal fi stula, Pneumobilia
Access this article online
www.ijss-sn.com
Month of Submission : 02-2016Month of Peer Review : 03-2016Month of Acceptance : 03-2016Month of Publishing : 04-2016
Corresponding Author: Dr. Garima Singh, 2202, Glen Ridge, Hiranandani Gardens, Powai, Mumbai - 400 076, Maharashtra, India. Phone: +91-9819565982. E-mail: [email protected]
DOI: 10.17354/ijss/2016/237Case Report

Singh, et al.: Pneumobilia with Cholangitic Abscess
296International Journal of Scientifi c Study | April 2016 | Vol 4 | Issue 1
In spite of starting the patient on higher antibiotics in full doses - injection piperacillin, injection metronidazole, the fever and abdominal pain did not subside. OGDscopy was done; which revealed multiple choledochoduodenal fi stulas and was advised MRCP for further evaluation. The presence of pneumobilia was confi rmed by MRCP, after which she was advised rest for 4 weeks till sepsis settled, after which surgical intervention would be contemplated and was asked to follow-up with ultrasonography scan weekly.
DISCUSSION
Pneumobilia is the presence of air in the biliary tree. Most cases are iatrogenic in origin, occurring post-surgeries for sphincterotomy or hepaticojejunostomy, or choledochojejunostomy. In the absence of a history of these procedures, other causes should be looked for. Mostly,
such patients do have enterobiliary fi stula of some origin, or more ominous, cholangitis. Spontaneous pneumobilia may occur due to gallstone erosion in the biliary tree to an adjacent viscus.3
Our patient was a 32-year-old woman with a history of congenital choledochal cyst of CBD, followed by cholecystectomy, 20 years ago. Her post-operative period was uneventful. However, her present imaging investigations revealed multiple calculi in the IHBDs, air foci in the proximal CBD, and intrahepatic cholangitic abscesses.
Pneumobilia has been reported to have a presentation similar to that of cholelithiasis. A long-standing history of biliary stones, recurrent biliary tract infections, and the presence of CBD stones do predispose the occurrence of choledochoduodenal fi stula when seen with cholelithiasis.4 Previous biliary surgery is a lesser contributing factor, as seems to be the case in our report. Choledochoduodenal fi stula leads to exposure of biliary tract to gut fl ora. This not only complicates the case by the occurrence of
Figure 1: Coronal T2-weighted (T2W) magnetic resonance (MR) image reveals that the suspected stones are air bubbles (*) within the right hepatic biliary radical. MR
cholangiopancreatography images may be misinterpreted therefore T2W images are most signifi cant in identifying the
pneumobilia
Figure 2: Abdominal ultrasound. Arrows represent mild fullness of intrahepatic biliary radicals in the right lobe of liver with few
echogenic foci within
Figure 3: Abdominal computed tomography-scan. Dilatation of central and peripheral intrahepatic biliary radicals (IHBR) with
pneumobilia, and multiple calculi in these IHBR. Few round cystic lesions, likely cholangitic abscesses could be seen
in the peripheral aspects of segment vii of right lobe of liver communicating with the biliary radicals
Figure 4: Oesophagogastroduodenoscopy. Fistulous openings at D1-D2 junction, considered to be choledocho-duodenal
fi stulas

Singh, et al.: Pneumobilia with Cholangitic Abscess
297 International Journal of Scientifi c Study | April 2016 | Vol 4 | Issue 1
cholangitic abscess, but also leads to biliary diarrhea, fl uid and electrolyte wasting, and malabsorption.
Abdominal computed tomography (CT) is a valuable diagnostic method as fi stulas, air in biliary tree, in addition to contraction of the gallbladder, can be visualized. Although our patient was cholecystectomized, CT imaging of a biliary enteric fi stula is also useful for differentiating between a gall bladder enteric fi stula and a common bile duct-enteric fi stula.5
Proximal choledochoduodenal fistulae are managed surgically. Two main surgical approaches, one-stage procedure (comprising enterotomy, cholecystectomy, and fi stula repair) and two-stage procedure (enterotomy with or without subsequent cholecystectomy and fi stula repair) are available.6 There is no consensus on which is better. In our case, the patient being previously cholecystectomized was managed with high dose antibiotics and OGDscopy done initially on presentation and revealed multiple choledochoduodenal fistulas. CT-abdomen was done which was suggestive of dilatation of central and peripheral IHBR with pneumobilia and fi ndings of the cholangitic abscess. MRCP was advised which confi rmed the presence of air foci in the proximal CBD, representing
choledochoduodenal fi stula, with dilatation of central and peripheral IHBR, with pneumobilia, with multiple calculi in the dilated IHBR.
CONCLUSION
Pneumobilia is a rare entity. Occurring with cholangitic abscess in a patient with an uneventful cholecystectomy, it presents a challenging case for determining the diagnosis as well as the management.
REF ERENCES
1. Rabou AA, Gaillard F. Pneumobilia, 2015. Available from: http://www.radiopaedia.org/articles/pneumobilia. [Last accessed on 2015 Nov 08].
2. Sherman SC, Tran H. Pneumobilia: Benign or life-threatening. J Emerg Med 2006;30:147-53.
3. Fedidat R, Safadi W, Waksman I, Hadary A. Choledochoduodenal fi stula: An unusual case of pneumobilia. BMJ Case Rep 2014;2014.
4. Sheu BS, Shin JS, Lin XZ, Lin CY, Chen CY, Chang TT, et al. Clinical analysis of choledochoduodenal fi stula with cholelithiasis in Taiwan: Assessment by endoscopic retrograde cholangiopancreatography. Am J Gastroenterol 1996;91:122-6.
5. Shimono T, Nishimura K, Hayakawa K. CT imaging of biliary enteric fi stula. Abdom Imaging 1998;23:172-6.
6. Wong CS, Crotty JM, Naqvi SA. Pneumobilia: A case report and literature review on its surgical approaches. J Surg Tech Case Rep 2013;5:27-31.
How to cite this article: Singh G, Mukherji A, Jain HR, Smita P. Pneumobilia with Cholangitic Abscess: A Case Report. Int J Sci Stud 2016;4(1):295-297.
Source of Support: Nil, Confl ict of Interest: None declared.
298International Journal of Scientifi c Study | April 2016 | Vol 4 | Issue 1
Synchronous Bilateral Breast Benign Phyllodes Tumors in an Adolescent Female along with Depression: A Case ReportSaswati Sucharita Pati1, Tapan Kumar Sahoo2
1Junior Resident, Department of Psychiatry, Sriram Chandra Bhanja Medical College, Cuttack, Odisha, India, 2Senior Resident, Department of Radiation Oncology, All India Institute of Medical Sciences, Bhubaneswar, Odisha, India
depression rating scale (HDRS) with decrease in score after surgery and with appropriate pharmacotherapy.
CASE REPORT
The 22 years young adolescent nulliparous female presented with bilateral breast lumps since 18 months. The patient developed features of depression during that period. Bilateral breast examination revealed lump on both the breasts without any axillary lymph node enlargement. Right breast examination showed a lump of size 6 cm × 6 cm, non-tender in nature, fi rm to hard in consistency, with lobulated appearance and normal intact nipple-areolar complex without any skin or chest wall fi xity. Left breast examination revealed a lump of size 10 cm × 10 cm, non-tender in nature, fi rm to hard in consistency, with lobulated appearance and normal intact nipple-areolar complex without any skin or chest wall fi xity. Contrast enhanced computed tomography scan of neck, chest, abdomen, and pelvis revealed lobulated well defined minimally enhancing bilateral breast masses (Figure 1). Careful examination ruled out other possible sites of lesion. Tru-cut biopsy from both the breast revealed
INTRODUCTION
Phyllodes tumor is a rare fi broepithelial neoplasm of the breast in children and adolescents. In most of the cases, it presents as a rapidly growing, clinically benign breast mass. These tumors usually present as unilateral painless, well-circumscribed, mobile breast masses.1 Bilateral tumors are rare entity and usually malignant and asynchronous in nature.2 These tumors are locally aggressive and have high recurrence rate. Surgery is the mainstay of treatment.1 We report a case of synchronous bilateral benign phyllodes tumors in a 22-year-old woman associated with depressive features. Local excision performed for the right side tumor and mastectomy with breast reconstruction performed for the left side tumor. There was an improvement in depressive features that was analyzed with Hamilton
Case Report
Abstract
Cystosarcoma phyllodes or phyllodes tumors are a rare neoplasm of the breast and present as painless breast mass. It accounts for 1% of all breast tumors. Whether benign, borderline or malignant, they have a high potential of recurrence. The bilateral occurrence of these biphasic tumors is rare. According to the literature, most of them are malignant and asynchronous. Synchronous bilateral benign presentation in a young nulliparous female is extremely rare. The defi nitive treatment of the benign entity is either wide local excision or mastectomy depending on size and age of the patient. We report a case of synchronous bilateral benign phyllodes tumors in a 22-year-old female associated with depressive features. Bilateral breast biopsy revealed benign phyllodes tumors. The case under report fi nds rarity due to its synchronous bilateral benign presentation in an unmarried adolescent female where the decision making regarding its management with surgical procedure becomes diffi cult and the signifi cance of treating the associated depression in such a patient.
Key words: Adolescent female, Bilateral benign tumors, Breast, Depression, Phyllodes tumor, Synchronous
Access this article online
www.ijss-sn.com
Month of Submission : 02-2016Month of Peer Review : 03-2016Month of Acceptance : 03-2016Month of Publishing : 04-2016
Corresponding Author: Dr. Tapan Kumar Sahoo, Department of Radiation Oncology, All India Institute of Medical Sciences, Bhubaneswar - 751 019, Odisha, India. Phone: +91-9437219525. E-mail: [email protected]
DOI: 10.17354/ijss/2016/238
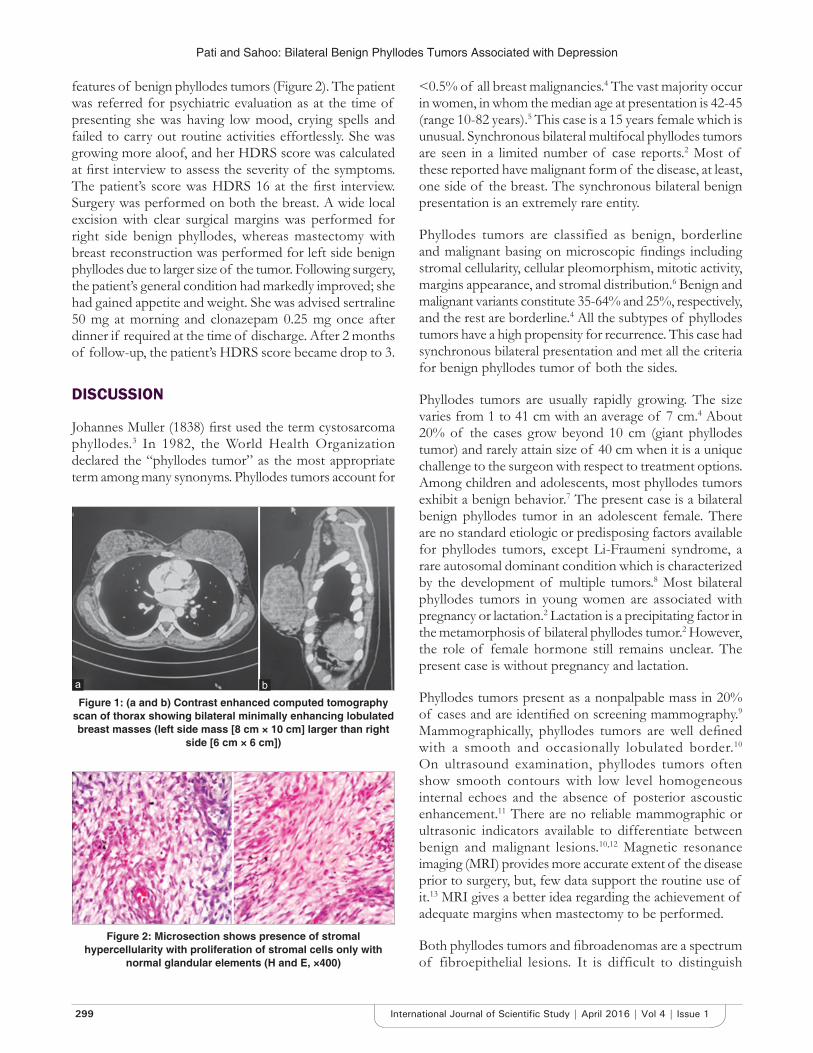
Pati and Sahoo: Bilateral Benign Phyllodes Tumors Associated with Depression
299 International Journal of Scientifi c Study | April 2016 | Vol 4 | Issue 1
features of benign phyllodes tumors (Figure 2). The patient was referred for psychiatric evaluation as at the time of presenting she was having low mood, crying spells and failed to carry out routine activities effortlessly. She was growing more aloof, and her HDRS score was calculated at fi rst interview to assess the severity of the symptoms. The patient’s score was HDRS 16 at the fi rst interview. Surgery was performed on both the breast. A wide local excision with clear surgical margins was performed for right side benign phyllodes, whereas mastectomy with breast reconstruction was performed for left side benign phyllodes due to larger size of the tumor. Following surgery, the patient’s general condition had markedly improved; she had gained appetite and weight. She was advised sertraline 50 mg at morning and clonazepam 0.25 mg once after dinner if required at the time of discharge. After 2 months of follow-up, the patient’s HDRS score became drop to 3.
DISCUSSION
Johannes Muller (1838) fi rst used the term cystosarcoma phyllodes.3 In 1982, the World Health Organization declared the “phyllodes tumor” as the most appropriate term among many synonyms. Phyllodes tumors account for
<0.5% of all breast malignancies.4 The vast majority occur in women, in whom the median age at presentation is 42-45 (range 10-82 years).5 This case is a 15 years female which is unusual. Synchronous bilateral multifocal phyllodes tumors are seen in a limited number of case reports.2 Most of these reported have malignant form of the disease, at least, one side of the breast. The synchronous bilateral benign presentation is an extremely rare entity.
Phyllodes tumors are classified as benign, borderline and malignant basing on microscopic fi ndings including stromal cellularity, cellular pleomorphism, mitotic activity, margins appearance, and stromal distribution.6 Benign and malignant variants constitute 35-64% and 25%, respectively, and the rest are borderline.4 All the subtypes of phyllodes tumors have a high propensity for recurrence. This case had synchronous bilateral presentation and met all the criteria for benign phyllodes tumor of both the sides.
Phyllodes tumors are usually rapidly growing. The size varies from 1 to 41 cm with an average of 7 cm.4 About 20% of the cases grow beyond 10 cm (giant phyllodes tumor) and rarely attain size of 40 cm when it is a unique challenge to the surgeon with respect to treatment options. Among children and adolescents, most phyllodes tumors exhibit a benign behavior.7 The present case is a bilateral benign phyllodes tumor in an adolescent female. There are no standard etiologic or predisposing factors available for phyllodes tumors, except Li-Fraumeni syndrome, a rare autosomal dominant condition which is characterized by the development of multiple tumors.8 Most bilateral phyllodes tumors in young women are associated with pregnancy or lactation.2 Lactation is a precipitating factor in the metamorphosis of bilateral phyllodes tumor.2 However, the role of female hormone still remains unclear. The present case is without pregnancy and lactation.
Phyllodes tumors present as a nonpalpable mass in 20% of cases and are identifi ed on screening mammography.9 Mammographically, phyllodes tumors are well defi ned with a smooth and occasionally lobulated border.10 On ultrasound examination, phyllodes tumors often show smooth contours with low level homogeneous internal echoes and the absence of posterior ascoustic enhancement.11 There are no reliable mammographic or ultrasonic indicators available to differentiate between benign and malignant lesions.10,12 Magnetic resonance imaging (MRI) provides more accurate extent of the disease prior to surgery, but, few data support the routine use of it.13 MRI gives a better idea regarding the achievement of adequate margins when mastectomy to be performed.
Both phyllodes tumors and fi broadenomas are a spectrum of fibroepithelial lesions. It is difficult to distinguish
Figure 2: Microsection shows presence of stromal hypercellularity with proliferation of stromal cells only with
normal glandular elements (H and E, ×400)
Figure 1: (a and b) Contrast enhanced computed tomography scan of thorax showing bilateral minimally enhancing lobulated breast masses (left side mass [8 cm × 10 cm] larger than right
side [6 cm × 6 cm])
ba

Pati and Sahoo: Bilateral Benign Phyllodes Tumors Associated with Depression
300International Journal of Scientifi c Study | April 2016 | Vol 4 | Issue 1
diagnosis of fi broadenoma and phyllodes tumors by fi ne needle aspiration cytology and core biopsy.14 An accurate pre-operative diagnosis needs imaging studies or biopsy, and the intraoperative frozen section. Microscopically, phyllodes tumors are characterized by epithelial lined cystic spaces with a hypercellular stromal projection. The stromal elements are a key component for differentiation of phyllodes tumor from fi broadenoma, and distinguishing between benign and malignant variants. An epithelial component with stromal components differentiates the phyllodes tumor from other stromal sarcomas.4 There is no standard diagnostic protocol for pre-operative diagnosis of this rare disease. The present case on pre-operative tru-cut biopsy revealed fi ndings consistent with bilateral benign phyllodes tumor of the breast.
Phyllodes tumor is best treated with wide excision when the size of the tumor is small. Surgical management is the mainstay of treatment in all types of phyllodes. Depending on the size of the breast, and size, location, and number of tumors; complete surgical excision with clear margins, mastectomy with or without breast reconstruction are the few treatment options for benign phyllodes tumors. Each subsequent recurrence converts tumor into a more aggressive one.15 In the case of giant phyllodes tumor, excision with required margins is not possible. Mastectomy should be the treatment of choice in such patients including recurrent disease.16 Like ipsilateral phyllodes tumor, surgery is the mainstay of treatment for bilateral presentation. Radical surgery does not have any survival advantage.17 Mastectomy has better results than breast-conserving surgery in borderline and malignant cases.18 There is controversy regarding the role of chemotherapy and radiotherapy.19
Phyllodes tumors have favorable prognosis with 5 years disease-free survival rates of 96%, 74% and 66% after surgery for benign, borderline and malignant phyllodes tumors, respectively.4 There is no correlation about risk factors between tumor size and local recurrence.20 Tumor size in relation to the breast is important for the extent of surgery and pathological resection margins. The most important factor for local control is excision with clear margins.18 Wider margins (>1 cm) have the lowest risk of recurrence.21 The possibility of local recurrence is 6-10% in benign, 25-30% in borderline and over 25% in malignant variants. Distant metastasis occurs in 3-13% of cases and lung is the most common site of distance metastasis.22
Depressive clinical features may develop in young women with breast phyllodes tumor. HDRS is the most widely used clinician-administered depression assessment scale.23 It has 17 questions on mood and other symptoms which are scored. It consists of a set of 17 questions on depressed
mood, feelings of guilt, suicide, insomnia in early and middle of night, insomnia early in the morning, work and activities, retardation, agitation, anxiety psychic, anxiety somatic, somatic symptoms of gastrointestinal, general somatic, genital symptoms, hypochondrias, loss of weight, and insight which are given scores. This provides with an objective score which is done before and after treatment to quantify the improvement in depressive symptoms.
The present case is treated with surgery. Left side breast phyllodes treated with mastectomy and breast reconstruction due to larger size of the tumor, whereas wide local excision with clear surgical margins was performed for right side breast phyllodes. There was a signifi cant improvement in depressive features.
CONCLUSION
A differential diagnosis of phyllodes tumor should be considered in a rapidly growing but clinically benign breast lump, especially in young women. A thorough pre-operative diagnosis of this rare disease is important to determine the surgical approach.
REFERENCES
1. Ben Hassouna J, Damak T, Gamoudi A, Chargui R, Khomsi F, Mahjoub S, et al. Phyllodes tumors of the breast: A case series of 106 patients. Am J Surg 2006;192:141-7.
2. Mrad K, Driss M, Maalej M, Romdhane KB. Bilateral cystosarcoma phyllodes of the breast: A case report of malignant form with contralateral benign form. Ann Diagn Pathol 2000;4:370-2.
3. Lester J, Stout AP. Cystosarcoma phyllodes. Cancer 1954;7:335-53.4. Reinfuss M, Mitus J, Duda K, Stelmach A, Rys J, Smolak K. The treatment
and prognosis of patients with phyllodes tumor of the breast: An analysis of 170 cases. Cancer 1996;77:910-6.
5. Bernstein L, Deapen D, Ross RK. The descriptive epidemiology of malignant cystosarcoma phyllodes tumors of the breast. Cancer 1993;71:3020-4.
6. Esposito NN, Mohan D, Brufsky A, Lin Y, Kapali M, Dabbs DJ. Phyllodes tumor: A clinicopathologic and immunohistochemical study of 30 cases. Arch Pathol Lab Med 2006;130:1516-21.
7. Tse GM, Niu Y, Shi HJ. Phyllodes tumor of the breast: An update. Breast Cancer 2010;17:29-34.
8. Birch JM, Alston RD, McNally RJ, Evans DG, Kelsey AM, Harris M, et al. Relative frequency and morphology of cancers in carriers of germline TP53 mutations. Oncogene 2001;20:4621-8.
9. Macdonald OK, Lee CM, Tward JD, Chappel CD, Gaffney DK. Malignant phyllodes tumor of the female breast: Association of primary therapy with cause-specifi c survival from the Surveillance, Epidemiology, and End Results (SEER) program. Cancer 2006;107:2127-33.
10. Page JE, Williams JE. The radiological features of phylloides tumour of the breast with clinico-pathological correlation. Clin Radiol 1991;44:8-12.
11. Cole-Beuglet C, Soriano R, Kurtz AB, Meyer JE, Kopans DB, Goldberg BB. Ultrasound, x-ray mammography, and histopathology of cystosarcoma phylloides. Radiology 1983;146:481-6.
12. Buchberger W, Strasser K, Heim K, Müller E, Schröcksnadel H. Phylloides tumor: Findings on mammography, sonography, and aspiration cytology in 10 cases. AJR Am J Roentgenol 1991;157:715-9.
13. Farria DM, Gorczyca DP, Barsky SH, Sinha S, Bassett LW. Benign phyllodes tumor of the breast: MR imaging features. AJR Am J Roentgenol 1996;167:187-9.

Pati and Sahoo: Bilateral Benign Phyllodes Tumors Associated with Depression
301 International Journal of Scientifi c Study | April 2016 | Vol 4 | Issue 1
14. Shimizu K, Masawa N, Yamada T, Okamoto K, Kanda K. Cytologic evaluation of phyllodes tumors as compared to fi broadenomas of the breast. Acta Cytol 1994;38:891-7.
15. Parker SJ, Harries SA. Phyllodes tumours. Postgrad Med J 2001;77:428-35.16. Liang MI, Ramaswamy B, Patterson CC, McKelvey MT, Gordillo G,
Nuovo GJ, et al. Giant breast tumors: Surgical management of phyllodes tumors, potential for reconstructive surgery and a review of literature. World J Surg Oncol 2008;6:117.
17. Cohn-Cedermark G, Rutqvist LE, Rosendahl I, Silfverswärd C. Prognostic factors in cystosarcoma phyllodes. A clinicopathologic study of 77 patients. Cancer 1991;68:2017-22.
18. Belkacemi Y, Bousquet G, Marsiglia H, Belkacémi YR, Bousquet G, Marsiglia H, et al. Phyllodes tumor of the breast. Int J Radiat Oncol Biol Phys 2008;70:492-500.
19. Chen WH, Cheng SP, Tzen CY, Yang TL, Jeng KS, Liu CL, et al. Surgical
treatment of phyllodes tumors of the breast: Retrospective review of 172 cases. J Surg Oncol 2005;91:185-94.
20. Ciatto S, Bonardi R, Cataliotti L, Cardona G. Phyllodes tumor of the breast: A multicenter series of 59 cases. Coordinating center and writing committee of FONCAM (National Task Force for Breast Cancer), Italy. Eur J Surg Oncol 1992;18:545-9.
21. Mangi AA, Smith BL, Gadd MA, Tanabe KK, Ott MJ, Souba WW. Surgical management of phyllodes tumors. Arch Surg 1999;134:487-92; discussion 492-3.
22. Keelan PA, Myers JL, Wold LE, Katzmann JA, Gibney DJ. Phyllodes tumor: Clinicopathologic review of 60 patients and fl ow cytometric analysis in 30 patients. Hum Pathol 1992;23:1048-54.
23. Kapali AS, Singh M, Deo S, Shukla NK, Muduly DK. Aggressive palliative surgery in metastatic phyllodes tumor: Impact on quality of life. Indian J Palliat Care 2010;16:101-4.
How to cite this article: Pati SS, Sahoo TK. Synchronous Bilateral Breast Benign Phyllodes Tumors in an Adolescent Female along with Depression: A Case Report. Int J Sci Stud 2016;4(1):298-301.
Source of Support: Nil, Confl ict of Interest: None declared.

302International Journal of Scientifi c Study | April 2016 | Vol 4 | Issue 1
Giant Vesical Calculus: A Rare Case ReportS Joseph1, Parth Nathwani1, Rajpal Singh Lamba1, Nitin Joshi2, Nandan Pujari3
1Resident, Department of Urology, MGM Medical College, Navi Mumbai, Maharastra, India, 2Professor & HOD, Department of Urology, MGM Medical College, Navi Mumbai, Maharastra, India, 3Associate Professor, Department of Urology, MGM Medical College, Navi Mumbai, Maharastra, India
hematuria with clots on and off since 6 months, and fever with chills since 2 days. The patient was investigated at a nursing home in the periphery, where ultrasonography (USG) abdomen revealed prostatomegaly likely to be a prostatic malignancy. So, the patient was referred from there to Tata Memorial Cancer Hospital. There on transrectal ultrasound revealed a large pelvic lesion with hyperechoic lesion measuring 10 cm × 8 cm, which was pushing urinary bladder anteriorly and with echoes within the bladder suggestive of cystitis, prostate appeared normal without any hypoechoic lesion of 26 g. Grayscale USG abdomen showed a 10 cm × 7 cm calculus in the bladder with changes of cystitis with left renal staghorn calculus (4.7 cm × 0.8 cm) with bilateral moderate hydroureteronephrosis. MRI pelvis showed a large intravesical calculus measuring 12 cm × 9 cm × 7 cm with mildly thickened bladder wall, with compression of the bilateral vesicoureteric junction and bilateral hydroureteronephrosis. Prostate and seminal vesicle were normal. So, the patient came to MGM Hospital, Kamothe where on examination there was an 11 cm × 7 cm hard fi xed immobile lump palpable in hypogastrium. On per rectal examination, there was hard nodular mass above prostate with fi rm grade 2 prostate. On routine investigation, hemoglobin - 12; thin layer chromatography - 11,740, urine routine showed occult blood 3+, protein 1+, 10-12 red blood cells, and 2-4 pus cells; creatinine - 1.8, sodium - 137; potassium - 5.2, serum calcium of 8 mg/dl. Urine culture was sterile. X-ray kidney, ureter, and bladder (KUB) (Figure 1)
INTRODUCTION
Bladder stones are the most common manifestation of lower urinary tract lithiasis, currently accounting for 5% of all urinary stone disease and approximately 1.5% of urologic hospital admissions. Bladder calculi in non-endemic areas are typically found in adults and almost always in association with other disease processes resulting in urinary stasis or the introduction of a foreign body. Primary bladder calculi are more common in children exposed to low protein, low phosphate diets. Primary bladder calculi rarely recur after treatment. Secondary bladder calculi are generally associated with bladder outlet obstruction.
CASE REPORT
A 48-year-old male patient residing at Karjat presented with complaints of dull aching pain in hypogastrium, with obstructive voiding symptoms such as poor stream, poor caliber of micturition, hesitancy and sense of incomplete evacuation, storage symptoms such as severe dysuria, urgency and frequency since 1 year, terminal painful
Case Report
Abstract
A vesical calculus weighing more than 100 g is considered to be a giant vesical calculus. Male preponderance for vesical calculi is well-known. Here, we report a 48-year-old male patient who presented to us with a giant vesical calculus of 700 g, which is quite rare. The stone was removed by open cystolithotomy. Although vesical stones are not rare but fi nding such a large vesical stone causing bladder outlet obstruction is extremely rare and causes a diagnostic dilemma. The purpose of presenting this case is that there are still rural places in India where basic medical facilities like ultrasound are not available leading to a delay in diagnosis and treatment of the patient.
Key words: Cystolithotomy, Urinary bladder, Vesical calculus
Access this article online
www.ijss-sn.com
Month of Submission : 02-2016Month of Peer Review : 03-2016Month of Acceptance : 03-2016Month of Publishing : 04-2016
Corresponding Author: Dr. Parth Nathwani, Flat No. 107, First Floor, Staff Quarters, MGM Hospital Campus, Kamothe, Sector 1, Navi Mumbai - 410 209, Maharashtra, India. Phone: +91-8652374289/`9819234207. E-mail: [email protected]
DOI: 10.17354/ijss/2016/239

Joseph, et al.: Giant Vesical Calculus
303 International Journal of Scientifi c Study | April 2016 | Vol 4 | Issue 1
revealed a large bladder stone with left renal staghorn calculus. Computed tomography-KUB was suggestive of 11 cm × 7 cm vesical calculus with left renal 4.8 cm staghorn calculus with bilateral moderate hydroureteronephrosis with grade 2 prostatomegaly.
The patient was catheterized to relieve his symptoms and was started on IV broad spectrum antibiotics as he had a fever with chills before surgery. In view of giant vesical calculus, suprapubic cystolithotomy was planned. A combined intra- and extra-peritoneal approach was taken as there were gross adhesions of the fundus with peritoneum due to repeated attacks of cystitis, through lower midline vertical incision. On exploration bladder was infl amed, stretched, and thin walled with gross adhesions to surrounding structures. After doing anterior cystostomy, there was a 13 cm × 10 cm × 8 cm yellowish-white hard bladder stone. Bladder stone was removed (Figure 2), wash given and bladder was closed in two layers after putting a 22 F suprapubic, 18 F per urethral catheter and a pelvic drain. Weight of the stone
was 700 gms. (Figure 3) Post-operative period was uneventful, and the patient was discharged on 7th post-operative day. Per urethral catheter was removed on the 10th day, suprapubic catheter was clamped and removed on the 12th day after checking his urine fl ow rate. Stone analysis revealed uric acid, triple phosphate, and calcium oxalate indicative of primary stone formation.
DISCUSSION
A giant vesical calculus more than 100 g is an unusual fi nding in urological practice.1-4 Giant vesical calculus are universally uncommon, and there are only a few case reports of stone weighing more than 500 g.2 Urinary bladder stone can be either primary or secondary. Most common causes include urinary tract infection due to bladder outlet obstruction leading to stasis, encrustation around a foreign body, neurogenic bladder, bladder diverticulum, and long-term catheterization.3 Urinary bladder stone constitute of 5% of all urolithiasis. Bladder stone are more common in males. Most vesical calculus is composed of triple phosphate, calcium carbonate, and calcium oxalate. It is thought that a giant vesical calculus develops from a nidus of infection or a single ureteric stone with progressive layerwise deposition of calcifi ed matrix. Bladder stones are often multilayered. Studies have shown that the bladder stone nucleus often does not contain struvite or calcium phosphate; however, subsequent concentric layers contain these substances only in large amount. Schwartz and Stoller indicated that infection may not be the inciting factor in stone formation but may also play a major role in further stone crystalization.3 In the era of laparoscopic and robotic surgery, the purpose of presenting this case is that there are still rural places in India where basic medical facilities such as ultrasound are not available leading to a delay in diagnosis and treatment of the patient.
Figure 1: X-ray kidney ureter bladder showing giant vesical calculus
Figure 2: Vesical calculus gross view
Figure 3: Vesical stone weighing 700 g

Joseph, et al.: Giant Vesical Calculus
304International Journal of Scientifi c Study | April 2016 | Vol 4 | Issue 1
ACKNOWLEDGMENT
I would like to thank my Head of the Department Dr. Nitin Joshi sir (Prof.) and Dr. Nandan Pujari sir (Asst. Prof.) for their constant support, guidance, and encouragement. Also, I would like to thank MGM Hospital and Medical College, Navi Mumbai for giving me this platform.
REFERENCES
1. Becher RM, Tolia BM, Newman HR. Giant vesical calculus. JAMA 1978;239:2272-3.
2. Rahman GA, Akande AA, Mamudu NA. Giant vesical calculi: Experience with management of two Nigerians. Niger J Surg Res 2005;7:203-5.
3. Schwartz BF, Stoller ML. The vesical calculus. Urol Clin North Am 2000;27:333-46.
4. Williams JP, Mayo ME, Harrison NW. Massive bladder stone. Br J Urol 1977;49:51-6.
How to cite this article: Joseph S, Nathwani P, Lamba RS, Joshi N, Pujari N. Giant Vesical Calculus: A Rare Case Report. Int J Sci Stud 2016;4(1):302-304.
Source of Support: Nil, Confl ict of Interest: None declared.

305 International Journal of Scientifi c Study | April 2016 | Vol 4 | Issue 1
Laparoscopic Distal Pancreatectomy for Serous Cystadenoma with Anomalous VasculatureDilip George1, S Saravanan2, Asha Reddy1, Narayanan Cunnigaiper Dhanasekhar3
1Resident, Department of General Surgery, Sri Ramachandra University, Chennai, Tamil Nadu, India, 2Associate Professor, Department of General Surgery, Sri Ramachandra University, Chennai, Tamil Nadu, India, 3Professor, Department of General Surgery, Sri Ramachandra University, Chennai, Tamil Nadu, India
Pancreatic cystic neoplasms account for 2% of all pancreatic neoplasms of which only 1% are malignant.1 They are usually picked up as incidental findings in imaging investigations. Pre-operative diagnosis still remains challenging. Imaging and fluid analysis often seems non-specifi c. Fine-needle aspiration cytology does not always yield diagnostic cells.
A 50-year old female presents with chronic abdominal pain for 5 years. Ultrasound abdomen revealed a pancreatic mass with features suggestive of cystadenoma. Contrast-enhanced computed tomography (CT) was done which showed an anomalous course of the splenic artery. A three-dimensional CT reconstruction (Figure 1)was used to trace the exact course and lie of the splenic artery, which showed it to be posterior and inferior to the pancreas, lying behind the course of the splenic vein. The patient was planned for laparoscopic distal pancreatectomy with the aid of the reconstructed image and underwent the same using high energy tissue sealing device (Figure 2). The spleen-preserving procedure could not be performed due to the posteroinferior and adherent course of the splenic artery. Post-operative period was uneventful. Histopathology confi rmed the mass (Figure 3) as serous cystadenoma of the pancreas with margins free. Subsequent follow-up was uneventful. This case is highlighted to show that laparoscopic distal pancreatectomy can be performed safely even in tricky situations providing careful evaluation, especially of vascular anomalies is done.
Case Pictorial
Access this article online
www.ijss-sn.com
Month of Submission : 02-2016Month of Peer Review : 03-2016Month of Acceptance : 03-2016Month of Publishing : 04-2016
Corresponding Author: Dr. Dilip George, Department of General Surgery, Sri Ramachandra University, Porur, Chennai - 600 116, Tamil Nadu, India. Phone: +91-9884424036. E-mail: [email protected]
DOI: 10.17354/ijss/2016/240
Figure 1: Computed tomography three-dimensional reconstruction of anomalous anatomy
Points to Ponder1. Rare reports of invasive growth2 and mass lesion
causing obstructive jaundice3 have been reported in serous cystadenoma of the pancreas and hence should be thought to have malignant potential and hence must be resected. Spleen-preserving distal pancreatectomy
Figure 2: Distal pancreatectomy with high energy tissue sealers

George, et al.: Laparoscopic Distal Pancreatectomy with Anomalous Vasculature
306International Journal of Scientifi c Study | April 2016 | Vol 4 | Issue 1
bleeding, more chance of splenic preservation, and overall less morbidity.4 Moreover, it provides better access to deeper reaches of the abdomen and in such cases having anomalous splenic artery, better visualization, and access are available to ideally tackle the tumor.
REFERENCES
1. Al-Jiffry BO, Rayzah F, Khayat SH. A disseminated variant of pancreatic serous cystadenoma causing obstructive jaundice, a very rare entity: A case report and review of the literature. BMC Res Notes 2014;7:749.
2. Limaiem F, Khalfallah T, Farhat LB, Bouraoui S, Lahmar A, Mzabi S. Pancreatic cystic neoplasms. N Am J Med Sci 2014;6:413-7.
3. Abe H, Kubota K, Mori M, Miki K, Minagawa M, Noie T, et al. Serous cystadenoma of the pancreas with invasive growth: Benign or malignant? Am J Gastroenterol 1998;93:1963-6.
4. Vijan SS, Ahmed KA, Harmsen WS, Que FG, Reid-Lombardo KM, Nagorney DM, et al. Laparoscopic vs open distal pancreatectomy: A single-institution comparative study. Arch Surg 2010;145:616-21.
should be the surgery of choice in ideal cases.2. Laparoscopic distal pancreatectomy is now being
done in advanced centers for its excellent patient acceptability, decreased hospital stay time, less
How to cite this article: George D, Saravanan S, Reddy A, Dhanasekhar NC. Laparoscopic Distal Pancreatectomy for Serous Cystadenoma with Anomalous Vasculature. Int J Sci Stud 2016;4(1):305-306.
Source of Support: Nil, Confl ict of Interest: None declared.
Figure 3: Specimen picture