General and Social Sector, Government of Rajasthan - CAG
175
-
Upload
khangminh22 -
Category
Documents
-
view
0 -
download
0
Transcript of General and Social Sector, Government of Rajasthan - CAG


Report of the
Comptroller and Auditor General of India
on
General and Social Sector
for the year ended 31 March 2018
Government of Rajasthan Report No. 4 of the year 2019
http://www.cag.gov.in

(i)
Table of Contents
Reference to
Paragraph Page
Preface - v
Chapter I
Introduction
About this Report 1.1 1
Profile of the Audited Entity 1.2 1
Authority for Audit 1.3 2
Planning and conduct of audit by Office of the Principal
Accountant General (General and Social Sector Audit),
Rajasthan, Jaipur
1.4 2
Significant audit observations 1.5 3
Response of the Departments to Performance Audits/
Compliance Draft Paragraphs
1.6 6
Inadequate response to audit observations 1.7 6
Follow-up on Audit Reports 1.8 7
Chapter II
Performance Audit
Food, Civil Supplies and Consumer Affairs
Department
Implementation of Public Distribution System under
National Food Security Act, 2013
2.1 9
School Education Department
Implementation of Rashtriya Madhyamik Shiksha
Abhiyan
2.2 41
Chapter III
Compliance Audit
Higher Education and Animal Husbandry
Departments
Loss to the contributors of New Contributory Pension
Scheme
3.1 71
Audit Report (G&SS) for the year ended 31 March 2018
(ii)
Reference to
Paragraph Page
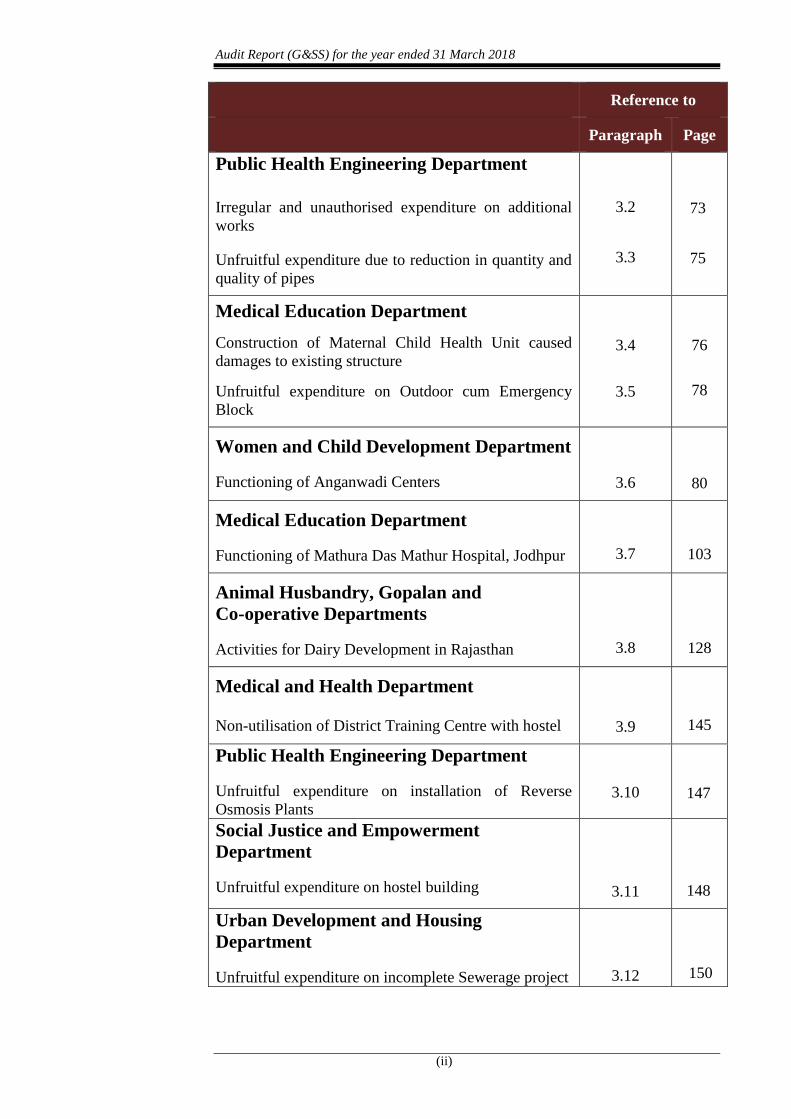
Public Health Engineering Department
Irregular and unauthorised expenditure on additional
works
Unfruitful expenditure due to reduction in quantity and
quality of pipes
3.2
3.3
73
75
Medical Education Department
Construction of Maternal Child Health Unit caused
damages to existing structure
Unfruitful expenditure on Outdoor cum Emergency
Block
3.4
3.5
76
78
Women and Child Development Department
Functioning of Anganwadi Centers
3.6 80
Medical Education Department
Functioning of Mathura Das Mathur Hospital, Jodhpur
3.7 103
Animal Husbandry, Gopalan and
Co-operative Departments
Activities for Dairy Development in Rajasthan
3.8
128
Medical and Health Department
Non-utilisation of District Training Centre with hostel
3.9
145
Public Health Engineering Department
Unfruitful expenditure on installation of Reverse
Osmosis Plants
3.10
147
Social Justice and Empowerment
Department
Unfruitful expenditure on hostel building
3.11
148
Urban Development and Housing
Department
Unfruitful expenditure on incomplete Sewerage project
3.12
150

Table of Contents
(iii)
Appendices
Page
Appendix 1.1 List of Departments 155
Appendix 1.2 Inadequate response to audit observations 156
Appendix 2.1 Statement showing salient features of the National Food Security
Act, 2013
157
Appendix 2.2 Statement showing detail of inclusion and exclusion categories in
Urban and Rural areas
158
Appendix 3.1 Statement showing loss occurred due to non-depositing of amount
with NSDL
160
Appendix 3.2 List of selected projects (CDPOs) and AWCs 163
Appendix 3.3 Statement showing the details of total Grants and expenditure
incurred during 2013-18 for dairy and livestock development
164
Appendix 3.4 Statement showing comparative analysis of performance of milk
unions established in seven divisional headquarters
165

(v)
PREFACE
This Report for the year ended 31 March 2018 has been prepared for
submission to the Governor of the State of Rajasthan under Article 151 of the
Constitution of India. This report contains three Chapters.
This Report relates to audit of the Social and General Sectors of the
Government departments conducted under provisions of the Comptroller and
Auditor General’s (Duties, Powers and Conditions of Service) Act, 1971 and
Regulations on Audit and Accounts 2007 issued thereunder by the
Comptroller and Auditor General of India. This report is required to be placed
before the State Legislatue under Article 151 (2) of the Constitution of India.
The instances mentioned in this Report are those, which came to notice in the
course of test audit during the period 2017-18 as well as those, which came to
notice in earlier years, but could not be reported in the previous Audit Reports;
instances relating to the period subsequent to 2017-18 have also been
included, wherever necessary.
The audit has been conducted in conformity with the Auditing Standards
issued by the Comptroller and Auditor General of India.


1
Chapter I
Introduction
1.1 About this Report
This Report of the Comptroller and Auditor General of India (C&AG) relates
to matters arising from Performance Audit of selected programmes and
activities and Compliance Audit of various Departments of Government of
Rajasthan (GoR).
Compliance Audit refers to examination of the transactions relating to
expenditure of the audited entities to ascertain whether the provisions of the
Constitution of India, applicable laws, rules, regulations and various orders
and instructions issued by competent authorities are being complied with. On
the other hand, performance audit also examines whether the objectives of the
programme/activity/department are achieved economically and efficiently.
The primary purpose of the Report is to bring to the notice of the State
Legislature, important results of Audit. Auditing Standards require that the
materiality level for reporting should be commensurate with the nature,
volume and magnitude of transactions. The findings of Audit are expected to
enable the Executive to take corrective actions and also to frame policies and
directives that will lead to improved financial management of the
organisations, thus, contributing to better governance.
This chapter, in addition to explaining the planning and extent of Audit,
provides a synopsis of the significant deficiencies in performance of selected
programme, significant audit observations made during the compliance audit
and follow-up on previous Audit Reports. Chapter-II of this report contains
findings arising out of performance audit of selected programme/
activity/departments. Chapter-III contains observations on the compliance
audit in Government Departments.
1.2 Profile of the Audited Entity
There are 49 Departments, 162 Autonomous Bodies (ABs) and 10 Public
Sector Undertakings (PSUs) under General and Social Sector of the
Government of Rajasthan, headed by Additional Chief Secretary/Principal
Secretaries/Secretaries, which are audited by the Principal Accountant General
(General and Social Sector Audit), Rajasthan, Jaipur. A list of the Departments
is given at Appendix 1.1.
The comparative position of expenditure incurred by the Government of
Rajasthan during 2015-16 to 2017-18 is given in Table 1

Audit Report (G&SS) for the year ended 31 March 2018
2
Table 1: Comparative position of expenditure
(` in crore)
Particulars 2015-16 2016-17 2017-18
Revenue expenditure
General services 31,016 39,203 43,450
Social services 43,349 49,371 53,064
Economic services 31,874 38,565 49,327
Grants-in-aid and
Contribution -* -** -***
Total 1,06,239 1,27,139 1,45,841
Capital and other expenditure
Capital Outlay 21,985 16,980 20,623
Loans and Advances
disbursed 36,602 12,965 1,334
Payment of Public Debt 4,959 5,015 11,674
Contingency Fund - -
Public Accounts
disbursement 1,40,432 1,48,885 1,47,088
Total 2,03,978 1,83,845 1,80,719
Grand Total 3,10,217 3,10,984 3,26,560
Source: Audit Reports on State Finances of the respective years.
* ` 10 lakh only. ** ` 6 lakh only, *** ` 11 lakh only.
1.3 Authority for Audit
The authority for Audit by the Comptroller and Auditor General of India
(C&AG) is derived from Articles 149 and 151 of the Constitution of India and
the CAG’s Duties, Powers and Conditions of Service (DPC) Act, 1971.
Principles and methodologies for various audits are prescribed in the
Regulations on Audit and Accounts, 2007 and the Auditing standards, 2017
issued by the CAG.
1.4 Planning and conduct of audit by office of Principal
Accountant General (General and Social Sector Audit),
Rajasthan, Jaipur
The Office of the Principal Accountant General (General and Social Sector
Audit), Rajasthan conducts audit of Government Departments/
Offices/Autonomous Bodies/PSUs/Institutions under the General and Social
Sector under the directions of the C&AG. During 2017-18, financial,
performance and compliance audits of the selected units under various General
and Social Sector Departments, Autonomous Bodies (except Panchayati Raj
Institutions and Urban Local Bodies), PSUs and externally-aided projects of
the GoR were conducted by audit teams of the office of Principal Accountant
General (General and Social Sector Audit), Rajasthan, Jaipur.
The audit process starts with an assessment of risk exposure of various
Government Departments/Organisations/Autonomous Bodies and schemes/
projects, etc. Risk assessment is based on expenditure, criticality/complexity
of activities, level of delegated financial powers, assessment of overall internal
controls and the concerns of stakeholders. Audit findings during previous
years are also considered in this exercise.

Chapter 1 Introduction
3
After completion of audit of each unit, Inspection Reports containing audit
findings are issued to the Heads of the units/departments with the request to
furnish replies on audit findings, within one month of receipt of the Inspection
Report. When the replies are received, audit findings are either settled or
further compliance is advised. The important audit observations arising out of
these Inspection Reports are processed for inclusion in the Audit Reports.
To carry out audit of 1,424 out of the 20,689 units of General and Social
Sector Departments, 8,679 audit party days (for financial audit, compliance
audit and performance audit) were used during 2017-18. The audit plan
covered those units/entities, which were vulnerable to significant risk, as per
the risk assessment.
1.5 Significant audit observations
During the last few years, audit has reported several significant deficiencies in
implementation of various programmes/activities as well as the quality of
internal controls in selected departments through performance audits, which
had impacted the success of programmes and functioning of the departments.
Similarly, the deficiencies noticed during compliance audit of the government
departments/organizations were also reported.
The current report brings out deficiencies in critical areas which impact the
effectiveness of functioning of programmes/activities of the Departments. The
significant areas of concern requiring corrective action are discussed below:
1.5.1 Performance audit of programmes/activities of departments
Chapter II of this report contains reports of two performance audits viz.
‘Implementation of Public Distribution System under National Food Security
Act, 2013’ and ‘Implementation of Rashtriya Madhyamik Shiksha Abhiyan’.
Brief summaries of the Performance Audits are discussed in the following
paragraphs:
1.5.1.1 Implementation of Public Distribution System under National
Food Security Act, 2013
The National Food Security Act (NFSA) 2013 was enacted in September 2013
in order to provide subsidised foodgrains to eligible beneficiaries under two
categories i.e. to Antyodaya Anna Yojana (AAY) Households and Priority
Households. The objective of the performance audit was interalia to assess
whether the identification of beneficiaries were as per rules and whether
management of foodgrains was efficient and effective. Summary of the audit
findings are given in paragraph 2.1 of this report. Some of the significant
audit findings include failure to conduct survey to identify beneficiaries
resulting in coverage in excess of the ceiling prescribed by GoI, non viability
of fair price shops due to minimal income and absence of automated system
resulting in poor monitoring and weak internal control.
(Paragraph 2.1)

Audit Report (G&SS) for the year ended 31 March 2018
4
1.5.1.2 Implementation of Rashtriya Madhyamik Shiksha Abhiyan
Government of India (GoI) launched Rashtriya Madhyamik Shiksha Abhiyan
(RMSA) in March 2009 to make good quality education available, accessible
and affordable to all young persons in the age group of 14-18 years. The
objective of the performance audit was interalia to assess the accessibility of
secondary/higher secondary schools within the prescribed distance of 5 kms,
availability of required infrastructure, teachers and textbooks as per norms and
the extent of achievement of the targets of enrolments, transition rate and
retention rate. Summary of the audit findings are given in paragraph 2.2 of
this report. Some of the significant audit findings include non accessibility of
secondary schools to 22.55 per cent habitations, non availability of minimum
five subject teachers and basic infrastructure facilities in schools, huge
shortfall in trainings to teachers and delay in distribution of free text books.
(Paragraph 2.2)
1.5.2 Significant audit observations during compliance audit
Audit observed significant deficiencies in critical areas, which impact the
effectiveness of the GoR. Some important findings of compliance audit
paragraphs have been reported in Chapter III. The major observations are as
follows:
Loss of ` 3.49 crore to the subscribers of New Contributory Pension Scheme
under Animal Husbandry and Higher Education Departments due to keeping
funds in saving account and delay in transferring the contributions to National
Securities Depository Limited.
(Paragraph 3.1)
Irregular and unauthorised expenditure of ` 7.15 crore incurred by PHED on
execution of additional works in contravention of financial rules.
(Paragraph 3.2)
Unjustified reduction in quantity and quality of pipes in PHED with an
intention to limit the value of sanction within the competency of Additional
Chief Engineer led to non-commissioning of Over Head Service Reservoirs
for more than three years and rendered expenditure of ` 0.94 crore unfruitful.
Besides, not achieving intended objective of providing drinking water to
habitations.
(Paragraph 3.3)
In Medical Education Department, construction of Maternal Child Health unit
above first floor of old hospital building at Government Pannadhaya Hospital,
Udaipur without ensuring structural safety, resulted in structural damages to
the whole building and unfruitful expenditure of ` 10.47 crore.
(Paragraph 3.4)

Chapter 1 Introduction
5
Expenditure of ` 3.67 crore in Medical Education Department on construction
of Outdoor cum Emergency Block at Umaid Hospital, Jodhpur remained
unfruitful due to improper planning and leaving the incomplete structure of no
use.
(Paragraph 3.5)
Functioning of Anganwadi Centres
Anganwadi Centres are the first outpost for delivery of supplementary
nutrition, pre-school education and other services under the Integrated Child
Development Services (ICDS) programme to children in the age group of 6
months to 6 years, pregnant women and lactating mothers. The objective of
the thematic audit was inter alia to assess regular and effective delivery of
services by AWCs. A summary of audit findings are given in Paragraph 3.6
of this report. Some of the significant audit findings include deficiencies in
planning, availability of infrastructure, equipment and manpower and lack of
regular supervision.
(Paragraph 3.6)
Functioning of Mathura Das Mathur Hospital, Jodhpur
Mathura Das Mathur (MDM) Hospital, Jodhpur is the largest hospital in the
western region of Rajasthan providing referral and tertiary healthcare
services. A thematic audit was conducted with a view to assess the quality of
inputs, efficiency and outcomes of the hospital processes. A summary of
audit findings are given in paragraph 3.7 of this report. Some of the
significant audit findings include the augmentation of its facilities was not
commensurate to the increasing load of patients, Operation Theaters (OTs),
Intensive Care Units (ICUs) and wards suffered from many infrastructural
deficiencies, beneficiaries were deprived of free drugs, due to insufficient
resources, various important hospital services like number of OPD days in a
week, consultation time per patient and diagnostic services suffered.
(Paragraph 3.7)
Activities for Dairy Development in Rajasthan
Rajasthan is the second largest livestock population and milk production in the
country has huge potential for development of dairy sector. The objective of
the thematic audit was to examine the efficiency and effectiveness of the
schemes/activities implemented for dairy development in the state over the
period 2013-18. A summary of the audit findings are given in paragraph 3.8
of this report. Some of the significant audit findings include GoR did not
provide necessary financial support for dairy development and the
development of the sector was mainly dependent on RCDF and its milk
unions, no market survey was carried out either by GoR or RCDF for
increasing procurement, processing and marketing of milk, RCDF and the
milk unions did not expand their capacities for processing of milk despite the
potential for development of dairy sector. RCDF’s execution and monitoring
Audit Report (G&SS) for the year ended 31 March 2018
6
of dairy sector schemes and its internal control mechanisms were also
inadequate.
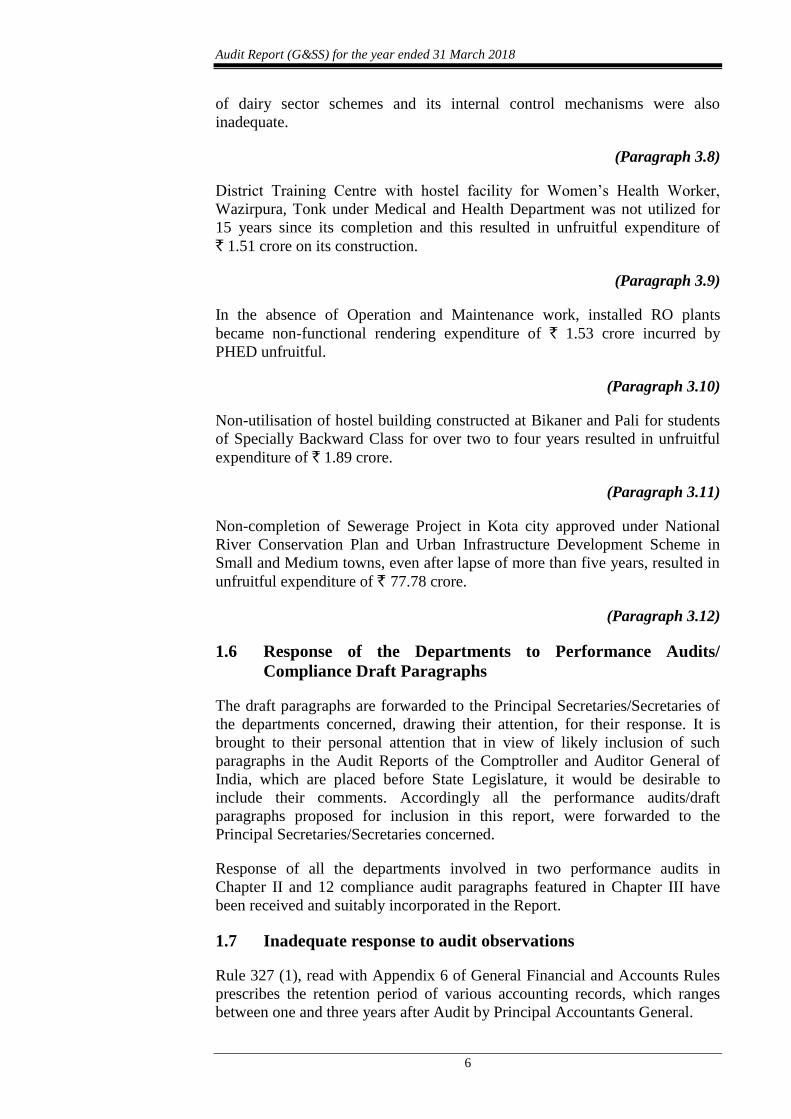
(Paragraph 3.8)
District Training Centre with hostel facility for Women’s Health Worker,
Wazirpura, Tonk under Medical and Health Department was not utilized for
15 years since its completion and this resulted in unfruitful expenditure of
` 1.51 crore on its construction.
(Paragraph 3.9)
In the absence of Operation and Maintenance work, installed RO plants
became non-functional rendering expenditure of ` 1.53 crore incurred by
PHED unfruitful.
(Paragraph 3.10)
Non-utilisation of hostel building constructed at Bikaner and Pali for students
of Specially Backward Class for over two to four years resulted in unfruitful
expenditure of ` 1.89 crore.
(Paragraph 3.11)
Non-completion of Sewerage Project in Kota city approved under National
River Conservation Plan and Urban Infrastructure Development Scheme in
Small and Medium towns, even after lapse of more than five years, resulted in
unfruitful expenditure of ` 77.78 crore.
(Paragraph 3.12)
1.6 Response of the Departments to Performance Audits/
Compliance Draft Paragraphs
The draft paragraphs are forwarded to the Principal Secretaries/Secretaries of
the departments concerned, drawing their attention, for their response. It is
brought to their personal attention that in view of likely inclusion of such
paragraphs in the Audit Reports of the Comptroller and Auditor General of
India, which are placed before State Legislature, it would be desirable to
include their comments. Accordingly all the performance audits/draft
paragraphs proposed for inclusion in this report, were forwarded to the
Principal Secretaries/Secretaries concerned.
Response of all the departments involved in two performance audits in
Chapter II and 12 compliance audit paragraphs featured in Chapter III have
been received and suitably incorporated in the Report.
1.7 Inadequate response to audit observations
Rule 327 (1), read with Appendix 6 of General Financial and Accounts Rules
prescribes the retention period of various accounting records, which ranges
between one and three years after Audit by Principal Accountants General.

Chapter 1 Introduction
7
Failure of the departmental officers to furnish compliance of the audit
observations in Inspection Reports (IRs) results in non-settlement of IR
paragraphs. As on 31 March 2018, there were 7,622 numbers of IRs
containing 28,336 numbers of paragraphs, issued during the period from
1993-94 to 2017-18 (upto September 2017) which were pending for
settlement. Year-wise pendency is shown in Table 2.
Table 2
Year IRs Paragraphs
Upto 2010-11 2,355 5,813
2011-12 730 2,300
2012-13 731 2,737
2013-14 1,031 3,632
2014-15 978 3,788
2015-16 836 3,852
2016-17 800 5,106
2017-18 (upto September 2017) 161 1,108
Total 7,622 28,336
For early settlement of outstanding paragraphs in IRs, GoR issued (August
1969) instructions to all the departmental officers for sending first reply to IRs
within a month and replies to further audit observations within a fortnight.
These instructions have been reiterated from time to time. The instructions
issued in March 2002 envisaged appointment of nodal officers and
Departmental Committee in each of the Administrative Department for
ensuring compliance to all the matters relating to audit.
Detailed analysis of IRs issued to three Departments was carried out to study
the pendency of responses to the paragraphs brought out in the IRs. Analysis
of the IRs of various units of the Agriculture Department (269 IRs),
Elementary Education Department (568 IRs) and Medical Education
Department (170 IRs) revealed that 4,096 paragraphs pertaining to 1,007 IRs
were outstanding as on 31 March 2018. Category-wise details of irregularities
commented in IRs is given in Appendix 1.2.
1.8 Follow-up on Audit Reports
The Finance Department of the GoR decided (December 1996) that Action
Taken Notes (ATNs) on all paragraphs/reviews that have appeared in Audit
Reports be submitted to the Public Accounts Committee, duly vetted by Audit,
within three months from the date of laying of the Reports in the State
Legislature. A review of the outstanding ATNs on paragraphs/performance
audits included in the Reports of the Comptroller and Auditor General of India
pertaining to various Departments as on 05 March 2019 revealed that
14 ATNs1 were pending from the concerned Departments.
1. Paragraphs 1.2.3, 1.2.4, 1.4.5, 2.3.6.1, 2.5, 3.2, 3.3 and 3.5 of the Audit Report (State
Finances) 2016-17 and paragraphs 2.1, 3.3, 3.12, 3.13, 3.14 and 3.15 of the Audit Report
(G&SS) 2016-17.


9
Chapter-II
Performance Audit
This Chapter presents the Performance Audits of ‘Implementation of Public
Distribution System under National Food Security Act, 2013’ and
‘Implementation of Rashtriya Madhyamik Shiksha Abhiyan’.
Food, Civil Supplies and Consumer Affairs Department
2.1 Implementation of Public Distribution System under National
Food Security Act, 2013
Executive Summary
Food security intervention by distributing subsidised foodgrains to eligible
beneficiaries through Public Distribution System is one of the important
interventions by both Central and State Governments in the social sector. To
achieve this objective, National Food Security Act (NFSA), 2013 was enacted
in September 2013 to provide wheat at subsidized prices of ₹ 2 per kg to
eligible beneficiaries under two categories i.e. to Antyodaya Anna Yojana
(AAY) Households and Priority Households. The Act came into effect in
Rajasthan from 2 October 2013. Maximum ceiling of population coverage
under NFSA, based on ‘Households Consumption Expenditure Survey (2011-
12) for each state was decided by the Government of India (GoI). The
responsibility to identify the eligible beneficiaries vested with the State as per
their own criteria. A Performance Audit of implementation of Public
Distribution System under NFSA, 2013, conducted in seven test checked
districts for the period from October 2013-March 2018 revealed following
significant audit findings.
Government of Rajasthan (GoR) neither conducted any survey for
identification of beneficiaries nor prescribed any rules and guidelines to
implement the scheme. Further, it neither reviewed the eligibility of
beneficiaries at regular intervals nor utilize the Bhamashah camps for doing
so. As a result, GoR continued to have coverage in excess of what was
prescribed by GoI for two years. Besides there were 65 lakh (47.10 per cent)
bogus Ration Cards in the State as on March 2018. Despite this, Food, Civil
Supplies & Consumer Affairs Department (FCS&CAD) did not organize any
special drives to eliminate these bogus RCs.
No norms were prescribed for monitoring the quality of foodgrains and stack
wise samples were not being collected from Food Corporation of India,
wholesalers and Fair Price Shops (FPSs) for comparison. The viability of
FPSs could not be ensured as 65 per cent of FPSs were earning a monthly
income of less than ` 6,400. Further, no efforts were taken by FCS&CAD to
distribute food coupons to 33,271 identified beneficiaries who were not able to
collect foodgrains by visiting FPSs.

Audit Report (G&SS) for the year ended 31 March 2018
10
Computerization of the supply chain management process was not initiated
despite availability of funds of ₹ 16.90 crore. As a result, there was no real
time monitoring of allotment of wheat to Kraya Vikraya Sahakari
Samitis/wholesalers, quantity available with them and supply to FPSs. Despite
Aadhar/Bhamashah numbers being unique and distribution of wheat through
Aadhar enabled Point of Sale was supposed to be fool proof, they were linked
with multiple Ration Cards (RCs) leading to duplication and pilferage.
Control-checks necessary for an automated system with respect to feeding
data on the PDS database were not adopted leading to errors in the data
entered and reports hosted on the department’s website.
State Food Commission was not made operational. Though District Grievance
Redressal Officers were made functional from December 2017, no cases were
found registered with them in the test checked districts. As a result, aggrieved
persons had to move their cases before the court. State level Vigilance
Committee (VC) was not formed. Further, though VCs were formed in 20 out
of 33 districts (61 per cent), 178 out of 244 blocks (73 per cent) and 10,638
out of 26,303 FPSs (40 per cent), they were not functioning effectively.
These deficiencies coupled with ineffective grievance redressal mechanisms,
lack of regular inspections, non-existent internal and social audit resulted in
weaknesses in the Public Distribution System. GoR should take expedient
measures to address all the deficiencies in order to streamline the PDS and to
make it efficient and achieve food security in the state.
2.1.1 Introduction
To ensure food security, distribution of subsidized foodgrains to eligible
beneficiaries through Public Distribution System1 (PDS) is one of the most
important interventions by both Central and State Governments in the social
sector. It is one of the biggest contributors (53 per cent) to Government of
India’s (GoI) subsidy bill of ` 2.64 lakh crore (2017-18). GoI fulfills the
objective of food security jointly with State Governments by distributing
subsidized food to eligible beneficiaries through PDS. The Food Corporation
of India (FCI) is the nodal agency at central level for procurement and
transportation of foodgrains to its godowns situated in a State. GoI procures
foodgrains from farmers at Minimum Support Price (MSP) and sells to the
States at Central Issue Price (CIP) of ₹ 2 per kg. The difference between the
MSP and the CIP is reimbursed to the FCI by the GoI as Food Subsidy.
Food, Civil Supplies & Consumer Affairs Department (FCS&CAD) of
Government of Rajasthan (GoR) is responsible for lifting foodgrains from
godowns of FCI and transporting it to each Fair Price Shop (FPS) across the
State. Rajasthan State Food and Civil Supplies Corporation (RSFCSC), is the
nodal agency for intermediate storage and transporting the foodgrains upto
FPSs within the State. For implementation of the scheme, GoR is also required
to formulate and implement foolproof arrangements for identifying the poor,
1 A network of Fair Price Shops, the last mile delivery points for distributing foodgrains.
They function under the administrative control of Food, Civil Supplies & Consumer
Affairs Department and are licensed & regulated under the PDS (Control) order, 2001.

Chapter II Performance Audit
11
issue Ration Cards (RCs), maintain database and implement the reforms in
PDS in consonance with the National Food Security Act, 2013 (NFSA).
2.1.2 National Food Security Act, 2013 and PDS (Control) Orders
The Parliament enacted the National Food Security Act, 2013 in September
2013, which came into effect from 2 October 2013 in Rajasthan. The
enactment marked a shift in the ‘right to food’ as a legal right rather than just
a general entitlement. The Act relies largely on the existing PDS to deliver
foodgrains as legal entitlements to poor households. It also retained the earlier
scheme of Antyodaya Anna Yojana (AAY launched in 2000) through which
poorest segments of the population were eligible for 35 kgs of foodgrains at
₹ 1/kg. Other salient features of the Act are given in Appendix 2.1.
The Targeted Public Distribution System (TPDS) (Control) Order, 2015 was
notified (20 March 2015) by GoI in order to bring the earlier PDS (Control)
Order of 2001 in consonance with the NFSA. The new order contained revised
provisions for identification of beneficiaries, transparency & accountability,
grievance redressal mechanism and digitization of beneficiary, ration card &
other database.
Under clause 3 of the TPDS (Control) Order, 2015, the maximum ceiling of
percentage coverage of eligible households under the Priority Households2
(PHHs) was specified as 69.09 per cent and 53 per cent to rural and urban
areas of Rajasthan respectively. Accordingly, maximum 4.46 crore (3.56 crore
rural and 0.90 crore urban) population of the State could be covered. The
number of Antyodaya households was also fixed at a maximum of 9,32,100
families. It also fixed the ceiling of allotment of wheat to Rajasthan at 27.92
lakh MT.
The details of total allotment of wheat by GoI and off-take thereof by GoR
during 2013-18 are given in Table 1 below:
Table 1
(Quantity in lakh MT)
Year Wheat
allotment
Off-take of
wheat by GoR
Un-lifted quantity out
of the allotted quantity
2013-14
(From October 2013)
13.96 13.24 0.72
2014-15 27.92 27.67 0.25
2015-16 27.92 27.04 0.88
2016-17 27.92 25.73 2.19
2017-18 23.15 22.15 1.00
Total 120.87 115.83 5.04
Source: Information provided by the Department
2 A category determined under NFSA, eligible to receive 5 kgs per person per month of
foodgrains.

Audit Report (G&SS) for the year ended 31 March 2018
12
2.1.3 Organizational set-up
Secretary, Food, Civil Supplies and Consumer Affairs Department
(FCS&CAD), is the administrative head of the department, responsible for
overseeing the activities of PDS at the Government level. The Secretary also
acts as Commissioner, FCS&CAD and ex-officio Chairperson of RSFCSC.
The Commissioner is assisted by Additional Food Commissioner (AFC), two
Deputy Commissioners and one Assistant Commissioner in the
Commissionerate and three General Managers in RSFCSC. At the District
level, the scheme is implemented by the District Collectors (DCs) with the
assistance of District Supply Officer (DSOs) and Manager, Civil Supplies
(MCSs) of RSFCSC through a network of 26,303 FPSs (March 2018) spread
across the State.
2.1.4 Audit Objectives
The Objectives of the Performance Audit were to assess:
1. Whether system for identification of different categories of beneficiaries
and issue of ration cards were as per rules and was effective;
2. Whether management of foodgrains distribution was efficient and
effective so as to ensure that all eligible households had access to
foodgrains in time at prescribed rate, quality and quantity;
3. Whether reforms in TPDS as envisaged under NFSA were effectively
implemented by the State Government; and
4. Whether the internal control systems for monitoring and grievance
redressal was adequate and effective.
2.1.5 Audit criteria
The Performance Audit was conducted against the criteria derived from the
following documents:
NFS Act, 2013 and notifications issued by GoI from time to time and
Supreme Court’s orders, wherever applicable.
Provisions of PDS (Control) Order, 2001 and TPDS (Control) Order
2015;
Orders/Circulars/Notifications and Guiding principles issued by GoI for
identification of beneficiaries and issuance of ration cards; and
Annual Progress Reports and Data uploaded on the departmental web
site (www.food.raj.nic.in) ;
2.1.6 Audit Scope, Methodologyand Sampling
The Performance Audit was carried out during April-September 2018,
covering the period from October 2013-March 2018. The test check of records
of the offices of AFC, DSOs of FCS&CAD and Managing Director & MCSs

Chapter II Performance Audit
13
of RSFCSC was conducted. For test check, seven districts3 taking one district
from each administrative region of the state were selected by using simple
random sampling method with size measure as total quantity of foodgrains
allotted to districts during 2016-17. Further, 29 blocks4 (two urban and two
rural blocks from each selected district) were selected by using same method
and size measure. In each selected ward/block, four FPSs were selected (total
114 FPSs) by using same method. In districts where wholesalers like Kray
Vikray Sahakari Samiti (KVSS) were involved in transporting and supply of
foodgrains to FPSs, they were also examined.
Data (dump data) of PDS for the period 2016-18 obtained from Department of
Information Technology and Communication (DoIT) was also analysed in
audit. Apart from these, joint inspection of FPSs was conducted with
departmental officials. An entry conference with Secretary, FCS&CAD was
held on 8 May 2018 to discuss the Audit objectives, Scope and Methodology
with the department. The exit conference was held on 5 December 2018 and
responses of the GoR have been taken into consideration while drafting the
report.
Audit Findings
Audit Objective 1: Whether system for identification of different
categories of beneficiaries and issue of ration cards
were as per rules and was effective.
2.1.7 Identification of Beneficiaries
2.1.7.1 Survey for identification of Priority Households (PHH) not
conducted
Post implementation of NFSA, GoI froze the pre-existing figures of
Antyodaya Anna Yojana5 households in each state and re-emphasized its
commitment to safeguard the entitlement of this category at 35 kg of
foodgrains per household each month. In Rajasthan also, the existing 9.32 lakh
AAY households were allowed to be carried forward as AAY upon
implementation of NFSA. GoI also fixed the total population to be covered
under PHH in Rajasthan at 4.46 crore (3.56 crore rural and 0.90 crore urban).
In order to identify beneficiaries, GoR had to undertake the process of
identification of beneficiaries as per Section 10(1) (b) of NFSA by July 2014.
Clause 3 (9) of TPDS (Control) Order, 2015 envisaged that the State
Government shall use the list of persons as compiled during Socio Economic
Caste Census (SECC)6 or any other authentic source of data to cross check and
verify the list of eligible households and their members.
3 Ajmer, Alwar, Baran, Bharatpur, Churu, Jodhpur and Udaipur. 4 Kishanganj block in Baran district was also selected to cover tribal population. 5 Antyodaya Anna Yojana is a GoI sponsored PDS scheme launched by GoR on 25
December 2000 to provide highly subsidised food to poorest families. 6 Using automatic exclusion/inclusion criteria and deprivation criteria. Ranking of
households under SECC was made on the basis of different parameters related to income
i.e. salaried job, income tax payer, monthly income less than ₹ 5,000, between ₹ 5,000
and ₹ 10,000, more than ₹ 10,000.

Audit Report (G&SS) for the year ended 31 March 2018
14
It was observed that a fresh survey was not conducted for identification of
beneficiaries under PHH category. In the absence of any fresh survey and
failure to use the available SECC data based on the census conducted by GoI
during 2011, resulted in the list of PHHs being prepared by merely subsuming
all categories of beneficiaries entitled for PDS under different schemes/
categories existing prior to launching of NFSA. This included classifications
of beneficiaries under Below Poverty Line (BPL) category (18,27,152
families), Below Poverty Line (State) category (SBPL)7 (11,24,245 families),
Above Poverty Line category (APL) (1,07,96,720 families) and Annapurna8
(1,05,293 families). This resulted in GoR including 5.16 crore population
(September 2013) under PHH which exceeded the ceiling of 4.46 crore set by
GoI by 69.54 lakh.
Failure to conduct the survey and issue detailed guidelines and methodology
resulted in GoR taking more than one year i.e. till October 2015 to eliminate
the excess coverage and reduce beneficiaries to the ceiling level fixed by GoI.
Audit also observed that the average distribution of wheat to rural PHHs in
Ajmer district reduced to 2.26 to 4.70 kgs in place of entitlement of 5 kgs per
person as a result of not reducing the number of PHHs beneficiaries for two
years (October 2013 to October 2015).
GoR stated (December 2018) that survey was not conducted in order to
implement the NFSA on time in the state. In order to tackle the resultant
excess, it was decided to verify the list of beneficiaries in the Bhamashah9
camps. Further, SECC data could not be utilized as it was not available at that
time and it did not have income related classification. Lastly, the list of
beneficiaries was also shared publicly, objections were received and the list
was refined accordingly. The reply is not tenable as the list of beneficiaries
was neither reviewed regularly nor verified in the Bhamashah camps as
pointed out in Paragraph 2.1.7.4. Moreover, the Principal Secretary also
instructed in January 2015 to utilize SECC data for deciding inclusion and
exclusion under NFSA.
2.1.7.2 Non preparation of guidelines for identification of Priority
Households (PHHs)
Section 40 (1) of NFSA stipulated that the State Government may, by
notification make rules to carry out the provisions of the Act and Section 40
(2) (a) ibid also stipulated that guidelines be prepared for identification of
7 State Below Poverty Line category was formed by the GoR for accommodating those
families who lost their BPL status in BPL survey conducted by GoI in 2002. 8 The Annapurna Scheme aims at providing food security to meet the requirement of those
senior citizens who though eligible have remained uncovered under the National Old
Age Pension Scheme. 9 Bhamashah Yojana was introduced by GoR in 2014 for financial empowerment of
women and for unified direct benefits transfer in a transparent manner. Under this
scheme, a unique Bhamashah ID number was given to women head of household and all
the departments had to link their welfare scheme database (PDS database in this case)
with Bhamashah data hub.

Chapter II Performance Audit
15
PHH as laid down under Section 10(1) of NFSA. The rules and guidelines
were to be laid before the State Legislature.
It was observed that no such rules and guidelines were prepared and laid
before the State Legislature by GoR in order to implement the provisions of
the Act. However, GoR issued (July 2014) a comprehensive guidelines to
rectify the errors occurred during preparation of list of beneficiaries and RCs
thereof.
GoR stated (December 2018) that the task force10 was constituted for deciding
inclusion/exclusion categories through which categories of beneficiaries were
reviewed regularly and new categories were included from time to time. The
fact remains that GoR neither prepared detailed rules/guidelines for
implementation of PDS under NFSA nor adopted guidelines issued by Chief
Secretary.
2.1.7.3 Frequent changes in exclusion-inclusion criteria and lack of
mechanism to verify beneficiaries against these criteria
As per section 10 of NFSA, the State Government was required to prepare
guidelines and identify priority households within the number of persons
determined under NFSA. GoR initially finalized (August 2013) 27 and 26
categories for inclusion and seven and five categories for exclusion in urban
and rural area respectively. Thereafter in November 2015, 13 new categories
were identified for inclusion of beneficiaries in urban and rural areas. Of this,
nine categories were deleted in January 2016 through a notification. Further,
seven categories were added in April 2018, out of which three categories had
already been included in November 2015 and deleted in January 2016. The list
of inclusion-exclusion categories as on August 2013 are given in
Appendix 2.2. The reasons for frequent changes of inclusion and exclusion
categories were not found on record.
GoR accepted the facts and stated (December 2018) that the reason for
initially including and later excluding categories was that it was leading to
exceeding of the ceiling prescribed by GoI. The reply is not acceptable as the
categories included (in November 2015) and later excluded formed only a
minor proportion and they belonged to socio-economically weaker sections as
evidenced by the fact that the three categories were added again by GoR in
April 2018.
2.1.7.4 No follow-up on State Government’s directions
NFSA defines the joint responsibility of the Centre and States/UTs. While the
Centre is responsible for allocation, transportation and delivery of required
food-grains to States/UTs, the States/UTs are responsible for effective
implementation of the Act, which inter-alia includes identification of eligible
households, issuing RCs to them, distribution of food-grains entitlements to
eligible households through FPSs.
10 Task force was constituted under chairmanship of Chief Secretary, GoR to identify
inclusion and exclusion categories under NFSA.

Audit Report (G&SS) for the year ended 31 March 2018
16
Since the NFSA marks a paradigm shift in the approach to food security
from a welfare to a rights based approach, the implementation and execution
of a well-planned process for accurate identification of legitimate and eligible
beneficiaries forms the core element of a successful and fair PDS. Following
the transformative agenda of the NFSA, the GoR had expeditiously issued11, at
the highest bureaucratic level of the State viz. the Chief Secretary12, a Circular
in July 2014 in the form of an exhaustive advisory/executive order for
identification of the beneficiary. The GoR circular consisted of 15 point
Guidelines and 12 Annexures for compliance by the Principal Secretary and
other functionaries heading the respective State departments in charge of the
implementation of the specific scheme.
This circular served as a detailed template and listed inter alia the following
crucial objectives, features and aspects of implementation of the PDS and
essential direct benefit transfer procedures.
A single-point, one-time survey for selection of beneficiaries was advised
(point no. 7) for correct identification of eligible beneficiaries and rectifying
defects that could have crept in during the past surveys. It also aimed at
avoiding repeated surveys for verification of beneficiary particulars and
criteria under the various schemes that have been or will be launched in the
future. These aims were to be achieved through a series of camps that were to
be set up for supervised, public and one-time identification of eligible
beneficiaries and for one-point of service (Annexure 1 of the Circular
ibid). Appropriate directions were to be issued by the FCS&CAD for
implementing the above points of the circular. Scrutiny of records revealed the
following:
(i) Failure to use Camps for Beneficiary Verification
The GoR circular also required that the FCS&CAD officers would
compulsorily attend these camps to verify the eligibility of beneficiaries under
NFSA. Thus it was for the formations subordinate to the State Government to
take the circular forward for its effective implementation.
It was observed that there were serious lacunae, omissions and non-
compliance with the Act and GoR guidelines. While the Guidelines and the
point-wise directions in it issued by the GoR at the apex level had established
a sound framework, no further operational order or enabling actions had been
11 The GoR order, in fact anticipated many of the salient features that were subsequently
referred in the TPDS (Control Order) 2015. The clause 3 (10) of ibid order provides that the State Government shall prescribe the detailed procedure for finalisation of the list of eligible households covering, inter alia, aspects like the process of drawing up of draft list, putting the draft list in the public domain including reading out of the list in meetings of the Gram Sabha or equivalent body in urban areas, inviting objections, disposal of objections, appeals and so on.
12 Point 1 to 3 of GoR circular (2014) states that, in 2008, the State of Rajasthan had introduced comprehensive procedures and processes for effecting an error-free data hub and thereby a transparent, fool-proof ‘financial inclusion’ as well as speedy delivery of benefits to legitimate beneficiaries, for use in various welfare schemes in the State. However no further action was taken to execute the provisions under this scheme during the intervening years upto 2014. The GoR circular of 2014 was issued to reiterate and update the provisions of the 2008 scheme and to lay down the detailed procedures for fool-proof implementation of the NFSA 2013.

Chapter II Performance Audit
17
issued or undertaken for effectively propagating them at the State, district and
panchayat levels.
No further follow-up was taken in pursuit of the intent of the state
Government. No action also is seen to have been taken on the instructions for
beneficiary authentication. There appears to be a perfunctory approach on the
part of the FCS&CAD in the implementation of the beneficiary identification
programme.
(ii) Non-verification of NFSA beneficiaries:
As per clause 3 (13) of the subsequent TPDS (Control) Order, 2015, annual
review for weeding out ineligible beneficiaries and for inclusion of fresh
eligible beneficiaries was required to be conducted in every district. The
verification of beneficiaries was also required to be done as per procedure laid
down in Chief Secretary’s circular.
It was observed that in five of the seven test checked districts13, only one
review was conducted in each district during four years (January 2015 to July
2018) as against prescribed annual review. In other two districts of Bharatpur
and Udaipur, the information was not furnished. Further, the verification of
NFSA beneficiaries was also not done in the 9,286 Bhamashah camps
organized upto December 2014 during which 1.50 crore beneficiaries were
enrolled for the scheme.
GoR stated (December 2018) that though the list of beneficiaries was not
verified in the Bhamashah camps, the department had weeded out 79.06 lakh
beneficiaries based on physical verification carried out by DSOs. It further
stated that village-wise revenue campaigns were organized from time to time
wherein the name of deprived beneficiaries were included and non-entitled
beneficiaries were excluded.
The fact remains that the department failed to utilize the opportunity of
Bhamashah camps to verify the eligibility of 1.50 crore beneficiaries and to
conduct a comprehensive annual review based on socio-economic parameters
to weed out the ineligible beneficiaries. The GoR circular issued (July 2014)
was exhaustive and comprehensive in nature and included controls that
covered all the principal risks and weaknesses arising in beneficiary
identification processes. Had these been complied with the FCS&CAD
previous lapses in the identification of beneficiaries, preparation and
digitization of RCs could have been rectified and fresh errors minimised. The
measures contained in the circular were crucial for establishing a fool proof
system for identification of beneficiaries and inclusion of legitimate
beneficiaries and exclusion of ineligible beneficiaries. Thus, non-adherence to
the prescribed procedure stipulated vide guidelines issued (July 2014) led to
large scale failure in beneficiary screening in PDS.
The State Government and the Department concerned should take concrete
steps to ensure that the controls prescribed in the NFSA and guidelines are
complied with diligently on priority basis.
13 Ajmer, Alwar, Baran, Churu and Jodhpur.

Audit Report (G&SS) for the year ended 31 March 2018
18
2.1.8 Preparation and issue of Ration Cards
The GoR circular (point no. 6) provided for linking of various cards including
Ration Cards meant for food distribution under the PDS and to correct the
errors already noted in the identification of beneficiaries among the RCs
issued in 2013-2014. The correction of these errors was stated to be an
indispensable objective behind the issue of the GoR circular. Point 12 laid
special emphasis on the procedure for rectification of errors in the RCs
prepared under the NFSA during 2013 and linking them with those already
validated under the Bhamashah eligibility identification procedure.
Point 9 and 10 of the GoR circular emphasised the importance of the identity
of the authorities in charge of the identification of the beneficiaries so that
responsibility can be easily attributed at any later date. The minimum number
and designations of authorised personnel who would compulsorily be in
charge of the beneficiary identification was also stipulated in the circular.
Their full names should be inscribed on the seal used for the beneficiary
verification processes. The purpose was to capture all important data including
biometric details, photographs and other details listed in Annexure 7 of the
circular. Point 15 made it mandatory that suitable action should be taken
against any officers/employees who are found responsible for any mistake/
error in the data captured and entered by them.
Further, as per Clause 4 of TPDS (Control) Order, 2015, it was the
responsibility of GoR to prepare and issue Ration Cards (RCs) to eligible
households, maintain database, review the list and monitor its implementation.
It also provided that GoR shall endeavor to eliminate bogus or ineligible RCs
as a continuous exercise. For this, an annual special drive was to be organized
before the end of every financial year.
The above controls were not complied with resulting in gravely undermining
the process of beneficiary selection and in the following audit findings. The
department lost out on an opportunity to lay a strong foundation for the
establishment of a foolproof system of beneficiary identification.
2.1.8.1 Existence of Bogus Ration Cards
A comparison of family data (extrapolated for 2017) as per Census-2011 with
RCs existing in the State (March 2018) is given in the Table 2 below:
Table 2
(in crore) Population
as per
census
2011
Families
in 2011
Average
member in
a family
(Col1/Col2)
Approximat
e population
in the year
201714
Approximate no of
families in 2018
taking 5.39 members
(col4/col3) as family
size
Total RC in
the State as
on 15 March
2018
Probable
Bogus RC in
the State
(Col6-Col5)
1 2 3 4 5 6 7
6.85 1.27 5.39 7.45 1.38 2.03 0.65 (47.10 per cent)
Source: Information provided by the Department.
14 Based on Report of the Technical Group constituted by the National Commission on
population projection for India and State 2001-2026 (Revised December 2006).

Chapter II Performance Audit
19
It can be seen from the above table that there were estimated 0.65 crore (47.10
per cent) bogus RCs existing in the State as on March 2018. The aforesaid
figure of bogus RCs was calculated conservatively on the assumption that
every family in the State was provided RCs irrespective of their status of
coverage under NFSA. However, given the fact that a large number of families
did not have RCs, the proportion of bogus RCs would be still significantly
higher than what has been estimated (0.65 crore).
The FCS&CAD carried out an exercise (April 2016) wherein about 39.32 per
cent bogus RCs were estimated in the State. As per department’s own
estimate, the figures increased by 50 per cent in seven districts15. Further, in
some blocks the percentage of RCs issued in 2015 were as high16 as 234-283
per cent of the total population of the blocks. On the other hand, in few blocks
the total number of RCs issued in comparison to population was very low17 at
12-17 per cent.
This indicates that in some blocks/wards, excess number of RCs were issued
whereas in some blocks /wards RCs were not distributed to the majority of the
population.
During 2014-18, National Informatics Centre (NIC) identified 14.83 lakh
bogus RCs through ‘organic de-duplication process’ at backend by matching
details of pan card, Aadhar, voter ID, name, father name, mother name etc. It
also pointed out in its report, there could be more than 42.29 lakh duplicate
RCs if database of RCs were compared with census family data. Further,
Principal Secretary, FCS&CAD while expressing his serious concerns about
existence of bogus RCs also directed (March 2016) all District Collectors to
undertake exercise for de-duplication of bogus RCs floating in their districts.
Despite this, no special drive was conducted in the test checked districts
except for cancellation of 14.83 lakh duplicate RCs identified by NIC through
organic de-duplication process.
GoR accepted the facts and stated (December 2018) that after the introduction
of e-KYC facilities in Point of Sale (PoS) machines and digitization of RCs,
the preparation of new bogus RCs would be effectively prevented. In addition,
instructions were also being issued to DSOs to identify and weed out duplicate
and bogus RCs. However, the fact remained that the department failed to take
effective measures to weed out existing bogus RCs. Even the detailed
guidelines stipulated for screening of beneficiaries during Bhamashah camps
and through stipulated annual review as prescribed in TPDS (Control) Order
were not followed by the Department.
15 Ajmer (58.06 per cent), Dholpur (55.30 per cent), Chittorgarh (55.01 per cent),
Jhunjhunu (51.97 per cent), Jhalawar (51.85 per cent), Sriganganagar (51.65 per cent)
and Sikar (50.73 per cent). 16 252.48 per cent (urban Bikaner), 238.55 per cent (Rajgarh- Churu), 258.62 per cent
(Sadulsahar- Sriganganagar), 233.75 per cent (Mundva- Nagaur), 282.90 per cent (Niwai-
Tonk). 17 Kaman- Bharatpur (13.60 per cent), Bayana - Bharatpur (17.45 per cent), Gangapur –
Bhilwara (16.38 per cent), Keshorai Patan - Bundi (12.38 per cent), Todabhim-Karauli
(12.31 per cent) and Shrimadhopur - Sikar (14.49 per cent).

Audit Report (G&SS) for the year ended 31 March 2018
20
The noncompliance of the controls and best practices in the GoR circular and
the TPDS (Control) Order resulted also in poor accountability and inability to
identify the officers and employees who were responsible for the bogus RCs
and thereby establish deterrent action against the defect in the system. The
State Government should ensure a foolproof identification by better
implementation of controls.
2.1.8.2 Lack of follow up action by FCS&CAD on suspected RCs
Deputy Director, RajCOMP Info Services Ltd. (RISL) Rajasthan, Jaipur
submitted (October 2017) to Additional Food Commissioner (AFC),
FCS&CAD a list of 41 RCs having 26 to 83 members in each RC and
requested to investigate the matter. However, it was observed that AFC,
FCS&CAD did not take measures to investigate the issue and take action
against suspected RC holders. Therefore, FCS&CAD failed to eliminate bogus
RCs and duly initiate corrective measures in the form of special drives despite
the irregularities being brought to its notice in October 2017 by DoIT. GoR
accepted the facts and stated (December 2018) that reports were being
obtained from DSOs and instructions were issued to verify the identified cases
through enforcement staff and for taking necessary action.
2.1.8.3 RCs not issued in the name of woman head of household
Section 13 of the Act provided that the eldest woman who is not less than 18
years of age shall be head of the household for the purpose of issuing of RC.
It was observed that the department did not take any measure to implement
this provision. There were only 20.79 lakh out of 2.03 crore RCs, which were
issued in the name of eldest woman only because of natural reasons that there
were no eldest male member in the family. Further, no periodical review was
done to incorporate the female member as a head of household.
GoR while accepting the facts stated (December 2018) that wide publicity
would be given through social audit campaigns to make RCs in the name of
the eldest woman head of the household. Henceforth new RCs are also going
to be issued in the name of woman head of the households.
2.1.8.4 Non-realisation of cost of application forms and issue of RCs to
APL families and Liquidated damages
Principal Secretary, FCS&CAD issued (July 2012) Administrative and
Financial sanction of ` 43.90 crore for preparation and issue of RCs under
New Ration Card Compaign-2012. The DSOs concerned executed agreements
with the firms for digitization of beneficiary data base, preparation of digital
RCs and preparation of other associate reports by September 2014, failing
which Liquidated Damage (LD) at a rate of ` 1 per RC per week subject to the
maximum of ` 5 per RC was to be recovered. In addition, the cost of
application forms at ₹ 1 per form and the cost of issuing RCs to APL
beneficiaries at ₹ 10 per RC were also to be recovered by enumerators/Sub
Divisional Officers/Block Development Officers. Scrutiny of the records of
Chapter II Performance Audit
21
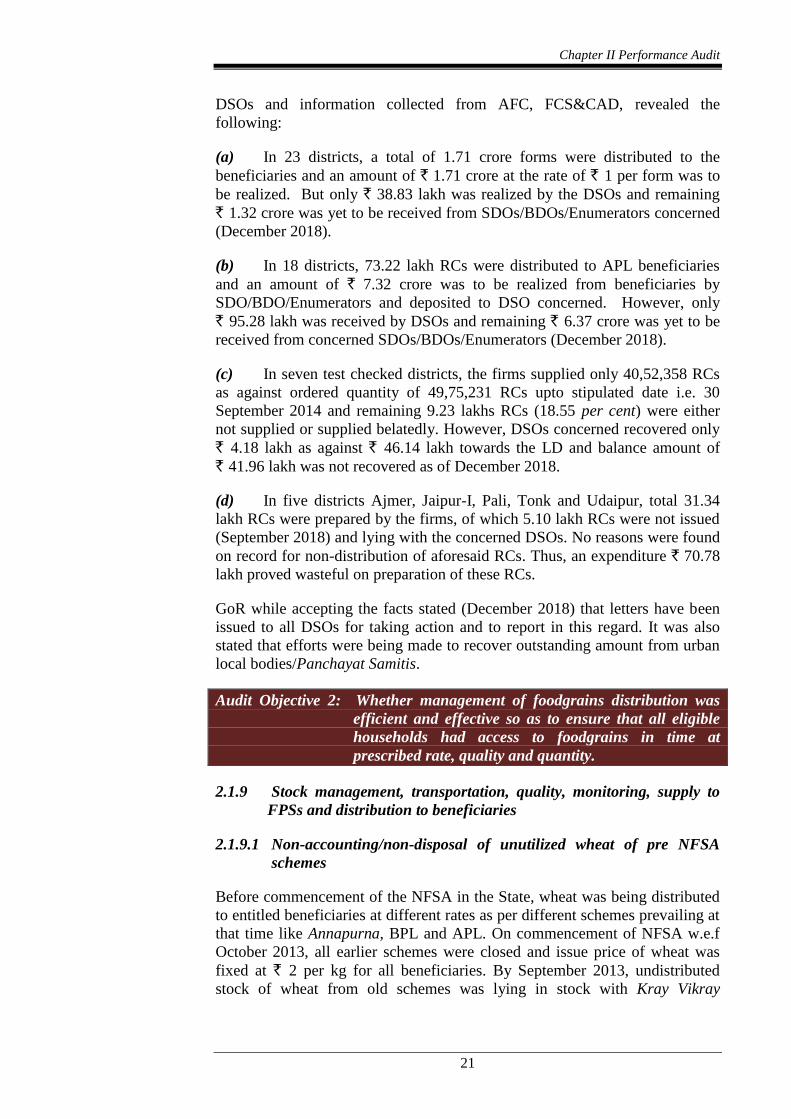
DSOs and information collected from AFC, FCS&CAD, revealed the
following:
(a) In 23 districts, a total of 1.71 crore forms were distributed to the
beneficiaries and an amount of ` 1.71 crore at the rate of ` 1 per form was to
be realized. But only ` 38.83 lakh was realized by the DSOs and remaining
` 1.32 crore was yet to be received from SDOs/BDOs/Enumerators concerned
(December 2018).
(b) In 18 districts, 73.22 lakh RCs were distributed to APL beneficiaries
and an amount of ` 7.32 crore was to be realized from beneficiaries by
SDO/BDO/Enumerators and deposited to DSO concerned. However, only
` 95.28 lakh was received by DSOs and remaining ` 6.37 crore was yet to be
received from concerned SDOs/BDOs/Enumerators (December 2018).
(c) In seven test checked districts, the firms supplied only 40,52,358 RCs
as against ordered quantity of 49,75,231 RCs upto stipulated date i.e. 30
September 2014 and remaining 9.23 lakhs RCs (18.55 per cent) were either
not supplied or supplied belatedly. However, DSOs concerned recovered only
` 4.18 lakh as against ` 46.14 lakh towards the LD and balance amount of
` 41.96 lakh was not recovered as of December 2018.
(d) In five districts Ajmer, Jaipur-I, Pali, Tonk and Udaipur, total 31.34
lakh RCs were prepared by the firms, of which 5.10 lakh RCs were not issued
(September 2018) and lying with the concerned DSOs. No reasons were found
on record for non-distribution of aforesaid RCs. Thus, an expenditure ` 70.78
lakh proved wasteful on preparation of these RCs.
GoR while accepting the facts stated (December 2018) that letters have been
issued to all DSOs for taking action and to report in this regard. It was also
stated that efforts were being made to recover outstanding amount from urban
local bodies/Panchayat Samitis.
Audit Objective 2: Whether management of foodgrains distribution was
efficient and effective so as to ensure that all eligible
households had access to foodgrains in time at
prescribed rate, quality and quantity.
2.1.9 Stock management, transportation, quality, monitoring, supply to
FPSs and distribution to beneficiaries
2.1.9.1 Non-accounting/non-disposal of unutilized wheat of pre NFSA
schemes
Before commencement of the NFSA in the State, wheat was being distributed
to entitled beneficiaries at different rates as per different schemes prevailing at
that time like Annapurna, BPL and APL. On commencement of NFSA w.e.f
October 2013, all earlier schemes were closed and issue price of wheat was
fixed at ` 2 per kg for all beneficiaries. By September 2013, undistributed
stock of wheat from old schemes was lying in stock with Kray Vikray

Audit Report (G&SS) for the year ended 31 March 2018
22
Sahakari Samitis18 (KVSSs) in each district. AFC, FCS&CAD directed
(October 2013) all DSOs to send details of unutilized wheat lying with them
of earlier schemes.
Scrutiny of the records of Additional Food Commissioner (AFC), FCS&CAD
revealed that only 13 DSOs sent the requisite information about availability of
3,739.8 MT wheat with them by the end of September 2013. DSOs of another
20 districts failed to send information about the pre-NFSA stock available
with them. After this, FCS&CAD did not take any steps to follow up on the
stocks available and their disposal for three years.
Thereafter only in October 2017 Principal Secretary, Administrative Reforms
Department issued directions for constitution of a committee at district level to
examine the quality of wheat and auction it for cattle feed in case it was not
found fit for human consumption. As a result of delay in taking steps for
disposal, a large quantity of wheat was still lying undisposed, not accounted
for by the DSOs or got damaged during the storage, the specific instances are
listed below:
(i) In test checked district of Ajmer, DSO intimated (March 2015) to AFC,
FCS&CAD that 5,570.80 quintals of pre-NFSA wheat was available in the
stock of KVSSs. Only in November 2017, after a lapse of two years, the block
level committees were appointed by DSO-I, Ajmer to examine the quality of
only 1,534.32 quintal of wheat against the availability of 5,570.80 quintals of
pre-NFSA wheat.
On being enquired about the reasons for not examining the rest of the quantity
of wheat, DSO, Ajmer replied (June 2018) that the wheat was distributed
under NFSA as the sale price of both schemes was same. However, DSO,
Ajmer did not furnish any evidence in support of distribution of this wheat
through FPSs. With regard to the 1,534.32 quintal of wheat examined by the
committee, it was replied that the wheat was lying in stock and action for
disposal of it was under process (December 2018).
Thus, 1,534.32 quintal of pre-NFSA wheat was still lying undistributed and
the fate of another 4,036.48 quintal pre-NFSA wheat was not known.
(ii) General Manager, KVSS Alwar intimated (November 2013) DSO Alwar
that 3,769.22 quintal wheat pertaining to earlier schemes was available with
them and sought further direction for disposal of this wheat. However, no
action was initiated by the DSO, Alwar for disposal of this wheat (December
2018). Thus 3,769.22 quintal wheat was lying undisposed.
In KVSS, Kherliganj, the pre-NFSA stock of wheat available was 563.10
quintal as on October 2013 and it was 46.40 quintal as on June 2018.
However, no details regarding the remaining wheat (516.70 quintals) was
available in order to ascertain its disposal.
18 A registered society engaged in transportation, intermediate storage and distribution of
food grains to FPS.

Chapter II Performance Audit
23
(iii) A committee was appointed by District Collector, Bharatpur for
examining the quantity and quality of wheat available with Mahila Bahu-
uddheshiya Sahakari Samiti19 (MBSS), Jurhara & Kumher, and KVSS-
Bayana. The quality of wheat available (1343.65 quintal) with MBSS, Jurhara
was examined (December 2017) by the committee and it was not found
suitable for human consumption but suitable for cattle feed. Accordingly, the
wheat was auctioned at ` 1,060 per quintal in an open bid on 16 March 2018
i.e. ` 290 per quintal less than MSP20. This was due to lack of timely decision
(more than four years delay) by the department in accounting and distributing
pre-NFSA wheat through NFSA channel.
In KVSS, Bayana 416.65 quintal of wheat was available, of which, 155 quintal
wheat was shown as transferred into NFSA and was distributed in the month
of October 2013. However, evidence for distribution of remaining 261.65
quintal wheat was not furnished to Audit. In MBSS, Kumher, 894.29 quintal
wheat was shown as distributed, but no evidence of distribution was provided.
Thus, FCS&CAD had no information from 20 districts on the fate of pre-
NFSA stock of wheat available with them and also did not take proactive and
timely measures in 13 other districts to account for and its proper disposal. As
a result, 5,349.94 quintal21 wheat was lying undisposed in KVSSs of two test
checked districts (Ajmer and Alwar). Further, the distribution of another
5,709.12 quintals22 was not verifiable in three test checked districts (Ajmer,
Alwar and Bharatpur).
GoR stated (December 2018) that report was being called for from DSOs
regarding taking action through the constituted committee at district level and
further action would be taken on the basis of report.
2.1.9.2 Short accounting of wheat due to irregularities in stock registers
RSFCSC was the coordinating agency for off-take of wheat from FCI
godowns by KVSSs. After receiving district-wise and KVSS-wise allocation
from office of District Supply Officer (DSO), Vigilance Inspector of RSFCSC
enters the vehicle details, quantity lifted etc., in off-take register maintained
for each KVSS and issues a delivery slip to the representative of KVSS who
also acknowledges slip by appending his signature on it. The quantity lifted by
each KVSS/wholesalers reaches its godown and gets recorded in its stock
register. Similarly, the stock of wheat distributed to Fair Price Shops (FPSs)
from KVSS/wholesalers should be recorded in the distribution register. All
these statistics are consolidated and sent as Monthly Progress Report to
Manager Civil Supplies (MCS) of RSFCSC who in turn forwards it to DSO
for monitoring. The wholesaler submits transportation bill to DSO for the
quantity of wheat transported from FCI to FPS after getting it verified from
MCS.
19 A cooperative society involved in transportation of foodgrains to FPSs. 20 In 2013-14 MSP of wheat was ` 1,350 per quintal. 21 1,534.32 (Ajmer) +3,815.62 (Alwar) =5,349.94 quintals. 22 4,036.48 (Ajmer) +516.70 (Alwar) +261.65 (Bayana-Bharatpur) +894.29 (Kumher-
Bharatpur) = 5,709.12 quintals.

Audit Report (G&SS) for the year ended 31 March 2018
24
Scrutiny (May-September 2018) of stock registers, transportation bills, off-
take register and distribution registers maintained by KVSS/ MCS, RSFCSC
of the test checked districts revealed the following:
(i) In nine KVSSs of two test checked districts (Jodhpur and Udaipur),
during 2013-18 there were differences between the quantity shown in off-take
register maintained for each KVSS by RSFCSC and corresponding entries
made in the stock register of KVSSs as receipt. The consolidated quantity of
wheat lifted from FCI in 67 such cases was 1,20,888.92 quintal as per off-take
register but only 1,08,392.39 quintal wheat was accounted for in the stock
register. By doing so these KVSSs short accounted for 12,496.53 quintal of
wheat in their stock registers. The possibility of pilferage of the less entered
quantity of wheat in stock registers could not be ruled out and the matter needs
to be examined at departmental level.
(ii) In four test checked KVSSs (out of 19 KVSSs) of Alwar, Bharatpur
and Churu districts, the closing balances of stock register on a day was not
tallied with the actual balances after adjusting the quantity received/
distributed. In seven such instances, lesser closing balances of stock than
actuals were carried forwarded to next day as opening balance. The
consolidated quantity of wheat short accounted for in the stock was 1,808.43
quintal and possibilities of pilferages of this quantity cannot be ruled out.
(iii) In Bharatpur district, against a quantity of 8,423.85 quintal of wheat
shown as off-take in the delivery slip issued by Vigilance Inspector of
RSFCSC, only 7,007.56 quintal of wheat was entered in the stock register of
three KVSSs (six cases) as receipt. Resultantly, 1,416.29 quintal of wheat was
not depicted in stock registers of KVSSs. Thus, the possibility of pilferage of
1,416.29 quintal of wheat could not be ruled out.
(iv) In KVSS, Rajgarh (Alwar district), old stocks of wheat pertaining to
Annapurna (132.35 quintal), BPL (140.11 quintal) and AAY (889.04 quintal)
categories was shown as transferred to NFSA, SBPL/BPL categories
respectively in November 2013. However, the corresponding entries of receipt
of wheat were not made in the stock registers of two respective categories
(NFSA & SBPL/BPL) to which they were transferred. Further, 140.11 quintal
of wheat of earlier BPL was shown as closing balance in November 2013, but
not carried forward to December 2013.Thus, possibility of pilferage of
1,161.50 quintal of wheat could not be ruled out.
(v) In Bharatpur district, work of transportation of three KVSSs was
discontinued (September 2017) and 1,007.94 quintal of wheat was lying
undistributed as closing balance with them. Accordingly, undistributed
quantities of wheat were supposed to be taken over from those KVSSs by
RSFCSC. It was observed that out of 1,007.94 quintal, only 418.13 quintal of
wheat was surrendered to RSFCSC and remaining 589.81 quintal23 of wheat
was not transferred back to RSFCSC even after lapse of 10 months (July
2018) of withdrawing the responsibility for distribution of wheat from these
23 Kaman: 9.38 quintal (30.09.2017); Kumher: 264.05 quintal (31.03.2017) and Nadbai:
316.38 quintal (30.09.2017).

Chapter II Performance Audit
25
KVSSs. MCS Bharatpur in case of KVSS Nadbai, stated (July 2018) that the
balance wheat would be deposited at the earliest.
Thus, there was short accounting and possible pilferage of 17,472.56 quintals
wheat valuing ` 2.66 crore24 due to different irregularities committed in
various KVSSs under the control of RSFCSC is indicative of the fact that
monitoring by RSFCSC over the KVSSs was not effective.
GoR stated (December 2018) that replies were being sought from Managers of
RSFCSC concerned.
2.1.9.3 Quality of wheat not being checked at the stage of lifting,
transportation and distribution
One of the primary objectives of PDS is that the foodgrains distributed to
consumers should be of Fair Standard Quality25 and fit for human
consumption. As per Annexure 4(7) of PDS (Control) Order, 2001 and clause
7 (6) of TPDS (Control) Order 2015, the representatives of the State and FCI
should conduct joint inspection of the stock intended for PDS to ensure that
the quality of foodgrains conformed to the prescribed quality specification.
Clause 7 (7) of TPDS (Control) Order, 2015 further extends the responsibility
upon the state agency (RSFCSC) to draw stack wise sample for display at
FPSs and to keep one duplicate sample with them for future reference.
Separately, samples were also to be drawn by Enforcement Inspectors/
Enforcement Officers from the wholesaler’s godowns and FPSs to adjudge the
quality of foodgrains.
It was observed in Audit that there were no detailed instructions issued to
monitor the quality of foodgrains. Further there were no targets set by GoR for
taking samples from FCI godowns, wholesalers and FPSs. In the absence of
such instructions, stack wise samples of wheat were not being collected from
FCI godowns and wholesalers’ godowns and FPSs jointly by representatives
of RSFCSC and FCS&CAD. DSOs of test checked districts confirmed that no
instructions for taking samples were given by FCS&CAD and no targets for
taking samples by EO/EIs were also prescribed.
GoR stated (December 2018) that the procurement of wheat was carried out by
FCI in the state which ensures quality while procuring the wheat. It was also
stated that RSFCSC, being the nodal agency for lifting and transportation of
wheat has issued guidelines/instructions (March 2015) for monitoring quality
and carry out joint inspection by representatives of RSFCSC and FCI for
quality of wheat. It was also stated that stack-wise sample of wheat were
collected and displayed at FPSs.
During joint inspection of 114 FPSs by Audit along with departmental
officials, sample of wheat was not found displayed in any of the FPS
24 ₹ 1,525 per quintal as per MSP 2016-17. 25 Wheat should be dried mature grains having natural size, shape, colour, luster and free
from obnoxious smell, admixture of deleterious substances including toxic weed seeds.
Stocks containing moisture between 12 per cent and 14 per cent were to be discounted at
full value and in excess of 14 per cent were to be rejected.

Audit Report (G&SS) for the year ended 31 March 2018
26
surveyed. As a result, it could not be ensured whether the quality of wheat
being currently distributed was the same as that was received from the FCI
godowns. Further, 17 FPS dealers stated that sometimes, in addition to
machine stitched bags, hand stitched bags were also delivered to them by the
wholesaler, in which dust and pebbles were found in excess quantity.
Therefore, quality of wheat was not checked at any stage of distribution
despite high probability of replacing of wheat by the inferior quality during
transportation and storage. Thus, the distribution of wheat of fair standard
quality could not be assured.
2.1.9.4 Irregularities in transportation of foodgrains
RSFCSC was responsible for transportation of wheat to the door step of FPSs
as per allotment. The corporation deposits advance payment to FCI for lifting
of foodgrains for distribution by FPSs. The cost on the basis of Central Issue
Price of wheat was to be collected from FPS dealers by RSFCSC at the time of
supply of wheat after adjusting commission payable to FPS dealer.
Scrutiny of records of DSOs of Baran and Jodhpur districts revealed that
` 3.49 crore26 was outstanding against FPSs dealers on account of cost of
Central Issue Price of wheat supplied during October 2016 to March 2018.
However, RSFCSC did not take action to recover dues and continued to
supply wheat to the FPSs.
GoR stated (December 2018) that ` 0.26 crore and ` 1.00 crore have been
recovered out of ` 1.17 crore and ` 2.32 crore by Manager Civil Supplies
Baran and Jodhpur respectively and remaining amount would be recovered
shortly.
2.1.9.5 Irregularities noticed in management of Fair Price Shops
FPSs form the last mile delivery points of the PDS network. They can be
owned privately by individuals or cooperative societies or by Gram
Panchayats. A network of 26,303 FPSs are licensed under the PDS (Control)
Order, 2001 to sell essential commodities as per entitlement of beneficiary at
central issue price. Audit scrutiny revealed the following:
(i) Viability of FPSs not ascertained
Clause 9(5) and 9(6) of TPDS (Control) Order, 2015 stipulates that the
licenses to FPS dealer should be issued keeping in view the number of RC
holders, location, coverage and the financial viability of an FPS. A committee
set up by GoI to look into the various issues under NFSA recommended
(December 2014) ` 10,000 as reasonable monthly income for FPS dealers
with average annual allocation of at least 1,100 quintal per FPS. Only a
criteria of minimum of 500 RCs or 2,000 persons was fixed to allot licenses to
FPSs.
26 Baran: ` 1.17 crore as of June 2018 and Jodhpur: ` 2.32 crore as of August 2018.

Chapter II Performance Audit
27
It was, however, observed that FCS&CAD had not set any norms for issue of
license to an FPS on the basis of location, coverage and the financial viability
of an FPS. As a result, there was wide disparity between FPSs in terms of RCs
attached. Further, AFC, FCS&CAD had instructed (January 2016) all District
Collectors for rationalization of all FPSs with regard to number of attached
RCs and forwarded a list of 198 FPS, covering all 33 districts as example of
irrational attachment of RCs with FPS. Out of 198 FPS, 41 were attached with
more than 5000 RCs, two FPS were attached with abnormally higher number
of 27,143 RCs and 40,178 RCs in Udaipur and Rajsamand district
respectively. On the other hand, 58 FPSs had only one RC attached.
Instructions were again issued (September 2017) to complete the work of
rationalization of FPSs by Deputy Commissioner, FCS&CAD.
Despite passing of such instructions, there were still 7,002 FPSs (26.62 per
cent) having RCs below the threshold required for minimum level of income
and were therefore unviable (Number of active FPSs having below 10 RCs:
784; 11 to 100 RCs: 364 and 101 to 500 RCs: 5,854).
Further, the amount of income, based on distribution of foodgrains during a
month was also analyzed for all the 24,761 FPSs during 2016-17 in the State
and it was observed that 16,090 FPSs (64.98 per cent) had less than ` 6,400
monthly income based on the FPSs commission margin of ` 77 per quintal.
Thus, rationalization of FPSs with regard to RCs attached with them was not
done by FCS&CAD to ensure minimum viability of FPSs.
GoR accepted the facts and stated (December 2018) that rationalization of
RCs was a regular process and continuous efforts were being made to make
FPSs economically viable and instructions were issued to DSOs for
rationalization of RCs.
(ii) Under reporting of 433 MT wheat in stock balances of FPS
Clause 10 (4) (vi) of TPDS (Control) Order, 2015 entrusted the responsibility
to submit accounts of the actual distribution of foodgrains and the balance
stock at the end of each month to the FPS dealer. Principal Secretary,
FCS&CAD issued (August 2016) directions for distribution of wheat through
PoS device instead of distributing manually from September 2016. The FPS
dealers were authorized to upload the quantity received from the wholesaler as
per allotment made by DSO into PoS. The undistributed quantity of wheat
available with FPS as on 1 September 2016 was also to be uploaded on PoS by
FPS dealer.
Audit scrutiny revealed that prescribed monthly returns showing opening
balance, quantity received and distributed during the month and closing
balance of wheat at the end of each month were not being obtained from the
FPS dealers. In the absence of this, correctness of quantity of wheat uploaded
by FPSs dealer as opening balance as on 1st September 2016 could not be
verified.
DSO, Churu and Jodhpur accepted the facts and stated (August-September
2018) that verification of correctness of the quantity uploaded by FPS dealer

Audit Report (G&SS) for the year ended 31 March 2018
28
was not done. Therefore, under reporting of stock available with the FPS
dealers as on 1 September 2016 as per the above direction issued by GoR
could not be ruled out.
In November 2017, Principal Secretary, FCS&CAD ordered to constitute an
inspection committee to verify the quantity of wheat uploaded in PoS by FPS
dealers of Udaipur district during September 2016 to July 2017. The
Committee observed that as against actual balance of 719 MT of wheat in 299
FPSs, only 286 MT was entered as opening stock of September 2016 on the
website resulting in under reporting of 433 MT wheat with a value of ` 66.03
lakh on the basis of MSP of ` 1525 per quintal in 2016-17. However, no
action was initiated for updating the correct stock position despite lapse of one
year of submission of findings of Committee.
GoR stated (December 2018) in respect of Udaipur district that suitable action
would be taken by conducting physical verification. However, the department
should examine this issue in other districts as well.
2.1.9.6 Results of joint inspection of FPSs
As per Clause 10 of TPDS (Control) Order, 2015, the license issued by GoR to
FPS owner shall lay down the duties and responsibilities of FPS dealer, which
shall include (i) display of information on a notice board at a prominent place
in the shop on daily basis, (ii) maintain records of ration card holders, stock
register, issue or sale register (iii) display of samples of foodgrains being
supplied through the FPS (iv) submit a monthly reports of actual foodgrains
distributed and balance stock at the end of month to district authority etc.
Accordingly, 114 out of 7,322 FPSs in seven test checked district were jointly
inspected by Audit along with the departmental representatives using a
questionnaire. The results are given in Table 3 below:
Table 3
S.No. Duty and
responsibility of
the FPS dealers
Audit observation GoR reply
1. Display of
information on
notice board
Various information about entitlement,
scale, prices, timings, stock, grievance
redressal, toll-free helpline etc., were not
displayed on the notice boards by 36.84 to
73.68 per cent FPSs.
GoR stated (December
2018) that regular
instructions were being
issued to display all
information at FPSs.
Information about the subsidy borne by
GoI on PDS foodgrains was not displayed
by any of the FPS.
2. Maintenance of
records of ration
card holders, stock
register and
issue/sales register
Important records like register of ration
card holders, stock register, issue or sale
register were not maintained in 53.50 to
91.22 per cent FPSs,
GoR while accepting the
facts stated (December
2018) that FPS dealers
were directed to maintain
the records properly.
3. Display of samples
of foodgrains being
supplied
None of the FPS displayed samples of
foodgrains being supplied.
19 FPS dealers (16.67 per cent) were not
satisfied with the quality of the foodgrains
supplied to them.
17 FPS dealers (14.91 per cent) also made
complaints of hand stitched bags which
contained dust/pebbles in excess quantity.

Chapter II Performance Audit
29
S.No. Duty and
responsibility of
the FPS dealers
Audit observation GoR reply
In 15 FPSs, wheat was found deteriorated
due to infestations, mixed with pebbles and
dust etc.,
4. Submission of
monthly reports of
actual distribution
and balance of
foodgrains at the
end of the month
None of the 114 FPS were submitting
monthly reports of actual quantity
distributed and balance stock at the end of
the month to the district authorities.
GoR stated (December
2018) that DSOs were
directed to obtain monthly
reports from FPS.
Further, Vigilance Committees (VCs) were
not constituted in 75 per cent FPSs and in
remaining 25 per cent FPSs, though VCs
were constituted, no records found
maintained at any FPS regarding meetings
held and inspections carried out
2.1.9.7 Distribution of foodgrains to beneficiaries
(i) Inadequate distribution of foodgrains to AAY families
As per section 3(1) of NFSA, the AAY households were entitled to 35 kgs
foodgrains irrespective of number of members in the family.
It was observed that 6.21 per cent AAY households, (41,052 out of a total of
6,61,237 AAY households) having more than seven members were receiving
only 35 kgs per month. On the other hand, 5.05 lakh families in the Priority
Household (PHH) category having more than seven family members were
receiving more than 35 kgs of foodgrains at 5 kg/person. Therefore, 41,052
AAY households were in a disadvantageous position despite their poverty
status.
GoR stated (December 2018) that necessary action would be taken after
making policy decision by the GoI.
(ii) Failure to provide food coupons to aged, disabled and lonely
persons
Section 12 (2) (h) of NFSA envisaged providing food coupons to old age,
disabled and lonely persons, who were not able to get their entitlements from
FPSs, in order to ensure their foodgrains entitlements. As on January 2018,
there were 4,06,082 RCs shown in abeyance list who never took their entitled
foodgrains and 25,94,882 RCs did not take entitled foodgrains for last three
months. FCS&CAD issued instructions (November 2017) to all DSOs to
identify among this list those beneficiaries who were not able to visit and
collect foodgrains through help of relatives or neighbours and thereby take
measures to issue food coupons to aforesaid beneficiaries.
FCS&CAD identified 33,550 beneficiaries to provide food coupons out of
which data of 18,406 beneficiaries was uploaded on the web portal.
Thereafter, it was observed that no efforts were taken by the department to
distribute food coupons to the identified beneficiaries. DSOs of seven test
checked districts replied that they were awaiting instructions from the
department in this regard.

Audit Report (G&SS) for the year ended 31 March 2018
30
GoR stated (December 2018) that 279 out of 18,406 identified beneficiaries
were being provided home delivery of foodgrains. However, the fact remained
that there were still 18,127 beneficiaries not being provided foodgrains at their
homes despite being unable to take foodgrains from FPS.
2.1.9.8 Non-follow up of proof of concept study conducted on Direct Cash
Transfers by J- PAL South Asia
In February 2015, a research consultancy firm Jameel-Poverty Action Lab
(J-PAL) South Asia proposed to run a pilot Proof of Concept (PoC) for Direct
Cash Transfers in Ajmer and Banswara Districts. The objectives were to
explore efficient processes for reducing leakages, to provide options in PDS,
to test the system readiness and to determine the extent of beneficiary interest
in the programme. Under PoC, 500 households were to be selected from urban
and rural blocks of Ajmer and Banswara districts. The selected households
were to be provided coupon with the option to either deposit the coupon at
e-mitra kiosks for transfer of funds to head of family or deposit the coupon at
FPS dealers for getting their entitled foodgrains. The entire cost of the PoC
including cash transfer was to be borne by J-PAL and there was no financial
obligation for the State Government. The pilot project was to be run from
March to June 2015. Permission was accorded (March 2015) by AFC,
FCS&CAD to J-PAL South Asia for carrying out PoC on Direct Cash
Transfers under NFSA, 2013.
It was observed that there were no details available with the department on the
results of PoC, follow up action taken by FCS&CAD etc. Deputy
Commissioner, FCS&CAD replied (August 2018) that they have no
knowledge about J-PAL.
However, in the selected district of Ajmer it was observed that 168 families of
12 villages and three wards of Ajmer district were selected to explore the
interest in Direct Cash Transfer by J-PAL. Food coupons were provided to the
92 families during PoC of which 81 families got cash through food coupons
and remaining got their foodgrains entitlement from FPSs. The results of the
study was to be shared by FCS&CAD and decision for extension of PoC was
to be taken up but no action was initiated by FCS&CAD.
Audit Objective 3: Whether reforms in TPDS as envisaged under NFSA
were effectively implemented by the State Government.
2.1.10 End-to-End computerization and PDS reforms
As per Section 12 of NFSA, end to end computerization was required to be
carried out by GoR in two components. Component-I comprised of
digitisation of Ration Cards/beneficiaries/other data base, computerisation of
supply-chain management, setting up of transparency portal and grievance
redressal mechanism. Component-II comprised of automation of FPSs. The
expenditure was to be shared between GoI and State in the ratio of 50:50. GoI
accorded A&F sanction for implementation of Component-I in December
2012. Under Component-I, computerisation of supply-chain management was

Chapter II Performance Audit
31
to be carried out by October 2013, in order to monitor the movement of
foodgrains from state godowns to FPSs. Audit scrutiny revealed the following:
2.1.10.1 Non computerisation of supply chain management
GoR was required to computerize operations regarding receiving foodgrains
from FCI, issuance at state depot, generation of delivery order, truck challans
& gate-passes and recording the acknowledgement receipt received from FPS
dealers etc. As regards computerization of Component-II, the automation of
FPSs was completed and the distribution of foodgrains was being carried out
through PoS machines on real time basis from September 2016 onwards.
However, it was observed that computerization of supply chain management
was not initiated (March 2018) even after lapse of four and half years of GoI’s
timeline and despite availability of funds amounting to ` 16.90 crore. As a
result, the allocation of foodgrains at district level, wholesalers and FPSs is
being done manually. This raises the risk of irregularities at the supply chain
level as the department cannot monitor the real time movement of foodgrains.
GoR stated (December 2018) that the supply chain management was being
implemented from August 2018 through which allotment, sub-allotment,
lifting and distribution were implemented online.
2.1.10.2 Other irregularities in Component-I Computerization
(i) Testing of modules and third party evaluation of computerization
process was not carried out
As per administrative approval of GoI, all modules of application software
were required to be tested by Standardization Testing and Quality Certification
Organization (STQC). A third party evaluation of entire computerization
process was to be carried out within three years i.e. by 2015-16.
However, no modules of application software were tested by STQC. It was
also observed that third party evaluation of the computerization of the PDS
was not carried out till date. In the absence of module testing and third party
evaluation, assessment of implementation of the scheme was not ensured.
GoR stated (December 2018) that security audit of supply chain management
system is under process and STQC process of all modules of the software
application would be carried out after completion of the security audit.
(ii) Full matching share was not released by GoR
Of the total project cost of computerization of component-I of ` 46.29 crore
on 50:50 sharing basis by GoI and GoR, GoI released an amount of ` 23.14
crore in three installments i.e. 60 per cent, 30 per cent and 10 per cent subject
to fulfilling the conditions viz. release of state matching share, submission of
UCs, testing of all modules of application software and assessment of the
scheme.

Audit Report (G&SS) for the year ended 31 March 2018
32
It was observed that as per sharing pattern, GoI released its full share
and as such, an equal amount was required to be released by GoR but it
released only ` 15.98 crore. Besides, GoI while intimating release of first
installment of its share directed (June 2014) GoR to utilize the funds
effectively. But as of September 2018, FCS&CAD could spend only ` 22.22
crore (56.80 per cent) out of a total release of ` 39.12 crore as hardware
required for computerization of supply chain management was not procured.
Further it submitted UCs to GoI for only ` 9.07 crore.
Thus, GoR neither released its matching share nor utilized the available funds,
thereby delaying the process of computerization.
2.1.10.3 Discrepancies noticed in data analysis of PDS transactions under
NFSA
Department of Information Technology and Communication (DoIT) of GoR is
the custodian of transaction data relating to Public Distribution System under
NFSA. Data analysis of the distribution of wheat for the year 2016-18 was
conducted by Audit and results of such analysis are discussed below:
(i) Seeding of single Aadhar with multiple RCs
There was duplication in seeding Aadhar number with RCs as 30,350 Aadhar
numbers were seeded with 95,618 RCs in 2016-17. One particular Aadhar
number was seeded the maximum with 1,255 RCs. The details of Aadhar
number seeded with more than one RC are given in Table 4 below:
Table 4
Range of RCs
seeded with one
Aadhar
Two
RCs
seeded
with
one
Aadhar
Between
three and
10 RCs
seeded
with one
Aadhar
Between
11 and 20
RCs
seeded
with one
Aadhar
Between
21 and 50
RCs
seeded
with one
Aadhar
Between
51 and 100
RCs
seeded
with one
Aadhar
Between
101 and
1255 RCs
seeded
with one
Aadhar
No of cases 27,875 1,929 219 159 106 62
Quantity
Distributed
(in quintal)
46,343 4,622 1,274 1,952 2,790 5,545
It can be seen from the above table that one Aadhar number was seeded with
more than one RC and 62,526 quintal of wheat amounting to ` 9.54 crore was
distributed to these RCs holders during 2016-17. As Aadhar number is unique
and one beneficiary cannot be part of more than one RC, seeding of one
Aadhar with more than one RC points to the systemic weaknesses in the
process.
Since September 2016, foodgrains were being delivered through PoS
machines after biometric authentication using Aadhar. While seeding Aadhar
with a different RC, an error message “Aadhar ID already exists” is displayed
on the PoS and therefore the system will not allow that particular transaction
to go through. However, despite this system check, having so many RCs
linked with single Aadhar raises possibility of tampering with the system.

Chapter II Performance Audit
33
Though the position of seeding of one Aadhar with multiple RCs reduced
from 30,350 cases in 2016-17 to 5,115 cases in 2017-18, the fact remained that
the problem of seeding of one Aadhar with multiple RCs still continues and
9,378 quintals wheat valued at around ` 1.52 crore27 were unauthorisedly
lifted in 2017-18.
GoR while accepting the facts stated (December 2018) that no validation
exercise was conducted at the time of initial Aadhar entry in the RC database.
DoIT has initiated the process of Aadhar validation through a bulk
authentication process to weed out duplication.
(ii) Delivery of PDS services made through Bhamashah platform
The detailed GoR circular (point no. 13) provided that data entry and
corrections have to be designed such that there is a full audit trail available in
the specially programmed application software package. This was also to help
identify which officer/employee had filled in the personal data and whose
irresponsible activity led to a mistake in any entry. The identification
procedures were also aimed at helping to form a comprehensive database for
deciding eligibility under various schemes including Aadhar cards and
Bhamashah cards.
GoR further issued (October 2017) directions to all the concerned departments
advising the use of the Bhamashah28 Resident Data Hub for delivery of
notified public welfare benefits and services through Bhamashah platform. In
order to utilize this platform for PDS benefits, the departmental data base of
RCs was to be seeded with Bhamashah number, bank account number and
Aadhar number. As on August 2018, 90.17 lakh RCs under NFSA were
seeded with Bhamashah cards.
Analysis of Data provided by DoIT revealed that there was duplication in
seeding Bhamashah number with RCs as one Bhamashah card was seeded
with 11 to 20 RCs in 2 cases; with 3 to 10 RCs in 3,068 cases; and 2 RCs in
98,292 cases. Further one particular Bhamashah card bearing ID Number
“BID” was seeded with 2,240 RCs.
However, in these cases the amount of foodgrains drawn from these RCs was
not available and the impact of the multiple seeding of RCs with one
Bhamashah card could not be ascertained.
GoR stated (December 2018) that report on the issue pointed out by Audit is
being obtained from DoIT.
27 ₹ 1,625 per quintal as per MSP 2017-18. 28 For women empowerment, financial inclusion, direct transfer of public welfare benefits
and delivery of services to the beneficiaries through Bhamashah platform, the Rajasthan
Bhamashah (Direct Transfer of Public Welfare Benefits and Delivery of Services) Act,
2017 was enacted by the Rajasthan State Legislature. The Act was came into force from
15 August 2017.

Audit Report (G&SS) for the year ended 31 March 2018
34
Had the detailed procedure laid down in the circular been followed the above
errors of seeding of single RC with multiple Bhamashah number would have
been avoided. It would also have been possible to fix the officials who are
responsible for the erroneous entries for suitable punitive and deterrent action.
(iii) Multiple transaction of wheat in a day/month from a single RC
Scrutiny of data revealed that there were 71 RCs receiving more than 15
quintals wheat each during 2016-17 through PoS. Scrutiny of such 50 RCs
revealed that 36 RC holders carried out 16 to 194 transactions in a single day
(April-May 2016), another 13 RC holders carried out 66 to 876 transactions
between February and July 2016 and remaining one RC holder carried out 19
transactions between March and July 2017. Therefore, a total of 1,807 quintal
of wheat valued at ` 27.56 lakh was collected by these 50 RC holders
irregularly for which they were not entitled. Even the quantity of wheat
distributed in a single transaction was also more than the entitled quantity as
per family members.
GoR stated (December 2018) that report on the issue pointed out by Audit is
being obtained from DoIT.
(iv) Distribution of wheat in excess of entitlement and to more family
members than actual members in Ration Cards
Analysis of data of RCs of NFSA (2017-18) revealed that in 96 RCs, wheat
was distributed in excess of entitlements of each family member. Further, in
another 162 RCs, names of family members were repeated more than once
(1-5 times) and excess wheat was lifted. Resultantly, 350 quintal wheat valued
at ` 5.69 lakh was lifted in excess during 2017-18.
GoR stated (December 2018) that wheat distribution in excess of entitlement
in a particular month is mainly due to carry forward option available with
beneficiaries under which beneficiaries can take foodgrains of previous three
month along with current month. The reply is not tenable as calculation made
by Audit had taken into account the carry forward option of foodgrains of the
last three months.
(v) Uploading erroneous details of Ration Cards
Analysis of details of RCs of NFSA revealed that the particulars of RC holders
and family members were entered erroneously as given below:
In 1,77,612 RC’s the age of family members entered were having
negative and exaggerated values ranging from (-)7,986 to 6,786 years.
In 12,968 RC’s the date of birth of family members was shown as
ranging from 1,753 to 9,999 years.
This shows that the beneficiaries’ data base was not foolproof and while
developing software necessary checks should have been incorporated in
respective data fields and processes. Despite linking RC database with unique

Chapter II Performance Audit
35
ID numbers like Aadhar & Bhamashah, there were still significant number of
cases with duplications in linking. Further, there were significant number of
transactions where excess wheat was lifted due to systemic deficiencies. This
brings out lot of loopholes in the system of distribution of wheat through PoS
and its online monitoring.
GoR accepted the facts and stated (December 2018) that all the irregularities
have been identified and DSOs have been asked to rectify them.
Audit Objective 4: Whether internal control systems for monitoring and
grievance redressal was adequate and effective.
2.1.11 Internal Control, Monitoring and Grievance Redressal
2.1.11.1 Non-constitution of State Food Commission
Section 16 of NFSA provided that every State Government shall constitute a
State Food Commission (SFC) for monitoring and review of implementation
of this Act. Accordingly, GoR delegated the powers of SFC to Rajasthan State
Consumers Redressal Commission constituted under section 9 of Consumer
Protection Act, 1986 by issuing (May 2015) notification. However, the
Supreme Court observed that this was not in consonance with the provision of
the law particularly the letter and spirit of NFSA. Consequently, GoR issued
(March 2017) notification for constitution of SFC.
It was observed that neither were any members appointed nor were the
required rules framed for proper functioning of SFC as prescribed in section
16 (5) of NFSA. In absence of SFC, monitoring and evaluation of
implementation of NFSA was not being carried out by a state level body.
GoR while accepting the facts stated (December 2018) that selection of
Chairperson and members is under process. The fact remained that SFC was
still not functional despite lapse of five years from the date of implementation
of NFSA.
2.1.11.2 Non-functioning of District Grievance Redressal Officers
Section 15 of the NFSA stipulated that the State Government shall appoint or
designate an officer as District Grievance Redressal Officer (DGRO) for each
district for expeditious and effective redressal of grievances of the aggrieved
persons in matters relating to distribution of entitled foodgrains, and to enforce
the entitlements under NFSA.
In September 2013, all the District Collectors were designated as DGRO.
However, as pointed out by the Supreme Court, this was against the principle
of natural justice as no one should be a judge in his own case. It also directed
that an independent person should be appointed and not the District Collector
as they were directly involved with the implementation of NFSA. Further, on
an objection raised (August 2016) by GoI, FCS&CAD issued (December
2017) orders to designate all the Additional District Magistrates
(Administration) as DGRO for their respective district. In case of complaints
Audit Report (G&SS) for the year ended 31 March 2018
36
case against the DC the Divisional Commissioner was designated as DGRO.
However, since majority of the decisions regarding implementation of NFSA
was being taken by the DCs, it was unlikely that appointing ADMs as DGROs
was going to be effective.
It was also observed that in the selected districts no complaint was received in
the offices of the ADM (Administration) regarding PDS. This shows that the
system of DGROs was not functioning effectively in the State.
Thus, as can be seen from the above, in the absence of adequate functioning of
regulatory and redressal structures like DGROs and SFC, aggrieved persons
had no option but to approach different courts of law for justice. This
contention was corroborated by the fact that 840 court cases were pending
(April 2018) in different courts against FCS&CAD. Out of those, two were in
Supreme Court, 609 were in High Court and remaining in various other
subordinate courts.
GoR stated (December 2018) that detailed guidelines have been issued (April
2018) to make the DGROs functional.
2.1.11.3 Delay in formation/non-functioning of Vigilance Committees
As per Section 29(1) of the NFSA, every State Government shall set up
Vigilance Committees (VCs) at the state, district, block and FPS levels for
ensuring transparency & proper functioning of the TPDS and accountability of
the functionaries in such system. AFC, FCS&CAD also issued (September
2017) guidelines to all District Collectors for formation of VCs with its
responsibilities and functions at district, block and FPS level. As per
guidelines the VCs were to meet once in a month wherein inclusion and
exclusion criteria were to be ascertained. As per clause 11 of TPDS (Control)
Order, 2015 State Government was also required to send an annual report on
functioning of VCs to GoI. Audit scrutiny revealed the following:
State level VC was not formed and district level VCs were formed only
in 20 (60.60 per cent) out of 33 districts. Block level VCs were formed
in 178 (72.95 per cent) out of 244 blocks and FPS level VCs were
formed in 10,638 (40.44 per cent) out of 26,303 FPSs as on March 2018.
VCs formed were not functional as neither cases of malpractices/
misappropriation of funds were reported nor the recommendation on
inclusion or exclusion of beneficiaries was made by these VCs. Further
no progress report regarding meetings held by block and FPS level VCs
was prescribed by the DSOs of selected districts in order to monitor the
functioning of VCs.
GoR did not send any annual report on functioning of VCs to GoI as
prescribed under clause 11 of TPDS (Control) Order, 2015.
Thus, the formation of VCs in the state was not adequate and functioning was
also not effective.

Chapter II Performance Audit
37
GoR stated (December 2018) that State level VC was constituted on May
2018. GoR did not furnished the reply in respect of non-formation of VCs in
13 Districts, 66 Blocks and 15,665 FPS.
2.1.11.4 Inspections of FPSs not carried out as per norms prescribed by
GoI
Clause 8 of the PDS (Control) Order, 2001 stipulated that the State
Governments should ensure regular inspections of FPSs not less than once in
six months by EOs/EIs, which was revised to at least once in every three
months by clause 11 of TDPS (Control) Order, 2015. Further, as per clause 8
of PDS (Control) Order, 2001 and clause 10 (10) of TPDS (Control) Order,
2015, monthly report on monitoring of FPS and annual report on action taken
against FPS were required to be submitted to GoI.
Audit scrutiny revealed that in five test checked districts29, against a
consolidated requirement of conducting 60,578 inspections, only 11,530
(19.03 per cent) were conducted due to insufficient designated officers/
inspectors as posts of 56 EOs (54.37 per cent) against 103 sanctioned and 193
(61.66 per cent) EIs against 313 sanctioned were lying vacant as of January
2018. Further, the reports required to be submitted to GoI regarding status of
FPS inspections and follow up actions by FCS&CAD, were not being
submitted.
GoR stated (December 2018) that less inspections were carried out due to
insufficient staff.
2.1.11.5 Internal audit was not conducted
Internal audit is an important tool for monitoring over the functions and
functionaries of a department. It also evaluates and contributes to the ongoing
effectiveness and level of compliance. It was observed that the department
neither laid down any plan for internal audit nor deployed regular audit parties
for internal audit. As a result, internal audit was not conducted in any of the
units of the department during 2013-18. Thus, in absence of internal audit
mechanism, the department was not able to monitor the system of TPDS.
GoR while accepting the facts stated (December 2018) that internal audit
could not be carried out due to lack of staff.
2.1.11.6 Social audit was not conducted
Section 28 (i) of NFSA provided that every local authority, or any other
authority or body, as may be authorized by the State Government, shall
conduct periodic social audit of the functioning of FPSs and TPDS. The
findings of social audit were to be published and necessary actions were to be
taken to improve the effectiveness of risk management and monitoring control
29 Information in respect of Bharatpur and Udaipur districts was not provided.

Audit Report (G&SS) for the year ended 31 March 2018
38
over the implementing authorities. The Supreme Court also directed all State
Governments to ensure that social audits are conducted at least once in every
six months by Gram Sabha akin to MGNREGA.
It was observed that the draft rules for carrying out of social audit were not
finalized by the FCS&CAD even after lapse of five years from launch of
NFSA in October 2013.
GoR while accepting the facts stated (December 2018) that draft notification
of Social Audit Rules were sent to Law Department for examination after due
publication on departmental portal and inviting objections/suggestions. It was
also stated that Social Audit would be conducted from 26 January 2019.
2.1.11.7 Redressal of consumers’ grievances
In compliance with Section 14 of NFSA, online grievance redressal
mechanism was started by piggybacking PDS related complaints to GoR’s
central complaints portal-‘Sampark’ from January 2014. A toll free number
181 was also available for registering of consumer grievances. The complaints
registered through 181 were also reflecting on Sampark Portal.
A Vigilance Cell was also functional in FCS&CAD under DSO (Vigilance).
Scrutiny of 35 complaints received with the cell through the Ministers, MLAs,
Anti-Corruption Bureau and aggrieved persons revealed the following:
In 16 complaints, directions were issued to the concerned DSOs to
investigate the case and to submit factual report within seven to 15 days
but the investigation report was not received even after lapse of five
months from the date of issue of directions.
In 19 complaints, an enquiry was conducted by the DSO (Vigilance),
wherein the FPSs dealer were found defaulter in distribution of
foodgrains, non-handing over of foodgrains stock and use of bogus RCs
etc. Though the directions were issued for taking action against the erring
FPSs, the concerned DSOs neither submitted the report of action taken
against defaulter FPS nor was it followed up by any superior authorities.
This shows lack of monitoring and control over district authorities to whom
the function of investigation of complaints and enforcement of law was
assigned.
2.1.11.8 Non-identification of state indicators and non-preparation of
action plan for implementation of Sustainable Development Goals
Sustainable Development Goals (SDGs) came into effect from 1st January
2016. The Planning Commission mapped the SDG targets with the schemes of
Center and State Government. The goals and targets related to FCS&CAD are
shown in the Table 5 below:

Chapter II Performance Audit
39
Table-5
Goal
No.
Goal Nodal
department
Targets Implementing
departments
2 End Hunger, achieve
food security,
improved nutrition
and promote
sustainable
agriculture
Agriculture
Department
2.1 By 2030, end hunger and
ensure access by all people, in
particular the poor and people in
vulnerable situations, including
infants, to safe, nutritious and
sufficient food all year round.
FCS&CAD,
TAD, WCD
12 Ensure sustainable
consumption and
production patterns
Environment
Department
12.3 By 2030, halve per capita
global food waste at the retail and
consumer levels and reduce food
losses along production and supply
chains, including post-harvest
issues
FCS&CAD,
Agriculture
and
Warehouse
Corporation
Principal Secretary, Planning Department, GoR issued (September 2017)
directions for identifying the state indicators and preparing Action Plan for
SDG implementation. Accordingly, FCS&CAD had to submit to Planning
Department by September 2017, a matrix of targets, their current status,
milestones to be achieved by 2019-20, 2022-23 and 2030 respectively. Two
officers, first as Nodal Officer and second as Focal Point officer for data
related information were to be nominated to facilitate the entire exercise
concerned with SDGs.
It was observed that no efforts were taken by FCS&CAD to comply with the
directions of Planning Department as it neither submitted desired note nor
nominated officers required for carrying out the exercise.
2.1.12 Conclusion
National Food Security Act (NFSA), 2013 was enacted in September 2013
which came into effect in Rajasthan from 2 October 2013. For effective
implementation of the NFSA in the state, GoR neither conducted a survey for
identification of beneficiaries nor took effective measures to eliminate
significant numbers of bogus Ration Cards. The quality of wheat could also
not be monitored at any stage of its distribution channel. There were
significant duplications in Aadhar/Bhamashah linking resulting in irregular
distribution of wheat in excess of entitlements. Further, the supply chain
management was not yet computerized.
No efforts were taken to distribute food coupons to 33,271 identified
beneficiaries who were not able to collect foodgrains by visiting FPSs. Despite
the distribution of wheat through Aadhar/Bhamashah enabled PoS which have
unique identification features, there were instances of multiple and duplicate
RCs leading to excess distribution of foodgrains.
Viability of fair price shops in terms of number of linked RCs and minimal
income was not ensured. Absence of automated system and monitoring bodies
like State level Vigilance Committee also resulted in poor monitoring and
weak internal control. Inspite of State Food Commission being notified by
GoR, it was not made functional. Inspections of FPSs were also not carried
out as per prescribed norms by Enforcement Officers/Inspectors. Even after

Audit Report (G&SS) for the year ended 31 March 2018
40
lapse of five years from launch of NFSA in October 2013, social audit was not
conducted as even the rules for carrying out of social audit were not finalized.
These deficiencies coupled with ineffective grievance redressal mechanisms,
lack of regular inspections, non-existent internal and social audit resulted in
weaknesses in the Public Distribution System, GoR should take expedient
measures to address all the deficiencies in order to streamline the PDS and to
make it efficient and achieve food security in the state.
Recommendations:
GoR should
1. Prepare detailed rules, guidelines and methodology for inclusion and
exclusion of Priority Households and conduct a comprehensive annual
review of PHHs to exclude non-entitled beneficiaries and to include
entitled beneficiaries.
2. Issue necessary instructions for detailed investigation of short
accountal/pilferage of wheat noticed in most of the KVVS.
3. Prescribe norms for collecting wheat samples from FCI/wholesalers/
FPSs to ensure distribution and monitoring of quality of foodgrains.
4. Expeditiously implement computerization of supply chain management
and reform of GPS tracking of trucks for effective monitoring of
foodgrains movement. Regular inspection of FPSs and internal/social
audit may also be ensured.
5. Conduct Information Systems Audit and install control-checks wherever
necessary to check the loopholes in Aadhar/Bhamashah enabled
distribution system.
6. Ensure that the grievance mechanism available through State Food
Commission and the District Grievance Redressal Officers as prescribed
under the National Food Security Act, 2013 is made fully functional.

Chapter II Performance Audit
41
School Education Department
2.2 Implementation of Rashtriya Madhyamik Shiksha Abhiyan
Executive summary
Government of India (GoI) launched Rashtriya Madhyamik Shiksha Abhiyan
(RMSA) in March 2009 to make good quality education available, accessible
and affordable to all young persons in the age group of 14-18 years and
integrated (July 2013) implementation of Information & Communication
Technology, construction of Girls Hostels, Inclusive Education for Disabled at
Secondary Stage (IEDSS) and Vocational Education with RMSA from the year
2013-14. A Performance Audit of Implementation of RMSA conducted in 225
test checked schools of nine districts revealed following significant audit
findings:
High-level task force and Core Groups were not constituted at state and
district level respectively. Perspective plan was not prepared at district level
and in 96 per cent of test checked schools, annual plans were not prepared.
Out of 1,51,042, 34,065 habitations (22.55 per cent) did not have access to
Secondary schools within the prescribed limit of five kms and 33.56 per cent of
children remained out of the purview of secondary school. As a result, the
vision of RMSA to ensure universal access of secondary education by 2017
was not fully achieved.
The Pupil Teacher Ratio (PTR) was more than the prescribed limit in 44 per
cent of the test checked schools. This pointed to the asymmetrical distribution
of teachers amongst schools, which was not reflected in the overall state level
PTR. The prescribed minimum of five subject teachers were not posted in 62
per cent of the test checked schools. Out of 14,103 schools, State Government
could not provide science laboratories in 10,216 schools, art/craft/culture
rooms in 10,093 schools, computer rooms in 9,971 schools, library in 9,737
schools and playground in 5,340 schools even after lapse of nine years of
implementation of RMSA. Further, no rooms for secondary classes were found
available in eight out of 225 test checked schools and in 47 per cent of test
checked schools, the classrooms were overcrowded with a student strength
ranging from 51 to 167.
The Gross Enrollment Ratio in Classes IX and X in the State increased from
71.12 per cent (2013-14) to 78.87 per cent (2017-18), even though it could not
attain the goal of universal access of Secondary Education by 2017. The
dropout rate in Class IX in test checked schools was much higher than state
average of 2.16 per cent. There was shortfall of 92.04 per cent and 80.58 per
cent in imparting of in-service training for teachers and induction training to
newly recruited teachers respectively during 2013-18.
In 155 test checked schools, ICT scheme was being conducted without
dedicated teachers and any prescribed syllabus.

Audit Report (G&SS) for the year ended 31 March 2018
42
The significant migration of students from government schools to other
management schools in Class IX points to need for the government schools to
improve quality of education imparted.
2.2.1 Introduction
Government of India (GoI) launched Rashtriya Madhyamik Shiksha Abhiyan
(RMSA) in March 2009 to achieve universal secondary education in a mission
mode. The vision of RMSA is (a) to make good quality education available,
accessible and affordable to all young persons in the age group of 14-18 years,
(b) to ensure universal access of secondary education (100 per cent Gross
Enrollment Ratio) by 2017, (c) to achieve universal retention by 2020,and
(d) to provide access to secondary education with special reference to
economically weaker sections of the society, educationally backward, girls
and disabled children residing in rural areas and the other marginalized
categories.
Further, four other schemes namely “implementation of Information &
Communication Technology”, “Construction of Girls’ Hostels”, “Inclusive
Education for Disabled at Secondary Stage (IEDSS)” and Vocational
Education were integrated (July 2013) with RMSA from the year 2013-14.
Government of India (GoI) and the Government of Rajasthan (GoR) were to
share the expenditure on these schemes in the ratio of 75:25 up to 2014-15
(except 90:10 for Girls Hostel and 100 per cent for IEDSS) and thereafter
uniformly for all schemes/components in the ratio of 60:40.
The main objectives of RMSA are:
1. To ensure that all secondary schools have physical facilities, staff and
supplies,
2. To improve access to secondary schooling to all (Secondary schools
within 5 kms and higher secondary schools within 7-10 kms),
3. To improve the quality of secondary education and to ensure that no
child is deprived of secondary education of satisfactory quality due to
gender, socio-economic, disability and other barriers,
4. To implement information and communication technology (ICT) in
schools,
5. To construct girls hostels and ensure inclusive education for disabled at
secondary stage (IEDSS), and
6. To provide vocational education (VE).
2.2.2 Organizational set-up
For implementation of RMSA in the State, an independent and autonomous
body i.e. “Rajasthan Council for Secondary Education (RCSE)” was

Chapter II Performance Audit
43
constituted (September 2009) and got registered as society under Rajasthan
Society Registration Act, 1958.A Governing Council (GC) headed by Chief
Minister of Rajasthan and represented by various Ministries is responsible to
review the implementation of RMSA and to give overall policy guidance and
direction for efficient functioning of the RCSE.
An Executive Committee (EC) of RCSE headed by Principal Secretary,
School Education Department, GoR is responsible to achieve the objects of the
RCSE and to discharge all its functions and exercise all administrative,
financial and academic authority in this behalf, including powers to create
posts of all descriptions and make appointments thereon in accordance with
the Regulations.
The State Project Director (SPD) is the Principal Executive Officer of RCSE
and implements the various activities of RMSA under the direction and
guidance of the Chairman of EC.SPD is assisted by Additional SPD, Financial
Advisor and Superintending Engineer, etc. Designated District Project
Coordinator (DPC) is responsible for carrying out all activities of RMSA at
the district level. School Management and Development Committee (SMDC)
in each Government school implements the scheme at school level.
2.2.3 Audit Objectives
The Performance Audit aimed to assess whether:
1. Planning for effective implementation of the scheme was adequate and
whether access to Secondary/Senior Secondary Schools was provided
within the distance prescribed in the scheme;
2. Teachers (including pupil-teacher ratio), staff and physical facilities like
school infrastructure, girls hostels, laboratories, text books, etc., were
provided as per norms and were effective in providing quality secondary
education;
3. Targets of enrolment, transition rate and retention rate were achieved
and whether teacher training and schemes for Vocational Education,
Information & Communication Technology and Inclusive Education for
Disabled at Secondary Stage were implemented effectively to improve
the quality of secondary education; and
4. Financial management, internal control, monitoring and evaluation of
the scheme were adequate and effective.
2.2.4 Audit Criteria
The Performance Audit was conducted against the criteria derived from the
following documents:
Framework for implementation of RMSA;
Manual on Financial Management and Procurement (MFMP) for RMSA
2012 (MHRD), Annual Work Plan and Budget (AWP&B) of RMSA,

Audit Report (G&SS) for the year ended 31 March 2018
44
Project Approval Board’s minutes; and circular/orders & instructions
issued by MHRD, GoI and GoR; and
Survey Reports, Unified District Information System for School
Education (UDISE) and other data available on RMSA.
2.2.5 Scope of audit and audit methodology
The Performance Audit on RMSA was conducted during May 2018 to
September 2018 covering period from 2013-14 to 2017-18. The records at the
office of SPD of RMSA in the State and Director Secondary Education were
examined. Besides, nine30 District Project Coordinators (out of 33) and 25
Government schools (90 per cent from rural areas and 10 per cent from urban
areas) from each of the nine districts were selected on random sampling basis.
Out of 25 schools in each district, three schools each having ICT and VE
facilities, two schools having Girls hostel, five schools having IEDSS facilities
were selected apart from 12 schools from rest of schools. On the request of
Principal Secretary, GoR one Government Model School each from seven
selected districts (except Churu and Hanumangarh districts where no model
school established) was also test checked. Thus, 232 schools out of a total of
14,103 Government schools were selected for test check. Data of Unified
District Information System for Education (UDISE) were also analyzed. Joint
physical inspection of selected schools was also conducted along with
departmental officials.
An entry conference was held (May 2018) with Principal Secretary, School
Education Department, GoR wherein Audit objectives, criteria, scope and
methodology were discussed and an exit conference was held (January 2019)
with Commissioner, School Education wherein audit findings were discussed.
Audit Findings
Audit Objective 1: Whether planning for effective implementation of the
scheme was adequate and whether access to
Secondary/Senior Secondary Schools was provided
within the distance prescribed in the scheme.
2.2.6 Planning
2.2.6.1 Non constitution of task force at State level
RMSA framework Paragraph 3.1.1 stipulated for the constitution of a high
level task force to work out comprehensive policies, plan and programmes for
the State. It was observed in Audit that the task force was not constituted at the
State level during 2013-18though district level committees were constituted
under the leadership of District Education Officers. However, a high level
Executive Committee has been constituted under the Chairmanship of
30 Baran, Chittorgarh, Churu, Dholpur, Hanumangarh, Jaipur, Jaisalmer, Jalore and Tonk.
State has been divided into nine educational zones and one district each from nine zones
was selected.

Chapter II Performance Audit
45
Education Secretary which implements the policies, plans and programmes of
RMSA comprehensively for the state.
2.2.6.2 Failure to conduct survey by Core Group
As per Paragraph 3.10 of RMSA framework, setting up of a Core Group of
Governmental and non-Governmental persons at the district level was the
starting point for planning activities. The Core Group would undertake an
extensive visit of the district, by interacting with each household to ascertain
the educational status and the educational need. It was observed in Audit that a
Core Group has been constituted only at State level under the leadership of
State Project Director and a District Executive Committee/Core Group has
been constituted under the Chairmanship of District Collector at district level.
The household survey conducted under Sarva Shiksha Abhiyan (SSA) is also
being used for RMSA. However, the survey conducted for SSA does not fulfill
the purpose as it covers only elementary education.
2.2.6.3 Non-preparation of Perspective Plan at district level
As per Paragraph 3.11.1 of RMSA framework, based on school level plan,
each district was required to prepare a Perspective Plan and an Annual Plan.
The Perspective Plan would be a plan for universalization within the time
frame of RMSA. It would be based on the existing position with regard to
attendance, retention, transition rate, drop out and learning achievement work
out the total requirement for universalization, spread over a number of years.
It was observed in Audit that district level Perspective Plan were not prepared
in any of the districts during 2013-18. RCSE however, prepared Indicative
Perspective Plan of the State for the years 2009-17 on the basis of UDISE and
census data. Thus, perspective plan of the state was not based on the district
level perspective plans and local conditions of the area could not be taken
care of.
2.2.6.4 Non preparation of Annual Plan at school level
As per Paragraph 3.10.5 of RMSA framework, the School has to play a critical
role in the bottom up planning process and the School Management and
Development Committee (SMDC) of every Government Secondary School
has to prepare a school level annual plan. In the un-served areas new schools
are required to be established. In the case of such schools, the school plan will
be prepared by the District Project Coordinator with the help of District Core
Group.
It was observed in Audit that 216 (96 per cent) out of 225 test checked
Government Secondary Schools (GSSs)/Government Senior Secondary
Schools (GSSSs) did not prepare their Annual Plan during2013-18.
GoR stated (December 2018) that annual plans of the Government schools
were prepared as per the prevailing directions. The reply is not correct as
annual plan was not found prepared in 96 per cent of the test checked schools.

Audit Report (G&SS) for the year ended 31 March 2018
46
Thus, the Annual Plans for implementation of RMSA in the State were
prepared without assessing the school level educational needs and the bottom
up approach for planning was not followed as envisaged in the framework.
Due to lack of proper planning, proposals of upgradation of 790 schools and
works of strengthening of 176 schools were rejected/cancelled by MHRD as
discussed in the paragraphs 2.2.7.2 and 2.2.9.5 (ii) respectively.
2.2.7 Access to the schools
2.2.7.1 Habitation without access to Secondary School
As per Paragraph 1.3.1 of the RMSA framework, the vision for secondary
education is to make good quality education available, accessible and
affordable to all young persons in the age group of 14-18 years. It inter alia
provided for establishment of Secondary school within a reasonable distance
of any habitation, which should be five kms for Secondary schools and 7 to 10
kms for Senior Secondary schools to ensure universal access of secondary
education by 2017. Perspective Plan (2009-17) of the State also stipulated that
all habitations would have access to Secondary schools within a radius of five
kms by 2017.
It was observed in Audit that out of 1,51,042 habitations in the State, only
1,16,977 habitations (77.45 per cent) had access to a Secondary school within
five kms, as of March 2018. Thus, 34,065 habitations (22.55 per cent) did not
have access to Secondary schools within five kms, indicating that the objective
of providing Secondary school to all habitations by 2017 was not fully
achieved.
For determining neighbourhood schools, Geographical Information System
(GIS) mapping was conducted in 2009 and 2012 in the State. SPD further
intimated (June2018) that GIS mapping was updated in 2017, however,
in spite of repeated requests, SPD, RMSA did not provide details of GIS
mapping conducted in 2012 and 2017 to Audit. As such, Audit was neither
able to verify the correctness of number of total habitations/number of
habitation with access to secondary schools within the prescribed distance nor
verify whether GIS mapping exercise (2017) was carried out in a transparent
and fair manner.
Further, while considering the proposals for upgradation of schools for
2014-15, MHRD rejected the proposal for upgradation of 300 schools, stating
that ‘School mapping exercise is in process and therefore the total
requirement of Secondary schools in the State has not yet been determined’.
GoR stated (December 2018) that the work of mapping of habitations with
existing secondary schools was under progress.
2.2.7.2 Rejection of proposal of upgradation of 790 Upper Primary
Schools
Scrutiny of Annual Work Plan & Budget of RMSA for the period 2013-18
revealed that SPD, identified 1,063 Upper Primary Schools and proposed for

Chapter II Performance Audit
47
their upgradation. Out of this list, MHRD approved only 273 (25.68 per cent)
schools for upgradation and rejected proposals of upgradation of 790 schools
during 2013-18 since the schools were already notified for upgradation or due
to non-assessment of requirement of Secondary school properly owing to non-
completion of GIS mapping or low gross access ratio, etc.
GoR accepted (December 2018) the facts that MHRD did not approve
proposals for upgradation of upper primary schools to GSSs as the proposals
did not fulfil the specified criteria.
Audit Objective 2: Whether teachers (including pupil-teacher ratio), staff
and physical facilities like school infrastructure, girls
hostels, laboratories, text books, etc., were provided as
per norms and were effective in providing quality
secondary education.
2.2.8 Quality Aspects
Good quality education demands the availability of quality infrastructure,
qualified and trained teachers.
2.2.8.1 Availability of teachers
As per Paragraph 4.6 of RMSA framework and Point 4 of Annexure III of
MFMP, every Secondary school would have at least one Headmaster and five
teachers31 for students' up to 160 and one teacher for every additional 30
students with overall Pupil Teacher Ratio (PTR) not more than 30:1.
The State level position of PTR which is a factor of dividing total number of
students by total number of teachers in Government Senior Secondary/
Secondary schools in the state during 2013-18 is given in Table 1 below:
Table 1: Position of PTR at State level
Year State level range of PTR in Government schools of
State Rural area Urban area
2013-14 Not provided 23:1 23:1
2014-15 22:1 24:1 26:1
2015-16 21:1 21:1 26:1
2016-17 22:1 21:1 25:1
2017-18 22:1 21:1 25:1
Source: As per information provided by Deputy Director (Planning), RCSE.
It could be seen from the table that during 2013-18, PTR in Government
schools was within the prescribed limit of 30:1 when we consider the total
number of teachers and the total number of students in the state. However, in
225 test checked schools, it was observed that, in 44 per cent schools (99 out
of 225), the PTR was more than the prescribed ratio of 30:1 and ranged
between 31:1 to 190:1 as per details given in Table 2 below.
31
One teacher each for English, Hindi, Mathematics, Social Studies & Science.

Audit Report (G&SS) for the year ended 31 March 2018
48
Table 2: PTR of test checked schools
Name of
district
Total
no. of
schools
Overall PTR less than
30:1
Overall PTR more than
30:1
PTR more than 30:1 in
rural area schools
PTR more than 30:1 in
urban area schools
No. of
schools
Range of
PTR
No. of
schools
Range of
PTR
No. of
schools
Range of
PTR
No. of
schools
Range of
PTR
Baran 25 17 8:1 to 23:1 8 36:1 to 69:1 7 36:1 to 69:1 1 45:1
Chittorgarh 25 13 10:1 to 27:1 12 31:1 to 186:1 11 31:1 to 186:1 1 56:1
Churu 25 16 3:1 to 30:1 9 43:1 to 96:1 4 43:1 to 92:1 5 44:1 to 96:1
Dholpur 25 11 12:1 to 30:1 14 34:1 to 84:1 13 34:1 to 84:1 1 83:1
Hanumangarh 25 14 10:1 to 30:1 11 32:1 to 74:1 9 32:1 to 74:1 2 38:1 to 44:1
Jaipur 25 14 6:1 to 30:1 11 34:1 to 53:1 9 35:1 to 52:1 2 34:1 to 53:1
Jaisalmer 25 19 5:1 to 29:1 6 31:1 to 82:1 5 31:1 to 82:1 1 56:1
Jalore 25 11 6:1 to 25:1 14 31:1 to 107:1 13 31:1 to 107:1 1 49:1
Tonk 25 11 5:1 to 26:1 14 31:1 to 190:1 9 32:1 to 190:1 5 31:1 to 63:1
Total 225 126 99 80 19
Source: As per information provided by concerned schools.
From table 2 above, it can be seen that the PTR in 126 out of 225 (56 per cent)
of the test checked schools was within the prescribed limit of 30:1 (ranged
between 3:1 to 30:1). However, 99 out of 225 schools (44 per cent) of the test
checked schools in rural areas and schools in urban areas was not as per the
prescribed limit (ranged between 31:1 to 190:1) .
Even though the overall PTR in Jaipur district was 20:1 and was within the
prescribed ratio of 30:1, various discrepancies in the deployment of teachers
were noticed as discussed below:
Out of 849 schools in Jaipur district, prescribed minimum five teachers
were available only in 184 schools (21.67 per cent). In 438 schools
(51.59 per cent), minimum five teachers were not available. In 56
(6.60 per cent) schools though five teachers were available but
teachers were still less than requirement as per norm (PTR of 30:1).
On the other hand, there were more teachers (six to 20) in 171 schools
(20.14 per cent) than the norm of five teachers.
Also in seven of the 171 schools located in Jaipur city or nearby
(Dudu, Jaitpura and Lunyawas), 10 to 20 teachers were deployed in
these schools even though there were less than 100 students.
Thus, there appears to be an asymmetrical distribution of teachers amongst
schools which was not reflected by overall state level PTR.
2.2.8.2 Non-availability of minimum subject teachers
As per Manual on Financial Management and Procurement (MFMP) for
RMSA norms at least one Headmaster and five subject teachers for students
up to 160 would be posted for secondary classes in every Government school.
Scrutiny of information furnished by RCSE of Government Secondary
Schools (GSSs) having less than five subject teachers revealed that the number
of GSSs having less than minimum five subject teachers reduced from 1,743
in 2013-14 to 118 in 2017-18 due to merger and upgradation of schools.
However, 118 GSSs still did not have the minimum of five subject teachers as

Chapter II Performance Audit
49
per detailed in Table 3 below:
Table 3: Position of GSSs having less than five teachers
Year Government Secondary Schools
Total schools Having less than five subject teachers (percentage)
2013-14 9,060 1,743 (19.24 per cent)
2014-15 7,934 542 (6.83 per cent)
2015-16 4,222 145 (3.43 per cent)
2016-17 4,257 145 (3.40 per cent)
2017-18 4,031 118 (2.93 per cent)
Source: As per information provided by RCSE.
In respect of 10,072 Government Senior Secondary Schools32 (GSSSs), RCSE
did not provide the number of schools having less than five subject teachers
for secondary classes (classes IX and X).
It was noticed that 62 per cent (139 out of 225 schools) test checked
Government Secondary and Senior Secondary Schools33 did not have
minimum five subject teachers during 2017-18 for secondary classes.
GoR did not offer any comment for non-availability of prescribed minimum
subject teachers in 118 GSSs. However, in respect of GSSSs it was stated
(December 2018) that services of subject lecturers are being utilized for
Secondary classes whenever they have free classes. The reply is not
convincing as only 857 GSSSs (8.51 per cent) had science stream and it seems
impracticable that subject lecturers other than Science stream were engaged to
teach Science and Mathematics in secondary classes.
2.2.8.3 Staff strength
It was observed in Audit that during 2013-18, posts of teachers for Class IX
and X were lying vacant ranging from 19.17 per cent to 28.75 per cent. In
2017-18, as against the sanctioned strength of 69,673, 53,502 teachers were
posted and 16,171 (23.21 per cent) posts were lying vacant. However, GoR
stated (December 2018) that as against the sanctioned strength of 73,053
senior teachers, 61,309 were working as on date and 11,744 (16.07 per cent)
posts were lying vacant.
Similarly, it was also noticed that during 2013-18, posts of non-teaching staffs
were lying vacant ranging from 38.23 per cent to 46.10 per cent. In 2017-18,
as against the sanctioned strength of 73,149 of non-teaching staff 43,750 were
posted and 29,399 (40.19 per cent) posts were lying vacant in Government
Secondary Schools (GSSs) and Government Senior Secondary Schools
(GSSSs).
32 (Total GSS/GSSS schools 14,103 minus 4,031 GSS) = 10,072 GSSS. 33 Baran: 17 schools, Chittorgarh: 16 schools, Churu: 15 schools, Dholpur: 19 schools,
Hanumangarh: 17 schools, Jaipur: 9 schools, Jaisalmer: 20 schools, Jalore: 13 schools and
Tonk: 13 schools.

Audit Report (G&SS) for the year ended 31 March 2018
50
2.2.9 Infrastructure facilities
2.2.9.1 Inadequate provision of infrastructure facilities
Paragraph 3.4.1 of MFMP provides for strengthening of infrastructure such as
science laboratory, art/craft/culture room, separate toilet for boys and girls,
drinking water, etc., for each existing schools. These facilities were required to
be provided by the end of 12th five year plan i.e March 2017.
The year-wise position of Government Secondary Schools (GSSs) and
Government Senior Secondary Schools (GSSSs) not having infrastructure
facilities in the State during 2015-18 is shown in the Table 4 given below:
Table 4: Position of lack of infrastructure facility
Year Total
schools
Number of GSSs and GSSSs not having facility of
Science
laboratory
Art/Craft/
Culture
room
Computer
room
Library Drinking
water
Play-
ground
Boundary
wall
2013-14 Not available
2014-15
2015-16 13,882 10,866 11,004 11,010 10,376 677 5,947 783
2016-17 14,056 10,408 10,928 10,577 10,256 619 5,841 819
2017-18 14,103 10,216
(72.44%)
10,093
(71.57%)
9,971
(70.70%)
9,737
(69.04%)
306
(2.17%)
5,340
(37.86%)
744
(5.28%)
Source: As per information provided by RCSE.
As per RMSA guidelines, infrastructure facilities such as science laboratory,
art/craft/culture room, drinking water, etc., would be provided in each existing
GSSs and GSSSs by March 2017. But even after lapse of nine years of
implementation of RMSA, out of 14,103 GSSs and GSSSs in the State,
science laboratory was not available in 10,216 (72.44 per cent) schools, art/
craft/ culture rooms in 10,093 (71.57 per cent) schools, computer rooms in
9,971 (70.70 per cent) schools, library in 9,737 (69.04 per cent) schools,
drinking water in 306 (2.17 per cent) schools, playground in 5,340 (37.86 per
cent) schools and boundary wall in 744 (5.28 per cent) schools as of March
2018.
Similarly, out of 225 test checked schools, science laboratory was not
available in 114 (50.67 per cent) schools, art/craft/culture rooms in 174 (77.33
per cent) schools, computer room in 83 (36.89 per cent) schools, library in 69
(30.67 per cent) schools, drinking water in 15 (6.67 per cent) schools, separate
toilets for boys and girls in 15 (6.67 per cent) schools, playground in 54 (24.00
per cent) schools and boundary wall in 41 (18.22 per cent) schools till date of
audit (December 2018). It was also observed that 217 (96.44 per cent) test
checked schools were not disabled friendly.
In seven test checked Model schools, no shortage in infrastructure facilities
was noticed. Though RCSE intimated (July 2018) that all GSSs and GSSSs
had separate toilets for boys and girls, however separate toilets were not found
available in 6.67 per cent of the test checked schools.
GoR stated (December 2018) that for providing infrastructure facilities, efforts
are being made to make necessary funds available from other schemes of
GoI/GoR.

Chapter II Performance Audit
51
The lack of infrastructure as prescribed in RMSA guidelines, is a big hurdle in
providing quality secondary education in a comfortable learning environment.
2.2.9.2 Inadequate provision of classrooms leading to adverse Student
Classroom Ratio
As per Paragraph 4.6 of RMSA framework, the Student Classroom Ratio
(SCR) of a minimum of 25:1 and maximum 40:1 was to be maintained. The
position of SCR and Additional Class Rooms (ACR) for Classes IX and X in
Government Schools during 2013-18 is given in Table 5 below:
Table 5: Position of SCR at State level
Year No. of students
enrolled
(IX & X)
No. of
classrooms
SCR No. of ACRs
proposed in
AWP&B
No. of ACRs
approved by
MHRD
2013-14 9,78,574 24,557 40:1 1,106 707
2014-15 10,73,730 29,452 37:1 629 0
2015-16 11,40,563 28,545 40:1 1,765 770
2016-17 12,23,640 28,471 43:1 1,702 86
2017-18 13,03,774 22,077 59:1 2,695 11
Total 7,897 1,574
Source: As per information provided by SPD, RMSA
It would be seen from the table above that SCR during 2016-18 in
Government Schools turned adverse (between 43:1 and 59:1) due to the
continuously increasing trend in enrolment of students and decreasing trend in
availability of classrooms for Classes IX and X. Further, it was also observed
that in spite of numbers of classrooms reducing drastically by 6,394 (28,471-
22,077) from 2016-17 to 2017-18, SPD proposed only 2,695 Additional
Classrooms in AWP&B for the year 2017-18 out of which MHRD approved
only 11.
In 225 test-checked schools, the position of SCR during 2017-18 is given in
Table 6 below.
Table 6: Position of SCR in test checked schools
Name of
district
Overall SCR during
2017-18
No. of schools
having no rooms
for Classes IX
and X
SCR more than 50:1
No. of
schools
Range of
SCR
No. of
schools
Range of
SCR
Baran 25 12:1 to 102:1 1 7 54:1 to 102:1
Chittorgarh 25 24:1 to 93:1 0 10 51:1 to 93:1
Churu 25 6:1 to 157:1 0 9 55:1 to 157:1
Dholpur 25 17:1 to 167:1 1 14 51:1 to 167:1
Hanumangarh 25 20:1 to 74:1 3 9 59:1 to 74:1
Jaipur 25 14:1 to78:1 0 15 51:1 to 78:1
Jaisalmer 25 9:1 to 75:1 0 7 56:1 to 75:1
Jalore 25 26:1 to 115:1 1 15 54:1 to115:1
Tonk 25 13:1 to 124:1 2 15 57:1to 124:1
Total 225 8 101
Source: As per information provided by concerned schools
The above table depicts that the maximum limit of SCR was ranging between
74:1 and 167:1in 2017-18 against prescribed norm of 40:1. Further, in eight

Audit Report (G&SS) for the year ended 31 March 2018
52
schools there were no rooms for students of Classes IX and X and in 46.54 per
cent (101 out of 217) schools, the classrooms were overcrowded with a
student strength ranging from 51 to 167. Thus, non-provision of adequate
number of classrooms in these schools resulted in overcrowding in classrooms
causing uncomfortable learning environment for the students, besides
conducting classes by making partitions, in verandahs or under trees.
GSSS, Parsneu, District Churu GSSS, Jhilay, Tonk
It was also observed that 11 Additional Class Rooms, art/craft/culture rooms,
library room, science lab room and computer room constructed in eight test
checked schools of Jaisalmer district were being used for either storage of
furniture/principal room/office room or lying vacant. Thus, these rooms were
not being used for the intended purpose for which they were constructed.
Further, in seven test checked model schools, SCR ranged from 32:1 to 39:1
and was within the prescribed limit of 40:1.
GoR stated (December 2018) that efforts are being made for arranging
necessary funds for construction of Additional classrooms.
The fact remains that in absence of school level annual plan as discussed in
paragraph 2.2.6.4, school specific needs could not be assessed resulting in
overcrowding causing uncomfortable learning environment for the students.
2.2.9.3 Delay in distribution of free text books
Paragraphs 3.10.3 and 3.13.4 of RMSA framework envisage provision of
distribution of free text books to children in Government schools. The State
Government had implemented a scheme since 2004 for providing free text
books to all girl students, all students belonging to SCs and STs and boy
students (whose parents are not tax payers) of Class IX to XII of Government
Secondary Schools (GSSs) and Government Senior Secondary Schools
(GSSSs). As per order (September 2010) of School Education Department,
GoR, consolidated demands for text books for the next academic year were
required to be submitted to Rajasthan State Textbook Board (RSTB) up to
month of July of the current academic year and free text books were to be
supplied by RSTB up to 30th April of the next academic year (at the beginning
of the session).
Scrutiny of records of Director Secondary Education (DSE) revealed that
during 2013-18, DSE never sent the consolidated demand of text books to

Chapter II Performance Audit
53
RSTB on time and sent demand in a piecemeal manner up to month of
September. Further, text books were required to be distributed to students in
beginning of the academic year i.e. in the month of April, but the text books
were actually made available to schools for distribution up to November of the
academic year with delay from one to six months. Thus, inspite of incurring
expenditure of ` 250.60 crore, free text books could not be provided in time to
the eligible students of class IX to XII in the government schools before the
start of the academic sessions.
GoR stated (December 2018) that efforts would be made to provide free text
books in time.
2.2.9.4 Construction and occupancy of Girls hostels
The main objective of providing hostel for Girls was to retain girl children in
Secondary School and also to ensure that girl students are not denied the
opportunity to continue their study due to distance, parent’s affordability and
other connected social factors. Under the scheme one hostel for girls with a
capacity of 100 beds was to be set up in each of the educationally backward
blocks in the state. The girl students in the age group of 14 to 18 years
studying in classes IX to XII and belonging to SCs/STs/OBCs/minority
communities and BPL families would form the target group.
Scrutiny of records revealed that 186 (100 bedded) Girl hostels were to be
constructed in the State up to March 2017. Out of these, 184 Girls’ hostels
were completed and made functional as of June 2018 and their occupancy had
improved to 91.89 per cent. GoR stated (December 2018) that efforts to
further increase occupancy are being made.
2.2.9.5 Civil Works
RMSA provided for infrastructure support to enhance access and enabling
conditions for quality education. Infrastructure support includes opening of
new secondary schools or upgradation of upper primary schools to the
secondary stage and strengthening of existing secondary schools through
construction of Additional Classrooms (ACR), science laboratories, library,
art/craft/culture rooms, computer rooms and separate toilets for girls and boys,
etc.
(i) Upgradation/Strengthening of schools
During 2013-18, MHRD approved 5,897 works for upgradation/strengthening
of school buildings (273 upgradation of schools, 1,574 ACRs, 1,092 Science
laboratories, 1,118 Art/Craft rooms, 702 Computer rooms, 891 Library rooms,
247 toilets) at a total outlay of ` 745.24 crore. Out of these, 5,080 (86.14 per
cent) works were completed, 749 works in progress and 68 works could not be
started as of March 2018.The details of all the works is given in Table 7
below.

Audit Report (G&SS) for the year ended 31 March 2018
54
Table 7: Position of construction of strengthening works
Sl.
No.
Item of
civil work
Works
Approved
by
MHRD
Nos. of
works
completed
(per cent)
Nos. of
works
in
progress
Nos. of
works
not
started
Details of approval of works
not started
1. Upgradation
of school
273 222
(81.32)
50 1 Non availability of land, land
dispute etc.
2. ACRs 1,574 1,477
(93.84)
79 18 Out of 18 works, 11 works
approved in 2013-14, six in
2015-16 and one in 2016-17
3. Science
laboratory
1,092 921
(84.34)
160 11 Out of 11 works, three works
approved in 2013-14, three in
2015-16, two in 2016-17 and
three in 2017-18.
4. Art & Craft
room
1,118 936
(83.72)
171 11 Out of 11, one work was
approved in 2013-14, four in
2015-16, three in 2016-17 and
three in 2017-18.
5. Computer
room
702 620
(88.32)
77 5 Out of five works, two works
were approved in 2013-14, two
in 2015-16 and one in 2016-17.
6. Library
room
891 722
(81.03)
161 8 Out of eight works, two works
were approved in 2013-14, two
in 2015-16, one in 2016-17 and
three in 2017-18.
7. Toilet 247 182
(73.68)
51 14 Out of 14 works, three works
were approved in 2016-17 and
11 in 2017-18.
Total 5,897 5,080
(86.14)
749 68
While the position of completed works was satisfactory, 817 strengthening/
upgradation works (13.86 per cent) were still in progress and completion
thereof required to be expedited.
GoR stated (December 2018) that efforts are being made to complete the
works.
(ii) Cancellation of strengthening works in 176 schools
It was observed in Audit that on the proposals of SPD, strengthening works in
176 schools were approved by the MHRD at a cost of ` 33.09 crore during
2010-14 as detailed in Table 8 below. These works were subsequently
cancelled by MHRD in 2015-16 due to non-availability of land, land dispute
or land was not in possession of schools.
Table 8: Cancelled works
Year No. of
schools
Name of component proposed for cancellation
ACR Science
lab
Computer
room
Library
room
Art/Craft
room
Drinking
water
Total
amount
(` in crore)
2010-11 23 19 18 23 6 23 2 4.90
2011-12 137 75 112 74 48 120 1 24.10
2013-14 16 28 9 6 6 7 0 4.09
Total 176 122 139 103 60 150 3 33.09
In terms of guidelines of RMSA, preparation of proper budget plays an
important role in timely implementation of any projects. Further, each district
was required to prepare a perspective plan up to 2016-17 based on the school

Chapter II Performance Audit
55
level plans as discussed in the paragraph 2.2.6.4. However, as per the
prevailing practice of preparation of State level annual plans based on data
available in UDISE without considering the actual requirements of the
schools, the ground level problems like non availability of land, land dispute,
etc., at individual school level went unnoticed. This resulted in not only
cancellation of strengthening works but the project outlay was also reduced by
` 33.09 crore owing to poor planning.
GoR accepted the facts and stated (December 2018) that strengthening works
of other 176 schools were sanctioned in 2015-16 against the cancellation of
these works.
The reply of GoR needs to be viewed in the light of the fact that in the year
2015-16 itself, GoR had proposed strengthening of 2079 schools and looking
to the huge pendency for completion of works of previous years, GoI did not
sanction any new work except works against cancellation. Thus, cancellation
of strengthening works could have been avoided by ensuring availability of
land for the proposed schools while planning of such works.
(iii) Lapses noticed in test checked districts
School building in dilapidated condition
During test check of Government Senior Secondary School, Ralawata,
Sambhar Lake of Jaipur district, it was observed that school building was in
dilapidated condition and Public Works Department declared this building
abandoned in August 2012. As such suitable rooms were not available in the
school for classroom purpose and all classes were being conducted under trees
and in verandah. Even though the school principal brought this issue various
times in the notice of department, no action was taken till date.
GoR stated (December 2018) that two additional classrooms have been
sanctioned under MPLAD/MLALAD and efforts are being made for repair/
construction of school building from other schemes.
View of dilapidated condition of school building and classes conducting
under tree on 01.08.2018
Incomplete works in test checked districts/schools
Test check revealed that strengthening works (construction of ACRs,
computer rooms, toilets, etc.) in 13 schools sanctioned during 2010-16 at the

Audit Report (G&SS) for the year ended 31 March 2018
56
cost of ` 2.11 crore were lying incomplete as of May-August 2018 as the
contractors abandoned the construction works. This resulted in not only the
students being deprived of the benefits, but also unfruitful expenditure of
` 2.11 crore.
Incomplete work at GSSS, Pali Incomplete work at GSS, Teetarkheri
GoR stated (December 2018) that five works have been completed out of 13
incomplete works and remaining works under progress. However, details of
five completed works was not provided to Audit.
2.2.9.6 Purchase of furniture
(i) Non utilisaiton of furniture grant
As per Paragraph 3.4.1 of MFMP for RMSA, grant was to be provided for
procuring furniture/fixture under the component ‘Strengthening of Schools’
where construction work of library, science laboratory, art/craft/culture/
computer rooms and ACRs had been completed.
Scrutiny of records of nine test checked District Project Coordinators (DPCs),
revealed that RCSE transferred ` 4.49 crore to three District Project
Coordinators during March 2015 to November 2016 for purchase of furniture
for 141 schools under RMSA. Out of ` 4.49 crore, only ` 0.75 crore could be
utilised for purchase of furniture for 37 schools as per details given in Table 9
below:
Table 9: Position of procurement of furniture
(` in crore)
Sl.
No.
Name of
DPC
Month of
transfer of
funds by
RCSE
Fund
released
No of
schools
Amount
utilised
Schools for
which
procured
Amount
lying
unutilized
Reasons for funds
lying unutilised
1. Jaisalmer February &
October 2016
0.71 16 0.00 0 0.71 Due to non
finalization of
tenders
2. Dholpur November
2016
1.66 35 0.00 0 1.66 Due to non
finalization of
tenders as no
tenderer was found
eligible.
3. Tonk March 2015 2.12 90 0.75 37 1.37 Due to non supply
of furniture by firms
to remaining 53
schools
Total 4.49 141 0.75 37 3.74

Chapter II Performance Audit
57
It would be seen from the table above that DPCs, Jaisalmer and Dholpur could
not finalize the tenders for purchase of furniture. In DPC, Tonk though a firm
was finalized, the firm supplied furniture in 37 out of 90 schools only. Thus, in
these three DPCs an amount of ` 3.74 crore (83.30 per cent) meant for
purchase of furniture was lying unutilized for 26 months to 46 months as of
December 2018.
GoR stated (December 2018) that in Dholpur district, utilization of furniture
grant is under progress and district offices of Jaisalmer and Tonk districts have
been directed to refund the unspent amount and fix the responsibility for non-
utilization of funds.
(ii) Avoidable expenditure incurred on purchase of computer furniture
ICT scheme was launched in the State during 2008-16 in 7025 schools34 in
four phases. Under this scheme, computers, its accessories along with
computer chair and tables were provided to these schools.
Scrutiny of records of seven test checked District Project Coordinators (DPCs)
revealed that RCSE transferred funds in March 2015 to the DPCs and further
these DPCs issued Administrative and Financial Sanctions and transferred
` 16.07 crore to 728 schools for purchase of furniture which included
purchase of computer chairs and tables. It was observed that out of 728
schools, in 337 schools computer chairs and tables were supplied without any
requirement as these schools were supplied computer chairs and tables earlier
under the ICT scheme. Thus, in 337 schools extra expenditure of ` 1.40 crore
was incurred on purchase of computer chairs and tables as per details given in
Table 10 below:
Table 10: Details of purchase of computer furniture
(` in crore)
Sl.No Name of
DPC
Particulars of sanction
issued by DPC
Particulars of extra purchase of
computer furniture
No. of
schools
Amount of
sanction
No of schools Amount of
purchase
1 Hanumangarh 78 1.62 49 0.21
2 Dholpur 60 1.57 39 0.20
3 Jaipur 249 3.81 52 0.19
4 Jaisalmer 42 0.73 29 0.11
5 Jalore 98 3.28 76 0.25
6 Tonk 113 3.16 39 0.20
7 Churu 88 1.90 53 0.24
Total 728 16.07 337 1.40
GoR stated (December 2018) that compliance would be intimated after
receiving the reply from the DPCs concerned.
34 1st Phase: 2,500 (2008-09), 2nd Phase: 2,000 (2010-11), 3rd Phase: 2,000 (2013-14) & 4th
Phase: 525 (2015-16).

Audit Report (G&SS) for the year ended 31 March 2018
58
Audit Objective 3: Whether targets of enrolment, transition rate and
retention rate were achieved and whether teacher
training and schemes for vocational education,
information & communication technology and
inclusive education for disabled at secondary stage
were implemented effectively to improve the quality of
secondary education.
2.2.10 Non achievement of universal access of secondary education
The vision of RMSA is to ensure universal access of Secondary Education by
2017 (Gross Enrolment Ratio35 (GER) of 100 per cent). The percentage of
GER of Class IX and X of Government Schools of the State during 2013-18
were 71.12 per cent (2013-14), 69.68 per cent (2014-15), 75.38 per cent
(2015-16), 78.45 per cent (2016-17) and 78.87 per cent (2017-18) showing an
increasing trend yet it could not fully attain the goal of universal access of
Secondary Education by 2017.
2.2.10.1 Enrolment of children in schools
One of the objective of RMSA was to attain universalisation of secondary
education in the State by bringing all the children in the age group of 14-18
years to school for education. Typically children in the age group of 14-18
years would be in classes IX to XII. However, in a scrutiny of UDISE data, it
was observed that some children in the age group of 14-18 years were also
enrolled in Class VIII.
Accordingly, based on the available data, the universalisation of secondary
education for all children in the age group of 14-15 years enrolled in Class
VIII to XII in Government and other schools (including private/other
management schools) were considered for verification by Audit. The position
of projected population of children of all categories, in the age group of 14-15
years as per census 2011 as adopted by GoR vis-a-vis enrolment of children in
the Class VIII to XII in all private/management schools during 2013-14 to
2017-18 is shown in Table 11 below:
Table 11: Enrolment of children of all categories
Year Projected population
of children in the age
group of 14-15 years
as per census 2011
Number of children of
that age group
enrolled in Class VIII
to XII as per UDISE
No of children
out of school
Percentage of
children out of
schools
2013-14 30,06,800 18,12,243 11,94,557 39.73
2014-15 31,95,300 17,97,801 13,97,499 43.74
2015-16 31,51,300 21,32,986 10,18,314 32.31
2016-17 32,72,800 21,74,593 10,98,207 33.56
2017-18 32,30,200 21,12,291 11,17,909 34.61
It would be seen from the table above that though there was increasing trend in
enrolment of children of all categories from 18.12 lakh in 2013-14 to 21.12
35 It shows level of proportion/percentage of relevant age group population enrolled in
Educational Institutions. GER=Total Enrollment in Classes IX and X in a year/
Population of 14-15 years in the same year * 100.

Chapter II Performance Audit
59
lakh in 2017-18. However, the fact remains that 34.61 per cent of children of
all categories were not enrolled in any school (government or private or other
management school) during 2017-18.
GoR stated (December 2018) that efforts would be made to increase
enrolment.
2.2.10.2 Examination results in Government schools vis-a-vis schools of
other Management
RMSA is committed to universalize quality education at Secondary school
stage. The focus on quality interventions would necessitate existence of
quality infrastructure, curriculum development, competency, subject specific
deployment in schools, in-service training of teachers and heads of the
schools, academic support at all levels, classroom based support and
supervision issues etc. It was also envisaged that the Mission would encourage
States to focus on total development of children, encouragement in sports,
cultural activities, etc.
No specific reports/survey regarding quality and desired learning outcomes of
school education for Secondary/Senior Secondary level was available with
MHRD. An analysis of the report of Pratham, a Non Government
Organization prominent in assessment of learning outcomes in education
sector also did not include outcomes for students of secondary/senior
secondary level. The audit analysis of learning outcomes was limited to
analysis of examination results only.
The performance of the students (both boys and girls) of both Government and
other management schools in common class X Board examination, which is a
major indicator of quality education, was analyzed to review whether RMSA’s
other objective of providing quality education was achieved.
Scrutiny of pass percentage of students in class X examination (Rajasthan
Board) in both Government and other than Government Schools furnished by
the Department revealed that at State level, average pass percentage of
students of class X was 69.90 (ranging between 57.55 per cent and 75.61
per cent) in government schools as compared to 77.04 (ranging between 69.51
per cent and 81.09 per cent) in other management schools during 2013-18.
However, the gap between Government schools and other management
schools reduced from 11.96 per cent in 2013-14 to 5.48 per cent in 2017-18.
GoR stated (December 2018) that the reply would be intimated in due course.
Thus, from the examination results for Class X, which is a major indicator of
quality education, though there is further scope for improvement, it appears
that the quality of education improved during the last 5 years.
2.2.10.3 Transition Rate
All the children in the age group of 14-18 years were required to be enrolled in
schools to attain universalization of secondary education.

Audit Report (G&SS) for the year ended 31 March 2018
60
(i) Transition rate from Class VIII to IX
During 2013-18, it was observed that the transition rate from Class VIII to
Class IX in all management schools in the State remained less than 100
per cent (ranging between 91 per cent and 95 per cent) as per details given in
Table 12 below. This indicates that 5 per cent to 9 per cent children were not
enrolled in Class IX.
Table 12: Transition rate of class VIII to IX in all management schools
Enrolment in class VIII Enrolment in class IX in the succeeding year Transition
rate from
Class VIII to
IX
(in per cent)
Year Number of
children
enrolled
Year Total
enrolment in
class IX
Repeater in
class IX
Net
Enrolment in
class IX
1 2 3 4 5 6 (4-5) 7 (col.6/col.2)
2012-13 12,73,868 2013-14 12,16,241 47,666 11,68,575 92
2013-14 12,57,697 2014-15 11,92,043 52,360 11,39,683 91
2014-15 12,24,944 2015-16 12,14,024 51,556 11,62,468 95
2015-16 12,58,976 2016-17 12,18,649 38,809 11,79,840 94
2016-17 12,88,995 2017-18 12,89,822 85,731 12,04,091 93
Source: UDISE data
(ii) Transition rate from Class IX to X
High transition rate from Class IX to Class X is also an indication of quality
education provided in Class IX. The position of transition rate from class IX to
X in all management schools at the State level and in 225 test checked
Government schools during 2013-18 is given in Table 13 below.
Table 13: Transition rate from Class IX to X in test checked and in
all management schools
Year Total enrolment in
Class IX
Fresh enrolment in class X in the
succeeding year
Transition rate from class
IX to X (%)
In all
management
schools
In test
checked
schools
Year In all
manageme
nt schools
In test
checked
schools
In all
management
schools
In test
checked
schools
1 2 3 4 5 6 7 (col 5/col
2)
8 (col 6/
col 3)
2012-13 10,96,079 NA 2013-14 10,80,864 Not
provided
99 -
2013-14 12,16,241 14,671 2014-15 10,71,263 10,408 88 71
2014-15 11,92,043 13,934 2015-16 10,73,327 10,412 90 75
2015-16 12,14,024 14,621 2016-17 10,92,770 11,705 90 80
2016-17 12,18,649 15,538 2017-18 10,79,715 12,310 89 79
Source: Data as per UDISE for State level and as per information provided by concerned
test checked school.
It can be seen from the table that though transition rate from class IX to
Class X in all management schools in the State was more than 88 per cent
(ranging between 99 per cent and 88 per cent) during 2013-18 but in 225 test
checked Government schools it was still up to 80 per cent (ranging between
71 per cent and 80 per cent) during 2014-15 to 2017-18. Low transition rate in
test checked Government school as compared to State average reflects on the
quality of education in these test checked Government schools.
GoR accepted (December 2018) the facts.

Chapter II Performance Audit
61
2.2.10.4 Trends in Dropout
Dropout refers to pupil who leaves school before completion of a school stage
or leaves at some intermediate point of a given level of education. Overall
dropout rate for classes IX and X in the state decreased from 13.65 per cent
(2013-14) to 1.34 per cent (2017-18) as it was 13.65 per cent (2013-14), 12.16
per cent (2014-15), 3.28 per cent (2015-16), 2.16 per cent (2016-17) and 1.34
per cent (2017-18).
However, in nine selected districts, dropout percentage36 in test checked
schools in class IX was 24.03 per cent in Baran, 26.56 per cent in Chittorgarh,
9.12 per cent in Churu, 11.76 per cent in Dholpur, 14.29 per cent in
Hanumangarh, 9.30 per cent in Jaipur, 17.17 per cent in Jaisalmer, 19.58 per
cent in Jalore and 19.39 per cent in Tonk district during 2016-17. The results
of the test checked schools during 2016-17 indicate that the dropout rate in
Class IX was higher than average of 2.16 per cent for the whole state.
GoR accepted the facts and stated (December 2018) that monitoring system at
block, district and state level was being strengthened for improving quality
education in Government schools. Dropout rate would improve in schools on
adoption of new monitoring system.
2.2.10.5 Training to teachers
RMSA framework envisages that the teacher is the most important component
in school education. It is necessary to continuously upgrade the quality of
teachers through in-service education programmes and a variety of other
measures, apart from pre-service qualifying programme of teacher training
viz., B.Ed. Hence, teachers' competency and efficiency can be improved
through focused planning for training so that observable improvements in
student effectiveness and education efficiency in terms of examination results
can be achieved. Scrutiny of records revealed the followings:
(i) Inadequate in-service training
In-service training to teachers: As per Paragraph 3.4.1 (Annexure–III)
of MFMP of RMSA, in-service training was to be given to all the teachers and
heads of schools for five days in a year.
During 2013-18, against requirement of training for 2,65,389 teachers as per
RMSA guidelines, only 32,028 teachers (12.06 per cent) were targeted for in-
service training. Of these, only 21,104 (65.89 per cent) teachers were imparted
in-service training. No training was imparted during 2013-14 though 8,000
teachers were targeted for training. During 2015-16, no teachers were even
targeted for in-service training.
Thus, 92.04 per cent teachers (2,44,285 out of 2,65,389) were not imparted
any in-service training during 2013-18. Further, out of ` 6.97 crore approved
36 The dropout in Class IX in test checked schools was calculated by applying the formula=
Total number of children enrolled in class IX in a particular year– (Number of children
promoted to Class X in next year + Number repeater in Class IX in next year)/Total
number of children enrolled in class IX in the particular year* 100.

Audit Report (G&SS) for the year ended 31 March 2018
62
for in- service training by MHRD, only ` 5.30 crore could be utilised for
imparting in-service training leaving unspent balance of ` 1.67 crore (23.96
per cent).
In-service training to Headmasters/Principals: In eight test checked
districts, out of 7,092 Headmasters/Principals, only 1,584 (22.33 per cent)
Headmasters/Principals were imparted with in-service training during
2015-18 resulting in 5,508 (77.67 per cent) Headmasters/Principals not being
imparted training. DPC, Chittorgarh did not provide such information though
called for by Audit.
(ii) Induction training to newly recruited teachers
As per Paragraph 3.4.1 of MFMP of RMSA, induction training for 10 days
was to be given to all the newly recruited teachers and heads of schools.
It was noticed that against availability of funds of ` 7.60 crore for induction
training of 10 days to 25,348 newly recruited teachers, 20,426 (80.58 per cent)
newly recruited teachers were imparted with induction training at an
expenditure of ` 5.96 crore during 2013-17. Thus, 4,922 newly recruited
teachers were not provided induction training despite availability of funds.
Further, no targets were set for induction training for the year 2017-18.
(iii) Training under different activities
It was also noticed that against availability of funds of ` 8.12 crore for other
trainings to 22,144 teachers/Personnel under different activities, 16,794 (75.83
per cent) teachers/Personnel were imparted training at an expenditure of
` 5.59 crore during 2013-18. Thus, 5,350 (24.17 per cent) teachers were not
imparted training despite availability of funds.
GoR stated (December 2018) that apart from training under RMSA other
training programmes were also organised by Secondary Education, Bikaner
and Career & Technical Education (CTE) under MHRD. The reply is not
convincing as the target set in AWP&B approved each year by GoI was not
achieved. However, State Mission RMSA did not provide any details
regarding number of teachers trained additionally (District wise) by Secondary
Education, Bikaner and CTE during the period 2013-18 to substantiate the
reply.
2.2.10.6 Vocational Education
The objectives for Vocational Education (VE) was to (a) empower Secondary
and Senior Secondary students (both boys and girls) with employable skills
along with academics and making them self-dependent, (b) reduce dropout in
education and (c) make the students belonging to SCs, STs, OBCs
communities and minorities especially girls residing in rural/urban areas self-
dependent. Vocational Education was to be implemented in class IX (level-I)
with the goal to make student employable when they complete Class XII
education (level-IV).

Chapter II Performance Audit
63
Scrutiny of information revealed that VE was introduced in 70 schools in
2014-15 in which 2,678 students were enrolled in level I (Class IX), against
which 1,274 (48 per cent) students had completed level IV (Class XII) in
2018. Similarly, in the year 2015-16, 12,277 students were enrolled in 220
schools (Class IX) of which only 6,114 (49.80 per cent) students completed
level III (Class XI).
GoR stated (December 2018) that due to non-availability of higher classes in
all three streams (Arts, Commerce & Science) in the Government Senior
Secondary School and due to lack of awareness among the parents/students
about Vocational courses, children dropped out after level II (i.e. after class
X). GoR further stated that while selecting Vocational Education schools,
preference would be given to schools where all three streams are available.
(i) Payment for Vocational Training providers without verification
RCSE contracted 20 private Vocational Training Providers (VTP) in four
phases37 for implementation of the scheme “Vocationalisation of Secondary/
Senior Secondary Education (VSHSE)” in alignment with National Skills
Qualifications Framework in Government Schools in the State. As per clause
1.1 to 1.2 of contract agreements, the VTP would pay gross honorarium of
` 1.80 lakh per annum (at the rate of ` 15,000/- per month) and of ` 3 lakh (at
the rate of ` 25,000/- per month) to each Vocational Trainer (VT) and
Vocational Coordinator (VC) respectively by crediting the honorarium directly
to the bank account of VT/VC’s through ECS/RTGS. Further, as per clause
1.3 to 1.4 of the agreements, the RCSE shall reimburse an equal amount of
honorarium which was paid by VTPs to VTs/VCs after proper verification of
the bills.
Scrutiny of records of RCSE revealed that RCSE reimbursed ` 36.65 crore to
20 Vocational Training Providers on account of honorarium paid to
Vocational Trainer/Vocational Coordinators during April 2014 to September
2017 without verification of bills and ECS/RTGS sheet duly verified by the
banks.
It was also noticed that VTs and VCs made complaints against VTPs
regarding non receipt of payment for various months and various issues at
district and State level. It was further noticed that 15 out of 20 VTPs paid
honorarium to VTs at different rates ranging from ` 12,345 to ` 14,800 per
month against contract agreement, for which no supporting documents were
attached with the bills. However, RCSE reimbursed at the full rate (i.e.
` 15,000 per month to VTs) without verification of bank’s certified NEFT/
RTGS/ECS sheets which was violation of the agreement. GoR accepted the
facts and stated (December 2018) that the supporting documents are being
obtained with bills before making payment to VTPs. The fact remains that no
action was taken to check the genuineness of earlier payments.
37 Scheme was implemented in 70 schools in 2014-15 (Phase-I), 220 in 2015-16 (Phase-II),
380 schools in 2016-17 (Phase-III) and 50 schools in 2017-18 (Phase-IV).

Audit Report (G&SS) for the year ended 31 March 2018
64
Further, RCSE released advance payment of ` 40.32 lakh to M/s Alies
Enterprises for the period of July 2017 to September 2017. However, despite
the fact that there is no provision in the agreement for advance payment. The
firm did not make any payment to VTs/VCs as of August 2018 resulting in
undue benefit to the firm to the tune of ` 40.32 lakh.
While accepting the fact, GoR stated (December 2018) that firm has been
directed to make payments to VTs/VCs and Government also proposed to take
legal action against the firm and provision for performance guarantee has
since been made in all the agreements executed in current year.
(ii) Engaging Vocational Trainers without establishment of Vocational
Labs in the schools
It was observed that Vocational Education scheme was being implemented in
720 Government Senior Secondary Schools (two trades per school) and two
VTs per school were engaged in the state. Against 1,440 labs to be established,
only 1,285 labs were established in these schools. Thus, 155 Vocational
Trainers (1,440-1,285) were engaged as of June 2018, without having trade
labs.
GoR stated (December 2018) that 1,408 Vocational labs have been established
against 1,440 labs as of December 2018 and remaining labs are being
established. Services of Vocational Trainers are being used for theoretical as
well as practical classes of vocational trades.
2.2.10.7 Information and Communication Technology
The main objectives of ICT was to create (a) an environment to develop a
community knowledgeable about ICT and (b) ICT literate community which
could deploy, utilize benefit from ICT and contribute to nation building.
Under ICT, all schools should eventually become smart, connected through a
common resource internet based platform. The shortcomings noticed in
implementation of ICT are discussed in the succeeding paragraphs.
(i) Non-conduct of classes as per prescribed syllabus
It was observed that as of July 2018 the ICT scheme (a GoI scheme) was
introduced in 8500 Government Secondary Schools (GSSs)/Government
Senior Secondary Schools (GSSSs) in the State. Out of test checked 225
schools, ICT was being implemented in 156 schools only, of which ICT
classes were being conducted without any prescribed syllabus in the 155 test-
checked schools. Only in one school in Baran district classes being conducted
as per prescribed syllabus. GoR stated (December 2018) that ICT classes are
being conducted as per prescribed syllabus. However, GoR did not offer
comment on the conduct of ICT classes without prescribed syllabus in 155 test
checked schools.
(ii) Non establishment of smart schools
As per Paragraph 4 of the Amended Guidelines of ICT in Schools Scheme
(February 2011), the emphasis would not only be on the use of Information
Technology but also on the use of skills and values that will be important in
future and at least one section (of 40 students) in each classes IX-XII will be

Chapter II Performance Audit
65
fully computerized. Thus, a school having 160 computers at the rate of 40
computers for each IX to XII classes may be called a smart school under the
scheme. Five Government Senior Secondary Schools (GSSSs) in Rajasthan
State were to be converted into smart schools during XI Five Year Plan up to
March 2012. Under this scheme, a non-recurring grant of not more than
` 25 lakh per smart school for purchase of 40 computers and recurring grant of
` 2.50 lakh per annum per smart school as maintenance, consumable, inter
usages and monitoring costs was to be given.
Scrutiny of records revealed that SPD, RCSE submitted a proposal to MHRD
for establishment of seven smart schools in Rajasthan in AWP&B for the year
2013-14. MHRD did not approve the proposal stating that the State
Government is yet to implement ICT in 4,000 schools approved up to
2010-11. Audit further observed that Project Approval Board approved ICT
scheme in 6500 schools38 during 2007-08 to 2010-11. Out of these, the State
Government implemented ICT in 2500 schools in Phase I in August 2008
only. Though ICT phase II started in 2000 schools in August 2010, but due to
delay in tender process and Rajasthan Assembly Election in 2008-09, it could
not be implemented in 2010-11.
GoR stated (December 2018) that instead of smart schools, smart virtual
classrooms have been established in 770 schools during 2016 under Education
& Research Network (ERNET). Thus, due to non-implementation of ICT in
4,000 schools on time, MHRD rejected the proposal for establishment of
seven smart schools in 2013-14.
2.2.10.8 Inclusive Education for Disabled at Secondary Stage
Inclusive Education for disabled at Secondary Stage (IEDSS) scheme was
introduced with a view to provide educational opportunities for children with
disabilities in general schools and to facilitate their retention in the school
system. The scheme provides facilities like free books and stationery, uniform,
transport allowance, reader allowance, escort allowance, hostel
accommodation, actual cost of equipment and payment of stipend to disabled
girl child. The scheme also supports appointment of special educators and
provision for resource room in each block. Special educator would be
appointed in resource centres39 in the ratio 1:5. Every school where more than
five disabled children are enrolled would have the services of at least one
special teacher. The shortcoming noticed in implementation IEDSS are
discussed in the next paragraphs.
(i) Shortfall in enrolment in resource centres
It was observed that 295 resource centres were opened in the selected
Government Secondary Schools (GSSs) and Government Senior Secondary
Schools (GSSSs) to cater to the need of disabled children identified in the
entire block. During 2017-18, as per the UDISE data 12,111 Children with
Special Needs (CWSN) were identified in 295 blocks. Out of them, only 8,051
38 2007-08: 2,500 schools, 2008-09: 2,000 schools and 2010-11: 2,000 schools. 39 One resource centre would be opened in a Government school in each block and to cater
the need of disabled children identified in the entire block by facilitating them with aids
and appliances to impart proper training.

Audit Report (G&SS) for the year ended 31 March 2018
66
(66.48 per cent) CWSN were enrolled in resource centres resulting in shortfall
in enrolment of 33.53 per cent (4,060 CWSNs). Further, in 12 resource
centres, there was zero enrollment inspite of 411 CWSNs identified in that
area. This indicates that necessary efforts were not being made by the Special
Educators/Principals of the schools concerned to enroll these identified CWSN
at the resource centres.
GoR stated (December 2018) that only needy CWSN students are required to
enroll in the resource centres. The reply is not convincing as there was no
mechanism available to identify that all the 411 CWSN students were not
needy.
(ii) Resource Centres in test checked schools
In 225 test checked schools, 45 resources centers were test checked, out of
which in three resource centres40, 16 to 66 CWSN were enrolled but no special
educator was posted since opening of these resources centers.
(iii) Stipend to CWSN girl children
IEDSS scheme envisaged payment of stipend to all disabled girl children at
the rate of ` 200 per month at the secondary level to encourage their
participation upto senior secondary level. The position of stipend paid to
CWSN girl children during 2013-18 is given in Table 14 below.
Table 14: Stipend paid to CWSN girl children
Year Total identified CWSN
girl children as per
UDISE
No. of CWSN girl children to
whom stipend paid
Shortfall
2013-14 2,090 Nil 2,090 (100%)
2014-15 2,319 2,085 234 (10.09%)
2015-16 2,123 1,278 845 (39.80%)
2016-17 3,040 1,971 1,069 (35.16%)
2017-18 5,005 3,040 1,965(39.26 %)
Total 14,577 8,374 6,203 (42.55%)
It was observed from the table above that SPD, RCSE did not consider actual
data of UDISE while sending the proposal to MHRD for approval for payment
of stipend to CWSN girl children. There was shortfall ranged from 10.09
per cent to 100 per cent. This resulted in deprival of benefits to 6,203 (42.55
per cent) identified CWSN girl children during 2013-18.
Audit Objective 4: Whether the financial management, internal control,
monitoring and evaluation of the scheme were
adequate and effective
2.2.11 Financial Management
The funding of the schemes (RMSA, ICT and Vocational Education) was in
the ratio of 75:25 between the GoI and the GoR up to 2014-15 (except of
90:10 for Girls’ hostel and 100 per cent for IEDSS). It was in the ratio of
40 GSSS Tibii (66 children enrolled), GSSS Sangaria (16 children) and GSSS Bidasar
(24 children).

Chapter II Performance Audit
67
60:40 for all components from 2015-16 onwards. The shortcomings noticed
during Audit in financial management of RMSA are discussed in the
succeeding paragraphs.
2.2.11.1 Receipts of funds and expenditure under RMSA
As per the audited annual accounts of RCSE the position of funds released by
the GoI and the GoR under RMSA and expenditure incurred there against
during 2013-18 is given in the Table 15 below:
Table 15: Position of funds released and expenditure incurred
(` in crore)
Year Approved
Outlay
Opening
Balance
Funds released by Other
Receipt
Total
availability
of funds
Expenditure
incurred
Unspent
Balance
(percentage) GoI State
1 2 3 4 5 6 7 (3+4+5+6) 8 9 (7-8)
2013-14 263.98 142.23 274.13 89.82 49.37 555.55 125.37 430.18 (77.43%)
2014-15 148.98 432.25 475.36 307.01 29.40 1,244.02 944.72 299.30 (24.06%)
2015-16 940.53 292.90 382.65 278.11 45.20 998.86 776.53 222.33 (22.26%)
2016-17 1,300.64 219.42 356.49 237.66 26.70 840.27 840.55 (-) 0.28 (0.03%)
2017-18* 1,211.41 (-) 0.28 412.21 213.51 0 625.44 822.90 (-) 197.46 (31.57%)
Total 3,865.54 1,900.84 1,126.11 150.67 3,510.07
Source: Certified UCs of relevant years and figures given by RCSE in respect of the year 2017-18.
*Provisional figures as the annual accounts for the year 2017-18 have not been audited.
It can be seen from the table above that:
(i) During 2013-17, there were differences between closing balance of a
financial year and opening balance of the corresponding next financial
year. While accepting the fact GoR stated (December 2018) that reasons
for difference would be intimated after obtaining information from
concerned Chartered Accountants.
(ii) During 2017-18 the expenditure of ` 197.46 crore (31.57 per cent) was
incurred more than available fund.
2.2.11.2 Delay in release of funds by GoR to State Implementing Society
RMSA framework envisages that the participating state would contribute its
cost in the agreed ratio within 30 days of the receipt of GoI contribution as per
the sharing arrangement.
Review of the information provided by RCSE revealed that during 2013-18
there were delays ranging from five to 249 days in release of matching share
by GoR amounting to ` 700.75 crore to RCSE beyond the prescribed 30 days
of the receipt of GoI contribution.
GoR stated (December 2018) that the funds are being released timely after
2013-14. The reply is not tenable as there were delays ranging from five to
249 days in release of matching share by GoR during 2013-18.
2.2.11.3 Failure to open separate bank accounts
As per Paragraph 3.18.4 of RMSA framework, separate bank accounts shall be
opened for funds under RMSA at the State, district and schools levels.

Audit Report (G&SS) for the year ended 31 March 2018
68
It was observed in Audit that funds under RMSA were being kept in separate
bank accounts at the state level (SPD, RCSE) and with selected nine District
Project Coordinators. Separate bank accounts were not opened for RMSA
funds in 139 test checked schools41. The funds at the school level are being
kept in the bank accounts along with funds received under other schemes.
Keeping funds of all schemes in one account at the school level often leads to
misutilization of funds relating to one scheme in another scheme. GoR stated
(December 2018) that separate ledger was maintained in schools but did not
furnish reply of non-maintenance of separate bank account.
2.2.12 Monitoring and evaluation
2.2.12.1 Internal audit arrangements
As per Paragraph 6.9.1 of Manual of Financial Management and Procurement
(MFMP), the internal audit of State Project Director (SPD) and District Project
Coordinators (DPCs) offices would be carried out every year. Internal audit of
schools would be conducted on a percentage basis, so as to cover five per cent
of schools in each district.
It was observed in Audit that, internal audit was conducted only from the year
2014-15 onwards, whereas RMSA project was started from the year 2008-09.
Scrutiny of the Internal Audit Reports of RMSA for the years 2015-16 and
2016-17 revealed that the internal audit only covered financial activities (bank
reconciliation, advances to employees and accounts) and not any operational
activities. Thus, the scope of internal audit was limited.
The internal audit for the year 2016-17 pointed out significant difference
between cash balance as per cash book and bank book but the same had not
been reconciled even as of August 2018. Further internal audit reports were
not placed before Executive Committee of RCSE during 2013-18 as required
in Paragraph 6.9.9 of MFMP.
During scrutiny of payment vouchers of Vocational Education, it was
observed that payments to Vocational Training Providers was made without
following the conditions of agreement as commented earlier in
paragraph 2.2.10.6 (i).
GoR accepted the facts and stated (December 2018) that action would be
initiated after reconciliation of differences in cash book and bank balances, the
internal audit report would be placed in next Executive Meeting and separate
internal audit arrangements would be made in respect of Vocational
Education.
2.2.12.2 Monitoring by SMDC
As per guidelines for Community Mobilisation and School Management and
Development Committee (SMDC) issued by GoI, every Secondary school will
41 Baran: 13 schools, Chittorgarh: 11 schools, Churu: 10 schools, Dholpur: 17 schools,
Hanumangarh: 14 schools, Jaipur: 19 schools, Jaisalmer: 22 schools, Jalore: 20 schools
and Tonk: 13 schools.

Chapter II Performance Audit
69
constitute a SMDC at the school level. SMDC plays a vital role in monitoring
and is also responsible for preparation of school level Annual Plan and
perspective plan. So, proper training and capacity building of SMDC members
about their roles and responsibilities is extremely critical towards ensuring
their active and effective participation in planning, plan preparation,
monitoring & supervision of the school level activities. With regard to the
monitoring and training of SMDCs, it was observed that:
(i) Deficiency in training of SMDC members
RMSA guidelines provide for two days training in a year to SMDC members
including the members of both the committees (Academic & School building)
at the rate of ` 300 per person per day.
Scrutiny of records of RCSE revealed that out of 2,53,854 SMDC members42
in the entire state, RCSE proposed training for only 1,687 SMDC members
(0.66 per cent). Further, out of targeted 1,687 SMDC members, training were
imparted to only 1,487 members for two days only in one year. Thus, coverage
of training for SMDC members was grossly inadequate.
(ii) Shortfall in conducting SMDC & PTA meetings
RMSA guidelines provide for conducting SMDC meetings twice in a month
and Parent Teacher Association (PTA) meeting once in a month.
As per information provided by 175 test checked schools of seven selected
districts, shortfall in conducting meetings of SMDC ranged between 61.97 per
cent and 80.90 per cent and shortfall in conducting PTAs ranged between
70.27 per cent and 88 per cent during 2013-18. Test checked schools of Baran
(25 schools) and Chittorgarh (25 schools) districts did not provide the
information.
GoR stated (December 2018) that compliance would be made after collecting
information from districts offices.
2.2.13 Evaluation of RMSA by external agency
As per Paragraph 9.2 of RMSA framework, verification and quality audit by
external and independent institutions must be conducted at State and district
level. It was observed in Audit that the evaluation work for RMSA activities
was assigned to an external agency only in 10 districts during 2014-15.
Thereafter, no work has been assigned to any agency to carry out evaluation of
RMSA activities in the State.
2.2.14 Conclusion
Government of India (GoI) launched Rashtriya Madhyamik Shiksha Abhiyan
(RMSA) in March 2009 to make good quality education available, accessible
and affordable to all young persons in the age group of 14-18 years. Though
there has been steady progress in the implementation of secondary education
in the state during the period 2013-18 through better enrolment, higher 42 Calculated on the basis of minimum 18 member per school for 14,103 schools (being
2,53,854 members).

Audit Report (G&SS) for the year ended 31 March 2018
70
transition between classes and lower dropout, the physical infrastructure and
the availability of teachers in secondary schools was still not adequate.
Audit noticed that 22.55 per cent habitations (34,065 out of 1,51042) did not
have access to Secondary schools within prescribed limit of five kms,
indicating that the vision of RMSA to ensure universal access of secondary
education by 2017 was not fully achieved.
In 44 per cent (99 out of 225) of the test checked schools, Pupil Teacher Ratio
(PTR) ranged between 31:1 to 190:1. This pointed to the asymmetrical
distribution of teachers amongst schools, which was not reflected in the
overall state level PTR which was within the prescribed limit of 30:1.
Government could not provide basic infrastructure facilities in every school
even after lapse of nine years of implementation of RMSA.
Though Gross Enrolment Ratio (enrolment in class IX and X as a percentage
of total population of age group 14-15 years) in Classes IX and X in the State
increased from 71.12 per cent (2013-14) to 78.87 per cent (2017-18), yet it
could not attain the goal of universal access of Secondary Education by 2017.
The transition rate from Class IX to X during 2014-15 and 2015-16 in 225 test
checked Government Schools was up to 80 per cent as compared to State
average of 90 per cent of all management schools points to the need for the
government schools to improve quality of education imparted.
The above deficiencies are indicative of the fact that the vision of RMSA to
ensure universal access of secondary education by 2017 was not fully
achieved.
Recommendations:
GoR should
1. Streamline the planning process as envisaged in the RMSA framework
duly updating the GIS mapping exercise and follow bottom up planning
approach for effective implementation.
2. Ensure maintaining prescribed PTR in all individual schools and posting
of minimum five subject teachers for secondary classes as per the RMSA
norms to improve the quality of teaching.
3. Ensure that all schools must comply with infrastructural norms for an
effective learning environment.
4. Identify the root cause for low enrolment at the village, block and district
level by mandatorily conducting a household survey through the core
group already envisaged under the RMSA framework.
5. Ensure mandatory training to teachers and regular monitoring and
evaluation of the scheme at all levels for effective implantation of RMSA
in the state.


71
Chapter III
Compliance Audit
Audit of transactions of the Government Departments, their field formations
as well as audit of the autonomous bodies brought out lapses in management
of resources and failures in the observance of the norms of regularity,
propriety and economy, which have been presented in the succeeding
paragraphs under broad objective heads.
Animal Husbandry and Higher Education Departments
3.1 Loss to the contributors of New Contributory Pension Scheme
Loss of ` 3.49 crore to the subscribers of New Contributory Pension
Scheme due to keeping funds in savings bank account and delay in
transferring the contributions to National Securities Depository Limited.
Government of Rajasthan (GoR) introduced (January 2004) new Contributory
Pension Scheme (NPS) for State Government employees appointed from
January 2004. The contributions were required to be deposited in the pension
account maintained with Pension Fund Regulatory and Development
Authority (PFRDA), which was to be appointed on a later date. Meanwhile,
GoR notified (August 2005) that the amount of contribution towards the
pension account shall be retained in interest bearing Personal Deposit (PD)
account as an interim measure. Further, Finance Department, GoR issued
(June 2005 and July 2009) directions that funds of NPS subscribers kept in PD
account, shall carry an interest of eight per cent per annum. Subsequently,
GoR did not appoint PFRDA and opted (August 2009) for NPS of
Government of India (GoI). Thereafter, GoR signed (November 2010) an
agreement with National Securities Depository Limited (NSDL) for
maintenance of accounts and the funds were to be transferred to NSDL from
July 2011. The scheme was also applicable to employees of all universities in
the state.
Under NPS, the total contribution uploaded in an employee's account was to
be divided among the three Pension Fund Managers1 (PFMs) in a ratio
prescribed by GoR and units to be allotted in the subscribers account
accordingly. PFMs would invest the money in different financial instruments
within the investment guidelines laid down by PFRDA and declare Net Asset
Value (NAV) at the end of each day. Accordingly, units based on NAV were
to be credited in the subscriber's account. The present value of the investment
was to be arrived at by the units held multiplied by NAV.
Test check (February-June 2018) of the records of University of Kota,
University of Rajasthan, Jaipur and Rajasthan University of Veterinary and
1 SBI Pension Funds Private Limited, UTI Retirement Solutions Limited and LIC Pension
Fund Limited.

Audit Report (G&SS) for the year ended 31 March 2018
72
Animal Sciences (RAJUVAS)2, Bikaner revealed that ` 20.59 crore collected
as contribution from the salary of 671 employees of the Universities as well as
employer’s contribution under NPS for the period 2005-2018, was deposited
in the savings bank accounts by the Universities contrary to the direction of
the Finance Department to deposit in PD account bearing interest of eight per
cent.
Further, the funds accumulated upto 2010-11 were also required to be
transferred to NSDL from July 2011 as directed by GoR. The Universities
however, did not follow the direction concurrently and deposited only ` 18.22
crore with NSDL from later periods. The universities however did not deposit
` 2.47 crore with NSDL as of June 2018, as details given in Table 1.
Table 1
(` in crore)
Name of the
University
No. of
Employees
Period for
which
contribution
received
Amount
to be
deposited
with
NSDL
Amount
deposited
with
NSDL
Amount
not
deposited
with
NSDL
Loss of
returns to
the
contribut
ors based
on NAV
Interest
earned in
the
Saving
Bank
Account
Net
loss
University of
Kota
113 2005-18 3.38 2.87 0.51 1.18 0.27 0.91
University of
Rajasthan,
Jaipur
413 2005-18 11.39 10.62 0.77 1.42 0.25 1.17
RAJUVAS,
Bikaner
145 2005-18 (Upto June
2018)
5.92 4.73 1.19 1.62 0.21 1.41
Total 671 20.69 18.22 2.47 4.22 0.73 3.49
Thus, failure to deposit contribution with NSDL from July 2011 resulted in a
loss of ` 3.49 crore (Appendix 3.1) to the contributors, which is the difference
between returns based on NAV3 declared by one of the fund managers i.e. SBI
Pension Fund on accumulated fund to be deposited with NSDL and interest
earned on the amount retained in saving bank account during that period.
GoR, in case of University of Kota and University of Rajasthan, stated
(August 2018) that balance contribution along with interest has been deposited
in Permanent Retirement Account Numbers (PRANs) accounts of employees
of the University of Kota in July 2018 and the balance contribution along with
interest of employees of the University of Rajasthan is being reconciled and
after reconciliation, the same would be deposited in respective accounts of the
contributors.
In case of RAJUVAS, GoR stated (September 2018) that delay in transferring
contributions to NPS was due to non-availability of PRANs. The reply was not
2 The RAJUVAS, Bikaner was constituted and came into existence in May 2010 under
RAJUVAS Act, 2010 consequent to carving out of units pertaining to Veterinary and
Animal Sciences from Swami Keshwanand Rajasthan Agricultural University (SKRAU),
Bikaner and Maharana Pratap University of Agriculture and Technology, Udaipur. 3 The NAV prevailing on the last day of each year has been taken for calculation of the loss
in the absence of details of monthly contribution.
Chapter III Compliance Audit
73
convincing as the University was also responsible for allotment of PRANs to
the contributors for timely transferring of their contribution to NSDL.
The fact remains that retaining the contributions in savings bank accounts
instead of PD accounts and delay in depositing the contribution with NSDL
resulted in a loss of return of ` 3.49 crore to 671 employees of three
Universities.
Thus, the Universities on the one hand, kept the funds in saving bank accounts
with lower interest rates and on the other hand did not transfer the same to
NSDL from July 2011 resulting in loss to the employees making NPS
contributions.
Public Health Engineering Department
3.2 Irregular and unauthorized expenditure on additional works
Irregular and unauthorised expenditure of ` 7.15 crore on execution of
additional works in contravention of financial rules.
Rajasthan Public Works Financial and Accounts Rules (PWF&ARs) delegate
the financial power of sanction, execution and payment of additional quantities
of items existing in Schedule ‘G’ or Bills of Quantities (BoQ) of a particular
work to the various levels of authorities in the Department. Accordingly, Chief
Engineer (CE)/Additional Chief Engineer (ACE)/Superintending Engineer
(SE)/Executive Engineer (EE) could sanction additional quantity up to 5 per
cent of original quantity of each item subject to 5 per cent of tendered amount
of works sanctioned by the authority concerned. Additional quantity up to 25
per cent of original quantity could be sanctioned by next higher authorities
subject to 25 per cent of tendered amount of work concerned. Administrative
Department could sanction additional quantity up to 50 per cent of original
quantity subject to 50 per cent of tendered amount of work concerned.
(i) Test check (November to December 2017) of records of EE, Public
Health Engineer Department (PHED) District Division-III, Jodhpur and SE,
PHED, Circle Sawai Madhopur revealed that the CE (Project), Jodhpur and the
SE, Sawai Madhopur approved (September 2013 and September 2015) the
rates of the respective lowest bidders4 for carrying out the works valuing
` 2.50 crore and ` 0.80 crore respectively. Therefore, they were empowered to
sanction additional quantities of ` 0.125 crore and ` 0.04 crore respectively
(being 5 per cent of the tendered amount) over the original quantities
sanctioned by them.
However, after exhausting the financial limits for these works, the tender
approving authorities (CE, Jodhpur and the SE, Sawai Madhopur), continued
the rate contracts, without inviting fresh tenders and the contractors executed
the works of ` 4.95 crore against the total tendered amount of ` 3.30 crore,
4 M/s Shiv Construction Co., Jodhpur and M/s Ram Swaroop Gurjar, Sawai Madhopur.

Audit Report (G&SS) for the year ended 31 March 2018
74
which was ` 1.65 crore (50 per cent) over the tendered amount and for it, the
approval from administrative level of the department was required but the
same was not obtained.
GoR stated (August 2018) that financial limit was enhanced upto 50 per cent
of the tendered amount by CE (Project) for the work of District Division-III,
Jodhpur as per Rule 73 of Rajasthan Transparency in Public Procurement
(RTPP) Rules. Reply is not convincing as the audit contention is not about
enhancement in the work but on the failure to get the requisite approvals from
the competent authority as per PWF&ARs to sanction this enhancement in
work.
(ii) Similarly, test check (March 2017) of records of Executive Engineer,
PHED, Project Division, Sardarshahar, revealed that the Finance Committee
(FC) of Rajasthan Water Supply and Sewerage Management Board approved
(August 2013) the rate of M/s L&T Construction, Chennai for ‘Ratangarh
Sujangarh Water Supply Project Phase-II’ for ` 591.40 crore. The work
included laying of 280 mm and 315 mm UPVC-3 pipe of lengths 839 and
3,637 meters respectively. However, the contractor was paid (March 2018) for
25,388 and 10,864 meters quantities respectively upto 47th running bill (details
given in Table 2).
Table 2
(` in crore)
S.
No.
Item Details of pipes
provided in Work order
Details of payment made
to the contractor
Quantity
excess over
sanctioned
quantity Length
(in meter)
Amount Length
(in meter)
Amount5
1. 280 mm UPVC-3
pipe
839 0.15 25,388 4.20 2,926 per cent
2. 315 mm UPVC-3 pipe 3,637 0.86 10,864 2.31 199 per cent
Total 1.01 6.51
It is evident from the table that the total tendered value of the items was ` 1.01
crore but the EE paid the contractor for quantities valuing ` 6.51 crore, which
was 545 per cent (` 5.50 crore) more than the original value. According to
PWF&ARs, the competent authority was empowered to sanction additional
items valuing ` 0.51 crore (50 per cent of the original value) however,
approval of the competent authority for the additional quantities valuing ` 5.50
crore was not obtained by EE before making payment to the contractor.
GoR stated (August 2018) that quantity of 280 mm and 315 mm pipes were
enhanced due to revision in drawings on the basis of final survey conducted by
the contractor and deviation statement would be submitted for approval after
completion of the work. Reply is not convincing as the increase in quantity of
pipes after the final survey conducted by the contractor leading to revision in
drawings, indicated improper planning for execution of the work and hence
required approval of the higher authorities as per PWF&ARs.
5 Calculated at 90 per cent of full rate for UPVC-3 Pipes (280 mm: ` 1,836 per meter and
315 mm: ` 2,361 per meter) for laying of pipes, pending sectional testing and
commissioning.

Chapter III Compliance Audit
75
Thus, execution of additional works in contravention of PWF&ARs led to
irregular and unauthorised expenditure of ` 7.15 crore.
3.3 Unfruitful expenditure due to reduction in quantity and quality of
pipes
Unjustified reduction in quantity and quality of pipes with an intention to
limit the value of sanction within the competency of Additional Chief
Engineer led to non-commissioning of Over Head Service Reservoirs for
more than three years and rendered expenditure of ` 0.94 crore
unfruitful. Besides, not achieving intended objective of providing
drinking water to habitations.
Superintending Engineer (SE) (Operation & Maintenance), Project
Management Cell, Public Health Engineering Department (PHED), Circle-
Churu issued (August 2012) two separate Technical Sanctions (TSs) each of
` 0.43 crore for providing drinking water to two water deficit zones of
Sardarshahar town namely Zone 5 and 6 inhabited predominantly by persons
belonging to scheduled caste/scheduled tribe community. The TSs included
the work of construction of two new Over Head Service Reservoirs (OHSRs)
one for each zone and connecting them with the existing distribution network
by providing pipes for rising and distribution mains. Subsequently, Additional
Chief Engineer (ACE), Bikaner issued (November 2012) two Administrative
and Financial (A&F) sanctions for ` 49.86 lakh and ` 49.71 lakh. Rates of
M/s Rathore Construction Company were approved (October 2013) by ACE
and the SE issued (October 2013) work orders for ` 1.02 crore6. The works
were completed and the contractor was paid ` 0.94 crore7as of November
2014.
Scrutiny of the records (March 2017) of Executive Engineer (EE), Project
Division- Sardarshahar and further information collected (September 2017,
January 2018 and June 2018) revealed that two separate proposals were made
for a work of similar nature i.e. construction of OHSRs and laying of
pipelines in two adjacent zones. The proposals inter alia included theprovision
of Unplasticised Polyvinyl Chloride (UPVC) pipes for rising mains instead of
Ductile Iron (DI) pipes against the approved (May 2010) pipe policy adopted
by the department.
Further, the provision of 7,872 meter pipe line approved (August 2012) in TSs
was reduced to 3,535 meter8 while issuing Notice Inviting Tender (NIT)
without any justification. As a result, the works of rising main and distribution
system could not be completed and OHSRs could not be commissioned for
supplying water. Later, a revised single proposal for ` 4.83 crore was prepared
(March 2017) for commissioning of OHSRs and augmentation of water supply
of Zone 5 and 6. This included provision for 32,445 meters pipeline including
7,700 meters DI pipe9 for rising mains which was not taken in the earlier
6 Zone 5: ` 0.51 crore and Zone 6: ` 0.51 crore. 7 Zone 5: ` 0.48 crore and Zone 6: ` 0.46 crore. 8 2,335 meter MS pipe, 200 meter DI pipe and 1,000 meter UPVC pipe. 9 Costing ` 1.22 crore.

Audit Report (G&SS) for the year ended 31 March 2018
76
works. This indicated that the requirement of quantity of pipeline for the work
in the original assessment was grossly underestimated. As a result, OHSRs
constructed at a cost of ` 0.94 crore could not be commissioned and the
possibility of their damage due to passage of time could not be ruled out.
GoR stated (December 2018) that due to non-availability of land at the
proposed locations, the department decided to construct these OHSRs at other
locations which led to increase in length of rising mains. It was also stated that
the work would be completed by December 2018.
The reply is not tenable as department should have conducted proper survey
and ensure availability of land before submitting the proposal for technical
sanction but the same was not done by the authorities concerned. As a result,
the department had to change the sites of OHSRs. Further, even after knowing
the requirement of 6,600 meters pipes for rising main, the department took
only 2,535 meter pipes for rising mains in Notice Inviting Tenders due to
which the constructed OHSRs remained unconnected as of December 2018.
This resulted in non-commissioning of OHSRs for more than three years and
rendered expenditure of ` 0.94 crore on these works unfruitful. Besides, the
objective of providing 100 Liters Per Capita Per Day (LPCD) drinking water
to the habitations of Zone 5 and 6 of Sardarshahar could not be achieved as
they are getting only 30 LPCD drinking water since 2014.
Medical Education Department
3.4 Construction of Maternal Child Health unit caused damages to
existing structure
Construction of Maternal Child Health unit above first floor of old
hospital building without ensuring structural safety, resulted in structural
damages to the whole building and unfruitful expenditure of ` 10.47
crore.
Construction of 100 bedded Maternal Child Health (MCH) unit at Government
Pannadhaya Hospital (hospital), Udaipur (constituent hospital of Medical
College, Udaipur) as a separate unit, was included in the State Programme
Implementation Plan for 2012-13 under National Rural Health Mission
(NRHM). Accordingly, Administrative sanction was issued by Mission
Director, NRHM in June 2012 for construction of MCH unit having 7,095
square meter area. Financial Sanction for ` 15.27 crore was issued in August
2013, which was subsequently revised to ` 17.64 crore in January 2015.
Test check (February 2018 to March 2018) of records revealed that a
departmental committee10 constituted in May 2012 recommended (October
10 Consisting of Principal, Medical College, Udaipur; Superintending Engineer, Medical &
Health, Jodhpur; Senior Architect, Medical and Health, Jaipur; Executive Engineer,
Medical and Health, Udaipur; Assistant Engineer, City Division, Public Works
Department, Udaipur; and Assistant Engineer, Medical and Health, Udaipur.

Chapter III Compliance Audit
77
2012) construction of MCH unit having 40,000 square feet area above the first
floor of the existing hospital building11. However, the committee also
suggested that before carrying out the construction, a Structural Safety
Certificate for the building should be obtained from the Public Works
Department (PWD).
It was, however, observed that without obtaining Structural Safety Certificate
from PWD, the Executive Engineer (EE) Medical and Health, Udaipur
awarded (August 2013) the work to M/s Chirag Infraprojects Pvt. Limited for
` 4.23 crore with stipulated date of completion in February 2015. Meanwhile,
another technical committee12 noted (October 2013) that as the walls of the
hospital were nearly sixty years old and was constructed with stone masonry
and lime mortar, the normal load bearing capacity was only 30 to 35 feet. As
the height of the building was more than 35 feet, the committee recommended
that construction of an additional floor was not feasible. Later, as the
contractor executed only 28.58 per cent (` 1.21 crore) of the work upto
November 2014, the contract was rescinded (February 2015).
Without taking into account, the recommendations of both these committees
(October 2012 and October 2013), EE awarded (June 2015) the remaining
work to another contractor i.e. M/s Shailendra Sharma with stipulated date of
completion as February 2016 who completed the work in April 2016 and
handed over to the department in February 2017. The updated expenditure on
the work was ` 10.47 crore.
Thereafter, severe horizontal cracks in the walls, lintels and roof were noticed
in March 2017. Consequently, another technical committee13 was constituted
(March 2017), which reported (March 2017) that cracks occurred due to
increase in gravity loading by additional construction of second floor and was
propagating in due course of time. These cracks further influenced the lintels
and stone patty roofing of ground floor and led to an unsafe condition. The
committee concluded that strengthening work of the floors was not executed
before carrying out construction of MCH unit. Further, another committee
headed by a professor of Malaviya National Institute of Technology, Jaipur
was designated (March 2017) by the State Government. The committee
endorsed the finding of the earlier technical committee and suggested (May
2017) remedial measures for strengthening of the structure.
11 Total area of the ground and first floor occupied by the hospital was 1,04,000 square feet. 12 Consisting of Chief Architect, PWD, Jaipur; Additional Chief Engineer, PWD, Udaipur;
Principal, Medical College, Udaipur; Superintendent, Maharana Bhupal Hospital,
Udaipur; Superintending Engineer, PWD, Jaipur, two Associate Professors, Malviya
National Institute of Technology, Jaipur and Executive Engineer, PWD, City Division,
Udaipur. 13 Consisting of Additional Chief Engineer, PWD, Udaipur; Executive Engineer, PWD, City
Division, Udaipur and Assistant Engineer, NRHM, Udaipur.

Audit Report (G&SS) for the year ended 31 March 2018
78
Horizontal cracks in the walls, lintels and roof of Government Pannadhaya Hospital, Udaipur
GoR while accepting the facts stated (July 2018) that the executing agency for
construction of MCH unit was NRHM and the Structural Safety Certificate
was not obtained by it before commencement of work inspite of the Assistant
Engineer, Medical and Health, Udaipur being a member of the committee.
Further, Principal & Controller, RNT Medical College, Udaipur at the behest
(June 2018) of the District Collector, Udaipur has issued instruction to vacate
the building keeping in view the safety of the public and transfer the medical
services to other places.
Thus, haste in awarding of the work, initially by the EE before obtaining
Structural Safety Certificate and later re-awarding the remaining work
ignoring the recommendation of the committees for strengthening the existing
structure before carrying the construction led to severe structural damages to
the existing Government Pannadhaya Hospital building. Thus, before the
entire building is utilised again, an additional expenditure would be needed for
strengthening of the structure besides expenditure of ` 10.47 crore remaining
unfruitful so far.
3.5 Unfruitful expenditure on Out Patient Department cum
Emergency Block
Expenditure of ` 3.67 crore on construction of Out Patient Department
cum Emergency Block remained unfruitful due to improper planning and
leaving the incomplete structure of no use.
Construction of a new Out Patient Department (OPD) cum Emergency Block
within one year, at Umaid Hospital, Jodhpur was decided (March 2012) in the
budget speech 2012-13 to fulfil the urgent need of OPD patients as the
existing OPD was not sufficient to meet the requirements of patients.
Accordingly, Administrative and Financial (A&F) sanction14 and Technical
Sanction15 were issued in June 2012 and November 2012 respectively for
14 Issued by Medical Education Department, Government of Rajasthan. 15 Issued by Additional Chief Engineer, PWD, Jodhpur.

Chapter III Compliance Audit
79
` 3.50 crore16. The work was to be executed by the Executive Engineer (EE),
Public Works Department (PWD) Medical Division, Jodhpur. PWD awarded
(March 2013) the work with stipulated date of completion as March 2014.
Scrutiny (February 2018) of the records revealed that though the sanction of
` 3.50 crore was issued only for construction of OPD cum emergency block
on ground floor, the Superintendent of the hospital proposed construction of
an underground parking along with the OPD cum emergency block after
award of work to the contractor during the ceremony for laying of foundation
stone. Consequently, the scope of work was enhanced and the EE submitted
(September 2013) revised estimate for ` 7.40 crore, which was not approved.
Thereafter, between August 2012 and November 2015 the design was also
changed three times to accommodate the provision for basement parking but
the revised estimates were not sent for revision in A&F sanction.
It was also observed that the final layout and designs for the work including
underground parking was provided by PWD to the contractor in November
2015 without getting revised sanction of the State Government. This resulted
in the work not being completed (June 2018) and since February 2017, the
work is at a standstill in spite of incurring an expenditure of ` 3.67 crore.
Further, Chief Engineer, PWD submitted (June 2017) revised proposal for
A&F of ` 6.86 crore to Director, Medical Education Department for
underground parking, ancillary and extra items of civil works and additional
electrical work. The revised A&F sanction for ` 6.86 crore was yet to be
accorded by the State Government as of March 2019.
Thus, OPD block which was required to be constructed within one year to
meet the urgent need of the patients could not be completed even after lapse of
six years of A&F sanction and expenditure of ` 3.67 crore17.
Incomplete structure of OPD cum Emergency Block and underground parking at Umaid
Hospital, Jodhpur
Further, a committee constituted (November 2017) by the State Government
for examining the causes for delay also stated that the work has been delayed
due to belated decision on underground parking and related changes in the
16 Civil work: ` 2.45 crore, joinery work: ` 0.17 crore, sanitary work: ` 0.10 crore, electric
work: ` 0.34 crore, other overheads: ` 0.04 crore and prorata charges: ` 0.40 crore. 17 Civil work, joinery work and sanitary work: ` 2.91 crore; electric work: ` 0.34 crore and
prorata charges: ` 0.42 crore.

Audit Report (G&SS) for the year ended 31 March 2018
80
drawings. However, no action was taken for this lapse as well as for initiating
work without obtaining revised sanction of the Government.
GoR accepted the facts and stated (August 2018) that cost of the work
increased due to inclusion of underground parking, ramp and other items in
the original estimate. Further, the proposal for getting revised sanction is
under process for approval since July 2018. Reply is not convincing as the
requirement of the underground parking was not evaluated before
commencement of the work and this has already led to the work lying
incomplete even after six years from its sanction.
Thus, failure of the department to properly assess the requirement of
underground parking before obtaining the A&F sanction, delay in finalisation
of revised design/obtaining additional funds resulted in unfruitful expenditure
of ` 3.67 crore on construction of OPD cum Emergency Block which is lying
incomplete even after lapse of six years from its sanction. Besides, the
objective of providing facility of new OPD cum Emergency Block within one
year to the patients was not achieved.
Women and Child Development Department
3.6 Functioning of Anganwadi Centres
3.6.1 Introduction
Anganwadi Centres (AWCs) are the ground level out posts tasked with
implementation of the Integrated Child Development Services (ICDS)
programme. ICDS has been implemented as a centrally sponsored scheme
since 1975. ICDS offers six services18 to children under six years of age,
pregnant women and lactating mothers through AWCs. After the notification
of the National Food Security Act (NFSA) 2013, the standards and quantities
prescribed for supplementary nutrition under ICDS have been dovetailed with
those under NFSA.
Director, ICDS, functioning under Department of Women and Child
Development, Government of Rajasthan (GoR), Jaipur, has overall
responsibility for implementation and monitoring of the scheme at State level.
At district level, Deputy Director and at block level, Child Development
Project Officer (CDPO) are responsible for effective implementation of
programmes. Delivery of various services under the scheme takes place at the
village/ward level through AWCs by Anganwadi Worker (AWW), Helper and
Accredited Social Health Activist (ASHA) Sahayogini. AWW is mainly
responsible for effective delivery of ICDS Services to children and women in
the community. Anganwadi Helper is appointed to assist an AWW. At the
18 Supplementary Nutrition, Pre-school Education, Nutrition & Health Education,
Immunization, Health Check-up and Referral Services. Three out of the six services
namely Supplementary Nutrition, Pre-school Education and Nutrition & Health Education
are delivered through Anganwadi Centres and the remaining services are delivered
through public health system.

Chapter III Compliance Audit
81
community level, ASHA will be the first port of call for any health related
demands of deprived sections of the population, especially women and
children.
During the period 2015-18, ICDS has delivered services to 110.87 lakh
beneficiaries through a network of 61,121 AWCs (March 2018) in the State at
a cost of ` 2,188.31 crore19, of which a major portion of expenditure was on
supplementary nutrition (80.92 per cent).
With a view to assess regular and effective delivery of services by AWCs, a
thematic audit on Functioning of Anganwadi Centres (AWCs) was conducted
(June-September 2018) for the period 2015-18. Out of total of 304 CDPOs, 15
CDPOs (including five tribal blocks representing the Saharia and Kathodi
tribes) and 60 AWCs (four AWCs within each selected CDPO) were selected
on random sampling basis as detailed in Appendix 3.2. Two AWCs
(Pachanwaa mini in Ahore and Ward 13-iii in Gangapur City) were found to
be non-functional during field study.
Audit Findings
Important findings related to the functioning of Anganwadi Centres regarding
planning, availability/utilisation of resources, implementation of schemes and
internal controls are discussed in the subsequent paragraphs.
3.6.2 Planning
Formulation of State/District Child Development Action Plan is the key
strategy for integrated action under the ICDS Mission. The process of the
development of these Plans would be based on initiation, demarcating
population, understanding the local context of AWCs and district ICDS
development plans. Audit scrutiny of the planning process revealed the
following:
3.6.2.1 Lack of inputs in Annual Plans from Districts
ICDS Mission Guidelines focus on decentralized planning and management
by identification of specific needs at State, District, Project and local level
through Annual Programme Implementation Plans (APIP), prepared at State
level, after carrying out needs assessment and local mapping. APIP includes
provisions related to development and maintenance of Anganwadi Centres so
that they are able to deliver services effectively. APIP for ICDS mission are
being made annually since 2015-16. In order to develop specific locally
relevant strategies, they were to be made with inputs from the district level.
Audit scrutiny revealed that none of the test checked districts prepared any
district plan for inclusion in APIP. It was also observed that none of the test
checked 58 AWCs forwarded proposals of local requirements to CDPO which
would have been used as an input to prepare the district plan.
19 Supplementary Nutrition Programme- ` 1,770.74 crore (80.92 per cent), ICDS-General-
` 401.44 crore (18.34 per cent) and ICDS Systems Strengthening and Nutrition
Improvement Project- ` 16.13 crore (0.74 per cent).

Audit Report (G&SS) for the year ended 31 March 2018
82
GoR stated (December 2018) that the APIPs were prepared on the basis of
information available in Monthly Progress Report received from district/
CDPOs office.
Thus, in absence of local inputs and lack of preparation of district plans, the
APIPs were prepared by the Directorate at State Level without incorporating
the actual needs of the villages and blocks. Deficiencies in respect of state
APIPs noticed are discussed as under:
3.6.2.2 AWCs/mini AWCs & crèches sanctioned without assessment of
requirement
As per ICDS Mission Guidelines, CDPO will assess the requirement of AWCs
on the basis of survey reports and identify the places where AWCs/Mini
AWCs20 are required in the block.
Scrutiny of records of 15 test checked CDPOs revealed that:
AWCs/Mini AWCs at four localities in CDPO Bakani, despite being
sanctioned, were found non-functional. When enquired, CDPO stated
(September 2018) that two localities (Kotda and Koli Mini) already had
functional AWCs while the other two were sanctioned in the villages
(Borkhedi and Bodikhedi Mini) which were not in existence in the block.
This clearly indicates deficiencies in sanctioning due to lack of inputs
from village/block/district levels regarding preparation of plans.
As per guidelines, the provision of day care crèches is essential for care
and development of children in six months to six years age group, whose
mothers go for work and there are no adult at home to take care. GoR
sanctioned (November 2012) 200 creches in CDPO Kishanganj and
Shahbad. An additional Anganwadi Helper was posted in each AWC
cum crèches, whereas only 141 creches remained functional during
2015-18. It was also noticed that none of the children stayed in these
creches during 2015-18. On being pointed by audit, CDPO accepted
these facts and stated that he had recommended for closure of these
creches to Dy. Director ICDS.
Moreover, an expenditure of ` 84.78 lakh incurred on honorarium for
additional Anganwadi workers posted at these crèches proved to be
unfruitful.
GoR stated (December 2018) that the AWCs/Mini AWCs and crèches were
opened as per population norms and identification/examination of locality
area. The reply is not tenable as AWCs/Mini AWCs were opened without
adhering to population norms and identification of local area. Further, crèches
were opened without assessing the requirement of beneficiaries.
20 AWC was to be established for minimum population of 400 persons in rural/urban area
and 300 persons in tribal area, whereas mini AWC was to be established for minimum
population of 150 persons in all areas.

Chapter III Compliance Audit
83
Thus, AWCs/mini AWCs and crèches were sanctioned/opened without
obtaining proposals from the village/ block functionaries.
3.6.2.3 Targets not set for Indicators of Nutritional Status
The National Family Health Survey (NFHS) is a large-scale, multi-round
survey conducted in a representative sample of households throughout India.
The survey provides state and national information for India on fertility, infant
and child mortality, the practice of family planning, maternal and child health,
reproductive health, nutrition, anemia, utilization and quality of health and
family planning services.
One of the indicators of nutritional status of a child that is provided by NFHS
is ‘wasting’. It is a weight to height ratio and measures body mass in relation
to body length/height thereby indicating the current nutritional status.
During comparison of NFHS-3 (2005-06) and NFHS-4 (2015-16) it was
observed that the performance of the State on indicators, such as percentages
of underweight children under five years age had reduced from 39.9 to 36.7.
However, percentage of children (under 5 years) who were categorized as
‘wasted21’, increased from 20.4 to 23.0 and ‘severely wasted’ increased from
7.3 to 8.6. Also, the percentage of ‘wasted’ and ‘severely wasted’ children in
the State was higher than the national average of 21.00 per cent and 7.40
per cent respectively. However, no targets were set for ‘wasted’ and ‘severely
wasted’ categories even though the state performed poorly on these indicators.
GoR stated (December 2018) that the supplementary nutrition was provided to
beneficiaries to eliminate malnutrition as per GoI norms. The reply is not
convincing as the under nourished children increased in a decade from
NFHS-3 to NFHS-4.
Thus, the increase in percentage of ‘wasted’ children indicates that an
important parameter of malnutrition was not identified, recognized and
addressed in the supplementary nutrition programme effectively.
3.6.2.4 Non utilisation of funds of SC plan components for bonafide
purpose
GoR, in order to achieve the basic objectives of SC/ST Sub-Plan, issued
circular and instructed that funds for schemes of personal/group beneficiaries
will be marked in proportion to beneficiaries of scheduled castes and also
instructed that while making provisions for SC Sub-Plan in budget, the area
with dominantly SC population may be given priority.
During scrutiny of records of Commissioner ICDS, it was revealed that the
GoI sanctioned ` 348.92 crore under SC component for Supplementary
Nutrition and ICDS (general). However, the expenditure against this sanction
was incurred on all the AWCs without prioritising SC majority areas due to
non-identification of such areas.
21 Wasting is low weight for height, which is strong predictor for mortality among children
under five year’s age.

Audit Report (G&SS) for the year ended 31 March 2018
84
GoR accepted the facts and stated (December 2018) that none of the AWCs
were identified according to SC population of the locality and the expenditure
of Sub-Plan was being booked under general budget. Moreover, the process
for identification of AWCs as per Sub-Plan is being carried out and in future
funds will be utilised accordingly.
This clearly indicates that the objectives with which the SC/ST Sub-Plan was
made, were not achieved with respect to services provided by AWCs.
3.6.2.5 Non Linking with Aadhar under ICDS
As per GoI notification issued in February 2017, with effect from 01.04.2017
(further extended up to 31.3.2018), individuals availing benefits of
supplementary nutrition were required to furnish proof of possession of
Aadhar number or undergo Aadhar authentication. Accordingly, GoI accorded
(December 2017) sanction for ` 13.68 crore for Aadhar enrolment kits (i.e.
one desktop computer, one laptop, one tablet along with scanner, printer, slap
fingerprint scanner, Iris scanner and GPS device).
Scrutiny of records however, revealed that no such kits were procured by the
department even after lapse of the target date of completion of Aadhar
authentication.
As a result, against a target of 100 per cent Aadhar seeding of beneficiaries by
31 March 2018, Aadhar seeding of 9.14 per cent children of age group 0-3
year, 14.82 per cent of children of 3-6 year and 62.22 per cent pregnant
women and lactating mothers only could be achieved.
GoR stated (December 2018) that the instructions to link 100 per cent
beneficiaries with Aadhar upto 31 March 2018 were already issued to
Dy. Director/CDPOs. Further, procurement of Aadhar Kits is under process.
The fact remains that Aadhar seeding of beneficiaries was delayed due to lack
of procurement of Aadhar enrolment kits.
3.6.3 Availability and utilisation of infrastructure, equipment and
manpower
Keeping in view the importance and enhanced role being played by AWCs in
the delivery of services to the targeted population, GoI prescribed (March
2011) an indicative and suggestive model/layout of AWC buildings.
Accordingly, an AWC must have multipurpose room, examination room,
consultation room, separate kitchen, store for storing food items, child friendly
toilets and space for playing (Indoor and outdoor activities) with safe drinking
water facilities. It was also prescribed that it would meet the minimum
requirements, if an AWC is constructed in a covered area of not less than 600
square feet as per the standard specifications. The observations of Audit in this
regard are discussed below.

Chapter III Compliance Audit
85
3.6.3.1 Infrastructure
(i) Absence of basic infrastructure
There were 61,121 functional AWCs in the State as on March 2018. Of these,
toilet facility was available only in 29,410 AWCs (48.12 per cent) and
drinking water in 47,358 AWCs (77.48 per cent). Thus, a substantial number
of AWCs were without these basic facilities. Audit test checked 58 AWCs.
The test check revealed that:
Of 30 AWCs which were running in own buildings, 18 AWCs (60 per
cent) did not have the prescribed land area of 1,500-2,000 square feet
and 11 AWCs (36.67 per cent) did not have prescribed constructed area
of 600 square feet.
Four AWCs did not have multipurpose room, 27 AWCs (90 per cent)
were without examination room and 27AWCs (90 per cent) did not have
consultation room.
Toilet facility was available only in 18 AWCs (31.03 per cent) however,
out of these, toilets were not usable in six AWCs due to non-availability
of water facility.
Electricity was available in only three AWCs (5.17 per cent).
Drinking water facility was not available in 12 AWCs (20.69 per cent).
Further, GoI approved ` 2.57 crore (December 2017) for procurement of
water containers (10 litres capacity) for 36,697 AWCs. However, no
water containers were procured so far despite availability of funds.
GoR stated (December 2018) that there was no provision/budget for providing
electricity. Thus, a significantly large number of AWCs were lacking drinking
water, toilet and electricity facilities.
(ii) Toilets not constructed despite availability of funds
Audit scrutiny revealed that GoI accorded sanction of ` 4.71 crore for
construction of toilets in 3,928 AWCs (`12,000 each for AWCs running in the
government buildings) during 2017-18, but construction work was not started.
On being pointed out (October 2018) GoR stated (December 2018) that
proposals for construction of toilet and drinking water facilities were not
received from the districts. Therefore, funds could not be allotted to them.
Further, the funds sanction will be revalidated by GoI and thereafter funds
would be disbursed into the PD accounts of respective Zila Parishads. The
fact still remains that despite availability of sufficient funds, essential facility
of toilets were not provided to the beneficiaries at AWCs.

Audit Report (G&SS) for the year ended 31 March 2018
86
(iii) Construction and funding delays regarding AWC buildings
Guidelines for construction of Anganwadi centres under Mahatma Gandhi
National Rural Employment Guarantee Scheme (MGNREGS) were issued
(August 2015 and February 2016) by Ministry of Rural Development to
develop the Anganwadi centre as a vibrant Early Childhood Development
(ECD) centre and to become the first village outpost for health, nutrition and
early learning. Accordingly, States/ UTs were required to identify the blocks
where there was acute shortage of AWC buildings. The identification of exact
location was to be done by the Gram Panchayats. Out of 61,039 functional
AWCs22 in the State, only 25,406 AWCs (41.62 per cent) were functioning
from their own buildings, while other AWCs were running either in rented
buildings or other community buildings. Audit scrutiny revealed that:
Construction work of 1,385 AWCs was included in Annual Plan
2015-16, which were to be completed within six months of issue (March
2016) of financial sanction including first instalment of grant-in-aid
amounting to ` 8.31 crore. Second instalment was to be released after
completion of work, but, construction of these AWCs was not completed
within scheduled time. As a result, GoI did not release second instalment
of ` 8.31 crore for want of completion certificate of works. On being
pointed out by Audit, GoR stated (December 2018) that construction
work regarding 207 AWC (14.95 per cent) buildings was completed, 922
(66.57 per cent) was under progress and 256 (18.48 per cent) was yet to
be started.
Construction work of 2,000 AWCs was included in Annual Plan 2016-17
and GoI released first and second instalments each of ` 12 crore in May
2016 and August 2016 respectively, but exact location of AWCs was not
identified before sending proposal to GoI. This resulted in slow progress
of construction work. On being pointed out by Audit, GoR stated
(December 2018) that construction work regarding 283 AWC (14.15 per
cent) buildings was completed, 970 (48.50 per cent) was under progress
and 747 (37.35 per cent) was yet to start.
Construction work of 1,000 AWC buildings in urban localities was
included in Annual Plan 2016-17. GoI released first instalment of
` 13.50 crore (May 2016), but construction was not started due to non-
identification of exact site and sanction of lower construction cost
(` 4.50 lakh per unit) in urban localities as compared to rural localities
(` 7.00 lakh per unit). GoR stated (December 2018) that GoI
discontinued (December 2017) funding from ICDS for construction
work of AWC buildings in urban areas. The fact remains that the funds
obtained from GoI were not utilised.
22 As per information available with construction wing.

Chapter III Compliance Audit
87
Further, test check of 15 CDPOs revealed that as many as 35 AWCs23
were running in kutcha buildings and six AWCs24 in open space in one
project (CDPO Kishanganj-Baran). GoR stated (December 2018) that the
construction work of building would be carried out after availability of
funds and land.
Thus, pace of construction of AWC buildings was very slow despite the fact
that there was acute shortage of own buildings of prescribed facilities in the
state for the AWCs.
(iv) Repair and maintenance of AWCs was not done despite availability
of funds
GoR released an amount of ` 40 crore in 2016-17 and ` 6.29 crore in 2017-18
to Local Bodies for repair, maintenance and construction of wall embedded
almirah in 5,432 AWCs and 871 AWCs in respective years.
Audit scrutiny of records of Dy. Director, ICDS of 13 test checked districts25,
revealed that out of 2,161 AWCs, construction works of almirah were
completed only in 130 AWCs while repair and maintenance works were
completed in 284 AWCs. Further, there was necessity of repair and
maintenance in 14 out of 58 test checked AWCs but no repair and
maintenance work was undertaken in these AWCs.
GoR stated (December 2018) that out of 5,432 AWCs, repair and maintenance
of 1,663 AWC buildings was completed, work was under progress in 1,603
AWCs and work was yet to start in 2,166 AWCs. GoR, however, did not offer
comments on non-completion of almirah and repair and maintenance work in
2,161 AWCs of test check districts.
Thus, slow progress in repair and maintenance of AWCs affected delivery of
services.
3.6.3.2 Equipment: Non-availability of basic equipments
Equipments26 like Infantometer, Stadiometer, MUAC (Mid-Upper Arm
Circumference) monitor, Weighing Scales (Infant and Adult) are essential to
monitor the growth of children while Blood Pressure (BP) instrument,
Hemoglobin (Hb) meter, examination table and curtain etc., are needed for
health checkup of beneficiaries. Similarly, indoor/outdoor play equipment
23 Acharpura Mini, Ahaliyabasti Mini, Asnavar 2, Balon Mini, Bandrpura Mini, Bhairupura
Mini, Bhutpura Mini, Bislai, Borda, Chhatarpura Dand 2, Dob Mini, Himmatgad Mini,
Jagdevpura, Jalwada 1, Jalwada 4, Kamtha, Karvarikalan 2, Keshwpura Mini, Kundi 3,
Laxmipura Mini 2, Mahrawata 3, Missaika Danda Mini, Nahargarh 5, Nahargarh 6,
Nahargarh 7, Nahargarh 9, Nathan Mahodri Mini, Pitampura 2, Prempura Mini, Rajkheda
Mini, Shariya Basti Ranibadoud Mini, Simlod 2, Suwas Mini, Tagariyadani and
Vijaypura Mini. 24 Madanpura Mini, Mohanbamori Mini, Piliya Dhani, Ramnagar Mini, Shariyabasti
Chhinod Mini and Vedhji Tapri Mini. 25 Baran, Banswara, Barmer, Dausa, Jaipur, Jalore, Jhalawar, Jhunjhunu, Pali, Pratapgarh,
Sawaimadhopur, Tonk and Udaipur. 26 For measurement of length, height and weight of children.

Audit Report (G&SS) for the year ended 31 March 2018
88
such as swing (jhula), slide and mat/dari are essential for the purpose of
playing/sitting at AWCs. Audit scrutiny in 58 test checked AWCs revealed
that:
Infantometers/Stadiometers were not available in 18 AWCs (31.03 per
cent), MUAC monitors were not available in 19 AWCs (32.76 per cent).
Weighing Scales (Infant) and Weighing Scales (Adult) were not
available in 11 AWCs (18.97 per cent) and 13 AWCs (22.41 per cent)
respectively. In 19 AWCs Weighing Scales (Infant) and in six AWCs
Weighing Scales (Adult) though available but were found non-
functional.
Similarly, BP instruments were not available in 38 AWCs (65.52 per
cent). Hemoglobin meters were not available in 52 AWCs (89.66 per
cent) while examination tables were not available in 31 AWCs (53.45
per cent). Further, curtains were also not available in 51 AWCs (87.93
per cent).
Indoor/outdoor play equipment like puppet/dolls for role plays, building
blocks, props for dramatic play, balls, carom, chess, football etc., were
not available in 42 AWCs (72.41 per cent).
Swing (Jhula) and slides were not available in 57 AWCs (98.28 per
cent). Further, mats/dari were not available in 9 AWCs (15.52 per cent)
and damaged mats/dari were found in other two AWCs.
Thus, due to unavailability/shortage of prescribed equipment, the monitoring
of important development parameters could not be fully done.
3.6.3.3 Manpower management
Efficiency and quality of AWC services are largely dependent on the
availability of adequate number of trained supervisory personnel as well as
grass root level functionaries. Audit scrutiny revealed the following
deficiencies:
(i) Shortage of manpower
The services of ICDS at village/ward level are delivered by Anganwadi
Workers and Helpers at AWCs. Child Development Project Officers (CDPO)
posted at block level, are responsible for effective implementation/monitoring
of programmes. Selection of Anganwadi Worker, Helper and Sathin and
operation of Anganwadi Centres, distribution of nutrition etc., are being done
in coordination with the Panchayat Samitis and Zila Parishads. Position of
vacancies against the sanctioned posts in various supervisory cadres and
vacancies in 62,020 sanctioned AWCs/Mini AWCs as on March 2018 are
given in the Table 3.

Chapter III Compliance Audit
89
Table 3
Name of post Sanctioned
post
Working
post
Vacant post Shortage
in per cent
CDPO/ACDPO 425 202 223 52.47
Supervisor 2,197 1,501 696 31.68
AWW (Including Mini AWC) 62,020 58,372 3,648 5.88
AWH 55,816 52,295 3,521 6.31
Total 1,20,458 1,12,370 8,088
It can be seen from the table that there was shortage of 52.47 per cent CDPOs,
31.68 per cent of supervisors, 5.88 per cent of Anganwadi Workers (AWWs)
and 6.31 per cent of Anganwadi Helper (AWH) as on 31 March 2018.
Shortages of CDPOs and supervisors hampered the effective supervision of
AWCs as discussed in paragraph 3.6.5 (i).
GoR stated (December 2018) that recruitment of CDPO/Supervisor is under
process.
(ii) Shortfall in achievement of targets related to trainings
At the time of joining of service the Supervisors, Anganwadi Workers and
Anganwadi helpers were required to be imparted job orientation training
which would include exposure to duties to be discharged by incumbents
effectively while delivering the ICDS services. A refresher course was also
required to be provided after two years of job orientation training.
The year wise targets of job orientation trainings/refresher courses for
Supervisor, Anganwadi Worker (AWW) and Anganwadi helper (AWH) and
achievements there against are given in Table 4 below:
Table 4
Details of
participants
2015-16 2016-17 2017-18 Total
Target Achieve-
ment
Target Achiev-
ement
Target Achiev-
ement
Target Achiev
-ement
Shortfall
(per cent)
Job Orientation training
Supervisors - - 75 44 200 146 275 190 85 (30.91)
AWW 1,330 1,179 2,275 1,971 2,205 2,014 5,810 5164 646 (11.12)
AWH 2,400 1,765 4,250 2,960 3,200 2,240 9,850 6,965 2,885 (29.29)
Refresher course
Supervisors 875 455 700 409 275 189 1,850 1,053 797 (43.08)
AWW 13,440 11,244 11,800 9,413 10,640 8,958 35,880 29,615 6,265 (17.46)
AWH 14,900 10,091 9,500 6,974 13,800 10,177 38,200 27,242 10,958 (28.69)
It can be seen from the above table that there was overall shortfall of 30.91 per
cent, 11.12 per cent and 29.29 per cent in job orientation training for
Supervisors, AWWs and AWHs respectively and 43.08 per cent, 17.46 per
cent and 28.69 per cent in refresher courses for Supervisors, AWWs and
AWHs during 2015-18.

Audit Report (G&SS) for the year ended 31 March 2018
90
3.6.4 Implementation and Delivery of services
The primary goal of ICDS is to break the inter-generational cycle of
malnutrition, reduce morbidity27 and mortality caused by nutritional
deficiencies. Under the scheme six services namely Supplementary Nutrition,
Nutrition & Health Education (NHE), Pre-school Education (PSE),
Immunization, Referral Services and Health Check-up are provided at the
Anganwadi Centres (AWCs). While the provision of first three services is the
primary task of the Anganwadi Centre, the remaining three are designed to be
delivered through the public health system. The responsibility of coordination
with the health functionaries for provision of these services rests with the
Anganwadi worker (AWW).
Scrutiny of records at various offices and test check of selected AWCs
revealed the following:
3.6.4.1 Supplementary Nutrition Programme
Supplementary Nutrition is one of the six services provided under the
Integrated Child Development Services (ICDS) Scheme which is primarily
designed to reduce intergenerational malnutrition. Supplementary Nutrition is
to be prepared and supplied to AWCs by Self Help Group (SHG) functioning
at local level and given to the children (6 months to 6 years), pregnant women
and lactating mothers under the ICDS. Supplementary nutrition includes
morning snacks, hot-cooked meal and take home ration to be given to
beneficiaries as per feeding and nutrition norms of Ministry of Women and
Child Development which is given in Table 5.
Table 5
S.
No.
Categories
(Age group)
Type of
meal/food
Quantity
(Per day)
Calorie/Protein
(Per day)
1 Children
(Between 6 to 36 months)
Take home
ration
125 gram baby mix 500 calories and
12-15 gram protein
2 Severely Malnourished
children (between 6 to 36
months)
Take home
ration
200 gram baby mix 800 calories and
20-25 gram protein
3 Children
(between 3 to 6 years)
Morning snacks
and hot cooked
meal
55 gram (roasted chanawith
gur/rice with jaggery) or 50
gramhalwa and 80 gram (khichdi/
dalia)
500 calories and
12-15 gram protein
4 Severely Malnourished
children (Between 3 to 6
years)
Morning snacks
and hot cooked
meal
55 gram (roasted chana with
gur/rice with jaggery) or 50
gramhalwa and 80 gram (khichdi/
dalia). Additional 75 gram baby
mix
800 calories and
20-25 gram protein
5 Pregnant women and
lactating or nursing
mothers
Take home
ration
155 gram baby mix 600 calories and
18-20 gram protein
27 As per National Cancer Institute (NCI), Morbidity Refers to having a disease or a
symptom of disease, or to the amount of disease within a population.

Chapter III Compliance Audit
91
Audit scrutiny revealed the following:
(i) Shortfall in coverage of targeted beneficiaries
ICDS Mission guidelines have fixed the targets for providing Supplementary
Nutrition to all the registered beneficiaries (100 per cent).
Scrutiny of records related to targets, achievements and shortfall in
distribution of supplementary nutrition in the state has been tabulated in the
Table 6.
Table 6
Year Targeted
beneficiaries
Actual beneficiaries Shortfall Percentage of
shortfall
2015-16 57,76,537 37,38,622 20,37,915 35.28
2016-17 55,60,866 37,08,367 18,52,499 33.31
2017-18 57,80,866 36,39,539 21,41,327 37.04
Total 1,71,18,269 1,10,86,528
(64.76 per cent)
60,31,741
( 35.24 per cent)
It can be seen from the above table that supplementary nutrition was provided
annually to an average of only 64.76 per cent of the targeted eligible
beneficiaries during 2015-18, depriving annually an average of 35.24 per cent
from the benefits of Supplementary Nutrition programme. Further, number of
deprived beneficiaries also increased to 37.04 per cent in 2017-18 as
compared to 35.28 per cent in 2015-16.
GoR stated (December 2018) that a beneficiary is registered for all six services
provided at AWCs, however, supplementary nutrition is given to only the
willing beneficiaries. Therefore, difference between registered and actual
beneficiaries of supplementary nutrition is obvious. The reply is not
convincing as all the registered beneficiaries were required to be provided
Supplementary Nutrition according to the ICDS Mission guidelines.
(ii) Shortfall in provision of Supplementary Nutrition as per prescribed
days
According to ICDS guidelines, supplementary nutrition was to be provided for
300 days in a year, that is, 25 days in a month. The similar provisions for
supplementary nutrition were also given in the Supplementary Nutrition Rules,
2015 made under the National Food Security Act 2013. GoI issued (May
2012) instructions to follow the directions of Supreme Court that the
supplementary nutrition was to be procured from Self Help Groups (SHG) and
local Mahila Mandals.
Scrutiny of records revealed that no supplementary nutrition was provided,
even for a single day, by 65 AWCs out of 60,267 AWCs (0.11 per cent) in
2015-16 and 577 AWCs out of 60,733 AWCs (0.95 per cent) in 2016-17 to the
targeted beneficiaries. On being enquired (April 2018), the Commissioner,
ICDS attributed this irregularity to non-availability of Self Help Groups
(SHGs) within the AWCs/Mini AWCs locality as well as provision of lower
rates for Supplementary Nutrition. Further, instructions have been issued from
time to time to CDPO/DD offices to comply with the provisions of NFSA .

Audit Report (G&SS) for the year ended 31 March 2018
92
It was further observed during test check that in one project (Mahuwa-Dausa
district) all 211 AWCs did not provide supplementary nutrition to the
beneficiaries during the period April 2017 to March 2018. Similarly, in
Kishangarhbas project, all 261 AWCs did not provide morning snacks to
2,941 beneficiaries during 2013-18. When enquired, Deputy Director, Dausa
stated that on the basis of complaints regarding alleged fraud, payment to SHG
was denied due to which it had discontinued further supply. CDPO
Kishangarhbas replied that nutrition was not provided as no SHG accepted the
prescribed lower rates for supply of morning snacks.
Further, the data regarding providing supplementary nutrition at AWCs for
minimum 25 days in a month was not maintained. Instead, it was being
maintained for 21 days. It was found during scrutiny of records that 2,235
AWCs out of 60,267 AWCs in 2015-16 (3.71 per cent) and 2,605 AWCs out
of 60,733 AWCs in 2016-17 (4.29 per cent) did not provide the supplementary
nutrition to the targeted beneficiaries for minimum prescribed days.
The failure of the department to provide supplementary nutrition for the
minimum prescribed days in these cases needs to be viewed in the light of the
fact that providing supplementary nutrition was the primary objective of the
ICDS programme.
(iii) Denial of additional supplementary nutrition to malnourished
children
World Health Organisation prescribed growth standards for children and has
classified children in three categories of normal, malnourished and severely
malnourished children in the age group 6–60 month old on the basis of score
for standard deviation from median standards of weight for age for normal
child.
ICDS guidelines for supplementary nutrition to ‘severely malnourished
children’ prescribed 800 calories and 20-25 gram protein per day for such
child. Subsequently, NFSA-2013 prescribed 800 calories and 20-25 gram of
protein per day for ‘malnourished child’.
Scrutiny of records of the Commissioner ICDS revealed that supplementary
nutrition was provided only to ‘severely malnourished children’ and therefore
the ‘malnourished children’ were not getting additional supplementary
nutrition as per NFSA-2013.
Thus, 23.30 lakh (20.78 per cent) malnourished children (6–60 month old)
were deprived of additional supplementary nutrition though mandated under
NFSA-2013as given in the Table 7.
Table 7
Year Total children Classification of nutritional status for 0-5 years children
Normal
Children
Underweight children
(malnourished)
Severely underweight
children
(severely malnourished)
2015-16 37,92,042 28,84,443 8,99,976 7,623
2016-17 36,97,489 29,15,733 7,76,563 5,193
2017-18 37,24,072 30,65,758 6,53,572 4,742
Total 1,12,13,603 88,65,934 23,30,111 17,558
Source: Monthly Progress Report of the department.

Chapter III Compliance Audit
93
GoR stated (December 2018) that, as per orders issued by GoI, the department
is providing supplementary nutrition to children (6-72 months), severely
malnourished children and pregnant women and lactating mother. Further,
ICDS financial norms and nutrition standards have not been changed by GoI,
to comply with NFSA and rules and hence malnourished children were not
provided additional supplementary nutrition. The reply is not tenable because
the department did not make any efforts to provide additional supplementary
nutrition to malnourished children and get the norms changed by GoI.
(iv) Inadequacies in Growth Monitoring
A joint policy directive dated 6 August 2008 was issued by Ministry of
Women and Child Development (MWCD) and Ministry of Health and Family
Welfare (MoHFW), Government of India to the Secretaries of Women and
Child Development and Health and Family Welfare of all the States stated that
the new World Health Organisation (WHO) child growth standards would be
adopted also in India with effect from 15 August 2008 and applicable to both
ICDS and National Rural Health Mission. Accordingly, children below the age
of three years are weighed once in a month and children in the age group of
3-6 years are weighed quarterly and results marked in a WHO Growth
Monitoring Chart for each child. Identification of growth faltering would be
done on this basis and appropriate counselling of care-givers especially on
optimal infant and young child feeding and health care would be reinforced.
It was observed during test check that out of 58 selected AWCs, 30 AWCs
(51.72 per cent), were not maintaining WHO card during 2017-18 for growth
monitoring, therefore, the objective of early identification of faltering of
growth was defeated and opportunity to take timely corrective action was lost.
These shortcomings should also be viewed in light of the fact that there were
shortages in health monitoring equipment such as infantometers, stadiometers
etc., at the AWC levelas discussed in paragraph 3.6.3.2.
GoR did not offer specific comments on the issue discussed in the para
(December 2018).
(v) Supplementary Nutrition provided without Micronutrient Fortification
As per ICDS guidelines Supplementary Nutrition was to be provided through
micronutrient fortification (salt with iodine and iron, wheat flour with iron,
folic acid and Vitamin B-12 and edible oil with Vitamin A and D) to curb
malnutrition. Further, fortified Supplementary Nutrition was to be procured
through SHGs/local Mahila Mandals as per directions (2009) of the Supreme
Court.
It was, however observed that no AWC in the state provided Supplementary
Nutrition with micronutrient fortification.
GoR stated (December 2018) that Supplementary Nutritioncould not be
fortified as SHGs did not have sufficient funds and technical capacity for
micronutrient fortification. Further, a letter was issued to Food Department
asking them to provide fortified wheat flour and oil at local level. Once it

Audit Report (G&SS) for the year ended 31 March 2018
94
would be available, instructions would be issued to use fortified raw material
in preparing supplementary nutrition.
The fact, however, remains that beneficiaries are being deprived of fortified
Supplementary Nutrition. Thus, the objective of addressing micronutrient
related deficiencies by providing fortified Supplementary Nutrition was
defeated.
(vi) Non adherence to prescribed procedure for quality tests of
Supplementary Nutrition
In order to ensure quality of Take Home Ration (THR) being supplied by Self
Help Groups (SHGs), instructions were issued by GoR in September 2016.
Accordingly, samples were required to be tested for prescribed norms of
protein and calories for recipe of 100 gram supplementary nutrition through
NABL accredited labs, at the prescribed rates. Samples were to be selected
randomly from the AWCs. In case of failure of samples, the concerned SHG
would be warned to maintain the quality of Supplementary Nutrition in future
and a prorata recovery was also to be effected.
Scrutiny of records of Deputy Director, Jalore revealed that 346 samples of
Supplementary Nutrition (supplied by 21 SHGs) collected from 23 AWCs
were sent to ‘Fare Lab’ Gurgaon during October 2017 to March 2018. Of
these, contamination due to yeast and mould28 was found in 23 samples
(6.65 per cent). Despite the fact that samples were not of the prescribed
quality, Supplementary Nutrition of same batch was distributed to
beneficiaries as quality test was not made mandatory prior to distribution of
the Supplementary Nutrition.
Further, the requisite follow up action regarding warning to terminate the
MoU with SHG was initiated by the Deputy Director in August 2018 only
after four months and at the instance of Audit. This placed the beneficiaries at
risk of getting sick due to consumption of contaminated supplementary
nutrition.
GoR accepted the fact and stated (December 2018) that in a decentralised
system, the supplementary nutrition is prepared by hand at large scale at local
level by SHG because of which possibility of contamination may not be ruled
out in some cases.
The fact remained that there was lack of effective efforts by the department to
ensure the quality of supplementary nutrition being delivered as the follow up
action to terminate the MoU with SHG who failed to adhere the prescribed
quality norms was initiated by the Deputy Director in August 2018 only after
four months and at the instance of Audit.
28 Presence of yeast and mould is known to cause allergic reactions and many respiratory
problems.
Chapter III Compliance Audit
95
(vii) Supplementary Nutrition not provided to adolescent girls
AWCs were to provide both nutritional and non-nutritional components to
adolescent girls in the age group of 11 to 18 years in 10 districts29 under Rajiv
Gandhi Scheme for Empowerment of Adolescent Girls (RGSEAG)-Sabla,
introduced by GoI in January 2011. The scheme envisaged providing 600
calories for 300 days in a year at ` five per beneficiary per day. Later, GoI
extended the coverage of the scheme to other districts of the State (during
November 2017 to April 2018) and renamed the scheme as “Scheme
Adolescent Girl30” (SAG).
Scrutiny of records revealed that 6,25,423 adolescent girls were provided
supplementary nutrition during 2014-15 but none were provided during
2015-18, despite availability of fund amounting to ` 29.81 crore since April
2015.
On being pointed out (May 2018), the Department stated (December 2018)
that there was disparity in the rates of nutrition under ICDS and SABLA and
SHGs could not be paid at two different rates for same Supplementary
Nutrition. Hence, GoI was requested to modify the rates accordingly. Further,
GoR also denied consent for additional funds to match the gap between the
two schemes and therefore, the scheme could not be implemented. Reply is
not tenable as GoI revised (October 2017) the rate to ` 9.50 and released
(December 2017) additional funds ` 39.38 lakh but none of the adolescent
girls were provided supplementary nutrition (March 2018). Thus, large
number of potential beneficiaries were deprived from the benefits of the
scheme.
3.6.4.2 Pre School Education
Pre School Education (PSE) is one of the most important components of the
ICDS and in many ways can be considered to be the backbone of the
programme. The purpose of PSE is to provide sustained activities through
joyful play-way method that helps to prepare the child for regular schooling.
PSE, as envisaged in the ICDS, focuses on holistic development of children up
to six years. Audit scrutiny revealed the following:
(i) Shortfall in coverage of beneficiaries
Scrutiny of records revealed that shortfall in achieving target of PSE during
2015-18 remained 40.27 to 41.99 per cent as detailed below in Table 8.
Table 8
Year Targeted
beneficiaries
Actual beneficiaries Shortfall in targets Percentage
of shortfall
2015-16 16,69,117 9,68,244 7,00,873 41.99
2016-17 16,53,708 9,87,811 6,65,897 40.27
2017-18 16,53,708 9,64,295 6,89,413 41.69
Total 49,76,533 29,20,350
( 58.68 per cent)
20,56,183
( 41.32 per cent)
29 Bhilwara, Banswara, Bikaner, Barmer, Dungarpur, Sriganganagar, Jaipur, Jodhpur,
Jhalawar and Udaipur. 30 Sub scheme of Umbrella ICDS.

Audit Report (G&SS) for the year ended 31 March 2018
96
It can be seen from the above table that only 58.68 per cent of targeted
beneficiaries were provided PSE during 2015-18. Further, it was observed
during test check that out of 58 selected AWCs, 38 AWCs (65.52 per cent) in
2015-16, 47 AWCs (81.03 per cent) in 2016-17 and 45 AWCs (77.59 per
cent) in 2017-18 did not provide PSE to all the registered children.
GoR stated (December 2018) that the efforts are being made to reduce the
difference in target and achievements.
(ii) Shortfall in provision of PSE as per prescribed days
As per guidelines issued (July 2014) by GoI, PSE/Early Childhood Care and
Education (ECCE) programme should be conducted for four hours daily for
minimum 21 days in a month.
Scrutiny of records at Commissioner ICDS revealed that 325 AWCs out of
60,267 functional AWCs (0.54 per cent) in 2015-16, 196 AWCs out of 60,733
functional AWCs (0.32 per cent) in 2016-17 and 1,839 AWCs out of 61,029
functional AWCs (3.01 per cent) in 2017-18 (December 2017) did not provide
PSE for prescribed 21 days in a month.
Further, during test check it was observed that out of 58 selected AWCs, in
seven AWCs31 in 2015-16, PSE was provided for days ranging from 85 to 249
days instead of prescribed minimum 252 days. However, in other AWCs, PSE
was provided for prescribed days during 2015-18.
(iii) Non procurement of PSE kits
Pre-school education (PSE) is a crucial component of ICDS and imparted
through a joyful play and activity based approach by the use of PSE kit
containing local and culturally relevant play and learning material. As per
guidelines (January 2014) of the scheme, the PSE kit was required to be
provided for each year for all functional AWCs. PSE kits having suggested 14
items in prescribed quantities valuing ` 3000 per kit for AWCs32 and ` 1500
per kit for mini AWC per annum were required to be provided. Sharp edge
items were not to be included in PSE kits. Scrutiny of records revealed the
following:
GoR decided to procure fewer items in lesser quantities (valuing
` 1000 for AWCs and ` 500 for mini AWCs) than the prescribed items
as mentioned above during 2016-17. Thus, seven items (as suggested by
GoI) were not provided at all and three items were provided in lesser
than prescribed numbers.
31 Bhawarani Mini, Bithuda, Khoripada, Mandali-2, Muliyawas, Serawala and Udaipur
Bada. 32 Puppet/Dolls for role plays (4 No.), Building Blocks (set of 40) (1No.), Props for
dramatic play (5 props), Strings and beads (coloured) (2 sets), Pad, paper, coloured, A4
size plain, 50 sheets (1 pack), Memory game (set of 32 cards) (2 packs), Slates (5 Nos.),
Educational toys (lacking animals/Puzzles (human body, animals etc.)/Shape cut outs etc.
(4 sets), Pre-reading/writing cards & flip books (set of 4) (1 set), Story Flash cards/Charts
(5), Clay/Plasticine (5), Colours (water, sketch, wax) paint brushes (5 sets), Balls (5 No.),
Local indigenous material as per requirement of activities planned.

Chapter III Compliance Audit
97
Contrary to prescribed guidelines, some sharp edge items, like pencil and
pencil colour were procured. Moreover, extra items like gum and colour
chalks were provided without any recommendation of specialists of
ECCE/SCERT33.
Despite availability of funds ` 30.34 crore provided by GoI during
2017-18, no PSE kit of any type was procured by the department.
Out of 58 test checked AWCs, PSE kits were not available in 19 AWCs
in 2015-16, 20 AWCs in 2016-17 and 19 AWCs in 2017-18.
Out of test checked 13 offices of Dy. Director ICDS, in three Offices
(Banswara, Jaipur and Udaipur), PSE kits were not purchased for 9,483
AWCs during 2016-17 despite availability of funds (` 0.91 crore).
GoR accepted the facts and stated (December 2018) that the PSE kits were not
procured during 2015-16 and 2017-18. Further, PSE kits in three districts were
not procured during 2016-17 due to shortage of manpower/time for carrying
out the tendering procedure. Further, items of PSE kits were decided by the
GoR as per local requirement.
While the children were deprived of quality PSE due to non-availability of
PSE Kits, the fact remains that they were also put at risk due to inclusion of
sharp edge items in the kits that were made available.
(iv) Child Assessment Cards not maintained
As per guidelines, a Child Assessment Card was to be maintained to assess the
child’s learning and development needs. It helps to understand how the child
is developing in terms of age and what he is able to do well and where he
needs further help and support. The Anganwadi worker was required to assess
and report the child’s progress to his/her parents once in every three months.
Out of 58 test checked AWCs, child assessment cards were not maintained in
44 AWCs (75.86 per cent) in 2015-16, 43 AWCs (74.14 per cent) in 2016-17
and 40 AWCs (68.97 per cent ) in 2017-18.
GoR accepted the facts and stated (December 2018) that in 2015-16
AWWs/AWHs were not trained for filling the Child Assessment Cards.
Further, the cards were provided during 2018-19 only.
(v) Non enrolment of children in primary school
As per scheme, PSE provided at AWCs would enable easy transition of
children from AWC to primary school. Accordingly, it was the duty of
Anganwadi Worker (AWW) to maintain records for the transition to primary
school, which should be monitored and analysed by the CDPO for shortfall in
number of children joining primary school.
33 State Council of Educational Research and Training.

Audit Report (G&SS) for the year ended 31 March 2018
98
Out of 58 test checked AWCs, 12 AWCs (20.69 per cent) in 2015-16, 10
AWCs (17.24 per cent) in 2016-17 and 11 AWCs (18.97 per cent) in 2017-18
did not enrol children ranging one to 30, in primary school after completion of
Pre School Education (PSE).
GoR stated (December 2018) that efforts are being made for convergence with
Education department to ensure 100 per cent enrolment in primary schools.
3.6.4.3 Nutrition and Health Education
(i) Nutrition and Health related education
One of the key roles of the Anganwadi worker and ASHA Sahyogini was to
provide health and nutrition related education to all women in the age group of
15-45 years, ensure optimal uptake of services and entitlements and practice
of recommended household behaviour through pictorial and audio visual aids.
It was observed that out of 58 test checked AWCs, necessary pictorial or
interactive communication aids required to interact with the beneficiaries were
not available in 53 AWCs ( 91.38 per cent) in 2015-16, 52 AWCs in 2016-17
(89.66 per cent) and 52 AWCs in 2017-18 (89.66 per cent).
(ii) Shortfall in organising Mother & Child Health Nutrition day
(MCHN)
Monthly MCHN day is organised at each AWC on a predetermined date with
the joint efforts of ICDS and Medical Department. MCHN day is organised
once a month at each of the AWC and is attended by the ANM34. For effective
implementation of MCHN days, the presence of ANM is a pre-requisite. The
Medical Department ensures the presence of ANM along with the vaccines
and medicines at the AWC to conduct immunization of children and pregnant
women and to conduct their health check-ups. Nutrition Counselling through
Godbharai35 and Annaprashan36 is imparted.
Audit scrutiny revealed that MCHN days were organised for less than
specified period (12 days in a year) in 16 AWCs during 2015-16 ranging from
1 to 12 days , in 14 AWCs during 2016-17 ranging from 1 to 8 days and in 14
AWCs during 2017-18 ranging from 1 to 12 days. There was overall shortfall
of 173 MCHN days in 58 test checked AWCs. Though presence of ANM on
MCHN day was a pre-requisite, there was shortfall in participation of ANMs
in 13 AWCs in 2015-16 ranging from 2 to 12 days, in 12 AWCs in 2016-17
ranging from 2 to 12 days and in 17 AWCs in 2017-18 ranging from 1 to 12
days. Overall, ANMs were absent for 318 MCHN days in these AWCs.
34 Auxiliary Nurse Midwifery: Works of ANM are include maternal and child health
alongwith family planning services, health and nutrition education, efforts for maintaining
environmental sanitation etc. 35 Godbharai is a ceremony held in local communities to welcome unborn baby and bless
the mother -to be. 36 Annaprashan is a ceremonial beginning of solid food intake by the baby after attaining 6
months of age

Chapter III Compliance Audit
99
GoR accepted the facts and stated (December 2018) that due to availing of
long period leave by ANMs or vacant posts, MCHN days could not be
organised. However, efforts are being made for alternative arrangements.
Thus, the services of immunization, health check-ups and Nutrition
Counselling were hampered to the extent of shortfall in organisation of
MCHN days and less participation of ANMs.
3.6.4.4 Immunisation and Referral services
Health check-up, immunisation, and referral services and treatment of
common ailments were the health related services of ICDS. Health check-up
service includes ante-natal care of expectant mothers, post-natal care of
nursing mothers and care of new born babies and children below six years of
age. The health check-up and medical care are to be rendered by the Auxiliary
Nurse Midwifery under the guidance of the Medical Officers of the PHC.
ICDS guidelines stipulate that during health check-up and growth monitoring,
sick or malnourished children in need of prompt medical attention be referred
to PHCs or their sub-centres.
(i) Immunisation
Vaccinations: Under ICDS, for protection from six vaccine
preventable diseases namely, poliomyelitis, diphtheria, pertussis, tetanus,
tuberculosis and measles, children up to the age of one year were required to
be administered the prescribed doses of BCG, DPT, OPV37 and Measles
vaccines with the help of Medical Department at AWCs.
Audit scrutiny of the 58 test checked AWCs revealed that 312 of the identified
3,766 beneficiaries (8.28 per cent) were not administered the prescribed
vaccines. Further, five AWCs (8.62 per cent) in 2015-16, four AWCs (6.90
per cent) in 2016-17 and 4 AWCs (6.90 per cent) in 2017-18 did not even
identify the beneficiaries for immunisation.
IFA Tablets/Syrup: As per guidelines of Weekly Iron & Folic
Supplementation Scheme (WIFS) weekly dose of 100 mg iron and 500 mcg
folic acid was to be given to adolescent girls. Audit scrutiny however, revealed
that Iron Folic Acid (IFA) tablets were not provided to 291 beneficiaries (4.56
per cent) of the identified 6,381 beneficiaries at 58 test checked AWCs.
Further, 12 AWCs (20.69 per cent) in 2015-16, 13 AWCs (22.41 per cent) in
2016-17 and 15 AWCs (25.86 per cent) in 2017-18 did not even identify the
beneficiaries.
Similarly under National Iron plus Initiative Program (NIPI), IFA syrup was to
be given two days in a week to children of age group 6-60 months. Audit
scrutiny however, revealed that IFA syrup was not provided to 551
beneficiaries (10.82 per cent) of the identified 5,092 beneficiaries at 58 test
checked AWCs. Further, 22 AWCs (37.93 per cent) in 2015-16, 16 AWCs
37 BCG: Bacille Calmette-Guerin, DPT: Diphtheria, Pertussis, Tetanus, OPV: Oral Polio
Vaccine.

Audit Report (G&SS) for the year ended 31 March 2018
100
(27.59 per cent) in 2016-17 and 19 AWCs (32.76 per cent) in 2017-18 even
did not identify the beneficiaries.
Vitamin-A dose: As per instructions issued (November 2006) by
Ministry of Health and Family Welfare, vitamin-A dose was required to be
administered to all children of 9 months to 5 years of age at AWCs.
Audit scrutiny however revealed that dose of vitamin-A was not provided to
700 beneficiaries (6.63 per cent) of the identified 10,558 beneficiaries at 58
test checked AWCs. Further, 8 AWCs (13.74 per cent) in 2015-16, 4 AWCs
(6.90 per cent) in 2016-17 and 3 AWCs (5.17 per cent) in 2017-18 did not
even identify the beneficiaries.
This was indicative of lack of coordination & responsibility between ICDS
(Anganwadi workers) and medical and health department (Auxiliary Nurse
Midwifery).
(ii) Referral services
During health check-ups and growth monitoring sessions, sick/malnourished
children as well as pregnant women and lactating mothers in need of prompt
medical attention, were required to be referred to health facilities. The
Anganwadi worker is required to facilitate the referrals and also detect
disabilities in young children and refer to health facilities with a referral slip.
It was observed during test check of 58 AWCs, that two AWCs did not refer
29 out of 40 (72.50 per cent) severely malnourished children to health
facilities in 2015-16. Similarly, four AWCs did not refer 13 out of 20 (65.00
per cent) severely malnourished children in 2016-17 and two AWCs did not
refer 16 out of 23 (69.57 per cent) severely malnourished children in 2017-18.
Thus, 58 children were deprived of specific treatment though identified at
AWCs.
Further, no beneficiaries in need of prompt medical attention (other than the
severely malnourished children) were referred to health facilities during
2015-18 by 50 out of 58 test checked AWCs.
Thus, due to lack of motivation among AWW and their inability to identify
and counsel the target beneficiaries, the referral services were not as effective
as desired.
3.6.5 Internal Controls
The monitoring and supervision of the ICDS Scheme is recognised as one of
the essential requirements for the effective working of the scheme. Regular
field visits to AWCs/ICDS Blocks by programme officials at different levels is
essential to monitor the working at AWCs. Audit scrutiny however, revealed
the following:
(i) Shortfall in stipulated supervision related field visits
As per norms, each CDPOs was to supervise at least 25 AWCs per month on
a rotational basis and was to ensure coverage of 100 per cent AWCs in a

Chapter III Compliance Audit
101
year. Supervisors were required to supervise all AWCs during a month in her
sector and in case of holding additional charge, 50 per cent AWCs of each
sector.
Year wise details of supervision/inspection conducted by CDPOs/Supervisors,
as provided by the 12 test checked projects (out of 15 projects) is given in the
Table 9.
Table 9
Years CDPOs Supervisors
Target Achieve-
ment
Shortfall
Shortfall
(Per cent)
Target Achieve-
ment
Shortfall
Shortfall
(Per cent)
2015-16 2,571 966 1605 62.43 30,852 10,336 20,516 66.50
2016-17 2,597 1008 1589 61.19 31,164 12,879 18,285 58.67
2017-18 2,607 930 1677 64.33 31,284 13,001 18,283 58.44
Total 7,775 2,904 4871 62.65 93,300 36,216 57,084 61.18
It can be seen from the table that there was a huge shortfall in supervisions/
inspections of the AWCs by CDPOs (62.65 per cent) and Supervisors (61.18
per cent). Further, out of 58 test checked AWCs, the Supervisors did not
inspect 36 AWCs in 2015-16 (62.07 per cent), 35 in 2016-17 (60.34 per cent)
and 34 in 2017-18 (58.62 per cent).
GoR accepted the facts and stated (December 2018) that shortfall in visits
remained due to vacancy in supervisory posts. However, audit is of the view
the government may revisit the feasibility of the norms set for supervision by
CDPOs/Supervisors.
(ii) Incomplete data reported in Rapid Reporting System
GoI has been taking steps to revamp the Management Information System
(MIS) under the ICDS programme. It is a web-enabled data entry system for
use across all States/UTs for entry of revamped reporting formats at State/UT
level.
Audit scrutiny revealed that 43.71 per cent (932 AWCs) of 2,132 AWCs of 10
test checked projects38 did not upload their Monthly Progress Reports on
Rapid Reporting System (RRS) MIS during March 2018.
Further, it was observed that in two (Chaksu and Jamawa Ramgarh) of these
projects, despite provision of Android tablets, the Supervisors did not utilise
them for uploading the same.
(iii) Monitoring committee not constituted at AWC level
As per instructions issued (March 2011) by GoI, an AWC level monitoring
committee was to be constituted to review and take/suggest action to improve
delivery of service at the AWC.
38 Ahore, Anandpuri, Bakani, Buhana, Balotra I, Chaksu, Devgarh, Gangapur City, Jhadol
and Jamawa Ramgarh.

Audit Report (G&SS) for the year ended 31 March 2018
102
Audit scrutiny revealed that out of 58 test checked AWCs, in 37 AWCs (63.79
per cent) such committee was not constituted. Though such committees were
constituted in two AWCs, regular meeting were not held during 2017-18.
3.6.6 Conclusion
Anganwadi Centres are the first outpost for delivery of supplementary
nutrition, pre-school education and other services under the ICDS programme
to children in the age group of 6 months to 6 years, pregnant women and
lactating mothers. Audit noticed that there were deficiencies in planning,
availability of infrastructure, equipment and manpower in these Anganwadi
centres. There was shortfall of 35.24 per cent and 41.32 per cent in coverage
of targeted eligible beneficiaries for supplementary nutrition and pre-school
education respectively. A substantial number (23.30 lakhs) of malnourished
children were deprived of additional nutrition. None of the AWCs were able to
provide micronutrient fortified supplementary nutrition as the Self Help
Groups who supplied food did not have the capacity for fortification. Shortage
of critical personnel like CDPOs/ACDPOs (52.47 per cent) and Supervisors
(31.68 per cent) and shortage in prescribed trainings also affected various
aspects of delivery of the programme. These deficiencies coupled with lack of
regular supervision resulted in weaknesses in the delivery of services.
Recommendations:
GoR should
1. Ensure that Annual Plans are prepared after taking inputs from villages
and blocks.
2. Review the increasing percentage of ‘wasted’ children in the state in
comparison to the national average and specific targets for reduction
may be set so that this could be monitored effectively.
3. Ensure that all the identified beneficiaries including the malnourished
children who have so far been excluded from the prescribed additional
nutrition are provided fortified supplementary nutrition.
4. Ensure appointment and training of staff, especially of CDPOs and
Supervisors so that implementation and supervision of ICDS programme
is made more effective.
5. Ensure that all the identified beneficiaries are provided pre-school
education with prescribed PSE kits and to mandatorily maintain Child
Assessment Cards to assess the child’s learning needs.

Chapter III Compliance Audit
103
Medical Education Department
3.7 Functioning of Mathura Das Mathur Hospital, Jodhpur
3.7.1 Introduction
Mathura Das Mathur (MDM) Hospital, Jodhpur is the largest hospital in the
western region of Rajasthan and is attached to Government Medical College
(Dr. SN Medical College) at Jodhpur. There are 18 departments39, including
seven Super-Specialty departments40 and a separate Geriatric clinic41 for
senior citizens, in MDM hospital. They have inpatient facility of 1,111 beds.
The hospital offers referral and tertiary healthcare services42 to the patients.
The Principal and Controller (P&C) of Dr. SN Medical College, Jodhpur is
controller of the hospital and controls the budget of the hospitals. MDM
Hospital, Jodhpur is headed by Superintendent, who is responsible for delivery
of healthcare services in the hospital.
During the period 2013-17(calendar year), MDM Hospital provided healthcare
services to 51.19 lakh patients and incurred revenue expenditure of
` 265.81 crore during 2013-18 (financial year). These funds were received
from various sources43. Smaller portion of these funds were available for
spending on medicines and repair & maintenance of the hospital assets during
the period 2013-18 since majority were spent on salary, general establishment
and contractual services (71.29 per cent).
With a view to assess the quality of inputs, efficiency and outcomes of the
hospital processes, a thematic audit of the delivery of services by MDM
Hospital Jodhpur, was conducted (May-September 2018) for the period
2013-18.
Audit Findings
Audit findings related to various aspects of the functioning of MDM Hospital
have been discussed below.
3.7.2 Resource Management
Hospital resources include infrastructure, human resources, equipment and
consumables and drugs. Audit scrutiny of the resources of MDM Hospital
and their management revealed the following:
39 Dentistry; Dermatology, Venereology & Leprosy; Ear, Nose & Throat (ENT); General
Medicine; General Surgery; Obstetrics & Gynecology; Ophthalmology; Orthopedics;
Pediatrics; Psychiatry and Radio-Therapy. 40 Cardiology, Cardiothoracic & Vascular Surgery, Gastroenterology, Nephrology,
Neurology, Neurosurgery and Urology. 41 Under National Programme for the Healthcare of the Elderly (NPHCE). 42 Tertiary care is a specialized consultative healthcare provided for inpatients referred from
primary and secondary level hospitals, in an institution that has personnel and facilities
for advanced laboratory and imaging investigations. 43 State General Budget, MNJY, MNDY (RMSCL), MNDY (MDM).

Audit Report (G&SS) for the year ended 31 March 2018
104
3.7.2.1 Building Infrastructure
MDM Hospital building comprises of four blocks accommodating 27 OPD
units in 18 departments, one Geriatric Clinic, one Trauma Centre and one
central laboratory.
The shortage in infrastructure with respect to standards of Medical Council of
India (MCI), for providing quality healthcare services in various departments,
operation theatres and wards are discussed in the following paragraphs.
(i) Infrastructure availability to meet increasing patient load: As per
clause B.1.9 of ‘Minimum Standard Requirements for the Medical College for
250 Admissions Annually Regulations, 1999’ (Regulations), the teaching
hospitals are required to have an attached 1,100 bedded facility for providing
tertiary healthcare facilities. MDM hospital has 19 departments which have 28
OPD units44 and 1,111 beds for patients’ care and treatment. Scrutiny of
records revealed that there was substantial patient load in the MDM hospital,
the details of which are given in Table 10.
Table 10
Year Number
of OPD
Patients
(in lakh)
Number
of IPD
Patients
(in lakh)
Patients
load
(in lakh)
Percentage
increase as
compared
to 2012
Number of
functional
OPD units
Availability
of beds
2012 7.08 0.30 7.38 - 17 NA
2013 8.70 0.37 9.07 22.90 23 703
2014 9.04 0.40 9.44 27.91 23 759
2015 9.25 0.46 9.71 31.57 25 936
2016 10.48 0.64 11.12 50.68 25 1,001
2017 11.12 0.73 11.85 60.57 28 1,111
Percentage
increase in 2017 as
compared to 2012
57.06 143.33 60.57 58.03
Source: information provided by MDM hospital, Jodhpur.
It can be seen from the above table that the number of OPD patients and IPD
patients increased by 57.06 per cent and 143.33 per cent respectively during
2012-17. However, during this period, the number of beds increased only by
58.03 per cent which was not commensurate with the growth of IPD patients.
Despite this, no planning for creation of additional/new units was done by the
hospital during 2013-18 to cater for the increasing patient load, though, 10
units45 were transferred from other hospitals to MDM Hospital during this
period and one Geriatric clinic for senior citizens was established in August
2013.
GoR accepted the facts and stated (February 2019) that many units were
transferred from other hospitals and seven super speciality departments and
one Geriatric clinic were operationalised. To decrease the patient load from
44 A unit is headed by either Professor or Associate Professor and generally have not more
than 30 beds. 45 Five units (one unit of General Medicine, two units of Obstetrics & Gynaecology, one
unit of paediatrics and one unit of Cardiothoracic & Vascular Surgery) in 2013, two units
of paediatrics in 2015 and three units (one unit of General Surgery, one unit of
Gastroenterology and one unit of Urology) in 2017.

Chapter III Compliance Audit
105
old building, a new OPD block was operationalised in 2017 and six OPD units
were transferred to new OPD Block. The construction of first, second and
third floors for remaining departments, Central Lab and Teaching Block was
still pending.
(ii) Insufficient infrastructure in Wards
Norms prescribed by MCI provided that accommodation in a ward shall not
exceed 30 patients. Further, the norms for infrastructure requirement for each
ward include availability of Clinical Demonstration Room, Examination and
Treatment Room, Residential Doctors and Student Duty Room, Nurses Duty
Room/Nursing Station and Ward Pantry etc., in each ward.
Audit scrutiny of records and information provided for 33 wards revealed that
Clinical demonstration rooms were not provided in 24 wards (72.73 per cent),
Examination and treatment rooms were not provided in 19 wards (57.58
per cent), Resident doctors and Student duty room were not provided in eight
wards (24.24 per cent) and Ward pantry was not provided in 22 wards (66.67
per cent). Further, there was a high bed occupancy ratio in two out of three
Pediatric wards. It was also noticed that bed occupancy ratio of these wards
was 104 per cent in 2016, 113 per cent in 2017 and 117 per cent in 2018.
Facilities prescribed by MCI for wards are necessary to ensure that quality
health services are provided efficiently and effectively. Thus, the delivery of
quality health services have been impacted to the extent of shortage of these
facilities.
GoR accepted the facts and stated (February 2019) that the old wards did not
have prescribed infrastructure. In some wards, treatment room was being used
as clinical demonstration room and wherever adequate space was available,
Public Works Department had been instructed to construct clinical
demonstration and treatment room in wards. It was also stated that to address
the high bed occupancy ratio in paediatric wards, one neo natal ward of 20
bedded capacity was constructed and would become operational upon
deployment of nursing staff and specialists.
However, the fact remained that a holistic view, of the current and future
infrastructure needs, required to be taken in order to ensure continued
infrastructure availability as per the prescribed norms.
(iii) Insufficient infrastructure for Operation Theatres
Norms prescribed by MCI in 1999 (revised norms w.e.f 03.11.2010) provides
for minimum infrastructure for each Operation Theatre (OT) consisting of (i)
waiting room for patients, (ii) pre-anesthetic/preparation room (for at least
four beds), (iii) post-operative recovery room (for at least 20 beds), (iv)
instrument room, (v) nurse room, (vi) washing room for Surgeon and
Assistants and (vii) students washing up and dressing room etc.
Five OTs were operating under MDM hospital namely Cath laboratory OT
(one table), Ophthalmology OT (four tables), Gynecology OT (three tables),

Audit Report (G&SS) for the year ended 31 March 2018
106
Main OT (seven tables)46 and Cardiothoracic OT (three tables)47. Audit
scrutiny revealed that:
Pre-Anesthetic/preparation room was not provided in two (Gynecology
and Cardiothoracic) out of five OTs and against the norm of four beds,
only three beds were provided in Ophthalmology OT.
Post-Operative Recovery Room was not provided in Cardiothoracic OT
while other four OTs had less number of beds in Post-Operative recovery
rooms.
Soiled Linen Room was not provided in three OTs (Ophthalmology,
Gynecology and Main OTs).
Instrument Room was not provided in two OTs (Ophthalmology and
Gynecology OT).
Nurse Room was not provided in two OTs (Ophthalmology and Main
OT).
Surgeon and Anesthetist Room was not provided in three OTs
(Ophthalmology, Main and Cardiothoracic OT).
Observation gallery required for practical training of students was not
provided in four OTs (Ophthalmology, Gynecology, Main OT and
Cardiothoracic).
GoR while accepting the facts stated (February 2019) that instructions were
being issued to provide sufficient space as well as upgrade infrastructure in
Operation Theatres as per MCI norms. It was also stated that presently all the
construction activities are being carried out in accordance with the MCI
norms.
(iv) Non availability of Oxygen line and connections in wards
As per MCI norms, all the wards in Orthopedic, Surgery and Pediatrics
Departments should have wall mounted suction lines along with piped wall
mounted central Oxygen lines on all beds and at least five beds in
Ophthalmology department should have the same arrangement.
Out of 319 beds in these four departments of Pediatrics, Surgery, Orthopedic
and Ophthalmology, oxygen line was provided to only 38 beds (11.91 per
cent).
GoR while accepting the fact stated (February 2019) that the tendering for
installation of oxygen lines in the wards was under process.
46 Includes Neurosurgery, Urology, ENT, Surgery and General Emergency. 47 Includes Orthopedic, Dental and Cardiothoracic department.

Chapter III Compliance Audit
107
(v) Insufficient infrastructure for Central Laboratory
As per MCI norms, there shall be well equipped and updated central
laboratories preferably along with common collection for all investigations in
pathology, microbiology and biochemistry and other specified works.
Accordingly, there was a central laboratory for carrying out various
investigations in pathology, biochemistry and microbiology. Scrutiny of
records and physical verification of central laboratory revealed that there was
no separate room for doctors (non-clinical) in microbiology laboratory. As a
result, they had to sit with technicians and collected the samples of patients in
the same room.
GoR while accepting the facts stated (February 2019) that the proposals for
construction of well equipped laboratory building in new OPD block was
pending for approval.
3.7.2.2 Human Resources: Shortage of medical specialists/medical staff
The details of sanctioned strength for various medical cadres in the hospital
vis-à-vis person-in-position as on 31 March 2018 is given in the Table 11.
Table 11
Name of post Sanctioned
Strength
Persons in
Position
(Regular
Staff)
Shortfall
(in per
cent)
Contractual
staff/other
staff
Total Overall
shortfall in
PIP
Medical Officers 37 18 19 (51.35) 0 18 19
Staff Nurses 941 417 524 (55.69) 283 700 241
Para-medical
staff
117 50 67 (57.26) 73 123 (+)6
Total 1,095 485 610 (55.71) 356 841 254
Source: information provided by MDM hospital, Jodhpur.
It can be seen from the table that as of March 2018:
There was 51.35 per cent shortage (19 out of 37) of Medical Officers
(Doctors).
There was an overall shortage of 25.61 per cent of nursing staff (241 out
of 941) including contractual nursing staff. It was also observed that
despite shortage of nursing staff, 11 staff nurses were allowed to proceed
on deputation and 11 staff nurses were deployed for tasks other than
nursing.
Further, though there was an overall excess of 6 specialists48 (Professors,
Associate Professors and Assistant Professors) as per MCI norms. However,
shortage of 1 or 2 specialists in departments of dentistry, obstetrics &
48 Specialists include Professors, Associate Professors and Assistant Professors (teaching
faculties). Department wise/hospital wise sanctioned strength of specialist was not
provided though overall sanctioned strength for all constituent hospitals was available at
medical college level. Comparison has been done between requirements of “Specialists”
as per MCI norms for 28 units and actual deployment thereof.

Audit Report (G&SS) for the year ended 31 March 2018
108
gynecology, ophthalmology, radio-therapy, cardiothoracic & vascular surgery
and nephrology was also noticed.
GoR accepted (February 2019) that there was shortage of medical officers and
staff nurses. To address the acute shortage of staff nurses, 283 nurses were
engaged on urgent temporary basis. Further, proposals are under consideration
for repatriation of the nursing staff who were on deputation.
3.7.2.3 Equipment Management
As per norms prescribed by MCI, availability and management of Machinery
and Equipment in a hospital and optimum utilisation thereof is essential for
better delivery of healthcare services
The status of availability and utilisation of machinery & equipment for
providing quality healthcare services in various departments and units of the
hospital, as compared to standards prescribed by MCI, are discussed in the
following paragraphs.
(i) Non-functional equipment in ICUs and OTs
Scrutiny of records of five OTs and six ICUs revealed that 33 to 100 per cent
of essential machines and equipment were non-functional in one OT (Cath lab
OT) and four ICUs (Pediatric, Surgical, Medical and Trauma), as detailed in
Table 12.
Table 12
Name of
ICU/
OT
Name of Machines/
Equipment
Total
available
Functional Non-
functioning
(per cent)
Period of non-
function as of
December 2018 (in
months)
Pediatric ICU Pulse Oximeter 4 1 3 (75 ) 16
Baby Warmer 6 0 6 (100) 18
Defibrillator 2 1 1 (50) 9
ECG Machine 1 0 1 (100) 30
Weighing Machine 3 2 1 (33) 16
B.P. Instrument
Mercurial
3 2 1 (33) 16
Infusion Pump 21 7 14 (67) 16
Surgical ICU Ventilator 15 8 7 (47) 18-48
Medical ICU ECG Machine 3 1 2 (67) 9
Defibrillator 4 2 2 (50) 16
Ultrasonic Machine 1 0 1 (100) 23
Trauma ICU Electric Suction
Machine
5 2 3 (60) 24-48
Advance ICU
Ventilator
2 0 2 (100) 36-60
Cath lab OT Fumigation Machine 2 1 1 (50) 23
Artery Forceps 15 4 11 (73) 107
Total 87 31 56 (64.37)
Source: Information provided by MDM hospital, Jodhpur.
Further, In-charge of Pediatric ICU also informed (May-July 2018) the
Superintendent that various machines in Pediatric ICU were repairable, but no
action for repairing these machines was initiated by the hospital.

Chapter III Compliance Audit
109
GoR stated (February 2019) that repair of equipment and instruments was an
ongoing process and in case they were not repairable under Annual
Maintenance Contract (AMC) and Comprehensive Maintenance Contract
(CMC), new equipment would be purchased.
The reply is not tenable as a large number of essential equipment in various
OTs/ICUs were found non-functional for substantial period which was
indicative of lapses in repair and maintenance of essential equipment.
(ii) Non-functional equipment in other departments/laboratories
Audit scrutiny of records of critical and costly medical equipment needed for
specified treatments/diagnosis revealed the following:
Cardiotocography (CTG) Machine: Scrutiny of records of labor room
revealed that though there were five CTG machines available in labor room,
all of them were inoperative since January 2017. In the absence of functional
CTG machines, measurement of fetal heart beats was being done on an adhoc
basis with the help of stethoscopes. Thus, specialized monitoring machines for
investigation of fetal heart beats of patients could not be accessed. GoR
assured (February 2019) that it would be repaired soon as work was under
process.
Clinical chemistry Analyzer: A fully automated Tulip coral 300
analyzer, for performing biochemistry and immune turbidimetry assays from
blood, serum, plasma and body fluids was installed (August 2013) in
biochemistry laboratory at a cost of ` 11.03 lakh. Scrutiny of stock register
and records of machines revealed (June 2018) that the machine was not
working properly since its installation and remained faulty since February
2014. Though the machine was under Comprehensive Maintenance Contract
(CMC) but was not made good (June 2018) as damage done by rats was not
covered in CMC. Thus, the patients had to be diverted to the Dr.SN Medical
College, Jodhpur for these tests.
ND YAG and CO2 Lazer machines: These machines were installed in
Skin Department in February 2014 at a cost ` 9.98 lakh and ` 3.89 lakh
respectively. It was observed that these machines were non-functional since
October 2014 and April 2016 respectively due to faulty optical fiber cables
damaged during shifting of machines from one room to another room.
However, these machines were not repaired even as of July 2018. GoR assured
(February 2019) that ND YAG laser machine would soon be repaired.
Cobalt-60 machine: A Cobalt machine was installed in 2001 in the
Radiotherapy Department for radiation therapy to treat 45-50 cancer patients
per month. The Cobalt machine uses Co-60 radioactive source for therapy. It
was observed that despite intimation by the dealing doctor (September 2011)
to the head of the Department that the source was going to complete its active
life and required replenishment, the order was placed only in December 2013.
As a result, the machine became inoperative in June 2014 and remained so till
January 2016 (19 months). Consequently, 850-900 cancer patients who could

Audit Report (G&SS) for the year ended 31 March 2018
110
have benefited from the services of the machine were deprived of access to
radiation therapy.
(iii) Equipment installed under Public Private Partnership
Poor contract management of MRI machine: An MRI machine was
installed (February 2009) under Public Private Partnership by M/s Satyam
Diagnostic Centre, Jodhpur (Licensee). Accordingly, the licensee was
required to perform the 26 types of imaging tests at their prescribed rate and
for 20 per cent cases of the poor category patients, tests were to be
performed free of cost. The number of free cases were to be evaluated on
monthly basis and carried forward to next month. At the end of calendar
year, if the number of cases remained less than 20 per cent, the licensee was
liable to pay for the number of cases not performed at a fixed rate of ` 2,000
as per condition number nine. The receipt for MRI investigation was to be
issued by licensee through computer on the receipt book provided by the
hospital and reconciliation of accounts was to be done on quarterly basis as
per condition number 17.
Scrutiny of records of the MRI machine and information provided by the
hospital revealed that the receipt books were not provided to the licensee by
the hospital and fee receipts were issued by the licensee at its own level.
Further, reconciliation of accounts was also not done as a result it could not
be verified in audit that 20 per cent of the patients were actually benefitted
by free MRI tests as per the contract.
It was also observed that the tests were to be performed at the prescribed rates,
however no mechanism was in place to ensure that the licensee was charging
the fee as per agreement.
PPP contract for Cancer Therapy Machine not finalized for 30
months: GoR in the budget announcement for 2016-17 proposed to establish
Linear Accelerator and Gamma Camera machines on PPP mode in
radiotherapy department of the hospital for upgradation of the available
facilities for cancer patients.
Scrutiny of records revealed that the P&C prepared bid proposals and
forwarded (May 2016) to the Director, Medical Education. Accordingly, e-
tenders for installation of the machines were invited (October 2017) and a pre-
bid meeting was held on 23 October 2017, wherein one of the bidders
suggested certain changes to the terms and conditions of contract. Technical
and Financial Committee forwarded (December 2017) the revised bid
documents to the Directorate, Medical Education, Jaipur whose approval was
not received despite repeated reminders.
As the Department failed (August 2018) to finalise the terms and conditions of
installation of Linear Accelerator and Gamma Camera machines on PPP
mode, the machines could not be installed even after lapse of more than two
years and deprived the cancer patients from the benefits of an upgraded
diagnostic facility. GoR stated (February 2019) that matter is pending for
approval.

Chapter III Compliance Audit
111
(iv) Monitoring of equipment through ‘e-Upkaran’
‘e-Upkaran’, a web based application, was launched (October 2015)by
Medical and Health Department, GoR for monitoring of usage and repair and
maintenance of equipment and instruments installed at healthcare centres
across the state from one platform. The application was available for
utilization by all government health institutions including medical college
attached hospitals. This application provides online status of Equipment
Inventory, functionalities and maintenance status to the users.
Scrutiny of records, however, revealed that neither the Medical College nor
MDM hospital was utilizing this application and did not upload any details on
this software. Therefore, timely remedial action on many critical equipment
could not be taken which deprived the patients of diagnostic services.
Only after being pointed out by Audit, GoR issued (February 2019)
instructions to all HoDs and Unit Heads to provide information regarding
procurement, installation, operation, repair, maintenance and upkeep of
equipment on e-Upkaran. Further, computerisation of information was under
progress.
3.7.2.4 Drugs, Consumables and Reagents Management
Drugs, sutures and surgical items are provided free of cost to all the patients
visiting government hospitals in Rajasthan through the scheme ‘Mukhyamantri
Nishulk Dava Yojana’ (MNDY). Under the scheme, more than 800 commonly
used essential medicines, surgical and suture items (Essential Drug List) were
to be made available to all visiting OPD and IPD patients at all Government
Healthcare Institutions in the State.
In the MDM hospital, Jodhpur, the drugs were being distributed to patients
through 14 Drug Distribution Counters (DDCs). In addition to drugs received
from Rajasthan Medical Services Corporation Limited (RMSCL), the hospital
also procured drugs locally of value ` 4.66 crore during 2013-18. Audit
scrutiny revealed the following:
(i) Shortage of Essential Drugs
As per MNDY scheme guidelines, Drug Distribution Warehouses (DDWs) are
to ensure continuous supply of drugs to the hospital sub store on receipt of
requisitions as per availability of medicines and annual financial limit of the
hospitals. Further, the drugs are issued to DDCs for distribution to the patients
on presentation of the prescription of Medical Officer (MO).
Test check of records revealed that against the requisition of type of medicines
included in Essential Drug List (EDL), 13.43 to 37.89 per cent drugs were not
available for a period of more than four months during 2013-18. The details of
requisition and availability of drugs is detailed in Table 13.

Audit Report (G&SS) for the year ended 31 March 2018
112
Table 13
Year Types of essential
Drugs required
Types of drugs unavailable for
more than 4 months to 12 months
Percentage
2013-14 607 230 37.89
2014-15 745 172 23.09
2015-16 819 110 13.43
2016-17 801 127 15.86
2017-18 821 178 21.68
Source: Information made available by the hospital
GoR stated (February 2019) that the drugs and medicines which were not
available/in short supply were procured as per availability of funds and it
would be ensured that all indoor patients receive drugs.
(ii) Decline in beneficiaries of free of cost drugs
As per calendar year wise data available with the hospital, 8.70 lakh OPD
patients had registered during the year 2013 which increased to 11.12 lakh
during the year 2017. Thus, OPD patients under MNDY, increased
substantially by 28 per cent during the period.
An analysis of total number of patients enrolled and benefited in MDM
hospital during 2013-17, was conducted during Audit. The results of the
analysis are detailed in Table 14
Table 14
Year No. of outdoor patients
enrolled during the year
No. of outdoor patients
benefitted
Percentage
2013 8,70,164 7,64,932 87.91
2014 9,04,413 6,65,036 73.53
2015 9,25,369 7,43,683 80.37
2016 10,47,984 8,19,973 78.24
2017 11,11,686 8,60,930 77.44
Total 48,59,616 38,54,554 79.32
Source: Information made available by the hospital
Above data reveals that there was a gradual increase in number of outdoor
patients enrolled during 2013-17 but the percentage of beneficiaries decreased.
As a result, over the years, about 21 per cent of the registered patients failed to
receive the requisite treatment/drugs prescribed.
Similar issue was also pointed out in paragraph 3.13.2.1 in the ‘CAG’s Audit
Report on General and Social Sector for the year ending on 31 March 2015’.
In this regard, the State Government assured Public Accounts Committee that
efforts were being made to extend the benefits of the scheme to the maximum
extent. However, in MDM hospital, the coverage of beneficiaries under
MNDY consistently reduced to 78.24 per cent in 2016 and 77.44 per cent in
2017.
GoR stated (February 2019) that drugs and medicines were distributed for free
to all patients under MNDY. The drugs and medicines which were not
available/in short supply were purchased as per availability of fund to make

Chapter III Compliance Audit
113
sure that all indoor patients received the drugs except those which were not in
essential drugs list.
The reply is not acceptable as 68.12 per cent of the patients (188 out of 276
patients test checked) were not provided all the drugs prescribed by the
doctors in the hospital and as many as 14.29 to 100 per cent medicines
prescribed by doctors were not available in the hospital. This indicated that
inspite of funds being available with RMRS as discussed in paragraph
3.7.4.3, medicines were not made available and undue financial burden was
put on the patients, which was against the objectives of the MNDY scheme.
(iii) Non availability of freezer in Sub Store/DDC
A physical inspection (July 2018) of sub store and the DDCs, revealed that all
the drugs were kept at room temperature as no freezer was available in the
store. The drugs and injectable items which were required to be kept at low
temperature were kept either in Ice boxes or in paper cartons due to non-
availability of freezer during 2013-18 despite the fact that Jodhpur city
recorded significantly high temperatures during most parts of the year.
GoR stated (February 2019) that acquisition of WIC freezer (mobile freezer)
was under progress.
(iv) Prescription of non-EDL drugs without reason
As per MNDY guidelines, in every prescription slip, as far as possible, doctor
has to prescribe medicines from essential drug list as per standard treatment
guidelines. If medicines are prescribed out of EDL, valid clinical reason and
proper justification for use of a specific medicine should be specified.
Test check of 276 prescriptions revealed that out of 456 drugs, 80 (17.54 per
cent) drugs were not included in EDL, which were prescribed. However, the
medical officers did not mention the valid clinical reason for prescribing non
EDL drugs. On being pointed out, P&C stated (November 2018) that
instructions would be issued to the doctors in this regard.
(v) Inadequate monitoring through “e-Aushadhi” software
For online monitoring, RMSCL adopted a drug inventory management system
‘e-Aushadhi’ which is a comprehensive online system capable of having
detailed information about availability of medicines, from procurement point
to consumption point, including Drug Distribution Counters.
Scrutiny of records of 14 DDCs in MDM hospital revealed that online ledger
for issue of medicines was not updated in the software for a period ranging
from four days to 10 months. As a result, there was mismatch in the number
of available drugs as per software and actual availability at the DDCs. Further,
only one out of 14 recruited Information Assistants (recruited in November
2013 for operation of DDCs under MNDY and MNJY) were posted at DDCs.
Hence their utilization for real time updating of data was not being done and
they were deployed for other clerical works. Similar issue was also pointed out

Audit Report (G&SS) for the year ended 31 March 2018
114
in paragraph 3.13.4.2 in the ‘CAG’s Audit Report on General and Social
Sector for the year ending on 31 March 2015’. In this regard, the Public
Accounts Committee also recommended (June 2017) to remove all the
deficiencies as pointed out by Audit.
GoR while accepting the fact stated (February 2019) that to address the delay
in updating of the system on daily basis, the necessary instructions were being
issued.
3.7.3 Management of hospital services
Healthcare services provided by hospitals are broadly classified into line
services (directly related to patient care), support services (indirectly related
to patient care) and auxiliary services (facilitate delivery of healthcare
services). The Audit findings related to management of these services are
discussed below.
3.7.3.1 Line services
Line Services provided in a hospital are the various healthcare services which
are directly related to patient treatment. These include Outdoor Patient
Department (OPD) patients, Indoor Patient Department (IPD) patients,
Emergency, Super Specialty, Maternity and other care services.
(i) Availability of Super Specialty Services: The detail of number of OPD
and IPD patients, surgeries/procedures conducted by Super Specialty
departments during 2017 are given in Table 15.
Table 15
S.
No.
Name of Super
Specialty
Department
(starting year)
Number
of units
Number
of beds
OPD
days
Number
of OPD
patients
in 2017
Number
of IPD
patients
in 2017
Average
OPD
patients per
OPD day in
2017
Surgery
cases in
2017
OPD
Patient per
OPD day
per
Specialist
1 Cardiothoracic
and Vascular
surgery (January
2013)
01 25 01 2,834 1,031 55 215 55
2 Cardiology
(2009)
01 37 04 43,797 7,422 211 3,018 105
3 Neurosurgery
(1991)
01 73 03 9,167 3,077 59 1,004 59
4 Neurology
(January 2017)
01 30 02 21,889 1,297 210 NA 70
5 Gastroenterology
(January 2017)
01 30 02 7,052 1,134 68 4,759 34
6 Nephrology (IPD
started from
April 2018)
01 12 02 7,152 NA 69 NA 69
7 Urology
(October 1987)
01 36 07 17,873 9,940 49 1,318 25
Scrutiny of records and information provided by the super specialty
departments concerned, revealed the following:

Chapter III Compliance Audit
115
Neurosurgery: MCI norms prescribe that a unit49 shall consist of not
less than 20 and not more than 30 beds for super specialty. During
2013-17, though there were 73 beds in the department, it was being
served by only one unit and number of operation cases also increased
substantially by 18.40 per cent during 2013-17. Further, OPD was
functioning for only three days in a week. As a result, the doctors were
overburdened. Considering the high patient load, though an additional
OT table was provided in the department but no additional units were
planned to be established.
Neurology: In this department, OPD was functioning only for two days
despite average of 70 patients per doctor per OPD day during 2017.
Audit analysis of average OPD per day and OPD duration during a day
revealed that for each doctor in Neurology Department the average
consultation time per patient50 was only five minutes for examination of
a patient as compared to 15 to 30 minutes in most other departments.
Gastroenterology: In this department, OPD was functioning for only
two days in a week and lengthy endoscopy procedures were being
performed along with OPD. Further, this facility was not available in
AIIMS, Jodhpur and other hospitals, hence the patients were being
referred to MDM hospital.
Nephrology: In the department, kidney transplant centre was
inaugurated in 2015 but could not be started as of March 2018. Further,
it was also noticed that 1,041 Chronic Renal Failure patients (546 in
MDM hospital and 495 in MG hospital) requiring kidney transplant were
registered during 2017-18. This indicates that large number of patients
were deprived of the intended benefits of the Centre.
Cardiothoracic and Vascular surgery: In this department, patients in
OPD, IPD and surgeries increased by 50.50 per cent, 164.36 per cent
and 35.22 per cent respectively during 2014-17. However, OPD unit was
available only once in a week. Further, against sanctioned bed strength
of 50 beds, only 25 beds were available as of March 2018. In violation of
MCI norms, no full time Unit Head (Professor) and Assistant Professor
were deployed/available in the department and the department was
dependent on only one Associate Professor.
Cardiology: In this department, patients in OPD, IPD and Cath Lab OT
increased by 90.97 per cent, 46.97 per cent and 47.87 per cent
respectively during 2013-17. Further, bed occupancy was 100 per cent
throughout the year in IPD. However, the number of units/beds/cath labs
were not increased during 2013-17.
49 As per Norms for minimum staff prescribed by MCI, each unit shall consist of (a)
Professor/Reader-1 (b) Lecturer-1 (c) Senior Resident/Tutor/Registrar-1 and (d) Junior
Residents 3 to 4. 50 Consultation time per patient is a Quality Indicator for measuring clinical care in OPD as
per National Quality Assurance Standards, 2016.

Audit Report (G&SS) for the year ended 31 March 2018
116
GoR stated that necessary action would be taken to address the deficiencies as
pointed out in audit.
(ii) Services provided by other departments
The details of number of units, beds, days, number of OPD/IPD patients in the
12 non-super specialty departments are given in Table 16.
Table 16
S.
No.
Name of
Department
Number
of units
Number
of beds
OPD
Days
Number of
OPD
patients
in 2017
Number
of IPD
patients in
2017
Average
OPD
patient
per OPD
day in
2017
Surgery
cases in
2017
Average
OPD51
patients
per
doctor
01 Dentistry 1 7 7 36,315 168 99 87 99
02 Dermatology,
Venereology and
Leprosy (Skin)
1 33 7 2,53,491 429 694 NA 231
03 Ear, Nose and
Throat (ENT)
1 47 7 81,720 1,113 224 899 56
04 General Medicine 3 123 7 1,33,242 14,820 365 NA 122
05 General Surgery 3 97 7 32,699 3,809 90 2,666 30
06 Obstetrics and
Gynecology
2 88 7 39,047 10,511 107 4,085 36
07 Ophthalmology 2 60 7 59,744 3,164 164 2,912 55
08 Orthopedics 2 63 7 49,953 3168 137 2,303 68
09 Pediatrics 3 117 7 53,211 6,747 146 NA 73
10 Psychiatry 1 105 7 52,374 2,547 143 NA 71
11 Radio-Therapy 1 35 7 11,478 1,554 31 NA 31
12 Geriatric 1 30 4 16,866 931 81 NA 81
It can be seen from the table that:
Average OPD per doctor per OPD day was very high in Skin (231),
General Medicine (122) and Dentistry (99) despite having OPD on all
days. GoR accepted (February 2019) that there was requirement of
faculties as well as more units.
As per MCI norm, a unit shall consist of not more than 30 beds. In four
departments (General Medicine, Obstetrics and Gynecology, Pediatrics
and Psychiatry), number of beds were in excess of norms. The number of
units was not increased to restrict the beds per unit to the prescribed
norms. GoR accepted (February 2019) that in medicine, gynecology,
pediatrics and psychiatry departments, number of beds were more as per
MCI norms due to huge patient load which could be reduced by increasing
number of units.
(iii) Denial of Services to Bhamashah Card Holders
Bhamashah Swasthya Bima Yojana (BSBY) was launched in December 2015
by GoR for providing cashless indoor medical treatment to those families
which were covered under National Food Security Act (NFSA) and Rashtriya
51 As per National Quality Assurance Standards 2016, OPD cases per doctor is an indicator
for measuring efficiency of doctors in OPD.

Chapter III Compliance Audit
117
Swasthya Bima Yojana. The scheme provides treatment up to ` 30,000 per
family per year in general cases and upto ` 3.00 lakh for serious ailments
which include packages for secondary and tertiary illnesses. A total of 21,051
patients were benefitted by free treatment under BSBY in the MDM hospital,
Jodhpur during December, 2015 to March, 2018.
Scrutiny of records, however, revealed that during December 2015 to March
2018, free treatment under BSBY were denied to 12,945 card holders (38.08
per cent) as their Bhamashah Cards were not linked with National Food
Security software.
GoR accepted (February 2019) that many of the Bhamashah card holders had
not linked their Bhamashah card to the National Food Security Act. The fact,
however, remained that a large number of BSBY card holders were deprived
of the benefit of inpatient treatments at free of cost due to lack of awareness.
(iv) Emergency Services
MCI norms prescribed that each attached hospital should have Accident and
Emergency Services, with distinct entrance for the emergency department.
The emergency department should be equipped with lifesaving instruments
such as Ventilator, Multi parameter monitor, Cardiac monitor with
defibrillator, etc., to treat accidental and emergency cases effectively.
It was however observed in Audit that:
Against 30 beds in trauma unit, only 24 beds were provided.
Against four fully equipped disaster trolleys (emergency trolleys), only
one emergency trolley (crash cart) was available.
Against four Ventilators, four Multipara Monitors, and four ECG
machines, no Ventilators and Multipara monitors were available and
only three ECG machines were available. GoR stated (February 2019)
that construction of a 100 bedded dedicated trauma hospital as per MCI
norms, was under progress and would address all the indicated
deficiencies. Further, purchase of new ECG machines for Minor
Operation Theatre was also under process.
(v) Maternity Services
Incentives under Janani Suraksha Yojana not provided: Janani
Suraksha Yojana (JSY), a centrally sponsored scheme was launched in
September, 2005 for reducing the infant mortality rate (IMR) and maternal
mortality rate (MMR) by encouraging and incentivizing the institutional
deliveries. A financial aid of ` 1,400 to rural and ` 1,000 to urban pregnant
women was to be given under this scheme. Director, Medical Health and
Family Welfare Services, Jaipur also issued instructions (July 2015) that it was
responsibility of the hospital to encourage opening of bank accounts of
pregnant women at the time of registration.
Scrutiny of records revealed that out of 21,124 eligible women, cash incentive
was not provided to 2,848 eligible women (13.48 per cent) during August

Audit Report (G&SS) for the year ended 31 March 2018
118
2015 to March 2018 due to non-availability of bank account details. Thus, the
hospital failed to adhere to these instructions.
Incentives under Mukyamantri Shubhlaxmi Yojana not provided:
The scheme was started from 1 April 2013 to encourage girl child birth, to
reduce the death rate of girl child and mothers and to make sure that there is
no discrimination on the basis of gender of the child. Under this scheme,
financial assistance of ` 7,300 (` 2,100 on discharge from hospital, ` 2,100
after one year of birth and ` 3,100 after completion of five year of birth) was
to be provided to the mother of the girl child. Further, the scheme was
modified in June 2016 to increase the positive attitude towards the girl child
and to improve their educational and health status. The scheme was also
renamed (June 2016) as Mukyamantri Rajshree Yojana and financial
assistance52 of ` 50,000 was to be provided.
Scrutiny of records revealed that out of 5,070 cases, financial assistance was
not provided in 364 cases (7.18 per cent) under Mukhyamantri Shubhlaxmi
Yojana during August 2015 to May 2016. Further, out of 7,287 cases, financial
assistance was not provided in 1,238 cases (16.99 per cent) under
Mukhyamantri Rajshree Yojana during June 2016 to March 2018 due to non-
availability of pass book or the fact that the beneficiary belonged to other
state.
GoR while accepting the facts stated (February 2019) that some of the patients
did not produce their bank account details and some patients belonged to other
states. The fact however remained that a substantial number of women were
deprived of incentive for institutional delivery and giving birth to girl child, as
envisaged in the Government schemes.
(vi) Indicators for measuring quality of service
Norms prescribed by MCI regarding provision of healthcare services are
based on number of MBBS/Post graduate (PG) seats sanctioned in the
medical college. Further, the National Quality Assurance Standards,
developed by National Health Systems Resource Centre (Ministry of Health
and Family Welfare, GoI) provides a list of service quality indicators to
assess the performance of public health facilities in the delivery of healthcare
services. However, no such indicators have been adopted by the government
tertiary care hospitals in Rajasthan. GoR stated (February 2019) that decision
of adopting the service quality indicators are yet to be finalised.
3.7.3.2 Support Services
(i) Diagnostic Services
Non-registration of laboratories: GoR issued instructions (June and
September 2015) for registration of all the hospitals having capacity of 50
beds or more, under Section 11 of the Clinical Establishments (Registration &
Regulation) Act, 2010, by 30 September 2015. It was observed that the
hospital was not registered under the Act as of March 2018. GoR stated
52 ` 2,500 at the time of discharge from the hospital to mother and ` 47,500 in the name of
girl for her education up to class XII in any government school in phases.

Chapter III Compliance Audit
119
(February 2019) that no Government laboratory was registered in the state
under the Act. The reply was not tenable as Government laboratories were
also required to adhere to the provisions of the Act.
Non-obtaining of quality certification from NABL: In accordance
with Indian Council of Medical Research (ICMR) guidelines, the department
decided (May 2014) for accreditation of Medical College attached Hospitals
with National Accreditation Board for Testing and Calibration
Laboratories (NABL). It was observed in Audit that the hospital was not
accredited with NABL as of March 2018. GoR stated (February 2019) that
pathology laboratory of the hospital was accredited by NABL. However, no
reply was furnished for accreditation of biochemistry and microbiology
laboratories.
Diagnostic tests not conducted due to non-availability of reagents:
Scrutiny of records of Central Laboratory of the hospital revealed (June 2018)
that blood culture tests could not be conducted in microbiology laboratory for
15 months (from 05 November 2016 to 05 February 2018) due to non-
availability of reagents (Antibiotic discs). The hospital, while accepting the
facts, stated (June 2018) that alternate arrangement for conducting these tests
was done in the Dr. SN Medical College. On being pointed out Principal &
Controller stated (November 2018) that availability of reagents would be
ensured.
Patients charged for free diagnostic tests: MNJY scheme was
launched in April 2013 with the objective of reducing high ‘out of pocket’
expenses borne by the patients for diagnostic tests and to provide all
healthcare services in the Hospital free of cost. It was, however observed in
Audit that during 2013-18, MDM Hospital irregularly charged ` 15.90 lakh53
from the patients for various diagnostic tests which were to be offered free of
cost. No specific reasons for charging the fee for these tests were intimated by
the hospital, though called for during Audit. GoR stated (February 2019) that
no fees was charged for tests under MNJY. Only few special tests which were
not covered under MNJY were charged. The reply is not tenable because the
accounts reflect charging of tests which were free under MNJY.
(ii) Bio Medical Waste Management
Bio Medical Waste (BMW) is generated by hospitals and other health
providers during diagnosis, treatment, immunization of human beings. BMW
consists of discarded drugs, waste sharps, microbiological and
biotechnological waste, human anatomical waste, etc. Scrutiny of records in
MDM Hospital, Jodhpur revealed the following:
Improper segregation, storage, transportation and disposal: Rule 8
(1) of BMW Rules, 2016 provides that no untreated BMW shall be mixed with
other wastes, while Rule 8 (2) provides that BMW shall be segregated into
containers or bags at the point of generation in accordance with Schedule I of
Rule 8 prior to its storage, transportation, treatment and disposal. It was,
53 X-Ray: ` 12.00 lakhs, ECG: ` 0.16 lakh, Dialysis: ` 3.67 lakh, Sonography: ` 0.07 lakh.

Audit Report (G&SS) for the year ended 31 March 2018
120
however observed that segregation of BMW at the point of generation as per
color coding was not done properly. BMW was kept in open spaces outside
the dumping station in common containers without prescribing the color
coding. Being in open space, there was no restriction on contact with BMW by
stray animals or unauthorized persons entering the vicinity, increasing the risk
of contamination. It was also found that BMW was being mixed with
Municipal Solid Waste (MSW). GoR stated (February 2019) that a committee
was formed to govern the segregation, storage and transportation of bio
medical waste. At present, bio medical waste after segregation was being sent
to Keru dumping station. The contention of GoR was not found correct as the
waste was not being segregated even as of 11 January 2019.
Improper arrangement for autoclaving of sharp waste: According to
Schedule I of the Rule 8, needles, syringes with fixed needles, needles from
needle tip cutter or burner, scalpels, blades or any other contaminated sharp
object that may cause puncture shall be stored in white (Translucent) disposal
bag and autoclaved. It was, however observed that sharp waste was not being
segregated at generation point (Ward, laboratory, and Operation theaters etc.)
due to absence of white containers/bags. As a result, sharp waste was not
being treated despite the availability of an Autoclave. Thus, it was lying idle
and not being utilised for treatment of sharp waste as prescribed in rules.
Absence of Effluent Treatment Plant (ETP): As per BMW Rules,
2016, ETP was to be established in a hospital for treatment of liquid wastes.
However, it was not established in MDM hospital as of March 2018. As a
result the infected sewage generated in the hospital consisting of three kinds of
contamination, bacterial, nuclear and chemical wastes, was being discharged
directly into the public sewer system. A similar issue was also pointed out in
paragraph 2.4.1 the ‘CAG’s Audit Report on General and Social Sector for the
year ending on 31 March 2013’. Public Accounts Committee recommended
(June 2015) that all the deficiencies pointed out by Audit may be rectified.
GoR stated (February 2019) that the matter was under process. However, the
fact remained that despite instructions of PAC, the deficiencies have not been
addressed for more than three and a half years.
(iii) Poor Ambulance Services
Indian Public Health Standards for district hospitals prescribe at least four
ambulances fully equipped with basic life support equipment (oxygen
cylinder, ventilator, defibrillator etc.) for hospital having 301 to 500 beds.
Further, serviceability and availability of equipment and drugs in the
ambulance needs to be ensured through checking on daily basis.
Though eight ambulances were available in MDM hospital as of March 2018,
none of the ambulances were equipped with life saving equipment. Thus, none
of the available ambulances were able to extend life saving support to the
patients in emergency and were being used merely as a transport vehicle.
GoR stated (February 2019) that new advanced life support (ALS) ambulance
has been purchased and will be delivered to hospital soon. However, it was not
delivered as of March 2019.

Chapter III Compliance Audit
121
(iv) Mortuary services
A Mortuary unit of the Department of Forensic Medicine and Toxicology is
functioning in the hospital which attends to medico legal cases including
postmortem on dead bodies. Five cold storages for accommodation of 24 dead
bodies were provided in the mortuary. Joint physical inspection of the
mortuary revealed the followings:
Building was below the road level due to which there was stagnation of
rain water.
Demonstration gallery for students was found in dilapidated condition
increasing the risk of injury for students entering the gallery.
Three out of five cold storage units (12 chambers) were found to be out
of order.
Unit Head in a letter to the Superintendent, stated that the viscera shelf
needed to be repaired and a separate viscera room for keeping viscera
samples was required.
GoR accepted the facts and stated (February 2019) that renovation work of
Mortuary was under progress and Viscera room was also under construction.
(v) Dietary Services
As per norms prescribed by MCI, central kitchen should be commodious
(spacious), airy, sunny and clean with proper flooring and with exhaust
system. It should be provided with proper and clean working platforms. The
services trolleys should cater for hot food and should be covered and made of
stainless steel. It is also stated that services of qualified dietician are essential
to prescribe diet on scientific lines for different types of patients.
Scrutiny of records revealed that sufficient utensils, trolley, staff etc., were not
available in the hospital kitchen to provide meals to the patients. The meals
were not served with due hygiene as the cook/serving staff did not wear head
masks and gloves etc., during cooking/serving of food to the patients. Further,
during 2013-18, no dietician was posted to prepare diet chart for the patients.
Cook/serving staff not wearing masks and gloves etc. in the hospital

Audit Report (G&SS) for the year ended 31 March 2018
122
GoR accepted (February 2019) that the post of dietician was vacant. However,
the cook maintained hygiene of the food. The reply was not tenable as the
instruction regarding wearing of head masks and gloves by the cook/serving
staff at the time of cooking/serving of food to the patients, was not found
adhered to during physical inspection by Audit.
(vi) Laundry Services
As per MCI Norms B 2.5 (Amended up to August 2017) for 250 P.G. Seats,
the Central Mechanical laundry shall be provided with bulk washing machine,
Hydro-Extractor, flat rolling machine. Further, laundering of hospital linen
shall satisfy two basic considerations, namely, cleanliness and disinfection.
The Principal & Controller of the Medical College, also directed (May 2017)
to use different colour bed sheets on different days of the week to ensure that
bed sheets are changed every day. Physical inspection of 33 wards (June-July
2018) revealed that bed sheets were being changed according to prescribed
color. During patients survey IPD patients also confirmed the cleanliness of
bed sheets and there was no complaint in this regard.
3.7.3.3 Auxiliary services
Auxiliary Services in a hospital are those services which are not directly
related to healthcare but contribute to facilitate the delivery of healthcare
services. Services such as patient registration, patient safety, transportation,
stores etc., are generally included under auxiliary services. Audit scrutiny of
delivery of these services revealed the following:
(i) Patient registration
Insufficient registration counters for Patients: Registration of
patients is the first step for getting healthcare facilities in hospitals. In 2017,
on an average 3,250 patients visited the hospital daily. Scrutiny of records
revealed that there were ten counters in the hospital for registration of patients.
Further, a patient survey of 142 patients was conducted wherein 74 patients
reported waiting time of 15 minutes, 29 patients reported waiting time of 15
minutes to 30 minutes, 28 patients reported waiting time of 30 minutes to one
hour and 11 patients reported waiting time of one hour to two hour. Further,
complete information i.e., age, gender, address, category, occupation, status,
mobile number etc., of patients was not being noted at the registration counter.
These facts indicated that the number of counters were not sufficient to handle
the volume of work.
GoR accepted (February 2019) the facts and stated that registration counters
would be increased as per availability of staff. Further, implementation of
integrated Health Management System (iHMS) was under process, which
would enable the patients to register themselves online and to access the
reports personally on computer/mobile.
Drug Distribution Counters not increased with increasing patient
load: 14 Drug Distribution Counters (DDCs) were established in the hospital
to distribute the medicines free of cost to the patients under Mukhyamantri

Chapter III Compliance Audit
123
Nishulk Dava Yojana (MNDY). The scheme was started in October 2011.
Scrutiny of records revealed that the total number of patients increased from
7.38 lakh to 11.85 lakh during 2012-17. Also, 42 (29.58 per cent) out of 142
patients surveyed, reported that they had to wait for more than 30 minutes to
get the medicines from DDCs. However, the Hospital did not plan to increase
the number of DDCs to cater for the increasing patient load. GoR stated
(February 2019) that proposals for additional DDCs would be taken up.
(ii) Patient safety
Legal requirements for laboratory equipment: Safety code issued by
Atomic Energy Regulatory Board (AERB) stipulates that to operate diagnostic
X-Ray/X-Ray equipment, the hospital would obtain the license for operation
and provide radiation protection devices such as protective lead glass viewing
window, barrier, apron, goggles and thyroid shields, ceiling suspended glass,
couch hanging flaps, gloves etc.
It was, however observed that 9 out of 11 X-Ray machines (81.82 per cent)
were operating without obtaining AERB registration. However, these nine
machines got AERB registration in October 2018 at the instance of audit.
Further, Radiology department neither had protective lead glass viewing
window nor protective door in the X-ray rooms. Thus, radiology laboratories
are functioning without adherence to AERB safety codes thereby exposing the
patients and technicians to harmful radiations. GoR assured (February 2019)
that lead goggle and lead thyroid shield would soon be procured by the
hospital.
Fire Safety Certificate of Hospital not obtained: As per instructions
of Ministry of Health and Family Welfare, Government of India issued in
November 2016, ‘No Objection Certificate/Fire Safety Certificate’ should be
obtained from the Local Authorities/Fire Department in public interest.
Scrutiny of records revealed that the MDM hospital did not initiate any action
to obtain Fire Safety Certificate from fire department though fire extinguishers
were installed in various wards/departments. Further, eight out of 44 test
checked wards did not have fire extinguishers including Emergency Medical
ward where an incident of fire occurred in 2016. It was also observed that no
staff in wards were provided training to operate the firefighting equipment
during 2013-18. GoR assured (February 2019) that fire extinguishers would be
procured and provided to all departments and fire safety certificate would also
be obtained.
3.7.4 General Administration and Financial management
The Principal and Controller (P&C) of Dr. SN Medical College, Jodhpur is
controller of the hospital and is responsible for planning and budgetary
controls of the hospital. MDM Hospital, Jodhpur is headed by Superintendent,
who is responsible for delivery of healthcare services in the hospital. In
addition, Rajasthan Medicare Relief Society (RMRS) has been formed in
every government hospital to strengthen and modernise the healthcare services
and provide them at nominal cost to the patients.

Audit Report (G&SS) for the year ended 31 March 2018
124
3.7.4.1 Financial management
To meet the general administrative expenses of the hospital and for
implementation of various schemes54, funds are allotted annually from the
state budget to the teaching hospitals through controlling Medical colleges.
During 2013-18, funds to the tune of ` 265.00 crore were allocated to MDM
Hospital through Dr. SN Medical College, Jodhpur under various heads55 and
` 265.81 crore were incurred on the items as detailed in Table 17.
Table17
(` in crore) Year Allotment Total
Expenditure
Salary and
General
Establishment
(per cent)
Contractual
Services56
(per cent)
Repair and
Maintenance
(per cent)
Drugs and
Medicine
(per cent)
Diagnosis/
Investigations
(per cent)
2013-14 34.15 35.31 22.63(64.09) 3.34(9.46) 0.70(1.98) 7.97(22.57) 0.67(1.90)
2014-15 39.49 39.95 25.41(63.60) 4.22(10.56) 0.74(1.85) 7.94(19.88) 1.64(4.11)
2015-16 54.56 55.16 34.46(62.47) 5.22(9.46) 1.00(1.81) 11.61(21.05) 2.87(5.21)
2016-17 62.62 62.11 38.41(61.84) 5.79(9.32) 1.07(1.72) 13.79(22.21) 3.05(4.91)
2017-18 74.18 73.28 43.70(59.63) 6.30(8.60) 1.21(1.65) 18.79(25.64) 3.28(4.48)
Total 265.00 265.81 164.61(61.93) 24.87 (9.36) 4.72(1.77) 60.10 (22.61) 11.51(4.33)
Source: information provided by MDM hospital, Jodhpur
It can be seen from the above table that:
A major portion of budget allocation was incurred on ‘Salary, General
Establishment and contractual services’ during 2013-18, which
constituted 71.29 per cent of total expenditure.
There was only a marginal increase in expenditure on drugs & medicines
whereas decrease on repair and maintenance of hospital assets during
2013-18, as compared to increase in patient load by 60.57 per cent.
Under Capital head, ` 47.56 crore was allotted for 17 works57 of which 13
works were completed at expenditure of ` 48.91 crore during 2013-18. Four
works58 were in progress as of March 2019.
Audit observed that only two proposals of major civil works were sent by the
hospital to the college during 2015-16 and those works that were announced in
annual budgets were undertaken. Though, seven works were undertaken for
improvement of hospital facilities but they were on the basis of directions of
the High Court (May 2013 to March 2015) regarding a public interest
54 Mukhyamantri Nishulk Janch Yojana (MNJY) and Mukhyamantri Nishulk Dava Yojana
(MNDY). 55 State general budget: ` 189.24 crore, MNJY: ` 27.86, MNDY (RMSCL): ` 40.00 crore
and MNDY (MDM): ` 7.90 crore. 56 Outsourcing of security guards and contract for housekeeping and cleanliness. 57 Three works sanctioned prior to 2013-14, two works announced in annual budget
2013-14, seven works undertaken in 2014-15 under public interest litigation, two works
(2015-16) and three works under budget announcement (2017-18). 58 Development work for renal transplant facilities, new building of cath lab, extension of
mother and child wing and construction of trauma centre.

Chapter III Compliance Audit
125
litigation. On being enquired, department stated (January 2019) that, due to
budget ceiling, proposals for new works were not sent during 2015-18.
3.7.4.2 Non approval of Master Plan
Planning in respect of expansion, upgradation of existing facilities and other
requirements of the hospital is essential to ensure continuous and improved
access to quality healthcare services to all the persons visiting the hospital.
It was, however observed that no short term or long term plan was approved
for expansion of MDM Hospital (under Dr. SN Medical College) during
2013-18, especially in view of the continuously increasing patient load.
Accepting the facts that extension of Medical College and all attached
teaching hospitals had been done on ad hoc basis and expansion of various
departments was done without any prior planning. The Government of
Rajasthan (GoR) in Budget 2015-16 announced that all future expansion of
Medical Colleges and teaching hospitals would be through a Master Plan.
MDM hospital prepared and sent (December 2015) the proposal to Dr. SN
Medical College. Though Dr. SN Medical College submitted (October 2016)
its Master plan for all attached hospitals for approval of GoR, however, the
approval was awaited as of February 2019.
3.7.4.3 Management of revenue generating services
Rajasthan Medicare Relief Society (RMRS) collects the user charges like
patients registration fee and diagnosis charges for high end diagnostic services
(MRI and CT Scan etc.) from the patients. RMRS also maintains the assets
(Shops, Canteen and Parking spaces) of the hospitals and leases them on rent.
Funds collected by RMRS are utilised where the budget allocated by the GoR
is insufficient or the budget is not available, as an additional amount for
procurement of x-ray films, CT films, kits and chemicals; repair, maintenance
and purchasing of various machines and equipment; construction, renovation
and repair of building etc., as per the RMRS Revised Rules, 2007.
Two important schemes i.e. Bhamashah Swasthya Bima Yojana and
Mukhyamantri Jeevan Raksha Kosh are also implemented through RMRS.
During 2013-17, total income and expenditure of RMRS was ` 14.11 crore
and ` 12.90 crore respectively, leaving an accumulated surplus of ` 1.21 crore.
The Management of RMRS did not draw a plan to utilize this surplus
accumulated during 2013-17.
Further in following cases, RMRS was not realizing the revenue from the
assets leased/rent out.
Two shops established for OPD registration in hospital premises were let
out for e-Mitra centres to private operators in 2011 without an
agreement. Though the operators were conducting commercial activities
but no rent was charged from them since 2011.

Audit Report (G&SS) for the year ended 31 March 2018
126
A private chemist shop was also running in the premises of hospital
without any agreement and no rent was recovered from the shopkeeper
during 2013-18.
A piece of land was allotted by GoR during 1985 to a trust for
construction and operation of a Dharamshala without any Memorandum
of Understanding. However, the trust let out three shops to the chemists
in the Dharamshala without any approval of the hospital management.
The trust was not depositing the rent realized from the chemists to the
hospital.
GoR stated (February 2019) that notices have been issued to all shopkeepers to
vacate the shops. The fact remains that RMRS was not able to collect potential
revenue from the various hospital assets which could have been utilised for
betterment of hospital services.
3.7.4.4 Incomplete implementation of ‘Arogya Online’
Hospital Management Information System (HMIS) also known as ‘Arogya
Online’ project was initiative by GoR for better delivery of healthcare through
automation. The Arogya Online software was to manage critical health related
data of Hospital operations including vital records of patients and providing
solution to support the Hospital administration through sharing of information.
The project was planned (September 2011) to be implemented in two phases
and a total of 28 modules (13 core clinical modules59, 11 Back office
modules60 and four miscellaneous modules61) were required to be developed
within 12 months i.e. by August 2012.
It was however noticed that two out of 13 core clinical modules, eight out of
11 back office modules and three out of four miscellaneous modules were not
developed even as of March 2018. Due to non-development of these modules,
hospital operations scheduled for computerisation in respect of these modules
were done manually.
GoR stated (February 2019) that Arogya Online project was planned in 2011
and as of now a higher version i.e. iHMS in place of Arogya online has been
taken up which is under process of implementation.
59 (i) Registration (ii) Emergency (iii) Out Patient Management (iv) Pharmacy Management
(v) Billing (vi) Investigation (vii) In patient Management (viii) Operation Theatre (ix)
Patient Medical Record (x) Diet Kitchen (xi) Blood Bank (xii) Enquiry and (xiii) User
Management. 60 (i) Store Management System (ii) Procurement & Purchase (iii) Central Sterile Services
(iv) Personnel Information System (v) Finance Management System (including RMRS
and Lifeline) (vi) Bio Medical Waste/Housekeeping (vii) Transport (viii) Linen/Laundry
(ix) Bio Medical Engineering Department (x) Administrative Module and (xi)
Appointment and Roster Management. 61 (i) Right to Information Module (ii) Health Portal (iii) File Tracking System (FTS) and
(iv) Library Management System.

Chapter III Compliance Audit
127
3.7.4.5 Patient Feedback Mechanism
For improvement in the healthcare services, it is necessary to maintain
mechanism to get feedback from patient regarding satisfaction and
suggestions.
It was observed that no mechanism to get feedback from patients regarding
satisfaction, grievances, redressal thereof etc., for further improvement in the
healthcare services provided by the hospital, was in existence. It was also
observed that no complaint register was maintained in the hospital during
2013-18. In the absence of any record regarding feedback from patient, Audit
could not ascertain the response of hospital administration to resolve the
patient specific issues and grievances. GoR stated (February 2019) that
instructions to get feedback from patients about hospital services have been
issued. Further, a complaint box and complaint register were being kept at
main enquiry of the hospital.
3.7.4.6 Physical verification of stores not conducted
As per rule 12(1) of General Financial and Accounts Rules (GF&AR) Part-II,
physical verification of all stores is required to be conducted at least once in a
year. Scrutiny of records however, revealed that physical verification of the
stores was not conducted during 2016-18. Further, reconciliation of items
(Machinery, Equipment, Tools and Plants) as per stock register with the items
actually installed in various departments/wards was also not done.
Accordingly, physical availability and disposal of unserviceable articles could
not be verified by Audit. GoR stated (February 2019) that instructions for
physical verification of stores had been issued in December 2018.
3.7.4.7 Prescription Audit
An Audit of one per cent of the total prescriptions issued by the doctors in the
hospital was to be conducted by a committee at the medical college level. It
was however observed that neither was a committee constituted by the
medical college nor was the prescription audit carried out in the hospital
during 2013-18. Only after being pointed out by Audit, GoR constituted
(December 2018) a three member committee for prescription audit.
3.7.5 Conclusion
Mathura Das Mathur (MDM) Hospital, Jodhpur is the largest hospital in the
western region of Rajasthan providing referral and tertiary healthcare
services. Though, the number of patients increased from 7.38 lakh to 11.85
lakhs during 2012-17, the augmentation of its facilities was not commensurate
to the increasing load of patients. Resource management was weak as
Operation Theaters (OTs), Intensive Care Units (ICUs) and wards suffered
from many infrastructural deficiencies and shortages of Medical Officers and
nursing staff. Beneficiaries were deprived of free drugs as all the essential
drugs were not available. Due to insufficient resources, various important
hospital services like number of OPD days in a week, consultation time per
patient and diagnostic services suffered. The hospital was not following the

Audit Report (G&SS) for the year ended 31 March 2018
128
legal/regulatory requirements regarding management of bio-medical waste,
patient safety and hospital safety.
Thus, mismanagement of resources of the hospital coupled with weaknesses in
planning and monitoring resulted in deficiencies in the services being
provided to the beneficiaries.
Recommendations:
GoR should
1. Take adequate initiatives to increase the number of units in the
departments wherever necessary, to address the increasing patient
load.
2. Ensure adequate availability, timely repair and maintenance of
prescribed medical equipment in ICUs, OTs, wards and laboratories
so that equipment downtime is minimized and services are rendered to
the patients without any hindrance.
3. Ensure effective inventory management to maintain adequate and
regular supply of essential drugs and reagents through stores and Drug
Distribution Counters so that no beneficiary is deprived of free
medicines and diagnostic tests.
4. Adopt defined service quality indicators and benchmarks so that
healthcare outcomes can be measured and assessed for future
improvements.
5. Increase the awareness amongst the beneficiaries of the Janani Suraksha
Yojana, Mukyamantri Shubhlaxmi Yojana and Mukyamantri Rajshree Yojana
so that they are able to avail of all benefits (by providing complete bank
details etc.) under these schemes.
Animal Husbandry, Gopalan and Co-operative Departments
3.8 Activities for Dairy Development in Rajasthan
3.8.1. Introduction
After agriculture, animal husbandry is the most important source of livelihood
in the state. Animal husbandry which includes cattle and other livestock,
contributes over 11 per cent to the gross state domestic product. Rajasthan has
the second highest livestock population and contributes 12.72 per cent of all
milk production making it the second largest milk producer state in India.
During 2017-18, 1.65 crore milch animals produced 2.24 crore tonnes of milk
in the state. During the year 2017-18, Rajasthan had 834 gram per capita per

Chapter III Compliance Audit
129
day availability of milk against 375 gram per capita per day availability of
milk in India.
Animal Husbandry Department (AHD) in co-ordination with Rajasthan
Livestock Development Board62 (RLDB), Gopalan Department and Rajasthan
Co-operative Dairy Federation63 (RCDF), implements the schemes for
livestock and dairy development. As regards the activities of the dairy sector,
the milk is procured, processed and marketed through a three tier Co-operative
structure i.e. RCDF at apex level, 21 milk unions64 at district level and 14,496
dairy co-operative societies at the village level.
The main scope of Audit was to examine the efficiency and effectiveness of
the schemes/activities implemented for dairy development in the state over the
period 2013-18. Seven65 districts were selected for examination using Simple
Random Sampling without Replacement method. Records of the offices of
Joint Director (AHD), veterinary hospitals, regional/district disease diagnosis
laboratories, cattle feed plants, semen banks, milk unions and control
mechanism of the Registrar of Co-operative Societies were examined during
the period April to August 2018.
3.8.2 Audit Findings
The results of Audit are discussed in the succeeding paragraphs:
3.8.2.1 Inadequate planning and financial support from GoR
(i) Inadequate planning: Government of Rajasthan (GoR) formulated
(March 2010) Livestock Development Policy, which underlined a vision to
procure and market 50 lakh kgs of milk per day by the year 2020. RCDF
separately approved (February 2014) Vision Document 2020 aimed at
achieving a collection of 40 lakh litre of milk per day and marketing of 35
lakh litre of liquid milk per day by the year 2020.
In this regard, it was observed that:
The targets set by RCDF was not in consonance with that of livestock
policy of 2010 as RCDF prepared its vision document independently
without consulting the AHD. Further, the targets set were also
inadequate in terms of the surplus milk production in the state and also
in terms of the national average procurement achieved by co-operatives
62 RLDB is the designated State Implementing Agency for implementing the centrally
sponsored schemes for dairy and livestock sectors like the National Programme for
Bovine Breeding, National Mission for Bovine Productivity and Risk Management &
Insurance under National Livestock Mission. 63 RCDF set up in 1977 as the implementing agency for dairy development programmes in
Rajasthan and registered as a society under the Rajasthan Co-operative Societies Act,
1965. 64 Milk union is a middle level co-operative society one each for one or more district. They
procure, process and market the milk supplied by the dairy co-operative societies (village
level) situated in their jurisdiction. 65 Ajmer, Bharatpur, Bikaner, Jaipur, Jhalawar, Jodhpur and Udaipur.
Audit Report (G&SS) for the year ended 31 March 2018
130
across the country (10.40 per cent of the production) during the year
2017-18.
Further, study/market survey was also not carried out either by AHD or
by RCDF for finalising the procurement targets and for planning and
implementation of projects/schemes for dairy development.
(ii) Inadequate financial support: With regard to financial resource
management required for achievement of livestock policy, scrutiny of Five
year plan, Annual plan and budget documents revealed that GoR did not make
significant financial contribution for growth of dairy sector as detailed below.
Scrutiny of the details of total grants received from GoR as well as from
GoI under various schemes66 and expenditure thereon during 2013-18
(Appendix 3.3) for livestock and dairy development revealed that against
a grant of ` 883.64 crore, ` 573.25 crore (64.87 per cent) was
contributed from GoI under various Centrally sponsored schemes
through various heads of budget67. The contribution from GoR was only
` 310.39 crore (35.13 per cent) which included subsidy for incentivising
milk producers under Mukhya Mantri Dugdh Sambal Yojana (` 157.05
crore), development of infrastructure under RKVY (` 83.56 crore),
production and allied activities (` 32.66 crore) and livestock health &
disease control (` 30.62 crore). An amount of ₹ 6.50 crore was allocated
under Devnarayan Yojana for establishing a dairy plant at Khetri,
Jhunjhunu. Thus, expenditure on creation of dairy infrastructure in the
state was not significant. During 12th plan period (2012-17) the financial
provision from GoR for dairy sector was a token provision of only
₹ 5000.
Further, as per budget speech of 2012-13 and 2013-14, ` 133 crore was
to be released as ‘grant’ to RCDF for creation of infrastructure68 under
dairy development initiative. However, it was observed that only ` 79
crore was released as an ‘interest free loan’ for five years to RCDF/Milk
Unions. As a result, only one Cattle Feed Plant in Pali, one Powder Plant
in Jaipur and 262 Bulk Milk Coolers (BMCs) could be established/taken
up. Other infrastructure projects (one Chilling Plant, one Milk Plant, one
Powder Plant and 238 BMCs) could not be established/taken up due to
shortage of funds. As a result, the development of infrastructure required
for enhanced procurement of milk was hampered.
66 National Dairy Plan-I (NDP-I), Rashtriya Krishi Vikas Yojana (RKVY), National
Programme for Bovine Breeding (NPBB), National Programme for Dairy Development
(NPDD), Clean Milk Production (CMP), National Livestock Mission (NLM), Livestock
Health & Disease Control (LH&DC), Dugdh Subsidy and Devnarayan Yojana. 67 2401-Crop Husbandry, 2403-Animal Husbandry, 2404-Dairy Development and 4225-
Capital Outlay on Welfare of Scheduled Castes, Scheduled Tribes, Other Backward
Classes and Minorities. 68 Cattle Feed Plant in Pali: ₹ 25.00 crore, Powder Plant in Jaipur: ₹ 40.00 crore, Chilling
Plant in Ghadsana: ₹ 4.00 crore, 500 Bulk Milk Coolers: ₹ 40.00 crore, Milk Plant in
Barmer: ₹ 4.00 crore and Powder Plant in Bhilwara: ₹ 20.00 crore.

Chapter III Compliance Audit
131
From the above, it can be seen that GoR did not provide adequate financial
support for creation of infrastructure and schemes of dairy development which
was necessary in the light of lack of adequate existing capacities with the milk
unions to handle the surplus production.
GoR’s reply (January 2019) was silent on the facts mentioned above.
3.8.2.2 Inadequate growth in milk procurement and marketing
(i) The details of milk production, processing capacity, procurement and
marketing in the state during 2013-18 are given below in Table 18:
Table 18
Year Number of
Registered
DCSs
Number of
Functional
DCSs
(per cent)
Production
of milk
(lakh kgs
per day)
Milk processing
capacity in lakh
kgs per day (lakh
litre69 per day )
Target for
procurement
(lakh kgs per
day)
Procurement of
milk against the
target in lakh
kgs per day
(per cent)
Marketing of
milk lakh kgs
per day (lakh
litre per day)
2013-14 12,875 8,298 (64.45) 399.26 19.53 (19.00) 22.70 22.45 (98.90) 18.09 (17.60)
2014-15 13,492 8,777 (65.05) 463.95 20.10 (19.55) 26.94 25.45 (94.47) 19.08 (18.56)
2015-16 13,878 8,778 (63.25) 506.85 20.92 (20.35) 29.23 26.01 (88.98) 19.35 (18.82)
2016-17 14,193 8,725 (61.47) 571.22 20.92 (20.35) 30.45 25.68 (84.33) 19.63 (19.10)
2017-18 14,496 8,804 (60.73) 614.44 20.92 (20.35) 35.17 28.45 (80.89) 20.66 (20.10)
It can be seen from the above table that:
Milk production in Rajasthan increased from 399.26 lakh kgs per day in
2013-14 to 614.44 lakh kgs per day in 2017-18 i.e. 53.89 per cent.
However, the milk procurement by RCDF and its milk unions grew only
by 26.73 per cent during 2013-18 i.e. from 22.45 lakh kgs per day in
2013-14 to 28.45 lakh kgs per day in 2017-18.
The achievement of milk procurement against the annual target set by
RCDF also declined from 99 to 81 per cent during 2013-18.
It was further noticed in audit that the percentage of milk procurement to milk
production in fact fell from 5.62 to 4.63 per cent during 2013-18. Interestingly,
procurement of milk to milk production during 2013-18 was even less than the
level of 6.44 per cent which RCDF achieved during 2004-05. This was mainly
due to low processing capacity of the milk unions as can be seen from the
Table 18 that the milk processing capacity of all the milk unions combined
remained almost stagnant between 19.53-20.92 lakh kgs per day during
2013-18.
GoR stated (January 2019) that the level of milk procurement has reached
28.45 lakh kgs per day in 2017-18 from 22.45 lakh kgs per day in 2013-14,
which shows that 27 per cent positive growth was recorded despite having
constraints of processing facilities. It also stated that the total milk handling
69 One litre of milk=1.028 kg milk

Audit Report (G&SS) for the year ended 31 March 2018
132
capacity would increase to 43.48 lakh kgs per day {42.30 lakh litre per day
(llpd70)} by 2019-20.
The reply is not convincing as growth of 27 per cent by milk unions during
2013-18 did not keep pace with growth in milk production (53.89 per cent)
during this period as well as with the expected levels in consonance with
national average (10.40 per cent of the production of milk). Even assuming the
achievement of procurement of 43.48 lakh kgs per day by the year 2020, the
procurement would still be substantially lower (only 7.08 per cent) even in
comparison to the production of milk in 2017-18.
(ii) The Dairy Co-operative Societies (DCSs), at the village level, form the
last mile collecting points for milk procurement. During 2013-18, RCDF had
set targets to establish 5,864 new DCSs and register 2.79 lakh new members.
However, it could establish only 1621 (27.64 per cent) DCSs and register 1.03
lakh (36.92 per cent) new members. Further, against target of 1000 women
DCSs as announced in budget 2017-18, only 248 new women DCSs were
established. Moreover, an average of 37.07 per cent of the total DCSs
registered in the state remained non-functional during 2013-18 mainly due to
their operational/financial non viability and conflict/dispute within the DCSs.
Thus, RCDF and milk unions failed to take effective measures to expand the
number of registered as well as functional DCSs and to increase the number of
milk producing members. This affected the procurement of milk from the
DCSs and the overall procurement in the state.
RCDF stated (November 2018) that targets for establishment of new DCSs
were fixed on higher side, hence the achievement are less. The target for 1000
new woman DCSs could not be achieved due to newly introduced system of
online registration and villagers are facing constraint in registering new
women DCS. However, the fact remains that GoR/RCDF could not expand the
number of registered as well as functional dairy co-operatives to the expected
levels in consonance with higher production of milk in the state.
3.8.2.3 Inadequate capacity expansion and marketing against milk
procurement
Para 3.6 of National Livestock Policy (April 2013) stated that major share of
marketable surplus of milk and other livestock products were not being
handled adequately by organized processing industry, resulting in reduced
price realization by farmers and post production losses and wastages. In this
regard, scrutiny of milk processing capacity, marketing and procurement
pricing followed in the state, revealed the following:
(i) Processing capacity: A detailed analysis of procurement, processing
and marketing of milk by the largest dairy i.e. Jaipur milk union, during
2013-18 is given in Table 19.
70 After the enhancement of the processing capacity of milk unions at Jaipur (10 llpd),
Ajmer (8 llpd), Pali (2.4 llpd), Udaipur (0.9 llpd) Chittorgarh (0.4 llpd) and Sikar (0.25
llpd).

Chapter III Compliance Audit
133
Table 19
S.
No.
Year Existing
Processing
Capacity of
Plant (litre
per day)
Average Milk
Collection/
Procurement
(kg per day)
Average Milk
Collection/
Procurement
(litre per day)
Capacity
Utilization
(per cent)
Average Milk
Marketing
(litre per day)
except Milk
Products
1. 2013-14 5,00,000 9,06,000 8,81,323 176.26 8,08,000
2. 2014-15 5,00,000 9,58,000 9,31,907 186.38 8,41,000
3. 2015-16 5,00,000 10,26,000 9,98,054 199.61 8,57,000
4. 2016-17 5,00,000 10,61,000 10,32,101 206.42 8,66,000
5. 2017-18 5,00,000 11,36,000 11,05,058 221.01 8,99,000
It is evident from above table that annual procurement of milk of Jaipur milk
union grew from 8.81 lakh litre per day (llpd) in 2013-14 to 11.05 llpd in
2017-18 (25.39 per cent). During the period, Jaipur Dairy marketed 8.08 llpd
to 8.99 llpd of milk. However, during this period the annual capacity to
process the milk procured remained static at 5 llpd. Neither RCDF nor the
milk union took measures to expand the processing capacity of milk. Due to
significantly low processing capacity of Jaipur Dairy, RCDF had to make
arrangements from time to time for outsourcing facilities for packing of milk,
conversion of milk to Skimmed Milk Powder (SMP) and ghee. Only in
December 2014, efforts were taken by Jaipur milk union to add an additional
processing capacity of 10 llpd, which was still under progress (September
2018) (elaborated in paragraph 3.8.2.5(i)).
Similarly, milk unions of Ajmer, Alwar, Ganganagar, Kota, Sikar and Udaipur
had capacity utilization ranging between 130 to 313 per cent during the years
2013-18. However, proposals to enhance the capacity of dairy plants for these
milk unions were not submitted to GoR/GoI by RCDF. This shows that they
were outsourcing the handling of milk without taking measures to expand their
capacity. GoR’s reply was silent on the facts mentioned above.
(ii) Marketing: Indian Council of Medical Research (ICMR)
recommended 280 grams for per capita per day consumption of milk. This
implied that there was a minimum average demand of 280 grams per day per
capita in urban areas which get their milk supply from rural areas and this
should have been tapped by the milk unions to market packaged milk.
A comparative analysis of performance of milk unions established in seven
test checked divisional headquarters (Appendix 3.4) shows that no milk unions
could market milk to the level of per capita basic consumption needs despite
having enough milk production in their jurisdiction. Only Jaipur milk union
could come nearer (226 to 252 grams per capita) in terms of procurement and
marketing milk in consonance with minimum per capita demand of milk. Milk
unions of Bharatpur, Jodhpur, Kota and Bikaner could market only less than
100 grams of milk per capita per day despite having adequate production in
their jurisdiction.
GoR stated (January 2019) that the dairy development could not be equal in all
the districts of the State. However, the fact remained that the milk unions

Audit Report (G&SS) for the year ended 31 March 2018
134
failed to tap into the existing demand despite having surplus milk production
in their jurisdictions.
(iii) Pricing: RCDF’s bye law 26.16 prescribed for preparation of pricing
policy by the Board. It also provided for the programming committee to
recommend prices of raw materials and/or finished products and review them
periodically. It was observed that there was no pricing policy prepared by
RCDF as discussed in paragraph 3.8.2.4(i). Scrutiny of procurement pricing
followed by each milk union for the last five years in the month of March is
given in Table 20. Table 20
(Amount in ` per kg)
S.No. Milk Union March
2014
March
2015
March
2016
March
2017
March
2018
1 Ajmer 39.00 32.45 33.09 39.60 35.01
2 Alwar 39.40 34.56 33.75 40.25 33.19
3 Banswara 32.94 30.17 28.41 36.93 35.07
4 Barmer 28.03 25.59 25.01 27.89 24.03
5 Bharatpur 38.58 30.12 31.19 38.72 31.50
6 Bhilwara 28.68 27.58 26.82 30.39 25.35
7 Bikaner 24.99 20.88 18.86 25.56 20.01
8 Chittorgarh 30.32 30.74 29.73 34.47 32.21
9 Churu 28.94 25.13 23.63 29.15 25.00
10 Ganganagar 30.51 24.58 24.12 30.54 23.89
11 Jalore 31.83 30.86 28.25 35.85 32.47
12 Jaipur 34.98 31.35 30.99 36.11 33.75
13 Jhalawar 31.67 28.57 27.56 31.86 31.56
14 Jodhpur 26.61 26.28 25.84 28.08 27.18
15 Kota 31.57 31.48 28.90 34.47 32.22
16 Nagaur 31.11 28.82 27.74 35.32 27.15
17 Pali 31.38 33.50 30.29 35.74 33.36
18 Sikar 34.86 29.29 26.60 31.58 26.88
19 Sawaimadhopur 34.32 32.00 33.81 37.08 34.87
20 Tonk 36.63 34.38 34.68 41.97 37.15
21 Udaipur 30.65 30.99 29.15 34.87 32.20
It can be seen from table above that there was significant difference in
procurement price of milk in milk unions during the same period. For instance
in March 2018, the price of milk per kg varied from ` 20.01 in Bikaner to
` 37.15 in Tonk.
Further, the procurement prices of milk in Ajmer, Alwar, Barmer, Bharatpur,
Bhilwara, Bikaner, Churu, Ganganagar, Jaipur, Jhalawar, Nagaur and Sikar
were on lower side in March 2018 in comparison to prices of March 2014
inspite of the fact that wholesale price index for milk increased by 20.43 per
cent from 116 points in 2013-14 to 139.7 points in 2017-18. Thus, it appeared
that there was no consistency and pattern visible in the pricing followed by the
unions due to which neither did the dairy farmers get remunerative prices for
their milk nor could the milk unions increase procurement to the expected
levels.
GoR accepted (January 2019) the fact that there was no fixed pricing policy
being followed by RCDF and its member unions. It also stated that the milk
procurement price was being fixed by the milk unions at their own level as per
Chapter III Compliance Audit
135
budget provisions, availability of milk, financial status of the milk union and
marketing trend in the milk shed area and hence, the milk procurement prices
were different for different milk shed areas. RCDF was just examining their
proposals and giving consent for implementation.
However, the fact remained that the cost of production of milk was not taken
into consideration which should have been considered to incentivize economic
development of milk producers and the procurement prices of many milk
unions remained lower than March 2014 prices.
3.8.2.4 Inadequate institutional and co-ordination mechanism
(i) Inadequate institutional mechanism
Dairy related activities in Rajasthan are mainly implemented by Rajasthan Co-
operative Dairy Federation and its milk unions in co-ordination with the
Animal Husbandry Department. Department of Co-operatives enforces control
over RCDF and its unions through the Co-operatives Act. RCDF is run by a
Board and executive functions are carried out by a Managing Director (MD)
appointed by GoR. In this regard, it was observed in Audit that:
(a) Bye-law 26 of RCDF stipulated that the Board would decide policies
for the functioning of RCDF including pricing policy for the dairy and allied
products supplied by the members. Bye-law 27 stipulated that the Board
would frame subsidiary rules for conduct of the business. Further, Bye-law
31.1 of RCDF also provided that a Programming Committee, consisting of
MD of RCDF and MDs of 21 affiliated milk unions, would recommend for
pricing of raw-materials & finished products, set terms & conditions for
procurement, processing & marketing and also review them periodically.
It was observed that there was no subsidiary rules framed for day to day
functions and no policy for fixing of price of raw materials and finished
products. It was also observed that no recommendation was made by the
Programming Committee during 2013-18 for prices of procurement of milk
and processed products (except for occasionally deciding price of ghee). In the
absence of such policies and subsidiary rules, it was left to the MD of RCDF
to take critical decisions on procurement of milk & other raw materials;
machineries & equipment; marketing milk & milk products and cattle feeds.
Such important decisions were being taken on the basis of recommendations
made by a General Manager Level Committee of RCDF in violation of bye-
laws 31.1, which stipulated for decision making through a Programming
Committee consisting of MD of RCDF and MDs of the 21 affiliated milk
unions.
(b) Section 29 of the Rajasthan Co-operative Societies Act, 2001 provided
that GoR would nominate three members to the management committee of the
co-operative society. Further, two additional members having expertise in the
fields of production, marketing, management etc., would also be nominated to
the apex society i.e. RCDF. Bye-law 20.1 of RCDF also stipulated that
maximum of two members from banking, management, finance or related
fields would be co-opted by RCDF.

Audit Report (G&SS) for the year ended 31 March 2018
136
It was, however observed that neither GoR nor RCDF appointed two
additional members having expertise in the related fields to the Board of
RCDF. The fact that during 2013-18, RCDF did not pass any resolution to
enhance dairy activities in the professional way {discussed in paragraphs
3.8.2.1, 3.8.2.3 and 3.8.2.5 (iii, vi-ix)} needs to viewed in the light of the facts
that RCDF lacked the necessary professional support in its Board of Directors.
GoR accepted the facts and stated (January 2019) that a proposal to this effect
would be put up before the forthcoming meeting of Board of RCDF for
decision and it also admitted that the polices and subsidiary Rules were not
formulated which would be taken up in near future.
(ii) Inadequate co-ordination between AHD and RCDF
During course of audit all the audit requisitions and observations issued to
GoR pertaining to long term policy/programme, perspective plan, five year
plan, livestock survey, planning, schemes etc., for dairy development in
Rajasthan were directed to RCDF. On the other hand, RCDF replied that they
pertained to the domain of GoR.
It was also observed that except for the Secretary, AHD and the Deputy
Secretary, Gopalan, there was no personnel posted in AHD to co-ordinate
with RCDF on issues relating to dairy activities and therefore the Secretary
was depending entirely on MD, RCDF to oversee dairy activities.
This shows that there was inadequate co-ordination between AHD and RCDF
with regard to duties and responsibilities pertaining to dairy sector. It also
raises question mark over their responsibility/ownership towards dairy sector
development.
3.8.2.5 Implementation of schemes and activities of dairy/livestock
development
(i) Deprival of central assistance of ₹ 56.25 crore under Rashtriya
Krishi Vikas Yojana (RKVY)
A plant study of Jaipur Dairy was carried out (August 2014) by Jaipur milk
union through National Dairy Development Board (NDDB), wherein it was
proposed to enhance the plant capacity from existing 5 llpd to 15 llpd by
installation of a new milk processing plant of 10 llpd capacity at an estimated
project cost of ` 174.93 crore. The study envisaged payback period of five and
half years even without any grant/support from GoI/GoR.
Accordingly, a proposal was submitted (January 2015) to GoR by Chairman,
Jaipur milk union at their own level for sanctioning grant under RKVY as the
RCDF did not take any initiative71 for it. Subsequently, GoR forwarded the
proposal to RCDF for examination. RCDF examined and resubmitted (May
2015) the proposal to GoR for an amount of ` 174.93 crore. The funding
71 In consonance with basic objective to carry out activities for promoting the production,
procurement, processing and marketing of milk and milk products for economic
development of the animal husbandry/farming community.

Chapter III Compliance Audit
137
pattern under RKVY was in the ratio of 60:40 between centre and state during
2015-16.
It was observed that the State Level Sanctioning Committee (SLSC)
downgraded (June 2015) the project proposal into half to a cost of ` 87.46
crore without recording any justification. Due to this downgrade, Jaipur milk
union was deprived of the benefit of central assistance under RKVY of
` 52.48 crore72.
Similarly, two other projects of ` 9.50 crore and ` 3.06 crore for strengthening
of Tonk Dairy Plant and Rehabilitation of Jhalawar Milk Union respectively
were also halved and approved (2015-16) by SLSC for ₹ 6.28 crore (50 per
cent of proposed amount) and thereby it deprived the benefit of central
assistance of ` 3.77 crore to the concerned milk unions.
Thus, central assistance of ` 56.25 crore could not be availed for improvement
of dairy sector under RKVY. No specific reply has been furnished by GoR.
(ii) Non establishment of Gokul Grams and In-Vitro Fertilization labs
GoI launched (December 2014) Rashtriya Gokul Mission (RGM) for
development and conservation of indigenous breeds with an outlay of
` 2,025 crore for three years on basis of 100 per cent grants-in-aid to the
states. The mission envisaged establishment of integrated indigenous cattle
centres ‘Gokul Grams’. It was observed that proposals for establishment of
Gokul Grams were not prepared and submitted to GoI by GoR, which resulted
in deprival of central assistance necessary for development of indigenous
breed in the state.
Similarly, under a sub mission of RGM ‘National Mission on Bovine
Productivity’, GoI envisaged establishment of 50 labs for In Vitro Fertilization
(IVF)/Multiple Ovulation Embryo Technology (MOET) including two in
Rajasthan. Each lab was to be established at the cost of ` 5 crore. However, no
proposal for establishment of IVF/MOET labs was prepared by GoR and
submitted to GoI and it resulted in deprival of central assistance of ` 10 crore
from GoI which could have been utilized to develop super elite animals from
super embryos. GoR accepted the facts (January 2019).
(iii) Non completion of dairy plant at Khetri
RCDF submitted a proposal to Social Justice and Empowerment Department
(SJED) for establishment of a dairy plant with a capacity of 25,000 litres milk
per day at Khetri (Jhunjhunu district) at a cost of ` 6.50 crore73 within a period
of 30 months under Devnarayan Yojana74 of GoR. Accordingly, SJED
approved (June 2011) the proposal and AHD issued (August 2012 and March
2013) Administrative & Financial sanction of ` 6.50 crore and the amount was
72 60 per cent of ` 87.46 crore. 73 Civil work: ` 2.00 crore, plant & machinery: ` 3.30 crore and working capital: ` 1.20
crore. 74 Devnarayan Yojana was implemented through SJED for welfare of Special Backward
Classes.

Audit Report (G&SS) for the year ended 31 March 2018
138
released to RCDF. Subsequently, RCDF executed (November 2012) a MoU
for ` 2 crore with Rajasthan Avas Vikas and Infrastructure Limited (RAVIL)
for civil work with scheduled completion by February 2014.
It was observed that RAVIL completed the civil work with a delay of three
years in July 2017 at a cost of ` 2.21 crore. Consequent upon increase in cost
due to delay in completion of civil works, RCDF demanded (September 2017)
additional funds of ` 3.40 crore from GoR for completion of dairy plant.
However, additional amount was not sanctioned by GoR as of August 2018.
RCDF also did not make efforts to supplement the shortfall from its own
funds. As a result, the milk plant could not be made operational even after
lapse of four and half years from the proposed completion period of the plant.
Further, remaining amount of ` 4.29 crore was lying unutilized with RCDF for
more than five years.
GoR while accepting the facts stated (January 2019) that RAVIL could not
complete the work timely and due to which the cost involved to complete the
project was escalated. Accordingly, RCDF decided to withdraw the work from
RAVIL and recovered 10.48 lakh by imposing penalty as per MoU. It also
stated that the work order for remaining civil work was awarded in September
2018, which is still under progress (March 2019) and supply order for
machinery has also been issued.
(iv) Implementation of Brucellosis Control Programme
Brucellosis is second most important zoonotic disease after Rabies which
poses bigger threat to human life. Brucellosis in humans occurs when a person
comes into contact with an animal or animal product is infected with
the Brucella bacteria. It had a prevalence of 3 to 5 per cent in Rajasthan.
Brucellosis is also a serious disease of livestock and it causes decreased milk
production, weight loss, infertility and physical deformities.
To contribute to the National Vision of “ Brucella Free India”, GoR submitted
(July 2011) a project proposal to GoI under National Control Program on
Brucellosis for Surveillance & Vaccination of ` 9.99 crore for five years. GoI
released (September 2012) ` 0.90 crore for the year 2012-13 as first
installment. The Brucellosis Control programme was to be run across the State
in all 33 districts. In this regard, it was observed that:
AHD utilized only ` 0.86 crore out of the sanctioned amount and that too,
over four years during 2013-17 after getting revalidation of the sanction
each year. As a result, it could not get subsequent installments from GoI.
AHD carried out only 3.18 lakh (2.65 per cent) vaccinations of female
calves against a bovine population which averaged 1.20 crore (between
1.06 to 1.34 crore) during 2013-18.
While incurring expenditure under this programme, AHD did not take
provision for procuring Lateral Flow Assay (LFA) kits to be used for
detection of the disease among dairy farmers at their site. Only 90 such
kits were procured in 2017-18, out of which 40 kits were used for testing

Chapter III Compliance Audit
139
and 18 (45 per cent) samples were found to be positive indicating the
importance of the test. In addition, the control strategy of obtaining a
small sample from milk tanks of district dairies two to four times a year
for evidence of brucellosis was also ignored in each district.
On enquiring by audit of the actual methodology/operational strategy adopted,
AHD submitted (July 2018) figures of only 2017-18 wherein it was stated that
3458 samples of milk ring was tested, out of which 214 samples found
positive. 9929 samples of rose bengal plate agglutination was tested, out of
which 386 samples found positive.
Thus, there was ineffective and deficient implementation of Brucellosis
Control Program in Rajasthan.
GoR stated (January 2019) that out of 10 components proposed in project, four
components amounting to ` 3.70 crore were approved by GoI and only ` 0.90
crore was released. Hence, the expected physical and financial targets could
not be achieved. The reply is not acceptable in view of GoR’s inability to
spend the released amount within a year and hence the subsequent installment
was not released by GoI. Furthermore, despite being requested to specify the
actual methodology/operational strategy adopted by AHD, the reply was silent
on the issue. This also shows initial diagnostic strategy was weak.
(v) Irregularities in Frozen Semen Bank, Bassi
RCDF submitted (November 2013) a proposal to National Dairy Development
Board (NDDB) for strengthening the capacity of semen production at FSB
Bassi under National Dairy Plan-I. The project envisaged (i) making animals
disease free within an area of 10 kms radius of frozen semen production area
and (ii) increase in production of semen. NDDB approved (February 2014) the
project for increase in semen production at FSB Bassi and released ` 11.12
crore. The project was completed in March 2017.
It was observed that RCDF proposed to increase the number of bulls
from existing 69 to 131 by 2016-17 to increase the semen production to
35 lakh straw. Though the number of bulls increased from 69 to 106 by
2017-18, however, FSB Bassi could not procure the targeted number of
131 bulls and the target of increase in semen production was not
achieved even after incurring an expenditure of ` 10.53 crore. In fact,
the semen production decreased from pre-project level of 27.27 lakh
(2013-14) to 22.09 lakh semen straw in 2017-18.
The project envisaged vaccination of animals around 10 kms radius of
frozen semen production area and 9.74 lakh vaccinations for five
diseases by AHD for control of diseases like Foot & Mouth disease,
Hemorrhagic septicemia, Black quarter, Brucellosis, Theileriosis and
Anthrax. RCDF was to co-ordinate with AHD for vaccination. However,
only 4.41 lakh (45.28 per cent) vaccinations were carried out during
2014-18. Further, no vaccinations for Brucellosis and Theileriosis
diseases were carried out.

Audit Report (G&SS) for the year ended 31 March 2018
140
Thus, RCDF could not achieve the goals of the project of increasing the
production of semen. Further, prescribed quality standards for hygiene for
frozen semen production could not be achieved thereby compromised the
quality of frozen semen.
GoR replied (January 2019) that the bulls allotted by NDDB were not mature
and it takes 1-3 years’ time for them to yield semen and the number of bulls
could not be increased due to change in the policy for including the indigenous
breeds which slowed down the induction. Currently, the project was almost
completed and the semen production was expected to increase. Further, the
vaccination around 10 kms radius of FSB is being carried out on regular basis
in co-ordination with AHD, GoR.
The reply is not acceptable as the policy changes had already taken place in
2014-15accordingly indigenous bulls could have been inducted during
2015-17 for strengthening the capacity of semen production. Further, the
vaccinations were essential to maintain the quality of the semen production.
(vi) Non synchronized execution of work in Milk Powder Plant, Jaipur
GoR released (October 2013) an amount of ` 35 crore to RCDF as interest
free loan for establishment of Milk Powder Plant of 30 MT capacity in Jaipur.
Audit scrutiny of records of RCDF revealed that the tenders for procurement
and installation of plant and machinery were invited in May 2013. However,
despite the funds being available, the Notice Inviting Tender for civil work
was issued only in April 2015 with a delay of one and half years. The civil
work was awarded (August 2015) at ₹ 16.34 crore with scheduled completion
by February 2018. Though the plants and machinery were supplied by May
2017, the civil works were not yet completed as of July 2018. As a result,
plants and machinery could not be installed and it was lying idle. With regard
to procurement of plant & machinery, MD approved the rate of M/s GEA at
₹ 21.71 crore on single tender basis, which needed approval of the Board of
RCDF in accordance with the Rule 68 (2) of Rajasthan Transparency in Public
Procurement (RTPP) Rules 2013. For the civil works, RCDF also approved
additional works of ₹ 1.15 cores (executed by 8 February 2018) in respect of
22 items, each item ranging from 51 to 515 per cent in excess of that in the
schedule ‘G’. This was in violation of Rule 73 of the RTPP Rules 2013 which
prevents any authority from approving excess quantity of items beyond 50 per
cent. This also shows that the estimates for the above work were not prepared
on realistic manner.
Thus, imprudent decision of RCDF in awarding the civil work after the order
for plant and machinery, led to hurried procurement of plant & machinery and
delay in completion of civil work. As a result, the powder plant was not yet
commissioned even after lapse of five years. Further deterioration of plant &
machinery lying idle could not be ruled out.
GoR stated (January 2019) that the civil structure for plant building could not
be finalized before finalizing the tender for powder plant machineries, as there
are various technologies for setting up powder plant. The additional civil work
of ₹ 1.15 crore was executed after due approval from the concerned authority.

Chapter III Compliance Audit
141
The reply is not convincing as after finalising the suitable prevailing
technology and layout for plant and machinery, the civil construction work
should have been carried out accordingly.
(vii) Undue benefit to distributors of ghee
Programming Committee of RCDF recommended (July 2015) for disposal of
2,689 MT (produced in January 2015: 1,100 MT and February 2015: 1,589
MT) of old stock of ghee by incentivising the distributors. Distributors were
allowed 18 tins (of 15 kgs) free for every purchase of minimum 600 tins. The
distributors lifted 1,46,667 tins ghee (2,200 MT) under this incentive scheme
from 1 August 2015 to 19 August 2015 at the rate of ` 323 per kg.
Consequently, they were provided 4,400 tins (66 MT) free of cost under the
scheme. The scheme was closed on 20 August 2015.
Audit scrutiny revealed that incentive was given to the distributors without
ultimate revision of Maximum Retail Price (MRP) of ghee. This amounted to
undue benefit of ` 2.13 crore to distributors without passing on the benefit to
consumers by reducing the MRP of ghee. Interestingly, after 14 days of the
closure of the scheme, RCDF increased the MRP of ghee from 323 per kg
(during the scheme period) to ₹ 333 per kg on 3 September 2015. Thereafter,
RCDF again increased the MRP of ghee to ₹ 348 per kg on 5 October 2015
(45 days after closure of the scheme). Thus, RCDF revised MRP of ghee by
₹ 10 per kg and ₹ 15 per kg respectively within a short span of time (14 days
and 45 days) which provided an opportunity to the distributors to sell ghee at
the increased rates, thereby giving an advantage of upto ₹ 3.97 crore75 to
distributors.
Thus, RCDF passed on a undue benefit of up to ` 6.10 crore to distributors by
incentivising distributors and increasing MRP in a short span of time. This
decision taken by RCDF needs to be viewed in the light of the fact that there
were no policies available for either procurement or marketing of milk and
milk products.
GoR stated (January 2019) that the expiry period of ghee was nine months and
stock of January and February 2015 was expiring in September and October
2015 which otherwise needed reprocessing for further use. Therefore, ` 10 per
kg benefit was given as quantitative sale promotion without revising MRP in
order to avoid higher reprocessing cost.
The reply is not convincing as there was sufficient demand (10,896 MT)
during January to July 2015 just before introduction of the incentive offer. As
such the balance stock (2,689 MT) of January and February 2015 could have
been disposed of by July 2015 if the first in first out (FIFO) method was
adopted for sale of ghee since it was a perishable commodity.
75 2,266 MT * (333 per kg+348 per kg)/2 (-) 2266 MT * 323 per kg = ` 3,96,55,000 (say
` 3.97 crore).

Audit Report (G&SS) for the year ended 31 March 2018
142
(viii) Unfruitful expenditure on capacity expansion of Cattle Feed Plant
During 2013-14, the production and sale of Cattle Feed Plant (CFP) Ajmer
was 71,096 MT and 72,917 MT respectively with a daily capacity of 150 MT.
Meanwhile, another cattle feed plant of 150 MT daily capacity was established
at Lambiyakalan in November 2014, for the catchment area of Bhilwara
district which earlier used to receive supplies from CFP, Ajmer.
Despite knowing this fact, CFP, Ajmer went for additional capacity expansion
in March 2015, of another 150 MT per day. Notably, after enhancement of the
capacity of CFP, Ajmer, the production during 2016-17 and 2017-18 declined
to 56,304 MT and 66,026 MT respectively with corresponding sale of 57,170
MT and 65,793 MT. Thus, the capacity of Cattle Feed Plant was enhanced
without need, resulting in an unfruitful expenditure of ₹ 6.28 crore.
GoR stated (January 2019) that in 2013-14, all the four CFPs of RCDF were
running beyond their capacities and RCDF was facing problem in catering to
the demand of milk unions and dealers network. Therefore, new CFP with 150
MT daily production capacity was established at Lambiyakalan (Bhilwara) in
November 2014. Further, it was decided to expand the capacity of four
existing old CFPs from 150 MT daily to 300 MT daily. The transportation cost
for catering the demand of Bhilwara milk union has been reduced by
establishment of new CFP at Lambiyakalan. The expansion of capacity at
CFP, Ajmer was an asset for future use.
The reply is not convincing in view of fact that the demand of CFP, Ajmer
was not re-assessed after establishing another plant in its catchment area and it
could have been expanded at a later stage after demand analysis instead of
enhancing capacities of all the CFPs.
(ix) Undue benefit to the advertising agency
M/s Proactive In & Out Advertising Pvt. Ltd., approached (July 2017) RCDF
for display of advertisement of Saras brand on the side panels of 1,000 ‘Blue
Line’ buses of Rajasthan State Road Transport Corporation (RSRTC). The
firm claimed that it was the sole licensee by virtue of an agreement with
RSRTC. Advertising Agency also submitted a letter issued by Directorate of
Advertising & Visual Publicity (DAVP), GoI, in which the Director General,
DAVP had approved the rates in favor of them. RCDF awarded the work to
the firm in September 2017 for 800 buses for two months. Consequently, the
firm was paid ` 58.04 lakh (including ` 44.80 lakh rental, Vinyl cost ` 4.38
lakh and ` GST 8.86 lakh) during November-December 2017.
In this regard, it was observed in Audit that the firm was not registered with
DAVP for category of multimedia advertising, based on which the work was
awarded. The firm had an agreement with RSRTC for display sizes of 115.6
sqft (14′x1.6′ size each side of bus and other spaces) on the buses with a
license fee of ₹ 485 per bus per month. But it sought ₹ 2,800 per bus per
month for display size of 56 sqft (14′x2′ size each side of bus) on side panels
of each bus.

Chapter III Compliance Audit
143
Thus, the offer submitted by the firm was not reliable on the following
grounds:
The firm was not registered with DAVP for category of multimedia/
outdoor advertising.
The size of display submitted by the firm was not in consonance to the
size mentioned in the agreement with RSRTC as well as the space of
specific size available on buses.
The price submitted by the firm was higher by 1,191 per cent.
However, RCDF awarded the work to the firm without verifying the facts with
RSRTC. This led to undue benefit of ` 58.04 lakh to the advertising agency.
GoR stated (January 2019) that the information about the firm was available
on the website of DAVP and all the details were verified before issuing the
work order to the firm. The display of Saras products was done on 56 sqft area
as per DAVP approved terms & conditions.
The reply is not convincing as neither was the firm registered with DAVP for
multimedia/outdoor advertising nor was the size of 14′x2′ on each side panel
of bus possible on RSRTC buses.
(x) Non utilization of co-operative funds
Section 48 of the Rajasthan Co-operative Societies Act, 2001 provided that
co-operative societies would contribute to the Co-operative Education and
Training Fund. Section 111 also mandates the Registrar for preparation of a
working plan for education and training and implement it through
co-operatives. Rule 55 of the Rajasthan Co-operative Societies Rules, 2003
also provided that the Co-operative Education & Training Fund Regulations
would be made for administration of the fund and allocation & distribution of
fund for co-operative education and training in order to carry out the working
plan and distribution amongst various district co-operative unions.
RCDF contributed one per cent of its net profit each year to Co-operative
Education & Training Fund. It also contributed three per cent to State Co-
operative Renewal Fund and two per cent to Co-operative Revitalization Fund
being operated by the Registrar, Co-operative Societies. Accordingly, RCDF
alone contributed ` 5.64 crore76 during 2013-18 to these three funds.
However, it was observed that no training and educational activities were
undertaken for the benefit of dairy farmers from this fund inspite of the fact
that milk unions were conducting training programmes. There was also no
evidence of having undertaken activities from the other two funds for
benefiting dairy co-operative members. As such, dairy co-operative
76 ` 94.02 lakh in Co-operative Education & Training Fund, ` 2.82 crore in State Co-
operative Renewal Fund and ` 1.88 crore in Co-operative Revitalization Fund.

Audit Report (G&SS) for the year ended 31 March 2018
144
members/employees were denied benefits of training and other activities for
which these funds were created.
3.8.2.6 Inadequate internal control mechanisms
Internal controls are the activities and safeguards that are put in place by the
management of an organization to ensure that its activities are carried out in
prescribed manner.
It was observed in Audit that:
No internal control manual was formulated by RCDF to safeguard its
resources.
RCDF did not carry out any inspections/vigilance activities in
compliance of procedures/norms devised by it.
RCDF did not prepare Annual Receipts and Disbursements Account.
This raised the risks of misappropriations of funds. Moreover, during
2013-18, statutory auditors also reported that RCDF was not following
the accounting principles.
RCDF did not formulate the Accounting Manual to establish effective
accounting system.
Cash book/bank book of all the bank accounts (except current account)
were not maintained as per fundamental accounting principles and non-
cash transactions were also being entered in the cash book.
Cashier of cattle feed plant, Jodhpur misappropriated ` 94.55 lakh by
manipulating the figure in carbon copy of receipt of sale of cattle feed.
This could not be noticed for three years due to non-reconciliation of the
amount of gate pass cum challans and cash receipts. The
misappropriation came to notice only in March 2018 after which the
cashier deposited ` 95.00 lakh but no criminal action was initiated
against him.
No human resources policies and practices were adopted by RCDF and
the manpower was deployed at the same position for long periods
thereby increasing the risk of error, manipulation and misappropriation.
Though Section 55 of Rajasthan Co-operative Societies Act provided for
the Registrar to hold inquiries into the constitution, working and
financial condition of RCDF, it was observed that no such
inquiry/investigation was conducted.
Thus, internal control and inspection mechanisms were inadequate in RCDF
due to which misappropriation of co-operative funds of milk producer
members cannot be ruled out.

Chapter III Compliance Audit
145
3.8.3 Conclusion
Rajasthan having the second largest livestock population and milk production
in the country has high potential for development of dairy sector. Although
GoR set out a vision of achieving a target of 50 lakh kg/day of milk
procurement by the year 2020, it did not support this with necessary planning
and financial assistance. No market survey was carried out either by GoR or
RCDF for increasing procurement, processing and marketing of milk. RCDF
and the milk unions did not expand their capacities. RCDF’s execution and
monitoring of dairy sector schemes and its internal control mechanisms were
also inadequate.
Thus, lack of planning, inadequate financial and institutional support by GoR
combined with RCDF’s failure to expand capacities and business activities
has led to the dairy sector in Rajasthan not being exploited to its full
potential.
Recommendations
GoR should
1. Conduct a detailed survey/study of the dairy sector to assess the
potential of the sector, identify demand supply gaps, resource gaps, plan
for capacity expansion and devise necessary policies for procurement
and marketing for the future.
2. Take initiative for expansion of dairy sector by committing financial
resources required to achieve targets set in its policy.
3. Establish a functional wing within the AHD for dairy development, with
clearly delineated responsibilities to co-ordinate and monitoring of
dairy activities in the state.
4. Conduct regular inspections so that the schemes for dairy sector are
implemented more effectively.
Medical and Health Department
3.9 Non utilization of District Training Centre with hostel constructed
for Women’s Health Workers
District Training Centre with hostel facility for Women’s Health
Workers, Wazirpura, Tonk was not utilized for 15 years since its
completion and this resulted in unfruitful expenditure of ` 1.51 crore on
its construction.
The Reproductive and Child Health (RCH) Programme was launched in
October 1997 with objective to reduce infant, child and maternal mortality

Audit Report (G&SS) for the year ended 31 March 2018
146
rates. Under the programme, a five year sub-project of ` 10 crore for the
period 1998-2003 was approved for Tonk district. This included construction
of a District Training Centre (DTC) with hostel facility for Auxiliary Nurse
Midwives (ANMs) at Wazirpura, Tonk at a cost of ` 0.65 crore.
The construction work was assigned (June 2000) to Rajasthan Housing Board
(RHB) with stipulated date of completion in December 2001. RHB
completed77 the work of DTC comprising training halls and hostel rooms for
60 girls at a cost of ` 1.23 crore78 and handed over to the Department in June
2003.
Test check (December 2017) of records of District Reproductive and Child
Health Officer (DRCHO), Tonk revealed that the DTC building was not being
utilized for ANM training and hostel purposes even after lapse of 15 years of
its completion. The ANM training center and hostel is still being operated in
the old building of Saadat Hospital, Tonk, where total 174 trainees79 were
imparted training during the period 2013-18 in the old hospital premises which
is insufficient as the classes are running only in two rooms.
Further, two Chowkidars engaged for watch and ward of DTC building were
paid ` 0.28 crore during 2012-18. A joint inspection conducted by audit (April
2018) with the DRCHO, Tonk revealed that the DTC was situated eight kms
away from the city and the area was uninhabited even as of June 2018. The
ANM training centre and hostel was being operated in the old building of
Saadat Hospital, Tonk instead of DTC as it was difficult for girls to reside in
the hostel and approach daily to Saadat Hospital, Tonk for training.
GoR stated (August 2018) that DTC was not being utilized due to non-
availability of transport facility and inadequate security for women trainees as
it is situated at remote location. CMHO, Tonk was directed to shift the training
centre and hostel at DTC building. In pursuance of the direction, CMHO,
Tonk intimated (August 2018) that the training centre and hostel would be
transferred to DTC building after rectification of deficiencies and provision of
electricity and water connections.
The reply is not found correct because the building was uninhabitable for girls
as the girls were reluctant to shift there in absence of proper facilities and
DRCHO submitted (August 2018) requirements for family quarter for warden,
appointment of cook and arrangement of emergency power back up. DRCHO
further intimated (November 2018) that the training centre and hostel would
only be transferred after budget allotment for additional guards and transport
77 Construction work of DTC was completed in June 2002 and other development works
such as approach road, electric connection, drinking water, plinth protection, boundary
wall, drainage, etc., were completed in June 2003. 78 Building work: ` 0.71 crore; Development works: ` 0.32 crore and furniture, equipment
and goods: ` 0.20 crore. 79 2013-15: 87, 2016-18: 42 and 2017-19: 45.

Chapter III Compliance Audit
147
facility. Further, the training centre and hostel was not shifted to DTC building
as of November 2018. Thus, an expenditure of ` 1.51 crore80 incurred on
construction of DTC remained unfruitful as the building was not being utilized
for intended purpose for 15 years.
Public Health Engineering Department
3.10 Unfruitful expenditure on installation of Reverse Osmosis Plants
In the absence of Operation and Maintenance work, installed RO plants
became non-functional rendering expenditure of ` 1.53 crore incurred by
PHED unfruitful.
Additional Chief Engineer (ACE), Jodhpur issued (May 2013) work order of
` 2.02 crore on the lowest bidder M/s Doshion Veolia Water Solutions Private
Limited, Ahmedabad (contractor) for installation of 15 Reverse Osmosis (RO)
plants81 in Jodhpur region with liability for seven years Operation and
Maintenance (O&M). The contractor was to be paid 65 per cent after
installation and commissioning of RO plants and remaining 35 per cent in
seven installments i.e. five per cent per year for seven years for which O&M
was to be provided. The works of installation of these 15 RO plants were
completed between August 2013 and January 2015 and an amount of ` 1.53
crore82 was paid to the contractor.
Test check (December 2017 and January 2018) of the records of Executive
Engineer (EE), District Division-III, Jodhpur and District Division, Phalodi
revealed that the contractor completed the work of installation of 15 RO plants
between August 2013 and January 2015. However, the contractor did not carry
out O&M for any of these plants after their installation. As a result, all the
installed RO plants became non-functional as of December 2017. A joint
physical verification of 10 RO plants83 conducted with engineers of
department in December 2017 and January 2018 also revealed that RO plants
were in damaged condition viz. broken tanks, missing water tank, burnt panel,
missing Ion Exchanger, chocked TDS meter, missing complete structure of
plant etc., as can be seen in the picture below:
80 Including ` 0.28 crore paid to Chowkidars. 81 District Division-III, Jodhpur: eight RO plants and Division, Phalodi: seven RO plants. 82 Installation of RO plant: ` 1.31 crore and power connection: ` 0.22 crore. 83 Seven RO plants in District Division-III, Jodhpur and three RO plants in District
Division, Phalodi.

Audit Report (G&SS) for the year ended 31 March 2018
148
Missing complete structure
at Tekra
Broken tank at Chandrakh Missing taps at Thob
Though the department repeatedly issued notices to contractor for carrying out
O&M work of RO plants since their installation, it neither initiated action to
recover compensation for delay under clause 2 of the contract nor awarded the
O&M work to other contractors on risk and cost of the original contractor
under clause 3 of agreement.
Thus, in absence of O&M work of installed RO plants, the expenditure of
` 1.53 crore incurred on installation of these RO plants remained unfruitful.
Further, the department also failed to provide safe drinking water to these
severely quality affected habitations as envisaged.
Non-functioning of 124 RO plants (costing ` 15.45 crore84) out of 193 plants85
installed in Barmer, Jaisalmer and Jalore due to not carrying out O&M work
by the contractor was also highlighted in paragraph 2.2.13.1 (Performance
Audit on ‘Drinking Water Management in Rajasthan’) of Audit Report
(G&SS) 2016-17.
GoR accepted (November 2018) the facts and stated that the department has
now rescinded the work and issued (July 2018) direction for carrying out
O&M work on the risk and cost of the contractor under clause 3 of the
agreement.
Social Justice and Empowerment Department
3.11 Unfruitful expenditure on hostel building
Non-utilisation of hostel building constructed at Bikaner and Pali for
students of Specially Backward Class for over two to four years resulted
in unfruitful expenditure of ` 1.89 crore.
Social Justice and Empowerment Department (SJED) approved construction
of model hostels under Devnarayan Yojana as per a special package
announced in 2011-12 for the welfare of persons belonging to Specially
Backward Class.
84 Barmer: 75 (` 9.48 crore), Jaisalmer: 25 (` 3.04 crore) and Jalore: 24 (` 2.93 crore). 85 Barmer: 113, Jaisalmer: 40 and Jalore: 40.

Chapter III Compliance Audit
149
SJED issued (November 2011) Administrative and Financial sanction of
` 0.96 crore for construction of each model hostel building at Bikaner and Pali
district to accommodate 50 students each. The construction work was
completed by Public Works Department (PWD) at a cost of ` 0.96 crore at
Bikaner (March 2013) and ` 0.93 crore at Pali (October 2014). Subsequently,
PWD handed over the hostel to SJED, Bikaner in January 2014 and to SJED,
Pali in October 2016.
Test check (January 2018) of records of Deputy Director, SJED, Bikaner and
information gathered (September 2018) from Assistant Director, SJED, Pali
revealed that no student was admitted to the newly constructed hostels even
after a lapse of two to four years since its handing over. It was also noticed
that the hostels were constructed 15 kms and 13 kms away from the city at
Bikaner and Pali respectively. During joint inspection conducted (June 2018)
with the Deputy Director, SJED, Bikaner that arrangement for supply of water
and electricity was not made in the hostel. Deputy Director, SJED, Bikaner
confirmed (June 2018) that the sanction was issued without obtaining any
proposal from the district. It was also stated that the hostel was not connected
with an approach road. This indicated that the department constructed the
hostels in a remote and inaccessible location, which resulted in deprival of
intended benefits to students belonging to Specially Backward Class.
Deputy Director, Bikaner (January 2018) and Assistant Director, Pali
(September 2018) accepted the facts and intimated that due to remote location
of hostel and lesser population of Specially Backward Class, students could
not be admitted in the hostel.
Hostel building at Bikaner constructed in a remote and inaccessible location without
civic facilities.
Hostel building at Pali constructed in a remote and inaccessible location.
Audit Report (G&SS) for the year ended 31 March 2018
150
GoR accepted the facts and stated (April 2018) that the process of inviting
applications in Bikaner has been initiated during 2018-19 session and efforts
are being made continuously to get the hostel operational. However, the reply
of GoR on model hostel at Pali, was awaited (October 2018).
The facts remains that the hostel building was constructed at a remote and
inaccessible locations which resulted in deprival of intended benefits to the
targeted section of the community rendering the expenditure of ` 1.89 crore
unfruitful.
Urban Development and Housing Department
3.12 Unfruitful expenditure on incomplete Sewerage project
Non-completion of Sewerage Project in Kota city approved under
National River Conservation Plan and Urban Infrastructure
Development Scheme in Small and Medium towns, even after lapse of
more than five years, resulted in unfruitful expenditure of ` 77.78 crore.
Ministry of Urban Development (MoUD), Government of India (GoI)
accorded sanction (May 2008) for ` 51.22 crore under Urban Infrastructure
Development Scheme in Small and Medium Towns (UIDSSMT) for
development of sewerage system in the areas of Kota city, where the sewerage
was being draining into the Chambal river. Similarly, Ministry of Environment
and Forest (MoEF), GoI approved (November 2009) ‘Environmental
Improvement Plan for River Chambal, Kota’ and accorded sanction for
` 149.59 crore under National River Conservation Plan (NRCP).
Accordingly, Rajasthan Urban Infrastructure Finance and Development
Corporation Limited (RUIFDCO) sanctioned (December 2008 and December
2009) one package for ` 51.22 crore under UIDSSMT86 and three packages87
for ` 136.57 crore under NRCP for the sewerage project with Sewage
Treatment Plants (STPs). Urban Improvement Trust, Kota was the executing
agency for the works under NRCP and UIDSSMT.
86 UIDSSMT/Sewerage/02: For the works of providing, laying, jointing, testing and
commissioning of lateral branch trunk and out fall sewers and all ancillary works
including construction of manholes and restoration of roads at various area of Kota city. 87 (i) NRCP/LB/01: Lateral, branch and main sewers and all ancillary works including
construction of manholes and restoration of roads etc., in area downstream of Kota
barrage left bank and trunk sewer along the river bank. (ii) NRCP/RBS/01: Lateral, branch and main sewers and all ancillary works including
construction of manholes and restoration of roads etc., in area upstream of Kota
barrage right bank. (iii) NRCP/RBN/02: Lateral, branch and main sewers and all ancillary works including
construction of manholes and restoration of roads etc., in inner city gravity zone right
bank and outfall sewer along Kaithun road upto Raipura and construction of water
tight retaining wall along Kishor Sagar Talab.

Chapter III Compliance Audit
151
Test check (October 2016) of records of Urban Improvement Trust (UIT),
Kota revealed that four packages were awarded (May and July 2010) to two
different contractors with stipulated dates of completion between November
2012 to July 2013. It was, however, noticed that the sewerage project in Kota
city, has not been completed, even after lapse of more than five years of
stipulated date of completion and lying standstill as of June 2018. Package-
wise details of the works under UIDSSMT and NRCP are given in Table 21.
Table 21
(` in crore)
S.
No.
Package No. Name of
contractor
Stipulated
date of
commence-
ment of
work
Stipulated
date of
completion
of work
Work
order
amount
Total
length
of
pipeline
to be
laid (in
Kms)
Total
length
of
pipeline
Actually
laid (in
Kms)
Work
executed
as of
August
2016
(per
cent)
Cost of
balance
work
Compen-
sation
recovered
1. UIDSSMT/
Sewerage/02
M/s
Shriram
EPC
Limited,
Chennai
July 2010
July 2013 42.05 137.63 54.58 19.42
(46.18)
22.63 4.21
2. NRCP/RBN/02
January
2013
39.64 61.09 18.34 16.82
(42.43)
22.82 3.96
3. NRCP/LB/01
M/s SMS
Paryavaran,
New Delhi
May 2010
November
2012
22.87 27.33 5.04 8.01
(35.02)
14.86 2.29
4. NRCP/RBS/01
May 2013 59.82 72.57 9.09 33.53
(56.05)
26.29 5.98
Total 164.38 298.62 87.05 77.78
(47.32)
86.60 16.44
The above table indicates that the contractors executed only 47.32 per cent
works even after lapse of more than five years of stipulated dates of
completion. Subsequently, the contractors left these projects incomplete. It
was noticed that against the scope of work of construction of two STPs, three
lifting stations, 22 drains and laying of 160.99 kms sewer line in three
packages of NRCP, the contractors did not complete the work of one STP, one
lifting station, 12 drains and laying of 128.52 kms sewer line. Further, out of
137.63 kms sewer line to be laid under UIDSSMT, only 54.58 kms line was
laid by the contractor.
Scrutiny also revealed that the project area had substrata of hard rocks,
therefore application of advanced technologies such as ‘mechanized
excavation’, ‘micro tunneling’ was recommended in the Detailed Project
Reports88 (DPRs) to overcome the hazards of rock blasting in a populated city.
UIT, instead of specifically identifying the appropriate technology for
excavation and including the use of that technology in the ‘Instruction to
Bidders’, made the contractors responsible for visiting and examining the site
of work before preparing the bid for the contracts.
88 Prepared (October 2009 and November 2009) for the packages under UIDSSMT and
NRCP.

Audit Report (G&SS) for the year ended 31 March 2018
152
It was also observed that neither was the application of advanced technologies
for excavation clarified by UIT with the bidder before finalizing the contract
nor verified during execution of the works. This resulted in the contractor
facing hurdles during execution of work due to inability to blast rocky reaches.
The contractor had to then resort to cutting of rock manually with
compressors, which resulted in poor output. Besides, the contractors also
found obstacles due to existing utilities along the alignment like potable water
rising main of large diameter, power cables, communication cables and
existing drainage system, which also caused delay in work. This also indicated
that alignment of sewer lines had hindrances and UIT did little to clear the
hindrances after award of the works to the contractors.
Subsequently, after three years of stipulated date of completion UIT rescinded
(August 2016) the works at the risk and cost of the contractors and recovered
(August 2016) compensation of ` 16.44 crore for not maintaining prorata
progress. Thereafter, UIT did not award the remaining works to other
contractors (as of June 2018) at the risk and cost of the previous contractors.
Later, UIT submitted (September 2017) a revised proposal for ` 200.48
crore89 to the Department for completing the balance works under both the
schemes, which was ` 36.10 crore in excess over the initial work order amount
(` 164.38 crore). This indicated that the balance work of both the schemes was
estimated to be done at a cost of ` 122.70 crore90. However, the recovery of
excess amount of ` 36.10 crore required to complete the works at the cost of
the contractors, was remote as UIT did not have any deposit from the
contractor when the contracts were rescinded.
GoR stated (September 2018) that looking to difficulties in excavation, the
items of hard rock excavation were included in H-Schedule91. Accordingly,
the contractors made excavation work with the help of mechanical equipment
but in narrow lanes, micro-tunneling technique for rock excavation was very
much costlier and required lot of time which was not estimated by the
consultant and the bidders. Further, it is general practice not to specify any
specific technique for excavation work in general work.
The reply is not acceptable as the DPR consultants suggested application of
advanced technologies such as ‘mechanized excavation’, ‘micro tunneling’
was recommended in DPRs, to overcome the hazards of rock blasting in a
populated city having substrata of hard rocks. Further, UIT neither clarified
the application of advanced technologies for excavation to the bidder before
finalizing the contract nor verified during execution of the work sand made the
contractors responsible for visiting and examining the site of work before
89 Excluding connections to property (` 85.02 crore) and Operation and Maintenance
(` 2.66 crore) for five years, which were not included in the original sanctions. 90 Cost of Balance work ` 86.60 crore + cost overrun` 36.10 crore. 91 H Schedule is prepared for items which either not covered by BSR or required additional
cost due to use of advance technology.

Chapter III Compliance Audit
153
preparing the bid for the contracts. Moreover, UIT undertook the works as
general practice even though it required special technology for execution.
The fact remains that UIT did not assess the difficulties of the work owing to
hard rock strata and did not provide hindrances free sites to the contractors.
Resultantly, the works were incomplete after incurring an expenditure of
` 77.78 crore on sewerage project under both the schemes even after lapse of
more than five years of stipulated date of completion. Besides, the purpose to
improve the water quality of the Chambal river under NRCP, was also
defeated.
JAIPUR, (R. G. VISWANATHAN)
The 25 September, 2019 Principal Accountant General
(General and Social Sector Audit), Rajasthan
Countersigned
NEW DELHI, (RAJIV MEHRISHI)
The 03 October, 2019 Comptroller and Auditor General of India


155
Appendix 1.1
(Refer paragraph 1.2; page 1)
Statement showing List of Departments
S.No. Name of Department S.No. Name of Department S.No. Name of Department
1 Agriculture 18 General Administration 35 Public Health Engineering Department
2 Agriculture Marketing 19 Gopalan 36 Rajasthan Institute of Public Administration (RIPA)
3 Animal Husbandry 20 Higher Education 37 Rajasthan Public Service Commission
4 Archaeology and Museum 21 Home 38 Sainik Kalyan
5 Art and Culture 22 Horticulture 39 Sanskrit Education
6 Ayurveda 23 Information and Public Relation 40 Secondary Education
7 Bhasha and Pustkalaya 24 Jail 41 Skill, Employment and Entrepreneurship
8 Colonization 25 Labour 42 Social Justice and Empowerment
9 Cooperative 26 Law and Legal Department 43 State Enterprises
10 Devsthan 27 Medical and Health 44 State Motor Garage
11 Disaster Management and Relief
28 Medical Education 45 Technical Education
12 Election 29 Minority Affairs 46 Tribal Area Development
13 Employees State Insurance 30 Pension and Pensioner’s Welfare 47 Urban Development and Housing
14 Factories and Boilers
(Inspection)
31 Personal 48 Women and Child Development
15 Finance 32 Planning 49 Youth and Sports Affairs
16 Fisheries 33 Primary Education
17 Food, Civil Supply and
Consumer Affairs
34 Printing and Stationary

Audit Report (G&SS) for the year ended 31 March 2018
156
Appendix 1.2
(Refer paragraph 1.7; page 7)
Statement showing Inadequate response to audit observations
S.
No
Nature of Irregularity Agriculture Department Elementary Education
Department
Medical Education
Department
No. of
Paragraphs
Amount
(` in lakh)
No. of
Paragraphs
Amount
(` in lakh)
No. of
Paragraphs
Amount
(` in lakh)
1. Fraud/Misappropriation/
embezzlement/losses/ theft of
stores and cash
25 8,901.77 31 708.18 13 208.72
2. Recoveries pointed out by audit 59 6,427.37 32 163.75 27 255.03
3. Violation of contractual
obligation, undue favour to
contractor.
14 332.89 32 37.69 37 3,981.49
4 Avoidable/Excess Expenditure 32 10,577.00 97 4,909.32 55 1,621.51
5 Wasteful/in fructuous
expenditure
42 3,876.29 135 28,020.44 36 4,143.28
6 Regulatory issues 225 35,440.70 271 43,776.43 221 21,482.75
7 Idle investments/idle
establishment/blockade of
funds/diversion of funds
71 9,047.94 376 38,039.66 120 41,987.29
8 Idle/delay in commissioning
equipment.
08 2,815.05 48 624.44 12 1,351.31
9 Non achievement of objectives 16 13,818.67 134 5,309.02 23 4,697.44
10 Miscellaneous 488 1,26,696.24 1,100 73,396.71 316 36,849.94
Total 980 2,17,933.92 2,256 1,94,985.64 860 1,16,578.76

Appendices
157
Appendix 2.1
(Refer paragraph 2.1.2; page 11)
Statement showing salient features of the National Food Security Act, 2013
Parliament enacted the National Food Security Act, 2013 (NFSA) in September 2013, which came into effect from 2 October 2013 in
Rajasthan. The salient features of the NFSA Act are:
Identification of beneficiaries under NFSA to be completed in one year’s time by 4 July 2014.
Within the coverage determined for each State, the State Governments were to identify the AAY and the Priority Households(PHHs);
Entitlement of existing AAY households to be protected at 35 kg per household per month, while each member of such PHH to get 5
kg of food grain per month.
Eldest woman of the household of 18 years or above is to be treated as the head of the household for the purpose of issuing ration
cards.
Establishment of Grievance Redressal Mechanism at the District and State levels, with States having the flexibility to use the existing
machinery or set up separate mechanism.
Central Government to provide assistance to the State in meeting the expenditure incurred by it towards intra-State movement,
handling of food grain and margins paid to the FPS dealers.
Provisions for transparency and accountability by placing TPDS related records in public domain, Social Audit and Vigilance
Committees.
Provision for penalty on public servant or authority, to be imposed by the State Food Commission, in case of failure to comply with
relief recommended by the District Grievance Redressal Officer.

Audit Report (G&SS) for the year ended 31 March 2018
158
Appendix 2.2
(Refer paragraph 2.1.7.3; page 15)
Statement showing detail of inclusion and exclusion categories in Urban and Rural areas
Inclusion categories Exclusion categories
Common in
Urban and
Rural
1. BPL Families as per BPL census 2003.
2. State BPL families.
3. Antyodaya families.
4. Beneficiaries of Annapurna Yojana.
5. CM Vriddhajan Samman Yojana.
6. Indira Gandhi National Old age Pension Scheme.
7. CM Single Woman Scheme.
8. Indira Gandhi National Widow Pension Scheme.
9. CM Specially Abled Person Scheme.
10. Indira Gandhi National PH Pension Scheme.
11. CM Life Safety Fund.
12. All Government Hostels inhabitants.
13. Single Women.
14. CM Destitute Rehabilitation Scheme.
15. Sahariya & Kathori Tribal Families.
16. Legally released bonded labour.
17. Construction labourer registered with Labour Department.
18. Garbage picker families.
19. Families suffered with Uttarakhand Tragedy.
20. Cycle Rickshaw Driver.
21. Porters.
22. Senior Citizens having independent RC and under the age limit
prescribed by the Social Justice & Empowerment Department for
pension scheme provided not fall under the exclusion criteria.
1. Any income tax payee member in family.
2. Any member of family working under Government/Semi
Government/Autonomous bodies as a regular employee
or receiving pension more than ` 1 lakh.
3. Any member of family having Four-wheeler (except one
commercial vehicle in use for livelihood).
4. Families having total annual income more than ` l lakh.
5. Families, whose all member consolidated total holding of
agriculture land is more than the prescribed limit to the
small farmers.

Appendices
159
Appendix 2.2 continued
Inclusion categories Exclusion categories
Only in Urban 1. Registered orphanage and old age homes.
2. Surveyed family inhabitant in Slum (Kacchi Basti).
3. Domestic worker.
4. Non-Government Sweepers.
5. Street vendors.
1. Family having pakka residential/commercial premises
built over more than 1000 Sq. feet area under Nagar
Nigam/Nagar Parishad region (except Kacchi Basti).
2. Family having pakka residential/commercial premises
built over more than 1500 Sq. feet area under Nagar
Palika region (except Kacchi Basti)
Only in Rural 1. Family of labour had done 100 days work in MNERGA in any of the
year between 2009-10 to as on date.
2. Family of beneficiary of CM Specially able pension scheme.
3. Landless farmer.
4. Small & marginal farmer.

Audit Report (G&SS) for the year ended 31 March 2018
160
Appendix 3.1
(Refer paragraph 3.1; page 72)
Statement showing loss occurred due to non depositing of amount with NSDL
Year Opening
Balance
from
previous
year
Interest @
8 per cent
per annum
payable on
PD
account
Contribution
for the
current year
Amount
Deposited
with NSDL
Balance
Amount
Balance
amount to be
deposited with
NSDL from
2011-12
Prevailing
NAV of SBI
Pension
Fund** at
the end of
year
Number of
units based
on NAV
Number of
units based on
funds
deposited by
University
Amount of
loss (in `)
1 2 3 4 5 6 (2+3+4) 7 8 9 (7÷8) 10 (In column
5)
11 (9-10)
University of Kota
2005-06 1,59,333 - 1,59,333 - - - - -
2006-07 1,59,333 12,747 2,19,044 - 3,91,124 - - - - -
2007-08 3,91,124 31,290 2,35,859 - 6,58,273 - - - - -
2008-09 6,58,273 52,662 2,67,960 - 9,78,895 - - - - -
2009-10 9,78,895 78,312 4,86,986 - 15,44,193 - - - - -
2010-11 15,44,193 1,23,535 5,06,244 - 21,73,972 - - - - -
2011-12* 21,73,972 43,479 14,89,729 - 37,07,180 37,07,180 12.4821 2,97,000 - -
2012-13 - - 24,59,651 - - 24,59,651 14.1066 1,74,362 - -
2013-14 - - 23,55,188 - - 23,55,188 14.6437 1,60,833 - -
2014-15 - - 40,65,331 - - 40,65,331 17.5375 2,31,808 - -
2015-16 - - 65,83,888 - - 65,83,888 18.6979 3,52,119 - -
2016-17 - - 74,06,310 2,08,15,386 - 74,06,310 20.8118# 3,55,871 10,00,172 -
2017-18
upto Dec
17
- - 72,53,228 79,33,800 - 72,53,228 22.0346# 3,29,174 3,60,061 -
3,34,88,751 2,87,49,186 3,38,30,776 #19,01,167 13,60,233 5,37,441
Total monetary Value of Units as on 29.12.2017 @ average NAV of ` 22.0346 4,18,91,454 2,99,72,197 1,18,42,288
Net loss= Amount of loss ` 1,18,42,288 (-) ` 27,11,548 the interest earned on balances kept in savings bank accounts from 2011-12 to 2017-18 91,30,740

Appendices
161
Appendix 3.1 continued
Year Opening
Balance
from
previous
year
Interest @
8 per cent
per annum
payable on
PD
account
Contribution
for the
current year
Amount
Deposited
with NSDL
Balance
Amount
Balance
amount to be
deposited with
NSDL from
2011-12
Prevailing
NAV of SBI
Pension
Fund** at
the end of
year
Number of
units based
on NAV
Number of
units based on
funds
deposited by
University
Amount of
loss (in `)
University of Rajasthan
2005-06 80,762 - 80,762 - - - - -
2006-07 80,762 6,461 3,23,188 - 4,10,411 - - - - -
2007-08 4,10,411 32,833 3,00,112 - 7,43,356 - - - - -
2008-09 7,43,356 59,468 3,85,978 - 11,88,802 - - - - -
2009-10 11,88,802 95,104 6,89,078 - 19,72,984 - - - - -
2010-11 19,72,984 1,57,839 15,60,454 - 36,91,277 - - - - -
2011-12* 36,91,277 73,826 32,87,778 - 70,52,881 70,52,881 12.4821 5,65,040 - -
2012-13 - - 43,30,376 23,88,376 - 43,30,376 14.1066 3,06,975 1,69,309 -
2013-14 - - 50,21,808 40,45,534 - 50,21,808 14.6437 3,42,933 2,76,264 -
2014-15 - - 91,19,660 70,85,010 - 91,19,660 17.5375 5,20,009 4,03,992 -
2015-16 - - 1,32,34,680 1,99,16,234 - 1,32,34,680 18.6979 7,07,816 10,65,159 -
2016-17 - - 3,29,40,246 3,37,50,376 - 3,29,40,246 21.1742 15,55,678 15,93,939 -
2017-18 - - 4,22,29,184 3,90,15,400 - 4,22,29,184 22.4329 18,82,467 17,39,204 -
11,35,03,304 10,62,00,930 11,39,28,835 58,80,918 52,47,868 6,33,051
Total monetary Value of Units as on 31.3.2018 @ ` 22.4329 per Unit 13,19,26,051 11,77,24,889 1,42,01,162
Net loss= Amount of loss ` 1,42,01,162 (-) ` 24,61,276 the interest earned on balances kept in savings bank accounts from 2011-12 to 2017-18 1,17,39,886
RAJUVAS, Bikaner
2005-06 - - 65,540 - 65540 - - - - -
2006-07 65540 5243 1,40,090 - 210873 - - - - -
2007-08 210873 16870 1,92,174 - 419917 - - - - -
2008-09 419917 33593 4,02,420 - 855930 - - - - -
2009-10 855930 68474 5,63,366 - 1487771 - - - - -

Audit Report (G&SS) for the year ended 31 March 2018
162
Appendix 3.1 continued
Year Opening
Balance
from
previous
year
Interest @
8 per cent
per annum
payable on
PD
account
Contribution
for the
current year
Amount
Deposited
with NSDL
Balance
Amount
Balance
amount to be
deposited with
NSDL from
2011-12
Prevailing
NAV of SBI
Pension
Fund** at
the end of
year
Number of
units based
on NAV
Number of
units based on
funds
deposited by
University
Amount of
loss (in `)
2010-11 1487771 119022 1,83,877 - 1790670 - - - - -
2011-12* 1790670 35,813 1,43,124 - 19,69,607 19,69,607 12.4821 1,57,795 0.00 -
2012-13 - - 1,36,756 - - 1,36,756 14.1066 9,694 0.00 -
2013-14 - - 26,48,564 - - 26,48,564 14.6437 1,80,867 0.00 -
2014-15 - - 78,99,884 44,88,912 - 78,99,884 17.5375 4,50,457 2,55,961 -
2015-16 - - 99,12,927 93,15,150 - 99,12,927 18.6979 5,30,163 4,98,192 -
2016-17 - - 1,28,98,406 80,67,180 - 1,28,98,406 21.1742 6,09,157 3,80,991 -
2017-18 - - 1,86,03,355 2,10,86,288 - 1,86,03,355 22.4329 8,29,289 9,39,972 -
2018-19
(Upto
June
2018)
- - 51,27,182 43,34,152 - 51,27,182 22.2905 2,30,016 1,94,439 -
5,89,17,665 4,72,91,682 5,91,96,681 29,97,437 22,69,555 7,27,882
Total Monetary Value of Units as on 29.06.2018 @ ` 22.2905 6,68,14,369 5,05,89,516 1,62,24,853
Net loss= Amount of loss ` 1,62,24,853 (-) ` 21,38,877 the interest earned on balances kept in savings bank accounts from 2011-12 to 2018-19 1,40,85,976
TOTAL 20,59,09,720 18,22,41,798 20,69,56,292 24,06,31,874 19,82,86,602 4,22,68,304
Net Loss 3,49,56,602
*Interest calculated upto June 2011
** NAV of one of PFM (SBI Pension Fund) has been taken for calculation.
# Average of NAVs prevailing on the dates of transfer of funds in NSDL has been taken.

Appendices
163
Appendix 3.2
(Refer paragraph 3.6.1; page 81)
Statement showing List of selected projects (CDPOs) and AWCs
S.No. Selected Projects Total AWCs Selected AWCs Type of Projects
1 Ahore 178 Bhanwarani Mini, Pachanwaa Mini, Bithuda and Rasiyavas
Khurd
2 Anandpuri 213 Udaipura Bada, Serawala 1, Khoripada and Kobadmajara Tribal
3 Bakani 228 Nasirabad, Rajpura, Kohadijhar and Motipura
4 Buhana 201 Bhopalpura, Singhana II, Nuhaniya and Banibadh
5 Balotara I 228 Rebariyonka was Pachpadra, Jasol-5, Meghwalo ki Dhani and
Kharwa
6 Chaksu 246 Kothun I, Jagrampura, Srikishanpura and Bhojyad
7 Dausa City 90 Nagarpalika Bandui-21-II, Nagarparishad Dausa-16,
Nagarpalika Lalsot-14-II and Nagarparishad Dausa-13
8 Devgarh 171 Semlopura 2, Gardoda, Haji ka Pathar and Chotilak Tribal
9 Gangapur City 88 Ward No. 15-ii, Ward No. 14-ii, Ward 13-iii and Ward No. 2-i
10 Jamwa Ramgarh 272 Chakmal ki Nangal, Mini ka Baadh, Ramyawala and
Daulatpura
11 Jhadol 310 Bamangarh, Lakhguda, Shivpura and Badlipaada Tribal (Kathodi)
12 Kishanganj 269 Khandela Khedi, Ranwasi, Kadilee and Prempura Tribal (Saharia)
13 Malpura 284 Bairwa Dhani Kiraval, Tordi III, Antoli III and Joginada
14 Pali rural 113 Muliyawas, Dari-I, Mandali-2 and Indra Nagar
15 Shahbad 188 Bilkhedadang, Sahrol Talahti 2, Sandhari and Hariya Nagar Tribal (Saharia)

Audit Report (G&SS) for the year ended 31 March 2018
164
Appendix 3.3
(Refer paragraph 3.8.2.1(ii); page 130)
Statement showing the details of total Grants and expenditure incurred during 2013-18 for dairy and livestock development
(` in crore) Name of Scheme 2013-14 2014-15 2015-16 2016-17 2017-18 Grant Total
Grant Expenditure Grant Expenditure Grant Expenditure Grant Expenditure Grant Expenditure Grant Expenditure
NDP-I 19.49 7.55 32.30 29.00 52.54 56.94 34.07 43.37 13.13 12.75 151.53 149.61
RKVY 56.53 49.23 56.64 54.95 116.07 72.47 103.34 131.92 69.89 70.56 402.47 379.13
NPBB (RLDB) 00 00 3.45 00 1.55 1.18 0.21 3.38 11.09 1.42 16.30 5.98
NPDD (RCDF) 00 00 00 00 0.92 0.32 7.93 7.75 19.00 15.83 27.85 23.90
CMP 3.26 3.02 0.65 2.03 1.89 2.03 1.09 00 00 1.09 6.89 8.17
NLM 2.00 2.00 00 00 5.24 3.32 3.67 2.19 8.31 5.94 19.22 13.45
Dugdh Subsidy 145 157.05 12.05 00 00 00 00 00 00 00 157.05 157.05
Dev Narayan Yojana 6.50 00 00 00 00 00 00 2.00 00 00 6.50 2.00
LH &DC 14.09 6.39 15.01 13.56 10.13 12.50 30.96 27.67 25.64 31.05 95.83 91.17
Total 246.87 225.24 120.10 99.54 188.34 148.76 181.47 218.28 147.06 138.64 883.64 830.46

Appendices
165
Appendix 3.4
(Refer paragraph 3.8.2.3(ii); page 133)
Statement showing comparative analysis of performance of milk unions established in seven divisional headquarters
Milk Union at
Divisional Head
Quarters
Year Urban
Population of
districts of
Milk Union as
per census
2011 (in lakh)
Milk
Production in
Jurisdiction of
Milk Union
(lakh Kg.)
Milk
Procurement
by Milk Union
(lakh Kg.)
Milk
marketing by
Milk Union
(lakh litre)
Milk
marketing by
Milk Union
(lakh Kg.)
Percentage of
procurement
of Milk to Milk
Production
Per capita
Marketing of
Milk per day
(in Grams)
Milk Union, Jaipur
(Jaipur & Dausa
Districts)
2013-14 36.74 15084.42 3306.90 2949.20 3031.78 21.92 226
2014-15 19895.15 3496.70 3069.65 3155.60 17.58 235
2015-16 23897.53 3744.90 3128.05 3215.64 15.67 240
2016-17 26255.06 3872.70 3160.90 3249.41 14.75 242
2017-18 22989.18 4146.40 3281.35 3373.23 18.04 252
Milk Union, Jodhpur
(Jodhpur and
Jaisalmer
Districts)
2013-14 13.54 10406.08 164.25 229.95 236.39 1.58 48
2014-15 10939.72 237.25 208.05 213.88 2.17 43
2015-16 9077.12 229.95 200.75 206.37 2.53 42
2016-17 12939.99 215.35 200.75 206.37 1.66 42
2017-18 14339.96 229.95 197.10 202.62 1.60 41
Milk Union, Udaipur
(Udaipur and
Rajsamand Districts)
2013-14 7.92 6928.71 270.10 288.35 296.42 3.90 103
2014-15 9102.70 313.90 301.49 309.93 3.45 107
2015-16 10917.10 368.65 303.68 312.18 3.38 108
2016-17 11356.66 361.35 328.50 337.70 3.18 117
2017-18 12487.89 383.25 361.35 371.47 3.07 129
Milk Union, Ajmer
(Ajmer District) 2013-14 10.35 6787.16 846.80 602.25 619.11 12.48 164
2014-15 7467.27 1025.70 646.05 664.14 13.74 176
2015-16 7497.10 974.55 657.00 675.40 13.00 179
2016-17 7869.77 1022.00 671.60 690.40 12.99 183
2017-18 8547.76 1135.20 711.75 731.68 13.28 194

Audit Report (G&SS) for the year ended 31 March 2018
166
Appendix 3.4 continued
Milk Union at
Divisional Head
Quarters
Year Urban
Population of
districts of
Milk Union as
per census
2011 (in lakh)
Milk
Production in
Jurisdiction of
Milk Union
(lakh Kg.)
Milk
Procurement
by Milk Union
(lakh Kg.)
Milk
marketing by
Milk Union
(lakh litre)
Milk
marketing by
Milk Union
(lakh Kg.)
Percentage of
procurement
of Milk to Milk
Production
Per capita
Marketing of
Milk per day
(in Grams)
Milk Union, Kota
(Kota and Bundi
Districts)
2013-14 14.00 6143.98 229.95 211.70 217.63 3.74 43
2014-15 5975.14 292.00 229.95 236.39 4.89 46
2015-16 5844.86 335.80 240.90 247.65 5.75 48
2016-17 7077.88 302.95 255.50 262.65 4.28 51
2017-18 7883.92 332.15 292.00 300.18 4.21 59
Milk Union, Bikaner
(Bikaner District)
2013-14 8.00 4871.80 351.13 113.15 116.32 7.21 40
2014-15 5862.05 354.05 109.50 112.57 6.04 39
2015-16 6012.35 292.00 102.20 105.06 4.86 36
2016-17 7224.22 197.10 105.85 108.81 2.73 37
2017-18 7908.51 310.25 94.90 97.56 3.92 33
Milk Union,
Bharatpur
(Bharatpur and
Dholpur Districts)
2013-14
7.42
5337.99 25.55 18.25 18.76 0.48 7
2014-15 8399.00 47.45 29.20 30.02 0.56 11
2015-16 9787.11 32.85 32.85 33.77 0.34 12
2016-17 14899.19 25.55 29.20 30.02 0.17 11
2017-18 14669.51 47.45 32.85 33.77 0.32 12