Economic Sector and PSUs Government of Uttar Pradesh - CAG
220
-
Upload
khangminh22 -
Category
Documents
-
view
1 -
download
0
Transcript of Economic Sector and PSUs Government of Uttar Pradesh - CAG


Report of the Comptroller and Auditor General of India
on Economic Sector and Public Sector Undertakings
for the year ended 31 March 2018
Government of Uttar Pradesh Report No. 1 of the year 2020

i
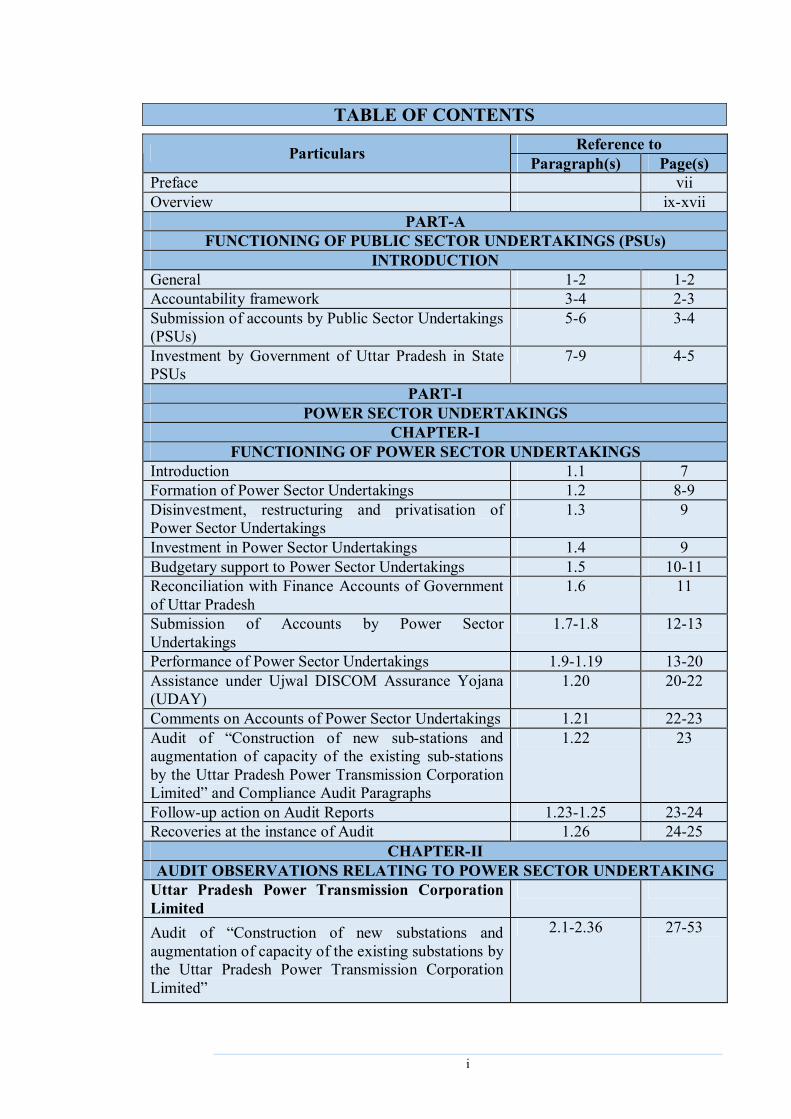
TABLE OF CONTENTS Reference to Particulars Paragraph(s) Page(s)
Preface vii Overview ix-xvii
PART-A FUNCTIONING OF PUBLIC SECTOR UNDERTAKINGS (PSUs)
INTRODUCTION General 1-2 1-2 Accountability framework 3-4 2-3 Submission of accounts by Public Sector Undertakings (PSUs)
5-6 3-4
Investment by Government of Uttar Pradesh in State PSUs
7-9 4-5
PART-I POWER SECTOR UNDERTAKINGS
CHAPTER-I FUNCTIONING OF POWER SECTOR UNDERTAKINGS
Introduction 1.1 7 Formation of Power Sector Undertakings 1.2 8-9 Disinvestment, restructuring and privatisation of Power Sector Undertakings
1.3 9
Investment in Power Sector Undertakings 1.4 9 Budgetary support to Power Sector Undertakings 1.5 10-11 Reconciliation with Finance Accounts of Government of Uttar Pradesh
1.6 11
Submission of Accounts by Power Sector Undertakings
1.7-1.8 12-13
Performance of Power Sector Undertakings 1.9-1.19 13-20 Assistance under Ujwal DISCOM Assurance Yojana (UDAY)
1.20 20-22
Comments on Accounts of Power Sector Undertakings 1.21 22-23 Audit of “Construction of new sub-stations and augmentation of capacity of the existing sub-stations by the Uttar Pradesh Power Transmission Corporation Limited” and Compliance Audit Paragraphs
1.22 23
Follow-up action on Audit Reports 1.23-1.25 23-24 Recoveries at the instance of Audit 1.26 24-25
CHAPTER-II AUDIT OBSERVATIONS RELATING TO POWER SECTOR UNDERTAKING
Uttar Pradesh Power Transmission Corporation Limited
Audit of “Construction of new substations and augmentation of capacity of the existing substations by the Uttar Pradesh Power Transmission Corporation Limited”
2.1-2.36 27-53

ii
Reference to Particulars Paragraph(s) Page(s) CHAPTER-III
COMPLIANCE AUDIT OBSERVATIONS RELATING TO POWER SECTOR UNDERTAKINGS
Energy Department Madhyanchal Vidyut Vitran Nigam Limited Avoidable loss of revenue 3.1 55-56 Audit Impact Purvanchal Vidyut Vitran Nigam Limited Recovery towards short levy of minimum charge 3.2 57 Madhyanchal Vidyut Vitran Nigam Limited Recovery towards interest on mobilisation advance 3.3 57 Uttar Pradesh Power Transmission Corporation Limited
Recovery towards shut down charges 3.4 58 PART-II
STATE PUBLIC SECTOR UNDERTAKINGS (OTHER THAN POWER SECTOR)
CHAPTER-IV FUNCTIONING OF STATE PUBLIC SECTOR UNDERTAKINGS (OTHER
THAN POWER SECTOR) Introduction 4.1-4.2 59-60 Investment in State PSUs (other than Power Sector) 4.3-4.4 60-61 Disinvestment, restructuring and privatisation of State PSUs (other than Power Sector)
4.5 61
Budgetary Support to State PSUs (other than Power Sector)
4.6 62-63
Reconciliation with Finance Accounts of Uttar Pradesh 4.7 63 Submission of Accounts by State PSUs (other than Power Sector)
4.8 63-65
Impact of non-finalisation of Accounts of State PSUs (other than Power Sector)
4.9 65
Winding up of non-functional State PSUs (other than Power Sector)
4.10 65
Placement of Separate Audit Reports of Statutory Corporations
4.11 65-66
Performance of State PSUs (other than Power Sector) 4.12-4.23 66-74 Comments on Accounts of State PSUs (other than Power Sector)
4.24-4.25 74-76
Compliance Audit Paragraphs 4.26 76 Follow-up action on Audit Reports 4.27-4.29 76-77 Recoveries at the instance of Audit 4.30 77-78

iii
Reference to Particulars Paragraph(s) Page(s) CHAPTER-V
COMPLIANCE AUDIT OBSERVATIONS RELATING TO STATE PUBLIC SECTOR UNDERTAKINGS (OTHER THAN POWER SECTOR)
Transport Department Uttar Pradesh State Road Transport Corporation Loss to Government due to non-levy of Service Tax 5.1 79-80 Housing and Urban Planning Department Uttar Pradesh Avas Evam Vikas Parishad Avoidable payment of interest 5.2 80-81 Loss to Parishad due to incorrect Reserve Price 5.3 82 Undue favour extended to the Contractor 5.4 82-84 Infrastructure and Industrial Development Department
Uttar Pradesh State Industrial Development Corporation Limited
Loss to the Company due to unprofessional approach 5.5 85-86 Loss due to selection of unsuitable land 5.6 86-87 Urban Development Department Uttar Pradesh Jal Nigam Award of higher rates of extra item of work to the Contractor
5.7 88-89
Undue favour to the Contractor 5.8 89-91 PART-B
DEPARTMENTS AND ENTITIES (OTHER THAN PUBLIC SECTOR UNDERTAKINGS) UNDER ECONOMIC SECTOR
CHAPTER-VI Functioning of Departments and Entities (other than Public Sector Undertakings) under Economic Sector Introduction 6.1 93 Profile of Departments and Authorities 6.2 93-94 Audit Coverage 6.3 94 Response of Government to Audit 6.4 94-95 Action taken on earlier Audit Reports 6.5 95-96 Status of Audit of Accounts of Entities 6.6 96-98 Recoveries at the instance of Audit 6.7 99
CHAPTER-VII COMPLIANCE AUDIT OBSERVATIONS RELATING TO DEPARTMENTS
AND ENTITIES (OTHER THAN PUBLIC SECTOR UNDERTAKINGS) UNDER ECONOMIC SECTOR
Housing and Urban Planning Department
Ghaziabad Development Authority
Hi-tech Township Policy 7.1 101
Undue benefit to Hi-tech township developers 7.1.1 101-102

iv
Reference to Particulars Paragraph(s) Page(s) Non-levy of additional land use conversion charges 7.1.2 102-103
Non-revision and recovery of City Development Charges 7.1.3 103-104
Short levy of land use conversion charges 7.2 104-105
Non-compliance of Government Orders in sale of properties
7.3 105
Undue favour to developers by not fixing reserve price in consonance with the allowed Floor Area Ratio
7.3.1 106
Non-inclusion of corner charges in the reserve price 7.3.2 106-107
Infrastructure Surcharge on sale of plots not levied 7.3.3 107-109
Undue benefit of incentive scheme 7.4 109-110
Infrastructure and Industrial Development Department
Lucknow Industrial Development Authority
Failure to assess and collect Labour Cess at the time of sanction of maps
7.5 110-111
Department of Additional Sources of Energy
Uttar Pradesh New and Renewable Energy Development Agency
Non-levy of liquidated damages 7.6 112-113
Appendices Appendix(s) Page(s) Summarised financial results of Power Sector Undertakings for the latest year for which accounts were finalised
1.1 115-116
Investment made by Government and others in 15 Power Sector PSUs as on 31 March 2018
1.2 117
Statement showing position of State Government investment in State PSUs (Power Sector) accounts of which are in arrears during the period of arrears
1.3 118
Details of Top Profit/Loss making PSUs during 2017-18 1.4 119 Statement showing State Government funds infused in the four Power Sector Undertakings from the year 2000-2001 to 2017-18
1.5 120
Statement showing details of investment by the State Government and present value (PV) of Government funds without considering defaulted interest bearing loan
1.6 121
Statement showing role of various wings of the Company 2.1 122 Statement showing details of physical position of Sub-stations and Lines at the beginning of 2013-14 and additions during 2013-14 to 2017-18
2.2 123
Statement showing the position of the construction of new SSs and augmentation of existing SSs planned during 2013-14 to 2017-18
2.3 124

v
Reference to Appendices Appendix(s) Page(s)
Statement showing the connected load of new SSs which were overloaded within a year of construction
2.4 125
(A) Statement showing the position of the overloaded 220 KV SSs
2.5 126
(B) Statement showing the position of the overloaded 132 KV SSs
2.5 126-127
Statement showing the position of procurement of material without synchronising with erection activities
2.6 128-129
Statement showing the details of Transformers of various capacities procured through TKCs
2.7 130
Statement showing loss of revenue due to incorrect billing to the Consumer
3.1 131-132
Statement showing loss of revenue due to non- applying provision of Minimum charges in Bills
3.2 (a) 133
Statement showing loss of revenue due to short verification of billed amount by the Consumer
3.2 (b) 134
Statement showing short/ excess charge in billed amount due to non-considering billable demand and excess demand
3.2 (c) 135
Summarised financial results of PSUs (other than Power Sector) covered in this Chapter for the latest year which accounts were finalised
4.1 136-137
Details of State PSUs (other than Power Sector) not covered in this Chapter
4.2 138-141
Statement showing position of equity and outstanding loans relating to State PSUs (other than Power Sector) covered in this Chapter as on 31 March 2018
4.3 142-143
Statement showing difference between Finance Accounts of Government of Uttar Pradesh and Accounts of the State PSUs (other than Power Sector) in respect of balances of Equity, Loans and Guarantees as on 31 March 2018
4.4 144-149
Statement showing position of State Government investment in State PSUs (other than Power Sector) accounts of which are in arrears
4.5 150-151
Statement showing State Government fund infused in State PSUs (other than Power Sector) during the period from 2000-01 to 2017-18
4.6 152-156
Statement showing loss to Parishad due to incorrect fixation of reserve price
5.1 157
Statement showing loss to Parishad due to allowing interest free mobilisation advance without assessing its requirement
5.2 157
Statement showing detail of excess payment made on execution of extra items
5.3 158

vi
Reference to Appendices Appendix(s) Page(s)
Statement showing detail of excess payment made on account of new timber as an extra item
5.4 159
Statement showing loss due to not levy of land use conversion charges from Hi-tech Township developers
7.1 160-161
Statement showing non-levying of additional land use conversion charges on Hi-tech Township Developer
7.2 162
Statement showing non-revision and recovery of CDC from Hi-tech Township Developer
7.3 163
Statement showing loss to the Authority due to not fixing reserve price of group housing plot as per allowed FAR
7.4 164
Statement showing loss due to non-inclusion of corner charges in the reserve price of auction of corner assets
7.5 165
Statement showing loss due to non-levy and non-recovery of Infrastructure Surcharge
7.6 166
Statement showing loss due to non-levy of Infrastructure Surcharge
7.7 167-168
Statement showing non-levy of Infrastructure Surcharge on sale of Commercial Plots
7.8 169
Statement showing amount of liquidated damages not levied on contractors
7.9 170

vii
Preface
This Report deals with the results of the audit of departments and entities under Economic Sector and Government companies and Statutory corporations of the Government of Uttar Pradesh. The Report has been prepared for submission to the Governor of Uttar Pradesh under Article 151 of the Constitution of India and Section 19A of the Comptroller and Auditor General’s (Duties, Powers and Conditions of Service) Act, 1971 as amended from time to time.
The accounts of Government companies (including companies deemed to be Government companies as per the provisions of the Companies Act) are audited by the Comptroller and Auditor General of India (CAG) under the provisions of Section 143 (6) of the Companies Act, 2013. The accounts certified by the Statutory Auditors (Chartered Accountants) appointed by the CAG under the Companies Act are subject to supplementary audit by officers of the CAG and the CAG gives his comments or supplements the reports of the Statutory Auditors. In addition, these companies are also subject to test audit by the CAG.
The audit arrangements of Statutory Corporations are prescribed under the respective Acts through which the Corporations are established. The audit of Government Departments is conducted under Comptroller and Auditor General’s (Duties, Powers and Conditions of Service) Act, 1971 as amended from time to time. This Report contains two parts. The Part-A deals with functioning of the Public Sector Undertakings and Part-B deals with functioning of Government departments and entities other than PSUs under Economic Sector of Uttar Pradesh.
The instances mentioned in this Report are those, which came to notice in the course of test audit during the year 2017-18 as well as those which came to notice in earlier years, but could not be reported in previous Audit Reports. Instances relating to the period subsequent to year 2017-18 have also been included, wherever related and necessary.
The audit has been conducted in conformity with the Auditing Standards issued by the Comptroller and Auditor General of India.


OVERVIEW


ix
Overview This Report contains two parts. Part-A of the Report comprises of five chapters relating to general information about the Public Sector Undertakings, Audit on “Construction of new sub-stations and augmentation of capacity of the existing sub-stations by the Uttar Pradesh Power Transmission Corporation Limited” and Compliance Audit paragraphs of the Public Sector Undertakings. Part-B of the Report comprises of two chapters relating to general information and Compliance Audit paragraphs relating to Government Departments and Entities other than Public Sector Undertakings under Economic Sector of Uttar Pradesh.
Part-A Functioning of Public Sector Undertakings Audit of Government companies is governed by Sections 139 and 143 of the Companies Act, 2013. The financial statements of Government companies are audited by the Statutory Auditors appointed by the Comptroller and Auditor General of India (CAG). These financial statements are also subject to supplementary audit by the CAG.
As on 31 March 2018, Uttar Pradesh had 107 State Public Sector Undertakings (PSUs) consisting of six Statutory Corporations and 101 Government companies (including 46 non-functional Government companies) under the audit jurisdiction of the Comptroller & Auditor General of India. As on 31 March 2018, the total investment (capital and long term loans) in 107 PSUs was ` 1,99,807.67 crore. The power sector received 85.60 per cent out of total investment of ` 69,554.02 crore made during the period from 2015-16 to 2017-18.
Chapter-I: Functioning of Power Sector Undertakings
Stake of Government of Uttar Pradesh As on 31 March 2018, the total investment (equity and long terms loans) in 15 Power Sector Undertakings was ` 1,83,202.93 crore. The investment consisted of 58.25 per cent towards equity and 41.75 per cent in long-term loans. The long term loans advanced by the State Government constituted 12.88 per cent (` 9,848.09 crore) of the total long term loans whereas 87.12 per cent (` 66,636.35 crore) of the total long term loans were availed from other financial institutions. Performance of Power Sector Undertakings The overall loss of ` 18,127.40 crore incurred by the Power Sector PSUs in 2015-16 increased to ` 18,534.62 crore in 2017-18. As per latest finalised accounts up to the year 2017-18 of the Power Sector PSUs, three PSUs earned profit of ` 449.01 crore and 10 PSUs incurred loss of ` 18,983.63 crore. The remaining two PSUs incurred marginal profit/loss1. The accumulated losses of the Power Sector companies were ` 1,33,638.98 crore as against the capital investment of ` 94,157.20 crore as on 31 March 2018. Of the 15 Power Sector undertakings, the net worth of 11 PSUs were completely eroded (` -60,616.92 crore) during 2017-18.
1 Southern UP Power Transmission Company Limited: ` 682 and Yamuna Power Generation
Company Limited: ` 91,611.

Audit Report on Economic Sector and Public Sector Undertakings for the year ended 31 March 2018
x
Financial Turnaround of DISCOMS under Ujwal DISCOM Assurance Yojana (UDAY) A Memorandum of Understanding (MoU) was signed (30 January 2016) among the Ministry of Power (MoP), the Government of Uttar Pradesh (GoUP) and Uttar Pradesh Power Corporation Limited on behalf of DISCOMs (PuVVNL, PVVNL, DVVNL, MVVNL and KESCO2) for providing assistance to the State owned Power Sector PSUs. As per provisions of the UDAY Scheme and MoU, out of total outstanding debt (` 53,935.06 crore) pertaining to DISCOMs as on 30 September 2015, the GoUP took over total debt of ` 39,133.76 crore during the period 2015-16 and 2016-17 by providing equity of ` 9,783.44 crore, grant of ` 19,566.88 crore and loan of ` 9,783.44 crore. In addition, GoUP also provided subsidy of ` 409.93 crore during 2017-18 for meeting out the future financial losses.
Quality of accounts The quality of accounts of Power Sector companies needs improvement. Out of 21 accounts finalised during 1 October 2017 to 30 September 2018, the Statutory Auditors gave qualified opinion on three accounts. There were 15 instances of non-compliance with Accounting Standards in three accounts by the Power Sector undertakings.
Chapter-II: Audit relating to Power Sector Undertaking
Audit of “Construction of new sub-stations and augmentation of capacity of the existing sub-stations by the Uttar Pradesh Power Transmission Corporation Limited” Transmission of electricity is defined as bulk transfer of power over long distances at high voltages, generally at 132 KV and above. Electric power generated at relatively low voltages in the power generating plants is stepped up to high voltage power before the same is transmitted through transmission lines. The sub-stations (SSs) are facilities within the high voltage electric system (transmission system) used for stepping-up/stepping down voltages from one level to another and connecting the electric systems of the distribution companies (DISCOMs) with the generation systems. In Uttar Pradesh, the management of the intra-state power transmission system and of the Grid operations are vested with the Uttar Pradesh Power Transmission Corporation Limited (Company). The present audit was conducted from March 2018 to November 2018 to evaluate the performance of the Company in planning and execution of the construction/augmentation of sub-station projects during 2013-14 to 2017-18.
Physical and Financial progress of the Company During the last five years ending March 2018, the Company had invested an amount of ` 17,788.43 crore in capital assets for strengthening its transmission networks. The Company constructed 172 new substations (SSs) of 20,045 MVA capacity and augmented the capacity of existing 486 SSs by 2 Purvanchal Vidyut Vitran Nigam Limited (PuVVNL), Paschimanchal Vidyut Vitran Nigam
Limited (PVVNL), Dakshinanchal Vidyut Vitran Nigam Limited (DVVNL), Madhyanchal Vidyut Vitran Nigam Limited (MVVNL) and Kanpur Electricity Supply Company Limited (KESCO).

Overview
xi
23,638 MVA. As a result, transmission capacity of the Company increased by 74 per cent and actual power transmitted increased by 55 per cent.
(Paragraphs 2.7 to 2.8) The main audit findings are as follows:
Project Planning
The Company did not have any Project Planning and Management Manual (Manual) to guide its planning process. Absence of the Manual led to ad-hoc decision making in planning and execution of various projects. As a result, some SSs became overloaded within a year of their construction while in some cases either idle capacity was created or the SSs constructed could not be put on commercial load.
(Paragraphs 2.13 and 2.14)
Contract and Procurement Management
In absence of purchase policy/procurement manual and periodic procurement plan, supply of material valued at ` 85.26 crore was received by the field units much before the projected utilisation of these materials. Procurements made without ensuring synchronisation with erection activities led to an avoidable burden of payment of interest of ` 5.45 crore.
(Paragraphs 2.15 and 2.16)
The Company failed to avail the benefit of the lower rates received in subsequent tender. This resulted in avoidable expenditure of ` 2.77 crore.
(Paragraph 2.18)
The Company failed to take appropriate action against the defaulting firm for non-lifting of 15 transformers valued at ` 24.75 crore damaged under the guarantee period despite passage of one year to five years.
(Paragraph 2.20)
Award and execution of project
There was a delay of 1 to 37 months in construction/augmentation of 165 sub-stations out of 402 sub-stations planned for construction/augmentation during 2013-14 to 2016-17. The main reasons for the delay were non-execution of parallel activities, delay in identification and acquisition of land, negligence in the execution of civil work and poor performance of the firms. The Company failed to review inordinately delayed projects and address the constraints delaying these projects.
(Paragraphs 2.22 to 2.25)
In case of four transmission projects, SSs and lines valuing ` 200.08 crore were completed but related components of these SSs and lines were still incomplete. As a result, expenditure incurred on the completed components valuing ` 200.08 crore was lying unutilised for the period ranging from nine months to eighteen months which resulted in avoidable payment of interest of ` 9.37 crore.
(Paragraph 2.26)
Audit Report on Economic Sector and Public Sector Undertakings for the year ended 31 March 2018
xii
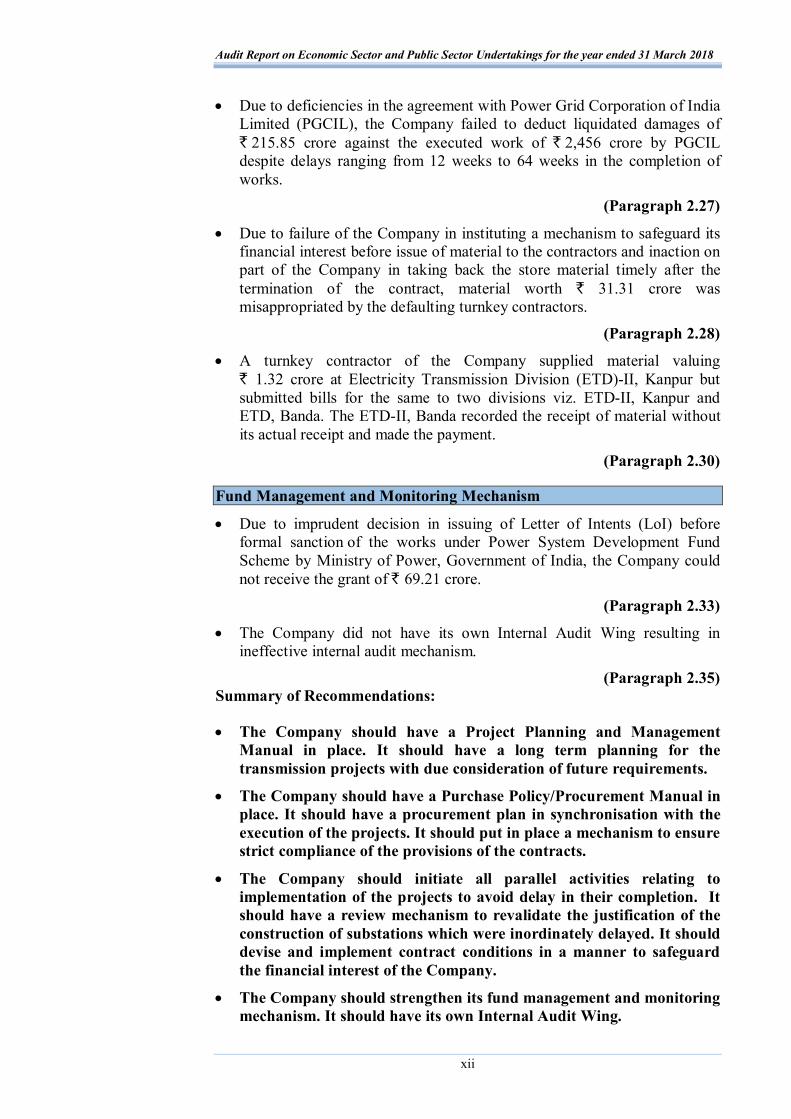
Due to deficiencies in the agreement with Power Grid Corporation of India Limited (PGCIL), the Company failed to deduct liquidated damages of ` 215.85 crore against the executed work of ` 2,456 crore by PGCIL despite delays ranging from 12 weeks to 64 weeks in the completion of works.
(Paragraph 2.27)
Due to failure of the Company in instituting a mechanism to safeguard its financial interest before issue of material to the contractors and inaction on part of the Company in taking back the store material timely after the termination of the contract, material worth ` 31.31 crore was misappropriated by the defaulting turnkey contractors.
(Paragraph 2.28)
A turnkey contractor of the Company supplied material valuing ` 1.32 crore at Electricity Transmission Division (ETD)-II, Kanpur but submitted bills for the same to two divisions viz. ETD-II, Kanpur and ETD, Banda. The ETD-II, Banda recorded the receipt of material without its actual receipt and made the payment.
(Paragraph 2.30)
Fund Management and Monitoring Mechanism
Due to imprudent decision in issuing of Letter of Intents (LoI) before formal sanction of the works under Power System Development Fund Scheme by Ministry of Power, Government of India, the Company could not receive the grant of ` 69.21 crore.
(Paragraph 2.33)
The Company did not have its own Internal Audit Wing resulting in ineffective internal audit mechanism.
(Paragraph 2.35) Summary of Recommendations:
The Company should have a Project Planning and Management Manual in place. It should have a long term planning for the transmission projects with due consideration of future requirements.
The Company should have a Purchase Policy/Procurement Manual in place. It should have a procurement plan in synchronisation with the execution of the projects. It should put in place a mechanism to ensure strict compliance of the provisions of the contracts.
The Company should initiate all parallel activities relating to implementation of the projects to avoid delay in their completion. It should have a review mechanism to revalidate the justification of the construction of substations which were inordinately delayed. It should devise and implement contract conditions in a manner to safeguard the financial interest of the Company.
The Company should strengthen its fund management and monitoring mechanism. It should have its own Internal Audit Wing.

Overview
xiii
Chapter-III: Compliance Audit Observations relating to Powers Sector Undertakings
Compliance Audit observations included in this Chapter highlight deficiencies in the management of Power Sector undertakings. The irregularities pointed out are broadly of the following nature:
The Madhyanchal Vidyut Vitran Nigam Limited suffered loss of revenue of ` 3.26 crore due to incorrect billing to a consumer.
(Paragraph 3.1)
The Purvanchal Vidyut Vitran Nigam Limited, Madhyanchal Vidyut Vitran Nigam Limited and Uttar Pradesh Power Transmission Corporation Limited recovered revenue of ` 5.89 crore in three cases after being pointed out by Audit.
(Paragraphs 3.2, 3.3 and 3.4)
Chapter-IV: Functioning of State Public Sector Undertakings (other than Power Sector)
As on 31 March 2018, Uttar Pradesh had 92 State Public Sector Undertakings (other than Power Sector) consisting of 49 functional PSUs (43 functional companies, six functional Statutory corporations) and 43 non-functional PSUs (all companies). Out of 92 PSUs, 21 PSUs which were functional and prepared their accounts up to 2015-16 or later periods, were selected for detailed financial analysis. These 21 PSUs registered a turnover of ` 7,725.28 crore during 2017-18 as per their latest finalised accounts. This turnover was equal to 0.56 per cent of the State Gross Domestic Product.
Stake of Government of Uttar Pradesh As on 31 March 2018, the total investment in these 21 PSUs was ` 9,407.26 crore (equity ` 4,495.12 crore and long term loans ` 4,912.14 crore). The investment consisted of 47.78 per cent towards equity and 52.22 per cent in long-term loans. The long term loans advanced by the State Government constituted 34.51 per cent (` 1,694.98 crore) of the total long term loans (` 4,912.14 crore) whereas 65.49 per cent (` 3,217.16 crore) of the total long term loans were availed from Central Government and other financial institutions.
Performance of Functional State PSUs (other than Power Sector) Out of 21 PSUs covered in this Chapter, 16 PSUs earned profit (` 423.52 crore), all of which were either having monopolistic advantage or were having assured source of income from budgetary support, centage, commission, interest on bank deposits etc. The top profit making companies in 2017-18 were Uttar Pradesh Awas Evam Vikas Parishad (` 158.95 crore), Uttar Pradesh State Road Transport Corporation (` 97.19 crore), Uttar Pradesh State Warehousing Corporation (` 51.23 crore) and Uttar Pradesh Purva Sainik Kalyan Nigam Limited (` 38.73 crore). Out of total loss of ` 56.58 crore incurred by five PSUs during the year 2017-18, loss of ` 30.54 crore was incurred by three PSUs in monopolistic sector despite not being in open to market competition.
Audit Report on Economic Sector and Public Sector Undertakings for the year ended 31 March 2018
xiv
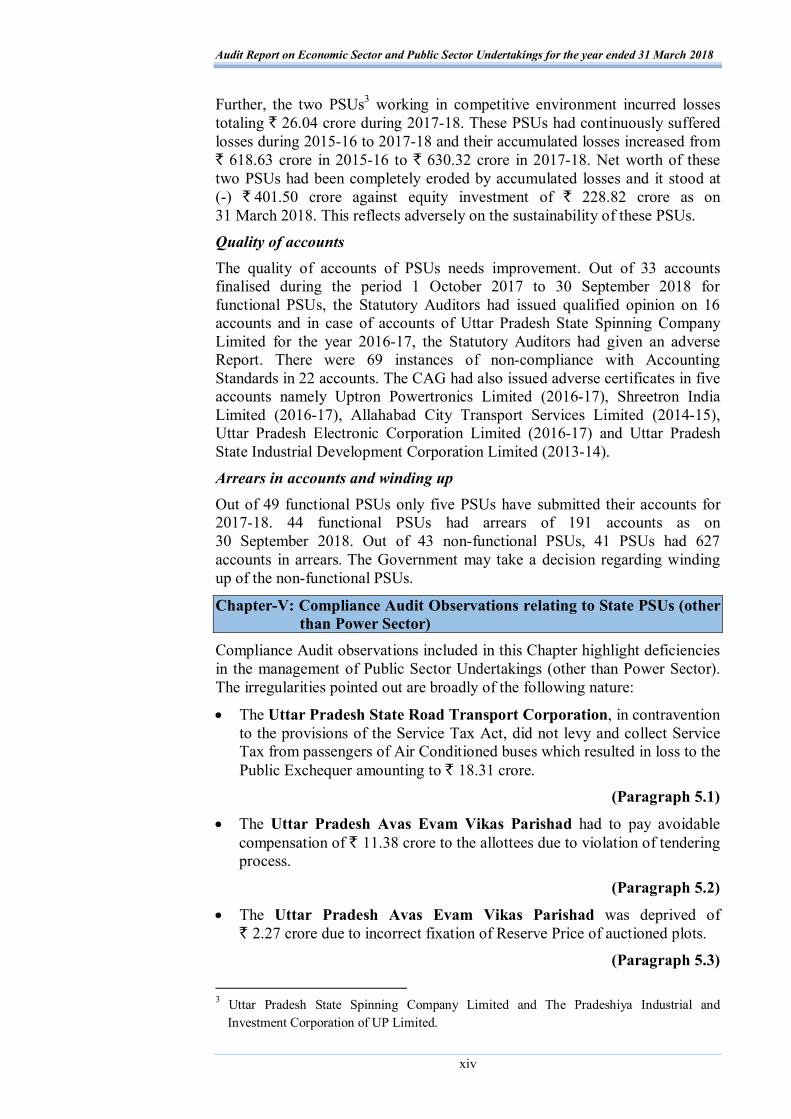
Further, the two PSUs3 working in competitive environment incurred losses totaling ` 26.04 crore during 2017-18. These PSUs had continuously suffered losses during 2015-16 to 2017-18 and their accumulated losses increased from ` 618.63 crore in 2015-16 to ` 630.32 crore in 2017-18. Net worth of these two PSUs had been completely eroded by accumulated losses and it stood at (-) ` 401.50 crore against equity investment of ` 228.82 crore as on 31 March 2018. This reflects adversely on the sustainability of these PSUs.
Quality of accounts The quality of accounts of PSUs needs improvement. Out of 33 accounts finalised during the period 1 October 2017 to 30 September 2018 for functional PSUs, the Statutory Auditors had issued qualified opinion on 16 accounts and in case of accounts of Uttar Pradesh State Spinning Company Limited for the year 2016-17, the Statutory Auditors had given an adverse Report. There were 69 instances of non-compliance with Accounting Standards in 22 accounts. The CAG had also issued adverse certificates in five accounts namely Uptron Powertronics Limited (2016-17), Shreetron India Limited (2016-17), Allahabad City Transport Services Limited (2014-15), Uttar Pradesh Electronic Corporation Limited (2016-17) and Uttar Pradesh State Industrial Development Corporation Limited (2013-14).
Arrears in accounts and winding up Out of 49 functional PSUs only five PSUs have submitted their accounts for 2017-18. 44 functional PSUs had arrears of 191 accounts as on 30 September 2018. Out of 43 non-functional PSUs, 41 PSUs had 627 accounts in arrears. The Government may take a decision regarding winding up of the non-functional PSUs.
Chapter-V: Compliance Audit Observations relating to State PSUs (other than Power Sector)
Compliance Audit observations included in this Chapter highlight deficiencies in the management of Public Sector Undertakings (other than Power Sector). The irregularities pointed out are broadly of the following nature:
The Uttar Pradesh State Road Transport Corporation, in contravention to the provisions of the Service Tax Act, did not levy and collect Service Tax from passengers of Air Conditioned buses which resulted in loss to the Public Exchequer amounting to ` 18.31 crore.
(Paragraph 5.1)
The Uttar Pradesh Avas Evam Vikas Parishad had to pay avoidable compensation of ` 11.38 crore to the allottees due to violation of tendering process.
(Paragraph 5.2)
The Uttar Pradesh Avas Evam Vikas Parishad was deprived of ` 2.27 crore due to incorrect fixation of Reserve Price of auctioned plots.
(Paragraph 5.3) 3 Uttar Pradesh State Spinning Company Limited and The Pradeshiya Industrial and
Investment Corporation of UP Limited.

Overview
xv
The Uttar Pradesh Avas Evam Vikas Parishad suffered a loss of interest amounting to ` 1.50 crore due to release of mobilisation advance of ` 40.86 crore to the contractor against the provision of Financial Hand Book of the Government of Uttar Pradesh and before the necessary Environmental Clearance was received.
(Paragraph 5.4)
The Uttar Pradesh State Industrial and Development Corporation Limited initiated the land acquisition proposal without entering into an agreement with the Bharat Electronics Limited, which required the land, and consequently suffered a loss of ` 6.49 crore on account of cancellation of the acquisition process.
(Paragraph 5.5)
The Uttar Pradesh State Industrial and Development Corporation Limited selected unsuitable land and ignored revised high rates of compensation due to applicability of the new Land Acquisition Act which resulted in loss to the extent of ` 2.92 crore.
(Paragraph 5.6)
Execution of extra items of work of timbering at higher rate by the Uttar Pradesh Jal Nigam resulted in undue benefit to the contractor to the extent of ` 4.05 crore.
(Paragraph 5.7) The Uttar Pradesh Jal Nigam extended undue favour to the contractor by
allowing inadmissible escalation resulting in loss to the Government of Uttar Pradesh of ` 4.09 crore.
(Paragraph 5.8)
Part-B Departments and Entities (other than Public Sector Undertakings) under Economic Sector
Chapter-VI: Introduction
Eighteen departments of Government of Uttar Pradesh fall under the Economic Sector. The trend of expenditure of major departments under the Economic Sector during 2015-16 to 2017-18 is given in following Table.

Audit Report on Economic Sector and Public Sector Undertakings for the year ended 31 March 2018
xvi
Table: Trend of Expenditure of major departments under the Economic Sector
(` in crore) Department 2015-16 2016-17 2017-18
Energy 48,218.81 33,976.694 17,265.505 Infrastructure and Industrial Development Department 3,080.27 6,296.116 1,740.567 Housing and Urban Planning 2,213.97 2,888.06 723.398 Revenue (Except Collectorate) 2,495.16 2,721.56 2,987.80 Forest 840.46 1,231.72 808.219 Source: Appropriation Accounts of respective years
(Paragraph 6.2)
Chapter-VII: Compliance Audit Observations relating to Departments and Entities (other than Public Sector Undertakings) under Economic Sector
Compliance Audit observations included in this Chapter highlight deficiencies in the management of Departments and Entities under Economic Sector which resulted in serious financial implications. The irregularities pointed out are as follows: The Housing and Urban Planning Department extended undue benefit
to the developers by altering the land use indicated in the Master Plan without levy of land use conversion charges, which resulted in undue benefit of ` 572.48 crore to the Hi-tech Township Developers at the cost of Ghaziabad Development Authority.
(Paragraph 7.1.1)
The Ghaziabad Development Authority failed to levy additional land use conversion charges on the increase in net area of land resulting not only in undue favour to the Hi-tech Township Developer, but also loss to the Authority to the extent of ` 6.83 crore.
(Paragraph 7.1.2)
The Ghaziabad Development Authority failed to initiate action for revision of City Development Charges on the basis of prevalent cost index and its recovery which resulted in loss of ` 18.91 crore.
(Paragraph 7.1.3) The Ghaziabad Development Authority short levied land use conversion
charges on Police City Sahkari Samiti amounting to ` 10.91 crore.
(Paragraph 7.2)
4 ̀ 24,232.47 crore spent on Ujwal DISCOM Assurance Yojana (UDAY) in 2015-16 and
` 14,801.29 crore in 2016-17. 5 Reduction in expenditure during 2017-18 was mainly due to decrease in power subsidy,
capital expenditure and loans for power projects. 6 ̀ 2,882.25 crore released for Purvanchal Expressway in 2016-17. 7 Reduction in expenditure during 2017-18 was mainly due to decrease in capital expenditure
on roads and bridges. 8 Reduction in expenditure during 2017-18 was mainly due to decrease in expenditure
on urban development, other general economic services; capital expenditure on education, sports, arts & culture, housing and urban development and decrease in loans for urban development.
9 Reduction in expenditure during 2017-18 was mainly due to decrease in capital expenditure on forestry and wildlife.
Overview
xvii
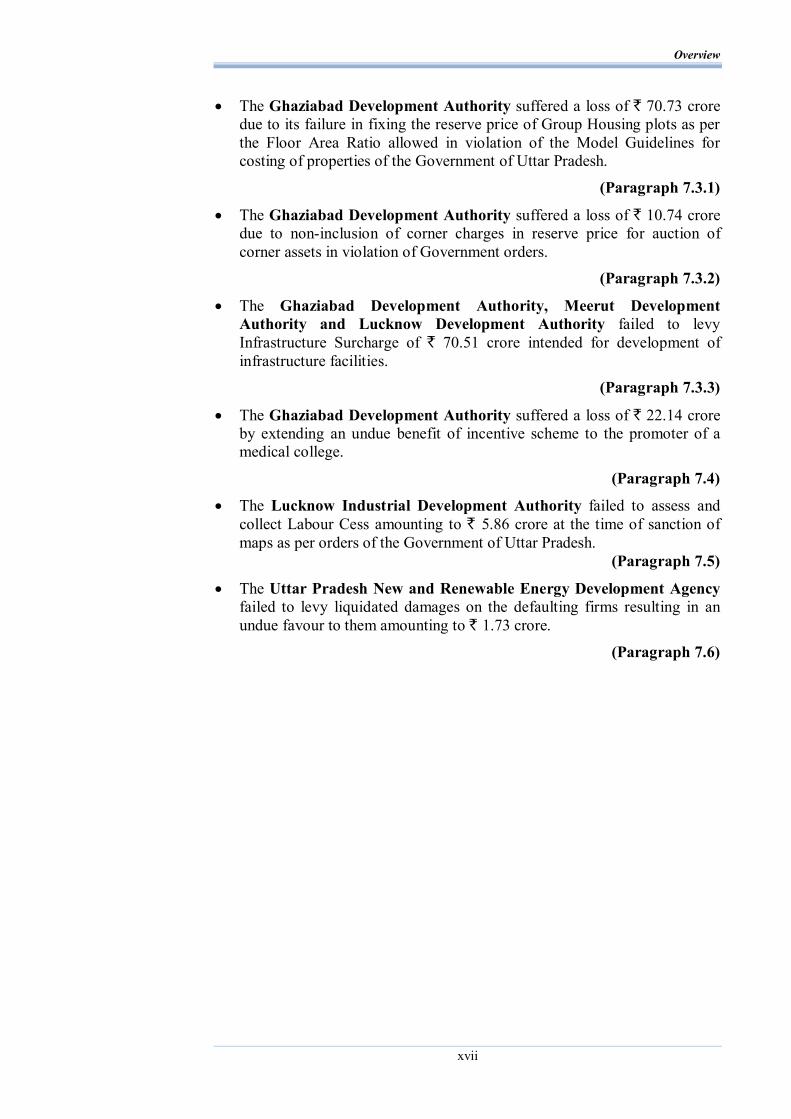
The Ghaziabad Development Authority suffered a loss of ` 70.73 crore due to its failure in fixing the reserve price of Group Housing plots as per the Floor Area Ratio allowed in violation of the Model Guidelines for costing of properties of the Government of Uttar Pradesh.
(Paragraph 7.3.1)
The Ghaziabad Development Authority suffered a loss of ` 10.74 crore due to non-inclusion of corner charges in reserve price for auction of corner assets in violation of Government orders.
(Paragraph 7.3.2)
The Ghaziabad Development Authority, Meerut Development Authority and Lucknow Development Authority failed to levy Infrastructure Surcharge of ` 70.51 crore intended for development of infrastructure facilities.
(Paragraph 7.3.3)
The Ghaziabad Development Authority suffered a loss of ` 22.14 crore by extending an undue benefit of incentive scheme to the promoter of a medical college.
(Paragraph 7.4)
The Lucknow Industrial Development Authority failed to assess and collect Labour Cess amounting to ` 5.86 crore at the time of sanction of maps as per orders of the Government of Uttar Pradesh.
(Paragraph 7.5)
The Uttar Pradesh New and Renewable Energy Development Agency failed to levy liquidated damages on the defaulting firms resulting in an undue favour to them amounting to ` 1.73 crore.
(Paragraph 7.6)

PART-A Public Sector Undertakings (PSUs)

Introduction Functioning of State Public Sector Undertakings General
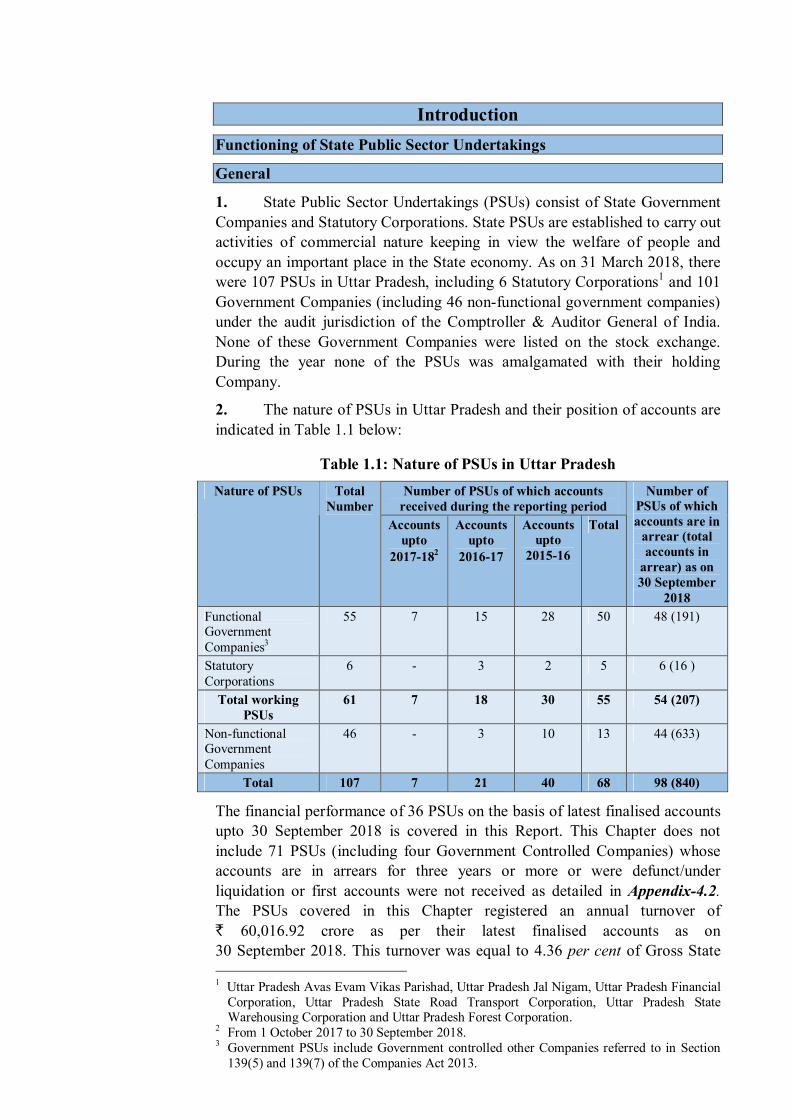
1. State Public Sector Undertakings (PSUs) consist of State Government Companies and Statutory Corporations. State PSUs are established to carry out activities of commercial nature keeping in view the welfare of people and occupy an important place in the State economy. As on 31 March 2018, there were 107 PSUs in Uttar Pradesh, including 6 Statutory Corporations1 and 101 Government Companies (including 46 non-functional government companies) under the audit jurisdiction of the Comptroller & Auditor General of India. None of these Government Companies were listed on the stock exchange. During the year none of the PSUs was amalgamated with their holding Company.
2. The nature of PSUs in Uttar Pradesh and their position of accounts are indicated in Table 1.1 below:
Table 1.1: Nature of PSUs in Uttar Pradesh Number of PSUs of which accounts
received during the reporting period Nature of PSUs Total
Number Accounts
upto 2017-182
Accounts upto
2016-17
Accounts upto
2015-16
Total
Number of PSUs of which accounts are in
arrear (total accounts in
arrear) as on 30 September
2018 Functional Government Companies3
55 7 15 28 50 48 (191)
Statutory Corporations
6 - 3 2 5 6 (16 )
Total working PSUs
61 7 18 30 55 54 (207)
Non-functional Government Companies
46 - 3 10 13 44 (633)
Total 107 7 21 40 68 98 (840)
The financial performance of 36 PSUs on the basis of latest finalised accounts upto 30 September 2018 is covered in this Report. This Chapter does not include 71 PSUs (including four Government Controlled Companies) whose accounts are in arrears for three years or more or were defunct/under liquidation or first accounts were not received as detailed in Appendix-4.2. The PSUs covered in this Chapter registered an annual turnover of ` 60,016.92 crore as per their latest finalised accounts as on 30 September 2018. This turnover was equal to 4.36 per cent of Gross State 1 Uttar Pradesh Avas Evam Vikas Parishad, Uttar Pradesh Jal Nigam, Uttar Pradesh Financial
Corporation, Uttar Pradesh State Road Transport Corporation, Uttar Pradesh State Warehousing Corporation and Uttar Pradesh Forest Corporation.
2 From 1 October 2017 to 30 September 2018. 3 Government PSUs include Government controlled other Companies referred to in Section
139(5) and 139(7) of the Companies Act 2013.

Audit Report on Economic Sector and Public Sector Undertakings for the year ended 31 March 2018
2
Domestic Product (GSDP) for the year 2017-18 (` 13,75,607 crore). The PSUs covered in this Chapter suffered a loss of ` 18,167.68 crore as per their latest finalised accounts. As on March 2018, the State PSUs covered in this Report had employed around 78,436 employees. There are 46 non-functional PSUs which were non-functional having GoUP investment of ` 929.76 crore towards capital (` 462.98 crore) and long term loans (` 466.78 crore). This is a critical area as the investments in non-functional PSUs do not contribute to the economic growth of the State.
Accountability framework
3. The procedure for audit of Government companies are laid down in Sections 139 and 143 of the Companies Act, 2013 (Act 2013). According to Section 2 (45) of the Act 2013, a Government Company means any company in which not less than fifty one per cent of the paid-up share capital is held by the Central Government or by any State Government or Governments or partly by the Central Government and partly by one or more State Governments, and includes a company which is a subsidiary company of such a Government Company. Besides, any other company4 owned or controlled, directly or indirectly, by the Central Government, or by any State Government or Governments, or partly by the Central Government and partly by one or more State Governments are referred to in this Report as Government Controlled other Companies.
Comptroller & Auditor General of India (CAG) appoints the Statutory Auditors of a Government Company and Government Controlled Other Company under Section 139 (5) and (7) of the Companies Act, 2013. Section 139 (5) of the Companies Act, 2013 provides that the Statutory Auditors in case of a Government Company or Government Controlled Other Company are to be appointed by the CAG within a period of one hundred and eighty days from the commencement of the financial year. Section 139 (7) of the Companies Acts, 2013 provides that in case of a Government Company or Government Controlled Other Company, the first auditors are to be appointed by the CAG within sixty days from the date of registration of the company and in case CAG does not appoint such auditor within the said period, the Board of Directors of the Company or the members of the Company have to appoint such auditor. Further, as per sub-Section 7 of Section 143 of the Act 2013, the Comptroller and Auditor General of India (CAG) may, in case of any company covered under sub-Section (5) or sub-Section (7) of Section 139, if considered necessary, by an order, cause test audit to be conducted of the accounts of such Company and the provisions of Section 19A of the Comptroller and Auditor General’s (Duties, Powers and Conditions of Service) Act, 1971 shall apply to the report of such test Audit. Thus, a Government Company or any other Company owned or controlled, directly or indirectly, by the Central Government, or by any State Government or Governments or partly by Central Government and partly by one or more State Governments is subject to audit by the CAG. An audit of the financial statements of a Company in respect of
4 The Companies (Removal of Difficulties) Seventh Order 2014 dated 4 September 2014
issued by Ministry of Corporate Affairs, Government of India

Introduction: Functioning of State Public Sector Undertakings
3
the financial years that commenced on or before 31 March 2014 shall continue to be governed by the provisions of the Companies Act, 1956. Statutory Audit 4. The financial statements of the Government Companies (as defined in Section 2 (45) of the Act 2013) are audited by Statutory Auditors, who are appointed by the CAG as per the provisions of Section 139(5) or (7) of the Act 2013. The Statutory Auditors submit a copy of the Audit Report to the CAG including, among other things, financial statements of the Company under Section 143(5) of the Act 2013. These financial statements are also subject to supplementary audit by the CAG within sixty days from the date of receipt of the audit report under the provisions of Section 143(6) of the Act 2013. Audit of Statutory Corporations is governed by their respective legislations. Out of six Statutory Corporations, the CAG is sole auditor for four Statutory Corporations namely Uttar Pradesh Avas Evam Vikas Parishad, Uttar Pradesh Jal Nigam, Uttar Pradesh State Road Transport Corporation and Uttar Pradesh Forest Corporation. In respect of Uttar Pradesh State Warehousing Corporation and Uttar Pradesh Financial Corporation, the audit is conducted by Chartered Accountants and supplementary audit is conducted by the CAG.
Submission of accounts by PSUs
Need for timely finalisation and submission
5. According to Section 394 and 395 of the Companies Act 2013, Annual Report on the working and affairs of a Government Company, is to be prepared within three months of its Annual General Meeting (AGM) and as soon as may be after such preparation laid before the Houses or both the Houses of State Legislature together with a copy of the Audit Report and any comments upon or supplement to the Audit Report, made by the CAG. Almost similar provisions exist in the respective Acts regulating Statutory Corporations. This mechanism provides the necessary legislative control over the utilisation of public funds invested in the companies from the Consolidated Fund of the State.
Section 96 of the Companies Act, 2013 requires every company to hold AGM of the shareholders once in every calendar year. It is also stated that not more than 15 months shall elapse between the date of one AGM and that of the next. Further, Section 129 of the Companies Act, 2013 stipulates that the audited Financial Statement for the financial year has to be placed in the said AGM for their consideration. Section 129 (7) of the Companies Act, 2013 provides for levy of penalty like fine and imprisonment on the persons including directors of the company responsible for non-compliance with the provisions of Section 129 of the Companies Act, 2013.
Role of Government and Legislature
6. The State Government exercises control over the affairs of these PSUs through its administrative departments. The Chief Executive and Directors to the Board are appointed by the State Government.
The State Legislature also monitors the accounting and utilisation of Government investment in the PSUs. For this, the Annual Reports together
Audit Report on Economic Sector and Public Sector Undertakings for the year ended 31 March 2018
4
with the Statutory Auditors’ Reports and comments of the CAG, in respect of State Government Companies and Separate Audit Reports in case of Statutory Corporations are to be placed before the State Legislature under Section 394 of the Act 2013 or as stipulated in the respective Acts. The Audit Reports of the CAG are submitted to the Government under Section 19A of the CAG’s (Duties, Powers and Conditions of Service) Act, 1971.
Investment by Government of Uttar Pradesh in State Public Sector Undertakings (PSUs)
7. The Government of Uttar Pradesh (GoUP) has high financial stakes in the PSUs. This is of mainly three types:
Share capital and loans – In addition to the share capital contribution, GoUP also provides financial assistance by way of loans to the PSUs from time to time.
Special financial support – GoUP provides budgetary support by way of grants and subsidies to the PSUs as and when required.
Guarantees – GoUP also guarantees the repayment of loans with interest availed by the PSUs from Financial Institutions.
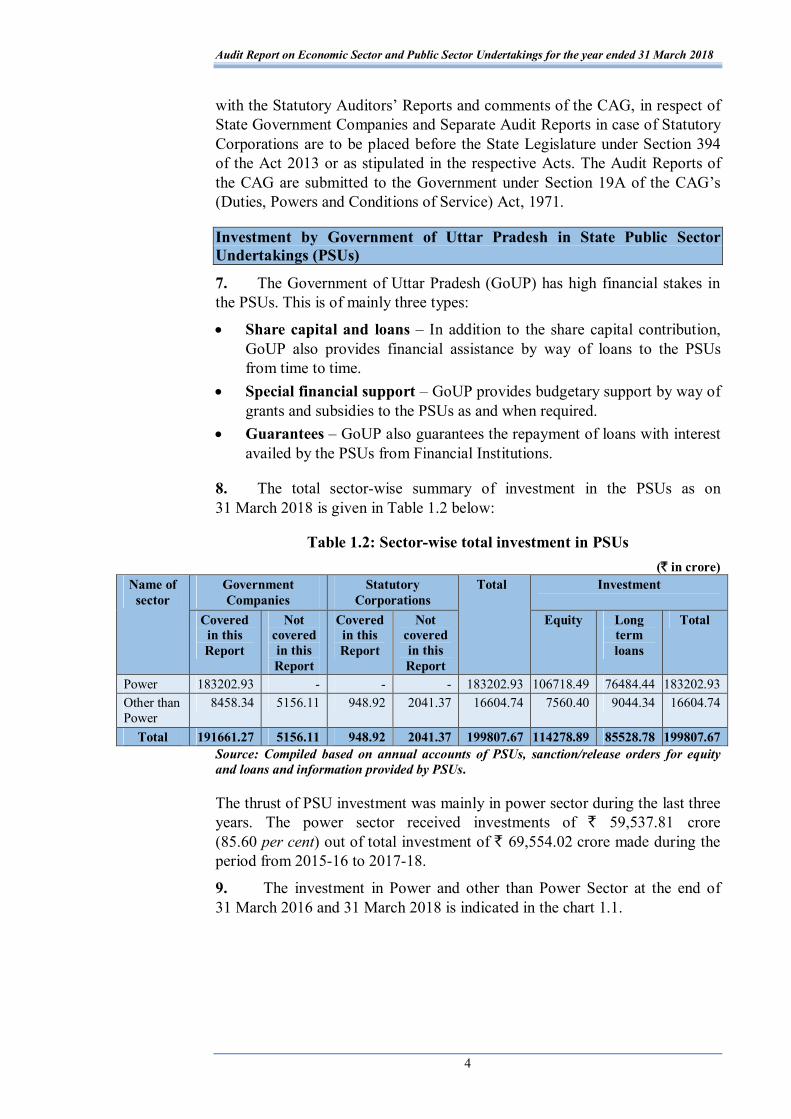
8. The total sector-wise summary of investment in the PSUs as on 31 March 2018 is given in Table 1.2 below:
Table 1.2: Sector-wise total investment in PSUs (` in crore)
Government Companies
Statutory Corporations
Investment
Name of sector
Covered in this Report
Not covered in this Report
Covered in this Report
Not covered in this Report
Total
Equity Long term loans
Total
Power 183202.93 - - - 183202.93 106718.49 76484.44 183202.93 Other than Power
8458.34 5156.11 948.92 2041.37 16604.74 7560.40 9044.34 16604.74
Total 191661.27 5156.11 948.92 2041.37 199807.67 114278.89 85528.78 199807.67 Source: Compiled based on annual accounts of PSUs, sanction/release orders for equity and loans and information provided by PSUs.
The thrust of PSU investment was mainly in power sector during the last three years. The power sector received investments of ` 59,537.81 crore (85.60 per cent) out of total investment of ` 69,554.02 crore made during the period from 2015-16 to 2017-18.
9. The investment in Power and other than Power Sector at the end of 31 March 2016 and 31 March 2018 is indicated in the chart 1.1.

Introduction: Functioning of State Public Sector Undertakings
5
Chart 1.1: Sector-wise investment in PSUs (Figures ` in crore)
Keeping in view the huge investment in Power Sector, we are presenting the results of audit of 15 Power Sector PSUs in Part-I5 and of 92 PSUs (other than Power Sector) in Part-II6 of Part-A of the Report.
5 The Part-I includes Chapter-I (Functioning of Power Sector undertakings), Chapter-II
(Audit on “Construction of new sub-stations and augmentation of capacity of the existing sub-stations by the Uttar Pradesh Power Transmission Corporation Limited”) and Chapter-III (Compliance Audit Observations relating to Power Sector undertakings).
6 The Part-II includes Chapter-IV (Functioning of PSUs other than Power Sector) and Chapter-V (Compliance Audit Observations relating to PSUs other than Power Sector).

PART-I Power Sector Undertakings


CHAPTER–I Functioning of Power Sector
Undertakings


PART I
Chapter I
Functioning of Power Sector Undertakings
Introduction
1.1 The Power Sector Undertakings play an important role in the economy of the State. Apart from providing a critical infrastructure required for development of the State’s economy, the sector also adds significantly to the GDP of the State. A ratio of Power Sector PSUs’ turnover to Gross State Domestic Product (GSDP) shows the extent of activities of PSUs in the State economy. The Table 1.1 below provides the details of turnover of the Power Sector Undertakings and GSDP of Uttar Pradesh for a period of four years ending March 20181:
Table 1.1: Details of turnover of Power Sector Undertakings vis-a-vis GSDP of Uttar Pradesh
(` in crore) Particulars 2014-15 2015-16 2016-17 2017-18
Turnover 40235.18 46976.70 54132.11 52291.64 Percentage change in turnover as compared to turnover of preceding year
- 16.76 15.23 -3.40
GSDP of Uttar Pradesh 1011790 1137210 1250213 1375607 Percentage change in GSDP as compared to GSDP of preceding year
- 12.40 9.94 10.03
Percentage of Turnover to GSDP of Uttar Pradesh
3.98 4.13 4.33 3.80
Source: Compiled based on Turnover figures of power sector PSUs and GSDP figures issued by Ministry of Statistics and Programme Implementation, Government of India.
The turnover of Power Sector Undertakings has increased in the years 2015-16 and 2016-17 but decreased in the year 2017-18 from the turnover of its previous year. The increase/decrease ranged between (-) 3.40 per cent and 16.76 per cent during the period 2015-18, whereas GSDP of Uttar Pradesh has recorded continuous increase during the same period ranging between 9.94 per cent and 12.40 per cent. The compounded annual growth2 of GSDP was 10.78 per cent during the last three years. The compounded annual growth is a useful method to measure growth rate over multiple time periods. Against the compounded annual growth of 10.78 per cent of the GSDP, the turnover of Power Sector Undertakings recorded lower compounded annual growth of 9.13 per cent during last three years. This resulted in decrease in share of turnover of these power sector undertakings to the GSDP from 3.98 per cent in the year 2014-15 to 3.80 per cent in the year 2017-18.
1 As per latest finalised accounts till of 30 September 2018. 2 Rate of Compounded Annual Growth [{(Value of 2017-18/Value of 2014-15)^(1/3 years)}-
1]*100.

Audit Report on Economic Sector and Public Sector Undertakings for the year ended 31 March 2018
8
Formation of Power Sector Undertakings 1.2 To make energy sector commercially viable, Government of Uttar Pradesh (GoUP) restructured (January 2000) erstwhile Uttar Pradesh State Electricity Board (UPSEB) and formed Uttar Pradesh Power Corporation Limited (UPPCL) under the Companies Act, 1956 and the distribution business of Kanpur Electricity Supply Authority (KESA) zone was transferred to Kanpur Electricity Supply Company Limited (KESCo), as wholly owned subsidiary company of UPPCL. Thermal and hydro generation functions were vested to the existing PSUs namely, Uttar Pradesh Rajya Vidyut Utpadan Nigam Limited (UPRVUNL) and Uttar Pradesh Jal Vidyut Nigam Limited (UPJVNL). Transmission and distribution functions of UPSEB were transferred to the newly created PSUs namely, UPPCL and KESCO and all the assets and liabilities of UPSEB (including equity of ` 5,554.96 crore3 and loan of ` 2,709.78 crore) were distributed among these four PSUs. Further in August 2003 the distribution business of UPPCL was transferred to subsidiary companies viz. Madhyanchal Vidyut Vitran Nigam Limited, Lucknow (MVVNL), Paschimanchal Vidyut Vitran Nigam Limited, Meerut (PVVNL), Purvanchal Vidyut Vitran Nigam Limited, Varanasi (PuVVNL) and Dakshinanchal Vidyut Vitran Nigam Limited, Agra (DVVNL) (known as DISCOMs-subsidiaries of UPPCL).
Further, Uttar Pradesh Power Transmission Corporation Limited (UPPTCL) was incorporated in July, 2006. Subsequently, in December, 2010, the GoUP notified the Uttar Pradesh Electricity Reforms (Transfer of Transmission and related activities including the assets, liabilities) Scheme, 2010, for the purpose of transfer of the transmission activities from UPPCL to UPPTCL with effect from April 2007. From this date UPPCL and UPPTCL started working as separate entities for purchase/sale of bulk power and transmission work respectively.
In addition to above, four PSUs namely UPSIDC Power Company Limited, subsidiary of Uttar Pradesh State Industrial Development Corporation (UPSIDC)4 (incorporated with effect from 11.04.2000), Sonebhadra Power Generation Company Limited (SPGCL), subsidiary of UPPCL (incorporated with effect from 14.02.2007), Jawaharpur Vidyut Utpadan Nigam Limited (JVUNL), subsidiary of UPRVUNL (incorporated with effect from 04.09.2009),Yamuna Power Generation Company Limited (YPGCL), associate of UPPCL (incorporated with effect from 20.04.2010) were formed for the purpose of generation of power. Similarly, Southern UP Power Transmission Company Limited (SUPPTCL) (incorporated with effect from 08.08.2013), subsidiary of UPPCL was formed to carry out business of transmission. Besides, one more company namely UCM Coal Company Limited (incorporated with effect from 16.10.2008), joint venture of UPRVUNL was formed for the purpose of extraction of coal and sale of coal to State Power Utilities. Thus, there were 15 Power Sector Undertakings in the State as on 31 March 2018. Of these 15 Power Sector Undertakings, three PSUs5 were 3 Accumulated losses was nil at the time of unbundling of UPSEB. 4 A non-power company established for the purpose of industrial development 5 Sonebhadra Power Generation Company Limited, Yamuna Power Generation Company
Limited, Southern UP Power Transmission Company Limited,

Chapter–I: Functioning of Power Sector Undertakings
9
non-functional and three PSUs6 did not commence commercial activities till 2017-187.
Disinvestment, restructuring and privatisation of Power Sector Undertakings
1.3 Two PSUs namely Western Uttar Pradesh Power Transmission Company Limited and South East UP Power Transmission Company Limited have been placed under private ownership with effect from 22 September 2011 and 16 December 2011 respectively through share purchase agreements.
Investment in Power Sector Undertakings
1.4 The activity-wise summary of investment in the Power Sector Undertakings as on 31 March 2018 is given in Table 1.2 below:
Table 1.2: Activity-wise investment in Power Sector Undertakings as on 31 March 2018
Investment (` in crore)
Activity Number of Power Sector Undertakings Equity Long Terms
Loans Total
Generation of Power 6 11232.29 10493.34 21725.63 Transmission of Power 2 12494.47 10764.46 23258.93 Distribution of Power 68 82991.57 55225.45 138217.02 Others 1 0.16 1.19 1.35 Total 15 106718.49 76484.44 183202.93 Source: Compiled figures based on Annual Accounts and Government orders.
As on 31 March 2018, the total investment (equity and long term loans) in 15 Power Sector Undertakings was ` 1,83,202.93 crore. The investment consisted of 58.25 per cent towards equity and 41.75 per cent in long terms loans.
The long term loans advanced by the State Government constituted 12.88 per cent (` 9,848.09 crore) of the total long-term loans whereas 87.12 per cent (` 66,636.35 crore) of the total long term loans was availed from other financial institutions. Besides, during the years 2015-16 and 2016-17, the State Government has taken over ` 44,403.96 crore9 (75 per cent) of the outstanding debts (` 59,205.19 crore10) of the DISCOMs due to banks and financial institutions under Financial Restructuring Plan/Ujwal DISCOM Assurance Yojana (UDAY11) scheme.
6 Jawaharpur Vidyut Utpadan Nigam Limited, UCM Coal Company Limited and UPSIDC
Power Generation Company Limited. 7 As per latest finalised accounts till 30 September 2018. 8 Including UPPCL (Holding Company). 9 It includes ` 39,133.77 crore taken over by State Government in 2015-16 and 2016-17 and
` 5,270.19 crore which has already been taken over by State Government under Financial Restructuring Plan (FRP)-2012during 2015-16.
10 Total debts of DISCOMs ` 59,205.19 crore which includes ` 53,935.06 crore outstanding as on 30.09.15 and bond of ` 5,270.19 crore already taken over under Financial Restructuring Plan (FRP)-2012 by State Government during 2015-16.
11 Scheme launched by Ministry of Power (MoP), Government of India (GoI) for financial and operational turnaround of DISCOMs.

Audit Report on Economic Sector and Public Sector Undertakings for the year ended 31 March 2018
10
Budgetary Support to Power Sector Undertakings
1.5 The Government of Uttar Pradesh (GoUP) provides financial support to Power Sector undertakings in various forms through annual budget. The summarised details of budgetary outgo towards equity, loans, grants/subsidies, loans written off and loans converted into equity during the year in respect of Power Sector Undertakings for the last three years ending March 2018 are given in Table 1.3 below: Table 1.3: Details of budgetary support to Power Sector Undertakings during last three
years ending March 2018
2015-16 2016-17 2017-18 Particulars12 No of
PSUs13 Amount
(` in crore)
No of PSU13
Amount (` in
crore)
No of PSUs13
Amount (` in
crore) Equity Capital outgo (i) 3 19078.43 3 12205.98 4 8234.53 Loans given (ii) 1 6083.12 1 3700.32 - 0.00 Grants/Subsidies provided (iii) 1 22385.92 1 14817.66 2 7593.19
Total Outgo (i+ii+iii) 314 47547.47 314 30723.96 414 15827.72 Loan repayment/ written off - - - - - -
Loans converted into equity - - - - - -
Guarantees Outstanding 3 35216.59 3 52791.17 3 57912.93 Guarantee Commitment 2 22489.05 2 62518.98 2 31488.20 Source: Compiled figures based on Annual Accounts, Government orders and information
received from PSUs. The chart depicting details of budgetary outgo towards equity, loans and grants/subsidies for the last three years ending March 2018 is given in chart 1.1:
Chart 1.1: Budgetary support towards Equity, Loans and Grants/Subsidies
12 Amount represents outgo from the State Budget only. 13 GoUP release equity to the UPPCL and UPRVUNL directly on behalf of their subsidiaries.
Therefore, for the purpose of infusion of Government’s fund, only holding companies on behalf of their subsidiaries have been considered. Remaining two Power Sector PSUs are UPPTCL and UPJVNL.
14 The figure represents number of PSUs which have received outgo from budget under one or more heads i.e. equity, loans, grants/subsidy.
Chapter–I: Functioning of Power Sector Undertakings
11
The budgetary assistance received by these PSUs during the year ranged between ` 15,827.72 crore and ` 47,547.47 crore during the period 2015-16 to 2017-18. The budgetary assistance of ` 15,827.72 crore received during the year 2017-18 included ` 8,234.53 crore and ` 7,593.19 crore in the form of equity and grants/subsidy respectively. Besides, the Ministry of Power (MoP), Government of India also launched (20 November 2015) UDAY Scheme for operational and financial turnaround of State owned Power Distribution Companies (DISCOMs). The provisions of UDAY and status of implementation of the scheme by five DISCOMs are discussed under Paragraph 1.20 of this Chapter.
In order to enable PSUs to obtain financial assistance from Banks and Financial Institutions, Government of Uttar Pradesh (GoUP) gives guarantee for which the guarantee commission is being charged at the rate of 0.25 per cent to one per cent as decided by the GoUP (15 September 2000) depending upon the loanees. Outstanding guarantee stood at ` 57, 912.93 crore in 2017-18. During the year 2017-18, guarantee commission of ` 10.14 crore was paid by the PSUs.
Reconciliation with Finance Accounts of Government of Uttar Pradesh
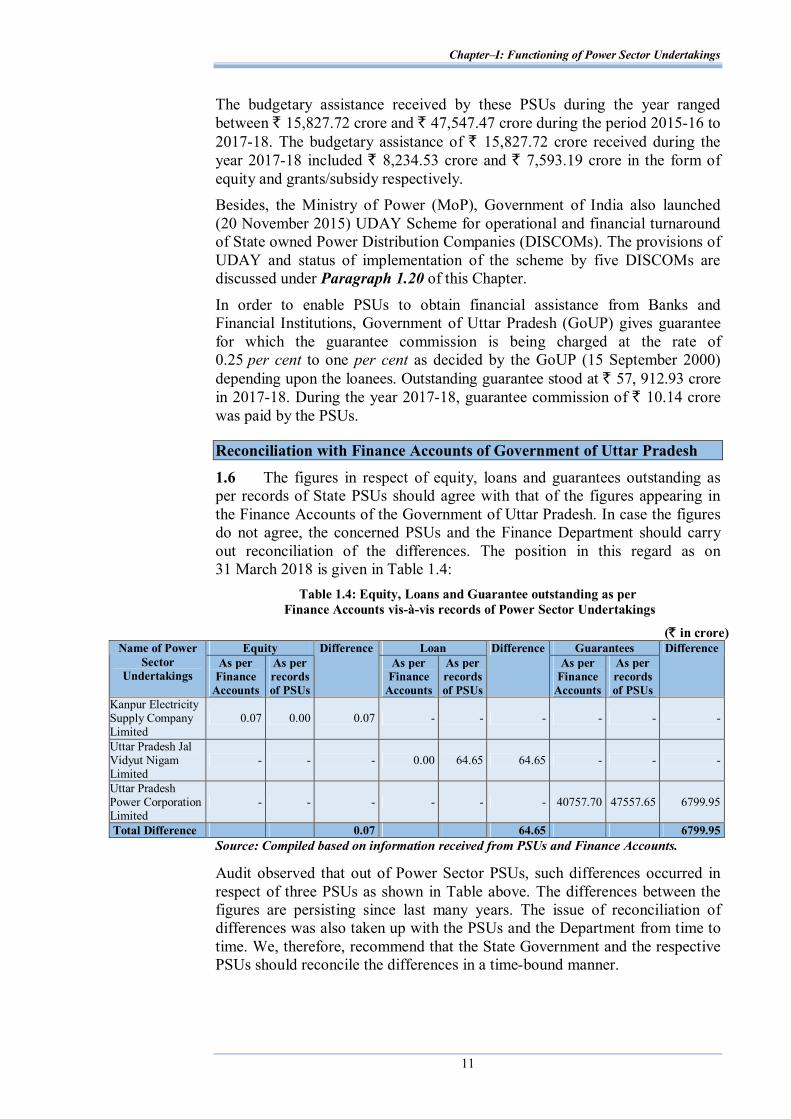
1.6 The figures in respect of equity, loans and guarantees outstanding as per records of State PSUs should agree with that of the figures appearing in the Finance Accounts of the Government of Uttar Pradesh. In case the figures do not agree, the concerned PSUs and the Finance Department should carry out reconciliation of the differences. The position in this regard as on 31 March 2018 is given in Table 1.4:
Table 1.4: Equity, Loans and Guarantee outstanding as per Finance Accounts vis-à-vis records of Power Sector Undertakings
(` in crore) Equity Loan Guarantees Name of Power
Sector Undertakings
As per Finance
Accounts
As per records of PSUs
Difference As per
Finance Accounts
As per records of PSUs
Difference As per
Finance Accounts
As per records of PSUs
Difference
Kanpur Electricity Supply Company Limited
0.07 0.00 0.07 - - - - - -
Uttar Pradesh Jal Vidyut Nigam Limited
- - - 0.00 64.65 64.65 - - -
Uttar Pradesh Power Corporation Limited
- - - - - - 40757.70 47557.65 6799.95
Total Difference 0.07 64.65 6799.95 Source: Compiled based on information received from PSUs and Finance Accounts.
Audit observed that out of Power Sector PSUs, such differences occurred in respect of three PSUs as shown in Table above. The differences between the figures are persisting since last many years. The issue of reconciliation of differences was also taken up with the PSUs and the Department from time to time. We, therefore, recommend that the State Government and the respective PSUs should reconcile the differences in a time-bound manner.

Audit Report on Economic Sector and Public Sector Undertakings for the year ended 31 March 2018
12
Submission of accounts by Power Sector Undertakings
Timeliness in preparation of accounts by Power Sector Undertakings 1.7 There were 15 Power Sector Undertakings under the audit purview of CAG as of 31 March 2018. Accounts for the year 2017-18 were submitted by only two working PSUs by 30 September 2018. Details of arrears in submission of accounts of Power Sector Undertakings as on 30 September of each financial year for the last three years ending 31 March 2018 are given in Table 1.5 below:
Table 1.5: Status of submission of accounts of Power Sector Undertakings
Sl. No. Particulars 2015-16 2016-17 2017-18
1. Number of PSUs 15 15 15 2. Number of accounts due 42 48 43
3. Number of accounts submitted during current year 9 20 21
4. Number of PSUs which finalised accounts for the current year
0 1 2
5. Number of previous year accounts finalised during current year
9 19 19
6. Number of PSUs with arrears in accounts 15 14 13
7. Number of accounts in arrears 33 28 22
8. Extent of arrears One to Five Years
One to Three Years
One to Four Years
Source: Compiled based on accounts of PSUs received during the period October 2015 to September 2018
Of these 15 Power Sector PSUs, 14 PSUs had finalised 21 annual accounts during the period 1 October 2017 to 30 September 2018 which included two annual accounts for the year 2017-18 and 19 annual accounts for previous years. Further, 22 annual accounts of 13 PSUs were in arrears.
The GoUP had provided ` 45,077.29 crore (Equity: ` 18,966.12 crore, Loan: ` 3,700.32 crore, Grant: ` 9,801.82 crore and Subsidy: ` 12,609.03 crore) during 2016-17 and 2017-18 to eight of the 13 Power Sector PSUs accounts of which were in arrears by 30 September 2018, whereas no investment was made by GoUP in the remaining five PSUs during the period for which accounts were in arrears as detailed in Appendix-1.3.
The administrative departments have the responsibility to oversee the activities of these PSUs and to ensure that the accounts are finalised and adopted by these PSUs within the stipulated period. The concerned departments were informed regularly regarding arrears in accounts.
Impact of non-finalisation of accounts of State Power Sector PSUs 1.8 Delay in finalisation of accounts may also result in risk of fraud and leakage of public money apart from violation of the provisions of the Companies Act, 2013. In view of the above status of arrears of accounts, the actual performance including loss incurred/profit earned and contribution of these 13 State Power Sector PSUs to State GDP during the period of arrear of accounts could not be ascertained/reported to the State Legislature. In the absence of finalisation of accounts by these PSUs and their subsequent audit, it

Chapter–I: Functioning of Power Sector Undertakings
13
could not be ensured whether the investments made and expenditure incurred had been properly accounted for and the funds were utilised for the purpose for which these were provided by the State Government. It is, therefore, recommended that the administrative departments should strictly monitor and issue necessary directions to liquidate the arrears in accounts. The Government may also look into the constraints in preparing the accounts of the PSUs and take necessary steps to liquidate the arrears in accounts.
Performance of Power Sector Undertakings
1.9 The financial position and working results of 15 Power Sector Undertakings as per their latest finalised accounts as of 30 September 2018 are detailed in Appendix-1.1.
The Public Sector Undertakings are expected to yield reasonable return on investment made by Government in the undertakings. The total investment of State Government and others in the Power Sector PSUs as on 31 March 2018 was ` 1,83,202.93 crore consisting of ` 1,06,718.49 crore as equity and ` 76,484.44 crore as long term loans as detailed in Appendix-1.2. Out of this, Government of Uttar Pradesh has investment of ` 1,16,566.12 crore in four Power Sector PSUs15 consisting of equity of ` 1,06,718.03 crore and long term loans of ` 9,848.09 crore. The year wise status of investment of GoUP in the form of equity and long term loans in the Power Sector PSUs during the period 2015-16 to 2017-18 is depicted in chart-1.2 as below:
Chart 1.2: Total investment of GoUP in Power Sector Undertakings
The profitability of a company is traditionally assessed through return on investment, return on equity and return on capital employed. Return on investment measures the profit or loss made in a fixed year relating to the amount of money invested in the form of equity and long term loans and is 15 GoUP released equity to the UPPCL and UPRVUNL directly on behalf of their
subsidiaries. Therefore, for the purpose of infusion of Government’s fund, only holding companies on behalf of their subsidiaries have been considered. Remaining two Power Sector PSUs are UPPTCL and UPJVNL.
Audit Report on Economic Sector and Public Sector Undertakings for the year ended 31 March 2018
14
expressed as a percentage of profit to total investment. Return on Equity is a measure of performance calculated by dividing net profit after tax by shareholders’ fund. Return on capital employed is a financial ratio that measures the company’s profitability and the efficiency with which its capital is used and is calculated by dividing company’s earnings before interest and taxes by capital employed
Return on Investment
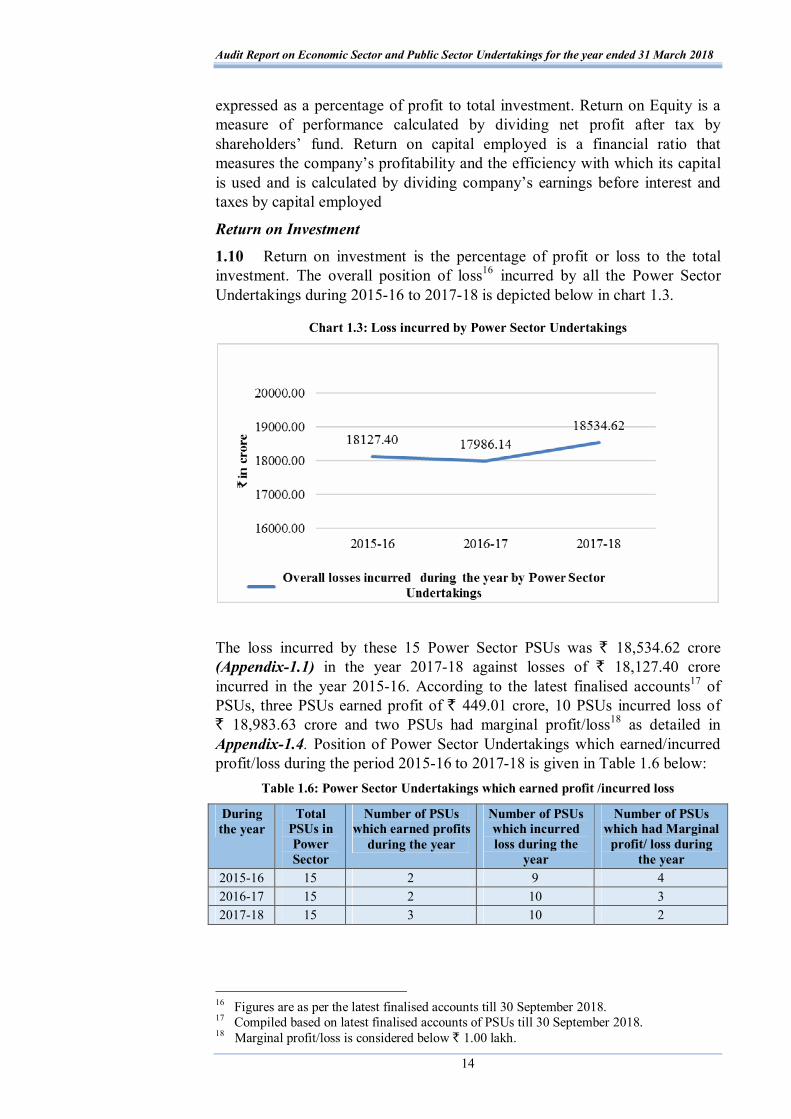
1.10 Return on investment is the percentage of profit or loss to the total investment. The overall position of loss16 incurred by all the Power Sector Undertakings during 2015-16 to 2017-18 is depicted below in chart 1.3.
Chart 1.3: Loss incurred by Power Sector Undertakings
The loss incurred by these 15 Power Sector PSUs was ` 18,534.62 crore (Appendix-1.1) in the year 2017-18 against losses of ` 18,127.40 crore incurred in the year 2015-16. According to the latest finalised accounts17 of PSUs, three PSUs earned profit of ` 449.01 crore, 10 PSUs incurred loss of ` 18,983.63 crore and two PSUs had marginal profit/loss18 as detailed in Appendix-1.4. Position of Power Sector Undertakings which earned/incurred profit/loss during the period 2015-16 to 2017-18 is given in Table 1.6 below:
Table 1.6: Power Sector Undertakings which earned profit /incurred loss
During the year
Total PSUs in Power Sector
Number of PSUs which earned profits
during the year
Number of PSUs which incurred loss during the
year
Number of PSUs which had Marginal
profit/ loss during the year
2015-16 15 2 9 4 2016-17 15 2 10 3 2017-18 15 3 10 2
16 Figures are as per the latest finalised accounts till 30 September 2018. 17 Compiled based on latest finalised accounts of PSUs till 30 September 2018. 18 Marginal profit/loss is considered below ` 1.00 lakh.

Chapter–I: Functioning of Power Sector Undertakings
15
Real Return on the basis of Present Value of Investment
1.11 In view of the significant investment by Government in all Power Sector Undertakings, return on such investment is essential from the perspective of State Government. The return on investment has been calculated after considering the Present Value of money to arrive at real return on investment made by GoUP in the 15 Power Sector Undertakings. PV of the State Government investment was computed where funds had been infused by the State Government in the form of equity, interest free/defaulted long term loans and Capital grants since finalisation of the balance sheets of these Power Sector Undertakings after unbundling of erstwhile Electricity Board (2000-01) till 31 March 2018.
The Present value (PV) of the State Government investment in Power Sector Undertakings was computed on the basis of following assumptions:
Interest free/defaulted long term loans and Capital Grants have been considered as investment infusion by the State Government. Further, in those cases where interest free loans given to the PSUs were later converted into equity, the amount of loan converted into equity has been deducted from the amount of interest free loans and added to the equity of that year. The funds made available in the form of revenue grants and subsidies have not been reckoned as investment. However, the effect of grant received under UDAY Scheme, has been shown separately.
The average rate of interest on government borrowings for the concerned financial year19 was adopted as discount rate for arriving at Present Value since they represent the cost incurred by the government towards investment of funds for the year.
For the period 2015-16 to 2017-18 when the nine to 10 PSUs incurred losses, a more appropriate measure of performance is the erosion of net worth due to the losses. The erosion of net worth of the company is commented upon in Paragraph 1.13.
1.12 The position of State Government investment in the Power Sector Undertakings in the form of equity, loans and capital grants since inception of these PSUs till 31 March 2018 is indicated in Appendix-1.5 and the consolidated position of the PV of the State Government investment relating to them since 2000-01 till 31 March 2018 is indicated in Table 1.7.
19 The average rate of interest on government borrowings was adopted from the Reports of
the C&AG of India on State Finances (Government of Uttar Pradesh) for the concerned year wherein the calculation for the average rate for interest paid = Interest Payment/ [(Amount of previous year's Fiscal Liabilities + Current year's Fiscal Liabilities)/2]*100.

Audit Report on Economic Sector and Public Sector Undertakings for the year ended 31 March 2018
16
Table 1.7: Year wise details of investment by the State Government and present value (PV) of the Government funds from 2000-01 to 2017-18
(` in crore) Financial
year Present value of
total investment
at the beginning of
the year
Equity infused by the State
Government during the
year
Total of Interest
free/ defaulted Loans and
capital grants given by the State Government during the
year
Total investment during the
year
Average rate of
interest on Government borrowings (in per cent)
Total investment
at the end of the year
Present value of
total investment
at the end of the year
Minimum expected return to recover cost of
funds for the year
Total Earnings
for the year as
per Profit & Loss
Statement
i ii iii iv v = iii+iv
vi vii = ii+v viii = vii* (1+vi/100)
ix =vii * vi/100
x
up to 2000-01
6336.47 1842.26 8178.73 9.58 8178.73 8962.25 783.52
2001-02 8962.25 315.03 377.96 692.99 9.49 9655.24 10571.52 916.28 -1562.66 2002-03 10571.52 225.90 432.97 658.87 7.22 11230.39 12041.23 810.83 -1453.67 2003-04 12041.23 6051.30 -1532.61 4518.69 9.13 16559.92 18071.84 1511.92 -1420.28 2004-05 18071.84 906.80 381.33 1288.13 9.47 19359.97 21193.36 1833.39 -2404.25 2005-06 21193.36 794.60 157.73 952.33 6.49 22145.69 23582.94 1437.26 -3146.92 2006-07 23582.94 3113.53 25.00 3138.53 6.74 26721.47 28522.50 1801.03 -4288.59 2007-08 28522.50 7260.25 99.48 7359.73 6.43 35882.23 38189.46 2307.23 -7931.01 2008-09 38189.46 6222.34 315.94 6538.28 6.29 44727.74 47541.11 2813.37 -10585.24 2009-10 47541.11 5322.37 0.00 5322.37 6.16 52863.48 56119.87 3256.39 -8916.25 2010-11 56119.87 4383.52 -100.00 4283.52 6.67 60403.39 64432.30 4028.91 -8682.32 2011-12 64432.30 4314.36 -219.09 4095.27 6.62 68527.57 73064.10 4536.53 -11914.56 2012-13 73064.10 3825.53 17.00 3842.53 6.73 76906.63 82082.44 5175.82 -13151.15 2013-14 82082.44 6580.95 -352.48 6228.47 6.43 88310.91 93989.30 5678.39 -17719.95 2014-15 93989.30 11546.16 -16.69 11529.47 6.40 105518.77 112271.98 6753.20 -19110.96 2015-16 112271.98 19078.43 6083.12 25161.55 6.35 137433.53 146160.55 8727.03 -18127.40 2016-17 146160.55 12205.97 3775.32 15981.29 6.82 162141.84 173199.92 11058.07 -17986.14 2017-18 173199.92 8234.52 83.40 8317.92 6.54 181517.84 193389.10 11871.27 -18534.62
Total 106718.03 11370.64 118088.67
The balance of investment of the State Government in these 15 PSUs at the end of the year increased to ` 1,18,088.67 crore in 2017-18 from ` 8,178.73 crore (up to 2000-01) as the State Government made further investments in shape of equity (` 1,00,381.56 crore) and Interest free/defaulted Loans and capital grants (` 9,528.38 crore). The PV of investments of the State Government upto 31 March 2018 worked out to ` 1,93,389.10 crore.
It could be seen that total earnings for the year relating to these PSUs remained negative during the period 2000-01 to 2017-18 which indicates that these PSUs did not recover the cost of funds to the Government.
In case the defaulted Interest Bearing Loan (IBL) is not considered as investment, the balance of investment by the State Government in these PSUs at the end of the year will be ` 1,18,027.57 crore in 2017-2018 against ` 6,367.04 crore in 2000-01 as the State Government made further investments in form of equity (`1,00,381.56 crore) and interest free loans/capital grant (` 11,278.97 crore) during the period 2000-01 to 2017-2018. The PV of funds infused by the State Government up to 31 March 2018 will amount to ` 1,90,696.62 crore (Appendix-1.6).
Chapter–I: Functioning of Power Sector Undertakings
17
Further, the Government has also given grant of ` 12,166.24 crore in 2015-16 and ` 7,400.64 crore in 2016-17 to the DISCOMs under UDAY scheme for taking over the debts of these DISCOMs due to banks and financial institutions. If we consider this grant as investment of the State government, the return on investment would further get reduced.
Erosion of Net Worth
1.13 Net Worth means the sum total of the paid-up capital and free reserves and surplus minus accumulated losses and deferred revenue expenditure. Essentially it is a measure of what an entity is worth to the owners. A negative net worth indicates that the entire investment by the owners has been wiped out by accumulated losses and deferred revenue expenditure.
As on 31 March 2018 there were 15 PSUs with accumulated losses of ` 1,33,638.98 crore. Of the 15 PSUs, 10 PSUs incurred losses in the year 2017-18 amounting to ` 18,983.63 crore. Further, three PSUs had not incurred loss in the year 2017-18, even though, out of these, two PSUs had accumulated loss of ` 3,181.73 crore and one PSU had accumulated profit of ` 1,049.92 crore. Further, rest two PSUs out of 15 had marginal profit/loss during the year 2017-18.
Net Worth of 11 out of 15 PSUs had been completely eroded by accumulated loss and their Net Worth was negative. The Net Worth of these 11 PSUs was `-60,616.92 crore against equity investment of ` 72,834.76 crore in these PSUs as on 31 March 2018. However, out of 11 PSUs whose Net Worth had been eroded, one PSU namely KESCO had earned profit of ` 319.55 crore during the year 2017-18. (Appendix-1.1) Net Worth was less than half of their paid up capital in respect of one20 out of four21 PSUs, whose net worth was positive at the end 31 March 2018, indicating their potential financial sickness.
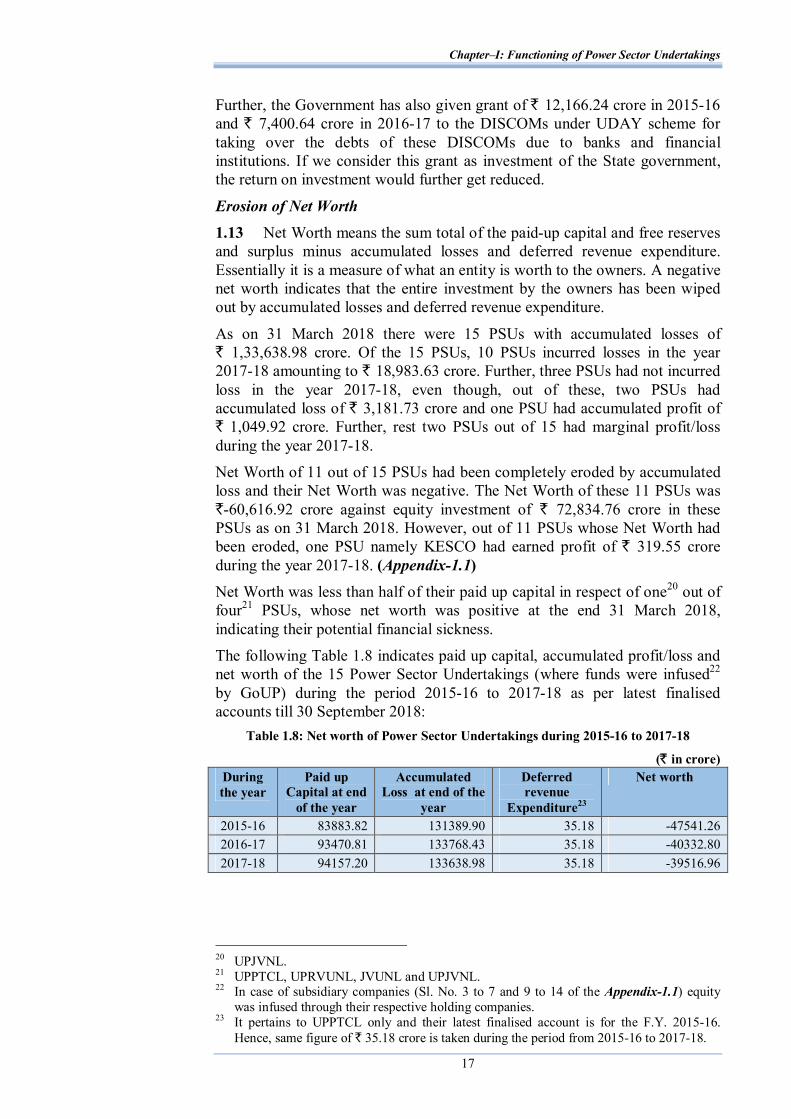
The following Table 1.8 indicates paid up capital, accumulated profit/loss and net worth of the 15 Power Sector Undertakings (where funds were infused22 by GoUP) during the period 2015-16 to 2017-18 as per latest finalised accounts till 30 September 2018:
Table 1.8: Net worth of Power Sector Undertakings during 2015-16 to 2017-18
(` in crore) During the year
Paid up Capital at end
of the year
Accumulated Loss at end of the
year
Deferred revenue
Expenditure23
Net worth
2015-16 83883.82 131389.90 35.18 -47541.26 2016-17 93470.81 133768.43 35.18 -40332.80 2017-18 94157.20 133638.98 35.18 -39516.96
20 UPJVNL. 21 UPPTCL, UPRVUNL, JVUNL and UPJVNL. 22 In case of subsidiary companies (Sl. No. 3 to 7 and 9 to 14 of the Appendix-1.1) equity
was infused through their respective holding companies. 23 It pertains to UPPTCL only and their latest finalised account is for the F.Y. 2015-16.
Hence, same figure of ` 35.18 crore is taken during the period from 2015-16 to 2017-18.
Audit Report on Economic Sector and Public Sector Undertakings for the year ended 31 March 2018
18
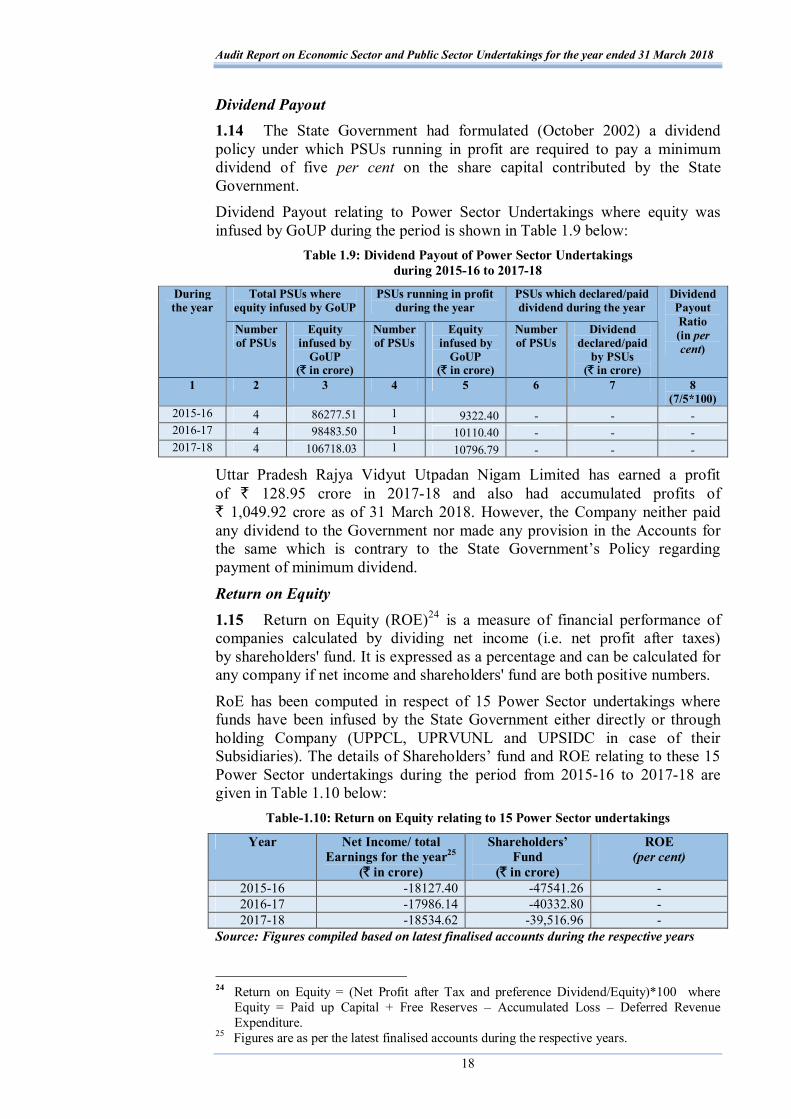
Dividend Payout 1.14 The State Government had formulated (October 2002) a dividend policy under which PSUs running in profit are required to pay a minimum dividend of five per cent on the share capital contributed by the State Government. Dividend Payout relating to Power Sector Undertakings where equity was infused by GoUP during the period is shown in Table 1.9 below:
Table 1.9: Dividend Payout of Power Sector Undertakings during 2015-16 to 2017-18
Total PSUs where equity infused by GoUP
PSUs running in profit during the year
PSUs which declared/paid dividend during the year
During the year
Number of PSUs
Equity infused by
GoUP (` in crore)
Number of PSUs
Equity infused by
GoUP (` in crore)
Number of PSUs
Dividend declared/paid
by PSUs (` in crore)
Dividend Payout Ratio (in per cent)
1 2 3 4 5 6 7 8 (7/5*100)
2015-16 4 86277.51 1 9322.40 - - - 2016-17 4 98483.50 1 10110.40 - - - 2017-18 4 106718.03 1 10796.79 - - -
Uttar Pradesh Rajya Vidyut Utpadan Nigam Limited has earned a profit of ` 128.95 crore in 2017-18 and also had accumulated profits of ` 1,049.92 crore as of 31 March 2018. However, the Company neither paid any dividend to the Government nor made any provision in the Accounts for the same which is contrary to the State Government’s Policy regarding payment of minimum dividend.
Return on Equity 1.15 Return on Equity (ROE)24 is a measure of financial performance of companies calculated by dividing net income (i.e. net profit after taxes) by shareholders' fund. It is expressed as a percentage and can be calculated for any company if net income and shareholders' fund are both positive numbers.
RoE has been computed in respect of 15 Power Sector undertakings where funds have been infused by the State Government either directly or through holding Company (UPPCL, UPRVUNL and UPSIDC in case of their Subsidiaries). The details of Shareholders’ fund and ROE relating to these 15 Power Sector undertakings during the period from 2015-16 to 2017-18 are given in Table 1.10 below:
Table-1.10: Return on Equity relating to 15 Power Sector undertakings
Year Net Income/ total Earnings for the year25
(` in crore)
Shareholders’ Fund
(` in crore)
ROE (per cent)
2015-16 -18127.40 -47541.26 - 2016-17 -17986.14 -40332.80 - 2017-18 -18534.62 -39,516.96 -
Source: Figures compiled based on latest finalised accounts during the respective years
24 Return on Equity = (Net Profit after Tax and preference Dividend/Equity)*100 where
Equity = Paid up Capital + Free Reserves – Accumulated Loss – Deferred Revenue Expenditure.
25 Figures are as per the latest finalised accounts during the respective years.

Chapter–I: Functioning of Power Sector Undertakings
19
As can be seen from the above Table, during the last three years period ending March 2018, the Net Income and shareholders’ fund were negative throughout the period. RoE in respect of 2015-16 to 2017-18 could not be worked out as shareholders’ fund was negative which indicates that the liabilities of these PSUs have exceeded the assets and instead of paying returns on the share capital, the accumulated losses have wiped out the entire share capital. Return on Capital Employed
1.16 Return on Capital Employed (ROCE) is a ratio that measures a company's profitability and the efficiency with which its capital is employed.
ROCE is calculated by dividing a company’s earnings before interest and taxes (EBIT) by the capital employed26. The details of ROCE of 15 Power Sector PSUs during the period from 2015-16 to 2017-18 are given in Table 1.11 below:
Table 1.11: Return on Capital Employed
During the year EBIT (` in crore)
Capital Employed (` in crore)
ROCE ( per cent)
2015-16 -10994.77 -10154.38 - 2016-17 -14909.94 18042.73 -82.64 2017-18 -15382.30 19064.81 -80.68
Source: Figures compiled based on latest finalised accounts till 30 September 2018
The ROCE of the Power Sector Undertakings ranged between -80.68 per cent and -82.64 per cent during the period 2016-17 to 2017-18. Further, ROCE was negative and unworkable during 2015-16 as both EBIT and Capital Employed were negative.
Analysis of Long term loans of the Power Sector Undertakings 1.17 The analysis of the long term loans of the companies which had leverage during 2015-16 to 2017-18 was carried out to assess the ability of the companies to service the debt owed by the companies to Government, banks and other financial institutions. This is assessed through the Interest Coverage Ratio.
Interest Coverage Ratio
1.18 Interest coverage ratio is used to determine the ability of a company to pay interest on outstanding debt and is calculated by dividing a company's earnings before interest and taxes (EBIT) by interest expenses of the same period. The lower the ratio, the lessor is the ability of the company to pay interest on debt. An interest coverage ratio of below one indicates that the company was not generating sufficient revenues to meet its expenses on interest. The details of interest coverage ratio of PSUs which had outstanding loans during the period from 2015-16 to 2017-18 are given in Table 1.12.
26 Capital employed = Paid up share capital + free reserves and surplus + long term loans –
accumulated losses - deferred revenue expenditure. Figures are as per the latest year for which accounts of the PSUs are finalised.

Audit Report on Economic Sector and Public Sector Undertakings for the year ended 31 March 2018
20
Table 1.12: Interest coverage ratio of the Power Sector PSUs having liability of interest on Long Term Loan
During the year
Interest (` in crore)
Earnings before
interest and tax
(` in crore)
Number of PSUs having
liability of interest on loans from
Government and Banks and other
financial institutions
Number of PSUs
having interest
coverage ratio more
than 1
Number of PSUs
having interest
coverage ratio less than 1
2015-16 7132.63 4451.41 8 2 6 2016-17 3076.20 536.48 8 2 6 2017-18 3152.32 63.61 8 2 6
It was observed that of the eight PSUs having liability of interest bearing loan during the period 2015-16 to 2017-18, two PSUs27 had interest coverage ratio of more than one whereas remaining six PSUs had negative/less than one interest coverage ratio. This indicates that these PSUs could not generate sufficient revenues to meet their expenses on interest during the period.
Age wise analysis of interest outstanding on State Government Loans 1.19 As on 31 March 2018, interest amounting to ` 204.18 crore in respect of one PSU was outstanding on the long term loans provided by GoUP. The age wise analysis of interest outstanding is depicted in Table 1.13 below:
Table No. 1.13: Age wise analysis of interest outstanding on State Government Loans
(` in crore) Name of PSU Outstanding
interest on loans Outstanding for less than 1 year
Outstanding for 1 to 3 years
Outstanding for more than 3 years
UP Jal Vidyut Nigam Limited
204.18 10.60 21.19 172.39
Assistance under Ujwal DISCOM Assurance Yojana (UDAY)
1.20 The MoP, Government of India launched (20 November 2015) Ujwal DISCOM Assurance Yojana (UDAY Scheme) for operational and financial turnaround of State owned Power Distribution Companies (DISCOMs). As per provisions of UDAY Scheme, the participating States were required to undertake following measures for operational and financial turnaround of DISCOMs:
Scheme for improving operational efficiency 1.20.1 The participating States were required to undertake various targeted activities like compulsory feeder and Distribution Transformer (DT) metering, consumer indexing and GIS mapping of losses, upgrading or changing transformers and meters, smart metering of all consumers consuming above 200 units per month, Demand Side Management (DSM) through energy efficient equipment, quarterly revision of tariff, comprehensive Information, Education and Communication (IEC) campaign to check theft of power, assure increased power supply in areas where the AT&C losses have been reduced for improving the operational efficiencies. The timeline prescribed for these targeted activities were also required to be followed so as to ensure achievement of the targeted benefits viz. ability to track losses at feeder and
27 KESCO and UPRVUNL.

Chapter–I: Functioning of Power Sector Undertakings
21
DT level, identification of loss making areas, reduce technical losses and minimise outages, reduce power theft and enhance public participation for reducing the theft, reduce peak load and energy consumption etc. The outcomes of operational improvements were to be measured through indicators viz reduction in gap between average cost of supply and average revenue realised to zero by 2018-19, reduction of AT&C losses to 15 per cent in 2018-19 as per loss reduction trajectory finalised by the MoP and States. Further, In Tripartite Memorandum of Understanding which was executed (30 January 2016) amongst MoP, Government of India, GoUP and UPPCL, target for reduction of AT&C losses to 19.36 per cent by Financial Year 2018-19 was fixed.
Scheme for financial turnaround 1.20.2 The participating States were required to take over 75 per cent of DISCOMs debt as on 30 September 2015 over two years i.e. 50 per cent in 2015-16 and 25 per cent in 2016-17. The scheme for financial turnaround inter alia provided that:
State will issue ‘Non Statutory Liquidity Ratio (Non-SLR) bonds’ and the proceeds realised from issue of such bonds shall be transferred to the DISCOMs which in turn shall discharge the corresponding amount of Banks/FIs debt. The bonds so issued will have a maturity period of 10-15 years with a moratorium on repayment of principal upto five years.
Debt of DISCOMs will be taken over in the priority of debt already due, followed by debt with higher cost.
The transfer to the DISCOMs by the State in 2015-16 and 2016-17 will be as a grant which can be spread over three years with the remaining transfer through State loan to DISCOMs. In exceptional cases, 25 per cent of grant can be given as equity.
Implementation of the UDAY Scheme 1.20.3 The status of implementation of the UDAY scheme is detailed below:
A. Achievement of operational parameters The achievements vis-a-vis targets under UDAY scheme regarding different operational parameters relating to the five State DISCOMs are given in Table 1.14:
Table-1.14: Parameter wise achievements vis-a-vis targets of operational performance upto March 2019
Parameter of UDAY Scheme Target under UDAY Scheme
Status under UDAY Scheme
Achievement (in per cent)
Feeder metering (in Nos.) 16072 19238 119.70 Metering at Distribution Transformers (in Nos.)
382460 111959 29.27
Feeder Segregation (in Nos.) 10564 1751 16.58 Rural Feeder Audit (in Nos.) 9722 19322 198.75 Electricity to unconnected household (in lakh Nos.)
184.56 64.90 35.16
Smart metering above 200 and up to 500kWH (Nos. in lakh)
9.37 1.22 13.02
Distribution of LED UJALA (in lakh Nos.)
264.53 266.11 100.60

Audit Report on Economic Sector and Public Sector Undertakings for the year ended 31 March 2018
22
Parameter of UDAY Scheme Target under UDAY Scheme
Status under UDAY Scheme
Achievement (in per cent)
AT&C Losses (in per cent) 19.36 24.64 Not achieved ACS-ARR Gap (` per unit) 0.22 0.22 100.00 Net Income or Profit/Loss including subsidy (` in crore)
-2613.70 -2575.87 100.00
Source: Information provided by the PSUs.
On the basis of above data, it is evident that the performance of DISCOMs was not up to the mark in areas of metering at distribution transformers, feeder segregation, electricity to unconnected households, smart metering and AT&C losses. According to the Ministry of Power, Government of India, the State of Uttar Pradesh stood at seventh position28 amongst all the States on the basis of overall achievements made by State DISCOMs under UDAY Scheme upto 30 June 2019. B. Implementation of Financial Turnaround 1.20.4 Memorandum of Understanding (MoU) was signed (30 January 2016) among the MoP, the GoUP and UPPCL on behalf of DISCOMs. As per provisions of the UDAY Scheme and MoU, out of total outstanding debt (` 53,935.06 crore) pertaining to DISCOMs as on 30 September 2015, the GoUP took over total debt of ` 39,133.76 crore during the period 2015-16 and 2016-17 by providing equity of ` 9,783.44 crore, grant of ` 19,566.88 crore and loan of ` 9,783.44 crore as detailed in Table 1.15 below:
Table-1.15: Implementation of UDAY Scheme (` in crore)
Year Equity Investment Grant Loan Total 2015-16 6083.12 12166.24 6083.12 24332.48 2016-17 3700.32 7400.64 3700.32 14801.28
Total 9783.44 19566.88 9783.44 39133.76 Source: Information provided by the PSUs.
Besides, the GoUP provided subsidy of ` 409.93 crore during the year 2017-18 for meeting out the future financial losses.
Comments on Accounts of Power Sector Undertakings 1.21 Fourteen Power Sector Undertakings29 forwarded their 21 audited accounts to the Accountant General during 1 October 2017 to 30 September 2018. Of these, 18 accounts were selected for Supplementary Audit. The Audit Reports of Statutory Auditors and Supplementary Audit conducted by the CAG indicated that the qualities of accounts need to be improved substantially. The details of aggregate money value of the comments of Statutory Auditors and the CAG for the accounts of 2015-18 are given in Table 1.16.
28 As per latest quarterly ranking of States depicted at website of UDAY for the quarter
ended 30 June 2019. 29 One PSU namely UPSIDC Power Company Limited has not submitted its annual accounts
after 2013-14.

Chapter–I: Functioning of Power Sector Undertakings
23
Table-1.16: Impact of audit comments on Power Sector undertakings
2015-16 2016-17 2017-18 Sl. No.
Particulars No. of
accounts Amount
(` in crore)
No. of accounts
Amount (` in
crore)
No. of accounts
Amount (` in
crore) 1. Decrease in profit 2 3.02 2 4.21 1 3.99 2. Increase in profit - - - - - - 3. Increase in loss - - 5 292.89 4 956.51 4. Decrease in loss - - 2 13.37 1 2.97 5. Non-disclosure of
material facts 2 45.33 2 693.34 3 9.65
6. Errors of classification 1 10.67 6 256.52 4 37.47
Source: Compiled from comments of the Statutory Auditors and the C&AG in respect of Government PSUs.
During the year 2017-18, the Statutory Auditors had issued qualified opinion on three30 accounts. Compliance to the Accounting Standards by the PSUs remained poor as the Statutory Auditors pointed out 15 instances of non-compliance to the Accounting Standards in three Accounts.
Audit of “Construction of new sub-stations and augmentation of capacity of the existing sub-stations by the UPPTCL” and Compliance Audit Paragraphs 1.22 For Part-I of the Report of the Comptroller and Auditor General of India for the year ended 31 March 2018, Audit of “Construction of new sub-stations and augmentation of capacity of the existing sub-stations by Uttar Pradesh Power Transmission Corporation Limited” and four compliance audit paragraphs relating to Power Sector Undertakings were issued to the Principal Secretary of Energy Department, GoUP with request to furnish replies within two weeks. Replies of Audit of “Construction of new sub-stations and augmentation of capacity of the existing sub-stations by the Uttar Pradesh Power Transmission Corporation Limited” and three compliance audit paragraphs have been received from the State Government and suitably incorporated in the respective audit observations/paragraphs in succeeding chapter II and chapter III of this Report. Out of four compliance audit paragraphs valuing ` 13.26 crore, recovery of ` 10 crore has been made. The total financial impact of the Audit of “Construction of new sub-stations and augmentation of capacity of the existing sub-stations by the Uttar Pradesh Power Transmission Corporation Limited” is ` 549.42 crore.
Follow-up action on Audit Reports Replies outstanding 1.23 The Report of the Comptroller and Auditor General of India represents the culmination of the process of audit scrutiny. It is, therefore, necessary that they elicit appropriate and timely response from the Executive. The Finance Department, Government of Uttar Pradesh issued (June 1987) instructions to all Administrative Departments to submit replies/explanatory notes to Paragraphs/Performance Audits included in the Audit Reports of the CAG of India within a period of two to three months of their presentation to the State Legislature, in the prescribed format without waiting for any questionnaires
30 MVVNL 2014-15, UPJVNL 2014-15 and UPPCL 2014-15.

Audit Report on Economic Sector and Public Sector Undertakings for the year ended 31 March 2018
24
from the Committee on Public Undertakings (COPU). The position of explanatory notes not received is given in Table1.17 below:
Table-1.17: Explanatory notes not received (as on 30 September 2019) Year of the
Audit Report (Commercial/
PSUs)
Date of placement of Audit Report in the
State Legislature
Total Performance Audits (PAs) and Paragraphs in the
Audit Report
Number of PAs/ Paragraphs for which
explanatory notes were not received
PA Paragraphs PA Paragraphs 2011-12 16 September 2013 1 8 1 2 2012-13 20 June 2014 0 8 0 1 2013-14 17 August 2015 1 6 1 3 2014-15 8 March 2016 4 8 0 4 2015-16 18 May 2017 2 5 1 1 2016-17 7 February 2019 1 4 1 4
Total 9 39 4 15 Source: Information compiled by Audit
From the above, it could be seen that, out of 39 Paragraphs and nine Performance Audits, explanatory notes to 15 Paragraphs and four Performance Audits in respect of Energy Department, which were commented upon, were awaited (September 2019).
Discussion of Audit Reports by COPU 1.24 The status as on 30 September 2019 of Performance Audits and Paragraphs that appeared in Audit Reports (Commercial/PSUs) and on which discussion was completed by the COPU as on 30 September 2019 is given in Table 1.18 below:
Table-1.18: Performance Audits/Paragraphs appeared in Audit Reports vis-a-vis discussed as on 30 September 2019
Number of Performance Audits (PAs)/Paragraphs
Appeared in Audit Report PAs and Paragraphs on which discussion completed
Period of Audit Report
PAs Paragraphs PAs Paragraphs 1982-83 to 2010-11 62 439 25 210
2011-12 1 8 0 3 2012-13 0 8 0 2 2013-14 1 6 0 1 2014-15 4 8 1 3 2015-16 2 5 0 2 2016-17 1 4 0 0
Total 71 478 26 221 Source: Information compiled by Audit
Compliance to Reports of the Committee on Public Undertakings 1.25 The internal working rules of COPU do not provide for vetting of Action Taken Notes (ATNs) by the Principal Accountant General. Hence, the ATNs on the recommendations of COPU are furnished by the Departments to the Principal Accountant General, only at the time of discussion of ATNs by COPU. Therefore, the status of ATNs is not discussed here.
Recoveries at the instance of Audit
1.26 During the course of audit, recoveries of ` 55.14 crore pointed out in 17 cases in various public sector undertakings, were accepted. Against this, recoveries of ` 31.73 crore in 16 cases were effected during 1 April 2017 to 30 September 2019 as per the details given in Table 1.19.

Chapter–I: Functioning of Power Sector Undertakings
25
Table-1.19: Recoveries pointed out by audit and accepted/recovered by the public sector undertakings
Recoveries pointed out in Audit and accepted by the
Department during 1 April 2017 to
30 September 2019
Recoveries effected during
1 April 2017 to 30 September 2019
Department Particulars of recoveries
Number of cases
Amount involved
(` in crore)
Number of cases
Amount involved
(` in crore) Madhyanchal Vidyut Vitran Nigam Limited 4 7.21 4 7.21 Purvanchal Vidyut Vitran Nigam Limited 5 3.43 5 3.46 Paschimanchal Vidyut Vitran Nigam Limited 2 7.61 2 7.61 Dakshinanchal Vidyut Vitran Nigam Limited 2 0.57 2 0.50
Energy Department
Uttar Pradesh Power Transmission Corporation Limited
4 36.32 3 12.95
Total 17 55.14 16 31.73 Source: Information compiled by Audit


CHAPTER–II Audit observations relating to Power
Sector Undertakings


27
Chapter-II
Audit of “Construction of new substations and augmentation of capacity of the existing substations by the Uttar Pradesh Power Transmission Corporation Limited”
Introduction 2.1 Transmission of electricity is defined as bulk transfer of power over long distances at high voltages, generally at 132 KV and above. Electric power generated at relatively low voltages in the power generating plants is stepped up to high voltage power before the same is transmitted through transmission lines. The substations (SSs) are facilities within the high voltage electric system (transmission system) used for stepping-up/stepping down voltages from one level to another and connecting the electric systems of the distribution companies (DISCOMs) with the generation systems. A robust and integrated power transmission system is therefore a pre-requisite for achieving the objective of ensuring universal access to reliable power supply1. 2.2 In Uttar Pradesh, the management of the intra-state power transmission system and of the Grid operations are vested with the Uttar Pradesh Power Transmission Corporation Limited (Company). The Company was incorporated on 31 May 2004 under the Companies Act, 1956 as Uttar Pradesh Vidyut Vyapar Nigam Limited. It was later rechristened as Uttar Pradesh Power Transmission Corporation Limited on 13 July 2006. The Energy Department, Government of Uttar Pradesh (GoUP) is the administrative department of the Company.
Organisational set up
2.3 The Management of the Company is vested with a Board of Directors comprising members appointed by the State Government. The day-to-day operations are carried out by the Managing Director (MD) who is also the Chief Executive of the Company. He/she is assisted by six Directors2 and a Company Secretary. For planning addition/augmentation of transmission systems, there are five Substations/Transmission Design Circles3 (Design Circles) each headed by a Superintending Engineer at the Company Headquarters. These circles are engaged in designing of transmission projects, finalisation of contracts for procurement of material, and award of works for execution of the transmission projects with the approval of the Stores Purchase Committees4.
Role of various wings in Project formulation and execution 2.4 The roles of various wings of the Company involved in project conceptualisation, approval and execution have been shown in the Appendix-2.1.
1 Sustainable Development Goal 7.1 of United Nations 2 Director (Operation), Director (Works and Projects), Director (Planning & Commercial), Director
(State Load Dispatch Centre), Director (Finance) and Director (Personnel and Administration). 3 (i) Electricity Substation Design Circle-I (ii) Electricity Substation Design Circle- II (iii) Electricity
Transmission Design circle (iv) 765/400 KV Electricity Substation Design Circle (v) 765 & 400 KV Electricity Transmission Design Circle.
4 Directors Store Purchase Committee (DSPC), Managing Directors Store Purchase Committee (MDPC) and Corporate Store Purchase Committee (CSPC) with the assigned financial limits of ` 1 to ` 10 crore, between ` 10 to ` 35 crore and above ` 35 crore respectively.
Audit Report on Economic Sector and Public Sector Undertakings for the year ended 31 March 2018
28
Audit Objectives
2.5 The audit was conducted to assess whether: projects were conceptualised properly and that the planning of the
identified projects was adequate and carried out as per the set time frame; system of procurement of goods and services was economic and efficient; execution of projects was economical, efficient, and gave the desired
results; fund management and monitoring mechanism for the implementation of
the projects were efficient and effective.
Scope, Methodology and Audit Criteria 2.6 A Performance Audit (PA) of Uttar Pradesh Power Transmission Corporation Limited was included in the Report of the Comptroller and Auditor General of India (Commercial), Government of Uttar Pradesh for the year ending 31 March 2012. The Performance Audit report has not been discussed by the Committee on Public Undertakings (COPU) till date (August 2019). The present audit was conducted from March 2018 to November 2018 to assess whether the projects were conceptualised properly with a view to evaluate the performance of the Company in conceptualising, planning and executing the construction/augmentation of substations on the basis of the documents/information maintained by the Company and its field units during 2013-14 to 2017-18, and to also ascertain whether the Company was able to achieve its targeted outcomes of facilitating transfer of power to the DISCOMs as per the demand without jeopardising the grid stability at any stage. Audit explained the objectives of the audit to the Principal Secretary, Energy Department and the Management of the Company in an Entry Conference held on 5 October 2018. It examined records and related documents at the Company’s Headquarters and in 42 units5 out of its 171 field units (25 per cent approx.). Audit also held discussions with the Principal Secretary, Energy Department and the Management on the audit findings in an Exit Conference held on 01 May 2019. The reply of the Company (May 2019) and the Government (September 2019) to the draft report has been received and suitably incorporated. The audit criteria were drawn from various documents6 issued by the Ministry of Power, GoI, Central Electricity Authority (CEA), Uttar Pradesh Electricity Regulatory Commission (Commission) and the Company.
The details of total number of SSs constructed/augmented and number of SSs selected for test check are given in Table-2.1. 5 Sample of 42 units was selected on Random Sample selection basis using IDEA Software. It
was duly approved by the Nodal Statistical Officer (NSO). 6 Provisions of National Electricity Policy and Plan, 2005 and 2016; Standards set in
Perspective Plan and Project Reports of the Company; Standard procedures prescribed for award of contracts; Manual of Transmission Planning Criteria (MTPC), 2013 issued by the CEA; Directives/Norms/Guidelines issued by State Government/the Uttar Pradesh Electricity Regulatory Commission/Central Electricity Authority(CEA)/Ministry of Power (MoP); Report of the Task force constituted by the CEA/MoP, GoI on transmission projects, 2005; “Best Practices in Transmission” as recommended by the Committee constituted by the MoP, GoI, in 2001.

Chapter–II: Audit relating to Power Sector Undertaking
29
Table-2.1: Details of the SSs constructed/augmented and number of SSs selected for test check
Total SSs constructed/augmented by the Company during 2013-14 to 2017-18
Total SSs test checked (in 42 units)
Nos. Capacity (in MVA)
Sanctioned Cost
(` in crore)
Nos. (per cent)
Capacity (in MVA)
Sanctioned Cost
` in crore (per cent)
New SSs Constructed 172 20,045 5,237.80 89 (52) 12,753 2,760.29
(53) Augmented SSs
486 23,637.50 2,610.75 180 (37) 5,661 1,471.90 (56)
Total 658 43,682.50 7,848.55 269 (41) 18,414 4,232.19
(54)
The audit findings discussed subsequently are a result of our test check. The Company may assess, at its level, more cases of similar nature in its other units as well. Audit acknowledges the cooperation and assistance extended by the Company and its officials during conduct of the Audit.
Financial Performance of the Company
Financial Status of the Company 2.7 The financial performance of the Company for the last five years ending 31 March 2018 is depicted in Table-2.2 below:
Table-2.2: Details showing the financial performance of the Company (` in crore)
Particulars 2013-14 2014-15 2015-16 2016-17 2017-18 Share Capital (including Application Money)
6,636.59 8,641.20 10,091.20 11,786.20 12,494.42
Gross Block of Fixed Assets related to transmission network7
10,278.94 10,898.29 13,352.56 18,245.92 22,623.98
Capital WIP 2,395.29 2,811.35 3,070.08 6,897.76 6,144.66 Loans 6,258.09 6,439.39 7,838.67 9,432.85 10,762.29 Interest 501.55 394.99 534.20 654.28 945.58 Depreciation 403.40 500.87 569.32 754.86 955.15 Turnover 1,655.878 1,304.91 1,682.64 1,759.51 2,069.41 Net Profit/(Loss) 321.39 (71.87) (27.13) (38.05) (367.20) Source: Annual Accounts of the Company
During the last five years ending March 2018, the Company had invested an amount of ` 17,788.43 crore9 in capital assets for strengthening its transmission networks. The above investment was mainly financed by share capital and loans which have increased substantially during the last five years. 7 Land; Building; Other Civil Works; Plant and Machinery; and Lines, Cables Networks etc. 8 It includes an amount of ` 581.18 crore (effect of increase in transmission revenue for the
year 2008-09 to 2011-12) in light of revised tariff on trued up basis as per UPERC order dated 01 October 2014 (Source: Note 16 of the Annual Accounts of the Company for the year ended 31st March 2014).
9 Gross Block of Fixed Assets as on 2017-18 i.e. ` 22,623.98 crore Plus Capital WIP as on 31 March 2018 i.e. ` 6,144.66 crore minus Gross Block of Fixed Assets as on 31 March 2013 i.e. ` 8,563.67 crore minus Capital WIP as on 31 March 2013 i.e. ` 2,416.54 crore.

Audit Report on Economic Sector and Public Sector Undertakings for the year ended 31 March 2018
30
The main reasons for substantial increase in losses during 2017-18 were heavy outflows on account of interest payments and depreciation during the given years.
Physical performance of the Company
2.8 The physical performance of the Company is given below:
(i) The physical performance of the Company as a whole for the last five years ending 31 March 2018 is detailed in Appendix-2.2 and summarised below in Table-2.3 below:
Table-2.3: Details showing the physical performance of the Company Particulars/Years 2012-13 2013-14 2014-15 2015-16 2016-17 2017-18
Number of substations (at the end of the year)
360 377 416 448 498 532
Transmission capacity of all categories of substations (in MVA) (at the end of the year)
58,650 63,614 68,543 76,482 88,847 1,02,333
Length of transmission lines (in ckm) (at the end of the year)
26,674.12 27,628.03 29,016.99 30,624.43 33,061.25 36,152
Actual Power Transmitted on UPPTCL Network (in MUs)
73,897.66 77,760.69 82,413.86 89,819.49 1,01,694.51 1,14,321.13
Source: Information provided by the Company
During 2013-14 to 2017-18, the Company constructed 172 new substations (SSs) of 20,045 MVA capacity and augmented the capacity of existing 486 SSs by 23,638 MVA as detailed in Appendix-2.2. As a result, transmission capacity increased by 74 per cent, length of transmission lines increased by 36 per cent and actual power transmitted increased by 55 per cent. Further, construction of 93 new substations of 26,125 MVA capacity and capacity augmentation of 86 existing SSs by 5,889 MVA were in progress at the end of 2017-18.
(ii) Transformation Capacity10 of the Company vis a vis that of DISCOMs Para 3.7 of the Manual of Transmission Planning Criteria (MTPC), 2013 of CEA provides that the transmission utility shall be responsible for meeting requirements of the DISCOMs. The SSs of 132 KV of the Company have direct interface with the 33KV SSs of the DISCOMs.
The Company had invested ` 17,788.43 crore during the period from 2013-14 to 2017-18 for augmenting/expanding its transmission systems. Against this expenditure, at an aggregate level, it was noticed that as on 31 March 2013, the total transformation capacity of 132 KV SSs of Company was 26,590 MVA against the transformation capacity of 27,981 MVA of DISCOMs (33/11 KV SSs and 66/11 KV SSs), which was 95 per cent of transformation capacity of the DISCOMs. However, given the scale of expenditure incurred, the transformation capacity of the Company as on 31 March 2018, stood at 44,423 MVA (at its 132 KV SSs) which was 102 per cent of the transformation capacity of DISCOMs at 43,706 MVA (33 KV SSs and 66 KV SSs).
10 Transformation capacity for transmission utility is the capacity of stepping up/steeping
down of the voltage.
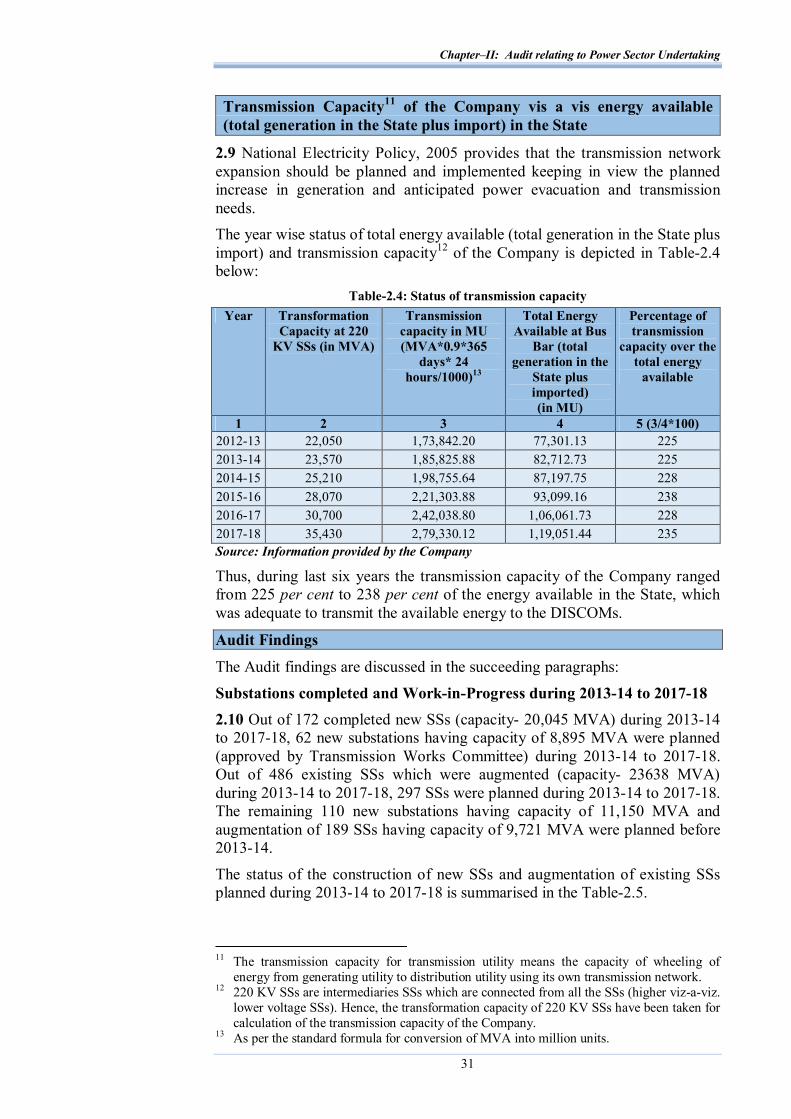
Chapter–II: Audit relating to Power Sector Undertaking
31
Transmission Capacity11 of the Company vis a vis energy available (total generation in the State plus import) in the State
2.9 National Electricity Policy, 2005 provides that the transmission network expansion should be planned and implemented keeping in view the planned increase in generation and anticipated power evacuation and transmission needs. The year wise status of total energy available (total generation in the State plus import) and transmission capacity12 of the Company is depicted in Table-2.4 below:
Table-2.4: Status of transmission capacity Year Transformation
Capacity at 220 KV SSs (in MVA)
Transmission capacity in MU (MVA*0.9*365
days* 24 hours/1000)13
Total Energy Available at Bus
Bar (total generation in the
State plus imported) (in MU)
Percentage of transmission
capacity over the total energy
available
1 2 3 4 5 (3/4*100) 2012-13 22,050 1,73,842.20 77,301.13 225 2013-14 23,570 1,85,825.88 82,712.73 225 2014-15 25,210 1,98,755.64 87,197.75 228 2015-16 28,070 2,21,303.88 93,099.16 238 2016-17 30,700 2,42,038.80 1,06,061.73 228 2017-18 35,430 2,79,330.12 1,19,051.44 235 Source: Information provided by the Company
Thus, during last six years the transmission capacity of the Company ranged from 225 per cent to 238 per cent of the energy available in the State, which was adequate to transmit the available energy to the DISCOMs.
Audit Findings
The Audit findings are discussed in the succeeding paragraphs: Substations completed and Work-in-Progress during 2013-14 to 2017-18 2.10 Out of 172 completed new SSs (capacity- 20,045 MVA) during 2013-14 to 2017-18, 62 new substations having capacity of 8,895 MVA were planned (approved by Transmission Works Committee) during 2013-14 to 2017-18. Out of 486 existing SSs which were augmented (capacity- 23638 MVA) during 2013-14 to 2017-18, 297 SSs were planned during 2013-14 to 2017-18. The remaining 110 new substations having capacity of 11,150 MVA and augmentation of 189 SSs having capacity of 9,721 MVA were planned before 2013-14.
The status of the construction of new SSs and augmentation of existing SSs planned during 2013-14 to 2017-18 is summarised in the Table-2.5.
11 The transmission capacity for transmission utility means the capacity of wheeling of
energy from generating utility to distribution utility using its own transmission network. 12 220 KV SSs are intermediaries SSs which are connected from all the SSs (higher viz-a-viz.
lower voltage SSs). Hence, the transformation capacity of 220 KV SSs have been taken for calculation of the transmission capacity of the Company.
13 As per the standard formula for conversion of MVA into million units.

Audit Report on Economic Sector and Public Sector Undertakings for the year ended 31 March 2018
32
Table-2.5: Details of construction of new SSs and augmentation of existing SSs Details of new SSs Details of augmentation of existing SSs
Status of planned SSs (in No.)
Status of SSs planned (in No.)
Year No. of
SSs planned
Capacity of planned SSs (in MVA)
Completed WIP
No. of SSs planned
Capacity planned
(in MVA) Completed WIP
2013-14 14 1,440 12 2 38 2,083 38 NIL 2014-15 52 12,118 29 23 28 1,389 27 1 2015-16 34 7,556 20 14 142 6,626 135 7 2016-17 21 7,394 1 20 94 4,629 84 10 2017-18 34 6,512 NIL 34 81 5,080 13 68
155 35,020 62 93 383 19,807 297 86 Source: Information provided by the Company
The above depicts that out of 155 SSs planned (Sanctioned Cost ` 9,954.31 crore) for construction during the period of audit, only 62 SSs (Sanctioned Cost ` 2,655.79 crore) could be completed. Construction of 93 SSs (Sanctioned Cost ` 72,98.52 crore) was in progress (March 2018). Similarly, out of 383 SSs planned for augmentation (Sanctioned Cost `1,940.31 crore), 297 SSs were augmented (Sanctioned Cost ` 1,425.16 crore) and augmentation of 86 SSs (Sanctioned Cost ` 515.15 crore) was in progress. Out of 179 SSs (New SSs-93 and Augmentation of existing SSs-86) which were in Work in Progress (WIP), 47 SSs (New SSs-39 and Augmentation of existing SSs-8) which were planned upto 2015-16, could not be completed even after a lapse of two years. Capacity wise detailed position of the SSs planned, SSs completed and those which were work-in-progress as on 31 March 2018 has been given in Appendix-2.3. Reasons for delay in their completion are discussed in the succeeding paragraphs no. 2.22, 2.23, 2.24 and 2.25.
Project planning
2.11 Planning wing of the Company, headed by the Chief Engineer (Planning), is the nodal wing for the formal planning and approval for the transmission projects. The Detailed Project Reports (DPRs) of new projects for the construction of new substations/augmentation of the existing substations (SSs) are sent by field units to the Director (Operations). After initial scrutiny at the Director (Operations) level, the projects are put up by Planning wing to Transmission Works Committee (TWC) for approval.
2.12 As required by the Electricity Act14, 2003, the Company prepares Five Year Plans (FYP) for capacity additions and obtains the approval of the same from the Central Electricity Authority (CEA). Though the 11th and 13th FYPs were approved by the CEA, the approval of 12th FYP (2012-13 to 2016-17) was not accorded by the CEA except for the power evacuation projects. During 2012-13 to 2016-17 the Company took up the Grid Strengthening Transmission projects in the Company’s TWC on a case to case basis. Further, the Company did obtain the approval of the CEA separately in respect of 400 KV and 765 KV SSs constructed during 12th FYP period.
14 As per Section-39 of the Electricity Act, 2003 read with the ‘Approved Procedure for
Grant of the Connectivity to the Intra State Transmission System’ of UPERC, the State Transmission Utility are required to prepare the intra state transmission plan in coordination with the CEA.
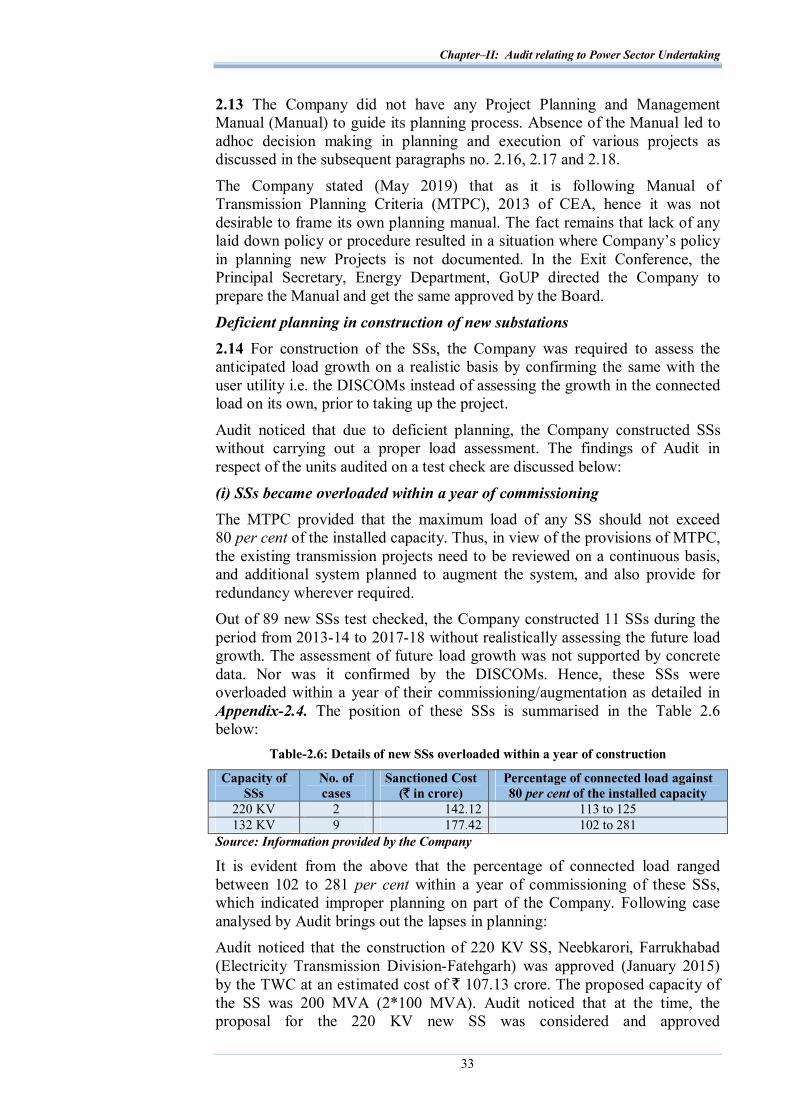
Chapter–II: Audit relating to Power Sector Undertaking
33
2.13 The Company did not have any Project Planning and Management Manual (Manual) to guide its planning process. Absence of the Manual led to adhoc decision making in planning and execution of various projects as discussed in the subsequent paragraphs no. 2.16, 2.17 and 2.18.
The Company stated (May 2019) that as it is following Manual of Transmission Planning Criteria (MTPC), 2013 of CEA, hence it was not desirable to frame its own planning manual. The fact remains that lack of any laid down policy or procedure resulted in a situation where Company’s policy in planning new Projects is not documented. In the Exit Conference, the Principal Secretary, Energy Department, GoUP directed the Company to prepare the Manual and get the same approved by the Board.
Deficient planning in construction of new substations 2.14 For construction of the SSs, the Company was required to assess the anticipated load growth on a realistic basis by confirming the same with the user utility i.e. the DISCOMs instead of assessing the growth in the connected load on its own, prior to taking up the project.
Audit noticed that due to deficient planning, the Company constructed SSs without carrying out a proper load assessment. The findings of Audit in respect of the units audited on a test check are discussed below:
(i) SSs became overloaded within a year of commissioning The MTPC provided that the maximum load of any SS should not exceed 80 per cent of the installed capacity. Thus, in view of the provisions of MTPC, the existing transmission projects need to be reviewed on a continuous basis, and additional system planned to augment the system, and also provide for redundancy wherever required. Out of 89 new SSs test checked, the Company constructed 11 SSs during the period from 2013-14 to 2017-18 without realistically assessing the future load growth. The assessment of future load growth was not supported by concrete data. Nor was it confirmed by the DISCOMs. Hence, these SSs were overloaded within a year of their commissioning/augmentation as detailed in Appendix-2.4. The position of these SSs is summarised in the Table 2.6 below:
Table-2.6: Details of new SSs overloaded within a year of construction
Capacity of SSs
No. of cases
Sanctioned Cost (` in crore)
Percentage of connected load against 80 per cent of the installed capacity
220 KV 2 142.12 113 to 125 132 KV 9 177.42 102 to 281
Source: Information provided by the Company
It is evident from the above that the percentage of connected load ranged between 102 to 281 per cent within a year of commissioning of these SSs, which indicated improper planning on part of the Company. Following case analysed by Audit brings out the lapses in planning: Audit noticed that the construction of 220 KV SS, Neebkarori, Farrukhabad (Electricity Transmission Division-Fatehgarh) was approved (January 2015) by the TWC at an estimated cost of ` 107.13 crore. The proposed capacity of the SS was 200 MVA (2*100 MVA). Audit noticed that at the time, the proposal for the 220 KV new SS was considered and approved
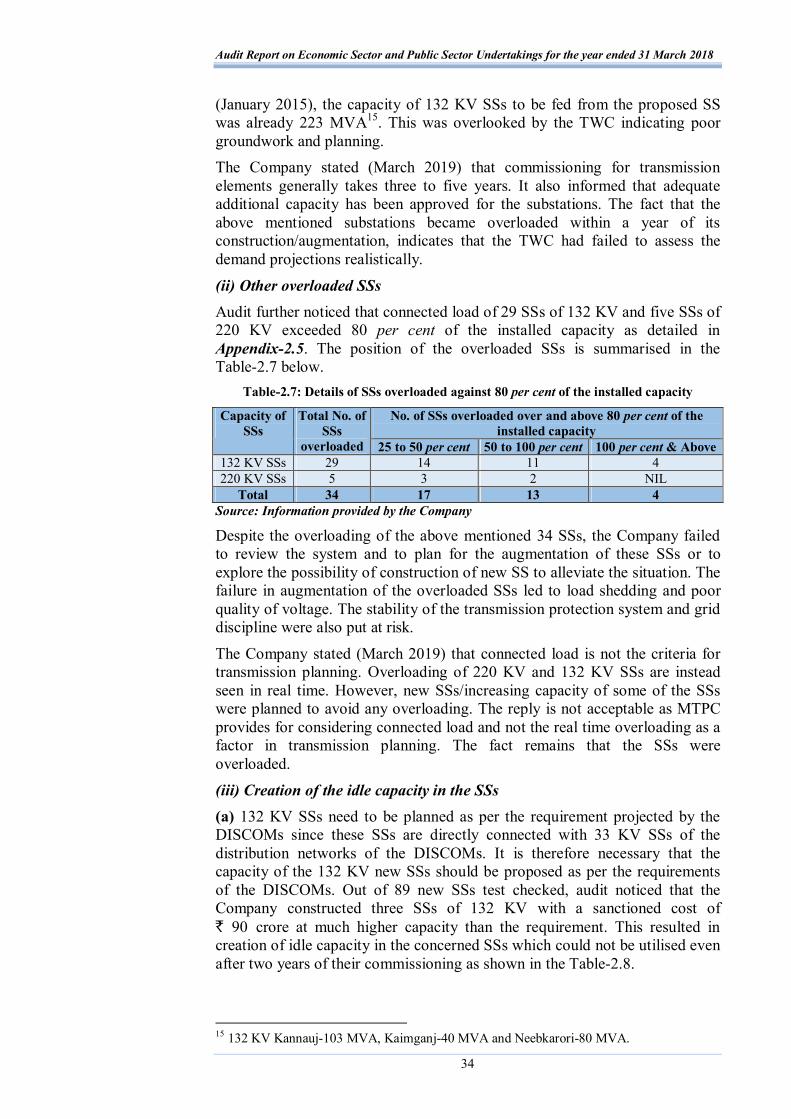
Audit Report on Economic Sector and Public Sector Undertakings for the year ended 31 March 2018
34
(January 2015), the capacity of 132 KV SSs to be fed from the proposed SS was already 223 MVA15. This was overlooked by the TWC indicating poor groundwork and planning. The Company stated (March 2019) that commissioning for transmission elements generally takes three to five years. It also informed that adequate additional capacity has been approved for the substations. The fact that the above mentioned substations became overloaded within a year of its construction/augmentation, indicates that the TWC had failed to assess the demand projections realistically.
(ii) Other overloaded SSs Audit further noticed that connected load of 29 SSs of 132 KV and five SSs of 220 KV exceeded 80 per cent of the installed capacity as detailed in Appendix-2.5. The position of the overloaded SSs is summarised in the Table-2.7 below.
Table-2.7: Details of SSs overloaded against 80 per cent of the installed capacity
No. of SSs overloaded over and above 80 per cent of the installed capacity
Capacity of SSs
Total No. of SSs
overloaded 25 to 50 per cent 50 to 100 per cent 100 per cent & Above 132 KV SSs 29 14 11 4 220 KV SSs 5 3 2 NIL
Total 34 17 13 4 Source: Information provided by the Company
Despite the overloading of the above mentioned 34 SSs, the Company failed to review the system and to plan for the augmentation of these SSs or to explore the possibility of construction of new SS to alleviate the situation. The failure in augmentation of the overloaded SSs led to load shedding and poor quality of voltage. The stability of the transmission protection system and grid discipline were also put at risk.
The Company stated (March 2019) that connected load is not the criteria for transmission planning. Overloading of 220 KV and 132 KV SSs are instead seen in real time. However, new SSs/increasing capacity of some of the SSs were planned to avoid any overloading. The reply is not acceptable as MTPC provides for considering connected load and not the real time overloading as a factor in transmission planning. The fact remains that the SSs were overloaded.
(iii) Creation of the idle capacity in the SSs (a) 132 KV SSs need to be planned as per the requirement projected by the DISCOMs since these SSs are directly connected with 33 KV SSs of the distribution networks of the DISCOMs. It is therefore necessary that the capacity of the 132 KV new SSs should be proposed as per the requirements of the DISCOMs. Out of 89 new SSs test checked, audit noticed that the Company constructed three SSs of 132 KV with a sanctioned cost of ` 90 crore at much higher capacity than the requirement. This resulted in creation of idle capacity in the concerned SSs which could not be utilised even after two years of their commissioning as shown in the Table-2.8.
15 132 KV Kannauj-103 MVA, Kaimganj-40 MVA and Neebkarori-80 MVA.
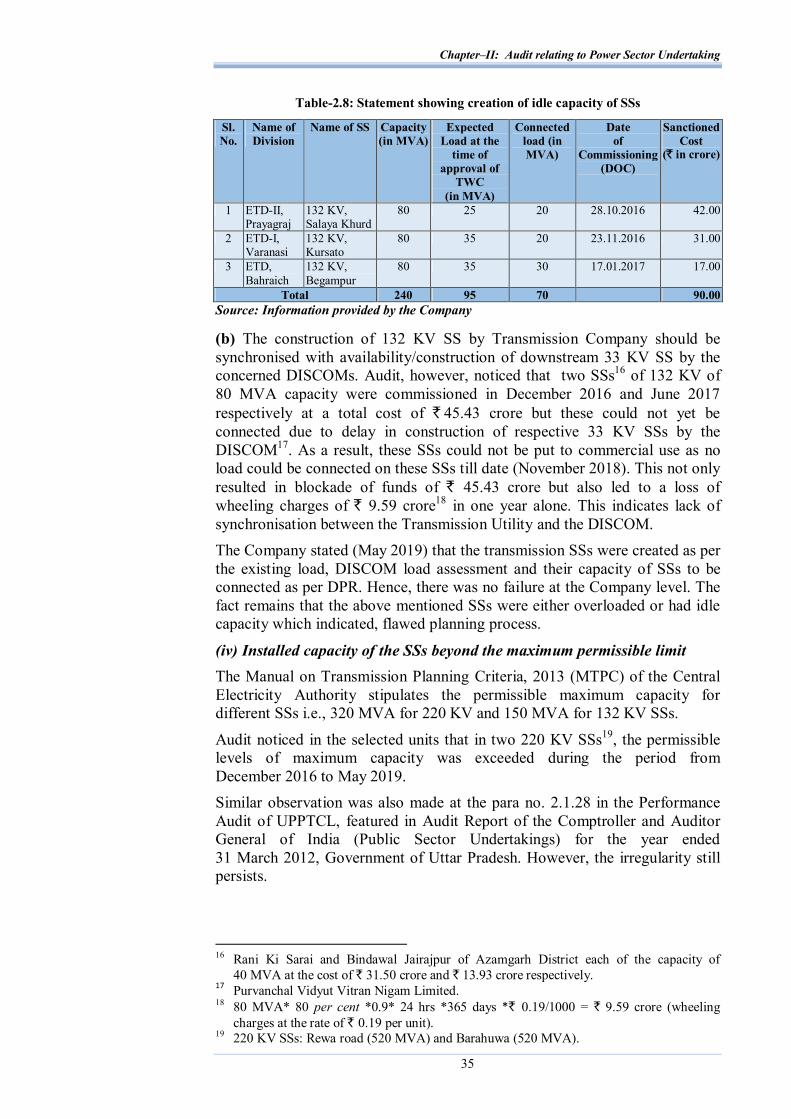
Chapter–II: Audit relating to Power Sector Undertaking
35
Table-2.8: Statement showing creation of idle capacity of SSs
Sl. No.
Name of Division
Name of SS Capacity (in MVA)
Expected Load at the
time of approval of
TWC (in MVA)
Connected load (in MVA)
Date of
Commissioning (DOC)
Sanctioned Cost
(` in crore)
1 ETD-II, Prayagraj
132 KV, Salaya Khurd
80 25 20 28.10.2016 42.00
2 ETD-I, Varanasi
132 KV, Kursato
80 35 20 23.11.2016 31.00
3 ETD, Bahraich
132 KV, Begampur
80 35 30 17.01.2017 17.00
Total 240 95 70 90.00 Source: Information provided by the Company
(b) The construction of 132 KV SS by Transmission Company should be synchronised with availability/construction of downstream 33 KV SS by the concerned DISCOMs. Audit, however, noticed that two SSs16 of 132 KV of 80 MVA capacity were commissioned in December 2016 and June 2017 respectively at a total cost of ` 45.43 crore but these could not yet be connected due to delay in construction of respective 33 KV SSs by the DISCOM17. As a result, these SSs could not be put to commercial use as no load could be connected on these SSs till date (November 2018). This not only resulted in blockade of funds of ` 45.43 crore but also led to a loss of wheeling charges of ` 9.59 crore18 in one year alone. This indicates lack of synchronisation between the Transmission Utility and the DISCOM. The Company stated (May 2019) that the transmission SSs were created as per the existing load, DISCOM load assessment and their capacity of SSs to be connected as per DPR. Hence, there was no failure at the Company level. The fact remains that the above mentioned SSs were either overloaded or had idle capacity which indicated, flawed planning process.
(iv) Installed capacity of the SSs beyond the maximum permissible limit The Manual on Transmission Planning Criteria, 2013 (MTPC) of the Central Electricity Authority stipulates the permissible maximum capacity for different SSs i.e., 320 MVA for 220 KV and 150 MVA for 132 KV SSs.
Audit noticed in the selected units that in two 220 KV SSs19, the permissible levels of maximum capacity was exceeded during the period from December 2016 to May 2019. Similar observation was also made at the para no. 2.1.28 in the Performance Audit of UPPTCL, featured in Audit Report of the Comptroller and Auditor General of India (Public Sector Undertakings) for the year ended 31 March 2012, Government of Uttar Pradesh. However, the irregularity still persists.
16 Rani Ki Sarai and Bindawal Jairajpur of Azamgarh District each of the capacity of
40 MVA at the cost of ` 31.50 crore and ` 13.93 crore respectively. 17 Purvanchal Vidyut Vitran Nigam Limited. 18 80 MVA* 80 per cent *0.9* 24 hrs *365 days *` 0.19/1000 = ` 9.59 crore (wheeling
charges at the rate of ` 0.19 per unit). 19 220 KV SSs: Rewa road (520 MVA) and Barahuwa (520 MVA).

Audit Report on Economic Sector and Public Sector Undertakings for the year ended 31 March 2018
36
Recommendation: The Company should have a Project Planning and Management Manual in place. It should have a long term planning for the transmission projects with due consideration of future requirements.
Contract and Procurement Management
2.15 As per the practice adopted, the Company first assesses the quantity of the major items required for all approved projects and invites tenders separately for each major item. Further, due to large quantities of purchases, the Company generally distributed the tendered quantity among the qualified bidders by making counter offers to them at the approved lowest rate of Corporate Store Purchase Committee (CSPC). The Company did not lay down any purchase policy/procurement manual nor did it prepare any periodic procurement plan. Against the requirement of material for new projects (SSs), augmentation of existing SSs and Operation & Maintenance (O&M) works, the Company procured the same in an ad-hoc manner through open tenders. The deficiencies in respect of contract and procurement management are discussed in the succeeding paragraphs:
Procurement of material without synchronisation with erection activities 2.16 To minimise the cost of transmission system, the supplies of materials should be received from suppliers at the time of actual requirements at the site and should also be synchronised with the erection activities. Otherwise, the material supplied by the suppliers would remain lying idle leading to blockage of funds with associated holding costs. Since, the Company avails 70 per cent of the project cost in form of loans from REC/PFC at the prevailing rates (ranging from 10.50 per cent to 12.5 per cent) of interest, the associated holding costs are substantial.
Audit noticed that the Company, while procuring the major materials i.e. transformers and conductor, did not take into account the actual site requirements. Further, procurements were not synchronised with the erection activities. In 32 cases in 14 field units20 out of 42 test checked units, audit noticed that supply of material valued at ` 85.26 crore was received by the field units much before the projected utilisation of these materials during the period from 2013-14 to 2017-18. In 16 cases, the material was not put to use for the period up to six months; in five cases, the material was not used for a period from six to twelve months while in 11 cases; the material was lying unused for a period of more than 12 months before its utilisation. As a result, the material was not put to use for a period ranging between one month to thirty-eight months (after allowing three months as lead period) as detailed in Appendix-2.6. The payments for these materials were made by the Company to the supplier firms immediately after receipt of the supply.
20 Electricity Transmission Division (ETD)-Mau; ETD-Gorakhpur; ETD-Aligarh; ETD-II
Varanasi; ETD-II Agra; ETD-Azamgarh; ETD-Behraich; ETD-Banda; ETD-Faizabad; ETD-I Lucknow; ETD-II Allahabad; ETD-II Kanpur; ETD-III Varanasi and ETD-Sitapur.

Chapter–II: Audit relating to Power Sector Undertaking
37
Procurements made without ensuring synchronisation with erection activities led to an avoidable burden of payment of interest of ` 5.45 crore21. There was a strong possibility that the quality of material procured but lying idle could also deteriorate due to passage of time.
The Company stated (May 2019) that in some cases, a mismatch between supply of materials and erection occurs due to some unforeseen reasons, and if it is felt that the allotted material cannot be used for long, diversion of the same to some other projects is considered. The Government also endorsed (September 2019) the reply of the Company. The reply is not acceptable as the major categories of material i.e. Transformers and Conductors valued at ` 85.26 crore were lying unutilised for periods ranging from one month to thirty eight months, indicating that these were not redeployed.
Procurement of transformers from Turnkey Contractors (TKCs) 2.17 Best Practices in Transmission Systems (BPITS) notified by MoP, GoI stipulated procurement practices of material and works for substations and transmission lines. Para 5 (i) of BPITS stipulated that SSs may be packaged for turnkey execution except that transformer/reactors may be procured separately and erected by turnkey contractor.
Audit noticed that during 2013-14 to 2017-18, in case of 116 SSs contracted out on turnkey basis, the Company awarded 102 SSs (88 per cent) excluding the supply of transformers while in case of 14 SSs (12 per cent) it awarded construction work including the supply of transformers. On further scrutiny of these 14 SSs awarded on turnkey basis (including the supply of transformers), audit noticed the following:
(i) In four cases of construction of 220 KV SSs, the cost of transformers supplied by the turnkey contractors were higher by 24 per cent to 68 per cent in comparison to the transformers of the same capacity which were purchased directly by the Company during the same period. This resulted into loss of ` 15.64 crore as detailed in the Appendix-2.7. The Company stated (May 2019) that rates in both procurements cannot be compared as the payment terms are different in both the procurements. The Government also endorsed (September 2019) the reply of the Company. The reply is not acceptable as the Company was well aware of the rate of transformers before finalisation of the turnkey contracts and examination by Audit revealed that the transformers supplied by the turnkey contractors were very expensive (24 per cent to 68 per cent) than the transformers of the same capacity which were purchased directly by the Company. This huge variation in the price cannot be justified on the grounds of different terms of payment.
(ii) In four cases, a payment of ` 8.56 crore was made to the TKCs for supply of transformers 28 months to 41 months before their actual erection leading to loss of interest of ` 1.73 crore as detailed in Table-2.9.
21 Calculated at the rate of 10.50 per cent being the lowest rate for 70 per cent of the value of
the material till November 2018 after allowing three months’ period as lead time for erection.

Audit Report on Economic Sector and Public Sector Undertakings for the year ended 31 March 2018
38
Table-2.9: Details of payment made to TKCs for procurement of transformers much before erection
Name of TKCs/Project
Number and Capacity of
transformers
Date of Supply/Erection
Value (` in crore)
Payment made to the TKCs
(70 per cent of the value of
supply)
Period for which the transformers
were lying unutilised after
leaving three months as lead
period (in Months)
Loss of interest ` in crore (calculated at the rate of 10.5 per
cent on 70 per cent22 of the payment made to TKCs)
M/s CGL/220 KV Sirathu
160 MVA October 2011/June 2014
4.70 3.29 28 0.56
M/s CGL/220 KV Sirathu
160 MVA October 2011/July 2015
4.70 3.29 41 0.83
M/s PME/132 KV Sarai Akil
20 MVA November 2012/July 2015
1.42 0.99 28 0.17
M/s PME/132 KV Sarai Akil
20 MVA November 2012/July 2015
1.42 0.99 28 0.17
Total 12.24 8.56 1.73 Source: Information provided by the Company
The Company stated (May 2019) that due to delay in construction of SSs, erection of transformers was delayed. The Government also endorsed (September 2019) the reply of the Company. The reply is not acceptable as these projects were awarded on a turnkey basis, hence, the TKCs (contractor) were well aware of the delay, if any, of the project. Hence, the TKCs should have synchronised the supply of the transformers with the actual requirement at the site. Thus, the Company followed the recommendation of BPITS in 102 cases (88 per cent) but deviated in 14 cases (12 per cent) without any reason on records which resulted in avoidable extra expenditure of ` 17.37 crore due to inclusion of supply of transformers in turnkey contracts. The Company stated (May 2019) that it is not mandatory to exclude transformers in turnkey contracts and therefore the same were included to avoid delays in some turnkey contracts. The Government also endorsed (September 2019) the reply of the Company. The reply is not acceptable as the Company followed BPITS in 102 cases (88 per cent) and there was no delay in completion of these projects due to delayed supply of transformers.
Failure to enforce vital clause of contract 2.18 As per clause contained in the “Instructions to the tenderers”, if the quantity of the equipment ordered remains unsupplied within scheduled delivery period and upto to the finalisation of the new tender and price of the equipment falls in new tender, then the contractor will reduce the price of the equipment to the level of new tender price. This vital clause of contract should be enforced for securing the financial interests of the Company. However, this clause was not observed as brought out in the following paragraph. For procurement of transformers, the Company invited various tenders during the period 2013-14 to 2017-18. Audit noticed that during the currency of the earlier tenders, the rates finalised in the subsequent tenders were found lower than the rates of earlier tenders. In order to avail the benefit of fall in price, the Company should have enforced the above mentioned clause of the contract by insisting that the balance quantity of the earlier tender be supplied at the rates 22 Being the portion of loan in the total cost of the project.

Chapter–II: Audit relating to Power Sector Undertaking
39
in the subsequent tenders. Failure to do so led to avoidable extra expenditure of ` 2.77 crore as detailed in Table-2.10 below:
Table-2.10: Details of Transformers procured at the rate of earlier tender instead of subsequent tender
Capacity of transformers
Earlier tender
no.
Tendered qty. (No.)
Rate ` in
crore (per no.)
Qty. balance to be procured
against earlier tender
Subsequent tender no.
Tendered qty. (No.)
Rate ` in
crore (per no)
Difference (` in
crore)
Extra expenditure (` in crore)
63 MVA ESD/377 22 1.87 7 ESD/403 35 1.79 0.08 0.56 63 MVA ESD/403 35 1.79 11 ESD/426 42 1.72 0.07 0.77 40 MVA ESD/376 28 1.51 12 ESD/430 25 1.39 0.12 1.44
Total 30 2.77 Source: Information provided by the Company
Moreover, in all the cases, the firms in both the earlier and subsequent tenders were the same. Similar observation was also made in Paragraph 2.1.18 in the Performance Audit of UPPTCL, featured in Audit Report of the Comptroller and Auditor General of India (Public Sector Undertakings) for the year ended 31 March 2012, Government of Uttar Pradesh.
The Government/Company stated (September 2019) that in case of 23 transformers final inspection was offered by the firms after the finalisation of the next tender. Therefore, an amount of ` 2.09 crore is required to be recovered from the concerned firms. Necessary action will be taken to recover the same. The fact remains that recovery is yet to be done.
Undue favour to contractor by violating clause of contract 2.19 The Company awarded (November 2010) tender for the work of Supply, Erection, Testing & Commissioning of 400 KV DC line in two packages23 to a contractor for total contracted value of ` 90.96 crore and ` 205.94 crore respectively. However, due to poor progress and on account of reluctance of the contractor, the agreement was terminated (May 2014) by the Company.
Audit noticed that clause 19.1 of Special Terms and Condition of the contract provided that the contractor was required to furnish a Performance Bank Guarantee (PBG) for 10 per cent of the value of the contract for correct quality and satisfactory performance of the works which shall be valid after 12 months from the date of taking over of the plant. Thus, the contractor was required to submit a PBG of ` 29.69 crore i.e. 10 per cent of total cost (` 90.96 crore + ` 205.94 crore). Audit further noticed that instead of getting the full 10 per cent bank guarantee from the contractor as PBG, the Transmission Design Circle deducted the PBG at the rate of 10 per cent from the running bills of the contractor without any reason on record. As a result, at the time of termination of agreement, only ` 18.37 crore was available for forfeiture against the required amount of ` 29.69 crore.
Thus, the contractor was extended an undue benefit of ` 11.32 crore (` 29.69 crore - ` 18.37 crore).
23 400 KV DC Banda-Orai for 100 KM under package-1 and 400 KV DC Banda-Allahabad
for 200 KM under package-2.

Audit Report on Economic Sector and Public Sector Undertakings for the year ended 31 March 2018
40
The Government/Company accepted (September 2019) the audit observation and stated that now PBG is being deposited within 30 days of the issuance of the LOI without which no bill for the payment is processed. Although the observation is accepted but the reply is silent about recovery of loss of ` 11.32 crore. Moreover, the reply also does not address the action taken against the officials who allowed the relaxation to the contractor in deposit of the PBG upfront in violation of the provision of the agreement.
Non-lifting/return of transformers damaged under guarantee period 2.20 As per agreement made with the supplier of the transformers, the supplied transformers were covered under a guarantee of 60 months from the date of energisation or 66 months from the date of supply of the transformers, whichever is earlier. Audit noticed that 15 transformers of 63 MVA valued at ` 24.75 crore which were damaged under guarantee period of 60/66 months, were not lifted by the supplier despite passage of one year to five years. Now the transformers have been categorised as defective. Further, one 132/33 KV transformer of 63 MVA damaged under guarantee period in Electricity Transmission Division (ETD), Banda was lifted by the firm (October 2017) but was not returned after repairs till date (November 2018).
The Company stated (May 2019) that a bill amounting to ` 5.20 crore has been withheld, ` 1.80 crore Bank Guarantee (BG) had been encashed and BG amounting to ` 13.64 crore was available with the Company and repairing of these damaged transformer shall be done from this amount. The Government also endorsed (September 2019) the reply of the Company. The fact remains that the transformers were not got repaired till date and BG has not been encashed. Moreover, the amount available with the Company is not adequate to cover the damage loss. Thus, the failure to take due cognisance of the contract terms deprived the Company to recover the damage loss adequately.
Recommendations: The Company should have a Purchase Policy/ Procurement Manual in place. It should have a procurement plan in synchronisation with the execution of the projects. It should put in place a mechanism to ensure the strict compliance of provisions of the contracts.
Award and execution of project
2.21 A transmission project consists of three components viz. the substation, the feeder lines of SS and outgoing lines to feed other ransmission/distribution SSs. The Company designed packages for implementation of transmission projects and allotted these to different turnkey contractors (TKCs) for execution of works of new SS. Apart from this, new SSs were also constructed departmentally. The work of augmentation of existing SSs has been executed departmentally. For award of the projects, the Company invited open tenders and issued letter of intents (LOI) to the turnkey contractors/firms (L-1 bidder) after approval of the Corporate Store Purchase Committee (CSPC). After the issuance of LOI, the works were got executed by the concerned Electricity Transmission Divisions of the Company. The deficiencies noticed in the award of projects and their execution are discussed below:

Chapter–II: Audit relating to Power Sector Undertaking
41
Delay in completion of projects 2.22 For the purpose of project implementation and execution, the Task Force constituted in February, 2005 by the Central Electricity Authority (CEA), Ministry of Power, Government of India had suggested that major reduction in project implementation schedule is possible by undertaking various preparatory activities (viz. surveys, design & testing, processing for forest & other statutory clearances, tendering activities etc.) in advance/parallel to project appraisal & approval phase and go ahead with construction activities once Transmission Line Project sanction/approval is received to complete within the targeted period of 24 months. In line with the suggestions of the Task Force, the Company adopted the target of project completion in the time schedule of 12 months, 18 months and 24 months from the date of award of work for 132 KV, 220 KV and 400 KV SSs respectively. However, the Company had not fixed any time schedule for the completion of the work of augmentation of the existing SSs. Therefore, Audit considered the targeted time schedule in such cases as six months. The summarised position of delay in 72 out of 100 new SSs planned during 2013-14 to 2015-1624 and 93 SSs out of augmentation of 302 SSs planned during 2013-14 to 2016-1725 has been depicted in Table-2.11:
Table-2.11: Details showing the position of delay during 2013-14 to 2017-18 (in months)
Delay at different stages Capacity of SSs
No. of cases
Total Delay in months beyond
24/6 months from the date of TWC
for New SSs/Augmentation
of SSs
Delay in award of work (leaving two/one
months from the date of TWC for new
SSs/Augmentation of SSs)/
(No. of cases)
Delay in handing over of
clear site (leaving one
month from the date of award)/ (No. of cases)
Delay in execution by the contractor
(beyond scheduled date of completion as per agreement)/
(No. of cases)
Details regarding New SSs 132 KV 48 1 to 35 3 to 45/(28) 1 to 21/(16) 2 to 21/(20) 220 KV 22 1 to 37 2 to 21/(19) 1 to 9/(12) 4 to 22/(7) 400 KV 2 6 to 20 10 and 14/(2) 19 and 36/(2) Both the works are
still WIP Total 72
Details regarding Augmentation of SSs 132 KV 56 7 to 28 1 to 28/(49) - 1 to 17/(39) 220 KV 31 8 to 33 5 to 30/(24) - 1 to 19 (20) 400 KV 6 8 to 23 13 to 16/(4) - 3 to 11/(5) Total 93
Grand Total 165
Source: Information provided by the Company
There was a delay of one to thirty seven months in construction/augmentation of SSs awarded during the audit period. The main reasons for the delay, as noticed by Audit, were non-execution of parallel activities, delay in identification and acquisition of land, negligence in the execution of civil work and poor performance of the firms. Due to delay in construction of new SSs/augmentation of existing SSs, the intended benefits of improving the
24 Considering the targeted period of 24 months for completion of new SSs from the date of
approval of TWC, the projects planned till 2015-16 have been analysed for delay. 25 Considering the targeted period of six months for completion of augmentation of SSs from
the date of approval of TWC, the projects planned till 2016-17 have been analysed for delay.

Audit Report on Economic Sector and Public Sector Undertakings for the year ended 31 March 2018
42
supply voltage, reducing the load on existing SSs was also delayed. It also indicates that review mechanism is not effective. The Company stated (May 2019) that the main reasons for delay in award of work after the approval of TWC were obtaining approval from Board of Directors, Appraisal Committee, Energy Task Force and the Cabinet. Regarding delay in execution of the contract, it was stated sometimes delays occurred due to reasons beyond the control and shifting of lines passing through the substation land. The Government also endorsed (September 2019) the reply of the Company. The fact remains that delays in awarding of the contracts after the TWC approval ranged up to 45 months. Similarly, delays in execution ranged up to 22 months. This indicates that compliance with the recommendation of the Audit for timely completion of the planned projects as given in the Performance Audit of UPPTCL, featured in Audit Report of the Comptroller and Auditor General of India (Public Sector Undertakings) for the year ended 31 March 2012, Government of Uttar Pradesh has not been acted upon. A few cases of inordinate delay in respect of construction of SSs and lines (started/executed during our audit period) are discussed below: 132 KV GI substation, Hanuman Setu, Lucknow 2.23 The TWC approved (March 2011) the construction of 2 x 40 MVA (capacity enhanced to 2 x 63 MVA in July 2012) 132 KV Gas Insulated substation (GIS) along with associated 132 KV underground lines. However, the clear site could be handed over to the contractor only in July 2017. The new firm started the work of construction from July 2017 which is still in progress (May 2019). For feeding of the SS, underground cable work of 93 km (out of total 107.90 km) was completed in October 2012 at a cost of ` 134.66 crore. This SS was planned (March 2011) to feed five SSs26 of 33/11 KV. However, even after lapse of more than seven years, the SS is still not completed and the intended 33/11 KV SSs were being fed from three27 other 132 KV SSs. Moreover, the Company did not report any unfavourable supply (quality and quantity) of power due to non-completion of the aforementioned 132 KV SS. Notwithstanding the above fact, the construction of the SS is being carried out even after more than seven years of the approval of TWC without any mechanism of the review of the current requirement by the TWC. The Company stated (May 2019) that the construction work of 132 KV Hanuman Setu is in progress and is expected to completed by June 2019. The Government also endorsed (September 2019) the reply of the Company. Construction 220 KV SS, Bhelupur, Varanasi 2.24 For smooth and proper power supply in Varanasi city, TWC approved (September 2007) 220 KV SS, Bhelupur and its associated lines at the abandoned land of old power house of Bhelupur at an estimated cost of ` 214.93 crore. The SS was to be constructed departmentally with feeder line of five KM underground 220 KV Cable (from Samne Ghat to Bhelupur SS) and 220 KV Sahupuri-Samne Ghat line and was scheduled for completion in August 2009. The work of 220 KV underground cabling work was completed in March 2013 with construction cost of ` 67.57 crore. For completion of 26 Ekka Stand, Lucknow University, Residency, Darul Shafa and Hanuman Setu. 27 Mehtab Bag, Martinpurwa and Gomti Nagar.
Chapter–II: Audit relating to Power Sector Undertaking
43
220 KV Sahupuri-Bhelupur line (Feeder line), the Company failed to obtain necessary permission from MoEF, GoI timely due to which the SS could be energised in May 2016 after the lapse of seven years from the scheduled date completion period. Further, an amount of ` 67.57 crore incurred on 220 KV underground cable work also remained blocked from March 2013 to April 2016. This SS was planned (September 2007) to feed eight SSs28 of 33/11 KV. However, the SS could not be energised for nine years from the approval of TWC and the intended 33/11 KV SSs were being fed from three29 other 132 KV SSs. Due to delayed energisation of the SS, the supply voltage of the concerned areas remained affected. Notwithstanding with the fact of huge delay of seven years, no approval of TWC for the current requirement was obtained to revalidate the justification of construction of the SS.
The Company stated (May 2019) that the delay occurred as many clearances were required from different departments. It further stated that TWC regularly reviews approved works and cancels/modifies them accordingly as per requirement. The Government also endorsed (September 2019) the reply of the Company. The reply is not acceptable as TWC reviews only those cases in which modifications are required based upon proposals sent by the field offices for such modifications.
400 KV GIS, Hardoi Road, Lucknow 2.25 In order to strengthen power management in the city of Lucknow, TWC approved (July 2014) construction of new 400 KV SS, Hardoi Road, Lucknow and associated lines at an estimated cost of ` 245 crore. The objective of the proposed SS was to cater the transformation capacity of 33 KV SSs of Lucknow Electricity Supply Administration (LESA) of 2,200 MVA by March 2015. The existing transformation capacity for the area including the augmentation plan of the Company was 2,186 MVA. For the construction of SS, the Company issued (January 2017) Letter of Intent (LOI) to a firm for a contracted value of ` 176.63 crore. However, the Company could finalise the clear site for the SS from the district administration in May 2017 and could hand over the site to the firm after the completion of civil works in September 2018 i.e. four years after the approval of the TWC. Thus, it is evident from the above that although the construction of 400 KV SS was proposed to cater the electricity demand of the city of Lucknow by the year 2015, yet the construction of SS commenced after three years (September 2018) from the year of anticipated demand. The Company stated (May 2019) that the delay in finalising the land was due to delay in availability of suitable land from the district administration and necessary permissions from the Mining Department for soil filling. The Government also endorsed (September 2019) the reply of the Company. Thus, the very purpose of strengthening of the power management of the city of Lucknow was not fulfilled even after three years.
28 Bhadaini, Sankuldhara, Beniya Bag, Bhelupur, Kabir Nagar, Godowlia, Sigra and
Vidyapeeth. 29 Manduadeeh, Cantt and Sarnath.

Audit Report on Economic Sector and Public Sector Undertakings for the year ended 31 March 2018
44
Due to inability of the Company in providing clear site, getting timely clearances from MoEF, GoI, delays in issue of LOI and delayed start of civil works in case of above SSs, there were time over runs ranging from two years to seven years (up to May 2019). These delays also led to blockage of totalling funds of ` 202.23 crore (` 134.66 crore in underground cable work of 132 KV Hanuman Setu SS and ` 67.57 crore in underground cable work of 220 KV Bhelupur SS) along with avoidable burden of interest of ` 109.67 crore30 on the Company. This indicates that the Company failed to review inordinately delayed projects or address the constraints delaying these projects. SSs completed but lines not completed and vice-versa 2.26 A transmission project consists of three components viz. the substation, the feeder lines of SS and outgoing lines to feed other transmission/ distribution SSs. The delay in completion of any component of the project leads to non-utilisation of the entire transmission project and also results in blockade of funds expended on the unutilised components. Thus, the construction activities of these three components should be synchronised in such a way that the entire component is completed simultaneously. Audit noticed that in case of four transmission projects, SSs and lines valuing ` 200.08 crore were completed but related components of these SSs and lines were still incomplete as detailed in the Table-2.12 below:
Table-2.12: Details of completed and not completed components of the SSs and lines as of November 2018
Sl. No.
Name of completed component
Date of completion
Cost of completed component (` in crore)
Name of incomplete component
Period the component was unutilised till
November 2018 (in months)
Loss of interest (` in crore
calculated at the rate of 10.5 per cent on 70
per cent of the cost for unutilised
period) 1 220 KV SS
Bhadaura, Ghazipur
April 2018 47.94 220 KV Sarnath-Sahupuri feeder Line
9 2.64
2 220 KV SS Awas Vikas Lucknow
April 2018 45.42 Feeder line 9 Deposit work
3 132 KV Sangipur-Lalganj downward line
May 2017 4.01 220 KV SS Sangipur and its feeder line
18 0.44
4 400 KV DC Meja-Rewa road feeder line
January 2018
102.71 400/132 Masauli Allahabad SS
10 6.29
Total 200.08 9.37 Source: Information provided by the Company Completed components of four projects valuing ` 200.08 crore were lying unutilised for the period ranging from nine months to eighteen months. Due to non-utilisation of the completed components, funds of ` 200.08 crore remained blocked which also led to avoidable payment of interest of ` 9.37 crore. Besides, due to delay/non construction of the related
30 ` 84.84 crore in case of Hanuman Setu SS (calculated at the rate of 10.50 per cent on
` 134.66 crore for six years) and ` 24.83 crore in case of Bhelupur SS (calculated at the rate of 10.5 per cent on ` 67.57 crore for three years six months).

Chapter–II: Audit relating to Power Sector Undertaking
45
components, the intended benefits of improving the supply voltage and reducing the load on existing SSs is also delayed.
The Company accepted the fact and stated (May 2019) that the execution of related components was still in progress due to various reasons and efforts are being made to complete them. The Government also endorsed (September 2019) the reply of the Company.
Deficiency in award and execution of work of power evacuation system 2.27 The Report of the Committee for the Best Practices in Transmission System (BPITS) prepared by the CEA, MoP, Government of India recommended that long term transmission plans should be evolved for evacuation of power and also for minimisation of transmission cost and loss. For evacuation of power from three units (3 x 660 MW) of Lalitpur Thermal Power Project (LTPP), scheduled to be commissioned in December 2015, June 2016 and December 2016 respectively, one 765 KV SS, two 400 KV SSs and associated lines (Transmission system) were to be constructed by the Company. The Company executed (04 March 2014) an agreement with Power Grid Corporation of India Limited (PGCIL) for the construction of transmission system under “Element-1”31 and “Element-2”32 at an estimated cost of ` 2,236.83 crore and consultancy charge of ` 279.61 crore with a completion schedule of 27 months and 33 months respectively on the grounds of ensuring timely completion and on account of insufficient staff and experience with the Company. Audit noticed the following deficiency in award and execution of the contract with PGCIL:
2.27.1 Non provision of liquidated damages Paragraph 204 (xvi) of the General Financial Rules provides that all contracts shall contain a provision for recovery of liquidated damages for defaults on the part of the contractor. As per clause 10.1 of the agreement, the completion schedule of transmission system of LTPP was to be 27 months for “Element-1” i.e. May 2016 and 33 months for “Element-2” i.e. November 2016.
Audit noticed that the Company, while executing the agreements with all other contractors, incorporated the appropriate clause of liquidated damages (LD) which stipulated that if the contractor shall fail in the due performance of his contract within time fixed by the contract or any extension thereof, the contractor agrees to accept a reduction of the contract price by half per cent per week subject to a maximum of 10 per cent reckoned on the contract value. However, the Company did not incorporate the relevant clause of LD in the agreement executed with PGCIL. The Company could, therefore, not deduct the LD despite delayed completion of all the works of “Element-1 and 2” (which were not extended) as detailed in Table-2.13.
31 Element-1: 765 KV SS, 765 KV line-Circuit-I, 400 KV SSs and 400 KV line- circuit-I. 32 Element-2: 765 KV line-Circuit-II and 400 KV lines circuit-II.
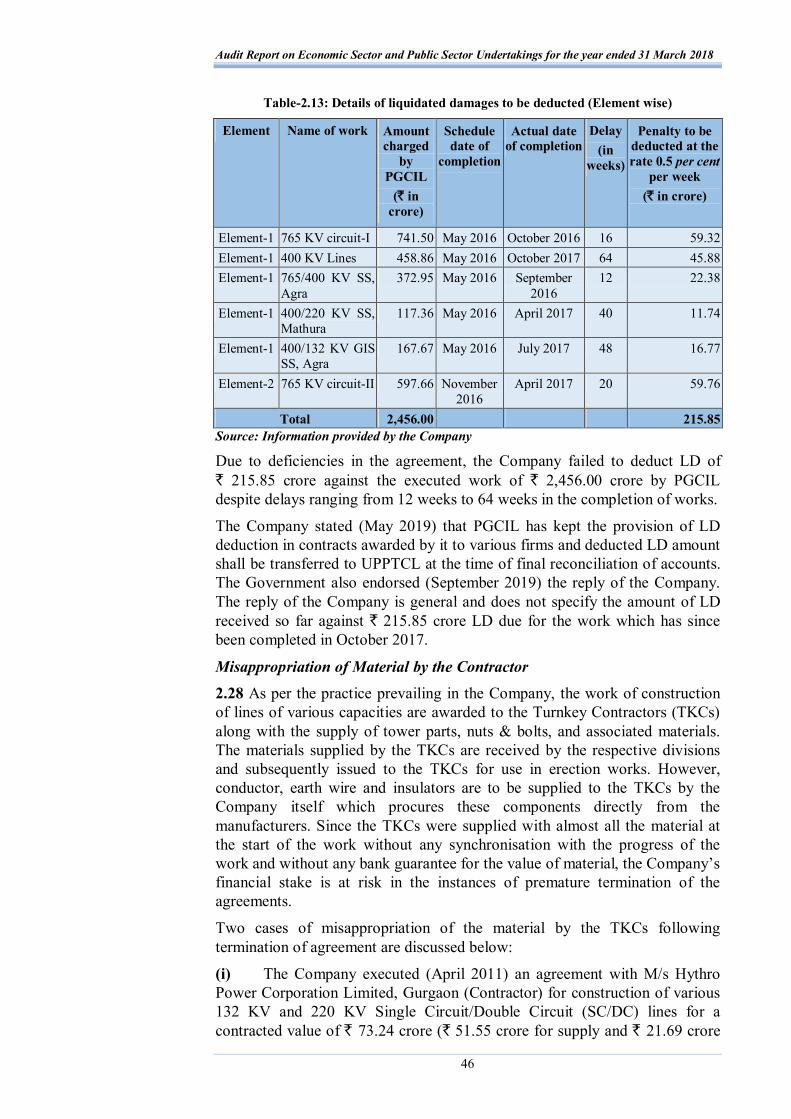
Audit Report on Economic Sector and Public Sector Undertakings for the year ended 31 March 2018
46
Table-2.13: Details of liquidated damages to be deducted (Element wise)
Element Name of work Amount charged
by PGCIL
(` in crore)
Schedule date of
completion
Actual date of completion
Delay (in
weeks)
Penalty to be deducted at the rate 0.5 per cent
per week (` in crore)
Element-1 765 KV circuit-I 741.50 May 2016 October 2016 16 59.32 Element-1 400 KV Lines 458.86 May 2016 October 2017 64 45.88 Element-1 765/400 KV SS,
Agra 372.95 May 2016 September
2016 12 22.38
Element-1 400/220 KV SS, Mathura
117.36 May 2016 April 2017 40 11.74
Element-1 400/132 KV GIS SS, Agra
167.67 May 2016 July 2017 48 16.77
Element-2 765 KV circuit-II 597.66 November 2016
April 2017 20 59.76
Total 2,456.00 215.85 Source: Information provided by the Company
Due to deficiencies in the agreement, the Company failed to deduct LD of ` 215.85 crore against the executed work of ` 2,456.00 crore by PGCIL despite delays ranging from 12 weeks to 64 weeks in the completion of works.
The Company stated (May 2019) that PGCIL has kept the provision of LD deduction in contracts awarded by it to various firms and deducted LD amount shall be transferred to UPPTCL at the time of final reconciliation of accounts. The Government also endorsed (September 2019) the reply of the Company. The reply of the Company is general and does not specify the amount of LD received so far against ` 215.85 crore LD due for the work which has since been completed in October 2017.
Misappropriation of Material by the Contractor
2.28 As per the practice prevailing in the Company, the work of construction of lines of various capacities are awarded to the Turnkey Contractors (TKCs) along with the supply of tower parts, nuts & bolts, and associated materials. The materials supplied by the TKCs are received by the respective divisions and subsequently issued to the TKCs for use in erection works. However, conductor, earth wire and insulators are to be supplied to the TKCs by the Company itself which procures these components directly from the manufacturers. Since the TKCs were supplied with almost all the material at the start of the work without any synchronisation with the progress of the work and without any bank guarantee for the value of material, the Company’s financial stake is at risk in the instances of premature termination of the agreements.
Two cases of misappropriation of the material by the TKCs following termination of agreement are discussed below:
(i) The Company executed (April 2011) an agreement with M/s Hythro Power Corporation Limited, Gurgaon (Contractor) for construction of various 132 KV and 220 KV Single Circuit/Double Circuit (SC/DC) lines for a contracted value of ` 73.24 crore (` 51.55 crore for supply and ` 21.69 crore

Chapter–II: Audit relating to Power Sector Undertaking
47
for erection). As per the terms of the agreement, all the line material (excluding conductor and earth wire) was to be supplied by the Contractor. The conductor and earth wire were supplied by the Company to the Contractor.
Audit noticed that huge quantity of line materials was supplied by the Contractor and the Company made payment for the same during 2011-12 and 2012-13. Further, during the same period, the Company also issued ACSR33 Panther conductor to the Contractor without ensuring the progress of the work as on the date of issue. Due to poor progress, and lackluster performance of the Contractor, the Company terminated (June 2015) the agreement of the Contractor and asked for appointment of his representative for verification of material instead of taking back the entire material immediately. Since, huge quantity of supplied line material by the Contractor and conductor issued by the Company was lying in the stores of the Contractor, hence, instead of asking for appointment of representative by the Contractor, the Company was required to take over the stores of the Contractor immediately after the termination of agreement. The Company failed to act promptly in taking the possession of stores of the Contractor which led to misappropriation of material valuing ` 10.03 crore by the Contractor as detailed in the Table-2.14 below:
Table-2.14: Details of materials issued, utilised and not returned
Sl. No.
Name of material Qty. issued to Contractor
Qty. used and returned by Contractor
Balance qty. not
returned
Value of balance quantity
(` in crore) 1 Tower parts (in MT) 2,223.65 1,500.55 723.10 6.50 2 ACSR Panther conductor
(in KM) 685.60 378.95 306.65 3.53
Total 10.03 Source: Information provided by the Company
The Company has not taken any legal action for recovery of the material.
The Government/Company stated (September 2019) that an amount of ` 23.87 crore being the retention money/PBG had been forfeited. Further, a new clause has been introduced that at no point of time, the material costing more than 250 per cent of the PBG will be provided to the TKCs. The reply is not acceptable as the PBG is taken to ensure adherence with the quality and performance parameters of the contract. There was no provision in the agreement to safeguard the financial interest of the Company for material issued to the Contractor. Hence, the agreement was deficient to that extent. The reply does not address the action taken against the officials responsible for framing the deficient agreement.
(ii) The Company awarded (November 2010) tender for the work of Supply, Erection, Testing & Commissioning of 400 KV DC line in two packages34 to the Maharashtra Power Transmission Structure Private Limited (Contractor) for total contracted value of ` 90.96 crore and ` 205.94 crore respectively. As per the agreement, all the required material for 33 Aluminium Conductor Steel Re-enforced. 34 400 KV DC Banda-Orai for 100 KM under package-1 and 400 KV DC Banda-Allahabad
for 200 KM under package-2.

Audit Report on Economic Sector and Public Sector Undertakings for the year ended 31 March 2018
48
construction of line (excluding ACSR Moose conductor, earth wire and OPGW35) was to be supplied and erected by the Contractor. For construction of line, Moose conductor and earth wire were to be provided by the Company to the Contractor.
Audit noticed that almost all the material required for construction of line which was supplied by the Contractor was paid for by the Company and issued to him. Out of this stock, the Contractor used some material. But, due to poor progress and on account of reluctance of the Contractor, the agreement was terminated (May 2014) by the Company. Since, all the materials including ACSR Moose conductor and earth wire had already been supplied by the Company by the termination date, and were in the custody of the Contractor, hence, to avoid the misappropriation of Company’s materials, the Company was required to act promptly and take back the materials lying in the possession of the Contractor. Instead, the Company wasted 30 months in asking the Contractor for reconciliation of the stores. After passage of more than 30 months, the Company started (December 2016) to take over the stores of the Contractors and found that a huge quantity of material valuing ` 21.28 crore was missing as per details given in the Table-2.15:
Table-2.15: Details of materials issued, utilised and not returned
Sl. No.
Name of material Quantity issued to
Contractor
Quantity used and
returned by Contractor
Balance quantity
not returned
Value of the balance
quantity (` in crore)
1 Tower parts & Nut bolts (in MT) 5,660.54 3,560.05 2,100.49 19.03 2 ACSR Moose conductor & Earth
wire (in KM) 913.44 823.04 90.40 1.26
3 Insulator (in No.) 39,400 28,509 10,891 0.99 Total 21.28
Source: Information provided by the Company
The Company stated (May 2019) that a claim worth ` 134.05 crore has been lodged against the Contractor which includes cost of material not returned. The Government also endorsed (September 2019) the reply of the Company.
Thus, due to failure of the Company in instituting a mechanism to safeguard its financial interest before issue of material to the Contractor and inaction on part of the Company in taking back the store material, immediately after the termination of the contract, the material worth ` 31.31 crore was misappropriated by the defaulting contractors. It also indicates weak Internal control.
Time and cost overrun due to delayed termination of agreement
2.29 The Company executed (June 2010) two agreements with two contractors for contracted values of ` 201.30 crore and ` 218.04 crore for construction of 765 KV line from Anpara to Jhusi (segment-1) and from Jhusi to Unnao (segment-2) respectively with completion schedule of 24 months i.e. up to February 2012.
Audit noticed that against the completion schedule up to February 2012, Segment-2 was completed in December 2017 with cost of ` 348.38 crore. However, the work of Segment-1 had been disrupted from May 2014 due to
35 Optical Fibre Ground Wire.

Chapter–II: Audit relating to Power Sector Undertaking
49
non-obtaining of timely clearance from MoEF, GoI. The clearance from MoEF could be obtained by the Company in June 2016. However, even after the MoEF clearance, the contractor did not start the work in right earnest. The Company, instead of terminating the agreement, issued several notices to the contractor and finally terminated the agreement only in July 2018 (after lapse of two years after MoEF clearance was obtained) and awarded (September 2018) the balance work to other contractor for the contract value of ` 93.98 crore. Audit further noticed that the Company had released payment of ` 238.95 crore to the first contractor against awarded value of ` 201.03 crore and awarded the balance work to the other contractor for ` 93.98 crore. Thus, there was a cost overrun of ` 30.93 crore (` 238.95 crore + ` 93.98 crore - ` 302 crore including 50 per cent positive variation in BOQ of 201.30 crore). Further, due to non-completion of segment-1 of the line, the completed segment-2 valuing ` 348.38 crore was also lying idle since December 2017 and expenditure incurred of ` 348.38 crore on segment-2 also remained blocked resulting in loss of interest of ` 36.58 crore36.
The Company stated (May 2019) that notices were issued and efforts were being made to handhold the firm to somehow make it execute its assigned work. The Government also endorsed (September 2019) the reply of the Company. The fact remains that delay of two years in termination of the contract was not justified.
Payment to contractor without receipt of material by Electricity Transmission Division Banda
2.30 For construction of 400 KV DC Quad Banda-Allahabad Line, M/s Maharashtra Power Transmission Structures Limited (Firm) submitted a bill for supply of tower material of 206.718 MT valuing ` 1.32 crore in Electricity Transmission Division (ETD)-II, Kanpur, receipt of which was recorded (July 2012) in the Measurement Book of the Junior Engineer (JE) of ETD-II, Kanpur. However, the division did not make the payment.
In the meantime, the firm submitted the same bill to ETD-Banda without actual supply of material. Audit noticed that the JE ETD-Banda recorded (September 2012) the receipt of material and the division released (January 2013) the payment without actual receipt of material.
Thus, with the connivance of the officials of ETD, Banda, the division made payment of ` 1.32 crore towards purchase of material which was not actually received by the Division. Although the above matter came to the notice of the Company in November 2013, no action has been taken against the concerned officials.
The Government/Company stated (September 2019) that no double payment was made to the firm. It further stated that care has been taken to ensure that this type of incident does not recur. Further, instruction has been issued to examine the matter and take necessary action. The fact remains that no disciplinary action was taken against the concerned officials of ETD-Banda
36 Calculated at the rate of 10.5 per cent (being the lowest rate of interest of loan taken from
REC by the Company during 2013-14 to 2017-18) per annum for one year.
Audit Report on Economic Sector and Public Sector Undertakings for the year ended 31 March 2018
50
for recording the receipt of material without receiving and releasing payment without actual receipt of material. It also indicates lack of internal controls that could have detected and prevented such instances.
Recommendations: The Company should initiate all parallel activities relating to implementation of the project to avoid delay in its completion. It should have a review mechanism to revalidate the justification of the construction of substations which were inordinately delayed. It should devise and implement contract conditions in the manner to safeguard the financial interest of the Company.
Fund Management 2.31 For the construction of transmission projects, the Fund Wing of the Company draws loans from REC/PFC for the portion of 70 per cent and avails the equity from the State Government for the balance 30 per cent portion. The loans and equity were drawn against the liability of the payment to be made during the year. The Wing was overall responsible for financial linking of the procurement and project packages and raising of funds from Financial Institutions as per requirement to avoid the burden of interest.
The deficiencies noticed in the funds management are discussed below:
Failure in obtaining the funds against the works under deposit head
2.32 As per the practice prevailing in the Company, the works under deposit head were executed after receiving the full cost of estimates from the user utility. Any increase/decrease in the cost of the work was also receivable from/payable to the user utility after preparation of executed estimate37. The cases where the Company executed the works under deposit head without receiving full cost of estimates and failed to recover the amount till date are discussed below: The Company constructed two 220 KV SSs, one for CG City (Lucknow Development Authority), Lucknow which was completed in March 2018 and the another for Awadh Vihar Yojna (Awas Evam Vikas Parishad), Lucknow which was under progress (92 per cent completed as on May 2018) under deposit head without receipt of full estimated cost of ` 99.92 crore and ` 112.08 crore respectively. The Company could recover only ` 57.86 crore and ` 60 crore from Lucknow Development Authority and Awas Evam Vikas Parishad respectively. Thus, due to execution of work without obtaining full deposit amount under deposit head, an amount of ` 94.14 crore remained unrecovered till date. The Company (May 2019) stated that reminders/letters were being sent for deposit of the balance amount. The Government also endorsed (September 2019) the reply of the Company.
Failure to obtain grant from GoI under PSDF Scheme 2.33 The Ministry of Power, GoI, approved (January 2014) the scheme for transmission system strengthening work under Power System Development Fund (PSDF). As per the scheme, the works were funded as grant for 90 per cent or 75 per cent on case to case basis. Accordingly, the Company 37 Executed estimates have been prepared after the execution of work to assess the actual cost
of the work done.

Chapter–II: Audit relating to Power Sector Undertaking
51
prepared two estimates for the ‘Up-gradation of protection and control system’ (` 279.19 crore) as well as work of ‘Re-conductoring of various lines’ (` 80.00 crore). The Company sent (November 2014) these two proposals to MoP, GoI for funding under PSDF scheme. However, the Company issued (March 2015 and August 2015) LOIs of ` 90.23 crore38 without waiting for the formal sanction of the MoP, GoI under PSDF Scheme. The MoP, GoI sanctioned the above works for ` 282.94 crore39 in May 2015 and March 2016. However, MoP, GoI did not fund LOIs which were issued by the Company before the sanction of the estimates by the MoP, GoI. Thus, the Company could not receive the grant of ` 69.21 crore40 due to its hasty decision in issuing of LOIs before formal sanction of these works under PSDF Scheme by MoP, GoI. The works are being financed internally now.
The Company stated (May 2019) that it was not aware of the fact that grant would not be given if LOI had been issued before sanction. The Government also endorsed (September 2019) the reply of the Company. The reply is not acceptable as issue of LOIs before sanction of the Scheme was against the common financial prudence.
Non-disposal of old/damaged transformers 2.34 In para no. 2.1.52 in the Performance Audit of UPPTCL, featured in Audit Report of the Comptroller and Auditor General of India (Public Sector Undertakings) for the year ended 31 March 2012, Government of Uttar Pradesh, it was stated the Company did not dispose damaged and uneconomical transformers. Audit further noticed that in five units out of 42 test checked units, 11 old/damaged and uneconomical transformers of various capacities were lying for disposal for periods ranging from one year to twelve years. Despite the passage of time from one to twelve years, no pursuance regarding disposal of these old/damaged transformers has been done by the Company which led to blockage of funds of ` 7.70 crore (40 per cent of the cost of new transformer). The Company stated (May 2019) that tender for disposal of these transformers is under process. The Government also endorsed (September 2019) the reply of the Company.
Monitoring Mechanism
Internal Audit 2.35 Since, the Company did not have its own Internal Audit Wing, they instead, appointed empanelled Chartered Accountant (CA) firms to do the work. It was observed that the Internal Audit Reports did not include detailed technical audits or comments upon propriety of expenditure. Further, no mechanism was created within the Company to review and pursue compliance with the Internal Audit observations. As a result, the overall internal audit mechanism was ineffective.
38 ` 10.23 crore for Up-gradation of protection and control system in March 2015 and
` 80.00 crore for Re-conductoring of various lines in August 2015. 39 Up-gradation of protection and control system for ` 202.94 crore and Re-conductoring of
various lines for ` 80.00 crore. 40 ` 9.21 crore (90 per cent of ` 10.23 crore) plus 60.00 crore (75 per cent of ` 80.00 crore).
Audit Report on Economic Sector and Public Sector Undertakings for the year ended 31 March 2018
52
The Company stated (May 2019) that due to shortage of regular employees, required strength of Internal Audit wing of the Company remains to be built up. The Government also endorsed (September 2019) the reply of the Company. The fact remains that the internal audit mechanism was not effective. 2.36 An effective monitoring mechanism plays a vital role in efficient implementation and execution of the projects as well as in efficient operation of the transmission system.
Audit noticed that the Management had failed to take necessary steps in planning of new SSs or augmentation of old SSs, for reviewing inordinately delayed projects, making critical procurements in synchronisation with project execution and in ensuing recovery of the amounts from both the contractors and clients as discussed in earlier paragraphs. These were largely due to deficient monitoring on part of the Management.
The Company stated (May 2019) that the reasons for inordinate delay were generally beyond control and due to unforeseen circumstances. The Government also endorsed (September 2019) the reply of the Company. However, no evidence of any proactive steps taken by the Management were evident during the course of Audit.
Recommendations: The Company should strengthen its fund management and monitoring mechanism. The Company should have its own Internal Audit Wing.
Conclusions:
The conclusions with respect to Audit objectives are as follows: 1. In the absence of Project Planning and Management Manual, the projects were not being conceptualised properly. The planning of the identified projects was inadequate resulting in substations becoming overloaded within one year of commissioning on one hand and creation of idle capacity in other substations on the other hand.
(Paragraphs 2.13 and 2.14)
2. The Company neither prepared a Purchase Policy/Procurement Manual nor put in place a mechanism for planning procurement in synchronisation with project execution. It also failed to ensure the compliance of the vital clauses of the contract. The ad-hoc system of procurement of goods and services resulted in extra expenditure of ` 36.91 crore and fund amounting to ` 24.75 crore remained blocked.
(Paragraphs 2.15 to 2.20)
3. The Company failed to execute most of the projects within the set time frame. It did not have a mechanism to review the justification of construction of inordinately delayed projects. Instances of deficiencies in award and execution of contracts and deficiencies in agreements were noticed. The Company incurred extra expenditure and suffered loss of interest of ` 433.71 crore. An amount of ` 750.69 crore of the Company also remained blocked. The Company also lacked any formal review
Chapter–II: Audit relating to Power Sector Undertaking
53
mechanism for monitoring projects that could help it in identifying potential bottlenecks and taking corrective action.
(Paragraphs 2.21 to 2.30) 4. Imprudent fund management by carrying out deposit works without receipt of full estimated cost of the works and issue of Letter of Intents (LoIs) before sanction of projects under Power System Development Fund Scheme of Ministry of Power, Government of India resulted in loss of ` 69.21 crore and blockade of funds of ` 94.14 crore. The Company did not have its own Internal Audit Wing resulting in ineffective internal audit mechanism.
(Paragraphs 2.31 to 2.35)


CHAPTER–III Compliance Audit observations relating
to Power Sector Undertakings


55
CHAPTER-III
3. Compliance Audit Observations relating to Power Sector Undertakings
Important audit findings emerging from test check of transactions made by the Public Sector Undertakings relating to Power Sector are included in this Chapter.
Energy Department
Madhyanchal Vidyut Vitran Nigam Limited
3.1 Avoidable loss of revenue
Madhyanchal Vidyut Vitran Nigam Limited suffered loss of revenue of ` 3.26 crore due to incorrect billing to a consumer.
Clause 5.3 (Supply and Installation of Meter) of the Uttar Pradesh Electricity Supply Code, 2005 (Supply Code) provides that if supply to a HT/EHT consumer is given on an independent feeder for his exclusive use, the metering arrangement shall be installed at the consumer’s premises or, if mutually agreed, the metering arrangement at the sub-station of the Licensee may be used for billing and no meter need be installed at the premises of the consumer.
The Tariff Orders1, applicable to High Voltage (HV)-4 category2 consumers (Lift Irrigation Works), provide the rates at which the applicable demand and energy charges shall be billed for the actual consumption of electricity. The Tariff Orders, further, provide for levy of monthly ‘minimum charges3’ if the sum of demand charges and energy charges, in any particular month, is less than the Minimum charges.
A consumer in Electricity Distribution Division- Balrampur (Division) of the Madhyanchal Vidyut Vitran Nigam Limited (Company) had a contracted load of 2,500 kVA and was getting supply through independent feeder of 132 kV Sub-station-Balrampur. No meter was installed at the Consumer’s premises and the Division was preparing bills on the basis of contracted demand and consumption recorded in the meter installed at its 132 kV Sub-station-Balrampur under HV-4 category.
Audit noticed (May 2017) that the Company suffered loss of ` 7.37 crore due to incorrect billing by the Division during the period from January 2015 to September 2018 (Appendix-3.1) as discussed below:
(i) Though the actual consumption charges in 27 out of 45 months during the period from January 2015 to September 2018 were less than the prescribed monthly minimum charges, yet the Division billed the Consumer on the basis
1 Tariff Order 2014-15 dated 12 October 2014, 2015-16 dated 28 June 2015, 2016-17 dated
10 August 2016 and 2017-18 dated 09 December 2017. 2 The Rate Schedule (HV-4) applies to medium and large pumped canals having load of more
than 100 BHP (75kW). 3 Minimum charges are computed at the prescribed rates on contracted load and further, it
also includes additional charges such as Electricity Duty, Regulatory Surcharges, etc.

Audit Report on Economic Sector and Public Sector Undertakings for the year ended 31 March 2018
56
of actual consumption. This resulted in loss of revenue of ` 2.00 crore as detailed in the Appendix-3.2 (a).
(ii) The Division had issued bills amounting to ` 9.29 crore in 28 out of 45 months during the period from January 2015 to September 2018. However, the consumer had arbitrarily and without any criteria on record verified the bills amounting to ` 5.92 crore only on the pretext of non-installation of meter at its premises. However, the Division did not carry forward the amount short verified against the billed amount as arrear in forthcoming bills of the Consumer. This resulted in short verification of billed amount by ` 3.37 crore as detailed in the Appendix-3.2(b). Moreover, reasons for non-installation of meter at the premises of the consumer since inception remained unexplained as no mutual agreement in this regard was entered into between the Division and the consumer.
(iii) During the period from January 2015 to September 2018, in 18 out of 45 months, the Division had prepared bills on the basis of the contracted load instead of the billable load4 which was significantly higher with range from two per cent to 472 per cent in five months and lower with range from 10 per cent to 88 per cent in 13 months of the contracted load of 2500 kVA. Further, it did not charge due penalty5. This resulted in loss of revenue of ` 2.00 crore as detailed in the Appendix 3.2 (c). The error came to the notice of the Management when reported (May 2017) by the Audit. However, the error was persisting till September 2018.
In the reply, the Management/Government stated (August 2019/ September 2019) that out of ` 7.37 crore as pointed out by the Audit, bills for an amount of ` 4.11 crore has been got verified from the consumer. Regarding short verification of ` 3.26 crore, it was stated that the same could not be billed to the consumer as the feeder line of the consumer was tapped during September 2016, September 2017 and October 2018 to provide energy to the consumers of Utraula region due to Utraula line being affected by flood. Hence, the consumer was billed for minimum charges during this period.
However, the reply did not mention how the difference amount of ` 3.26 crore has been compensated even after specifically being asked by the Audit in August 2019.
4 General provision of Rate Schedule of Tariff Order stipulates that Billable Load/Demand
during a month shall be the actual maximum load/ demand as recorded by the meter or 75 per cent of the contracted load/demand, whichever is higher.
5 General provision of Rate Schedule of Tariff Orders stipulates that if the maximum load/demand in any month, exceeds the contracted load/demand, then such excess load/demand shall be levied equal to 200 per cent of the normal rate apart from the normal fixed/demand charges as per the maximum load/demand recorded by the meter.
Chapter–III: Compliance Audit Observations
57
Audit Impact In the following cases, recoveries were made at the instance of audit:
Purvanchal Vidyut Vitran Nigam Limited 3.2 Recovery of ` 1.15 crore towards short levy of minimum charges The Tariff Orders for the years 2015-16 and 2016-17, approved by the Uttar Pradesh Electricity Regulatory Commission and applicable to High Voltage (HV)-3 category Consumers (Railway Traction), provide that a consumer shall be billed on the basis of ‘minimum charges’ only when the sum of actual demand and energy charges are less than the minimum charges. Further, General Provision of the Tariff Orders provides that monthly minimum charges are to be computed at the contracted load. After being pointed by Audit in August 2017, that the minimum charges during the period August 2015 to July 2016 of a consumer were incorrectly calculated at 75 per cent of the contracted load contrary to the 100 per cent of the contracted load, the Electricity Urban Distribution Division-III Gorakhpur of the Purvanchal Vidyut Vitran Nigam Limited issued (January 2018) supplementary bill of ` 1.15 crore for recovery of the short charged amount of minimum charges and recovered the same from the Consumer in April 2018.
Madhyanchal Vidyut Vitran Nigam Limited 3.3 Recovery of ` 1.82 crore towards interest on mobilisation advance In contravention of the CVC guidelines (April 2007) regarding recovery of interest free mobilisation advance (MA), the Madhyanchal Vidyut Vitran Nigam Limited (Company) neither fixed any time schedule for recovery of mobilisation advance nor stipulated any provision in this regard in an agreement (September 2012) with a contractor for supply and erection work of ‘System Improvement, Strengthening and Augmentation of Distribution System in Shahjahapur Town’ under R-APDRP Part-B scheme on turnkey basis at a cost of ` 81.54 crore with the date of completion December 2013. The Company provided (October 2012) interest free mobilisation advance of ` 8.15 crore to the Contractor. Audit noticed that the Company deducted ten per cent of the value of bills against mobilisation advance from the bills submitted by the contractor. However, only ` 0.22 crore could be recovered against the MA upto the scheduled completion date i.e. December 2013. As work could not be completed within scheduled period, the contractor enjoyed interest free mobilisation advance upto January 2018 instead of December 2013. This had resulted in an interest loss of ` 1.82 crore to the Company on unrecovered amount of advance during the period from January 2014 to January 2018.
After being pointed out by Audit in November 2017, the Management recovered ` 1.82 crore against loss of interest from the pending bills of Contractor in March 2019.
Audit Report on Economic Sector and Public Sector Undertakings for the year ended 31 March 2018
58
Uttar Pradesh Power Transmission Corporation Limited 3.4 Recovery of ` 2.92 crore towards shut down charges Uttar Pradesh Power Transmission Corporation Limited (UPPTCL) realises shut down charges from external agencies who request for line shifting, height raising or for allotment of shutdown of transmission lines at the rates approved by the Board of Directors (BoD) of the UPPTCL. Rates applicable with effect from 30 October 2009 were further revised (May 2016) by the BoD with effect from 03 August 2016. After being pointed out by Audit in September 2017, the Electricity Transmission Division-I, Varanasi included the shutdown charges amounting to ` 2.92 crore in five executed estimates of height raising works of 132 KV transmission lines relating to the four external agencies and the same were recovered from the concerned agencies in June 2019.

PART-II State Public Sector Undertakings
(other than Power Sector)

CHAPTER–IV Functioning of State Public Sector
Undertakings (other than Power Sector)

PART II
Chapter IV
Functioning of State Public Sector Undertakings (other than Power Sector)
Introduction 4.1 There were 92 State Public Sector Undertakings (PSUs) as on 31 March 2018 which were related to sectors other than Power Sector. These State PSUs were incorporated during the period between 1954-55 and 2016-17 and included 86 Government Companies and 6 Statutory Corporations i.e. Uttar Pradesh Avas Evam Vikas Parishad, Uttar Pradesh Jal Nigam, Uttar Pradesh Financial Corporation, Uttar Pradesh State Road Transport Corporation, Uttar Pradesh State Warehousing Corporation and Uttar Pradesh Forest Corporation. These Government Companies further included 43 non-functional companies and 16 subsidiary companies1 owned by other Government Companies. Four companies2 were added during the year 2017-18. The nature of these PSUs in other than power sector is indicated in Table 4.1:
Table 4.1: Nature of PSUs (other than power sector) in Uttar Pradesh
Number of PSUs covered in this Chapter
Accounts up to
Nature of the PSUs
Total number
Accounts up to 2017-18 2016-17 2015-16
Total
Number of PSUs not
covered in this
Chapter Government Companies
80 4 7 4 15 65
Statutory Corporations
6 - 3 1 4 2
Total Companies/ Corporations
86 4 10 5 19 67
Government Controlled other Companies
6 1 1 - 2 4
Total 92 5 11 5 21 71
The chapter covers financial performance of 21 PSUs as detailed in Appendix-4.1. It does not include 71 PSUs (including four Government Controlled Other Companies) whose accounts were in arrears for three years or more or were defunct/under liquidation or first accounts were not received or were not due as detailed in Appendix-4.2. The State Government provides financial support to the State PSUs in the shape of equity, loans and grants/subsidy from time to time. Of the 92 State PSUs, the State Government invested funds in 69 State PSUs (in 67 PSUs equity and in 2 PSUs3 only loans) only. The State Government did not directly infuse any equity in 25 PSUs which includes 15 subsidiary companies in
1 SI No. 11 and 12 of Appendix-4.1 and 15, 29, 31, 32, 33, 35, 38, 63 and 65 to 70 of
Appendix-4.2. 2 Sl. No 4 and 19 of Appendix-4.1 and 25 and 26 of Appendix-4.2. 3 Uttar Pradesh Jal Nigam and Uttar Pradesh Carbide and Chemical Limited.

Audit Report on Economic Sector and Public Sector Undertakings for the year ended 31 March 2018
60
which equity was contributed through their holding companies4, three companies5 in which the equity was jointly contributed by more than one Government companies, three smart city companies6 and Noida Metro Rail Corporation Limited in which equity were contributed by Autonomous Bodies and three Statutory corporations7 in which there was no equity of the State Government. Contribution to Economy of the State 4.2 A ratio of turnover of the 21 PSUs covered in this Chapter to the Gross State Domestic Product (GSDP) shows the extent of activities of these PSUs in the State economy. The Table 4.2 below provides the details of turnover of these 21 State PSUs (other than Power Sector) and GSDP of Uttar Pradesh for a period of four years ending March 2018: Table 4.2: Details of turnover of State PSUs (other than Power Sector) vis-a-vis GSDP of
Uttar Pradesh (` in crore)
Particulars 2014-15 2015-16 2016-17 2017-18 Turnover8 5889.00 6861.86 7699.57 7725.28 Percentage change in turnover as compared to turnover of preceding year
- 16.52 12.21 0.33
GSDP of Uttar Pradesh 1011790 1137210 1250213 1375607 Percentage change in GSDP as compared to GSDP of preceding year
- 12.40 9.94 10.03
Percentage of Turnover to GSDP of Uttar Pradesh
0.58 0.60 0.62 0.56
Source: Compiled based on turnover figures of PSUs (other than Power Sector) and GSDP figures issued by Ministry of Statistics and Program Implementation, Government of India. The turnover of these 21 PSUs has shown increasing trend during 2015-16 to 2017-18. The increase in turnover ranged between 0.33 per cent and 16.52 per cent during the period 2015-18 whereas increase in GSDP of the Uttar Pradesh ranged between 9.94 per cent and 12.40 per cent during the same period. The compounded annual growth9 of GSDP was 10.78 per cent during last three years. The compounded annual growth is a useful method to measure growth rate over multiple time periods. Against the compounded annual growth of 10.78 per cent of the GSDP, the turnover of non-power sector undertakings recorded lower compounded annual growth of 9.47 per cent during last three years. This resulted in marginal decrease in the share of turnover of these PSUs to the GSDP from 0.58 per cent in 2014-15 to 0.56 per cent in 2017-18.
Investment in State PSUs (other than Power Sector) 4.3 Details of investment in equity and long term loans in 21 State PSUs (PSUs covered in this Chapter) upto 31 March 2018 are detailed in Appendix-4.3. The PSUs covered in this Chapter fall in the following three categories: 4 Government of Uttar Pradesh released equity to six Holding companies (SI No. 13 of
Appendix-4.1 and SI No. 1, 11, 16, 30 and 37 of Appendix-4.2) on behalf of their subsidiary companies.
5 SI No. 3 of Appendix-4.1 and SI No.59 and 71 of Appendix-4.2. 6 SI No. 4 of Appendix-4.1 and SI No. 25 to 26 of Appendix-4.2. 7 Uttar Pradesh Avas Evam Vikas Parishad, Uttar Pradesh Forest Corporation and Uttar
Pradesh Jal Nigam. 8 As per latest finalised accounts. 9 Rate of Compounded Annual Growth [{(Value of 2017-18/Value of 2014-15)^(1/3 years)}-1]*100.

Chapter-IV: Functioning of State Public Sector Undertakings (other than Power Sector)
61
i. PSUs not in open market competition (monopolistic PSUs): In Uttar Pradesh, out of 21 functional PSUs, eight PSUs fall under this category as they have monopolistic/oligopolistic nature of operations i.e. their operations do not have any competition or have very limited competition.
ii. PSUs with assured source of income: This category includes PSUs whose major income comes from Assured Sources of Income such as Government grants/subsidies, centage, commission, interest on bank deposits etc. 11 PSUs fall under this category.
iii. PSUs in competitive sector: This category includes two PSUs, which are open to market competition.
4.4 The sector-wise summary of investment in these State PSUs as on 31 March 2018 is given in Table 4.3 below:
Table 4.3: Sector-wise investment in State PSUs (other than power sector)
Investment (` in crore)
Equity Long term loans
Sector Number of PSUs
GoUP GoI Others10 GoUP GoI Others Total
PSUs covered in this Chapter PSUs in Monopolistic Sector
8 1861.74 1795.55 493.50 731.77 247.00 2965.05 8094.61
PSUs with Assured Source of Income
11 103.22 1.00 11.29 117.88 0 5.11 238.50
PSUs in Competitive Environment
2 203.82 0 25.00 845.33 0 0 1074.15
Total of PSUs covered in this Chapter
21 2168.78 1796.55 529.79 1694.98 247.00 2970.16 9407.26
PSUs not covered in this Chapter
71 2591.62 123.41 350.25 2149.89 1.10 1981.21 7197.48
Grand Total 92 4760.40 1919.96 880.04 3844.87 248.10 4951.37 16604.74 Source: Compiled based on annual accounts of PSUs, sanction/release orders for equity and loans and information provided by PSUs.
As on 31 March 2018, the face value11 of total investment (equity and long term loans) in 21 PSUs covered in this Chapter was ` 9,407.26 crore. The investment consisted of 47.78 per cent towards equity and 52.22 per cent in long-term loans. The long term loans advanced by the State Government constituted 34.51 per cent (` 1,694.98 crore) of the total long term loans whereas 65.49 per cent (` 3,217.16 crore) of the total long term loans were availed from other financial institutions like European Investment Bank and NCR Planning Board. The investment has grown by 243.92 per cent from ` 2,735.27 crore in 2015-16 to ` 9,407.26 crore in 2017-18. The investment increased due to addition of ` 2,727.51 crore and ` 3,944.48 crore towards equity and long term loans respectively during 2015-16 to 2017-18.
Disinvestment, restructuring and privatisation of State PSUs (other than Power Sector) 4.5 During the year 2017-18, no disinvestment, restructuring or privatisation was done by the State Government in State PSUs.
10 Others includes investment by Holding Companies, financial institutions, banks, etc. 11 The original cost of the equity shares paid by the subscribers to the equity shares.
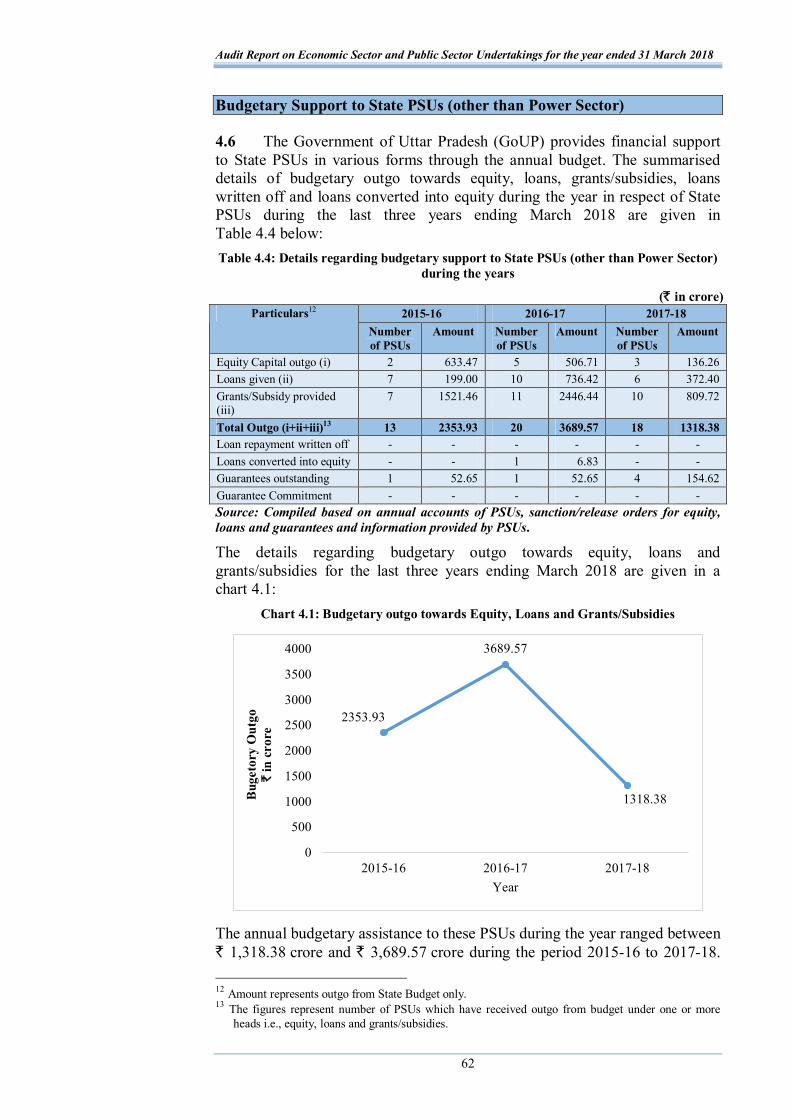
Audit Report on Economic Sector and Public Sector Undertakings for the year ended 31 March 2018
62
Budgetary Support to State PSUs (other than Power Sector)
4.6 The Government of Uttar Pradesh (GoUP) provides financial support to State PSUs in various forms through the annual budget. The summarised details of budgetary outgo towards equity, loans, grants/subsidies, loans written off and loans converted into equity during the year in respect of State PSUs during the last three years ending March 2018 are given in Table 4.4 below: Table 4.4: Details regarding budgetary support to State PSUs (other than Power Sector)
during the years
(` in crore) 2015-16 2016-17 2017-18 Particulars12
Number of PSUs
Amount Number of PSUs
Amount Number of PSUs
Amount
Equity Capital outgo (i) 2 633.47 5 506.71 3 136.26 Loans given (ii) 7 199.00 10 736.42 6 372.40 Grants/Subsidy provided (iii)
7 1521.46 11 2446.44 10 809.72
Total Outgo (i+ii+iii)13 13 2353.93 20 3689.57 18 1318.38 Loan repayment written off - - - - - - Loans converted into equity - - 1 6.83 - - Guarantees outstanding 1 52.65 1 52.65 4 154.62 Guarantee Commitment - - - - - - Source: Compiled based on annual accounts of PSUs, sanction/release orders for equity, loans and guarantees and information provided by PSUs.
The details regarding budgetary outgo towards equity, loans and grants/subsidies for the last three years ending March 2018 are given in a chart 4.1:
Chart 4.1: Budgetary outgo towards Equity, Loans and Grants/Subsidies
2353.93
3689.57
1318.38
0
500
1000
1500
2000
2500
3000
3500
4000
2015-16 2016-17 2017-18
Bug
etor
y O
utgo
`
in c
rore
Year
The annual budgetary assistance to these PSUs during the year ranged between ` 1,318.38 crore and ` 3,689.57 crore during the period 2015-16 to 2017-18. 12 Amount represents outgo from State Budget only. 13 The figures represent number of PSUs which have received outgo from budget under one or more
heads i.e., equity, loans and grants/subsidies.

Chapter-IV: Functioning of State Public Sector Undertakings (other than Power Sector)
63
The budgetary assistance ` 1,318.38 crore received during the year 2017-18 included ` 136.26 crore, ` 372.40 crore and ` 809.72 crore in form of equity, loans and grants/subsidy respectively. Out of grants of ` 809.72 crore given by the State Government during the year 2017-18, ` 766.82 crore was provided to Uttar Pradesh Jal Nigam to meet out their establishment expenditure.
In order to enable PSUs to obtain financial assistance from banks and financial Institutions, Government of Uttar Pradesh (GoUP) gives guarantee for which the guarantee commission is being charged at the rate of 0.25 per cent to 1 per cent as decided by the GoUP (15 September 2000) depending upon the loanees. Outstanding guarantee stood at ` 154.62 crore in 2017-18. During the year 2017-18, no guarantee commission was paid by the PSUs.
Reconciliation with Finance Accounts of Uttar Pradesh
4.7 The figures in respect of equity, loans and guarantees outstanding as per records of all State PSUs should agree with that of the figures appearing in the Finance Accounts of the Government of Uttar Pradesh. In case the figures do not agree, the concerned PSUs and the Finance Department should carry out reconciliation of the differences. The position in this regard as on 31 March 2018 is given in Table 4.5:
Table 4.5: Equity, loans and guarantees outstanding as per Finance Accounts of Government of Uttar Pradesh vis-à-vis records of State PSUs (other than Power Sector)
(` in crore) Outstanding in
respect of Amount as per
records of State PSUs Amount as per Finance
Accounts Difference
Equity 4760.40 5457.09 -696.69 Loans 3844.87 2845.84 999.03
Guarantees 154.62 90.01 64.61 Source: Compiled based on annual accounts of PSUs, sanction/release orders for equity, loans and guarantees, information received from PSUs and Finance Accounts.
Audit observed that out of State PSUs, such differences occurred in respect of 50 PSUs14 as shown in Appendix-4.4. The differences between the figures are persisting since last many years. The issue of reconciliation of differences was also taken up with the PSUs and the Departments from time to time. Major difference in balances was observed in Uttar Pradesh Jal Nigam, Uttar Pradesh Rajya Chini Evam Ganna Vikas Nigam Limited and Uttar Pradesh State Sugar Corporation Limited (Sl No. 48, 36 and 37 of Appendix-4.4 respectively). Audit, therefore, recommend that the State Government and the respective PSUs should reconcile the differences in a time-bound manner. Submission of accounts by State PSUs (other than Power Sector) 4.8 Of the total 92 State PSUs (other than Power Sector), there were 49 functional PSUs i.e. 43 Government companies and six Statutory corporations and 43 non-functional PSUs under the purview of CAG as of 31 March 2018. The status of timelines followed by the State PSUs in preparation of accounts is as follows:
14 Sl. No. 1, 7, 8, 13, 16, 19 to 23, 26, 29, 32, 36 to 45, 48, 49, 51, 55 to 58, 60 to 66, 68, 69,
71, 72, 74 to 78, 82, 83, 85, 90 of Appendix-4.4.

Audit Report on Economic Sector and Public Sector Undertakings for the year ended 31 March 2018
64
Timeliness in preparation of accounts by the State PSUs 4.8.1 Accounts for the year 2017-18 were required to be submitted by all the PSUs by 30 September 2018. However, out of 43 functional Government companies, only five Government companies15 submitted their accounts for the year 2017-18 for audit by CAG on or before 30 September 2018 whereas accounts of 38 functional Government companies were in arrears. Out of six Statutory corporations, the CAG is the sole auditor in four Statutory corporations (Uttar Pradesh State Road Transport Corporation, Uttar Pradesh Avas Evam Vikas Parishad, Uttar Pradesh Jal Nigam and Uttar Pradesh Forest Corporation). The accounts of all six Statutory corporations for the year 2017-18 were awaited as on 30 September 2018. Details of arrears in submission of accounts by PSUs (other than Power Sector) as on 30 September 2018 are given in Table 4.6:
Table 4.6: Position relating to submission of accounts by the State PSUs (other than Power Sector)
Government Companies/Government Controlled Other Companies/Statutory Corporations
Particulars
Government companies
Government controlled
other companies
Statutory corporati
ons
Total
Total number of PSUs under the purview of CAG’s audit as on 31.03.2018
80 6 6 92
Less: New PSUs from which accounts for 2017-18 were not due
- - - -
Less: PSUs under liquidation from which accounts for 2017-18 were not due
11 1 0 12
Number of PSUs from which accounts for 2017-18 were due
69 5 6 80
Number of PSUs which presented the accounts for CAG’s audit by 30 September 2018.
4 1 - 5
Number of PSUs16 whose accounts were in arrears
74 5 6 85
Number of accounts in arrears 778 35 5 818 (i) Under Liquidation 94 8 - 102 (ii) non-functional 502 23 - 525 (iii) First Accounts not submitted
33 3 - 36
Break- up of Arrears
(iv) Others 149 1 5 155 One year (2017-18) 7 1 3 11 Two years (2016-17 and 2017-18)
8 - 2 10 Age–wise analysis of arrears against ‘Others’ category Three years and more 134 - - 134
The GoUP had provided ` 11,694.75 crore (Equity: ` 93.29 crore, Loan: ` 774.77 crore and Grant: ` 10,826.69 crore) in 23 of the 85 State PSUs accounts of which had not been finalised by 30 September 2018 whereas no investment was made in remaining 62 PSUs during the period for which
15 Sl. No. 1, 2, 3, 16, and 19 of Appendix-4.1. 16 This include PSUs under liquidation.

Chapter-IV: Functioning of State Public Sector Undertakings (other than Power Sector)
65
accounts were in arrears. PSU wise details of investment made by State Government during the years for which accounts are in arrears are shown in Appendix-4.5. The administrative departments have the responsibility to oversee the activities of these PSUs and to ensure that the accounts are finalised and adopted by these PSUs within the stipulated period. The concerned departments were informed regularly regarding arrears in accounts.
Impact of non-finalisation of accounts of State PSUs (other than Power Sector)
4.9 The delay in finalisation of accounts may also result in risk of fraud and leakage of public money apart from violation of the provisions of the relevant statutes. In view of the above status of arrears of accounts, the actual contribution of these 85 PSUs (other than Power Sector) to State GDP and their profitability including profit earned/loss incurred for the period of arrear accounts could not be ascertained and their contribution to State exchequer was also not reported to the State Legislature. In the absence of finalisation of accounts by these PSUs and their subsequent audit, it could not be ensured whether the investments made and expenditure incurred had been properly accounted for and the funds were utilised for the purpose for which these were provided by the State Government. It is, therefore, recommended that the Administrative Department should strictly monitor and issue necessary directions to liquidate the arrears in accounts. The Government may also look into the constraints in preparing the accounts of the PSUs and take necessary steps to liquidate the arrears in accounts.
Winding up of non-functional State PSUs 4.10 43 State PSUs were non-functional companies having a total investment of ` 1,790.38 crore mainly, in Uttar Pradesh State Textile Corporation Limited (` 285.62 crore) Nandganj-Sihori Sugar Company Limited (` 256.80 crore) and Uttar Pradesh State Handloom Corporation Limited (` 239.26 crore), towards capital (` 1,058.25 crore) and long term loans (` 732.13 crore) as on 31 March 2018. The number of non-functional PSUs at the end of each year during last three years ended 31 March 2018 are given Table 4.7 below:
Table 4.7: Non-functional State PSUs Particulars 2015-16 2016-17 2017-18
No. of non-functional PSUs 38 43 43 Out of above, No. of PSUs which were under liquidation
12 12 12
Source: Compiled from the information provided by PSUs.
As regards 31 non-functional PSUs17, the Government may take appropriate decision regarding winding up of these PSUs.
Placement of Separate Audit Reports of Statutory Corporations
4.11 None of the six Statutory Corporations, had submitted their accounts for 2017-18 by 30 September 2018.
17 Out of 43 non-functional PSUs, 12 PSUs were under liquidation

Audit Report on Economic Sector and Public Sector Undertakings for the year ended 31 March 2018
66
Separate Audit Reports (SARs) are audit reports of the CAG on the accounts of Statutory Corporations. These reports are to be laid before the Legislature as per the provisions of the respective Acts. Status of annual accounts of Statutory Corporations and placement of their SARs in Legislature is shown in Table 4.8:
Table 4.8: Status of placement of SAR of the Statutory Corporations
Years for which SARs not placed in State Legislature
Sl. No.
Name of Corporation
Year of accounts up to which SARs
placed in State Legislature
Date of placement
of SAR Year of accounts
Date of issue to the Government
1 Uttar Pradesh State Road Transport Corporation
2012-13 12 February
2016
2013-14 2014-15
2 September 2015 24 March 2017
2 Uttar Pradesh Financial Corporation
2011-12 19 November
2014
2012-13 12 November 2015
3 Uttar Pradesh Forest Corporation
2015-16 14 February
2019
2016-17 20 November 2018
4 Uttar Pradesh Avas Evam Vikas Parishad
2015-16 7 February 2019
2016-17 15 July 2019
5 Uttar Pradesh Jal Nigam
2007-08 4 December
2012
2008-09 2009-10 2010-11 2011-12
3 August 2011 20 May 2013
12 December 2013 25 May 2017
6 Uttar Pradesh State Warehousing Corporation
2012-13 29 August 2016
2013-14 2014-15
20 July 2016 27 June 2017
Source: Information furnished by the corporations and website of GoUP.
Performance of State PSUs (other than Power Sector)
4.12 The financial position and working results of the 21 State PSUs covered in this Chapter as per their latest finalised accounts18 as of 30 September 2018 are detailed in Appendix-4.1. The PSUs are expected to yield reasonable return on investments made by Government in the undertakings. The total investment of State Government and others in the PSUs was ` 9,407.26 crore consisting of equity of ` 4,495.12 crore and long term loans of ` 4,912.14 crore (Appendix-4.3). Out of this, Government of Uttar Pradesh has investment of ` 3,863.76 crore in the 14 PSUs consisting of equity of ` 2,168.78 crore and long term loans of ` 1,694.98 crore.
The year wise status of investment of GoUP in the PSUs other than Power Sector covered in this Chapter during the period 2015-16 to 2017-18 is as follows:
18 Latest finalised accounts for the years 2015-16 to 2017-18.

Chapter-IV: Functioning of State Public Sector Undertakings (other than Power Sector)
67
Chart 4.2: Total investment of GoUP in PSUs (other than Power Sector)
1362.68 1460.882168.78
797.221431.16 1694.98
2159.92892.04
3863.76
0500
10001500200025003000350040004500
2015-16 2016-17 2017-18
` in
cro
re
GoUP Equity GoUP Loan Total
The profitability of a company is traditionally assessed through return on investment (ROI), return on equity (ROE) and return on capital employed (ROCE). Return on investment measures the profit or loss made in a fixed year relating to the amount of money invested in the form of equity and long term loans and is expressed as a percentage of profit to total investment. Return on Equity is a measure of performance calculated by dividing net profit after tax by shareholders’ fund. Return on capital employed is a financial ratio that measures the company’s profitability and the efficiency with which its capital is used and is calculated by dividing company’s earnings before interest and taxes by capital employed.
Return on Investment 4.13 The Return on investment is the percentage of profit or loss to the total investment. The overall position of Profit/losses19 earned/incurred by the 21 functional State PSUs during 2015-16 to 2017-18 is depicted below in chart 4.3:
Chart 4.3: Profit/Losses earned/incurred by 21 functional PSUs (other than Power Sector) during last three years
4.13.1 The profit of ` 159.62 crore earned by these functional PSUs in the year 2015-16 increased to ` 366.94 crore in the year 2017-18. According to latest finalised accounts of these 21 functional State PSUs, 16 PSUs earned profit of ` 423.52 crore and five PSUs incurred losses of ` 56.58 crore as detailed in Appendix-4.1. The details of sector wise profit of these PSUs during 2017-18 are summarised in Table 4.9. 19 Figures are as per the latest finalised accounts of the respective years.
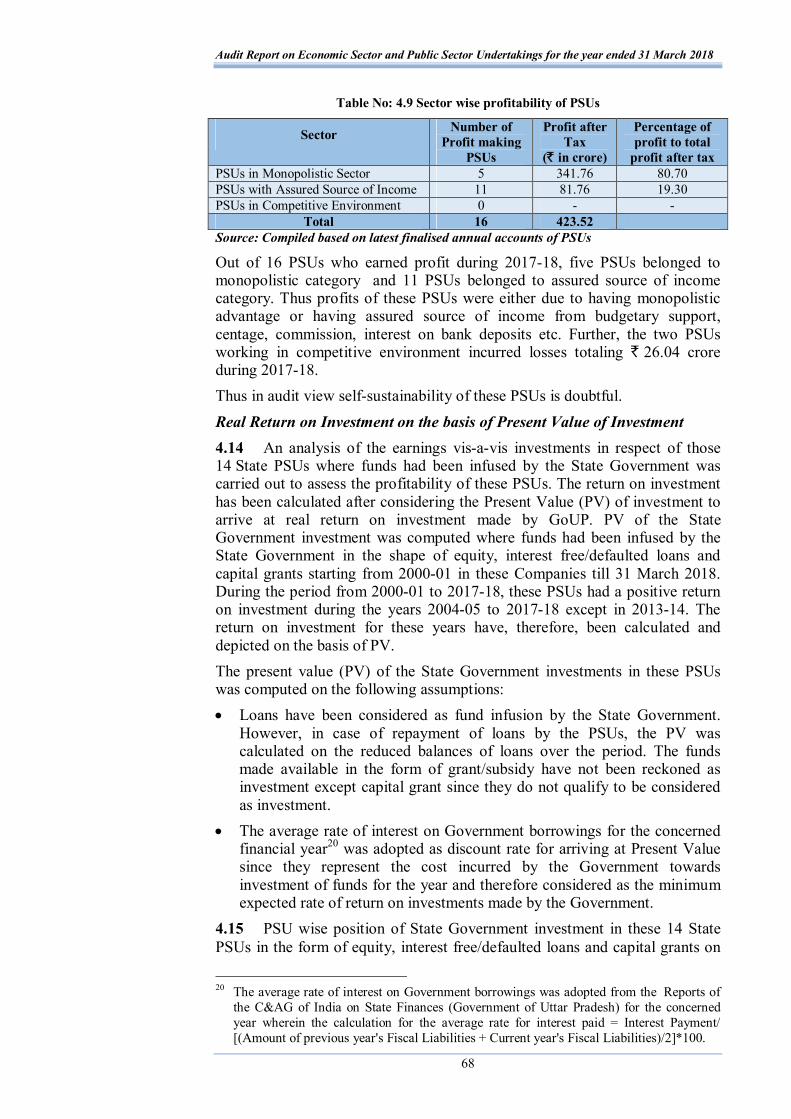
Audit Report on Economic Sector and Public Sector Undertakings for the year ended 31 March 2018
68
Table No: 4.9 Sector wise profitability of PSUs
Sector Number of Profit making
PSUs
Profit after Tax
(` in crore)
Percentage of profit to total
profit after tax PSUs in Monopolistic Sector 5 341.76 80.70 PSUs with Assured Source of Income 11 81.76 19.30 PSUs in Competitive Environment 0 - -
Total 16 423.52 Source: Compiled based on latest finalised annual accounts of PSUs
Out of 16 PSUs who earned profit during 2017-18, five PSUs belonged to monopolistic category and 11 PSUs belonged to assured source of income category. Thus profits of these PSUs were either due to having monopolistic advantage or having assured source of income from budgetary support, centage, commission, interest on bank deposits etc. Further, the two PSUs working in competitive environment incurred losses totaling ` 26.04 crore during 2017-18. Thus in audit view self-sustainability of these PSUs is doubtful. Real Return on Investment on the basis of Present Value of Investment 4.14 An analysis of the earnings vis-a-vis investments in respect of those 14 State PSUs where funds had been infused by the State Government was carried out to assess the profitability of these PSUs. The return on investment has been calculated after considering the Present Value (PV) of investment to arrive at real return on investment made by GoUP. PV of the State Government investment was computed where funds had been infused by the State Government in the shape of equity, interest free/defaulted loans and capital grants starting from 2000-01 in these Companies till 31 March 2018. During the period from 2000-01 to 2017-18, these PSUs had a positive return on investment during the years 2004-05 to 2017-18 except in 2013-14. The return on investment for these years have, therefore, been calculated and depicted on the basis of PV. The present value (PV) of the State Government investments in these PSUs was computed on the following assumptions: Loans have been considered as fund infusion by the State Government.
However, in case of repayment of loans by the PSUs, the PV was calculated on the reduced balances of loans over the period. The funds made available in the form of grant/subsidy have not been reckoned as investment except capital grant since they do not qualify to be considered as investment.
The average rate of interest on Government borrowings for the concerned financial year20 was adopted as discount rate for arriving at Present Value since they represent the cost incurred by the Government towards investment of funds for the year and therefore considered as the minimum expected rate of return on investments made by the Government.
4.15 PSU wise position of State Government investment in these 14 State PSUs in the form of equity, interest free/defaulted loans and capital grants on
20 The average rate of interest on Government borrowings was adopted from the Reports of
the C&AG of India on State Finances (Government of Uttar Pradesh) for the concerned year wherein the calculation for the average rate for interest paid = Interest Payment/ [(Amount of previous year's Fiscal Liabilities + Current year's Fiscal Liabilities)/2]*100.
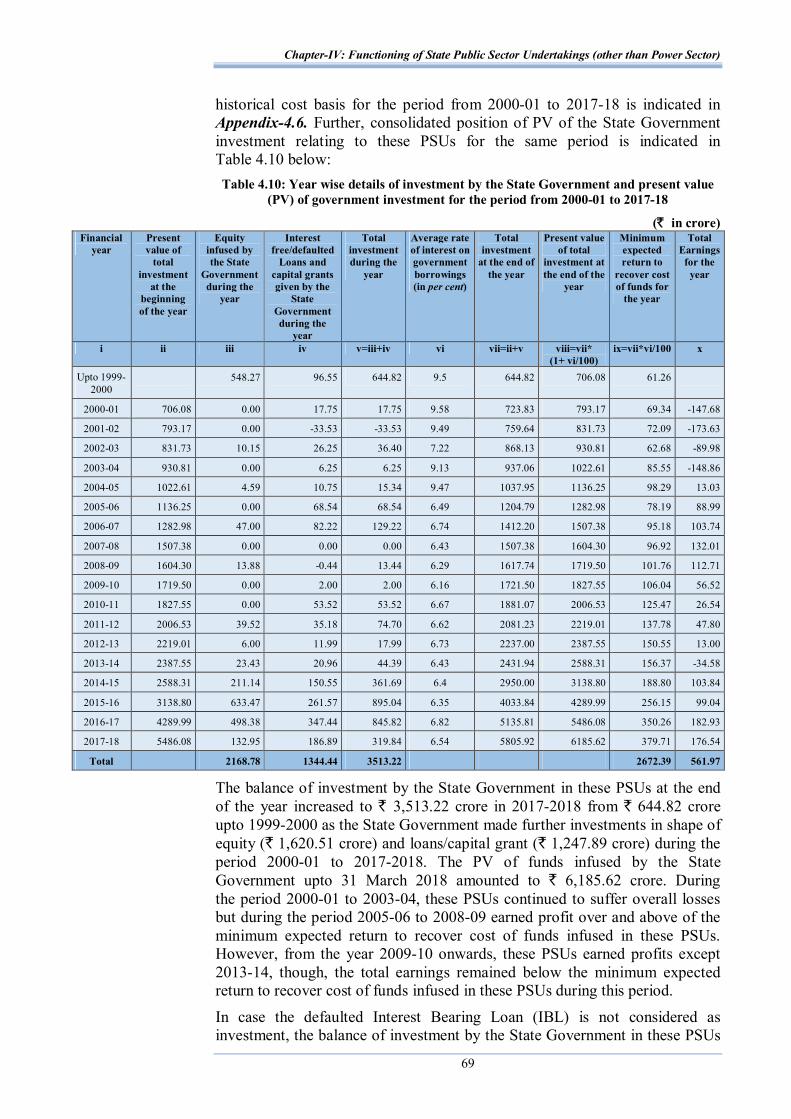
Chapter-IV: Functioning of State Public Sector Undertakings (other than Power Sector)
69
historical cost basis for the period from 2000-01 to 2017-18 is indicated in Appendix-4.6. Further, consolidated position of PV of the State Government investment relating to these PSUs for the same period is indicated in Table 4.10 below: Table 4.10: Year wise details of investment by the State Government and present value
(PV) of government investment for the period from 2000-01 to 2017-18
(` in crore) Financial
year Present value of
total investment
at the beginning of the year
Equity infused by the State
Government during the
year
Interest free/defaulted
Loans and capital grants given by the
State Government during the
year
Total investment during the
year
Average rate of interest on government borrowings (in per cent)
Total investment
at the end of the year
Present value of total
investment at the end of the
year
Minimum expected return to
recover cost of funds for
the year
Total Earnings
for the year
i ii iii iv v=iii+iv vi vii=ii+v viii=vii* (1+ vi/100)
ix=vii*vi/100 x
Upto 1999-2000
548.27 96.55 644.82 9.5 644.82 706.08 61.26
2000-01 706.08 0.00 17.75 17.75 9.58 723.83 793.17 69.34 -147.68
2001-02 793.17 0.00 -33.53 -33.53 9.49 759.64 831.73 72.09 -173.63
2002-03 831.73 10.15 26.25 36.40 7.22 868.13 930.81 62.68 -89.98
2003-04 930.81 0.00 6.25 6.25 9.13 937.06 1022.61 85.55 -148.86
2004-05 1022.61 4.59 10.75 15.34 9.47 1037.95 1136.25 98.29 13.03
2005-06 1136.25 0.00 68.54 68.54 6.49 1204.79 1282.98 78.19 88.99
2006-07 1282.98 47.00 82.22 129.22 6.74 1412.20 1507.38 95.18 103.74
2007-08 1507.38 0.00 0.00 0.00 6.43 1507.38 1604.30 96.92 132.01
2008-09 1604.30 13.88 -0.44 13.44 6.29 1617.74 1719.50 101.76 112.71
2009-10 1719.50 0.00 2.00 2.00 6.16 1721.50 1827.55 106.04 56.52
2010-11 1827.55 0.00 53.52 53.52 6.67 1881.07 2006.53 125.47 26.54
2011-12 2006.53 39.52 35.18 74.70 6.62 2081.23 2219.01 137.78 47.80
2012-13 2219.01 6.00 11.99 17.99 6.73 2237.00 2387.55 150.55 13.00
2013-14 2387.55 23.43 20.96 44.39 6.43 2431.94 2588.31 156.37 -34.58
2014-15 2588.31 211.14 150.55 361.69 6.4 2950.00 3138.80 188.80 103.84
2015-16 3138.80 633.47 261.57 895.04 6.35 4033.84 4289.99 256.15 99.04
2016-17 4289.99 498.38 347.44 845.82 6.82 5135.81 5486.08 350.26 182.93
2017-18 5486.08 132.95 186.89 319.84 6.54 5805.92 6185.62 379.71 176.54
Total 2168.78 1344.44 3513.22 2672.39 561.97
The balance of investment by the State Government in these PSUs at the end of the year increased to ` 3,513.22 crore in 2017-2018 from ` 644.82 crore upto 1999-2000 as the State Government made further investments in shape of equity (` 1,620.51 crore) and loans/capital grant (` 1,247.89 crore) during the period 2000-01 to 2017-2018. The PV of funds infused by the State Government upto 31 March 2018 amounted to ` 6,185.62 crore. During the period 2000-01 to 2003-04, these PSUs continued to suffer overall losses but during the period 2005-06 to 2008-09 earned profit over and above of the minimum expected return to recover cost of funds infused in these PSUs. However, from the year 2009-10 onwards, these PSUs earned profits except 2013-14, though, the total earnings remained below the minimum expected return to recover cost of funds infused in these PSUs during this period.
In case the defaulted Interest Bearing Loan (IBL) is not considered as investment, the balance of investment by the State Government in these PSUs
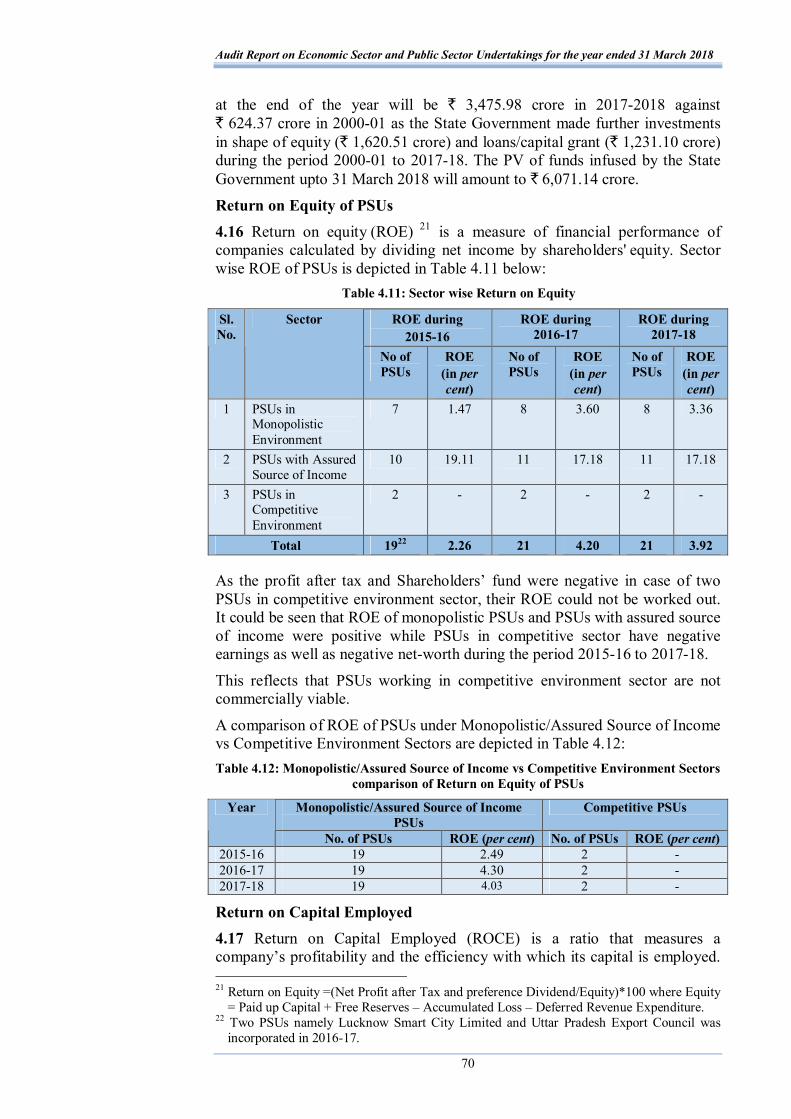
Audit Report on Economic Sector and Public Sector Undertakings for the year ended 31 March 2018
70
at the end of the year will be ` 3,475.98 crore in 2017-2018 against ` 624.37 crore in 2000-01 as the State Government made further investments in shape of equity (` 1,620.51 crore) and loans/capital grant (` 1,231.10 crore) during the period 2000-01 to 2017-18. The PV of funds infused by the State Government upto 31 March 2018 will amount to ` 6,071.14 crore.
Return on Equity of PSUs 4.16 Return on equity (ROE) 21 is a measure of financial performance of companies calculated by dividing net income by shareholders' equity. Sector wise ROE of PSUs is depicted in Table 4.11 below:
Table 4.11: Sector wise Return on Equity
ROE during 2015-16
ROE during 2016-17
ROE during 2017-18
Sl. No.
Sector
No of PSUs
ROE (in per cent)
No of PSUs
ROE (in per cent)
No of PSUs
ROE (in per cent)
1 PSUs in Monopolistic Environment
7 1.47 8 3.60 8 3.36
2 PSUs with Assured Source of Income
10 19.11 11 17.18 11 17.18
3 PSUs in Competitive Environment
2 - 2 - 2 -
Total 1922 2.26 21 4.20 21 3.92
As the profit after tax and Shareholders’ fund were negative in case of two PSUs in competitive environment sector, their ROE could not be worked out. It could be seen that ROE of monopolistic PSUs and PSUs with assured source of income were positive while PSUs in competitive sector have negative earnings as well as negative net-worth during the period 2015-16 to 2017-18.
This reflects that PSUs working in competitive environment sector are not commercially viable.
A comparison of ROE of PSUs under Monopolistic/Assured Source of Income vs Competitive Environment Sectors are depicted in Table 4.12: Table 4.12: Monopolistic/Assured Source of Income vs Competitive Environment Sectors
comparison of Return on Equity of PSUs
Monopolistic/Assured Source of Income PSUs
Competitive PSUs Year
No. of PSUs ROE (per cent) No. of PSUs ROE (per cent) 2015-16 19 2.49 2 - 2016-17 19 4.30 2 - 2017-18 19 4.03 2 -
Return on Capital Employed 4.17 Return on Capital Employed (ROCE) is a ratio that measures a company’s profitability and the efficiency with which its capital is employed. 21 Return on Equity =(Net Profit after Tax and preference Dividend/Equity)*100 where Equity
= Paid up Capital + Free Reserves – Accumulated Loss – Deferred Revenue Expenditure. 22 Two PSUs namely Lucknow Smart City Limited and Uttar Pradesh Export Council was
incorporated in 2016-17.
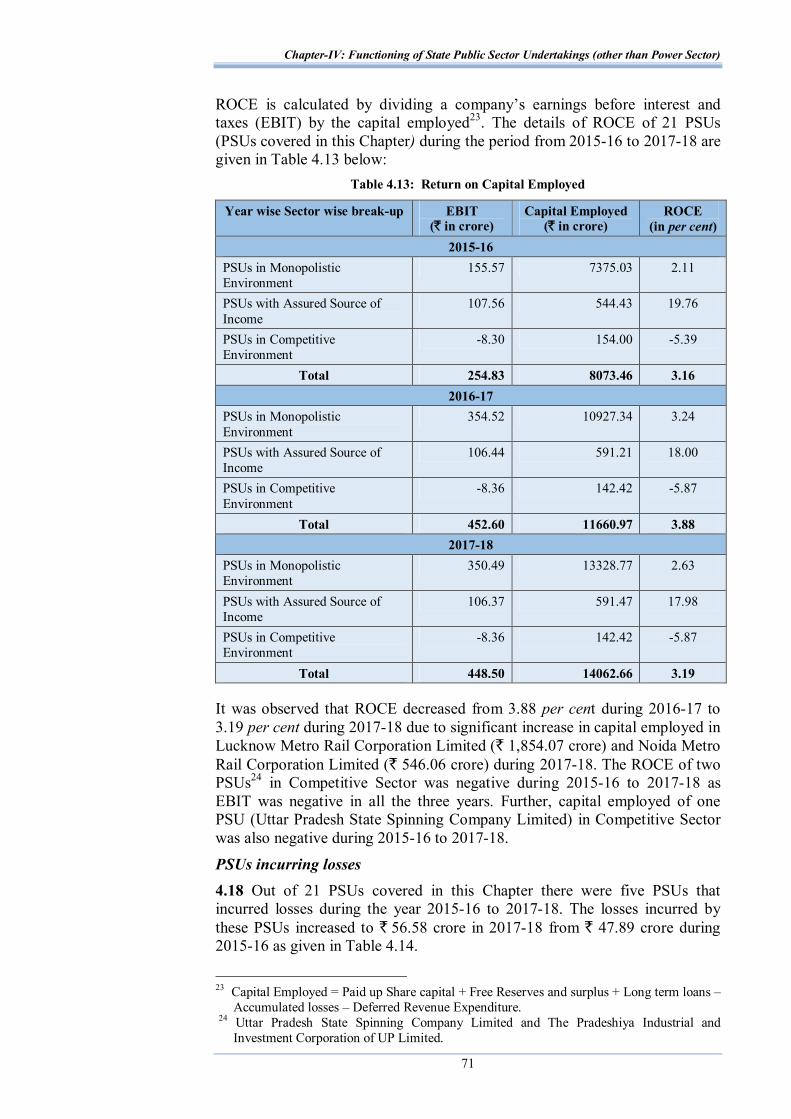
Chapter-IV: Functioning of State Public Sector Undertakings (other than Power Sector)
71
ROCE is calculated by dividing a company’s earnings before interest and taxes (EBIT) by the capital employed23. The details of ROCE of 21 PSUs (PSUs covered in this Chapter) during the period from 2015-16 to 2017-18 are given in Table 4.13 below:
Table 4.13: Return on Capital Employed
Year wise Sector wise break-up EBIT (` in crore)
Capital Employed (` in crore)
ROCE (in per cent)
2015-16 PSUs in Monopolistic Environment
155.57 7375.03 2.11
PSUs with Assured Source of Income
107.56 544.43 19.76
PSUs in Competitive Environment
-8.30 154.00 -5.39
Total 254.83 8073.46 3.16 2016-17
PSUs in Monopolistic Environment
354.52 10927.34 3.24
PSUs with Assured Source of Income
106.44 591.21 18.00
PSUs in Competitive Environment
-8.36 142.42 -5.87
Total 452.60 11660.97 3.88 2017-18
PSUs in Monopolistic Environment
350.49 13328.77 2.63
PSUs with Assured Source of Income
106.37 591.47 17.98
PSUs in Competitive Environment
-8.36 142.42 -5.87
Total 448.50 14062.66 3.19
It was observed that ROCE decreased from 3.88 per cent during 2016-17 to 3.19 per cent during 2017-18 due to significant increase in capital employed in Lucknow Metro Rail Corporation Limited (` 1,854.07 crore) and Noida Metro Rail Corporation Limited (` 546.06 crore) during 2017-18. The ROCE of two PSUs24 in Competitive Sector was negative during 2015-16 to 2017-18 as EBIT was negative in all the three years. Further, capital employed of one PSU (Uttar Pradesh State Spinning Company Limited) in Competitive Sector was also negative during 2015-16 to 2017-18.
PSUs incurring losses 4.18 Out of 21 PSUs covered in this Chapter there were five PSUs that incurred losses during the year 2015-16 to 2017-18. The losses incurred by these PSUs increased to ` 56.58 crore in 2017-18 from ` 47.89 crore during 2015-16 as given in Table 4.14.
23 Capital Employed = Paid up Share capital + Free Reserves and surplus + Long term loans –
Accumulated losses – Deferred Revenue Expenditure. 24 Uttar Pradesh State Spinning Company Limited and The Pradeshiya Industrial and
Investment Corporation of UP Limited.

Audit Report on Economic Sector and Public Sector Undertakings for the year ended 31 March 2018
72
Table 4.14: Number of PSUs that incurred losses during 2015-16 to 2017-18
During the year No of PSUs incurring loss
Net loss for the year
(` in crore)
Accumulated loss
(` in crore)
Net Worth25 (` in crore)
PSUs in Monopolistic Environment 2015-16 1 22.18 25.14 642.51 2016-17 3 26.31 53.13 2241.69 2017-18 3 30.54 85.00 2801.09
PSUs with Assured Source of Income 2015-16 0 0 0 0 2016-17 0 0 0 0 2017-18 0 0 0 0
PSUs in Competitive Environment 2015-16 2 25.71 618.63 -389.81 2016-17 2 26.04 630.32 -401.50 2017-18 2 26.04 630.32 -401.50
Out of total loss of ` 56.58 crore incurred by five PSUs during the year 2017-18, loss of ` 30.54 crore was incurred by three PSUs in monopolistic sector. Further, both the PSUs in competitive sector continuously incurred losses during the period 2015-16 to 2017-18 and their accumulated losses increased from ` 618.63 crore to ` 630.32 crore during this period. This reflects adversely on the sustainability of these PSUs.
Erosion of Net worth of PSUs 4.19 As on 31 March 2018, out of the 21 PSUs (covered in this Chapter), there were eight PSUs with accumulated losses of ` 1,922.71 crore. Of these eight PSUs, five PSUs incurred losses in the year 2017-18 amounting to ` 56.58 crore. These included two PSUs in competitive sector which incurred loss of ` 26.04 crore during the year. Further, three PSUs had not incurred loss in the year 2017-18, even though they had accumulated loss of ` 1,207.39 crore. Net worth of four PSUs including both the PSUs in competitive sector had been completely eroded by accumulated loss and their net worth was (-) ` 781.22 crore against equity investment of ` 1,055.26 crore as on 31 March 2018. This included negative net worth of (-) ` 401.50 crore in two PSUs of competitive sector against equity investment of ` 228.82 crore. However, out of four PSUs, whose net worth had been eroded, two PSUs had earned profit of ` 97.23 crore during 2017-18 largely on account of profit of ` 97.19 crore earned by the Uttar Pradesh State Road Transport Corporation due to its monopolistic advantage. In all four PSUs whose capital had been eroded, Government loans outstanding as on 31 March 2018 amounted to ` 696.28 crore.
Dividend Payout 4.20 The State Government had formulated (October 2002) a dividend policy under which PSUs running in profit are required to pay a minimum return of five per cent on the paid up share capital contributed by the State Government. Dividend Payout relating to 14 out of 21 PSUs (covered in this Chapter) where 25 Net worth means the sum total of the paid-up share capital and free reserves and surplus
less accumulated loss and deferred revenue expenditure. Free reserves mean all reserves created out of profits and share premium account but do not include reserves created out of revaluation of assets and write back of depreciation provision

Chapter-IV: Functioning of State Public Sector Undertakings (other than Power Sector)
73
equity was infused by State Government during the period is shown in Table 4.15 below:
Table 4.15: Dividend Payout of PSUs (other than Power Sector) during 2015-16 to 2017-18
Total PSUs where equity infused by
GoUP
PSUs which running in profit for the year
PSUs which declared/paid dividend
for the year
Dividend Payout Ratio
( in per cent)
Year
Number of PSUs
Equity infused by
GoUP (` in crore)
Number of PSUs
Equity infused by
GoUP (` in crore)
Number of PSUs
Dividend declared/paid
by PSUs (` in crore)
1 2 3 40 5 6 7 8=7/5*100 2015-16 13 1362.68 8 110.81 7 3.21 2.90 2016-17 14 1460.88 5 93.17 4 0.19 0.20 2017-18 14 2168.78 1 0.05 - - -
During the period 2015-16 to 2017-18, the number of PSUs running in profits ranged between one and eight. During this period, number of PSUs which declared/paid dividend to GoUP ranged from four26 to seven27. The Dividend Payout Ratio decreased from 2.90 per cent in 2015-16 to 0.20 per cent in 2016-17. Analysis of Long Term Loans of the PSUs (other than Power Sector) 4.21 Analysis of the Long Term Loans of the PSUs which had leverage during 2015-16 to 2017-18 was carried out to assess the ability of PSUs to serve the debt owed by PSUs to the Government, banks and other financial institutions. This is assessed through the interest coverage ratio and debt turnover ratio. Interest Coverage Ratio 4.22 Interest coverage ratio is used to determine the ability of a PSU to pay interest on outstanding debt and is calculated by dividing earnings before interest and taxes (EBIT) of a PSU by interest expenses of the same period. The lower the ratio, the lessor the ability of the PSU to pay interest on debt. An interest coverage ratio below one indicated that the PSU was not generating sufficient revenues to meet its expenses on interest. The details of positive and negative interest coverage ratio of PSUs covered in this Chapter which had outstanding loans during the period from 2015-16 to 2017-18 are given in Table 4.16.
26 SI No. 10, 13, 14, and 15 of Appendix-4.1. 27 SI No. 8, 9, 10, 13, 14, 15 and 18 of Appendix-4.1.

Audit Report on Economic Sector and Public Sector Undertakings for the year ended 31 March 2018
74
Table 4.16: Interest coverage ratio of functional State PSUs (other than Power Sector) having interest liability of loans
During the year
Interest (` in
crore)
Earnings before
interest and tax (EBIT) (` in crore)
Number of
PSUs having interest
liability of loans
Number of PSUs having
interest coverage ratio more than one
Number of PSUs having interest
coverage ratio less than one
2015-16 36.93 31.38 4 2 2 2016-17 30.00 131.25 5 3 2 2017-18 30.84 112.10 6 3 3
Of the six State PSUs (other than Power Sector) having liability of loans during 2017-18, three PSUs had interest coverage ratio of more than one and three PSUs had interest coverage ratio below one which indicates that these three PSUs could not generate sufficient revenues to meet their expenses on interest during the period.
Age wise analysis of interest outstanding on State Government Loans 4.23 As on 31 March 2018, interest amounting to ` 96 crore was outstanding on the long term loans of four PSUs provided by GoUP. The age wise analysis of interest outstanding on GoUP Loans in PSUs is depicted in Table 4.17 below:
Table 4.17: Interest outstanding on State Government Loans
Sl. No.
Name of PSU Outstanding interest on loans as on 31 March
2018 (` in crore)
Outstanding for less than
1 year (` in crore)
Outstanding for 1 to 3
years (` in crore)
Outstanding for more
than 3 years (` in crore)
1 Uttar Pradesh Electronics Corporation Limited.
44.94 2.21 4.39 38.34
2 Uttar Pradesh Development Systems Corporation Limited
7.00 0.00 7.00 0.00
3 Uttar Pradesh State Spinning Company Limited
16.43 3.17 5.09 8.17
4 The Pradeshiya Industrial and Investment Corporation of UP Limited
27.63 1.75 0.00 25.88
Total 96.00 7.13 16.48 72.39
Comments on Accounts of State PSUs (other than Power Sector)
4.24 25 functional companies forwarded 33 audited accounts to the Accountant General during the period from 1 October 2017 to 30 September 2018. Of these, 24 accounts were selected for supplementary audit. The Audit Reports of Statutory Auditors and supplementary audit conducted by the CAG indicated that the quality of accounts needs to be improved substantially. The details of aggregate money value of the comments of Statutory Auditors and the CAG are given Table 4.18.

Chapter-IV: Functioning of State Public Sector Undertakings (other than Power Sector)
75
Table 4.18: Impact of audit comments on functional companies (other than Power Sector)
2015-16 2016-17 2017-18 Sl. No.
Particulars Number
of accounts
Amount (` in crore)
Number of
accounts
Amount (` in crore)
Number of
accounts
Amount (` in crore)
1. Decrease in profit
12 221.89 13 379.22 12 132.71
2. Increase in profit 1 0.16 2 0.18 2 0.71 3. Increase in loss 5 42.58 5 7.23 4 352.13 4. Decrease in loss - - 1 0.18 3 5.05 5. Non-disclosure
of material facts 2 11241.40 8 121.18 12 718.68
6. Errors of classification
- - 9 124.80 6 159.23
Source: Compiled from comments of the Statutory Auditors/C&AG in respect of Government Companies.
During the year 2017-18, the Statutory Auditors had issued qualified certificates on 16 accounts and in case of accounts of Uttar Pradesh State Spinning Company Limited for the year 2016-17, the Statutory Auditors had given an adverse Report. Compliance to the Accounting Standards by the PSUs remained poor as the Statutory Auditors pointed out 69 instances of non-compliance to the Accounting Standards in 22 accounts. The CAG had also issued adverse certificates in five accounts namely Uptron Powertronics Limited (2016-17), Shreetron India Limited (2016-17), Allahabad City Transport Services Limited (2014-15), Uttar Pradesh Electronic Corporation Limited (2016-17) and Uttar Pradesh State Industrial Development Corporation Limited (2013-14).
4.25 The State has six Statutory Corporations i.e. (i) Uttar Pradesh Avas Evam Vikas Parishad (UPAEVP), (ii) Uttar Pradesh Jal Nigam (UPJN), (iii) Uttar Pradesh Financial Corporation (UPFC), (iv) Uttar Pradesh State Road Transport Corporation (UPSRTC), (v) Uttar Pradesh State Warehousing Corporation (UPSWC) and Uttar Pradesh Forest Corporation. The CAG is the sole auditor of these Statutory Corporations except UPSWC and UPFC.
Out of six functional Statutory Corporations, four Corporations (UPSWC, UPAEVP, UPSRTC and Uttar Pradesh Forest Corporation) forwarded five annual accounts for the years 2015-16 to 2016-17 and none of the Statutory Corporations forwarded their accounts for 2017-18 during the period of 01 October 2017 to 30 September 2018. All five accounts were selected for sole/supplementary audit. The Statutory Auditors had given qualified certificates on annual accounts of UPSWC for the year 2015-16. Out of five accounts received, the CAG audit of one account i.e. accounts of Uttar Pradesh Forest Corporation for the year 2016-17, was completed upto December 2018 and a ‘qualified’ certificate was issued. The details of aggregate money value of the comments of Statutory Auditors and supplementary audit by the CAG in respect of Statutory Corporations are given in Table 4.19.

Audit Report on Economic Sector and Public Sector Undertakings for the year ended 31 March 2018
76
Table 4.19: Impact of audit comments on Statutory Corporations
2015-16 2016-17 2017-18 Sl. No.
Particulars Number
of accounts
Amounts (` in
crore)
Number of
accounts
Amounts (` in
crore)
Number of
accounts
Amounts (` in
crore) 1. Decrease in profit 2 3.66 5 7.27 3 26.33 2. Increase in profit - - - - 2 2.09 3. Increase in loss - - - - - - 4. Decrease in loss - - - - - - 5. Non-disclosure of
material facts 1 448.02 5 1114.38 - -
6. Errors of classification
- - 4 1472.19 1 0.71
Source: Compiled from comments of the Statutory Auditors/C&AG in respect of Statutory Corporations.
Compliance Audits Paragraphs 4.26 For the Report of the Comptroller and Auditor General of India (Economic and Public Sector Undertakings) for the year ended 31 March 2018, eight compliance audit paragraphs related to Uttar Pradesh State Road Transport Corporation, Uttar Pradesh Avas and Vikas Parishad, Uttar Pradesh State Industrial Development Corporation Limited and Uttar Pradesh Jal Nigam were issued to the Principal Secretaries/Secretaries of the respective Administrative Departments with request to furnish replies. Replies of three compliance audit paragraphs have been received from the State Government and taken into account while finalising this report. The replies of five compliance audit paragraphs are awaited (August 2019) from State Government. The total financial impact of these compliance audit paragraphs is ` 51.01 crore.
Follow-up action on Audit Reports
Replies outstanding 4.27 The Report of the Comptroller and Auditor General of India represents the culmination of the process of audit scrutiny. It is, therefore, necessary that they elicit appropriate and timely response from the executive. The Finance Department, Government of Uttar Pradesh issued (June 1987) instructions to all administrative Departments to submit replies/explanatory notes to paragraphs/performance audits included in the Audit Reports of the CAG of India within a period of two to three months of their presentation to the State Legislature, in the prescribed format without waiting for any questionnaires from the Committee on Public Undertakings (COPU). The position of explanatory notes not received is given in Table 4.20:
Table-4.20: Explanatory notes not received (as on 30 September 2019) Total Performance
Audit (PA) and Paragraphs in the
Audit Report
Number of PA/ Paragraphs for which
explanatory notes were not received
Year of the Audit Report (Commercial/
PSUs)
Date of placement of Audit Report in the
State Legislature
PA Paragraphs PA Paragraphs 2011-12 16 September 2013 1 6 0 1 2012-13 20 June 2014 1 11 0 0 2013-14 17 August 2015 1 9 0 2 2014-15 8 March 2016 2 4 2 0

Chapter-IV: Functioning of State Public Sector Undertakings (other than Power Sector)
77
Total Performance Audit (PA) and
Paragraphs in the Audit Report
Number of PA/ Paragraphs for which
explanatory notes were not received
Year of the Audit Report (Commercial/
PSUs)
Date of placement of Audit Report in the
State Legislature
PA Paragraphs PA Paragraphs 2015-16 18 May 2017 4 6 2 0 2016-17 7 February 2019 2 3 2 2
Total 11 39 6 5 Source: Information compiled by Audit
From the above, it could be seen that, out of 39 paragraphs and 11 Performance Audits, explanatory notes to five Paragraphs and six Performance Audits in respect of seven Departments28, which were commented upon, were awaited (September 2019).
Discussion of Audit Reports by COPU 4.28 The status as on 30 September 2019 of Performance Audits and paragraphs that appeared in Audit Reports (Commercial/PSUs) and on which discussion completed by the COPU is given in Table 4.21 below:
Table-4.21: Performance Audits/Paragraphs appeared in Audit Reports vis-a-vis discussed as on 30 September 2019
Number of Performance Audits (PAs)/Paragraphs Appeared in Audit Report PAs and Paragraphs on which
discussion completed
Period of Audit
Report PAs Paragraphs PAs Paragraphs
1982-83 to 2010-11
7629 475 56 415
2011-12 1 6 0 5 2012-13 1 11 0 7 2013-14 1 9 0 7 2014-15 2 4 0 3 2015-16 4 6 0 0 2016-17 2 3 1
Total 87 514 56 438 Source: Information compiled by Audit
Compliance to Reports of the Committee on Public Undertakings 4.29 The internal working rules of COPU do not provide for vetting of Action Taken Notes (ATNs) by the Accountant General. Hence, the ATNs on the recommendations of COPU are furnished by the Departments to the Accountant General, only at the time of discussion of ATNs by COPU. Therefore, the status of ATNs is not discussed here.
Recoveries at the instance of Audit
4.30 During the course of audit, recoveries of ` 18.31 crore pointed out in one case in one PSU (other than Power Sector), was accepted during 1 April 2017 to 30 September 2019 as per the details given in Table 4.22.
28 Department of Forest, Information Technology and Electronic Department, Infrastructure
and Industrial Development Department and Housing & Urban Planning Development Department, Irrigation Department, Public Work Department and Urban Development Department.
29 Included Standalone Performance Audit Report on Sale of Sugar Mills of Uttar Pradesh State Sugar Corporation Limited.

Audit Report on Economic Sector and Public Sector Undertakings for the year ended 31 March 2018
78
Table-4.22: Recoveries pointed out by audit and accepted/recovered by the PSU (other than Power Sector)
(` in crore) Recoveries pointed out in Audit and accepted
by the Department during
1 April 2017 to 30 September 2019
Recoveries effected during
1 April 2017 to 30 September 2019
Department Particulars of recoveries
Number of cases
Amount involved
Number of cases
Amount involved
Transport Department
Loss to Government due to non-levy of Service Tax by Uttar Pradesh State Road Transport Corporation
1 18.31 - -
Total 1 18.31 - - Source: Information compiled by Audit

CHAPTER–V Compliance Audit observations relating
to State Public Sector Undertakings (other than Power Sector)


CHAPTER-V
5. Compliance Audit Observations relating to State Public Sector Undertakings (other than Power Sector)
Important audit findings emerging from test check of transactions made by the Public Sector Undertakings other than Power Sector are included in this Chapter.
Transport Department
Uttar Pradesh State Road Transport Corporation
5.1 Loss to Government due to non-levy of Service Tax: ` 18.31 crore
The Corporation, in contravention to the provisions of the Service Tax Act, did not levy and collect Service Tax from passengers of AC buses which resulted in loss to the Public Exchequer amounting to ` 18.31 crore.
The service of transportation of passengers by stage carriage was exempted from the Service Tax as the same was included in the Negative List. However, by amendment (1 March 2016) in the Negative List, the Government restricted the exemption to the services of transportation of passengers only by non-air-conditioned buses w.e.f. 1 June 2016. Therefore, the service of transportation of passengers by Air Conditioned (AC) buses was brought into Service Tax Act w.e.f. 1 June 2016. Accordingly, the State Transport Corporations were required to levy and collect Service Tax from the passengers of such AC buses and deposit the same with the Government.
Uttar Pradesh State Road Transport Corporation (Corporation) is engaged in the business of transportation of passengers by AC stage carriages (both its own AC buses as well as the hired AC buses) on different designated routes and was required, in light of the above amendments, to levy and collect Service Tax from passengers of such buses. On the advice of the service tax consultant of the Corporation, the Finance Controller (FC) brought (June 2016) this fact to the notice of the Chief General Manager (CGM) Operations and directed him to ensure compliance of the amended provision of the Service Tax Act. FC further reminded (December 2016) CGM Operations that as no action has been taken by the CGM Operations hence he would be personally liable for any liability arising in future. Audit noticed that CGM Operations, despite amendment in the Service Tax Act as stated above and express directions from the FC to this effect, failed to comply with the same. The Corporation earned a total revenue of ` 305.23 crore from the operation of AC buses during the period from June 2016 to June 2017. Non-levy and collection of Service Tax resulted in loss to the Government exchequer amounting to ` 18.31 crore (15 per cent of 40 per cent1 of ` 305.23 crore). Further, non-collection and deposit of Service Tax may also attract penal proceedings under the provisions of the Service Tax Act.
1 Calculated after allowing abatement of 60 per cent on revenue as provided in the
Government of India notification No. 26/2012- Service Tax dated 20 June 2012.

Audit Report on Economic Sector and Public Sector Undertakings for the year ended 31 March 2018
80
The Management accepted (June 2019) the audit observation and stated that the process of determination of liabilities of Service Tax payable and its payment has been initiated. However, no liability has been fixed so far by the Corporation against the CGM Operations for not initiating timely action to levy and collect Service Tax.
The matter was reported to the Government (August 2018). Reply is still awaited (September 2019).
Housing and Urban Planning Department
Uttar Pradesh Avas Evam Vikas Parishad
5.2 Avoidable payment of interest
The Parishad had to pay avoidable compensation of ` 11.38 crore to the allottees due to violation of tendering process.
Uttar Pradesh Avas Evam Vikas Parishad (Parishad) opened registration (21 January 2011 to 5 March 2011) for allotment of flats (216 flats) in Shikhar Enclave, Vasundhara Yojna, Ghaziabad under a self-finance scheme with the expected date of completion of construction in 24 months from the date of issue of the demand notice. The eligibility draw was organised on 7 June 2011 and demand letters were issued in June 2011. Therefore, tentative date of possession of flats worked out to July 2013. The Parishad executed two agreements for construction of flats on 3 August 2011. As per the agreements with the Contractors, the dates of start and completion of work were 3 August 2011 and 2 February 2013 respectively.
Further, the Parishad had invited (21 July 2013) bids based on a two bid system for external development works at Shikhar Enclave. Technical bids of three firms were opened (29 July 2013) and all the firms were found technically qualified. Thereafter, their financial bids were opened (30 July 2013) and recommendation for award of work in favour of the lowest bidder (who was also one of the contractors for construction of the flats) was sent to the Superintending Engineer (SE) for approval. However, the SE did not approve the recommendation on the grounds of poor progress made by the contractor in the construction work of the said building. The Contractor was informed (4 September 2013) about cancellation of the bid without assigning any reason thereof. Fresh tenders were invited (12 September 2013). The Contractor moved the High Court and obtained a stay (8 October 2013) on award of work of external development through fresh tendering on the grounds that re-invited tenders would be disadvantageous to the firm. The stay could not be vacated in the next 21 months. As a result, no progress could be achieved in the matter. On the other hand, allottees were also demanding interest for the period of delay. The Parishad tried to settle the matter out of court with the Contractor who agreed (8 July 2015) to settle the matter provided the work was awarded in its favour at the rates quoted in the tender which was cancelled. Accordingly, the Parishad Board decided (8 October 2015) in favour of an out of court settlement keeping in view the delay, and the demand of interest/compensation by the allottees. The work was awarded in favour of the Contractor (02 November 2015). The High Court

Chapter–V: Compliance Audit Observations
81
dismissed the writ petition as withdrawn (21 January 2016) at the request of the petitioner.
The Parishad, after approval of final costing, decided 31 December 2016 as the date for physical possession which was further extended to 31 July 2017 due to slow progress of work. Meanwhile, aggrieved by excessive delay in handing over of the flats, allottees demanded (September 2016) interest on the ground that the Parishad had charged interest at the rate of 13.5 per cent from the allotees who had defaulted in making timely payment. The Parishad decided (30 December 2016) to pay interest at the rate of six per cent to allottees after six months from the date of last deposit made by them and accordingly paid an interest amounting to ` 15.60 crore to 201 allottees (for 37 months).
Audit analysed the reasons for delay. While assessing records relating to the tendering process, it noticed (September 2017) that the Tender Committee had not analysed the technical bid (Pre-Qualification Bid) properly as per the requirements of the standard tendering process. The bidders were required to submit details of works satisfactorily completed by them during the last three financial years indicating the date of start of the work, the date of completion of the work, the amount of work actually completed, etc. Further, as per terms of the tender, if any ongoing work of a tenderer was running behind schedule by more than 15 per cent due to fault of the contractor at a stage when 50 per cent time period from the date of start had passed, the contractor was to be held technically disqualified and his financial-bid was not to be opened. Though the Tender Committee analysed the details of works satisfactorily completed by the tenderer during the last three years, it ignored the status of ongoing work of the Contractor. This resulted in omission to analyse the bids on this important pre-qualification criterion. Instead the Tender Committee treated all the participants as technically qualified, and recommended for opening their price bids despite non-submission of required information regarding on-going works by the Contractor.
Later on, the SE cancelled the tender on the ground that the progress of construction of flats by the Contractor was less than 50 per cent. The Contractor obtained a court stay on the ground that his bid was cancelled without assigning any reason. This delayed the work for at least 27 months2. Thus, violation of the tendering process by the Tender Committee resulted in delay of 27 months and consequent payment of interest for such period amounting to ` 11.38 crore3. The Parishad stated (January 2019) that evaluation of pre-qualification bid was correctly done as per pre-qualification condition by the Tender Committee.
The Government, however, accepted (June 2019) the contention of Audit but did not intimate about initiation of any action for fixing responsibility on the concerned officials of the Tender Committee.
2 Period of stay i.e. 8 October 2013 to 21 January 2016 (27 Months and 14 days). 3 ` 15.60 crore/37*27= ` 11.38 crore.
Audit Report on Economic Sector and Public Sector Undertakings for the year ended 31 March 2018
82
5.3 Loss to Parishad due to incorrect Reserve Price
The Parishad was deprived of ` 2.27 crore due to incorrect fixation of Reserve Price of auctioned plots.
Para 16.1 of the Costing Guidelines (1986 as amended in 2001) of the Uttar Pradesh Awas Evam Vikas Parishad (Parishad) provides that the reserve price of the commercial plot shall be fixed at twice the prevalent land rates. It also provides that if the Parishad has auctiond nearby land at a rate above/below the reserve price, the auction rate of nearby land would be considered for fixation of the reserve price of the said plot. In addition to this, 12 per cent freehold charges and 10 per cent corner charges (for corner plots) shall be loaded to the cost of plot to arrive at the reserve price. Audit noticed (January 2017) that the Parishad auctioned (April 2016) a commercial plot (16/com-4) measuring 450.00 sqm at Sector 16 of the Vrindavan Yojna, Lucknow at the rate of ` 59,500 per sqm (Reserve Price ` 35,840 per sqm). The Parishad, however, without considering the auctioned rate of the plot (16/com-4), fixed the reserve price of nearby commercial plots (Plot No. 16/com-5,6 and 7) at the rate of ` 35,840 per sqm, fixed at twice the prevalent sector rates of ` 16,000 plus 12 per cent free hold charges, and auctioned these plots (on 22 July 2016). Moreover, the Parishad did not record any reason for not considering auctioned price of the nearby plot (16/com-4).
Thus, the Parishad was deprived of ` 2.27 crore due to incorrect fixation of reserve price (Appendix-5.1). Audit further noticed that there was no system in existence in the Parishad to ensure that the reserve price had been fixed correctly as per the extant guidelines/rules framed by it. The fact that nearby commercial plot had been auctioned at a much higher rate, was not factored into the fixing of reserve price of the plots in question. This indicates that the MIS at Parishad was deficient. The Parishad stated (January 2019) that as the areas of plot no 16/com-5 and 16/com-6 were slightly less than that of plot no 16/com-4; hence, there was a possibility of getting of lower bids. No reply in respect of plot no. 16/com-7 was furnished. The Government accepted (June 2019) the contention of Audit that specific reasons for not considering auction price of nearby plots for fixation of reserve price should have been recorded.
5.4 Undue favour extended to the Contractor
The Parishad suffered a loss of interest amounting to ` 1.50 crore due to release of mobilisation advance of ` 40.86 crore to the contractor against the provision of Financial Hand Book and before the necessary Environmental Clearance was received.
Para 456 of Volume VI of the Financial Hand Book (FHB) of the Government of Uttar Pradesh provided that advances to contractors are not allowed except for secured advances not exceeding 75 per cent of the value of material brought to the site. Further, Para 457 of FHB provided for advance payment

Chapter–V: Compliance Audit Observations
83
for the work actually executed. As per Government of India (GoI) notification (September 2006) also, no activity related to Building and Construction projects can be undertaken by the Project Management except for securing of the land prior to obtaining the necessary environmental clearance (EC) from the State Level Environment Impact Assessment Authority (SEIAA), where required. Moreover, as per the Central Vigilance Commission (CVC) guidelines (April 2007), Mobilisation Advance (MA) extended to a contractor should essentially be need based and its recovery should be time based and not linked with the progress of work.
The Construction Division-15 (Division), Lucknow of the Uttar Pradesh Avas Evam Vikas Parishad (Parishad) entered into an agreement (January 2016) with a contractor for construction of 1,680 multistoried flats in the Samajwadi Avas Yojna, and 448 multistoried residential flats under the self-financed scheme in Sector-8, Avadh Vihar Yojna, Lucknow for a total consideration of ` 408.63 crore. The scheduled dates of start of work and its completion were 27 January 2016 and 26 July 2018 respectively. The Parishad could obtain the necessary EC for construction of the above projects only on 2 September 2016 from the SEIAA, Uttar Pradesh. As per the clauses of the agreement, 10 per cent interest free MA was to be provided to the contractor and its recovery was to be commenced after completion of 20 per cent of the work. Accordingly, Parishad provided an MA of ` 40.86 crore4 to the contractor in three instalments from February 2016 to May 2016.
Scrutiny of the records in view of the extant provision of FHB, GoI notification for obtaining EC, and the CVC guidelines revealed (July 2017) following irregularities:
The FHB prohibited any advances to contractor except secured advance against material and advance against the work actually executed. Further, the Parishad has no documented policy for providing MA. It has also not obtained any approval or exceptions from FHB provisions from the State Government for providing MAs to contractors. Thus, providing MA of ` 40.86 crore to the Contractor was not covered under General Financial Rules applicable in the State.
The Parishad had fixed the date of start of work as 27 January 2016 without obtaining the necessary EC. The Parishad had released ` 40.86 crore MA to the Contractor in three instalments from February 2016 to May 2016 despite being aware of the fact that the necessary EC had not been received, and that no work could possibly be initiated by the Contractor before the EC was received. Audit observed that the Parishad had also released the second and the third instalments of the MA (March 2016 and May 2016) without obtaining the utilisation certificate for the earlier instalments. It was verified by Audit from the records of the Parishad that the Contractor had not commenced any work till 2 September 2016, being date of approval of EC, on the grounds of non-receipt of the EC. Thus, grant of MA not only resulted in extending an undue favour to the Contractor but also of loss of interest, amounting to ` 1.50 crore (Appendix-5.2).
4 ` 24.52 crore on 17 February 2016, ` 14.30 crore on 30 March 2016 and ` 2.04 crore on
19 May 2016.
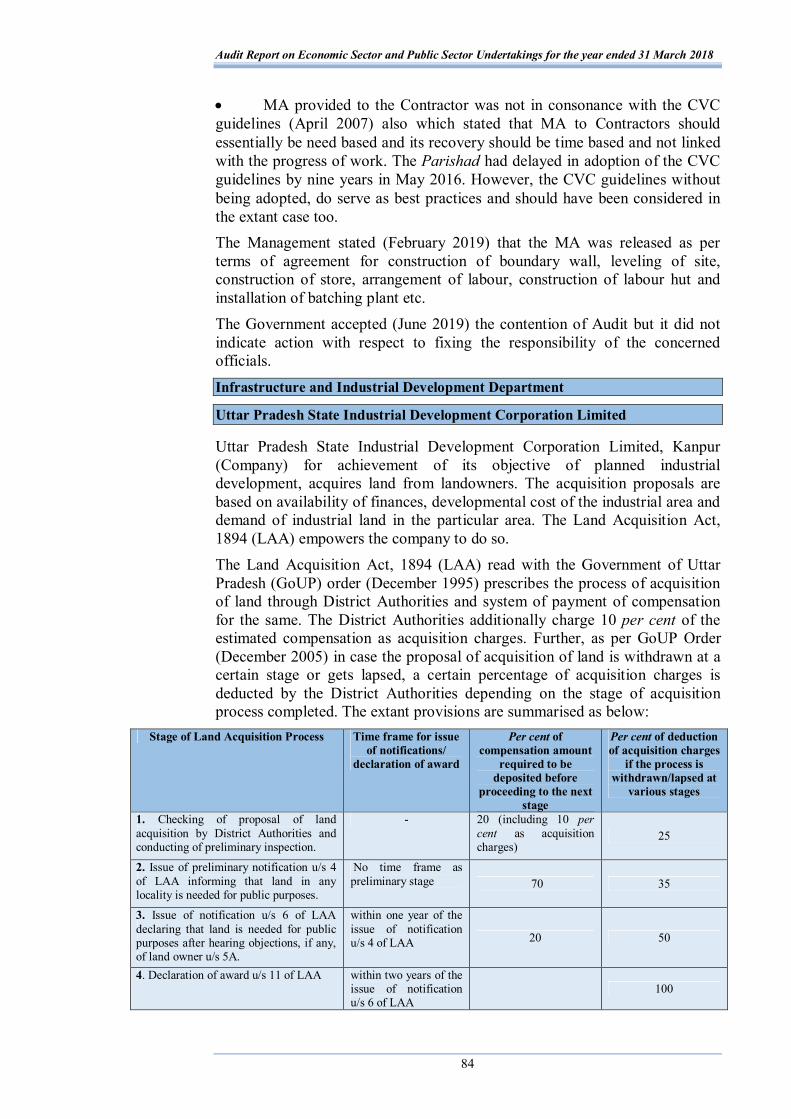
Audit Report on Economic Sector and Public Sector Undertakings for the year ended 31 March 2018
84
MA provided to the Contractor was not in consonance with the CVC guidelines (April 2007) also which stated that MA to Contractors should essentially be need based and its recovery should be time based and not linked with the progress of work. The Parishad had delayed in adoption of the CVC guidelines by nine years in May 2016. However, the CVC guidelines without being adopted, do serve as best practices and should have been considered in the extant case too. The Management stated (February 2019) that the MA was released as per terms of agreement for construction of boundary wall, leveling of site, construction of store, arrangement of labour, construction of labour hut and installation of batching plant etc. The Government accepted (June 2019) the contention of Audit but it did not indicate action with respect to fixing the responsibility of the concerned officials. Infrastructure and Industrial Development Department
Uttar Pradesh State Industrial Development Corporation Limited
Uttar Pradesh State Industrial Development Corporation Limited, Kanpur (Company) for achievement of its objective of planned industrial development, acquires land from landowners. The acquisition proposals are based on availability of finances, developmental cost of the industrial area and demand of industrial land in the particular area. The Land Acquisition Act, 1894 (LAA) empowers the company to do so. The Land Acquisition Act, 1894 (LAA) read with the Government of Uttar Pradesh (GoUP) order (December 1995) prescribes the process of acquisition of land through District Authorities and system of payment of compensation for the same. The District Authorities additionally charge 10 per cent of the estimated compensation as acquisition charges. Further, as per GoUP Order (December 2005) in case the proposal of acquisition of land is withdrawn at a certain stage or gets lapsed, a certain percentage of acquisition charges is deducted by the District Authorities depending on the stage of acquisition process completed. The extant provisions are summarised as below:
Stage of Land Acquisition Process Time frame for issue of notifications/
declaration of award
Per cent of compensation amount
required to be deposited before
proceeding to the next stage
Per cent of deduction of acquisition charges
if the process is withdrawn/lapsed at
various stages
1. Checking of proposal of land acquisition by District Authorities and conducting of preliminary inspection.
- 20 (including 10 per cent as acquisition charges)
25
2. Issue of preliminary notification u/s 4 of LAA informing that land in any locality is needed for public purposes.
No time frame as preliminary stage 70 35
3. Issue of notification u/s 6 of LAA declaring that land is needed for public purposes after hearing objections, if any, of land owner u/s 5A.
within one year of the issue of notification u/s 4 of LAA 20 50
4. Declaration of award u/s 11 of LAA within two years of the issue of notification u/s 6 of LAA
100

Chapter–V: Compliance Audit Observations
85
With the reference to the above provision of Land Acquision Act, 1894 the compliance audit of the Company revealed a loss of ` 9.41 crore as discussed below:
5.5 Loss to the Company due to unprofessional approach
The Company initiated the land acquisition proposal without entering an agreement with the Bharat Electronics Limited and consequently suffered a loss of ` 6.49 crore on account of cancellation of the acquisition process.
As per Section 39 of the LAA, an agreement is required to be executed by the proposing agency in case land is to be acquired for a company. Bharat Electronics Limited (BEL) intimated (April 2012) its requirement5 of 200 acres of land and requested Company to initiate the process for the same. BEL had also categorically asked Company for certain information such as location of land, approximate cost involved, time to be taken etc. before commencing the acquisition process. The Company, however, initiated the acquisition process for 394.32 acres of land in three villages (Dehra, Rawli and Udayrampur) located in the Industrial Area of Masoorie-Gulawati in district Ghaziabad without furnishing the required details to BEL. This proposal was in fact a revival of an earlier proposal which was modified to include the requirements of BEL. An acquisition proposal was accordingly sent (April 2013) to the District Authorities, Ghaziabad. The Company also requested (October 2013) the District Authorities to adjust an amount of ` 37.10 crore which was deposited by the Company towards its previous land acquisition proposals that could not materialise, towards meeting out the 10 per cent acquisition charges and 10 per cent compensation (` 18.55 crore each) pertaining to the BEL proposal. The notification u/s 4(1)/166 of the LAA was published on 28 December 2013.
The District Authorities further demanded (June 2014) ` 203.04 crore7 for the issue of notification u/s 6/16 of the LAA. The Company raised a demand notice with BEL (July 2014) for a total amount of ` 305.11 crore8. BEL however refused (December 2014) to provide the necessary funds to the Company stating that the rates were very high. In the interregnum, as the notification u/s 6/169 could not be issued within one year after the date of publication of the notification u/s 4(1)/16 of the LAA, the acquisition proposal lapsed (22 January 2015) as per section 6(1)(ii) of the LAA. In between, since no decision could be reached, the Company had also decided (January 2015) to drop the proposal.
Audit noticed (April 2018) that the Company had initiated the land acquisition process without entering into an agreement with BEL as required under LAA. The Company had also failed to address the concerns raised by BEL before 5 For setting up an additional infrastructure facility of their unit in order to meet the heavy
demand for Radar and Antenna for the three Armed Forces. 6 Preliminary notification that land in any locality is needed or is likely to be needed for any
public purpose. 7 70 per cent of the estimated cost of acquisition of 394.32 acres. 8 On account of 10 per cent acquisition charges (` 27.35 crore), Rehabilitation charges
(` 25.00 crore), 80 per cent of estimated compensation (` 218.86 crore) and its overhead @ 12.5 per cent (` 33.90 crore).
9 The notification issued under Section 6/16 of the Act is the declaration that land is required for a public purpose after considering the report under section 5A.

Audit Report on Economic Sector and Public Sector Undertakings for the year ended 31 March 2018
86
proceeding ahead with the acquisition process. Further, against the due amount of ` 137.07 crore10, the Company had raised a demand for ` 305.11 crore which was in excess of BEL’s portion. As a result, the BEL expressed (December 2014) its unwillingness to proceed ahead with the land acquisition process citing budget constraints and the high cost of land acquisition. As the proposal lapsed before the notification under Section 6/16 of the LAA could be issued, the Company suffered a loss of ` 6.49 crore11. This loss has to be borne by the Company as it had not entered an agreement.
The Management stated (March 2019) that the Company is a commercial entity, and that in anticipation of potential loss in acquisition of a particular land, the proceedings were withdrawn by it. The fact remains that the Company had to suffer loss as it failed to execute an agreement with BEL as per the provisions of LAA before initiating land acquisition process. Execution of such an agreement would have addressed BEL’s concerns on viability of the proposal and also safeguarded Company’s financial interests. The matter was reported to the Government (December 2018). Reply is still awaited (September 2019).
5.6 Loss due to selection of unsuitable land
The Company selected unsuitable land and ignored revised high rates of compensation due to applicability of the new Land Acquisition Act which resulted in loss to the extent of ` 2.92 crore.
The Company forwarded (November 2013) a proposal to the District Authorities, Firozabad for acquisition of 170.537 hectare of land for development of an IT Park and an Industrial Area at Shikohabad12, Firozabad, and paid ` 18.81 crore13 to the District Authorities, Firozabad. Notifications were issued under Section 4/16 (for 170.537 hectare) in December 2013 and u/s 6/16 (for 167.578 hectare) in December 2014. The final notification u/s 6(i)/16 on site14 of the Land Acquisition Act (LAA) was published in the Gazette in May 2015. Audit noticed (April 2018) that the demand for estimated compensation and acquisition charges amounting to ` 46.11 crore was raised by the District Authorities (17 December 2015) so that award under Section 11 could be declared and land might be handed over to the Company. The Management of the Company, however, did not deposit the compensation due to its assessment of weaker marketing prospects given the high input cost (due to revised high rates of compensation under the new LAA effective from 1 January 2014 and the high development cost of uneven land). The Company forwarded Karar patra with land owners in respect of only 6.859 hectare of land out of total 167.578 hectare of land to the District Authorities for which award was declared and compensation amounting to ` 1.65 crore was
10 Pro rata for 200 acres - ` 240.14 crore (` 37.10 crore + ` 203.04)/394.32 acres*200 acres
= ` 121.84 crore, plus ` 15.23 crore (` 121.84 crore * 12.5 per cent) towards overhead. 11 35 per cent of the total acquisition charges of ` 18.55 crore. 12 Village Gurhsan, Fatehpur Nasirpur and Patna Karkhain , tehsil Shikohabad. 13 10 per cent each towards acquisition charges and estimated compensation ` 1.79 crore +
` 1.79 crore (December 2013), for Rehabilitation ` 3.81 crore (October 2014) and for Annuity ` 11.42 crore (October 2014).
14 In the locality in which the land is situated.
Chapter–V: Compliance Audit Observations
87
disbursed. As a result, the land acquisition proceedings in respect of 160.719 hectare of land lapsed after two years of publication of notification at site i.e. on 31 May 2017. The District Authorities deducted (November 2017) ` 89.38 lakh as 50 per cent of acquisition charges of ` 1.79 crore.
Thus, the Company suffered a loss of ` 2.92 crore being acquisition charges of ` 85.73 lakh15 and interest amounting to ` 2.06 crore16 on the total amount of ` 17.46 crore blocked with the district authorities for acquisition of land. Audit noticed that the Company was well aware since September/October 2013 that though the land in question could be easily acquired at lower rates, however, it was highly uneven and not suitable for acquisition and onward development/disposal. Later on, by November 2013, the Company was also aware of the fact that the amount of compensation would increase up to three times17 (approximately) due to applicability of new Land Acquisition Act which was also brought to the notice of the Company by the District Authorities through their initial demand letter dated 30 November 2013. Despite above, the Company did not stop the process of land acquisition in time. The Company had paid ` 18.81 crore to District Authorities during the period December 2013 to October 2014, but did not make any further payments, as the new rates were four times that of the D.M. circle rates considered at the time of issue of notification u/s 4/16. Thus, by selection of unsuitable land in the first instance and by not taking cognizance of the higher rates of compensation due to applicability of the new Land Acquisition Act, the Company ended up suffering a loss to the extent of ` 2.92 crore. The Management stated (March 2019) that the Company decided to quash the process of land acquisition as prospects of its marketing had weakened after determination of the market value of land at new acquisition rates under the new Rules. It also stated that the Board had subsequently increased the land allotment rates by an additional ` 300 per sqm in all of its existing industrial areas to recoup the expenditure incurred on such acquisition. The reply of the Management is not acceptable as the Company has shifted the incidence of the cost of its inefficiency upon new allottees for no fault of theirs.
The matter was reported to the Government (December 2018). Reply of the Government is still awaited (September 2019).
15 Loss of acquisition charges calculated on the area 160.719 hectare for which award was
not declared and proposal was lapsed. 16 Calculated at the rate of four per cent per annum, simple interest on ` 17.16 crore
(` 18.81crore - ` 1.65 crore paid for compensation) for 3 years (November 2014 to October 2017).
17 Expected new compensation as per D.M. circle rate was ` 53.38 crore as compared to ` 17.88 crore as per old rates).

Audit Report on Economic Sector and Public Sector Undertakings for the year ended 31 March 2018
88
Urban Development Department
Uttar Pradesh Jal Nigam
5.7 Award of higher rates of extra item of work to the Contractor
Execution of extra items of work of timbering at higher rate resulted in undue benefit to the Contractor to the extent of ` 4.05 crore.
Uttar Pradesh Jal Nigam18 (UPJN) entered (December 2010) into a contract with a contractor for survey, design, supply of all materials, labour, T&P (tools and plant) in the work related to the construction of branch, lateral, and main trunk sewer lines and appurtenant works for Bijnor sewerage scheme on turnkey basis at a cost of ` 70.09 crore. Audit noticed (November 2017) following irregularities in the execution of the contract.
(i) As per Schedule-H “Additional Items Rates” of the contract, all extra or additional work done shall be valued at the rates and price set out in the contract. If the contract does not contain any rates or prices applicable to the extra or additional work, then the rates shall be minimum of the rate derived from (a) the tendered/contract rates of the contract of similar class of work, (b) the UP Jal Nigam schedule of rates of the year in which the work actually done for Bijnor district.
The contract executed with the Contractor contained rates of “close timbering 3 to 6.0 m19” and “close timbering > 6.0 m left in trench” at ` 170 per Sqm and ` 910 per Sqm respectively. Notwithstanding the above rates in the contract, UPJN paid to the Contractor higher rates of ` 482 per Sqm for “close timbering 0 to 3.0 m”, ` 1,206 per Sqm for “close timbering 0 to 3.0 m left in trench” and ` 1,981 per Sqm for “close timbering 3 to 6.0 m left in trench” as extra items. The higher rates allowed were based on the UPJN Schedule of Rate (SoR) 2011-12. As the rates of similar class of work with higher specification were available in the contract itself, the UPJN should have paid the same rate for extra items of work as per the provisions of the Schedule H of the contract. Thus, violation of the contract, resulted into undue favour to the Contractor and excess payment of ` 2.42 crore (Appendix-5.3).
(ii) As per the terms and conditions of the contract, the timber to be used in the shuttering works was to be from the heart of a sound tree of natural growth with the sapwood being entirely removed. It was to be uniform in substance, straight in fiber, free from large, loose and dead knots, flaws, shakes, decay, rot, fungi, insect attacks and from any other damages of harmful nature which may affect the strength, durability, appearance or its usefulness. The colour was to be uniform as far as possible. The timber was to comply with other requirements of PWD specifications as well.
There was no mention either in the contract or in the Manual on Sewerage and Sewage Treatment regarding use of unused timber for the purpose of timbering. Besides, the Bill of Quantity also did not mention the type of
18 Circle-8, U.P. Jal Nigam, Moradabad. 19 Meter.

Chapter–V: Compliance Audit Observations
89
timber (i.e. used or unused)20 to be used in timbering. Further, as per general conditions of the tender document, the Contractor was required to quote the rates, item wise, for every item including supply of all materials, labour, T&P required for proper completion of work, whether clearly mentioned in the tender or not. No extra claims were to be entertained on this ground. Scrutiny of the records related to sewer and appurtenant work revealed that an item providing all material, labour and T&P etc. for fixing of close timbering 0 to 3.0 m and 3 to 6.0 m depth with unused timber (left in trench) was got executed by the UPJN at the rate of ` 2,975 per sqm and ` 3,690 per sqm respectively based on UPJN SoR 2011-12 as extra items under the above contract. However, rate quoted by the Contractor for similar class of work was ` 910 per sqm only. As timber of only the specified quality was to be used as per contract terms, execution of work using unused timber as an extra item at higher rates was unjustified which resulted in avoidable expenditure of ` 1.63 crore incurred by UPJN as detailed in the Appendix-5.4. The Management stated (May 2019) that Contractor had expressed unwillingness to execute the extra item of the work on the basis of rate derived from similar type of work and agreed to work only on current SoR rate. Since, it was not possible to deploy any other agency for the balance work at that stage, hence the higher rates were allowed. It was further stated that it was difficult to get used timber of specified quality and specification in the market. The reply of the Management is not acceptable as the Contractor executed agreement with UPJN based upon the rates quoted by him. Therefore, it was binding upon the Contractor to execute the work as per the terms and condition of the contract. The matter was reported to the Government (December 2018). Reply is still awaited (September 2019).
5.8 Undue favour to the Contractor
The Uttar Pradesh Jal Nigam extended undue favour to the Contractor by allowing inadmissible escalation resulting in loss to the GoUP of ` 4.09 crore.
The Department of Technical Education, Government of Uttar Pradesh (GoUP), awarded (March 2009) the work of construction of Dr. Bhim Rao Ambedkar Engineering College of Information and Technology (College) at Banda to the Construction and Design Wing (C&DS) of the Uttar Pradesh Jal Nigam (UPJN) as a deposit work at an estimated cost of ` 126.05 crore as approved (February 2009) by the Expenditure Finance Committee (EFC)21. However, due to standardisation of the design of the work, the GoUP revised (January 2010) the cost of the work downwards to ` 62.13 crore which was also approved (December 2009) by the EFC. The C&DS, after inviting (March 2010) the tenders, awarded (July 2010) the above work to M/s Ultra Homes Construction Private Limited (Contractor) at a cost of ` 54.76 crore (5.8 per cent below the schedule of rates). The scheduled dates of the start and completion of the work were fixed as 14 July 2010 and 13 July 2012 respectively. The work was completed in June 2014.
20 Timber being used first time is unused timber & timber being used after being used once is
designated as used timber. 21 A committee of GoUP.

Audit Report on Economic Sector and Public Sector Undertakings for the year ended 31 March 2018
90
As per Clause 44 of the Agreement (July 2010), no price escalation, for whatsoever reason, was payable to the Contractor.
The C&DS prepared the detailed estimates on the basis of Bill of Quantity of the work and accorded the Technical Sanction in June 2010. The detailed estimates inter-alia included the work of 300 mm dia Pile work at the analysed22 rate of ` 5,569 per pile.
Audit noticed (February 2016) that the C&DS had paid an amount of ` 1.89 crore for the item “300 mm dia Pile work” to the contractor for 3,595 pile works at the rate of ` 5,569 per pile less 5.8 per cent through the first and the second running bills (October 2010 and January 2011).
Due to revision of the rates and inclusion of some extra items, the C&DS subsequently submitted (October 2012) a revised estimate of the work to the GoUP totaling ` 81.49 crore which was approved (January 2013) by the GoUP for ` 80.08 crore as also approved by the EFC (October 2012). As required by the GoUP, the C&DS also submitted detailed estimates along with the revised estimates. The detailed estimates were prepared on the basis of ‘Work Done’ and ‘Work to be Done’. Audit further noticed that although the works of ‘300 mm dia Pile work’ were already executed and paid for at the rate of ` 5,569 per pile, however, the C&DS had depicted the above works as executed at the rates of ` 17,650 per pile (increase of 217 per cent) in the detailed estimates submitted to the EFC. The discrepancy was not noticed by either the EFC or by the Department.
After approval by the GoUP, the C&DS paid (March 2013) the Contractor the difference between the rates already paid and the new rates. This resulted in an inadmissible payment of ` 4.09 crore23 to the Contractor. Therefore, by submitting highly inflated rates for a work which had been already executed and paid for, the C&DS not only submitted incorrect information to the GoUP, it also paid the difference between the rates paid and the rates subsequently approved to the Contractor, thereby allowing him an undue advantage of ` 4.09 crore.
The Management stated (July 2019) that the value of the contract (` 54.76 crore) made with the Contractor was adhoc as C&DS could not get sufficient time to estimate the value of the contract in view of GoUP Order dated 27 January 2010. The contractor was paid on tentative basis. The revised rates for the above works were recommended by Project Formulation and Appraisal Division (PFAD) and approved by the EFC and no incorrect information was given to Government. The reply is not acceptable as there is no condition in the contract showing its value as adhoc. The pile works were already executed and paid for at the agreed rate (` 5,569 per pile). The C&DS, however, had depicted the works as executed at the rate ` 17,650 per pile in the detailed revised estimates submitted to the EFC which clearly shows that the subsequent EFC’s approval was based on the incorrect information submitted to them by the C&DS. Moreover, as per the agreement, no price escalation was admissible to the contractor. 22 Analysed on the basis of the market rate. 23 3,595 nos. piling work (1,835 nos. academic block + 704 nos. Girls Hostel + 1,056 nos.
boys and girls hostel) X (` 17,650- ` 5,569) less 5.8 per cent.
Chapter–V: Compliance Audit Observations
91
The matter was reported to the Government (March 2019). Reply is still awaited (September 2019).

PART-B Departments and Entities (other than
Public Sector Undertakings) under Economic Sector


CHAPTER–VI Functioning of Departments and Entities (other than Public Sector
Undertakings) under Economic Sector


93
CHAPTER-VI
Functioning of Departments and Entities (other than Public Sector Undertakings) under Economic Sector
Introduction
6.1 This chapter presents the profile of audited entities, trends of expenditure under the Economic Sector, response of the Government to Audit, action taken on earlier Audit Reports, status of placement of Separate Audit Reports of Entities (other than PSUs) under Economic Sector, in the State Assembly and position of their arrear of accounts.
Profile of Departments and Authorities
6.2 Eighteen departments of Government of Uttar Pradesh and 44 Authorities fall under the Economic Sector. These departments are headed by Additional Chief Secretaries/Principal Secretaries, who are assisted by Commissioners/ Directors and subordinate officers under them.
Trends of budget estimate and actual expenditure of the State Government during 2013-18 are as detailed in Chart-1:
Source: Annual Financial Statement and Explanatory Memorandum of the State Budget of
respective years
The trend of expenditure of five major departments under the Economic Sector during 2015-16 to 2017-18 is given in Table 6.1.

Audit Report on Economic Sector and Public Sector Undertakings for the year ended 31 March 2018
94
Table - 6.1: Trend of Expenditure of major departments under the Economic Sector
(` in crore) Department 2015-16 2016-17 2017-18
Energy 48,218.81 33,976.691 17,265.502 Infrastructure and Industrial Development Department 3,080.27 6,296.113 1,740.564 Housing and Urban Planning 2,213.97 2,888.06 723.395 Revenue (Except Collectorate) 2,495.16 2,721.56 2,987.80 Forest 840.46 1,231.72 808.216 Source: Appropriation Accounts of respective years
Audit Coverage
6.3 During the year 2017-18, the Principal Accountant General (Economic and Revenue Sector Audit), Uttar Pradesh conducted the compliance audit of 111 out of the total 508 auditable units under the 18 departments pertaining to the Economic Sector.
Response of Government to Audit 6.4 Audit affords a four stage opportunity to the audited units/departments to elicit their views on audit observations, viz.,
Audit Memos: Issued to the head of the audited unit during the field audit to be replied during the audit itself.
Inspection Reports (IR): Issued within a month of the completion of audit to be replied by the head of the audited unit within four weeks.
Draft Paragraphs: Issued to the heads of the departments under whom the audited units function for submission of departmental views within a period of six weeks for consideration prior to their being included in the Audit Report.
Exit Conference: Opportunity is given to the head of departments and State Government to elicit departmental/Government views on the audit observations prior to finalisation of the Audit Report.
In all these stages, Audit strives to provide full opportunity to audited units/head of departments/State Government to provide rebuttals and clarifications and only when the departmental replies are not received or are not convincing, the audit observations are processed for inclusion in the Inspection Report or Audit Report, as the case may be. However, in most of the cases, the audited units/departments, do not submit timely and satisfactory replies as indicated below:
1 ` 24,232.48 crore spent on Ujwal DISCOM Assurance Yojana (UDAY) in 2015-16 and
` 14,801.28 crore in 2016-17. 2 Reduction in expenditure during 2017-18 was mainly due to decrease in power subsidy
capital expenditure and loans for power projects. 3 ` 2,882.25 crore released for Purvanchal Expressway in 2016-17. 4 Reduction in expenditure during 2017-18 was mainly due to decrease in capital expenditure
on roads and bridges. 5 Reduction in expenditure during 2017-18 was mainly due to decrease in expenditure on
urban development, other general economic services; capital expenditure on education, sports, arts & culture, housing and urban development and decrease in loans for urban development.
6 Reduction in expenditure during 2017-18 was mainly due to decrease in capital expenditure on forestry and wildlife.
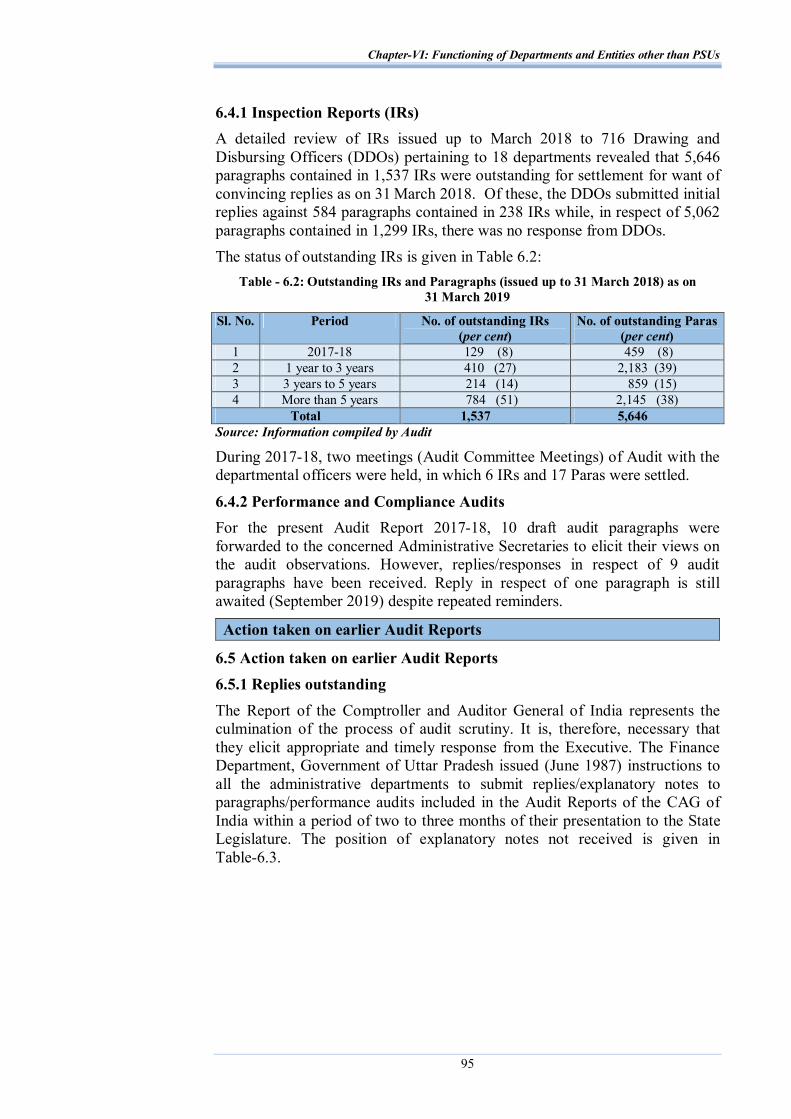
Chapter-VI: Functioning of Departments and Entities other than PSUs
95
6.4.1 Inspection Reports (IRs) A detailed review of IRs issued up to March 2018 to 716 Drawing and Disbursing Officers (DDOs) pertaining to 18 departments revealed that 5,646 paragraphs contained in 1,537 IRs were outstanding for settlement for want of convincing replies as on 31 March 2018. Of these, the DDOs submitted initial replies against 584 paragraphs contained in 238 IRs while, in respect of 5,062 paragraphs contained in 1,299 IRs, there was no response from DDOs. The status of outstanding IRs is given in Table 6.2:
Table - 6.2: Outstanding IRs and Paragraphs (issued up to 31 March 2018) as on 31 March 2019
Sl. No. Period No. of outstanding IRs (per cent)
No. of outstanding Paras (per cent)
1 2017-18 129 (8) 459 (8) 2 1 year to 3 years 410 (27) 2,183 (39) 3 3 years to 5 years 214 (14) 859 (15) 4 More than 5 years 784 (51) 2,145 (38)
Total 1,537 5,646 Source: Information compiled by Audit
During 2017-18, two meetings (Audit Committee Meetings) of Audit with the departmental officers were held, in which 6 IRs and 17 Paras were settled.
6.4.2 Performance and Compliance Audits For the present Audit Report 2017-18, 10 draft audit paragraphs were forwarded to the concerned Administrative Secretaries to elicit their views on the audit observations. However, replies/responses in respect of 9 audit paragraphs have been received. Reply in respect of one paragraph is still awaited (September 2019) despite repeated reminders.
Action taken on earlier Audit Reports
6.5 Action taken on earlier Audit Reports 6.5.1 Replies outstanding The Report of the Comptroller and Auditor General of India represents the culmination of the process of audit scrutiny. It is, therefore, necessary that they elicit appropriate and timely response from the Executive. The Finance Department, Government of Uttar Pradesh issued (June 1987) instructions to all the administrative departments to submit replies/explanatory notes to paragraphs/performance audits included in the Audit Reports of the CAG of India within a period of two to three months of their presentation to the State Legislature. The position of explanatory notes not received is given in Table-6.3.
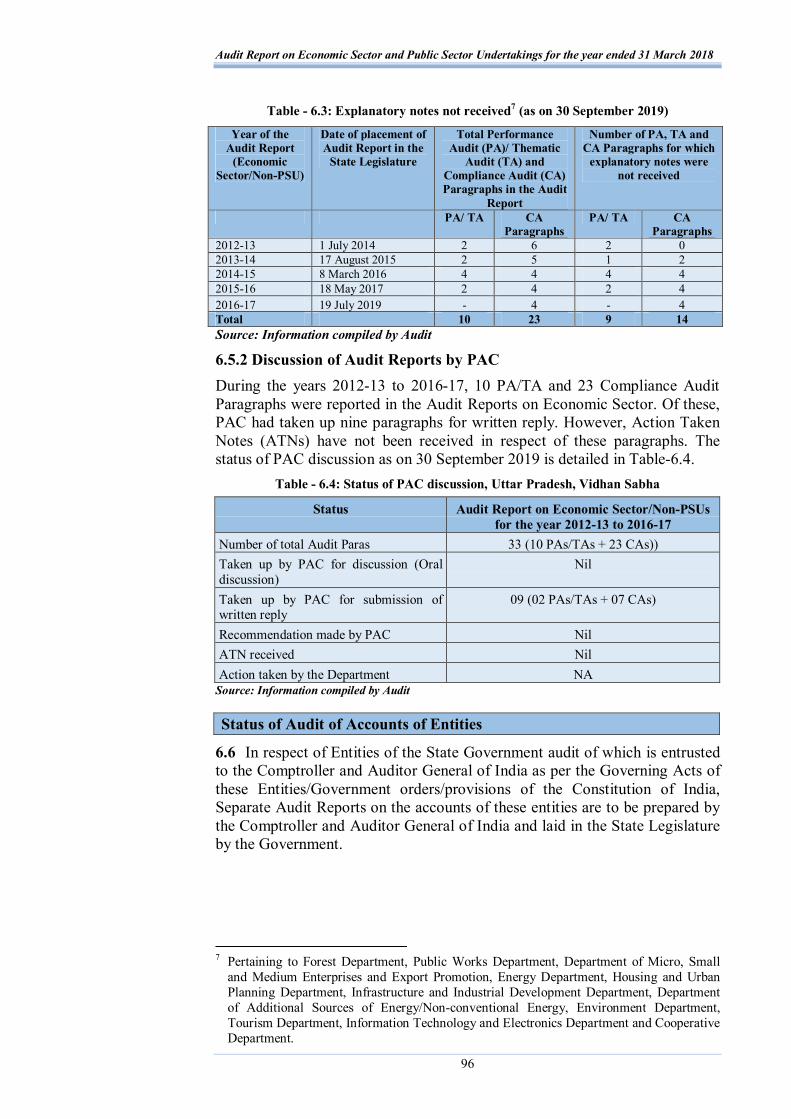
Audit Report on Economic Sector and Public Sector Undertakings for the year ended 31 March 2018
96
Table - 6.3: Explanatory notes not received7 (as on 30 September 2019)
Year of the Audit Report
(Economic Sector/Non-PSU)
Date of placement of Audit Report in the
State Legislature
Total Performance Audit (PA)/ Thematic
Audit (TA) and Compliance Audit (CA) Paragraphs in the Audit
Report
Number of PA, TA and CA Paragraphs for which
explanatory notes were not received
PA/ TA CA Paragraphs
PA/ TA CA Paragraphs
2012-13 1 July 2014 2 6 2 0 2013-14 17 August 2015 2 5 1 2 2014-15 8 March 2016 4 4 4 4 2015-16 18 May 2017 2 4 2 4 2016-17 19 July 2019 - 4 - 4 Total 10 23 9 14 Source: Information compiled by Audit
6.5.2 Discussion of Audit Reports by PAC During the years 2012-13 to 2016-17, 10 PA/TA and 23 Compliance Audit Paragraphs were reported in the Audit Reports on Economic Sector. Of these, PAC had taken up nine paragraphs for written reply. However, Action Taken Notes (ATNs) have not been received in respect of these paragraphs. The status of PAC discussion as on 30 September 2019 is detailed in Table-6.4.
Table - 6.4: Status of PAC discussion, Uttar Pradesh, Vidhan Sabha
Status Audit Report on Economic Sector/Non-PSUs for the year 2012-13 to 2016-17
Number of total Audit Paras 33 (10 PAs/TAs + 23 CAs)) Taken up by PAC for discussion (Oral discussion)
Nil
Taken up by PAC for submission of written reply
09 (02 PAs/TAs + 07 CAs)
Recommendation made by PAC Nil ATN received Nil Action taken by the Department NA
Source: Information compiled by Audit
Status of Audit of Accounts of Entities
6.6 In respect of Entities of the State Government audit of which is entrusted to the Comptroller and Auditor General of India as per the Governing Acts of these Entities/Government orders/provisions of the Constitution of India, Separate Audit Reports on the accounts of these entities are to be prepared by the Comptroller and Auditor General of India and laid in the State Legislature by the Government.
7 Pertaining to Forest Department, Public Works Department, Department of Micro, Small
and Medium Enterprises and Export Promotion, Energy Department, Housing and Urban Planning Department, Infrastructure and Industrial Development Department, Department of Additional Sources of Energy/Non-conventional Energy, Environment Department, Tourism Department, Information Technology and Electronics Department and Cooperative Department.

Chapter-VI: Functioning of Departments and Entities other than PSUs
97
Arrears in finalisation and submission of Accounts of Entities 6.6.1 As on 31 March 2018, audit of annual accounts of 44 Entities under Economic Sector of Uttar Pradesh had been entrusted8 to the Comptroller and Auditor General of India. Out of 44 entities, two entities had finalised their accounts up to 2017-18. The remaining 42 entities have arrears of 106 accounts up to September 2019. Out of 42 entities, accounts of 36 entities were in arrear for one year, account of one entity was in arrear for five years and accounts of five entities were in arrear for 13 years as detailed in Table-6.5:
Table-6.5: Statement showing arrears of accounts of various Entities falling under Economic Sector
Sl. No.
Name of Entities Year(s) for which Accounts are in
arrears
Number of
accounts in arrears
1 Uttar Pradesh Electricity Regulatory Commission (UPERC).
2017-18 01
2 Uttar Pradesh Compensatory Afforestation Fund Management Planning Authority
2017-18 01
3 Khadi & Village Industries Board 2013-14 to 2017-18 05 4 UP Expressway Industrial Development Authority 2017-18 01 5 New Okhla Industrial Development Authority 2005-06 to 2017-18 13 6 Greater Noida Industrial Development Authority NIL NIL 7 Yamuna Expressway Industrial Development Authority 2005-06 to 2017-18 13 8 Satharia Industrial Development Authority 2005-06 to 2017-18 13 9 Gorakhpur Industrial Development Authority 2005-06 to 2017-18 13
10 Lucknow Industrial Development Authority 2005-06 to 2017-18 13 11 Lucknow Development Authority 2017-18 01 12 Ghaziabad Development Authority 2017-18 01 13 Agra Development Authority 2017-18 01 14 Meerut Development Authority 2017-18 01 15 Prayagraj Development Authority 2017-18 01 16 Hapur/Pilkhuwa Development Authority 2017-18 01 17 Varanasi Development Authority 2017-18 01 18 Moradabad Development Authority 2017-18 01 19 Gorakhpur Development Authority 2017-18 01 20 Mathura-Vrindavan Development Authority 2017-18 01 21 Aligarh Development Authority 2017-18 01 22 Bareilly Development Authority 2017-18 01 23 Raebareli Development Authority 2017-18 01 24 Saharanpur Development Authority 2017-18 01 25 Ayodhya/Faizabad Development Authority 2017-18 01 26 Firozabad-Shikohabad Development Authority 2017-18 01 27 Kanpur Development Authority 2017-18 01 28 Rampur Development Authority 2017-18 01 29 Unnao-Shuklaganj Development Authority 2017-18 01 30 Jhansi Development Authority 2017-18 01 31 Muzaffarnagar Development Authority 2017-18 01 32 Bulandshahar Development Authority 2017-18 01 33 Khurza Development Authority 2017-18 01 34 Urai Development Authority 2017-18 01 35 Banda Development Authority 2017-18 01
8 Audit of seven Industrial Development Authorities was entrusted w.e.f. 2005-06 vide GoUP order dated 17 January 2018 and audit of 28 Development Authorities and five Special Area Development Authorities was entrusted w.e.f. 2017-18 vide GoUP order dated 10 April 2017.

Audit Report on Economic Sector and Public Sector Undertakings for the year ended 31 March 2018
98
Sl. No.
Name of Entities Year(s) for which Accounts are in
arrears
Number of
accounts in arrears
36 Baghpat Badaut Khekda Development Authority 2017-18 01 37 Azamgarh Development Authority 2017-18 01 38 Basti Development Authority 2017-18 01 39 Special Area Development Authority, Shakti Nagar 2017-18 01 40 Special Area Development Authority, Chitrakoot 2017-18 01 41 Special Area Development Authority, Kapilvastu 2017-18 01 42 Special Area Development Authority, Vindhyachal-
Mirzapur 2017-18 01
43 Special Area Development Authority, Kushinagar 2017-18 01 44 UP Real Estate Regulatory Authority NIL NIL
Source: Information compiled by Audit
Status of placement of Separate Audit Reports of Entities in the State Legislature 6.6.2 Details of Separate Audit Reports (SARs) on the audit of accounts of two entities under Economic Sector of Uttar Pradesh which are yet to be presented in the State Legislature are depicted in Table-6.6:
Table-6.6: Statement showing details of outstanding Separate Audit Reports to be presented in the State Legislature
Position of SARs not placed in Legislature
Sl. No.
Name of Entities
Year upto which SAR placed in
Legislature Years of SAR Date of issue to Government
Reasons for not-placing
of SAR
1 Uttar Pradesh Electricity Regulatory Commission (UPERC).
No SAR placed in legislature since its establishment (2003-04).
2003-04 2004-05 2005-06 2006-07 2007-08 2008-09 2009-10 2010-11 2011-12 2012-13 2013-14 2014-15 2015-16 2016-17
19 October 2006 5 October 2007 5 October 2007 3 October 2008 17 August 2009 15 August 2010
26 May 2011 08 June 2012
24 September 2014 20 February 2015
22 June 2015 28 December 2015
18 May 2017 08 March 2019
Reasons not furnished.
2 Uttar Pradesh Compensatory Afforestation Fund Management Planning Authority
NIL 2010-11 2011-12 2012-13
2 May 2019 1 October 2019 1 October 2019
Reasons not furnished.

Chapter-VI: Functioning of Departments and Entities other than PSUs
99
Recoveries at the instance of Audit
6.7 During the course of audit, recoveries of ` 49.00 crore pointed out in four cases in various departments/entities, were accepted. Against this, recoveries of ` 1.19 crore in one case were effected during 1 April 2017 to 30 September 2019 as per the details given in Table-6.7:
Table-6.7: Recoveries pointed out by audit and accepted/recovered by the departments/entities
(` in crore) Recoveries pointed out in Audit and accepted by the
Department during 1 April 2017 to
30 September 2019
Recoveries effected during
1 April 2017 to 30 September 2019
Department Particulars of recoveries
Number of cases
Amount involved
Number of cases
Amount involved
Ghaziabad Development Authority failed to levy additional land use conversion charges
1 6.83 - -
Ghaziabad Development Authority failed to revise and recover City Development Charges
1 18.91 - -
Housing and Urban Planning Department
Ghaziabad Development Authority suffered a loss by extending undue benefit of incentive scheme
1 22.14 - -
Department of Additional Sources of Energy
Non-deduction of labour cess from the bills of the contractor
1 1.12 1 1.19
Total 4 49.00 1 1.19 Source: Information compiled by audit.


CHAPTER–VII Compliance Audit observations relating to Departments and Entities (other than
Public Sector Undertakings) under Economic Sector


101
CHAPTER-VII
7. Compliance Audit Observations relating to Departments and Entities (other than PSUs) under Economic Sector
Important audit findings emerging from test check of transactions made by the various departments/entities are included in this Chapter. Housing and Urban Planning Department
Ghaziabad Development Authority
7.1 Hi-tech Township Policy Government of Uttar Pradesh (GoUP), in order to mitigate the housing problems in the urban areas, and to promote planned development of cities, formulated (November 2003) the Hi-tech Township Policy, 2003 with the objective of inviting private developers for development of Hi-tech Townships with minimum investment of ` 750 crore on land holding of 1,500 acres. The Compliance audit of Ghaziabad Development Authority (GDA) revealed some irregularities in respect of Hi-Tech Township Policy as discussed in succeeding paragraphs 7.1.1 to 7.1.3: 7.1.1 Undue benefit to Hi-tech township developers By altering the land use indicated in the Master Plan without levy of land use conversion charges, GoUP allowed undue benefit of ` 572.48 crore to the developers at the cost of Ghaziabad Development Authority. As per the GoUP order (August 2001), land use conversion charges were to be levied on the net area of the land at the Circle rates fixed by the District Magistrate for the existing use of the land. It was further mentioned in aforesaid order that rates of land use conversion will be 50 per cent in case of land use conversion from agricultural to residential. In May 2005, the GoUP selected two developers1 for the development of Hi-tech townships in Ghaziabad. At this time, Master Plan-2001 was in force according to which, the land use of the area designated for Hi-tech township was agricultural. In July 2005, Master Plan-2021 was approved by the GoUP. It was provided in Master Plan 2021 that the use of the land designated for Hi-tech township was indicative, the developers selected by the GoUP shall have to pay the applicable land use conversion charges and the use of balance land remaining after use in Hi-tech township shall be considered as agricultural. Further, GoUP orders (18 May 2006 and 17 September 2007) introducing Hi-tech Township Policies 2006 and 2007 respectively also stipulated that the applicable land use conversion charges shall be payable by the developers in case the land use of the selected site is not earmarked as residential in the Master Plan. However, GoUP order (23 April 2010) regarding Master Plan-2021 stated that there is no provision under the UP Urban Planning and Development Act, 1973 for showing land use as indicative for Hi-tech Township. As the land use had been shown so in the Ghaziabad Master Plan-2021, therefore, the land use for the same will be considered as residential. Hence, land use conversion charges would not be payable on this area.
1 Uppal Chaddha Hi-tech Developers Private Limited and Suncity Hi-tech Infra Private Limited.

Audit Report on Economic Sector and Public Sector Undertakings for the year ended 31 March 2018
102
Audit noticed (May 2017) that vide above order (23 April 2010) the Housing and Urban Planning Department (Department), GoUP, on the request of the developers, altered the indicated land use in the Master Plan to residential and consequently no charges for conversion of land use were henceforth payable by the two developers. In this connection, the following was observed by Audit: The MOUs executed2 with the developers stipulated that if the site selected
by the developers falls within the Master Plan area and needs conversion of land use for the purpose of developing a Hi-tech township, the same shall be completed by the GoUP through amendments in the Master Plan in accordance with law for which conversion charges as prescribed by the GoUP shall be payable by the developers.
This aforesaid order was issued ignoring the fact that the proposed land use of Hi-tech city in the Master Plan 2021 was only indicative, and that the Authority had stated upfront its intention to change the land use from agricultural to residential only after recovering land use conversion charges from the developers.
The opinion of the Sanyukt Shaskeeya Hastantarak3, Legal Department, GoUP mentioned that non levy of land use conversion charges would amount to ‘post bid benefit’. This specific opinion was overruled by the Principal Secretary, Legal Department.
Audit further noticed that the Authority has approved (October 2010 to October 2013) the layout plans of the developers for an area of 4,722.19 acre4 land which included 3,702.97 acre5 land indicatively earmarked as Hi-tech township in the Master Plan 2021 wherein land use conversion charges of ` 572.48 crore6 (Appendix-7.1) were leviable on the developers. However, due to GoUP order (23 April 2010) the above charges could not be levied. Thus, land use of agricultural land was changed to residential land without levying land use conversion charges. This resulted in extension of an undue benefit to the developers and loss to the Authority of ` 572.48 crore. The Government in the meeting with Audit accepted (June 2019) the contention of Audit but did not intimate any action plan for recovery of the land use conversion charges.
7.1.2 Non-levy of additional land use conversion charges
Authority failed to levy additional land use conversion charges of ` 6.83 crore. In May 2005, the GoUP selected M/s Uppal Chaddha Hi-tech Developers Private Limited (Developer) for the development of Hi-tech townships in Ghaziabad. The Ghaziabad Development Authority (Authority) signed (November 2005) a Memorandum of Understanding (MOU) with the
2 With Uppal Chaddha Hi-tech Developers Private Limited on 30.11.2005 and with Suncity
Hi-tech Infra Private Limited on 22.12.2005. 3 It is a post in Legal Department, Government of Uttar Pradesh 4 4,004.25 acres for Uppal Chaddha Hi-tech Developers Private Limited (October 2010 to
October 2013) and 717.94 acres for Suncity Hi-tech Infra Private Limited (July 2011). 5 Uppal Chaddha Hi-tech Developers Private Limited- 2,985.03 acres and Suncity Hi-tech Infra Private
Limited-` 717.94 acres. 6 Uppal Chaddha Hi-tech Developers Private Limited-` 401.30 crore and Suncity Hi-tech Infra Private
Limited- ` 171.18 crore.

Chapter–VII: Compliance Audit Observations
103
Developer under the Hi-tech Township Policy 2003, for the development of the Hi-tech township in Ghaziabad. As per clause 8 of the MOU entered into between the Authority and the Developer, if the land belonging to the Developer required conversion of land use for the purpose of Hi-tech township, the same would be processed in accordance with the law, and the prescribed land use conversion charges would be payable by the Developer. As per the GoUP order (August 2001) read with the GoUP order of April 2010, the applicable land use conversion charges were based on the net area of land on which construction of houses was proposed in the approved Detailed Project Report (DPR). Therefore, if the DPR was revised entailing an increase in the availability of the net area of land, the additional land use conversion charges were also to be levied besides increase in other charges such as inspection charges, City Development Charges, etc. The Authority approved (July 2011) the DPR for 4,494.31 acre which included 1,019.22 acre of agricultural land. On the request of the Developer (December 2011) for land use conversion, the Authority levied (December 2011) land use conversion charges amounting to ` 114.26 crore on the basis of ‘factor of net area’ (0.6262) arrived at after deducting the area earmarked for green belt and roads. Audit noticed (February 2016) that the Developer thereafter changed the scheme plan and submitted (March 2013) a revised DPR which was approved by the Board of the Authority (September 2013). Based on the revised DPR, the Developer submitted (September 2013) a revised layout plan which was approved by the Authority (October 2013). In the revised layout plan, the ‘factor of net area’ had increased from 0.6262 to 0.6502 entailing an increase in the availability of net area of land for construction of houses. Hence, additional land use conversion charges amounting to ` 6.83 crore was leviable (Appendix-7.2) besides other charges. Though the Authority levied other charges, it failed to levy additional land use conversion charges on the increase in net area of land. This resulted in not only an undue favour being extended to the Developer, but also loss to the Authority to the extent of ` 6.83 crore. The Authority/Government accepted (January 2019/June 2019) the contention of Audit. The Authority further stated that a demand letter has been issued to the Developer for the recovery of the due amount. The recovery in the instant case is yet to be intimated despite being requested (August 2019) by Audit.
7.1.3 Non-revision and recovery of City Development Charges
The Authority failed to revise and recover City Development Charges amounting to ` 18.91 crore.
GoUP decided (September 2007) to levy City Development Charges (CDC) at the rate of ` 1.5 lakh per acre on the developers in the area covered under Nagar Nigam. The rate of CDC was further revised (August 2008) to ` three lakh per acre. In November 2014, GoUP notified Uttar Pradesh Urban Planning and Development (Assessment, Levy and Collection of City Development Charges) Rules, 2014 (framed under Uttar Pradesh Urban Planning and Development Act, 1973). As per the Rules, 2014, the CDC was to be revised on 1 April of each calendar year on the basis of cost index of the Central Public Works Department. Thereafter, GoUP instructed (September 2015) all
Audit Report on Economic Sector and Public Sector Undertakings for the year ended 31 March 2018
104
the Development Authorities to revise CDC on the basis of cost index and recover the same from the Hi-tech township developers whose layouts had been approved before the notification of the Rules, 2014. Audit noticed that for development of Hi-tech township in Ghaziabad, M/s Uppal Chaddha Hi-tech Developers Private Limited (Developer) was selected (May 2005) and an MoU was signed (November 2005). Ghaziabad Development Authority (Authority) approved the layout plan for the Hi-tech Township for a total of 4,004.25 acre of land in stages7 and levied CDC at the rate of ` three lakh per acre at every stage. Audit noticed that despite GoUP order (September 2015), the Authority failed to initiate any action for revision of CDC on the basis of prevalent cost index and its recovery. This resulted in loss of ` 18.91 crore (Appendix-7.3). The Authority/Government accepted (June 2019) the contention of Audit. The Authority further stated that demand letter has been issued to the Developer. The recovery in the instant case is yet to be intimated despite being requested (August 2019) by Audit.
7.2 Short levy of land use conversion charges
Ghaziabad Development Authority short levied land use conversion charges amounting to ` 10.91 crore.
As per Uttar Pradesh Urban Planning and Development (Land Use Conversion Charges-Assessment, Levy and Collection) Rules8, 2014 (Rules, 2014), where in any development area, the land use of the particular land is changed as a result of amendment of the Master Plan or the Zonal Development Plan under Section 13 of the Uttar Pradesh Urban Planning and Development Act, 1973 (Act), land use conversion charge is to be levied on the owner of such land. Further, the land use conversion charges were to be levied on the basis of circle rate of the land applicable on the date of the final decision of the Board. Prior to this notification, levy of land use conversion charges was governed by GoUP order of August 2001. The final notification of land use conversion is issued by the Government. The Police City Sahkari Samiti (Samiti) applied (September 2009) for conversion of land use of 20.79 hectare of agricultural land located at village- Shahpur Bumhehta, District-Ghaziabad into residential. Thereafter, the Authority raised a demand (August 2011) of ` 13.72 crore as land use conversion charges. As the proposed area was later reduced to 17.598 hectare, the Authority issued (June 2012) a revised demand of ` 12.18 crore to the Samiti based on the then prevalent land rates. No amount was deposited by the Samiti against the demand of ` 12.18 crore raised by the Authority. The Samiti again approached (January 2014) the Authority and requested to allow it to deposit the land use conversion charges within three years in six equal instalments. The Authority referred the matter to the State Government which directed (June 2014) that the matter be resolved as per applicable rules. In view of the GoUP order, the Authority again asked (June 2014) the Samiti to deposit the amount. However, the Samiti did not deposit the same.
7 In October 2010, September 2011 and October 2013. 8 Notified in December 2014.

Chapter–VII: Compliance Audit Observations
105
The Samiti once again approached (February 2016) the Authority and requested to issue a fresh demand letter. The Authority issued demand letter for ` 29.73 crore in August 2016 (calculated as per Rules, 2014). The Samiti approached (December 2016) the Authority and requested to recalculate the land use conversion charges on the basis of demand raised in June 2012 along with interest at the rate of 12 per cent per annum. The Board of Authority accepted (December 2016) the request of the Samiti. The Authority thereafter issued a revised demand of ` 18.82 crore (18.741 hectare) based on the land rate applicable in June 2012 along with interest at the rate of 12 per cent per annum. The Samiti deposited the entire amount of ` 18.82 crore in December 2016. Audit noticed that the Rules, 2014 only prescribed that the interest at the rate of 12 per cent be charged in case the applicant is allowed to deposit the land use conversion charges in instalments. There was no provision to calculate these charges on land rates applicable on a previous date. Besides, the maximum time allowed for depositing the entire amount of land use conversion charges as per the Rules was two years. As no extension of time was given by the Authority to deposit the charges, the case gets closed after two years (June 2014), the maximum time allowed under the rules to deposit the demanded amount. Hence, the application should have been treated as a new application, and as decided by the Authority in August 2016, the demand should have been raised afresh. By calculating land use conversion charges based on land rates applicable in June 2012 along with interest instead of upon rates applicable in December 2016 (the date of decision of the board) and not treating the case as a new one though it had automatically got closed after two years of initial demand being raised, the applicable land use conversion charges were short levied to the extent of ` 10.91 crore. The Authority stated (August 2019) that the matter of charging land use conversion charges on the basis of letter (June 2012) along with interest at the rate of 12 per cent was a policy issue and the decision was to be taken by the Authority’s Board only. Accordingly, the Board had approved the same in its meeting (December 2016) and communicated (January 2017) the decision to the Government. Audit notes that land use conversion charge is a levy fixed by the Government and it is therefore beyond the remit of the Board to alter/modify it. The Government, however, in the meeting with Audit accepted (June 2019) the contention of Audit but has not intimated any action plan for recovery of the short levy of land use conversion charges.
7.3 Non-compliance of the Government orders in sale of properties Compliance audit of Development Authorities revealed non-compliance of Government orders in sale of properties resulting in loss of ` 151.98 crore as discussed in succeeding paragraphs 7.3.1 to 7.3.3.

Audit Report on Economic Sector and Public Sector Undertakings for the year ended 31 March 2018
106
Ghaziabad Development Authority
7.3.1 Undue favour to developers by not fixing reserve price in consonance with the allowed Floor Area Ratio
Ghaziabad Development Authority suffered a loss of ` 70.73 crore due to its failure in fixing the reserve price of Group Housing plots as per the Floor Area Ratio allowed, in violation of the Model Guidelines of the Government. The Government of Uttar Pradesh (GoUP) issued (November 1999) Model Guidelines (Guidelines) for bringing uniformity in the costing of properties by the Development Authorities in the State. These Guidelines provide that the costing of saleable residential/commercial properties shall depend upon the demand for property, and the admissible floor area ratio (FAR) on it. The Board of the Ghaziabad Development Authority (Authority) adopted (February 2000) the aforesaid Guidelines. Further, the Building Bye-laws, 2008, also provide for allowing 1.5 basic FAR for Group Housing plots with any excess FAR being purchasable. The Authority fixes the sector rate of the land in each of its scheme which then serves as the base rate for sale of residential plots. The plots of Group Housing are sold by the Authority through auction after fixing a reserve price. Hence, as per the GoUP Guidelines, the reserve price for the auction of Group Housing plots should be fixed on the basis of sector rate multiplied by the allowed FAR. Audit noticed (May 2017 and April 2018) that the Authority auctioned (December 2010 and December 2014) six group housing plots and allowed basic FAR ranging from 2.0 to 2.5. However, the reserve price of these plots was fixed on the basis of 1.5 times the sector rates of land fixed by the GDA instead of on the basis of the allowed FAR. This resulted in extending an undue favour to the developers and consequent loss to the Authority amounting to ` 70.73 crore (Appendix-7.4). The Authority stated (January 2019) that reserve prices were fixed as per the Board’s decision (September 2009) of fixing the reserve price at the rate of 1.5 times and 2.0 times of the sector rate for Group housing and Commercial Properties respectively. It was further stated that GoUP directed (August 2011) that the FAR charges would be recovered for additional FAR from more than 1.5 and up to 2.5 from the builder. Therefore, builder, after payment of required charges, can obtain the additional desired FAR. While the reply of the Authority confirms the extant Rule position, it is silent on the specific cases of non-consideration of additional FAR in fixation of reserve price. The Government, however, in the meeting with Audit accepted (June 2019) the contention of Audit but has not intimated any action plan for the recovery of the amount.
7.3.2 Non-inclusion of corner charges in the reserve price
Ghaziabad Development Authority suffered a loss of ` 10.74 crore due to non-inclusion of corner charges in reserve price for auction of corner assets. The Government of Uttar Pradesh (GoUP), Housing and Urban Planning Department (Department) issued (November 1999) Model Guidelines for the

Chapter–VII: Compliance Audit Observations
107
costing of assets created and developed by Development Authorities to ensure uniformity in the valuation of their assets. The aforesaid Guidelines inter alia provide for levy of additional charges at the rate of 10 per cent for costing of assets situated at the corner. The GoUP clarified (18 June 2009) that the additional charges of 10 per cent on the corner assets will be levied only on the cost of the land. Audit noticed (January 2016 and May 2018) that Ghaziabad Development Authority (Authority) failed to include corner charges in fixing of the reserve price of four corner assets out of 36 test checked assets auctioned during July 2006 to December 2014. This has resulted in loss of ` 10.74 crore (Appendix-7.5). The Authority stated (January 2019) that in view of the large number of unsold assets, the Board of the Authority decided (October 2014) to request the Department for not levying corner charges on the sale of corner plots measuring above 2,000 sqm and not to demand the same from the bidders till the decision of the Government. But no reply has since been received from the Government. Non-levy of corner charges by the Board as fixed by the Government, is a clear case of overreach of powers by the Authority and clear violation of the orders of the Government which has caused loss to the Authority. The Government, however, in the meeting with Audit accepted (June 2019) the contention of Audit but it did not intimate any action plan for recovery of the loss.
Ghaziabad Development Authority, Meerut Development Authority and Lucknow Development Authority
7.3.3 Infrastructure Surcharge on sale of plots not levied
Development Authorities failed to levy Infrastructure Surcharge amounting to ` 70.51 crore on sale of plots.
The Government of Uttar Pradesh (GoUP) directed (15 January 1998) all the Development Authorities in the State to set aside a specified portion of their income from identified sources9 to create a separate fund for developing residential infrastructure in urban areas. This fund was to be maintained in a separate bank account, distinct from Authorities’ own fund. Amongst the identified sources was a levy of surcharge at the rate of 10 per cent on the value of plots sold by the Authorities. The GoUP issued (26 July 2018) a fresh order, applicable from the date of its issue, which directed that a specified portion of Authorities’ income from identified sources would be deposited in two separate accounts i.e. Urban Infrastructure Development Account and Regional Infrastructure Development Account. This order did not mention levying of Infrastructure Surcharge as a source. The applicability of levy of Infrastructure Surcharge, therefore, existed from January 1998 to July 2018.
9 As per Clause 5 of GO dated 15.01.1998- Conversion charges for conversion of lower level land,
development charges for layout approval for the urban area out of Authorities’ schemes, development charges for layout approval of unauthorized colonies, compounding charges in respect of unauthorized construction, charges for free-hold of land, Infrastructure Surcharge and income received from registration of sale deed.

Audit Report on Economic Sector and Public Sector Undertakings for the year ended 31 March 2018
108
The Development Authorities develop and sell the plots for the different purposes i.e. residential, commercial, institutional, etc. These plots are being sold by the Authority through auction/lottery system. For this purpose, the Authority fixes minimum reserve price for these plots. However, in contravention of GoUP order (January 1998) three Developments Authorities did not levy Infrastructure Surcharge amounting to ` 70.51 crore as detailed below: (i) Ghaziabad Development Authority: The Board of Directors (BoD) of the Ghaziabad Development Authority (GDA), took a decision (October 2014) in view of the large number of its assets remaining unsold to request the GoUP to issue orders for non-levy of Infrastructure Surcharge superseding Government order of January 1998. The BoD, further decided not to levy the Infrastructure Surcharge on the auction of plots exceeding 2,000 sqm. till the Government took a decision based on their request. However, BoD also decided to incorporate the provision of levying of Infrastructure Surcharge in all its sale brochures specifically mentioning that if the Government did not agree with the request of the GDA, Infrastructure Surcharge would be payable by the bidders. Accordingly, the matter was referred to the Government (October 2014). Audit noticed (April 2017/May 2018) that after the aforesaid decision of the Board (October 2014), the GDA had auctioned six plots each having area of more than 2,000 sqm. for a total value of ` 175.45 crore under various schemes.10 However, it did not levy the applicable Infrastructure Surcharge amounting to ` 17.55 crore (Appendix-7.6). Although, the GDA had mentioned in the allotment letters for payment of Infrastructure Surcharge by the bidder in future, in the event of the GoUP not agreeing to the proposal of the GDA, it did not put in place any recovery mechanism such as obtaining bank guarantee or any other form of security from the bidders to ensure that they pay up the Surcharge as per brochure conditions. Thus, the action of the GDA lacked enforceability. Moreover, even after the GoUP order of July 2018, for ensuring the recovery of the outstanding Infrastructure Surcharge for the period October 2014 to June 2018, the GDA failed to initiate any steps (October 2018). In the absence of any recovery mechanism, the recovery of the Infrastructure Surcharge is now doubtful. It was further noticed that the GDA had also failed to levy the Infrastructure Surcharge amounting to ` 42.10 crore (Appendix-7.6) even on 10 plots auctioned before October 2014 i.e. before the aforesaid decision of the Board without recording any reasons in the concerned files. (ii) Meerut Development Authority: Audit noticed (December 2017) that Meerut Development Authority (MDA) sold (during June 2015 to January 2017) 17 plots (nine commercial plots and eight residential plots) through auction/lottery system for a total value of ` 14.28 crore under various schemes11. However, the MDA did not levy the applicable Infrastructure Surcharge at the rate of 10 per cent on the value of aforesaid plots amounting to ` 1.43 crore (Appendix-7.7).
10 Pratap Vihar, Indirapuram, Vaishali, Koyal Enclave and Karpuripuram. 11 Shradha Puri Phase-II, Pocket-D; Rakshapuram Yojna Sec-1; Sports Goods Complex (Major
Dhyanchand Nagar) Scheme Pocket-A; Dr. Ram Manohar Lohiya Nagar Scheme, Pocket-D & E; Pallavpuram scheme Pocket-J.

Chapter–VII: Compliance Audit Observations
109
(iii) Lucknow Development Authority: Similarly, audit noticed (February 2019) that Lucknow Development Authority (LDA) sold (May 2016 to April 2018) 13 commercial plots through auction system for a total value of ` 94.28 crore under various schemes12. However, the Authority did not levy the applicable Infrastructure Surcharge at the rate of 10 per cent on the value of aforesaid plots amounting to ` 9.43 crore (Appendix-7.8). Thus, additional revenue amounting to ` 70.51 crore intended for development of infrastructure facilities has still not been realised by the Authorities. The management of GDA and LDA stated (January 2019 and July 2019) that the GoUP has discontinued/suspended (July 2018) the levy of Infrastructure Surcharge. The management of MDA accepted (July 2018) the contention of Audit. The Government, in the meeting with Audit, accepted (June 2019) the contention of Audit and stated that levy of infrastructure surcharge at the rate of 10 per cent was effective during the period January 1998 to July 2018 on the sale of properties by Development Authorities. However, it has not intimated any action plan for recovery of Infrastructure Surcharge.
7.4 Undue benefit of incentive scheme
Ghaziabad Development Authority suffered a loss of ` 22.14 crore by extending undue benefit of incentive scheme to a medical college.
Government of Uttar Pradesh (GoUP) issued (August 2011) instructions providing for land use conversion for establishment of Engineering/Medical/ Dental Colleges in private sector. As per the instructions (August 2011), the applicants were to deposit the land use conversion charges at the time of approval of maps after notification of land use conversion. Further, the Department of Medical Education, GoUP introduced (June 2013) an incentive scheme for private investment in the higher medical education. Accordingly, the Housing and Urban Planning Department (HUPD) allowed (December 2013) exemptions in land use conversion charges and development fees with the condition that exemption for the private medical college would be applicable from date of introduction of the incentive scheme (i.e. from 20 June 2013). The building of a medical institute was being constructed on agriculture land situated at Modinagar, Ghaziabad without approval of the map. After the Ghaziabad Development Authority (Authority) initiated action against the builder/promoter under the Uttar Pradesh Urban Planning and Development Act, 1973 for unauthorised construction, the Institute submitted (September 2011) a proposal for change of land use from agriculture to Knowledge Park for land area of 24 acre (97,120.00 sqm) and for compounding (March 2013) of unauthorised construction of building. The Authority sent (March 2012) the proposal of land use conversion to the GoUP for approval. Final notification of the land use conversion was issued in May 2013. Audit noticed (May 2017) that the Institute requested (July 2013) the Authority to allow it the benefits of the incentive scheme of GoUP of 2013 in respect of the land use conversion charges and other charges for map approval. The Authority asked (September 2013) the HUPD for allowing benefit under
12 Gomti Nagar Scheme, Gomti Nagar Extension Scheme, Sitapur Road Scheme and Kanpur Road
Scheme.

Audit Report on Economic Sector and Public Sector Undertakings for the year ended 31 March 2018
110
the said incentive scheme to the Institute. HUPD clarified (October 2013) that the benefit of the incentive scheme envisaged in the GoUP order (June 2013) could not be extended to this Institute and further directed the Authority for recovery of land use conversion charges as per the relevant Government orders. The Authority did not issue any demand notice and again asked (March 2014) the HUPD for allowing benefit to the Institute under the incentive scheme effective from June 2013 as per HUPD’s order of December 2013. The HUPD again clarified (August 2014) that the benefit of the incentive scheme could not be extended to the Institute. Despite clear instructions from the HUPD declining extending any benefit under the incentive scheme, the Authority approved (July 2016) the compounding map of the Institute after allowing the benefit of incentive scheme to the Institute. It also did not issue demand notice of ` 22.14 crore13 for land use conversion charges and development fee as ordered by the HUPD. Thus, the Authority suffered a loss of ` 22.14 crore by extending an undue benefit of incentive scheme to the Institute. The Authority stated (August 2018 and January 2019) that the Government has allowed (June 2018) exemption to the Institute for obtaining MCI permission and from payment of land use conversion charges and development fee till March 2019. The Authority further, stated (June 2019) that as the Institute did not furnish the approval of MCI hence, a demand notice for deposit of development fee and land use conversion charges has been issued. The fact remains that undue benefit was extended as notification of land use conversion in this case was issued in May 2013 i.e. before the introduction of the Incentive Scheme from June 2013 and the Government had categorically stated (October 2013 and August 2014) that the benefit of Incentive Scheme could not be extended in this case. The Government, however, in the meeting with Audit accepted (June 2019) the contention of Audit. But it did not direct the authority to fix the responsibility for violation of the Government orders (October 2013 and August 2014). Further, recovery in the instant case is yet to be intimated despite being requested (August 2019) by Audit. Infrastructure and Industrial Development Department
Lucknow Industrial Development Authority
7.5 Failure to assess and collect Labour Cess at the time of sanction of maps
Disregarding the extant Government orders, Lucknow Industrial Development Authority failed to assess and collect Labour cess amounting to ` 5.86 crore at the time of sanction of 145 maps.
The Government of India (GoI) enacted the Building and Other Construction Workers’ Welfare Cess Act, 1996 (Cess Act) which provided for levy and collection of a cess14 on the cost of construction incurred by the employers. The GoI also framed the Building and Other Construction Workers’ Welfare Cess Rules, 1998 (Cess Rules) in exercise of the powers conferred by sub-section (1) of Section 14 of the Cess Act.
13 Development fee ` 16.02 crore and land use conversion ` 6.12 crore. 14 At such rate not exceeding two per cent, but not less than one per cent.

Chapter–VII: Compliance Audit Observations
111
The aforesaid Cess Acts and Cess Rules were made applicable in the State of Uttar Pradesh with the notification15 (February 2009) of the ‘Uttar Pradesh Building and Other Construction Workers (Regulation of Employment and Condition of Service) Rules, 2009 (Rules)16 by the State Government. The State Government also constituted the ‘Uttar Pradesh Building and Other Construction Workers’ Welfare Board’ (Board) under Section 18 of the Act.
The GoUP orders (September 2010/August 2011) designated the Secretary of every Development Authority as the Assessment and Collection Officer of the labour cess on the maps sanctioned in the authority at the rate of one per cent of the construction cost of residential buildings if the cost exceeded ` 10 lakh and deposit the same with the account of the Labour Welfare Board (LWB). The GoUP also directed (December 2010) all the Divisional Commissioners/ District Magistrates to review cess collection by various Development Authorities under their jurisdiction and ensure the compliance of the said orders. The Lucknow Industrial Development Authority (LIDA) approves map/layouts of the construction works to be carried out under its jurisdiction. However, audit noticed (October 2017) that in disregard of the GoUP orders, LIDA did not develop any mechanism to assess and collect the due amount of labour cess on the estimated cost of construction while sanctioning maps/layouts. It was also noticed that LIDA had sanctioned (February 2010 to March 2018) 145 maps related to construction of different categories of residential buildings.17 However, it did not assess and collect the due labour cess from the applicants amounting to ` 5.86 crore18.
On being pointed out by Audit, the matter was put up to the Board of the Authority which approved (April 2018) assessing and collecting of labour cess while sanctioning the maps/layouts. However, no responsibility was fixed for delayed implementation (eight years) of GoUP orders as a result of which Labour Cess amounting to ` 5.86 crore could not be assessed and collected. The LIDA stated (February 2019) that Board of Directors had authorised (April 2018) the Chief Executive Officer for onward assessment and collection of labour cess while sanctioning the maps/layouts.
The fact remains that no responsibility was fixed for delayed implementation (eight years) of GoUP orders as a result of which, statutory liability of labour cess amounting to ` 5.86 crore could not be assessed and collected. Thus, additional revenue amounting to ` 5.86 crore intended for welfare of the workers has still not been realised by the LIDA. The matter was reported (November 2018) to the Government. The reply is still awaited (September 2019).
15 Notification No. 143/36-2-2009-251 (,l,e)/95 dated 04 February 2009. 16 Framed in exercise of powers conferred by Section 40 read with Section 62 of the Cess Act. 17 140 maps of own residential buildings and 5 group housing buildings maps. 18 Calculated at the UPPWD’s plinth area rate of building construction which was also used by the
LIDA after its Board of Directors decision to assess and collect labour cess on the maps sanctioned.
Audit Report on Economic Sector and Public Sector Undertakings for the year ended 31 March 2018
112
Department of Additional Sources of Energy
Uttar Pradesh New and Renewable Energy Development Agency
7.6 Non-levy of liquidated damages
The Agency extended undue favour to the contractors by not levying liquidated damages amounting to ` 1.73 crore for their failure to perform services. The Uttar Pradesh New and Renewable Energy Development Agency (UPNEDA), after inviting tenders, placed work orders (12 February 2016) with eight firms for supply, installation, commissioning along with five years comprehensive warranty maintenance of 99,353 Solar Power Packs19 (SPPs), at the rate of ` 26,200 per SPP inclusive of all taxes, in the dwellings constructed under Dr Ram Manohar Lohiya Awas housing projects in 75 districts of Uttar Pradesh. The agreement entered into with each of the firms stipulated that: The work shall be completed within four months from the placement of work order which can be extended by UPNEDA upto a maximum of two months. In case the contractor failed to execute the work within stipulated time, the UPNEDA will be at liberty to get the work executed from open market at the risk and cost of the contractor (Clause No. 1.3); and If the contractor fails to perform the services within the time period, UPNEDA shall, without prejudice to its other remedies under the contract, deduct from the contract price as liquidated damages, a sum equivalent to one per cent of the price of the unperformed services for each week of delay subject to a maximum of 10 per cent of price of the delayed services. Once the maximum is reached, the UPNEDA may consider termination of the contract (Clause No. 2.1). Audit noticed (February 2018) that out of eight firms, three firms with whom 57 per cent of the total supply orders (56,268 SPPs in 32 districts) were placed, could not complete the assigned work within the scheduled period20. These firms together failed to supply 13,108 (23 per cent of the ordered quantity to these firms) SPPs in 13 districts. UPNEDA cancelled (August 2016 to November 2016) the orders with the defaulting firms for the remaining SPPs and diverted the same to two of the existing suppliers at the same cost. However, in contravention to the agreement, UPNEDA did not levy the liquidated damages on all the three defaulting firms which resulted in extending an undue favour to them amounting to ` 1.73 crore (Appendix-7.9).
The Government and the UPNEDA stated (April 2019 and February 2019) that Clause 2.1 of the agreement relating to levy of liquidated damages was not applicable in these cases as the unexecuted supplies by the defaulting firms were diverted to other contractor firms at the same rate. Further, there was no condition of delayed executed supply by the three defaulting firms in the agreements executed with them.
19 Solar Power Pack to operate 3 LED indoor lights (2 LED lights of 3 Watt each & 1 LED light of
5 Watt), a 25 Watt D.C. ceiling fan & a mobile charger. 20 Scheduled period of four months (12 June 2016) which was further extended by UPNEDA upto
20 August 2016 i.e. for nine weeks against eight weeks as stipulated in the agreement.


APPENDICES

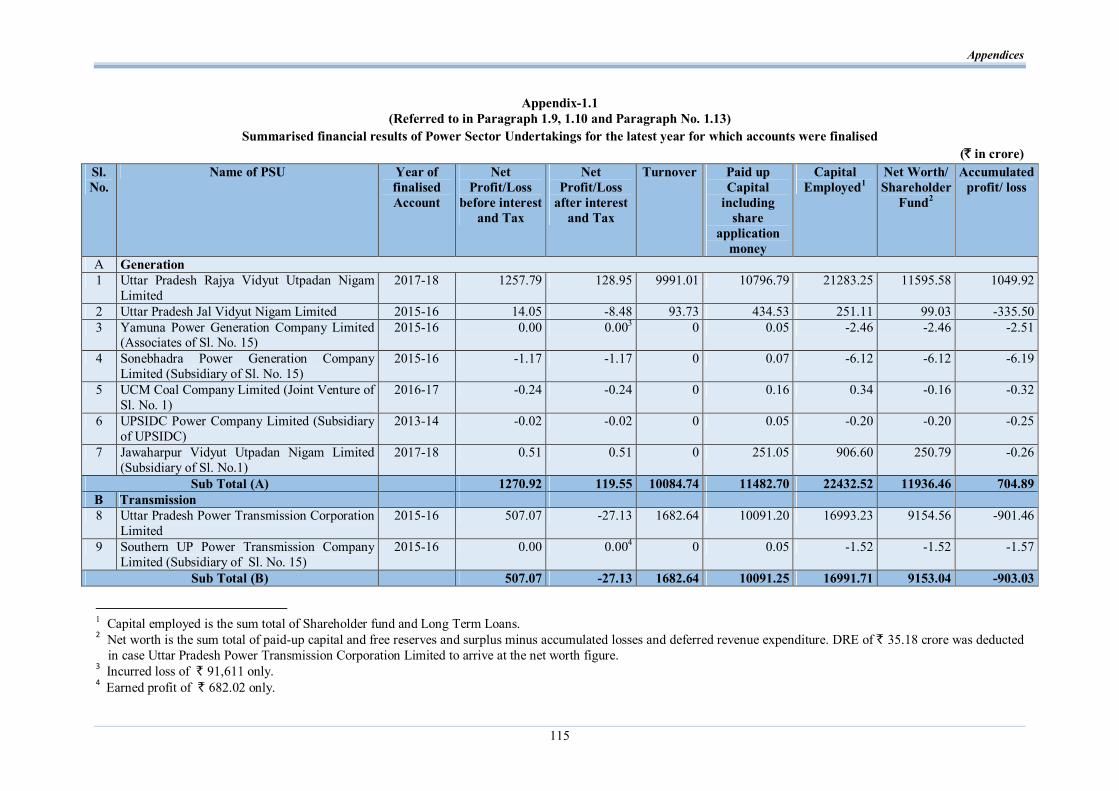
Appendices
115
Appendix-1.1 (Referred to in Paragraph 1.9, 1.10 and Paragraph No. 1.13)
Summarised financial results of Power Sector Undertakings for the latest year for which accounts were finalised (` in crore)
Sl. No.
Name of PSU Year of finalised Account
Net Profit/Loss
before interest and Tax
Net Profit/Loss
after interest and Tax
Turnover Paid up Capital
including share
application money
Capital Employed1
Net Worth/ Shareholder
Fund2
Accumulated profit/ loss
A Generation 1 Uttar Pradesh Rajya Vidyut Utpadan Nigam
Limited 2017-18 1257.79 128.95 9991.01 10796.79 21283.25 11595.58 1049.92
2 Uttar Pradesh Jal Vidyut Nigam Limited 2015-16 14.05 -8.48 93.73 434.53 251.11 99.03 -335.50 3 Yamuna Power Generation Company Limited
(Associates of Sl. No. 15) 2015-16 0.00 0.003 0 0.05 -2.46 -2.46 -2.51
4 Sonebhadra Power Generation Company Limited (Subsidiary of Sl. No. 15)
2015-16 -1.17 -1.17 0 0.07 -6.12 -6.12 -6.19
5 UCM Coal Company Limited (Joint Venture of Sl. No. 1)
2016-17 -0.24 -0.24 0 0.16 0.34 -0.16 -0.32
6 UPSIDC Power Company Limited (Subsidiary of UPSIDC)
2013-14 -0.02 -0.02 0 0.05 -0.20 -0.20 -0.25
7 Jawaharpur Vidyut Utpadan Nigam Limited (Subsidiary of Sl. No.1)
2017-18 0.51 0.51 0 251.05 906.60 250.79 -0.26
Sub Total (A) 1270.92 119.55 10084.74 11482.70 22432.52 11936.46 704.89 B Transmission 8 Uttar Pradesh Power Transmission Corporation
Limited 2015-16 507.07 -27.13 1682.64 10091.20 16993.23 9154.56 -901.46
9 Southern UP Power Transmission Company Limited (Subsidiary of Sl. No. 15)
2015-16 0.00 0.004 0 0.05 -1.52 -1.52 -1.57
Sub Total (B) 507.07 -27.13 1682.64 10091.25 16991.71 9153.04 -903.03
1 Capital employed is the sum total of Shareholder fund and Long Term Loans. 2 Net worth is the sum total of paid-up capital and free reserves and surplus minus accumulated losses and deferred revenue expenditure. DRE of ` 35.18 crore was deducted
in case Uttar Pradesh Power Transmission Corporation Limited to arrive at the net worth figure. 3 Incurred loss of ` 91,611 only. 4 Earned profit of ` 682.02 only.

Audit Report on Economic Sector and Public Sector Undertakings for the year ended 31 March 2018
116
Sl. No.
Name of PSU Year of finalised Account
Net Profit/Loss
before interest and
Tax
Net Profit/Loss
after interest and Tax
Turnover Paid up Capital
including share
application money
Capital Employed
Net Worth/ Shareholder
Fund
Accumulated profit/ loss
C Distribution 10 Purvanchal Vidyut Vitaran Nigam Limited
(Subsidiary of Sl. No. 15) 2016-17 -446.74 -867.32 9320.19 13646.98 5790.76 -3899.27 -17546.25
11 Paschimanchal Vidyut Vitaran Nigam Limited (Subsidiary of Sl. No. 15)
2016-17 -302.77 -468.00 13161.10 10995.20 4465.39 -2424.07 -13419.27
12 Madhyanchal VidyutVitaran Nigam Limited (Subsidiary of Sl. No. 15)
2016-17 -622.71 -722.80 7980.60 12553.30 6746.43 -989.42 -13542.72
13 Dakshinanchal Vidyut Vitaran Nigam Limited (Subsidiary of Sl. No. 15)
2016-17 -766.80 -1443.48 7731.75 14084.31 4754.85 -9183.29 -23267.6
14 Kanpur Electricity Supply Company Limited (Subsidiary of Sl. No. 15)
2016-17 423.72 319.55 2330.62 1568.77 380.86 -1612.7 -3181.47
15 Uttar Pradesh Power Corporation Limited 2015-16 -15444.99 -15444.99 0 66429.38 -42497.71 -42497.71 -62483.53 Sub Total (C) -17160.29 -18627.04 40524.26 119277.94 -20359.42 -60606.46 -133440.84
Grand Total (A+B+C) -15382.30 -18534.62 52291.64 140851.895 19064.81 -39516.96 -133638.98
5 Paid up capital of ` 1,40,851.89 crore includes an amount of ` 46,694.69 crore in holding companies at Sl. No. 1 (` 251.13 crore) and Sl. No. 15 (` 46,443.56 crore) which
was given by the Government for their subsidiary/associates/joint venture companies at Sl. No. 3,4,5,7,9,10,11,12,13 and 14. Therefore, the amount of ` 46,694.69 crore has been excluded for calculation of net worth and capital employed.

Appendices
117
Appendix-1.2 (Referred to in Paragraph 1.9)
Investment made by Government and others in 15 Power Sector PSUs as on 31 March 2018
(` in crore)
Equity Long Terms Loans Sl. No.
Name of the PSUs Number of PSU State Govt. Others
Total Equity State Govt.
loan Central
Govt. Loan Holding
Company/ Other
Financial Institutions
loan
Total Long Terms Loans
Total Investment (Equity and Long term
loans)
1. UP Rajya Vidyut Utpadan Nigam Ltd. (including subsidiary Jawaharpur VUNL)
2 10796.79 0.00 10796.79 0.00 0.00 10343.48 10343.48 21140.27
2. Yamuna Power Generation Company Ltd.
1 0.00 0.05 0.05 0.00 0.00 0.00 0.00 0.05
3. UPSIDC Power Co. Ltd. (Accounts Received. Upto 2013-14 only)
1 0.00 0.05 0.05 0.00 0.00 0.00 0.00 0.05
4. UP Jal Vidyut Nigam Ltd. (Accounts Received Upto 2016-17 only)
1 435.33 0.00 435.33 64.65 0.00 85.21 149.86 585.19
5. UP Power Transmission Corporation Ltd.
1 12494.42 0.00 12494.42 0.00 0.00 10762.29 10762.29 23256.71
6. UPPCL (including subsidiaries i.e. PuVVNL, PVVNL, DVVNL, MVVNL, KESCO. SPGCL and SUPPTCL)
8 82991.49 0.20 82991.69 9783.44 0.00 45444.18 55227.62 13821 9.31
7. UCM Coal Company Limited 1 0.00 0.16 0.16 0.00 0.00 1.19 1.19 1.35 Total 15 106718.03 0.46 106718.49 9848.09 0.00 66636.35 76484.44 183202.93
Note: (i) Total investment in Power Sector PSUs = (Equity in PSUs) + (Loan in PSUs) = ` 1,06,718.49 crore + ` 76484.44 crore = ` 1,83,202.93 crore.
(ii) Total Govt. investment in Power Sector PSUs = (GoUP Equity in PSUs) + (GoUP Loan in PSUs) = ` 1,06,718.03 crore + ` 9,848.09 crore = ` 1,16,566.12 crore.
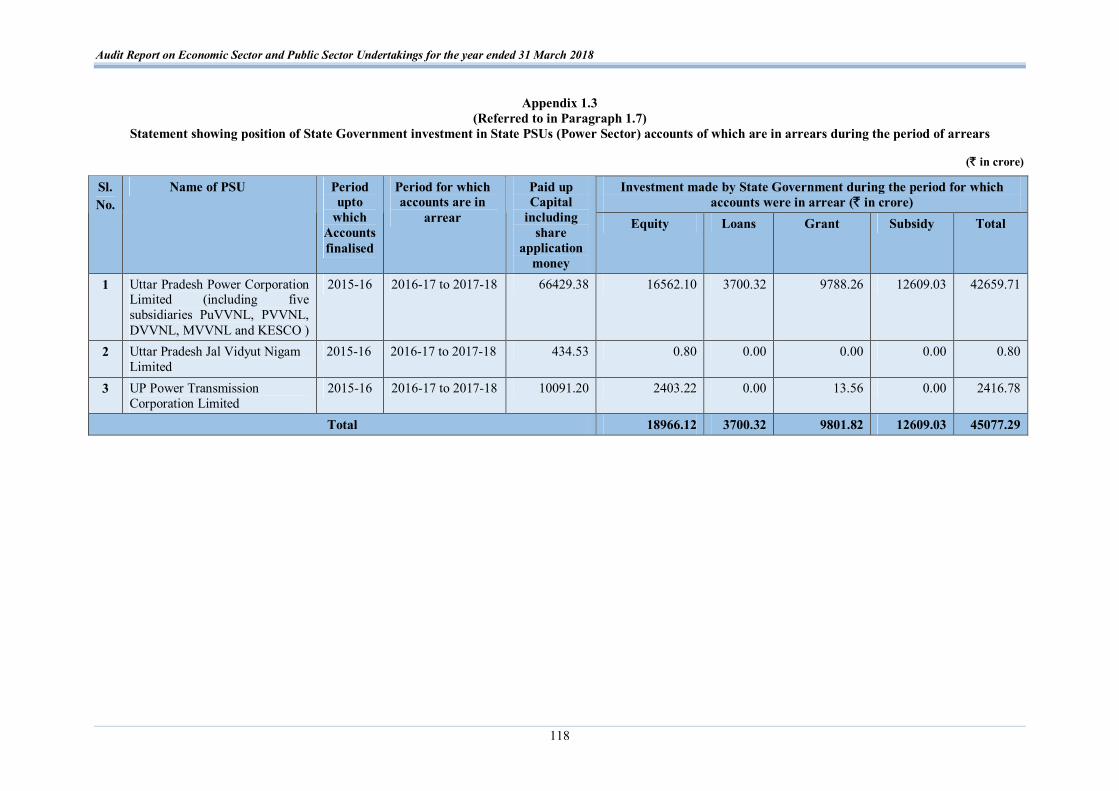
Audit Report on Economic Sector and Public Sector Undertakings for the year ended 31 March 2018
118
Appendix 1.3 (Referred to in Paragraph 1.7)
Statement showing position of State Government investment in State PSUs (Power Sector) accounts of which are in arrears during the period of arrears
(` in crore)
Investment made by State Government during the period for which accounts were in arrear (` in crore)
Sl. No.
Name of PSU Period upto
which Accounts finalised
Period for which accounts are in
arrear
Paid up Capital
including share
application money
Equity Loans Grant Subsidy Total
1 Uttar Pradesh Power Corporation Limited (including five subsidiaries PuVVNL, PVVNL, DVVNL, MVVNL and KESCO )
2015-16 2016-17 to 2017-18 66429.38 16562.10 3700.32 9788.26 12609.03 42659.71
2
Uttar Pradesh Jal Vidyut Nigam Limited
2015-16 2016-17 to 2017-18 434.53 0.80 0.00 0.00 0.00 0.80
3 UP Power Transmission Corporation Limited
2015-16 2016-17 to 2017-18 10091.20 2403.22 0.00 13.56 0.00 2416.78
Total 18966.12 3700.32 9801.82 12609.03 45077.29
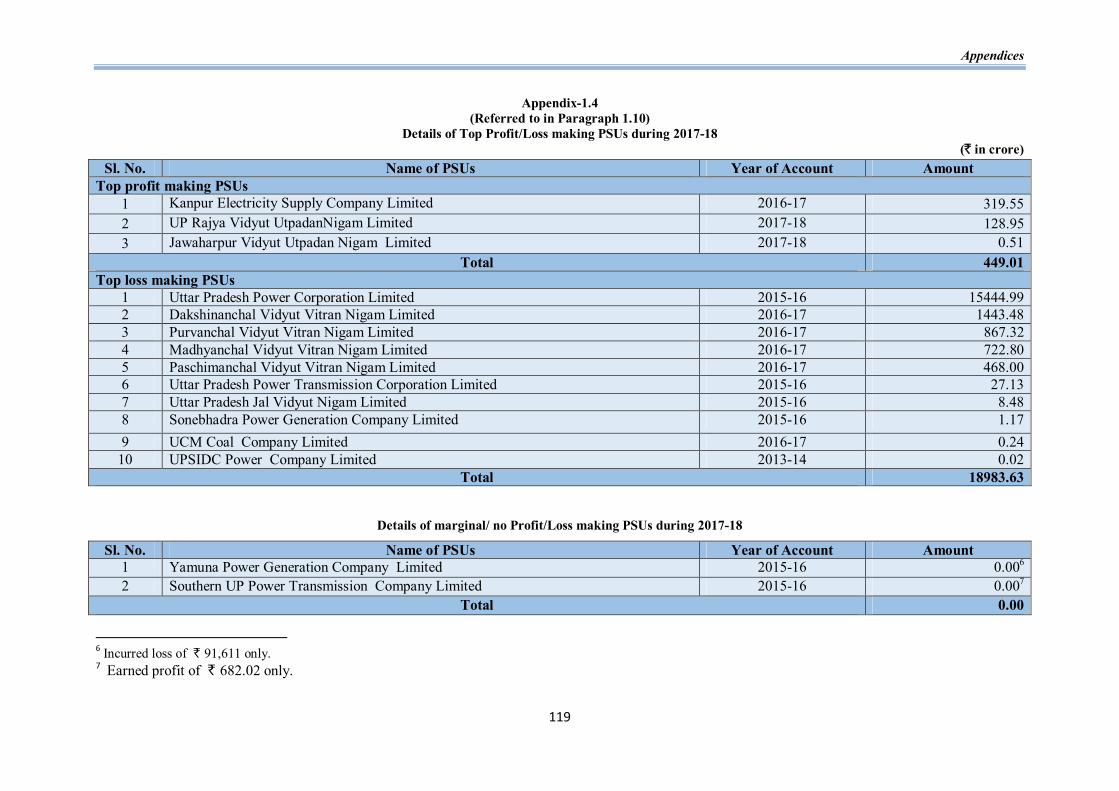
Appendices
119
Appendix-1.4 (Referred to in Paragraph 1.10)
Details of Top Profit/Loss making PSUs during 2017-18 (` in crore)
Sl. No. Name of PSUs Year of Account Amount Top profit making PSUs
1 Kanpur Electricity Supply Company Limited 2016-17 319.55 2 UP Rajya Vidyut UtpadanNigam Limited 2017-18 128.95 3 Jawaharpur Vidyut Utpadan Nigam Limited 2017-18 0.51
Total 449.01 Top loss making PSUs
1 Uttar Pradesh Power Corporation Limited 2015-16 15444.99 2 Dakshinanchal Vidyut Vitran Nigam Limited 2016-17 1443.48 3 Purvanchal Vidyut Vitran Nigam Limited 2016-17 867.32 4 Madhyanchal Vidyut Vitran Nigam Limited 2016-17 722.80 5 Paschimanchal Vidyut Vitran Nigam Limited 2016-17 468.00 6 Uttar Pradesh Power Transmission Corporation Limited 2015-16 27.13 7 Uttar Pradesh Jal Vidyut Nigam Limited 2015-16 8.48 8 Sonebhadra Power Generation Company Limited 2015-16 1.17 9 UCM Coal Company Limited 2016-17 0.24
10 UPSIDC Power Company Limited 2013-14 0.02 Total 18983.63
Details of marginal/ no Profit/Loss making PSUs during 2017-18
Sl. No. Name of PSUs Year of Account Amount 1 Yamuna Power Generation Company Limited 2015-16 0.006 2 Southern UP Power Transmission Company Limited 2015-16 0.007
Total 0.00
6 Incurred loss of ` 91,611 only. 7 Earned profit of ` 682.02 only.

Audit Report on Economic Sector and Public Sector Undertakings for the year ended 31 March 2018
120
Appendix-1.5
(Referred to in Paragraph 1.12) Statement showing State Government funds infused in the four Power Sector Undertakings from the year 2000-2001 to 2017-18
(` in crore) UPJVNL UPRVUNL UPPTCL UPPCL Grand Total Year
Equity CG IFL IBL Equity CG IFL IBL Equity CG IFL IBL Equity CG IFL IBL Equity CG IFL IBL
Up to 2000-01
372.88 20.00 3.55 62.60 1764.25 0.00 0.00 187.00 0.00 0.00 0.00 0.00 4199.34 7.02 0.00 1562.09 6336.47 27.02 3.55 1811.69
2001-02 0.00 4.82 0.00 -1.50 32.82 24.59 0.00 24.59 0.00 0.00 0.00 0.00 282.21 173.23 0.00 152.23 315.03 202.64 0.00 175.32
2002-03 0.00 0.00 0.00 0.00 0.00 0.00 7.50 0.00 0.00 0.00 0.00 225.90 143.57 0.00 281.90 225.90 143.57 0.00 289.40
2003-04 21.06 0.00 0.00 335.85 0.00 0.00 0.00 0.00 0.00 0.00 0.00 5694.39 140.62 0.00 -1673.23 6051.30 140.62 0.00 -1673.23
2004-05 10.50 0.00 0.00 1.00 0.00 0.00 0.00 0.00 0.00 0.00 0.00 895.30 172.27 0.00 209.06 906.80 172.27 0.00 209.06
2005-06 10.65 0.00 0.00 389.89 0.00 0.00 0.00 0.00 0.00 0.00 0.00 394.06 67.82 0.00 89.91 794.60 67.82 0.00 89.91
2006-07 9.16 0.00 0.00 407.00 0.00 0.00 0.00 0.00 0.00 0.00 0.00 2697.37 25.00 0.00 0.00 3113.53 25.00 0.00 0.00
2007-08 1.00 0.00 0.00 1006.00 0.00 0.00 0.00 2213.34 0.00 0.00 99.71 4039.91 99.48 0.00 -99.71 7260.25 99.48 0.00 0.00
2008-09 2.00 0.00 0.00 778.00 0.00 0.00 0.00 428.55 0.00 0.00 0.00 5013.79 315.94 0.00 0.00 6222.34 315.94 0.00 0.00
2009-10 3.50 0.00 0.00 812.20 0.00 0.00 0.00 891.57 0.00 0.00 0.00 3615.10 0.00 0.00 0.00 5322.37 0.00 0.00 0.00
2010-11 1.00 0.00 0.00 775.00 0.00 0.00 0.00 500.00 0.00 0.00 0.00 3107.52 0.00 0.00 -100.00 4383.52 0.00 0.00 -100.00
2011-12 0.00 0.00 0.00 555.75 0.00 0.00 -219.09 409.05 0.00 0.00 0.00 3349.56 0.00 0.00 0.00 4314.36 0.00 0.00 -219.09
2012-13 1.39 0.00 0.00 865.35 0.00 0.00 0.00 800.00 0.00 0.00 0.00 2158.79 17.00 0.00 0.00 3825.53 17.00 0.00 0.00
2013-14 1.39 0.00 0.00 117.89 0.00 0.00 0.00 1394.08 0.00 0.00 0.00 5067.59 69.77 0.00 -422.25 6580.95 69.77 0.00 -422.25
2014-15 0.00 0.00 0.00 351.90 0.00 0.00 0.00 2004.61 0.00 0.00 -99.71 9189.65 83.02 0.00 0.00 11546.16 83.02 0.00 -99.71
2015-16 0.00 0.00 0.00 1129.51 0.00 0.00 0.00 1450.00 0.00 0.00 0.00 16498.92 0.00 6083.12 0.00 19078.43 0.00 6083.12 0.00
2016-17 0.00 0.00 0.00 788.00 0.00 0.00 0.00 1695.00 0.00 0.00 0.00 9722.97 75.00 3700.32 0.00 12205.97 75.00 3700.32 0.00
2017-18 0.80 0.00 0.00 686.38 0.00 0.00 0.00 708.22 0.00 0.00 0.00 6839.12 83.40 0.00 0.00 8234.52 83.40 0.00 0.00
Total 435.33 24.82 3.55 61.1 10796.79 24.59 0.0 0.0 12494.42 0.0 0.0 0.0 82991.49 1473.14 9783.44 0.0 106718.03 1522.55 9786.99 61.10
Note: CG = Capital Grant, IFL = Interest Free Loan, IBL = Interest Bearing defaulted Loan.
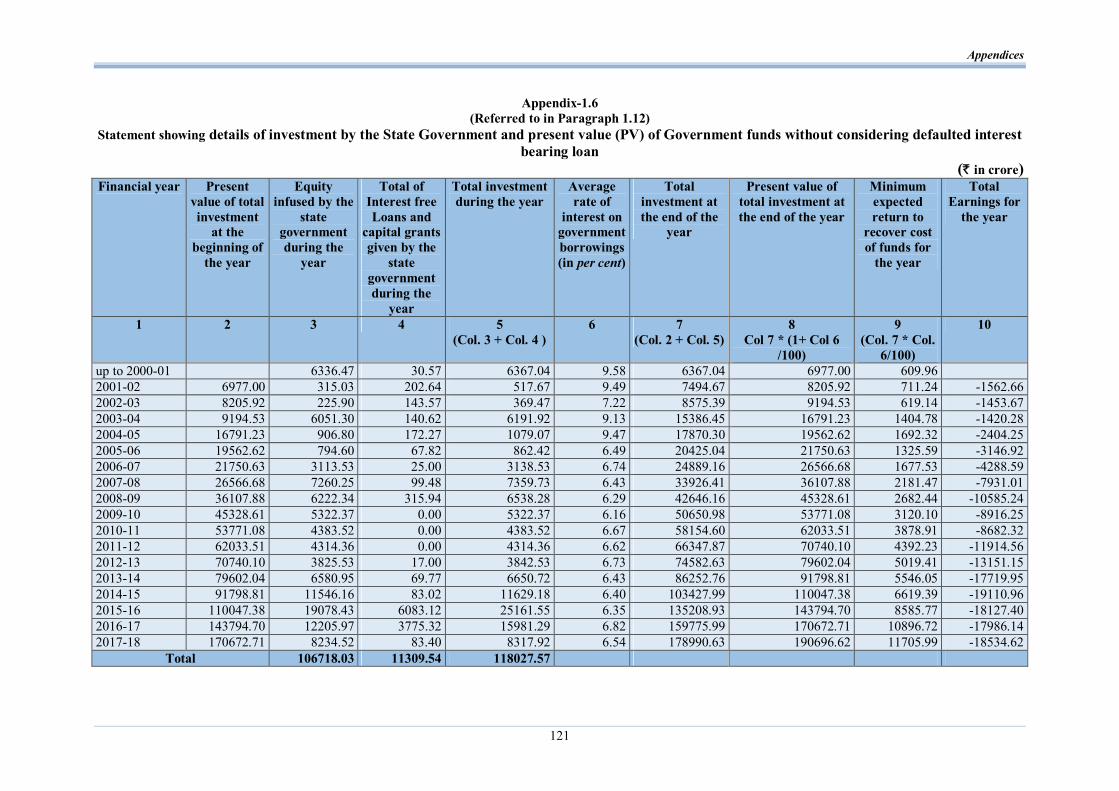
Appendices
121
Appendix-1.6 (Referred to in Paragraph 1.12)
Statement showing details of investment by the State Government and present value (PV) of Government funds without considering defaulted interest bearing loan
(` in crore) Financial year Present
value of total investment
at the beginning of
the year
Equity infused by the
state government during the
year
Total of Interest free Loans and
capital grants given by the
state government during the
year
Total investment during the year
Average rate of
interest on government borrowings (in per cent)
Total investment at the end of the
year
Present value of total investment at the end of the year
Minimum expected return to
recover cost of funds for
the year
Total Earnings for
the year
1 2 3 4 5 (Col. 3 + Col. 4 )
6 7 (Col. 2 + Col. 5)
8 Col 7 * (1+ Col 6
/100)
9 (Col. 7 * Col.
6/100)
10
up to 2000-01 6336.47 30.57 6367.04 9.58 6367.04 6977.00 609.96 2001-02 6977.00 315.03 202.64 517.67 9.49 7494.67 8205.92 711.24 -1562.66 2002-03 8205.92 225.90 143.57 369.47 7.22 8575.39 9194.53 619.14 -1453.67 2003-04 9194.53 6051.30 140.62 6191.92 9.13 15386.45 16791.23 1404.78 -1420.28 2004-05 16791.23 906.80 172.27 1079.07 9.47 17870.30 19562.62 1692.32 -2404.25 2005-06 19562.62 794.60 67.82 862.42 6.49 20425.04 21750.63 1325.59 -3146.92 2006-07 21750.63 3113.53 25.00 3138.53 6.74 24889.16 26566.68 1677.53 -4288.59 2007-08 26566.68 7260.25 99.48 7359.73 6.43 33926.41 36107.88 2181.47 -7931.01 2008-09 36107.88 6222.34 315.94 6538.28 6.29 42646.16 45328.61 2682.44 -10585.24 2009-10 45328.61 5322.37 0.00 5322.37 6.16 50650.98 53771.08 3120.10 -8916.25 2010-11 53771.08 4383.52 0.00 4383.52 6.67 58154.60 62033.51 3878.91 -8682.32 2011-12 62033.51 4314.36 0.00 4314.36 6.62 66347.87 70740.10 4392.23 -11914.56 2012-13 70740.10 3825.53 17.00 3842.53 6.73 74582.63 79602.04 5019.41 -13151.15 2013-14 79602.04 6580.95 69.77 6650.72 6.43 86252.76 91798.81 5546.05 -17719.95 2014-15 91798.81 11546.16 83.02 11629.18 6.40 103427.99 110047.38 6619.39 -19110.96 2015-16 110047.38 19078.43 6083.12 25161.55 6.35 135208.93 143794.70 8585.77 -18127.40 2016-17 143794.70 12205.97 3775.32 15981.29 6.82 159775.99 170672.71 10896.72 -17986.14 2017-18 170672.71 8234.52 83.40 8317.92 6.54 178990.63 190696.62 11705.99 -18534.62
Total 106718.03 11309.54 118027.57

Audit Report on Economic Sector and Public Sector Undertakings for the year ended 31 March 2018
122
Appendix-2.1 (Referred to in Paragraph 2.4)
Statement showing role of various wings of the Company

Appendices
123
Appendix 2.2 {Referred to in Paragraph 2.8 (i)}
Statement showing details of physical position of Sub-stations and Lines at the beginning of 2013-14 and additions during 2013-14 to 2017-18
Status of sub-stations (SSs) (in MVA) 765 KV SSs 400 KVSSs 220 KV SSs 132 KV SSs Total
No. Capacity No. Capacity No. Capacity No. Capacity No. Capacity Nos. and capacity of SSs at the
beginning of 2013-14
1 1000 14 9010 71 22050 274 26590 360 58650 Construction of new sub-station during 2013-14 to 2017-18
Year No. of
SSs
Capacity added
during the year in MVA
No. of
SSs
Capacity added during
the year in MVA
No. of
SSs
Capacity added
during the year in MVA
No. of
SSs
Capacity added during
the year in MVA
No. of S/s
Capacity added during
the year in MVA
2013-14 0 0 0 0 4 1000 13 740 17 1740 2014-15 0 0 0 0 8 1380 31 1550 39 2930 2015-16 0 0 2 980 5 1100 25 1220 32 3300 2016-17 1 3000 1 315 10 1640 38 1952 50 6907 2017-18 0 0 3 1545 8 2040 23 1583 34 5168
Total new constructed 1 3000 6 2840 35 7160 130 7045 172 20045 Total sub-stations at the end of 2017-18
532
Augmentation of capacity of existing sub-station 2013-14 1 1000 1 185 8 520 53 1519 63 3224 2014-15 0 0 1 500 4 260 47 1239 52 1999 2015-16 0 0 4 1280 24 1760 60 1599 88 4639 2016-17 0 0 2 685 16 990 136 3783 154 5458 2017-18 1 1000 10 1980 33 2690 85 2648 129 8318
Total augmented 2 2000 18 4630 85 6220 381 10788 486 23638 Total SSs and Transformation capacity addition in 2013-14 to 2017-18
5000 7470 13380 17833 43683
Capacity at the end of 2017-18 6000 16480 35430 44423 102333 Status of Lines (in Ckm)
765 KV 400 KV 220 KV 132 KV Total Length of lines upto 2012-13 (at the beginning of TA period)
410.93 4259.42 8090.77 13913 26674.12
Construction of new lines (Added during TA period i.e. 2013-14 to 2017-18) 2013-14 0 518.312 84.434 351.167 953.913 2014-15 2.63 136.1 558.558 691.672 1388.96 2015-16 0 71.6 522.55 1013.29 1607.44 2016-17 336.81 233.74 730.216 1136.049 2436.815 2017-18 335 343.38 601.408 1810.959 3090.747
Total lines constructed 674.44 1303.132 2497.166 5003.137 9477.875 Total length of lines as on March 2018
1085.37 5562.552 10587.936 18916.137 36151.995
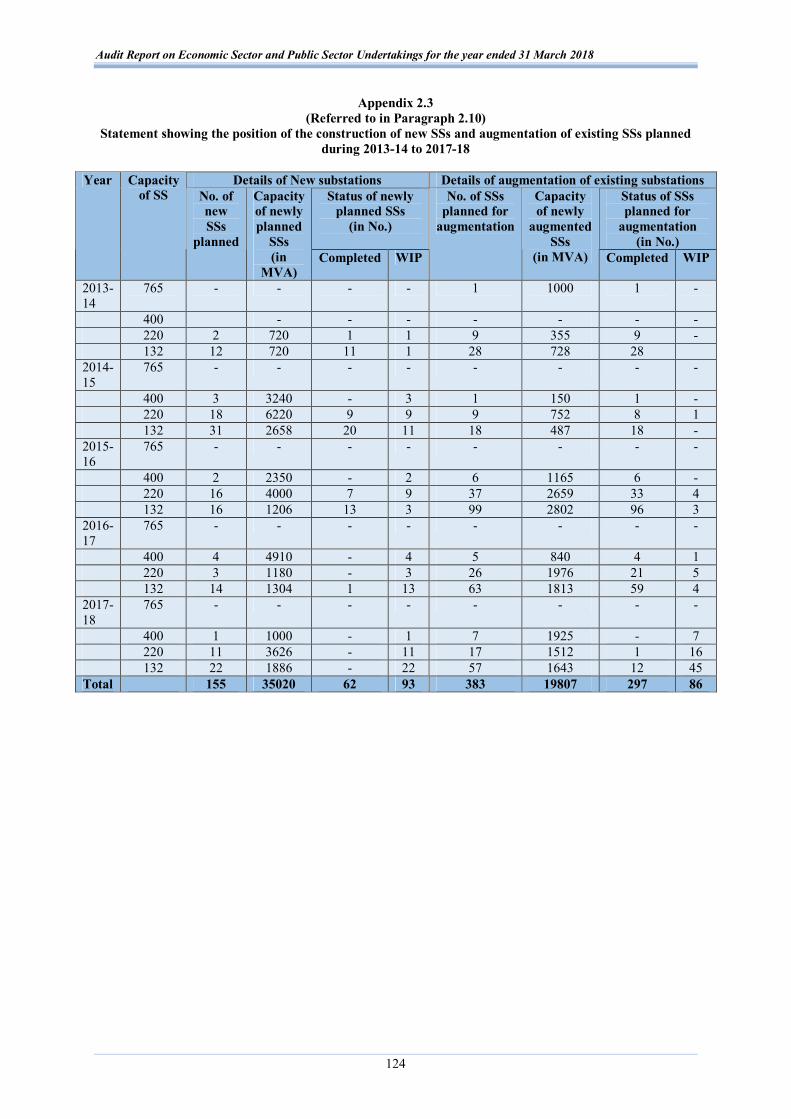
Audit Report on Economic Sector and Public Sector Undertakings for the year ended 31 March 2018
124
Appendix 2.3 (Referred to in Paragraph 2.10)
Statement showing the position of the construction of new SSs and augmentation of existing SSs planned during 2013-14 to 2017-18
Details of New substations Details of augmentation of existing substations
Status of newly planned SSs
(in No.)
Status of SSs planned for
augmentation (in No.)
Year Capacity of SS No. of
new SSs
planned
Capacity of newly planned
SSs (in
MVA) Completed WIP
No. of SSs planned for
augmentation
Capacity of newly
augmented SSs
(in MVA) Completed WIP
2013-14
765 - - - - 1 1000 1 -
400 - - - - - - - 220 2 720 1 1 9 355 9 - 132 12 720 11 1 28 728 28 2014-15
765 - - - - - - - -
400 3 3240 - 3 1 150 1 - 220 18 6220 9 9 9 752 8 1 132 31 2658 20 11 18 487 18 - 2015-16
765 - - - - - - - -
400 2 2350 - 2 6 1165 6 - 220 16 4000 7 9 37 2659 33 4 132 16 1206 13 3 99 2802 96 3 2016-17
765 - - - - - - - -
400 4 4910 - 4 5 840 4 1 220 3 1180 - 3 26 1976 21 5 132 14 1304 1 13 63 1813 59 4 2017-18
765 - - - - - - - -
400 1 1000 - 1 7 1925 - 7 220 11 3626 - 11 17 1512 1 16 132 22 1886 - 22 57 1643 12 45 Total 155 35020 62 93 383 19807 297 86

Audit Report on Economic Sector and Public Sector Undertakings for the year ended 31 March 2018
125
Appendix 2.4 {(Referred to in Paragraph 2.14 (i)}
Statement showing the connected load of new SSs which were overloaded within a year of construction
Statement showing the position of new SSs (220 KV) overloaded within an year of construction Sl. No.
Name of Division Name of SS Capacity (in MVA)
Date of approval by
TWC
Date of commissioning
Sanctioned Cost
(` in crore)
80 per cent of
the installed capacity
Connected load up to November
2018
Percentage of connected load against 80 per cent
of the installed capacity
1 ETD-I,Kanpur 220 KV, Sikandara 100 09.07.2011 28.05.2018 33.12 80 90 112.50 2 ETC-Kanpur (ETD-Fatehgarh) 220 KV, Neebkarori 200 02.02.2015 31.03.2018 109.00 160 200 125.00
Total 142.12
Statement showing the position of new SSs (132 KV) overloaded within an year of construction Sl. No.
Name of Division Name of SS Capacity (in MVA)
Date of TWC
DOC Sanctioned Cost (` in
crore)
80 per cent of
the installed capacity
Connected load
Percentage of connected load against 80 per cent
of the installed capacity
1 ETD-II, Agra 132 KV, Bichpuri 80 08.04.2013 19.06.2017 16.17 64 65 101.56 2 ETD-Robertsganj 132 KV, Pasahi 40 08.07.2015 18.05.2018 28.90 32 38 118.75 3 ETD-Basti 132 KV, Nathnagar 40 27.08.2008 Mar-16 12.57 32 40 125.00 4 ETC-Kanpur (ETD-Fatehgarh) 132 KV, Talegram 80 05.05.2016 16.03.2018 34.00 64 80 125.00 5 ETD-I,Kanpur 132 KV, Rasoolabad 80 13.02.2014 04.03.2016 32.94 64 80 125.00 6 ETD, Sitapur 132 KV, Neri 60 06.07.2012 09.03.2016 12.00 48 75 156.25 7 ETC, Kanpur (ETD-Etawah) 132 KV, Takha 40 06.07.2012 08.06.2016 10.30 32 50 156.25 8 ETD-Jhansi 132 KV, Gurusarai 40 07.09.2011 02.12.2016 18.54 32 63 196.88 9 ETD, Sitapur 132 KV, Mahmoodabad 20 06.07.2012 23.03.2017 12.00 16 45 281.25
Total 177.42

Audit Report on Economic Sector and Public Sector Undertakings for the year ended 31 March 2018
126
Appendix 2.5 {(Referred to in Paragraph 2.14 (ii)}
(A) Statement showing the position of the overloaded 220 KV SSs Sl. No.
Name of the division
Name of the SS
Installed capacity
(in MVA)
80 per cent of the
installed capacity
(in MVA)
Connected load upto November
2018 (in MVA)
Overload in MVA
Percentage of overload
(against 80 per cent Capacity)
1 ETD-Basti 220 KV, Basti
360 288 370 82 28
2 ETD-II, Gorakhpur 220 KV, Barahuwa
520 416 569 153 37
3 ETD-Sitapur 220 KV, Sitapur
300 240 479 239 100
4 ETD-II, Prayagraj 220 KV, Rewa Road
520 416 831 415 100
5 ETD-Sitapur 220 KV, Sitapur
143 114 145 31 27
(B) Statement showing the position of the overloaded 132 KV SSs
Sl. No.
Name of the division
Name of the SS Installed capacity
(in MVA)
80 per cent of the installed capacity (in
MVA)
Connected load
(in MVA)
Overload in MVA
Percentage of overload (against
80 per cent Capacity)
1 ETD-Basti 132 KV, Naugarh 60 48 60 12 25
2 ETD-Basti 132 KV, Dumariaganj 80 64 80 16 25
3 ETD-Basti 132 KV, Nathnagar 40 32 40 8 25
4 ETD-I, Gorakhpur
132 KV, Rajapakar 80 64 85 21 33
5 ETD-Basti 132 KV, Bansi 60 48 65 17 35
6 ETD-II, Gorakhpur
132 KV, Kauriram 103 82 113 31 38
7 ETD-Sitapur 132 KV, Sidhauli 60 48 66 18 38
8 ETD-I, Lucknow 132 KV,TRT 189 151 210 59 39
9 ETD-I, Gorakhpur
132 KV, FCI, Gorakhpur
166 133 185 52 39
10 ETD, Aligarh 132 KV, Aligarh-III 120 96 135 39 41
11 ETD-Basti 132 KV, Khalilabad 80 64 90 26 41
12 ETD-Basti 132 KV, Mehdawal 40 32 45 13 41
13 ETD-Jhansi 132 KV, Lalitpur 100 80 116 36 45
14 ETD-Jhansi 132 KV, Hansari 143 114 170 56 49
15 ETD-Jhansi 132 KV, Mehrauni 40 32 48 16 50
16 ETD-Sitapur 132 KV, Neri 60 48 75 27 56
17 ETD-Sitapur 132 KV, Biswan 40 32 50 18 56
18 ETD, Aligarh 132 KV, Aligarh-V 80 64 104 40 63

Appendices
127
Sl. No.
Name of the division
Name of the SS Installed capacity
(in MVA)
80 per cent of the installed capacity (in
MVA)
Connected load
(in MVA)
Overload in MVA
Percentage of overload (against
80 per cent Capacity)
19 ETD-I, Gorakhpur
132 KV, Kasia, Kushinagar
166 133 218 85 64
20 ETD-II, Lucknow 132 KV, Khurram Nagar
120 96 160 64 67
21 ETD, Aligarh 132 KV, Jattari 80 64 108 44 69
22 ETD, Aligarh 132 KV, Boner 120 96 163 67 70
23 ETD-II, Lucknow 132 KV, NKN 120 96 166 70 73
24 ETD, Aligarh 132 KV, Sarsol 143 114 215 101 89
25 ETD-III, Lucknow
132 KV, Barabanki 126 101 193 92 91
26 ETD-Jhansi 132 KV, Gurusarai 40 32 63 31 100
27 ETD-Sitapur 132 KV, Laherpur 20 16 35 19 119
28 ETD-I, Lucknow 132 KV, Mohan Road 80 64 168 104 163
29 ETD-Sitapur 132 KV, Mahmoodabad
20 16 45 29 181
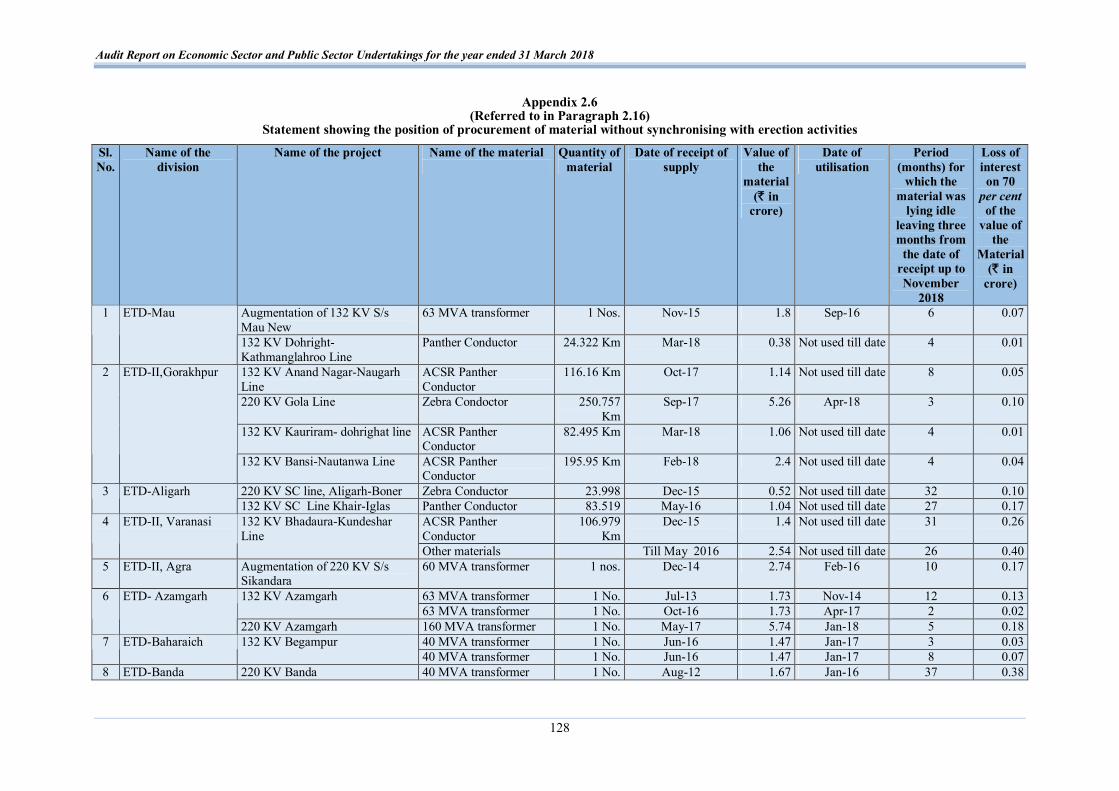
Audit Report on Economic Sector and Public Sector Undertakings for the year ended 31 March 2018
128
Appendix 2.6 (Referred to in Paragraph 2.16)
Statement showing the position of procurement of material without synchronising with erection activities Sl. No.
Name of the division
Name of the project Name of the material
Quantity of material
Date of receipt of supply
Value of the
material (` in
crore)
Date of utilisation
Period (months) for
which the material was
lying idle leaving three months from
the date of receipt up to November
2018
Loss of interest on 70
per cent of the
value of the
Material (` in
crore)
Augmentation of 132 KV S/s Mau New
63 MVA transformer 1 Nos. Nov-15 1.8 Sep-16 6 0.07 1 ETD-Mau
132 KV Dohright-Kathmanglahroo Line
Panther Conductor 24.322 Km Mar-18 0.38 Not used till date 4 0.01
132 KV Anand Nagar-Naugarh Line
ACSR Panther Conductor
116.16 Km Oct-17 1.14 Not used till date 8 0.05
220 KV Gola Line Zebra Condoctor 250.757 Km
Sep-17 5.26 Apr-18 3 0.10
132 KV Kauriram- dohrighat line ACSR Panther Conductor
82.495 Km Mar-18 1.06 Not used till date 4 0.01
2 ETD-II,Gorakhpur
132 KV Bansi-Nautanwa Line ACSR Panther Conductor
195.95 Km Feb-18 2.4 Not used till date 4 0.04
220 KV SC line, Aligarh-Boner Zebra Conductor 23.998 Dec-15 0.52 Not used till date 32 0.10 3 ETD-Aligarh 132 KV SC Line Khair-Iglas Panther Conductor 83.519 May-16 1.04 Not used till date 27 0.17
ACSR Panther Conductor
106.979 Km
Dec-15 1.4 Not used till date 31 0.26 4 ETD-II, Varanasi 132 KV Bhadaura-Kundeshar Line
Other materials Till May 2016 2.54 Not used till date 26 0.40 5 ETD-II, Agra Augmentation of 220 KV S/s
Sikandara 60 MVA transformer 1 nos. Dec-14 2.74 Feb-16 10 0.17
63 MVA transformer 1 No. Jul-13 1.73 Nov-14 12 0.13 132 KV Azamgarh 63 MVA transformer 1 No. Oct-16 1.73 Apr-17 2 0.02
6 ETD- Azamgarh
220 KV Azamgarh 160 MVA transformer 1 No. May-17 5.74 Jan-18 5 0.18 40 MVA transformer 1 No. Jun-16 1.47 Jan-17 3 0.03 7 ETD-Baharaich 132 KV Begampur 40 MVA transformer 1 No. Jun-16 1.47 Jan-17 8 0.07
8 ETD-Banda 220 KV Banda 40 MVA transformer 1 No. Aug-12 1.67 Jan-16 37 0.38

Appendices
129
Sl. No.
Name of the division
Name of the project Name of the material
Quantity of material
Date of receipt of supply
Value of the
material (` in
crore)
Date of utilisation
Period (months) for
which the material was
lying idle leaving three months from
the date of receipt up to November
2018
Loss of interest on 70
per cent of the
value of the
Material (` in
crore)
220 KV PGCIL Sohawal –New Tanda DC line
ACSR Zebra conductor 425.88 kms. Up to July 2013 7.71 Aug-14 9 0.43 9 ETD-Faizabad
132 KV Akbarpur 63 MVA transformer 1 No. Feb-17 1.89 Jul-17 1 0.01 132 KV Neebu Park 63 MVA transformer 1 No. Jul-14 1.9 Feb-15 3 0.03 220 KV SS, Hardoi Road 200 MVA transformer 1 No. Jul-15 4.77 Jan-16 2 0.06
10 ETD-I, Lucknow
132 KV SS, TRT 63 MVA transformer 1 No. Mar-16 1.75 Dec-16 5 0.05 132 KV GIS, Old power House 63 MVA transformer 2 No. May-14 5.66 Mar-16 18 0.62 220 KV SS, Rewa Road 40 MVA transformer 1 No. Dec-16 1.46 Jul-18 15 0.13
11 ETD-II,Allahabad
132 KV SS, Salaykhurd 40 MVA transformer 1 No. Aug-16 1.46 Jul-18 19 0.17 220 KV SS, Sarh 40 MVA transformer 1 No. May-17 1.35 Mar-18 6 0.05 12 ETD II Kanpur 132 KV SS, Krishna Nagar 63 MVA transformer 1 No. Apr-17 1.74 Sep-17 1 0.01 220 KV SS Sahupuri 200 MVA transformer 1 No. Aug-17 4.5 Feb-18 2 0.06 13 ETD-III, Varanasi 132 KV Jeonathpur (Mughalsarai)
40 MVA transformer 2 No. Apr-12 4.76 May-14 21 0.61
220 KV Sitapur Nighasan line ACSR Zebra conductor 367.51 kms. Up to February 2012 6.67 Dec-13 18 0.74 132 KV lakhimpur-Laharpur line ACSR Panther conductor 99.05 kms. Up to Nov 2012 1.18 May-16 38 0.27
14 ETD-Sitapur
220 KV SS Sitapur 200 MVA transformer 1 No. Jul-17 4.37 Dec-17 1 0.03 Total 85.26 5.45

Audit Report on Economic Sector and Public Sector Undertakings for the year ended 31 March 2018
130
Appendix 2.7 {(Referred to in Paragraph 2.17 (i)}
Statement showing the details of Transformers of various capacities procured through TKCs
Sl. No.
Name of SSs LoI No. and date
Trans-former
capacity (in MVA)
No. of trans-former
Rate awarded to TKC per
trans-former (` in crore)
Total awarded value of trans-former
(` in crore)
Date of supply of transformer
by TKC
Date of procu-
rement of transformer
by the Company
(independent Supply)
Rate per trans- former
(independent supply)
(` in crore)
Difference in rate (` in
crore)
Rate of TKC
higher by (in
per cent)
Total excess exp. (` in
crore)
1 2 3 4 5 6 7 8 9 10 11 (col 6- col 10)
12 (11* 100/10)
13 (col
11*col 5) 1 Chhata 64/4.3.14 160 2 5.49 10.98 15.3.16, 20.10.18 30.12.13 3.69 1.80 49 3.60 2 Sikandrarahathras 69/10.4.15 160 2 5.48 10.96 28.4.16, 23.7.16 7.1.15 3.47 2.01 58 4.02 3 Partapur 126/13.7.15 160 2 5.83 11.66 16.2.17, 25.3.17 7.1.15 3.47 2.36 68 4.72 4 Sultanpur road
Lucknow 151/22.3.16 60 5 3.37 16.85 5.2017, 8.2017 27.2.16 2.71 0.66 24 3.30
Total 50.45 15.64

Audit Report on Economic Sector and Public Sector Undertakings for the year ended 31 March 2018
131
Appendix 3.1 (Referred to in Paragraph 3.1)
Statement showing loss of revenue due to incorrect billing to the Consumer
Sl. No. Month Recorded demand in
(kVA)
Amount of bill raised by the Division
(in `)
Amount of bill verified by the Lift Division
(in `)
Bill to be raised as per provision of
Tariff Order (in `)
Short (+)/Excess (-) charged by the Division (in `)
Remarks for incorrect billing
1 2 3 4 5 6 7 (col 6-col 5)
8
1 January 15 1800 1193132 864409 2066625 1202216 Minimum charge 2 February 15 1240 1474193 1216079 2066625 850546 Minimum charge 3 March 15 1040 1066379 711393 2066625 1355232 Minimum charge 4 April 15 120 1027802 829511 2066625 1237114 Minimum charge 5 May 15 480 1523792 1452315 2066625 614310 Minimum charge 6 June 15 920 1821386 1774455 2066625 292170 Minimum charge 7 July 15 1440 2480094 2480094 2311914 -168180 Billable Demand 8 August 15 1680 3433339 3433339 3265159 -168180 Billable Demand 9 September 15 1960 7688022 7520337 7188220 -332117 Billable Demand 10 October 15 2760 4877769 4771379 4966141 194762 Excess demand 11 November 15 2200 1191360 745598 2242400 1496802 Minimum charge 12 December 15 280 2052615 2007845 2242400 234555 Minimum charge 13 January 16 960 1659239 1623049 2242400 619351 Minimum charge 14 February 16 880 2124138 2077808 2242400 164592 Minimum charge 15 March 16 1640 1414869 1414869 2242400 827531 Minimum charge 16 April 16 560 2240369 2032738 2242400 209662 Minimum charge 17 May 16 1720 1656259 1656259 2242400 586141 Minimum charge 18 June 16 920 2301103 2142400 2139922 -2478 Billable Demand 19 July 16 920 3018954 2142400 2859957 717557 Billable Demand 20 August 16 2240 8474042 2142400 8910522 6768122 Billable Demand &
Tariff change 21 September 16 8480 6294332 2142400 12075792 9933392 Excess demand 22 October 16 2560 2847484 2142400 3190590 1048190 Excess demand 23 November 16 1800 1469907 1469907 2185600 715693 Minimum charge

Audit Report on Economic Sector and Public Sector Undertakings for the year ended 31 March 2018
132
Sl. No. Month Recorded demand in
(kVA)
Amount of bill raised by the Division
(in `)
Amount of bill verified by the Lift Division
(in `)
Bill to be raised as per provision of
Tariff Order (in `)
Short (+)/Excess (-) charged by the Division (in `)
Remarks for incorrect billing
1 2 3 4 5 6 7 (col 6-col 5)
8
24 December 16 280 2481292 2142400 2548082 405682 Tariff change 25 January 17 1080 1761348 1761348 2185600 424252 Minimum charge 26 February 17 1040 1391438 1391438 2185600 794162 Minimum charge 27 March 17 760 1467095 1464095 2185600 721505 Minimum charge 28 April 17 560 2355858 2085600 2164618 79018 Billable Demand 29 May 17 640 2704461 2085600 2513221 427621 Billable Demand 30 June 17 600 2546005 2085600 2354765 269165 Billable Demand 31 July 17 1280 2973837 2085600 2782596 696996 Billable Demand 32 August 17 1200 11262618 2085600 10819485 8733885 Billable Demand 33 September 17 9480 8633664 2085600 14485137 12399537 Excess demand 34 October 17 14302 2532935 2085600 12696628 10611028 Excess demand 35 November 17 1640 1622040 1622040 2185600 563560 Minimum charge 36 December 17 200 2383820 2383820 2590994 207174 Minimum charge 37 January 18 1560 1599348 1599348 2732000 1132652 Minimum charge 38 February 18 1120 1340019 1340019 2732000 1391981 Minimum charge 39 March 18 NA 1310844 1310844 2732000 1421156 Minimum charge 40 April 18 0 1288153 1288153 2732000 1443847 Minimum charge 41 May 18 640 1210353 1210353 2732000 1521647 Minimum charge 42 June 18 600 2075867 2075867 2732000 656133 Minimum charge 43 July 18 1320 3038258 2607000 2732000 125000 Minimum charge 44 August 18 2280 1647973 1647973 2732000 1084027 Minimum charge 45 September 18 880 2503761 2503761 2732000 228239 Minimum charge
Total 123461566 89741043 163476292.8 73735250

Appendices
133
Appendix 3.2(a) {Referred to in paragraph 3.1(i)}
Statement showing loss of revenue due to non- applying provision of Minimum charges in Bills
Sl. No. Month Amount of bill raised by the Division (in `)
Amount of bill to be raised by applying Minimum charges8 (in `)
Short charged in billed amount against Minimum charges(in `)
1 2 3 4 5 (col 4-col 3) 1 January 15 1193132 2066625 873493 2 February 15 1474193 2066625 592432 3 March 15 1066379 2066625 1000246 4 April 15 1027802 2066625 1038823 5 May 15 1523792 2066625 542833 6 June 15 1821386 2066625 245239 7 November 15 1191360 2242400 1051040 8 December 15 2052615 2242400 189785 9 January 16 1659239 2242400 583161
10 February 16 2124138 2242400 118262 11 March 16 1414869 2242400 827531 12 April 16 2240369 2242400 2031 13 May 16 1656259 2242400 586141 14 November 16 1469907 2185600 715693 15 January 17 1761348 2185600 424252 16 February 17 1391438 2185600 794162 17 March 17 1467095 2185600 718505 18 November 17 1622040 2185600 563560 19 December 17 2383820 2590994 207174 20 January 18 1599348 2732000 1132652 21 February 18 1340019 2732000 1391981 22 March 18 1310844 2732000 1421156 23 April 18 1288153 2732000 1443847 24 May 18 1210353 2732000 1521647 25 June 18 2075867 2732000 656133 26 August 18 1647973 2732000 1084027 27 September 18 2503761 2732000 228239
Total 43517499 63471544 19954045
8 Minimum charges are computed at the rate of ` 750 per kVA ` 800 per kVA and ` 1000 per kVA w.e.f. 12.10.2014, 28.06.2015 and 09.12.2017 respectively on contracted
load of 2500 kVA and further added on Electricity duty at the rate of 5 per cent and Regulatory surcharge at the rate of 5.22 per cent, 7.12 per cent and 4.28 per cent are applicable w.e.f. 12.10.14, 28.06.15 and 10.08.16 respectively.

Audit Report on Economic Sector and Public Sector Undertakings for the year ended 31 March 2018
134
Appendix 3.2(b) {Referred to in paragraph 3.1(ii)}
Statement showing loss of revenue due to short verification of billed amount by the Consumer
Sl. No. Month Amount of bill raised by the Division (in `)
Amount of bill verified by the Lift Division (in `)
Short verified by Consumer against billed amount (in `)
1 2 3 4 5 (col 3-col 4) 1 January 15 1193132 864409 328723 2 February 15 1474193 1216079 258114 3 March 15 1066379 711393 354986 4 April 15 1027802 829511 198291 5 May15 1523792 1452315 71477 6 June 15 1821386 1774455 46931 7 September 15 7688022 7520337 167685 8 October 15 4877769 4771379 106390 9 November 15 1191360 745598 445762 10 December 15 2052615 2007845 44770 11 January 16 1659239 1623049 36190 12 February 16 2124138 2077808 46330 13 April 16 2240369 2032738 207631 14 June 16 2301103 2142400 158703 15 July 16 3018954 2142400 876554 16 August 16 8474042 2142400 6331642 17 September 16 6294332 2142400 4151932 18 October 16 2847484 2142400 705084 19 December 16 2481292 2142400 338892 20 March 17 1467095 1464095 3000 21 April 17 2355858 2085600 270258 22 May 17 2704461 2085600 618861 23 June 17 2546005 2085600 460405 24 July 17 2973837 2085600 888237 25 August 17 11262618 2085600 9177018 26 September 17 8633664 2085600 6548064 27 October 17 2532935 2085600 447335 28 July 18 3038258 2607000 431258
Total 92872134 59151611 33720523

Appendices
135
Appendix 3.2(c) {Referred to in Paragraph 3.1(iii)}
Statement showing short/ excess charge in billed amount due to non-considering billable demand and excess demand
Sl. No. Month Recorded demand(in kVA)
Amount of bill raised by the Division (in `)
Amount of bill to be raised by considering billable demand and
excess demand (in `)
Short (+)/ excess (-) charge in billed amount
(in `) 1 2 3 4 5 6 (col 5-col 4) 1 July 2015 1440 2480094 2311914 -168180 2 August 2015 1680 3433339 3265159 -165180 3 September 15 1960 7688022 7188220 -499802 4 October 15 2760 4877769 4966141 88372 5 June 16 920 2301103 2139922 -161181 6 July 16 920 3018954 2859957 -158997 7 August 16 2240 8474042 8910522 436480 8 September 16 8480 6294332 12075792 5781460 9 October 16 2560 2847484 3190590 343106
10 December 16 280 2481292 2548082 66790 11 April 17 560 2355858 2164618 -191240 12 May 17 640 2704461 2513221 -191240 13 June 17 600 2546005 2354765 -191240 14 July 17 1280 2973837 2782596 -191241 15 August 17 1200 11262618 10819485 -443133 16 September 17 9480 8633664 14485137 5851473 17 October 17 14302 2532935 12696628 10163693 18 July 18 1320 3038258 2732000 -306258
Total 79944067 100004749 20063682

Audit Report on Economic Sector and Public Sector Undertakings for the year ended 31 March 2018
136
Appendix-4.1 (Referred to in paragraph 4.1, 4.12 and 4.13)
Summarised financial results of PSUs (other than Power Sector) covered in this Chapter for the latest year for which accounts were finalised
(` in crore) Sl. No.
Sector & Name of the PSU Period of accounts
Year in which
finalised
Net profit/ loss before dividend, interest &
tax
Net profit/ loss after dividend, interest &
tax
Turn over
Paid up capital
(including share
application)
Capital employed
Net Worth
Accumulated Profit/ loss
1 2 3 4 5 6 7 8 9 10 11 I. PSUs working in Monopolistic environment A Government Companies 1 Lucknow Metro Rail Corporation Limited 2017-18 2017-18 -24.57 -25.38 5.55 1897.92 4580.72 1826.67 -71.25 2 NOIDA Metro Rail Corporation Limited 2017-18 2017-18 -4.94 -4.94 9.81 987.67 2104.14 974.14 -13.53
Sub Total -29.51 -30.32 15.36 2885.59 6684.86 2800.81 -84.78 B Other Government controlled companies 3 Almora Magnesite Limited (as per Sec 2 (45) read with
2 (27)) 2017-18 2017-18 3.61 2.47 35.89 2.00 7.52 7.47 5.53
4 Lucknow Smart City Limited 2016-17 2017-18 -0.22 -0.22 0.00 0.50 0.28 0.28 -0.22 Sub Total 3.39 2.25 35.89 2.50 7.80 7.75 5.31 C. Statutory Corporations 5 Uttar Pradesh Avas Evam Vikas Parishad 2016-17 2017-18 160.01 158.95 911.24 0.00 4906.20 4906.20 4906.20 6 Uttar Pradesh Forest Corporation 2016-17 2017-18 32.62 31.92 330.28 0.00 1478.19 1459.22 1459.22 7 Uttar Pradesh State Road Transport Corporation 2016-17 2017-18 108.80 97.19 3903.65 826.19 -229.32 -379.20 -1205.39 8 Uttar Pradesh State Warehousing Corporation 2015-16 2017-18 75.18 51.23 395.98 13.37 481.04 481.04 473.00
Sub Total 376.61 339.29 5541.15 839.56 6636.11 6467.26 5633.03 II. PSUs with Assured Source of Income from centage,
commission, revenue grants/subsidies, etc.
Government Companies 9 U.P. Projects Corporation Limited 2015-16 2017-18 35.86 23.08 790.29 6.40 93.32 93.32 86.92
10 Uttar Pradesh State Construction & Infrastructure Development Corporation Limited (formely known as Uttar Pradesh Samaj Kalyan Nirman Nigam Limited)
2016-17 2017-18 2.42 1.62 692.29 0.15 73.31 73.31 73.16
11 Shreetron India Limited (Subsidiary of Uttar Pradesh Electronics Corporation Limited)
2016-17 2017-18 1.11 0.76 36.91 7.12 12.72 10.09 2.97
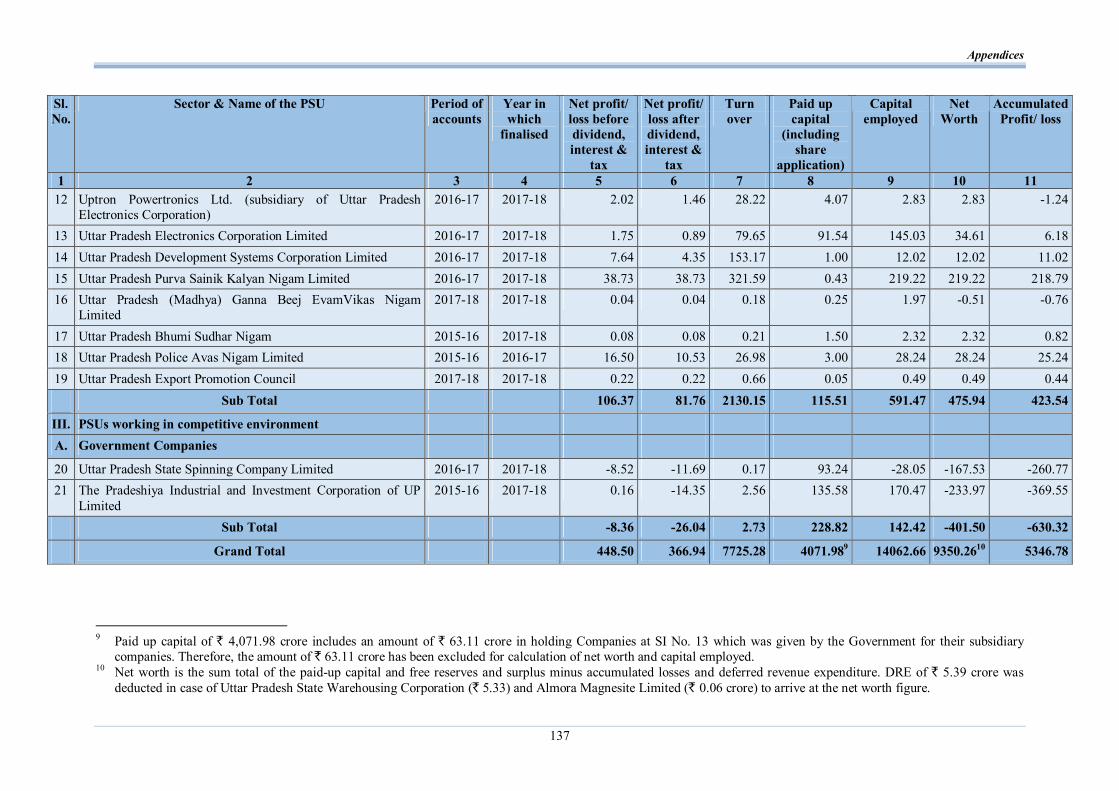
Appendices
137
Sl. No.
Sector & Name of the PSU Period of accounts
Year in which
finalised
Net profit/ loss before dividend, interest &
tax
Net profit/ loss after dividend, interest &
tax
Turn over
Paid up capital
(including share
application)
Capital employed
Net Worth
Accumulated Profit/ loss
1 2 3 4 5 6 7 8 9 10 11 12 Uptron Powertronics Ltd. (subsidiary of Uttar Pradesh
Electronics Corporation) 2016-17 2017-18 2.02 1.46 28.22 4.07 2.83 2.83 -1.24
13 Uttar Pradesh Electronics Corporation Limited 2016-17 2017-18 1.75 0.89 79.65 91.54 145.03 34.61 6.18 14 Uttar Pradesh Development Systems Corporation Limited 2016-17 2017-18 7.64 4.35 153.17 1.00 12.02 12.02 11.02 15 Uttar Pradesh Purva Sainik Kalyan Nigam Limited 2016-17 2017-18 38.73 38.73 321.59 0.43 219.22 219.22 218.79 16 Uttar Pradesh (Madhya) Ganna Beej EvamVikas Nigam
Limited 2017-18 2017-18 0.04 0.04 0.18 0.25 1.97 -0.51 -0.76
17 Uttar Pradesh Bhumi Sudhar Nigam 2015-16 2017-18 0.08 0.08 0.21 1.50 2.32 2.32 0.82 18 Uttar Pradesh Police Avas Nigam Limited 2015-16 2016-17 16.50 10.53 26.98 3.00 28.24 28.24 25.24 19 Uttar Pradesh Export Promotion Council 2017-18 2017-18 0.22 0.22 0.66 0.05 0.49 0.49 0.44
Sub Total 106.37 81.76 2130.15 115.51 591.47 475.94 423.54
III. PSUs working in competitive environment A. Government Companies
20 Uttar Pradesh State Spinning Company Limited 2016-17 2017-18 -8.52 -11.69 0.17 93.24 -28.05 -167.53 -260.77 21 The Pradeshiya Industrial and Investment Corporation of UP
Limited 2015-16 2017-18 0.16 -14.35 2.56 135.58 170.47 -233.97 -369.55
Sub Total -8.36 -26.04 2.73 228.82 142.42 -401.50 -630.32
Grand Total 448.50 366.94 7725.28 4071.989 14062.66 9350.2610 5346.78
9 Paid up capital of ` 4,071.98 crore includes an amount of ` 63.11 crore in holding Companies at SI No. 13 which was given by the Government for their subsidiary
companies. Therefore, the amount of ` 63.11 crore has been excluded for calculation of net worth and capital employed. 10 Net worth is the sum total of the paid-up capital and free reserves and surplus minus accumulated losses and deferred revenue expenditure. DRE of ` 5.39 crore was
deducted in case of Uttar Pradesh State Warehousing Corporation (` 5.33) and Almora Magnesite Limited (` 0.06 crore) to arrive at the net worth figure.

Audit Report on Economic Sector and Public Sector Undertakings for the year ended 31 March 2018
138
Appendix-4.2 (Referred to in paragraph 4.1)
Details of State PSUs (other than Power Sector) not covered in this Chapter (` in crore)
Sl. No.
Sector & Name of the PSU Period of latest finalised
accounts
Year in which
finalised
Net profit/ loss after tax
Turn over Paid up capital
1 2 3 4 5 6 7 I Functional PSUs with arrears of accounts for three or more years/first accounts
not received/not due
A Government Companies 1 Uttar Pradesh State Industrial Development Corporation Limited 2013-14 2017-18 95.22 193.45 24.08 2 Uttar Pradesh Alpsankhyak Vittya Avam Vikas Nigam Limited 2005-06 2017-18 -1.10 3.32 30.00 3 Uttar Pradesh Pichhara Varg Vitta Evam Vikas Nigam Limited 2011-12 2014-15 -0.01 2.94 8.10 4 Uttar Pradesh Scheduled Castes Finance and Development Corporation Limited 2014-15 2017-18 -13.25 87.11 230.42 5 Uttar Pradesh Food and Essential Commodities Corporation Limited 2009-10 2017-18 9.97 1512.06 5.50 6 Uttar Pradesh Mahila Kalyan Nigam Limited 2013-14 2014-15 0.36 0.60 5.19 7 Uttar Pradesh Waqf Vikas Nigam Limited 2003-04 2016-17 -0.21 0.38 5.25 8 Uttar Pradesh State Agro Industrial Corporation Limited 2010-11 2016-17 10.26 793.26 46.30 9 Uttar Pradesh Rajkiya Nirman Nigam Limited 2012-13 2016-17 98.48 2588.10 1.00 10 Uttar Pradesh State Bridge Corporation Limited 2014-15 2016-17 27.91 1375.68 15.00 11 Uttar Pradesh Small Industries Corporation Limited 2007-08 2016-17 4.39 175.48 5.96 12 Uttar Pradesh Beej Vikas Nigam Limited 2012-13 2015-16 3.51 272.59 6.92 13 Uttar Pradesh Matsya Vikas Nigam Limited 2011-12 2017-18 1.10 5.94 1.07 14 Uttar Pradesh Drugs and Pharmaceuticals Limited 2009-10 2012-13 -8.53 0.33 1.10 15 Uttar Pradesh Rajya Chini Avam Ganna Vikas Nigam Limited (Subsidiary of Uttar
Pradesh State Sugar Corporation Limited) 2014-15 2017-18 1.24 0.00 880.13
16 Uttar Pradesh State Sugar Corporation Limited 2014-15 2017-18 -26.95 82.26 1648.31 17 Uttar Pradesh Handicraft & Marketing Development Corporation Limited(Formerly
Uttar Pradesh Export Corporation Limited) 2007-08 2017-18 -0.13 10.65 7.24
18 Uttar Pradesh State Tourism Development Corporation Limited 2014-15 2016-17 -5.13 31.08 18.60 19 Lucknow City Transport Services Limited** - - - - - 20 Meerut City Transport Services Limited 2010-11 2012-13 0.00 0.00 0.05 21 Allahabad City Transport Services Limited 2014-15 2017-18 -7.21 16.11 0.05 22 Agra Mathura City Transport Services Limited** - - - - - 23 Kanpur City Transport Services Limited** - - - - - 24 Varanasi City Transport Services Limited** - - - - -
Sub Total 189.92 7151.34 2940.27

Appendices
139
Sl. No.
Sector & Name of the PSU Period of latest finalised
accounts
Year in which
finalised
Net profit/ loss after tax
Turn over Paid up capital
1 2 3 4 5 6 7 B Other Government Control Companies 25 Agra Smart City Limited** - - - - - 26 Jhansi Smart City Limited** - - - - - Sub Total 0.00 0.00 0.00 C Statutory Corporations 27 Uttar Pradesh Jal Nigam 2011-12 2016-17 16.82 397.45 0.00 28 Uttar Pradesh Financial Corporation 2012-13 2015-16 17.38 22.22 179.28 Sub Total 34.20 419.67 179.28
II Non-functional PSUs A Government Companies 29 Uplease Financial Services Limited (Subsidiary of Uttar Pradesh Electronics
Corporation Limited) 1997-98 1998-99 -0.40 1.29 1.05
30 Uttar Pradesh State Mineral Development Corporation Limited 2013-14 2016-17 -0.48 0.00 59.43 31 Chhata Sugar Company Limited (Subsidiary of Uttar Pradesh State Sugar Corporation
Limited) 2015-16 2017-18 -0.71 0.00 81.38
32 Ghatampur Sugar Company Limited (Subsidiary of Uttar Pradesh State Sugar Corporation Limited
2016-17 2017-18 -0.60 0.00 147.72
33 Nandganj-Sihori Sugar Company Limited (Subsidiary of Uttar Pradesh State Sugar Corporation Limited)
2015-16 2017-18 -0.33 0.00 256.80
34 The Indian Turpentine and Rosin Company Limited 2010-11 2012-13 -0.60 0.03 0.22 35 Uttar Pradesh Instruments Limited (Subsidiary of Uttar Pradesh State Industrial
Development Corporation Limited) 2001-02 2005-06 -0.29 0.16 1.93
36 Uttar Pradesh State Brassware Corporation Limited 1997-98 2007-08 2.39 0.53 5.38 37 Uttar Pradesh State Textile Corporation Limited 2016-17 2017-18 -8.80 0.00 197.10 38 Uptron India Limited (Subsidiary of Uttar Pradesh Electronics Corporation Limited) 1995-96 1997-98 -32.12 97.15 53.16 39 Uttar Pradesh State Handloom Corporation Limited 1998-99 2016-17 -4.97 24.00 47.07 40 Uttar Pradesh State Leather Development and Marketing Corporation Limited 2000-01 2002-03 0.26 3.60 5.74 41 Uttar Pradesh State Yarn Company Limited 2016-17 2017-18 -5.38 0.00 53.67 42 Uttar Pradesh Pashudhan Udyog Nigam Limited 2014-15 2017-18 0.30 0.00 2.73 43 Uttar Pradesh Poultry and Livestock Specialties Limited 2011-12 2017-18 -0.27 0.00 2.94 44 Uttar Pradesh State Horticultural Produce Marketing & Processing Corporation
Limited 1984-85 1994-95 -0.67 0.27 1.90
45 Uttar Pradesh (Paschim) Ganna Beej Evam Vikas Nigam Limited 2013-14 2014-15 -0.12 0.00 0.64

Audit Report on Economic Sector and Public Sector Undertakings for the year ended 31 March 2018
140
Sl. No.
Sector & Name of the PSU Period of latest finalised
accounts
Year in which
finalised
Net profit/ loss after tax
Turn over Paid up capital
1 2 3 4 5 6 7 46 Uttar Pradesh Panchayati Raj Vitta Evam Vikas Nigam Limited 1995-96 2012-13 -0.16 0.45 1.46 47 Agra Mandal Vikas Nigam Limited 1988-89 2007-08 -0.09 3.91 1.00 48 Allahabad Mandal Vikas Nigam Limited 1983-84 1992-93 -0.11 2.74 0.55 49 Bareilly Mandal Vikas Nigam Limited 1988-89 2011-12 -0.39 3.33 1.00 50 Gorakhpur Mandal Vikas Nigam Limited 1988-89 2013-14 -0.07 0.25 1.26 51 Lucknow Mandaliya Vikas Nigam Limited 1981-82 1992-93 0.01 1.70 0.50 52 Meerut Mandal Vikas Nigam Limited 2008-09 2010-11 -0.03 0.00 1.00 53 Moradabad Mandal Vikas Nigam Limited 1991-92 2011-12 -0.19 0.85 0.25 54 Tarai Anusuchit Janjati Vikas Nigam Limited 1982-83 1990-91 -0.04 0.01 0.25 55 Uttar Pradesh Bundelkhand Vikas Nigam Limited 2010-11 2016-17 0.09 0.00 1.23 56 Uttar Pradesh Chalchitra Nigam Limited 2009-10 2011-12 -0.38 0.12 8.18 57 Uttar Pradesh Poorvanchal Vikas Nigam Limited 1987-88 1994-95 -0.14 1.30 1.15 58 Varanasi Mandal Vikas Nigam Limited 1987-88 1993-94 -0.03 1.47 0.70 Sub Total -54.32 143.16 937.39 B Other Government Control Companies 59 Command Area Poultry Development Corporation Limited (as per Sec 2 (45) read with
2 (27) ) 1994-95 - 0.01 0.96 0.24
Sub Total 0.01 0.96 0.24 III PSUs under liquidation A Government Companies 60 Uttar Pradesh (Poorva) Ganna Beej Evam Vikas Nigam Limited 2002-03
(UL from 01-07-03)
2004-05 -0.18 0.04 0.31
61 Uttar Pradesh (Rohilkhand Tarai) Ganna Beej Evam Vikash Nigam Limited 2006-07 (UL from 01-07-03)
2008-09 -1.05 0.11 0.71
62 Uttar Pradesh Cement Corporation Limited 1995-96 (UL from
08-02-1999)
1996-97 -47.75 113.01 68.28
63 Vindhyachal Abrasives Limited (Subsidiary of Uttar Pradesh State Mineral Development Corporation Limited)
1987-88 (UL from
28-11-2002)
1995-96 -0.12 0.00 0.00

Appendices
141
Sl. No.
Sector & Name of the PSU Period of latest finalised
accounts
Year in which
finalised
Net profit/ loss after tax
Turn over Paid up capital
1 2 3 4 5 6 7 64 Auto Tractors Limited 1991-92
(UL from 14-02-2003)
1995-96 0.11 6.31 7.50
65 Bhadohi Woollens Limited (Subsidiary of Uttar Pradesh State Textile Corporation Ltd.)
1994-95 (UL from 20-02-96)
0 -1.66 0.27 3.76
66 Continental Float Glass Limited (Subsidiary of Uttar Pradesh State Mineral Development Corporation Limited)
1997-98 (UL from
01-04-2002)
2002-03 0.00 0.00 46.24
67 Kanpur Components Limited (Subsidiary of Uttar Pradesh Electronics Corporation Ltd.)
(UL from 10-06-1996)
- 0.00 0.05 0.00
68 Uttar Pradesh Abscott Private Limited (Subsidiary of Uttar Pradesh Small Industries Corporation Limited)
1975-76 (UL from
19-04-1996)
- -0.02 0.00 0.05
69 Uttar Pradesh Carbide and Chemicals Limited (Subsidiary of Uttar Pradesh State Mineral Development Corporation Limited)
1992-93 (UL from 19-02-94)
- -6.18 2.26 6.58
70 Uttar Pradesh Plant Protection Appliances (Private) Limited (Subsidiary of Uttar Pradesh Small Industries Corporation Limited)
1974-75 (UL from 11/2003)
1984-85 -0.01 0.04 0.01
Sub Total -56.86 122.09 133.44 B Other Government Control Companies 71 Electronics and Computers (India) Limited (as per Sec 2 (45) read with 2 (27) ) (UL from
14-07-1981) - 0.00 0.00 0.00
Sub Total 0.00 0.00 0.00 Total of all sectors 112.95 7837.22 4190.62 Note: ** indicate PSUs which have not submitted their first accounts.

Audit Report on Economic Sector and Public Sector Undertakings for the year ended 31 March 2018
142
Appendix- 4.3 (Referred to in paragraphs 4.3 and 4.12)
Statement showing position of equity and outstanding loans relating to State PSUs (other than Power Sector) covered in this Chapter as on 31 March 2018
(` in crore) Equity11 at close of the year 2017-18 Long term loans outstanding at close of
the year 2017-18 Sl. No.
Sector & Name of the PSU Name of the Department
Month and year of
incorporation GoUP12 GoI13 Others Total GoUP GoI Others Total 1 2 3 4 5 (a) 5 (b) 5 (c) 5 (d) 6 (a) 6 (b) 6 (c) 6 (d) I PSUs working in Monopolistic environment Government Companies
1 Lucknow Metro Rail Corporation Limited Housing and Urban Planning
11/25/2013 1037.95 859.92 0.05 1897.92 685.05 247.00 1822.00 2754.05
2 NOIDA Metro Rail Corporation Limited Infrastructure and Industrial Development
5/11/2014 0.00 687.62 300.05 987.67 0.00 0.00 1130.00 1130.00
Sub Total 1037.95 1547.54 300.10 2885.59 685.05 247.00 2952.00 3884.05 Other Government controlled companies
3 Almora Magnesite Limited (as per Sec 2 (45) read with 2 (27) )
8/27/1971 0.00 0.00 2.00 2.00 0.00 0.00 0.05 0.05
4 Lucknow Smart City Ltd Urban Development 8/16/2016 0.00 188.00 186.00 374.00 0.00 0.00 0.00 0.00 Sub Total 0.00 188.00 188.00 376.00 0.00 0.00 0.05 0.05 Statutory Corporations
5 Uttar Pradesh Avas Evam Vikas Parishad Housing and Urban Planning
3/4/1966 0.00 0.00 0.00 0.00 0.00 0.00 0.00 0.00
6 Uttar Pradesh Forest Corporation Forest 11/25/1974 0.00 0.00 0.00 0.00 0.00 0.00 13.00 13.00 7 Uttar Pradesh State Road Transport
Corporation Transport 1/6/1972 816.18 60.01 0.00 876.19 46.72 0.00 0.00 46.72
8 Uttar Pradesh State Warehousing Corporation Co-operative 3/19/1958 7.61 0.00 5.40 13.01 0.00 0.00 0.00 0.00 Sub Total 823.79 60.01 5.40 889.20 46.72 0.00 13.00 59.72 Sub Total of sector I 1861.74 1795.55 493.50 4150.79 731.77 247.00 2965.05 3943.82
II PSUs with Assured Source of Income from centage, commission, revenue grants/subsidies, etc Government Companies
9 U.P. Projects Corporation Limited Irrigation 5/26/1976 5.40 1.00 0.00 6.40 0.00 0.00 0.00 0.00
11 Equity includes share application money 12 Government of Uttar Pradesh 13 Government of India
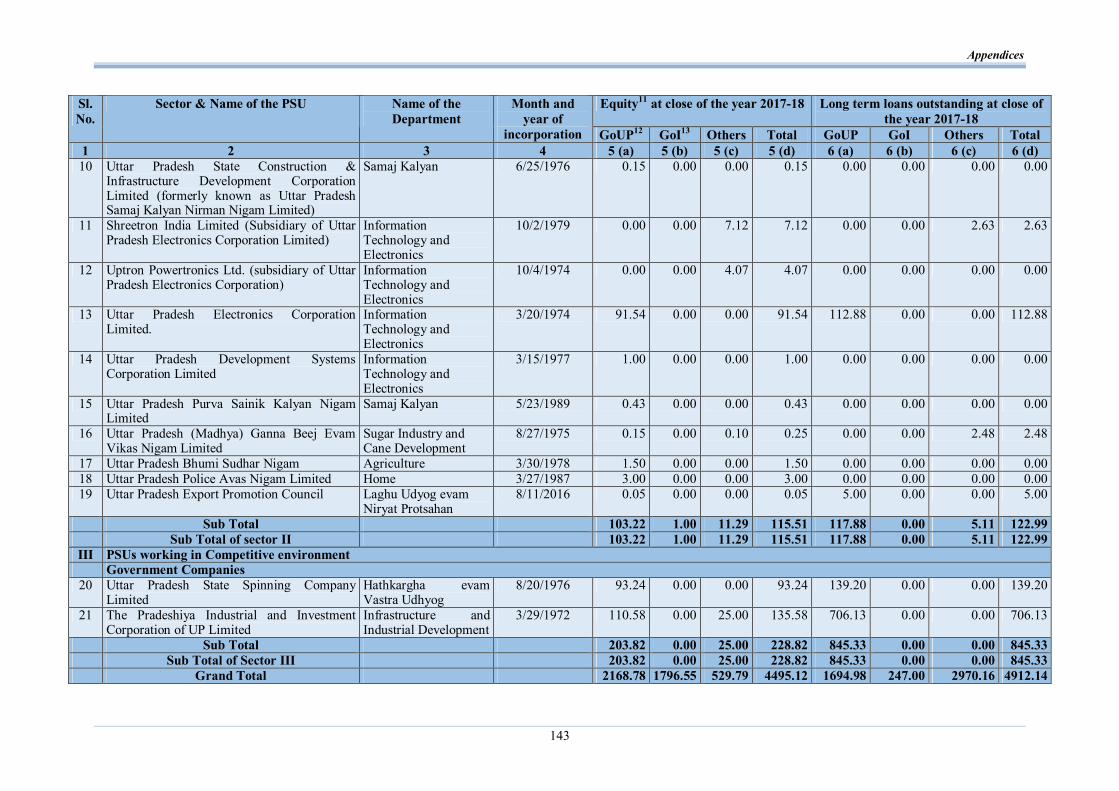
Appendices
143
Equity11 at close of the year 2017-18 Long term loans outstanding at close of the year 2017-18
Sl. No.
Sector & Name of the PSU Name of the Department
Month and year of
incorporation GoUP12 GoI13 Others Total GoUP GoI Others Total 1 2 3 4 5 (a) 5 (b) 5 (c) 5 (d) 6 (a) 6 (b) 6 (c) 6 (d) 10 Uttar Pradesh State Construction &
Infrastructure Development Corporation Limited (formerly known as Uttar Pradesh Samaj Kalyan Nirman Nigam Limited)
Samaj Kalyan 6/25/1976 0.15 0.00 0.00 0.15 0.00 0.00 0.00 0.00
11 Shreetron India Limited (Subsidiary of Uttar Pradesh Electronics Corporation Limited)
Information Technology and Electronics
10/2/1979 0.00 0.00 7.12 7.12 0.00 0.00 2.63 2.63
12 Uptron Powertronics Ltd. (subsidiary of Uttar Pradesh Electronics Corporation)
Information Technology and Electronics
10/4/1974 0.00 0.00 4.07 4.07 0.00 0.00 0.00 0.00
13 Uttar Pradesh Electronics Corporation Limited.
Information Technology and Electronics
3/20/1974 91.54 0.00 0.00 91.54 112.88 0.00 0.00 112.88
14 Uttar Pradesh Development Systems Corporation Limited
Information Technology and Electronics
3/15/1977 1.00 0.00 0.00 1.00 0.00 0.00 0.00 0.00
15 Uttar Pradesh Purva Sainik Kalyan Nigam Limited
Samaj Kalyan 5/23/1989 0.43 0.00 0.00 0.43 0.00 0.00 0.00 0.00
16 Uttar Pradesh (Madhya) Ganna Beej Evam Vikas Nigam Limited
Sugar Industry and Cane Development
8/27/1975 0.15 0.00 0.10 0.25 0.00 0.00 2.48 2.48
17 Uttar Pradesh Bhumi Sudhar Nigam Agriculture 3/30/1978 1.50 0.00 0.00 1.50 0.00 0.00 0.00 0.00 18 Uttar Pradesh Police Avas Nigam Limited Home 3/27/1987 3.00 0.00 0.00 3.00 0.00 0.00 0.00 0.00 19 Uttar Pradesh Export Promotion Council Laghu Udyog evam
Niryat Protsahan 8/11/2016 0.05 0.00 0.00 0.05 5.00 0.00 0.00 5.00
Sub Total 103.22 1.00 11.29 115.51 117.88 0.00 5.11 122.99 Sub Total of sector II 103.22 1.00 11.29 115.51 117.88 0.00 5.11 122.99
III PSUs working in Competitive environment Government Companies
20 Uttar Pradesh State Spinning Company Limited
Hathkargha evam Vastra Udhyog
8/20/1976 93.24 0.00 0.00 93.24 139.20 0.00 0.00 139.20
21 The Pradeshiya Industrial and Investment Corporation of UP Limited
Infrastructure and Industrial Development
3/29/1972 110.58 0.00 25.00 135.58 706.13 0.00 0.00 706.13
Sub Total 203.82 0.00 25.00 228.82 845.33 0.00 0.00 845.33 Sub Total of Sector III 203.82 0.00 25.00 228.82 845.33 0.00 0.00 845.33 Grand Total 2168.78 1796.55 529.79 4495.12 1694.98 247.00 2970.16 4912.14
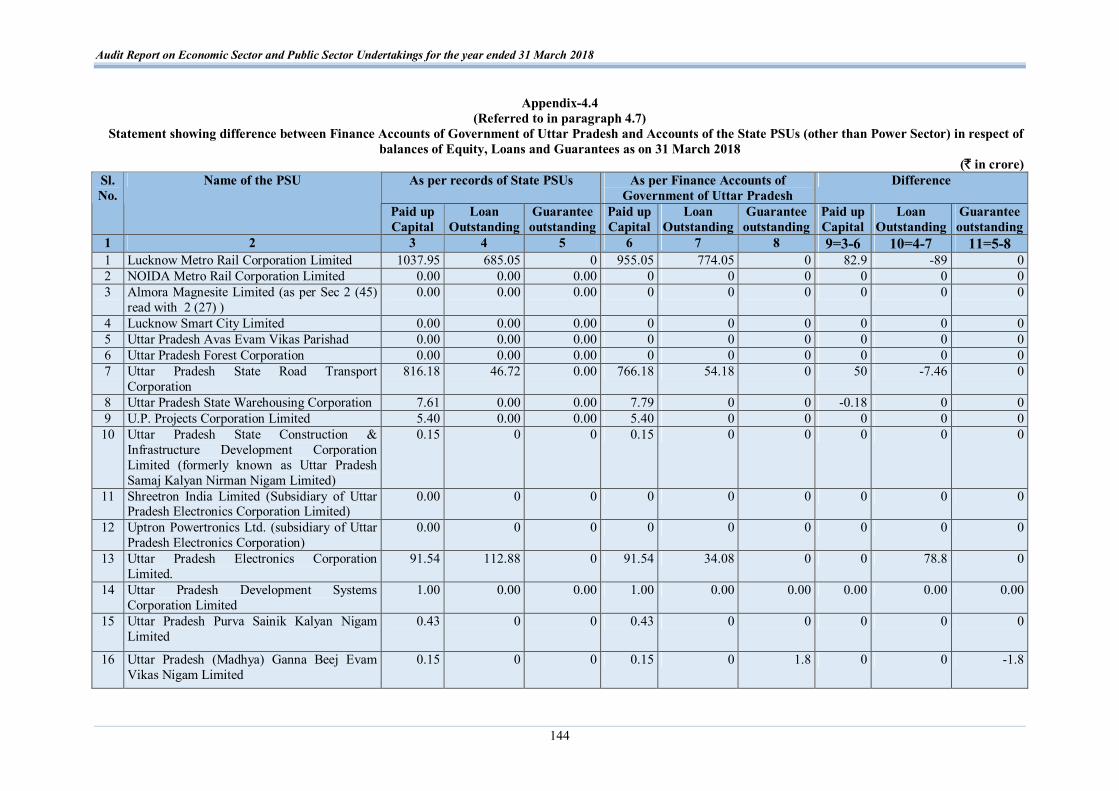
Audit Report on Economic Sector and Public Sector Undertakings for the year ended 31 March 2018
144
Appendix-4.4 (Referred to in paragraph 4.7)
Statement showing difference between Finance Accounts of Government of Uttar Pradesh and Accounts of the State PSUs (other than Power Sector) in respect of balances of Equity, Loans and Guarantees as on 31 March 2018
(` in crore) As per records of State PSUs As per Finance Accounts of
Government of Uttar Pradesh Difference Sl.
No. Name of the PSU
Paid up Capital
Loan Outstanding
Guarantee outstanding
Paid up Capital
Loan Outstanding
Guarantee outstanding
Paid up Capital
Loan Outstanding
Guarantee outstanding
1 2 3 4 5 6 7 8 9=3-6 10=4-7 11=5-8 1 Lucknow Metro Rail Corporation Limited 1037.95 685.05 0 955.05 774.05 0 82.9 -89 0 2 NOIDA Metro Rail Corporation Limited 0.00 0.00 0.00 0 0 0 0 0 0 3 Almora Magnesite Limited (as per Sec 2 (45)
read with 2 (27) ) 0.00 0.00 0.00 0 0 0 0 0 0
4 Lucknow Smart City Limited 0.00 0.00 0.00 0 0 0 0 0 0 5 Uttar Pradesh Avas Evam Vikas Parishad 0.00 0.00 0.00 0 0 0 0 0 0 6 Uttar Pradesh Forest Corporation 0.00 0.00 0.00 0 0 0 0 0 0 7 Uttar Pradesh State Road Transport
Corporation 816.18 46.72 0.00 766.18 54.18 0 50 -7.46 0
8 Uttar Pradesh State Warehousing Corporation 7.61 0.00 0.00 7.79 0 0 -0.18 0 0 9 U.P. Projects Corporation Limited 5.40 0.00 0.00 5.40 0 0 0 0 0 10 Uttar Pradesh State Construction &
Infrastructure Development Corporation Limited (formerly known as Uttar Pradesh Samaj Kalyan Nirman Nigam Limited)
0.15 0 0 0.15 0 0 0 0 0
11 Shreetron India Limited (Subsidiary of Uttar Pradesh Electronics Corporation Limited)
0.00 0 0 0 0 0 0 0 0
12 Uptron Powertronics Ltd. (subsidiary of Uttar Pradesh Electronics Corporation)
0.00 0 0 0 0 0 0 0 0
13 Uttar Pradesh Electronics Corporation Limited.
91.54 112.88 0 91.54 34.08 0 0 78.8 0
14 Uttar Pradesh Development Systems Corporation Limited
1.00 0.00 0.00 1.00 0.00 0.00 0.00 0.00 0.00
15 Uttar Pradesh Purva Sainik Kalyan Nigam Limited
0.43 0 0 0.43 0 0 0 0 0
16 Uttar Pradesh (Madhya) Ganna Beej Evam Vikas Nigam Limited
0.15 0 0 0.15 0 1.8 0 0 -1.8
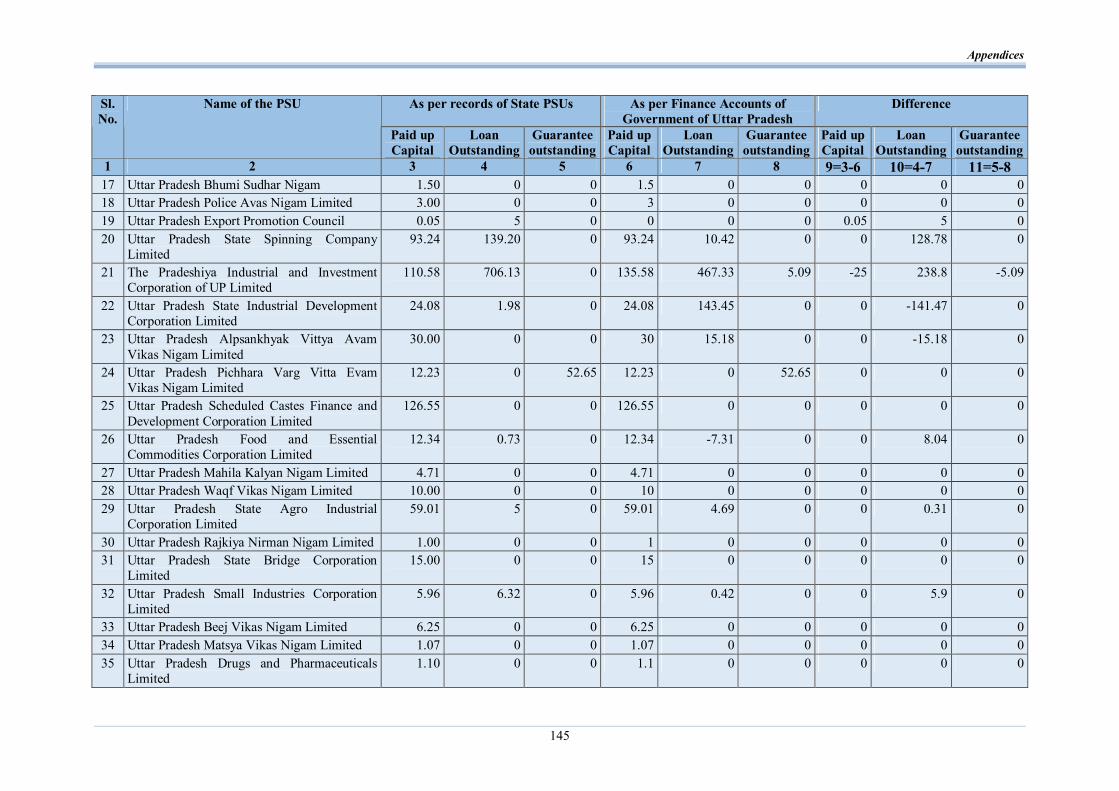
Appendices
145
As per records of State PSUs As per Finance Accounts of Government of Uttar Pradesh
Difference Sl. No.
Name of the PSU
Paid up Capital
Loan Outstanding
Guarantee outstanding
Paid up Capital
Loan Outstanding
Guarantee outstanding
Paid up Capital
Loan Outstanding
Guarantee outstanding
1 2 3 4 5 6 7 8 9=3-6 10=4-7 11=5-8 17 Uttar Pradesh Bhumi Sudhar Nigam 1.50 0 0 1.5 0 0 0 0 0 18 Uttar Pradesh Police Avas Nigam Limited 3.00 0 0 3 0 0 0 0 0 19 Uttar Pradesh Export Promotion Council 0.05 5 0 0 0 0 0.05 5 0 20 Uttar Pradesh State Spinning Company
Limited 93.24 139.20 0 93.24 10.42 0 0 128.78 0
21 The Pradeshiya Industrial and Investment Corporation of UP Limited
110.58 706.13 0 135.58 467.33 5.09 -25 238.8 -5.09
22 Uttar Pradesh State Industrial Development Corporation Limited
24.08 1.98 0 24.08 143.45 0 0 -141.47 0
23 Uttar Pradesh Alpsankhyak Vittya Avam Vikas Nigam Limited
30.00 0 0 30 15.18 0 0 -15.18 0
24 Uttar Pradesh Pichhara Varg Vitta Evam Vikas Nigam Limited
12.23 0 52.65 12.23 0 52.65 0 0 0
25 Uttar Pradesh Scheduled Castes Finance and Development Corporation Limited
126.55 0 0 126.55 0 0 0 0 0
26 Uttar Pradesh Food and Essential Commodities Corporation Limited
12.34 0.73 0 12.34 -7.31 0 0 8.04 0
27 Uttar Pradesh Mahila Kalyan Nigam Limited 4.71 0 0 4.71 0 0 0 0 0 28 Uttar Pradesh Waqf Vikas Nigam Limited 10.00 0 0 10 0 0 0 0 0 29 Uttar Pradesh State Agro Industrial
Corporation Limited 59.01 5 0 59.01 4.69 0 0 0.31 0
30 Uttar Pradesh Rajkiya Nirman Nigam Limited 1.00 0 0 1 0 0 0 0 0 31 Uttar Pradesh State Bridge Corporation
Limited 15.00 0 0 15 0 0 0 0 0
32 Uttar Pradesh Small Industries Corporation Limited
5.96 6.32 0 5.96 0.42 0 0 5.9 0
33 Uttar Pradesh Beej Vikas Nigam Limited 6.25 0 0 6.25 0 0 0 0 0 34 Uttar Pradesh Matsya Vikas Nigam Limited 1.07 0 0 1.07 0 0 0 0 0 35 Uttar Pradesh Drugs and Pharmaceuticals
Limited 1.10 0 0 1.1 0 0 0 0 0

Audit Report on Economic Sector and Public Sector Undertakings for the year ended 31 March 2018
146
As per records of State PSUs As per Finance Accounts of Government of Uttar Pradesh
Difference Sl. No.
Name of the PSU
Paid up Capital
Loan Outstanding
Guarantee outstanding
Paid up Capital
Loan Outstanding
Guarantee outstanding
Paid up Capital
Loan Outstanding
Guarantee outstanding
1 2 3 4 5 6 7 8 9=3-6 10=4-7 11=5-8 36 Uttar Pradesh Rajya Chini Avam Ganna Vikas
Nigam Limited (Subsidiary of Uttar Pradesh State Sugar Corporation Limited)
0.00 0 0 880.13 0 0 -880.13 0 0
37 Uttar Pradesh State Sugar Corporation Limited
1648.31 166.8 73.96 1648.31 944.05 0 0 -777.25 73.96
38 Uttar Pradesh Handicraft & Marketing Development Corporation Limited (Formerly Uttar Pradesh Export Corporation Limited)
6.34 12.44 0 6.34 5.77 0 0 6.67 0
39 Uttar Pradesh State Tourism Development Corporation Limited
32.60 0.66 0 32.6 2.76 0 0 -2.1 0
40 Lucknow City Transport Services Limited* 17.84 0 0 0 0 0 17.84 0 0 41 Meerut City Transport Services Limited 0.05 0 0 0 0 0 0.05 0 0 42 Allahabad City Transport Services Limited 0.05 0 0 0 0 0 0.05 0 0 43 Agra Mathura City Transport Services
Limited* 0.05 0 0 0 0 0 0.05 0 0
44 Kanpur City Transport Services Limited* 0.05 0 0 0 0 0 0.05 0 0 45 Varanasi City Transport Services Limited* 0.05 0 0 0 0 0 0.05 0 0 46 Agra Smart City Limited* 0.00 0 0 0 0 0 0 0 0 47 Jhansi Smart City Limited* 0.00 0 0 0 0 0 0 0 0 48 Uttar Pradesh Jal Nigam 0.00 1196.19 0 0 88.77 0 0 1107.42 0 49 Uttar Pradesh Financial Corporation 114.17 292.99 27.46 114.17 13.81 27.46 0 279.18 0 Sub Total of Functional PSUs 4297.59 3378.09 154.07 5051.86 2551.65 87 -754.27 826.44 67.07 Non-functional PSUs
50 Uplease Financial Services Limited (Subsidiary of Uttar Pradesh Electronics Corporation Limited)
0.00 0 0 0 0 0 0 0 0
51 Uttar Pradesh State Mineral Development Corporation Limited
59.43 18.24 0 59.43 6.83 0 0 11.41 0
52 Chhata Sugar Company Limited (Subsidiary of Uttar Pradesh State Sugar Corporation Limited)
0.00 0 0 0 0 0 0 0 0
53 Ghatampur Sugar Company Limited (Subsidiary of Uttar Pradesh State Sugar Corporation Limited
0.00 0 0 0 0 0 0 0 0

Appendices
147
As per records of State PSUs As per Finance Accounts of Government of Uttar Pradesh
Difference Sl. No.
Name of the PSU
Paid up Capital
Loan Outstanding
Guarantee outstanding
Paid up Capital
Loan Outstanding
Guarantee outstanding
Paid up Capital
Loan Outstanding
Guarantee outstanding
1 2 3 4 5 6 7 8 9=3-6 10=4-7 11=5-8 54 Nandganj-Sihori Sugar Company Limited
(Subsidiary of Uttar Pradesh State Sugar Corporation Limited)
0.00 0 0 0 0 0 0 0 0
55 The Indian Turpentine and Rosin Company Limited
0.19 5.33 0 0.19 1.9 1.76 0 3.43 -1.76
56 Uttar Pradesh Instruments Limited (Subsidiary of Uttar Pradesh State Industrial Development Corporation Limited)
0.09 5.55 0 0.09 0 0 0 5.55 0
57 Uttar Pradesh State Brassware Corporation Limited
5.28 1.94 0 5.28 0.15 0 0 1.79 0
58 Uttar Pradesh State Textile Corporation Limited
197.10 88.52 0 160.79 202.76 0 36.31 -114.24 0
59 Uptron India Limited (Subsidiary of Uttar Pradesh Electronics Corporation Limited)
0.00 0 0 0 0 0 0 0 0
60 Uttar Pradesh State Handloom Corporation Limited
36.44 123.71 0 36.44 12.53 0 0 111.18 0
61 Uttar Pradesh State Leather Development and Marketing Corporation Limited
5.74 1.91 0 5.74 1.4 0 0 0.51 0
62 Uttar Pradesh State Yarn Company Limited 53.67 66.12 0 31.91 13.17 0 21.76 52.95 0 63 Uttar Pradesh Pashudhan Udyog Nigam
Limited 2.10 0.71 0 2.73 1.1 0 -0.63 -0.39 0
64 Uttar Pradesh Poultry and Livestock Specialties Limited
2.88 0 0 0.44 0 0 2.44 0 0
65 Uttar Pradesh State Horticultural Produce Marketing & Processing Corporation Limited
6.41 3.34 0.55 8.72 0 0.55 -2.31 3.34 0
66 Uttar Pradesh (Paschim) Ganna Beej Evam Vikas Nigam Limited
0.51 0 0 0.51 0 0.7 0 0 -0.7
67 Uttar Pradesh Panchayati Raj Vitta Evam Vikas Nigam Limited
0.78 0 0 0.78 0 0 0 0 0
68 Agra Mandal Vikas Nigam Limited 1.00 0.05 0 1 0 0 0 0.05 0 69 Allahabad Mandal Vikas Nigam Limited 0.67 0.66 0 0.67 0 0 0 0.66 0 70 Bareilly Mandal Vikas Nigam Limited 1.25 0 0 1.25 0 0 0 0 0 71 Gorakhpur Mandal Vikas Nigam Limited 0.94 0.65 0 0.93 0 0 0.01 0.65 0
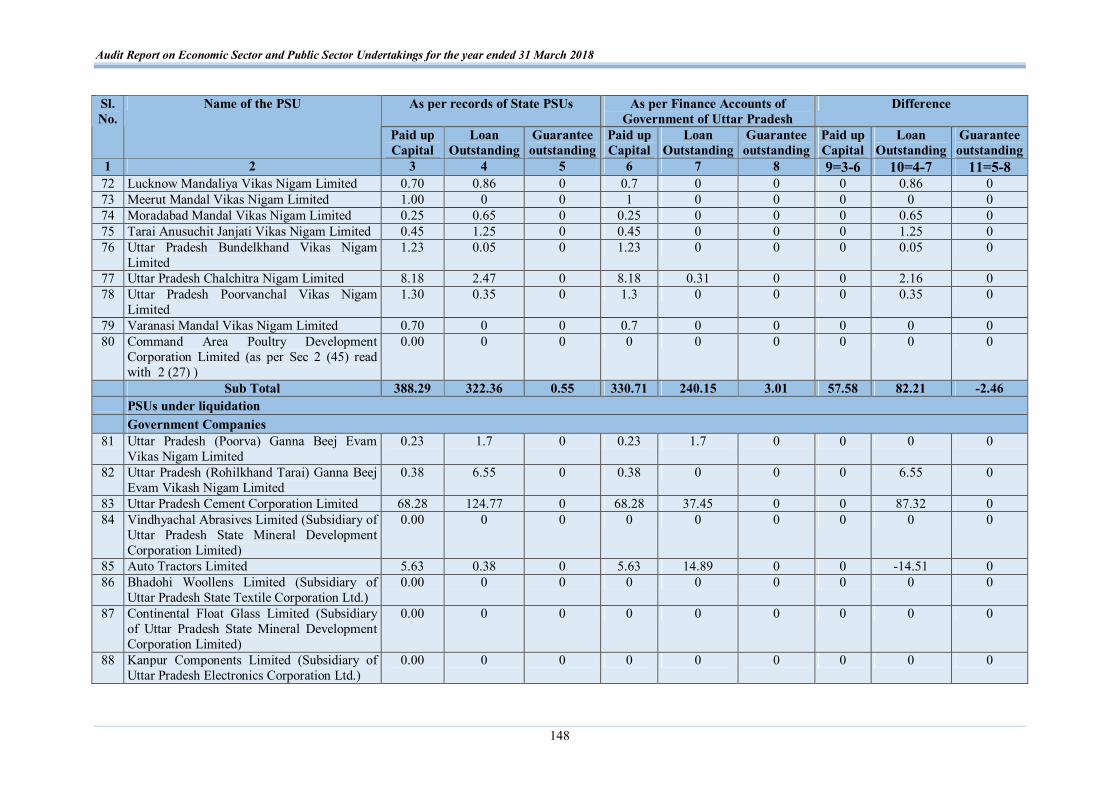
Audit Report on Economic Sector and Public Sector Undertakings for the year ended 31 March 2018
148
As per records of State PSUs As per Finance Accounts of Government of Uttar Pradesh
Difference Sl. No.
Name of the PSU
Paid up Capital
Loan Outstanding
Guarantee outstanding
Paid up Capital
Loan Outstanding
Guarantee outstanding
Paid up Capital
Loan Outstanding
Guarantee outstanding
1 2 3 4 5 6 7 8 9=3-6 10=4-7 11=5-8 72 Lucknow Mandaliya Vikas Nigam Limited 0.70 0.86 0 0.7 0 0 0 0.86 0 73 Meerut Mandal Vikas Nigam Limited 1.00 0 0 1 0 0 0 0 0 74 Moradabad Mandal Vikas Nigam Limited 0.25 0.65 0 0.25 0 0 0 0.65 0 75 Tarai Anusuchit Janjati Vikas Nigam Limited 0.45 1.25 0 0.45 0 0 0 1.25 0 76 Uttar Pradesh Bundelkhand Vikas Nigam
Limited 1.23 0.05 0 1.23 0 0 0 0.05 0
77 Uttar Pradesh Chalchitra Nigam Limited 8.18 2.47 0 8.18 0.31 0 0 2.16 0 78 Uttar Pradesh Poorvanchal Vikas Nigam
Limited 1.30 0.35 0 1.3 0 0 0 0.35 0
79 Varanasi Mandal Vikas Nigam Limited 0.70 0 0 0.7 0 0 0 0 0 80 Command Area Poultry Development
Corporation Limited (as per Sec 2 (45) read with 2 (27) )
0.00 0 0 0 0 0 0 0 0
Sub Total 388.29 322.36 0.55 330.71 240.15 3.01 57.58 82.21 -2.46 PSUs under liquidation Government Companies
81 Uttar Pradesh (Poorva) Ganna Beej Evam Vikas Nigam Limited
0.23 1.7 0 0.23 1.7 0 0 0 0
82 Uttar Pradesh (Rohilkhand Tarai) Ganna Beej Evam Vikash Nigam Limited
0.38 6.55 0 0.38 0 0 0 6.55 0
83 Uttar Pradesh Cement Corporation Limited 68.28 124.77 0 68.28 37.45 0 0 87.32 0 84 Vindhyachal Abrasives Limited (Subsidiary of
Uttar Pradesh State Mineral Development Corporation Limited)
0.00 0 0 0 0 0 0 0 0
85 Auto Tractors Limited 5.63 0.38 0 5.63 14.89 0 0 -14.51 0 86 Bhadohi Woollens Limited (Subsidiary of
Uttar Pradesh State Textile Corporation Ltd.) 0.00 0 0 0 0 0 0 0 0
87 Continental Float Glass Limited (Subsidiary of Uttar Pradesh State Mineral Development Corporation Limited)
0.00 0 0 0 0 0 0 0 0
88 Kanpur Components Limited (Subsidiary of Uttar Pradesh Electronics Corporation Ltd.)
0.00 0 0 0 0 0 0 0 0

Appendices
149
As per records of State PSUs As per Finance Accounts of Government of Uttar Pradesh
Difference Sl. No.
Name of the PSU
Paid up Capital
Loan Outstanding
Guarantee outstanding
Paid up Capital
Loan Outstanding
Guarantee outstanding
Paid up Capital
Loan Outstanding
Guarantee outstanding
1 2 3 4 5 6 7 8 9=3-6 10=4-7 11=5-8 89 Uttar Pradesh Abscott Private Limited
(Subsidiary of Uttar Pradesh Small Industries Corporation Limited)
0.00 0 0 0 0 0 0 0 0
90 Uttar Pradesh Carbide and Chemicals Limited (Subsidiary of Uttar Pradesh State Mineral Development Corporation Limited)
0.00 11.02 0 0 0 0 0 11.02 0
91 Uttar Pradesh Plant Protection Appliances (Private) Limited (Subsidiary of Uttar Pradesh Small Industries Corporation Limited)
0.00 0 0 0 0 0 0 0 0
92 Electronics and Computers (India) Limited (as per Sec 2 (45) read with 2 (27) )
0.00 0 0 0 0 0 0 0 0
Sub Total 74.52 144.42 0.00 74.52 54.04 0.00 0.00 90.38 0.00
Sub Total of Non-Functional PSUs 462.81 466.78 0.55 405.23 294.19 3.01 57.58 172.59 -2.46 Grand Total 4760.40 3844.87 154.62 5457.09 2845.84 90.01 -696.69 999.03 64.61
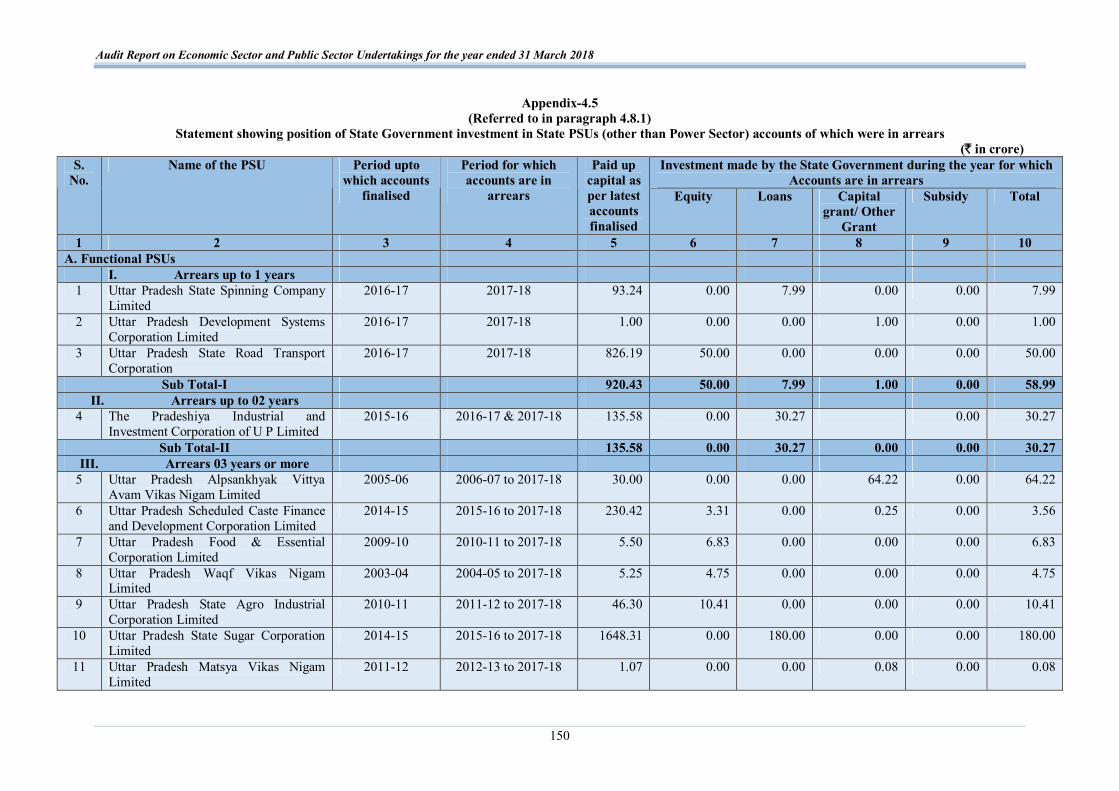
Audit Report on Economic Sector and Public Sector Undertakings for the year ended 31 March 2018
150
Appendix-4.5 (Referred to in paragraph 4.8.1)
Statement showing position of State Government investment in State PSUs (other than Power Sector) accounts of which were in arrears (` in crore)
Investment made by the State Government during the year for which Accounts are in arrears
S. No.
Name of the PSU Period upto which accounts
finalised
Period for which accounts are in
arrears
Paid up capital as per latest accounts finalised
Equity Loans Capital grant/ Other
Grant
Subsidy Total
1 2 3 4 5 6 7 8 9 10 A. Functional PSUs
I. Arrears up to 1 years 1 Uttar Pradesh State Spinning Company
Limited 2016-17 2017-18 93.24 0.00 7.99 0.00 0.00 7.99
2 Uttar Pradesh Development Systems Corporation Limited
2016-17 2017-18 1.00 0.00 0.00 1.00 0.00 1.00
3 Uttar Pradesh State Road Transport Corporation
2016-17 2017-18 826.19 50.00 0.00 0.00 0.00 50.00
Sub Total-I 920.43 50.00 7.99 1.00 0.00 58.99 II. Arrears up to 02 years
4 The Pradeshiya Industrial and Investment Corporation of U P Limited
2015-16 2016-17 & 2017-18 135.58 0.00 30.27 0.00 30.27
Sub Total-II 135.58 0.00 30.27 0.00 0.00 30.27 III. Arrears 03 years or more
5 Uttar Pradesh Alpsankhyak Vittya Avam Vikas Nigam Limited
2005-06 2006-07 to 2017-18 30.00 0.00 0.00 64.22 0.00 64.22
6 Uttar Pradesh Scheduled Caste Finance and Development Corporation Limited
2014-15 2015-16 to 2017-18 230.42 3.31 0.00 0.25 0.00 3.56
7 Uttar Pradesh Food & Essential Corporation Limited
2009-10 2010-11 to 2017-18 5.50 6.83 0.00 0.00 0.00 6.83
8 Uttar Pradesh Waqf Vikas Nigam Limited
2003-04 2004-05 to 2017-18 5.25 4.75 0.00 0.00 0.00 4.75
9 Uttar Pradesh State Agro Industrial Corporation Limited
2010-11 2011-12 to 2017-18 46.30 10.41 0.00 0.00 0.00 10.41
10 Uttar Pradesh State Sugar Corporation Limited
2014-15 2015-16 to 2017-18 1648.31 0.00 180.00 0.00 0.00 180.00
11 Uttar Pradesh Matsya Vikas Nigam Limited
2011-12 2012-13 to 2017-18 1.07 0.00 0.00 0.08 0.00 0.08

Appendices
151
Investment made by the State Government during the year for which Accounts are in arrears
S. No.
Name of the PSU Period upto which accounts
finalised
Period for which accounts are in
arrears
Paid up capital as per latest accounts finalised
Equity Loans Capital grant/ Other
Grant
Subsidy Total
1 2 3 4 5 6 7 8 9 10 12 U.P. Handicrafts & Marketing
Development Corporation Limited 2007-08 2008-09 to 2017-18 7.24 0.00 5.00 13.19 0.00 18.19
13 Uttar Pradesh Mahila Kalyan Nigam Limited
2013-14 2014-15 to 2017-18 5.19 0.00 0.00 15.14 0.00 15.14
14 Lucknow City Transport Services Limited
Incorporated on 01-02-2010
2009-10 to 2017-18 0.00 17.84 0.00 19.30 0.00 37.14
15 Meerut City Transport Services Limited 2010-11 2012-13 to 2017-18 0.05 0.00 0.00 11.38 0.00 11.38 16 Allahabad City Transport Services
Limited 2014-15 2015-16 to 2017-18 0.05 0.00 0.00 15.73 0.00 15.73
17 Agra Mathura City Transport Services Limited
Incorporated w.e.f. 08-07-10
2010-11 to 2017-18 0.00 0.05 0.00 22.57 0.00 22.62
18 Kanpur City Transport Services Limited Incorporated w.e.f. 28-04-10
2010-11 to 2017-18 0.00 0.05 0.00 27.50 0.00 27.55
19 Varanasi City Transport Services Limited
Incorporated on 15-06-2010
2010-11 to 2017-18 0.00 0.05 0.00 22.66 0.00 22.71
20 Uttar Pradesh Jal Nigam 2011-12 2012-13 to 2017-18 0.00 0.00 440.61 10613.67 0.00 11054.28 Sub Total-III 1979.38 43.29 625.61 10825.69 0.00 11494.59
Total A 3035.39 93.29 663.87 10826.69 0.00 11583.85 B. Non-Functional PSUs
I. Arrears up to 1 years 21 Uttar Pradesh State Yarn Company 2016-17 2017-18 53.67 0.00 4.01 0.00 0.00 4.01
Sub Total-I 53.67 0.00 4.01 0.00 0.00 4.01 II. Arrears 03 years or more
22 The Indian Turpentine and Rosin Company Limited
2010-11 2011-12 to 2017-18 0.22 0.00 0.34 0.00 0.00 0.34
23 Uttar Pradesh State Handloom Corporation Limited
1998-1999 1999-2000 to 2017-18 47.07 0.00 106.55 0.00 0.00 106.55
Sub Total-II 47.29 0.00 106.89 0.00 0.00 106.89 Total B 100.96 0.00 110.90 0.00 0.00 110.90
Grand Total 3136.35 93.29 774.77 10826.69 0.00 11694.75

Audit Report on Economic Sector and Public Sector Undertakings for the year ended 31 March 2018
152
Appendix-4.6 (Referred to in Paragraph 4.15)
Statement showing State Government fund infused in State PSUs (other than Power Sector) during the period from 2000-01 to 2017-18
(` in crore) 1. Lucknow Metro Rail Corporation Limited 2. Uttar Pradesh State Road Transport
Corporation 3. Uttar Pradesh State Warehousing
Corporation Year
Equity Interest
free Loans Loans on
which interest
payment has been
defaulted
Capital Grants
Equity Interest free Loans
Loans on which
interest payment has been defaulted
Capital Grants
Equity Interest free
Loans
Loans on which
interest payment has been defaulted
Capital Grants
Up to 1999-2000 0.00 0.00 0 0.00 252.11 0.00 0.00 7.79 0.00 2000-01 0.00 0.00 0.00 0.00 0.00 0.00 0.00 0.00 0.00 0.00 0.00 0.00 2001-02 0.00 0.00 0.00 0.00 0.00 0.00 0.00 0.00 0.00 0.00 0.00 0.00 2002-03 0.00 0.00 0.00 0.00 0.00 0.00 0.00 0.00 0.00 0.00 0.00 0.00 2003-04 0.00 0.00 0.00 0.00 0.00 0.00 0.00 0.00 0.00 0.00 0.00 0.00 2004-05 0.00 0.00 0.00 0.00 0.00 0.00 0.00 0.00 0.00 0.00 0.00 0.00 2005-06 0.00 0.00 0.00 0.00 0.00 0.00 0.00 0.00 0.00 0.00 0.00 0.00 2006-07 0.00 0.00 0.00 0.00 47.00 0.00 0.00 0.00 0.00 0.00 0.00 0.00 2007-08 0.00 0.00 0.00 0.00 0.00 0.00 0.00 0.00 0.00 0.00 0.00 0.00 2008-09 0.00 0.00 0.00 0.00 10.00 0.00 0.00 0.00 0.00 0.00 0.00 0.00 2009-10 0.00 0.00 0.00 0.00 0.00 0.00 0.00 0.00 0.00 0.00 0.00 0.00 2010-11 0.00 0.00 0.00 0.00 0.00 0.00 0.00 0.00 0.00 0.00 0.00 0.00 2011-12 0.00 0.00 0.00 0.00 39.52 0.00 0.00 0.00 0.00 0.00 0.00 0.00 2012-13 0.00 0.00 0.00 0.00 6.00 0.00 0.00 0.00 0.00 0.00 0.00 0.00 2013-14 20.00 0.00 0.00 27.00 3.43 0.00 0.00 0.00 0.00 0.00 0.00 0.00 2014-15 60.00 35.00 0.00 115.00 151.32 0.00 0.00 0.00 -0.18 0.00 0.00 0.00 2015-16 475.00 150.00 0.00 73.29 158.47 0.00 0.00 0.00 0.00 0.00 0.00 0.00 2016-17 400.00 350.00 0.00 20.46 98.33 0.00 0.00 0.00 0.00 0.00 0.00 0.00 2017-18 82.95 150.05 0.00 0.00 50.00 0.00 0.00 0.00 0.00 0.00 0.00 0.00
Total 1037.95 685.05 0 235.75 816.18 0.00 0.00 0.00 7.61 0.00 0.00 0.00

Audit Report on Economic Sector and Public Sector Undertakings for the year ended 31 March 2018
153
4. U.P. Projects Corporation Limited 5. Uttar Pradesh State Construction & Infrastructure Development Corporation
Limited (formerly known as Uttar Pradesh Samaj Kalyan Nirman Nigam Limited)
6. Uttar Pradesh Electronics Corporation Limited
Year
Equity Interest free Loans
Loans on which
interest payment has been defaulted
Capital Grants
Equity Interest free
Loans
Loans on which
interest payment has been defaulted
Capital Grants
Equity Interest free
Loans
Loans on which
interest payment has been defaulted
Capital Grants
Up to 1999-2000 5.40 0.00 0.00 0.00 0.15 0.00 0.00 0.00 77.51 24.99 10.45 0.00 2000-01 0.00 0.00 0.00 0.00 0.00 0.00 0.00 0.00 0.00 17.75 0.00 0.00 2001-02 0.00 0.00 0.00 0.00 0.00 0.00 0.00 0.00 0.00 0.00 0.00 0.00 2002-03 0.00 0.00 0.00 0.00 0.00 0.00 0.00 0.00 10.15 18.75 0.00 0.00 2003-04 0.00 0.00 0.00 0.00 0.00 0.00 0.00 0.00 0.00 6.25 0.00 0.00 2004-05 0.00 0.00 0.00 0.00 0.00 0.00 0.00 0.00 0.00 5.34 -0.42 0.00 2005-06 0.00 0.00 0.00 0.00 0.00 0.00 0.00 0.00 0.00 0.00 0.00 0.00 2006-07 0.00 0.00 0.00 0.00 0.00 0.00 0.00 0.00 0.00 0.00 0.00 0.00 2007-08 0.00 0.00 0.00 0.00 0.00 0.00 0.00 0.00 0.00 0.00 0.00 0.00 2008-09 0.00 0.00 0.00 0.00 0.00 0.00 0.00 0.00 3.88 0.00 0.00 0.00 2009-10 0.00 0.00 0.00 0.00 0.00 0.00 0.00 0.00 0.00 0.00 0.00 0.00 2010-11 0.00 0.00 0.00 0.00 0.00 0.00 0.00 0.00 0.00 32.70 0.00 0.00 2011-12 0.00 0.00 0.00 0.00 0.00 0.00 0.00 0.00 0.00 0.00 0.00 0.00 2012-13 0.00 0.00 0.00 0.00 0.00 0.00 0.00 0.00 0.00 0.00 0.00 0.00 2013-14 0.00 0.00 0.00 0.00 0.00 0.00 0.00 0.00 0.00 0.00 0.00 0.00 2014-15 0.00 0.00 0.00 0.00 0.00 0.00 0.00 0.00 0.00 0.00 0.00 0.00 2015-16 0.00 0.00 0.00 0.00 0.00 0.00 0.00 0.00 0.00 0.00 0.00 0.00 2016-17 0.00 0.00 0.00 0.00 0.00 0.00 0.00 0.00 0.00 -0.28 0.00 0.00 2017-18 0.00 0.00 0.00 0.00 0.00 0.00 0.00 0.00 0.00 0.00 0.00 0.00
Total 5.40 0.00 0.00 0.00 0.15 0.00 0.00 0.00 91.54 105.50 10.03 0.00

Audit Report on Economic Sector and Public Sector Undertakings for the year ended 31 March 2018
154
7. Uttar Pradesh Development Systems Corporation Limited
8. Uttar Pradesh Purva Sainik Kalyan Nigam Limited
9. Uttar Pradesh (Madhya) Ganna Beej Evam Vikas Nigam Limited
Year
Equity Interest free Loans
Loans on which
interest payment has been defaulted
Capital Grants
Equity Interest free
Loans
Loans on which
interest payment has been defaulted
Capital Grants
Equity Interest free
Loans
Loans on which
interest payment has been defaulted
Capital Grants
Up to 1999-2000 1.00 0.00 0.00 0.00 0.43 0.00 0.00 0.15 0.00 0.00 0.00 2000-01 0.00 0.00 0.00 0.00 0.00 0.00 0.00 0.00 0.00 0.00 0.00 0.00 2001-02 0.00 0.00 0.00 0.00 0.00 0.00 0.00 0.00 0.00 0.00 0.00 0.00 2002-03 0.00 0.00 0.00 0.00 0.00 0.00 0.00 0.00 0.00 0.00 0.00 0.00 2003-04 0.00 0.00 0.00 0.00 0.00 0.00 0.00 0.00 0.00 0.00 0.00 0.00 2004-05 0.00 0.00 0.00 0.00 0.00 0.00 0.00 0.00 0.00 0.00 0.00 0.00 2005-06 0.00 0.00 0.00 0.00 0.00 0.00 0.00 0.00 0.00 0.00 0.00 0.00 2006-07 0.00 0.00 0.00 0.00 0.00 0.00 0.00 0.00 0.00 0.00 0.00 0.00 2007-08 0.00 0.00 0.00 0.00 0.00 0.00 0.00 0.00 0.00 0.00 0.00 0.00 2008-09 0.00 0.00 0.00 0.00 0.00 0.00 0.00 0.00 0.00 0.00 0.00 0.00 2009-10 0.00 0.00 0.00 0.00 0.00 0.00 0.00 0.00 0.00 0.00 0.00 0.00 2010-11 0.00 0.00 0.00 0.00 0.00 0.00 0.00 0.00 0.00 0.00 0.00 0.00 2011-12 0.00 0.00 0.00 0.00 0.00 0.00 0.00 0.00 0.00 0.00 0.00 0.00 2012-13 0.00 0.00 0.00 0.00 0.00 0.00 0.00 0.00 0.00 0.00 0.00 0.00 2013-14 0.00 0.00 0.00 0.00 0.00 0.00 0.00 0.00 0.00 0.00 0.00 0.00 2014-15 0.00 0.00 0.00 0.00 0.00 0.00 0.00 0.00 0.00 0.00 0.00 0.00 2015-16 0.00 0.00 24.71 0.00 0.00 0.00 0.00 0.00 0.00 0.00 0.00 0.00 2016-17 0.00 0.00 -24.71 0.00 0.00 0.00 0.00 0.00 0.00 0.00 0.00 0.00 2017-18 0.00 0.00 0.00 0.00 0.00 0.00 0.00 0.00 0.00 0.00 0.00 0.00
Total 1.00 0.00 0.00 0.00 0.43 0.00 0.00 0.00 0.15 0.00 0.00 0.00
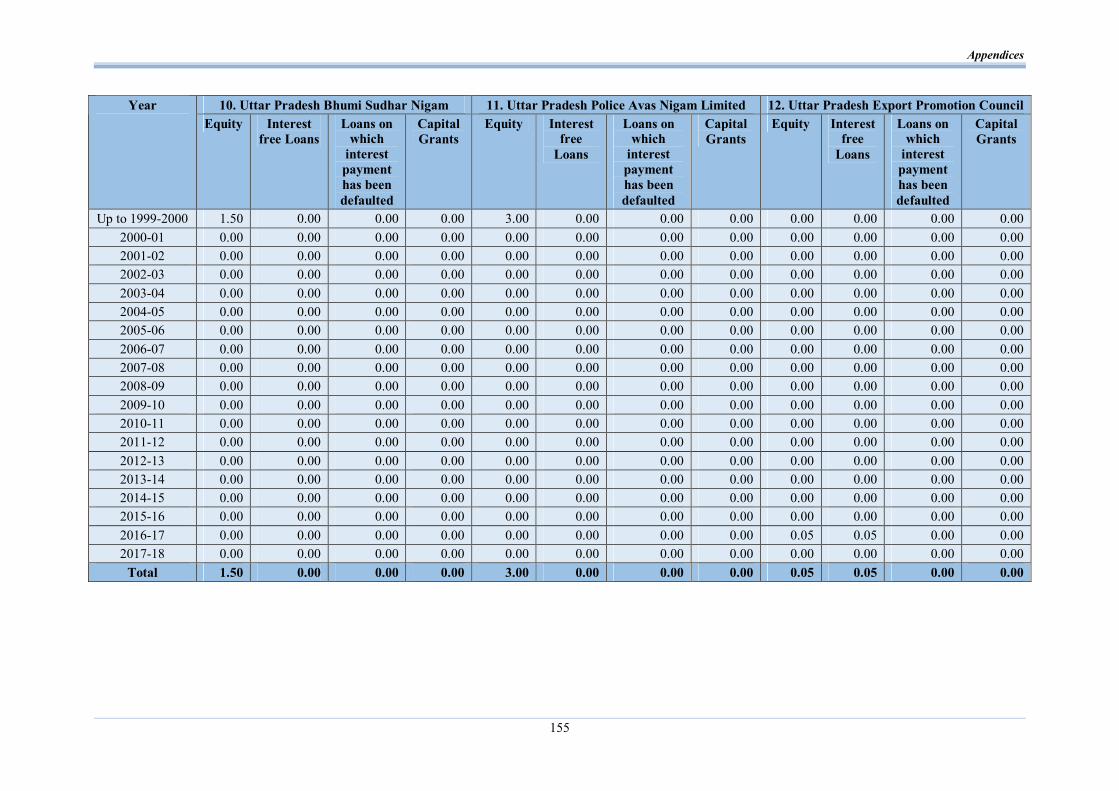
Appendices
155
10. Uttar Pradesh Bhumi Sudhar Nigam 11. Uttar Pradesh Police Avas Nigam Limited 12. Uttar Pradesh Export Promotion Council Year Equity Interest
free Loans Loans on
which interest payment has been defaulted
Capital Grants
Equity Interest free
Loans
Loans on which
interest payment has been defaulted
Capital Grants
Equity Interest free
Loans
Loans on which
interest payment has been defaulted
Capital Grants
Up to 1999-2000 1.50 0.00 0.00 0.00 3.00 0.00 0.00 0.00 0.00 0.00 0.00 0.00 2000-01 0.00 0.00 0.00 0.00 0.00 0.00 0.00 0.00 0.00 0.00 0.00 0.00 2001-02 0.00 0.00 0.00 0.00 0.00 0.00 0.00 0.00 0.00 0.00 0.00 0.00 2002-03 0.00 0.00 0.00 0.00 0.00 0.00 0.00 0.00 0.00 0.00 0.00 0.00 2003-04 0.00 0.00 0.00 0.00 0.00 0.00 0.00 0.00 0.00 0.00 0.00 0.00 2004-05 0.00 0.00 0.00 0.00 0.00 0.00 0.00 0.00 0.00 0.00 0.00 0.00 2005-06 0.00 0.00 0.00 0.00 0.00 0.00 0.00 0.00 0.00 0.00 0.00 0.00 2006-07 0.00 0.00 0.00 0.00 0.00 0.00 0.00 0.00 0.00 0.00 0.00 0.00 2007-08 0.00 0.00 0.00 0.00 0.00 0.00 0.00 0.00 0.00 0.00 0.00 0.00 2008-09 0.00 0.00 0.00 0.00 0.00 0.00 0.00 0.00 0.00 0.00 0.00 0.00 2009-10 0.00 0.00 0.00 0.00 0.00 0.00 0.00 0.00 0.00 0.00 0.00 0.00 2010-11 0.00 0.00 0.00 0.00 0.00 0.00 0.00 0.00 0.00 0.00 0.00 0.00 2011-12 0.00 0.00 0.00 0.00 0.00 0.00 0.00 0.00 0.00 0.00 0.00 0.00 2012-13 0.00 0.00 0.00 0.00 0.00 0.00 0.00 0.00 0.00 0.00 0.00 0.00 2013-14 0.00 0.00 0.00 0.00 0.00 0.00 0.00 0.00 0.00 0.00 0.00 0.00 2014-15 0.00 0.00 0.00 0.00 0.00 0.00 0.00 0.00 0.00 0.00 0.00 0.00 2015-16 0.00 0.00 0.00 0.00 0.00 0.00 0.00 0.00 0.00 0.00 0.00 0.00 2016-17 0.00 0.00 0.00 0.00 0.00 0.00 0.00 0.00 0.05 0.05 0.00 0.00 2017-18 0.00 0.00 0.00 0.00 0.00 0.00 0.00 0.00 0.00 0.00 0.00 0.00
Total 1.50 0.00 0.00 0.00 3.00 0.00 0.00 0.00 0.05 0.05 0.00 0.00
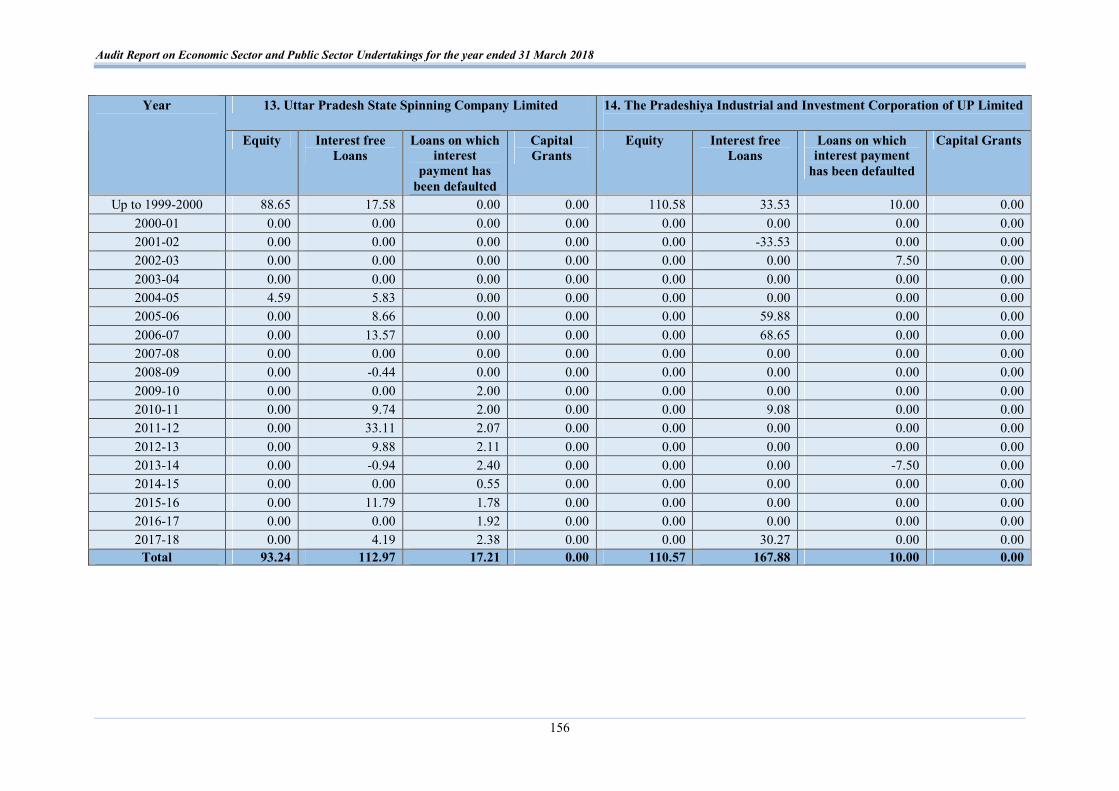
Audit Report on Economic Sector and Public Sector Undertakings for the year ended 31 March 2018
156
13. Uttar Pradesh State Spinning Company Limited 14. The Pradeshiya Industrial and Investment Corporation of UP Limited
Year
Equity Interest free Loans
Loans on which interest
payment has been defaulted
Capital Grants
Equity Interest free Loans
Loans on which interest payment
has been defaulted
Capital Grants
Up to 1999-2000 88.65 17.58 0.00 0.00 110.58 33.53 10.00 0.00 2000-01 0.00 0.00 0.00 0.00 0.00 0.00 0.00 0.00 2001-02 0.00 0.00 0.00 0.00 0.00 -33.53 0.00 0.00 2002-03 0.00 0.00 0.00 0.00 0.00 0.00 7.50 0.00 2003-04 0.00 0.00 0.00 0.00 0.00 0.00 0.00 0.00 2004-05 4.59 5.83 0.00 0.00 0.00 0.00 0.00 0.00 2005-06 0.00 8.66 0.00 0.00 0.00 59.88 0.00 0.00 2006-07 0.00 13.57 0.00 0.00 0.00 68.65 0.00 0.00 2007-08 0.00 0.00 0.00 0.00 0.00 0.00 0.00 0.00 2008-09 0.00 -0.44 0.00 0.00 0.00 0.00 0.00 0.00 2009-10 0.00 0.00 2.00 0.00 0.00 0.00 0.00 0.00 2010-11 0.00 9.74 2.00 0.00 0.00 9.08 0.00 0.00 2011-12 0.00 33.11 2.07 0.00 0.00 0.00 0.00 0.00 2012-13 0.00 9.88 2.11 0.00 0.00 0.00 0.00 0.00 2013-14 0.00 -0.94 2.40 0.00 0.00 0.00 -7.50 0.00 2014-15 0.00 0.00 0.55 0.00 0.00 0.00 0.00 0.00 2015-16 0.00 11.79 1.78 0.00 0.00 0.00 0.00 0.00 2016-17 0.00 0.00 1.92 0.00 0.00 0.00 0.00 0.00 2017-18 0.00 4.19 2.38 0.00 0.00 30.27 0.00 0.00
Total 93.24 112.97 17.21 0.00 110.57 167.88 10.00 0.00
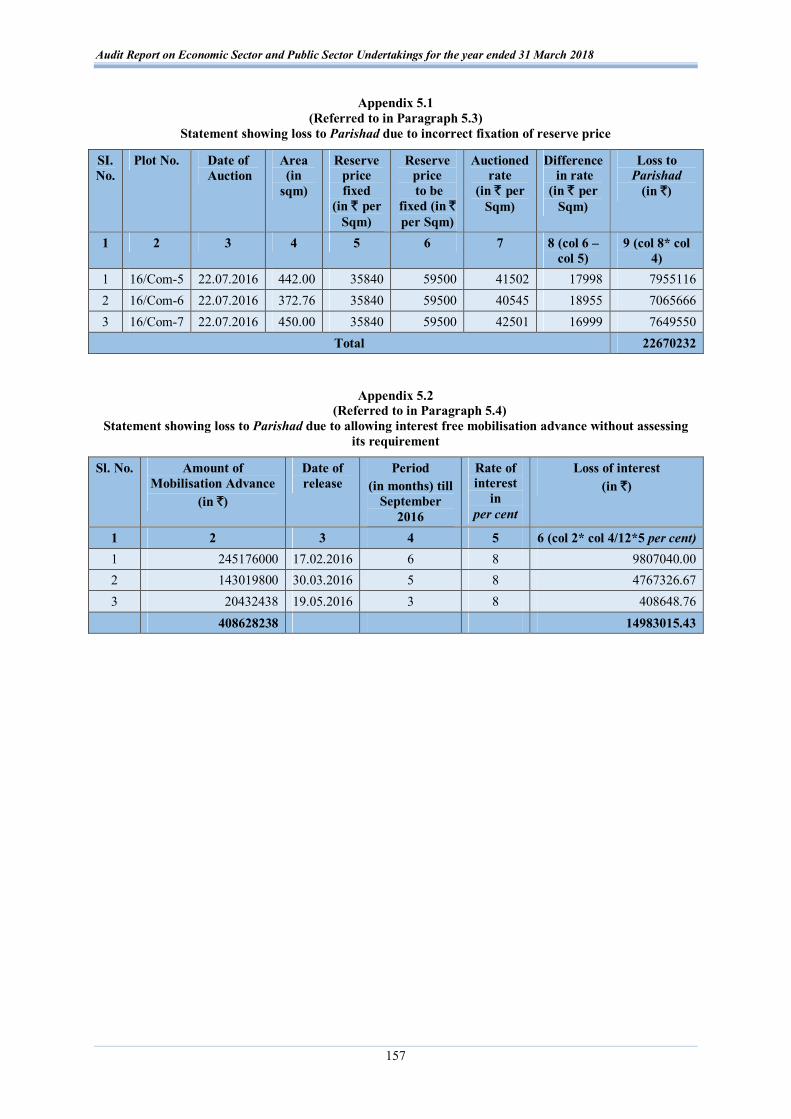
Audit Report on Economic Sector and Public Sector Undertakings for the year ended 31 March 2018
157
Appendix 5.1 (Referred to in Paragraph 5.3)
Statement showing loss to Parishad due to incorrect fixation of reserve price
SI. No.
Plot No. Date of Auction
Area (in
sqm)
Reserve price fixed
(in ` per Sqm)
Reserve price to be
fixed (in ` per Sqm)
Auctioned rate
(in ` per Sqm)
Difference in rate
(in ` per Sqm)
Loss to Parishad
(in `)
1 2 3 4 5 6 7 8 (col 6 –col 5)
9 (col 8* col 4)
1 16/Com-5 22.07.2016 442.00 35840 59500 41502 17998 7955116 2 16/Com-6 22.07.2016 372.76 35840 59500 40545 18955 7065666 3 16/Com-7 22.07.2016 450.00 35840 59500 42501 16999 7649550
Total 22670232
Appendix 5.2
(Referred to in Paragraph 5.4) Statement showing loss to Parishad due to allowing interest free mobilisation advance without assessing
its requirement
Sl. No. Amount of Mobilisation Advance
(in `)
Date of release
Period (in months) till
September 2016
Rate of interest
in per cent
Loss of interest (in `)
1 2 3 4 5 6 (col 2* col 4/12*5 per cent) 1 245176000 17.02.2016 6 8 9807040.00 2 143019800 30.03.2016 5 8 4767326.67 3 20432438 19.05.2016 3 8 408648.76
408628238 14983015.43

Audit Report on Economic Sector and Public Sector Undertakings for the year ended 31 March 2018
158
Appendix 5.3 (Referred to in Paragraph 5.7)
Statement showing detail of excess payment made on execution of extra items
Particulars Qty. executed
(Sqm)
Rate paid
(` per Sqm)
Amount paid (in `)
Rate to be paid (` per Sqm)
Amount to be paid (in `)
Excess payment
(in `)
Remarks
1 2 3 4 (col.2*col.3)
5 6 (col.2*col 5)
7 (col 4-col 6)
8
Close timbering in 0 to 3.0 m depth
68661.054 482 33094628 170 11672379 21422249 As per the contract, the rate for close timbering in 3.0 to 6.0 m depth was ` 170 per sqm, hence, the rate for close timbering in 0 to 3.0 m depth cannot be in excess of that payable for 3.0 to 6.0 m depth.
Close timbering in 3 to 6.0 m depth left in trench with used timbering
1934.774 1981 3832787 910 1760644 2072143 As per the contract, the rate for close timbering in depth >6 m was ` 910 per sqm, hence, the rate for close timbering in 3.0 to 6.0 m depth cannot be in excess of that payable for depth >6 m.
Close timbering in 0 to 3.0 m depth left in trench with used timbering
2626.651 1206 3167741 910 2390252 777489 As per the contract, the rate for close timbering in depth >6 m was ` 910 per sqm, hence, the rate for close timbering in 0 to 3.0 m depth cannot be in excess of that payable for depth >6 m.
Total 40095156 15823275 24271881 Less: Rate of Contractor after discount of 0.20 per cent 48544 Net excess payment 24223337

Appendices
159
Appendix 5.4 (Referred to in Paragraph 5.7)
Statement showing detail of excess payment made on account of new timber as an extra item
Particulars Qty. executed
(Sqm)
Rate paid
(` per Sqm)
Amount paid (in `)
Rate to be paid (` per Sqm)
Amount to be paid (in `)
Excess payment
(in `)
Remarks
1 2 3 4 (col.2*col. 3)
5 6 (col 2*col 5)
7 (col.4-col.6)
8
Close timbering in 0 to 3.0 m depth left in trench with unused timber
5308.799 2975 15793677 910 4831007 10962670 As per the contract, the rate for close timbering in depth >6 m left in trench was ` 910 per sqm, hence, the rate for close timbering in 0 to 3.0 m depth cannot be in excess of that payable for depth >6 m.
Close timbering in 3 to 6.0 m depth left in trench with unused timber
1939.411 3690 7156427 910 1764864 5391563 As per the contract, the rate for close timbering in depth >6 m left in trench was ` 910 per sqm, hence, the rate for close timbering in 3.0 to 6.0 m depth cannot be in excess of that payable for depth >6 m.
Total 22950104 6595871 16354233 Less: Rate of Contractor after discount of 0.20 per cent 32708 Net excess payment 16321525

Audit Report on Economic Sector and Public Sector Undertakings for the year ended 31 March 2018
160
Appendix-7.1 (Referred to in Paragraph 7.1.1)
Statement showing loss due to not levy of land use conversion charges from Hi-tech Township developers
A. Uppal Chaddha Hi-tech Township Developers Private limited Sl. No.
Name of village Area (in acres)
Effective DM circle rate from August 2010 to 27 September 2011
and during 2013 (` per acre)
Factor14 (0.65*0.50)
= 0.325
Total Land use conversion charges
(in `)
1 2 3 4 5 6 (Col.3*Col.4*Col.5)
(i) As per layout dated 19.10.2010 1 Mehrauli 202.978 10000000 0.325 659678500 2 Sadiqpur Kajipur 154.716 4000000 0.325 201130800 3 Naiphal 367.779 4000000 0.325 478112700 4 Kacherabarshabad 13.363 3238866 0.325 14066314 5 Duryai 401.283 3441296 0.325 448803414 6 Dasna 17.455 10000000 0.325 56728750 7 Bayana 343.889 2500000 0.325 279409813 8 Shahpur Bamheta 142.545 8000000 0.325 370617000
Total 1644.008 2508547291 (ii) As per layout dated 27.09.2011
1 Mehrauli 3.687 10000000 0.325 11982750 2 Kacherabarshabad 476.835 3238866 0.325 501931518 3 Duryai 353.393 3441296 0.325 395242223 4 Dujana 280.502 3238866 0.325 295265227 5 Talabpur Hathipur 87.164 3441296 0.325 97486065 6 Girdharpur Sunarshi 66.106 3441296 0.325 73934352
Total 1267.687 1375842135 (iii) As per layout dated 07.10.2013
1 Shadat Nagar Ekla 7.083 7085020 0.325 16309539 2 Kacherabarshabad 37.16 5263158 0.325 63563159 3 Dujana 14.3 5263158 0.325 24460527 4 Talabpur Hathipur 14.79 5060729 0.325 24325659
Total 73.333 128658884 Total-A {(i)+(ii)+(iii)} 2985.028 4013048310
14 Net Area {Total area – (Green belt+Roads)} x factor for conversion of agricultural land to residential land i.e. 50 per cent.
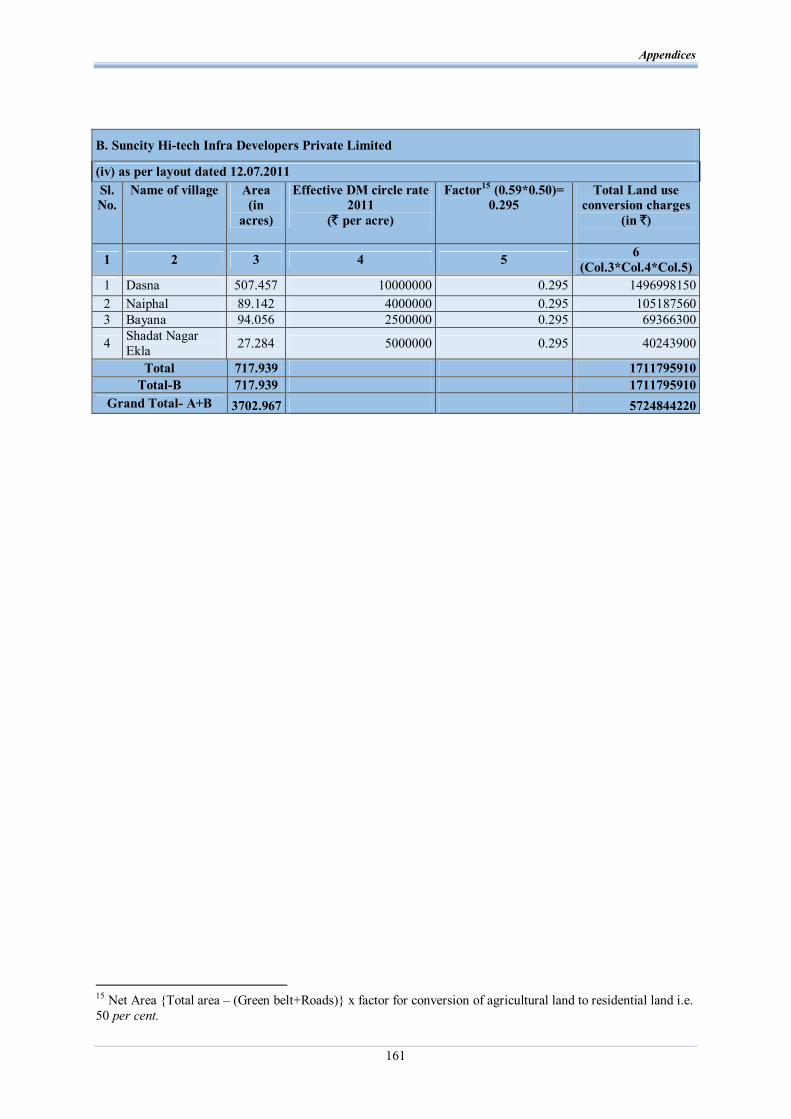
Appendices
161
B. Suncity Hi-tech Infra Developers Private Limited
(iv) as per layout dated 12.07.2011 Sl. No.
Name of village Area (in
acres)
Effective DM circle rate 2011
(` per acre)
Factor15 (0.59*0.50)= 0.295
Total Land use conversion charges
(in `)
1 2 3 4 5 6 (Col.3*Col.4*Col.5)
1 Dasna 507.457 10000000 0.295 1496998150 2 Naiphal 89.142 4000000 0.295 105187560 3 Bayana 94.056 2500000 0.295 69366300
4 Shadat Nagar Ekla 27.284 5000000 0.295 40243900
Total 717.939 1711795910 Total-B 717.939 1711795910
Grand Total- A+B 3702.967 5724844220
15 Net Area {Total area – (Green belt+Roads)} x factor for conversion of agricultural land to residential land i.e. 50 per cent.

Audit Report on Economic Sector and Public Sector Undertakings for the year ended 31 March 2018
162
Appendix-7.2 (Referred to in paragraph 7.1.2)
Statement showing non-levying of additional land use conversion charges on Uppal Chaddha Hi-tech Township Developers Private limited
Sl. No.
Name of Village
Area (in
acre)
Area (in
hectare)
DM circle rate of land at
the time of approval of DPR in July
2011 (` in lakh per
hectare)
Land use conversion charges as
calculated by Authority at the time of approval of DPR in July
201116 (` in lakh)
Effective DM circle rate of land at the
time of approval of revised DPR in October
2013 (` in lakh per
hectare)
Additional Land use
conversion charges to be levied by the Authority at the time of approval of revised DPR in October
201317 (` in lakh)
1 2 3 4 5 6 7 8 1 Dujana 530.70 214.77 80.00 5379.56 130.00 335.04 2 Kachera
Barshabad 222.17 89.91 80.00 2252.07 130.00 140.26
3 Talabpur Hathipur
13.26 5.37 85.00 142.91 125.00 8.06
4 Talabpur Hathipur
63.62 25.75 85.00 685.30 125.00 38.63
5 Sadatnagar Ekla
189.47 76.68 123.55 2966.25 175.00 161.03
Total 1019.22 412.48 11426.09 683.02
16 As per DPR dated 12.07.2011(Area x 0.6262 x 0.5 x Rate) 17 As per revised DPR on difference of factor {Area x 0.024 (0.6502-0.6262) x 0.5 x Rate}

Appendices
163
Appendix-7.3 (Referred to in paragraph 7.1.3)
Statement showing non-revision and recovery of CDC from Uppal Chaddha Hi-tech Township Developers Private Limited
(` in lakh)
Sl. No. Date of approval of
layout
Total area of approved
layout
Incremental area of
layout above 1500 acre18
(in acre)
Area for CDC
charges19 (in acre)
Cost index applicable
Rate of CDC per
acre20
Rate of CDC per acre to be
recovered21
Amount of Short levy
on account of CDC charges
1 2 3 4 5=4*0.65024 6 7 8 9=(8*4) 1 19.10.2010 1671.08 171.08 111.24 136 3.58 0.58 64.52 2 21.10.2011 2911.70 1240.62 806.70 151 3.97 0.97 782.50 3 20.09.2013 4004.25 1092.55 710.42 170 4.47 1.47 1044.32
Total 1628.36 1891.34
18 Original approved area of the Developer was 1500 acre. In April 2010, GoUP decided not to levy CDC on
the original approved area of the developers, who were selected under the Policy, 2003 and executed Memorandum of Undertakings in 2005.
19 After deducting green and road area factor as per GoUP Order of April 2010 20 Considering cost index on 114 (in August 2008) for ` 3.00 lakh. 21 After deducting CDC already recovered at the rate of ` 3.00 lakh per acre.
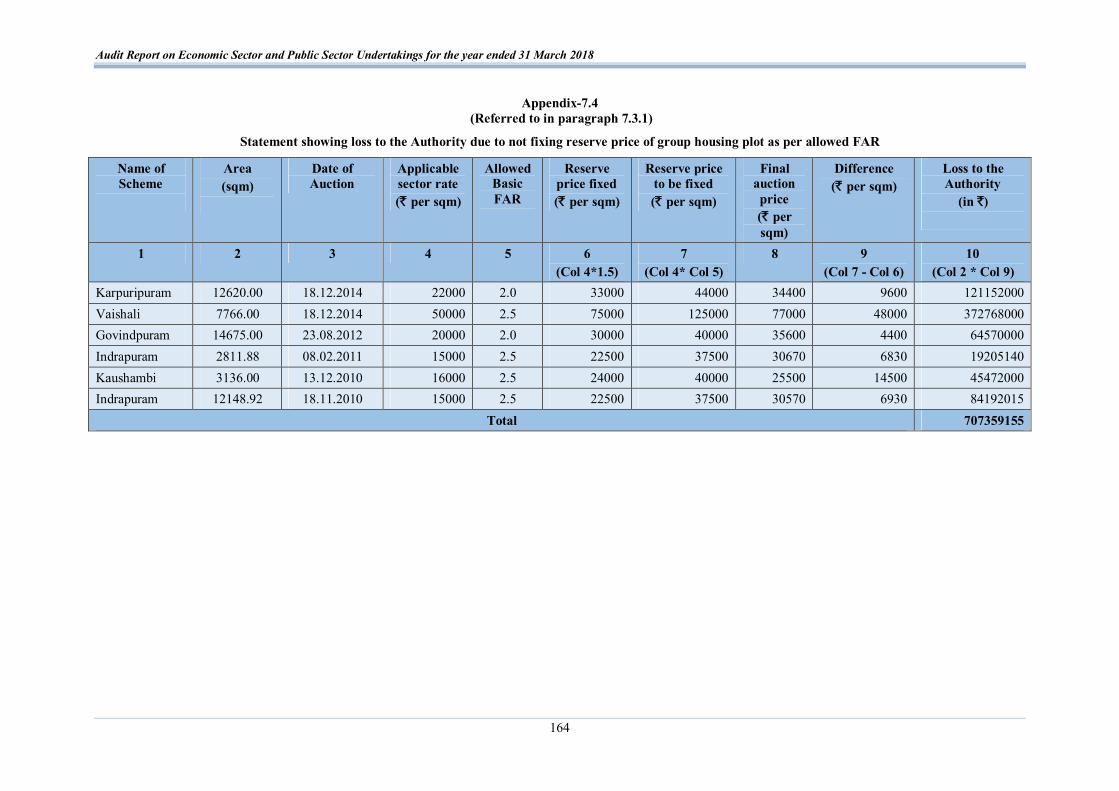
Audit Report on Economic Sector and Public Sector Undertakings for the year ended 31 March 2018
164
Appendix-7.4 (Referred to in paragraph 7.3.1)
Statement showing loss to the Authority due to not fixing reserve price of group housing plot as per allowed FAR
Name of Scheme
Area (sqm)
Date of Auction
Applicable sector rate (` per sqm)
Allowed Basic FAR
Reserve price fixed (` per sqm)
Reserve price to be fixed (` per sqm)
Final auction price (` per sqm)
Difference (` per sqm)
Loss to the Authority
(in `)
1 2 3 4 5 6 (Col 4*1.5)
7 (Col 4* Col 5)
8 9 (Col 7 - Col 6)
10 (Col 2 * Col 9)
Karpuripuram 12620.00 18.12.2014 22000 2.0 33000 44000 34400 9600 121152000 Vaishali 7766.00 18.12.2014 50000 2.5 75000 125000 77000 48000 372768000 Govindpuram 14675.00 23.08.2012 20000 2.0 30000 40000 35600 4400 64570000 Indrapuram 2811.88 08.02.2011 15000 2.5 22500 37500 30670 6830 19205140 Kaushambi 3136.00 13.12.2010 16000 2.5 24000 40000 25500 14500 45472000 Indrapuram 12148.92 18.11.2010 15000 2.5 22500 37500 30570 6930 84192015
Total 707359155

Appendices
165
Appendix-7.5 (Referred to in paragraph 7.3.2)
Statement showing loss due to non-inclusion of corner charges in the reserve price of auction of corner assets
Sl. No.
Name of the Scheme
Plot No. Date of Auction
Area (in sqm)
Reserve price (` per sqm)
Reserve Price to be fixed (including
corner charges at the rate of 10 per cent) (` per sqm)
Actual auctioned price
(` per sqm)
Difference of reserve price to
be fixed and actual auctioned
price (` per sqm)
Loss due to not levy of corner charges
(in `)
1 2 3 4 5 6 7 (Col.6*1.10)
8 9 (Col.7-Col.8)
10 (Col.9*Col.5)
1 Vaishali GH-18A 18.12.14 7766.00 75000.00 82500.00 77000.00 5500.00 42713000 2 Karpuripuram ML-1 18.12.14 12620.00 33000.00 36300.00 34400.00 1900.00 23978000 3 Tulasi Niketan* - 17.08.13 1252.05 11000.00 12100.00 11500.00 600.00 751230 4 Nehru Vikas Minar
at GT Road^ - 12.07.06 45936.00 14000.00 15400.00 14530.00 870.00 39964320
Total 107406550
*As per the sale brochure 1331.33 sqm area was available for auction at Tulasi Nikatan Scheme where as in actual measurement, 1252.05 sqm was measured. ^As per the sale brochure Nehru Vikas Minar Commercial Complex situated on GT road was available for auction. However, as per the Costing Guidelines corner charges
was calculated only on the approx plot area i.e. 45936.00 sqm.

Audit Report on Economic Sector and Public Sector Undertakings for the year ended 31 March 2018
166
Appendix-7.6 {Referred to in Paragraph 7.3.3(i)}
Statement showing loss due to non-levy and non-recovery of Infrastructure Surcharge
Sl. No.
Name of the Scheme
Plot No. Date of Auction Area (in sqm)
Final auction rate
(` per sqm)
Value of plot (in `)
Amount of Infrastructure surcharge at the rate of 10 per cent of plot value (in `)
1 2 3 4 5 6 7 (Col.5*Col.6)
8 (Col.7*10 per cent)
(A) Plots Auctioned after Board decision (October 2014) to June 2018 1 Pratap Vihar P Block Convenient Shopping
Plot 22.10.2016 3212.22 38500 123670470 12367047
2 Indirapuram School Plot Shakti Khand-4 11.08.2016 5269 50500 266084500 26608450 3 Vaishali GH-1 (18A) 18.12.2014 7768 77000 598136000 59813600 4 Koyal Enclave GH-7A 18.12.2014 6400 28551 182726400 18272640 5 Karpuripuram ML-01 18.12.2014 12620 34400 434128000 43412800 6 Koyal Enclave GH-3A 22.11.2014 5250 28525 149756250 14975625
Total (A) 1754501620 175450162 (B) Plots Auctioned before Board decision (October 2014)
7 Indraprashth D Block
4 23.08.2012 4500 18000 81000000 8100000
8 Govindpuram CP 1/A 23.08.2012 14675 35600 522430000 52243000 9 Govindpuram CP 1/B 23.08.2012 5273.22 42000 221475240 22147524
10 Indirapuram Vistar GH-2 24.12.2011 17507.095 40050 701159155 70115915 11 Indirapuram Vistar GH-3 23.12.2011 16350 40050 654817500 65481750 12 Vaishali RC-1/2 20.10.2011 24462 40300 985818600 98581860 13 Indirapuram Vistar GH-1 25.05.2011 7607 30750 233915250 23391525 14 Kaushambi GH plot near Neelam
Cooperative Awas Samiti 20.12.2010 3136 25500 79968000 7996800
15 Kaushambi Commercial Plot no1 29.06.2010 598.71 104250 62415518 6241551 16 G.T Road Nehru Vikas Minar 12.07.2006 45936 14529.77 667439515 66743951
Total (B) 4210438777 421043876 Grand Total (A)+(B) 180564.245 5964940397 596494038
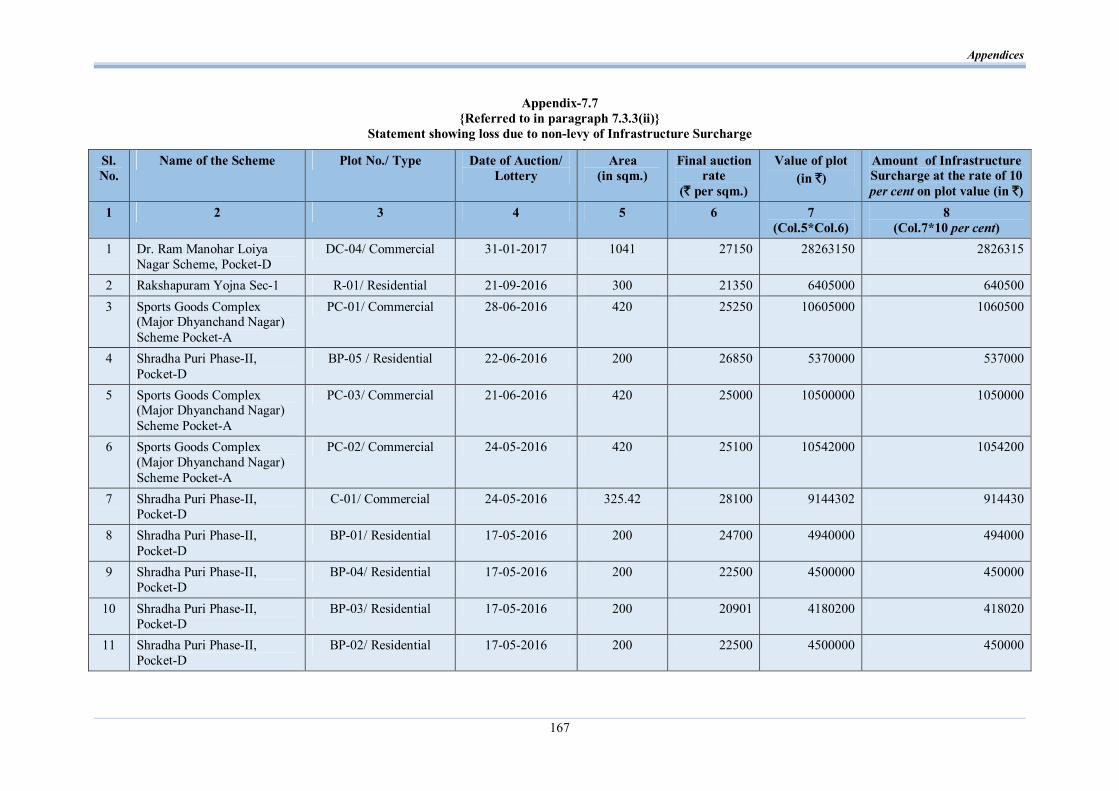
Appendices
167
Appendix-7.7 {Referred to in paragraph 7.3.3(ii)}
Statement showing loss due to non-levy of Infrastructure Surcharge
Sl. No.
Name of the Scheme Plot No./ Type Date of Auction/ Lottery
Area (in sqm.)
Final auction rate
(` per sqm.)
Value of plot (in `)
Amount of Infrastructure Surcharge at the rate of 10 per cent on plot value (in `)
1 2 3 4 5 6 7 (Col.5*Col.6)
8 (Col.7*10 per cent)
1 Dr. Ram Manohar Loiya Nagar Scheme, Pocket-D
DC-04/ Commercial 31-01-2017 1041 27150 28263150 2826315
2 Rakshapuram Yojna Sec-1 R-01/ Residential 21-09-2016 300 21350 6405000 640500 3 Sports Goods Complex
(Major Dhyanchand Nagar) Scheme Pocket-A
PC-01/ Commercial 28-06-2016 420 25250 10605000 1060500
4 Shradha Puri Phase-II, Pocket-D
BP-05 / Residential 22-06-2016 200 26850 5370000 537000
5 Sports Goods Complex (Major Dhyanchand Nagar) Scheme Pocket-A
PC-03/ Commercial 21-06-2016 420 25000 10500000 1050000
6 Sports Goods Complex (Major Dhyanchand Nagar) Scheme Pocket-A
PC-02/ Commercial 24-05-2016 420 25100 10542000 1054200
7 Shradha Puri Phase-II, Pocket-D
C-01/ Commercial 24-05-2016 325.42 28100 9144302 914430
8 Shradha Puri Phase-II, Pocket-D
BP-01/ Residential 17-05-2016 200 24700 4940000 494000
9 Shradha Puri Phase-II, Pocket-D
BP-04/ Residential 17-05-2016 200 22500 4500000 450000
10 Shradha Puri Phase-II, Pocket-D
BP-03/ Residential 17-05-2016 200 20901 4180200 418020
11 Shradha Puri Phase-II, Pocket-D
BP-02/ Residential 17-05-2016 200 22500 4500000 450000

Audit Report on Economic Sector and Public Sector Undertakings for the year ended 31 March 2018
168
Sl. No.
Name of the Scheme Plot No./ Type Date of Auction/ Lottery
Area (in sqm.)
Final auction rate
(` per sqm.)
Value of plot (in `)
Amount of Infrastructure Surcharge at the rate of 10 per cent on plot value (in `)
1 2 3 4 5 6 7 (Col.5*Col.6)
8 (Col.7*10 per cent)
12 Shradha Puri Phase-II, Pocket-D
BP-06/ Residential 17-05-2016 200 27200 5440000 544000
13 Shradha Puri Phase-II, Pocket-D
BP-07/ Residential 17-05-2016 200 28600 5720000 572000
14 Shradha Puri Phase-II, Pocket-D
C-02/ Commercial 16-05-2016 405 28200 11421000 1142100
15 Sports Goods Complex (Major Dhyanchand Nagar) Scheme Pocket-A
PC-04/ Commercial 16-05-2016 420 25100 10542000 1054200
16 Dr. Ram Manohar Loiya Nagar Scheme, Pocket-E
ES-25/ Commercial 26-04-2016 253.88 23900 6067732 606773
17 Pallavpuram scheme Pocket-J C-24/ Commercial 09-06-2015 200 23250 4650000 465000 Total 5611.30 142790384 14279038

Appendices
169
Appendix-7.8 {Referred to in paragraph 7.3.3(iii)}
Statement showing non-levy of Infrastructure Surcharge on sale of Commercial Plots
Sl. No. Plot No. and Name of the Scheme Date of Auction Area of Plot (Sq. Meter)
Rate of Auction (per Sq. Meter)
Value of Plot (in `)
Amount of Infrastructure
Surcharge @10 per cent to be
levied (in `)
1 2 3 4 5 6 (Col.4*Col.5)
7 (Col.6*10 per cent)
1 CP-2, Vastu Khand, Gomati Nagar Scheme 04.05.2016 1010.00 48000.00 48480000.00 4848000.00
2 1/41, Vardan Khand, Gomati Nagar Extn. Scheme 04.05.2016 1490.00 50000.00 74500000.00 7450000.00
3 4/17, Basant Khand, Gomti Nagar Extn. Scheme 04.05.2016 5103.84 47142.00 240605225.28 24060522.53
4 C.P. -228, Viraj Khand, Gomati Nagar Scheme 20.07.2016 447.90 60700.00 27187530.00 2718753.00
5 CP-47-A, Sitapur, Road Scheme 20.07.2016 600.00 40000.00 24000000.00 2400000.00
6 CP-225, Viraj Khand, Gomati Nagar Scheme 20.07.2016 447.90 51895.00 23243770.50 2324377.05
7 CP-16, Sec. D-1, Kanpur Road Scheme 20.07.2016 478.50 30000.00 14355000.00 1435500.00
8 K.V.C.-30, Kanpur Road Scheme 06.10.2016 726.00 31500.00 22869000.00 2286900.00
9 C-7, Kanpur Road Scheme 06.10.2016 864.00 36005.00 31108320.00 3110832.00
10 TC-49-V-XVII, Vibhuti Khand, Gomati Nagar Scheme 06.10.2016 1159.00 80250.00 93009750.00 9300975.00
11 4/31-C, Basant Khand Sec-4, Gomati Nagar Extn. Scheme 09.01.2018 2326.50 41200.00 95851800.00 9585180.00
12 CP-222, Viraj Khand, Gomti Nagar Scheme 09.01.2018 447.90 54000.00 24186600.00 2418660.00
13 4/4, Basant Khand, Gomti Nagar Extn Scheme 11.04.2018 4843.04 46188.94 223694907.00 22369490.70
Total 943091902.78 94309190.28
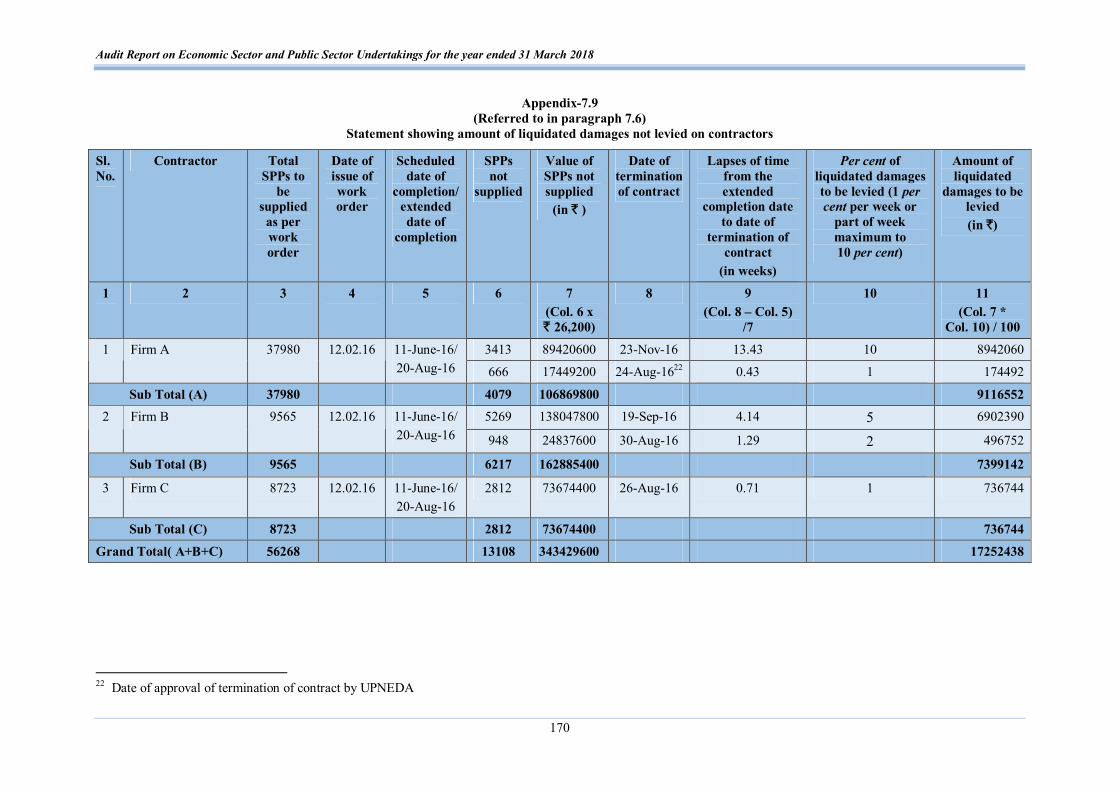
Audit Report on Economic Sector and Public Sector Undertakings for the year ended 31 March 2018
170
Appendix-7.9 (Referred to in paragraph 7.6)
Statement showing amount of liquidated damages not levied on contractors
Sl. No.
Contractor Total SPPs to
be supplied as per work order
Date of issue of work order
Scheduled date of
completion/ extended date of
completion
SPPs not
supplied
Value of SPPs not supplied
(in ` )
Date of termination of contract
Lapses of time from the extended
completion date to date of
termination of contract
(in weeks)
Per cent of liquidated damages to be levied (1 per cent per week or
part of week maximum to 10 per cent)
Amount of liquidated
damages to be levied (in `)
1 2 3 4 5 6 7 (Col. 6 x ` 26,200)
8 9 (Col. 8 – Col. 5)
/7
10 11 (Col. 7 *
Col. 10) / 100
3413 89420600 23-Nov-16 13.43 10 8942060 1 Firm A 37980 12.02.16 11-June-16/ 20-Aug-16 666 17449200 24-Aug-1622 0.43 1 174492
Sub Total (A) 37980 4079 106869800 9116552 5269 138047800 19-Sep-16 4.14 5 6902390 2 Firm B 9565 12.02.16 11-June-16/
20-Aug-16 948 24837600 30-Aug-16 1.29 2 496752
Sub Total (B) 9565 6217 162885400 7399142
3 Firm C 8723 12.02.16 11-June-16/ 20-Aug-16
2812 73674400 26-Aug-16 0.71 1 736744
Sub Total (C) 8723 2812 73674400 736744
Grand Total( A+B+C) 56268 13108 343429600 17252438
22 Date of approval of termination of contract by UPNEDA