Revenue Sector, Government of Uttar Pradesh - CAG
146
-
Upload
khangminh22 -
Category
Documents
-
view
0 -
download
0
Transcript of Revenue Sector, Government of Uttar Pradesh - CAG


Report of the Comptroller and Auditor General of India
on
Revenue Sector
for the year ended 31 March 2018
Government of Uttar Pradesh Report No. 4 of the year 2019


i
TABLE OF CONTENTS
Reference to Particulars
Paragraph(s) Page(s) Preface iii Overview v
CHAPTER-I: GENERAL Introduction 1.1 1 Trend of receipts 1.2 1 Analysis of arrears of revenue 1.3 5 Follow up on the Audit Reports-summarised position
1.4 6
Response of the Government/Departments towards Audit
1.5 7
Results of audit 1.6 8 Coverage of this Report 1.7 9
CHAPTER-II: STATE EXCISE Tax administration 2.1 11 Results of audit 2.2 12 Failure to cancel the settlement of shops and forfeiture of basic license fee/license fee and security deposit
2.3 13
Sale of Beer without Beer bar license 2.4 14 Short levy of license fee on model shops 2.5 15
CHAPTER-III: TAX ON SALES, TRADE, ETC. Tax administration 3.1 17 Results of audit 3.2 17 Application of incorrect rate of tax 3.3 19 Central Sales Tax (CST) 3.4 25 Irregularities relating to Input Tax Credit (ITC)
3.5 28
Interest short/not charged 3.6 36 Penalties not imposed 3.7 37 Non-forfeiture of amount wrongly realised by the dealers as tax
3.8 42
Preparedness for transition to Goods and Services Tax
3.9 43

Audit Report (Revenue Sector) for the year ended 31 March 2018
ii
CHAPTER-IV: OTHER TAX RECEIPTS
(A) TAXES ON VEHICLES, GOODS AND PASSENGERS
Tax administration 4.1 59
Results of audit 4.2 60
Penalty not imposed on overloaded goods vehicles under the Carriage by Road Act
4.3 61
Additional tax on JnNURM buses not levied 4.4 63
(B) STAMPS AND REGISTRATION FEES
Tax administration 4.5 65
Results of audit 4.6 65
Compliance with Acts/Rules 4.7 66
Residential land valued at agricultural rate 4.8 67
CHAPTER-V: MINING RECEIPTS
Tax administration 5.1 69
Results of audit 5.2 69
Cost of minerals not realised from contractors for works executed without transit passes
5.3 71
Unauthorised extraction of minerals 5.4 72
Royalty and permit application fees not realised from the brick kiln owners
5.5 75
Non/Short deposit of dead rent 5.6 76
Appendices 79-128

iii
PREFACE
This Report of the Comptroller and Auditor General of India for the year ended March 2018 has been prepared for submission to the Governor of Uttar Pradesh under Article 151 of the Constitution of India. The Report contains significant findings of audit of Receipts and Expenditure of major Revenue earning Departments under the Revenue Sector conducted under the Comptroller and Auditor General’s (Duties, Powers and Conditions of Service) Act, 1971. The instances mentioned in this Report are those, which came to notice in the course of test audit for the period 2017-18 as well as those which came to notice in earlier years, but could not be reported in the previous Audit Reports, instances relating to the period subsequent to 2017-18 have also been included, wherever necessary.
The Audit has been conducted in conformity with the Auditing Standards issued by the Comptroller and Auditor General of India.


v
OVERVIEW
This Report contains 17 paragraphs relating to State Excise, Tax on Sales, Trade, etc., Taxes on Vehicles, Goods and Passenger, Stamp and Registration Fees and Mining Receipts including one paragraph on “Preparedness for transition to Goods and Services Tax”. The total financial implication of the Audit findings is ` 195.88 crore of this the concerned Department accepted audit observations amounting to ` 140.34 crore. Some of the major findings are mentioned below:
Chapter-I: General
Total receipts of the Government of Uttar Pradesh for the year 2017-18 were ` 2,78,775.45 crore, of which, ` 1,17,187.86 crore (42.04 per cent) constituted the State’s own receipts. Government of India contributed ` 1,61,587.59 crore (57.96 per cent), comprising State’s share of divisible Union taxes of ` 1,20,939.14 crore (43.38 per cent of total receipts) and grants-in-aid of ` 40,648.45 crore (14.58 per cent of total receipts). The State’s own tax revenues and the State’s share in central taxes increased from 2013-14 to 2017-18.
Wide variations between the budget estimates approved by the Finance Department and the actual revenues were noticed in Audit. The reasons for such wide variations could not be assessed as the Finance Department did not produce the budget files to Audit despite requests at that point of time.
(Paragraph 1.2)
The arrears of revenue as on 31 March 2018 on Tax on Sales, Trade, etc., Stamps and Registration Fees, Taxes on Vehicles, Goods and Passengers, State Excise, Entertainment Tax and Mining Receipts amounted to ` 22,564.66 crore, of which ` 10,581.96 crore was outstanding for more than five years.
Audit recommends that the Departments should create a centralised database of outstanding arrears and introduce a mechanism to monitor the progress of arrears on a periodic basis. The reasons for accumulation of arrears should also be analysed and mechanisms/procedures developed to prevent any further accumulation of arrears.
(Paragraph 1.3)
Chapter-II: State Excise
The Department failed to act on the recommendation made by the Public Accounts Committee for timely deposit of Basic License Fee and License Fee on settlement of shops. The Department did not initiate any action for cancellation of settlement, and forfeiture of basic license fee/license fee (` 28.35 crore) and security (` 30.50 crore) totalling to ` 58.85 crore, in contravention to the rules.
Audit recommends that the Department should ensure adherence to the provisions of the Act/Rules and the recommendation made by the Public

Audit Report (Revenue Sector) for the year ended 31 March 2018
vi
Accounts Committee, to safeguard the financial interests of the State. The Department should adopt a transparent bidding system and devise a mechanism to settle licenses of liquor shops in case the highest bidder fails to comply with allotment conditions.
(Paragraph 2.3)
Non-issue of Beer bar license for retail sale of bottled Beer led to loss of revenue of ` 2.36 crore in respect of 119 licensees.
(Paragraph 2.4)
The license fee of model shops was not fixed as per the norms prescribed in the Excise Policy resulting in short levy of license fee of ` 1.36 crore.
(Paragraph 2.5)
Chapter-III: Tax on Sales, Trade etc.
Assessing Authorities accepted the tax rates on sale of goods worth ` 148.62 crore as mentioned by the dealers in tax returns without verifying the rates applicable on such goods as per the schedules. Thus, tax amounting to ` 12.36 crore was short/not levied.
Audit recommends that the Commercial Tax Department should consider instituting enquiry from vigilance angle in cases where typographic errors have been stated as reasons for application of incorrect rate of tax.
(Paragraphs 3.3)
Assessing Authorities allowed the irregular exemption of ` 2.80 crore on stock transfer of ` 55.97 crore as the dealer failed to submit the required declaration Form ‘F’ along with the proof of dispatch.
Audit recommends that the Commercial Tax Department should carefully examine all such cases where such exemptions are being allowed by the Assessing Authorities.
(Paragraphs 3.4.1)
The dealers had purchased goods valued at ` 6.81 crore which were not covered under the Registration Certificate at concessional rates of tax against the declaration in form ‘C’. This fact was not scrutinised at the time of assessment and a penalty of ` 1.05 crore was not imposed.
Audit recommends that the Commercial Tax Department may ensure that while assessment orders are being passed, the Registration Certificates and utilization certificates, where such concession are being considered by the Assessing Authorities, should be carefully examined.
(Paragraphs 3.4.2)

Overview
vii
The dealers had wrongly claimed Input Tax Credit amounting to ` 64.88 lakh which was irregularly allowed by the Assessing Authorities. This resulted in non-reversal of Input Tax Credit alongwith interest totalling ` 1.01 crore.
Audit recommends that the Commercial Tax Department should carefully examine and verify the transections where Input Tax Credit are being claimed by the dealers and benefit of Input Tax Credit are being allowed by the Assessing Authorities.
(Paragraphs 3.5.1)
The Assessing Authorities had not reversed the Input Tax Credit alongwith interest of ` 1.40 crore claimed by the dealers in respect of those goods which were sold by the dealers at a price lower than the purchase price.
Audit recommends that the Commercial Tax Department should carefully examine and verify the cases where Input Tax Credit are being claimed by the dealer.
(Paragraphs 3.5.2)
The Assessing Authorities had not reversed the Input Tax Credit alongwith interest of ` 2.20 crore claimed by the dealers in respect of goods which were taxable at lower rates than that claimed by the dealers.
Audit recommends that the Commercial Tax Department should ensure periodic and randomised reviews of all Input Tax Credit claims to ensure that Input Tax Credit is being claimed as per prescribed rates.
(Paragraphs 3.5.3)
On cross verification undertaken by the Department, Input Tax Credit amounting to ` 1.94 crore claimed by the dealers was found false. Though it was reversed by the Assessing Authorities, penalty amounting to ` 9.71 crore was not imposed against the defaulters.
Audit recommends that the Commercial Tax Department should carefully examine and verify the cases where Input Tax Credit is being claimed falsely or fraudulently by the dealer.
(Paragraphs 3.5.4)
The dealers had deposited the admitted tax of ` 5.56 crore with delay, on which interest was chargeable. However, the same was not charged at the time of assessment resulting in non-levy of interest amounting to ` 2.56 crore.
Audit recommends that the Commercial Tax Department should carefully calculate the interest amount in cases where there is delay in payment of due taxes by the dealers.
(Paragraphs 3.6)

Audit Report (Revenue Sector) for the year ended 31 March 2018
viii
The Assessing Authorities did not impose penalty amounting to ` 3.66 crore on concealed turnover amounting to ` 20.44 crore.
Audit recommends that the Commercial Tax Department should carefully examine all the cases where concealment of turnover by the dealers is detected and ensure that due penalty is imposed for ensuring tax compliance.
(Paragraphs 3.7.1)
The Assessing Authorities, while finalising the assessments, did not impose penalty amounting to ` 3.06 crore and an interest of ` 55.30 lakh on delayed deposit of admitted tax amounting to ` 15.31 crore.
Audit recommends that the Commercial Tax Department should carefully examine the cases where admitted tax is not being deposited within the prescribed time limit and without due interest.
(Paragraph 3.7.2)
The Assessing Authorities had not imposed penalty amounting to ` 26.80 crore alongwith interest of ` 14.26 lakh on dealers for not depositing the tax deducted at source (TDS) amounting to ` 13.40 crore within the prescribed time.
Audit recommends that the Commercial Tax Department should ensure timely deposit of TDS by the dealers/contractors.
(Paragraphs 3.7.3)
The dealers had collected tax of ` 4.61 crore in excess of their tax liability. However, the Assessing Authorities did not forfeit this amount wrongly realised by the dealers.
Audit recommends that the Commercial Tax Department should carefully examine the cases where the dealers have wrongly realised an amount as tax from other dealers in contravention of the provisions of the Act.
(Paragraph 3.8)
Preparedness for transition to Goods and Services Tax
The State Commercial Taxes Department did not provide Audit with either access to the Goods and Services Tax Network (GSTN) or to any data dump related to the Goods and Services Tax (GST) data in its possession despite persistent persuasion. The Department stated that the issue of data sharing protocol with the Comptroller and Auditor General of India has been referred to GST Council. Until the matter is decided, it will be proper, to wait for access to GSTN and data dump. As GST data was not shared, we were unable to audit and therefore, findings on “Preparedness for transition to Goods and Services Tax” is derived largely from the information provided to Audit with respect to its queries and requisitions, but without any independent verification vis-à-vis actual databases or documents.
(Paragraph 3.9.4 and 3.9.5)

Overview
ix
Chapter-IV: Other Tax Receipts
The Transport Department failed to stop unsafe vehicles from plying on roads and also did not impose penalty amounting to ` 2.16 crore under the Carriage by Road (CBR) Act on 913 goods vehicles which were seized for overloading.
Audit recommends that the Transport Department may register vehicles carrying minor minerals under the definition of common carrier of the Carriage By Road Act, 2007 to stop such overloaded vehicles carrying minor minerals.
Audit recommends that the Geology and Mining Department may in consultation with the Transport Department work out an online system for detecting the overloaded vehicles running on road based on the MM 11 operated by the Transport Department.
(Paragraph 4.3)
Additional tax of ` 2.61 crore was not levied on 393 JnNURM buses plying outside the designated municipal areas.
(Paragraph 4.4)
Residential land measuring 5.09 lakh square meter was wrongly registered for ` 58.56 crore at agricultural rates. Correct valuation at the residential rate worked out to ` 256.09 crore which resulted in short levy of Stamp Duty and Registration Fees by ` 11.42 crore.
Audit recommends that the Stamps and Registration Department should ensure correct valuation of property using features available in the PRERNA Software and, after a mandatory physical verification by Sub Registrar or Tehsildar/Patvori where a part of the same arazi has been sold within a reasonable short period at residential rates.
(Paragraph 4.8)
Chapter-V: Mining Receipts
The Department did not recover cost of minerals amounting to ` 26.27 crore and due penalty in 334 cases from contractors undertaking civil works, for raising mineral without lawful authority.
Audit recommends that the Mining Department should ensure coordination with the executing agencies undertaking civil works to ensure that the contractors have sourced minerals from legitimate lessees, and possess valid MM-11 for transporting such minerals.
(Paragraph 5.3)
Cost of excess excavated minerals valuing to ` 1.66 crore was not recovered from two lessees for excavating excess than minor minerals permitted in Environment Clearance.
(Paragraph 5.4.1)

Audit Report (Revenue Sector) for the year ended 31 March 2018
x
Cost of excavation of minerals valuing to ` 3.35 crore was not recovered from one lessee for excavating beyond the limit fixed in the Mining Plan.
(Paragraph 5.4.2.1)
Cost of excavated minerals valuing to ` 3.00 crore was not recovered from one lessee for excavating minerals without Mining Plan.
(Paragraph 5.4.2.2)
Cost of brick earth amounting to ` 1.77 crore was not recovered in 36 cases from brick kilns operating without Environment Clearance.
Audit recommends that the Department should ensure that minerals including brick earth are not excavated without the requisite environment clearance to curb illegal mining.
(Paragraph 5.4.3)
Royalty of ` 6.94 crore and permit application fees of ` 13.14 lakh were not realised in 660 cases from brick kiln owners, though the same was specified in the One Time Settlement Scheme.
Audit recommends that the Department should ensure that all brick kiln owners in the State abide with the provisions of the One Time Settlement Scheme as applicable in the given brick year. Efforts should also be made to recover the outstanding royalty from the defaulting brick kiln owners.
(Paragraph 5.5)
19 lessees deposited dead rent of ` 1.85 crore for the lease period against recoverable amount of ` 3.94 crore. Department did not make any effort to recover short deposit of dead rent of ` 2.09 crore.
(Paragraph 5.6)
Most of the audit observations are of a nature that may reflect similar errors/omissions in other units of the concerned State Government department, but were not covered in the test check conducted during the year. The Department/Government may therefore like to internally examine all other units with a view to ensuring that they are functioning as per requirement and rules.

CHAPTER-I: GENERAL
1.1 Introduction This Chapter presents an overview of the trend of receipts raised by the Government of Uttar Pradesh, and the arrears of revenue, both Tax and non-tax, pending collection against the backdrop of the audit findings.
1.2 Trend of receipts 1.2.1 The tax and non-tax revenue raised by the Government of Uttar Pradesh, the State’s share of the net proceeds of the divisible Union taxes and duties assigned to States, grants-in-aid received from the Government of India during 2017-18, and the corresponding figures for the preceding four years are presented in Table - 1.1.
Table - 1.1 Trend of revenue receipts
(` in crore)
Sl. No. Particulars 2013-14 2014-15 2015-16 2016-17 2017-18
Revenues raised by the State Government
• Tax Revenue 66,582.08 74,172.42 81,106.26 85,965.92 97,393.00
Percentage of growth compared to previous year
14.60 11.40 9.35 5.99 13.29
• Non-tax Revenue 16,449.80 19,934.80 23,134.65 28,944.07 19,794.86
Percentage of growth compared to previous year
26.82 21.19 16.05 25.11 (-) 31.60
1.
Total 83,031.88 94,107.22 1,04,240.91 1,14,909.99 1,17,187.86
Receipts from the Government of India
Share of net proceeds of divisible Union taxes and duties
62,776.70 66,622.91 90,973.69 1,09,428.29 1,20,939.141
Grants-in-aid 22,405.17 32,691.47 31,861.34 32,536.87 40,648.45
2.
Total 85,181.87 99,314.38 1,22,835.03 1,41,965.16 1,61,587.59
3.
Total revenue receipts of the State Government (1 and 2)
1,68,213.75 1,93,421.60 2,27,075.94 2,56,875.15 2,78,775.45
4. Percentage of 1 to 3 49 49 46 45 42
Source: Finance Accounts of the Government of Uttar Pradesh.
Above table indicates that the average annual growth rate in respect of tax revenue and non-tax revenue were 10.93 per cent and 11.51 per cent respectively during 2013-18.
The State’s share in central taxes increased following the implementation (from 2015-16) of the recommendations of the 14th Finance Commission increasing the State’s share by 10 per cent (from 32 to 42 per cent).
1 For details, please see Statement No. 14 - Detailed accounts of revenue by minor heads in the Finance Accounts
of the Government of Uttar Pradesh for the year 2017-18. Figures under the major heads 0005 - Central Goods and Services Tax, 0008 – Integrated Goods and Services Tax, 0020 - Corporation tax, 0021 - Taxes on income other than corporation tax, 0028 - Other Taxes on Income and Expenditure, 0032 - Taxes on wealth, 0037 - Customs, 0038 - Union excise duties, 0044 - Service tax and 0045 - Other taxes and duties on commodities and services, Minor Head 901 - Share of net proceeds assigned to States booked in the Finance Accounts under ‘A - Tax revenue’ have been excluded from revenue raised by the State and included in ‘State’s share of net proceeds of divisible Union taxes’ in this statement.

Audit Report (Revenue Sector) for the year ended 31 March 2018
2
The breakup of revenue receipts of the State for the year 2017-18 in terms of percentage is shown in Chart – 1.1.
Chart - 1.1
1.2.2 Details of the tax revenue raised during the period 2013-14 to 2017-18 are given in Table - 1.2.
Table - 1.2 Details of tax revenue
Source: Finance Accounts of the Government of Uttar Pradesh and budget estimates as per the Statement of Revenue and Receipts of Government of Uttar Pradesh.
2
48.486,56
00.000,65
96.373,2552.112,31
70.602,2830.397,36?
?
?
3 New Tax Revenue Head introduced from 01.07.2017 4 Includes receipts (less than five per cent of tax revenue) from the following: Taxes and duties on Electricity, Land Revenue, Hotel Receipt Tax, Other Taxes and Duties on Commodities and
Services etc.
(` in crore) 2013-14 2014-15 2015-16 2016-17 2017-18 Percentage of increase (+)
or decrease (-) in actuals of 2017-18 in comparison to
Sl. No.
Head of revenue
BE Actual
BE Actual
BE Actual
BE Actual
BE Actual
BE of 2017-18
Actuals of 2016-17
Tax on Sales, Trade, etc.
43,936.00 39,645.45
47,497.92 42,931.54
52,670.69 47,692.40
57,940.30 51,882.88
36,397.30 31,112.52
1.
State Goods and Service Tax (SGST)3 (July 2017 to March 2018)
28,602.70 25,373.96
(-) 13.102 (+) 8.87
2. State Excise 12,084.00 11,643.84
14,500.00 13,482.57
17,500.00 14,083.54
19,250.00 14,273.49
20,593.23 17,320.27
(-) 15.89 (+) 21.35
3. Stamps and Registration Fees
10,555.00 9,520.92
12,722.67 11,803.34
14,836.00 12,403.72
16,319.60 11,564.02
17,458.34 13,397.57
(-) 23.26 (+) 15.86
4. Taxes on Vehicles, Goods and Passengers (0041 & 0042)
3,713.00 3,442.01
3,950.00 3,797.58
4,658.00 4,410.53
5,123.80 5,148.37
5,481.20 6,403.69
(+) 16.83 (+)24.38
5. Others4 1,905.00 2,329.86
2,327.34 2,157.39
2,250.31 2,516.07
2,622.80 3,097.16
2,969.13 3,784.99
(+) 27.48 (+)22.21
Total 72,193.00 66,582.08
80,997.93 74,172.42
91,915.00 81,106.26
1,01,256.50 85,965.92
1,11,501.90 97,393.00
(-)12.65 (+)13.29

Chapter I: General
3
The breakup of tax revenue for the year 2017-18 is shown in Chart - 1.2. Chart - 1.2
The overall growth of 13.29 per cent in own tax revenue during 2017-18 was mainly due to increase in ‘State Excise’ (by ` 3,047 crore), ‘Stamp and registration’ (by ` 1,834 crore), ‘Taxes on vehicle’ (by ` 1,255 crore), ‘Land revenue’ (by ` 576 crore) and ‘Taxes and duties on Electricity’ (by ` 568 crore).
Taxes on sales, trade, etc. decreased by ` 20,770 crore during 2017-18 in comparision to the previous year, as this tax was subsumed in Goods and Services Tax (GST) which was implemented from 1 July 2017. However, State GST (SGST) collection during the year was ` 25,374 crore.
The growth in ‘State Excise’ was due to increase in sale of country liquor (by ` 892 crore), Indian Made Foreign Liquor (by ` 795 crore) and Beer (by ` 279 crore). The State Excise Department also received ` 373 crore during the year from e-lottery tendering process for shops for the year 2018-19.
The receipts under ‘Stamps and Registration’ increased mainly due to annual revision of circle rates of land, more receipts from fees for registering documents (58 per cent) and sale of judicial and non-judicial stamps (23 per cent). The increase of receipts ‘taxes and duties on Electricity’ was due to more collection of taxes on sale and consumption of electricity (41 per cent).

Audit Report (Revenue Sector) for the year ended 31 March 2018
4
1.2.3 Details of the non-tax revenue raised during the period 2013-14 to 2017-18 are indicated in Table - 1.3.
Table - 1.3 Details of non-tax revenue
(` in crore)
2013-14 2014-15 2015-16 2016-17 2017-18 Percentage of increase (+) or decrease (-) in actuals of 2017-18 in comparison to
Sl. No.
Head of revenue
BE Actual
BE Actual
BE Actual
BE Actual
BE Actual
BE of 2017-18
Actuals of 2016-17
1. Miscellaneous General Services
2,970.98 3,194.28
4,037.81 6,400.41
4,774.00 4,949.22
4,220.61 4,460.40
4,502.00 4,841.11
(+)7.53 (+)8.54
2. Education, Sports, Art and Culture
5,852.75 6,414.09
6,887.18 5,798.52
7,600.00 10,652.08
11,170.31 14,092.31
520.00 432.05
(-)16.91 (-)96.93
3. Non-Ferrous Mining and Metallurgical Industries
1,000.00 912.52
1,100.00 1,029.42
1,500.00 1,222.17
1,650.00 1,548.39
3,200.00 3,258.88
(+)1.84 (+)110.47
4. Power 270.00 1,060.81
2,700.00 967.87
2,700.00 1,322.17
2,700.00 2,938.85
4,448.34 4,695.85
(+)5.80 (+)59.79
5. Other Non-tax receipts5
3,088.75 4,868.10
5,506.96 5,738.58
5,062.32 4,989.01
4,499.93 5,904.12
5,766.37 6,566.97
(+)13.69 (+)11.23
Total 13,182.48 16,449.80
20,231.9519,934.80
21,636.32 23,134.65
24,240.85 28,944.07
18,436.71 19,794.86
(+)7.37 (-)31.61
Source: Finance Accounts of the Government of Uttar Pradesh and budget estimates as per the Statement of Revenue and Receipts of Government of Uttar Pradesh.
The breakup of non-tax revenue for the year 2017-18 is shown in Chart - 1.3.
Chart - 1.3
5 Others includes receipts (less than five per cent of non-tax revenue) from the following: Interest receipts, Roads
& Bridges, Other Administrative Services, Medium Irrigation, Village and Small Industries, Forestry and Wild Life, Medical and Public Health, Urban Development, etc.

Chapter I: General
5
There was overall decrease of 31.61 per cent in non-tax receipts amounting to ` 9,149 crore during 2017-18 over 2016-17. The decrease was mainly on account of the receipts under the head ‘Education, Sports, Art and Culture’ due to the fact that during 2017-18, the compensation by the Department in lieu of salary to the teachers appointed under Sarva Shiksha Abhiyan was accounted for as reduction in expenditure of the Primary Education Department, which was earlier shown as non-tax receipts of the Government. Further, the increase in realisation of mineral concession fees, rent and royalties (186 per cent) led to higher receipts under ‘Non-ferrous mining and metallurgical industry’, which was mainly due to revision of rates of royalty/dead rent of various minerals.
Further, Audit noted wide variations between the budget estimates approved by the Finance Department and the actual revenues (Tables 1.2 and 1.3 refer). The reasons for such wide variations could not be assessed as the Finance Department did not produce the budget files to Audit despite requests at that point of time. The matter was flagged in the Audit Report (Economic and Revenue Sectors) for the year ended 31 March 2017 (Chapter-3 General para No. 3.2.3).
Recommendation:
The Finance Department should revisit their budgeting methods to make the budget estimates more realistic.
1.3 Analysis of arrears of revenue
Arrears of revenue as on 31 March 2018 in respect of some principal heads of revenue amounted to ` 22,564.66 crore6, of which ` 10,581.967 crore were outstanding for more than five years. Details as provided by the Departments are given in Chart - 1.4.
6 Tax on Sales, Trade, etc.: ` 21,548.61 crore; Stamps and Registration Fees: ` 398.47 crore; Taxes on Vehicles,
Goods and Passengers: ` 109.78 crore; State Excise: ` 52.37 crore; Entertainment Tax: ` 348.74 crore, Non-Ferrous Mining and Metallurgical Industries ` 106.69 crore.
7 Tax on Sales, Trade, etc.: ` 10,257.17 crore; Stamps and Registration Fees: ` 140.71 crore; Taxes on Vehicles, Goods and Passengers: ` 53.83 crore; State Excise: ` 52.08 crore; Entertainment Tax: ` 13.14 crore, Non-Ferrous Mining and Metallurgical Industries ` 65.03 crore.

Audit Report (Revenue Sector) for the year ended 31 March 2018
6
Chart -1.4
At ` 22,564.66 crore, the total arrears in revenue at the end of 2017-18 constituted 19 per cent of the total revenue receipts of the State (` 1,17,187.86 crore) of which 47 per cent (` 10,581.96 crore) of the arrears were pending recovery for periods of five years or more. This is indicative of lax revenue administration and non-compliance in the State. The quantum of arrears is unsustainably large and calls for concerted efforts at recovery of the same.
The Departments intimated pendency at different stages, but individual records relating to outstanding arrears were not made available for examination. There was no mechanism to monitor the progress of collection of arrears or to assess reasons for accumulation of arrears in the Departments8. Further, the Departments do not maintain any centralised database of outstanding arrears. Figures of outstanding arrears were compiled by the concerned Departments each year, at the instance of Audit, from the data furnished by their respective field units.
Recommendation: The Departments should create a centralised database of outstanding arrears and introduce a mechanism to monitor the progress of arrears on a periodic basis. The reasons for accumulation of arrears should also be analysed and mechanisms/procedures developed to prevent any further accumulation of arrears.
1.4 Follow up on the Audit Reports-summarised position To ensure accountability of the executive in respect of all the issues dealt with in various Audit Reports (ARs), the Department of Finance issued instructions in June 1987 to initiate suo motu action on all Paragraphs/ Performance Audits figuring in the Audit Reports irrespective of whether the cases were taken up for examination by the Public Accounts Committee (PAC) or not. Significant delays were observed in submission of explanatory notes (replies of the 8 Commercial Tax, State Excise, Transport, Stamps and Registration, Entertainment Tax and Geology and
Mining.

Chapter I: General
7
Departments) itself, with delays ranging between nine months and 52 months in respect of 164 Paragraphs (including Performance Audits) appearing in the CAG’s Revenue Audit reports for the year ended 31 March 2013, 2014, 2015, 2016 and 2017 placed before the State Legislative Assembly between June 2014 and July 2019. Details of pending explanatory notes pertaining to the various Departments9 are given in Table - 1.4.
Table - 1.4
Sl. No.
Audit Report ending on
Date of presentation in the legislature
Number of paragraphs
Number of paragraphs
where explanatory
notes received
Number of paragraphs
where explanatory
notes not received
1 31 March 2013 20 June 2014 49 49 00
2 31 March 2014 17 August 2015 43 36 07
3 31 March 2015 06 March 2016 31 00 31
4 31 March 2016 18 May 2017 26 00 26
5 31 March 2017 19 July 2019 15 00 15
Total 164 85 79
In 2017-18, no PAC meeting was held to discuss the pending Audit Reports. Action Taken Notes (ATNs) have also not been received in respect of paragraphs discussed in the PAC from time to time.
1.5 Response of the Government/Departments towards Audit
On completion of the Audit of Government/Departments and the offices, Audit issues the Inspection Reports (IRs) to the concerned head of the offices, with copies to their superior officers for corrective action and their monitoring. Serious financial irregularities are reported to Heads of the Departments and the Government.
Review of IRs issued up to March 2018 revealed that 44,357 paragraphs relating to 12,582 IRs remained outstanding at the end of June 2018. The potentially recoverable revenue brought out in these IRs is as much as ` 8,075.46 crore whereas the total revenue collection of the State is ` 1,17,187.86 crore. Department-wise details relating to revenue sector of the State Government are given in Table - 1.5.
9 Commercial Tax (17 paragraphs), State Excise (11 paragraphs), Transport (17 paragraphs), Stamps and
Registration (15 paragraphs), Geology and Mining (14 paragraphs) and Entertainment Tax (5 paragraphs).

Audit Report (Revenue Sector) for the year ended 31 March 2018
8
Table - 1.5 Department-wise details of Inspection Reports
(` in crore)
Sl. No
Name of the Department
Nature of receipts
Number of outstanding
IRs
Number of outstanding
audit observations
Money value
involved
Tax on Sales, Trade, etc.
5,779 25,474 3,925.45 1. Finance
Entertainment tax 203 497 22.51
2. State Excise State Excise 1,072 1,972 1,086.60
3. Transport Taxes on vehicles 1,356 5,986 862.46
4. Stamps and Registration
Stamps and registration fees
3,954 9,395 745.88
5. Geology and Mining
Non-ferrous mining and metallurgical industries
218 1,033 1,432.56
Total 12,582 44,357 8,075.46
Source: Information available in the Audit office Even the first replies, required to be received from the heads of offices within four weeks of receipt of IRs, were not received in time. Out of total 597 IRs issued during 2017-18, Audit received first reply from the heads of offices in case of seven IRs within six months, and in respect of 45 IRs beyond six months. The first replies had not been received in case of remaining 545 IRs issued during 2017-18. This large pendency of the IRs and non-receipt of first replies from the Departments is indicative of the fact that the Heads of Auditee units have failed to take cognisance of the reported Audit findings and initiate any corrective action in their respect. The lack of interest of the Executive in Audit is also evident from the fact that irregularities of similar nature are being reported year after year with no improvement/ evidence of any corrective action by the concerned Departments visible at the ground level. This adversely affected effectiveness of Audit.
Recommendation: The State Government should introduce a mechanism to ensure that the Departmental officers respond to IRs promptly, take corrective action, and work closely with Audit to bring about early settlement of IRs.
1.6 Results of audit Position of local audit conducted during the year Audit covered six Departments10 of the State Government and test checked the records of 663 out of 1,585 auditable units (42 per cent) relating to Tax on Sales, Trade, etc., State Excise, Taxes on Vehicles, Goods and Passengers, Stamps and Registration Fees, Entertainment Tax and Mining receipts during the year 2017-18. Further, this was a test audit. In six Departments, revenue of ` 85,142.94 crore was collected during 2016-17, out of which the 663 audited units collected ` 46,918.44 crore (55 per cent). In 663 audited units, records
10 Commercial Tax, State Excise, Transport, Stamps and Registration, Entertainment Tax and Geology and Mining.

Chapter I: General
9
were test checked on the basis of turnover/tax payments which revealed underassessment/short levy/loss of revenue aggregating to ` 745.95 crore (two per cent) in 41,277 cases. The Department concerned accepted (between April 2017 and September 2019) underassessment and other deficiencies of ` 161.81 crore in 17,086 cases pointed out in the year 2017-18 by the audit. During the course of the year the Department reported (between April 2017 and September 2019) recovery of ` 45.03 crore out of which 185 cases of ` 4.9 crore is related to the year 2017-18 and the rest of the cases pertain to the earlier years.
Recommendation:
The State Government should evolve a mechanism to ensure that Departments recover all under-assessments/short levies pointed out by Audit and accepted by the Departments.
1.7 Coverage of this Report This Report contains 17 paragraphs from the local audits conducted during the year and those of earlier years which could not be included in the previous reports involving financial effect of ` 195.88 crore including one Paragraph on “Preparedness for transition to Goods and Services Tax”.
The Departments have accepted audit observations involving ` 140.34 crore and recovered ` 2.09 crore. These are discussed in the succeeding Chapters II to V. Most of the audit observations are of a nature that may reflect similar errors/ omissions in other units of the concerned State Government Department, but were not covered in the test check conducted during the year. The Department/Government may therefore like to internally examine all other units with a view to ensuring that they are functioning as per requirement and rules.


CHAPTER-II: STATE EXCISE
2.1 Tax administration Various kinds of liquor, such as Country Liquor (CL) and Indian Made Foreign Liquor (IMFL) are manufactured from alcohol. Excise duty on production of alcohol and liquor in distilleries forms a major part of the State’s excise revenue1. Apart from the excise duty, license fee2 also forms a part of excise revenue. The Uttar Pradesh Excise Act, 1910 and Rules3 made thereunder govern the levy and collection of excise duty on liquor for human consumption and applicable license fee. The Principal Secretary (State Excise) is the administrative head of the State Excise Department (Department) at the Government level. The Department is headed by the Excise Commissioner (EC) who is assisted by two Additional Excise Commissioner (AEC). The Department has five zones headed by Joint Excise Commissioners (JECs) who is assisted by 18 Deputy Excise Commissioner (DEC). Assistant Excise Commissioners (AEs) head the districts they are assisted by Excise Inspectors (EIs) to oversee and regulate levy/collection of excise duties and allied levies. Additional District Magistrate (Finance & Revenue) is in charge of collection and accountal of excise receipts under over all the administrative control of the District Collector.
The organisational setup of the Department is as under:
Chart 2.1 Organisational setup
1 CL formed 51 per cent, IMFL 33 per cent, Beer 13 per cent and others three per cent of total excise revenue of
2016-17. 2 License fee is applicable on licensees of CL, IMFL, Beer, Bars, Distilleries, Breweries, Pharmacies, etc. and on
other manufacturing units using alcohol as raw material. 3 Uttar Pradesh Excise (Settlement of licenses for retail sale of foreign liquor) (excluding Beer and wine) Rules
2001. UP Excise (Settlement of licenses for retail sale of foreign liquor) (excluding Beer and wines) (Third
Amendment) Rules 2002. UP Excise (Wholesale and retail vend of foreign liquor) (Thirteenth Amendment) Rules 2002. UP Excise (Settlement of licenses for retail sale of country liquor) Rules 2002. UP Excise (Settlement of licenses for country liquor bonded warehouse) Rules 2003. UP Excise (Settlement of retail licenses for model shop of foreign liquor) Rules 2003.

Audit Report (Revenue Sector) for the year ended 31 March 2018
12
2.2 Results of audit During 2017-18, Audit test checked 4,006 cases (30 per cent) out of 13,144 total cases in 824 units out of 231 auditable units (35 per cent) of the Department in which irregularities amounting to ` 190.96 crore in 2,332 cases (58 per cent) were found. The Department generated a revenue of ` 14,273.49 crore during 2016-17, of which the audited units had collected ` 9,125.01 crore (64 per cent).
Audit scrutiny revealed short realisation of excise duty, non-realisation of license fee/ interest etc. amounting to ` 190.96 crore in 199 paragraphs as shown in Table 2.1.
Table - 2.1 Sl. No.
Categories Number of paragraphs
Amount (` in crore)
Share in per cent to the total
objected amount 1. Short realisation of excise duty 8 80.46 42.13 2. License fee/ interest not realised 159 110.29 57.76 3. Other irregularities5 32 0.21 0.11
Total 199 190.96
Source: Information available in the Audit office. The Department accepted (between April 2017 and September 2019) 717 cases amounting to ` 53.80 crore pointed out in the year 2017-18. The Department reported (between April 2017 and September 2019) recovery of ` 7.52 crore out of which three cases of ` 90.04 lakh is related to the year 2017-18 and the rest of the cases pertain to the earlier years. This chapter discusses 860 cases worth ` 62.57 crore. The Department accepted 667 cases amounting to ` 52.90 crore. Out of these some irregularities have been repeatedly reported during the last five years as detailed in Table - 2.2. Most of the audit observations are of a nature that may reflect similar errors/omissions in other units of the concerned State Government Department, but were not covered in the test check conducted during the year. The Department/Government may therefore like to internally examine all other units with a view to ensuring that they are functioning as per requirement and rules.
Table - 2.2 (` in crore)
2012-13 2013-14 2014-15 2015-16 2016-17 Total Nature of observation Cases Amount Cases Amount Cases Amount Cases Amount Cases Amount Cases Amount
Failure to cancel the selection of shops and forfeiture of basic license fee and security deposit
639 53.68 - - 32 3.66 1,007 37.43 14,334 1,297.07 16,012 1,391.84
Sale of Beer without Beer bar license
1,370 16.80 87 1.31 - - 364 6.70 720 13.59 2,541 38.40
Short levy of license fee on model shops
393 7.51 - - 2 0.36 - - 44 2.49 439 10.36
Source: Information available as per Audit Report (Revenue Sector).
4 This consists of Excise Commissioner (HOD), 47 District Excise Officer and 34 Distilleries. 5 Non-maintenance of cash book, Imposition of less rent on warehouse, Non-execution of bond, less imposition of
stamp fee on rented warehouse, Non completion of MFS register, and slow progress in arrear recovery.

Chapter II: State Excise
13
Recommendation: The Department may initiate systemic measures to ensure that persistent irregularities that are routinely found during Audit do not recur.
2.3 Failure to cancel the settlement of shops and forfeiture of basic license fee/ license fee and security deposit
The various Uttar Pradesh Excise (Settlement of Licenses of Retail Sale) Rules6 stipulate that the amount of Basic License Fee7 (BLF)/License Fee8 (LF) shall be deposited in full within three working days, half of the security9 amount within 10 working days and the remaining amount within 20 working days of the receipt of information of the selection of shop. In case of default, the settlement of shops would be cancelled, and the amount of BLF/LF, security deposit are required to be forfeited, and these shops need to be resettled.
Previous Audit Reports for the years 2012-13, 2014-15, 2015-16 and 2016-17 had highlighted instances of such persistent losses amounting to ` 1,391.84 crore in 16,012 cases. In a similar issue highlighted in Para 3.8.8.1 of Audit Report (Revenue Sector) 2012-13, the Public Accounts Committee has made recommendation (May 2015) to the Principal Secretary, Excise to take action against the defaulting licensees and ensure that similar irregularity is not repeated in future. To evaluate the corrective measures taken by the Department in this regard, Audit test checked the records of 15 out of 47 District Excise Offices. Audit noticed that licensees of 714 out of 4,851 liquor shops (14.72 per cent) in 15 districts, which were settled or renewed during the years 2015-16 to 2017-18, did not deposit the entire amount of security deposit and BLF/LF within the prescribed time frame involving an amount of ` 58.85 crore (BLF/LF ` 28.35 crore and security deposit ` 30.50 crore). The delay ranged from 02 to 327 days. No action was, however, initiated by the concerned District Excise Officers (DEOs) as envisaged under the Rules according to which no relaxation is allowed. Inaction on extant such delays in deposit of due amount resulted in non-forfeiture of an amount of ` 58.85 crore.
The Department stated during the exit conference (December 2018) that the re-settlement of shops was very time-consuming. Hence, such delays were generally allowed by the DEOs at the local level.
6 UP Excise (Settlement of Licenses for Retail Sale of Foreign Liquor) (excluding Beer and Wine) Rules 2001. UP Excise (settlement of licenses for retail sale of Beer) Rules 2001. UP Excise (settlement of licenses for retail sale of country liquor) Rules 2002. UP Excise (settlement of retail licenses for model shop of foreign liquor) Rules 2003. 7 BLF- ` 23 per BL (2013-14), ` 24 per BL (2014-15) and ` 25 per BL (2015-16, 2016-17 and 2017-18). 8 LF-` 184 per BL (2013-14), ` 204 per BL (2014-15), ` 227 per BL (2015-16) and ` 226 per BL (2016-17 and
2017-18). 9 10 per cent of the license fees fixed for the shop.
The Department failed to act on the recommendation made by the Public Accounts Committee for timely deposit of Basic License Fee and License Fee on settlement of shops. The Department did not initiate any action for cancellation of settlement, and forfeiture of basic license fee/license fee (` 28.35 crore) and security (` 30.50 crore) totalling to ` 58.85 crore, in contravention to the rules.

Audit Report (Revenue Sector) for the year ended 31 March 2018
14
Audit analysed that even after allowing 15 more days as the time that an allottee normally takes to complete the formalities for depositing the dues, as stated by the Department during the exit conference (December 2018), the amount involved was worked out to ` 52.90 crore (BLF/LF ` 25.78 and security deposit ` 27.12) in 667 liquor shops of 15 DEOs. The delays in deposit ranged between 16 days and 327 days. Therefore, a major percentage of delays (93.42 per cent) were beyond the 15 days’ grace period being allowed by the DEOs (Appendix-I).
Recommendations: 1 The Department should ensure adherence to the provisions of the
Act/Rules and the recommendation made by the Public Accounts Committee, to safeguard the financial interests of the State.
2 The Department should adopt a transparent bidding system and devise a mechanism to settle licenses of liquor shops in case the highest bidder fails to comply with allotment conditions.
2.4 Sale of Beer without Beer bar license
Foreign liquor, as defined in UP Excise (Settlement of Licenses for Retail Sale of Foreign Liquor) (excluding Beer and Wines) (Third Amendment) Rules, 2002, includes Malt Spirit, Whiskey, etc., but does not include Beer. As per the United Provinces Excise Act, 1910, and the UP Excise (wholesale and retail vend of foreign liquor) (Thirteenth Amendment) Rules, 2002, a Beer Bar license, in form FL 7B, is required for retail sale of Beer in the premises of hotels, dak bungalows or restaurants. FL 6A composite and FL 7 licenses cover sale of only Draught Beer10.
Previous Audit Reports for the year 2012-13 to 2013-14 and 2015-16 to 2016-17 had highlighted persistent losses amounting to ` 38.40 crore in 2,541 cases. On previous occasions, the State Government had insisted that foreign liquor included Beer, and that no separate licenses was required. Audit had maintained that as United Provinces Excise Act, 191011 rules pre date 2002 rules, the present definition of foreign liquor excluded bottled Beer. Therefore, a separate license was required for its sale. Audit test checked consumption details of hotels/restaurant bars and other records in 10 out of 47 District Excise Offices and noticed that 119 out of 362 licenses of the hotels/restaurant bars, settled or renewed during the years 2015-16 to 2017-18 under FL 7 category, had sold bottled Beer in addition to IMFL. FL 7B licenses required under the 2002 rules to sell bottled Beer were not issued to them. In spite of having information, the AECs of these districts did not take required action. As a result, the Government was deprived of license fee of ` 2.36 crore (as shown in Appendix-II). Audit reported the matter to the Department (August 2017 to March 2018). During the exit conference (December 2018), the Department stated that in compliance to the Audit observations of the previous years, and to resolve the
10 Draught Beer, is beer served from a cask or keg rather than from a bottle or cane. 11 Chapter I: Preliminary and Definitions: Section 3(10) and 3(11)
Non-issue of Beer bar license for retail sale of bottled Beer led to loss of revenue of ` 2.36 crore in respect of 119 licensees.

Chapter II: State Excise
15
matters arising out of different definitions of foreign liquor, a new license FL-7 for sale of Beer had been introduced in the Excise Policy 2019-20 against the existing two licenses FL-7A and FL-7B and by increasing the license fee of the new composite license. Audit acknowledges the acceptance made by the Department regarding objections raised by the Audit in amending the rules which have a prospective effect. But the Department did not state how the loss of license fee pointed out by the Audit will be recovered (August 2019).
2.5 Short levy of license fee on model shops
As per the State Excise Policy, the license fee for a model shop12 was to be fixed at the amount of accumulated highest license fee of settled retail shops of both foreign liquor and Beer in the town for the same year. But it could not be less/more than the minimum/maximum prescribed limit in the Excise Policy as detailed in Table – 2.3.
Table – 2.3 ( ` in lakh )
Year Date of notification Minimum license fee Maximum license fee
2013-14 28 February 2013 11.00 30.00 2014-15 29 January 2014 12.65 34.50 2015-16 12 January 2015 14.55 39.70 2016-17 17 February 2016 14.55 39.70 2017-18 17 February 2016 14.55 39.70
Source: Information from excise policy issued by the Government
Previous Audit Reports had highlighted persistent losses amounting to ` 10.36 crore in 439 cases during the period from 2012-13, 2014-15 and 2016-17. To check the level of compliance with the above provisions, Audit test checked 44 out of the 46 model shops in seven DEOs in the state. In case of 27 model shops renewed during 2013-14 to 2017-18, the license fee was not observed to have been fixed as per the extant provisions of the Excise Policy. The details of all 27 model shops are available in Appendix-III.
The noncompliance can be understood from the following case of a model shop13 in Etah nagar palika:
The actual levied highest license fee of IMFL shop14 - ` 22.40 lakh. The actual levied highest license fee of Beer shop15 - ` 7.15 lakh. Total accumulated highest license fee of the model shop would be - ` 29.55 lakh. The model shop license fee fixed by Etah DEO in case of Thandi Sadak, Etah Model Shop - ` 24.45 lakh. Difference (as per the accumulated highest license fee) - ` 5.10 lakh. 12 Model shop is a licensed liquor shop having at least 600 sq. ft. carpet area and consumption facility. 13 Thandi Sadak Etah Model Shop. 14 Agra Chauraha Jalesar, Etah. 15 Agra Chauraha Jalesar, Etah.
The license fee of model shops was not fixed as per the norms prescribed in the Excise Policy resulting in short levy of license fee of ` 1.36 crore.

Audit Report (Revenue Sector) for the year ended 31 March 2018
16
Thus, in this shop above, the State Government suffered a loss of ` 5.10 lakh. On the lines above, in all 27 model shops in seven towns/districts, the loss worked out to ` 1.36 crore (Appendix-III). Audit reported the matter to the Department (September 2017 to March 2018). During the exit conference (December 2018), the Department stated that the license fee for the new model shop in a town should be assessed and classified as per nagar nigam, nagar palika, nagar panchayat and gramin area of the shop, but the Audit had made the observation considering license fees of all shops in the district. Further, in compliance to the Audit observations of previous years, the maximum limit of license fee for the model shop have been deleted in the Excise Policy 2019-20. The reply of the Department is factually incorrect as the Audit has calculated license fee of model shops considering highest license fee of foreign liquor and beer shops located in the same nagar palika only.

CHAPTER-III: TAX ON SALES, TRADE, ETC.
3.1 Tax administration The Additional Chief Secretary (Commercial Tax and Entertainment Tax), Uttar Pradesh administers the Sales Tax/ Value Added Tax laws and rules framed thereunder. The Commissioner, Commercial Tax (CCT), Uttar Pradesh is the head of the Commercial Tax Department. He/she is assisted by 100 Additional Commissioners, 157 Joint Commissioners (JCs), 494 Deputy Commissioners (DCs), 964 Assistant Commissioners (ACs) and 1,275 Commercial Tax Officers (CTOs). Since 1 July, 2017, the Department is also administrating the Goods and Services Tax (GST) in the State.
The organisational setup of the Department is as depicted below: Chart 3.1 Organisational setup
3.2 Results of Audit During 2017-18, Audit test checked 1,05,080 assessment cases (18.40 per cent) out of 5,71,634 assessment cases and noticed irregularities in 2,087 assessment cases (2 per cent) in 2561 audited units (33 per cent) out of total 772 auditable units of the Commercial Tax Department. The Department collected ` 51,882.88 crore revenue during 2016-17 out of which the audited units had collected ` 25,111.88 crore (48 per cent). Audit identified irregularities amounting to ` 252.99 crore in 2,087 paragraphs as reported to the Department through the Audit Inspection Reports. These are as detailed in Table - 3.1.
1Apar Mukhya Sachiv Vanijya Kar Evam Manoranjan Kar Uttar Pradesh Shasan (01), Commissioner, CT (01), Addl. Commissioner (01), JCs (25), Sectors (208), Mobile Squad Units (14), Administration Units (5) and Tax Recovery Unit (01).

Audit Report (Revenue Sector) for the year ended 31 March 2018
18
Table - 3.1 Sl. No.
Categories Number of Paragraphs
Amount (` in crore)
Share in per cent to the total objected amount
1 Under-assessment of tax 571 55.47 21.93 2 Acceptance of defective
statutory forms 26 6.19 2.45
3 Evasion of tax due to suppression of sale/ purchase
40 5.39 2.13
4 Irregular/ Incorrect/ Excess allowance of ITC
261 33.88 13.39
5 Non/short charging of interest
194 18.38 7.26
6 Non imposition of penalty
837 112.73 44.56
7 Other irregularities 158 20.95 8.28 Total 2,087 252.99
Source: Information available in the Audit office
The Department accepted (between April 2017 and September 2019) 514 cases amounting to ` 44.87 crore pointed out in the year 2017-18. The Department reported (between April 2017 and September 2019) recovery of ` 6.49 crore out of which 151 cases of ` 2.43 crore is related to the year 2017-18 and the rest of the cases pertain to the earlier years.
This chapter discusses 394 cases worth ` 71.91 crore out of the above cases based on their significance. Some of these irregularities continue to persist, despite similar cases having been repeatedly reported during the last five years as detailed in Table - 3.2. Most of the audit observations are of a nature that may reflect similar errors/omissions in other units of the concerned State Government department, but were not covered in the test check conducted during the year. The Department/Government may therefore like to internally examine all other units with a view to ensuring that they are functioning as per requirement and rules.
Table - 3.2 (` in crore)
2012-13 2013-14 2014-15 2015-16 2016-17 Total Nature of observations Cases Amount Cases Amount Cases Amount Cases Amount Cases Amount Cases Amount
Application of incorrect rate of tax
95 2.36 75 8.49 132 7.49 35 2.72 24 2.00 361 23.06
Irregular concession allowed on goods not covered under the Registration Certificate (RC)
10 1.00 16 1.03 9 0.41 7 0.27 24 3.80 66 6.51
Inadmissible ITC
- - 15 12.41 21 0.87 15 0.77 20 1.18 71 15.23
ITC on goods sold on lower price than purchase price not reversed
- - - - 4 0.08 6 0.13 - - 10 0.21
Incorrect claim of ITC on goods purchased which were taxable at lower rates than that claimed by the dealers
10 0.67 - - 3 0.47 7 0.25 10 1.64 40 3.03

Chapter III : Tax on Sales, Trade Etc.
19
(` in crore) 2012-13 2013-14 2014-15 2015-16 2016-17 Total Nature of
observations Cases Amount Cases Amount Cases Amount Cases Amount Cases Amount Cases Amount
False/fraudulent claim of ITC
32 3.59 28 8.62 16 7.45 13 1.54 - - 89 21.20
Interest short/not charged
19 0.60 20 0.42 46 5.85 8 2.17 30 1.53 123 10.57
Concealment of turnover
55 3.27 61 1.98 31 2.66 23 1.02 - - 170 8.93
Delayed deposit of admitted tax
27 0.99 69 4.95 75 2.37 30 1.45 - - 201 9.76
Delayed deposit of tax deducted at source
13 2.88 28 8.74 25 8.75 14 2.98 28 8.05 108 31.40
The repetitive nature of irregularities makes it evident that the State Government and the Commercial Tax Department have not taken effective measures to address the persistent irregularities being pointed out year after year by the Audit. Recommendation: Given that assessments of legacy VAT cases is underway, the State Government may take steps to prevent recurrence of the reported irregularities before such cases become time barred. There is a high probability that undetected leakages of revenue at this stage would go unaddressed as the system would be totally focussed upon GST administration in the foreseeable future.
3.3 Application of incorrect rate of tax
Assessing Authorities accepted the tax rates on sale of goods worth ` 148.62 crore as mentioned by the dealers in tax returns without verifying the rates applicable on such goods as per the schedules. Thus, tax amounting to ` 12.36 crore was short/not levied.
Under the Uttar Pradesh Value Added Tax (UPVAT) Act, 2008, tax-free goods are mentioned in Schedule I and taxable goods are mentioned in Schedules II to IV according to the applicable rates of tax on such goods. Goods not mentioned in any of the above schedules are covered under Schedule V and are taxable at the rate of 12.5 per cent. In addition to the above tax, additional tax notified by the Government from time to time is also levied.
Audit Reports for the year 2012-13 to 2016-17 had highlighted failure of AAs in observing the aforesaid provisions while finalising the assessments of 361 dealers resulting in short levy of tax of ` 23.06 crore. The Department in response to the Audit observations has assured to take appropriate action. Up till now, of the above, Audit Report 2012-13 has been discussed in the PAC in which the Department reported a recovery of ` 37.93 lakh.
In the test check of the assessment records of 51 CTOs2 (out of 256 CTOs audited), Audit noticed that in the case of 58 dealers (out of 23,247 dealers test checked), the AAs, while finalising the assessments (between December 2013 and March 2017) for the year 2008-09 to 2014-15, accepted tax rates of zero to nine per cent on the sale of goods worth ` 148.62 crore as mentioned by the dealers in their respective tax returns. The AAs failed to verify and levy the 2 Name of CTOs, rate of tax and other details are given in Appendix.

Audit Report (Revenue Sector) for the year ended 31 March 2018
20
applicable rates of four to 17.5 per cent on such goods as per the schedules. Thus, tax amounting to ` 12.36 crore was short/not levied (Appendix-IV).
Audit reported the matter to the Department (between November 2016 and April 2018). In their reply (January/May 2019), the Department accepted the Audit observations in 23 cases amounting to ` 1.43 crore, out of which in three cases, a recovery of ` 19.65 lakh was reported by the Department.
In 20 cases, the Department did not accept the Audit observation. The main contention of the Department in 10 of the 20 cases not accepted by them was that the concerned AAs while passing the assessment orders, had made typographical errors3 in their initial orders, which they subsequently corrected when Audit observations were received by them. Audit urges the Department to fix accountability for such reported lapses. The analysis of Government’s replies in these 20 cases is listed in the Table 3.3 (i) and Table 3.3 (ii).
Table 3.3 (i) Cases where the Department has mentioned typographical errors in the assessment
orders in the cases pointed out by the Audit
Sl. No.
Audited Unit/ Observation in brief
Department reply in brief
Rebuttal
1 Sec-10 Agra Observation: Sale of canvas footwear was shown in the central sales without the required Form C @ five per cent. As per the Audit, this commodity should have been taxed @ 14 per cent.
Due to typographical error in the assessment order, in place of PVC footwear, canvas footwear was typed in the order, which has been amended u/s 31 dated 15 June 2018.
The reply is not acceptable, as the initial assessment order passed on 30 September 2016 makes a specific mention of canvas footwear in different pages of the order. A typographical error cannot occur on several pages. Further the dealer himself in his annual return has shown the same commodity as shoes which is also taxable @ 14 per cent. Further no supporting documents were given to the Audit to establish the claim of the Department on sale of PVC footwear. As such shoes/canvas footwear should be taxable @ 14 per cent as per UPVAT Act
2 Sec-11 Agra (b) Observation: Sale of Fire extinguisher was taxed @ five per cent. As per the Audit, this commodity should be taxable @ 14 per cent.
Due to typographical error in the assessment order, in place of PVC pipe, hose pipe and fitting, fire extinguishers were mentioned which has been amended u/s 31 dated 31 October 2018.
The reply is not acceptable, as in the initial assessment order passed on 19 September 2016 sale of fire extinguishers was shown in different pages of the assessment order. A typographical error cannot occur on several pages. Further, the dealer himself in his annual return has shown the same commodity fire extinguishers. Further, no supporting documents were given to the Audit to establish the claim of the Department on sale of PVC pipe, hose pipe and fitting. As
3 Errors committed reportedly relate to description of goods in Assessment Orders.

Chapter III : Tax on Sales, Trade Etc.
21
Sl. No.
Audited Unit/ Observation in brief
Department reply in brief
Rebuttal
such, fire extinguishers should be taxable @ 14 per cent as per UPVAT Act.
3 Sec-2 Auraiya Observation: Sale of Computers and its parts was shown and taxed @ five per cent. This should have been instead taxed @ 14 per cent and 13.5 per cent.
Due to typographical error in the annexures of purchase and sale list, computer parts were mentioned. Revised annexures of purchase and sale list are being submitted.
The reply is not acceptable. As per the records submitted by the dealer, in both his quarterly return and in the Purchase list & sales list, computer parts have been mentioned and accepted by the AAs at the time of assessment. Further, no provisions were shown to the Audit whereby the AAs can accept the revised annexure after passing the initial assessment order.
4 Sec-2 Ghaziabad (a) Observation: Sale of electronic meter parts was shown in the central sale in the assessment order without the required Form C @ five per cent. As per the Audit, this commodity should have been taxed @ 14 per cent.
Due to typographical error in the assessment order, in place of winding wire and strips etc., electronic meter parts were mentioned, which has been amended u/s 31 dated 1 August 2017.
The reply is not acceptable as in the annual return submitted by the dealer the commodity name was not mentioned. This was clarified by the AA at the time of passing both the assessment orders dated 29 July 2016 and 10 January 2017. Sale of electronic meter parts were mentioned on different pages in the assessment order. A typographical error cannot occur on several pages. Further, no supporting documents were given to audit to establish the claim of the Department on sale of winding wire strips etc. As such, electronic meter parts should be taxable @ 14 per cent as per UPVAT Act.
5 Sec-2 Ghaziabad (b) Observation: Sale of scooter parts was shown in central sale in assessment order without the required Form C @ five per cent. As per the Audit, this commodity should have been taxed @ 14 per cent.
Due to typographical error in the assessment order, in place of HDPE cloth, scooter parts were mentioned, which has been amended u/s 31 dated 19 May 2017.
The reply is not acceptable. As per the records submitted by the dealer in his annual return, the commodity name was not mentioned. This was clarified by the AA at the time of passing the assessment order in several pages. A typographical error cannot occur on several pages. Further, no supporting documents were given to audit to establish the claim of the Department on sale of HDPE cloth. As such, scooter parts should be taxable @ 14 per cent as per UPVAT Act.
6 Sec-29 Kanpur Observation: Sale of varnish was shown in the assessment order @ five per cent. As per the Audit, this commodity should
Due to typographical error in the assessment order, in place of chemical and minerals, varnish was mentioned which has been
The reply is not acceptable. As per the annual return submitted by the dealer, the name of the commodity has not been shown. This was clarified by the AA at the time of passing the

Audit Report (Revenue Sector) for the year ended 31 March 2018
22
Sl. No.
Audited Unit/ Observation in brief
Department reply in brief
Rebuttal
have been taxed @ 14 per cent.
amended u/s 31 dated 1 October 2018.
assessment order. The dealer is a trader of paint, varnishes and adhesive as per assessment order. The sale of varnish has been mentioned numerous times in the order. A typographical error cannot occur on several occasions. Further no supporting documents were given to the audit to establish the claim of the Department on sale of chemical and minerals. As such varnish should be taxable @ 14 per cent as per UPVAT Act.
7 Sec-13 Lucknow Observation: Sale of food supplement was shown in the assessment order @ five per cent. As per the Audit, this commodity should have been taxed @ 14 per cent.
Due to typographical error in the assessment order, in place of spices and custard, medicines and food supplements were written which are taxable under Schedules II (four per cent) and V (12.5 per cent) respectively. As such, the dealer is not found to sell food supplements.
The reply is not acceptable. In the initial assessment order passed on 23 January 2017 sale of food supplement was shown in numerous pages. A typographical error cannot occur on several pages. Further, it is also notable that the dealer himself in his annual return has shown the same commodity as food item. Further, no supporting documents were given to the Audit to establish the claim of the Department on sale of spices and custard. As such, food supplement should be taxable @ 14 per cent as per UPVAT Act.
8 Sec-3 Sultanpur(a) Observation: Sale of machinery parts was shown in the assessment order @ five per cent. As per the Audit, this commodity should have been taxed @ 14 per cent.
The dealer had submitted the wrong return in which machinery and plant was depicted in place of mono block submersible pump, etc. Therefore, machinery and plant was shown in the assessment order which has been amended u/s 31 after the dealer submitted the correct return.
The reply is not acceptable. As per the records submitted by the dealer, plant and machinery have been mentioned and the same has been accepted by the AA at the time of assessment. Further, no provisions were shown to the Audit whereby the AAs can accept a revised return after passing the initial assessment order.
9 Sec-3 Sultanpur(b) Observation: Sale of set top box was shown in the assessment order @ five per cent. As per the Audit, this commodity should have been taxed @ 13.5 per cent and 14 per cent.
Due to typographical error in the assessment order, in place of set top box user charges, sale of set top box was written. The dealer is not selling set top box but paying tax on set top box user charges under right to use.
The reply is not acceptable. Audit noted that in a series of assessment orders dated 1 July 2014, 31 July 2014 and 29 December 2016 specific reference to sale of set top box had been recorded. A typographical error cannot occur across assessment orders spreading over the period 2014 to 2016. Further, the dealer himself in his annual

Chapter III : Tax on Sales, Trade Etc.
23
Sl. No.
Audited Unit/ Observation in brief
Department reply in brief
Rebuttal
return has shown the same commodity as set top box. Further, no supporting documents were given to the Audit to establish the claim of the Department on paying tax on set top box user charges under right to use. As such, set top box should be taxable @ 13.5 per cent and 14 per cent as per UPVAT Act.
10 Sec-8 Varanasi Observation: Sale of Furniture was shown in the assessment order @ five per cent. As per the Audit, this commodity should have been taxed @ 14 per cent.
Due to typographical error in the assessment order, in place of plywood, furniture was mentioned. The dealer has submitted a revised return in which sale of plywood and furniture have been shown separately. A revised assessment order was passed.
The reply is not acceptable. As per the records submitted by the dealer, sale of furniture has been mentioned in the return and accepted by the AA at the time of passing the assessment order. Further, no provisions were shown to Audit whereby the AA can accept a revised return after passing the initial assessment order. As per the notification dated 11 October 2012, plywood is also taxable @ 14 per cent under UPVAT Act.
Table 3.3(ii) Cases where the Department reply is not acceptable
Sl. No.
Audited Unit/ Observation in brief
Department reply in brief
Rebuttal
1 Sec-11 Agra (a) Observation: Sale of computer parts was shown in the assessment order @ five per cent. As per the Audit, this commodity should have been taxed @ 13.5 per cent.
The Department stated that computer parts are taxable @ five per cent under Schedule–II-Part-II B at Sl. no.22.
The reply is not acceptable. The computer parts are taxable @ five per cent with effect from 20 December 2014. The Audit observation is related to the assessment year 2013-14, when computer parts were taxable @ 12.5 per cent plus additional tax in that period.
2 JC (CC) Allahabad Observation: Sale of copper conductor was shown in the assessment order @ five per cent. As per the Audit, this commodity should have been taxed @ 14 per cent.
The Department has stated that the dealer is engaged in manufacturing of contact wire made from copper.
The basis of reply of the Department that the item is contact wire is not clear to the Audit in light of the fact that the dealer himself in his annual return stated that the item is copper conductor. Further, the assessing officer while passing the assessment order has specifically stated that the item is copper conductor. As such, the copper conductor is taxable @ 14 per cent as per UPVAT Act.
3 Sec 4 Ghaziabad Observation: The dealer has received a payment of ` 390.28 lakh against the value of soil upon which
The Department, in its reply, has stated that all the payments received by the dealer relates to labour and
The reply is not acceptable as in the assessment order, it is clearly mentioned that the dealer has received a payment of ` 390.28 lakh from the sale

Audit Report (Revenue Sector) for the year ended 31 March 2018
24
Sl. No.
Audited Unit/ Observation in brief
Department reply in brief
Rebuttal
no tax was imposed. As per the Audit, it should be taxed @ five per cent.
freight. As such no purchase of soil was made by the dealer.
of soil, on which the tax was not imposed. Soil is taxable @ five per cent as per UPVAT Act.
4 Sec-6 Ghaziabad Observation: Sale of machinery and machinery parts was shown in assessment order @ five per cent. As per the Audit, this commodity should have been taxed @ 14 per cent.
The Department, in its reply, has stated that the V-belt (machinery part) has been classified under Schedule–II according to the commodity code @ five per cent.
The reply is not acceptable as both in the return submitted by the dealer and in the assessment order of the assessing officer there is specific mention of machinery parts. Machinery parts are taxable @ 14 per cent as per UPVAT Act.
5 Sec-8 Ghaziabad (a) Observation: Sale of Mill Board was shown in the assessment order @ five per cent. As per the Audit, this commodity should have been taxed @ 13.5 per cent.
The Department stated that as per the Commissioner’s decision u/s 59, Mill Board is taxable @ five per cent.
The reply is not acceptable as any levy of tax on goods must be based on the authority of law. Decision of the Commissioner has to be in conformity with the statutory provision under the UPVAT Act. Therefore, Mill Board is taxable @ 13.5 per cent as per UPVAT Act.
6 Sec-8 Ghaziabad (b) Observation: Sale of Starch Based Adhesive Powder was shown in the assessment order and taxed @ 5 per cent. As per the Audit, this commodity should have been taxed @ 14 per cent.
The Department has stated that the dealer did not sell Starch Based Adhesive Powder. Instead, it sold chemicals only.
The reply is not acceptable as both in the return submitted by the dealer and in the assessment order of the assessing officer there is specific mention of Starch Based Adhesive Powder. Starch Based Adhesive Powder is taxable @ 14 per cent as per UPVAT Act.
7 Sec-10 Ghaziabad (b) Observation: Sale of scrap was shown in assessment order @ four per cent. As per audit, this commodity should have been taxed @ five per cent.
The Department has stated that the dealer is selling MS Scrap which is taxable @ four per cent.
The reply is not acceptable as both in the return submitted by the dealer and in the assessment order of the assessing officer there is specific mention of scrap. Further, the dealer is a manufacturer of plant & machinery. As such, dealer is selling scrap of the above product. Therefore, the product is taxable @ five per cent as per UPVAT Act.
8 Sec-21 Kanpur Observation: Sale of toffee was shown in the assessment order @ five per cent. As per the Audit, this commodity should have been taxed @ 14 per cent.
The Department stated that Toffee is classified under schedule-II-A, Sl. No. 137.
The reply is not acceptable as the dealer is engaged in selling of Perfetti Brands toffee such as Mentos, Alpenliebe etc. These branded toffees contains sugar less than 70 per cent. Only those toffees which contain minimum 70 per cent sugar, 25 per cent liquid glucose and five per cent essence colour combination will fall under the said schedule such as lemonchoos, lollypop etc. Sale of Perfetti Brands toffee is therefore taxable @ 14 per cent as per UPVAT Act.

Chapter III : Tax on Sales, Trade Etc.
25
Sl. No.
Audited Unit/ Observation in brief
Department reply in brief
Rebuttal
9 Sec-2 Kasganj Observation: Sale of toffee was shown in the assessment order @ five per cent. As per the Audit, this commodity should have been taxed @ 13.5 per cent.
The Department stated that the Commissioner judgement under Sec-59 Candy (Toffee) contain 70 per cent sugar will fall under Schedule-II such as Lemonchoos, lollypop etc.
The reply is not acceptable as the dealer is engaged in selling of ITC Ltd products such as Candyman, Eclairs, Jelimals, etc. These branded toffees contain sugar less than 70 per cent. Only those toffees which contain minimum 70 per cent sugar, 25 per cent liquid glucose and five per cent essence colour combination will fall under the said schedule such as lemonchoos, lollypop etc. Sale of ITC Ltd. Products such as Candyman Eclairs, Jelimals etc. is taxable @ 13.5 per cent as per UPVAT Act.
10 Sec-17 Lucknow Observation: Sale of scrap was shown in the assessment order @ four per cent. As per the Audit, this commodity should have been taxed @ five per cent.
The Department stated that reassessment was made on 16 November 2018 u/s 28 read with Sec 32 in which the dealer was found to have sold MS Scrap of ` 229.83 lakh at four per cent and scrap of ` 2.21 lakh at five per cent out of the total sale of scrap of ` 235.93 lakh.
The reply is not acceptable as both in the return submitted by the dealer and in the assessment order of the assessing officer there is specific mention of scrap of plastic and glass. Sale of scrap of plastic and glass is taxable @ five per cent as per UPVAT Act.
In the remaining 15 cases, amounting to ` 59.30 lakh, the Department stated that action is under process (August 2019).
Recommendation: CTD should consider instituting enquiry from vigilance angle in cases where typographic errors have been stated as reasons for application of incorrect rate of tax.
3.4 Central Sales Tax (CST)
3.4.1 Irregular exemption of tax
Under CST4 Act, where any dealer claims that he is not liable to pay tax, in respect of any goods, on the ground that the movement of such goods from one State to another was occasioned by reason of transfer of such goods by him to any other place of his business or to his agent or principal, as the case may be, and not by reason of sale, the burden of proving that the movement of those goods was so occasioned shall be on that dealer and for this purpose he may furnish to the assessing authority a declaration, duly filled and signed by the principal officer of the other place of business, or his agent or principal, 4 Section 6A (1).
Assessing Authorities allowed the irregular exemption of ` 2.80 crore on stock transfer of ` 55.97 crore as the dealer failed to submit the required declaration Form ‘F’ along with the proof of dispatch.

Audit Report (Revenue Sector) for the year ended 31 March 2018
26
containing the prescribed particulars in the prescribed form, along with the evidence of dispatch of such goods. If the dealer fails to furnish such declaration, then, the movement of such goods shall be deemed for all purposes of this Act to have been occasioned as a result of sale. The Hon`ble Supreme Court had also stated that the Form ‘F’ is required for all transfer of goods which are otherwise than by way of sale (M/s Ambika Steels Ltd. v/s State of U.P. and others in Civil Appeal No. 4970 of 2008 decided on 31st March 2009).
In the test check (June 2017) of assessment records of Sector-1 Firozabad, Audit noticed that in the case of one dealer (out of 803 dealers test checked), the AA, while finalising the assessments (between February 2016 and March 2017) for the year 2012-13 to 2013-14, allowed irregular exemption of ` 2.80 crore on stock transfer of ` 55.97 crore to another State, as the dealer had failed to submit the required declaration Form ‘F’ along with the proof of dispatch before the AA to substantiate his claim as per provisions of the Act. The details are mentioned in the Table-3.4.
Table - 3.4 Irregular exemption of tax
(` in crore) Sl. No
Name of unit
No. of dealer
Assessment year (month and year of assessment)
Name of goods
Value of
goods
Rate of tax
leviable (per cent)
Tax
2012-13 (February-2016)
Jackets, trousers etc.
29.23 5 1.46 1 DC Sec 1 Firozabad
1
2013-14 (March-2017)
Jackets, trousers etc.
26.74 5 1.34
Total 1 55.97 2.80
Audit reported the matter to the Department (July 2017). In its reply (January/May 2019), the Department stated that under Section 17, the dealer had no liability of tax and the goods manufactured were only for defence purposes. No purchase/sale is being done by the dealer. Therefore, it does not fall under the category of business defined under Section 2. The requirement of producing the form ’F’ for the above transaction had been waived off on the basis of the certificate issued by the Ministry of Defence and a letter issued by Finance Department. The reply of the Department is not acceptable as Section 17 is for registration of the dealer under the VAT Act. This section does not provide for any exemption to be allowed to the dealer. The dealer is engaged in trading of goods as is evident from the assessment order. Therefore, for claiming exemptions for the stock transfer, the dealer had to produce form ‘F’ as it is also evident from the above quoted Hon`ble Supreme Court Judgement.
Recommendation:
CTD should carefully examine all such cases where such exemptions are being allowed by the AAs.

Chapter III : Tax on Sales, Trade Etc.
27
3.4.2 Irregular concession allowed on goods not covered under the Registration Certificate (RC)
Under Central Sales Tax (CST) Act, 19565, a registered dealer may purchase any goods from outside the State at concessional rate of tax against the declaration in form ‘C’. If his respective registration certificate does not cover such goods, the dealer is liable to for persecution under the CST Act.6 However, if the Assessing Authority deems it fit, he, in lieu of prosecution, may impose a penalty up to one and a half times the tax payable on the sale of such goods. The Audit Reports for the year 2012-13 to 2016-17 had highlighted failure of AAs in observing the aforesaid provisions while finalising the assessments of 66 dealers resulting in non-levy of penalty of ` 6.51 crore. The Department in response to the Audit observations has assured to take appropriate action. Up till now, of the above, Audit Report 2012-13 has been discussed in the PAC in which the Department had reported a recovery of ` 21.56 lakh. Audit test checked (between February 2017 and December 2017) the assessment records of 13 CTOs (out of 256 CTOs audited). It noticed that 14 dealers (out of 3,710 dealers test checked) had purchased goods valued at ` 6.81 crore during the year 2010-11 to 2013-14 at a concessional rate of tax against declaration in Form ‘C’. However, the goods purchased were not covered by their respective RCs due to which they were liable to pay penalty at one and half times of the tax payable on the sale of such goods, in lieu of prosecution. The AAs, while finalising the assessment between October 2015 and March 2017, did not scrutinise the relevant RCs and the utilisation details of forms ‘C’ of the dealers in question, and consequently penalty of ` 1.05 crore could not be imposed (Appendix-V).
Audit reported the matter to the Department (between March 2017 and January 2018). In their replies (January/May 2019), the Department stated that a penalty of ` 92.29 lakh had been imposed in 11 cases out of which, in two cases, a recovery of ` 4.49 lakh had been reported. In two cases, the reply of the Department has been reviewed and not found acceptable as per analysis detailed in the Table 3.5.
5 Section 8 of the Central Sales Tax (CST) Act, 1956. 6 Section 10 of the CST Act.
The dealers had purchased goods valued at ` 6.81 crore which were not covered under the RC at concessional rates of tax against the declaration in form ‘C’. This fact was not scrutinised at the time of assessment and a penalty of ` 1.05 crore was not imposed.

Audit Report (Revenue Sector) for the year ended 31 March 2018
28
Table 3.5 Cases where the Department reply is not acceptable
Sl. No
Audited Unit/ Observation in brief
Department reply in brief
Rebuttal
1 Sec-9 Ghaziabad Observation: The dealer is not authorised to purchase bitumen at a concessional rate against the Form C as per the RC. As such, he is liable to pay 1.5 times of the tax due.
The Department stated that the dealer is authorised for the purchase of bitumen in his Registration Certificate (RC).
The reply is not acceptable, since as per the RC details seen in audit, the dealer was not authorised for the purchase of bitumen at concessional rate. Hence, penalty should have been imposed.
2 Sec-2 Shahjahanpur Observation: The dealer is not authorised to purchase Generator, machinery, compressor plate and elevator at a concessional rate against Form C as per the RC. As such, he is liable to pay 1.5 times of the tax due.
The Department stated that the dealer is registered for the purchase of electrical goods in his Registration Certificate (RC). As such, purchase of Generator, machinery, compressor plate and elevator comes under electrical goods.
The reply is not acceptable, as goods such as Generator7, machinery, compressor plate and elevator do not fall under the category of electrical goods. These goods fall under the category of machinery.
In the remaining one case, reply of the Department is awaited (August 2019).
Recommendation:
The CTD may ensure that while the assessment orders are being passed, the RCs and utilization certificates, where such concession are being considered by the AAs, should be carefully examined.
3.5 Irregularities relating to Input Tax Credit (ITC) Our scrutiny of records of the Department revealed several cases of irregularities regarding ITC claims such as inadmissible ITC allowed to dealers, excess claims, ITC not reversed, penalties not imposed and interest not charged thereon, etc. amounting to ` 14.32 crore in respect of 66 dealers in 54 CTOs for the period from 2009-10 to 2014-15. These cases are mentioned in the following paragraphs.
3.5.1 Inadmissible ITC allowed to dealers
Under UPVAT Act, 20088, tax paid on purchases of goods from registered dealers against tax invoices within the State or cash deposited on purchase of goods from the unregistered dealer, ITC to the extent provided under the relevant clauses of the said Act is allowed to the dealers subject to certain conditions and restrictions for resale or use in manufacture of goods intended for sale. Further9, if any dealer has wrongly claimed ITC in respect of any
7 Decision of High Court Allahabad in the case of Commissioner Trade Tax vs Elmech Engineers. 8 Section 13 of UPVAT Act, 2008. 9 Section 14 (2).
The dealers had wrongly claimed ITC amounting to ` 64.88 lakh which was irregularly allowed by the AAs. This resulted in non-reversal of ITC alongwith interest totalling ` 1.01 crore.

Chapter III : Tax on Sales, Trade Etc.
29
goods, benefit of ITC to the extent it is not admissible, shall stand reversed along with simple interest at the rate of 15 per cent per annum.
The Audit Reports for the year 2013-14 to 2016-17 had highlighted failure of AAs in observing the aforesaid provisions while finalising the assessments of 71 dealers resulting in non-reversal of ITC of ` 15.23 crore. The Department in response to the Audit observation has made assurance to take appropriate action. Audit test checked (between January 2017 and March 2018) the assessment records of 24 CTOs (out of 256 CTOs audited). It noticed that 27 dealers out of 9,855 dealers test checked, had wrongly claimed ITC of ` 64.88 lakh during the year 2009-10 to 2013-14 which was not admissible to them. The AAs while finalising the assessment between March 2015 and March 2017 were required to reverse this inadmissible ITC and direct the dealers to pay such amount of reverse ITC along with simple interest, which was not reversed. This resulted in non-reversal of ITC along with interest together totalling ` 1.01 crore (ITC ` 0.65 crore and interest ` 0.36 crore) (Appendix-VI).
Audit reported the matter to the Department (between February 2017 and April 2018). In their replies (January/May 2019), the Department accepted the Audit observation in 13 cases amounting to ` 36.32 lakh, out of which, in seven cases, a recovery of ` 15.35 lakh was reported by the Department. In seven cases the Department did not accept the Audit observation. The main contention of the Department in five of the seven cases not accepted by them was that the concerned AAs while passing the assessment orders, had made typographical errors10 in their initial orders, which they subsequently corrected when Audit observations were received by them. Audit urges the Department to fix accountability for such lapses. The analysis of Government/ Department’s replies in these seven cases is listed in the Table 3.6 (i) and Table 3.6 (ii).
Table 3.6 (i) Cases where the Department has mentioned typographical errors in the assessment
orders in cases pointed out by the Audit
Sl. No.
Audited Unit/ Observation in brief
Department reply in brief
Rebuttal
1 Sec-15 Agra Observation: ITC is being claimed on the exempted (no tax) item i.e. cloth as per purchase list submitted by the dealer. Hence, ITC claimed by the dealer on the purchase of exempted item cloth should be reversed.
Due to typographical error in his monthly returns, purchase of cloth was shown in his purchase list, however, ITC is being claimed on the taxable items by the dealer.
Cloth is a exempted item entailing no levy of VAT. Hence, basis of giving the excess benefit of ITC on the purchase of cloth is not clear. Examination of the records of the dealer indicates/ refer to ‘cloth’ in his purchase list in each month of his return. Hence, the reply regarding typographical error is not acceptable.
10 Wrong purchase list was submitted, high rate of admissible ITC was shown at lower amount, false ITC was carry
forwarded, etc.

Audit Report (Revenue Sector) for the year ended 31 March 2018
30
Sl. No.
Audited Unit/ Observation in brief
Department reply in brief
Rebuttal
2 Sec-18 Agra (b) Observation: Due to the calculation mistake, while allowing ITC as per the ITC admissible on the purchase, more ITC was allowed.
Due to typographical error, purchase of juice was shown at ` 60.54 lakh instead of ` 25.76 lakh and Purchase of cold drink was shown at ` 25.76 lakh instead of ` 60.54 lakh which has been amended u/s sec 31 dated 16 October 2018.
The reply is not acceptable as the dealer, in his annual return, has not given any bifurcation of his purchases. Bifurcation of purchase is mandatorily required under UPVAT Rules. Bifurcation of purchase has been clarified by the assessing authority at the time of finalising and passing the assessment order dated 28 October 2015.
3 Sec-3 Gorakhpur Observation: Due to the calculation mistake, while allowing ITC as per the ITC admissible on the purchase, more ITC was allowed.
Due to typographical error, purchase of cement sheet was shown at ` 46.60 lakh instead of at ` 77.05 lakh and Purchase of iron sheet was shown ` 1630.74 lakh instead of ` 1600.30 lakh. That was amended u/s sec 31.
The reply is not acceptable. The dealer, in his annual return, has not given any bifurcation of his purchases. Bifurcation of purchase is mandatory as per sub-rule (7) of Rule-45 of UPVAT Rules. Bifurcation of purchase has been clarified by the assessing authority at the time of finalising and passing the assessment order dated 11 January 2017.
4 Sec-20 Lucknow Observation: Due to the calculation mistake, while allowing ITC as per the ITC admissible on the purchase, more ITC was allowed.
Due to typographical error ` 6.09 lakh ITC was made admissible and ITC of ` 2.89 lakh was carried forward as per annual return in assessment order, which has been amended u/s 31 dated 6 March 2017 by making admissible ITC of ` 3.20 lakh and nil ITC was carried forward.
While the Department has accepted the facts pointed out by audit, the reply does not specify why the RITC along with interest has not been done. The amendment in the assessment order has been made u/s 31 dated 6 March 2017 for the assessment year 2012-13. Up till now the dealer has submitted the annual return for succeeding assessment year and had claimed excess ITC assessed by the AA at the time of assessment order for the assessment year 2012-13. The UPVAT Act/ Rules requires raising demand for excess ITC benefit given to the dealer along with interest at the time of assessment.
5 Sec-6 Meerut Observation: Due to the calculation mistake, while allowing ITC as per the ITC admissible on the purchase, more ITC was allowed.
Due to typographical error Gas Stove was not shown in the detail purchase list of ` 16.98 lakh which has been amended u/s 31 dated 21 May 2018.
The reply is not acceptable. The dealer, in his annual return, has not given any bifurcation of his purchases. Bifurcation of purchase is mandatory required under UPVAT Rules. Bifurcation of purchase has been clarified by the assessing authority at the time of finalising and passing the assessment order dated 20 August 2016. Further, in the reply given by the Department, the purchase value of Gas Stove is still not disclosed.

Chapter III : Tax on Sales, Trade Etc.
31
Table 3.6 (ii) Cases where the Department reply is not acceptable
Sl. No
Audited Unit/ Observation in brief
Department reply in brief Rebuttal
1 Sec-13 Agra Observation: ITC was allowed on discount.
Purchase which have been shown in annual return and accounts submitted by the dealer only that purchase have been incorporated in the assessment while passing the assessment order. As such no discount and credit note has been deducted from the purchase submitted by the dealer.
The reply of the Department is not convincing as the discount which has been shown in the Audited Balance Sheet has not been taken into account, at the time of passing the assessment order in allowing admissible ITC. Rule 21 of UPVAT Rule specifically states that ITC is not admissible on discount.
2 Sec-4 Jhansi Observation: Due to the calculation mistake, while allowing ITC as per the ITC admissible on the purchase, more ITC was allowed.
The Department stated that u/s 14 all the tax invoices of purchase have been verified and found to be correct. As such no Reverse Input Tax Credit (RITC) is required to be done.
The reply of the Department is not according to the facts submitted by the dealer in his return. The calculation mistake is self-evident, made in the assessment order while allowing ITC to the dealer.
In the remaining four cases, the Department stated that action is under process (August 2019).
Recommendation: CTD should carefully examine and verify the transections where ITC are being claimed by the dealers and benefit of ITC are being allowed by the AAs.
3.5.2 ITC on goods sold on lower price than purchase price not reversed
Under UPVAT Act, 2008,11 where goods purchased are resold or goods manufactured or processed by using or utilising such goods are sold, at the price which is lower than the purchase price of such goods in case of resale or cost price in case of manufacture, the amount of input tax credit shall be claimed and be allowed to the extent of tax payable on the sale value of goods or manufactured goods. If the dealer claims full amount of ITC, the ITC in excess of tax payable on the sale value of goods, will be reversed with simple interest at the rate of 15 per cent per annum.
The Audit Reports for the year 2014-15 to 2015-16 had highlighted failure of the AAs in observing the aforesaid provisions while finalising the assessments of 10 dealers resulting in non-reversal of ITC of ` 0.21 crore. The Department, in response to the Audit observations, has assured to take appropriate action.
11 Section 13(1)(f) of UPVAT Act, 2008.
The AAs had not reversed the ITC alongwith interest of ` 1.40 crore claimed by the dealers in respect of those goods which were sold by the dealers at a price lower than the purchase price.

Audit Report (Revenue Sector) for the year ended 31 March 2018
32
Audit test checked (between January 2017 and February 2018), the assessment records of 13 CTOs (out of 256 CTOs audited). It noticed that 13 dealers (out of 3,507 dealers test checked), had purchased goods worth ` 90.25 crore during the year from 2011-12 to 2013-14, had claimed an ITC of ` 4.86 crore and sold the said goods for ` 69.68 crore. The dealers availed ITC on the purchase price of the goods instead of to the extent of ` 3.98 crore, the tax payable on the sale value of goods. The AAs, while finalising the assessments between March 2015 and March 2017, neither reversed this inadmissible ITC nor created any demand with simple interest. Thus ITC along with interest together totalling ` 1.40 crore was not reversed (ITC ` 0.88 crore and interest ` 0.52 crore) (Appendix-VII). Audit reported the matter to the Department (between March 2017 and April 2018). In their replies (January/May 2019), the Department accepted the Audit observation in four cases amounting to ` 1.18 crore. Out of these, in three cases, ` 8.95 lakh had been recovered. One accepted case with a total financial implication of 0.73 crore was still to be acted upon. In two cases the Department did not accept the Audit observation. The main contention of the Department in one out of the two cases not accepted by them was that the concerned AAs while passing the assessment orders, had made typographical errors12 in their initial orders, which they subsequently corrected when Audit observations were received by them. Audit urges the Department to fix accountability for such lapses. The analysis of Government’s replies in these two cases is listed in the Table-3.7(i) and. Table-3.7(ii).
Table-3.7 (i) Cases where the Department has mentioned typographical errors in the assessment
orders in the cases pointed out by the Audit Sl. No.
Audited Unit/ Observation in brief
Department reply in brief Rebuttal
1 Sec-10 Varanasi Observation: Less sale is shown in comparison to purchase hence Reverse Input Tax Credit (RITC) on loss of sale is required.
Due to typographical error in the closing stock in the assessment order, purchase of goods @ 14 per cent was mentioned in place of goods purchased @ five per cent and vice-versa which have been amended u/s 31. Due to this revised assessment order sale of goods, as a result, sale of goods taxable @ five per cent was found to be less by ` 1.70 lakh on which RITC of ` 0.09 lakh was done and was deposited by the dealer later on 1 May 2018.
The reply is not acceptable. The assessing authority at the time of passing the assessment order had accepted the trading account of the dealer while finalising the assessment order. After being pointed out by Audit, the dealer has submitted a revised return in which the goods @ five per cent was shown in place of goods @ 14 per cent and vice versa in the closing stock. This is not a typographical error as the dealer has submitted a revised return after the assessment has been passed. Further, no provisions were shown to the Audit whereby the AAs accepted the revised returns after passing the initial order.
12 Figures of different commodity of rate of tax was wrongly mentioned in the assessment orders.

Chapter III : Tax on Sales, Trade Etc.
33
Table-3.7 (ii) Cases where Department reply is not acceptable
Sl. No.
Audited Unit/ Observation in brief
Department reply in brief
Rebuttal
1 Sec-1 Faizabad Observation: Less sale is shown in comparison to purchase, hence Reverse Input Tax Credit (RITC) on loss of sale is required.
The Department stated that u/s 31, account of the dealer has been verified and accepted. Therefore, no Reverse Input Tax Credit (RITC) is required.
The reply of the Department is not according to the facts submitted by the dealer in his annual return. The less sale in comparison to purchase in the assessment order as well as in the annual return submitted by the dealer is self-evident. Hence, due to loss in sale as is evident from the assessment order RITC needs to be done.
In the remaining seven cases, the Department stated that action is in process (August 2019).
Recommendation:
CTD should carefully examine and verify the cases where ITC are being claimed by the dealer.
3.5.3 Incorrect claim of ITC on goods purchased which were taxable at lower rates than that claimed by the dealers
Under UPVAT 2008, ITC to the extent provided under the relevant clauses of the said Act and Rules, is allowed on tax paid or payable by a registered dealer on purchase of taxable goods from within the State subject to certain conditions and restrictions for resale or use in manufacturing of goods intended to resale. Further13, if any dealer has wrongly claimed ITC in respect of any goods, benefit of ITC to the extent it is not admissible, shall stand reversed along with simple interest at the rate of 15 per cent per annum. The Audit Reports for the year 2012-13 and for the period from 2014-15 to 2016-17 had highlighted failure of AAs in observing the aforesaid provisions while finalising the assessments of 40 dealers resulting in correct claim of ITC of ` 3.03 crore. The Department in response to the Audit observations has assured to take appropriate action. Up till now, of the above, Audit Report 2012-13 has been discussed in the PAC in which the Department reported a recovery of ` 5.33 lakh.
Audit test checked (between February 2017 and September 2017), of the assessment records of five CTOs (out of 256 CTOs), revealed that five dealers (out of 1,330 dealers test checked), had purchased goods worth ` 18.06 crore during the year 2012-13 to 2014-15 and had claimed an ITC of ` 2.53 crore at the rate of 13.5 to 14 per cent instead of ` 90.28 lakh at the rate of five per cent. Goods purchased by the dealers were mentioned in Schedule II of UPVAT Act and rate of tax applicable was five per cent. The AAs, while finalising the assessments between March 2016 and January 2017, did not
13 Under Section 14(2).
The AAs had not reversed the ITC alongwith interest of ` 2.20 crore claimed by the dealers in respect of goods which were taxable at lower rates than that claimed by the dealers.

Audit Report (Revenue Sector) for the year ended 31 March 2018
34
notice this fact, and without carrying out any cross verification and thorough examination, allowed an excess inadmissible ITC of ` 1.62 crore to the dealers. This incorrect claim attracts reversal of ITC along with interest of ` 2.20 crore (ITC ` 1.62 crore and interest of ` 0.58 crore) which was not done by the AAs. The details are mentioned in the Table-3.8.
Table-3.8 Incorrect claim of ITC on goods purchased which were taxable at lower rates than
claimed by dealers (` in lakh)
Sl. No.
Name of the unit
Number of
dealers
Assessment year (month and year of assessment)
Name of goods
Value of
goods
ITC claimed by the dealer
ITC admissible
to the dealer
Amount of
RITC not
done by AAs
Interest leviable
1 Sec. 1 Agra
1 2013-14 (December
2016)
Foam and fabrics
28.22 3.95 1.41 2.54 1.23
2
JC (CC) Gorakhpur
1 2012-13 (March 2016)
Wooden drum
25.43 3.52 1.27 2.25 1.18
3 DC Sec. 1 G B Nagar
1 2013-14 (January
2017)
Centrifugal mono block pump sets, hose collar and spare
parts
21.74 3.04 1.09 1.95 0.97
4 DC Sec. 2 Kanpur
1 2014-15 (January
2017)
Multimedia, speaker,
head phones
1,645.95 230.43 82.30 148.13 51.20
5 DC Sec. 6 Noida
1 2013-14 (July 2016)
Digital video
camera
84.21 11.79 4.21 7.58 3.17
Total 5 1,805.55 252.73 90.28 162.45 57.75
Audit reported the matter to the Department (between March 2017 and September 2017). In their replies (January/May 2019), the Department accepted the Audit observation in three cases amounting to ` 17.10 lakh. In remaining two cases, Department did not accept the observation. The reply of the Department in these cases has been reviewed and not found acceptable as per analysis detailed in the Table 3.9 (i) and Table 3.9 (ii).
Table 3.9(i) Cases where Department has mentioned typographical errors in the assessment orders
in cases pointed out by the Audit Sl. No
Audited Unit/ Observation in brief
Department reply in brief
Rebuttal
1 Sec-1 Agra Observation: Purchase of foam and fabrics was shown in assessment order @ 14 per cent. As per Audit, ITC admissible @ five per cent.
The Department stated that the dealer had actually purchased adhesive which, by mistake, was mentioned as foam and fabrics in the assessment order which has been amended u/s 31 dated 17 March 2018
The reply is not acceptable, as in the initial assessment order passed on 20 December 2016 purchase of foam and fabrics has been specifically shown. A typographical error cannot occur on several pages. Further, the dealer himself in his annual return has shown the purchase of same commodity. Further no supporting documents were given to audit to establish the claim of the Department on purchase of adhesive. Hence, ITC claimed at higher rates on foam and fabrics needs to be reversed.

Chapter III : Tax on Sales, Trade Etc.
35
Table3.9 (ii) Cases where Department reply is not acceptable
Sl. No
Audited Unit/ Observation in brief
Department reply in brief
Rebuttal
1 Sec-2 Kanpur Observation: ITC on speakers, microphone, etc. is admissible as per Schedule II instead of Schedule V.
The Department stated that the dealer trades in the public address systems such as speaker, microphone etc. which is taxable @ 12.5 per cent plus additional tax.
The reply of the Department is not acceptable. UPVAT Schedule –II –Part-II- B -Sl. No. 2 unambiguously stipulates that speakers, microphone, etc. are classified under this entry, and as such, ITC @ five per cent is admissible on these items. Hence, ITC claimed at higher rates on speakers, microphone, etc., needs to be reversed.
Recommendation:
The CTD should ensure periodic and randomised reviews of all ITC claims to ensure that ITC is being claimed as per prescribed rates.
3.5.4 False/fraudulent claim of ITC
Under UPVAT 200814, if the purchased goods are resold, ITC is allowed to the extent of the tax paid or payable by the dealer on such sale or purchase. Further,15 if the AA is satisfied that any dealer falsely or fraudulently claims an amount as ITC, he may direct such dealer to pay a penalty of a sum equal to five times of amount of ITC, in addition to the tax. The Audit Reports for the year 2012-13 to 2015-16 had highlighted failure of AAs in observing the aforesaid provisions while finalising the assessments of 89 dealers resulting in non-imposition of penalty of ` 21.20 crore. The Department in response to the Audit observations has assured to take appropriate action. Up till now, of the above, Audit Report 2012-13 has been discussed in the PAC in which ` 11.13 lakh was recovered by the Department. Audit test checked (between October 2016 and March 2018), the assessment records of 20 CTOs (out of 256 CTOs), revealed that in the case of 21 dealers (out of 5,727 dealers test checked), the AAs had cross verified the ITC claim of the dealers and found that the dealers had falsely/fraudulently claimed ITC amounting to ` 1.94 crore during the year 2009-10 to 2014-15. Though the AAs, while finalising the assessments (between April 2013 and March 2017), reversed the ITC, they chose not to impose the penalty due amounting to ` 9.71 crore (Appendix-VIII).
Audit reported the matter to the Department (between December 2016 and April 2018). In their replies (January/May 2019), the Department accepted the Audit observation in 18 cases amounting to ` 5.05 crore. In two cases, ` 41.46
14 Section 54(1) (19) of the VAT Act. 15 Section 13 of UPVAT Act, 2008 read with Rule 24 of UPVAT Rules, 2008.
On cross verification undertaken by the Department, ITC amounting to ` 1.94 crore claimed by the dealers was found false. Though it was reversed by the AAs, penalty amounting to ` 9.71 crore was not imposed against the defaulters.

Audit Report (Revenue Sector) for the year ended 31 March 2018
36
lakh had been recovered. In remaining three cases, the Department stated that action is in process (August 2019).
Recommendation: CTD should carefully examine and verify the cases where ITC is being claimed falsely or fraudulently by the dealer.
3.6 Interest short/not charged
Under UPVAT Act 2008, and Entry of Goods into Local Areas Act, 200716, every dealer liable to pay tax is required to deposit the amount of tax into the Government Treasury before the expiry of due date failing which simple interest at the rate of one and quarter per cent per month from 1 January 2008 shall become due and be payable on unpaid amount with effect from the day immediately following the last date prescribed till the date of payment.
The Audit Reports for the year 2012-13 to 2016-17 had highlighted failure of AAs in observing the aforesaid provisions while finalising the assessments of 123 dealers resulting in non/short levy of interest of ` 10.57 crore. The Department in response to the Audit observations has assured to take appropriate action. Up till now, of the above, Audit Report 2012-13 has been discussed in the PAC in which ` 33.24 lakh was recovered by the Department.
Audit test checked (between March 2017 and March 2018), the assessment records of 25 CTOs (out of 256 CTOs) revealed that 28 dealers (out of 13,651 dealers test checked) had deposited the admitted tax of ` 5.56 crore during the year 2008-09 to 2013-14 with delays ranging from 32 days to 2,610 days without paying the due interest on account of the delay. The belated payment of admitted tax attracted interest of ` 2.60 crore up to the date of deposit of tax, whereas the dealers deposited ` 4.02 lakh only. The AAs while finalising the assessment between July 2013 and March 2017 did not charge interest of ` 2.56 crore (Appendix-IX). Audit reported the matter to the Department (between April 2017 and April 2018). In their replies (January/May 2019), the Department accepted the Audit observation in 23 cases amounting to ` 55.74 lakh, out of which ` 28.05 lakh was reported as recovered in 13 cases. In the cases accepted by the Department, there is however no indication of action proposed to be taken against the AAs for their failure to levy of interest in the cases of delayed deposit of admitted tax, as per the law. The Department did not accept the finding in one case where it stated that the dealer has opted for compounding scheme and compounding fees was deposited on various dates as per applicable rules and as such interest of ` 0.11 lakh and of ` 0.06 lakh had been deposited on 2 February 2018 and 25 January 2018 respectively. The reply of the Department is not acceptable. The dealer has deposited the interest after the delay was pointed by the audit. Further, the dealer had not deposited the
16 Section 33(2) of the UPVAT Act 2008 read along with Section 13 of Uttar Pradesh Tax on Entry of Goods into
Local Areas Act, 2007.
The dealers had deposited the admitted tax of ` 5.56 crore with delay, on which interest was chargeable. However, the same was not charged at the time of assessment resulting in non-levy of interest amounting to ` 2.56 crore.

Chapter III : Tax on Sales, Trade Etc.
37
full interest i.e. ` 1.07 lakh (1 October 2013 to 5 October 2016). In remaining four cases, Department stated that action is in process (August 2019).
Recommendation: CTD should carefully calculate the interest amount in cases where there is delay in payment of due taxes by the dealers.
3.7 Penalties not imposed Tax related legislations carry penal provisions are made to discourage malafide practices by the dealers. The AAs, while finalising the assessments, disregarded various offences committed by the dealers i.e. transactions not recorded in the accounts books, delayed deposit of tax, transactions against the provisions of the UPVAT Act and Rules made thereunder, etc. Though there are clear cut provisions for imposition of penalties in the Act, the AAs concerned chose not to impose penalty amounting to ` 33.52 crore in the case of 218 dealers in respect of 125 CTOs for the period from 2007-08 (VAT) to 2015-16 as mentioned in the following paragraphs:
3.7.1 Concealment of turnover
Under UPVAT Act17, where a dealer has concealed particulars of his turnover or has deliberately furnished inaccurate particulars of such turnover, or submitted a false tax return under this Act or evaded payments of tax which he is liable to pay under this Act, the AA may direct that such dealer shall, in addition to the tax, if any, payable by him, pay by way of penalty, a sum equal to three times the amount of tax concealed or avoided. The Audit Reports for the year 2012-13 to 2015-16 had highlighted failure of AAs in observing the aforesaid provisions while finalising the assessments of 170 dealers resulting in non-imposition of penalty of ` 8.93 crore. The Department in response to the Audit observations has assured to take appropriate action. Up till now, of the above, Audit Report 2012-13 has been discussed in the PAC in which ` 9.58 lakh was recovered by the Department. Audit test checked (between January 2017 and March 2018), the assessment records of 56 CTOs (out of 256 CTOs) revealed that 69 dealers (out of 25,491 dealers test checked) had concealed purchases and sales turnover amounting to ` 20.44 crore during the year from 2007-08 to 2015-16. As the dealers had wrongfully concealed their turnover, they were liable to pay penalty of a sum equal to three times the tax concealed. However, the AAs, while finalising the assessments (between September 2012 and March 2017), chose to levy a tax amounting to only ` 1.22 crore on this concealed turnover. The concerned AAs neither imposed penalty amounting to ` 3.66 crore nor recorded any reason for not imposing the penalty (Appendix-X). This was despite the fact that in 40 cases falling under 32 sectors, the Appellate Authorities had confirmed (between June 2014 and November 2017) that the dealers had concealed the turnover/evaded payment of liable tax or the dealers had
17 Section 54(1) (2).
The Assessing Authorities did not impose penalty amounting to ` 3.66 crore on concealed turnover amounting to ` 20.44 crore.

Audit Report (Revenue Sector) for the year ended 31 March 2018
38
themselves accepted the same and deposited the tax due on the concealed turnover.
Audit reported the matter to the Department (between March 2017 and April 2018). In their replies (January/May 2019), the Department accepted the Audit observation in 56 cases amounting to ` 2.81 crore, out of which in 15 cases, ` 49.25 lakh had been recovered. In three cases, the Department did not accept the finding. The reply of the Department is not acceptable, as in these three cases, concealment has been confirmed by the Appellate Authority as brought out in the following Table 3.10.
Table 3.10 Cases where Department reply is not acceptable
Sl. No.
Audited Unit Department reply in brief
Rebuttal
1 JC(CC) Gorakhpur
2 Sec. 3 Gorakhpur
3 Sec. 2 Kanshiramnagar (Kasganj)
The Department stated that if the concealment is not intentional penalty cannot be imposed.
In all the three cases the dealers filed an appeal regarding concealment of turnover. In all these cases, the Appellate Authority upheld the contention of Assessing Officer, thereby confirming the fact of concealment. In these circumstances, the reply of the Department that the concealment is not intentional, is not acceptable.
In the remaining 10 cases, the Department stated that the action is in process. (August 2019).
Recommendation: CTD should carefully examine all the cases where concealment of turnover by the dealers is detected and ensure that due penalty is imposed for ensuring tax compliance.
3.7.2 Delayed deposit of admitted tax
Under UPVAT Act18, if the AA is satisfied that any dealer has, without reasonable cause, failed to deposit the tax due for any tax period within prescribed or extended time, he may direct the dealer to pay, by way of penalty in addition to tax, if any payable by him, a sum equal to 20 per cent of the tax due. The Audit Reports for the year 2012-13 to 2015-16 had highlighted failure of AAs in observing the aforesaid provisions while finalising the assessments of 201 dealers resulting in non-imposition of penalty of ` 9.76 crore. The Department in response to the Audit observations has assured to take appropriate action. Up till now, of the above, Audit Report 2012-13 has been discussed in the PAC in which ` 8.82 lakh were recovered by the Department. Audit test check (between September 2015 and March 2018), the assessment records of 60 CTOs (out of 256 CTOs) revealed that 80 dealers (out of 26,519 dealers test checked) had not deposited their admitted tax of ` 15.31 crore for the period 2008-09 to 2014-15 in time. The delays ranged between five days to 1,397 days. As the tax was deposited late, penalty amounting to a sum equal to
18 Sec 54(1) (1) (a).
The AAs, while finalising the assessments, did not impose penalty amounting to ` 3.06 crore and an interest of ` 55.30 lakh on delayed deposit of admitted tax amounting to ` 15.31 crore.

Chapter III : Tax on Sales, Trade Etc.
39
20 per cent of the tax due in addition to the tax levied, was payable by the dealers in question. However, the AAs, while finalising the assessments (between May 2012 and March 2017), chose not to impose the penalty amounting to ` 3.06 crore along with interest of ` 55.30 lakh nor recorded any reason for not imposing the penalty and the interest (Appendix-XI).
Audit reported the matter to the Department (between April 2017 and April 2018). In their replies (January/May 2019), the Department accepted the Audit observation in 58 cases amounting to ` 2.14 crore, out of which in 10 cases, ` 17.92 lakh had been recovered. In four cases, the Department did not accept the audit finding. The reply of the Department is not acceptable as in all the four cases, admitted tax was deposited without interest/after being pointed out by the Audit which is contrary to the provision of the VAT Act, as per the analysis detailed in the following Table 3.11.
Table 3.11 Cases where the Department reply is not acceptable
Sl. No.
Audited Unit/ Observation in
brief
Department reply in brief
Rebuttal
1 Sec-12 Allahabad Observation: Admitted tax for the month of 03/14 was deposited with a delay of 278 to 887 days. As such, penalty is leviable as per the VAT Act.
The Department stated that the dealer has opted for compounding scheme and various compounding fees of ` 9.64 lakh was deposited on various dates with interest. As such, penalty is not leviable.
The Department reply is not according to the facts submitted by the dealer. The challan copy of the admitted tax submitted by the dealer in his return indicate that the admitted tax was deposited without interest at the time of audit. Hence, the reply of the Department that the dealer has deposited the admitted tax with interest is not correct. As such, penalty should have been imposed.
2 Sec-5 Bareilly Observation: Admitted tax for the month July 2012 and August 2012 was deposited with delay ranging from six to nine days. As such penalty is leviable as per UPVAT Act.
The Department stated that admitted tax was deposited with interest of ` 2,000/- and ` 4,000/-dated 4 August 2017 and penalty will not be imposed if delay is for 10 days and the admitted tax was deposited with interest as per Commissioner’s circular.
The reply of the Department is not acceptable. As per the Commissioner’s Circular, if the delay of the admitted tax is up to 10 days and the admitted tax was deposited with interest with justified reasons by the dealer, penalty will not be imposed. In the instant case the dealer has deposited the admitted tax with delay and without interest. As such, the above Circular of the Commissioner is not applicable in the instant case. Hence, penalty should have been imposed.
3 Sec-8 Lucknow Observation: Admitted tax for the month of December 2013 and January 2014 was deposited with delay ranging from five to seven days. As such penalty is leviable as per VAT Act.
The Department stated that if the admitted tax is deposited with interest penalty will not be imposed as per Hon. High Court decision dated 26 October 2004.
The Department reply is not according to the facts submitted by the dealer. The challan copy of the admitted tax submitted by the dealer in his return indicate that the admitted tax was deposited without interest at the time of audit. Hence, the reply of the Department that the dealer has deposited the admitted tax with interest is not correct. As such, penalty should have been imposed.
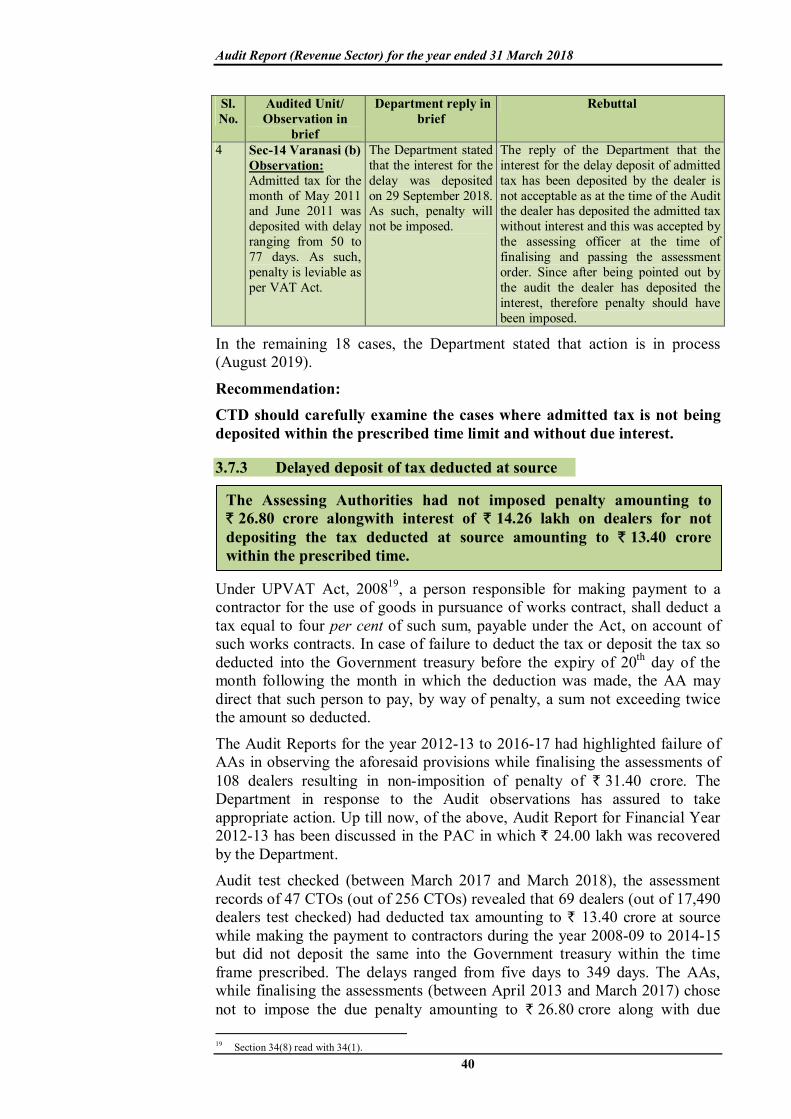
Audit Report (Revenue Sector) for the year ended 31 March 2018
40
Sl. No.
Audited Unit/ Observation in
brief
Department reply in brief
Rebuttal
4 Sec-14 Varanasi (b) Observation: Admitted tax for the month of May 2011 and June 2011 was deposited with delay ranging from 50 to 77 days. As such, penalty is leviable as per VAT Act.
The Department stated that the interest for the delay was deposited on 29 September 2018. As such, penalty will not be imposed.
The reply of the Department that the interest for the delay deposit of admitted tax has been deposited by the dealer is not acceptable as at the time of the Audit the dealer has deposited the admitted tax without interest and this was accepted by the assessing officer at the time of finalising and passing the assessment order. Since after being pointed out by the audit the dealer has deposited the interest, therefore penalty should have been imposed.
In the remaining 18 cases, the Department stated that action is in process (August 2019).
Recommendation: CTD should carefully examine the cases where admitted tax is not being deposited within the prescribed time limit and without due interest.
3.7.3 Delayed deposit of tax deducted at source
Under UPVAT Act, 200819, a person responsible for making payment to a contractor for the use of goods in pursuance of works contract, shall deduct a tax equal to four per cent of such sum, payable under the Act, on account of such works contracts. In case of failure to deduct the tax or deposit the tax so deducted into the Government treasury before the expiry of 20th day of the month following the month in which the deduction was made, the AA may direct that such person to pay, by way of penalty, a sum not exceeding twice the amount so deducted.
The Audit Reports for the year 2012-13 to 2016-17 had highlighted failure of AAs in observing the aforesaid provisions while finalising the assessments of 108 dealers resulting in non-imposition of penalty of ` 31.40 crore. The Department in response to the Audit observations has assured to take appropriate action. Up till now, of the above, Audit Report for Financial Year 2012-13 has been discussed in the PAC in which ` 24.00 lakh was recovered by the Department. Audit test checked (between March 2017 and March 2018), the assessment records of 47 CTOs (out of 256 CTOs) revealed that 69 dealers (out of 17,490 dealers test checked) had deducted tax amounting to ` 13.40 crore at source while making the payment to contractors during the year 2008-09 to 2014-15 but did not deposit the same into the Government treasury within the time frame prescribed. The delays ranged from five days to 349 days. The AAs, while finalising the assessments (between April 2013 and March 2017) chose not to impose the due penalty amounting to ` 26.80 crore along with due 19 Section 34(8) read with 34(1).
The Assessing Authorities had not imposed penalty amounting to ` 26.80 crore alongwith interest of ` 14.26 lakh on dealers for not depositing the tax deducted at source amounting to ` 13.40 crore within the prescribed time.

Chapter III : Tax on Sales, Trade Etc.
41
interest of ` 14.26 lakh nor recorded any reason for not imposing the penalty and the interest (Appendix-XII).
Audit reported the matter to the Department (between April 2017 and April 2018). In their replies (January/May 2019), the Department accepted the Audit observation in 53 cases amounting to ` 18.71 crore, out of which, in two cases, ` 2.35 lakh was recovered. Replies of the Department are not acceptable in four cases as detailed in the Table 3.12.
Table 3.12 Cases where the Department reply is not acceptable
Sl. No.
Audited Unit/ Observation in
brief
Department reply in brief Rebuttal
1 Sec-16 Agra(a) Observation: TDS for the month of March 2014 was deposited with a delay of eight days without interest. Hence, the penalty was leviable as per the VAT Act.
The Department stated that the delay was of eight days, and as per Commissioner’s circular, if the period of delay is less than 10 days, penalty will not be leviable. Interest of ` 1,305/- was deposited by the dealer for the delay.
The reply of the Department is not acceptable. As per the Commissioner’s Circular, if the delay of the admitted tax is up to 10 days and the admitted tax was deposited with interest with justified reasons by the dealer, penalty will not be imposed. In the instant case, the dealer has deposited the admitted tax with delay and without interest. As such, the above Circular of the Commissioner is not applicable in the said case. Hence, penalty should have been imposed on the dealer.
2 Sec-16 Agra (b) Observation: Various TDS for the month of April 2013 and March 2014 was deposited with a delay ranging from eight to nine days without interest. Hence, the penalty was leviable as per VAT Act.
The Department stated that the delay was of eight days, and as per Commissioner’s circular, if the period of delay is less than 10 days, penalty will not be leviable. Interest of ` 1,9743/- was deposited by the dealer for the delay.
The reply of the Department is not acceptable. As per the Commissioner’s Circular, if the delay of the admitted tax is up to 10 days and the admitted tax was deposited with interest with justified reasons by the dealer, penalty will not be imposed. In the instant case the dealer has deposited the admitted tax with delay and without interest. As such, the above Circular of the Commissioner is not applicable in the said case.
3 Sec-8 Ghaziabad (b) Observation: TDS for the month of January 2012 was deposited with a delay of 11 days without interest. Hence the penalty was leviable as per UPVAT Act.
The Department stated that tax was deducted on 8 February 2012 which was deposited on 2 March 2012 as such TDS was deposited in due time.
The reply of the Department is not according to the facts submitted by the dealer at the time of the assessment. The return of the dealer states that the TDS for the month of January 2012 which was to be deposited on or before 20 February 2012 was deposited on 2 March 2012 with a delay of 11 days. Hence, penalty should have been imposed on the dealer.

Audit Report (Revenue Sector) for the year ended 31 March 2018
42
Sl. No.
Audited Unit/ Observation in
brief
Department reply in brief Rebuttal
4 Sec-17 Varanasi Observation: TDS for the month of February 2013 was deposited with a delay of 11 days without interest. Hence the penalty was leviable as per VAT Act.
The Department stated that there was no deduction in the month of February 2013. February 2013 was erroneously mentioned in place of May 2013 in the challan form. As such, there was no delay.
The reply of the Department is not according to the facts submitted by the dealer at the time of assessment. It is not clear to the Audit how the TDS for the month of May 2013 was deposited on 31 March 2013 even before the TDS was deducted. The return of the dealer states that the TDS for the month of February 2013 which was to be deposited on or before 20 March 2013 was deposited on 31 March 2013 involving a delay of 11 days. Hence, penalty should have been imposed on the dealer.
In the remaining 12 cases, the Department stated that action is in process (August 2019).
Recommendation: CTD should ensure timely deposit of TDS by the dealers/contractors.
3.8 Non-forfeiture of amount wrongly realised by the dealers as tax
Under UPVAT Act20, where any amount has been realised from any person by a dealer, purporting to do so by way of realisation of tax on the sale or purchase of goods, in contravention of the provisions of the Act, such amount deposited by any dealer, shall to the extent is not a due tax be held by the State Government. Audit test checked (between April 2017 and March 2018) records of eight CTOs21(out of 256 CTOs). Audit noticed that nine dealers (out of 2,824 dealers test checked) had charged/realised an excess amount of ` 4.61 crore as tax in contravention of the provisions of the Act for the period from 2011-12 and 2013-14 to 2014-15. The AAs while finalising the assessment between April 2015 and March 2017 did not forfeit this amount so realised by the said dealers. (Appendix-XIII).
Audit reported the matter to the Department (between May 2017 and April 2018). The reply of the Department is still awaited (August 2019).
20 Section 43(2). 21 JC(CC) Range-B, GB Nagar-1; ` 138.75 lakh, Sec-2 Kanpur-1; ` 293.55 lakh, Sec-16 Kanpur-1; ` 0.88 lakh,
Sec-3 LKheri-1; ` 16.67 lakh, Sec-1 Lalitpur-2; ` 2.77 lakh & ` 2.17 lakh, Sec-1 Noida-1; ` 5.33 lakh, Sec-2 Pilibhit-1; ` 0.67 lakh, Sec-3 Sultanpur-1; ` 0.53 lakh.
The dealers had collected tax of ` 4.61 crore in excess of their tax liability. However, the AAs did not forfeit this amount wrongly realised by the dealers.

Chapter III : Tax on Sales, Trade Etc.
43
Recommendation: CTD should carefully examine the cases where the dealers have wrongly realised an amount as tax from other dealers in contravention of the provisions of the Act.
3.9. Preparedness for transition to Goods and Services Tax 3.9.1 Introduction Goods and Services Tax (GST)22, implemented with effect from 1 July 2017, is levied on intra-State supply of goods or services (except alcohol for human consumption and upon five specified petroleum products23) separately but concurrently by the Union (CGST) and the States (SGST)/Union territories (UTGST). Further, under the provisions of the new taxation regime, Integrated GST (IGST) is being levied on inter-State supply of goods or services (including imports). The Parliament has the exclusive power to levy IGST. GST has replaced a plethora of state and central taxes. The main taxes replaced include the Value Added Tax (VAT) on intra-State sale of goods in the series of sales by successive dealers as per Uttar Pradesh Value Added Tax (UPVAT) Act, 2008, and the Central Sales Tax (CST) levied on the sale of goods in the course of inter-State trade or commerce as per the CST Act, 1956.
Under the previous VAT regime, the State Government was empowered to regulate the provisions of UPVAT Act. The provisions related to GST on the other hand are regulated by the Centre and the State on the recommendations of the Goods and Services Tax Council (GSTC), constituted with representation from both the Centre as well as all the States to recommend on the matters related to GST. The State Government notified (May 2017) the Uttar Pradesh Goods and Services Tax Act, 2017 and the Uttar Pradesh Goods and Services Tax Rules 2017 (June 2017) subsuming various local and central taxes24. Goods and Services Tax Network (GSTN) was set up by the Government of India as a private company to provide IT services to the State and Central tax authorities. GSTN manages the entire IT system of the GST portal. It is used by the Government to track every financial transaction, and provides the taxpayers with all services-from registration to filing taxes and maintaining all tax details. It comprises Front-end IT services intended for use by the taxpayers such as registration, payment of tax and filing of returns, and back end IT services including registration approval, taxpayer detail viewer, refund processing, MIS reports, etc. for use by the taxation authorities. Back end services are available to only Model-II25 States, of which Uttar Pradesh is one.
3.9.2 Audit objectives The audit was conducted with a view:
to evaluate the preparedness of the State Government for implementing the IT solution;
22 Central GST: CGST and State/Union Territory GST: SGST/UTGST. 23 Petroleum Products: crude, high speed diesel, petrol, aviation turbine fuel and natural gas. 24 Value Added Tax, Central Sales Tax, Entry Tax, Luxury Tax and Entertainment Tax. 25 Model I States: Only front end services provided by GSTN.
Model II States: Both front end and back end services provided by GSTN.

Audit Report (Revenue Sector) for the year ended 31 March 2018
44
to assess the capacity building measures undertaken by State Government for its employees for framing/implementing the Rules /Regulations/ IT system; and
to analyse the strategy of the State Government in handling the issues of legacy tax regime.
3.9.3 Audit criteria The audit criteria were derived from the provisions of the following Acts, rules and notifications/circulars issued thereunder:
Uttar Pradesh Goods and Services Tax Act, 2017; Uttar Pradesh Goods and Services Tax Rules, 2017; GST (Compensation to States) Act, 2017; The Taxation Laws Amendment Act, 2017; Integrated Goods and Services Tax Act, 2017; Acts relating to subsumed taxes and Rules made thereunder:
o Uttar Pradesh VAT Act, 2008, Uttar Pradesh Tax on Entry of Goods into Local Areas Act, 2007, Central Sales Tax Act, 1956 and other guidelines issued by Central/State Government and GST Council.
3.9.4 Scope of Audit The activities of the State Government/Commercial Taxes Department relating to implementation of GST since the 101st amendment to the Constitution of India i.e. with effect from 8 September 2016 to 31 March 2018, were reviewed in the course of audit. Besides, information / data obtained from the Office of the Commissioner, Commercial Tax, Uttar Pradesh regarding Migration of Dealers in GST, Transitional Credit and GST Refunds. Action taken with respect to Legacy issues i.e. assessment, recovery/refund etc. was also examined.
The State Commercial Taxes Department did not provide Audit with either access to the GSTN or to any data dump related to the GST data in its possession despite persistent persuasion. As GST data was not shared, we were unable to audit and therefore, this section of the report is derived largely from the information provided to Audit with respect to its queries and requisitions, but without any independent verification vis-à-vis actual databases or documents. An entry conference with the Commissioner, Commercial tax was held on 18 March 2019. The observations were sent to the Department on 11 June 2019. A meeting in this regard was held with the Department on 14 June 2019 to discuss the findings. The final observations were forwarded to the State Government on 16 July 2019. The replies of the Department were received on 12 September 2019. The Exit Conference was held on 1 October 2019 with the Commissioner, Commercial Tax and the Government to discuss the findings.
3.9.5 Access to the GSTN Database With the introduction of IT Platform for GST implementation, access to GSTN IT system and its data becomes necessary for Audit so that necessary assurance regarding robustness of the system could be derived. With respect

Chapter III : Tax on Sales, Trade Etc.
45
to CAG’s requirement for Complete Access to the GSTN IT systems and data, GSTN had recommended (October 2016) to the Government of India to create login credentials for the CAG teams. The State Government was informed by this office26 (April 2018) that GST data could be shared with the C&AG of India subject to relevant protocols. The Department responded27 (May 2018) that the issue of providing access to GSTN portal and creating role script was possible only through the GST Council.
The Department further replied (September 2019) that the issue of data sharing protocol with the Comptroller and Auditor General of India has been referred to GST Council. Until the matter is decided, it will be proper, to wait for access to GSTN and data dump.
The reply is not acceptable as Section 18 of the CAG’s DPC Act, 1971 provides that CAG has the mandate to access any record, accounts and other documents that are relevant to his inquiry. Further, as per Section 16 of the CAG’s DPC Act, 1971, it shall be the duty of the CAG to audit all receipts which are payable into the Consolidated Fund of India and of each State. It has been further clarified in Regulation 181 of the Regulations on Audit and Accounts, 2007 that every Department or entity shall establish and implement a mechanism to ensure that data, information and documents that are required by Audit are made available to CAG. Thus, not providing access to GST data to CAG is violation of the provisions of CAG’s DPC Act. The fact that some other states, viz., Bihar and Chhattisgarh, have started sharing the GST data with the Audit indicates that sharing of data did not require the approval of GST Council or GoI. 3.9.6 Trend of Revenue from 2013-14 to 2017-18 Receipts under VAT/CST including non-subsumed/subsumed taxes during the year 2017-18 were ` 31,436.89 crore and SGST receipts (including IGST apportionment including advance apportionment) were ` 25,373.96 crore. Total Receipts during the year 2017-18 were ` 56,810.85 crore against ` 52,664.47 crore of previous year 2016-17 i.e. an increase of 7.87 per cent. The tax base also increased from 6,97,457 migrated dealers to 13,30,281 dealers28. This explains the increase in revenue during this period. Actual receipts during the last five years are mentioned in Table-3.13.
Table-3.13: Trend of Revenue (` in crores)
Year Receipts under VAT
& CST
Receipts under other subsumed
taxes in GST29
Receipts under SGST
Total Receipts
Increase in receipt from
previous years (in per
cent)
Compensation Received GST
Total Receipts
2013-14 39,645.45 509.36 40,154.81 40,154.81 2014-15 42,931.54 541.68 43,473.22 8.26 43,473.22 2015-16 47,692.40 745.76 48,438.16 11.42 48,438.16 2016-17 51,882.88 781.59 52,664.47 8.73 52,664.47 2017-18 31,112.52 324.37 25,373.96 56,810.85 7.87 2,124.00 58,934.85 Source: Finance Accounts of the Government of Uttar Pradesh
26 Vide letter no. AG(E&RSA), UP/Sectt/2018-19/03 dated 05.04.2018. 27 Vide letter no. Joint Commissioner (Audit)// 2018-19/431/Vanijya Kar dated 21.05.2018. 28 Till 11.06.2018. 29 Figures included from Major Head 0023-Hotel Receipts, 0045-Other Taxes and Duties on Commodities and
Services.

Audit Report (Revenue Sector) for the year ended 31 March 2018
46
In their reply the Department (September 2019) stated that as on 11 June 2018 the total dealers were 13.30 lakh30 of which the migrated dealers of GSTN were 6.97 lakh and new dealers were 6.33 lakh. Thus, clearly accepting that tax base has increased.
3.9.7 Establishment of the Department 3.9.7.1 Shortage of Staff For efficient performance of an organisation, it is necessary that there are sufficient number of officers for operation and for monitoring and administering the relevant Tax laws and rules with the assistance of allied staff. In this connection, audit focussed upon the extent of availability of human resources at the disposal of the Department. It was observed that there were huge shortages in the cadre of officers and supporting staff as depicted in the Table-3.14.
Table-3.14 -Status of manpower Sl. No. Cadre Sanctioned
Post Men in position
(2018-19)
Shortage Shortage (in per cent)
1 Officers 3,033 2,433 600 20 2 Clerical 5,328 3,096 2,232 42 3 Stenographers 1,302 722 580 45 4 Shankhya Cadre 111 77 34 31 5 Auditors 91 26 65 71 6 Accounts Cadre 131 31 100 76 7 Collection Cadre 481 309 172 36 8 Computer Operator 235 173 62 26
Source: Information provided by the Commercial Tax Department
It can be seen from the above that there was a huge shortage of six hundred officers in the Department which works out to 20 per cent of the sanctioned strength of 3,033. Likewise, for effective Internal Controls and analytical works, the cadres of Shankhya, Audit and Accounts are critical. However, these cadres have shortages to the extent of 31, 71 and 76 per cent respectively. Similarly, 26 per cent posts of Computer Operators are lying vacant.
In GST regime, the work involved is technology driven and the working environment is intended to be paper-less. In the GST scenario, requirement of IT trained officers and analysts assumes importance for the purposes of tax administration. There is a need to restructure the cadres and recruit IT skilled staff for developing necessary Business Intelligence models for administration and enforcement purposes.
The Department in its reply (September 2019) stated that the Cadre restructuring was being done in GST as per requirement. But, they have not provided any documents to Audit to substantiate their statement.
3.9.7.2 Deployment of Entertainment Tax Staff
Entertainment Tax has been subsumed in GST. As a consequence, the Entertainment Tax Department, which administered the tax, has also been
30 Till 11 June 2018.

Chapter III : Tax on Sales, Trade Etc.
47
merged31 (April 2018) with the CTD. Audit observed that the mergers could be notified only after a lapse of nine months, with retrospective effect, from the implementation of GST. Even thereafter, the Department failed to deploy 131 officers of the erstwhile Entertainment Tax Department to their new duties in the CTD as District Magistrates had delegated miscellaneous work to Entertainment Tax officers. ` 21.15 crore had been spent on the establishment of these 131 officers between July 2017 and February 2019. The Department was deprived of their services, which could have come handy given shortages in the Officer cadre.
The Department in its reply (September 2019) accepted the audit finding and stated that the Cadre restructuring of officers and officials of the erstwhile Entertainment Tax Department was still in process and stated that the staff was engaged in miscellaneous work of Entertainment Tax.
3.9.7.3 Capacity building efforts by the Department for GST regime
CTD had started training its offices along with the implementation of GST. During the year 2017-18, a total of 2,920 officers were trained, out of which 2,537 were trained in GST. In 2018-19, a total of 815 officers were trained, out of which 393 officers were trained in GST at Commercial Tax Officers Training Institute, Lucknow. Besides, the Department established helpdesks at 82 places and conducted 5,494 seminars wherein 3,71,329 persons participated.
3.9.8 Legal/Statutory preparedness
The State Government notified (May 2017) the Uttar Pradesh Goods and Services Tax Act, 2017 and Uttar Pradesh Goods and Services Tax Rules, 2017. Further, necessary notifications were issued by the State Government from time to time for facilitating implementation of GST in the State. The State Government/ Commercial Taxes Department had issued 189 notifications, 66 Circulars regarding GST from June 2017 to March 2019.
3.9.9 E-Way bill system
Before the enactment of GST Act, under the older regime, the Mobile Squad Units (MSUs) were deployed to check evasion of tax not covered by prescribed documents/information and purportedly belonging to unregistered dealers, during the movement of such goods within and/or transiting through the State. Assistant Commissioners (Mobile Squad) were in-charge of such MSUs. Their main responsibility was to check the movement of goods being transported with fake documents within the State, and prevent tax evasion with reference to goods imported by rail and roads through effective search work. The National Informatics Centre (NIC), Lucknow had developed necessary software for issuing /downloading transit passes/Transit Declaration Form (TDF) for transporting goods from one State to another State via Uttar Pradesh. This software provided enhanced Management Information System (MIS) and reporting capabilities to the MSUs for smarter decision making, thereby helping in arresting tax evasion and resulting in greater revenue mobilisation.
31 Notification no. 624/11-3-2018-103/2017 dated 24.04.2018 and 520/11-3-2018-13/2017 dated 24.04.2018.

Audit Report (Revenue Sector) for the year ended 31 March 2018
48
After the enactment of GST Act, system of TDF automatically became obsolete. Further, no alternate arrangement was brought into force by GST Council up to 31 March 2018 at an all India level. The State Government commenced32 (16 August 2017) its own E-way bill system to strengthen the monitoring of transportation of goods. However, the system could not be stabilised till March 2018. In this period (July 2017- March 2018), the system was suspended on two occasions33 and for overall duration of 52 days. Thus, between July 2017 and March 2018, the system for monitoring the movement of vehicles carrying taxable goods at the All India level, which was to detect tax evasions, was not very effective. National E-way bill system has commenced from 1 April 2018.
3.9.10 IT preparedness of the Department
3.9.10.1 IT preparedness by GSTN
The IT platform of GSTN is divided into two parts namely “Front end” and “Backend”. The front end provides services to the taxpayers viz~ registration, payment of tax and filing of returns etc. Backend consists of IT system to be used by tax officials to process administration functions such as registration approval, assessment, audit and enforcement, adjudication, recovery and analytics. For States opting Model-I and Central Board of Excise and Customs (CBEC), development of Backend application was to be done by them. For Model-II States, Backend application is being developed by GSTN. As Uttar Pradesh has opted for Model-II, for implementation of GST, backend applications like registration approval, taxpayer detail viewer, refund processing and Management Information System (MIS) reports, etc. for the purposes of GST administration are developed by GSTN.
GSTN has created a portal on intranet wherein login credentials have been created for officers and staff of Commercial Tax Department (CTD) to enable them to perform their duties by working directly on it. Modules available on GST Portal for the CTD are Registration and Payments, Services related Taxpayers Account. MIS reports such as Enrolment reports, Registration reports, Payment reports and Return report are also available. Officers access GSTN portal through intranet i.e. on the Department’s own private secure network.
Assessing Authorities have to perform certain duties as per the SGST Act. To perform their duties, they have been allocated roles on GSTN portal to view Jurisdictional Record, Refund Processing, Registration, Registration- Approval, Registration Site Visit, Adjudicating/Authority, View Dashboard, MIS user, LUT (Letter of Undertaking) Processing, Grievance processing.
As per the roles provided by GSTN, Assessing Officers had access to dealers under their jurisdiction only.
Audit obtained information from the CTD on the status and functionality of the GSTN and IT system and observed the following gaps /shortcomings:
(i) Mapping of Dealers with Assessing Authorities: Mapping of migrated dealers with Assessing Authorities, was completed by
32 Circular no. 1028 dated 27.07.2017. 33 From 01.07.2017 to 15.08.2017 & 02.02.2018 to 08.02.2018.

Chapter III : Tax on Sales, Trade Etc.
49
February 2019, which itself reveals the delay in process of mapping. In the absence of demarcated jurisdiction over dealers, the day to day working of the Assessing Authorities was adversely affected.
The Department (September 2019) has accepted the audit observation.
(ii) Delay in adding the offices of Joint Commissioner (Corporate Circle) in the GSTN system: JC(Corporate Circle) had been entrusted with the duty of assessment of top level dealers in the specific area. But these offices had been provided in master of GSTN system for this State by GSTN only in December 2018. This means that officers of these offices, did not had access to GSTN portal and were able to perform their duties only from December 2018.
The Department (September 2019) has accepted the audit observation.
(iii)Non stabilisation of GSTN and IT initiative by the Department: GSTN is still developing applications and has not stabilised even after a lapse of 22 months34 since the implementation of GST. Since, Uttar Pradesh is Model II State, GSTN was required to develop all the backend modules (assessment, refund, enforcement, etc). Initially GSTN had started providing data in the consolidated form and department had to develop the reports as per its requirement. Refund module is still not operational. Therefore, to further the implementation of GST, IT wing of the department had developed some systems and modules35.
The Department accepted audit observation and stated (September 2019) that during the initial stages several changes were made by GST Council, resulting in delay in stabilising of modules, application and solution being developed, which is natural. Applications/solutions are being developed and made live as per the provisions of the Act and Rules. GST Administration is a dynamic process. From time to time MIS reports are made available on Bob web portal. Till now 51 MIS reports have been made available by GSTN. At present refund processing is not available online and HSN wise report of Tax payers has still not been provided by GSTN.
The reply of the Department confirms that GSTN has not stabilised.
(iv) Roles as per Statutory Duties: In the initial stage the Department did not reply to the specific query as to whether the allotted roles suffice the requirements of the Departmental officers in performing their Statutory duties.
The Department in its final reply (September 2019) stated that implementation of different types of roles on GSTN portal may take time.
34 Till April 2019. 35 (i) Dealer Monitoring System: The application provides, via a single window with multiple dashboards, the
Registration Status, Dealer Profile, Filer/Non filer status, Refund Status, and Recovery Status, allowing generation of Notices/orders. (ii) Online Mobile Management System: The system allows for monitoring the real time activity of Department’s mobile units. Special Investigation Branch (SIB) management system is in place for close monitoring of SIB cases.

Audit Report (Revenue Sector) for the year ended 31 March 2018
50
The Department in its reply did not indicate a timeframe within which necessary action will be taken in this regard.
Thus, due to delay in mapping of dealers with Assessing Authorities, non-creation of office of JC(Corporate) till December 2018 and not providing separate roles for different level of Assessing Authorities during the initial period of implementation of GST, it was not possible for CTD authorities to perform their day to day duties effectively.
3.9.10.2 Availability of Hardware and Network Security
As per the information made available (30 April 2019) by the Department, the Department has allotted 2,433 terminals to all available 2,433 officers36, and 3,051 terminals amongst 4,064 subordinate staff 37 for performing their duties. All the terminals/computers connected with GSTN are connected via intranet i.e. department’s private secure network. They are, however, also connected with an open Internet line which compromises the security of the network and leaves ample scope for threat/vulnerability to data.
In reply to specific query the Department stated that Terminals/ Computers are connected through UTM38 firewall gateway device with required security policy and restrictions. The Department has also applied Access control list to restrict and filter unwanted data and traffic and issued guidelines for data security policy, taken steps to block external drives and developed Antivirus, DLP39 solution and File encryption on such Terminals/Computers for ensuring data security.
In spite of above steps taken by the Department, connectivity of the Computers/terminals with GSTN secured lines and simultaneously with open internet lines makes the network vulnerable to attack.
The Department in its reply (September 2019) stated that this is related to policy matter and hence needs no comments.
The Department needs to keep in view the fact that the IT systems on which the GSTN database is accessed should be secure. The GSTN data being confidential and critical in nature, exposure of the IT systems handling GSTN data to insecure networks can pose serious risks to data integrity, confidentiality and availability.
3.9.11 Implementation of GST
Major issues/challenges faced by the Department in implementation of GST were in the areas of registration, migration, allocation of taxpayers, filing of returns, payment of tax, transitional credit, refunds, etc. These issues along with the changes in rules and regulations made since 1 July 2017 by the State Government were analysed in Audit, and are briefly discussed in the following paragraphs:
36 All Executive Authorities and Assessing Authorities. 37 Sr. Administrative Officer/Administrative Officer, Pradhan Sahayak, Varisth Sahayak, Kanishth Lipik, Vyaktik
Sahayak, Ashulipik, Sahayak Sankhyaki Adhikari, Lekhakar, Computer Operator. 38 Unified Threat Management. 39 Data Loss Prevention.

Chapter III : Tax on Sales, Trade Etc.
51
3.9.11.1 Registration of taxpayers Every person registered under any of the pre-GST laws and having a valid Permanent Account Number (PAN) was to be issued a certificate of registration on provisional basis. Thereafter, final certificate of registration was to be granted on completion of the prescribed conditions. Further, taxpayers having turnover of more than the threshold limit of ` 20 lakh were required to be registered under GST.
(i) Migration of existing taxpayers of the Commercial Taxes Department
As per rule 24 of the Uttar Pradesh Goods and Services Tax Rules, 2017, every person, other than a person deducting tax at source or an Input Service Distributor, registered under an existing law and having a Permanent Account Number shall enrol on the common portal by validating his email address and mobile number, either directly or through a Facilitation Centre notified by the Commissioner. Upon enrolment, the said person shall be granted registration on a provisional basis.
Every person who has been granted a provisional registration shall submit an application electronically, duly signed or verified through electronic verification code, along with the information and documents specified in the said application, on the common portal within a period of three months. If found to be correct and complete, a certificate of registration shall be made available.
Every person registered under any of the existing laws, who is not liable to be registered under the Act may, within a period of thirty days from the appointed day, at his option, submit an application for the cancellation of registration granted to him and the proper officer shall, after conducting such enquiry as deemed fit, cancel the said registration. As per the information provided by the Department, position of provisional registration and final registration of the existing registered dealers in Commercial Taxes Department is given in Table-3.15.
Table-3.15 Migration of dealers
Total Number
of Existing
VAT dealers
Total number of Provisional ID received from
GSTN
Number of dealers primarily enrolled.
(per cent with respect to Column-2)
Number of dealers in whose case Complete Enrolment
was carried out (per cent with respect to
Column-3)
Number of dealers who
finally did not migrate
1 2 3 4 5
8,31,694 9,84,206 9,09,323 (92.39%)
7,23,978 (79.62%)
1,85,345 (20.38%)
Source: Information furnished by the Commercial Taxes Department
The provisional IDs received from the GSTN were more than the existing VAT dealers by 1,52,512 which indicates that this number included dealers from VAT as well as other subsumed taxes. Out of this aggregate, 92.39 per cent of the existing dealers completed the primary enrolment. Even from those who were primarily enrolled, only 79.62 per cent completed the migration process and were finally registered under GST. 20.38 per cent dealers did not migrate.

Audit Report (Revenue Sector) for the year ended 31 March 2018
52
The Department was not able to provide any segregated figures of dealers who did not migrate due to various factors like
(a) increase in threshold limit, (b) due to incomplete/incorrect information, (c) were not liable to be taxed or were wholly exempt from tax in GST, (d) were eligible for migration but did not apply for the same (e) those who did not migrate due to any other reasons.
The Department in its reply (September 2019) stated that segregated data for dealers who did not migrate is not available. Due to increase in threshold limit up to ` 20 lakhs, there was difference between pre GST period dealers and migrated dealers which was natural. Migration was also affected due to certain goods getting tax free in GST which were earlier taxable and vice versa. Tax base was increased due to efforts by the Department. It was stated that the total number of GST dealers till 31 August 2019 has increased to 14.88 lakhs.
The reply of the Department indicates that they are not able to fully reconcile the reasons for non-migration of 20.38% of existing tax-payers of the erstwhile Act to GST regime.
(ii) Allocation of taxpayers between the Centre and the State
(a) Existing registered taxpayers of the Commercial Taxes Department and the Central Excise Department:
As per the recommendation of the GST Council, 90 per cent of the existing registered taxpayers having turnover up to ` 1.5 crore, and 50% of the existing registered taxpayers having turnover more than ` 1.5 crore, were allotted to the State. Accordingly, State was allotted the jurisdiction over 6,31,521 existing registered taxpayers (April 2019) as detailed in Table-3.16.
Table-3.16 Allocation of taxpayers between the Centre and the State
Existing registered taxpayers Turnover above ` 1.5
crore Turnover below ` 1.5
crore Total
State 41,619 5,89,902 6,31,521 Centre 41,621 65,547 1,07,168
Total 83,240 6,55,449 7,38,689 Source: Information furnished by the Commercial Taxes Department updated till April 2019
(b) New taxpayers:
Jurisdiction over newly registered taxpayers is being allotted to the State and Centre by GST portal electronically during the submission of applications for registration by the taxpayers. The position of new registrations under the jurisdiction of the State as on 31 March 2018 is given in Table 3.17.
Table 3.17 New taxpayers
Application received up to 31March 2018
Number of Applications rejected
Number of Applications approved
Number of Applications pending
6,05,924 18,068 5,58,312 29,544
Source: Information furnished by the Commercial Taxes Department updated till April 2019

Chapter III : Tax on Sales, Trade Etc.
53
Overall, 29,544 applications were pending at various stages of registration as on 31 March 2018.
3.9.11.2 Filing of returns and payment of tax As per Rules 59 to 61 of the Uttar Pradesh GST Rules, 2017, every registered person, required to furnish the details of outward supplies of goods and services or both, shall furnish such details in form GSTR-1, details of inward supplies of goods and services or both in form GSTR-2 and a return in form GSTR-3 (electronically generated by system on the basis of information furnished through GSTR-1 and GSTR-2) monthly, whereas composition taxpayers were required to file a quarterly return GSTR-4. Further, taxpayers having turnover below ` 1.5 crore were to file GSTR-1 on quarterly basis. The prescribed process of return filing was amended to address the difficulties faced by the taxpayers in the initial period of the new tax regime. The filing of GSTR-2 and GSTR-3 was postponed and all taxpayers were mandated to submit a simple monthly return in form GSTR-3B with payment of tax by 20th of the succeeding month.
Monthly return GSTR-3B and quarterly return GSTR-4 were required to be filed after payment of the due tax. Therefore, monitoring of these returns was important to ensure timely deposit of due tax by the taxpayers. Information provided (April 2019) by the Department for the period July 2017 to March 2018 revealed that out of 8,07,861 dealers registered in the State, 5,72,002 (96.03 per cent) had filed their monthly return GSTR-3B against 5,95,631 taxpayers required to file GSTR-3B for the period from July 2017 to March 2018. The remaining 23,629 tax payers had not filed their GSTR-3B. Further, only 1,96,738 (92.70 per cent) composite dealers had filed their quarterly return GSTR-4 against 2,12,230 required to file their return. Thus, 15,492 composite dealers had not filed their GSTR-4. The Department in its reply (September 2019) stated that their Headquarter is regularly issuing instructions to its subordinate officers to take action against non-filers of returns. It further stated that field officers are regularly monitoring non-filers, because of which return filing position is comparatively better in the State of Uttar Pradesh. They also stated that return filing of GSTR-3B and GSTR-4 was above the national average. The main reason stated by the Department for not attaining hundred per cent filing was that the dealers were still coming to terms with the new system of GST. The problems in user interface of GST portal also affected the per cent of return filing. The problems faced by dealers were being tackled after it was brought to the notice of the Department. To increase the return filing, the officers and employees of the Department pursued with the dealers personally to solve their problems. Action was being taken against non-filers in accordance with the provisions of the GST Acts and Rules. The reply confirms that gaps exist in filing of returns by dealers, which needs to be addressed.

Audit Report (Revenue Sector) for the year ended 31 March 2018
54
3.9.11.3 No system of Verification of Inter-State ITC on GSTN A registered person shall be entitled to take credit of tax charged to him on supply of goods or services taken by him and used in the course of his business. That amount is credited to the electronic credit ledger of the registered person. The ITC credit is availed on the basis of invoice issued by the supplier of goods/services. In case of inter-State transactions of the registered person with a supplier being registered in another State, access to such inter-State transactions is not available to the Assessing Authorities of the State. Independent verification of the ITC claimed by the registered person is essential to keep watch on correctness of ITC claims availed. It is notable that the Assessing Authorities have no option but to rely upon the information furnished by the GST authorities of other States in response to the occasional requests made by Assessing Authorities for such ITC verification.
CTD has not framed any guidelines regarding regulating inter-State ITC verification by its officers in the absence of access to such inter-state transactions on the GSTN portal. Thus, non-verification of inter-State ITC may result in possibility of incorrect claims of ITC, its utilisation against tax due and refund of incorrectly depicted unutilised input tax credit. Thus, loss to State exchequer cannot be ruled out.
The Department in its reply (September 2019) stated that GSTR-01 is being filed by the dealers. Though, GSTR-2 is postponed, the entries of GSTR-01 of the seller are auto-populated on GSTR-2A of the recipient, which are verified by the Assessing Authorities before allowing ITC.
The reply of the Department is not acceptable, as the information required to be added by dealers in GSTR-2 are essential for calculating the admissibility of correct ITC. Once, the admissibility of the ITC is verified only then correct refund can be made. Further, from the circular40 dated 26 June 2019 it is clear that earlier GSTN had not given access to the State Authorities to view the records of other State dealers. Even, now, only from June 2019, senior officers41 will be provided roles to “View All India Records” by sub-State Admin, for the purpose of investigation of tax evasion cases, verifications and preliminary enquiries before registering new cases.
Recommendation:
Department may frame suitable methods and guidelines for regulating ITC verification.
3.9.12 Legacy Issues Audit assessed the legacy issues regarding assessment, recovery of arrears and other related matters. Audit observations are summarised in the following sections:
40 IT-Sub State Admn/2019-20/678/1920028/Vaniya Kar dated 26 June 2019. 41 Additional Commissioner, Gr.I and II, JC(Executive), JC(Tax Audit). JC(SIB), JC(Corporate Circle), Mobile
Squad, SIB and Sector Officers.

Chapter III : Tax on Sales, Trade Etc.
55
3.9.12.1 Assessment of VAT cases Dealers were registered under UPVAT Act, 2008 and CST Act, 1956 and other minor taxes i.e. luxury tax, entertainment tax, etc. prior to implementation of GST.
All the pre-GST tax related assessments and other matters are being handled online by the officers of the CTD on VYAS42 Central Software. According to a circular issued by the CTD43 (April 2019) regarding settlement of cases pertaining to the year 2016-17, the last date for online identification of deemed cases for the year 2016-17 was 31 March 2019. Cases of dealers having turnover of less than ` 50 lakh were to be identified online for tax assessment on the basis of risk parameters. This was required to be completed by 31 May 2019. The last date for completing tax assessment of all other pending cases for the year 2016-17 has since been extended by the CTD to 31October 2019. No instructions have been issued for completing the VAT assessments of the year 2017-18 (VAT period- April 2017 to June 2017). The Department in its reply (September 2019) stated that as per provisions of VAT Act, the due date for completing the VAT Assessment cases for the assessment year 2017-18 is up to March 2021 but instructions have been issued to the Assessing Authorities to complete the Assessment cases of 2016-17 and 2017-18 in the year 2019-20.
3.9.12.2 No System of Monitoring of Declaration forms As per Section 6 and Section 8 of Central Sales Tax Act (CST), 1956, a registered dealer may purchase goods from outside the State of Uttar Pradesh at concessional rate of tax of two per cent of such turnover by issuing to the selling dealer a declaration in form ‘C’. Further, as per Section 6A of Central Sales Tax Act (CST), 1956, a registered dealer may receive goods from any other place of business outside the State or from his agent or principal in other states without paying tax against issue of declaration in form ‘F’. Form ‘C’ and ‘F’ are obtained from the Department.
After the enactment of GST, provisions of CST Act are now applicable only on Non-GST goods for which forms can be obtained from the Department.
As both these declaration forms provide a huge amount of concessional tax/ exemption from tax, it is necessary to ensure that these forms may not be used beyond the authorisation provided under the provisions of the Act. Audit called for the information regarding stock of declaration forms lying with the Department, forms issued to the VAT dealers and balance of forms available with the VAT dealers after the date of implementation of GST. The Department stated that though these forms were still being issued to the dealers for pre-GST transactions, it was not possible for them to provide consolidated information regarding Forms ‘C’ and ‘F’ available with the VAT registered dealers after the post GST period.
42 Vanijya Kar Automation System- There is time barring of Annual Assessment of VAT cases so presently
assessment of pre-GST (VAT) cases and other related works such as recovery, refund etc.are being done on VYAS.
43 No. CCT/Nirikshan Anubhag/(2019-20)/1920006/54/Vanijya Kar dated 11 April 2019.

Audit Report (Revenue Sector) for the year ended 31 March 2018
56
Scrutiny of two sectors in Allahabad44 revealed that (i) no database was maintained for remaining forms with the VAT dealers.
(ii) Assessing Authorities accepted that post GST dealers were not giving utilisation details to the sectors.
(iii) The use of forms by the dealers is checked from the details declared by the dealer at the time of assessment only.
Thus, there is no verification of utilisation of forms by dealers at the level of the Assessing Authority.
It clearly indicates lack of any mechanism to verify the number of forms available with the dealers, or their utilisation. This, may result in incorrect utilisation of declaration forms which may further, result in a huge amount of incorrect concessional tax/ exemption from tax.
The Department in its reply (September 2019) stated that there is solid and old system of maintaining stock and database of Declaration forms. Details of form issued earlier are obtained while issuing new forms. Further, for dealers, within prescribed limit of turnover, there is a system for online issue of forms.
The reply of the Department is very general and does not provide specific details for example:
(i) the Department does not have any database that, how many forms were available with the printing press at the end of June 2017, March 2018 and March 201945.
(ii) the Department does not have any database that, how many forms were still available with the registered VAT dealers of Uttar Pradesh46.
(iii) the Department was not able to tell whether all the remaining forms available with the VAT dealers at the end of June 17 have been surrendered by the them47.
(iv) regarding misuse of forms, the Department had stated48 that during Assessment details of forms are obtained and compared and ensured that these are not misused. The reply is not acceptable as only on the basis of the details submitted by the dealer, non-misuse of the forms cannot be ensured. Verification of the forms is required before Assessment for the value and commodity it is issued, from the returns of dealers (recipient of forms) of other States.
(v) the Department does not have any database that, number of forms utilised by the dealers for VAT period after June 201749.
(vi) the Department does not have any database that, number of forms issued for GST period transaction for goods covered under new definition of goods under CST Act post GST50.
44 Sector 7 and 10, Allahabad. 45 Departments letter dated 30.04.2019. 46 Departments letter dated 30.04.2019. 47 Departments letter dated 30.04.2019. 48 Departments letter dated 30.04.2019. 49 Departments letter dated 30.04.2019. 50 Departments letter dated 30.04.2019.

Chapter III : Tax on Sales, Trade Etc.
57
The Department was not able to provide information on the above, it clearly vindicates the stand of Audit that the Department lacks mechanism for proper verification and monitoring of the forms.
3.9.13 Conclusion
To sum up, the Department was prompt in its preparedness for implementation of GST as can be seen with reference to enactment of the Act and Rules as per the model laws approved by GST Council, and rules governing primary enrolment of existing taxpayers, capacity building efforts, etc. Audit however, noticed that frequent changes were made in the rules/regulations since 1 July 2017 on the recommendations of the GST Council by the State Government which have resulted in non-implementation of many of the procedures laid down in SGST.
The GSTN has not been able to provide the complete IT solution, resulting in Assessing Authorities not being able to perform their duties effectively.
As GSTN had not provided CTD with access to the records of the inter-state dealers, the verification of inter-state ITC could not be verified online by the Department. There is possibility of claims of incorrect ITC, its utilisation against tax due and settlement of claims of refunds in cases of incorrect depiction of unutilised input credit and thus, loss to State exchequer cannot be ruled out.
Legacy issues like Assessments of pre-GST cases needed to be sorted out expeditiously in a time bound manner so that pending revenue of pre-GST regime may be collected expeditiously and officers may concentrate on GST work only.
Day to day working of the officers was hampered due to delayed mapping of dealers and incomplete solution from GSTN.
From the above it is evident that CTD was not yet fully prepared to implement GST in the state.


CHAPTER-IV: OTHER TAX RECEIPTS
(A) TAXES ON VEHICLES, GOODS AND PASSENGERS
4.1 Tax administration
The levy and collection of motor vehicles tax and fee in the State is governed under the Motor Vehicles Act, 1988 (MV Act), the Central Motor Vehicles Rules, 1989 (CMV Rules), the Uttar Pradesh Motor Vehicles Taxation Act, 1997 (UPMVT Act), the Uttar Pradesh Motor Vehicles Taxation Rules, 1998 (UPMVT Rules), the Carriage by Road Act, 2007 (CBR Act), the Carriage by Road Rules, 2011 (CBR Rules), and various Notifications, Circulars and G.O.s issued by the Government and the Department from time to time.
The Principal Secretary, Transport, Uttar Pradesh is the administrative head at the Government level. The entire process of assessment and collection of taxes and fee is administered and monitored by the Transport Commissioner (TC), Uttar Pradesh, who is assisted by three Additional Transport Commissioners at Headquarters.
There are six1 Deputy Transport Commissioners (DTCs), 192 Regional Transport Officers (RTOs) and 75 Assistant Regional Transport Officers (ARTOs) (Administration) in the field. RTOs perform the overall work of issue and control of permits of transport vehicles. The ARTOs perform the work of assessment and levy of taxes and fee regarding both transport vehicles and other than transport vehicles. Respective RTOs are responsible for the overall administration of the Sub-Regional Transport Offices. The organisational setup is described below:
Chart 4.1- Organisational setup
There are 114 Enforcement squads in the State, each consisting of one ARTO (Enforcement), one supervisor and three Enforcement constables. These are attached to the Headquarters and deployed at the district level. Two special Enforcement squads are posted at the Headquarters. 10 Regional Transport
1 Agra, Bareilly, Kanpur Nagar, Lucknow, Meerut and Varanasi. 2 Agra, Aligarh, Allahabad, Azamgarh, Banda, Bareilly, Basti, Faizabad, Ghaziabad, Gonda, Gorakhpur, Jhansi,
Kanpur Nagar, Lucknow, Meerut, Mirzapur, Moradabad, Saharanpur and Varanasi.

Audit Report ( Revenue Sector) for the year ended 31March 2018
60
Officers (Enforcement) are posted at the district level, under the control and supervision of an Additional TC (Enforcement) at the Headquarters and six Deputy TCs at the zonal3 level. The Enforcement administration is responsible for checking offences related to plying of unregistered vehicles/ overloaded vehicles/ tax evasion/ vehicles plying in the state without valid permits, driving licenses, certificates of fitness, and in violation of the applicable norms of pollution, statute and rules.
A software viz., VAHAN had been adopted by the Department for automating the processes of vehicle registration, issue/ renewal of permits, calculation and payment of taxes and fees, issue/ renewal of fitness certificates, issue of challans and payment of the penalty amount. VAHAN is therefore an important monitoring tool at the disposal of the Department. This software also has the facility to generate reports like arrears of revenue, lists of vehicles without permit and certificate of fitness, etc. However, objections raised by the CAG in the previous reports indicate that the Departmental authorities have regularly failed to take cognisance of such exception reports leading to recurring instances of non-compliance with the statutory provisions.
4.2 Results of audit
During 2017-18, Audit test checked 89,221 vehicles (11 per cent) out of 8,18,953 vehicles registered in 594 out of 76 Auditable units (78 per cent) of the Transport Department. Of the test checked cases, Audit noticed irregularities amounting to ` 37.60 crore in respect of 35,895 vehicles (40 per cent). Revenue collected by the Department during the year 2016-17 aggregated to ` 5,148.37 crore of which, the audited units collected ` 4,199.31 crore (82 per cent). Audit scrutiny revealed instances of short realisation of tax, non-levy of additional tax and fitness fee, non-imposition of penalty and other irregularities amounting to ` 37.60 crore in 670 paragraphs as shown in Table - 4.1.
Table – 4.1
Sl. No. Categories Number of paragraphs
Amount (` in crore)
Share in per cent to the total
objected amount 1. Short realisation of
Passenger tax/ additional tax Goods tax
334
25.15 66.89
2. Evasion of tax Passenger tax/ additional tax Goods tax
58
2.70 7.18
3. Other irregularities5 278 9.75 25.93 Total 670 37.60
Source: Information available in the Audit office.
3 Agra, Bareilly, Kanpur Nagar, Lucknow, Meerut and Varanasi. 4 One Principal Secretary, One Transport Commissioner, 13 RTOs and 44 ARTOs. 5 1. Procedural Lapses. 2. Delay in compliance of orders. 3. Compounding not done as per rules. 4. Non maintenance of GPF Pass Book and Cash Book, etc.

Chapter IV: Other Tax Receipts
61
The Department accepted (between April 2017 and September 2019) 14,640 cases amounting to ` 17.79 crore pointed out in the year 2017-18. The Department reported (between April 2017 and September 2019) recovery of ` 19.85 crore out of which 27 cases of ` 1.56 crore is related to the year 2017-18 and the rest of the cases pertain to the earlier years. Irregularities involving 1,306 cases worth ` 4.77 crore have been illustrated in this chapter. Out of these, some irregularities have been regularly reported during the last five years as detailed in Table-4.2. Most of the audit observations are of a nature that may reflect similar errors/omissions in other units of the concerned State Government department, but were not covered in the test check conducted during the year. The Department/Government may therefore like to internally examine all other units with a view to ensuring that they are functioning as per requirement and rules.
Table - 4.2
(` in crore)
2012-13 2013-14 2014-15 2015-16 2016-17 Total Nature of observation Cases Amount Cases Amount Cases Amount Cases Amount Cases Amount Cases Amount Penalty under Carriage by Road Act not levied
-- -- -- -- 1,786 4.08 1,430 4.00 836 2.18 4,052 10.26
Additional tax on JnNURM buses not levied
-- -- 248 19.20 464 30.36 805 35.69 210 1.95 1,727 87.20
Recommendations:
1. The Department should initiate systemic measures to ensure that the shortcomings repeatedly reported by Audit do not recur.
2. The Department should introduce more effective measures to monitor and ensure recoveries of the large amounts of non/ short realisations pointed out in Audit Reports.
4.3 Penalty not imposed on overloaded goods vehicles under the Carriage by Road Act
The CBR Act, 2007 provides for imposition of penalty equal to the penalty prescribed under MV Act on over loaded motor vehicles (goods) in additional to the penalty already imposed on and realised from such vehicles.
The CBR Act also provides that any unregistered common carrier6 engaged in
6 Common carrier means a person engaged in the business of collecting, storing, forwarding or distributing goods
to be carried by goods carriages under a goods receipt and includes a goods booking company, contractor, agent, broker and courier agency engaged in door to door transportation of documents/ goods/ articles utilising the services of a person either directly or indirectly to carry or accompany such documents, goods or articles.
The Transport Department failed to stop unsafe vehicles from plying on roads and also did not impose penalty amounting to ` 2.16 crore under the Carriage by Road (CBR) Act on 913 goods vehicles which were seized for overloading.

Audit Report ( Revenue Sector) for the year ended 31March 2018
62
the business shall be punishable for the offence with a fine of ` 4,0007 per offence.
Previous Audit Reports of 2014-15 to 2016-17 had highlighted persistent loss of Government revenue amounting to ` 10.26 crore due to non-imposition of penalty under CBR Act on 4,052 overload vehicles.
To evaluate the corrective measures adopted by the Department in this regard, Audit test checked the records of 50 RTOs/ ARTOs out of 59 RTOs/ARTOs during 2017-18. In 913 out of 13,398 cases of overloading of goods vehicles during December 2015 to December 2017, Audit noticed that the concerned RTOs/ ARTOs (Enforcement) failed to impose a penalty8 on the vehicle owner/lease holder amounting to ` 2.16 crore under the CBR Act which was equivalent to the amount of penalty imposed under MV Act (Appendix-XIV).
Audit reported the matter to the Departmental (between May 2017 and April 2018). In the exit conference (December 2018), the Department stated that three vehicles of districts Muzaffarnagar and Mirzapur had been penalised under the CBR Act and ` 0.76 lakhs had been recovered as penalty. The Department further stated that the maximum number of vehicles which are included in the Audit observation are only transporting minerals from the mines for sale in the market. Whether these vehicles, which are registered in the Mining Department, need to be penalised under the CBR Act, was not clear. The matter therefore needed a clarification from the Mining Department.
In continuation of the above matter, Audit held (April 2019) a meeting with both the Geology and Mining Department and the Transport Department in which it was recommended by Audit that as overladen vehicles transporting minor minerals were also unsafe, the transport vehicles of the mining lease holders may be brought under the purview of the CBR Act, 2007. The Mining Department may update its online application for downloading MM 11 form by adding fields related to laden and unladen weight of the vehicles engaged in transporting of minor minerals. The MM 11 should also mention the CBR registration number.
The Department in its reply dated 12 April 2019, stated that necessary orders had been issued to all Enforcement teams to compulsorily register common carriers under the CBR Act. Audit is however of the opinion that above would not cover all vehicles transporting minor minerals.
Recommendations:
The Transport Department may register vehicles carrying minor minerals under the definition of common carrier of the CBR Act, 2007 to stop such overloaded vehicles carrying minor minerals.
The Geology and Mining Department may in consultation with the Transport Department work out an online system for detecting the overloaded vehicles running on road based on the MM 11 operated by the Transport Department.
7 UP Notification No 7/800/30-4-2014-172/89 dated 05 June 2014. 8 Minimum fine of two thousand rupees and additional amount of one thousand rupees per tonne of excess load.

Chapter IV: Other Tax Receipts
63
4.4 Additional tax on JnNURM buses not levied
No transport vehicle of the State Transport Undertaking (STU) shall be used in any public place in Uttar Pradesh unless additional tax prescribed under UPMVT Act, 1997 (as amended on 28 October 2009) has been paid. Motor vehicles of STU operating within the limits of Municipal Corporation or Municipality are exempted from the payment of additional tax.
Previous Audit Reports of 2013-14 to 2016-17 had highlighted non-levy of Additional tax on 1,727 defaulting vehicles amounting to ` 87.20 crore. In pursuance of the deliberations of the PAC in its meeting dated 02 July 2018 (for the Audit Report 2013-14), amount of ` 17.36 crore has been recovered by the Department.
To evaluate the corrective measures adopted by the Department in this regard, Audit test checked the records of three RTOs/ARTOs out of 59 RTOs/ARTOs during 2017-18. Audit cross checked the list of JnNURM buses with that of routes defined under municipal corporations, and noticed that 393 out of 590 JnNURM buses under three State Transport Undertakings (Kanpur City Transport Services Limited, Lucknow City Transport Services Limited and Agra Mathura City Transport Services Limited) were plying outside the designated municipal areas of these cities from February 2016 to July 2017 and for which they were liable for payment of additional tax of ` 2.61 crore. The concerned RTOs/ARTOs did not check the route chart of these JnNURM buses and therefore failed to notice that these JnNURM buses were plying outside the municipal areas as defined by the municipal corporation. As a result, additional tax of ` 2.61 crore was not levied as detailed in Table 4.3.
Table 4.3 (Amount in `)
Sl. No.
Name of district No of buses under STUs
No. of buses in which
irregularity noticed
Period (Add. tax leviable)
Total Additional tax
1 RTO Kanpur Nagar 270 183 04/16 to 04/17
11518650
2 RTO Lucknow 260 180 04/16 to 06/17
12435750
3 ARTO Mathura 60 30 02/2016 to 07/2017
2187000
Total 590 393 26141400
Audit reported the matter to the Department (between May 2017 and April 2018). In the exit conference (December 2018), the Department accepted the audit observation and stated that the issue of recovery of additional tax had already been taken up with the Urban Transport Directorate Authorities. However, recovery position has not been received (September 2019).
Additional tax of ` 2.61 crore was not levied on 393 JnNURM buses plying outside the designated municipal areas.


(B): STAMPS AND REGISTRATION FEES
4.5 Tax administration
The levy and collection of stamp duty and registration fees in the State is governed by the Indian Stamp Act, 1899 (IS Act), the Registration Act, 1908 and the rules framed thereunder as applicable in Uttar Pradesh. Stamp duty and registration fees are levied on the execution of instruments at the prescribed rates fixed under the above Acts. Valuation of properties is decided as per the circle rates fixed by the Collector of the district as per the provisions of the Uttar Pradesh Stamp (Valuation of Property) Rules, 1997.
The determination of policy, monitoring and control at the Government level is carried out by the Principal Secretary, Stamps and Registration. The Inspector General (Registration) (IGR) is the head of the Stamps and Registration Department. He/she is empowered with the task of superintendence and administration of the registration work. The IG is assisted by 92 Assistant Inspectors General (AIsG) at the district/ headquarters level and 355 Sub-Registrars (SRs) at the tehsil level respectively.
The Organisational setup is described below: Chart 4.2 Organisational setup
4.6 Results of audit
During 2017-18, Audit test checked 2,78,192 documents (9 per cent) out of 30,45,393 documents and noticed irregularities amounting to ` 35.77 crore in 750 documents (0.30 per cent) in 2171 units [out of 355 auditable units (61 per cent)] of the Stamps and Registration Department. The Department collected revenue of ` 11,564.02 crore (stamp duty: ` 6,540.84 crore and registration fees and other receipts: ` 5,023.18 crore) during 2016-17 out of which the audited units had collected ` 8,136.52 crore (70 per cent). Audit noticed deficiencies and irregularities amounting to ` 35.77 crore in 808 paragraphs as detailed in Table – 4.4 These have been reported through Inspection Reports issued to various SRs test checked during 2017-18.
1 One Principal Secretary Stamps and Registration Lucknow and 216 SRs.
Principal Secretary (Kar Evam Nibandhan)
Inspector General (Registration)
Assistant Inspector General (in districts and Headquarter)
Sub-Registrars (in tehsils)

Audit Report ( Revenue Sector) for the year ended 31March 2018
66
Table – 4.4
Sl. No.
Categories Number of paragraphs
Amount (` in crore)
Share in per cent to the total
objected amount
1. Short levy of stamp duty and registration fees due to undervaluation of properties
40 0.92 2.57
2. Short levy of stamp duty and registration fees due to misclassification of documents
665 27.03 75.57
3. Other irregularities 103 7.82 21.86
Total 808 35.77
Source: Information available in the Audit office.
The Department accepted (between April 2017 and September 2019) 270 cases amounting to ` 11.43 crore pointed out in the year 2017-18. The Department reported (between April 2017 and September 2019) recovery of ` 52 lakh in 359 cases out of which four cases of ` one lakh is related to the year 2017-18 and the rest of the cases pertain to the earlier years.
Irregularities involving 266 cases worth ` 11.42 crore have been illustrated in this chapter. Out of these, some irregularities have been repeatedly reported during the last five years as detailed in Table – 4.5 (Cases pertaining to the previous audit reports). Most of the audit observations are of a nature that may reflect similar errors/omissions in other units of the concerned State Government department, but were not covered in the test check conducted during the year. The Department/Government may therefore like to internally examine all other units with a view to ensuring that they are functioning as per requirement and rules.
Table – 4.5 Cases pertaining to the previous audit reports
(` in crore)
2012-13 2013-14 2014-15 2015-16 2016-17 Total Nature of observation
Cases Amount Cases Amount Cases Amount Cases Amount Cases Amount Cases Amount
Residential land valued at agricultural rate
64 2.43 97 4.35 194 7.78 214 9.66 157 6.05 726 30.27
Recommendation: The Department should initiate suitable measures to plug the defects so as to avoid similar lapses in future.
4.7 Compliance with Acts/Rules The Indian Stamp Act, 1899 (IS Act), the Registration Act, 1908 and the Uttar Pradesh Stamp (Valuation of Property) Rules, 1997 made thereunder provide for:
(i) payment of registration fees at the prescribed rate; and (ii) payment of stamp duty by the executants at the prescribed rate.
Failures of the Departmental officers to comply with the above mentioned provisions are highlighted below:

Chapter IV: Other Tax Receipts
67
4.8 Residential land valued at agricultural rate
The IS Act, 1899 defines that stamp duty on a deed of conveyance is chargeable either on the value of the consideration set forth therein or on the market value of the property, whichever is higher. The Inspector General of Registration (IGR), vide guidelines issued in June 2003, further clarified that a property in the same arazi2 number should not be split in more than one parts for different purposes i.e. one part for agriculture and the other for non-agriculture for the purpose of levy of stamp duty.
A Khasra based search facility to get the details of lands sold in a given Khasra was available in the PRERNA3 software. However, this feature was not being used by the SRs while determining the stamp duty to be charged at the time of registration of the sale deeds of land.
Audit Reports for the year 2012-13 to 2016-17 had highlighted short levy of stamp duty and registration fee amounting to ` 30.27 crore in 726 cases due to valuation of residential land at agriculture rates by SRs (refer Table 4.5).
To evaluate the corrective measures adopted by the Department, Audit test checked the records of 120 Sub-registrar offices (SROs) out of 217 audited units. In the 120 SROs audit noticed that 266 sale deeds (out of 1,06,266 sale deeds checked) of land at agricultural rates. In 266 of the test checked sale deeds related to 5.09 lakh square meters of residential land valued at ` 58.56 crore, the deeds were registered at agriculture rates in violation of the 2003 clarification of the IGR. As a result, stamp duty and registration fees of only ` 3.98 crore was levied. Out of these 266 cases audit further noticed that a part of the same arazi (on same day, in 12 cases - ` 0.86 crore, within one to 30 days, 73 cases - ` 2.36 crore and 31 days to 2,167 days, 181 cases - ` 8.20 crore) was sold earlier or on the same day at residential rates. Hence, the land in question should have also been valued at ` 256.09 crore at the prevalent residential rates with due stamp duty and registration fees of ` 15.40 crore being charged. The incorrect valuation of property and under-utilisation of features of PRERNA thus resulted in short levy of stamp duty and registration fees of ` 11.42 crore (Appendix-XV).
Audit reported the matter to the Department (between May 2017 and April 2018). During the exit conference (14 November 2018), the Department accepted the audit observation and stated that the order dated 5 June 2003 will be examined and, in future, spot verification reports will be provided to the audit party. In this respect the orders would be issued by the Government (October 2018). Further, in their reply, the Department also stated that out of 286 cases initially pointed out, 20 cases were found duly stamped. In 39 cases,
2 Arazi, Khasra and Gata numbers are same and show the particular number of a land holding in a locality. 3 PRERNA (Property Evaluation and Registration Application) Software was introduced by the Department on
1 August 2006 for computerisation of the registration process.
Residential land measuring 5.09 lakh square meter was wrongly registered for ` 58.56 crore at agricultural rates. Correct valuation at the residential rate worked out to ` 256.09 crore which resulted in short levy of Stamp Duty and Registration Fees by ` 11.42 crore.

Audit Report ( Revenue Sector) for the year ended 31March 2018
68
RCs amounting to ` 48.52 lakh had been issued and of which, ` 21.47 lakh had been recovered. In rest of the cases, replies were yet to be received.
Recommendation: The Stamps and Registration Department should ensure correct valuation of property using features available in the PRERNA Software and, after a mandatory physical verification by SR or Tehsildar/Patvori where a part of the same arazi has been sold within a reasonable short period at residential rates.

CHAPTER-V: MINING RECEIPTS
5.1 Tax administration
The levy and collection of receipts from mining activities in the State is governed by the Mines and Minerals (Development and Regulation) (MMDR) Act, 1957, the Mineral Concession Rules, 1960, and the Uttar Pradesh Minor Mineral Concession (UPMMC) Rules, 1963. The Principal Secretary, Geology and Mining, Uttar Pradesh, is the administrative head of the Department at the Government level. The overall control and direction of the Geology and Mining Department (Department) is vested with the Director, Geology and Mining, Uttar Pradesh, Lucknow. At the Headquarter the Director, Geology and Mining is assisted by Joint Director who is further assisted by Chief Mining Officer. At district level, the District Mines Officer is responsible for determining royalty, dead rent, and permit fee, etc. due and payable. Additional District Magistrate (Finance & Revenue) is in charge of collection and accountal of mining receipts under the overall administrative control of the District Collector.
The organisational setup is shown below:
Chart 5.1 Orgainsational setup
5.2 Results of Audit
During 2017-18, Audit test checked 363 leases (43 per cent) out of 849 total leases in 241 [out of 75 Auditable (32 per cent)] units of the Geology and Mining Department in the State. Out of the total test checked leases, irregularities amounting to ` 226.65 crore were found in 148 leases (41 per cent). Revenue collected by the Department during the year 2016-17 aggregated to ` 1,548.39 crore of which, the units covered in Audit collected ` 700.00 crore (45.21 per cent). Audit noticed irregularities amounting to ` 226.65 crore in 175 paragraphs on account of various deficiencies as detailed in Table - 5.1.
1 Principal Secretary, Geology and Mining, Uttar Pradesh, Lucknow, Director, Geology and Mining Uttar Pradesh,
Lucknow and DMO: Allahabad, Ambedkarnagar, Barabanki, Bijnore, Bulandshahar, Chitrakoot, Deoria, Fatehpur, Hamirpur, Hardoi, Jalaun, J.P. Nagar, Kanpur Nagar, Kushinagar, Mahoba, Mirzapur, Pilibhit, Saharanpur, Sitapur, Siddharthanagar, Sonebhadra and Sant Ravidas Nagar.
Principal Secretary (Geology and Mining)
Director Geology and Mining
Joint Director (HQ)
District Collector (at District level)
Chief Mines Officer (HQ)
District Mines Officer/ Mining Inspectors

Audit Report (Revenue Sector) for the year ended 31 March 2018
70
Table - 5.1 (` in crore)
Sl. No.
Categories Number of paragraphs
Amount Share in per cent to the total objected amount
1. Royalty non/short realised 47 15.10 6.66 2. Interest/penalty not imposed 16 3.46 1.53 3. Cost of minerals not recovered 34 71.24 31.43 4. Other irregularities2 78 136.85 60.38
Total 175 226.65
Source: Information available in the Audit office.
The Department accepted (between April 2017 and September 2019) 945 cases amounting to ` 33.92 crore pointed out in the year 2017-18. The Department reported (between April 2017 and September 2019) recovery of ` 8.99 crore in cases pertaining to the earlier years. Irregularities involving 1,053 cases worth ` 45.21 crore have been illustrated in this chapter. The Department had accepted 945 out of total 1,053 findings in the Exit Conference (November 2018). However, no recoveries in the accepted cases have been reported to Audit till date (September 2019). Out of these, some irregularities have been repeatedly reported during the last five years as detailed in Table - 5.2. Most of the audit observations are of a nature that may reflect similar errors/omissions in other units of the concerned State Government department, but were not covered in the test check conducted during the year. The Department/Government may therefore like to internally examine all other units with a view to ensuring that they are functioning as per requirement and rules.
Table - 5.2
(` in crore)
2012-13 2013-14 2014-15 2015-16 2016-17 Total Nature of observation
Cases Amount Cases Amount Cases Amount Cases Amount Cases Amount Cases Amount
Cost of minerals not realised
15 0.37 221 13.92 311 13.98 3,491 476.06 1,181 193.97 5,219 698.30
Excavation of minerals without Environment Clearance (EC)
- - -- -- -- -- 04 66.90 04 33.75 08 100.65
Excavation of brick earth without Environment clearance (EC)
-- -- -- -- -- -- 2,909 66.80 1,131 62.27 4,040 129.07
Royalty and permit fees not realised from brick kiln owners
1,655 10.22 412 3.87 1,430 6.84 39 0.25 353 6.66 3,889 27.84
Non levy/Short deposit of dead rent
- - 10 0.23 - - 30 0.61 - - 40 0.84
2 No proper monitoring to realise the revenue. Non-compliance of e-tendering. Non-payment of dead rent by lease holders. Lapses regarding non verification of challan from the treasury. Non-recovery of recovery certificates.

Chapter V: Mining Receipts
71
Recommendations: 1. The Department should initiate systemic measures to ensure that
the shortcomings repeatedly reported by Audit do not recur. 2. The Department should introduce more effective measures to
monitor and ensure recoveries of the large amounts of non/short realisations pointed out in the Audit Reports.
5.3 Cost of minerals not realised from contractors for works executed without transit passes
The UPMMC Rules, 1963 and the Uttar Pradesh Minerals (Prevention of Illegal Mining Transportation and Storage) Rules, 2002 stipulate that no person shall transport any mineral without a valid transit pass (Form MM-113/Form C4). The MMDR Act5 stipulates that the price of minerals along with the royalty may be recovered for raising minerals without lawful authority. The Government, in its order dated 15 October 2015, reiterated that apart from royalty, the cost of minerals (ordinarily five times of royalty) be deducted from the contractor’s bill and deposited into the treasury, if the contractors do not produce the requisite royalty receipt in the form MM-11 or Form C.
Previous Audit Reports of 2012-13 to 2016-17 had highlighted persistent loss of Government revenue amounting to ` 698.30 crore due to non-realisation of cost of minerals from 5,219 contractors.
To evaluate the corrective measures adopted by the Department in this regard, Audit test checked the records of 22 District Mines Offices (DMOs) during 2017-18. It was noticed in eight DMOs that the executing agencies got 68 civil works executed prior to 16 October 2015 (06/2014 to 07/2015) and 266 civil works on or after 16 October 2015 (04/2016 to 01/2018) through the contractors. In total 334 cases (out of 350 tests checked), the contractors did not submit the required MM-11 forms along with the bills for the minerals used in civil works. The executing agencies deducted royalty of ` 5.25 crore from the bills of the contractors and deposited the same into the treasury. The concerned DMOs, despite having the knowledge of deduction of royalty by the executing agency, did not raise the issue with the executing agencies for ensuring recovery of the cost of minerals from the works contractors and failed to initiate any action in the matter to recover the cost of minerals valued at ` 26.27 crore (` 1.51 crore prior to 16 October 2015 and ` 24.76 crore from 16 October 2015 and onwards) (Appendix-XVI).
Audit reported the matter to the Department in (July 2017 to May 2018). In the exit conference (November 2018), the Department accepted the Audit 3 Transit pass (Rawanna) issued by the holder of the mining lease or crusher plant for transportation of minor
minerals. It includes names and addresses of the lease holders, nature and quantity of minerals and vehicle registration number through which the minerals are transported.
4 The holder of licence for storage of minerals shall issue the transit pass in ‘Form-C’ for lawful transportation of minerals from the Store.
5 Section 21(5) of the MMDR Act.
The Department did not recover cost of minerals amounting to ` 26.27 crore and due penalty in 334 cases from contractors undertaking civil works, for raising mineral without lawful authority.

Audit Report (Revenue Sector) for the year ended 31 March 2018
72
observation and stated that the mineral price (five times of Royalty) will be recovered in cases that have been identified after the notification dated 15 October 2015. However, in cases prior to that notification, no recovery can be made as no instructions for the same existed. The reply of the Department is not acceptable as far as cases pertaining to the period prior to notification dated 15 October 2015 are concerned. Under Section 21(5) of MMDR Act, price of the mineral may be recovered if any person raises any mineral from any land without lawful authority. Transportation of minerals without a valid transit pass indicates possibility of illegal mining. Thus the matter needs to be investigated into and action taken where illegal mining and transportation of minerals are established as per the provisions of the MMDR Act.
Recommendation:
The Mining Department should ensure coordination with the executing agencies undertaking civil works to ensure that the contractors have sourced minerals from legitimate lessees, and possess valid MM-11 for transporting such minerals.
5.4 Unauthorised extraction of minerals
The MMDR Act stipulates that mining operations shall be undertaken in accordance with the terms and conditions of a mining lease granted under the Act and the rules made there under. It further stipulates that if any person raises without lawful authority, any mineral from any land, the State Government may recover from such person, the mineral so raised or where such mineral has already been disposed off, the price thereof along with royalty. Under UPMMC Rules, the total royalty has been fixed at the rate of not more than 20 per cent of the pit’s mouth value6 of minerals.
The Environment Protection Act (EPA), 1986 stipulates that whoever fails to comply with or contravenes any of the provisions of this Act, shall be punishable for each failure with imprisonment, which may extend to five years, or with fine which may extend to ` one lakh, or both.
5.4.1 Excavation of minerals beyond the limit fixed in Environment Clearance (EC)
The State Government ordered (May 2011 and March 2012) that mining lease holders shall get EC from the Ministry of Environment and Forest (MoEF). If any person excavates minerals beyond the quantity approved in the EC, the same is to be treated as illegal mining as it violates the essential conditions governing grant of the lease. The lease holder7 is therefore liable to pay royalty, cost of minerals and fine under Section 21(5) of the MMDR Act.
6 “Pit’s mouth value” means “the sale price of the minor minerals at the pit head or at the point of production.” 7 Persons authorised to undertake mining operations in areas specified in lease under and in accordance with the
terms and conditions of a mining lease granted under MMDR Act and the rules made there under.
Cost of excess excavated minerals valuing to ` 1.66 crore was not recovered from two lessees for excavating excess than minor minerals permitted in Environmental Clearance (EC).

Chapter V: Mining Receipts
73
The previous Audit Reports of 2015-16 to 2016-17 had highlighted loss of Government revenue amounting to ` 100.65 crore due to excavation of minerals without Environment Clearance in eight cases.
To evaluate the corrective measures adopted by the Department in this regard, Audit test checked the records of two8 DMOs out of 22 DMOs audited during 2017-18 and noticed that in two out of 30 test checked cases (total 92 cases), lessees had excavated 0.35 lakh cubic meters of minerals (moram and gitti) in excess of the quantities approved in their respective ECs between December 2013 and February 2018 and paid a royalty of ` 0.33 crore. The excavation of minerals in excess of that permitted in EC was not only illegal but could also affect the environment adversely. The concerned DMOs neither took any action to stop the business nor recovered the cost of illegally mined mineral amounting to ` 1.66 crore (five times of the applicable royalty). Further, a fine of ` one lakh was also not imposed upon each of the lessees for violation of Environment Rules.
5.4.2 Violation of Mining Plan 5.4.2.1 Excavation of minerals beyond the limit fixed in Mining Plan
Under MMDR Act, mining operation shall in respect of in situ rock deposits and sand or morrum or bajari or boulder or any of these in mixed state exclusively found in river bed be undertaken in accordance with the mining plan, detailing yearly development schemes which is duly approved by the Director of Geology and Mining Department. The mining plan, once approved by the Director, shall be valid for entire duration of the lease. Mining operations shall be undertaken in accordance with the duly approved mining plan. Any modification of the approved mining plan during the operation of a mining lease also requires prior approval of the competent authority.
To evaluate the enforcement of the above by the Department, Audit test checked the records of DMO Mahoba during 2017-18, It was noticed that a (the sole case test checked) lessee had excavated 0.45 lakh cubic meters of minerals (moram and gitti) in excess of the quantity permitted in the Mining Plan between December 2016 and April 2017 and paid a royalty of ` 0.67 crore. The excess excavation of minerals was not only illegal but could also affect the environment adversely. The concerned DMO neither took any action to stop the business nor recovered the cost of mineral amounting to ` 3.35 crore (five times of the applicable royalty). Further, a fine of ` one lakh was also not imposed on the lessee for violation of Environment Rules
8 Barabanki and Sonebhadra
Cost of excavation of minerals valuing to ` 3.35 crore was not recovered from one lessee for excavating beyond the limit fixed in the Mining Plan.

Audit Report (Revenue Sector) for the year ended 31 March 2018
74
5.4.2.2 Excavation of minerals without Mining Plan
The Mining Plan should be prepared by technical experts scientifically in such a manner so that it could help in development of the area. If the mining activities are done without an approved mining plan, the Department will not have any control over the same and the lessee may extract more minerals in an unscientific manner which would adversely affect the mineral resources, protection of forest, water courses and would also abet air and water pollution.
To evaluate the enforcement by the Department in this regard, Audit test checked the records of DMO Hamirpur during 2017-18 and noticed that a (out of single case test checked) lessee had excavated 0.80 lakh cubic meters of minerals (moram and gitti) between March 2013 and February 2014 without any approved mining plan and had paid a royalty of ` 0.60 crore. The total quantity of mineral excavated by the lessee was unauthorised and amounted to illegal mining. The concerned DMO neither took any action to stop the business nor recovered cost of mineral amounting to ` 3.00 crore (five times of the applicable royalty). Further, a fine of ` one lakh was also not imposed on the lessee for violation of the extant rules.
5.4.3 Excavation of brick earth without Environment Clearance (EC)
MoEF, in OM dated 24 June 2013, had categorised mining of brick earth into B-2 category9 wherein obtaining the EC from the State Environment Impact Assessment Authority (SEIAA10) is mandatory.
The previous Audit Reports of 2015-16 to 2016-17 had highlighted loss of the Government revenue amounting to ` 129.07 crore due to excavation of brick earth without EC in 4,040 cases by brick kilns.
To evaluate the assurances by the Department in this regard, Audit test checked the records of 22 DMOs during 2017-18. It was noticed that in two DMOs, that 36 out of 72 brick kilns test checked had operated during the period 2015-16 to 2016-17 without obtaining EC and paid a royalty of ` 0.35 crore. The excavation of brick earth without EC was not only illegal but could also affect the environment adversely. The concerned DMOs neither took any action to stop the business nor recovered the cost of mineral amounting to ` 1.77 crore. Further, a fine of ` one lakh was also not imposed upon each of the lessees for violation of Environment Rules shown in Table 5.3.
9 The activities of excavation of ‘brick earth’ and ‘ordinary earth’ up to an area less than five hectares have been
categorised under B-2 category on the basis of spatial extent of potential impacts and potential impacts on human health.
10 A State Level Environment Impact Assessment Authority (SEIAA) shall be constituted by the Central Government under sub-section (3) of section 3 of the Environment (Protection) Act, 1986 comprising of three Members including a Chairman and a Member – Secretary to be nominated by the State Government or the Union territory Administration concerned.
Cost of excavated minerals valuing to ` 3.00 crore was not recovered from one lessee for excavating minerals without Mining Plan.
Cost of brick earth amounting to ` 1.77 crore was not recovered in 36 cases from brick kilns operating without Environmental Clearance (EC).

Chapter V: Mining Receipts
75
Table 5.3 (Amount in `)
Sl. No.
Name of Unit Year Total No. of Brick Kiln
No. of Brick Kiln
checked
No of Bricks Kiln
Objected
Royalty paid
Mineral Value
2015-16 24 24 13 1337370 6686850 1 DMO Hamirpur 2016-17 27 27 14 1427631 7138155 2015-16 12 12 7 570600 2853000 2 DMO Jalaun 2016-17 9 9 2 203800 1019000
Total 72 72 36 3539401 17697005
Audit reported the matter in 5.4.1, 5.4.2.1, 5.4.2.2 and 5.4.3 to the Department (between October 2017 and May 2018). In the exit conference (November 2018), the Department stated that with reference to previous Audit observations, the Government, through notification dated 14 August 2017, had amended Rule 59 of UPMMC Rules, 1963 vide which the penalty would be imposed in such cases after the date of this amendment. For cases prior to the notification, no action could be taken as no instruction had existed for the same. The reply of the Department for cases prior to amendment of Rule 59 is not acceptable. Since 2011-12, the State Government had insisted upon observance of EC conditions by the lease holders, any violation of conditions of mining rendered such excess excavation of minerals illegal and attracted recovery of cost of minerals under the MMDR Act. The Department had the omnibus powers under Rule 6011 of the UPMMC Rules, 1963 to investigate all such cases where the lessees had flouted the conditions of mining lease, and act accordingly. There is no evidence of either any cognisance being taken or any punitive action being taken in any case. Excess excavation was an illegal mining action. It attracted recovery of cost of minerals under the MMDR Act.
Recommendation:
The Department should ensure that minerals including brick earth are not excavated without the requisite environment clearance to curb illegal mining.
5.5 Royalty and permit application fees not realised from the brick kiln owners
One Time Settlement Schemes (OTSS) for brick kilns, announced by the Government from time to time, provided for payment of a consolidated amount of royalty at the prescribed rates along with permit application fees. It also provided for charging of interest at the rate of 24 per cent on belated payment of royalty, fee or other sum due to the Government. In OTSS of
11 Rule-60 of UPMMC Rules, 1963 already provides that in case of any breach or contravention by a lessee of any
of these rules or conditions and covenants contained or deemed to be contained in the lease, lessee may be black listed by the District Officer for such period.
Royalty of ` 6.94 crore and permit application fees of ` 13.14 lakh were not realised in 660 cases from brick kiln owners, though the same was specified in the OTS scheme.

Audit Report (Revenue Sector) for the year ended 31 March 2018
76
2015-16, an additional 20 per cent of royalty was to be levied for palothan12 soil used in brick making.
Previous Audit Reports of 2012-13 to 2016-17 had highlighted persistent loss of Government revenue amounting to ` 27.84 crore due to non-realisation of royalty and permit application fees from 3,889 brick kilns. Audit Report for 2012-13 was only discussed in PAC where a recovery of ` 3.78 crore was reported by the Department.
To evaluate whether the Department had followed up on its assurances in this regard, Audit test checked the records of 22 DMOs during 2017-18. It was noticed that 660 out of 2,835 brick kilns test checked which were in operation during the period in 12 DMOs that the concerned brick kiln owners did not pay any royalty and permit application fees for the brick years13 2013-14 to 2016-17. The concerned DMOs neither initiated any action to stop the business nor made any efforts to realise the due royalty of ` 6.94 crore and permit application fees of ` 13.14 lakh (Appendix-XVII).
Audit reported the matter to the Department (October 2016 to April 2018). In the exit conference (November 2018), the Department accepted the Audit observations and stated that the action will be taken for the recovery.
Recommendation:
The Department should ensure that all brick kiln owners in the State abide with the provisions of the OTSS as applicable in the given brick year. Efforts should also be made to recover the outstanding royalty from the defaulting brick kiln owners.
5.6 Non/Short deposit of dead rent
Under UPMMC Rules,14 every lessee of mining lease shall pay every year, dead rent15 in advance for the whole year at the rates prescribed in the Second Schedule for all areas included in the lease.
The previous Audit Report of 2013-14 and 2015-16 had highlighted persistent loss of Government revenue amounting to ` 0.84 crore due to non/short deposit of dead rent in 40 leases.
Audit test checked the records of 22 District Mines Offices (DMOs) during 2017-18. In six DMOs, Audit noticed that 19 lessees out of 283 lessees had deposited dead rent of ` 1.85 crore for the dead rent period between February 2012 to November 2017 against the due amount of ` 3.94 crore. Although the details of payment were available in the lease files, the Department did not
12 Sandy soil. 13 October to September. 14 Rule 72 of UPMMC 15 Dead Rent: The holder of a mining lease shall, during the terms of the lease pay in advance instalments for every
year of the lease, such amount as dead rent at the rates mentioned in the Second Schedule to these rules.
19 lessees deposited dead rent of ` 1.85 crore for the lease period against recoverable amount of ` 3.94 crore. Department did not make any effort to recover short deposit of dead rent of ` 2.09 crore.


APPENDICES


Appendices
79
Trend of receipts (Reference Para No. 1.2.3)

Audit Report (Revenue Sector) for the year ended 31 March 2018
80
APPENDIX-I Failure to cancel the settlement of shops and forfeiture of basic license
fee/license fee and security deposit (Reference Para No. 2.3)
(Amount in `)
Sl. No.
Name of district Year Type of shops
Number of shops
Number of shops checked
No. of shops in which
objection found
Period of late
deposit of Security
Deposit in days
Basic License Fee/License Fee required
to be forfeited
Security Deposit
required to forfeited
Total Amount
required to forfeited
(i) Period of delay upto 15 days
1 DEO Ballia 2016-17 Country Liqour
142 14 14 04 to 15 94,65,375 1,43,45,268 2,38,10,643
2016-17 Foreign Liquor
73 73 6 03 to 07 36,12,500 5,88,500 42,01,000
2017-18 Foreign Liquor
74 74 5 06 to 12 29,50,000 6,00,840 35,50,840
2016-17 Country Liqour
357 357 10 03 to 07 55,27,125 1,10,60,324 1,65,87,449
2 DEO Sitapur
2017-18 Country Liqour
394 394 12 02 to 13 41,58,500 72,51,659 1,14,10,159
Total (i) 1,040 912 47 02 to 15 2,57,13,500 3,38,46,591 5,95,60,091
(ii) Period of delay More than 15 days
1 DEO Aligrah 2017-18 Country Liqour
204 13 13 upto 76 80,11,250 1,56,04,462 2,36,15,712
2015-16 Country Liqour
290 75 75 upto 142 4,02,22,500 4,22,42,141 8,24,64,641 2 DEO Azamgarh
2015-16 Foreign Liquor
128 128 19 upto 116 55,67,500 7,95,230 63,62,730
* DEO Ballia 2017-18 Country Liqour
142 39 20 upto 181 1,30,00,250 1,98,52,868 3,28,53,118
3 DEO Etah 2016-17 Country Liqour
186 79 79 upto 327 3,08,53,250 2,85,06,737 5,93,59,987
4 DEO Faizabad 2017-18 Country Liqour
205 17 17 upto 33 16,48,900 27,78,487 44,27,387
5 DEO Firozabad 2016-17 Country Liqour
142 32 10 upto 33 61,88,625 54,98,981 1,16,87,606
6 DEO Ghazipur 2016-17 Country Liqour
192 39 12 upto 102 52,37,125 69,44,893 1,21,82,018
7 DEO Kannauj 2016-17 Country Liqour
17 17 17 upto 95 1,25,40,000 93,40,209 2,18,80,209
2016-17 Country Liqour
257 11 11 upto 201 37,27,500 78,54,923 1,15,82,423
2017-18 Country Liqour
264 10 10 upto 76 18,63,750 30,87,994 49,51,744
8 DEO Lakhimpur Kheri
2015-16 Country Liqour
253 9 9 upto 201 11,81,750 18,23,792 30,05,542
2017-18 Country Liqour
57 47 10 upto 141 1,22,38,750 1,34,07,224 2,56,45,974 9 DEO MahaMaya Nagar
2016-17 Country Liqour
57 30 17 upto 52 1,01,90,250 88,95,222 1,90,85,472
2017-18 Foreign Liquor
52 25 2 upto 136 3,40,000 - 3,40,000 10 DEO Maharajganj
2017-18 Country Liqour
226 75 26 upto 268 87,24,750 78,80,479 1,66,05,229

Appendices
81
(Amount in `)
Sl. No.
Name of district Year Type of shops
Number of shops
Number of shops checked
No. of shops in which
objection found
Period of late
deposit of Security
Deposit in days
Basic License Fee/License Fee required
to be forfeited
Security Deposit
required to forfeited
Total Amount
required to forfeited
2015-16 Country Liqour
219 9 9 upto 255 59,37,000 45,78,305 1,05,15,305 11 DEO Pratapgarh
2016-17 Country Liqour
224 17 17 upto 115 38,29,125 56,52,312 94,81,437
12 DEO Shahjahanpur
2017-18 Country Liqour
216 13 13 upto 105 46,02,375 11,44,464 57,46,839
2017-18 Foreign Liqour, bear & m.shop
162 162 60 upto 48 1,72,13,000 31,64,240 2,03,77,240 13 DEO Unnao
2017-18 Country Liqour
318 318 221 upto 48 6,46,60,075 8,21,34,154 14,67,94,229
Total (ii) 3,811 1,165 667 upto 327 25,77,77,725 27,11,87,117 52,89,64,842
Grand Total 4,851 2,077 714 28,34,91,225 30,50,33,708 58,85,24,933
*DEO Ballia is repeated. Source: Information available on the basis of Audit findings.

Audit Report (Revenue Sector) for the year ended 31 March 2018
82
APPENDIX-II Sale of Beer without Beer bar license
(Reference Para No. 2.4) (Amount in `)
Sl. No.
Name of units
(DEO)
Year Total no. of cases
No. of cases
checked
No. of license for
FL-7 (objection
found)
Due license fee per FL-7B
Total license fees not received
2016-17 62 22 7 2,14,000 14,98,000 1 Agra 2017-18 58 22 7 2,14,000 14,98,000 2016-17 7 7 1 2,14,000 2,14,000 2 Aligarh 2017-18 8 8 2 2,14,000 4,28,000 2016-17 2 2 2 1,48,000 2,96,000 3 Ballia 2017-18 3 3 3 1,48,000 4,44,000
4 Bareilly 2017-18 26 25 13 2,14,000 27,82,000 2016-17 2 2 1 1,48,000 1,48,000 5 Chandauli 2017-18 2 2 1 1,48,000 1,48,000 2016-17 82 82 27 2,14,000 57,78,000 6 G.B.Nagar 2017-18 82 82 35 2,14,000 74,90,000 2015-16 5 5 3 1,34,000 4,02,000 2016-17 5 5 3 1,48,000 4,44,000
7 Lakhimpur Kheri
2017-18 5 5 3 1,48,000 4,44,000 2015-16 3 3 2 1,34,000 2,68,000 8 Pilibhit 2016-17 3 3 2 1,48,000 2,96,000 2015-16 3 3 3 1,34,000 4,02,000 9 Sambhal 2016-17 3 3 3 1,48,000 4,44,000
10 Unnao 2017-18 1 1 1 1,48,000 1,48,000 Total 362 285 119 32,32,000 2,35,72,000
Source: Information available on the basis of Audit findings.

Appendices
83
APPENDIX-III Short levy of license fee on model shops
(Reference Para No. 2.5) (Amount in `)
Sl. No.
Name of district
Period No. of
cases
No. of cases test
chec-ked
No of cases in which objec-tion
found
Highest License Fee of (IMFL+Beer) in
the town
Total License
fee according to Highest
License fee of
IMFL and Beer shops
in the town
Total License fee according to Highest Licence fee
of IMFL and Beer
shops
License fee
realised per case
Total License fee
realised
License fee short levied
2016-17 3 3 2 22,40,000+7,15,000 29,55,000 59,10,000 24,45,000 48,90,000 10,20,000 1 Etah
2017-18 3 3 2 22,40,000+7,15,000 29,55,000 59,10,000 24,45,000 48,90,000 10,20,000
2016-17 3 3 1 20,60,000+6,85,000 27,45,000 27,45,000 15,25,000 15,25,000 12,20,000 2 Ghazipur
2017-18 3 3 1 20,60,000+6,85,000 27,45,000 27,45,000 15,25,000 15,25,000 12,20,000
2017-18 1 17,40,000+3,30,000 20,70,000 20,70,000 20,20,000 20,20,000 50,000
2017-18 1 17,40,000+3,30,000 20,70,000 20,70,000 16,35,000 16,35,000 4,35,000
3 Kannauj
2017-18
3 3
1 17,40,000+3,30,000 20,70,000 20,70,000 16,70,000 16,70,000 4,00,000
2016-17 1 1 1 15,55,000+5,45,000 21,00,000 21,00,000 18,22,000 18,22,000 2,78,000 4 Maha-rajganj 2017-18 1 1 1 15,55,000+5,45,000 21,00,000 21,00,000 18,22,000 18,22,000 2,78,000
2013-14 1 19,35,000+7,80,000 27,15,000 27,15,000 14,40,000 14,40,000 12,75,000
2013-14
4 4
1 11,25,000+2,75,000 14,00,000 14,00,000 12,60,000 12,60,000 1,40,000
2014-15 1 22,30,000+9,00,000 31,30,000 31,30,000 16,60,000 16,60,000 14,70,000
2014-15
4 4
1 12,95,000+3,20,000 16,15,000 16,15,000 14,55,000 14,55,000 1,60,000
2015-16 1 25,65,000+10,35,000 36,00,000 36,00,000 19,10,000 19,10,000 16,90,000
2015-16
4 4
1 14,90,000+3,70,000 18,60,000 18,60,000 16,75,000 16,75,000 1,85,000
2016-17 1 25,65,000+10,35,000 36,00,000 36,00,000 19,10,000 19,10,000 16,90,000
2016-17
4 4
1 14,90,000+3,70,000 18,60,000 18,60,000 16,75,000 16,75,000 1,85,000
5 Shamli
2017-18 4 4 1 16,05,000+3,05,000 19,10,000 19,10,000 16,75,000 16,75,000 2,35,000
2016-17 4 3 3 17,80,000+4,55,000 22,35,000 67,05,000 21,55,000 64,65,000 2,40,000 6 Sitapur
2017-18 4 3 3 17,80,000+4,55,000 22,35,000 67,05,000 21,55,000 64,65,000 2,40,000
7 Sone-bhadra
2016-17 1 1 1 13,50,000+4,00,000 17,50,000 17,50,000 15,76,000 15,76,000 1,74,000
Total 46 44 27 6,45,70,000 5,09,65,000 1,36,05,000
Source: Information available on the basis of Audit findings.

Audit Report (Revenue Sector) for the year ended 31 March 2018
84
APPENDIX-IV Application of incorrect rate of tax
(Reference Para No. 3.3) (` in lakh)
Sl.No. Name of the unit
Number of
dealers
Assessment year
(month and year of
assessment)
Name of commodity
Value of goods
Rate of tax
leviable (per cent)
Rate of tax levied (per cent)
Tax short levied
1 DC Sec. 10 CT Agra
1 2013-14 (August-
2016
Canvas footwear 213.51 14 5 19.22
1 2012-13 (January
2016)
Computer parts 12.28 13.5 5 1.04 2
DC Sec. 11 CT Agra
1 2013-14 (September
2016)
Fire extinguisher 20.49 14 5 1.84
3 DC Sec. 13 CT Agra
1 2013-14 (November
2016)
Adult diaper 39.96 14 5 3.60
4 DC Sec. 15 CT Agra
1 2012-13 (March 2016)
Footwear 55.00 13.5 3 5.78
2012-13 (September
2016)
Computer parts 15.10 13.5 5 1.28
7.91 14 5 0.71
5
DC Sec. 16 CT Agra
1
2013-14 (December
2016)
Computer parts
2.27 14 5 0.20
6 JC (CC) CT Aligarh
1 2013-14 (March 2017)
Processed meat 74.08 17.5 9 6.30
7 JC (CC) CT Allahabad
1 2013-14 (December
2016)
Copper conductor 10118.38 14 5 910.65
8 DC Sec. 1 CT Allahabad
1 2012-13 (January
2015)
Computer parts 38.75 14 5 3.29
50.14 14 5 4.51 9
DC Sec. 2 CT Auraiya
1 2012-13 (July 2016)
Computer parts
17.49 13.5 5 1.49
2011-12 (March 2015)
Hand pump 65.69 5 0 3.28 10
DC Sec. 2 CT Bahraich
1
2012-13 (December
2015)
Hand pump 34.42 5 0 1.72
11 DC Sec. 3 CT Bareilly
1 2012-13 (February
2016)
Photo state machine
43.80 13.5 5 3.72

Appendices
85
(` in lakh) Sl.No. Name of the
unit Number
of dealers
Assessment year
(month and year of
assessment)
Name of commodity
Value of goods
Rate of tax
leviable (per cent)
Rate of tax levied (per cent)
Tax short levied
12 DC Sec. 9 CT Bareilly
1 2012-13 (March 2015)
Plywood 16.20 14 5 1.46
13 AC Sec. 5 CT Firozabad
1 2011-12 (February
2015)
Paint and varnish 24.46 13.5 5 2.08
1 2013-14 (July 2016)
Electronic meter parts
256.12 14 5 23.05 14
DC Sec. 2 CT Ghaziabad
1 2013-14 (June 2016)
Scooter parts 28.95 14 5 2.61
15 DC Sec. 4 CT Ghaziabad
1 2013-14 (March 2017)
Soil 390.29 5 0 19.51
16 DC Sec. 6 CT Ghaziabad
1 2013-14 (October
2016)
Machinery and machinery parts
11.59 14 5 1.04
1 2012-13 (February
2016)
Mill Board 31.53 13.5 5 2.68 17
DC Sec. 8 CT Ghaziabad 1 2013-14
(August 2016)
Starch Based Adhesive Powder
20.93 14 5 1.88
1 2013-14 (November
2016)
Mobile charger and Battery
16.03 14 5 1.44 18
DC Sec. 10 CT Ghaziabad 1 2013-14
(November 2016)
Railway engine machinery scrap
136.31 5 4 1.36
19 DC Sec. 15 CT Ghaziabad
1 2013-14 (September
2016)
Silencer 17.61 14 5 1.59
20 DC Sec. 17 CT Ghaziabad
1 2013-14 (November
2016)
Computer parts 38.02 14 5 3.42
21 AC Sec. 3 CT Gonda
1 2014-15 (January
2017)
Marble 24.63 14 5 2.22
22 DC Sec. 3 CT Gorakhpur
1 2011-12 (October
2015)
Modem 54.89 13.5 5 4.67
23 AC Sec. 8 CT Gorakhpur
1 2013-14 (March 2016)
Buckets made of Iron and steel,
Plastic and other material
166.49 5 4 1.66

Audit Report (Revenue Sector) for the year ended 31 March 2018
86
(` in lakh) Sl.No. Name of the
unit Number
of dealers
Assessment year
(month and year of
assessment)
Name of commodity
Value of goods
Rate of tax
leviable (per cent)
Rate of tax levied (per cent)
Tax short levied
24 JC (CC) CT Jhansi
1 2013-14 (June 2016)
Old bags 226.14 5 4 2.26
25 DC Sec. 4 CT Jhansi
1 2012-13 (December
2015)
Harpic tablet 268.12 13.5 5 22.79
26 DC Sec. 1 CT Kanpur
1 2013-14 (March 2017)
Tips of refill 305.87 14 5 27.53
27 DC Sec. 16 CT Kanpur
1 2013-14 (January-
2017)
Diaper 40.27 14 5 3.62
28 DC Sec. 21 CT Kanpur
1 2013-14 (November
2016)
Toffee 33.20 14 5 2.99
29 DC Sec. 22 CT Kanpur
1 2012-13 (January
2016)
P.V.C. heat shrink leaves
50.45 13.5 5 4.29
30 DC Sec. 26 CT Kanpur
1 2013-14 (September
2016)
D.T.H. 48.46 14 5 4.36
31 DC Sec. 29 CT Kanpur
1 2013-14 (February
2017)
Varnish 15.27 14 5 1.37
2013-14 (December
2016)
Machinery and machinery spare
parts
24.01 14 5 2.16 32
DC Sec. 2 CT Kannauj
1
2013-14 (December
2016)
Machinery and machinery spare
parts
1.38 14 4 0.14
2012-13 (August 2015)
Toffee 16.03 13.5 5 1.36 33
DC Sec. 2 CT Kanshiram Nagar (Kasganj)
1
2011-12 (December
2013)
Toffee 17.66 13.5 5 1.50
34 DC Sec. 3 CT Lakhimpur Kheri
1 2013-14 (July 2016)
Pesticide 25.93 5 0 1.30
35 DC Sec. 1 CT Lucknow
1 2013-14 (November
2016)
Modem 78.31 14 5 7.05
36 DC Sec. 6 CT Lucknow
1 2013-14 (January
2016)
Corn flakes 19.56 13.5 5 1.76

Appendices
87
(` in lakh) Sl.No. Name of the
unit Number
of dealers
Assessment year
(month and year of
assessment)
Name of commodity
Value of goods
Rate of tax
leviable (per cent)
Rate of tax levied (per cent)
Tax short levied
2013-14 (December
2016)
Mobile accessories
84.64 14 5 7.62 37
DC Sec. 7 CT Lucknow
1
2012-13 (December
2015)
Mobile accessories
70.40 13.5 5 5.98
38 DC Sec. 9 CT Lucknow
1 2013-14 (February
2017)
Computer parts 32.81 14 5 2.95
423.45 14 5 38.11 39
DC Sec. 10 CT Lucknow
1 2013-14 (January
2017)
Demark mass gainer/Shaktiprash
/muscle builder 9.52 14 5 0.86
40 DC Sec. 13 CT Lucknow
1 2013-14 (January
2017)
Food supplement 41.08 14 5 3.70
41 DC Sec. 17 CT Lucknow
1 2013-14 (September
2015)
Scrap of Plastic, glass
232.05 5 4 2.32
1 2012-13 (March 2016)
Computerised Water Treatment
Plant
56.40 13.5 5 4.79 42
DC Sec. 13 CT Meerut
1 2012-13 (February
2016)
S.T.P. plant 12.50 13.5 5 1.06
43 JC (CC) CT Moradabad
1 2008-09 (November
2016)
Wood and timber 170.18 12.5 4 14.46
44 DC Sec. 2 CT Noida
1 2013-14 (July 2016)
Computer/laptop parts
34.46 14 5 3.10
1 2013-14 (October
2016)
Toffee 77.76 14 5 7.00
2012-13 (February
2017)
Modem 8.94 14 5 0.81
45
DC Sec. 12 CT Noida 1
2013-14 (February
2017)
Modem 10.62 14 5 0.95
46 DC Sec. 13 CT Noida
1 2013-14 (September
2016)
AC parts 13.52 14 5 1.22

Audit Report (Revenue Sector) for the year ended 31 March 2018
88
(` in lakh) Sl.No. Name of the
unit Number
of dealers
Assessment year
(month and year of
assessment)
Name of commodity
Value of goods
Rate of tax
leviable (per cent)
Rate of tax levied (per cent)
Tax short levied
47 DC Sec. 2 CT Raebareli
1 2011-12 (March 2015)
D.A.P. 188.35 4 0.69 1.10
48 DC Sec. 1 CT Shahjahanpur
1 2010-11 (February
2016)
Computer parts 38.45 13.5 5 3.27
1 2012-13 (February
2016)
Machinery and parts
54.79 14 5 4.93
2011-12 (July 2014)
14.34 13.5 5 1.22
2012-13 (July 2014)
10.48 13.5 5 0.89
49
DC Sec. 3 CT Sultanpur
1
2013-14 (December
2016)
Set top box
7.05 14 5 0.63
50 AC Sec. 6 CT Varanasi
1 2011-12 (August 2015)
Auto parts 41.74 13.5 5 3.55
51 DC Sec. 8 CT Varanasi
1 2013-14 (February
2017)
Furniture 14.77 14 5 1.33
Total 58 14862.28 1235.63
Source: Information available on the basis of Audit findings.

Appendices
89
APPENDIX-V Irregular concession allowed on goods not covered under the Registration
Certificate (RC) (Reference Para No. 3.4.2)
(` in lakh) Sl. No
Name of unit No of dealers
Assessment year (month & year of
assessment)
Name of commodity not
covered by registration certificate
Amount of
purchase
Rate of tax (per cent)
Rate of penalty
imposable (per cent)
Penalty leviable
1 DC Sec. 16 CT Agra
1 2013-14 (March 2017)
JCB machine 41.31 14 21.00 8.68
1 2013-14 (February 2017
Industrial paint 11.72 13.5 20.25 2.37
Printer scanner 68.81 5 7.50 5.16
2
JC (CC) CT Allahabad 1 2010-11
(March 2017 Ink ribbon 5.17 13.5 20.25 1.05 T.M.T bar 162.94 4 6.00 9.78
Air compressor 5.39 13.5 20.25 1.09 3
AC Sec. 2 CT Chandauli
1
2011-12 (October 2015)
Pollution control
equipment
3.47 5 7.50 0.26
4 JC (CC) I CT Ghaziabad
1 2013-14 (November 2016
Petrol 2.40 26.55 39.82 0.95
5 DC Sec. 4 CT Ghaziabad
1 2013-14 (March 2017)
Laminated toughened
glass, generator, SS pillar railing
8.93 14 21.00 1.88
6 DC Sec. 9 CT Ghaziabad
1 2013-14 (March 2017)
Bitumen 8.12 14 21.00 1.71
Thandai 12.45 14 21.00 2.61 7
DC Sec. 10 CT Ghaziabad
1 2013-14 (June 2016) Syrup 13.52 5 7.50 1.01
8 JC (CC) CT Meerut
1 2013-14 (September 2016)
Printer 4.01 5 7.50 0.30
9 DC Sec. 4 CT Noida
1 2013-14 (March 2017)
R.O. machine parts, stabilizer
7.92 14 21.00 1.66
Water chiller 6.89 14 21.00 1.45 10
DC Sec. 10 CT Noida
1
2013-14 (October 2016) Air cooler 1.09 13.5 20.25 0.22
11 DC Sec. 2 CT Shahjahanpur
1 2013-14 (February 2017)
Generator, machinery compressor
plate, elevator
46.05 14 21.00 9.67
Electrical goods and generator
rim dowel
258.67 13.5 20.25 52.38 12
JC (CC) I CT Varanasi
1
2013-14 (August 2016)
Dowel 1.89 14 21.00 0.40
13 DC Sec. 8 CT Varanasi
1 2012-13 (September 2016
Hydraulic mobile crane
10.29 14 21.00 2.16
TOTAL 14 681.04 104.79
Source: Information available on the basis of Audit findings.

Audit Report (Revenue Sector) for the year ended 31 March 2018
90
APPENDIX-VI Inadmissible ITC allowed to dealers
(Reference Para No. 3.5.1) (` in lakh)
Sl. No.
Name of the unit
Number of
dealers
Assessment year (month and year
of assessment)
ITC claimed by the dealer
Reason of wrongly
claimed ITC
Period of Interest
Interest leaviable
1 DC Sec. 11 Agra
1 2012-13 (December 2016)
0.71 RITC not done on stock transfer
01-10-2012 to 18-12-2016
0.45
2 DC Sec. 13 Agra
1 2013-14 (April 2016)
4.59 RITC not done on discount
amount
01-10-2013 to 30-04-2016
1.78
3 DC Sec.15 Agra
1 2013-14 (September 2016)
1.45 ITC claimed on exempted
goods
01-10-2013 to 07-09-2016
0.64
1 2013-14 (August 2016)
1.25 Excess claim 01-10-2013 to 20-08-2016
0.54 4
DC Sec. 18 Agra 1 2012-13
(October 2015) 3.26 Excess claim 01-10-2012 to
28-10-2015 1.50
5 JC (CC) Allahabad
1 2010-11 (March 2017)
8.10 RITC not done on stock transfer
01-10-2010 to 31-03-2017
7.90
6 DC Sec. 1 Auraiya
1 2013-14 (June 2016)
1.50 RITC not done on closing stock of lubricant
21-02-2014 to 22-06-2016
0.53
7 DC Sec. 2 Auraiya
1 2010-11 (August 2016)
0.50 Excess claim 21-05-2010 to 24-08-2016
0.47
8 DC Sec. 9 Ghaziabad
1 2013-14 (November 2016)
0.73 Irregular claim of ITC
21-05-2013 to 25-11-2016
0.39
9 DC Sec. 14 Ghaziabad
1 2013-14 (October 2016)
2.05 Excess claim 01-10-2013 to 29-10-2016
0.95
1 2013-14 (June 2016)
1.18 Excess claim due to wrong calculation
01-10-2013 to 30-06-2016
0.49 10
DC Sec. 18 Ghaziabad
1 2013-14 (September 2016)
0.80 Excess claim 01-10-2013 to 30-09-2016
0.36
11 DC Sec. 19 Ghaziabad
1 2011-12 (March 2015)
1.50 Excess claim 21-05-2011 to 31-03-2015
0.87
12 DC Sec. 3 Gorakhpur
1 2013-14 (January 2017)
3.04 Excess claim 01-10-2013 to 11-01-2017
1.50
13 DC Sec. 7 Gorakhpur
1 2009-10 (June 2016)
3.72 RITC not done on discount
01-10-2009 to 03-06-2016
3.73
14 DC Sec. 4 Jhansi
1 2012-13 (November 2015)
1.04 Excess claim 01-10-2012 to 09-11-2015
0.49
15 DC Sec. 15 Kanpur
1 2013-14 (July 2016)
6.78 Excess claim 01-10-2013 to 22-07-2016
2.86

Appendices
91
(` in lakh) Sl. No.
Name of the unit
Number of
dealers
Assessment year (month and year
of assessment)
ITC claimed by the dealer
Reason of wrongly
claimed ITC
Period of Interest
Interest leaviable
1 2013-14 (December 2016)
2.47 RITC not done on closing stock of lubricant
21-02-2014 to 27-12-2016
1.06 16
DC Sec. 22 Kanpur
1 2013-14 (September 2016)
2.61 RITC not done on closing stock of lubricant
21-02-2014 to 20-09-2016
1.01
17 DC Sec. 23 Kanpur
1 2013-14 (September 2016)
1.00 Excess claim 21-05-2013 to 28-09-2016
0.50
18 DC Sec. 26 Kanpur
1 2013-14 (October 2016)
1.03 RITC not done on closing stock of lubricant
21-02-2014 to 09-10-2016
0.41
19 DC Sec. 27 Kanpur
1 2013-14 (March 2017)
4.23 Excess claim 21-05-2013 to 17-03-2017
2.43
20 DC Sec. 29 Kanpur
1 2013-14 (December 2016)
2.27 RITC not done on closing stock of lubricant
21-02-2014 to 03-12-2016
0.95
21 DC Sec. 8 Lucknow
1 2013-14 (December 2016)
3.61 Excess claim 01-10-2013 to 13-12-2016
1.74
22 DC Sec. 20 Lucknow
1 2012-13 (February 2016)
2.90 Excess claim 01-10-2012 to 16-02-2016
1.47
23 DC Sec. 22 Lucknow
1 2013-14 (March 2017)
1.29 Excess claim 01-10-2013 to 21-03-2017
0.67
24 DC Sec. 6 Meerut
1 2013-14 (August 2016)
1.27 Excess claim 01-10-2013 to 20-08-2016
0.55
Total 27 64.88 36.22
Source: Information available on the basis of Audit findings.

Audit Report (Revenue Sector) for the year ended 31 March 2018
92
APPENDIX-VII ITC on goods sold on lower price than purchase price not reversed
(Reference Para No. 3.5.2) (` in lakh)
Sl. No. Name of the unit
Number of dealers
Assessment year (month and year
of assessment)
ITC claimed by the dealer
Tax on sale
Amount of RITC not done by
AAs
Interest leviable
1 JC (CC) Aligarh
1 2011-12 (November 2016)
71.51 30.25 41.26 31.86
2 DC Sec. 13 Allahabad
1 2012-13 (March 2017)
74.71 71.89 2.82 1.89
3 DC Sec. 9 Bareilly
1 2013-14 (March 2016)
14.31 13.04 1.27 0.48
4 DC Sec. 1 Faizabad
1 2012-13 (March 2016)
3.66 2.73 0.93 0.49
5 DC Sec. 6 Ghaziabad
1 2013-14 (October 2016)
21.73 20.58 1.15 0.52
6 DC Sec. 4 Gonda
1 2013-14 (March 2016)
76.60 47.66 28.94 10.86
7 JC (CC) Gorakhpur
1 2012-13 (March 2016)
32.45 30.11 2.34 1.22
8 DC Sec. 3 Gorakhpur
1 2013-14 (September 2016)
6.40 5.74 0.66 0.40
9 DC Sec. 2 Kanpur
1 2013-14 (April 2016)
100.69 99.95 0.74 0.28
10 DC Sec. 21 Kanpur
1 2012-13 (March 2016)
33.35 30.34 3.01 1.55
11 DC Sec. 12 Lucknow
1 2011-12 (March 2015)
13.31 11.81 1.50 0.78
12 DC Sec. 12 Noida
1 2012-13 (January 2016)
10.62 8.31 2.31 0.80
13 DC Sec. 10 Varanasi
1 2013-14 (September 2016)
27.14 25.64 1.50 0.68
Total 13 486.48 398.05 88.43 51.81
Source: Information available on the basis of Audit findings.

Appendices
93
APPENDIX-VIII False/fraudulent claim of ITC
(Reference Para No. 3.5.4) (` in lakh)
Sl. No.
Name of the unit No. of dealers
Assessment year (month and year
of assessment)
Amount of false claim of ITC reversed
by AAs
Brief description of ITC claimed
Penalty leviable
1 DC Sec. 2 CT Agra 1 2012-13 (June 2016)
3.76 Purchase not verified
18.80
2 AC Sec. 14 CT Agra
1 2013-14 (August 2016)
0.36 Purchase not verified
1.80
3 JC (CC) CT Aligarh
1 2013-14 (August 2016)
18.73 Purchase not verified
93.65
4 JC (CC) CT Bareilly
1 2013-14 (November 2016)
7.54 Purchase not verified
37.70
5 DC Sec. 2 CT Basti
1 2012-13 (March 2016)
0.27 Purchase not verified
1.37
6 DC Sec. 2 CT Ghaziabad
1 2012-13 (March 2016)
0.66 Purchase not verified
3.30
7 DC Sec. 7 CT Ghaziabad
1 2011-12 (March 2015)
0.39 Purchase not verified
1.95
8 DC Sec. 11 CT Ghaziabad
1 2013-14 (January 2017)
0.27 Purchase not verified
1.35
9 DC Sec. 17 CT Ghaziabad
1 2009-10 (April 2013)
34.46 Purchases from firm not in existence
172.30
10 DC Sec. 18 CT Ghaziabad
1 2013-14 (December 2016)
0.25 Purchases from firm not in existence
1.25
1 2013-14 (March 2017)
7.63 Purchases without tax invoice
38.15 11 DC Sec. 19 CT Ghaziabad
1 2011-12 (March 2015)
1.50 Excess claim of brought forward ITC
7.50
12 JC (CC)-II CT Kanpur
1 2013-14 (March 2017)
2.97 Purchases from firm not in existence
14.85
13 DC Sec. 12 CT Kanpur
1 2013-14 (July 2016)
2.01 Purchases from firm not in existence
10.05
14 DC Sec. 23 CT Kanpur
1 2013-14 (September
2016)
1.00 Excess claim of brought forward ITC
5.00
15 JC (CC)-II CT Lucknow
1 2013-14 (May 2015)
17.15 ITC claimed on non-vat goods
85.73
16 DC Sec. 12 CT Lucknow
1 2013-14 (March 2017)
88.68 Purchase not verified
443.40
17 DC Sec. 11 CT Meerut
1 2013-14 (March 2017)
0.56 Purchases from firm not in existence
2.80
18 DC Sec. 5 CT Noida
1 2011-12 (April 2015)
4.10 Purchases from firm not in existence
20.50
19 DC Sec. 2 CT Shahjahanpur
1 2014-15 (July 2016)
1.26 Purchases from firm not in existence
6.30
20 DC Sec. 3 CT Shahjahanpur
1 2011-12 (April 2015)
0.65 Purchase not verified
3.25
Total 21 194.20 971.00 Source: Information available on the basis of Audit findings.

Audit Report (Revenue Sector) for the year ended 31 March 2018
94
APPENDIX- IX Interest short/not charged (Reference Para No. 3.6)
(` in lakh)
Sl. No.
Name of the unit
No. of
dealers
Assessment year (month and year
of assessment)
Amount depo-sited
Rate of interest
per annum
(per cent)
Period of
delay in days
Total interest leviable
Interest deposited
by the dealer
Interest short/not charged
1 DC Sec. 9 CT Agra
1 2013-14 (September 2016)
12.18 15 1096 5.49 0.00 5.49
2 JC (CC) CT Allahabad
1 2010-11 (March 2017)
366.42 15 1278 to 1397
195.70 0.00 195.70
3 DC Sec. 7 CT Allahabad
1 2012-13 (June 2016)
3.50 15 1278 1.84 0.00 1.84
4 DC Sec. 12 CT Allahabad
1 2013-14 (September 2016)
2.41 15 1101 1.09 0.00 1.09
1 2012-13 (March 2016)
2.31 15 1462 1.39 0.00 1.39
2011-12 (June 2016)
1.01 15 1873 0.78 0.00 0.78
5
DC Sec. 1 CT Auraiya 1
2013-14
(June 2016) 1.94 15 1142 0.91 0.00 0.91
6 DC Sec. 3 CT Barabanki
1 2013-14 (March 2017)
3.46 15 1323 1.88 0.00 1.88
7 DC Sec. 6 CT Bareilly
1 2011-12 (April 2015)
3.68 15 1797 2.72 1.32 1.40
8 DC Sec. 2 CT Basti
1 2008-09 (July 2013)
1.47 15 1472 0.91 0.00 0.91
9 AC CT (Gulawati) Bulandshahar
1 2010-11 (July 2014)
7.27 15 32 to 1292
3.65 0.00 3.65
1 2013-14 (March 2017)
1.90 15 1340 1.05 0.00 1.05 10
JC (CC) CT Firozabad
1 2013-14 (January 2017)
3.07 15 1170 to 1311
1.56 0.03 1.53
11 DC Sec. 1 CT Ghaziabad
1 2013-14 (March 2017)
12.36 15 124 to 277
1.05 0.00 1.05
12 DC Sec. 7 CT Ghaziabad
1 2013-14 (March 2017)
10.37 15 1371 5.71 0.00 5.71
13 DC Sec. 12 CT Ghaziabad
1 2013-14 (August 2016)
50.71 15 39 to 68
1.06 0.00 1.06
14 DC Sec. 16 CT Ghaziabad
1 2012-13 (March 2016)
2.52 15 1368 1.41 0.06 1.35
15 JC (CC) CT Jhansi
1 2013-14 (March 2017)
9.15 15 457 to 918
3.23 0.00 3.23
16 JC (CC) II CT Kanpur
1 2013-14 (July 2016)
6.89 15 1030 2.92 0.00 2.92
2013-14 (May 2016)
1.19 15 1013 0.50 0.00 0.50 17
DC Sec. 27 CT Kanpur
1
2012-13 (October 2015)
1.61 15 1143 0.76 0.00 0.76

Appendices
95
(` in lakh) Sl. No.
Name of the unit
No. of
dealers
Assessment year (month and year
of assessment)
Amount depo-sited
Rate of interest
per annum
(per cent)
Period of
delay in days
Total interest leviable
Interest deposited
by the dealer
Interest short/not charged
2010-11 (February 2016)
13.45 15 1232 to 1255
6.91 0.00 6.91 18
DC Sec. 29 CT Kanpur
1
2013-14 (September 2016)
4.14 15 1130 1.92 0.00 1.92
19 DC Sec. 5 CT Lucknow
1 2012-13 (June 2016)
2.17 15 1406 1.25 0.00 1.25
20 DC Sec. 5 CT Meerut
1 2013-14 (March 2017)
2.31 15 1253 1.19 0.00 1.19
21 DC Sec. 2 CT Shahjahanpur
1 2013-14 (March 2017)
6.36 15 1518 3.97 0.00 3.97
1 2013-14 (March 2017)
2.67 15 1346 1.48 0.00 1.48 22
DC Sec. 3 CT Shahjahanpur 1 2013-14
(November 2016) 2.27 15 1507 1.41 0.00 1.41
23 AC Sec. 2 CT Sultanpur
1 2009-10 (December 2016)
1.00 15 2610 1.07 0.00 1.07
24 JC (CC) I CT Varanasi
1 2013-14 (December 2016)
3.27 15 1218 1.64 0.00 1.64
25 DC Sec. 12 CT Varanasi
1 2012-13 (February 2016)
12.92 15 267 to 1559
3.74 2.61 1.13
Total 28 555.98 260.19 4.02 256.17
Source: Information available on the basis of Audit findings.

Audit Report (Revenue Sector) for the year ended 31 March 2018
96
APPENDIX-X Concealment of turnover
(Reference Para No. 3.7.1) (` in lakh)
Sl. No.
Name of the unit
No. of dealers
Assessment year (month & year of
assessment)
Name of the goods
Concealed turnover
Tax levied on
concealed turnover
Penalty leviable
1 DC Sec. 9 Agra 1 2013-14 (August 2015)
Sweet, namkeen and coldrink etc.
6.50 0.51 1.53
2 DC Sec. 11 Agra 1 2011-12 (March 2015)
Acrylic solid surface sheet,
furniture
6.00 0.81 2.43
3 DC Sec. 12 Agra
1 2013-14 (June-2014)
10.00 0.86 2.58
4 DC Sec. 13 Agra
1 2012-13 (March 2017)
Sweet, namkeen and confectionary
23.00 1.15 3.45
5 DC Sec. 19 Agra
1 2013-14 (August 2015)
Footwear 70.00 8.72 26.16
6 JC (CC) CT Aligarh
1 2013-14 (October 2016)
M S ingot 12.00 0.48 1.44
7 DC Sec. 1 Aligarh
1 2011-12 (April 2015)
Iron and steel 29.00 0.74 2.22
1 2012-13 (February 2015)
General store goods,bidi and
gutka
7.00 0.62 1.86 8
DC Sec. 9 Aligarh
1 2013-14 (June 2015)
Sweets and namkeen
48.00 2.40 7.20
9 DC Sec. 5 Allahabad
1 2013-14 (July 2015)
Electronic goods 4.00 0.56 1.68
1 2013-14 (November 2016)
Rice and rice bran 14.00 0.58 1.74 10
DC Sec. 1 Ambedkarnagar 1 2014-15
(September 2016) Cement, Iron
Steel 18.65 0.92 2.76
11 DC Sec. 1 Amroha
1 2012-13 (February 2015)
Iron steel, PVC pipe
32.50 1.11 3.33
12 AC Sec. Nanpara Bahraich
1 2013-14 (November 2015)
Sugar 40.00 0.80 2.40
13 DC Sec. 4 Barabanki
1 2011-12 (April 2013)
Wheat 8.40 0.34 1.02
1 2011-12 (March 2015)
Cement 2.55 0.40 1.20 14
DC Sec. 1 Bijnore 1 2013-14
(February 2016) Saria and cement 3.70 0.44 1.32
15 DC Sec. Gulawati Bulandshahar
1 2013-14 (June 2014)
Vegetable ghee, refined oil
15.00 0.75 2.25
16 AC Sec. 3 Chandauli
1 2009-10 (October 2016)
Rice and rice bran 31.00 1.25 3.75
1 2013-14 (February 2015)
Menthol, D.M.O. 22.00 1.10 3.30 17
DC Sec. 1 Chandausi 1 2013-14
(October 2016) Cement, Saria, bricks and sand
1.67 0.44 1.32
18 JC(CC) II CT Ghaziabad
1 2013-14 (November 2016)
Craft paper 6.00 0.30 0.90
19 DC Sec. 8 Ghaziabad
1 2013-14 (February 2017)
Sweet, namkeen, cashew and pista.
30.00 2.40 7.20

Appendices
97
(` in lakh) Sl. No.
Name of the unit
No. of dealers
Assessment year (month & year of
assessment)
Name of the goods
Concealed turnover
Tax levied on
concealed turnover
Penalty leviable
20 DC Sec. 11 Ghaziabad
1 2013-14 (June 2015)
Plastic chair 18.00 2.52 7.56
21 DC Sec. 15 Ghaziabad
1 2011-12 (February 2017)
Metal scrap 13.32 0.67 2.01
22 DC Sec. 17 Ghaziabad
1 2011-12 (September 2015)
Iron and steel 26.00 0.65 1.95
23 JC (CC) CT Gorakhpur
1 2014-15 (June 2016)
Gold, silver and diamond
200.00 2.00 6.00
24 DC Sec. 1 Gorakhpur
1 2013-14 (November 2015)
Tea, coffee 20.00 1.18 3.54
25 DC Sec. 3 Gorakhpur
1 2013-14 (March 2016)
Rice and rice bran 15.00 0.61 1.83
26 AC Sec. 7 Gorakhpur
1 2008-09 (June 2016)
Wheat and rice 4.30 0.17 0.51
27 AC Sec. 6 Jaunpur
1 2013-14 (August 2015)
Cement 4.00 0.62 1.86
1 2010-11 (June 2014)
Food grains and oilseeds
10.20 0.41 1.23
1 2011-12 (January 2014)
Plastic bottle 20.00 1.00 3.00
1 2012-13 (May 2015)
Raw tobacco 8.00 0.40 1.20
28
DC Sec. 2 Kannauj
1 2013-14 (May 2015)
Bidi 8.00 1.12 3.36
1 2013-14 (January 2017)
Steel rack 8.20 1.15 3.45 29
DC Sec. 3 Kanpur 1 2014-15
(April 2016) Sweets, namkeen,
cold drink, confectionery
33.00 1.92 5.76
30 DC Sec. 8 Kanpur
1 2011-12 (February 2015)
Turmeric 22.00 1.10 3.30
31 DC Sec. 15 Kanpur
1 2013-14 (November 2015)
Readymade garments
12.00 0.60 1.80
32 DC Sec. 16 Kanpur
1 2011-12 (June 2015)
1.00 0.07 0.21
33 DC Sec. 20 Kanpur
1 2009-10 (February 2014)
Namkeen and sweet
16.39 2.12 6.36
34 DC Sec. 27 Kanpur
1 2012-13 (August 2016)
Paper 26.72 1.34 4.02
35 DC Sec. 28 Kanpur
1 2014-15 (June 2016)
Tyre and tubes 15.00 2.33 6.99
36 AC Sec. 1 Kanshiram Nagar (Kasganj)
1 2013-14 (February 2017)
Pavers, bricks 5.68 0.79 2.37
2013-14 (July 2014)
Sweet, Juice, fast food and cold
drink etc.
3.00 0.20 0.60 37
DC Sec. 2 Kanshiram Nagar (Kasganj)
1
2015-16 (August 2016)
Sweet, Juice, fast food and cold
drink etc.
1.91 0.18 0.54
38 AC Sec. 1 Khatauli
1 2013-14 (February 2015)
Sweets, tea, namkeen, cold
drink and biscuit
8.50 0.52 1.56
39 DC Sec. 3 Lakhimpur Kheri
1 2012-13 (June 2016)
Gutkha, beetelnuts
4.69 1.78 5.34

Audit Report (Revenue Sector) for the year ended 31 March 2018
98
(` in lakh) Sl. No.
Name of the unit
No. of dealers
Assessment year (month & year of
assessment)
Name of the goods
Concealed turnover
Tax levied on
concealed turnover
Penalty leviable
40 DC Sec. 1 Lalitpur
1 2013-14 (September 2016)
Iron steel 15.54 0.63 1.89
41 DC Sec. 2 Lalitpur
1 2011-12 (January 2015)
Building material 555.04 27.60 82.80
42 JC (CC) I CT Lucknow
1 2013-14 (June 2016)
Medicine, food product
30.00 3.12 9.36
1 2013-14 (August 2015)
Sweets, namkeen and cooked food
41.10 3.40 10.20 43
DC Sec. 1 Lucknow 1 2013-14
(August 2016) Cooked food 2.50 0.35 1.05
44 DC Sec. 11 Lucknow
1 2013-14 (October 2016)
Hardware, ply etc. 6.00 0.66 1.98
1 2009-10 (February 2016)
Mix concrete 42.07 5.68 17.04 45
DC Sec. 21 Lucknow 1 2010-11
(March 2014) Electronic 9.36 1.26 3.78
46 DC Sec. 11 Meerut
1 2014-15 (June 2016)
Ceramic tiles 8.67 1.21 3.63
47 JC (CC) CT Moradabad
1 2014-15 (June 2016)
Brass scrap, GP sheet
23.00 1.09 3.27
48 DC Sec. 9 Noida
1 2012-13 (March 2016)
Iron steel, computer
furniture and hardware
50.00 4.15 12.45
1 2013-14 (March 2016)
Plain glass, toughend glass
10.00 1.40 4.20 49
DC Sec. 13 Noida 1 2014-15
(February 2016) Plastic cabinet
(TV parts) 105.14 5.26 15.78
1 2009-10 (March 2017)
Structural steel tubes and empty bags of cement
29.00 3.51 10.53 50
DC Sec. 14 Noida
1 2013-14 (March 2017)
Mitti (mineral), iron scrap,
bardana, other scrap, electrical
goods and sanitary
55.00 3.45 10.35
51 DC Sec. 2 Pratapgarh
1 2007-08 (September 2012)
Bricks 7.26 0.91 2.73
52 DC Sec. 4 Saharanpur
1 2010-11 (March 2015)
Hand pump parts 10.00 0.50 1.50
53 DC Sec. 1 Shahjahanpur
1 2014-15 (November 2016)
Paint, PVC pipe & sariya
8.40 0.64 1.92
54 DC Sec. 3 Shahjahanpur
1 2011-12 (March 2014)
Bricks 26.11 1.31 3.93
1 2010-11 (June 2014)
Iron, saria 40.00 1.60 4.80 55
AC Sec. 2 Sultanpur
1 2014-15 (June 2016)
Iron 11.50 0.46 1.38
56 AC Sec. 12 Varanasi
1 2013-14 (March 2016)
Cement, yarn etc. 12.00 0.59 1.77
Total 69 2043.57 121.91 365.73 Source: Information available on the basis of Audit findings.

Appendices
99
APPENDIX-XI Delayed deposit of admitted tax
(Reference Para No. 3.7.2) (` in lakh)
Sl. No.
Name of the unit
No. of dealers
Assessment year (month and year of
assessment)
Amount of admitted
tax
Period of delay (in
days)
Penalty imposable
Interest leviable
1 DC Sec. 3 Agra 1 2013-14 (December 2016)
5.19 05 to 55 1.04 0.035
2 JC (CC) Aligarh 1 2013-14 (June 2016)
10.00 19 2.00 0.078
3 JC (CC) Allahabad
1 2014-15 (October 2016)
21.76 27 4.35 0.241
4 DC Sec. 12 Allahabad
1 2013-14 (September 2015)
8.28 278 to 887 1.66 2.885
5 DC Sec. 2 Auraiya
1 2013-14 (January 2017)
17.94 283 to 435 3.59 2.670
1 2010-11 (March 2014)
18.00 08 to 113 3.60 0.512
2012-13 (March 2016)
3.96 160 0.79 0.260
6 DC Sec. 2 Azamgarh
1
2013-14 (January 2017)
9.42 15 to 69 1.88 0.100
2010-11 (July 2016)
51.34 08 10.27 0.169 7 DC Sec. 5 Azamgarh
1
2012-13 (July 2016)
69.07 06 to 1158 13.81 11.958
8 DC Sec. 4 Barabanki
1 2012-13 (April 2014)
6.25 07 1.25 0.018
9 DC Sec. 5 Bareilly
1 2012-13 (November 2015)
25.94 06 to 09 5.19 0.074
10 JC (CC) Firozabad
1 2013-14 (March 2017)
45.14 06 to 83 9.03 0.585
1 2012-13 (March 2016)
4.15 19 0.83 0.032 11 DC Sec. 1 Firozabad
1 2013-14 (November 2016)
2.35 123 0.47 0.119
1 2013-14 (March 2017)
16.79 05 to 108 3.36 0.286
1 2013-14 (September 2016)
25.94 09 to 24 5.19 0.143
12 DC Sec. 2 G B Nagar
1 2013-14 (September 2016)
5.72 05 1.14 0.012
1 2013-14 (March 2017)
77.60 11 to 21 15.52 0.464 13 DC Sec. 3 G B Nagar
1 2013-14 (August 2016)
6.12 07 to 09 1.23 0.019
14 JC (CC) II Ghaziabad
1 2013-14 (September 2016)
48.50 28 9.70 0.558
15 DC Sec. 1 Ghaziabad
1 2013-14 (March 2017)
12.36 124 to 277 2.47 1.051
16 DC Sec. 3 Ghaziabad
1 2013-14 (November 2016)
5.43 81 to 207 1.08 0.268
17 DC Sec. 4 Ghaziabad
1 2013-14 (December 2016)
7.94 20 to 29 1.59 0.084
18 DC Sec. 5 Ghaziabad
1 2012-13 (October 2015)
7.42 13 1.48 0.040
2013-14 (March 2017)
21.13 15 to 350 4.23 1.487 19 DC Sec. 11 Ghaziabad
1
2014-15 (March 2017)
8.79 12 to 370 1.76 0.444
20 DC Sec. 12 Ghaziabad
1 2013-14 (August 2016)
50.71 39 to 68 10.14 1.060

Audit Report (Revenue Sector) for the year ended 31 March 2018
100
(` in lakh) Sl. No.
Name of the unit
No. of dealers
Assessment year (month and year of
assessment)
Amount of admitted
tax
Period of delay (in
days)
Penalty imposable
Interest leviable
1 2012-13 (March 2016)
5.32 06 to 38 1.06 0.044
1 2012-13 (January 2016)
2.20 05 to 08 0.44 0.011
21 DC Sec. 16 Ghaziabad
1 2013-14 (September 2016)
7.13 15 to 86 1.43 0.153
1 2013-14 (May 2016)
6.32 06 1.26 0.016 22 DC Sec. 17 Ghaziabad
1 2013-14 (February 2016)
7.44 07 to 44 1.49 0.072
23 DC Sec. 18 Ghaziabad
1 2013-14 (February 2017)
16.62 05 to 07 3.32 0.035
24 AC Sec. 7 Gorakhpur
1 2012-13 (February 2017)
8.72 06 to 11 1.74 0.030
25 AC Sec. 4 Jaunpur
1 2011-12 (April 2015)
5.61 16 to 80 1.12 0.105
1 2013-14 (July 2016)
11.62 07 to 09 2.32 0.037 26 JC (CC) II Kanpur
1 2013-14 (September 2016)
116.60 07 to 08 23.32 0.370
27 DC Sec. 3 Kanpur
1 2013-14 (January 2017)
96.73 05 to 11 19.35 0.358
28 DC Sec. 6 Kanpur
1 2013-14 (August 2016)
7.32 22 to 72 1.46 0.126
29 DC Sec. 17 Kanpur
1 2013-14 (March 2017)
8.24 85 1.65 0.288
30 DC Sec. 20 Kanpur
1 2013-14 (November 2016)
21.02 05 to 12 4.20 0.070
31 DC Sec. 22 Kanpur
1 2013-14 (September 2016)
18.56 05 to 09 3.71 0.049
32 DC Sec. 24 Kanpur
1 2013-14 (October 2016)
9.36 06 to 07 1.87 0.026
1 2009-10 (July 2016)
43.90 10 to 22 8.78 0.254 33 DC Sec. 28 Kanpur
1 2012-13 (August 2016)
32.20 05 to 12 6.44 0.121
34 DC Sec. 29 Kanpur
1 2010-11 (February 2016)
13.45 1232 to 1255
2.69 6.906
35 DC Sec. 1 Khatauli
1 2011-12 (March 2015)
19.00 74 to 110 3.80 0.746
36 JC (CC) II Lucknow
1 2013-14 (February 2017)
10.70 05 to 17 2.14 0.045
37 JC (CC) Oil Sector Lucknow
1 2013-14 (March 2017)
98.85 31 19.77 1.259
38 DC Sec. 8 Lucknow
1 2013-14 (January 2017)
16.50 05 to 07 3.30 0.038
39 DC Sec. 9 Lucknow
1 2013-14 (March 2017)
6.93 05 to 28 1.38 0.027
40 DC Sec. 11 Lucknow
1 2013-14 (November 2016)
6.01 06 to 08 1.20 0.018
1 2013-14 (July 2016)
5.93 06 to 11 1.19 0.021 41 DC Sec. 12 Lucknow
1 2013-14 (September 2016)
5.00 08 1.00 0.014
42 DC Sec. 18 Lucknow
1 2013-14 (December 2016)
9.63 219 1.93 0.867
43 DC Sec. 10 Meerut
1 2013-14 (July 2016)
7.21 05 1.44 0.015

Appendices
101
(` in lakh) Sl. No.
Name of the unit
No. of dealers
Assessment year (month and year of
assessment)
Amount of admitted
tax
Period of delay (in
days)
Penalty imposable
Interest leviable
44 AC Sec. 11 Meerut
1 2011-12 (March 2015)
6.77 15 to 50 1.35 0.132
1 2013-14 (September 2016)
6.50 05 1.30 0.013 45 DC Sec. 12 Meerut
1 2013-14 (November 2016)
48.94 08 to 514 9.79 2.710
46 DC Sec. 7 Noida 1 2013-14 (January 2017)
23.86 09 to 10 4.77 0.092
47 DC Sec. 8 Noida 1 2013-14 (August 2016)
6.11 05 to 119 1.22 0.096
1 2012-13 (March 2016)
8.63 07 to 13 1.73 0.041
1 2012-13 (December 2016)
14.79 09 to 213 2.96 0.262
1 2013-14 (March 2017)
9.48 05 to 172 1.90 0.363
48 DC Sec. 13 Noida
1 2013-14 (September 2016)
6.64 20 to 38 1.33 0.082
1 2012-13 (March 2016)
18.47 08 to 90 3.69 0.302
1 2013-14 (March 2017)
13.67 07 to 105 2.73 0.305
49 DC Sec. 14 Noida
1 2013-14 (August 2017)
5.74 33 1.15 0.078
50 AC Sec. 2 Pratapgarh
1 2013-14 (March 2017)
24.00 06 to 221 4.80 0.899
51 DC Sec. 1 Santkabir Nagar
1 2013-14 (February 2016)
7.03 146 to 328 1.41 0.834
52 DC Sec. 2 Deoband Saharanpur
1 2012-13 (January 2017)
13.76 05 2.75 0.028
53 DC Sec. 1 Shahjahanpur
1 2013-14 (March 2017)
7.34 10 to 14 1.47 0.035
54 DC Sec. 2 Shahjahanpur
1 2012-13 (February 2016)
12.80 14 to 44 2.56 0.150
55 DC Sec. 3 Shahjahanpur
1 2013-14 (November 2016)
7.90 223 to 603 1.58 1.021
56 DC Sec. 1 Sultanpur
1 2014-15 (March 2017)
5.55 05 to 23 1.11 0.048
1 2013-14 (September 2016)
12.37 09 2.47 0.046 57
AC Sec. 2 Sultanpur 1 2013-14
(January 2017) 5.97 12 to 104 1.20 0.043
58 JC (CC) I Varanasi
1 2008-09 (May 2012)
16.94 1365 to 1397
3.39 9.635
1 2013-14 (March 2017)
8.86 10 to 50 1.77 0.127 59 JC (CC) II Varanasi (at Sonebhadra) 1 2013-14
(December 2016) 6.20 08 to 10 1.24 0.024
2012-13 (March 2016)
4.80 07 to 28 0.96 0.016 1
2013-14 (March 2017)
5.56 08 to 10 1.11 0.022
60 DC Sec. 14 Varanasi
1 2011-12 (February 2015)
5.26 50 to 77 1.05 0.129
Total 80 1531.30 306.24 55.306 Source: Information available on the basis of Audit findings.

Audit Report (Revenue Sector) for the year ended 31 March 2018
102
APPENDIX-XII Delay deposit of tax deducted at source
(Reference Para No. 3.7.3) (` in lakh)
Sl. No.
Name of the unit No. of dealers
Assessment year (month and year of assessment)
Amount of tax
Period of delay (in
days)
Penalty imposable
Interest leviable
1 DC Sec. 3 Agra 1 2013-14 (March 2017) 4.30 05 to 136 8.60 0.115 2 DC Sec. 13 Agra 1 2012-13 (April 2017) 37.39 06 to 10 74.78 0.150
1 2013-14 (October 2016) 3.97 08 7.94 0.013 3
DC Sec. 16 Agra 1 2013-14 (November 2016) 57.60 08 to 09 115.20 0.197
4 DC Sec. 19 Agra 1 2011-12 (March 2015) 1.91 08 to 12 3.82 0.007 1 2013-14 (March 2017) 2.59 09 to 39 5.18 0.025 5
DC Sec. 1 Bijnore
1 2013-14 (March 2017) 2.74 16 5.48 0.018 2009-10 (March 2017) 16.46 10 to 138 32.92 0.668 6
DC Sec. 9 Aligarh 1
2008-09 (March 2017) 1.60 12 3.20 0.008 7 DC Sec. 3 Allahabad 1 2012-13 (June 2016) 2.69 16 5.38 0.017 8 DC Sec. 4 Allahabad 1 2010-11 (March 2016) 1.22 20 2.44 0.010 9 DC Sec. 12 Allahabad 1 2013-14 (March 2017) 2.79 09 5.58 0.010
10 DC Sec. 2 Amroha 1 2011-12 (March 2015) 0.59 08 1.18 0.002 11 DC Sec. 1 Auraiya 1 2008-09 (March 2017) 1.27 05 to 11 2.54 0.006 12 DC Sec. 3 Bareilly 1 2013-14 (March 2017) 2.35 13 4.70 0.013 13 AC Sec. 1 Etawah 1 2012-13 (March 2016) 4.00 17 8.00 0.028 14 DC Sec. 4 Ghaziabad 1 2013-14 (March 2017) 197.70 06 to 33 395.40 1.691
1 2013-14 (February 2017) 4.23 24 to 26 8.46 0.045 15
DC Sec. 8 Ghaziabad 1 2011-12 (July 2014) 0.70 11 1.40 0.003
2012-13 (December 2015) 2.22 08 4.44 0.007 1 2013-14 ( March 2017) 19.99 124 39.98 1.019 1 2010-11 (December 2015) 1.98 06 to 91 3.96 0.007
16
DC Sec. 11 Ghaziabad
1 2013-14 (March 2017) 0.43 06 to 22 0.86 0.002 2014-15 (August 2016) 24.41 15 to 319 48.82 0.967 17
DC Sec. 12 Ghaziabad 1
2013-14 (August 2016) 1.19 349 2.38 0.170 1 2011-12 (April 2015) 3.00 26 6.00 0.032 18
DC Sec. 18 Ghaziabad 1 2012-13 (March 2016) 45.87 06 to 28 91.74 0.193
2010-11 (January 2014) 12.51 05 to 67 25.02 0.131 19
AC Sec. 2 Jaunpur 1 2012-13 (March 2016) 3.31 20 to 266 6.62 0.096
2013-14 (February 2017) 22.18 19 44.36 0.173 2011-12 (February 2015) 14.69 06 to 39 29.38 0.064
1 2012-13 (March 2016) 3.57 09 to 41 7.14 0.015
2011-12 (February 2015) 5.86 09 to 10 11.72 0.022 1 2012-13 (March 2016) 0.72 08 1.44 0.002
20
DC Sec. 1 Kannauj
1 2011-12 (May 2016) 1.82 11 3.64 0.008 21 JC (CC) II Kanpur 1 2013-14 (September 2016) 61.37 07 to 09 122.74 0.202 22 DC Sec 16 Kanpur 1 2013-14 (March 2017) 10.39 05 to 260 20.78 0.659
2012-13 (March 2016) 70.38 08 to 101 140.76 1.509 1 2011-12 (January 2014) 4.33 05 to 10 8.66 0.010
23
DC Sec 17 Kanpur
1 2013-14 (December 2016) 76.10 05 to 94 152.20 0.237 24 DC Sec 25 Kanpur 1 2013-14 (March 2017) 6.61 35 to 65 13.22 0.102

Appendices
103
(` in lakh) Sl. No.
Name of the unit No. of dealers
Assessment year (month and year of assessment)
Amount of tax
Period of delay (in
days)
Penalty imposable
Interest leviable
25 AC Sec 1 Kanshiram Nagar (Kasganj)
1 2013-14 (March 2017) 2.31 06 to 232 4.62 0.045
26 DC Sec 1 Khatauli 1 2013-14 (March 2017) 8.91 15 to 223 17.82 0.138 1 2013-14 (February 2017) 39.28 05 to 10 78.56 0.117 27
DC Sec 1 Lalitpur
1 2013-14 (February 2017) 5.53 06 to 29 11.06 0.048 1 2013-14 (March 2017) 11.63 05 to 10 23.26 0.039 28
DC Sec 3 Lucknow
1 2013-14 (March 2017) 18.91 07 to 11 37.82 0.055 29 DC Sec 12 Lucknow 1 2011-12 (February 2015) 2.27 50 4.54 0.047
1 2013-14 (March 2017) 2.45 06 to 19 4.90 0.009 30
DC Sec 20 Lucknow 1 2013-14 (March 2017) 0.91 12 1.82 0.004
31 DC Sec 5 Meerut 1 2013-14 (March 2017) 1.26 06 to 10 2.52 0.005 32 DC Sec 13 Meerut 1 2013-14 (March 2017) 1.52 10 to 29 3.04 0.007
1 2009-10 (April 2013) 1.14 08 to 27 2.28 0.007 1 2009-10 (September 2013) 20.84 11 to 113 41.68 0.512
33
DC Sec 3 Mirzapur
1 2009-10 (September 2013) 2.59 91 5.18 0.097 34 DC Sec 1 Moradabad 1 2013-14 (August 2016) 0.70 16 to 22 1.40 0.005 35 DC Sec 8 Moradabad 1 2012-13 (March 2016) 2.94 08 to 39 5.88 0.021
1 2013-14 (January 2017) 0.92 08 1.84 0.003 36
JC (CC) Muzaffarnagar 1 2013-14 (February 2017) 16.40 07 to 11 32.80 0.062
37 JC (CC) Noida 1 2013-14 (March 2017) 40.81 25 81.62 0.436 1 2013-14 (October 2016) 19.00 35 to 142 38.00 0.816
2012-13 (March 2016) 13.87 11 to 35 27.74 0.173 1 2013-14 (September 2016) 3.37 29 6.74 0.040
38
DC Sec 3 Noida
1 2013-14 (October 2016) 3.50 31 7.00 0.045 1 2012-13 (March 2016) 4.33 07 8.66 0.012 39
DC Sec. 13 Noida
1 2013-14 (December 2016) 1.18 07 2.36 0.003 1 2012-13 (October 2015) 2.12 11 4.24 0.010 40
DC Sec 14 Noida
1 2013-14 (March 2017) 59.12 07 to 154 118.24 1.703 2011-12 (April 2015) 0.91 34 1.82 0.013 41
DC Sec 2 Pilibhit 1
2013-14 (March 2017) 0.59 54 to 85 1.18 0.017 42 DC Sec 5 Saharanpur 1 2013-14 (March 2017) 3.56 08 to 212 7.12 0.120 43 AC Shrawasti 1 2012-13 (March 2016) 0.56 05 to 16 1.12 0.003 44 DC Sec 1 Sultanpur 1 2010-11 (January 2014) 1.03 07 2.06 0.003
2012-13 (June 2016) 20.19 06 40.38 0.050 1 2013-14 (September 2016) 139.57 05 to 07 279.14 0.299 1 2013-14 (September 2016) 125.57 08 to 144 251.14 0.418
45
AC Sec 6 Varanasi
1 2013-14 (December 2016) 10.02 05 to 13 20.04 0.032 46 DC Sec 10 Varanasi 1 2013-14 (March 2017) 8.10 31 to 123 16.20 0.188
1 2012-13 (March 2016) 2.00 06 to 07 4.00 0.005 47
DC Sec 17 Varanasi 1 2012-13 (March 2016) 0.85 11 1.70 0.004
TOTAL 69 1339.79 2679.58 14.264 Source: Information available on the basis of Audit findings.

Audit Report (Revenue Sector) for the year ended 31 March 2018
104
APPENDIX-XIII Non forfeiture of amount wrongly realised by the dealers as tax
(Reference Para No. 3.8) (` in Lakh)
Sl. No
Name of the unit Number of dealers
Assessment year (month and year of assessment)
Excess charged tax
1 JC (CC) Range B CT GB Nagar
1 2013-14 (September 2016)
138.75
2 DC Sec. 2 Kanpur 1 2014-15 (January 2017)
293.55
3 DC Sec. 16 Kanpur 1 2013-14 (November 2016)
0.88
4 DC Sec. 3 Lakhimpur Kheri
1 2013-14 (June 2016)
16.67
1 2013-14 (February 2017)
2.77 5
DC Sec. 1 Lalitpur
1 2011-12 (April 2015)
2.17
6 DC Sec. 1 Noida 1 2013-14 (January 2017)
5.33
7 DC Sec. 2 Pilibhit 1 2013-14 (August 2016)
0.67
8 DC Sec. 3 Sultanpur 1 2013-14 (March 2017)
0.53
Total 9 461.32 Source: Information available on the basis of Audit findings.

Appendices
105
APPENDIX-XIV Penalty not imposed on overloaded goods vehicles under the Carriage by Road Act
(Reference Para No.4.3) (Amount in `)
Sl. No.
Name of unit No of vehicles seized by
RTO/ARTO in respect to over
load
No of seized vehicles file checked by audit party
No of vehicles in which objection
found
Period of penalty imposed
Penalty imposed as per MVT Act
Penalty imposed as per CBR
Act
Amount due as
per CBR Act
1 ARTO Ambedkar Nagar 762 115 24 10/16 to 03/17 433000 0 433000
2 ARTO Amroha 2230 500 22 04/16 to 04/17 461000 0 461000
3 ARTO Auraiya 5108 150 08 09/16 to 11/17 189000 0 189000
4 ARTO Bahraich 1250 500 15 11/16 to 05/17 333000 0 333000
5 ARTO Ballia 1471 155 03 Apr-16 83000 0 83000
6 RTO Banda 2784 105 26 05/16 to 12/17 539000 0 539000
7 ARTO Barabanki 2500 360 07 07/16 to 12/16 332000 0 332000
8 ARTO Bijnore 1108 145 09 12/16 to 04/17 117000 0 117000
9 ARTO Bulandshahar 1240 16 16 12/16 to 08/17 283000 0 283000
10 ARTO Etah 4117 318 15 12/15 to 04/17 382000 0 382000
11 RTO Faizabad 450 157 05 07/16 to 09/16 166000 0 166000
12 ARTO Fathepur 1960 400 26 09/16 to 12/16 713000 0 713000
13 RTO Ghaziabad 20292 543 35 02/16 to 04/16 628000 0 628000
14 ARTO Gonda 1130 500 18 10/16 to 04/17 359000 0 359000
15 RTO Gorakhpur 1250 231 21 Oct-16 197000 0 197000
16 ARTO Hamirpur 4090 500 30 12/16 to 01/17 895000 0 895000
17 ARTO Hapur 5100 100 03 Sept-16 101000 0 101000
18 ARTO Hardoi 1025 165 20 01/17 to 09/17 667000 0 667000
19 ARTO Jalaun 2497 168 18 04/16 to 05/16 701000 0 701000

Audit Report (Revenue Sector) for the year ended 31 March 2018
106
(Amount in `)
Sl. No.
Name of unit No of vehicles seized by
RTO/ARTO in respect to over
load
No of seized vehicles file checked by audit party
No of vehicles in which objection
found
Period of penalty imposed
Penalty imposed as per MVT Act
Penalty imposed as per CBR
Act
Amount due as
per CBR Act
20 ARTO Jaunpur 1273 300 18 03/17 to 04/17 165000 0 165000
21 RTO Jhansi 8671 267 24 10/16 to 01/17 731000 0 731000
22 ARTO Kannauj 404 112 11 02/17 to 03/17 160000 0 160000
23 ARTO Kanpur Dehat 7414 366 09 08/16 to 03/17 251000 0 251000
24 RTO Kanpur Nagar 7414 366 29 10/16 to 04/17 807000 0 807000
25 ARTO Kaushambi 5441 346 12 05/16 to 12/16 283000 0 283000
26 ARTO Kushinagar 3257 292 25 10/16 to 08/17 429000 0 429000
27 ARTO Lakhimpur Kheri 1759 500 21 12/16 to 01/17 425000 0 425000
28 ARTO Lalitpur 964 66 05 02/17 to 06/17 163000 0 163000
29 RTO Lucknow 10037 1500 57 01/16 to 06/17 1339000 0 1339000
30 ARTO M.Nagar 1875 400 22 01/17 to 06/17 517000 0 517000
31 ARTO Mahoba 340 16 16 03/16 to 03/17 356000 0 356000
32 ARTO Mahrajganj 317 12 09 03/17 to 05/17 118000 0 118000
33 ARTO Mainpuri 635 150 07 Jul-17 149000 0 149000
34 ARTO Mathura 1235 340 50 01/16 to 09/17 1386000 0 1386000
35 ARTO Mau 10323 112 10 03/16 to 04/17 177000 0 177000
36 RTO Meerut 1240 18 18 03/17 to 11/17 299000 0 299000
37 RTO Mirzapur 12678 275 26 02/16 to 03/16 900000 0 900000
38 RTO Moradabad 1240 19 05 04/17 to 11/17 143000 0 143000
39 ARTO Pilibhit 1160 26 25 12/16 to 09/17 553000 0 553000
40 ARTO Pratapgarh 1050 400 25 01/17 to 06/17 583000 0 583000

Appendices
107
(Amount in `)
Sl. No.
Name of unit No of vehicles seized by
RTO/ARTO in respect to over
load
No of seized vehicles file checked by audit party
No of vehicles in which objection
found
Period of penalty imposed
Penalty imposed as per MVT Act
Penalty imposed as per CBR
Act
Amount due as
per CBR Act
41 ARTO Raibareilly 10978 439 28 11/16 to 02/17 938000 0 938000
42 ARTO Rampur 1956 500 14 03/17 to 04/17 420000 0 420000
43 ARTO Santkabirnagar 746 186 14 09/16 to 10/17 273000 0 273000
44 ARTO Shamli 2500 325 41 11/16 to 02/17 1103000 0 1103000
45 ARTO Shravasti 385 45 16 02/16 to 04/17 223000 0 223000
46 ARTO Siddharthnagar 1899 164 09 04/17 to 06/17 137000 0 137000
47 ARTO Sonebhadra 1850 300 19 10/16 to 12/16 496000 0 496000
48 ARTO Sant Ravidas Nagar
790 07 01 Dec-16 39000 0 39000
49 ARTO Sultanpur 3506 311 14 10/16 to 05/17 334000 0 334000
50 ARTO Unnao 480 110 12 03/17 to 05/17 114000 0 114000
TOTAL 164181 13398 913 21590000 21590000
Source: Information available on the basis of Audit findings.

Audit Report (Revenue Sector) for the year ended 31 March 2018
108
APPENDIX-XV Residential land valued at agricultural rate
(Reference Para No.4.8) (Amount in `)
Sl. No.
Name of unit (Sub
Registrar- SR)
Name of district
Deed No. & date of execution
Earlier executed
Deed No. & date of
execution for same
gata/ khasra no.
Gata / Khasra
No.
Land sold (In Sq. M)
Value of the property on which stamp duty levied
Rate on which
property was
required to be
valued (In Sq Metre)
Value of the
property on which
stamp duty was
required to be imposed
Total value of the
property rounded to
next thousand on which stamp
duty was required to be imposed
Rate of stamp duty
appli-cable
Leviable Stamp Duty
Due Regis-tration
fees
Leviable stamp duty and regist-ration fee
Stamp duty paid
Registration
fee paid
Levied stamp duty and regis-tration fee
Difference
1 Kiravali 10378/ 20.10.16
4305/ 04. 05.16
459/2 575 863000 6500 3737500 3738000 5 186900 20000 206900 43150 17260 60410 146490
2 Sadar I 4360/ 22.12.16
2396/ 29.06.16
1220 2155 7758000 10000 21550000 21550000 7 1508500 20000 1528500 543100 20000 563100 965400
3878/ 16.05.16
2785/ 23.03.15
720 5934 10700000 6000 35604000 35604000 7 2492280 20000 2512280 1240500 20000 1260500 1251780
1598/ 24.02.16
11489/ 02.12.15
469 1313 1313000 7000 9191000 9191000 7 643370 20000 663370 92000 20000 112000 551370
3 Sadar III
1180/ 10.02.16
12012/ 28.12.15
734 2112 2535000 3000 6336000 6336000 6 & 7 433520 20000 453520 167500 20000 187500 266020
4 Sadar V
Agra
495/ 17.03.17
258/ 08.02.17
477 2520 756000 6500 16380000 16380000 7 1146600 20000 1166600 53000 15120 68120 1098480
5 Gabhana 862/ 08.03.17
3276/ 22.05.15
293/3 4000 1400000 1800 7200000 7200000 7 504000 20000 524000 98100 20000 118100 405900
5973/ 24.06.16
10687/ 18.11.15
139 fe0 4030 7545000 4500 18135000 18135000 7 1269450 20000 1289450 528500 20000 548500 740950
3973/ 07.07.17
1239/ 04.02.16
190 fe0 4651 15258000 4500 20929500 20930000 7 1465100 20000 1485100 1068200 20000 1088200 396900
3694/ 28.06.17
10687/ 18.11.15
139 fe0 1690 2535000 4500 7605000 7605000 6 & 7 522350 20000 542350 168000 20000 188000 354350
6 Sadar I
Aligarh
378/ 02.02.17
10198/ 25.11.16
139 fe0 1210 1815000 4500 5445000 5445000 6 & 7 371150 20000 391150 117500 20000 137500 253650
7 Soranv 6053/ 30.10.17
2515/ 04.05.17
73 2008 928000 5700 11445600 11446000 7 801220 20000 821220 65000 18500 83500 737720
214/ 22.01.15
1922/ 17.06.14
1412 4180 138000 7000 29260000 29260000 5 1463000 10000 1473000 69000 10000 79000 1394000 8 Koranv
Allahabad
1801/ 02.08.17
1177/ 20.05.15
279 2786 120000 10200 28417200 28418000 5 1420900 20000 1440900 60000 20000 80000 1360900

Appendices
109
(Amount in `) Sl. No.
Name of unit (Sub
Registrar- SR)
Name of district
Deed No. & date of execution
Earlier executed
Deed No. & date of
execution for same
gata/ khasra no.
Gata / Khasra
No.
Land sold (In Sq. M)
Value of the property on which stamp duty levied
Rate on which
property was
required to be
valued (In Sq Metre)
Value of the
property on which
stamp duty was
required to be imposed
Total value of the
property rounded to
next thousand on which stamp
duty was required to be imposed
Rate of stamp duty
appli-cable
Leviable Stamp Duty
Due Regis-tration
fees
Leviable stamp duty and regist-ration fee
Stamp duty paid
Registration
fee paid
Levied stamp duty and regis-tration fee
Difference
740/ 31.03.17
739/ 31.03.17
370mi 4517 1248000 5500 24843500 24844000 5 1242200 20000 1262200 62500 20000 82500 1179700
2419/ 01.11.17
1922/ 17.06.14
1412 2070 768000 8800 18216000 18216000 5 910800 20000 930800 38500 15360 53860 876940
811/ 11.07.17
1762/ 21.11.15
4mi 2530 1468000 3200 8096000 8096000 4 & 5 394800 20000 414800 63500 20000 83500 331300 9 Bhiti
1671/ 07.11.16
1644/ 02.11.16
61/2mi 2430 3111000 5100 12393000 12393000 5 619650 20000 639650 155550 20000 175550 464100
2308/ 18.06.16
1256/ 21.03.16
371 1180 1228000 4600 5428000 5428000 5 271400 20000 291400 61410 20000 81410 209990 10 Alapur
2149/ 08.06.16
1532/ 18.04.16
37 mi 950 7960000 2400 2280000 2280000 4 & 5 104000 20000 124000 31850 15920 47770 76230
3818/ 29.07.16
3768/ 28.07.16
1876 630 429000 5500 3465000 3465000 4 & 5 163250 20000 183250 25750 8580 34330 148920 11 Akberpur
Ambedkar nagar
402/ 25.01.16
349/ 22.01.16
1865 656 1516000 8000 5248000 5248000 6 & 7 357360 20000 377360 96120 20000 116120 261240
12 Musaphir khana
5229/ 19.09.16
2982/ 19.05.16
159 670 740000 5000 3350000 3350000 4 & 5 157500 20000 177500 30000 14800 44800 132700
510/ 23.02.17
3683/ 10.09.15
296 Mi 890 663000 5500 4895000 4895000 5 244750 20000 264750 33200 13260 46460 218290
940/ 04.03.16
3516/ 05.09.14
776 Mi 760 1940000 14000 10640000 10640000 4 & 5 493200 20000 513200 87700 20000 107700 405500
4236/ 11.11.14
740/ 25.02.14
8259 935 1636000 9000 8415000 8415000 5 420750 10000 430750 81800 10000 91800 338950
13 Tilohi
Amethi
1940/ 18.05.16
4471/ 20.11.14
208 1015 551000 4500 4567500 4568000 4 & 5 218400 20000 238400 22050 11020 33070 205330
3053/ 29.04.17
130/ 04.01.16
2064 1370 1268000 5000 6850000 6850000 7 479500 20000 499500 88900 20000 108900 390600
4295/ 12.06.17
14690/ 03.11.16
176 791 401000 3700 2926700 2927000 5 146350 20000 166350 22100 8020 30120 136230
14 Dhanuara Amroha
6250/ 24.08.17
3930/ 31.05.17
293 1350 1215000 2900 3915000 3915000 4 & 5 185750 20000 205750 50750 20000 70750 135000

Audit Report (Revenue Sector) for the year ended 31 March 2018
110
(Amount in `) Sl. No.
Name of unit (Sub
Registrar- SR)
Name of district
Deed No. & date of execution
Earlier executed
Deed No. & date of
execution for same
gata/ khasra no.
Gata / Khasra
No.
Land sold (In Sq. M)
Value of the property on which stamp duty levied
Rate on which
property was
required to be
valued (In Sq Metre)
Value of the
property on which
stamp duty was
required to be imposed
Total value of the
property rounded to
next thousand on which stamp
duty was required to be imposed
Rate of stamp duty
appli-cable
Leviable Stamp Duty
Due Regis-tration
fees
Leviable stamp duty and regist-ration fee
Stamp duty paid
Registration
fee paid
Levied stamp duty and regis-tration fee
Difference
15 Hasanpur 1132/ 25.01.18
43/ 02.01.18
426mi 1270 883000 4200 5334000 5334000 7 373380 20000 393380 62000 17660 79660 313720
16 Phoolpur Azamgarh 3437/ 01.08.16
741/ 17.02.16
169 1255.5 750000 7938 9966159 9967000 5 498350 20000 518350 37500 15000 52500 465850
17 Bansdeeh Ballia 1888/ 12.08.16
1335/ 15.06.16
197 1850 555000 2700 4995000 4995000 4 & 5 239750 20000 259750 22200 11100 33300 226450
18 Utraula 3346/ 13.6.16
1536/ 22.03.16
1731mi 4300 1120000 3500 15050000 15050000 5 752500 20000 772500 56020 20000 76020 696480
1306/ 10.03.17
5268/ 22.05.15
579mi 610 223000 7000 4270000 4270000 5 213500 20000 233500 11150 4460 15610 217890
6255/ 01.08.16
5268/ 22.05.15
579mi 810 2822000 7000 5670000 5670000 5 283500 20000 303500 141000 20000 161000 142500
19 Tulsipur
76/ 09.01.17
5268/ 22.05.15
579mi 400 146000 7000 2800000 2800000 4 & 5 130000 20000 150000 5850 2920 8770 141230
7279/ 03.11.16
5977/ 02.09.16
937 6600 8136000 12000 79200000 79200000 5 3960000 20000 3980000 407000 20000 427000 3553000
2507/ 27.04.16
6332/ 18.09.15
47 850 340000 9500 8075000 8075000 5 403750 20000 423750 17000 6800 23800 399950
20 Sadar
Balrampur
7633/ 28.11.15
5962/ 04.09.14
171 460 138000 3900 1794000 1794000 5 89700 10000 99700 6900 1380 8280 91420
3683/ 20.09.16
3536/ 06.09.16
1363k 1020 1789000 7800 7956000 7956000 4 & 5 387800 20000 407800 79500 20000 99500 308300 21 Sirauli Gauspur
4920/ 22.12.15
4298/ 26.10.15
682 1260 2624000 5000 6300000 6300000 4 & 5 305000 20000 325000 121500 20000 141500 183500
966/ 23.02.16
1182/ 27.02.15
945 Mi 2010 4115000 15000 30150000 30150000 4 & 5 1497500 20000 1517500 196000 20000 216000 1301500 22 Ramsanehi ghat
2917/ 01.06.15
1182/ 27.02.15
945 Mi 2010 4115000 11000 22110000 22110000 4 & 5 1095500 20000 1115500 196000 20000 216000 899500
23 Sadar
Barabanki
7603/ 24.04.15
4477/ 10.3.15
408 553 830000 5000 2765000 2765000 7 193550 10000 203550 58200 10000 68200 135350
24 Faridpur Bareilly 5126/ 02.08.17
4770/ 09.08.17
9591/ 24.10.16
600mi/2 2525 910000 1150 2903750 2903800 5 145190 40000 185190 44500 18200 62700 122490

Appendices
111
(Amount in `) Sl. No.
Name of unit (Sub
Registrar- SR)
Name of district
Deed No. & date of execution
Earlier executed
Deed No. & date of
execution for same
gata/ khasra no.
Gata / Khasra
No.
Land sold (In Sq. M)
Value of the property on which stamp duty levied
Rate on which
property was
required to be
valued (In Sq Metre)
Value of the
property on which
stamp duty was
required to be imposed
Total value of the
property rounded to
next thousand on which stamp
duty was required to be imposed
Rate of stamp duty
appli-cable
Leviable Stamp Duty
Due Regis-tration
fees
Leviable stamp duty and regist-ration fee
Stamp duty paid
Registration
fee paid
Levied stamp duty and regis-tration fee
Difference
25 Rudhauli Basti 256/ 15.02.17
115/ 28.01.16
7mi 1770 1647000 4300 7611000 7611000 4 & 5 370550 20000 390550 72350 20000 92350 298200
26 Sadar 389/ 25.02.17
1026/ 26.04.16
7mi 570 779000 4000 2280000 2280000 7 159600 20000 179600 54550 15580 70130 109470
1677/ 27.06.16
1253/ 17.05.16
04 2450 4900000 4000 9800000 9800000 4 & 5 480000 20000 500000 235000 20000 255000 245000
1505/ 09.06.16
963/ 20.04.16
301 1430 1430000 4000 5720000 5720000 5 286000 20000 306000 71500 20000 91500 214500
27 Gyanpur
Bhadohi
2805/ 04.11.16
1918/ 08.06.15
188 1260 1260000 4000 5040000 5040000 4 & 5 242000 20000 262000 53000 20000 73000 189000
683/ 27.01.17
15294/ 06.10.16 &
15296/ 06.10.16
57 1260 1764000 4800 6048000 6048000 4 & 5 292400 20000 312400 88200 20000 108200 204200 28 Chandpur Bijnore
11799/ 31.10.17
5721/ 05.06.16 &
5722/ 05.06.16
548 500 270000 3000 1500000 1500000 5 75000 20000 95000 13500 5400 18900 76100
4576/ 26.07.17
1684/ 27.03.17
316 1265 967000 3300 4174500 4175000 4 & 5 198750 20000 218750 38700 19340 58040 160710 29 Sikandrabad
7578/ 25.11.17
7362/ 12.9.16 &
7131/ 15.09.16
847 1049 3986200 12500 13112500 13113000 7 917910 20000 937910 279200 20000 299200 638710
4461/ 30.08.16
3579/ 07.07.17
478 1914 2584000 5000 9570000 9570000 6 & 7 659900 20000 679900 181000 20000 201000 478900
1701/ 31.03.17
1201/ 08.10.16
485 632 2276000 14000 8848000 8848000 7 619360 20000 639360 159500 20000 179500 459860
30 Sadar II
Buland Shahar
2883/ 03.06.17
2496/ 17.05.17
692 3373 3036000 2500 8432500 8433000 6 & 7 580310 20000 600310 202600 20000 222600 377710
31 Chakiya Chandauli 4154/ 23.11.15
356/ 29.01.15
450 885 390000 4500 3982500 3983000 7 278810 20000 298810 27300 7800 35100 263710

Audit Report (Revenue Sector) for the year ended 31 March 2018
112
(Amount in `) Sl. No.
Name of unit (Sub
Registrar- SR)
Name of district
Deed No. & date of execution
Earlier executed
Deed No. & date of
execution for same
gata/ khasra no.
Gata / Khasra
No.
Land sold (In Sq. M)
Value of the property on which stamp duty levied
Rate on which
property was
required to be
valued (In Sq Metre)
Value of the
property on which
stamp duty was
required to be imposed
Total value of the
property rounded to
next thousand on which stamp
duty was required to be imposed
Rate of stamp duty
appli-cable
Leviable Stamp Duty
Due Regis-tration
fees
Leviable stamp duty and regist-ration fee
Stamp duty paid
Registration
fee paid
Levied stamp duty and regis-tration fee
Difference
1127/ 24.03.17
985/ 16.03.17
160 1760 852000 3200 5632000 5632000 4 & 5 271600 20000 291600 34100 17040 51140 240460
5524/ 20.12.16
4511/ 06.10.16
180 1760 968000 3700 6512000 6512000 7 455840 20000 475840 68000 19500 87500 388340
32 Sakaldiha
4868/ 05.11.16
4785/ 29.10.16
312 945 333040 3000 2835000 2835000 4 & 5 131750 20000 151750 13320 6660 19980 131770
33 Rudrapur 1770/ 05.08.17
168/ 06.02.17
253 1820 2630000 6237 11351340 11351400 4 & 5 507570 20000 527570 121500 20000 141500 386070
933/ 10.03.16
460/ 09.02.16
699 1030 153500 8600 8858000 8858000 6 & 7 610060 20000 630060 153500 20000 173500 456560 34 Salempur
Deoria
3773/ 25.10.16
3759/ 24.10.16
60 1020 1020000 5760 5875200 5875200 5 293760 20000 313760 51000 20000 71000 242760
35 Bharthana Etawah 3916/ 05.08.17
3266/ 18.05.16
97 1000 840000 7000 7000000 7000000 6 & 7 480000 20000 500000 50450 16800 67250 432750
36 Sadar 10638/ 10.11.17
10412/ 08.11.17
321 1620 250000 1100 1782000 1782000 7 124740 20000 144740 17500 5000 22500 122240
37 Amritpur
Farrukhabad
2839/ 26.08.16
201/ 14.01.16
43 810 235000 4000 3240000 3240000 4 & 5 152000 20000 172000 9400 4700 14100 157900
5218/ 26.10.17
2343/ 23.05.17
111 1620 778000 5300 8586000 8586000 5 429300 20000 449300 38900 15560 54460 394840
7294/ 28.10.16
7025/ 20.10.16
2264 1210 600000 4800 5808000 5808000 4 & 5 280400 20000 300400 24000 12000 36000 264400
38 Khaga Fatehpur
1165/ 21.03.17
608/ 14.02.17
147 1168 211000 2750 3212000 3212000 5 160600 20000 180600 10550 4220 14770 165830
2118/ 21.04.17
249/ 01.08.16
337 1150 1495000 5000 5750000 5750000 7 402500 20000 422500 105000 20000 125000 297500
8256/ 30.12.17
8077/ 26.12.17
131 632 1506000 5900 3728800 3729000 7 261030 20000 281030 105450 20000 125450 155580
39 Sadar I
5339/ 30.06.16
5042/ 09.06.16
27 2043 1635000 3500 7150500 7151000 7 500570 20000 520570 114500 20000 134500 386070
278/ 08.02.17
2003/ 05.05.16
413 1323.3 1390000 3000 3969900 3969900 7 277893 20000 297893 97500 20000 117500 180393 40 Sadar II
Firozabad
3677/ 11.08.16
3315/ 26.07.16
13 2060 2164000 2500 5150000 5150000 7 360500 20000 380500 151500 20000 171500 209000

Appendices
113
(Amount in `) Sl. No.
Name of unit (Sub
Registrar- SR)
Name of district
Deed No. & date of execution
Earlier executed
Deed No. & date of
execution for same
gata/ khasra no.
Gata / Khasra
No.
Land sold (In Sq. M)
Value of the property on which stamp duty levied
Rate on which
property was
required to be
valued (In Sq Metre)
Value of the
property on which
stamp duty was
required to be imposed
Total value of the
property rounded to
next thousand on which stamp
duty was required to be imposed
Rate of stamp duty
appli-cable
Leviable Stamp Duty
Due Regis-tration
fees
Leviable stamp duty and regist-ration fee
Stamp duty paid
Registration
fee paid
Levied stamp duty and regis-tration fee
Difference
3157/ 21.07.16
4699/ 17.11.16
139& 142
2080 1997000 2500 5200000 5200000 7 364000 20000 384000 140000 20000 160000 224000 41 Sadar II
2977/ 29.06.16
4699/ 17.11.16
139& 142
2010 1930000 2500 5025000 5025000 7 351750 20000 371750 135100 20000 155100 216650
3160/ 19.07.17
5099/ 27.08.16
33Mi 3460 3287000 4500 15570000 15570000 7 1089900 20000 1109900 230100 20000 250100 859800
3710/ 24.08.17
4084/ 06.07.16
33/1 1750 700000 2200 3850000 3850000 7 269500 20000 289500 49000 14000 63000 226500
5184/ 05.12.17
5100/ 27.08.16
33Mi 4610 5071000 5000 23050000 23050000 7 1613500 20000 1633500 350000 20000 370000 1263500
4212/ 25.09.17
3812/ 30.08.17
124/1 2118 2755000 8000 16944000 16944000 7 1186080 20000 1206080 193500 20000 213500 992580
4800/ 21.11.17
5954/ 14.10.16
144 2191 2411000 5000 10955000 10955000 6 & 7 756850 20000 776850 159000 20000 179000 597850
3388/ 31.07.17
5099/ 27.08.16
33mi 4610 4380000 4500 20745000 20745000 7 1452150 20000 1472150 307000 20000 327000 1145150
42 Tundala
2163/ 30.05.17
1493/ 21.04.17
134 1580 870000 3800 6004000 6004000 5 300200 20000 320200 43500 17400 60900 259300
6202/ 30.07.16
2336/ 19.03.16
200 1410 536000 5300 7473000 7473000 5 373650 20000 393650 11700 5880 17580 376070
802/ 28.02.17
3864/ 20.05.16
2606 570 240000 10000 5700000 5700000 4 & 5 275000 20000 295000 11700 5820 17520 277480
43 Jasarana
1971/ 01.05.17
1605/ 13.04.17
134 810 454000 5000 4050000 4050000 5 202500 20000 222500 22700 9080 31780 190720
11064/ 11.07.16
943/ 23.02.15
548m,551,
552,553
5058 13355000 13000 65754000 65754000 5 3287700 20000 3307700 668000 20000 688000 2619700 44 Sadar I
10293/ 21.06.16
943/ 23.02.15
548m,551,
552,553
5058 13355000 13000 65754000 65754000 5 3287700 20000 3307700 668000 20000 688000 2619700
18190/ 05.07.16
4129/ 04.03.16
638 843 1124000 6500 5479500 5480000 5 274000 20000 294000 56250 20000 76250 217750 45 Greter Noida
G B Nagar
20765/ 29.07.16
748/ 12.01.15
40 794 1009000 5600 4446400 4447000 4 & 5 212350 20000 232350 40500 20000 60500 171850

Audit Report (Revenue Sector) for the year ended 31 March 2018
114
(Amount in `) Sl. No.
Name of unit (Sub
Registrar- SR)
Name of district
Deed No. & date of execution
Earlier executed
Deed No. & date of
execution for same
gata/ khasra no.
Gata / Khasra
No.
Land sold (In Sq. M)
Value of the property on which stamp duty levied
Rate on which
property was
required to be
valued (In Sq Metre)
Value of the
property on which
stamp duty was
required to be imposed
Total value of the
property rounded to
next thousand on which stamp
duty was required to be imposed
Rate of stamp duty
appli-cable
Leviable Stamp Duty
Due Regis-tration
fees
Leviable stamp duty and regist-ration fee
Stamp duty paid
Registration
fee paid
Levied stamp duty and regis-tration fee
Difference
15258/ 07.06.16
5185/ 16.03.16
40,44,& 56
843 675000 4500 3793500 3794000 5 189700 20000 209700 33800 13500 47300 162400
6753/ 22.04.16
2081/ 05.02.16
283 Mi 1854 3709000 6000 11124000 11124000 5 556200 20000 576200 185500 20000 205500 370700
5829/ 06.04.16
2174/ 08.02.16
581 665 1330000 8000 5320000 5320000 5 266000 20000 286000 66500 20000 86500 199500
46 Dadri,Noida
15110/ 20.09.16
6146/ 12.04.16
372 836 1672000 6000 5016000 5016000 5 250800 20000 270800 83600 20000 103600 167200
47 Sadar II 4522/ 28.04.16
3790/ 07.04.16
43mi 1260 4410000 8000 10080000 10080000 7 705600 20000 725600 308700 20000 328700 396900
1627/ 03.03.16
2387/ 31.03.15
1154Ka 717 1341000 5000 3585000 3585000 7 250950 20000 270950 94000 20000 114000 156950
9258/ 08.12.15
6327/ 17.08.15
881 920.66 760000 4000 3682640 3683000 6 & 7 247810 20000 267810 45600 15200 60800 207010
48 Sadar III
9667/ 28.12.15
6705/ 28.08.15
968 505 723000 5000 2525000 2525000 7 176750 20000 196750 50700 14460 65160 131590
49 Sadar IV 3844/ 02.03.16
3813/ 02.03.16
1563 9349 34461000 9000 84141000 84141000 7 5889870 20000 5909870 2412300 20000 2432300 3477570
4310/ 29.07.16
3863/ 18.07.16
520 1265 2505000 7000 8855000 8855000 7 619850 20000 639850 175500 20000 195500 444350
4309/ 29.07.16
3863/ 18.07.16
520 1265 2505000 7000 8855000 8855000 7 619850 20000 639850 175500 20000 195500 444350
2948/ 10.06.16
2846/ 07.06.16
513 1020 2020000 7000 7140000 7140000 7 499800 20000 519800 141500 20000 161500 358300
50 Sadar V
Ghaziabad
4311/ 29.07.16
2380/ 13.05.16
354 1256 2487000 7000 8792000 8792000 7 615440 20000 635440 174200 20000 194200 441240
780/ 31.01.17
5111/ 27.09.16
1660 3140 3140000 6500 20410000 20410000 4 & 5 1010500 20000 1030500 147000 20000 167000 863500
1858/ 20.03.17
361/ 27.01.16
64 1200 3240000 7500 9000000 9000000 5 450000 20000 470000 162000 20000 182000 288000
1860/ 20.04.16
741/ 11.02.16
36/1, 36/2
720 2520000 9000 6480000 6480000 6 & 7 443600 20000 463600 166500 20000 186500 277100
51 Sadar Ghazipur
2094/ 01.04.17
2046/ 31.03.17
66 760 1368000 6500 4940000 4940000 5 247000 20000 267000 68500 20000 88500 178500

Appendices
115
(Amount in `) Sl. No.
Name of unit (Sub
Registrar- SR)
Name of district
Deed No. & date of execution
Earlier executed
Deed No. & date of
execution for same
gata/ khasra no.
Gata / Khasra
No.
Land sold (In Sq. M)
Value of the property on which stamp duty levied
Rate on which
property was
required to be
valued (In Sq Metre)
Value of the
property on which
stamp duty was
required to be imposed
Total value of the
property rounded to
next thousand on which stamp
duty was required to be imposed
Rate of stamp duty
appli-cable
Leviable Stamp Duty
Due Regis-tration
fees
Leviable stamp duty and regist-ration fee
Stamp duty paid
Registration
fee paid
Levied stamp duty and regis-tration fee
Difference
2694/ 15.05.17
2620/ 06.05.17
111 1101 6590000 8500 9358500 9358500 5 467925 20000 487925 329500 20000 349500 138425
4686/ 09.09.16
4158/ 12.08.16
118 845 676000 3200 2704000 2704000 5 135200 20000 155200 33800 13520 47320 107880
1610/ 06.06.16
1194/ 30.04.16
4&7 1684 2966000 5000 8420000 8420000 4 & 5 411000 20000 431000 138600 20000 158600 272400 52 Jakhania
1255/ 06.05.16
915/ 04.04.16
204 760 1368000 5000 3800000 3800000 4 & 5 180000 20000 200000 58500 20000 78500 121500
2634/ 26.07.16
1963/ 06.06.16
1054 845 1053000 6200 5239000 5239000 4 & 5 251950 20000 271950 43000 20000 63000 208950 53 Saidpur
1819/ 23.05.16
1716/ 12.05.16
120 760 534000 4800 3648000 3648000 4 & 5 172400 20000 192400 21370 10680 32050 160350
288/ 13.01.16
15125/ 23.11.15
2086 S 1050 441000 5000 5250000 5250000 5 262500 20000 282500 22050 8820 30870 251630
2123/ 26.04.16
1113/ 25.02.16
2088 S 1010 505000 5000 5050000 5050000 4 & 5 242500 20000 262500 20200 10100 30300 232200
54 Coronelganj Gonda
6160/ 15.06.15
6172/ 15.06.15
2085 S 1210 460000 4200 5082000 5082000 5 254100 10000 264100 23000 9200 32200 231900
482/ 06.02.17
478/ 06.02.17
386 2100 1155000 4000 8400000 8400000 5 420000 20000 440000 57750 20000 77750 362250 55 Bansgaon
1142/ 03.05.16
3550/ 01.12.15
575 1050 788000 5000 5250000 5250000 5 262500 20000 282500 39400 15760 55160 227340
56 Gola Bazar 4140/ 16.12.17
3827/ 17.11.17
171 850 697000 3800 3230000 3230000 4 & 5 151500 20000 171500 27880 13940 41820 129680
2627/ 05.08.17
2042/ 27.06.17
327 1700 2550000 6000 10200000 10200000 4 & 5 500000 20000 520000 117520 20000 137520 382480 57 Chauri Chaura
610/ 25.02.17
807/ 23.02.16
515 mi 810 1037000 4400 3564000 3564000 4 & 5 168200 20000 188200 41850 20000 61850 126350
58 Sahjanwa 2587/ 20.07.17
2246/ 20.06.17
331mi 2060 1763000 4100 8446000 8446000 5 422300 20000 442300 88150 20000 108150 334150
5715/ 10.08.17
4315/ 30.06.17
345 850 1955000 9000 7650000 7650000 5 382500 20000 402500 97800 20000 117800 284700 59 Sadar I
Gorakhpur
7233/ 20.08.16
6219/6220/ 23.07.16
51 1130 2860000 7150 8079500 8080000 4 & 5 394000 20000 414000 143000 20000 163000 251000

Audit Report (Revenue Sector) for the year ended 31 March 2018
116
(Amount in `) Sl. No.
Name of unit (Sub
Registrar- SR)
Name of district
Deed No. & date of execution
Earlier executed
Deed No. & date of
execution for same
gata/ khasra no.
Gata / Khasra
No.
Land sold (In Sq. M)
Value of the property on which stamp duty levied
Rate on which
property was
required to be
valued (In Sq Metre)
Value of the
property on which
stamp duty was
required to be imposed
Total value of the
property rounded to
next thousand on which stamp
duty was required to be imposed
Rate of stamp duty
appli-cable
Leviable Stamp Duty
Due Regis-tration
fees
Leviable stamp duty and regist-ration fee
Stamp duty paid
Registration
fee paid
Levied stamp duty and regis-tration fee
Difference
7021/ 12.08.16
5674/ 06.07.16
27 1010 1485000 6000 6060000 6060000 5 303000 20000 323000 80000 20000 100000 223000
1236/ 10.03.17
687/ 10.02.17
1153 650 1365000 7000 4550000 4550000 4 & 5 217500 20000 237500 59000 20000 79000 158500
3356/ 31.05.17
3705/ 10.05.16
209 800 2120000 5500 4400000 4400000 4 & 5 210000 20000 230000 96000 20000 116000 114000
60 Sadar II 6247/ 19.07.17
2553/ 15.04.17
50 2050 2614000 6500 13325000 13325000 5 666250 20000 686250 130720 20000 150720 535530
61 Klhajani 2402/ 29.06.15
2404/ 29.06.15
168 1420 838000 2100 2982000 2982000 4 & 5 139100 10000 149100 33520 10000 43520 105580
439/ 11.01.18
6672/ 18.11.17
966 1815.35 3295000 11000 19968850 19969000 6 & 7 1387830 20000 1407830 225000 20000 245000 1162830
1705/ 15.02.18
6223/ 07.01.17
725 606 376000 5200 3151200 3152000 7 220640 20000 240640 26320 7520 33840 206800
62 Garh Mukteshwer
4326/ 23.05.16
291/ 12.01.16
73 465 586000 6100 2836500 2837000 7 198590 20000 218590 41100 11720 52820 165770
5795/ 25.09.17
4569/ 31.08.17
203 1050 1890000 5000 5250000 5250000 7 367500 20000 387500 132500 20000 152500 235000
2094/ 21.04.17
282/ 21.01.17
603 850 1318000 5300 4505000 4505000 7 315350 20000 335350 92300 20000 112300 223050
63 Dhaulana
Hapur
5692/ 21.09.17
4569/ 31.08.17
203 1050 1890000 5000 5250000 5250000 7 367500 20000 387500 132500 20000 152500 235000
2269/ 07.05.15
2238/ 05.05.15
1225 3672 808000 3500 12852000 12852000 5 642600 10000 652600 40500 10000 50500 602100 64 Konch
2295/ 19.07.17
1013/ 25.04.17
1254 2050 1782000 4900 10045000 10045000 5 502250 20000 522250 89200 20000 109200 413050
65 Orai
Jalaun
5859/ 23.06.16
5001/ 01.08.15
349 4050 1904000 15500 62775000 62775000 7 4394250 20000 4414250 133500 20000 153500 4260750
66 Badlapur 2238/ 28.01.16
3579/ 20.10.15
253/2 2020 5454000 13000 26260000 26260000 5 1313000 20000 1333000 273000 20000 293000 1040000
2810/ 06.07.16
2760/ 05.07.16
1510 1820 1748000 3400 6188000 6188000 5 309400 20000 329400 87350 20000 107350 222050 67 Kerakat
Jaunpur
3748/ 02.09.16
3213/ 08.08.16
434mi 720 893000 4500 3240000 3240000 5 162000 20000 182000 44650 17860 62510 119490

Appendices
117
(Amount in `) Sl. No.
Name of unit (Sub
Registrar- SR)
Name of district
Deed No. & date of execution
Earlier executed
Deed No. & date of
execution for same
gata/ khasra no.
Gata / Khasra
No.
Land sold (In Sq. M)
Value of the property on which stamp duty levied
Rate on which
property was
required to be
valued (In Sq Metre)
Value of the
property on which
stamp duty was
required to be imposed
Total value of the
property rounded to
next thousand on which stamp
duty was required to be imposed
Rate of stamp duty
appli-cable
Leviable Stamp Duty
Due Regis-tration
fees
Leviable stamp duty and regist-ration fee
Stamp duty paid
Registration
fee paid
Levied stamp duty and regis-tration fee
Difference
68 Sadar II Jhansi 6865/ 14.11.17
4911/ 24.08.17
1908 1175 1058000 4500 5287500 5288000 7 370160 20000 390160 74100 20000 94100 296060
7455/ 03.09.16
4682/ 31.05.16
1128 mi 4100 1763000 3000 12300000 12300000 5 615000 20000 635000 88150 20000 108150 526850
2700/ 29.05.17
2705/ 29.05.17
1149mi 4100 1763000 3000 12300000 12300000 5 615000 20000 635000 88200 20000 108200 526800
5512/ 27.06.16
5102/ 13.06.16
16 910 565000 6500 5915000 5915000 7 414050 20000 434050 39700 11300 51000 383050
9194/ 08.12.15
9160/ 07.12.15
132 2460 666000 3000 7380000 7380000 5 369000 20000 389000 33300 13320 46620 342380
3839/ 30.04.16
9701/ 30.12.15
1128mi 2050 820000 2500 5125000 5125000 5 256250 20000 276250 41000 16400 57400 218850
69 Akbarpur Kanpur Dehat
3482/ 30.06.17
1508/ 27.03.17
1197 820 1000000 4000 3280000 3280000 4 & 5 154000 20000 174000 40000 20000 60000 114000
70 Sadar II 2113/ 18.05.17
1672/ 27.04.17
1133 1170 2399000 10500 12285000 12285000 7 859950 20000 879950 168000 20000 188000 691950
71 Sadar II 6552/ 22.10.16
6551/ 22.10.16
508mi 1451 5057500 10500 15235500 15236000 6 & 7 1056520 20000 1076520 344300 20000 364300 712220
72 Sadar III
Kanpur Nagar
16483/ 24.10.16
16177/ 19.10.16
239k 2050 533000 1500 3075000 3075000 6 & 7 205250 20000 225250 32000 10660 42660 182590
1387/ 08.05.17
291/ 02.02.17
283 1888 1800000 11000 20768000 20768000 5 1038400 20000 1058400 90000 20000 110000 948400
1629/ 12.05.15
2595/ 24.12.12
374 fe0 2280 1425000 5400 12312000 12312000 5 615600 10000 625600 71250 10000 81250 544350
4047/ 05.10.16
3560/ 28.08.15
93 fe0 1580 1440000 6800 11236000 11236000 5 561800 20000 581800 72000 20000 92000 489800
73 Chayal
4091/ 06.10.16
1390/ 14.06.13
1006 1481 464000 6400 9478400 9479000 5 473950 20000 493950 23200 9280 32480 461470
3756/ 02.08.16
587/ 01.08.16
971 2280 412000 8000 18240000 18240000 5 912000 20000 932000 20600 8240 28840 903160
651/ 03.02.16
559/ 16.02.15
1326 830 501000 9000 7470000 7470000 4 & 5 363500 20000 383500 23330 10020 33350 350150
74 Sirathu
Kaushambi
2111/ 17.10.17
2579/ 11.11.11
199 1590 360000 3500 5565000 5565000 5 278250 20000 298250 18000 7200 25200 273050

Audit Report (Revenue Sector) for the year ended 31 March 2018
118
(Amount in `) Sl. No.
Name of unit (Sub
Registrar- SR)
Name of district
Deed No. & date of execution
Earlier executed
Deed No. & date of
execution for same
gata/ khasra no.
Gata / Khasra
No.
Land sold (In Sq. M)
Value of the property on which stamp duty levied
Rate on which
property was
required to be
valued (In Sq Metre)
Value of the
property on which
stamp duty was
required to be imposed
Total value of the
property rounded to
next thousand on which stamp
duty was required to be imposed
Rate of stamp duty
appli-cable
Leviable Stamp Duty
Due Regis-tration
fees
Leviable stamp duty and regist-ration fee
Stamp duty paid
Registration
fee paid
Levied stamp duty and regis-tration fee
Difference
1694/ 06.05.17
5604/ 27.12.16
2236 1390 695000 1400 1946000 1946000 6 & 7 126220 20000 146220 41700 13900 55600 90620 75 Kasyan
3115/ 24.07.17
1035/ 24.03.17
2236 1390 695000 1400 1946000 1946000 6 & 7 126220 20000 146220 41700 13900 55600 90620
4457/ 19.09.17
4258/ 06.09.17
1422 2240 1524000 5900 13216000 13216000 6 & 7 915120 20000 935120 96700 20000 116700 818420 76 Tamkuhiraj
4841/ 12.10.17
4810/ 11.10.17
905 690 2243000 6500 4485000 4485000 6 & 7 303950 20000 323950 147100 20000 167100 156850
1355/ 24.03.17
1068/ 15.03.17
1043mi 6130 2452000 1900 11647000 11647000 4 & 5 572350 20000 592350 112600 20000 132600 459750
627/ 14.02.17
545/ 10.02.17
492 2270 1476000 4300 9761000 9761000 4 & 5 478050 20000 498050 63800 20000 83800 414250
205/ 19.01.17
185/ 18.01.17
87 1255.5 2804000 6700 8411850 8412000 6 & 7 578840 20000 598840 186280 20000 206280 392560
5009/ 22.09.17
6530/ 20.10.16
333 716.6 1673000 7000 5016200 5017000 7 351190 20000 371190 117110 20000 137110 234080
77 Hata
Kushinagar
546/ 29.01.18
5279/ 16.08.16
159 1210 1130000 2800 3388000 3388000 4 & 5 159400 20000 179400 46510 20000 66510 112890
2795/ 25.07.17
2099/ 22.04.16
900 3880 1887000 7200 27936000 27936000 5 1396800 20000 1416800 94500 20000 114500 1302300
3936/ 12.07.16
1992/ 13.04.16
333 2170 526000 5610 12173700 12173700 5 608685 20000 628685 26300 10520 36820 591865
1667/ 16.05.17
2495/ 11.05.16
1546 1050 174000 5600 5880000 5880000 5 294000 20000 314000 8700 3480 12180 301820
78 Nighasan
23/ 04.01.17
2495/ 11.05.16
1546 1050 174000 5600 5880000 5880000 5 294000 20000 314000 8700 3480 12180 301820
79 Palia
Lakhimpur Kheri
2326/ 22.06.17
6692/ 26.12.16
1009 1300 813000 4000 5200000 5200000 5 260000 20000 280000 40650 16260 56910 223090
6312/ 22.05.17
449/ 16.01.17
3990mi 2530 684000 4100 10373000 10373000 7 726110 20000 746110 48000 13680 61680 684430
5505/ 04.05.17
449/ 16.01.17
3990mi 2530 684000 4100 10373000 10373000 7 726110 20000 746110 48000 13680 61680 684430
80 Mohanlal-ganj
Lucknow
10024/ 22.06.16
9038/ 08.06.16
4876S 2530 810000 5000 12650000 12650000 5 632500 20000 652500 40500 16200 56700 595800

Appendices
119
(Amount in `) Sl. No.
Name of unit (Sub
Registrar- SR)
Name of district
Deed No. & date of execution
Earlier executed
Deed No. & date of
execution for same
gata/ khasra no.
Gata / Khasra
No.
Land sold (In Sq. M)
Value of the property on which stamp duty levied
Rate on which
property was
required to be
valued (In Sq Metre)
Value of the
property on which
stamp duty was
required to be imposed
Total value of the
property rounded to
next thousand on which stamp
duty was required to be imposed
Rate of stamp duty
appli-cable
Leviable Stamp Duty
Due Regis-tration
fees
Leviable stamp duty and regist-ration fee
Stamp duty paid
Registration
fee paid
Levied stamp duty and regis-tration fee
Difference
11232/ 20.07.16
10298/ 08.07.16
4876mi 2530 810000 5000 12650000 12650000 5 632500 20000 652500 40500 16200 56700 595800
16784/ 18.10.16
16726/ 18.10.16
831mi 2115 931000 5000 10575000 10575000 5 528750 20000 548750 46600 18620 65220 483530
4516/ 23.03.17
3508/ 23.03.17
1370mi 2040 2024000 5500 11220000 11220000 7 785400 20000 805400 141700 20000 161700 643700 81 Sadar I
21967/ 05.12.16
17044/ 05.09.16
88mi 928 361920 1800 1670400 1671000 7 116970 20000 136970 25500 7240 32740 104230
11637/ 27.07.16
11347/ 23.07.16
552 san 3160 2308625 3500 11060000 11060000 7 774200 20000 794200 161700 20000 181700 612500
11634/ 27.07.16
11347/ 23.07.16
552 san 1890 1385175 3500 6615000 6615000 7 463050 20000 483050 97100 20000 117100 365950
82 Sadar II
5011/ 09.05.17
17229/ 18.11.16
237 2768 4095000 3500 9688000 9688000 7 678160 20000 698160 315000 20000 335000 363160
83 Sadar III 1693/ 24.04.17
366/ 01.02.17
69 3327.50 22029725 12000 39930000 39930000 7 2795100 20000 2815100 1542100 20000 1562100 1253000
1474/ 20.02.17
14618/ 13.10.16
3520mi 2530 2624000 2000 5060000 5060000 7 354200 20000 374200 183700 20000 203700 170500
4412/ 04.05.17
3626/ 13.04.17
647sa 1770 800000 2000 3540000 3540000 5 177000 20000 197000 40000 16000 56000 141000
2659/ 24.03.17
14618/ 13.10.16
3520mi 2530 1518000 2000 5060000 5060000 7 354200 20000 374200 106300 20000 126300 247900
1631/ 23.02.17
1180/ 10.02.17
1978 1480 888000 4000 5920000 5920000 7 414400 20000 434400 62500 17760 80260 354140
84 Sadar IV
3450/ 10.04.17
14618/ 13.10.16
3520mi 2530 1518000 2000 5060000 5060000 7 354200 20000 374200 106300 20000 126300 247900
85 Sadar V 3966/ 23.04.16
12071/ 05.12.15
600 fe0 4807 20941610 7600 36533200 36534000 7 2557380 20000 2577380 1466000 20000 1486000 1091380
2237/ 01.08.17
1586/ 14.06.17
206 2831 262000 4900 13871900 13871900 4 & 5 683595 20000 703595 10480 5240 15720 687875 86 Kulpahar Mahoba
2168/ 25.07.17
1586/ 14.06.17
206 1887 160000 4900 9246300 9246300 4 & 5 452315 20000 472315 6400 3200 9600 462715

Audit Report (Revenue Sector) for the year ended 31 March 2018
120
(Amount in `) Sl. No.
Name of unit (Sub
Registrar- SR)
Name of district
Deed No. & date of execution
Earlier executed
Deed No. & date of
execution for same
gata/ khasra no.
Gata / Khasra
No.
Land sold (In Sq. M)
Value of the property on which stamp duty levied
Rate on which
property was
required to be
valued (In Sq Metre)
Value of the
property on which
stamp duty was
required to be imposed
Total value of the
property rounded to
next thousand on which stamp
duty was required to be imposed
Rate of stamp duty
appli-cable
Leviable Stamp Duty
Due Regis-tration
fees
Leviable stamp duty and regist-ration fee
Stamp duty paid
Registration
fee paid
Levied stamp duty and regis-tration fee
Difference
2886/ 12.07.16
874/ 15.02.14
1407 1740 253000 4500 7830000 7830000 5 391500 20000 411500 12650 5060 17710 393790
2167/ 25.07.17
1586/ 14.06.17
206 943.3 113000 4900 4622170 4622200 4 & 5 221110 20000 241110 4520 2260 6780 234330
1535/ 18.03.16
5896/ 14.10.14
653mi 4305 449000 4500 19372500 19373000 4 & 5 958650 20000 978650 18060 8980 27040 951610
2017/ 8.09.16
176/ 22.01.16
128 1560 441000 2800 4368000 4368000 5 218400 20000 238400 22050 8820 30870 207530 87 Charkhari
1963/ 24.08.16
739/ 04.04.16
133 510 290000 2750 1402500 1403000 4 & 5 60150 20000 80150 11600 5800 17400 62750
88 Sadar 3491/ 27.06.16
2326/ 04.05.16
599 7470 3287000 4000 29880000 29880000 5 1494000 20000 1514000 164350 20000 184350 1329650
3946/ 26.10.16
872/ 14.03.16
78mi 570 360000 4850 2764500 2765000 5 138250 20000 158250 18000 7200 25200 133050 89 Farenda
4091/ 15.11.16
4063/ 08.11.16
2401mi 570 240000 4850 2764500 2765000 4 & 5 128250 20000 148250 9600 4800 14400 133850
90 Sadar 865/ 02.02.18
6406/ 25.08.17
399 3630 2142000 5700 20691000 20691000 4 & 5 1024550 20000 1044550 97100 20000 117100 927450
2901/ 20.06.16
2561/ 03.06.16
40 1280 474000 5550 7104000 7104000 4 & 5 345200 20000 365200 18960 9480 28440 336760
2900/ 20.06.16
2561/ 03.06.17
40 1280 474000 5550 7104000 7104000 4 & 6 345200 20000 365200 18960 9480 28440 336760
2229/ 20.05.17
3214/ 11.07.16
326 2220 733000 3100 6882000 6882000 4 & 7 334100 20000 354100 29320 14660 43980 310120
91 Nichlaul
Mahrajganj
131/ 12.01.16
25/ 05.01.16
475mi 790 288000 2700 2133000 2133000 5 106650 20000 126650 14400 5760 20160 106490
92 Sadar 11713/ 19.10.15
4226/ 09.04.15
49 730 379000 5000 3650000 3656000 6 & 7 245920 10000 255920 22800 3790 26590 229330
5007/ 28.05.16
9049/ 03.09.15
770mi 2020 505000 3000 6060000 6060000 5 303000 20000 323000 25300 10100 35400 287600 93 Bhogaon
Mainpuri
4959/ 27.05.16
11602/ 22.12.14
770mi 2020 505000 3000 6060000 6060000 5 303000 20000 323000 25300 10100 35400 287600
94 Sadar Mathura 2910/ 30.03.17
2381/ 21.03.17
14A 3050 5490000 4500 13725000 13725000 7 960750 20000 980750 384500 20000 404500 576250

Appendices
121
(Amount in `) Sl. No.
Name of unit (Sub
Registrar- SR)
Name of district
Deed No. & date of execution
Earlier executed
Deed No. & date of
execution for same
gata/ khasra no.
Gata / Khasra
No.
Land sold (In Sq. M)
Value of the property on which stamp duty levied
Rate on which
property was
required to be
valued (In Sq Metre)
Value of the
property on which
stamp duty was
required to be imposed
Total value of the
property rounded to
next thousand on which stamp
duty was required to be imposed
Rate of stamp duty
appli-cable
Leviable Stamp Duty
Due Regis-tration
fees
Leviable stamp duty and regist-ration fee
Stamp duty paid
Registration
fee paid
Levied stamp duty and regis-tration fee
Difference
5847/ 30.04.16
4160/ 21.03.16
402 1760 1760000 4500 7920000 7920000 6 & 7 544400 20000 564400 113200 20000 133200 431200
6871/ 23.06.17
15956/ 14.12.16
409 1265 1392000 3000 3795000 3795000 7 265650 20000 285650 97500 20000 117500 168150
1479/ 22.02.17
1220/ 14.02.17
497 4050.00 1500000 1300 5265000 5265000 7 368550 20000 388550 105000 20000 125000 263550 95 Chata
8138/ 04.06.16
3530/ 10.03.16
128mi 16130.00 53230000 3400 54842000 54842000 7 3838940 20000 3858940 3726200 20000 3746200 112740
96 Madhuban 424/ 23.02.16
289/ 06.02.16
115mi 900 981000 5350 4815000 4815000 4 & 5 230750 20000 250750 39250 19620 58870 191880
565/ 17.02.17
32/ 06.01.17
249 1100.00 924000 3900 4290000 4290000 4 & 5 204500 20000 224500 36960 18480 55440 169060 97 Mohammadabad, Gohana
1661/ 18.05.17
1184/ 20.04.17
2533 660.50 1330000 5800 3830900 3830900 5 191545 20000 211545 66500 20000 86500 125045
746/ 15.03.16
580,581/ 26.02.16
671 2160.00 1188000 5200 11232000 11232000 4 & 5 551600 20000 571600 49400 20000 69400 502200 98 Ghosi
Mau
1648/ 21.07.17
1093/ 27.04.16
1131 610.00 915000 5200 3172000 3172000 4 & 5 148600 20000 168600 36600 18300 54900 113700
4550/ 17.06.16
3478/ 12.05.16
123mi 5060 6452000 2560 12953600 12954000 6 & 7 896780 20000 916780 442000 20000 462000 454780
2009/ 16.03.16
1907/ 11.03.16
1733 1640 215000 2480 4067200 4068000 5 203400 20000 223400 10750 4300 15050 208350
2276/ 25.04.17
1622/ 25.03.17
212 & 252
2710 1776000 1370 3712700 3713000 7 259910 20000 279910 124350 20000 144350 135560
4098/ 03.06.16
1814/ 08.03.16
2J mi 1900 1794000 1840 3496000 3496000 7 244720 20000 264720 108100 20000 128100 136620
99 Sadar
6979/ 28.10.17
6893/ 26.10.17
413 561 288000 2270 1273470 1273500 7 89145 20000 109145 20200 5760 25960 83185
2270/ 20.04.17
1930/ 31.03.17
271/ 272
2450 1186000 2900 7105000 7105000 7 497350 20000 517350 83230 20000 103230 414120
3399/ 02.06.17
2745/ 11.05.17
132 2530 920000 3600 9108000 9108000 4 & 5 445400 20000 465400 36800 18400 55200 410200
100 Chunar
Mirzapur
7914/ 25.10.16
653/ 25.01.16
333 825 440000 3200 2640000 2640000 7 184800 20000 204800 31000 8800 39800 165000

Audit Report (Revenue Sector) for the year ended 31 March 2018
122
(Amount in `) Sl. No.
Name of unit (Sub
Registrar- SR)
Name of district
Deed No. & date of execution
Earlier executed
Deed No. & date of
execution for same
gata/ khasra no.
Gata / Khasra
No.
Land sold (In Sq. M)
Value of the property on which stamp duty levied
Rate on which
property was
required to be
valued (In Sq Metre)
Value of the
property on which
stamp duty was
required to be imposed
Total value of the
property rounded to
next thousand on which stamp
duty was required to be imposed
Rate of stamp duty
appli-cable
Leviable Stamp Duty
Due Regis-tration
fees
Leviable stamp duty and regist-ration fee
Stamp duty paid
Registration
fee paid
Levied stamp duty and regis-tration fee
Difference
4618/ 20.11.17
4377/ 01.11.17
262 1270 1970000 7500 9525000 9525000 5 476250 20000 496250 98500 20000 118500 377750 101 Kanthh
5903/ 31.08.16
5821/ 27.08.16
175 6290 2142000 2400 15096000 15096000 4 & 5 744800 20000 764800 97100 20000 117100 647700
2823/ 30.03.16
2833/ 30.03.16
223 aa 233 b
1428 1481000 6600 9424800 9425000 5 471250 20000 491250 65274 20000 85274 405976 102 Thakurdwara
Moradabad
4376/ 25.05.16
2177/ 17.06.16
148 650 367000 4950 3217500 3217500 6 & 7 215225 20000 235225 22650 7340 29990 205235
103 Raniganj 448/ 15.02.17
1561/ 27.05.16
295 Mi 510 251000 3300 1683000 1683000 5 84150 20000 104150 12550 5020 17570 86580
104 Kunda 1178/ 23.02.16
1016/ 18.02.16
3482 1260 693000 6000 7560000 7560000 5 378000 20000 398000 34650 13860 48510 349490
212/ 21.01.17
112/ 17.01.17
4134 1160 592000 4600 5336000 5336000 4 & 5 256800 20000 276800 23700 11840 35540 241260
616/ 27.02.16
617/ 27.02.16
1282 1150 575000 4000 4600000 4600000 4 & 5 220000 20000 240000 23000 11500 34500 205500
105 Lal ganj
Pratapgarh
3827/ 23.08.16
189/ 13.01.16
228 1190 322000 4200 4998000 4998000 4 & 5 239900 20000 259900 12880 6440 19320 240580
106 Sadar Rampur 551/ 20.01.18
41/ 02.01.18
14 1140 570000 3000 3420000 3420000 7 239400 20000 259400 40000 11440 51440 207960
107 Maharajganj 1339/ 09.03.17
1246/ 01.08.16
947 5690 1252000 2800 15932000 15932000 5 796600 20000 816600 62600 20000 82600 734000
2855/ 10.04.17
1157/ 29.01.16
187 fe0 3160 1517000 4200 13272000 13272000 7 929040 20000 949040 106200 20000 126200 822840
6483/ 23.05.16
1907/ 20.02.16
163@8 o 162
3980 8073000 5400 21492000 21492000 7 1504440 20000 1524440 565200 20000 585200 939240
4850/ 15.06.17
4126/ 24.05.17
733 fe0 1265 1014000 5800 7337000 7337000 7 513590 20000 533590 71000 20000 91000 442590
3929/ 18.05.17
1157/ 29.01.16
187 fe9 2530 1215000 4200 10626000 10626000 6 & 7 733820 20000 753820 96200 20000 116200 637620
108 Sadar
Raebareli
2387/ 24.03.17
718/ 20.01.16
496 fe0 886 532000 4600 4075600 4076000 6 & 7 275320 20000 295320 32000 10640 42640 252680

Appendices
123
(Amount in `) Sl. No.
Name of unit (Sub
Registrar- SR)
Name of district
Deed No. & date of execution
Earlier executed
Deed No. & date of
execution for same
gata/ khasra no.
Gata / Khasra
No.
Land sold (In Sq. M)
Value of the property on which stamp duty levied
Rate on which
property was
required to be
valued (In Sq Metre)
Value of the
property on which
stamp duty was
required to be imposed
Total value of the
property rounded to
next thousand on which stamp
duty was required to be imposed
Rate of stamp duty
appli-cable
Leviable Stamp Duty
Due Regis-tration
fees
Leviable stamp duty and regist-ration fee
Stamp duty paid
Registration
fee paid
Levied stamp duty and regis-tration fee
Difference
8738/ 07.11.16
1495/ 16.02.15
1653 632.5 225000 7200 4554000 4554000 4 & 5 217700 20000 237700 9000 4500 13500 224200 109 Maharajganj
4910/ 08.06.16
1669/ 20.02.15
3189 843 653000 5600 4720800 4721000 5 236050 20000 256050 32700 13060 45760 210290
110 Salon 468/ 03.02.17
3141/ 21.07.16
2604 403 170000 7200 2901600 2902000 5 145100 20000 165100 8500 20000 28500 136600
111 Itwa Siddharth Nagar
715/ 03.04.17
2972/ 30.09.16
963 630 378000 4400 2772000 2772000 5 138600 20000 158600 19000 7560 26560 132040
112 Sadar 651/ 23.01.16
431/ 18.01.16
69 1300 3081000 4000 5200000 5200000 6 & 7 354000 20000 374000 207500 20000 227500 146500
113 Mahmooda bad
Sitapur
2657/ 06.06.16
2458/ 26.05.16
288 810 3208000 5300 4293000 4293000 7 300510 20000 320510 225000 20000 245000 75510
7388/ 04.10.16
572/ 25.01.14
160mi 5060 1417000 2400 12144000 12144000 4 & 5 597200 20000 617200 61000 20000 81000 536200
1357/ 15.03.17
572/ 25.01.14
160mi 2530 709000 2400 6072000 6072000 5 303600 20000 323600 35450 14180 49630 273970
114 Sadar
313/ 27.01.17
138/ 17.01.17
165mi 2400 627000 1400 3360000 3360000 5 168000 20000 188000 31350 12540 43890 144110
1511/ 31.05.16
845/ 21.03.16
223 6240 565000 1300 8112000 8112000 4 & 5 395600 20000 415600 22600 11300 33900 381700
496/ 21.03.17
86/ 23.01.17
693mi 3540 425000 1400 4956000 4956000 4 & 5 237800 20000 257800 17000 8500 25500 232300
1535/ 02.06.16
1517/ 01.06.16
44mi 3790 471000 1100 4169000 4169000 5 208450 20000 228450 20850 8340 29190 199260
115 Ghoraval
Sonebhadra
4203/ 19.12.15
180/ 15.01.15
668mi 660 179000 6000 3960000 3960000 4 & 5 188000 20000 208000 7200 3620 10820 197180
5565/ 04.07.16
4976/ 15.06.16
97mi 1260 511000 1900 2394000 2394000 5 119700 20000 139700 25700 10220 35920 103780 116 Sadar Sultanpur
4853/ 10.06.16
3110/ 16.04.16
39chh 1450 870000 3960 5742000 5742000 4 & 5 277100 20000 297100 34800 17400 52200 244900
117 Safipur Unnao 6228/ 23.07.16
9592/ 09.12.15
257a & 257b
4789 2497000 1800 8620200 8621000 5 431050 20000 451050 125000 20000 145000 306050

Audit Report (Revenue Sector) for the year ended 31 March 2018
124
(Amount in `) Sl. No.
Name of unit (Sub
Registrar- SR)
Name of district
Deed No. & date of execution
Earlier executed
Deed No. & date of
execution for same
gata/ khasra no.
Gata / Khasra
No.
Land sold (In Sq. M)
Value of the property on which stamp duty levied
Rate on which
property was
required to be
valued (In Sq Metre)
Value of the
property on which
stamp duty was
required to be imposed
Total value of the
property rounded to
next thousand on which stamp
duty was required to be imposed
Rate of stamp duty
appli-cable
Leviable Stamp Duty
Due Regis-tration
fees
Leviable stamp duty and regist-ration fee
Stamp duty paid
Registration
fee paid
Levied stamp duty and regis-tration fee
Difference
7212/ 13.11.17
6112/ 04.10.17
57 2800 2148000 3200 8960000 8960000 6 & 7 617200 20000 637200 140500 20000 160500 476700 118 Hasanganj
7617/ 28.11.17
10699/ 14.12.16
95ch 1210 1280000 3200 3872000 3872000 6 & 7 261040 20000 281040 81000 20000 101000 180040
7707/ 05.08.17
15042/ 08.09.16
18 1655 1880000 6000 9930000 9930000 7 695100 20000 715100 132000 20000 152000 563100 119 Sadar
7706/ 05.08.17
15042/ 08.09.16
18 820 9333000 6600 5412000 5412000 7 378840 20000 398840 65500 17800 83300 315540
3287/ 23.06.16
2108/ 02.05.16
422k 660 792000 5600 3696000 3696000 6 & 7 248720 20000 268720 47550 15840 63390 205330
3931/ 25.07.16
1107/ 04.03.16
41 1010 829000 3200 3232000 3232000 7 226240 20000 246240 58050 16580 74630 171610
120 Pindara Varanasi
3910/ 08.09.17
2210/ 24.05.17
337 750 1207500 4800 3600000 3600000 4 & 5 170000 20000 190000 50400 15840 66240 123760
Total 266 508933.71 585618795 2560871800 148768108 5250000 154018108 35601624 4230510 39832134 114185974
Source: Information available on the basis of Audit findings.

Appendices
125
APPENDIX-XVI Cost of minerals not realised from contractors for works executed without transit passes
(Reference Para No.5.3) (Amount in `)
Sl. No.
Name of unit Total No. of cases
No. of cases test checked
No. of objection
found
Period of royalty Paid Royalty Due Price of Mineral
Cases pertaining to prior 16 October 2015 1 DMO Fatehpur 19 19 19 06/14 to 07/15 1049601 52,48,005 2 DMO J.P.Nagar 35 35 35 01-01-2015 12,82,078 64,10,390 3 DMO Pilibhit 14 14 14 01-02-2015 6,95,078 34,75,390
(i) Total 68 68 68 30,26,757 1,51,33,785 Cases pertaining to on & after 16 October 2015
1 DMO Barabanki 94 94 94 06/16 to 07/17 1,43,91,686 7,19,58,430 2 DMO Fatehpur 03 03 03 August 2017 92,291 4,61,455 3 DMO Jalaun 52 52 45 04/17 to 09/17 24,79,039 1,23,95,195
14 14 14 01-03-2017 28,74,474 1,43,72,370 4 DMO J.P.Nagar 04 04 04 02/17 to 03/17 17,01,000 85,05,000
5 DMO Mahoba 18 18 09 03/17 to 09/17 43,17,559 2,15,87,795 6 D.M.O. Pilibhit 04 04 04 2016-17 63,59,695 3,17,98,475 7 DMO Siddharthnagar 21 21 21 09/16 to 07/17 94,38,181 4,71,90,905 8 DMO Sonebhadra 72 72 72 08/17 to 01/18 78,57,785 3,92,88,925
(ii) Total 282 282 266 4,95,11,710 24,75,58,550 Grand Total (i + ii) 350 350 334 5,25,38,467 26,26,92,335
Source: Information available on the basis of Audit findings.

Appendices
126
APPENDIX-XVII Royalty and permit application fees not realised from the brick kiln owners.
(Reference Para No.5.5) (Amount in `)
Non Levy/Short Levy Sl. No.
Name of district
Cat. of
brick Kiln
No. of total Brick Klin
No. of cases
checked by the audit party
No. of objection
found
Period of
Royalty
Royalty due
Royalty due on palothan
soil
Permit fees due
Total Royalty and Permit
Fees due
Total Deposit Non Levy Short Levy Total
1 DMO Bagpat A 488 164 62 2015-16 10049400 2009880 124000 12183280 5151380 0 7031900 7031900 C 3 3 2 2015-16 194400 38880 4000 237280 0 237280 0 237280 2 DMO
Chitrakoot C 3 3 2 2016-17 194400 19440 4000 217840 0 217840 0 217840 B 329 215 21 2015-16 2394900 478980 42000 2915880 0 2915880 0 2915880 3 DMO Fatehpur B 329 215 41 2016-17 4679100 467910 82000 5229010 0 5229010 0 5229010 B 51 51 17 2015-16 2000700 400140 34000 2434840 1538100 0 896740 896740 B 51 51 14 2016-17 1641600 164160 28000 1833760 1427631 0 406129 406129 B 21 21 3 2013-14 136350 0 6000 142350 0 142350 0 142350 B 23 23 9 2014-15 427950 0 18000 445950 0 445950 0 445950 B 24 24 9 2015-16 1061100 212220 18000 1291320 0 1291320 0 1291320
4 DMO Hamirpur
B 27 27 14 2016-17 1647000 164700 28000 1839700 0 1839700 0 1839700 5 DMO Hardoi B 302 302 19 2015-16 2433600 486720 38000 2958320 1270300 0 1688020 1688020
A 118 87 3 2014-15 242250 0 0 242250 229500 0 12750 12750 A 120 87 18 2015-16 2635200 527040 36000 3198240 0 3198240 0 3198240
6 DMO J.P.Nagar
A 120 87 3 2015-16 456300 91260 6000 553560 308130 0 245430 245430 B 12 12 7 2015-16 774900 154980 14000 943880 570600 0 373280 373280 B 12 12 5 2015-16 548100 109620 10000 667720 0 667720 0 667720
7 DMO Jalaun
B 9 9 7 2016-17 774900 77490 14000 866390 0 866390 0 866390 C 322 255 90 2015-16 7543800 1508760 180000 9232560 0 9232560 0 9232560 8 DMO Mirzapur C 322 255 195 2016-17 17471700 1747170 390000 19608870 0 19608870 0 19608870

Appendices
127
(Amount in `) Non Levy/Short Levy Sl.
No. Name of district
Cat. of
brick Kiln
No. of total Brick Klin
No. of cases
checked by the audit party
No. of objection
found
Period of
Royalty
Royalty due
Royalty due on palothan
soil
Permit fees due
Total Royalty and Permit
Fees due
Total Deposit Non Levy Short Levy Total
A 160 93 20 2015-16 3024000 604800 40000 3668800 1867377 0 1801423 1801423 A 147 87 17 2014-15 1308150 0 34000 1342150 0 1342150 0 1342150
9 DMO Pilibhit
A 160 93 22 2015-16 3369600 663920 44000 4087520 0 4087520 0 4087520 C 225 225 8 2015-16 696600 139320 16000 851920 0 851920 0 851920 10 DMO
Siddharthnagar C 225 225 14 2016-17 1128600 112860 28000 1269460 0 1269460 0 1269460 11 DMO
Sonebhadra C 9 9 6 2016-17 545400 54540 12000 611940 0 611940 0 611940
B 250 100 8 2014-15 491350 0 16000 507350 0 507350 0 507350 12 DMO Sitapur B 250 100 24 2015-16 3024000 604800 48000 3676800 0 3676800 0 3676800
Total 4112 2835 660 7,08,95,350 1,08,39,590 13,14,000 8,30,58,940 1,23,63,018 5,82,40,250 1,24,55,672 7,06,95,922
Source: Information available on the basis of Audit findings. Note:- Total Royalty + Permit fee = ` 7.07 crore. Permit Fee Due = ` 13.14 lakh. Royalty = ` 6.94 crore.

Appendices
128
APPENDIX-XVIII Non/Short deposit of dead rent
(Reference Para No.5.6) (Amount in `)
Sl. No.
Name of Unit Total no of cases
Checked by audit
party
No. of cases in which
objection found
Lease period Period of Dead Rent
Due Dead Rent
Deposited Dead Rent
Non / Short
deposit of Dead Rent
1 DMO Allahabad 77 8 1 06-02-2009 to 05-02-2019
06/02/12 to 05/02/16
1768192 0 1768192
2 DMO Bagpat 1 1 1 17-12-2011 to 16-12-2014
17/12/13 to 16/12/14
650611 0 650611
3 DMO Banda 10 2 2 13-06-2013 to 12-06-2016
13/06/15 to 12/06/16
21015746 17285000 3730746
4 DMO Hamirpur 57 25 6 11-03-2013 to 18-06-2018
01/04/15 to 01/01/16
7397480 1200000 6197480
5 DMO Jalaun 6 6 2 29-11-2006 to 12-12-2016
01/04/15 to 01/10/16
4185000 0 4185000
6 DMO Mahoba 132 32 7 28-08-2009 to 29-06-2021
18/06/2017 to 13/11/17
4342800 0 4342800
TOTAL 283 74 19 11/2006 to 06/2021
02/2012 to 11/2017
39359829 18485000 20874829
Source: Information available on the basis of Audit findings.