Report 5 of 2016 Revenue PSU NCT Delhi.pdf - CAG
106
Report of the Comptroller and Auditor General of India on Revenue and Social & Economic Sectors (PSUs) for the year ended 31 March 2016 Government of National Capital Territory of Delhi Report No. 5 of the year 2016
-
Upload
khangminh22 -
Category
Documents
-
view
4 -
download
0
Transcript of Report 5 of 2016 Revenue PSU NCT Delhi.pdf - CAG

Report of the Comptroller and Auditor General of India
on
Revenue
and
Social & Economic Sectors (PSUs)
for the year ended 31 March 2016
Government of National Capital
Territory of DelhiReport No. 5 of the year 2016


Overview
i
Table of ContentsDescription
Reference to
Paragraph Page No.
Preface v
Overview vii
Chapter-I : Revenue Sector
Trend of revenue receipts 1.1.1 1
Analysis of arrears of revenue 1.1.2 2
Arrears in assessments 1.1.3 3
Evasion of tax detected by the department 1.1.4 3
Details of pendency of refund cases 1.1.5 3
Response of the Government/Departments to Audit 1.1.6 4
Recovery of accepted cases 1.1.7 6
Audit planning 1.1.8 7
Results of Audit 1.1.9 7
Coverage of the Revenue Chapter 1.1.10 8
Department of Trade and Taxes
System for collection of arrears of revenue 1.2 8
Irregular allowance of concessional rate of tax 1.3 17
Non-recovery of demand and consequential loss of interest
1.4 18
Department of Revenue
Short levy of stamp duty and registration fees 1.5 19
Chapter-II: Functioning of State Public Sector Undertakings
Introduction 2.1.1 21
Accountability framework 2.1.2 21
Statutory Audit 2.1.3 22
Role of Government and Legislature 2.1.4 22
Stake of Government of NCT of Delhi 2.1.5 22
Investment in State PSUs 2.1.6 23
Special support and returns during the year 2.1.7 24

Audit Report No. 5 – Revenue and Social & Economic Sectors (PSUs) for the year ended 31 March 2016
ii
DescriptionReference to
Paragraph Page No.
Reconciliation with Finance Accounts 2.1.8 24
Arrears in finalisation of accounts 2.1.9 25
Performance of PSUs as per their latest finalized accounts
2.1.10 26
Accounts Comments 2.1.11 28
Placement of Separate Audit Reports 2.1.12 29
Response of the Government to Audit 2.1.13 29
Follow up action on Audit Reports 2.1.14 30
Discussion of Audit Reports by Committee on Government Undertakings (COGU)
2.1.15 30
Compliance to Reports of COGU 2.1.16 31
Disinvestment, Restructuring and Privatisation of PSUs
2.1.17 31
Coverage of the Chapter 2.1.18 31
Performance Audit and Transaction Audit
Department of Power
Performance Audit on Working of Power Generation Companies of Delhi
2.2 32
Department of Finance
Working of Delhi Financial Corporation 2.3 48
Department of Power
Delay in disposal 2.4 53
Lack of coordination in procurement 2.5 54
Avoidable payment to Pension Trust 2.6 55
Department of Tourism
Non-recovery of parking charges from private operator
2.7 56
Department of Transport
Short recovery of Concession Fee 2.8 58

Overview
iii
Annexures
Number Particulars Reference to
Paragraph Page No.
2.1 (i) Statement showing investments made by State Government in PSUs whose accounts are in arrears
2.1.9 61
2.1 (ii) Summarised financial position and working results of Government companies and Statutory corporations as per their latest finalised financial statements/ accounts
2.1.10 63
2.2A Statement showing financial position of IPGCL and PPCL
2.2.2 66
2.2B Statement showing working results of IPGCL and PPCL
2.2.2 70
2.3 Statement showing the Cash inflow and outflow of IPGCL and PPCL
2.2.4 74
2.4 Statement showing excess consumption of fuel in Power Plants of IPGCL and PPCL
2.2.6.1 (c) 75
2.5 Statement showing Operational Performance of the Indraprastha Power Generation Company limited and Pragati Power Corporation Limited
2.2.6.3 (a) & (c)
78
2.6 Statement showing less recovery of capacity charges (annual fixed cost) in respect of Power Plants of IPGCL and PPCL
2.2.6.3 (b) 80
2.7 Statement showing the position of outages in Power Plants of IPGCL and PPCL
2.2.6.4 82
2.8 Statement showing excess Auxiliary Energy Consumption in Power Plants of IPGCL and PPCL
2.2.6.5 84
2.9 Summary of key financial indicators of Delhi Financial Corporation
2.3.1 86


Overview
v
Preface
This Report of the Comptroller and Auditor General of India for the year ended 31 March 2016 has been prepared for submission to the Lieutenant Governor of Delhi. This Report contains two parts.
Chapter –I of this Report relates to the audit of Revenue Sector departments of the Government. The audit of receipts is conducted under Section 16 of the Comptroller and Auditor General’s (Duties, Powers and Conditions of Service) Act, 1971 and is required to be placed before the Legislative Assembly of National Capital Territory of Delhi under Section 48 of the Government of National Capital Territory of Delhi Act, 1991. This Chapter presents the results of audit of receipts such as sales tax/value added tax and taxes on motor vehicles of the Government of NCT of Delhi for the year ended 31 March 2016.
Chapter -II of this Report relates to the audit of State Public Sector Undertakings. Audit of accounts of Government Companies is conducted by the Comptroller and Auditor General under the provisions of Section 619 of the Companies Act, 1956 and Sections 139 and 143 of the Companies Act, 2013 and audit of Statutory Corporations under their respective legislation. The Government is required to submit this portion of the Audit Report to the Legislative Assembly of National Capital Territory of Delhi under Section 19A of the Comptroller and Auditor General’s (Duties, Powers and Conditions of Service) Act, 1971.
The instances mentioned in this Report are those which came to notice in the course of test audit during the year 2015-16 as well as those which had come to notice in earlier years, but could not be dealt with in previous Reports; instances relating to the period subsequent to 2015-16 but pertaining to the year 2015-16 have also been included, wherever necessary.
The audit has been conducted in conformity with the Auditing Standards issued by the Comptroller and Auditor General of India.


Overview


Overview
vii
Overview
This Report comprises of two chapters containing audit findings pertaining to Revenue and Social & Economic Sectors (PSUs). Chapter I relating to Revenue Sector contains four paragraphs involving ` 122.97 crore, on underassessment, short payment/loss of revenue, interest and penalty and Chapter II relating to Social and Economic Sectors (PSUs) contains one Performance Audit and six paragraphs involving ` 957.35 crore. The total money value of this Report is ` 1,080.32 crore. Some of the major findings are mentioned below:
Chapter-I: Revenue Sector
The total revenue receipts of the Government for the year 2015-16 were ` 34,998.85 crore as compared to ` 29,584.59 crore in the year 2014-15. Out of this, 88 per cent was raised through tax revenue (` 30,225.16 crore) and non-tax revenue (` 515.40 crore). The balance 12 per cent was received from the Government of India as grants-in-aid (` 4,258.29 crore). The increase in tax revenue was 13.61 per cent and decrease in non-tax revenue was 18.52 per cent over the previous year.
(Paragraph 1.1.1)
Test check of the records of 80 units of the Department of Trade and Taxes, State Excise, Transport and Revenue conducted during the year 2015-16 revealed under assessment/short levy/loss of revenue and other irregularities involving ` 164.17 crore in 459 cases. During the course of the year, the concerned Departments accepted under assessment and other deficiencies of ` 7.02 crore and recovered an amount of ` one lakh which were pointed out in audit during 2015-16.
(Paragraph 1.1.9)
Trade and Taxes Department and Department of Excise, Entertainment and Luxury Tax
System for collection of arrears of Revenue
A review of the efforts of the departments in collection of government revenues as arrears of land revenue as provided for under the respective Acts brought out ineffective monitoring and poor maintenance of details of defaulters that undermined the ability of the department to pursue the arrears and effect recovery. There was an evident lack of seriousness in timely enforcement of the provisions relating to recovery of government dues that resulted in an increase of arrears by 31 per cent from ` 15,249.16 crore at the start of 2012-13 to ` 20,039.34 crore at the end of 2014-15 in the Department of Trade and Taxes. The recovery process in Department of Trade and Taxes and Department of Excise, Entertainment and Luxury Tax was not initiated in pending demand cases implying inherent

Audit Report No. 5 – Revenue and Social & Economic Sectors (PSUs) for the year ended 31 March 2016
viii
system deficiencies and weak internal checks. Improper reflection of payments and system designing flaws resulted in non-recovery of demands. Refund of ` 80.53 lakh was allowed in Value Added Tax though the registration of the dealers was cancelled. The Demand and Collection Register was not properly maintained in Department of Excise, Entertainment and Luxury Tax to watch the payment and arrears of revenue.
(Paragraph 1.2)
Irregular allowance of concessional rate of tax on Forms ‘C’ by two assessees resulted in short levy of tax of ` 0.58 crore. In addition, interest of ` 0.39 crore and penalty of ` 0.57 crore were also leviable.
(Paragraph 1.3)
The Department failed to recover demand of ` 2.84 crore from the dealers whose registration had been cancelled. It also resulted in loss of interest of ` 0.38 crore.
(Paragraph 1.4)
Incorrect categorization of localities by Sub-Registrars resulted in short levy of stamp duty and registration fee of ` 36.44 lakh.
(Paragraph 1.5)
Chapter-II: Public Sector Undertakings (PSUs)
As on 31 March 2016, there were 17 PSUs which included 15 Government companies and two statutory corporations. The investment in these 17 PSUs as on 31 March 2016 was ` 27,289.04 crore. This total investment consisted of 35.24 per cent towards capital and 64.76 per cent in long-term loans. The total investment decreased by 2.37 per cent from ` 27,951.87 crore in 2011-12 to ` 27,289.04 crore in 2015-16. The Government contributed ` 1,904.41 crore towards Equity, Loans and Grants/ Subsidies to State PSUs during 2015-16.
(Paragraphs 2.1.6 and 2.1.7)
The number of accounts in arrears increased from 16 (2011-12) to 27 (2015-16). One PSU, namely the Delhi SC/ST/OBC/Minorities & Handicapped Financial and Development Corporation Limited had an arrear of accounts of 12 years while the arrear in other PSUs ranged from one to three years as on 30 September 2016.
(Paragraph 2.1.9)
Out of 17 PSUs, 12 PSUs earned profit of ̀ 1,177.81 crore and four PSUs incurred loss of ` 2,917.77 crore. One PSU prepared its accounts on a ‘no profit no loss’ basis.
(Paragraph 2.1.10)

Overview
ix
In respect of the 11 accounts received during the period October 2015 to September 2016, the Statutory Auditors gave unqualified certificates for four accounts, qualified certificates for six accounts and adverse certificate (which means that accounts do not reflect a true and fair position) for one account.
(Paragraph 2.1.11)
Department of Power
A performance audit of the working of the two power generation companies, Indraprastha Power Generation Company Limited (IPGCL) and Pragati Power Corporation Limited (PPCL) covering the period 2011-12 to 2015-16 brought out deficiencies in capacity addition programmes, excess consumption of fuel and non-achievement of generation targets and plant load factor norms due to less scheduling of power, unplanned major shutdowns and delays in repair and maintenance. Some of the significant findings are as under:
Outstanding dues of ` 4,911.07 crore recoverable from DISCOMs adversely affected the cash flow of IPGCL and PPCL and the companies had to resort to heavy short term borrowings.
(Paragraph 2.2.2 and 2.2.4.1)
Out of planned commissioning of six power plants of 3,340 MW by the end of 12th Five Year Plan, only 1,500 MW PPS-III, Bawana has been commissioned while other projects were held up due to non-availability of either gas or land. Inability to effectively monitor execution of project of Block I and Block II and delayed commissioning of the projects resulting in PPCL not being able to recover ` 474.32 crore in tariff and avail of additional return of ` 163.32 crore on equity.
(Paragraph 2.2.5 and 2.2.5.1)
Operational performance of the power plants was sub-optimal. Gross Station Heat Rate of the plants was higher than the norms resulting in excess consumption of fuel of ` 125.92 crore. Rajghat Power House, Gas Turbine Power Station and PPS-III could not achieve targeted plant availability resulting in under recovery of capacity charges of ` 616.87 crore. Further, auxiliary energy consumption of these power plants was higher than the norms leading to excess consumption of 154.75 MUs valued at ` 48.04 crore.
(Paragraph 2.2.6.1 (c), 2.2.6.3 (b) and 2.2.6.5)
Undertaking major overhauling of Unit-2 of RPH without incorporating any action plan to comply with norms of Delhi Pollution Control Committee resulted in the plant lying idle and unfruitful expenditure of ` 15.09 crore expended on the major overhauling.
(Paragraph 2.2.7.1)

Audit Report No. 5 – Revenue and Social & Economic Sectors (PSUs) for the year ended 31 March 2016
x
Department of Finance
The Delhi Financial Corporation not only failed to fulfil the objectives of promotion and development of small scale industries, but it also could not take timely decision to diversify its activities to overcome the shrinking business. The business of the Corporation declined due to its inability to secure potential business of ` 14.69 crore. The Corporation could not rent out its excess space at the Corporate Office to earn additional revenue of ` 0.81 crore.
(Paragraph 2.3)
Department of Power
Delhi Transco Limited
• Delay in disposal of scrap resulted in blocking of ` 5.45 crore and loss of interest of ` 1.71 crore.
(Paragraph 2.4) • Non-synchronization of activities of purchase of transformers and
commissioning of associated bays resulted in blocking of funds of ` 13.15 crore and associated loss of interest of ` 4.55 crore.
(Paragraph 2.5) • Avoidable payments to Pension Trust on account of TDS instead of
claiming it from DISCOMs resulted in blocking of funds of ` 29.97 crore and consequent loss of interest of ` 2.52 crore.
(Paragraph 2.6)
Department of Tourism
Delhi Tourism and Transport Development Corporation Limited did not enforce terms of agreement relating to payment of parking charges of ` 1.93 crore by private operator though it granted concession of extension of moratorium for payment of revenue share foregoing income of ` 1.20 crore.
(Paragraph 2.7)
Department of Transport
Delhi Transport Infrastructure Development Corporation Limited failed to recover Concession Fee as per an agreement resulting in short recovery of ` 1.49 crore. It also failed to charge interest of ` 1.49 crore on delayed payment of Concession Fee.
(Paragraph 2.8)

Chapter I Revenue Sector


Chapter-I : Revenue Sector
1
Chapter-I
Revenue Sector
1.1 Introduction
1.1.1 Trend of revenue receipts
1.1.1.1 The tax and non-tax revenue raised by the Government of National Capital Territory of Delhi (GNCTD) during the year 2015-16, the State’s share of net proceeds of divisible Union taxes and duties assigned to the State and Grants-in-aid received from the Government of India during the year and the corresponding figures for the preceding four years are mentioned in Table-1.1 below.
Table-1.1: Trend of revenue receipts(` in crore)
Sl.No. Particulars 2011-12 2012-13 2013-14 2014-15 2015-16
1. Revenue raised by the State Government
Tax revenue 19,971.67 23,431.52 25,918.69 26,603.90 30,225.16
Non-tax revenue 460.87 626.93 659.14 632.55 515.40
Total 20,432.54 24,058.45 26,577.83 27,236.45 30,740.56
2. Receipts from the Government of India
Grants-in-aid 1,960.64 1,502.52 1,402.86 2,348.14 4,258.29
3. Total revenue receipts of the State Government (1 and 2)
22,393.18 25,560.97 27,980.69 29,584.59 34,998.85
4. Percentage of 1 to 3 91 94 95 92 88
Source: Finance Accounts
The revenue raised by the NCT of Delhi (` 30,740.56 crore) during the year 2015-16 was 88 per cent of the total revenue receipts. The balance 12 per cent of the receipts during 2015-16 was Grants-in-aid from the Government of India.
1.1.1.2 The details of tax revenue raised during the period 2011-12 to 2015-16 are given in Table-1.2.
Table-1.2: Details of Tax Revenue raised(` in crore)
Sl. No.
Head of revenue
2011-12 2012-13 2013-14 2014-15 2015-16Percentage of increase (+) or decrease (-) in 2015-16
BE1 Actual BE Actual BE Actual BE Actual BE ActualActual over
BE for 2015-16
Actual of 2015-16 over
2014-15
1 Taxes on sales, trade etc.
14,000.00 13,750.95 16,500.00 15,803.68 18,200.00 17,925.71 19,000.00 18,289.31 21,000.00 20,245.82 (-)3.59 (+)10.70
2 State Excise 2,400.00 2,533.72 3,000.00 2,869.74 3,200.00 3,151.63 3,550.00 3,422.39 4,500.00 4,237.69 (-)5.83 (+)23.823 Stamp Duty 2,399.97 2240.25 3,799.97 3,098.06 3,799.98 2,969.07 2,938.15 2,779.88 3,449.98 3,433.60 (-)0.47 (+)23.524 Motor Vehicles
Tax950.00 1,049.19 1,370.00 1,240.18 1,400.00 1,409.27 1,600.00 1,558.83 1,700.00 1,607.01 (-)5.47 (+)3.09
5 Others 378.00 397.54 487.00 419.84 475.00 463.00 520.00 491.70 720.00 700.53 (-)2.70 (+)42.476 Land Revenue 0.03 0.01 0.03 0.01 0.02 0.01 61.85 61.79 0.02 0.51 (+)2450.00 (-)99.17
Total 20,128.00 19,971.66 25,157.00 23,431.51 27,075.00 25,918.69 27,670.00 26,603.90 31,370.00 30,225.16
Source: Finance Accounts1
1 Budget Estimates

Audit Report No. 5 – Revenue and Social & Economic Sectors (PSUs) for the year ended 31 March 2016
2
Actual receipts for the year 2015-16 under the Head State Excise and Motor Vehicles Tax decreased by 5.83 and 5.47 per cent respectively over the Budget Estimates (BE). The actual receipts for the year 2015-16 under the Head ‘Taxes on Sales, Trade etc.’ increased by 10.70 per cent from ` 18,289.31 crore to ` 20,245.82 crore while Land Revenue decreased by 99.17 per cent from ` 61.79 crore to ` 0.51 crore over the previous year.
The Transport Department stated that decrease in revenue collection was due to ban on registration of diesel vehicles of more than 2000 CC.
1.1.1.3 The details of the non-tax revenue raised during the period 2011-12 to 2015-16 are indicated in Table-1.3 below.
Table-1.3: Details of Non-tax Revenue raised
(` in crore)
Sl. No.
Head of revenue 2011-12 2012-13 2013-14 2014-15 2015-16 Percentage of increase (+) or decrease (-) in 2015-16 over
2014-15BE Actual BE Actual BE Actual BE Actual BE Actual Actual over
BE for 2015-16
Actual of 2015-16 over
2014-15
1 Interest receipts
369.81 174.14 473.54 340.03 754.50 379.35 604.00 350.52 173.16 82.53 (-)52.34 (-)76.45
2 Medical and Public Health
41.00 47.56 44.24 54.32 65.00 63.05 73.00 58.20 129.23 125.88 (-)2.59 (+)116.29
3 Public Works 20.00 26.15 23.10 25.55 20.00 18.59 17.50 14.74 19.00 18.47 (-)2.79 (+)25.314 Power 15.00 12.12 14.00 9.93 22.01 18.46 24.01 16.38 32.01 42.06 (+)31.40 (+)156.785 Other
administrative services
78.00 92.93 91.00 95.60 115.00 91.04 112.17 98.91 106.18 89.43 (-)15.78 (-)9.58
6 Other Non-tax receipts
116.66 107.97 123.66 101.50 111.42 88.65 133.32 93.79 109.42 157.03 (+)43.51 (+) 67.43
Total 640.47 460.87 769.54 626.93 1,087.93 659.14 964.00 632.54 569.00 515.40
Source: Finance Accounts
The actual receipts under the Heads of Interest receipts and other administrative services for the year 2015-16 decreased by 52.34 per cent and 15.78 per cent respectively over BE. The actual receipts under the Heads of Medical and Public Health and Power for the year 2015-16 increased by 116.29 per cent and 156.78 per cent respectively while the Head of Interest receipts decreased by 76.45 per cent over the previous year.
The detailed reasons for variations were not furnished by the respective Departments (November 2016).
1.1.2 Analysis of arrears of revenue
The arrears of revenue as on 31 March 2016 under some principal heads of revenue amounted to ` 24,517.22 crore of which ` 14,312.14 crore was outstanding for more than five years as detailed in the Table-1.4.

Chapter-I : Revenue Sector
3
Table-1.4: Arrears of revenue
(` in crore)
Sl. No.
Head of revenue
Total Amount outstanding as on
31 March 2016
Amount outstanding for more than five years as
on 31 March 2016Remarks
1. Taxes on sales, trade etc.
24,244.89 14,312.14 Reasons for arrear of revenue not furnished by the department.
2. State Excise, Entertainment and Luxury
272.33 0.00 Pending in Courts
Total 24,517.22 14,312.14
1.1.3 Arrears in assessments
The details of cases pending at the beginning of the year, cases becoming due for assessment, cases disposed of during the year and number of cases pending for finalisation at the end of the year as furnished by Department of Trade and Taxes and Department of State Excise, Entertainment and Luxury, are given in Table-1.5 below.
Table-1.5: Arrears in assessments
Head of revenue
Opening balance
New cases due for assessment during 2015-16
Total assessments
due
Cases disposed of during 2015-16
Balance at the end of the year
Percentage of disposal (col. 5 to 4)
1 2 3 4 5 6 7
Taxes on sales, trade etc.
57 4,15,554 4,15,611 4,15,611 0 100
State excise, Entertainment and Luxury
1,461 18 1,479 7 1,472 0.47
Source: Department of Trade & Taxes, State Excise, Entertainment & Luxury
The percentage of disposal of assessment cases was as low as 0.47 per cent in respect of Department of State Excise, Entertainment and Luxury Tax.
1.1.4 Evasion of tax detected by the department
During 2015-16, the Enforcement Branch (Department of Trade and Taxes) detected 361 cases on search and raised a demand of ` 169.49 crore and Department of Excise, Entertainment & Luxury Tax detected 18 cases and raised a demand of ` 166.28 crore in eight cases.
1.1.5 Details of pendency of refund cases
The number of refund cases pending at the beginning of the year 2015-16, claims received during the year, refunds allowed during the year and the cases pending

Audit Report No. 5 – Revenue and Social & Economic Sectors (PSUs) for the year ended 31 March 2016
4
at the end of 2015-16 as reported by Department of Trade and Taxes are given in Table 1.6 below.
Table-1.6: Details of pendency of refund cases(` in crore)
Sl. No.
ParticularsSales Tax/VAT
Entertainment Tax
Stamp & Registration
No. of cases
Amount No. of cases
AmountNo. of cases
Amount
1 Claims outstanding at the beginning of the year
3,876 139.15 Nil Nil Not furnished
Not furnished
2 Claims received during the year
4,163 157.07 24 0.73 743 30.49
3 Total claims 8,039 296.22 24 0.73 743 30.49
4 Refunds made during the year
7,299 253.91 06 0.13 Not furnished
26.04
5 Percentage of refunds to the total claims
90.79 85.72 25 17.81 Not furnished
85.41
6 Balance outstanding at the end of year
740 42.31 18 0.60 Not furnished
4.45
Section 42 of Delhi Value Added Tax Act (DVAT Act) provides for payment of interest at an annual rate notified by government, if the excess amount is not refunded to the dealer within 60 days from the date of the order. Not refunding the claims within the stipulated period may attract the payment of interest.
1.1.6 Response of the Government/Departments to Audit
The Accountant General (Audit), Delhi (AG) conducts periodical inspection of the departments to test check transactions and verify maintenance of accounts and other records as prescribed in the rules and procedures. These inspections are followed up through Inspection Reports (IRs) incorporating irregularities detected during the inspection and not settled on the spot, which are issued to the heads of the offices inspected with copies to the next higher authorities for taking prompt corrective action. The heads of the offices/Government are required to promptly comply with the observations contained in the IRs, rectify the defects and omissions and report compliance to the AG within four weeks from the date of receipt of the IRs. Serious financial irregularities are reported to the heads of the Departments and the Government.
The summarised position of the Inspection Reports issued during the last 10 years, paragraphs included in these reports and their status as on 31 March 2016 are tabulated in the Table-1.7.

Chapter-I : Revenue Sector
5
Table-1.7: Position of Inspection Reports(` in crore)
Sl. No.
Year Opening Balance Addition during the year Clearance during the year
Closing Balance during the year
IRs Para-graphs
Money value
IRs Para-graphs
Money value
IRs Para-graphs
Money value
IRs Para-graphs
Money value
1. 2006-07 424 4,250 1,253.72 64 880 320.51 265 2,548 543.25 223 2,582 1,030.98
2. 2007-08 223 2,582 1,030.98 62 1329 1,077.42 79 1,266 349.89 206 2,645 1,758.51
3. 2008-09 206 2,645 1,758.51 89 2265 1,748.24 6 429 413.39 289 4,481 3,093.36
4. 2009-10 289 4,481 3,093.36 108 2972 2,900.71 11 301 218.47 386 7,152 5,775.60
5. 2010-11 386 7,152 5,775.60 54 2009 1,831.89 85 564 434.09 355 8,597 7,173.40
6. 2011-12 355 8,597 7,173.40 96 2204 3,079.27 24 657 394.02 427 10,144 9,858.65
7. 2012-13 427 10,144 9,858.65 104 1610 1,209.64 62 520 571.99 469 11,234 10,496.31
8. 2013-14 469 11,234 10,496.31 92 790 1,099.45 3 83 - 558 11,941 11,595.76
9. 2014-15 558 11,941 11,595.76 76 506 159.57 15 159 7.40 619 12,288 11,747.93
10. 2015-16 619 12,288 11,747.93 80 458 52.23 09 129 4.12 690 12,617 11,796.04
The number of pending paras increased from 4,250 involving an amount of ` 1,253.72 crore in 2006-07 to 12,617 involving money value of ` 11,796.04 crore at the end of the year 2015-16 which indicates that the Department did not take adequate steps to settle the outstanding paragraphs.
1.1.6.1 Departmental Audit Committee Meetings
The Government set up Audit Committees to monitor and expedite the progress of settlement of audit paragraphs in the IRs. However, no Audit Committee meeting was held by the Departments of Trade and Taxes, State Excise, Entertainment and Luxury Tax, Transport & Revenue during the year 2015-16. It is recommended that the Government may hold periodical meetings and take concrete steps to clear outstanding paragraphs.
1.1.6.2 Non-production of records to Audit for scrutiny
The programme of local audit of Tax Revenue offices is drawn up sufficiently in advance and intimations are issued, usually one month before the commencement of audit, to the departments to enable them to keep the relevant records ready for audit scrutiny.
The Department of Trade and Taxes did not provide 8,813 assessment files/cases out of 11,202 files/cases (79 per cent) requisitioned during the year 2015-16. Consequently, the revenue involved in these cases could not be ascertained.
1.1.6.3 Follow up on Audit Reports – summarized position
The Public Accounts Committee (PAC) stipulates that after presentation of the Report of the CAG of India in the Legislative Assembly, Departments shall initiate action on the audit paragraphs and the Action Taken Notes (ATNs) thereon should

Audit Report No. 5 – Revenue and Social & Economic Sectors (PSUs) for the year ended 31 March 2016
6
be submitted by the Government within four months of tabling the Report, for consideration of the Committee. However, ATNs on the Reports were delayed in respect of 33 paragraphs and six Performance Audits (PAs) included in the Reports of the CAG of India on the Revenue Sector of the GNCTD for the years ended 31 March 2011, 2012, 2013, 2014 and 2015, placed before the State Legislature Assembly between March 2012 to June 2016. The ATNs from the concerned Departments were received late with an average delay of six months in respect of each of these Audit Reports. ATNs in respect of 18 paragraphs and three PAs from the departments had not been received in respect of the Audit Reports for the year ended 31 March 2011, 2012, 2013, 2014 and 2015 as mentioned in the Table-1.8 below.
Table-1.8: Details of paragraphs and performance audits and the ATNs
Sl. No.
Year of Report ending 31 March
Number of Paragraphs and Performance Audits
printed in Report
Number of Paragraphs and Performance Audits for which
ATNs were awaited
1 2011 12+3 (PA) 10+1(PA)
2 2012 16+1 (PA) 3+0(PA)
3 2013 2+1 (PA) 2+1(PA)
4 2014 3+0 (PA) 3+0(PA)
5 2015 0+1 (PA) 0+1(PA)
Total 33+6 (PA) 18+3(PA)
PAC did not discuss paragraphs pertaining to the Audit Reports (Revenue Sector) for the period 2010-11 to 2014-15.
1.1.7 Recovery of accepted cases
The position of paragraphs included in the Audit Reports of the last 10 years, those accepted by the Department and the amount recovered are mentioned in Table-1.9 below.
Table-1.9: Position of paragraphs included, accepted and amount recovered(` in crore)
Year of Audit
Report
Number of Para-graphs
included
Money value of
the Para-graphs
Number of Para-graphs
accepted
Money value
accepted
Amount recovered during the
year 2015-16
Cumulative position of recovery of
accepted cases as of 31 March 2016
Percentage of recovery
2005-06 20 177.85 13 18.44 - 0.06 0.332006-07 16 254.93 13 209.06 - 0.27 0.132007-08 11 945.52 7 28.17 - 0.18 0.642008-09 15 1,729.62 7 109.00 - 0.14 0.132009-10 18 1,764.20 5 49.36 - 0.39 0.792010-11 15 1,479.98 4 58.00 - 0.06 0.102011-12 17 2,363.11 1 19.14 - 1.23 6.432012-13 3 536.00 3 70.16 - 00 0.002013-14 3 98.39 3 20.83 - 00 0.002014-15 1 1.34 1 1.34 0.02 0.02 1.49
Total 119 9,350.94 57 583.50 0.02 2.35 0.40

Chapter-I : Revenue Sector
7
It is evident from the above table that the progress of recovery, even in accepted cases was negligible. The reports for the year 2005-06 to 2014-15 contained audit findings involving ` 9,350.94 crore, out of which audit observations with revenue implication of ` 583.50 crore were accepted by the Department. However, only an amount of ` 2.35 crore (0.40 per cent) was recovered by the Department.
The Department may initiate prompt action to pursue and monitor recovery of dues in the accepted cases.
1.1.8 Audit Planning
The unit offices under various Departments are categorised into high, medium and low risk units according to their revenue position, past trends of audit observations and other parameters. The annual audit plan is prepared on the basis of a risk analysis which takes into account matters highlighted in the budget speech, white paper on State Finances, Reports of the Finance Commission (State and Central), recommendations of the Taxation Reforms Committee, statistical analysis of the revenue earnings, audit coverage and its impact during the past five years.
During the year 2015-16, there were 153 auditable units of which 80 units were planned and audited.
1.1.9 Results of audit
1.1.9.1 Position of local audits conducted during the year
Test check of the records of 80 units of the Department of Trade and Taxes, State Excise, Transport and Revenue conducted during the year 2015-16 revealed under assessment/short levy/loss of revenue and other irregularities involving ` 164.17 crore in 459 paragraphs as categorized in Table-1.10.
Table-1.10: Category-wise Audit observations(` in crore)
Sl.No. Categories No. of paras AmountSales Tax/Value Added Tax
1 System for collection of Arrears of Revenue 1 116.762 Non-recovery of demand and consequential loss of interest 3 3.473 Irregular allowance of concessional rate of tax 2 1.544 Other irregularities 237 36.44
Total 243 158.21Motor Vehicle Tax
1 Miscellaneous irregularities 72 -Total 72 -Stamp Duty and Registration Fee and State Excise, Entertainment & luxury tax
1 Short levy of stamp duty and registration fees due to consideration of incorrect category of locality
2 0.36
2 Other Irregularities 142 5.60Total 144 5.96Grand Total 459 164.17

Audit Report No. 5 – Revenue and Social & Economic Sectors (PSUs) for the year ended 31 March 2016
8
During the course of the year, audit pointed out instances of short/non levy of revenue amounting to ` 164.17 crore out of which the concerned Departments accepted under assessment and other deficiencies of ` 7.02 crore and recovered an amount of ` one lakh which were pointed out in audit during 2015-16.
1.1.10 Coverage of the Revenue Chapter
This chapter contains four paragraphs involving financial effect of ̀ 122.97 crore. The Departments have accepted audit observations involving ` 7.02 crore out of which ` one lakh had been recovered. The paragraphs were forwarded to the Government, their reply was awaited (November 2016).
1.2 System for collection of arrears of revenue
The amount of arrears in Department of Trade and Taxes increased by 31 per cent from ` 15,249.16 crore at the start of 2012-13 to ` 20,039.34 crore at the end of 2014-15. The recovery process in Department of Trade and Taxes and Department of Excise, Entertainment and Luxury Tax was not initiated in pending demand cases, implying inherent system deficiencies and weak internal checks. Improper reflection of payments and system designing flaws resulted in non-recovery of demands. Refund of ` 80.53 lakh was allowed in Value Added Tax, though the registrations of the dealers were cancelled. The Demand and Collection Register was not properly maintained in Department of Excise, Entertainment and Luxury Tax to watch the payment and arrears of revenue.
1.2.1 Introduction
The major source of revenue of the Government of NCT of Delhi is levy and collection of tax on sale of goods and liquor, entertainment programmes and luxuries provided in hotels. The Department of Trade and Taxes (DTT) is responsible for collection of Value Added Tax (VAT) for local sale and Central Sales Tax (CST) for interstate sale. The Department of Excise, Entertainment and Luxury Tax (DEELT) is responsible for collection of State excise, taxes on cinema shows, entertainment programmes, cable and DTH services, hotels, banquet halls, gym/spa owners, bets and stakes placed on horse races. During the year 2014-15, these two Departments contributed 84 per cent of the total tax revenue collected by the government with VAT having a share of 69 per cent and DEELT 15 per cent.
The regular tax and additional demand not paid by the assessees constitute arrears of revenue. In DTT, any demand which remains unpaid, shall be recoverable as arrears of land revenue (ALR) under the DVAT Act. In DEELT, any unpaid amount shall be recoverable as ALR under Delhi Excise Act, whereas the Delhi Entertainments and Betting Tax (DEBT) Act and the Delhi Tax on Luxuries (DTL) Act provides for recovery of pending dues as ALR.

Chapter-I : Revenue Sector
9
An audit was conducted of the Departments of Trade & Taxes (DTT) and Excise, Entertainment and Luxury Tax (DEELT) during April 2016 to August 2016 to assess the effectiveness of the system of collection of arrears in the departments. In DTT, audit selected 10,990 cases, assessed during 2012-13 to 2014-15 with revenue implication of ` 9,612.18 crore, using the criteria of demand of more than ` 10 lakh. In Luxury Tax branch, audit selected 734 cases, where demand was above ` 10,000, involving revenue implication of ` 36.86 crore, assessed during 2012-13 to 2014-15, while in case of Excise, Entertainment and Betting Tax branch, the entire data available in the system and records made available was audited.
1.2.1.1 Trend of arrears
The year wise details of consolidated arrears of revenue for the period 2012-13 to 2014-15 were not furnished to audit by DEELT. However, in DTT, the amount of arrears indicates an increasing trend from 2012-13 to 2013-14, though it decreased marginally in 2014-15. The year-wise details of arrears of revenue are given in Table 1.2.1 below.
Table 1.2.1: Trend of arrears of VAT and CST(` in crore)
YearOpening Balance
Additions during the year
Recovery made/reduced during the year
Closing Balance
2012-13 15,249.16 2,700.00 1,727.86 16,221.30
2013-14 16,221.30 6,605.08 1,029.28 21,797.10
2014-15 21,797.10 8,260.75 10,018.51 20,039.34
Source: Department of Trade & Taxes
Audit findings
(i) Value Added Tax (VAT)
1.2.2 Non-initiating of recovery process against the defaulting dealers
Section 43(3) of DVAT Act provides that any amount of tax, interest or penalty, composition money or other amount due under this Act which remains unpaid, shall be recoverable as arrears of land revenue. Further, Section 43(6) provides that the Commissioner may serve a ‘recovery certificate’ upon the dealer specifying the amount of such tax, interest or penalty, composition money or other amount due from him. Section 74(1) of DVAT Act provides that any person who is dis-satisfied with an assessment, or any other order or decision made under this Act, may make an objection against such assessment, or order or decision, as the case may be, to the Commissioner. Under Section 74(4), such objection can be filed within two months of the date of service of the assessment, or order or decision, as the case may be. Test check of 68 demand cases of Ward-63 with revenue implication of ` 17.66 crore revealed that the concerned dealers neither paid the demand nor filed objections against the assessment orders within the stipulated

Audit Report No. 5 – Revenue and Social & Economic Sectors (PSUs) for the year ended 31 March 2016
10
time. Therefore, the recovery proceedings were not initiated by the Department against the defaulting dealers, resulting in non-realisation of revenue of ` 17.66 crore.
1.2.3 Lack of data authenticity
Section 36 of DVAT Act, Rule 31 of DVAT Rules and Rule 10C of CST (Delhi) Rules stipulates payment of tax, interest, penalty or any other amount due under the DVAT and CST Act. The dealer has the option to make the payment through challans or in electronic form against the demand raised. The computerised DVAT system has been designed to reflect all such payments, including regular payment of VAT, CST made by a dealer, in his ‘Dealer Profile’ report. In Demand Collection Register (DCR), the amount paid is reflected against the demand amount and the ‘Reconciliation’ module of the system also reflects the payments. Audit observed the following.
(i) Test check of 190 cases revealed that in 99 cases, demand of ` 36.06 crore was shown as paid by the dealers in DCR Report and ‘Reconciliation’ module while they were not reflected in the ‘Dealer Profile’ of the assessees for the particular year. Further, scrutiny of Reconciliation module revealed that the date of payment by the dealer predates date of demand notice, which is not possible.
(ii) Scrutiny of records relating to refund adjustment in DVAT system revealed that in 86 cases, demand of ` 64.99 crore was raised during 2012-13 to 2014-15 and were adjusted against the refunds claimed by the dealers and shown accordingly in DCR Report of the system. However, audit verification revealed that in 54 out of 86 cases, demand of ` 57.98 crore was adjusted against refunds of equal amount while refund was not available to any of the dealers as per the individual ‘Dealer Profile’.
Thus, lack of data authenticity coupled with inadequate monitoring, cross checking and reconciliation of details in arrear cases with revenue implication of ` 94.04 crore may potentially result in loss of revenue.
1.2.4 Injudicious release of refunds to the cancelled dealers without determining tax liabilities
Section 38(2) of DVAT Act, 2004 stipulates that ‘before making any refund, the Commissioner shall first apply such excess towards the recovery of any other amount due under this Act, or under the CST Act, 1956’.
Test check of selected cases revealed that refund of ` 80.53 lakh was allowed (April 2011 to April 2014) in 39 cases though the registration of the dealers had been cancelled between November 2009 and April 2013. Thereafter, assessment of these dealers was conducted during the year 2014-15 and total demand of ` 1.89 crore was raised, which remained unpaid (October 2016). Audit observed
Chapter-I : Revenue Sector
11
that refund had been allowed without ensuring that all dues have been paid. This resulted in revenue loss of ` 1.89 crore.
1.2.5 Non-recovery of interest on delayed payment of demands
Section 42(2) of DVAT Act stipulates that ‘when a person is in default in making payment of any tax, penalty or other amount due under this Act, he shall be liable to pay simple interest at an annual rate of 15 per cent, from the date of such default till the date of payment.
Analysis of the “Payment Module” of DVAT system revealed that in three2 demand cases, the dealers deposited the amount after the expiry of due date with delay ranging between 35 days to over three years but the department did not impose interest of ` 73.26 lakh on account of such delay.
On being pointed out, the Department replied (September 2016) that recovery of ` 0.92 lakh has been made in one case.
1.2.6 Under-utilisation of Recovery Branch
The DTT in its circular dated 29 August 2007 allocated the following works to Recovery Branch (RB): (i) to deal with the recovery cases prior to assessment year 1992-93, (ii) setting up of targets for all wards at the beginning of each financial year, (iii) to compile weekly and monthly ward-wise recovery report, (iv) to inform the liquidator appointed by various courts about the dues of the department after obtaining information from all the zones of the department, and (v) to deal with the court cases related to Recovery Branch.
Audit noted the following-
(i) Recovery Branch had neither set up targets for the wards at the beginning of each financial year nor compiled weekly and monthly ward wise recovery report. Further, RB does not have access to the database of the dealers against whom demands are pending and cases where the dealers have filed objections against the assessment orders passed by the Assessing Authorities; and
(ii) RB is only handling dealers having individual demand of more than ` 10 crore, which pertains to only 160 dealers out of total of 3.19 lakh dealers as on 31 January 2015. In respect of the cases having demand amount of less than ` 10 crore, the ward officers and zonal in-charge are competent to take action against the defaulting dealers.
Thus, the Recovery Branch was not fully performing the functions for which it was setup. This resulted in ineffective monitoring of pending demand cases and non-initiation of recovery proceedings against defaulting dealers.
2 (i)TIN- 07310197454, (ii) TIN- 07550236704, (iii) TIN- 07570184216.

Audit Report No. 5 – Revenue and Social & Economic Sectors (PSUs) for the year ended 31 March 2016
12
(ii) Department of Excise, Entertainment and Luxury Tax
Excise Supply Chain Information Management System (ESCIMS) was introduced in December, 2013, for streamlining the revenue collection process for excise, luxury and entertainment tax collection and reconciliation, submission of excise, luxury and entertainment tax returns as well as inbuilt facilities for registration and tracking of grievances. The complete database for the year 2012-13 and 2013-14 was not made available to audit, however, analysis of the database for the year 2014-15 and scrutiny of records furnished to audit revealed the following:
Excise Branch
1.2.7 Non-recovery of outstanding dues from the defaulters
Section 29(1) of the Delhi Excise Act, 2009 provides that all excise revenue, payable to the Government under this Act, may be recovered from the person liable to pay the same or his legal successor or from his surety or his agent as if they were the arrears of land revenue (ALR). Further, any violation of the terms and conditions of grant of license attracts penalty.
Audit noted that in 38 cases of penalty and miscellaneous payment orders issued during 2014-15, the licensees had not paid the outstanding dues of ` 12.91 lakh. However, no action was taken by the Department to recover the same under the Section 29 of the Delhi Excise Act, even after the lapse of more than one year. The Department stated (October 2016) that recovery notices have now been issued to concerned licensee for pending payments.
Entertainment and Betting Tax Branch
1.2.8 Non-imposition of penalty for failure to file returns
The Delhi Entertainment and Betting Tax Act, 1996 (DEBT Act) provides that proprietors of entertainment should pay their dues as per timelines and submit their returns. The tax/return is required to be furnished monthly by hotel/restaurant with cable/ Direct to Home (DTH) connection; Multi Service Operator (MSO)/DTH operators; cable TV operators and weekly for cinema halls; video games parlours and amusement parks/fun parks. Section 33 of DEBT Act stipulates imposition of penalty not exceeding two thousand rupees per default for any failure to comply with the provisions of this Act.
Audit noted that during the period 2014-15, there were 751 assesses3 of Entertainment Tax who had defaulted in filing the return for varying periods. However, the department took no action to impose penalty as stipulated in the Act. At the maximum rate provided in the Act for not filing return, the amount of penalty works out to ̀ 1.75 crore under Section 33 of DEBT Act was also payable.
3 604 hotels/restaurants with cable/DTH connection, 21 MSO/ DTH operators, 58 cable TV operators, 45 cinema halls, 11 amusement parks/fun parks and 12 video games parlours.
Chapter-I : Revenue Sector
13
Luxury Tax Branch
1.2.9 Non-assessment of assesses who failed to file return and pay tax
Section 12(1) of Delhi Tax on Luxuries Act, 1996, (DTL Act), provides that every registered proprietor shall furnish returns for such period, by such dates, and to such authority, as may be prescribed : provided that, the Commissioner may, subject to such terms and conditions as may be prescribed, exempt any such proprietor from furnishing such returns or permit any such proprietor: (a) to furnish them for such different period; or (b) to furnish a consolidated return relating to all or any of the places of business of the proprietor in the National Capital Territory of Delhi for such period, or for such different periods, to such authority, as he may direct. Section 13(1) provides that the amount of tax due from a proprietor liable to pay tax shall be assessed separately for each year during which he is liable; provided that, the Commissioner may, subject to such conditions as may be prescribed, assess the tax due from any proprietor during a part of a year.
Audit noted the following:
(a) During 2014-15, there were 606 assesses of Luxury Tax who had not filed the returns/paid the tax. Further scrutiny revealed that 539 assesses had defaulted in filing their returns while 67 assesses defaulted in paying their full tax. However the department did not levy penalty under Section 16 of the DTL Act which is equal to the tax due. In the absence of data on the returns and tax due, audit could not calculate the tax liability of these defaulters and penalty likely to be imposed. The Department stated (October 2016) that notices are being sent to the defaulters who failed to file return/pay tax within the stipulated time period for producing documents on the basis of which assessments would be done.
(b) As per the Demand Collection Register (DCR), demand of ` 8.42 crore was pending even after a lapse of one to four years in 244 cases though it was to be deposited within the date specified in the demand notice which is normally 30 days. However, no action had been taken under Section 18(5)/Section 21 of the DTL Act, 1996 to recover the same. The Department stated (October 2016) that recovery proceedings have been initiated against the defaulters and recovery certificates have been issued in 85 cases. The process of issuing recovery certificates in rest of the cases is going on.
(c) Section 16(2) of the DTL Act envisages that a person is liable to pay simple interest at the rate of two per cent of the tax for each month if he fails to make the payment within the stipulated time. In 191 cases, the assessees deposited the demand of tax with delay ranging between one day to over three years. However, the department had not levied any interest for delayed deposit. This resulted in non-levy of interest of ` 6.47 lakh.

Audit Report No. 5 – Revenue and Social & Economic Sectors (PSUs) for the year ended 31 March 2016
14
(d) In nine cases, the assessment was complete (between April 2012 and March 2015) creating additional demand of ` 98.90 lakh against which the assesses had paid only ` 43.31 lakh. This resulted in short realisation of ` 55.59 lakh. In addition, interest was also leviable. The Department stated (October 2016) that the recovery proceedings have been initiated and recovery certificates are being issued.
(e) As per the Section 13(5) of DTL Act, all remand cases are to be re-assessed by the Assessing Authorities (AA) within one year from the date of receipt of order of the Appellate Authority. Audit noted the following-
(i) 123 cases involving ` 22.08 crore were remanded back to the AA during April 2011 to August 2015 for re-assessment. Of this, 32 cases involving amount of ` 3.04 crore were not available. In the absence of files relating to remand back cases, audit could not ascertain the status of re-assessment. The Department stated (October 2016) that in cases which were remanded back by the appellate authority for re-assessment, the files of five cases involving ` 2.62 lakh have been located and found that re-assessment orders have been issued. Efforts are being made to locate other files also.
(ii) In 35 cases involving ` 47.64 lakh, demand letters were issued on the basis of re-assessment between February 2012 and February 2016 after being remanded back by the Appellate Authority. However, the assesses are yet to pay the demand amount though the date specified in the demand notice has lapsed and the cases were not sent to Collector for recovery as land revenue as required under section 18(5) of the DTL Act. The Department stated (October 2016) that recovery proceedings had been initiated and recovery certificates issued.
(iii) The Appellate Authority had dismissed appeals filed by assesses in 18 cases during April 2013 to September 2015 and upheld demand of ` 74.36 lakh created by the AAs. However, payment of only ` 6.97 lakh in respect of six cases has been received and luxury tax of ` 67.39 lakh in respect of remaining 12 cases was outstanding. The department had not taken any action to refer the cases for recovery as land revenue. The Department stated (October 2016) that recovery proceedings had been initiated and recovery certificates issued.
1.2.10 Ineffective system of monitoring of arrears
(a) Non-maintenance of records to watch the arrears
For monitoring of arrears, centralised up-to-date database showing assessee-wise detail of outstanding amount in the beginning of year, addition, recovery during the year and outstanding amount at the end of the year is required to be maintained. Audit noted that there is no system of maintaining a consolidated database of arrears to watch position of arrears of revenue. The Commissioner, DEELT stated (May 2016) that w.e.f. December 2013, a new computerised system has been

Chapter-I : Revenue Sector
15
introduced and the data relating to arrears of revenue has been migrated from old system, but it could not be integrated completely in new system so far.
The Department stated (October 2016) that in Luxury Tax branch, a system has been developed to watch demand, collection and revenue of an assessee with effect from the current financial year and in respect of Entertainment Tax branch, a register regarding demand and collection has been prepared on the basis of available records with effect from April 2011.
(b) Maintenance of Demand and Collection Register
Audit noted that Excise, Entertainment and Betting Tax branches did not maintain the DCR to watch the arrears due from the defaulters. In the DCR for 2012-13 and 2013-14 of Luxury Tax branch, demand was not entered for 17 cases involving ` 114.97 lakh while in the DCR for 2014-15, the date of service of assessment order, due date of payment, payment made and actual date of payment were not found entered in almost all cases. In absence of this, Audit could not ascertain total dues recoverable from the assesses.
The Department stated (October 2016) that in respect of Luxury Tax branch, the online system of DCR to monitor demands and payments of the assesses has been implemented with effect from 01 April 2016 and updating of data base for DCR of previous years (2011-12 to 2015-16) has been undertaken. In respect of Entertainment Tax, it was stated that a register regarding demand and collection has been prepared on the basis of available records. Further, Restaurant branch (State Excise) intimated (October 2016) that it is working to monitor the penalty/miscellaneous payment imposed on the licensee more efficiently in future.
1.2.11 Excise Supply Chain Information Management System (ESCIMS)
The computerised ESCIMS was introduced by the DEELT with the objective of digitization and streamlining the complete process of revenue collection. The system was intended to assist the Department in conducting assessment, keeping a track of revenue collection and dues recoverable from the assesses. However, analysis of the database of ESCIMS revealed system deficiencies as detailed below.
(a) The ESCIMS has a module for regular assessment as well as for assessment of defaulter licensees. The Luxury Tax and the Entertainment and Betting Tax branches did not utilise this module and continued with the manual system of assessment. The Department stated (October 2016) that in respect of Luxury Tax, assessment module is now functional and assessments in the current financial year are being done through online assessment module.
(b) Data analysis of DCR in respect of Luxury Tax revealed that input controls intended to ensure data integrity were absent in the application as:

Audit Report No. 5 – Revenue and Social & Economic Sectors (PSUs) for the year ended 31 March 2016
16
• in 56 out of 252 assessment cases for the period 2012-13, where tax/interest/penalty payable was above ̀ 10,000, the payment made by assesses against assessment was not shown in specifically designed “Luxury Tax Assessment Ledger”;
• dates of assessment orders and their serving to the assesses were not shown in the database in 237 and 36 cases pertaining to years 2012-13 and 2013-14 respectively;
• in 507 and 397 cases pertaining to years 2012-13 and 2013-14 respectively, the sum of tax, penalty and interest do not tally with the total dues reflected in the data;
• in 336 and 296 cases pertaining to years 2012-13 and 2013-14 respectively, the difference between total tax due and actual tax paid, does not tally with balance amount payable as shown in the data; and
• in a number of cases, the same tax period was repetitively shown against several payment transactions, having different dates.
The Department stated (October 2016) that the matter of streamlining the Luxury Tax Module of ESCIMS is being taken up with M/s Tata Consultancy Services (TCS) on the issues raised by the audit.
(c) Database for the period 2012-13 to 2014-15 in respect of Entertainment and Betting Tax Branch revealed that in most of the cases, the period for which the payment was made by the assesses was not mentioned due to which the authenticity of payments made could not be verified in audit. The Department stated (October 2016) that the system is not reflecting the data properly and efforts are being made to obtain the requisite information from the concerned licensees and in case of any mismatch/non-payment/delayed payment, action will be taken to recover the tax due along with interest and penalty.
(d) As per Schedule-III of the Master Service Agreement of ESCIMS between DEELT and TCS, there is a provision for six-monthly audit by the Project Director, during the Project Implementation Phase and thereafter during the Operation Management Phase. However, audit noted that no such audit was conducted. The Department stated (August 2016) that audit report could not be completed as National Institute for Smart Government-Project Monitoring Unit team left the department on account of completion of its tenure, however, the Department is taking appropriate action for auditing the ESCIMS project. It assured that the audit report will be furnished after the requisite audit process is completed.
1.2.12 Conclusion
Thus, non-enforcement of the provisions in the Acts for recovery of government revenues as arrears of land revenue resulted in increase in arrears from ` 15,249.16 crore at the start of 2012-13 to ` 20,039.34 crore at the end of

Chapter-I : Revenue Sector
17
2014-15. In DTT, absence of a system of verification of payment data and refunds, coupled with flaws in system design led to incorrect depiction of adjustment of demands which are still outstanding. The DTT allowed refunds to the cancelled dealers without ascertaining their tax liabilities. The cancellation of registration and non-initiation of recovery process against these dealers further reduce the possibility of realisation of the outstanding dues. The scope of functioning of Recovery Branch was severely restricted as it did not have access to the complete database of all outstanding demand cases. In DEELT, the assessment of defaulters was not conducted to determine the tax liabilities in Entertainment and Luxury Tax Branch. Demand and Collection Registers had not been prepared by the Excise and Entertainment Tax Branches whereas in Luxury Tax Branch, it was not maintained properly which adversely affected the monitoring of the outstanding dues. There were system deficiencies in ESCIMS which resulted in non-achievement of desired level of effective tax administration.
1.3 Irregular allowance of concessional rate of Tax
Irregular allowance of concessional rate of tax on Forms ‘C’ by two assessees resulted in short levy of tax of ` 0.58 crore. In addition, interest of ` 0.39 crore and penalty of ` 0.57 crore were also leviable.
As per Section 8(1) of the CST Act, 1956, every dealer, who in the course of inter-state trade or commerce, sells to a registered dealer, shall be liable to pay tax at the rate of two per-cent of his turnover or at the rate applicable to the sale or purchase of such goods inside the appropriate State under the sales tax law of that State, whichever is lower. Section 8(4) of the CST Act, 1956, provided that a dealer furnishes to the prescribed authority a declaration in Forms ‘C’ duly filled and signed by the registered dealer to whom the goods are sold containing the prescribed particulars in the prescribed manner. Further, Section 86(15) of DVAT Act, 2004 stipulates that the dealer shall be liable to pay, by way of penalty, a sum of one lakh rupees or the amount of the tax deficiency, if any, whichever is greater. Interest shall also be payable under Section 42(2) of the DVAT Act for default in making the payment of any amount.
(i) Audit scrutiny of records of Ward-93 revealed that assessment of a dealer4 for the year 2011-12 was completed in September 2013 at turnover of ` 2.90 crore. This included inter-state sale of ` 2.66 crore against Forms ‘C’. Audit scrutiny revealed that concessional sale of ` 1.46 crore was allowed on two Forms ‘C’ which were not in the name of the selling dealer. This resulted in irregular allowance of concessional sale of ̀ 1.46 crore involving tax effect of ̀ 4.39 lakh. In addition, interest of ` 2.69 lakh and penalty of ` 4.39 lakh were also leviable.
4 TIN 07660103996

Audit Report No. 5 – Revenue and Social & Economic Sectors (PSUs) for the year ended 31 March 2016
18
(ii) Scrutiny of assessment records relating to Ward 201 revealed that a dealer5 filed returns for the assessment year 2011-12 declaring Gross Turnover of ` 43.19 crore including inter-state sale of ` 20.26 crore against Forms ‘C’. Out of ` 20.26 crore, the dealer claimed and was allowed (April 2014) concessional rate of tax on inter-state sale of ` 5.18 crore against six Forms ‘C’ received from registered dealers of the States of Manipur and Nagaland. These Forms were cross verified from the issuing states and it was found that excess inter-state sale of ` 2.44 crore (` 2.54 crore– ̀ 0.10 crore) was claimed by the assessee in respect of four Forms ‘C’ while the remaining two Forms involving sale of ` 2.64 crore were not issued to the purchasing dealer. This resulted in irregular allowance of concession of ` 0.53 crore. In addition, interest of ` 0.36 crore and penalty of ` 0.53 crore were also leviable.
On being pointed out, the department stated in September 2016/October 2016 that for (i) the action of re-assessment is under process and for (ii) the assessment of the dealer has been completed regarding evasion of tax in the year 2011-12 and a demand of ` 0.93 crore including interest of ` 40.03 lakh and penalty of ` 0.53 crore has been created against the dealer.
The matter was reported to the Government in July 2016; their reply was awaited (November 2016).
1.4 Non-recovery of demand and consequential loss of interest
The Department failed to recover demand of ` 2.84 crore from the dealers whose registration had been cancelled. It also resulted in loss of interest of ` 0.38 crore.
Section 22(9) of DVAT Act 2004, states that the cancellation of registration shall not affect the liability of any person to pay tax due for any period and unpaid as on the date of such cancellation or which is assessed thereafter notwithstanding that he is not otherwise liable to pay tax under this Act.
Audit scrutiny of the records of two wards6 for the years 2010-11 to 2013-14 revealed that the assessment of three dealers was completed under Sections 32 and 33 of the DVAT Act 2004 and Section 9(2)7 of the CST Act between February 2013 and June 2015 creating an additional demand of ` 2.84 crore (tax ` 0.81 crore; interest ` 0.32 crore and penalty ` 1.71 crore) though their registration had been cancelled by the department.
Further, it was noticed that the demand is still pending even after lapse of 15 months to four years which also resulted in loss of interest of ` 0.38 crore.
5 TIN 072803451536 Ward: 4 and 67.7 The notice of assessment of penalty under section 9(2) of CST Act and liability to pay penalty under Section 86(9) of DVAT Act, 2004.

Chapter-I : Revenue Sector
19
On being pointed out (June to August 2016), the Department in its reply stated that the recovery proceedings have been initiated against the above dealers and notices have been issued.
The matter was reported to the Government in August 2016; their reply was awaited (November 2016).
Department of Revenue
1.5 Short levy of stamp duty and registration fees
Incorrect categorisation of locality by the Sub-Registrar offices resulted in short levy of stamp duty and registration fee of ` 36.44 lakh.
GNCTD notified (December 2012) revised minimum circle rates for valuation of land and immovable properties. Localities in Delhi were categorised from ‘A’ to ‘H’ and minimum rates were prescribed for each category.
Test check of the records of two Sub-Registrar offices8, for the year 2014-15, revealed incorrect categorisation of localities by the registering authorities in 31 cases resulting in application of lower circle rates and consequent short levy of stamp duty and registration fee of ` 36.44 lakh.
On being pointed out, the Department provided (June 2016) the list of category of revenue villages as per circle rate notification which confirms incorrect consideration of category of locality undertaken by the department.
The matter was reported to the Government in July 2016; their reply was awaited (November 2016).
8 SR-I (Kashmere Gate), SR-IX (Kapashera).


Chapter-I : Revenue Sector
21
Chapter II Public Sector Undertakings


Chapter-II : Public Sector Undertakings
21
Chapter - II
Public Sector Undertakings
2.1 Functioning of State Public Sector Undertakings
2.1.1 Introduction
State Public Sector Undertakings (PSUs) are established to carry out activities of commercial nature and occupy an important place in the State’s economy. As on 31 March 2016, there were 17 PSUs, all working, in NCT of Delhi. Of these, no company was listed on the stock exchange(s). During the year 2015-16, no PSU was incorporated or closed down. The details of the State PSUs in NCT of Delhi as on 31 March 2016 are given in Table 2.1.1 below:
Table 2.1.1: Total number of PSUs as on 31 March 20161
Type of PSUs Working PSUs Total
Government Companies1 15 15
Statutory Corporations 2 2
Total 17 17
The PSUs registered a turnover of ` 8,597.77 crore as per their latest finalised accounts as of 30 September 2016 which was equal to 1.54 per cent of State’s Gross Domestic Product (GDP) for the year. Twelve PSUs earned profit of ` 1,177.81 crore and four PSUs incurred loss of ` 2,917.77 crore. Thus, the aggregate loss incurred by PSUs was ` 1,739.96 crore as per their latest finalised accounts as of 30 September 2016. These PSUs had 0.36 lakh employees as at the end of March 2016.
2.1.2 Accountability framework
Audit of Government Companies is governed by Section 143(6) of the Companies Act, 2013 (Act). According to Section 2(45) of the Act, a Government company is one in which not less than 51 per cent of the paid up capital is held by Government(s) and includes a subsidiary company of a Government company. Further, as per Section 143(7) of the Act, in case of any other company owned or controlled, directly or indirectly, by the Central Government, or by any State Government or Governments or partly by Central Government and partly by one or more State Governments, the Comptroller and Auditor General of India (CAG), may, by an order, cause test audit to be conducted of the accounts of such Company and provisions of Section 19A of the Comptroller and Auditor General’s (Duties, Powers and Conditions of Service) Act, 1971, shall apply to such test audit. Audit of the financial statements in respect of the financial years that commenced earlier than 01 April 2014 shall continue to be governed by the provisions of the Companies Act, 1956.1Non- working PSUs are those which have ceased to carry on their operations.

Audit Report No. 5 – Revenue and Social & Economic Sectors (PSUs) for the year ended 31 March 2016
22
2.1.3 Statutory Audit
The financial statements of the Government companies (as defined in Section 2(45) of the Companies Act, 2013) are audited by statutory auditors who are appointed by the CAG as per the provisions of Section 139(5) or (7) of the Companies Act, 2013. As per provisions of Section 143(6) of the Act ibid, these financial statements are also subject to supplementary audit to be conducted by CAG within sixty days from the date of receipt of the audit report under Section 143(5). The comments given by the CAG upon, or supplement to, the audit report shall be sent by the company to every person entitled to audited financial statements under sub section (1) of section 136 of the Companies Act and also be placed before the annual general meeting of the company under section 143(6)(b).
Audit of statutory corporations is governed by their respective legislations. CAG is the sole auditor for Delhi Transport Corporation. Audit of Delhi Financial Corporation is conducted by chartered accountants and supplementary audit by CAG.
2.1.4 Role of Government and Legislature
The State Government exercises control over the affairs of these PSUs through its administrative departments. The Chief Executive and Directors to the Board are appointed by the Government.
The State Legislature also monitors the accounting and utilisation of Government investment in the PSUs. For this purpose, the Annual Reports together with the Statutory Auditors’ Reports and comments of the CAG in respect of State Government companies and Separate Audit Report in case of statutory corporation are to be placed before the Legislature within three months of their finalisation or as stipulated in the respective Acts. The Audit Reports of CAG are submitted to the Government under Section 19A of the CAG’s (Duties, Powers and Conditions of Service) Act, 1971.
2.1.5 Stake of Government of NCT of Delhi
The GNCTD has substantial financial stake in these PSUs. This stake is of mainly three types:
• Share Capital and Loans- In addition to the share capital contribution, GNCTD also provides financial assistance by way of loans to the PSUs from time to time.
• Special Financial Support- GNCTD provides budgetary support by way of grants and subsidies to the PSUs as and when required.
• Guarantees- GNCTD also guarantee the repayment of loans with interest availed by the PSUs from Financial Institutions.

Chapter-II : Public Sector Undertakings
23
2.1.6 Investment in State PSUs
As on 31 March 2016, the investment (capital and long-term loans) in 17 PSUs was ` 27,289.04 crore as given in Table 2.1.2 below:
Table 2.1.2: Total investment in PSUs(` in crore)
Type of
PSUs
Government Companies Statutory CorporationsGrand TotalCapital
Long Term Loans
Total CapitalLong Term
LoansTotal
PSUs 7,607.72 5,947.91 13,555.63 2,010.27 11,723.14 13,733.41 27,289.04
Source: Information collected from PSUs
As on 31 March 2016, total investment consisted of 35.24 per cent towards capital and 64.76 per cent in long-term loans. The investment has decreased by 2.37 per cent from ` 27,951.87 crore in 2011-12 to ` 27,289.04 crore in 2015-16 as shown in chart 2.1.1 below:
Chart 2.1.1: Total investment in PSUs
The investment in four significant sectors and percentage thereof at the end of 31 March 2012 and 31 March 2016 are indicated in chart 2.1.2 below.
Chart 2.1.2: Sector wise investment in PSUs
(Figure in brackets show the percentage of sectoral investment to total investment)

Audit Report No. 5 – Revenue and Social & Economic Sectors (PSUs) for the year ended 31 March 2016
24
The thrust of PSU investment was mainly in the transport and power sectors. The investment in Power sector decreased from 50.78 per cent of total investment in 2011-12 to 48.84 per cent of total investment in 2015-16. The share of transport sector in total investments increased from 48.34 per cent in 2011-12 to 50.35 per cent in 2015-16.
2.1.7 Special support and returns during the year
The GNCTD provides financial support to PSUs in various forms through the annual budget. The summarised details of budgetary outgo towards equity, loans and grants/ subsidies in respect of State PSUs are given in Table 2.1.3 below for three years ended 2015-16:
Table 2.1.3: Details regarding budgetary support to PSUs(` in crore)
Sl. No.
Particulars
2013-14 2014-15 2015-16
No. of PSUs
AmountNo. of PSUs
AmountNo. of PSUs
Amount
1. Equity Capital outgo from budget
- - - - - -
2. Loans given from budget 5 3,639.39 2 200.00 3 565.00
3. Grants/Subsidy from budget 4 1,455.14 6 1,603.35 4 1,339.41
Total Outgo (1+2+3) 8 5,094.53 7 1,803.35 6 1,904.41
Source: Information collected from PSUs
2.1.8 Reconciliation with Finance Accounts
The figures in respect of equity and loans outstanding as per records of State PSUs should agree with that of the figures appearing in the Finance Accounts of the State. In case the figures do not agree, the concerned PSUs and the Finance Department should carry out reconciliation of differences. The position in this regard as at 31 March 2016 is given in Table 2.1.4 below:
Table 2.1.4: Equity and loans outstanding as per finance accounts vis-à-vis records of PSUs23
(` in crore)
Outstanding in respect of
Amount as per Finance Accounts
Amount as per records of PSUs*
Difference
Equity2 9,182.58 9,197.70 15.12
Loans3 17,559.27 15,453.94 2,105.33
*Source: Information collected from PSUs
2Equity figure consists of the share of GNCTD only.3Figures of Loan were taken from the records of companies and matched with the information sourced from PAOs.

Chapter-II : Public Sector Undertakings
25
Audit observed that differences occurred in respect of 12 PSUs4 and some of the differences were pending reconciliation since 2008. The Government and the PSUs should take concrete steps to reconcile the differences in a time-bound manner.
2.1.9 Arrears in finalisation of accounts
The financial statements of companies for every financial year are required to be finalised within six months from the end of the relevant financial year i.e. by September end, in accordance with Section 96(1) read with Section 129(2) of the Companies Act, 2013. Failure to do so may attract penal provisions under Section 99 of the Act ibid. Similarly, in case of statutory corporations, their accounts are finalised, audited and presented to the Legislature as per the provisions of their respective Acts.
Table 2.1.5 below provides the details of progress made by PSUs in finalisation of accounts as of 30 September 2016:
Table 2.1.5: Position relating to finalisation of accounts of PSUs
Sl.No. Particulars 2011-12 2012-13 2013-14 2014-15 2015-16
1. Number of PSUs 17 17 17 17 17
2. Number of accounts finalised during the year
12 21 15 9 12
3. Number of accounts in arrears 16 12 14 22 27
4. Number of PSUs with arrears in accounts
8 3 4 11 14
5. Extent of arrears (numbers in years)
1 to 9 1 to 9 1 to 10 1 to 11 1 to 12
PSUs having arrears of accounts need to take effective measures for early clearance of backlog and to make the accounts up-to-date. Towards this end, the PSUs should ensure that at least one year’s accounts are finalised every year so as to restrict further accumulation of arrears.
The administrative departments have the responsibility to oversee the activities of these entities and to ensure that the accounts are finalised and adopted by these PSUs within the prescribed period. Though the Finance Department was informed periodically by the Accountant General (Audit), Delhi, of the arrears in finalisation of accounts, adequate remedial measures were not taken. As a result, the net worth of these PSUs could not be assessed in audit. The matter was also taken up with the Chief Secretary, Government of NCT of Delhi in June and November 2016.
4DSCFDC, DSIIDC, SRC, GDL, DTIDC, DTC for equity figures and DSCFDC, SRC, GDL, DPCL, DTL, IPGCL, PPCL, DSCSC, and DTTDC for loan figures
Audit Report No. 5 – Revenue and Social & Economic Sectors (PSUs) for the year ended 31 March 2016
26
The GNCTD had invested ` 2,072.42 crore in six PSUs {equity: ` 19.28 crore (one PSU), loans: ` 627.49 crore (four PSUs) and grants/subsidy ` 1,425.65 crore (four PSUs)} during the years for which accounts have not been finalised as detailed in Annexure 2.1(i). In the absence of finalisation of accounts and their subsequent audit, it could not be ensured whether the investments and expenditure incurred have been properly accounted for and whether the purpose for which the amount was invested was achieved or not. Thus, Government’s investment in such PSUs remained outside the control of State Legislature.
Further, delay in finalisation of accounts may result in risk of fraud and leakage of public money apart from violation of the provisions of the relevant statutes. In view of the above state of arrears of accounts, the actual contribution of PSUs to the State GDP for the year 2015-16 could not be ascertained and their contribution to State exchequer was also not reported to the State Legislature.
2.1.10 Performance of PSUs as per their latest finalised accounts
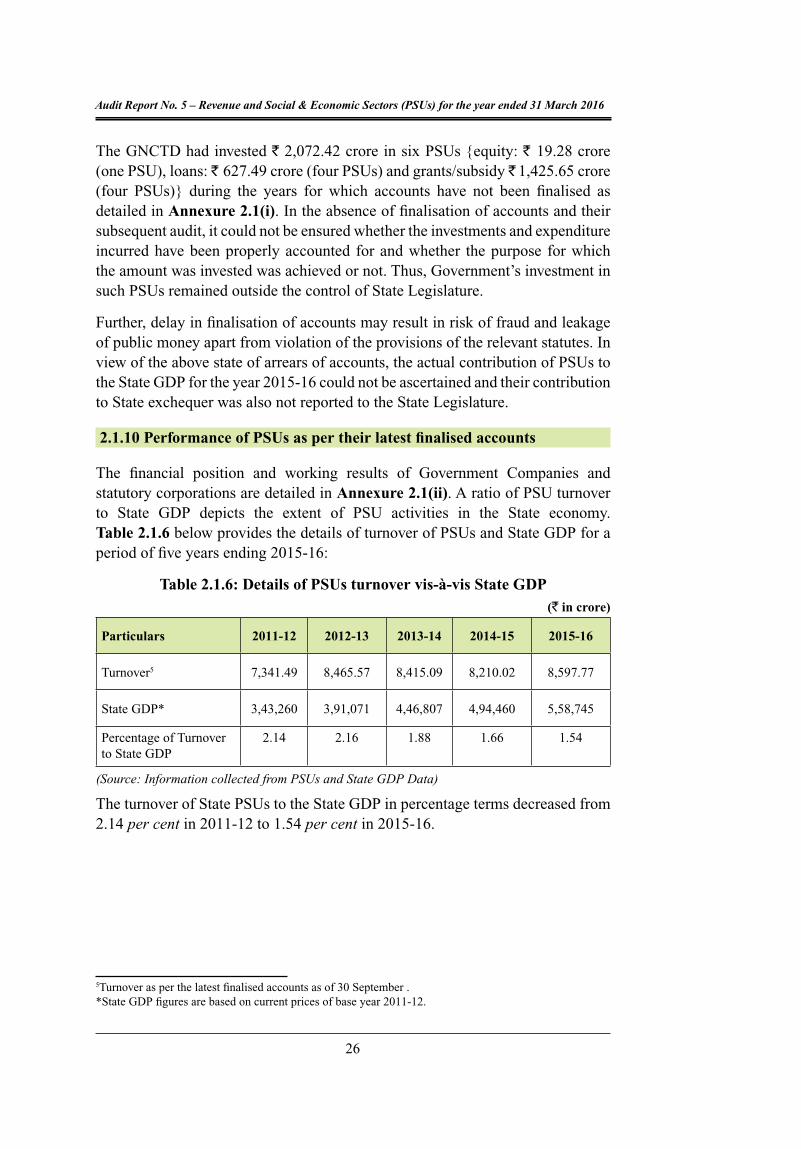
The financial position and working results of Government Companies and statutory corporations are detailed in Annexure 2.1(ii). A ratio of PSU turnover to State GDP depicts the extent of PSU activities in the State economy. Table 2.1.6 below provides the details of turnover of PSUs and State GDP for a period of five years ending 2015-16:
Table 2.1.6: Details of PSUs turnover vis-à-vis State GDP5*(` in crore)
Particulars 2011-12 2012-13 2013-14 2014-15 2015-16
Turnover5 7,341.49 8,465.57 8,415.09 8,210.02 8,597.77
State GDP* 3,43,260 3,91,071 4,46,807 4,94,460 5,58,745
Percentage of Turnover to State GDP
2.14 2.16 1.88 1.66 1.54
(Source: Information collected from PSUs and State GDP Data)
The turnover of State PSUs to the State GDP in percentage terms decreased from 2.14 per cent in 2011-12 to 1.54 per cent in 2015-16.
5Turnover as per the latest finalised accounts as of 30 September .*State GDP figures are based on current prices of base year 2011-12.

Chapter-II : Public Sector Undertakings
27
Overall losses incurred by PSUs during 2011-12 to 2015-16 are given in a chart 2.1.3 below:
Chart 2.1.3: Loss of PSUs
The summarized financial results of Government companies and statutory corporations for the latest year for which accounts were finalized are given in Annexure 2.1(ii). During the period from 01 October 2015 to 30 September 2016, out of 17 PSUs, 12 PSUs earned profit of ` 1,177.81 crore and four PSUs incurred loss of ` 2,917.77 crore. One PSU prepared its accounts on a ‘no profit no loss’ basis. The major contributors to profit were Pragati Power Corporation Limited (` 595.83 crore), Delhi Transco Limited (` 378.31 crore) and Delhi State Industrial and Infrastructure Development Corporation Limited (` 112.57 crore). Losses were incurred by Delhi Transport Corporation (` 2,917.76 crore).
Some other key parameters of PSUs are given in Table 2.1.7 below:
Table 2.1.7: Key Parameters of State PSUs6(` in crore)
Particulars 2011-12 2012-13 2013-14 2014-15 2015-16
Return on Capital Employed (Per cent)
10.45 17.41 5.21 12.90 8.30
Debt 19,071.18 18,426.18 18,900.86 18,052.64 17,976.39
Turnover6 7,341.49 8,465.57 8,415.09 8,210.02 8,597.77
Debt/ Turnover Ratio 2.60:1 2.18:1 2.25:1 2.20:1 2.09:1
Interest Payments 2,140.48 2,341.86 2,655.25 3,117.02 3,456.13
Accumulated Profits (losses) (15,519.42) (17,299.73) (19,507.97) (21,153.51) (23,255.91)
Source: As per latest finalised Annual Accounts of PSUs
The percentage of Return on Capital Employed showed an increasing trend during 2011-12 and 2012-13. Thereafter, it declined sharply in 2013-14, rose again to 12.90 per cent in 2014-15 before declining to 8.30 per cent in 2015-16. The ratio of debts to the turnover ratio which was 2.60:1 in 2011-12 decreased to 2.09:1 in 2015-16.
6Turnover of working PSUs as per the latest finalised accounts as of 30 September 2016.

Audit Report No. 5 – Revenue and Social & Economic Sectors (PSUs) for the year ended 31 March 2016
28
As per their latest finalised accounts, 12 PSUs earned an aggregate profit of ` 1,177.81 crore but only one PSU, namely Delhi State Civil Supplies Corporation Limited declared a dividend of ` 0.50 crore. The remaining 11 PSUs did not declare dividend despite earning profit of ̀ 1,169.25 crore. As of November 2016, the GNCTD had not formulated any policy for payment of minimum return on the paid up capital contributed by it.
2.1.11 Accounts Comments
Ten companies forwarded their 11 audited accounts to AG during the period from October 2015 to September 2016. All of these accounts were selected for supplementary audit. The audit reports of statutory auditors appointed by CAG and the supplementary audit of CAG indicate that the quality of maintenance of accounts needs to be improved substantially. The details of aggregate money value of comments of statutory auditors and CAG are given in Table 2.1.8 below:
Table 2.1.8: Impact of audit comments on Companies(` in crore)
Sl. No.
Particulars2013-14 2014-15 2015-16
No. of accounts
AmountNo. of
accountsAmount
No. of accounts
Amount
1. Decrease in profit 3 11.12 - - 6 359.42
2. Increase in profit 3 68.29 2 0.25 3 339.47
3. Decrease in loss - - - - - -
4. Increase in loss 1 554.82 1 2.59 - -
5. Non-disclosure of material facts
- - 1 3.15 1 57.43
6. Errors of classification 1 40.17 1 3.54 2 31.36
During the year, the Statutory Auditors had given unqualified certificates for four accounts7, qualified certificates for six accounts8 and adverse certificate (i.e., accounts do not reflect a true and fair position) for one account9. Qualifications by statutory auditors had the effect of decreasing the reported profit (` 45.22 crore) of DPCL by ` 316 crore for the year 2014-15. In addition to the above, after taking into consideration the effect of CAG’s qualifications on the account of DPCL, the profit for the year 2014-15 would turn to loss of ` 276.40 crore. There were two instances of non-compliance with the Accounting Standards in two accounts during the year.
Similarly, two Statutory Corporations forwarded two accounts for audit during the period from October 2015 to September 2016. Of these, one account of Delhi Transport Corporation pertained to sole audit by CAG which was completed and
7 SRDC, DSCSC, DTTDC (2015-16), GSDL8 DPCL, DTL, IPGCL, PPCL, DTTDC (2014-15), DSIIDC9 DTIDC

Chapter-II : Public Sector Undertakings
29
SAR was issued for the year 2014-15. Remaining one account of Delhi Financial Corporation for the year 2015-16 was selected for supplementary audit which was under finalization as on 30 September 2016. The Audit Reports of Statutory Auditors and the sole/ supplementary audit of CAG indicated the need to improve the quality of maintenance of accounts. The details of aggregate money value of comments of statutory auditors and CAG on the accounts audited during the last three years are given in Table 2.1.9 below:
Table 2.1.9: Impact of audit comments on Statutory Corporations10(` in crore)
Sl. No.
Particulars
2013-14 2014-1510 2015-16
No. of accounts
AmountNo. of
accountsAmount
No. of accounts
Amount
1. Decrease in profit - - - - 1 0.16
2. Increase in profit - - - - - -
3. Decrease in loss 1 1,306.17 1 24.56 - -
4. Increase in loss 2 2,569.52 1 2,695.74 1 1,978.50
5. Non-disclosure of material facts
1 1.54 - - 1 964.04
6. Errors of classification 1 116.66 - - - -
2.1.12 Placement of Separate Audit Reports
Table 2.1.10 below shows the status of placement of Separate Audit Reports (SARs) issued by the CAG on the accounts of statutory corporations in the Legislature.
Table 2.1.10: Status of placement of SARs in Legislature
Sl. No.
Name of statutory corporation
Year up to which SARs placed in Legislature
Year for which SARs not placed in Legislature
Year of SAR
Date of issue to the Government/Present Status
1. Delhi Transport Corporation
2014-15 - -
2. Delhi Financial Corporation
2013-14 2014-15 16.10.2015
2.1.13 Response of the Government to Audit
For the Report of the CAG for the year ended 31 March 2016, one PA and nine audit paragraphs were issued to the Additional Chief Secretaries/Principal Secretaries of the respective Departments with request to furnish replies within six weeks. However, replies were awaited from the GNCTD (November 2016).
10The impact of accounts comments for DTC and DFC is for the year 2014-15.

Audit Report No. 5 – Revenue and Social & Economic Sectors (PSUs) for the year ended 31 March 2016
30
2.1.14 Follow up action on Audit Reports
The Public Accounts Committee (PAC) stipulates that after presentation of the Report of the CAG of India in the Legislative Assembly, Departments shall initiate action on the audit paragraphs and the Action Taken Notes (ATNs) thereon should be submitted by the Government within four months of tabling the Report, for consideration of the Committee. However, Action Taken Notes were not received in 40 per cent of the performance audits and 26 per cent of the audit paragraphs as on 30 September 2016 as depicted in Table 2.1.11 below:
Table 2.1.11: Action Taken Notes not received as on 30 September 2016
Period of Audit Report
Date of placement of Audit Report in the State
Legislature
Number of reviews/paragraphs
Appeared in Audit Report Pending ATNs
PAs Paragraphs PAs Paragraphs
2010 05.09.2011 1 8 Nil Nil
2011 06.06.2012 Nil 5 Nil Nil
2012 02.04.2013 1 3 1 Nil
2013 01.08.2014 (In Parliament) 1 7 Nil Nil
2014 30.06.2015 1 2 Nil 2
2015 13.06.2016 1 6 1 6
Total 5 31 2 8
2.1.15 Discussion of Audit Reports by Committee on Government Undertakings (COGU)
The status as on 30 September 2016 of PAs and paragraphs that appeared in Audit Reports (PSUs) and discussed by COGU was as given in Table 2.1.12 below:
Table 2.1.12: Reviews/paras appeared in Audit Reports and discussed as on 30 September 2016
Period of Audit Report
Number of reviews/paragraphs
Appeared in Audit Report Paras discussed
PAs Paragraphs PAs Paragraphs
2010 1 8 Nil Nil
2011 Nil 5 Nil 1
2012 1 3 Nil Nil
2013 1 7 Nil Nil
2014 1 2 Nil Nil
2015 1 6 Nil 4
Total 5 31 Nil 5

Chapter-II : Public Sector Undertakings
31
2.1.16 Compliance to Reports of COGU
ATNs to three paragraphs pertaining to one Report of the COGU presented to the State Legislature between March 2009 and March 2015 had not been received (October 2016) as indicated in Table 2.1.13 below:
Table 2.1.13: Compliance to COGU Reports
Year of the
COGU Report
Total number of
COGU Reports
Total no. of recommendations
in COGU Report
No. of recommendations
where ATNs not received
2010 1 11 11
This Report of COGU contained recommendations in respect of paragraphs pertaining to one11 undertaking, which appeared in the Report of the CAG of India for the year ended March 2005.
It is recommended that the Government may ensure sending of replies to inspection reports/draft paragraphs/PAs and ATNs on the recommendations of COGU as per the stipulated time schedule12.
2.1.17 Disinvestment, Restructuring and Privatisation of PSUs
The GNCTD had not undertaken the exercise of disinvestment, privatisation or restructuring of any of the State PSUs during 2015-16.
2.1.18 Coverage of the Chapter
This chapter contains six paragraphs and one performance audit on the ‘Working of Power Generation Companies of Delhi’ involving financial implications of ` 957.35 crore.
11 Delhi SC/ ST/ OBC/ Minorities & Handicapped Financial and Development Corporation Limited12 Inspection Report (four weeks), Draft Paragraphs & Performance Audits (six weeks) and Action Taken Note on COGU recommendations (three months).

Audit Report No. 5 – Revenue and Social & Economic Sectors (PSUs) for the year ended 31 March 2016
32
Department of Power
2.2 Performance Audit on the ‘Working of Power Generation Companies of Delhi’
In terms of the Delhi Electricity Reform (Transfer Scheme) Rules, 2001, the activity of power generation in the State was entrusted to Indraprastha Power Generation Company Limited (IPGCL) and Pragati Power Corporation Limited (PPCL). A performance audit of the working of the two power generation companies covering the period 2011-12 to 2015-16 brought out inter alia deficiencies in capacity addition programmes, excess consumption of fuel and non-achievement of generation targets and plant load factor norms due to less scheduling of power, unplanned major shutdowns and delays in repair and maintenance. Some of the significant findings are as under:
Highlights
Outstanding dues of ` 4,911.07 crore recoverable from DISCOMs adversely affected the cash flow of IPGCL and PPCL and the companies had to resort to heavy short term borrowings.
(Paragraph 2.2.2 and 2.2.4.1)
Out of planned commissioning of six power plants of 3,340 MW by the end of 12th Five Year Plan, only 1,500 MW PPS-III, Bawana has been commissioned while other projects have been held up due to non-availability of either gas or land. Inability to effectively monitor execution of project of Block-I and Block-II and delayed commissioning of the projects resulted in PPCL not being able to recover ` 474.32 crore in tariff and avail of additional return of ` 163.32 crore on equity.
(Paragraph 2.2.5 and 2.2.5.1)
Operational performance of the power plants was sub-optimal. Gross Station Heat Rate of the plants was higher than the norms resulting in excess consumption of fuel of ` 125.92 crore. Rajghat Power House, Gas Turbine Power Station and PPS-III could not achieve targeted plant availability resulting in under recovery of capacity charges of ` 616.87 crore. Further, auxiliary energy consumption of these power plants was higher than the norms leading to excess consumption of 154.75 MUs valued at ` 48.04 crore.
(Paragraph 2.2.6.1 (c), 2.2.6.3 (b) and 2.2.6.5)
Undertaking major overhauling of Unit-2 of RPH without incorporating any action plan to comply with norms of Delhi Pollution Control Committee resulted in the plant lying idle and unfruitful expenditure of ` 15.09 crore expended on the major overhauling.
(Paragraph 2.2.7.1)

Chapter-II : Public Sector Undertakings
33
2.2.1 Introduction
The availability of reliable and quality power at competitive rates is crucial to sustain growth of all sectors of the economy. As part of the power sector reforms, the Government of National Capital Territory of Delhi (GNCTD) enacted the Delhi Electricity Reforms Act, 2000 in March 2001. Pursuant to the provisions of this Act, it notified the Delhi Electricity Reform (Transfer Scheme) Rules, 2001 on 20 November 2001. Consequently, the activity of power generation in the State was entrusted to the IPGCL and PPCL under the administrative control of the Power Department. As on 31 March 2016, the cumulative installed capacity of IPGCL and PPCL was 2,106.20 MW with two power stations each of IPGCL {Rajghat Power House (RPH): 135 MW and Gas Turbine Power Station (GTPS): 270 MW} and PPCL {Pragati Power Station (PPS-I): 330 MW and PPS-III, Bawana: 1371.20 MW}.
2.2.1.1 Organisational structure
IPGCL and PPCL are managed by a common Board of Directors (BoD), comprising of a Chairman, a Managing Director, Directors and functional Directors (Director Finance, HR and Technical) appointed by the GNCTD. The BoD is headed by Chairman who is ex-officio Secretary, Department of Power, GNCTD. The Managing Director is the Chief Executive and is assisted in the day to day operations by the functional Directors, Executive Directors and General Managers.
2.2.1.2 Audit objectives
The main audit objectives were to assess whether:
• financial resources were managed efficiently, economically and effectively;
• capacity addition was planned adequately and projects undertaken were executed efficiently, economically and effectively;
• requirement of inputs (fuel, manpower, etc.) was assessed realistically, procured economically and utilised efficiently; and
• companies operated efficiently to maximise the output of its power plants.
2.2.1.3 Scope of audit and methodology
The performance audit on the functioning of IPGCL and PPCL was conducted from April 2016 to August 2016, covering the period of five years from 2011-12 to 2015-16. Audit examined the records at the Head Offices of IPGCL and PPCL and the four power stations of these companies.
An entry conference to discuss audit methodology, scope, objectives and criteria was held with the Management (April 2016). The report was issued to the Government and Management (September 2016) to elicit their views on the audit observations. An exit conference was held (September 2016) with the

Audit Report No. 5 – Revenue and Social & Economic Sectors (PSUs) for the year ended 31 March 2016
34
Management. The views of the IPGCL/PPCL, expressed in the exit conference have been considered while finalising this performance report.
2.2.1.4 Audit criteria
The audit findings were evaluated against criteria sourced from the following:
• National Electricity Plan, norms and guidelines of Central Electricity Authority (CEA) regarding planning and implementation of the projects;
• Norms fixed by CEA/allowed by Delhi Electricity Regulatory Commission (DERC)/Central Electricity Regulatory Commission (CERC) and Acts relating to environmental issues; and
• Agenda and minutes of the meetings of the BoD and Audit Committee.
2.2.1.5 Previous performance audit
A performance audit (PA) on ‘Power Generation Activities in Delhi’ was included in the Report of the Comptroller and Auditor General of India (Civil and Commercial), GNCTD for the year ended 31 March 2010. The Report is yet to be discussed (August 2016) by the Committee on Government Undertakings (COGU) of the Legislative Assembly. The Management had not initiated action on the recommendations of previous report which related primarily to strengthening of project monitoring system, improving station heat rate, ensuring adequate availability of gas for the power plants and strengthening repair and maintenance practices and procedures.
Audit findings
2.2.2 Financial Position and Working Results
The financial position and working results of the IPGCL and PPCL for the years 2011-12 to 2015-16 are given in Annexures 2.2A and 2.2B.
2.2.2.1 During the period of 2011-16, trade receivables of IPGCL increased from ` 810.82 crore to ` 1,740.03 crore and in PPCL from ` 671.74 crore to ` 3,275.63 crore, due to default in payment of power dues by power distribution companies (DISCOMs) of Delhi. This non receipt of power dues adversely affected the financial position of both the companies as they had to resort to short term borrowings to meet their day to day operational expenses. The short term borrowings increased by 195.32 per cent from ` 222.96 crore in 2011-12 to ` 658.44 crore in 2015-16 in IPGCL and by 263.77 per cent from ` 148.58 crore in 2011-12 to ` 540.49 crore in 2015-16 in PPCL.
2.2.2.2 During 2011-12 to 2015-16, the cost of generation per unit at IPGCL increased from ` 4.14 per unit to ` 10.45 per unit due to increase in variable cost per unit from ` 2.97 to ` 4.26, while at PPCL, it increased from ` 3.05 per unit to ` 6.00 per unit, due to increase in variable cost per unit from ` 2.37 to ` 3.36. Due

Chapter-II : Public Sector Undertakings
35
to this increase in cost of generation per unit, there was less purchase of power by DISCOMs from IPGCL/PPCL. On an average, 32 per cent (RPH) to 37 per cent (GTPS) generating capacities of IPGCL power plants and 10 per cent (PPS-I) to 68 per cent (PPS-III) generating capacities of PPCL power plants remained under-utilised each year.
2.2.2.3 The companies also failed to make timely repayment of loans and interest thereon and advance income tax on due dates and paid penal interest of ` 132.63 crore (penal interest on loans: ` 113.96 crore and penal interest on advance income tax: ̀ 18.67 crore). During 2011-16, interest and finance charges of IPGCL increased from ` 41.79 crore to ` 134.52 crore and of PPCL from ` 37.32 crore to ` 331.38 crore. The increased interest and finance charges raised the operating cost of the companies.
2.2.3 Planning
The CEA estimates indicated that electricity demand may reach to around 8700 MW in Delhi by the end of the 12th Five Year Plan (2012-2017). The Power availability scenerio in terms of peak demand vis-à-vis peak demand met, overall power supply in terms of energy and share of IPGCL and PPCL in power supply in Delhi during 2011-12 to 2015-16 is given below.
Table 2.2.1: Peak demand vis-à-vis peak demand metYear Peak
Demand (MW)
Peak Demand
met (MW)
Peak Deficit(MW)
(Percentage of Peak
Demand)
Sources for meeting Peak Demand
Percentage of IPGCL and PPCL share to the Peak
Demand met
IPGCL and PPCL share
(MW)
Import (MW)
2011-12 5,031 5,028 3 (0.06) 525 4,503 10.44
2012-13 5,727 5,642 85 (1.48) 804 4,838 14.25
2013-14 5,714 5,653 61 (1.07) 655 4,998 11.59
2014-15 6,006 5,925 81 (1.35) 821 5,104 13.86
2015-16 5,846 5,846 0.00 611 5,135 10.45
Source: State Load Despatch Centre Reports
Table 2.2.2: Overall power supply in terms of energyYear Requirement
(MUs)Availability
(MUs) Deficit (MUs)(Percentage of requirement)
Energy scheduled by IPGCL and PPCL (MUs)
Percentage of
availability2011-12 26,751 2,6674 77 (0.3) 4,540.00 17.02
2012-13 26,088 2,5950 138 (0.5) 5,781.94 22.28
2013-14 26,867 2,6791 76 (0.3) 4,294.62 16.03
2014-15 29,231 2,9106 125 (0.4) 5,191.08 17.84
2015-16 29,626 2,9583 43 (0.1) 3,788.06 12.80
Source: CEA’s Load Generation Balance Reports and data supplied by IPGCL and PPCL
Thus, IPGCL and PPCL were able to meet only 10 to 14 per cent of the peak demand. Their share in overall power supply ranged between 13 to 22 per cent.

Audit Report No. 5 – Revenue and Social & Economic Sectors (PSUs) for the year ended 31 March 2016
36
2.2.4 Fund Management
Efficient fund management involves optimum utilisation of available resources and borrowings at favourable terms at appropriate time. The details of cash flow of IPGCL and PPCL for the years 2011-12 to 2015-16 are given in Annexure 2.3. There was a net decrease in cash and cash equivalent during 2011-12 to 2013-14 and 2015-16 in IPGCL. In PPCL, decrease in cash and cash equivalent was in the years 2012-13, 2013-14 and 2015-16. The primary reason for cash deficit were default in payments of power bills by the DISCOMs.
2.2.4.1 Outstanding Energy bills
BSES Rajdhani Power Limited (BRPL) and BSES Yamuna Power Limited (BYPL) were defaulters from October 2010 and Tata Power Delhi Distribution Limited (TPDDL) from April 2014 onwards. As on 31 March 2016, an amount of ` 4,911.07 crore (IPGCL: ` 1,722.54 crore and PPCL: ` 3,188.53 crore) was recoverable from them. Audit observed:
• Letters of credit (LCs)13, required to be maintained as per PPAs were not maintained by BRPL and BYPL since March 2011. LCs established by TPDDL expired on 31 March 2014 and were not maintained after 1 April 2014;
• Default Escrow agreements14 were not signed; and
• The power purchase agreement between IPGCL/PPCL and DISCOMs provided that in the event of continued default by BRPL, BYPL and TPDDL in making payment of power supply bills, IPGCL and PPCL may initiate action for suspension of power supply and cancellation of the agreements by giving notice of 90 days.
However, IPGCL and PPCL did not initiate any steps to ensure compliance with the terms of the power purchase agreements. The Management stated (September 2016) that action against the DISCOMs for default in payment of power dues was not initiated in the interest of consumers. The point remains that dues of ` 4,911.07 crore are pending recovery.
2.2.4.2 Payment of deviation charges
Under the Availability Based Tariff (ABT) system, the Companies are required to pay deviation charges when their power plant generates more/less than the power demand schedule causing disturbance in grid frequency. Audit noted that on a number of occasions, power plants of IPGCL and PPCL deviated from the given power demand schedules which was indicative of inadequate assessments while declaring capacities. The State Load Despatch Centre (SLDC) raised deviation charges of ` 26.38 crore during 2011-12 to 2015-16 which had to be paid. 13 BRPL, BYPL and TPDDL were required to provide IPGCL and PPCL, unconditional, revolving and irrecoverable LCs having term of minimum twelve months and covering 105 per cent of one month’s average bill amount based on the preceding twelve month’s billing.14 BRPL, BYPL and TPDDL were required to hypothecate the receivables equivalent to the LCs amount in favour of IPGCL and PPCL.

Chapter-II : Public Sector Undertakings
37
2.2.4.3 Bonus and incentive under Generation Linked Incentive Scheme
Payment of Bonus Act, 1965 (Act) and the Department of Public Enterprises (DPE) instructions (20 November 1997), forbids Public Sector Enterprises to pay their employees bonus/ex-gratia over and above the entitlement under the provisions of the Act unless the amount was authorised under the duly approved incentive scheme. DPE further clarified (December 2005) that there was no provision for the DPE/administrative ministry to approve the payment of ex-gratia/bonus to the ineligible employees. Audit observed the following:
(a) Upto 2006-07, IPGCL/PPCL paid ex-gratia/bonus to their ‘B’, ‘C’ and ‘D’ category employees as per the entitlements. However, during 2007-08, in deviation of the provisions of the Act and DPE instructions, IPGCL and PPCL approved (28 December 2007) the payment of ex-gratia/bonus to all regular employees @ ` 5,100, which was increased every year from ` 5,100 in 2007-08 to ` 39,000 in 2014-15 against the ceiling limit of ` 3,500, without the approval of the Department of Power (DoP), GNCTD.
(b) IPGCL/PPCL Wage Revision Committee while allowing (December 2008) to continue to follow the Act in respect of eligible employees, recommended that in lieu of bonus/ex-gratia, the companies should formulate performance linked incentive scheme for all employees. The BoD of IPGCL/PPCL approved (26 March 2010) ‘Generation Linked Incentive Scheme’ (GLIS) applicable from 1 April 2010 without discontinuation of ex-gratia in lieu of bonus. GLIS was further extended (11 June 2011) for 2011-12 and approved by the DoP in December 2011. While submitting this proposal to GNCTD, the fact that the companies were paying ex-gratia in lieu of bonus to their employees, was not disclosed. BoD further approved (25 June 2012) extension of existing GLIS beyond 2011-12 till the implementation of revised GLIS scheme.
Thus, IPGCL and PPCL paid ex-gratia in lieu of bonus to ineligible employees and also in excess of the specified limits (` 3,500) to eligible employees, resulting in excess payment of ` 13.68 crore during 2011-12 to 2014-15. Incentive of ` 14.46 crore under GLIS was also paid during 2012-13 to 2015-16 without the approval of the Scheme by GNCTD.
The Management stated in September 2016 that DPE instructions/guidelines are not applicable to IPGCL and PPCL and the BoD of the companies headed by Secretary (Power) GNCTD was empowered to frame policies for their employees including ex-gratia scheme or generation linked incentive scheme. However, the Management could not furnish instructions regarding non-applicability of DPE instructions to the companies. Moreover, these schemes were not approved by the DoP, GNCTD.
2.2.4.4 Expenditure on DLN Burners and Sewage Treatment Plants
PPCL had installed Dry Low Nitrogen Oxide (DLN) Burners at PPS-1 to control the emission level of Nitrogen Oxide. PPCL had taken over Delhi Gate drain

Audit Report No. 5 – Revenue and Social & Economic Sectors (PSUs) for the year ended 31 March 2016
38
and Sen Nursing Home drain sewage water treatment plants (STPs) from Delhi Jal Board for use of treated sewerage water in PPS-I. During MYT control period of FY 2012-13 to 2015-16, DERC allowed ` 15 crore every year on account of DLN Burners and ` 3.27 crore for 2012-13, ` 3.53 crore for 2013-14 and ` 3.81 crore for 2014-15 for operation and maintenance of STPs. During 2012-14, PPCL claimed ̀ 13.05 crore on account of DLN Burners and ̀ 8.08 crore on account of O&M STPs. DERC, finding that the expenses claimed were not verifiable against payment vouchers, disallowed (September 2015) expenditure of ` 21.13 crore. PPCL had filed an appeal before the APTEL which is pending decision.
2.2.5 Capacity Addition Programmes
For augmenting power generation capacity, GNCTD targeted (2012) commissioning of six15 power plants of 3,340 MW by the end of the 12th Five Year Plan (2012-17). Out of these, three power plants16 were put on hold due to non-availability of gas. The power plant planned at the site of the Indraprastha Power Station was abandoned (January 2013) due to non-availability of land and decision of GNCTD in respect of 270 MW GTPS was awaited as of November 2016. Only the 1,500 MW PPS-III Bawana was commissioned in March 2014. Thus, conceptualisation and planning of capacity addition programme was not realistic as they failed to take into account critical factors like availability of gas and of land.
2.2.5.1 Execution of Gas Based Power Project at Bawana
Para 5.2.12 of the Report of CAG of India for the year ended 31 March 2010 (Civil and Commercial) of GNCTD highlighted the delay in execution of Gas Based Power Project PPS-III at Bawana. PPCL awarded (30 April 2008) an Engineering Procurement and Commissioning (EPC) contract to BHEL for ` 3,500 crore. As per the contract, Block17-I and Block-II were to be commissioned by 31 July 2010 and 30 November 2010 respectively. Subsequently, on the basis of detailed engineering and operating conditions at site, the capacity of the plant was fixed at 1,371.20 MW with estimated cost of ` 4,536.20 crore. The Block-I was commissioned on 14 December 2012 and Block-II on 27 March 2014. As on 27 March 2014, PPCL had incurred an expenditure of ` 4,355.19 crore on the 15 1500 MW at Bawana approved by GNCTD in June 2007, 750 MW at Bamnauli approved by GNCTD in February 2011, remaining four plants namely 350 MW at Kanjhawala, 350 MW at the site of IP Station, 330 MW at the site of RPH and 330 MW as replacement of 270 MW GTPS were approved by IPGC BoD in September 2011.16 750 MW at Bamnauli (August 2011) (Para 2.2.5.2), 350 MW at Kanjhawala (August 2012) and 330 MW at the site of RPH (August 2014)17 Each block consisting of two Gas Turbine Generators, associated Waste Heat Recovery Boilers and connected Steam Turbine-Generator

Chapter-II : Public Sector Undertakings
39
project. Audit noted the following:
(i) There was a delay of 28½ and 40 months in the commissioning of Block-I and Block-II respectively. While PPCL attributed the reasons to delay by BHEL in transportation and commissioning of the project, the Company had also failed to monitor the implementation of the project and to persuade M/s BHEL to adhere to the stipulated time schedule. These factors were controllable with effective monitoring. In accordance with the principle18 laid down by the Appellate Tribunal for Electricity (APTEL) judgement (27 April 2011 in Appeal No.72/2010 in case of Maharashtra State Power Generation Company Limited Vs Maharashtra Electricity Regulatory Commission & others), PPCL could not recover ̀ 474.32 crore on account of interest during construction (` 407.69 crore), foreign exchange rate variation (` 11.11 crore) and incidental expenditure during construction (` 55.52 crore) in tariff.
(ii) Due to delay in commissioning of the project, PPCL could not avail additional return (at the rate of 0.50 per cent per annum) of ` 163.32 crore19 on equity, which was admissible under CERC (Terms and Conditions of Tariff) Regulations, 2009.
(iii) Performance guarantee tests of a completed facility which were to be carried out after the successful completion of initial operation, had not been conducted so far even after a lapse of more than two years since the commissioning of the project.
The Management stated that interest was wrongly disallowed by CERC and an appeal has been filed with APTEL in 2015.
2.2.5.2 750 MW Power Project at Bamnauli
PPCL issued (29 March 2011) a Letter of Intent (LOI) to BHEL for shifting of existing overhead 400 KV transmission lines passing over the site of proposed Bamnauli Power project for ` 128.34 crore and for construction of plant at a cost of ` 1,064.90 crore. In August 2011, GNCTD advised PPCL not to incur any expenditure on the Project without a firm commitment of allotment of gas from the Central Electricity Authority (CEA)/Government of India (GoI). Without initiating action to get the allocation of gas for the project, PPCL entered (November 2011) into a contract for shifting of transmission lines and incurred an expenditure of ` 98.56 crore as of July 2016. No further progress had been observed in the project so far.
18 In case of delay in execution of a generating project due to factors entirely attributable to the generating company, the entire cost due to time over run has to be borne by the generating company. However, the liquidated damages and insurance proceeds on account of delay, if any, received could be retained by the generating company.19 Total cost of ` 4,355.19 crore × 30 per cent (Cost to be treated as Equity in accordance with CERC Regulations) × 0.50 per cent × 25 (Life of the project)

Audit Report No. 5 – Revenue and Social & Economic Sectors (PSUs) for the year ended 31 March 2016
40
The Management stated (September 2016) that execution of the project was linked with availability of land and the work of shifting of existing transmission lines was undertaken to get available land. The reply is not tenable as the contract for shifting of the overhead lines was entered into without any assurance as to availability of gas for the power plant in contravention of explicit instructions of GNCTD. There was no allotment of gas at the time of entering into contract and continues to be so by November 2016.
2.2.6 Operational Performance
The operations of power generating companies are dependent on inputs i.e. fuel and manpower. The output is related to plant load factor, plant availability, capacity utilisation, outages and auxiliary consumption. Operational performance of the generating stations of IPGCL and PPCL during 2011-12 to 2015-16 is given in Annexure 2.5 to Annexure 2.8 which showed that operational performance was decreasing year by year during the review period. Fuel consumption was higher than the norms. The generating stations were not able to achieve generation targets nor meet the norms for plant load factor, plant availability and capacity utilisation.
2.2.6.1 Input Efficiency
(a) Coal Management
Coal Procurement: IPGCL contracted a Fuel Supply Agreement (FSA) with M/s Northern Coal Fields Limited (NCL) for supply of coal for Rajghat Power House (RPH). Delhi Electricity Regulatory Commission (DERC) had stipulated the average calorific value of coal at 3,601 Kcal for 2011-12 and 3,703 Kcal for 2012-13 to 2015-16. The average calorific value of coal actually received at the station during 2012-13 to 2015-16 ranged from 3,671 Kcal to 3,699 Kcal which was below the norm set by DERC. Low calorific value of coal impacts the consumption of coal and increases costs.
Audit observed that the FSA only specified the size of coal pieces and the maximum ash content but did not indicate any commitment on calorific value of the coal. The Company did not also take up the matter of low calorific value of the coal supplied with the supplier.
The Management admitted (September 2016) that there was no provision in FSA in this regard.
Non-disposal of coal reject: Coal rejected by the coal mills during crushing process is dumped into the designated area. Scrap and Surplus Identification and Disposal Committee (SSIDC) recommended (March 2014) disposal of 32,000 MT lying in RPH as coal reject through e-auction. The Management asked RPH in February 2015 to provide details of coal reject on year to year

Chapter-II : Public Sector Undertakings
41
basis and directed disposal of 32,000 MT of coal reject at a reserve price of ` 650 PMT, based on the recommendations of SSIDC. However, the plant authorities could not provide requisite details and the coal reject could not be sold even by November 2016, depriving IPGCL of revenue of ` 2.08 crore (calculated @ ` 650 per MT for 32,000 MT).
Loss in transit: DERC had fixed a norm of maximum of 0.8 per cent for transit loss. Audit noted that transit losses ranged between 0.60 to 4.01 per cent as compared to the norms, resulting in loss of 23,169.93 MT of coal valuing ` 6.05 crore during the review period.
(b) Tie ups for gas
Agreements for supply of KG Basin gas to PPS-III, Bawana: In June 2012 PPCL entered into three agreements for supply and transportation of gas from the KG basin to PPS-III Bawana viz. (i) agreement with a consortia of three private companies for supply of 0.836 Million Metric Standard Cubic Meter Per Day (MMSCMD) to PPS-III, Bawana, (ii) an agreement with a private company for transportation of this gas from East Coast to West Coast and (iii) agreement with M/s. GAIL (India) Limited for further transportation of this gas from West Coast to Bawana plant. The agreements had clauses of Minimum Guarantee Offtake, Minimum Ship or Pay and daily drawal of gas from the pipelines. Between July 2012 and February 2013, due to decreased scheduling of power, plant authorities failed to utilise the minimum guaranteed gas and consequently had to pay penalty of ` 28 crore20.
Audit further noted that PPCL was informed on 1st March 2013 by the gas supplier that that Government of India had intimated a change of priorities for supply of gas to fertilisers and LPG as compared to power consumers and consequently supply of KG Basin gas to the Bawana Plant would be zero with immediate effect. However, PPCL did not scrap the transportation agreement with GAIL and paid ` 29.68 crore on account of minimum transportation charges during 2013-14. The gas supply agreements from KG Basin expired on 31 March 2014.
The Management stated (September 2016) that there was no exit clause in the contract. The reply is not tenable as the transportation contract with M/s GAIL provides that the contract may be terminated if a Party to the agreement is prevented or hindered from performance of his obligations due to a force majeure event. A force majeure event includes acts of Government which affects the ability of the parties to perform its obligations. Hence, the contract could have been terminated by invoking these contractual provisions obviating the need to pay the minimum transportation charges particularly since the contract was in any event expiring on 31st March 2014. 20 ` 0.80 crore to the consortium due to failure of taking 80 per cent of monthly minimum quantity in August 2012, ` 10.13 crore due to failure of shipment of minimum quantities and ` 17.07 crore to GAIL due to maintaining imbalance in the pipe line more than the minimum prescribed percentage.

Audit Report No. 5 – Revenue and Social & Economic Sectors (PSUs) for the year ended 31 March 2016
42
(c) Consumption of fuel
Consumption of fuel mainly depends upon “Gross Station Heat Rate” (GSHR)21 of power plants. The DERC and CERC in its Multi Year Tariff (MYT) Regulations fixed the GSHR norms for RPH, GTPS, PPS-I and PPS-III, Bawana. The position of GSHR norms fixed by DERC/CERC vis-à-vis achieved by the four power plants during 2011-12 to 2015-16 is given below:2223
Table 2.2.3: Fuel consumption norms vis-à-vis actual achievements
Name of the plant
DERC/CERC norms vis-à-vis actual achievement
(in Kcal/Kwh)
2011-12 2012-13 2013-14 2014-15 2015-16
RPH DERC norms 3,200 3,200 3,200 3,200 3,200Actual achieved 3,072 3,340 3,375 3,368 3,292
GTPS DERC norms OC22 3,125 3,125 3,125 3,125 3,125CC23 2,450 2,450 2,450 2,450 2,400
Actual achieved OC 3,391 3,448 3,441 3,473 3,465CC 2,489 2,445 2,424 2,503 2,527
PPS I DERC norms OC 2,900 2,900 2,900 2,900 2,900CC 2,000 2,000 2,000 2,000 2,000
Actual achieved OC 3,095 3,121 3,161 3,188 3,197CC 1,988 1,989 1,990 1,990 1,997
PPS III CERC norms OC 2,756 2,756 2,756 2,756 2,756CC 1,845 1,845 1,845 1,845 1,845
Actual achieved OC 2,991 3,722 3,031 2,817 2,853CC 0* 2,041 1,971 1,867 1,888
Source: Data supplied by IPGCL and PPCL
*Since PPS III was not commissioned fully
As evident from above, the GSHR of all the four power plants was higher than the norms during the review period. This translated into excess consumption of fuel worth ` 125.92 crore (Annexure 2.4).
The Management stated (September 2016) that excess consumption of fuel, was due to frequent starting and stopping of units and running of the plants on partial load due to less scheduling. Audit observed that the plant authorities had not conducted performance guarantee test in the machines during the review period to ascertain the reasons for high station heat rate.
2.2.6.2 Manpower Management
The manpower of IPGCL and PPCL was 1,396 at the beginning of 2011-12 which reduced to 1,189 at the end of 2015-16. However, the manpower still exceeded the CEA norms for thermal power stations as given in Table 2.2.4:
21Gross Station Heat Rate” (GSHR) means the heat energy input in kCal required to generate one kWh of electrical energy at generator terminals of a thermal generating station.22Open Cycle23Combined Cycle

Chapter-II : Public Sector Undertakings
43
Table 2.2.4: Manpower at RPH vis-à-vis CEA Norms
Sl.No. Particulars 2011-12 2012-13 2013-14 2014-15 2015-16
1 Installed capacity of Rajghat Power House (MW)
135 135 135 135 135
2 Nos of employees as per Pay Ledger 417 369 353 345 268
3 Manpower required as per CEA Norms 1.1 persons per MW (Nos)
149 149 149 149 149
4 Excess Deployment (Nos.) 268 220 204 196 119
5 Expenditure on employees remuneration & benefits (` in crore) (As per Pay Ledger)
26.39 25.80 25.68 26.64 25.60
6 Extra expenditure with reference to CEA norms (` in crore) (5 × 4/2)
16.96 15.38 14.84 15.13 11.37
Source: Data supplied by IPGCL
The excess manpower with reference to the CEA norms resulted in extra expenditure of ` 73.68 crore on remuneration and benefits paid to employees.
Management stated (September 2016) that RPH is a small plant and had a number of non-mechanised operations and it cannot be compared with big capacity plants/new technology based plants.
2.2.6.3 Output Efficiency
The operational performance on various parameters to evaluate the performance of power stations of IPGCL and PPCL in terms of output efficiency is discussed below.
(a) Generation Targets and Plant Load Factor
The targets for generation of power for each year are approved by the CEA. DERC/CERC also fixes targets of generation for power plants. The targets fixed by CEA and DERC/CERC vis-à-vis achievements during 2011-12 to 2015-16 are given in Annexure 2.5. The power plants were able to generate only 25,724.233 MUs of power from 2011-12 to 2015-16 against the target of 54,436.810 MUs, leaving a shortfall of 28,712.577 MUs (52.74 per cent). The main reason for non-achievement of generation targets was low plant load factor (PLF) of the power plants.
PLF fixed by DERC/CERC vis-à-vis achieved by the power plants during 2011-12 to 2015-16 is given in Annexure 2.5. Analysis of PLF showed that none of the power plants except PPS-I in 2011-12 and 2012-13 could achieve PLF as fixed by the DERC/CERC. The low PLF was attributable to low plant availability, decreasing capacity utilisation, less scheduling of power, unplanned major shut downs and delays in repair and maintenance.
Audit Report No. 5 – Revenue and Social & Economic Sectors (PSUs) for the year ended 31 March 2016
44
(b) Plant Availability
Plant Availability is the average of the daily declared capacities certified by State Load Despatch Centre (SLDC). The position of Normative Annual Plant Availability Factor (NAPAF) fixed by DERC/CERC, vis-à-vis achieved by power plants during 2011-12 to 2015-16 is given in Annexure 2.6. During 2011-12 to 2015-16, only PPS-I was able to achieve NAPAF. RPH could not achieve it in any of the years. GTPS was not able to achieve NAPAF in 2014-15 and 2015-16 and PPS-III could not achieve it during 2011-12 and 2015-16. Due to non-achievement of NAPAF, the IPGCL and PPCL could not recover capacity charges of ` 616.87 crore from the DISCOMs during 2011-12 to 2015-16. The main reasons for non-achievement of NAPAF by the power plants were increased outages due to non-adherence to periodic maintenance schedules, decreasing capacity utilisation, major shut downs and delays in repair and maintenance.
(c) Capacity Utilisation
Capacity utilisation means the ratio of actual generation to possible generation during actual hours of operation. The capacity utilisation of the IPGCL and PPCL power plants decreased between 2011-12 and 2015-16 (Annexure 2.5). In RPH, it decreased from 86 to 80 per cent while in GTPS it decreased from 80 to 72 per cent, in PPS-I from 92 to 74 per cent and in case of PPS-III, Bawana, it decreased from 72 per cent in 2011-12 to 57 per cent in 2015-16. The main reasons for decreasing capacity utilisation were old generating units, frequent shut downs due to excessive forced outages, delayed repair and maintenance and running of units with partial load/without load.
The power stations were thus running at an efficiency level of 47 per cent. Due to non-achievement of the normative PLF, on an average 10 to 68 per cent capacity of the power plants remained under-utilised and IPGCL and PPCL could not recover capacity charges of ` 616.87 crore from DISCOMs.
2.2.6.4 Outages
Outages refer to the period for which the plant remained closed for attending to planned/forced maintenance. The details of the total hours available, hours operated, planned and forced outages in respect of RPH, GTPS, PPS-I and PPS-III are given in the Annexure 2.7. The observations in this regard are summarised in Table 2.2.5.
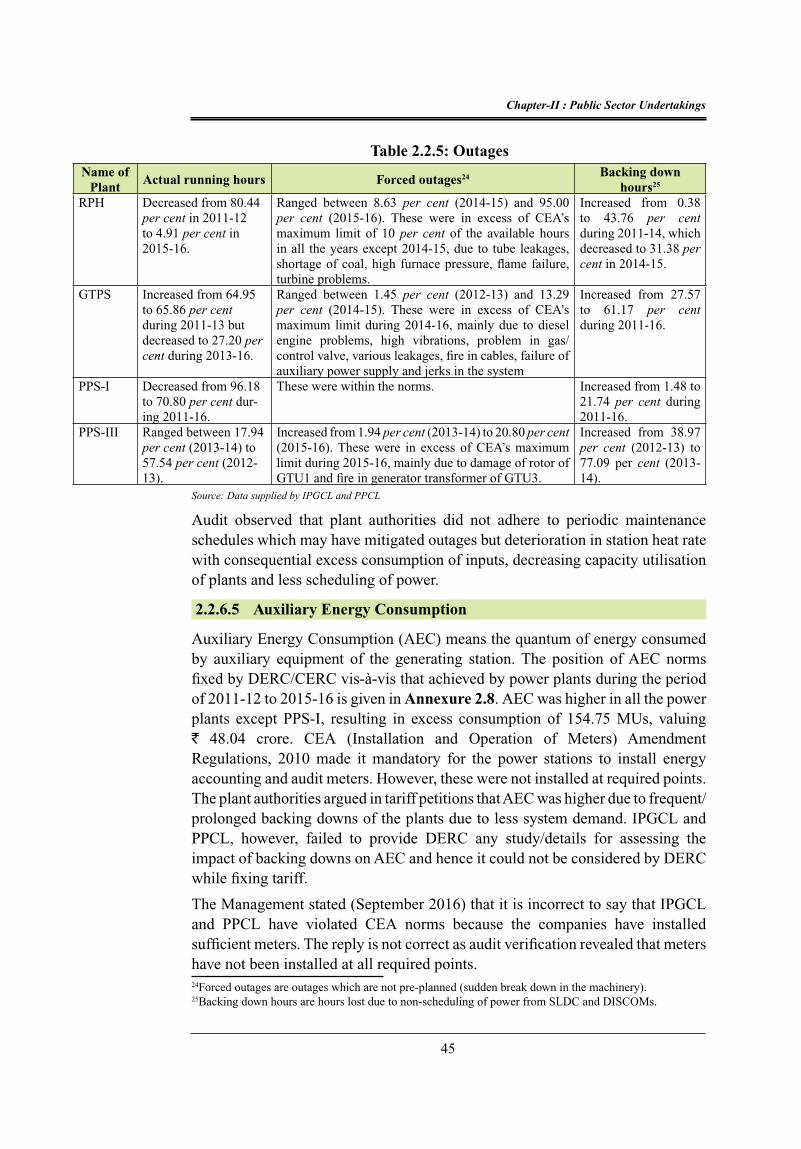
Chapter-II : Public Sector Undertakings
45
Table 2.2.5: Outages2425
Name of Plant
Actual running hours Forced outages24 Backing down hours25
RPH Decreased from 80.44 per cent in 2011-12 to 4.91 per cent in 2015-16.
Ranged between 8.63 per cent (2014-15) and 95.00 per cent (2015-16). These were in excess of CEA’s maximum limit of 10 per cent of the available hours in all the years except 2014-15, due to tube leakages, shortage of coal, high furnace pressure, flame failure, turbine problems.
Increased from 0.38 to 43.76 per cent during 2011-14, which decreased to 31.38 per cent in 2014-15.
GTPS Increased from 64.95 to 65.86 per cent during 2011-13 but decreased to 27.20 per cent during 2013-16.
Ranged between 1.45 per cent (2012-13) and 13.29 per cent (2014-15). These were in excess of CEA’s maximum limit during 2014-16, mainly due to diesel engine problems, high vibrations, problem in gas/control valve, various leakages, fire in cables, failure of auxiliary power supply and jerks in the system
Increased from 27.57 to 61.17 per cent during 2011-16.
PPS-I Decreased from 96.18 to 70.80 per cent dur-ing 2011-16.
These were within the norms. Increased from 1.48 to 21.74 per cent during 2011-16.
PPS-III Ranged between 17.94 per cent (2013-14) to 57.54 per cent (2012-13).
Increased from 1.94 per cent (2013-14) to 20.80 per cent (2015-16). These were in excess of CEA’s maximum limit during 2015-16, mainly due to damage of rotor of GTU1 and fire in generator transformer of GTU3.
Increased from 38.97 per cent (2012-13) to 77.09 per cent (2013-14).
Source: Data supplied by IPGCL and PPCL
Audit observed that plant authorities did not adhere to periodic maintenance schedules which may have mitigated outages but deterioration in station heat rate with consequential excess consumption of inputs, decreasing capacity utilisation of plants and less scheduling of power.
2.2.6.5 Auxiliary Energy Consumption
Auxiliary Energy Consumption (AEC) means the quantum of energy consumed by auxiliary equipment of the generating station. The position of AEC norms fixed by DERC/CERC vis-à-vis that achieved by power plants during the period of 2011-12 to 2015-16 is given in Annexure 2.8. AEC was higher in all the power plants except PPS-I, resulting in excess consumption of 154.75 MUs, valuing ` 48.04 crore. CEA (Installation and Operation of Meters) Amendment Regulations, 2010 made it mandatory for the power stations to install energy accounting and audit meters. However, these were not installed at required points. The plant authorities argued in tariff petitions that AEC was higher due to frequent/prolonged backing downs of the plants due to less system demand. IPGCL and PPCL, however, failed to provide DERC any study/details for assessing the impact of backing downs on AEC and hence it could not be considered by DERC while fixing tariff.
The Management stated (September 2016) that it is incorrect to say that IPGCL and PPCL have violated CEA norms because the companies have installed sufficient meters. The reply is not correct as audit verification revealed that meters have not been installed at all required points. 24Forced outages are outages which are not pre-planned (sudden break down in the machinery).25Backing down hours are hours lost due to non-scheduling of power from SLDC and DISCOMs.

Audit Report No. 5 – Revenue and Social & Economic Sectors (PSUs) for the year ended 31 March 2016
46
2.2.7 Repairs and Maintenance
The efficiency and availability of the equipment is dependent on adherence to annual maintenance and overhauling schedules. The significant observations noticed in this regard are discussed in succeeding paragraphs.
2.2.7.1 Major overhauling of Rajghat Power House
The GNCTD decided to close the RPH by 31 March 2011 which was postponed to 31 March 2013. However, the BoD of IPGCL, accorded (March 2013) in-principle approval for its continued operation beyond March 2013 for a period of five years subject to the approval of GNCTD on the grounds that RPH was catering to the needs of walled city and it needed to continue till alternative arrangement could be made. The BoD also approved Major Overhauling (MO) of both the units of RPH for ` 22.92 crore. Department of Power, GNCTD approved (November 2014) the decision of BoD, and MO of Unit-2 was taken from 30 December 2014 and completed on 1 April 2015 by incurring expenditure of ` 15.09 crore. Audit observed the following:
(i) MO was taken up after a lapse of more than one year of the proposed schedule. Further, it was to be completed within 60 days but it took 92 days.
(ii) The MO was to achieve the norms of suspended particulate matter (SPM) of the Delhi Pollution Control Committee (DPCC). But no provision was made for upgradation of Electronic Static Precipitators (ESPs) or retrofitting additional ESPs to comply with DPCC particulate matter emission norms of 50 mg/Nm3. Consequently, DPCC directed (March 2016) not to operate the RPH. The RPH plant was lying in idle condition since May 2015, resulting in unfruitful expenditure of ` 15.09 crore.
The Management stated (September 2016) that delay in completion of overhauling was due to unexpected additional damages found after opening of generator, turbine and boiler. New/additional ESPs were not retrofitted due to space constraints and high cost involved. The reply is not tenable as retrofitting ESPs was essential to achieve the SPM norms enabling their operation. Failure to do so resulted in RPH lying idle since May 2015 despite expenditure of ` 15.09 crore.
2.2.7.2 Revival of Gas Turbine Unit 2 (GTU) of GTPS
During Hot Gas Path Inspection of GTU2 of Gas Turbine Power Station (GTPS) in February 2014, it was found that Compressor Discharge Casing and Turbine casing of machine had got deformed and was beyond repair. After the approval of Managing Director (October 2014), purchase orders (POs) for material, spares and service was placed in March 2015. The machine was repaired for ̀ 13.29 crore and re-commissioned on 25 October 2015. Audit observed that the Management took more than seven months to decide to procure a new gas turbine (GT) and a further four months thereafter to place the POs.

Chapter-II : Public Sector Undertakings
47
The revival of GTU-2 was further delayed as the Exhaust plenum and Diffuser ordered for GTU2 was commissioned in GTU4 in June 2014. Instead of placing the PO of this equipment for GTU2 in June 2014, it was placed in March 2015. Though the machine after repair was received on 14 July 2015 its re-commissioning was delayed for another three months due to receipt of parts by September 2015.
Thus, delayed decision of the management coupled with delay in placement of POs for the requisite equipment resulted in loss of ` 26.45 crore on account of non-recovery of capacity charges for a period of eight months26.
The Management stated (September 2016) that revival of GT was delayed due to funds problem. However, there was no evidence that funds were a constraint.
2.2.8 Conclusion
Thus, the deficiencies in the functioning of the power generation companies that had been brought out in the previous Audit Report continued to persist. The financial position of the companies were adversely impacted by continued increase in receivables mainly from the DISCOMs as well as payment of penal interest of ` 132.63 crore due to failure to make timely re-payment of loans and interest thereon. Due to outstandings of ` 4,911.07 crore from DISCOMs against energy bills, IPGCL and PPCL have become dependent on borrowings and drifting towards liquidity crunch. Low operational efficiency translated into high unit cost of power which led to low purchase of power by DISCOMs from these Companies. Resultantly, about 10 per cent to 68 per cent generating capacities of the power plants of IPGCL and PPCL remained under-utilised each year. The companies could not fully implement its planned capacity addition programmes. Delayed commissioning of PPS-III, Bawana resulted in under recovery of capital cost in tariff. The deteriorating station heat rates of the plants were causing excess consumption of fuel. The power plants also failed to achieve targeted plant availability resulting in under recovery of capacity charges while Auxiliary Energy consumption of RPH, GTPS and PPS-III was higher than the norms.
2.2.9 Recommendations
Based on the audit findings, it is recommended that the Companies may:
• Take steps to improve financial management to ensure that payment of penalties are minimized and to recover outstanding dues from power distribution companies as per the power purchase agreements;
• Conduct periodic performance tests to help improve operational parameters; and
• Adhere to the periodical maintenance schedules, strengthen repair and maintenance practices to control costs.
The matter was referred to the Government in October 2016; their reply was awaited (November 2016).26 Calculated after allowing period of four months for decision and placement of purchase/work orders

Audit Report No. 5 – Revenue and Social & Economic Sectors (PSUs) for the year ended 31 March 2016
48
Department of Finance
2.3 Working of Delhi Financial Corporation
The Corporation not only failed to fulfil the objectives of promotion and development of small scale industries, but it also could not take timely decision to diversify its activities to overcome the shrinking business. The business of the Corporation declined due to its inability to secure potential business of ` 14.69 crore. The Corporation could not rent out its excess space at the Corporate Office to earn additional revenue of ` 0.81 crore.
2.3.1 Introduction
The Delhi Financial Corporation (Corporation) was set up in 1967 under the State Financial Corporation (SFC) Act 1951, to promote, develop and finance industries and service sector enterprises in the medium, small and micro sectors in the National Capital Territory of Delhi (GNCTD) and Union Territory of Chandigarh. The Corporation financed cost of plots/shops allotted by Government agencies, business loans and commercial transport in GNCTD and Chandigarh. The Corporation has one branch at Chandigarh.
The Corporation has finalized its accounts upto the year 2015-16. The financial position of the Corporation between 2013-14 and 2015-16 is given in Annexure 2.9. The loan portfolio of the Corporation decreased from ` 134.82 crore to ` 119.55 crore between 2013-14 and 2015-16 due to less disbursal of loans and higher repayments. However, during the same period income from operations has increased from ` 16.99 crore to ` 17.52 crore due to recovery of claims on assets hitherto classified as non-performing assets (NPA). The NPA of the Corporation stood at ` 9.57 crore which is 8.01 per cent of the total outstanding loan as on 31 March 2016.
An audit covering the period 2013-14 to 2015-16, was conducted from May 2016 to June 2016 to assess the working of the Corporation.
Audit Findings
2.3.2 Targets of sanction and disbursement of sanction loan
The Corporation fixed its targets of disbursement and recovery of loans annually. The details of achievements against targets fixed by the Corporation for the last three years are given in Table 2.3.1.

Chapter-II : Public Sector Undertakings
49
Table 2.3.1: Targets vs. Achievements of Sanctions, Disbursements and Recovery
(` in crore)
Year Sanction Disbursement Recovery
Target Achieve- ment
% of target
achieved
Target Achieve- ment
% of target
achieved
Target Achieve-ment
% of target
achieved
2013-14 25.00 7.20 28.80 20.00 6.65 33.25 45.00 50.79 112.87
2014-15 45.00 60.72 134.93 40.00 9.14 22.85 35.00 43.70 124.86
2015-16 20.00 23.19 115.95 40.00 49.37 123.43 35.00 52.40 149.71
The Corporation raised its target of sanction of loans from ` 25 crore in 2013-14 to ` 45 crore in 2014-15. Against this sanction target, the Corporation achieved a higher target of ` 60.72 crore and a majority of the loan sanctioned in the scheme was disbursed in the year 2015-16. The loan disbursement improved in the audit period due to Corporation getting government sponsored business of financing shops at Gazipur allotted by Delhi Agriculture Marketing Board (DAMB). A loan of ` 53.18 crore was sanctioned for the shops. The Corporation however failed to achieve the targets of disbursement of loans in 2013-14 and 2014-15. The deficit stood at 67 per cent and 77 per cent respectively.
Audit observed that out of total disbursement of ` 65.16 crore during the period 2013-14 to 2015-16, the Corporation disbursed loans of only ̀ 1.45 crore to Micro, Small and Medium Enterprises (MSME) sector, although the main objective of the Corporation was to promote, finance and develop MSME sector.
The Management stated in August 2016 that it is not getting business from MSME Sector and overall business is shrinking due to non-availability of soft loan or equity infusion by the Government and refinance from SIDBI at concessional rates.
2.3.3 Business planning
The business of the Corporation has been minimal during the three years excluding onetime business of financing shops allotted by DAMB. The Corporation did not tap the potential business as discussed below:
2.3.3.1 Financing of E-rickshaws
The BoD decided in March 2015 to provide financial assistance for purchase of E-rickshaws. It expected to finance 2,000 numbers of E-rickshaws by providing upto 80 per cent of the cost of new E-rickshaw at rate of interest of 13 per cent per annum.

Audit Report No. 5 – Revenue and Social & Economic Sectors (PSUs) for the year ended 31 March 2016
50
The Corporation received 550 applications up to September 2015 of which 304 applications were sanctioned. It disbursed ` 1.87 crore till 31 March 2016 in 226 cases. The Corporation stopped disbursing further loan noting default in 58 cases in September 2015 in repayment of first installment.
Records of the Corporation, however, revealed that due to sudden upsurge in loan applications under E-rickshaws Scheme, it could not scrutinize the documents in a timely manner and it closed the scheme in September 2015. Thus, the Corporation did business of only ` 1.87 crore immediately after opening and failed to avail of opportunity of confirmed business of ` 2.69 crore27 in 78 cases in which loan was sanctioned but not disbursed. The Corporation also lost business of financing remaining 1,450 E-rickshaws of nearly ` 12 crore due to weak marketing and poor handling of the Scheme.
The Management stated in August 2016 that Corporation restricted financial assistance to E-rickshaws as doubts were raised on recovery, due to low residual value of E-rickshaws and difficulties in tracing the owners. It also stated that GNCTD did not provide any assistance (soft loan) for the scheme. The reply is not acceptable as the Corporation was to extend loan to the registered E-rickshaw owners against security of the vehicle and collateral security of guarantors. Moreover, Audit found only six cases of default in repayment by 31 March 2016.
2.3.3.2 Venture into diversified areas
The Corporation constituted various Committees between 2008-09 and 2014-15 which recommended undertaking non-financial activities to generate additional revenue viz. transaction advisory services for projects, training and consultancy, insurance business of assets financed. They also recommended to diversify into financing infrastructure activities of nursing home/diagnostic centre, commercial shops, hotels/restaurants, information technology sector and setting up of Non-Banking Financing Company (NBFC). However, the Corporation failed to implement any of these suggestions.
2.3.4 Recovery Performance
The classification of Corporation’s loan assets as standard, sub standard, doubtful and loss assets during the period 2013-14 to 2015-16 is summarized in Table 2.3.2.
27 324 cases (550-226 cases) calculated on the basis of average rate of actual disbursement per E-rickshaw i.e. ` 0.83 lakh (` 1.87 crore/226 cases)

Chapter-II : Public Sector Undertakings
51
Table 2.3.2: Classification of Loan Assests(` in crore)
Particulars 2013-14 2014-15 2015-16
Standard assets 116.87 94.95 109.98
Sub-Standard assets (default overdue for 3 months but not exceeding 2 years )
9.38 4.39 2.62
Doubtful assets (default overdue beyond 2 years) 3.51 6.07 1.67
Loss assets (cases identified as loss but not written off) 5.07 5.10 5.28
Total Non Performing Assets (NPA) 17.96 15.56 9.57
Total outstanding loan 134.83 110.51 119.55
Percentage of NPA to total Loans 13.31% 14.08% 8.01%
The Corporation signed a Tripartite MoU with SIDBI and GNCTD in July 2011 valid for five years. The Corporation agreed to bring down the level of NPA to 10 per cent of total outstanding loan during the MoU period. The Corporation was able to achieve the target by the end of MoU period 2015-16.
2.3.5 Issues impacting financial position
2.3.5.1 Non availing of opportunity to reduce cost of borrowing
DSIIDC agreed to advance a term loan of ` 30 crore @ 9.25 per cent per annum in December 2014 to help it finance business arising out of allotment of shops by DAMB. The Corporation did not, however, avail the said loan and financed the business out of internal accruals. This was despite the Corporation carrying a loan of ` 33 crore from the GNCTD (balance out of total of ` 40 crore availed in September 2011) at a higher rate of interest of 10 per cent per annum. Thus, by not availing the loan of ` 30 crore from DSIIDC available at a lower rate of interest of 9.25 per cent per annum, the Corporation lost the opportunity to save interest expenditure of ` 28.13 lakh upto March 2016.
The Management stated (August 2016) that the Corporation did not avail the loan as it utilized its internal accruals for financing. The reply is not tenable as it would have been prudent to avail of the funds from DSIIDC at lower rates of interest and refund the outstanding higher rates loans of GNCTD.
2.3.5.2 Non-recovery of amount on claims lodged as well as liability payable to Credit Guarantee Fund Trust for Micro and Small
Enterprises (Trust)
Ministry of MSME, GoI and SIDBI set up a Credit Guarantee Fund Trust for Micro and Small Enterprises (Trust) in August 2000 which reassures the lender up to 85 per cent of the credit facility. The guarantee cover is available, under the scheme, for micro enterprises for credit up to ` 5 lakh. Audit noted that the Corporation lodged claims for 202 cases between February 2013 and

Audit Report No. 5 – Revenue and Social & Economic Sectors (PSUs) for the year ended 31 March 2016
52
November 2014 with the Trust, out of which claims in respect of 72 cases, amounting to ` 53.53 lakh was pending for recovery as on 31 March 2016. In the remaining 130 cases, where first instalment of 75 per cent was received, recovery of ` 25.91 lakh was pending for balance. Audit observed that the Corporation did not follow up the pending cases with the Trust. The Corporation was yet to recover the claim of ` 79.44 lakh as on September 2016.
As per the terms and conditions of the Scheme, the Corporation was to refund the amount, if any, subsequently recovered from the defaulting parties to the Trust. Audit observed that though the Corporation recovered ` 56.78 lakh from the defaulters between February 2013 and March 2016, it refunded only ` 5.78 lakh to the Trust and retained balance amount of ` 51 lakh payable to the Trust.
The Management stated (August 2016) that the matter will be taken up with the Trust to allow the Corporation to adjust the liability with the claims lodged and pending with the Trust.
2.3.6 Other findings
2.3.6.1 Non-renting of available excess office space
The Corporation’s corporate office has total floor area of approx. 12,520 sqft. The Corporation was occupying 8,180 sqft. and had leased out 4,340 sqft. area28 of its building to different tenants between November 2006 and October 2015. Audit observed that with every subsequent vacation of space by respective tenants, the Corporation did not take any steps to rent out the excess space to earn additional revenue. The failure to let out the excess available space by the Corporation between March 2011 and March 2016 resulted in non-availing of opportunity to earn ` 80.61 lakh (calculated at lowest rent out rate of ` 68 per sqft. earned by the Corporation from the tenant in the year 2009 for an area of 4,340 sqft.).
The Corporation stated in August 2016 that efforts were made to let out the excess space but it did not receive response and now it has uploaded the advertisement on its website. However, no records were produced to audit to establish the efforts stated to have been made.
2.3.6.2 Non-recovery of service tax from tenants
The Corporation had entered into rent agreement with different parties between November 2006 and December 2009. Renting of immovable property was made taxable w.e.f June 01, 2007. However, the Corporation did not take note of the change in the tax structure to either amend existing agreements or to ensure that agreements entered into after that date had provision for inclusion of service tax to
28 The Corporation rented out 4340 sqft. area in different portion of its building viz. 1210 sqft. at first floor from December 2008 to November 2010, 1480 sqft. at ground floor from December 2009 to August 2013 and 1650 sqft. at ground floor from November 2006 to October 2015.

Chapter-II : Public Sector Undertakings
53
be paid by the tenants. The Corporation noted the liability of service tax belatedly in June 2012 and deposited ` 21.35 lakh during 2012-13 from its own funds. It raised demand in September 2012 on the ex-tenants for payment who refused to make any payment towards service tax. Thus, failure of the Corporation to take timely note of the statutory liability of service tax resulted in non-recovery of ` 21.35 lakh which is a loss to the Corporation.
The Management stated (August 2016) that the Corporation is pursuing the matter with the ex-tenants.
2.3.7 Conclusion
Thus, the Corporation failed to avail of business opportunities as well as implement recommendations of various committees constituted by BoD to diversify its existing business in the field of consultancy, insurance and financing infrastructure activities. Lack of prudent decision making resulted in avoidable expenditure of ` 28.13 lakh on interest and loss of possible rental income of ` 80.61 lakh from surplus office space.
The matter was referred to the Government in August 2016; their reply was awaited as on November 2016.
Department of Power
Delhi Transco Limited
2.4 Delay in disposal
Delay in disposal of scrap resulted in blocking of ` 5.45 crore and loss of interest of ` 1.71 crore.
Paragraph no. 7.11.2.2 featured in Report No. 1 of the CAG for the year ended March 2012 of Govt. of NCT of Delhi highlighted loss of ` 2.54 crore due to delay in disposal of damaged transformer by Delhi Transco Limited (DTL). The Management in December 2012 had stated that to eliminate procedural delays, a scrap disposal policy was under consideration. Audit noted (January 2016) that DTL failed to finalise the policy even after a lapse of almost four years.
DTL had four transformers not in use which were disposed off during the year 2014 and 2015 with delays ranging from 13 months to 66 months29 after allowing a reasonable period of six months to allow the Company to complete the pre auction process and fix reserve price. The delay in decision making for disposal of damaged transformers, resulted in blocking of funds of ` 5.45 crore
29 In absence of any time frame, the audit has taken a reasonable period of six months for processing the case of treating transformer as scrap, fixing its reserve price and its disposal.

Audit Report No. 5 – Revenue and Social & Economic Sectors (PSUs) for the year ended 31 March 2016
54
and consequent loss of interest of ` 1.7130 crore on the disposal price of four transformers.
DTL stated (August 2016) that it has been following Quality System Procedures for disposal management and the disposal of transformers was made after the approval of the competent authority. They added that the decision to scrap the transformer depends on the report of CEA, declaring it as a scrap, fixation of reserve price by Store Disposal Committee (SDC) and its E-auctioning through MSTC. The reply is not tenable as there was delay at every stage of the process including fixation of reserve price by SDC even after getting approvals from CEA.
The matter was referred to Government in June 2016, their reply was awaited (November 2016).
2.5 Lack of coordination in procurement
Non-synchronization of activities of purchase of transformers and commissioning of associated bays resulted in blocking of funds of ` 13.15 crore and associated loss of interest of ` 4.55 crore.
Delhi Transco Limited (DTL) in its Business Plan for the Control Period 2007-11 and 2012-15, proposed (December 2007 and June 2010) augmentation of transformer capacity of 220 KV South of Wazirabad (SOW) and Gazipur substations. This augmentation work was to be completed by 2008-09 and 2013-14 for SOW and Gazipur substations respectively alongwith installation of association bays which was a pre-requisite for such energisation of transformers.
The Board of Directors of DTL approved the procurement, erection, testing and commissioning of 160 MVA transformer along with associated items for SOW in September 2008 and the purchase order was placed to a firm ‘A’ in November 2008 and supplied in September 2009. A payment of ` 7.30 crore was made between June and December 2009.
Similarly, to augment the capacity of 220 KV Gazipur substation from 200 MVA to 360 MVA, DTL decided in October 2012 to install a new 160 MVA transformer. The purchase order was placed on firm ‘B’ in December 2012 and supply received in April 2013. A payment of ` 5.85 crore was released in June and July 2013.
Both the transformers could not be commissioned in time due to non-installation of associated bays of transformers at the sites. Though the transformers were supplied in September 2009 and April 2013, the tenders for supply, erection and commissioning of associated bays at SOW and Gazipur were called for only in February and April 2013, which could not be finalised as the rates were higher against the estimated cost. The contract was ultimately finalised for ` 5.24 crore
30 calculated @10 per cent per annum, the minimum borrowing rate.

Chapter-II : Public Sector Undertakings
55
in June 2014. Finally, the bays along with transformers of SOW and Gazipur substations were energized in January 2015 and March 2015 respectively.
Audit observed that the DTL did not initiate the tender enquiry for associated bays concurrently with the purchase of transformers for SOW and Gazipur substations. This lack of synchronization of activities of purchase of transformers and commissioning of associated bays resulted in blocking of funds of ` 13.15 crore and associated loss of interest of ` 4.55 crore. It also delayed energisation of transformers and deprived the consumers of reliable power.
DTL stated in August 2016 that as per the prevailing practice, procurement of 66 KV and 220 KV bay equipment, erection, testing and commissioning of the bay equipment and civil foundation and yard development works were through separate orders but due to delay in finalisation of the orders for these activities, it was decided in October 2012 that the work should be executed through turnkey tender basis. It added that delay had occurred in tendering process due to prevalent store procedures and DTL has now adopted the policy of tendering on turnkey basis which would minimise such delays.
The matter was referred to Government in July 2016; their reply was awaited (November 2016).
2.6 Avoidable payment to Pension Trust
Avoidable payment to Pension Trust on account of TDS instead of claiming it from DISCOMs resulted in blocking of funds of ` 29.97 crore and consequent interest loss of ` 2.52 crore.
In terms of Delhi Electricity Reforms Act, 2000 and the Delhi Electricity Reforms Rules, 2001, (Transfer Scheme) the erstwhile Delhi Vidyut Board (DVB) was unbundled w.e.f. 1 July 2002 into successor utilities of generation, transmission and distribution with distribution of electricity being handled by three private companies. For the purpose of payment of retirement benefits to the pensioners, Employees Terminal Benefits Fund-2002, known as Pension Trust (Trust) was created. Since the DISCOMs were defaulting in their contributions to the Trust from time to time, Delhi Electricity Regulatory Commission (DERC), ordered in August 2012 for an interim arrangement for collection and transfer of fund to Trust by Delhi Transco Limited (DTL) on behalf of all the power utilities. The funds were accordingly provided in Aggregate Revenue Requirement of DTL. It also ordered that no rebate/TDS should be deducted on the apportioned amount by the power utilities.
Audit observed (December 2015) that two DISCOMs, BSES Rajdhani Power Ltd. (BRPL) and BSES Yamuna Power Ltd. (BYPL) while remitting ` 299.74 crore to DTL as their contribution to the Trust, deducted TDS of ` 29.97 crore. However, DTL, while transferring the contribution to the Trust, added TDS amount of

Audit Report No. 5 – Revenue and Social & Economic Sectors (PSUs) for the year ended 31 March 2016
56
` 29.97 crore deducted by BRPL/BYPL (between July 2014 and August 2015) from its own funds. Further, the Company claimed the refund of TDS in its Income Tax Return for the Assessment Year 2015-16 while it never raised the issue of deduction of TDS with the DISCOMs.
Audit observed that DTL was taking interest bearing loans from State Bank of India during 2014-15 to meet its working capital requirement. The blocking of ` 29.97 crore led to DTL suffering a loss of interest of ` 2.5231 crore till 30 November 2016.
DTL replied in August 2016 that BRPL and BYPL had wrongly deducted TDS of ` 29.97 crore on their contribution to Pension Trust for the year 2014-15. Also, there was shortage of funds with Pension Trust and in anticipation of refund of the same from the Income Tax Department, the payment was released and DISCOMs had been requested to reimburse ` 1.90 crore.
The matter was referred to the Government in June 2016, their reply was awaited (November 2016).
Department of Tourism
Delhi Tourism and Transport Development Corporation Ltd.
2.7 Non-recovery of parking charges from private operator
The Corporation did not enforce terms of agreement relating to payment of parking charges of ` 1.93 crore by private operator though it granted concession of extension of moratorium for payment of revenue share foregoing income of ` 1.20 crore.
Delhi Tourism and Transportation Development Corporation (DTTDC) entered into an agreement on 10 July 2010 with an Operator to start “HOP ON HOP OFF” (HoHo) tourist bus service. The contract was effective for 10 years with effect from 15 September 2010. The bus service was to cover important tourist destinations in NCT of Delhi.
The agreement stipulated that in consideration of the right to procure, operate and maintain the HoHo bus service, the operator shall share 12 per cent of the gross revenue net of applicable taxes with DTTDC after 24 months from Commercial Operations Date (COD). The operator requested DTTDC (July 2012) for extension of moratorium period for further two years till September 2014 citing continuous losses. At the instance of GNCTD, DTTDC agreed to extend the moratorium
31 The loss of interest is calculated @10.1 per cent p.a. upto 31 March 2015 and @ 4.1 per cent p.a w.e.f April 2015, after giving benefit of 6 per cent interest available on refund of excess TDS under section 244A of Income Tax Act, 1961.

Chapter-II : Public Sector Undertakings
57
period further for two years (January 2013) thereby foregoing revenue share of ` 1.20 crore. The service continues to operate at a loss (November 2016).
The agreement also provided that the operator shall manage facilities for parking and maintenance of the buses with such facilities being provided by DTTDC in association with Delhi Transport Corporation (DTC) and other land owning agencies. In August 2010, DTC agreed to provide space for parking the HoHo buses at its Indraprastha Depot on cost basis and subsequently raised (September 2012) a demand for ` 62.07 lakh for period from October 2010 to September 2012. This was communicated by DTTDC to the operator in October 2012 but the operator refused to pay the charges towards parking on the ground that it was not provided for in the agreement. Subsequently in February 2013, DTC sent another communication for release of outstanding payment of ` 75.17 lakh for period from October 2010 to February 2013. Thereafter, DTTDC issued a Show Cause Notice to the operator in February 2013 for payment of the charges. The show cause notice stated that non-payment of the charges would constitute a violation of the terms of the agreement rendering it liable for cancellation and recovery of outstanding amount from the operator. The liability on account of the parking charges had accumulated to ` 1.93 crore as of January 2016. In March 2016, the Senior Standing Counsel, GNCTD, on a reference made by DTTDC, opined that the operator was liable to bear the parking charges under the terms of the agreement.
Audit observed that no further action had been taken by DTTDC to enforce the terms of the agreement though it had already granted a concession to the operator by extending the moratorium period for revenue sharing by two years foregoing income of ` 1.20 crore.
Management stated (May 2016) that HoHo bus service was started in a time bound manner on behalf of Delhi Government without any financial interest to promote the cause of tourism without any profit motive. It added that neither the Request for Quotation (RFQ) document nor agreement had any provision for payment of parking rental for land owning agency like DTC. The reply is not tenable as it contradicts its own position taken in issue of the show cause notice and the legal opinion of the Government Counsel.
The matter was referred to the Government in June 2016; their reply was awaited (November 2016).

Audit Report No. 5 – Revenue and Social & Economic Sectors (PSUs) for the year ended 31 March 2016
58
Department of Transport
Delhi Transport Infrastructure Development Corporation Limited
2.8 Short recovery of Concession Fee
Delhi Transport Infrastructure Development Corporation Limited
(DTIDCL) failed to recover Concession Fee as per an agreement resulting
in short recovery of ` 1.49 crore. It also failed to charge interest of
` 1.49 crore on delayed payment of Concession Fee.
The Department of Transport (DoT) and Delhi Integrated Multi-Modal Transit System Limited (DIMTS- referred to as ‘Concessionaire’) signed an agreement for construction, operation and maintenance of 250 Bus Queue Shelters (BQSs) in April 2010 with private sector participation for 20 years. GNCTD ordered (August 2012) the construction and maintenance of all the BQSs in NCT of Delhi (including the said 250 BQSs) transferred to the Delhi Transport Infrastructure Development Corporation Limited (DTIDCL) w.e.f 16 August 2012. The DTIDCL was to sign a supplementary concession agreement with DIMTS for execution of obligations of DoT and realization of monthly payment in respect of concession agreement signed by the DoT for marketing, operation and maintenance of 250 BQSs. DTIDCL is yet to (November 2016) sign a supplementary concession agreement with the DIMTS.
As per article 11.1(i) of the existing agreement, DIMTS was to pay concession fee of 16 per cent of net revenue earned by it on sale/renting of advertising and other space on the BQSs subject to a minimum concession fee of ` 23.15 lakh per calendar month for 250 BQSs for the first year after commercial operation date (COD) irrespective of the revenue earned by the Concessionaire. For the subsequent years, the concession fee was to be increased by 5 per cent per year over and above the concession fee for the previous year. Article 11.1 (iii) stipulated that the minimum concession fee due would be paid not later than the 15th day of the first month of the quarter for which it is due. Additional concession fee over the minimum concession fee, calculated at 16 per cent of the revenue, was to be paid within 30 days of the end of each quarter along with audited quarterly reports. Failure to pay the concession fee in time was to attract an interest of 10 per cent per annum on the entire amount of unpaid concession fee payable during the quarter.
Audit noticed that the COD of the project was 1 November 2010 and the concessionaire did not remit the concession fee as per terms of agreement. The concessionaire paid only ̀ 15.33 crore instead of ̀ 16.82 crore for the period from

Chapter-II : Public Sector Undertakings
59
November 2010 to March 2016, resulting in short recovery of ` 1.49 crore. The concessionaire also did not pay the concession fee quarterly as per the prescribed schedule. However, DTIDCL did not charge interest of ` 1.49 crore32 on delayed payment of concession fee for the period from November 2010 to March 2016.
Thus, the DTIDCL failed to recover full concession fee of ` 1.49 crore from DIMTS and also did not charge interest of ` 1.49 crore on delayed payment as per agreement.
The matter was referred to the Government/ Management in July 2016, their reply
was awaited (November 2016).
New Delhi (SUSHIL KUMAR JAISWAL)Dated: 06 February 2017 Accountant General (Audit), Delhi
Countersigned
New Delhi (SHASHI KANT SHARMA)Dated: 08 February 2017 Comptroller and Auditor General of India
32 calculated at a rate of 10 per cent per annum


Chapter-I : Revenue Sector
61
Annexures


Annexures
61
Annexure 2.1(i)
Statement showing investments made by State Government in PSUs whose accounts are in arrears
(Referred to in paragraph no. 2.1.9)(Figures in columns 4 and 6 to 8 are ` in crore)
Sl. No.
Name of the Public Sector Undertaking
Year upto
which accounts finalised
Paid up capital as per latest finalised accounts
Period of accounts pending
finalisation
Investment made by State Government during the years for which the accounts
are in arrears
Year Equity Loans Grants/ Subsidy
(1) (2) (3) (4) (5) (6) (7) (8)
A Working Companies/ Corporations
1 Delhi SC/ST /OBC/Minorities & Handicapped Financial and Development Corporation Limited
2003-04 25.92 12 years (2004-05 to
2015-16)
2004-05 0.00 0.00 2.04
2005-06 1.81 0.00 0.66
2006-07 0.00 0.34 0.00
2007-08 7.00 2.15 0.00
2008-09 0.64 0.00 0.36
2009-10 6.00 0.00 0.64
2010-11 3.83 0.00 0.51
2011-12 0.00 0.00 0.50
2012-13 0.00 50.00 0.53
2013-14 0.00 0.00 81.00
2014-15 0.00 0.00 0.00
2015-16 0.00 0.00 0.55
2 Delhi State Industrial & Infrastructure Development Corporation Limited
2014-15 21.00 1 year (2015-16)
2015-16 0.00 0.00 0.00
3 Delhi Power Company Limited
2014-15 745.05 1 year (2014-15)
2015-16 0.00 0.00 182.18
4 Delhi Transco Limited 2014-15 3,951.00 1 year (2014-15)
2015-16 0.00 295.00 0.00
5 Indraprastha Power Generation Company Limited
2014-15 736.54 1 year (2014-15)
2015-16 0.00 90.00 5.00

Audit Report No. 5 – Revenue and Social & Economic Sectors (PSUs) for the year ended 31 March 2016
62
Sl. No.
Name of the Public Sector Undertaking
Year upto
which accounts finalised
Paid up capital as per latest finalised accounts
Period of accounts pending
finalisation
Investment made by State Government during the years for which the accounts
are in arrears
Year Equity Loans Grants/ Subsidy
(1) (2) (3) (4) (5) (6) (7) (8)
6 Pragati Power Corporation Limited
2014-15 2,074.19 1 year (2014-15)
2015-16 0.00 180.00 0.00
7 Delhi State Civil Supplies Corporation Limited
2014-15 7.00 1 year (2014-15)
2015-16 0.00 0.00 0.00
8 Delhi Transport and Infrastructure Development Corporation Limited
2012-13 10.65 3 year (2013-14 to
2015-16)
2013-14 0.00 10.00 0.00
2014-15 0.00 0.00 0.00
2015-16 0.00 0.00 0.00
9 DSIIDC Energy Limited*
2014-15 0.01 1 year (2015-16)
2015-16 0.00 0.00 0.00
10 DSIIDC Liquor Ltd* 2014-15 0.01 1 year (2015-16)
2015-16 0.00 0.00 0.00
11 DSIIDC Exim Ltd* 2014-15 0.01 1 year (2015-16)
2015-16 0.00 0.00 0.00
12 DSIIDC Maintenance Services Ltd*
2014-15 0.01 1 year (2015-16)
2015-16 0.00 0.00 0.00
Total A (Working Government Companies)
7,571.39 19.28 627.49 273.97
B Working Statutory Corporations
1 Delhi Financial Corporation
2014-15 26.36 1 year (2015-16)
2015-16 0.00 0.00 0.00
2 Delhi Transport Corporation
2014-15 1,983.85 1 year (2015-16)
2015-16 0.00 0.00 1,151.68
Total B (Working Statutory Corporations)
2,010.21 0.00 0.00 1,151.68
Grand Total (A+B) 9,581.60 19.28 627.49 1,425.65
Total Investment 2,072.42
*subsidiaries of DSIIDC (Investment made by DSIIDC)

Annexures
63
Annexures
Ann
exur
e –
2.1
(ii)
Sum
mar
ised
fina
ncia
l pos
itio
n an
d w
orki
ng r
esul
ts o
f G
over
nmen
t co
mpa
nies
and
Sta
tuto
ry c
orpo
rati
ons
as p
er t
heir
late
st
final
ised
fina
ncia
l sta
tem
ents
/ acc
ount
s (R
efer
red
to in
par
agra
ph 2
.1.1
0)(F
igur
es in
Col
umns
5 t
o 12
are
` in
cro
re)
Sl.
Sect
or &
Nam
e of
th
e C
ompa
nyP
erio
d of
A
ccou
nts
Yea
r in
w
hich
ac
coun
ts
final
ised
Pai
d up
C
apit
alL
oans
out
-st
andi
ng a
t th
e en
d of
the
ye
ar
Acc
umul
ated
P
rofit
(+
)/
Los
s (-
)
Tur
nove
rN
et P
rofit
(+
)/ L
oss
(-)
Net
Im
pact
of
Aud
it
Com
men
ts1
Cap
ital
em
ploy
ed2
Ret
urn
on c
apit
al
empl
oyed
3
Per
cent
-ag
e re
turn
on
cap
ital
em
ploy
ed
Man
-po
wer
Net
Pro
fit/ L
oss
befo
re I
nter
est
& D
epre
ciat
ion
Inte
rest
Dep
re-
ciat
ion
Net
Pro
fit/
Los
s (b
e-fo
re t
ax)
(1)
(2)
(3)
(4)
(5)
(6)
(7)
(8)
9 (a
)9
(b)
9 (c
) 9(
d)(1
0)(1
1)(1
2)(1
3)(1
4)
A. W
orki
ng G
over
nmen
t C
ompa
nies
FIN
AN
CE
1D
elhi
SC
/ST
/OB
C/
Min
orit
ies
& H
andi
-ca
pped
Fin
anci
al a
nd
Dev
elop
men
t Cor
po-
rati
on L
imit
ed
2003
-04
2013
-14
25.9
211
.79
26.9
911
.09
6.22
0.40
0.25
5.57
0.00
81.9
45.
977.
2916
5
Sect
or w
ise
tota
l
25
.92
11.7
926
.99
11.0
96.
220.
400.
255.
570.
0081
.94
5.97
7.29
165
INF
RA
STR
UC
TU
RE
2D
elhi
Sta
te I
ndus
tria
l &
Inf
rast
ruct
ure
De-
velo
pmen
t Cor
pora
-ti
on L
imit
ed
2014
-15
2015
-16
21.0
00.
0039
5.79
1,12
7.41
114.
640.
002.
0711
2.57
63.5
02,
065.
0711
2.57
5.45
1,46
6
3S
hahj
ahan
abad
R
edev
elop
men
t C
orpo
rati
on4
2015
-16
2016
-17
0.00
0.00
0.00
0.00
0.01
0.00
0.01
0.00
0.00
0.18
0.00
0.00
16
Sect
or w
ise
tota
l
21
.00
0.00
395.
791,
127.
4111
4.65
0.00
2.08
112.
5763
.50
2,06
5.25
112.
575.
451,
482
1 Im
pact
of
acco
unts
com
men
ts in
clud
e th
e ne
t im
pact
of
com
men
ts o
f S
tatu
tory
Aud
itor
s an
d C
AG
issu
ed d
urin
g th
e pe
riod
Oct
ober
201
5 to
Sep
tem
ber
2016
on
the
late
st fi
nali
sed
acco
unts
and
is d
enot
ed b
y (+
) in
crea
se in
pro
fit/
dec
reas
e in
loss
es (
-) d
ecre
ase
in p
rofi
t/ in
crea
se in
loss
es.
2 Cap
ital
em
ploy
ed r
epre
sent
s ne
t fixe
d as
sets
(in
clud
ing
capi
tal w
orks
-in-
prog
ress
) pl
us w
orki
ng c
apit
al e
xcep
t in
case
of
fina
nce
com
pani
es/c
orpo
rati
ons
whe
re th
e ca
pita
l em
ploy
ed
is w
orke
d ou
t as
a m
ean
of a
ggre
gate
of
the
open
ing
and
clos
ing
bala
nces
of
paid
up
capi
tal,
free
res
erve
s, b
onds
, dep
osit
s an
d bo
rrow
ings
(in
clud
ing
refi
nanc
e).
3 Ret
urn
on c
apit
al e
mpl
oyed
has
bee
n w
orke
d ou
t by
addi
ng p
rofi
t and
inte
rest
cha
rged
to p
rofi
t and
loss
acc
ount
.4 S
RC
has
a p
aid
up c
apit
al o
f `
700
only
, int
eres
t of `
658
and
accu
mul
ated
pro
fit o
f `
44,
492
only

Audit Report No. 5 – Revenue and Social & Economic Sectors (PSUs) for the year ended 31 March 2016
64
Sl.
Sect
or &
Nam
e of
th
e C
ompa
nyP
erio
d of
A
ccou
nts
Yea
r in
w
hich
ac
coun
ts
final
ised
Pai
d up
C
apit
alL
oans
out
-st
andi
ng a
t th
e en
d of
the
ye
ar
Acc
umul
ated
P
rofit
(+
)/
Los
s (-
)
Tur
nove
rN
et P
rofit
(+
)/ L
oss
(-)
Net
Im
pact
of
Aud
it
Com
men
ts1
Cap
ital
em
ploy
ed2
Ret
urn
on c
apit
al
empl
oyed
3
Per
cent
-ag
e re
turn
on
cap
ital
em
ploy
ed
Man
-po
wer
Net
Pro
fit/ L
oss
befo
re I
nter
est
& D
epre
ciat
ion
Inte
rest
Dep
re-
ciat
ion
Net
Pro
fit/
Los
s (b
e-fo
re t
ax)
(1)
(2)
(3)
(4)
(5)
(6)
(7)
(8)
9 (a
)9
(b)
9 (c
) 9(
d)(1
0)(1
1)(1
2)(1
3)(1
4)
PO
WE
R
4D
elhi
Pow
er C
om-
pany
Lim
ited
20
14-1
520
15-1
674
5.05
2,51
7.63
-1,6
09.4
70.
0010
9.84
64.5
80.
0445
.22
321.
623,
574.
5010
9.80
3.07
17
5D
elhi
Tra
nsco
L
imit
ed20
14-1
520
15-1
63,
951.
001,
642.
94-2
,293
.10
814.
8665
0.06
120.
4415
1.31
378.
3158
.16
3,91
9.51
498.
7512
.72
1,45
0
6In
drap
rast
ha P
ower
G
ener
atio
n C
ompa
ny
Lim
ited
2014
-15
2015
-16
736.
5462
.57
455.
9485
7.48
157.
9110
8.68
41.6
07.
6312
9.26
1,32
5.49
116.
318.
7787
3
7P
raga
ti P
ower
Cor
po-
rati
on L
imit
ed
2014
-15
2015
-16
2,07
4.19
1,99
1.82
1,48
8.61
2,73
8.36
1,18
4.53
301.
4428
7.26
595.
830.
006,
702.
6089
7.27
13.3
930
0
8D
SII
DC
Ene
rgy
Lim
ited
2014
-15
2015
-16
0.01
0.00
0.21
0.16
0.11
0.00
0.00
0.11
0.00
0.23
0.11
47.8
30
Sect
or w
ise
tota
l
7,
506.
796,
214.
96-1
,957
.81
4,41
0.86
2,10
2.45
595.
1448
0.21
1,02
7.10
509.
0415
,522
.33
1,62
2.24
10.4
52,
640
SER
VIC
ES
9D
elhi
Sta
te C
ivil
S
uppl
ies
Cor
pora
tion
L
imit
ed
2014
-15
2015
-16
7.00
2.14
24.0
689
3.78
9.36
0.00
0.79
8.57
5.31
47.8
28.
5717
.92
611
10D
elhi
Tou
rism
and
T
rans
port
atio
n D
evel
opm
ent C
orpo
-ra
tion
Lim
ited
2015
-16
2016
-17
6.28
0.00
115.
321,
112.
706.
790.
084.
232.
488.
8418
0.95
2.56
1.41
731
11G
eosp
atia
l Del
hi
Lim
ited
20
15-1
620
16-1
710
.76
0.00
6.70
6.64
5.23
0.00
0.46
4.77
-3.1
619
.04
4.77
25.0
574
12D
SII
DC
Exi
m
Lim
ited
2014
-15
2015
-16
0.01
0.03
-0.0
40.
000.
000.
000.
000.
000.
000.
000.
000.
000
13D
SII
DC
Liq
uor
Lim
ited
2014
-15
2015
-16
0.01
0.00
-0.0
40.
000.
000.
000.
000.
000.
00-0
.03
0.00
0.00
0
14D
SII
DC
Mai
nten
ance
S
ervi
ces
Lim
ited
2014
-15
2015
-16
0.01
0.00
-0.0
70.
00-0
.01
0.00
0.00
-0.0
10.
00-0
.06
-0.0
10.
000
Sect
or w
ise
tota
l
24
.07
2.17
145.
932,
013.
1221
.37
0.08
5.48
15.8
110
.99
247.
7215
.89
6.41
1,41
6

Annexures
65
Sl.
Sect
or &
Nam
e of
th
e C
ompa
nyP
erio
d of
A
ccou
nts
Yea
r in
w
hich
ac
coun
ts
final
ised
Pai
d up
C
apit
alL
oans
out
-st
andi
ng a
t th
e en
d of
the
ye
ar
Acc
umul
ated
P
rofit
(+
)/
Los
s (-
)
Tur
nove
rN
et P
rofit
(+
)/ L
oss
(-)
Net
Im
pact
of
Aud
it
Com
men
ts1
Cap
ital
em
ploy
ed2
Ret
urn
on c
apit
al
empl
oyed
3
Per
cent
-ag
e re
turn
on
cap
ital
em
ploy
ed
Man
-po
wer
Net
Pro
fit/ L
oss
befo
re I
nter
est
& D
epre
ciat
ion
Inte
rest
Dep
re-
ciat
ion
Net
Pro
fit/
Los
s (b
e-fo
re t
ax)
(1)
(2)
(3)
(4)
(5)
(6)
(7)
(8)
9 (a
)9
(b)
9 (c
) 9(
d)(1
0)(1
1)(1
2)(1
3)(1
4)
TR
AN
SP
OR
T
15D
elhi
Tra
nspo
rt a
nd
Infr
astr
uctu
re D
evel
-op
men
t Cor
pora
tion
L
imit
ed
2012
-13
2014
-15
10.6
520
.00
21.9
728
.23
36.0
119
.31
1.98
14.7
20.
0021
9.84
34.0
315
.48
135
Sect
or w
ise
tota
l
10
.65
20.0
021
.97
28.2
336
.01
19.3
11.
9814
.72
0.00
219.
8434
.03
15.4
813
5
Tota
l A (
All
sec
tor
wis
e w
orki
ng G
over
nmen
t com
-pa
nies
)
7,58
8.43
6,24
8.92
-1,3
67.1
37,
590.
712,
280.
7061
4.93
490.
001,
175.
7758
3.53
18,1
37.0
81,
790.
709.
875,
838
B. W
orki
ng S
tatu
tory
cor
pora
tion
s
FIN
AN
CE
16D
elhi
Fin
anci
al
Cor
pora
tion
2014
-15
2015
-16
26.3
651
.33
0.00
14.8
97.
545.
230.
282.
030.
1612
6.39
7.26
5.74
93
Sect
or w
ise
tota
l
26
.36
51.3
30.
0014
.89
7.54
5.23
0.28
2.03
0.16
126.
397.
265.
7493
TR
AN
SPO
RT
17D
elhi
Tra
nspo
rt
Cor
pora
tion
2014
-15
2015
-16
1,98
3.85
11,6
76.1
4-2
1,88
8.78
992.
1787
.32
2,83
5.97
169.
11-2
,917
.76
-1,9
78.5
02,
414.
00-8
1.79
-3.3
930
,527
Sect
or w
ise
tota
l
1,
983.
8511
,676
.14
-21,
888.
7899
2.17
87.3
22,
835.
9716
9.11
-2,9
17.7
6-1
,978
.50
2,41
4.00
-81.
79-3
.39
30,5
27
Tota
l B (
All
sec
tor
wis
e w
orki
ng S
tatu
tory
cor
pora
-ti
ons)
2,01
0.21
11,7
27.4
7-2
1,88
8.78
1,00
7.06
94.8
62,
841.
2016
9.39
-2,9
15.7
3-1
,978
.34
2,54
0.39
-74.
53-2
.93
30,6
20
Gra
nd T
otal
(A
+ B
)
9,
598.
6417
,976
.39
-23,
255.
918,
597.
772,
375.
563,
456.
1365
9.39
-1,7
39.9
6-1
,394
.81
20,6
77.4
71,
716.
178.
3036
,458
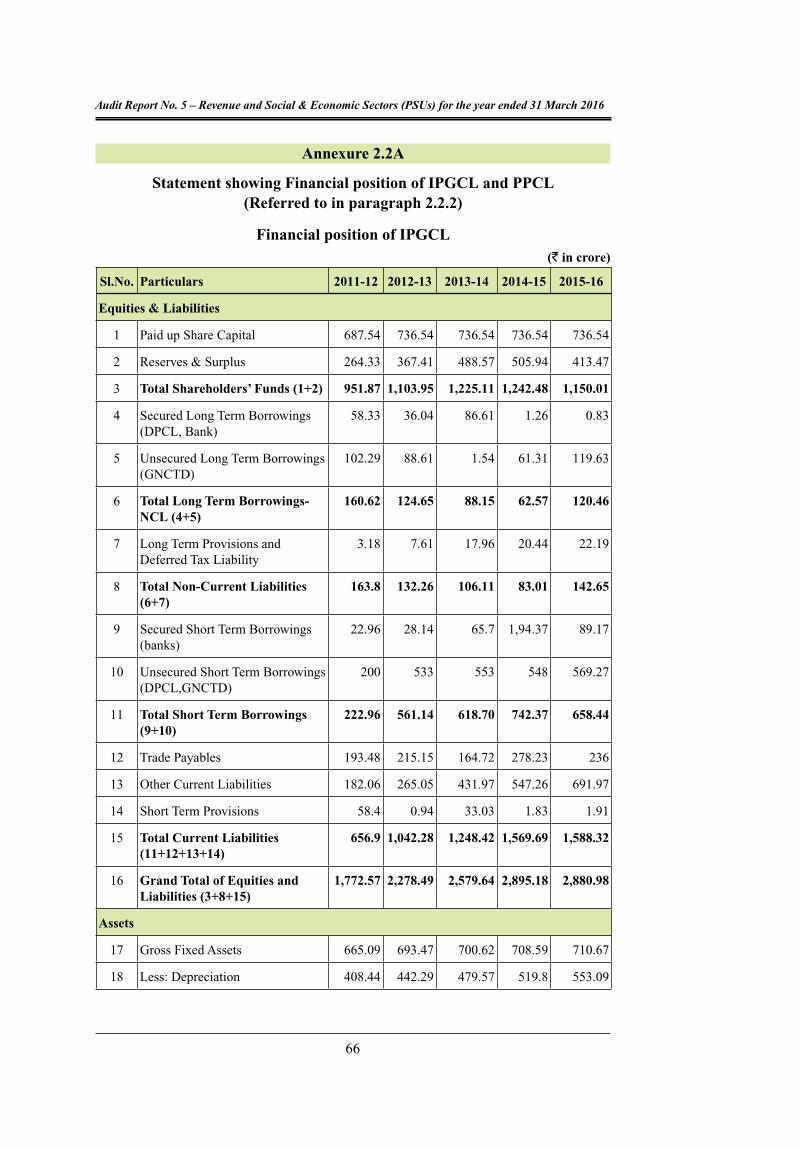
Audit Report No. 5 – Revenue and Social & Economic Sectors (PSUs) for the year ended 31 March 2016
66
Annexure 2.2A
Statement showing Financial position of IPGCL and PPCL (Referred to in paragraph 2.2.2)
Financial position of IPGCL(` in crore)
Sl.No. Particulars 2011-12 2012-13 2013-14 2014-15 2015-16
Equities & Liabilities
1 Paid up Share Capital 687.54 736.54 736.54 736.54 736.54
2 Reserves & Surplus 264.33 367.41 488.57 505.94 413.47
3 Total Shareholders’ Funds (1+2) 951.87 1,103.95 1,225.11 1,242.48 1,150.01
4 Secured Long Term Borrowings (DPCL, Bank)
58.33 36.04 86.61 1.26 0.83
5 Unsecured Long Term Borrowings (GNCTD)
102.29 88.61 1.54 61.31 119.63
6 Total Long Term Borrowings-NCL (4+5)
160.62 124.65 88.15 62.57 120.46
7 Long Term Provisions and Deferred Tax Liability
3.18 7.61 17.96 20.44 22.19
8 Total Non-Current Liabilities (6+7)
163.8 132.26 106.11 83.01 142.65
9 Secured Short Term Borrowings (banks)
22.96 28.14 65.7 1,94.37 89.17
10 Unsecured Short Term Borrowings (DPCL,GNCTD)
200 533 553 548 569.27
11 Total Short Term Borrowings (9+10)
222.96 561.14 618.70 742.37 658.44
12 Trade Payables 193.48 215.15 164.72 278.23 236
13 Other Current Liabilities 182.06 265.05 431.97 547.26 691.97
14 Short Term Provisions 58.4 0.94 33.03 1.83 1.91
15 Total Current Liabilities (11+12+13+14)
656.9 1,042.28 1,248.42 1,569.69 1,588.32
16 Grand Total of Equities and Liabilities (3+8+15)
1,772.57 2,278.49 2,579.64 2,895.18 2,880.98
Assets
17 Gross Fixed Assets 665.09 693.47 700.62 708.59 710.67
18 Less: Depreciation 408.44 442.29 479.57 519.8 553.09

Annexures
67
Sl.No. Particulars 2011-12 2012-13 2013-14 2014-15 2015-16
19 Net Fixed Assets (17-18) 256.65 251.18 221.05 188.79 157.58
20 Capital Work-in-Progress 0 0.51 0
21 Non-Current Investments 580.37 629.37 629.37 635.38 666.44
22 Long Term Loans & Advances and Other Non-Current Assets
1.65 7.98 7.83 69.45 83.76
23 Total Non-Current Assets (19+20+21+22)
838.67 888.53 858.25 894.13 907.78
24 Inventories 68.29 41.22 51.60 39.48 38.19
25 Trade Receivables 810.82 1,299.76 1,637.94 1,807.83 1,740.03
26 Cash & Bank Balances 5.28 4.85 1.69 5.00 6.75
27 Short Term Loans & Advances 22.74 43.85 30 148.56 188.06
28 Other Current Assets 26.77 0.28 0.15 0.19 0.17
29 Total Current Assets (24+25+26+27+28)
933.9 1389.96 1721.38 2001.06 1973.2
30 Grand Total of Assets (23+29) 1,772.57 2,278.49 2,579.63 2,895.19 2,880.98
Ratio Analysis
31 Debt Equity Ratio = Debt/Equity (6/3)
0.17 0.11 0.07 0.05 0.10
32 Capital Employed = Current Assets + Net Fixed Assets-Current Liabilities (29+19-15)
533.65 598.86 694.01 620.16 542.46
33 Total Assets = Total Current Assets + Total Non-Current Assets (29+23)
1,772.57 2,278.49 2,579.63 2,895.19 2,880.98
34 Total Liabilities = Total Current Liabilities + Total Non-Current Liabilities ( 8+15)
820.7 1,174.54 1,354.53 1,652.70 1,730.97
35 Net Worth = Total Assets-Total Liabilities (33-34)
951.87 1,103.95 1,225.1 1,242.49 1,150.01
36 Working Capital Ratio = CA/CL (29/15)
1.42 1.33 1.38 1.27 1.24

Audit Report No. 5 – Revenue and Social & Economic Sectors (PSUs) for the year ended 31 March 2016
68
Financial Position of PPCL(` in crore)
Sl.No. Particulars 2011-12 2012-13 2013-14 2014-15 2015-16
Equities & Liabilities
1 Paid up Share Capital 1,424.19 1,824.19 2,074.19 2,074.19 2,074.19
2 Reserves & Surplus 802.89 1,059.75 1,477.62 1,838 2,009.62
3 Total Shareholders’ Funds (1+2) 2,227.08 2,883.94 3,551.81 3,912.19 4,083.81
4 Deferred Revenue 46.96 46.96 0 0 0
5 Secured Long Term Borrowings (DPCL, Bank)
1,915.58 1,778.85 1,642.04 1,505.15 1,368.27
6 Unsecured Long Term Borrowings (GNCTD)
237.32 360 426.67 486.67 593.33
7 Total Long Term Borrowings-NCL (5+6)
2,152.90 2,138.85 2,068.71 1,991.82 1,961.60
8 Other Long Term Liabilities, Long Term Provisions and Deferred Tax Liability
344.29 386.6 710.23 798.6 796.31
9 Total Non-Current Liabilities (7+8)
2,497.19 2,525.45 2,778.94 2,790.42 2,757.91
10 Secured Short Term Borrowings (Banks)
48.58 65.20 86.40 186.99 160.83
11 Unsecured Short Term Borrowings (DPCL,GNCTD)
100 300 320 300 379.66
12 Total Short Term Borrowings (10+11)
148.58 365.2 406.4 486.99 540.49
13 Trade Payables 37.70 117.16 43.71 77.83 88.51
14 Other Current Liabilities 383.63 498.94 445.81 615.49 811.73
15 Short Term Provisions 43.12 12.63 93.28 0.53 0.41
16 Total Current Liabilities (12+13+14+15)
613.03 993.93 989.20 1,180.84 1,441.14
17 Grand Total of Equities and Liabilities (3+4+9+16)
5,384.26 6,450.28 7,319.95 7,883.45 8,282.86
Assets
18 Gross Fixed Assets 5,208.91 5,500.77 5,419.62 5,717.01 5,749.55

Annexures
69
Sl.No. Particulars 2011-12 2012-13 2013-14 2014-15 2015-16
19 Less: Depreciation 522.51 685.96 889.51 1,180.78 1,474.59
20 Net Fixed Assets(18-19)
4,686.40 4,814.81 4,530.11 4,536.23 4,274.96
21 Capital Work-in-Progress 292.6 181.09 181.62
22 Non-Current Investments 0 0 0 0 0
23 Long Term Loans & Advances and Other Non-Current Assets
17.01 14.73 8.85 6.95 9.73
24 Total Non-Current Assets (20+21+22+23)
4,703.41 4,829.54 4,831.56 4,724.27 4,466.31
25 Inventories 41.31 106.35 141.18 58.12 63.68
26 Trade Receivables 671.74 1,359.48 1,959.65 2,637.39 3,275.63
27 Cash & Bank Balances 362.68 377.30 355.05 433.41 452.87
28 Short Term Loans & Advances 3.92 15.68 24.40 21.59 17.09
29 Other Current Assets 1.20 11.93 8.11 8.67 7.28
30 Total Current Assets (25+26+27+28+29)
1,080.85 1,870.74 2,488.39 3,159.18 3,816.55
31 Grand Total of Assets 5,784.26 6,700.28 7,319.95 7,883.45 8,282.86
Ratio Analysis
32 Debt Equity Ratio = Debt/Equity (7/3)
0.97 0.74 0.58 0.51 0.48
33 Capital Employed = Current Assets+ Net Fixed Assets-Current Liabilities (30+20-16)
5,154.22 5,691.62 6,029.3 6,514.57 6,650.37
34 Total Assets = Total Current Assets + Total Non-Current Assets (30+24)
5,784.26 6,700.28 7,319.95 7,883.45 8,282.86
35 Total Liabilities = Total Current Liabilities + Total Non-Current Liabilities (9+16)
3,110.22 3,519.38 3,768.14 3,971.26 4,199.05
36 Net Worth = Total Assets-Total Liabilities (34-35)
2,674.04 3,180.90 3,551.81 3,912.19 4,083.81
37 Working Capital Ratio (30/16) 1.76 1.88 2.52 2.68 2.64

Audit Report No. 5 – Revenue and Social & Economic Sectors (PSUs) for the year ended 31 March 2016
70
Annexure 2.2B
Statement showing working results of IPGCL and PPCL (Referred to in paragraph 2.2.2)
Working results of IPGCL(` in crore)
Sl.No. Particulars 2011-12 2012-13 2013-14 2014-15 2015-16
1 Sale of energy 1,065.13 977.48 763.43 816.09 318.22
2 Surcharge on sale of energy 56.76 107.99 202.85 38.49 27.31
3 Sale of fly ash 5.61 5.58 2.83 2.89 0.2
4 Total revenue from operations (1+2+3)
1,127.5 1,091.05 969.11 857.47 345.73
5 Interest Income 1.05 0.84 0.31 0.18 33.55
6 Total Other Income including Interest Income
24.37 6.29 4.29 2.58 70.12
7 Total Revenue (4+6) 1,151.87 1,097.34 973.40 860.05 415.85
8 Coal 182.54 222 115.55 136.58 16.33
9 Oil 9.47 13.32 13.50 8.52 0.58
10 Gas 375.93 459.19 364.39 423.33 189.40
11 Total Fuel Cost (8+9+10) 567.94 694.51 493.44 568.43 206.31
12 Employees Cost 77.44 81.78 75.08 59.41 66.09
13 Administrative and General Expenses (A&G Expenses)
75.52 71.85 54.68 72.61 64.93
14 Depreciation 27.9 35.85 37.78 41.59 33.85
15 Interest and Finance Charges 41.79 73.92 122.76 110.39 134.52
16 Total Cost other than Fuel Cost (12 to 15)
222.65 263.4 290.3 284 299.39
17 Total Cost (11+16) 790.59 957.91 783.74 852.43 505.7
18 Profit before exceptional items, prior period items and tax
361.28 139.43 189.66 7.62 -89.85
19 Add(+)/less (-) Adjustment exceptional items, prior period items and tax
-95.12 -40.35 68.50 -9.72 2.62

Annexures
71
Sl.No. Particulars 2011-12 2012-13 2013-14 2014-15 2015-16
20 Profit After Tax 266.16 99.08 121.16 17.34 -92.47
21 Percentage of Interest and Finance Charges to Total Cost
5.29 7.72 15.66 12.95 26.60
22 Percentage of Fuel Cost to Total Cost
71.84 72.50 62.96 66.68 40.80
23 Percentage of Employee and A&G expenses to Total Cost
19.35 16.04 16.56 15.49 25.91
24 Percentage of Fuel Cost to Operational Revenue
50.4 63.7 50.9 66.3 59.7
Generation
25 Total generation (In MUs) 2,056.72 2,100.63 1,420.83 1,359.87 513.68
26 Less: Auxiliary consumption (In MUs)
145.76 143.03 88.75 97.12 29.586
27 Total generation available for Transmission and Distribution (In MUs) (25-26)
1,910.96 1957.6 1,332.08 1,262.75 484.094
28 Realization (per unit) (4/27×10)
5.90 5.57 7.28 6.79 7.14
29 Fixed Cost (per unit) (16/27×10)
1.17 1.35 2.18 2.25 6.18
30 Variable Cost (per unit) (11/27×10)
2.97 3.55 3.70 4.50 4.26
31 Total Cost per unit (29+30) 4.14 4.89 5.88 6.75 10.45
32 Contribution (28-30) 2.93 2.03 3.57 2.29 2.88
33 Profit (+)/Loss(-) (28-31) 1.76 0.68 1.39 0.04 -3.31

Audit Report No. 5 – Revenue and Social & Economic Sectors (PSUs) for the year ended 31 March 2016
72
Working results of PPCL(` in crore)
Sl.No. Particulars 2011-12 2012-13 2013-14 2014-15 2015-16
1 Sale of energy 964.67 1,782.42 1,943.22 2,691.4 2,111
2 Surcharge on sale of energy 40.54 92.74 195.77 46.95 47.84
3 Total revenue from operations (1+2)
1,005.21 1,875.16 2,138.99 2,738.35 2,158.84
4 Interest Income 19.74 39.10 38.64 37.89 37.41
5 Total Other Income including Interest Income
17.72 39.16 34.27 37.97 40.19
6 Total Revenue (3+5) 1,022.93 1,914.32 2,173.26 2,776.32 2,199.03
7 Fuel Cost 636.78 1,102.7 996.99 1,425.7 1,121.04
8 Employees Cost 30.59 38.19 47.93 70.19 74.66
9 Administrative and General expenses (A&G expenses)
43.5 122.37 79.1 90.56 179.74
10 Depreciation 71.45 163.35 202.23 287.26 294.35
11 Interest and Finance Charges
37.22 165.76 249.1 306.77 331.38
12 Total Cost other than Fuel Cost (8 to 11)
182.76 489.67 578.36 754.78 880.13
13 Total Cost (7+12) 819.54 1,592.37 1,575.35 2,180.48 2,001.17
14 Profit before exceptional items, prior period items and tax
203.39 321.95 597.91 595.84 197.86
15 Add(+)/less (-) Adjustment exceptional items, prior period items and tax
-35.47 -99.37 -180.04 -235.44 26.24
16 Profit After Tax 167.92 222.58 417.87 360.40 171.62
17 Percentage of Interest and Finance Charges to Total Cost
4.54 10.41 15.81 14.07 16.56
18 Percentage of Fuel Cost to Total Cost
77.70 69.25 63.29 65.38 56.02
19 Percentage of Employee and A & G expenses to Total Cost
9.04 10.08 8.06 0.00 0.00

Annexures
73
Sl.No. Particulars 2011-12 2012-13 2013-14 2014-15 2015-16
20 Percentage of Fuel Cost to Operational Revenue
63.35 58.81 46.61 52.06 51.93
21 Profit to Total Revenue 16.42 11.63 19.23 12.98 7.80
Generation
22 Total generation (In MUs) 2,750.92 3,921.63 3,067.79 4,081.51 3,450.49
23 Less: Auxiliary consumption (In MUs)
67.2 114.24 99.73 125.45 113.85
24 Total generation available for Transmission and Distribution (In MUs)
2,683.72 3,807.39 2,968.06 3,956.06 3,336.64
25 Realization (per unit) (3/24×10)
3.75 4.93 7.21 6.92 6.47
26 Fixed Cost (per unit) (12/24×10)
0.68 1.29 1.95 1.91 2.64
27 Variable Cost (per unit) (7/24×10)
2.37 2.90 3.36 3.60 3.36
28 Total Cost per unit (26+27) 3.05 4.19 5.31 5.51 6.00
29 Contribution (25-27) 1.38 2.03 3.85 3.32 3.11
30 Profit (+)/Loss(-) (25-28)
0.70 0.74 1.90 1.41 0.47

Audit Report No. 5 – Revenue and Social & Economic Sectors (PSUs) for the year ended 31 March 2016
74
Annexure-2.3
Statement showing the Cash inflow and outflow of IPGCL and PPCL (Referred to in paragraph 2.2.4)
(` in crore)
Sl.No. Particulars 2011-12 2012-13 2013-14 2014-15 2015-16
IPGCL
Cash Inflow
1 Net Profit/(Loss) 361.26 139.44 189.66 7.63 -89.84
2 Add: Adjustments 30.16 104.76 156.59 149.09 138.15
3 Operating activities 59.39 162.16 90.37 289.51 95.62
4 Investing activities 1.06 0.88 0.45 0.21 31.88
5 Financing activities 255 392.43 25.19 15.27 90.2
Total 706.87 799.67 462.26 461.71 266.01
Cash Outflow
6 Operating activities 535.28 641.51 334.73 401.97 27.64
7 Investing activities 90.48 67.93 8.12 18.54 38.78
8 Financing activities 97.40 90.66 122.75 38.38 201.76
Total 723.17 800.10 465.60 458.90 268.18
Net increase(+)/decrease (-) in cash and cash equivalents
-16.30 -0.43 -3.34 2.81 -2.17
PPCL
Cash Inflow
1 Net Profit 203.40 321.96 595.06 595.83 197.85
2 Add: Adjustments 97.99 294.41 417.20 557.12 588.65
3 Operating activities 387.37 289.90 288.33 185.76 0
4 Investing activities 15.38 34.80 35.71 37.39 38.76
5 Financing activities 1,137.45 484.40 100.05 100.00 380.00
Total 1,841.59 1,425.47 1,436.35 1,476.11 1,205.26
Cash Outflow
6 Operating activities 447.66 872.35 810.30 844.84 712.71
7 Investing activities 1,243.18 336.88 213.29 241.35 65.43
8 Financing activities 139.03 246.62 436.86 372.35 427.15
Total 1,829.86 1,455.85 1,460.44 1,458.54 1,205.29
Net increase(+)/decrease (-) in cash and cash equivalents
11.73 -30.37 -24.09 17.57 -0.03

Annexures
75
Annexure 2.4
Statement showing excess consumption of fuel in Power Plants of IPGCL and PPCL
(Referred to in paragraph 2.2.6.1 (c))
Sl.No. Particulars 2011-12 2012-13 2013-14 2014-15 2015-16
A. Excess consumption of coal in Rajghat Power House
1 Gross generation (MUs) 818.364 792.799 379.883 423.575 46.594
2 Gross Station heat rate allowed by DERC (Kcal/kWh)
3,200 3,200 3,200 3,200 3,200
3 Actual Station Heat Rate (Kcal/kWh)
3,072.1 3,340.5 3,375.2 3,367.8 3,292.4
4 Average calorific value of coal allowed by DERC (Kcal /Kg)
3,601 3,703 3,703 3,703 3,703
5 Coal required for gross generation as per norms (2÷4x1x1000) (MT)
7,27,232.65 6,85,108.51 3,28,281.29 3,66,038.35 40,264.87
6 Actual coal consumption (MT)
7,07,987.14 7,17,153.01 3,46,849.39 3,86,620.92 41,424.09
7 Excess consumption of coal (MT) (6-5)
- 32,044.50 18,568.10 20,582.57 1,159.22
8 Rate of coal per MT (`) - 3,104.31 3,356.00 3,549.00 3,549.00
9 Value of excess coal consumed (` in crore) (7×8)
- 9.95 6.23 7.30 0.41
(` 23.89 crore)
B. Excess consumption of gas in Gas Turbine Power Station
1 Gross Generation (MUs)
OC 33.296 7.278 5.140 15.966 3.706
CC 1,205.061 1,300.556 1,035.809 920.385 463.380
Total 1,238.357 1,307.834 1,040.949 936.351 467.086
2 GCV of gas (Kcal/SCM) 9,477.50 9,576.02 9,600.60 9,628.42 9,593.76
3 Heat rate allowed by DERC (Kcal/kWh)
OC 3,125 3,125 3,125 3,125 3,125
CC 2,450 2,450 2,450 2,450 2,400
4 Actual heat rate (Kcal/kWh)
OC 3,391 3,448 3,441 3,473 3,465
CC 2,489 2,445 2,424 2,503 2,527
5 Gas to be consumed per unit as per norms allowed by DERC (3/2) (SCM/kWh)
OC 0.3297 0.3263 0.3255 0.3246 0.3257
CC 0.2585 0.2558 0.2552 0.2545 0.2502

Audit Report No. 5 – Revenue and Social & Economic Sectors (PSUs) for the year ended 31 March 2016
76
Sl.No. Particulars 2011-12 2012-13 2013-14 2014-15 2015-16
6 Gas actually consumed per unit (4/2) (SCM/kWh)
OC 0.3578 0.3601 0.3584 0.3607 0.3612
CC 0.2592 0.2545 0.2519 0.2580 0.2630
7 Total actual gas consumption (SCM)
32,51,77,154 33,38,68,612 26,28,41,157 24,34,31,130 12,30,53,882
8 Gas required for gross generation as per DERC norms (3/2×1×1000000) (SCM)
OC 1,09,78,634 23,75,073 16,73,073 51,81,925 12,07,165
CC 31,15,16,692 33,27,43,896 26,43,30,568 23,41,96,602 11,59,20,348
Total 32,24,95,326 33,51,18,969 26,60,03,641 23,93,78,527 11,71,27,513
9 Excess consumption of gas (7-8) (SCM)
26,81,828 - - 40,52,603 59,26,369
10 Landed cost of gas (` /SCM)
11.6 14.21 13.905 17.429 15.264
11 Value of excess gas consumed (` in crore) (9×10)
3.11 - - 7.06 9.05
1,26,60,800 SCM Gas amounting to ` 19.22 crore
C. Excess consumption of gas in Pragati Power Station-I
1 Gross Generation (in MUs)
OC 68.625 41.331 26.416 85.424 9.862
CC 2,491.393 2,466.956 2,398.936 1,761.944 1,529.609
Total 2,560.018 2,508.287 2,425.352 1,847.368 1,539.471
2 GCV of gas (Kcal/SCM) 9,483.92 9,591.48 9,620.20 9,646.89 9,579.42
3 Heat rate allowed by DERC (Kcal/kWh)
OC 2,900 2,900 2,900 2,900 2,900
CC 2,000 2,000 2,000 2,000 2,000
4 Actual heat rate (in kCal/kWh)
OC 3,095 3,121 3,161 3,188 3,197
CC 1,988 1,989 1,990 1,990 1,997
5 Gas to be consumed per unit as per norms allowed by DERC (3/2) (SCM/kWh)
OC 0.3058 0.3024 0.3014 0.3006 0.3027
CC 0.2109 0.2085 0.2079 0.2073 0.2088
6 Gas actually consumed per unit (4/2) (SCM/kWh)
OC 0.3263 0.3254 0.3286 0.3305 0.3337
CC 0.2096 0.2074 0.2069 0.2063 0.2085
7 Total actual gas consumption (SCM)
54,47,57,740 52,51,23,635 50,49,59,052 39,17,96,943 32,24,33,309
8 Gas required for gross generation as per DERC norms (3/2×1×1000000) (SCM
OC 2,09,84,203 1,24,96,497 79,63,078 2,56,79,737 29,85,546
CC 52,53,93,086 51,44,05,702 49,87,28,925 36,52,87,466 31,93,53,155
Total 54,63,77,289 52,69,02,199 50,66,92,003 39,09,67,203 32,23,38,701
9 Excess consumption of gas (7-8) (SCM)
- - - 8,29,740 94,608
10 Landed cost of gas (` /SCM)
10.06 12.66 15.45 19.08 18.06

Annexures
77
Sl.No. Particulars 2011-12 2012-13 2013-14 2014-15 2015-16
11
Value of excess gas consumed (` in crore) (9×10)
- - - 1.58 0.17
9,24,348 SCM of Gas amounting to ` 1.75 crore
D. Excess consumption of gas in Pragati Power Station-III, Bawana
1 Gross Generation (in MUs)
OC 190.91 42.29 3.56 4.98 4.15
CC Nil 1,371.05 638.87 2,229.16 1,906.87
Total 190.905 1,413.34 642.43 2,234.14 1,911.02
2 GCV of gas (Kcal/SCM) 9,592.65 9,604.01 9,571.32 9,656.76 9,607.53
3 Heat rate allowed by CERC (Kcal/kWh)
OC 2,755.78 2,755.78 2,755.78 2,755.78 2,755.78
CC 1,845.14 1,845.14 1,845.14 1,845.14 1,845.14
4 Actual heat rate (in KCal/kWh)
OC 2,991.00 3,721.88 3,030.68 2,817.25 2,853.48
CC 0 2,040.55 1,971.11 1,867.17 1,888.49
5 Gas to be consumed per unit as per norms allowed by CERC (3/2) (SCM/kWh)
OC 0.287 0.287 0.288 0.285 0.287
CC 0.192 0.192 0.193 0.191 0.192
6 Gas actually consumed per unit (4/2) (SCM/kWh)
OC 0.312 0.388 0.317 0.292 0.297
CC 0 0.212 0.206 0.193 0.197
7 Total actual gas consumption (SCM)
5,90,57,385 30,70,72,000 13,27,05,298 43,30,78,891 37,56,39,629
8 Gas required for gross generation as per CERC norms (3/2×1×1000000) (SCM
OC 5,48,44,695 1,21,35,692 10,25,109 14,22,368 11,89,845
CC 0 26,34,09,251 12,31,60,011 42,59,30,026 36,62,17,600
Total 5,48,44,695 27,55,44,943 12,41,85,120 42,73,52,394 36,74,07,445
9 Excess consumption of gas (7-8) (SCM)
- 3,15,27,057 85,20,178 57,26,497 82,32,184
10 Landed cost of gas (` /SCM)
- 15.22 14.35 15.714 14.394
11
Value of excess gas consumed (` in crore) (9×10)
- 47.98 12.23 9.00 11.85
5,40,05,916 SCM gas amounting to ` 81.06 crore
Grand Total A + B + C + D = ` 125.92 crore

Audit Report No. 5 – Revenue and Social & Economic Sectors (PSUs) for the year ended 31 March 2016
78
Annexure 2.5
Statement showing Operational Performance of the Indraprastha Power Generation Company limited and Pragati Power Corporation Limited
(Referred to in paragraph 2.2.6.3 (a) and (c))
A. Indraprastha Power Generation Company limited
Rajghat Power House
Sl.No. Particulars Unit 2011-12 2012-13 2013-14 2014-15 2015-16
1 Installed Capacity MW 135 135 135 135 135
2 Maximum possible Generation at Installed Capacity (1 × No. of days in the year × 24 hours)/1000
MUs 1,185.840 1,182.600 1,182.600 1,182.600 1,185.840
3 Targets fixed by CEA MUs NA Not fixed by CEA 450.00 400.00
4 Targets fixed by DERC MUs 828.000 887.000 887.000 887.000 394.500
5 Gross generation MUs 818.364 792.799 379.883 423.575 46.594
6 Total hours available in a year Hrs 17,568.00 17,520.00 17,520.00 17,520.00 17,568.00
7 Actual Running hours Hrs 14131.50 14,163.42 7,293.00 8,302.67 863.33
8 Plant Load Factor fixed by DERC
% 70.00 75.00 75.00 75.00 75.00
9 Plant Load Factor (5/2) × 100 % 69.01 67.04 32.12 35.82 3.93
10 Possible generation with reference to hours actually run (7 × 67.5 MW/1000)
MUs 953.876 956.031 492.278 560.430 58.275
11 Capacity utilisation Factor (5/10) × 100
% 85.79 82.93 77.17 75.58 79.96
Gas Turbine Power Station
Sl. No Particulars Unit 2011-12 2012-13 2013-14 2014-15 2015-16
1 Installed Capacity MW 270 270 270 270 270
2 Maximum possible Generation at Installed Capacity (1 × No. of days in the year × 24 hours)/1000
MUs 2,371.680 2,365.200 2,365.200 2,365.200 2,371.680
3 Targets fixed by CEA MUs 1,782.00 1,260.000 1,260.000 900.000 1,000.000
4 Targets fixed by DERC MUs 1,660.000 1,892.000 1,892.000 1,892.000 927.840
5 Gross generation MUs 1,238.357 1,307.834 1,040.949 936.351 467.086
6 Total hours available in a year Hrs 79,056.00 78,840.00 78,840.00 78,840.00 79,056.00
7 Actual Running hours Hrs 51,345.50 51,921.37 41,233.01 38,981.79 21,502.69
8 Plant Load Factor fixed by DERC
% 70.00 80.00 80.00 80.00 80.00
9 Plant Load Factor (5/2) × 100 % 52.21 55.29 44.01 39.59 19.69
10 Possible generation with refer-ence to hours actually run (7 × 30 MW/1000)
MUs 1,540.365 1,557.641 1,236.990 1,169.454 645.081
11 Capacity utilisation Factor (5/10) × 100
% 80.39 83.96 84.15 80.07 72.41
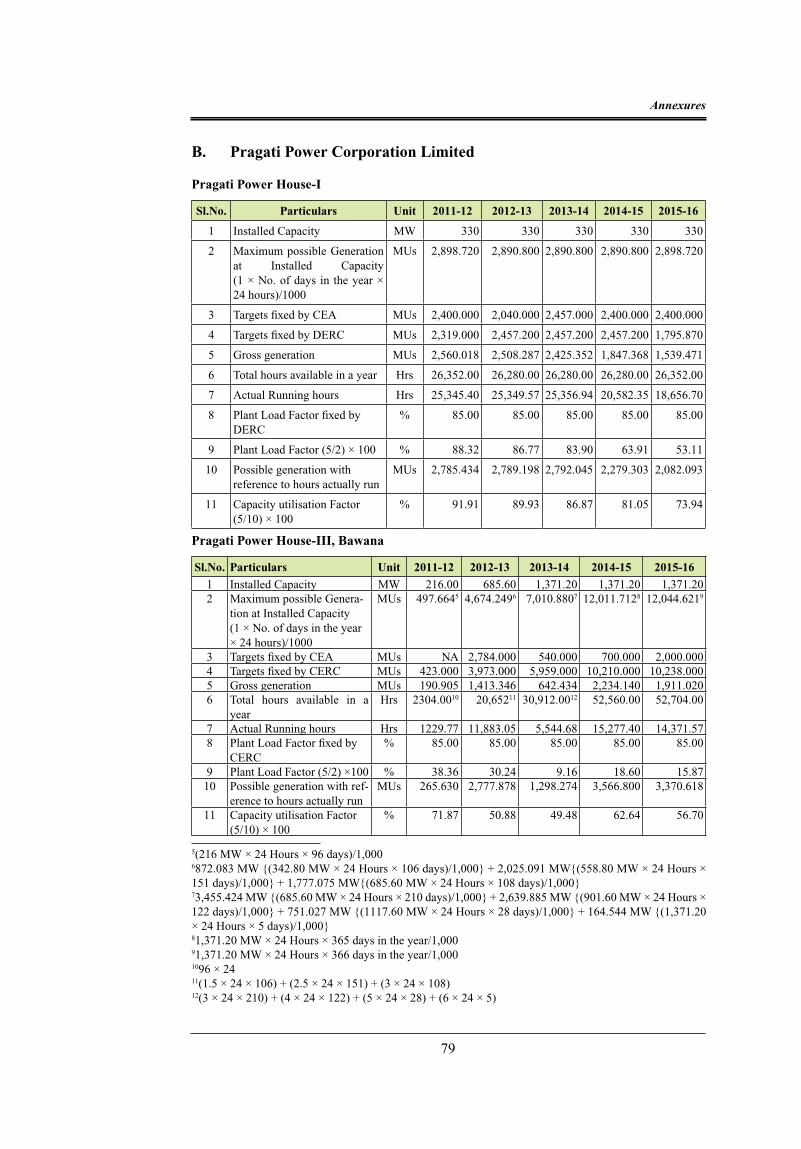
Annexures
79
B. Pragati Power Corporation Limited
Pragati Power House-I
Sl.No. Particulars Unit 2011-12 2012-13 2013-14 2014-15 2015-16
1 Installed Capacity MW 330 330 330 330 330
2 Maximum possible Generation at Installed Capacity (1 × No. of days in the year × 24 hours)/1000
MUs 2,898.720 2,890.800 2,890.800 2,890.800 2,898.720
3 Targets fixed by CEA MUs 2,400.000 2,040.000 2,457.000 2,400.000 2,400.000
4 Targets fixed by DERC MUs 2,319.000 2,457.200 2,457.200 2,457.200 1,795.870
5 Gross generation MUs 2,560.018 2,508.287 2,425.352 1,847.368 1,539.471
6 Total hours available in a year Hrs 26,352.00 26,280.00 26,280.00 26,280.00 26,352.00
7 Actual Running hours Hrs 25,345.40 25,349.57 25,356.94 20,582.35 18,656.70
8 Plant Load Factor fixed by DERC
% 85.00 85.00 85.00 85.00 85.00
9 Plant Load Factor (5/2) × 100 % 88.32 86.77 83.90 63.91 53.11
10 Possible generation with reference to hours actually run
MUs 2,785.434 2,789.198 2,792.045 2,279.303 2,082.093
11 Capacity utilisation Factor (5/10) × 100
% 91.91 89.93 86.87 81.05 73.94
Pragati Power House-III, Bawana
Sl.No. Particulars Unit 2011-12 2012-13 2013-14 2014-15 2015-16
1 Installed Capacity MW 216.00 685.60 1,371.20 1,371.20 1,371.202 Maximum possible Genera-
tion at Installed Capacity (1 × No. of days in the year × 24 hours)/1000
MUs 497.6645 4,674.2496 7,010.8807 12,011.7128 12,044.6219
3 Targets fixed by CEA MUs NA 2,784.000 540.000 700.000 2,000.0004 Targets fixed by CERC MUs 423.000 3,973.000 5,959.000 10,210.000 10,238.0005 Gross generation MUs 190.905 1,413.346 642.434 2,234.140 1,911.0206 Total hours available in a
yearHrs 2304.0010 20,65211 30,912.0012 52,560.00 52,704.00
7 Actual Running hours Hrs 1229.77 11,883.05 5,544.68 15,277.40 14,371.578 Plant Load Factor fixed by
CERC% 85.00 85.00 85.00 85.00 85.00
9 Plant Load Factor (5/2) ×100 % 38.36 30.24 9.16 18.60 15.8710 Possible generation with ref-
erence to hours actually run MUs 265.630 2,777.878 1,298.274 3,566.800 3,370.618
11 Capacity utilisation Factor (5/10) × 100
% 71.87 50.88 49.48 62.64 56.70
5(216 MW × 24 Hours × 96 days)/1,0006872.083 MW {(342.80 MW × 24 Hours × 106 days)/1,000} + 2,025.091 MW{(558.80 MW × 24 Hours × 151 days)/1,000} + 1,777.075 MW{(685.60 MW × 24 Hours × 108 days)/1,000} 73,455.424 MW {(685.60 MW × 24 Hours × 210 days)/1,000} + 2,639.885 MW {(901.60 MW × 24 Hours × 122 days)/1,000} + 751.027 MW {(1117.60 MW × 24 Hours × 28 days)/1,000} + 164.544 MW {(1,371.20 × 24 Hours × 5 days)/1,000}81,371.20 MW × 24 Hours × 365 days in the year/1,00091,371.20 MW × 24 Hours × 366 days in the year/1,0001096 × 2411(1.5 × 24 × 106) + (2.5 × 24 × 151) + (3 × 24 × 108)12(3 × 24 × 210) + (4 × 24 × 122) + (5 × 24 × 28) + (6 × 24 × 5)

Audit Report No. 5 – Revenue and Social & Economic Sectors (PSUs) for the year ended 31 March 2016
80
*Up to 31 May 2015
Annexure 2.6
Statement showing less recovery of capacity charges (annual fixed cost) in respect of power Plants of IPGCL and PPCL
(Referred to in paragraph no. 2.2.6.3 (b))
Sl.No Particulars 2011-12 2012-13 2013-14 2014-15 2015-16
A. Less recovery of capacity charges in respect of Rajghat Power House
1 NAPAF fixed by DERC for recovery of full capacity charges
70.00 75.00 75.00 75.00 75.00
2 Actual Plant Availability Factor i.e. average of daily declared capacities (as certified by the SLDC)
68.37 66.94 67.55 56.50 55.18*
3 Capacity charges Trued up (2011-14) and allowed in Tariff Orders (2014-16) by DERC (` in crore)
102.26 142.77 144.46 159.25 175.13
4 Pro-rata Recovery of capacity charges (3÷1 × 2)
99.88 127.43 130.11 119.97 21.47*
5 Non recovery of capacity charges due to low NAPAF (3-4)
2.38 15.34 14.35 39.28 153.66
Total = ` 225.01 crore
B. Less recovery of capacity charges in respect of Gas Turbine Power Station
1 NAPAF fixed by DERC for recovery of full capacity charges
70.00 80.00 80.00 80.00 80.00
2 Actual Plant Availability Factor i.e. average of daily declared capacities (as certified by the SLDC)
79.41 84.22 85.76 68.80 74.81
3 Capacity charges Trued up (2011-14) and allowed in Tariff Orders (2014-16) by DERC (` in crore)
140.17 174.55 178.10 192.99 198.24
4 Pro-rata Recovery of capacity charges (3÷1 × 2)
140.17 174.45 178.10 165.97 185.38
5 Non recovery of capacity charges due to low NAPAF (3-4)
- - - 27.02 12.86
Total = ` 39.88 crore

Annexures
81
Sl.No Particulars 2011-12 2012-13 2013-14 2014-15 2015-16
C. Recovery of capacity charges in respect of Pragati Power Station-I
1 NAPAF fixed by DERC for recovery of full capacity charges
85.00 85.00 85.00 85.00 85.00
2 Actual Plant Availability Factor i.e. average of daily declared capacities (as certified by the SLDC)
92.61 90.50 92.62 85.62 90.25
3 Capacity charges Trued up (2011-14) and allowed in Tariff Orders (2014-16) by DERC (` in crore)
210.78 198.43 200.34 213.15 238.75
4 Pro-rata recovery of capacity charges as per DERC Regulations
Full Full Full Full Full
5 Non recovery of capacity charges due to low NAPAF (3-4)
- - - - -
D. Less recovery of capacity charges in respect of Pragati Power Station-III
1 NAPAF fixed by CERC for recovery of full capacity charges
85.00 85.00 85.00 85.00 85.00
2 Actual Plant Availability Factor i.e. average of daily declared capacities (as certified by the SLDC)
68.65 88.04 95.69 92.32 64.55
3 Capacity charges allowed (2011-14) in tariff order by CERC and claimed (2014-16) in tariff petition for 2014-19. (` in crore)
68.77 493.73 653.59 1,394.68 1,432.73
4 Pro-rata recovery of capacity charges as per CERC Regulations
61.4913 Full Full Full 1,088.0314
5 Non recovery of capacity charges due to low NAPAF (3-4)
7.28 - - - 344.70
Total= ` 351.98 crore
Total of A + B + C + D = ` 616.87 crore
13 Since the plant availability factor achieved during 2011-12 was less than 70 per cent, the total capacity charges for the year in accordance CERC Regulations 2009 shall be restricted to Annual Fixed Cost × (0.5 + 35/Normative Annual Plant Availability Factor) × (Plant Availability Factor Achieved during Year/70) i.e. ` 68.77 crore × (0.5 + 35/85) × (68.65/70)14 In accordance with CERC Regulations 2014, the total capacity charges shall be restricted to Annual Fixed Cost × Plant Availability Factor Achieved during the Year/ Normative Annual Plant Availability Factor i.e. ` 1,432.73 crore × 64.55/85

Audit Report No. 5 – Revenue and Social & Economic Sectors (PSUs) for the year ended 31 March 2016
82
Annexure-2.7
Statement showing the position of outages in Power Plants of IPGCL and PPCL
(Referred to in paragraph 2.2.6.4)
Sl. No Particulars 2011-12 2012-13 2013-14 2014-15 2015-16
Rajghat Power House
1 Total Hours available in a year
17,568.00 17,520.00 17,520.00 17,520.00 17,568.00
2 Actual Running Hours 14,131.50 14,163.42 7,293.00 8,302.67 863.33
Percentage of total Hours available
80.44 80.84 41.63 47.39 4.91
3 Planned Outages Hours Nil 1,100.67 Nil 2,207.08 16.00
Percentage of total Hours available
- 6.28 - 12.60 0.09
4 Forced Outages Hours 3,295.58 2,218.50 2,560.33 1,512.67 16,688.87
Percentage of total Hours available
18.76 12.66 14.61 8.63 95.00
5 Backing down hours 140.92 37.41 7,666.67 5,497.58 -
Percentage of total Hours available
0.80 0.22 43.76 31.38 -
Gas Turbine Power Station
1 Total Hours available in a year
79,056.00 78,840.00 78,840.00 78,840.00 79,056.00
2 Actual Running Hours 51,345.50 51,921.37 41,233.01 38,981.79 21,502.69
Percentage of total Hours available
64.95 65.86 52.30 49.44 27.20
3 Planned Outages Hours 1,444.92 3,383.97 845.50 2,421.87 917.50
Percentage of total Hours available
1.83 4.29 1.07 3.07 1.16
4 Forced Outages Hours 4,471.63 1,143.69 2,282.07 10,473.63 8,278.01
Percentage of total hours available
5.65 1.45 2.90 13.29 10.47
5 Backing down hours 21,793.95 22,390.97 34,479.42 26,962.71 48,357.80
Percentage of total hours available
27.57 28.40 43.73 34.20 61.17

Annexures
83
Sl. No Particulars 2011-12 2012-13 2013-14 2014-15 2015-16
Pragati Power House-I
1 Total Hours available in a year
26,352.00 26,280.00 26,280.00 26,280.00 26,352.00
2 Actual Running Hours 25,345.40 25,349.57 25,356.94 20,582.35 18,656.70
Percentage of total hours available
96.18 96.46 96.49 78.32 70.80
3 Planned Outages Hours 354.19 568.72 177.93 2,528.34 1,910.71
Percentage of total hours available
1.34 2.16 0.68 9.62 7.25
4 Forced Outages Hours 263.37 188.57 545.95 272.48 54.52
Percentage of total hours available
1.00 0.72 2.08 1.04 0.21
5 Backing down hours 389.04 173.14 199.18 2,896.83 5,730.07
Percentage of total hours available
1.48 0.66 0.75 11.02 21.74
Pragati power House-III
1 Total Hours available in a year
2,304.00 20,652.00 30,912.00 52,560.00 52,704.00
2 Actual Running Hours 1,229.77 11,883.05 5,544.68 15,277.40 14,371.57
Percentage of total hours available
53.38 57.54 17.94 29.07 27.27
3 Planned Outages Hours 60.58 37.30 935.64 - 1,653.00
Percentage of total hours available
2.63 0.18 2.93 - 3.14
4 Forced Outages Hours - 683.12 600.08 2,239.39 10,963.13
Percentage of total hours available
- 3.31 1.94 4.26 20.80
5 Backing down hours 1,013.65 8,048.53 23,831.60 35,043.21 25,716.30
Percentage of total hours available
43.99 38.97 77.09 66.67 48.79

Audit Report No. 5 – Revenue and Social & Economic Sectors (PSUs) for the year ended 31 March 2016
84
Annexure-2.8
Statement showing excess Auxiliary Energy Consumption in Power Plants of IPGCL and PPCL
(Referred to in paragraph 2.2.6.5)
A. Excess Auxiliary Energy Consumption in Rajghat Power House
Sl.No. Particulars 2011-12 2012-13 2013-14 2014-15 2015-161 Gross Generation (MUs) 818.364 792.799 379.883 423.575 46.594*2 Auxiliary Energy Consumption
(MUs)102.107 104.962 56.842 65.211 8.382
3 Net Generation (MUs) 716.257 687.837 323.041 358.364 38.2124 Percentage of Auxiliary Energy
Consumption to Gross Generation (2÷1×100)
12.48 13.24 14.96 15.40 17.99
5 Auxiliary Energy Consumption allowed by DERC - 11.28 per cent (MUs)
92.311 89.428 42.851 47.779 5.256
6 Excess Auxiliary Energy Consumption (MUs)
9.796 15.534 13.991 17.432 3.126
7 Variable cost per unit (`)** 2.69 2.91 3.13 3.33 3.558 Financial Loss (` in crore) (6 × 7)/10 2.64 4.52 4.38 5.80 1.10
Total 59.879 MUs valuing ` 18.44 crore
* Up to May 2015**Cost at which Energy bills were billed (Provided by Auditee Units)
B. Excess Auxiliary Energy Consumption in Gas Turbine Power Station
Sl.No. Particulars 2011-12 2012-13 2013-14 2014-15 2015-161 OC Generation (MUs) 33.296* 7.278* 5.140* 15.966* 3.710**
CC Generation (MUs) 1,205.061 1,300.556 1,035.809 920.385 463.376Gross Generation (MUs) 1,238.357 1,307.834 1,040.949 936.351 467.086
2 Actual Auxiliary Energy Consumption (MUs)
43.651 38.065 31.906 31.963 21.204
3 Net Generation (MUs)[1-2] 1,194.706 1,269.769 1,009.043 904.388 445.8824 Percentage of Auxiliary
Energy Consumption to Gross Generation (2÷1×100)
3.52 2.91 3.07 3.41 4.54
5 Auxiliary Energy Consumption allowed by DERC (MUs)
OC (1 per cent)
0.333 0.073 0.051 0.160 0.037
CC (3 per cent)
36.152 39.017 31.074 27.611 13.901
Total 36.485 39.090 31.125 27.771 13.9386 Excess Auxiliary Energy
Consumption (MUs) [2-5]7.166 --- 0.781 4.192 7.266
7 Variable cost per unit (`) *** 3.10 3.67 3.65 4.57 4.048 Financial Loss (` in crore)
(6 × 7)/102.22 --- 0.29 1.92 2.94
Total 19.405 MUs valuing ` 7.37 crore
* As certified by SLDC** It included figures up to September 2015 certified by SLDC and from October 2015 to March 2016 as per statistics of GTPS*** Cost at which Energy bills were billed (Provided by Auditee Units)

Annexures
85
C. Excess Auxiliary Energy Consumption in Pragati Power Station-III, Bawana
Sl.No. Particulars 2011-12 2012-13 2013-14 2014-15 2015-16
1 OC Generation (MUs) 190.905* 42.293* 3.560* 4.984* 4.148**
CC Generation (MUs) 00 1,371.053 638.874 2,229.156 1,906.872
Gross Generation (MUs) 190.905 1,413.346 642.434 2,234.140 1,911.020
2 Actual Auxiliary Energy Consumption (MUs)
3.183 48.779 36.900 78.060 74.703
3 Net Generation (MUs)[1-2] 187.723 1,364.567 605.534 2,156.080 1,836.317
4 Percentage of Actual Auxiliary Energy Consumption to Gross Generation (2÷1×100)
1.67 3.45 5.74 3.49 3.91
5 Auxiliary Energy Consumption allowed by CERC (MUs)
OC (1 per cent) 1.909 0.423 0.036 0.050 0.041
CC (3 per cent for 2011-12 to 2013-14 and 2.5 per cent for 2014-15 to 2015-16)
0.000 41.132 19.166 55.729 47.672
Total 1.909 41.555 19.202 55.779 47.713
6 Excess Auxiliary Energy Consumption (MUs) [2-5]
1.274 7.224 17.698 22.281 26.990
7 Variable cost per unit (`) *** 4.38 2.87 2.84 3.08 2.86
8 Financial Loss (` in crore) (6 × 7)/10
0.56 2.07 5.03 6.86 7.71
Total 75.467 MUs valuing ` 22.23 crore
Grand Total A + B + C = 154.75 MUs valuing ` 48.04 crore
* As certified by SLDC** It included figures up to September 2015 certified by SLDC and from October 2015 to March 2016 as per statistics of PPS-III, Bawana*** Cost at which Energy bills were billed (Provided by Auditee Units)

Audit Report No. 5 – Revenue and Social & Economic Sectors (PSUs) for the year ended 31 March 2016
86
Annexure – 2.9
Summary of key financial indicators of Delhi Financial Corporation
(Referred to in paragraph 2.3.1)(` in lakh)
Particulars 2013-14 2014-15 2015-16
Liabilities
Capital 2,629.75 2,635.75 2,641.75
Reserve 4,679.90 4,499.25 4,778.75
Borrowings 5,698.83 5,133.33 4,700.00
Provisions & Other Liabilities 2,473.41 2,595.77 2,972.87
Total Liabilities 15,481.90 14,864.10 15,093.37
Assets
Loans & Advances 13,481.95 11,050.97 11,955.22
Provisions for NPA written back during the year (853.14) (833.43) (663.41)
Cash & Bank Balances 1,274.51 3,114.25 2,551.90
Fixed & Other Assets 1,578.57 15,32.31 1,249.67
Total Assets 15,481.90 14,864.10 15,093.37
Gross Income
(i) Income from Operations
(ii) Other Income
1,698.92
199.96
1,489.27
210.58
1,751.92
173.92
Expenditure 1,806.87 1,576.19 1,496.32
Operating Profit
(Profit before Tax, Provision etc.)92.01 123.66 429.52
Net Profit (19.31) 169.79 279.50