GeneBrowser: an approach for integration and functional classification of genomics data
10
Journal of Integrative Bioinformatics 2007 http://journal.imbio.de/ GeneBrowser: an approach for integration and functional classification of genomic data Joel Arrais, Bruno Santos, João Fernandes, Laura Carreto, Manuel A.S. Santos, José Luis Oliveira University of Aveiro, Campus Universitário de Santiago, 3810-193 Aveiro, Portugal [jpa, jlo]@ieeta.pt Summary The achievements coming from genome analysis depend greatly on the quality of computational and processing methods. Tools for functional mRNA profiling and for gene information integration have become essential to this task. We have developed GeneBrowser as a novel approach that combines the advantages of mRNA profiling tools, at genome-scale experiments, with the features provided by data integration systems. For a given set of genes, GeneBrowser integrates bibliography information with functional annotations, using Gene Ontology, Entrez Gene, KEGG Orthology and KEGG Pathways. The result is a comprehensive and easy to use web application that helps researchers to extract knowledge from large data sets and to speed up the discovery process. Availability: GeneBrowser is freely available at http://bioinformatics.ua.pt/genebrowser 1 Introduction In a gene expression microarray experiment the completion of the “wet lab” work is far from representing the end of the research workflow [1-3]. The remaining challenge is the extraction of knowledge from the produced data sets in order to answer the initial experimental question [3-7]. The classical approach to this analysis is a two step procedure. In the first step, a subgroup of genes considered differentially expressed is selected by one or more bioinformatics tools. In the second step, this list of candidate genes is further explored to extract any possible biological meaning. One of the possible approaches to the second step consists in the assignment of functional biological categories to the identified genes, since it is now accepted that genes with similar expression profiles tend to have similar biological roles. Programs like Onto-Express [5], FatiGo [4, 8] and GOminer [9] can be considered as reference tools for functional and ontological analysis. Another completely different set of tools used for this step allows the user to explore relationships between genes in the context of the biological pathways in which the genes are involved. Tools like GenMapp [10] and Pathway Explorer [11] are often used for this task. However, the complexity of the biological phenomena involved requires the use of a more systematic approach, combining the information provided by those tools with gene descriptions and specific information available in the scientific literature in order to extract consistent knowledge from the data. For this purpose, we developed a new web service called GeneBrowser, which combines several sources of data and visualization methods in order to improve the biological interpretation and the knowledge extraction from a group of genes. This tool takes a list of gene IDs as input and then connects to several public data sources, such as Entrez gene [12], Gene Ontology (GO) [13], KEGG [14] and PubMed [15] and extracts relevant information for each gene present in the list. This data is then processed and combined, giving the user the Journal of Integrative Bioinformatics, 4(3):82, 2007 1
-
Upload
independent -
Category
Documents
-
view
2 -
download
0
Transcript of GeneBrowser: an approach for integration and functional classification of genomics data
Journal of Integrative Bioinformatics 2007 http://journal.imbio.de/
GeneBrowser: an approach for integration and functional classification of genomic data
Joel Arrais, Bruno Santos, João Fernandes, Laura Carreto, Manuel A.S. Santos, José Luis Oliveira
University of Aveiro, Campus Universitário de Santiago, 3810-193 Aveiro, Portugal [jpa, jlo]@ieeta.pt
Summary
The achievements coming from genome analysis depend greatly on the quality of computational and processing methods. Tools for functional mRNA profiling and for gene information integration have become essential to this task. We have developed GeneBrowser as a novel approach that combines the advantages of mRNA profiling tools, at genome-scale experiments, with the features provided by data integration systems. For a given set of genes, GeneBrowser integrates bibliography information with functional annotations, using Gene Ontology, Entrez Gene, KEGG Orthology and KEGG Pathways. The result is a comprehensive and easy to use web application that helps researchers to extract knowledge from large data sets and to speed up the discovery process.
Availability: GeneBrowser is freely available at http://bioinformatics.ua.pt/genebrowser
1 Introduction
In a gene expression microarray experiment the completion of the “wet lab” work is far from representing the end of the research workflow [1-3]. The remaining challenge is the extraction of knowledge from the produced data sets in order to answer the initial experimental question [3-7]. The classical approach to this analysis is a two step procedure. In the first step, a subgroup of genes considered differentially expressed is selected by one or more bioinformatics tools. In the second step, this list of candidate genes is further explored to extract any possible biological meaning.
One of the possible approaches to the second step consists in the assignment of functional biological categories to the identified genes, since it is now accepted that genes with similar expression profiles tend to have similar biological roles. Programs like Onto-Express [5], FatiGo [4, 8] and GOminer [9] can be considered as reference tools for functional and ontological analysis. Another completely different set of tools used for this step allows the user to explore relationships between genes in the context of the biological pathways in which the genes are involved. Tools like GenMapp [10] and Pathway Explorer [11] are often used for this task. However, the complexity of the biological phenomena involved requires the use of a more systematic approach, combining the information provided by those tools with gene descriptions and specific information available in the scientific literature in order to extract consistent knowledge from the data.
For this purpose, we developed a new web service called GeneBrowser, which combines several sources of data and visualization methods in order to improve the biological interpretation and the knowledge extraction from a group of genes. This tool takes a list of gene IDs as input and then connects to several public data sources, such as Entrez gene [12], Gene Ontology (GO) [13], KEGG [14] and PubMed [15] and extracts relevant information for each gene present in the list. This data is then processed and combined, giving the user the
Journal of Integrative Bioinformatics, 4(3):82, 2007 1
Journal of Integrative Bioinformatics 2007 http://journal.imbio.de/
opportunity to further explore the results, using several visualization methods. Moreover, the system provides direct links to visualize the source data in their original context where complementary data is provided.
The motivation that drove the development of this software was to build a system that could combine the advantages of web portals, like Entrez gene [12] or GeneCards [16], with the features present in other software used for knowledge extraction from DNA microarray data sets. A direct comparison of GeneBrowser with the first group of tools, that only combine information from one gene at a time, showed immediately the importance of comparing tens or hundreds of genes at the same time. Moreover, when compared with currently available tools for ontology analysis that only use one source of information, our portal shows important advantages of using four different sources of data (more are being added). Finally, as the system is web based, the accessibility of the tools is greatly improved since it overcomes common software installation problems.
The following section explains in detail the workflow of a microarray experiment, especially how to use the available sources of data to conduct a functional analysis. The architecture, the data model and the graphical interface are presented in section 3. Finally, in the last section, the main advantages, drawbacks and future developments are discussed.
2 Extracting knowledge from DNA microarray data
2.1 DNA Microarray data analysis
The development of several high-throughput techniques for genome functional analysis, such as microarrays, allow researchers to monitor thousands of genes simultaneously [1, 2]. These techniques opened a new window of opportunity to the study of genes and gene products in the context of entire genomes, and gave a better understanding of the true complexity of biological systems. However, extracting knowledge from microarray data, although simple in principle, is a complex and challenging task, due to the complexity of some steps and the fact that the methodology used in one step affects the subsequent steps [3].
In general, DNA-microarray technology is used to answer biological questions in the context of a global genome study. Therefore, the first step of a microarray experiment is to define the research questions. This step – Experimental Design – specifies the required bioassays and the relationships between them. After this, the laboratorial work starts with the isolation and labelling of the mRNA/cDNA samples of interest, which are then hybridized to pre-printed microarrays. These steps ends with the acquisition of microarray images that are produced using highly specialized laser scanners capable of exciting the fluorescent dye labels attached to the mRNA/cDNA samples.
Next, the image is analyzed using either commercial or open source tools capable of locating the probes and deriving measures of the associated hybridization intensity, including background correction and spot quality assessment. The interpretation of every microarray experiment relies on the hypothesis that the measured fluorescence intensities represent the abundance of the target sequences in the analysed sample. However, before the measured intensity values can be compared, they should be filtered and adjusted to eliminate bad quality data and experimental bias. The normalized intensity values can then be further explored to provide information about the gene expression alterations observed between samples. The result is a list of genes differentially expressed from the global set of samples.
Journal of Integrative Bioinformatics, 4(3):82, 2007 2
Journal of Integrative Bioinformatics 2007 http://journal.imbio.de/
2.2 Using available databases to perform functional analysis
After obtaining the differentially expressed genes we need yet to give answer to the biological question. For this, researchers carry out a combination of searches through public databases and retrieve information from the literature to infer the biological meaning from the gene expression pattern being analysed [17, 18]. This can be a tedious and labour dependent task since it implicates dealing with several information resources, with different user interfaces, terminologies and results.
One of the most common resources used to perform that analysis is Gene Ontology [13, 19], a collection of controlled and structured vocabulary to describe gene products. It is organized following a particular ontology that includes three different hierarchical classifications: Molecular Function, Biological Process and Cellular Component. In order to achieve dynamics and extensibility, GO is organized as a Direct Acyclic Graph (DAG), in which each GO term is connected to the top node by an “is_a” or “part_of” relationship. Both the ontology and the entire gene annotations database are available to download. The added value that GO brings to the functional annotation of gene products is well recognized and there are currently a large number of tools that link microarray data with this structure, either in the form of standalone programs like GOSurfer [20], or as web-based applications like OntoExpress [5] and FatiGO [4, 8]. Those systems also implement statistical tests to detect significant enrichments or depletion in GO categories, and commonly present the result in graphical forms [21].
Another popular resource is the Kyoto Encyclopedia of Genes and Genomes (KEGG) [14], a research project built with the aim of computing the knowledge of genetics, biochemistry, molecular and cellular biology in terms of the pathway of interacting molecules and genes. Initially, KEGG focused on metabolic pathways, but since then it was expanded to provide a reference knowledge base for linking genomes to biological systems, categorized as building blocks in the genome space (KEGG GENES) and the chemical space (KEGG LIGAND), and wiring diagrams of interaction networks and reaction networks (KEGG PATHWAY) [22]. In 2005 the BRITE database was also included in KEGG to allow automating functional interpretations associated with the KEGG Pathways reconstruction and assisting discovery of empirical rules involving genome-environment interaction. Currently, KEGG focus on hierarchical structuring of knowledge on functional aspects of the genomic and chemical space, including the KEGG Orthology (KO) system for ortolog/parolog gene groups, and other classification systems for compounds and drugs. Also, the KO is being extended to include the definition of functional modules in the KEGG Pathways and to develop ontologies for computational inference of high-order function. Despite that, the majority of the tools still only use the KEGG Pathway dataset and do not consider the advantages that come with the integration of other datasets especially the KO and BRITE Hierarchy.
3 System description
3.1 User interface
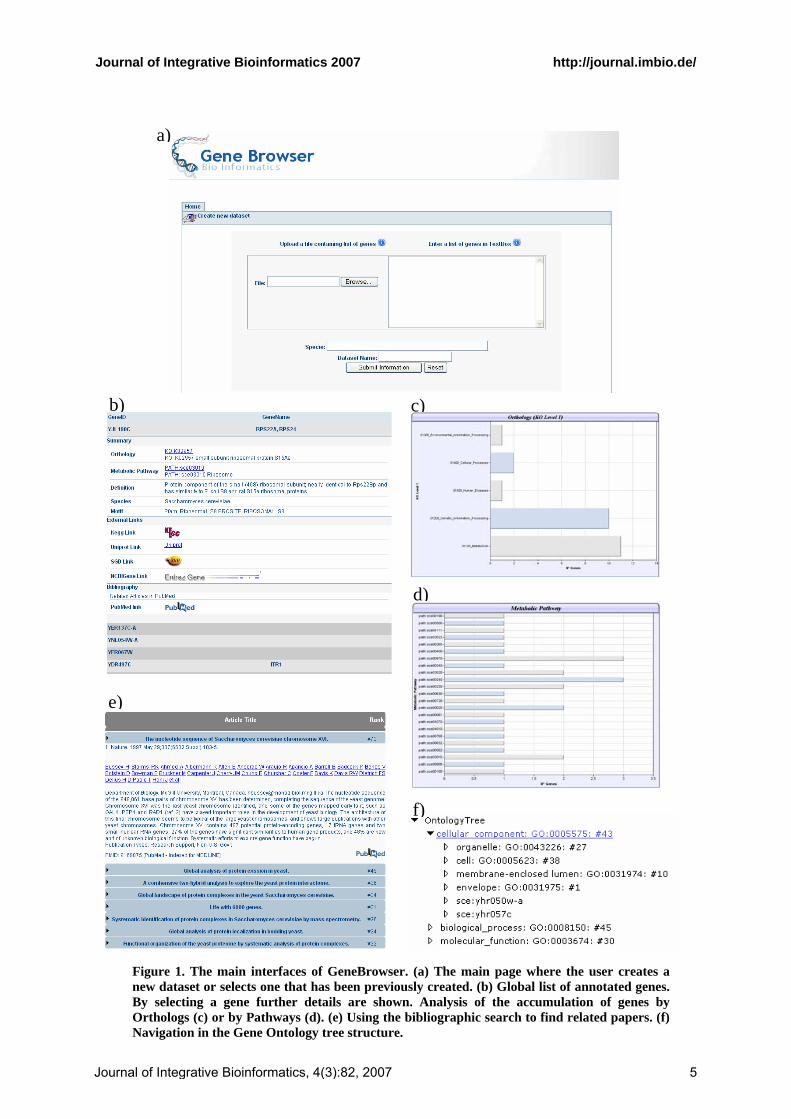
GeneBrowser is a web-based application publicly available1 without requiring any login or password. After accessing the website, the user can create a new dataset with the list of genes relevant to his/her study. As Figure 1.a. shows, this can be done either by uploading one column text file, or by inserting the list of genes in a textbox. Currently, the only supported format to identify each gene is by their systematic name. After the selection phase, the data
1 http://bioinformatics.ua.pt/genebrowser
Journal of Integrative Bioinformatics, 4(3):82, 2007 3
Journal of Integrative Bioinformatics 2007 http://journal.imbio.de/
access module will be used to extract the information necessary to annotate the genes. Once the annotation step is completed a table is displayed with the list of submitted genes (Figure 1.b). After selecting a specific gene, additional information is shown, such as the gene description, the list of pathways that include that gene, the list of PubMed publications that refer that gene, and links to external databases. Further functionalities, namely Orthology, Pathways, Gene Ontology and Bibliography, are accessible through a toolbar at the top of the screen.
The functional Orthology (Figure 1.c.) classifies each gene according to the structure provided by KEGG. By allowing a faster and easy detection of functional classes that accumulate higher numbers of genes, the system give hints to the classes that require further analysis, thus guiding the user to particular characteristics of the gene list.
The Pathway (Figure 1.d.) operates in a similar mode of the Orthology. It classifies genes according to its pathway and, for each gene-pathway pair, it is generated an external link providing additional information.
The Gene Ontology (Figure 1.f.) functionality shows the distribution of genes according to the GO categories, enabling an easier detection of genes in enriched and depleted categories. In order to provide an intuitive visualisation over the GO structure – which is based in a Direct Cyclic Graph (DAG) – two different visualization methods have been implemented. First, a tree that shows the entire classification path from the gene to the top level category. Then a graph bar, synchronised with the tree, showing the accumulation of genes in each category.
The Bibliography (Figure 1.e.) information, gathered from PubMed, provides a list of the most relevant abstracts associated to the gene set. The list is ordered by relevance, which is determined on the basis of the number of times a particular gene is referred in an abstract.
3.2 Data integration model
The functionalities provided by GeneBrowser allow a faster and easier interpretation of the biological phenomena underlying a set of genes. To achieve that, the system needs to access heterogeneous sources of data through one of the following approaches: navigators, mediators and warehouses [23].
Navigators are usually web-based applications that aggregate links related with a specific subject. The motivation to this approach is that an increasing number of sources on the web require users to manually browse through several web pages and data sources in order to obtain the desired information. With the use of navigators all of those links are integrated in a single interface, removing the need for iterative searches. Although this is the simplest and most successful approach to data integration it has as main drawback the inexistence of data manipulation facilities, once that a web page is the minor data element. This approach is used by the SRS [24], Entrez [12] and DiseaseCard [25] databases.
Journal of Integrative Bioinformatics, 4(3):82, 2007 4
Journal of Integrative Bioinformatics 2007 http://journal.imbio.de/
b) c)
d)
f)
e)
Figure 1. The main interfaces of GeneBrowser. (a) The main page where the user creates a new dataset or selects one that has been previously created. (b) Global list of annotated genes. By selecting a gene further details are shown. Analysis of the accumulation of genes by Orthologs (c) or by Pathways (d). (e) Using the bibliographic search to find related papers. (f) Navigation in the Gene Ontology tree structure.
a)
Journal of Integrative Bioinformatics, 4(3):82, 2007 5
Journal of Integrative Bioinformatics 2007 http://journal.imbio.de/
The second approach, Mediators, translates, in real-time, the user’s requests into queries to external data sources in order to create the illusion that the system is part of a larger database. As in the navigator approach no data is locally stored but due to the action of wrappers the data can be obtained, parsed and processed. Those wrappers detect predefined patterns in the data source and retrieve the desired information. One major limitation of this approach can be the delays necessary to obtain and process the data. Systems such as TAMBIS [26] and DiscoveryLink [27] use this approach. Recently, due to increased number of systems that provide web-services interfaces to their databases, the use of mediators is being gradually deprecated.
The last approach, Warehouse, consists in a local repository that aggregates the data from several databases. In an initial step, it must be defined a data model to accommodate the information contained in all the data sources. The definition of this model can be a major issue due to its scalability as also due to the possibility of changes in the external schemas. Thereafter, the entire source data needs to be loaded, converted to the local schema and stored in the data warehouse. Examples for this approach are BN++ [28] and Biozon [29].
From a system efficiency and reliability point of view, the use of a warehouse approach would be preferred due to fast performance of the user’s requests and to the non-dependence of external sources. Despite that, the use of the last approach would not be feasible due to the large size of the information that needs to be locally stored and also to the need to periodical data updates. In alternative, the use of navigators and mediators have as main advantages the warranty that the accessed data is always updated and that small, or even none, local repositories are required. Nevertheless, when the access to the data is rather intense the use of mediators can cause delays in the system response, harming the system usability.
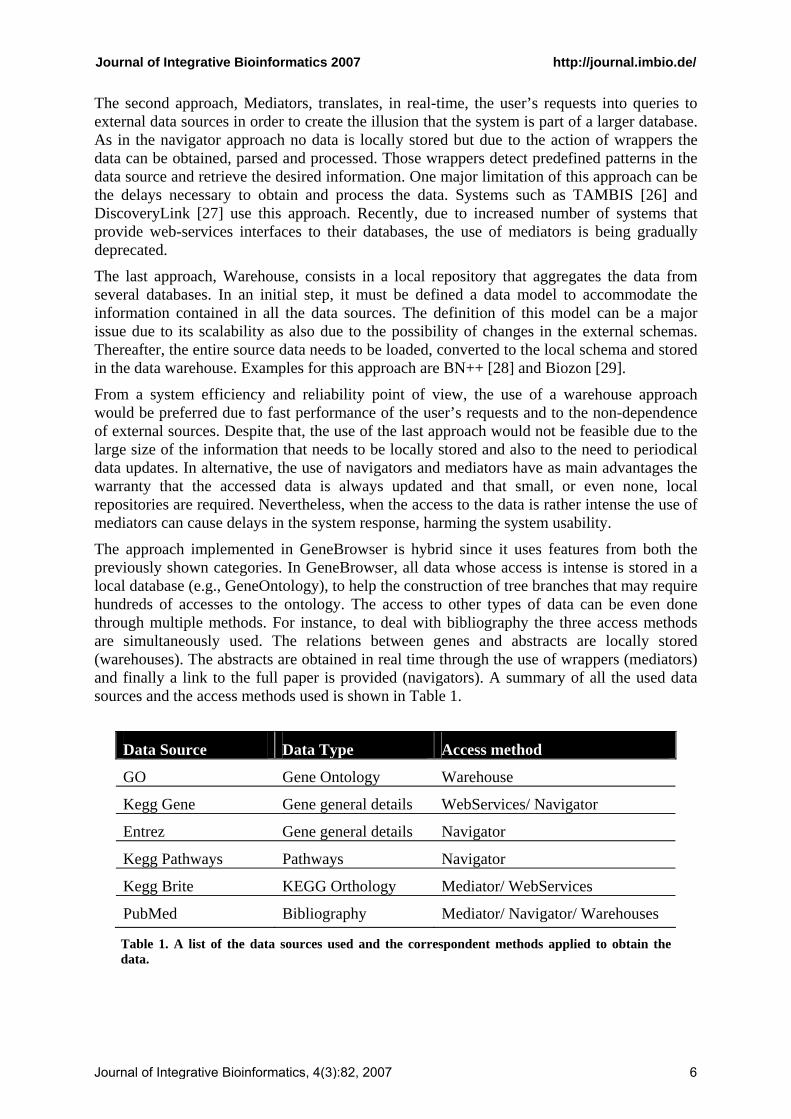
The approach implemented in GeneBrowser is hybrid since it uses features from both the previously shown categories. In GeneBrowser, all data whose access is intense is stored in a local database (e.g., GeneOntology), to help the construction of tree branches that may require hundreds of accesses to the ontology. The access to other types of data can be even done through multiple methods. For instance, to deal with bibliography the three access methods are simultaneously used. The relations between genes and abstracts are locally stored (warehouses). The abstracts are obtained in real time through the use of wrappers (mediators) and finally a link to the full paper is provided (navigators). A summary of all the used data sources and the access methods used is shown in Table 1.
Data Source Data Type Access method
GO Gene Ontology Warehouse
Kegg Gene Gene general details WebServices/ Navigator
Entrez Gene general details Navigator
Kegg Pathways Pathways Navigator
Kegg Brite KEGG Orthology Mediator/ WebServices
PubMed Bibliography Mediator/ Navigator/ Warehouses
Table 1. A list of the data sources used and the correspondent methods applied to obtain the data.
Journal of Integrative Bioinformatics, 4(3):82, 2007 6
Journal of Integrative Bioinformatics 2007 http://journal.imbio.de/
3.3 System architecture
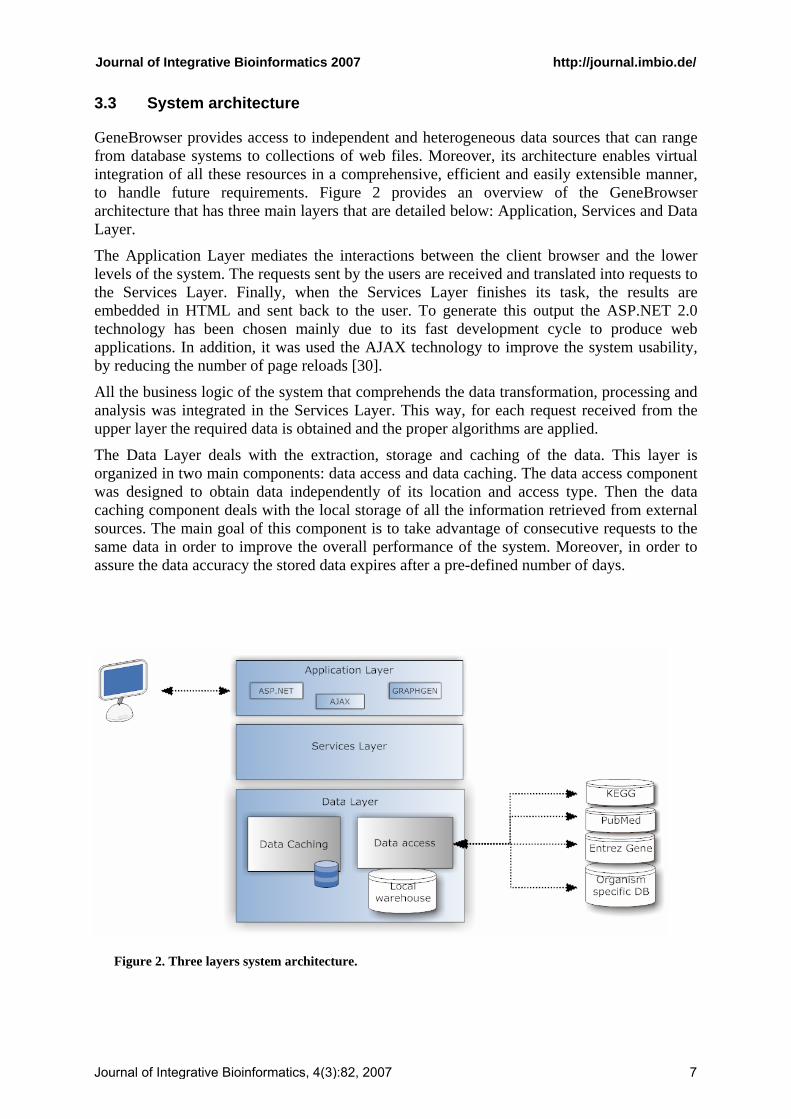
GeneBrowser provides access to independent and heterogeneous data sources that can range from database systems to collections of web files. Moreover, its architecture enables virtual integration of all these resources in a comprehensive, efficient and easily extensible manner, to handle future requirements. Figure 2 provides an overview of the GeneBrowser architecture that has three main layers that are detailed below: Application, Services and Data Layer.
The Application Layer mediates the interactions between the client browser and the lower levels of the system. The requests sent by the users are received and translated into requests to the Services Layer. Finally, when the Services Layer finishes its task, the results are embedded in HTML and sent back to the user. To generate this output the ASP.NET 2.0 technology has been chosen mainly due to its fast development cycle to produce web applications. In addition, it was used the AJAX technology to improve the system usability, by reducing the number of page reloads [30].
All the business logic of the system that comprehends the data transformation, processing and analysis was integrated in the Services Layer. This way, for each request received from the upper layer the required data is obtained and the proper algorithms are applied.
The Data Layer deals with the extraction, storage and caching of the data. This layer is organized in two main components: data access and data caching. The data access component was designed to obtain data independently of its location and access type. Then the data caching component deals with the local storage of all the information retrieved from external sources. The main goal of this component is to take advantage of consecutive requests to the same data in order to improve the overall performance of the system. Moreover, in order to assure the data accuracy the stored data expires after a pre-defined number of days.
Figure 2. Three layers system architecture.
Journal of Integrative Bioinformatics, 4(3):82, 2007 7
Journal of Integrative Bioinformatics 2007 http://journal.imbio.de/
4 Discussion and future developments
GeneBrowser is a web-based software that proposes a novel approach to extract knowledge from large scale DNA-microarray data, since it integrates characteristics from both web portals and knowledge extraction software tools. By one side it provides general details about the submitted genes and links to external resources which are characteristics common to web portals and, by the other side, it allows the direct comparison and analysis of hundreds of genes simultaneously, a feature normally associated with knowledge extraction tools. With the development of GeneBrowser we also demonstrate the usefulness of integrating genomic data extracted from heterogeneous data sources.
The GeneBrowser is currently being extended to include new functionalities. For example, statistical models are being implemented in order to verify if the shown categories are effectively relevant or if they are just happening by chance. This is done by comparing the incidence of a category in the submitted dataset to it incidence in the set of genes of the whole organism or microarray. Also, the current version of the system only supports as entry point the ID’s supported by the KEGG database, since it is currently our entry point to all databases. We are working in a naming service capable of automatically convert the GeneBank, UniGene, Entrez gene and UniProt ID’s to those used by KEGG.
We are also focusing on adding new functionalities to the system. For example, tools to visualize genes in their chromosomal locus, and tools to include more regulatory information, especially the inclusion of the TransFac database. The idea is to cover a broad spectrum of information to lead to better understanding of the biological phenomena associated with genes.
5 Acknowledgments
This study was supported by the EC INFOBIOMED project IST-507585 and the Human Frontier Science Program project RGP45/2005. J. Arrais is funded by FCT grant SFRH/BD/23837/2005.
6 References
[1] Imbeaud, S. and Auffray, C., "'The 39 steps' in gene expression profiling: critical issues and proposed best practices for microarray experiments," Drug Discov Today, vol. 10, pp. 1175-82, 2005.
[2] Anderle, P., Duval, M., Draghici, S., Kuklin, A., Littlejohn, T.G., Medrano, J.F., Vilanova, D. and Roberts, M.A., "Gene expression databases and data mining," Biotechniques, vol. Suppl, pp. 36-44, 2003.
[3] Mocellin, S. and Rossi, C.R., "Principles of gene microarray data analysis," Adv Exp Med Biol, vol. 593, pp. 19-30, 2007.
[4] Al-Shahrour, F., Arbiza, L., Dopazo, H., Huerta-Cepas, J., Minguez, P., Montaner, D. and Dopazo, J., "From genes to functional classes in the study of biological systems," BMC Bioinformatics, vol. 8, pp. 114, 2007.
[5] Draghici, S., Khatri, P., Martins, R.P., Ostermeier, G.C. and Krawetz, S.A., "Global functional profiling of gene expression," Genomics, vol. 81, pp. 98-104, 2003.
[6] Arrais, J., Oliveira, J.L., Grimes, G., Moodie, S., Robertson, K. and Ghazal, P., "Microarray data sharing in BioMedicine," presented at MIE 2006, Maastricht, Netherlands, 2006.
Journal of Integrative Bioinformatics, 4(3):82, 2007 8
Journal of Integrative Bioinformatics 2007 http://journal.imbio.de/
[7] Arrais, J., Silva, L., Rodrigues, M., Carreto, L., Oliveira, J.L. and Santos, M.A.S., "Why another microarray LIMS," presented at EMBEC 2005, Prage, Czech Republic, 2005.
[8] Al-Shahrour, F., Diaz-Uriarte, R. and Dopazo, J., "FatiGO: a web tool for finding significant associations of Gene Ontology terms with groups of genes," Bioinformatics, vol. 20, pp. 578-80, 2004.
[9] Zeeberg, B.R., Feng, W., Wang, G., Wang, M.D., Fojo, A.T., Sunshine, M., Narasimhan, S., Kane, D.W., Reinhold, W.C., Lababidi, S., Bussey, K.J., Riss, J., Barrett, J.C. and Weinstein, J.N., "GoMiner: a resource for biological interpretation of genomic and proteomic data," Genome Biol, vol. 4, pp. R28, 2003.
[10] Dahlquist, K.D., Salomonis, N., Vranizan, K., Lawlor, S.C. and Conklin, B.R., "GenMAPP, a new tool for viewing and analyzing microarray data on biological pathways," Nat Genet, vol. 31, pp. 19-20, 2002.
[11] Mlecnik, B., Scheideler, M., Hackl, H., Hartler, J., Sanchez-Cabo, F. and Trajanoski, Z., "PathwayExplorer: web service for visualizing high-throughput expression data on biological pathways," Nucleic Acids Res, vol. 33, pp. W633-7, 2005.
[12] Maglott, D., Ostell, J., Pruitt, K.D. and Tatusova, T., "Entrez Gene: gene-centered information at NCBI," Nucleic Acids Res, vol. 33, pp. D54-8, 2005.
[13] Ashburner, M., Ball, C.A., Blake, J.A., Botstein, D., Butler, H., Cherry, J.M., Davis, A.P., Dolinski, K., Dwight, S.S., Eppig, J.T., Harris, M.A., Hill, D.P., Issel-Tarver, L., Kasarskis, A., Lewis, S., Matese, J.C., Richardson, J.E., Ringwald, M., Rubin, G.M. and Sherlock, G., "Gene ontology: tool for the unification of biology. The Gene Ontology Consortium," Nat Genet, vol. 25, pp. 25-9, 2000.
[14] Ogata, H., Goto, S., Sato, K., Fujibuchi, W., Bono, H. and Kanehisa, M., "KEGG: Kyoto Encyclopedia of Genes and Genomes," Nucleic Acids Res, vol. 27, pp. 29-34, 1999.
[15] McEntyre, J. and Lipman, D., "PubMed: bridging the information gap," Cmaj, vol. 164, pp. 1317-9, 2001.
[16] Rebhan, M., Chalifa-Caspi, V., Prilusky, J. and Lancet, D., "GeneCards: integrating information about genes, proteins and diseases," Trends Genet, vol. 13, pp. 163, 1997.
[17] Rivals, I., Personnaz, L., Taing, L. and Potier, M.C., "Enrichment or depletion of a GO category within a class of genes: which test?," Bioinformatics, vol. 23, pp. 401-7, 2007.
[18] Dopazo, J., "Functional interpretation of microarray experiments," Omics, vol. 10, pp. 398-410, 2006.
[19] Myhre, S., Tveit, H., Mollestad, T. and Laegreid, A., "Additional gene ontology structure for improved biological reasoning," Bioinformatics, vol. 22, pp. 2020-7, 2006.
[20] Zhong, S., Storch, K.F., Lipan, O., Kao, M.C., Weitz, C.J. and Wong, W.H., "GoSurfer: a graphical interactive tool for comparative analysis of large gene sets in Gene Ontology space," Appl Bioinformatics, vol. 3, pp. 261-4, 2004.
[21] Zhang, B., Schmoyer, D., Kirov, S. and Snoddy, J., "GOTree Machine (GOTM): a web-based platform for interpreting sets of interesting genes using Gene Ontology hierarchies," BMC Bioinformatics, vol. 5, pp. 16, 2004.
Journal of Integrative Bioinformatics, 4(3):82, 2007 9
Journal of Integrative Bioinformatics 2007 http://journal.imbio.de/
[22] Kanehisa, M., Goto, S., Hattori, M., Aoki-Kinoshita, K.F., Itoh, M., Kawashima, S., Katayama, T., Araki, M. and Hirakawa, M., "From genomics to chemical genomics: new developments in KEGG," Nucleic Acids Res, vol. 34, pp. D354-7, 2006.
[23] Stein, L.D., "Integrating biological databases," Nat Rev Genet, vol. 4, pp. 337-45, 2003.
[24] Etzold, T. and Argos, P., "SRS--an indexing and retrieval tool for flat file data libraries," Comput Appl Biosci, vol. 9, pp. 49-57, 1993.
[25] Dias, G.S., Oliveira, J.L., Vicente, J. and Martin-Sanchez, F., "Integrating medical and genomic data: a successful example for rare diseases," Stud Health Technol Inform, vol. 124, pp. 125-30, 2006.
[26] Stevens, R., Baker, P., Bechhofer, S., Ng, G., Jacoby, A., Paton, N.W., Goble, C.A. and Brass, A., "TAMBIS: transparent access to multiple bioinformatics information sources," Bioinformatics, vol. 16, pp. 184-5, 2000.
[27] Haas, L.M., Schwarz, P.M., Kodali, P., Kotlar, E., Rice, J.E. and Swope, W.C., "DiscoveryLink: A system for integrated access to life sciences data sources," IBM Systems Journal, vol. 40(2), pp. 489-511, 2001.
[28] K¨untzer, J., Blum, T., Gerasch, A., Backes, C., Hildebrandt, A., Kaufmann, M., Kohlbacher, O. and Lenhof, H.-P., "BN++ - A Biological Information System," Journal of Integrative Bioinformatics, 2006.
[29] Birkland, A. and Yona, G., "BIOZON: a system for unification, management and analysis of heterogeneous biological data," BMC Bioinformatics, vol. 7, pp. 70, 2006.
[30] Garret, J.J., "Ajax: A New Approach to Web Applications. http://www.adaptivepath.com/publications/essays/archives/000385.php."
Journal of Integrative Bioinformatics, 4(3):82, 2007 10