Gene-rich islands for fiber development in the cotton genome
11
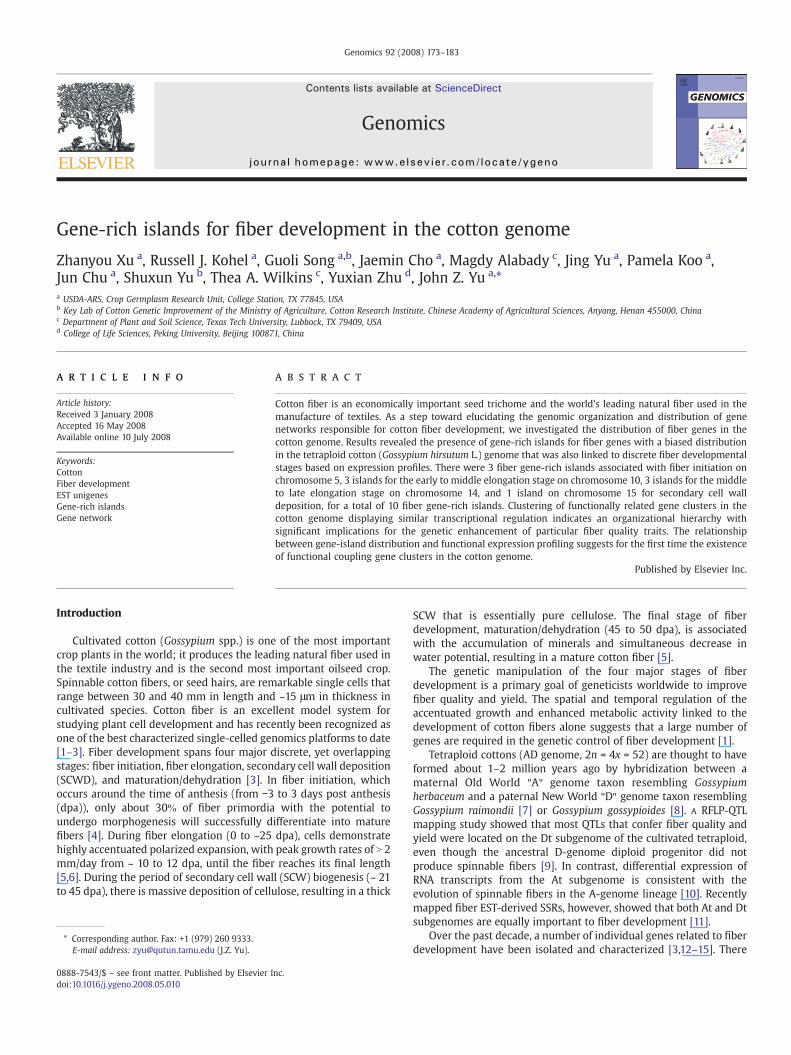
Gene-rich islands for fiber development in the cotton genome Zhanyou Xu a , Russell J. Kohel a , Guoli Song a,b , Jaemin Cho a , Magdy Alabady c , Jing Yu a , Pamela Koo a , Jun Chu a , Shuxun Yu b , Thea A. Wilkins c , Yuxian Zhu d , John Z. Yu a, * a USDA-ARS, Crop Germplasm Research Unit, College Station, TX 77845, USA b Key Lab of Cotton Genetic Improvement of the Ministry of Agriculture, Cotton Research Institute, Chinese Academy of Agricultural Sciences, Anyang, Henan 455000, China c Department of Plant and Soil Science, Texas Tech University, Lubbock, TX 79409, USA d College of Life Sciences, Peking University, Beijing 100871, China abstract article info Article history: Received 3 January 2008 Accepted 16 May 2008 Available online 10 July 2008 Keywords: Cotton Fiber development EST unigenes Gene-rich islands Gene network Cotton fiber is an economically important seed trichome and the world's leading natural fiber used in the manufacture of textiles. As a step toward elucidating the genomic organization and distribution of gene networks responsible for cotton fiber development, we investigated the distribution of fiber genes in the cotton genome. Results revealed the presence of gene-rich islands for fiber genes with a biased distribution in the tetraploid cotton (Gossypium hirsutum L.) genome that was also linked to discrete fiber developmental stages based on expression profiles. There were 3 fiber gene-rich islands associated with fiber initiation on chromosome 5, 3 islands for the early to middle elongation stage on chromosome 10, 3 islands for the middle to late elongation stage on chromosome 14, and 1 island on chromosome 15 for secondary cell wall deposition, for a total of 10 fiber gene-rich islands. Clustering of functionally related gene clusters in the cotton genome displaying similar transcriptional regulation indicates an organizational hierarchy with significant implications for the genetic enhancement of particular fiber quality traits. The relationship between gene-island distribution and functional expression profiling suggests for the first time the existence of functional coupling gene clusters in the cotton genome. Published by Elsevier Inc. Introduction Cultivated cotton (Gossypium spp.) is one of the most important crop plants in the world; it produces the leading natural fiber used in the textile industry and is the second most important oilseed crop. Spinnable cotton fibers, or seed hairs, are remarkable single cells that range between 30 and 40 mm in length and ~15 μm in thickness in cultivated species. Cotton fiber is an excellent model system for studying plant cell development and has recently been recognized as one of the best characterized single-celled genomics platforms to date [1–3]. Fiber development spans four major discrete, yet overlapping stages: fiber initiation, fiber elongation, secondary cell wall deposition (SCWD), and maturation/dehydration [3]. In fiber initiation, which occurs around the time of anthesis (from -3 to 3 days post anthesis (dpa)), only about 30k of fiber primordia with the potential to undergo morphogenesis will successfully differentiate into mature fibers [4]. During fiber elongation (0 to ~25 dpa), cells demonstrate highly accentuated polarized expansion, with peak growth rates of N 2 mm/day from ~ 10 to 12 dpa, until the fiber reaches its final length [5,6]. During the period of secondary cell wall (SCW) biogenesis (~ 21 to 45 dpa), there is massive deposition of cellulose, resulting in a thick SCW that is essentially pure cellulose. The final stage of fiber development, maturation/dehydration (45 to 50 dpa), is associated with the accumulation of minerals and simultaneous decrease in water potential, resulting in a mature cotton fiber [5]. The genetic manipulation of the four major stages of fiber development is a primary goal of geneticists worldwide to improve fiber quality and yield. The spatial and temporal regulation of the accentuated growth and enhanced metabolic activity linked to the development of cotton fibers alone suggests that a large number of genes are required in the genetic control of fiber development [1]. Tetraploid cottons (AD genome, 2n =4x = 52) are thought to have formed about 1–2 million years ago by hybridization between a maternal Old World qAq genome taxon resembling Gossypium herbaceum and a paternal New World qDq genome taxon resembling Gossypium raimondii [7] or Gossypium gossypioides [8]. A RFLP-QTL mapping study showed that most QTLs that confer fiber quality and yield were located on the Dt subgenome of the cultivated tetraploid, even though the ancestral D-genome diploid progenitor did not produce spinnable fibers [9]. In contrast, differential expression of RNA transcripts from the At subgenome is consistent with the evolution of spinnable fibers in the A-genome lineage [10]. Recently mapped fiber EST-derived SSRs, however, showed that both At and Dt subgenomes are equally important to fiber development [11]. Over the past decade, a number of individual genes related to fiber development have been isolated and characterized [3,12–15]. There Genomics 92 (2008) 173–183 * Corresponding author. Fax: +1 (979) 260 9333. E-mail address: [email protected] (J.Z. Yu). 0888-7543/$ – see front matter. Published by Elsevier Inc. doi:10.1016/j.ygeno.2008.05.010 Contents lists available at ScienceDirect Genomics journal homepage: www.elsevier.com/locate/ygeno
-
Upload
independent -
Category
Documents
-
view
0 -
download
0
Transcript of Gene-rich islands for fiber development in the cotton genome
Genomics 92 (2008) 173–183
Contents lists available at ScienceDirect
Genomics
j ourna l homepage: www.e lsev ie r.com/ locate /ygeno
Gene-rich islands for fiber development in the cotton genome
Zhanyou Xu a, Russell J. Kohel a, Guoli Song a,b, Jaemin Cho a, Magdy Alabady c, Jing Yu a, Pamela Koo a,Jun Chu a, Shuxun Yu b, Thea A. Wilkins c, Yuxian Zhu d, John Z. Yu a,*a USDA-ARS, Crop Germplasm Research Unit, College Station, TX 77845, USAb Key Lab of Cotton Genetic Improvement of the Ministry of Agriculture, Cotton Research Institute, Chinese Academy of Agricultural Sciences, Anyang, Henan 455000, Chinac Department of Plant and Soil Science, Texas Tech University, Lubbock, TX 79409, USAd College of Life Sciences, Peking University, Beijing 100871, China
* Corresponding author. Fax: +1 (979) 260 9333.E-mail address: [email protected] (J.Z. Yu).
0888-7543/$ – see front matter. Published by Elsevier Idoi:10.1016/j.ygeno.2008.05.010
a b s t r a c t
a r t i c l e i n f oArticle history:
Cotton fiber is an economic Received 3 January 2008Accepted 16 May 2008Available online 10 July 2008Keywords:CottonFiber developmentEST unigenesGene-rich islandsGene network
ally important seed trichome and the world's leading natural fiber used in themanufacture of textiles. As a step toward elucidating the genomic organization and distribution of genenetworks responsible for cotton fiber development, we investigated the distribution of fiber genes in thecotton genome. Results revealed the presence of gene-rich islands for fiber genes with a biased distributionin the tetraploid cotton (Gossypium hirsutum L.) genome that was also linked to discrete fiber developmentalstages based on expression profiles. There were 3 fiber gene-rich islands associated with fiber initiation onchromosome 5, 3 islands for the early to middle elongation stage on chromosome 10, 3 islands for the middleto late elongation stage on chromosome 14, and 1 island on chromosome 15 for secondary cell walldeposition, for a total of 10 fiber gene-rich islands. Clustering of functionally related gene clusters in thecotton genome displaying similar transcriptional regulation indicates an organizational hierarchy withsignificant implications for the genetic enhancement of particular fiber quality traits. The relationshipbetween gene-island distribution and functional expression profiling suggests for the first time the existenceof functional coupling gene clusters in the cotton genome.
Published by Elsevier Inc.
Introduction
Cultivated cotton (Gossypium spp.) is one of the most importantcrop plants in the world; it produces the leading natural fiber used inthe textile industry and is the second most important oilseed crop.Spinnable cotton fibers, or seed hairs, are remarkable single cells thatrange between 30 and 40 mm in length and ~15 μm in thickness incultivated species. Cotton fiber is an excellent model system forstudying plant cell development and has recently been recognized asone of the best characterized single-celled genomics platforms to date[1–3]. Fiber development spans four major discrete, yet overlappingstages: fiber initiation, fiber elongation, secondary cell wall deposition(SCWD), and maturation/dehydration [3]. In fiber initiation, whichoccurs around the time of anthesis (from −3 to 3 days post anthesis(dpa)), only about 30k of fiber primordia with the potential toundergo morphogenesis will successfully differentiate into maturefibers [4]. During fiber elongation (0 to ~25 dpa), cells demonstratehighly accentuated polarized expansion, with peak growth rates of N 2mm/day from ~ 10 to 12 dpa, until the fiber reaches its final length[5,6]. During the period of secondary cell wall (SCW) biogenesis (~ 21to 45 dpa), there is massive deposition of cellulose, resulting in a thick
nc.
SCW that is essentially pure cellulose. The final stage of fiberdevelopment, maturation/dehydration (45 to 50 dpa), is associatedwith the accumulation of minerals and simultaneous decrease inwater potential, resulting in a mature cotton fiber [5].
The genetic manipulation of the four major stages of fiberdevelopment is a primary goal of geneticists worldwide to improvefiber quality and yield. The spatial and temporal regulation of theaccentuated growth and enhanced metabolic activity linked to thedevelopment of cotton fibers alone suggests that a large number ofgenes are required in the genetic control of fiber development [1].
Tetraploid cottons (AD genome, 2n = 4x = 52) are thought to haveformed about 1–2 million years ago by hybridization between amaternal Old World qAq genome taxon resembling Gossypiumherbaceum and a paternal New World qDq genome taxon resemblingGossypium raimondii [7] or Gossypium gossypioides [8]. A RFLP-QTLmapping study showed that most QTLs that confer fiber quality andyield were located on the Dt subgenome of the cultivated tetraploid,even though the ancestral D-genome diploid progenitor did notproduce spinnable fibers [9]. In contrast, differential expression ofRNA transcripts from the At subgenome is consistent with theevolution of spinnable fibers in the A-genome lineage [10]. Recentlymapped fiber EST-derived SSRs, however, showed that both At and Dtsubgenomes are equally important to fiber development [11].
Over the past decade, a number of individual genes related to fiberdevelopment have been isolated and characterized [3,12–15]. There

174 Z. Xu et al. / Genomics 92 (2008) 173–183
are a number of parallels between morphogenesis of cotton fibers andArabidopsis leaf trichomes. Cotton and Arabidopsis use similar, butevolutionarily divergent, genetic mechanisms for regulating cottonfiber and trichome morphogenesis [1,16–18]. Recent efforts havefocused on genome-scale systematic studies of fiber developmentgenes to identify promising candidate genes and their functionalannotation [1,10,19–22]. Expression profiling during fiber elongationindicated that cotton fiber development could involve as much as 50kof the cotton transcriptome [1,21]. The genetic complexity of the fibertranscriptome translates into an estimated 36,000 homologous fibergenes in the At and Dt genomes of the tetraploid species. Transcrip-tome profiling has also revealed dynamic changes in gene expressionbetween primary and secondary cell wall biogenesis, which furtherillustrates that fiber genes are highly stage-specific. Genetic mappingof stage-specific fiber-elongation ESTs representing 1749 cDNAsrevealed a nonrandom distribution; 65 intervals were localized togene-rich regions and 17 intervals to gene-poor regions of thechromosomes [23].
The inconsistency of results in assessing the contributions of thesubgenomes to fiber development can be attributed to the limitednumber of mapped markers, especially those for fiber candidategenes [1], and a bias in the selection of markers based on low levelsof polymorphism in DNA markers. Despite efforts to determine thedistribution of fiber development genes in the cotton genome usingDNA-based polymorphic markers [9,11,23], controversy still reigns asto which subgenome (At or Dt) is more important for fiberdevelopment and which chromosome(s) is primarily responsiblefor the development and production of a natural fiber. A frequentlyasked question that remains to be addressed is whether there aregene-rich islands in the cotton genome and what would be thedistribution of such islands in the subgenomes. Elucidating the genenetworks that contribute to fiber development will help facilitategenomic manipulations of cotton and other polyploid plants,including the design of a strategy for sequencing gene-rich regionsof a genome.
Table 1Summary of the genetically mapped markers in the 26 chromosomesa
Map Reference
[62] [9] [63] [64] [65] [66] [67] [68] [69] [70] [71]
c01 22 0 0 0 0 20 0 23 32 0 35c02 8 0 0 0 0 0 0 38 0 14 42c03 0 0 0 0 0 11 0 36 0 26 46c04 0 0 0 0 0 21 0 26 10 49 0c05 0 0 0 0 0 32 0 38 0 28 54c06 0 0 0 0 0 0 0 37 24 21 46c07 0 0 0 0 0 0 0 39 0 15 49c08 0 0 0 0 0 2 0 50 0 19 60c09 0 0 0 0 0 46 0 38 40 31 42c10 0 0 0 0 0 21 0 32 5 22 18c11 0 0 0 0 0 2 0 54 0 41 65c12 0 0 0 0 0 34 0 47 27 26 50c13 0 0 0 0 0 0 0 49 0 21 60c14 0 3 0 0 1 0 14 31 12 0 12c15 0 0 21 0 1 0 0 30 0 0 11c16 0 2 27 0 1 0 0 17 0 17 3c17 0 0 22 0 0 0 0 22 0 15 6c18 0 0 37 0 1 0 0 37 11 0 5c19 0 0 0 0 0 0 0 0 0 36 0c20 0 0 31 0 0 0 0 42 38 25 11c21 0 0 0 0 0 0 0 0 0 26 0c22 0 0 11 0 1 0 0 20 9 0 7c23 0 0 17 0 0 0 0 30 0 19 6c24 0 0 0 0 0 0 0 0 0 30 0c25 0 0 26 1 0 0 0 33 11 22 7c26 0 0 0 0 0 0 0 21 14 22 25Total loci 30 5 192 1 5 189 14 790 233 525 660
a Data were compiled as of February 2007. Letter bcQ in the first column stands for chrom
A solution to overcome the marker limitation and to obtain anaccurate distribution of fiber genes may be to map all fiber ESTsonto an integrated physical and genetic map of cotton. Cottoncurrently has a limited genetic map and a partial physical map. Asthe first step toward mapping the genetic network regulating fiberdevelopment, a bioinformatics approach was employed that utilizedexisting resources to identify the expression pattern of fiber genesand their distribution across the genome to tag key regions astargets for further investigation. Resources mined for this studyinclude ~185,000 EST sequences in GenBank amassed from 31 cDNAlibraries constructed from 16 developing fiber stages and 15nonfiber tissues, a total of 6921 genetic markers collected frompublished maps, and a 6 x genome coverage integrated genetic andphysical map (Xu et al., in preparation) deposited in the CottonDBdatabase (http://www.cottondb.org/). A recently described set of51,107 nonredundant unigene sequences from cotton [24] provides avaluable new resource for studying the distribution and expressionpatterns of these fiber genes, in which 185,370 ESTs were assembledinto 51,107 EST unigene sequences for further analysis. The aims ofthis study were (1) to assign assembled fiber unigenes to cottonchromosomes to discern any patterns in the distribution of gene-rich islands in the cotton genome and (2) to connect these gene-richislands with functionally related clusters on the basis of develop-mental expression patterns. The discovery of gene-rich clusters thatare linked to specific development stages and localized to specificchromosomes provides the first glimpse into the genetic networkregulating fiber development.
Results
The first step in investigating the genome distribution of devel-opmentally regulated and stage-specific fiber genes was to assemble allgene sequences, markers, andmapped sequence-tagged-sites (STSs) forcomparative analysis. The three major resources used for comparativeanalysis included fiber and nonfiber ESTs, a consensus genetic map, and
Loci/Chr Sequenceloci/Chr
[23] [72] [73] [74] [75] [76] [11] [77]
76 0 0 6 6 7 26 4 257 15566 0 0 5 0 0 25 9 207 11095 0 83 12 17 5 37 8 376 19499 0 0 0 6 0 19 1 231 150
166 9 5 4 32 0 54 7 429 24970 0 0 0 12 0 38 14 262 152
106 9 12 6 13 0 26 6 281 161102 0 0 6 17 2 36 11 305 19395 0 4 11 9 1 39 5 361 19599 0 3 5 27 1 44 12 289 180
105 0 0 3 33 1 50 17 371 247122 11 2 4 0 0 39 9 371 218107 0 0 4 19 0 34 0 294 183112 0 1 2 32 1 27 1 249 15796 0 0 18 0 1 29 8 215 16488 0 0 2 0 1 21 8 187 12857 0 0 1 0 0 19 8 150 98110 0 0 7 18 0 32 16 274 171157 0 0 0 11 0 51 1 256 19593 0 4 6 20 1 29 4 304 176133 0 0 0 3 2 46 0 210 16864 0 0 0 0 0 28 4 144 9695 0 0 1 16 0 31 5 220 14694 0 0 0 18 1 50 0 193 14986 0 0 0 4 1 39 1 231 15191 0 27 3 12 1 37 1 254 173
2584 29 141 106 325 26 906 160 6921 4359
osome.
175Z. Xu et al. / Genomics 92 (2008) 173–183
an integrated genetic and physicalmap (Xu et al., in preparation) (http://www.cottondb.org/) as described in the following paragraphs.
Assembly of a virtual genetic consensus map
A total of 6921 nonredundant genetic loci (including both fiber-and non-fiber-relatedmarkers) that map to all 26 chromosomes of theAt (chromosomes 1–13) and Dt (chromosomes 14–26) subgenomes ofallotetraploid cotton were collected and summarized from 24published genetic linkage maps (Table 1). While 59.1k (4021) of themarkers detected single loci, the remainder (40.9k or 2830 markers)detected multiple loci. Among the 26 chromosomes, chromosome 5was assigned the highest number of loci, with 429 genetic markersand 249 STSs, while chromosome 22 bore the smallest number ofgeneticmarkers (144) andSTSs (96) (Table S1).However, basedonoutlieranalysis (Table S1), both geneticmarkers and sequenced lociwere evenlydistributed among the 26 chromosomes, meaning no bias based on thedistribution of markers and STSs would be introduced. In addition, 152BAC-end sequences and 110 BAC-derived subclone sequences anchoredonto a 6 x genome coverage integrated genetic and physical map (Xu etal., in preparation) in theCottonDBdatabase (http://www.cottondb.org/)were used to locate the EST unigenes in the genome.
In silico analysis of stage-specific fiber gene expression
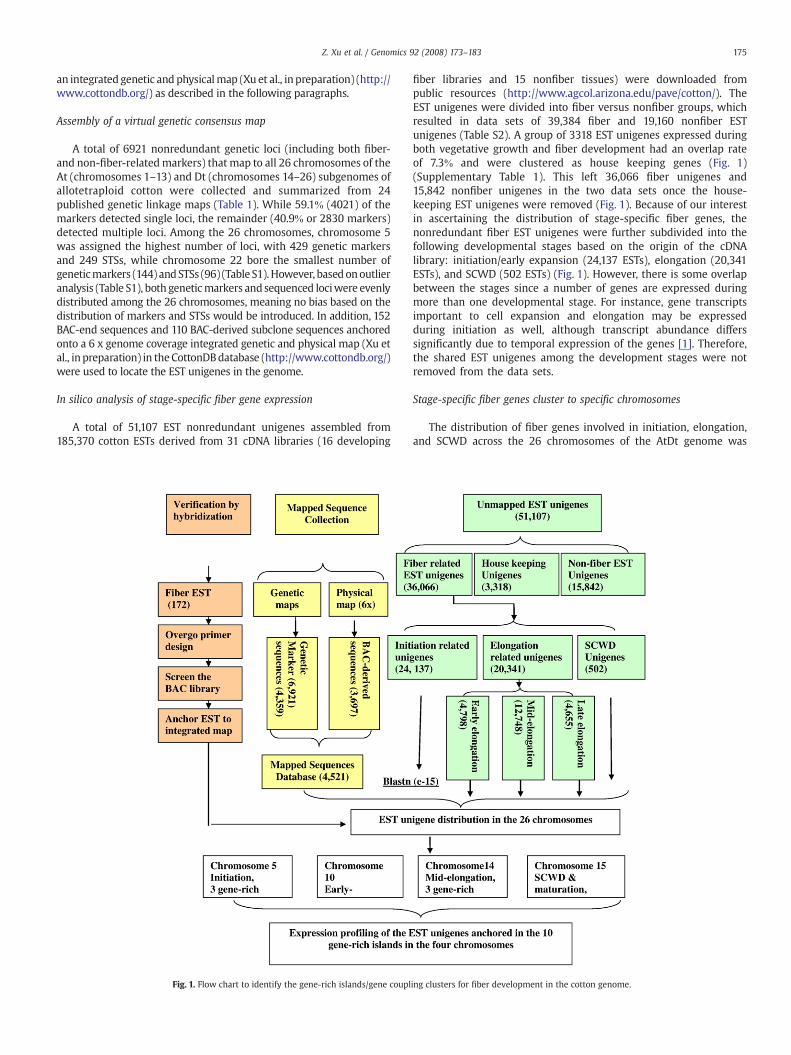
A total of 51,107 EST nonredundant unigenes assembled from185,370 cotton ESTs derived from 31 cDNA libraries (16 developing
Fig. 1. Flow chart to identify the gene-rich islands/gene coupl
fiber libraries and 15 nonfiber tissues) were downloaded frompublic resources (http://www.agcol.arizona.edu/pave/cotton/). TheEST unigenes were divided into fiber versus nonfiber groups, whichresulted in data sets of 39,384 fiber and 19,160 nonfiber ESTunigenes (Table S2). A group of 3318 EST unigenes expressed duringboth vegetative growth and fiber development had an overlap rateof 7.3k and were clustered as house keeping genes (Fig. 1)(Supplementary Table 1). This left 36,066 fiber unigenes and15,842 nonfiber unigenes in the two data sets once the house-keeping EST unigenes were removed (Fig. 1). Because of our interestin ascertaining the distribution of stage-specific fiber genes, thenonredundant fiber EST unigenes were further subdivided into thefollowing developmental stages based on the origin of the cDNAlibrary: initiation/early expansion (24,137 ESTs), elongation (20,341ESTs), and SCWD (502 ESTs) (Fig. 1). However, there is some overlapbetween the stages since a number of genes are expressed duringmore than one developmental stage. For instance, gene transcriptsimportant to cell expansion and elongation may be expressedduring initiation as well, although transcript abundance differssignificantly due to temporal expression of the genes [1]. Therefore,the shared EST unigenes among the development stages were notremoved from the data sets.
Stage-specific fiber genes cluster to specific chromosomes
The distribution of fiber genes involved in initiation, elongation,and SCWD across the 26 chromosomes of the AtDt genome was
ing clusters for fiber development in the cotton genome.
176 Z. Xu et al. / Genomics 92 (2008) 173–183
determined based on EST homologues with an E value of 1 × 10⁻¹⁵
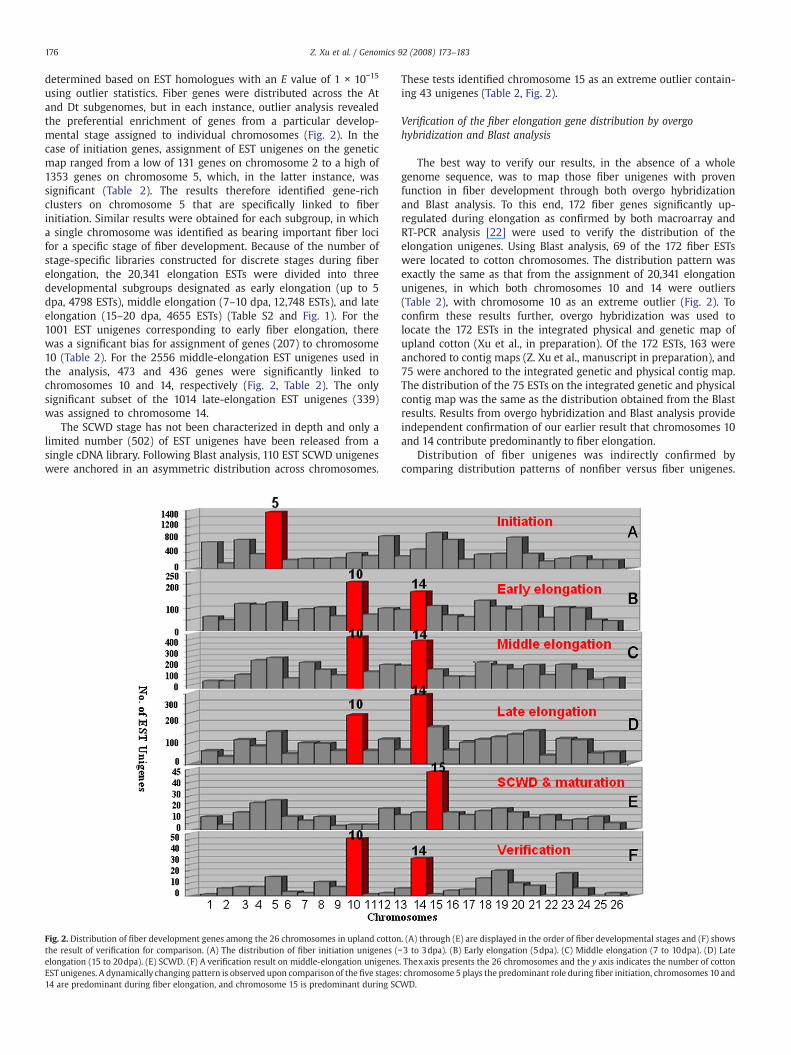
using outlier statistics. Fiber genes were distributed across the Atand Dt subgenomes, but in each instance, outlier analysis revealedthe preferential enrichment of genes from a particular develop-mental stage assigned to individual chromosomes (Fig. 2). In thecase of initiation genes, assignment of EST unigenes on the geneticmap ranged from a low of 131 genes on chromosome 2 to a high of1353 genes on chromosome 5, which, in the latter instance, wassignificant (Table 2). The results therefore identified gene-richclusters on chromosome 5 that are specifically linked to fiberinitiation. Similar results were obtained for each subgroup, in whicha single chromosome was identified as bearing important fiber locifor a specific stage of fiber development. Because of the number ofstage-specific libraries constructed for discrete stages during fiberelongation, the 20,341 elongation ESTs were divided into threedevelopmental subgroups designated as early elongation (up to 5dpa, 4798 ESTs), middle elongation (7–10 dpa, 12,748 ESTs), and lateelongation (15–20 dpa, 4655 ESTs) (Table S2 and Fig. 1). For the1001 EST unigenes corresponding to early fiber elongation, therewas a significant bias for assignment of genes (207) to chromosome10 (Table 2). For the 2556 middle-elongation EST unigenes used inthe analysis, 473 and 436 genes were significantly linked tochromosomes 10 and 14, respectively (Fig. 2, Table 2). The onlysignificant subset of the 1014 late-elongation EST unigenes (339)was assigned to chromosome 14.
The SCWD stage has not been characterized in depth and only alimited number (502) of EST unigenes have been released from asingle cDNA library. Following Blast analysis, 110 EST SCWD unigeneswere anchored in an asymmetric distribution across chromosomes.
Fig. 2. Distribution of fiber development genes among the 26 chromosomes in upland cottonthe result of verification for comparison. (A) The distribution of fiber initiation unigenes (elongation (15 to 20dpa). (E) SCWD. (F) A verification result on middle-elongation unigenesEST unigenes. A dynamically changing pattern is observed upon comparison of the five stages14 are predominant during fiber elongation, and chromosome 15 is predominant during SC
These tests identified chromosome 15 as an extreme outlier contain-ing 43 unigenes (Table 2, Fig. 2).
Verification of the fiber elongation gene distribution by overgohybridization and Blast analysis
The best way to verify our results, in the absence of a wholegenome sequence, was to map those fiber unigenes with provenfunction in fiber development through both overgo hybridizationand Blast analysis. To this end, 172 fiber genes significantly up-regulated during elongation as confirmed by both macroarray andRT-PCR analysis [22] were used to verify the distribution of theelongation unigenes. Using Blast analysis, 69 of the 172 fiber ESTswere located to cotton chromosomes. The distribution pattern wasexactly the same as that from the assignment of 20,341 elongationunigenes, in which both chromosomes 10 and 14 were outliers(Table 2), with chromosome 10 as an extreme outlier (Fig. 2). Toconfirm these results further, overgo hybridization was used tolocate the 172 ESTs in the integrated physical and genetic map ofupland cotton (Xu et al., in preparation). Of the 172 ESTs, 163 wereanchored to contig maps (Z. Xu et al., manuscript in preparation), and75 were anchored to the integrated genetic and physical contig map.The distribution of the 75 ESTs on the integrated genetic and physicalcontig map was the same as the distribution obtained from the Blastresults. Results from overgo hybridization and Blast analysis provideindependent confirmation of our earlier result that chromosomes 10and 14 contribute predominantly to fiber elongation.
Distribution of fiber unigenes was indirectly confirmed bycomparing distribution patterns of nonfiber versus fiber unigenes.
. (A) through (E) are displayed in the order of fiber developmental stages and (F) shows−3 to 3dpa). (B) Early elongation (5dpa). (C) Middle elongation (7 to 10dpa). (D) Late. Thexaxis presents the 26 chromosomes and the y axis indicates the number of cotton: chromosome 5 plays the predominant role during fiber initiation, chromosomes 10 andWD.
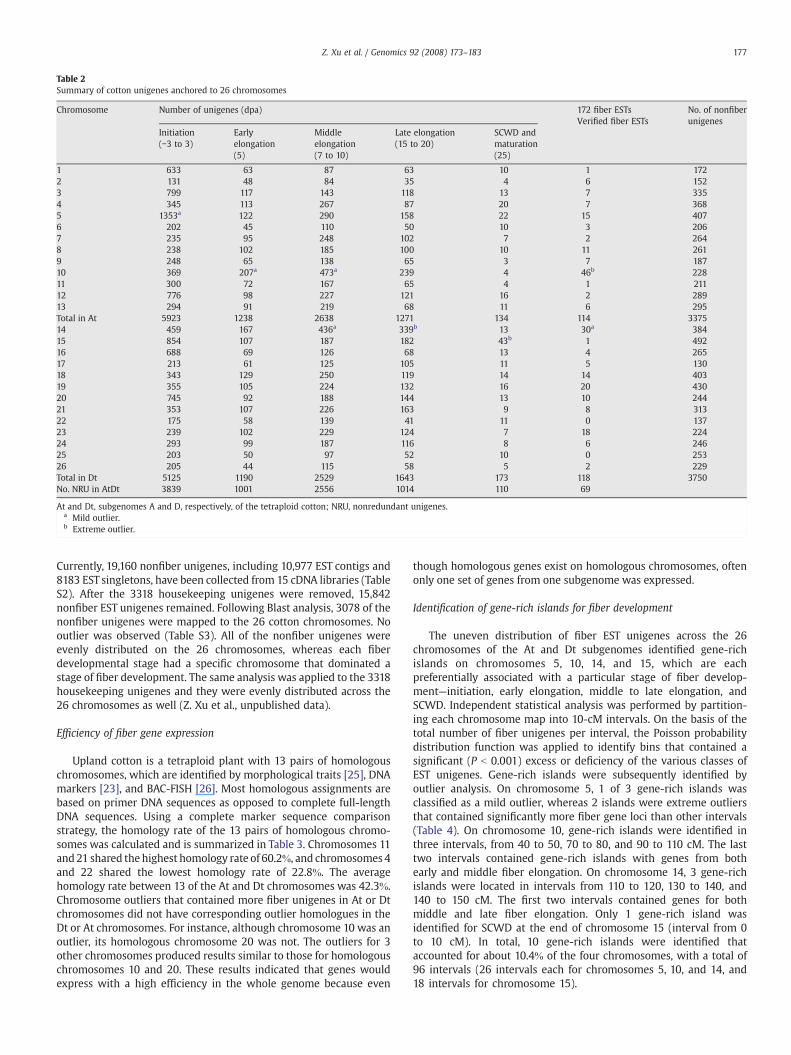
Table 2Summary of cotton unigenes anchored to 26 chromosomes
Chromosome Number of unigenes (dpa) 172 fiber ESTsVerified fiber ESTs
No. of nonfiberunigenes
Initiation(−3 to 3)
Earlyelongation(5)
Middleelongation(7 to 10)
Late elongation(15 to 20)
SCWD andmaturation(25)
1 633 63 87 63 10 1 1722 131 48 84 35 4 6 1523 799 117 143 118 13 7 3354 345 113 267 87 20 7 3685 1353a 122 290 158 22 15 4076 202 45 110 50 10 3 2067 235 95 248 102 7 2 2648 238 102 185 100 10 11 2619 248 65 138 65 3 7 18710 369 207a 473a 239 4 46b 22811 300 72 167 65 4 1 21112 776 98 227 121 16 2 28913 294 91 219 68 11 6 295Total in At 5923 1238 2638 1271 134 114 337514 459 167 436a 339b 13 30a 38415 854 107 187 182 43b 1 49216 688 69 126 68 13 4 26517 213 61 125 105 11 5 13018 343 129 250 119 14 14 40319 355 105 224 132 16 20 43020 745 92 188 144 13 10 24421 353 107 226 163 9 8 31322 175 58 139 41 11 0 13723 239 102 229 124 7 18 22424 293 99 187 116 8 6 24625 203 50 97 52 10 0 25326 205 44 115 58 5 2 229Total in Dt 5125 1190 2529 1643 173 118 3750No. NRU in AtDt 3839 1001 2556 1014 110 69
At and Dt, subgenomes A and D, respectively, of the tetraploid cotton; NRU, nonredundant unigenes.a Mild outlier.b Extreme outlier.
177Z. Xu et al. / Genomics 92 (2008) 173–183
Currently, 19,160 nonfiber unigenes, including 10,977 EST contigs and8183 EST singletons, have been collected from 15 cDNA libraries (TableS2). After the 3318 housekeeping unigenes were removed, 15,842nonfiber EST unigenes remained. Following Blast analysis, 3078 of thenonfiber unigenes were mapped to the 26 cotton chromosomes. Nooutlier was observed (Table S3). All of the nonfiber unigenes wereevenly distributed on the 26 chromosomes, whereas each fiberdevelopmental stage had a specific chromosome that dominated astage of fiber development. The same analysis was applied to the 3318housekeeping unigenes and they were evenly distributed across the26 chromosomes as well (Z. Xu et al., unpublished data).
Efficiency of fiber gene expression
Upland cotton is a tetraploid plant with 13 pairs of homologouschromosomes, which are identified by morphological traits [25], DNAmarkers [23], and BAC-FISH [26]. Most homologous assignments arebased on primer DNA sequences as opposed to complete full-lengthDNA sequences. Using a complete marker sequence comparisonstrategy, the homology rate of the 13 pairs of homologous chromo-somes was calculated and is summarized in Table 3. Chromosomes 11and21 shared the highest homology rate of 60.2k, and chromosomes 4and 22 shared the lowest homology rate of 22.8k. The averagehomology rate between 13 of the At and Dt chromosomes was 42.3k.Chromosome outliers that contained more fiber unigenes in At or Dtchromosomes did not have corresponding outlier homologues in theDt or At chromosomes. For instance, although chromosome 10 was anoutlier, its homologous chromosome 20 was not. The outliers for 3other chromosomes produced results similar to those for homologouschromosomes 10 and 20. These results indicated that genes wouldexpress with a high efficiency in the whole genome because even
though homologous genes exist on homologous chromosomes, oftenonly one set of genes from one subgenome was expressed.
Identification of gene-rich islands for fiber development
The uneven distribution of fiber EST unigenes across the 26chromosomes of the At and Dt subgenomes identified gene-richislands on chromosomes 5, 10, 14, and 15, which are eachpreferentially associated with a particular stage of fiber develop-ment—initiation, early elongation, middle to late elongation, andSCWD. Independent statistical analysis was performed by partition-ing each chromosome map into 10-cM intervals. On the basis of thetotal number of fiber unigenes per interval, the Poisson probabilitydistribution function was applied to identify bins that contained asignificant (P b 0.001) excess or deficiency of the various classes ofEST unigenes. Gene-rich islands were subsequently identified byoutlier analysis. On chromosome 5, 1 of 3 gene-rich islands wasclassified as a mild outlier, whereas 2 islands were extreme outliersthat contained significantly more fiber gene loci than other intervals(Table 4). On chromosome 10, gene-rich islands were identified inthree intervals, from 40 to 50, 70 to 80, and 90 to 110 cM. The lasttwo intervals contained gene-rich islands with genes from bothearly and middle fiber elongation. On chromosome 14, 3 gene-richislands were located in intervals from 110 to 120, 130 to 140, and140 to 150 cM. The first two intervals contained genes for bothmiddle and late fiber elongation. Only 1 gene-rich island wasidentified for SCWD at the end of chromosome 15 (interval from 0to 10 cM). In total, 10 gene-rich islands were identified thataccounted for about 10.4k of the four chromosomes, with a total of96 intervals (26 intervals each for chromosomes 5, 10, and 14, and18 intervals for chromosome 15).
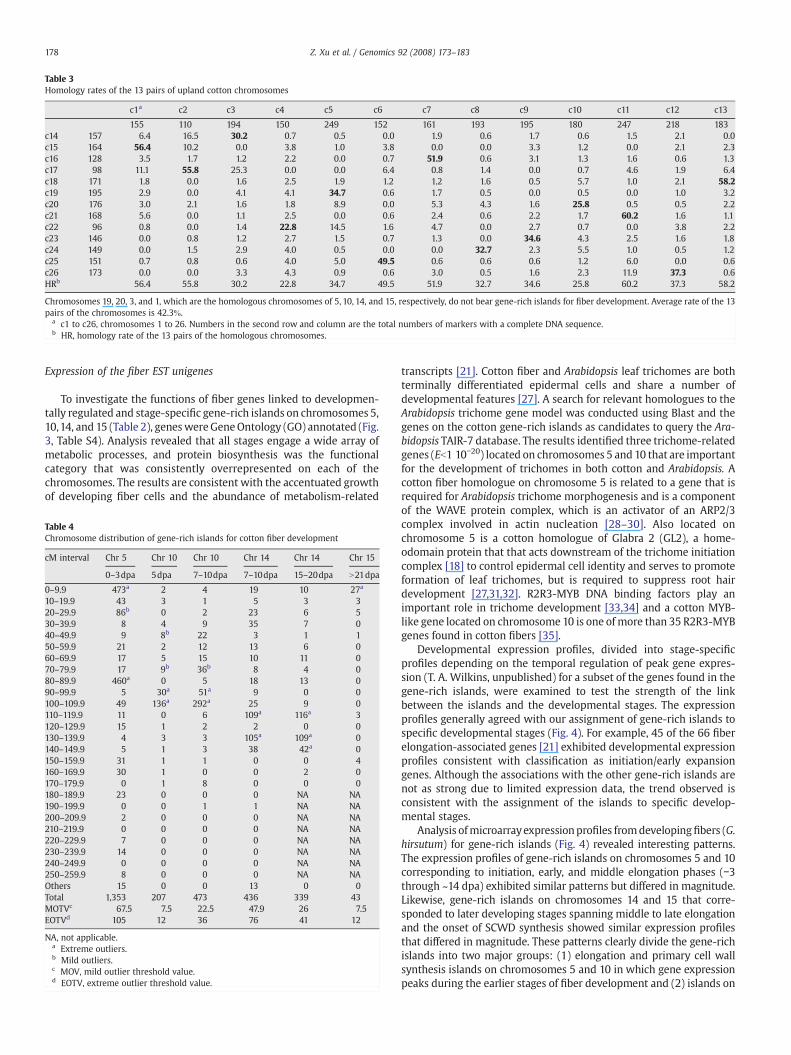
Table 3Homology rates of the 13 pairs of upland cotton chromosomes
c1a c2 c3 c4 c5 c6 c7 c8 c9 c10 c11 c12 c13
155 110 194 150 249 152 161 193 195 180 247 218 183c14 157 6.4 16.5 30.2 0.7 0.5 0.0 1.9 0.6 1.7 0.6 1.5 2.1 0.0c15 164 56.4 10.2 0.0 3.8 1.0 3.8 0.0 0.0 3.3 1.2 0.0 2.1 2.3c16 128 3.5 1.7 1.2 2.2 0.0 0.7 51.9 0.6 3.1 1.3 1.6 0.6 1.3c17 98 11.1 55.8 25.3 0.0 0.0 6.4 0.8 1.4 0.0 0.7 4.6 1.9 6.4c18 171 1.8 0.0 1.6 2.5 1.9 1.2 1.2 1.6 0.5 5.7 1.0 2.1 58.2c19 195 2.9 0.0 4.1 4.1 34.7 0.6 1.7 0.5 0.0 0.5 0.0 1.0 3.2c20 176 3.0 2.1 1.6 1.8 8.9 0.0 5.3 4.3 1.6 25.8 0.5 0.5 2.2c21 168 5.6 0.0 1.1 2.5 0.0 0.6 2.4 0.6 2.2 1.7 60.2 1.6 1.1c22 96 0.8 0.0 1.4 22.8 14.5 1.6 4.7 0.0 2.7 0.7 0.0 3.8 2.2c23 146 0.0 0.8 1.2 2.7 1.5 0.7 1.3 0.0 34.6 4.3 2.5 1.6 1.8c24 149 0.0 1.5 2.9 4.0 0.5 0.0 0.0 32.7 2.3 5.5 1.0 0.5 1.2c25 151 0.7 0.8 0.6 4.0 5.0 49.5 0.6 0.6 0.6 1.2 6.0 0.0 0.6c26 173 0.0 0.0 3.3 4.3 0.9 0.6 3.0 0.5 1.6 2.3 11.9 37.3 0.6HRb 56.4 55.8 30.2 22.8 34.7 49.5 51.9 32.7 34.6 25.8 60.2 37.3 58.2
Chromosomes 19, 20, 3, and 1, which are the homologous chromosomes of 5, 10, 14, and 15, respectively, do not bear gene-rich islands for fiber development. Average rate of the 13pairs of the chromosomes is 42.3k.
a c1 to c26, chromosomes 1 to 26. Numbers in the second row and column are the total numbers of markers with a complete DNA sequence.b HR, homology rate of the 13 pairs of the homologous chromosomes.
178 Z. Xu et al. / Genomics 92 (2008) 173–183
Expression of the fiber EST unigenes
To investigate the functions of fiber genes linked to developmen-tally regulated and stage-specific gene-rich islands on chromosomes 5,10,14, and 15 (Table 2), geneswereGeneOntology (GO) annotated (Fig.3, Table S4). Analysis revealed that all stages engage a wide array ofmetabolic processes, and protein biosynthesis was the functionalcategory that was consistently overrepresented on each of thechromosomes. The results are consistent with the accentuated growthof developing fiber cells and the abundance of metabolism-related
Table 4Chromosome distribution of gene-rich islands for cotton fiber development
cM interval Chr 5 Chr 10 Chr 10 Chr 14 Chr 14 Chr 15
0–3dpa 5dpa 7–10dpa 7–10dpa 15–20dpa N21dpa
0–9.9 473a 2 4 19 10 27a
10–19.9 43 3 1 5 3 320–29.9 86b 0 2 23 6 530–39.9 8 4 9 35 7 040–49.9 9 8b 22 3 1 150–59.9 21 2 12 13 6 060–69.9 17 5 15 10 11 070–79.9 17 9b 36b 8 4 080–89.9 460a 0 5 18 13 090–99.9 5 30a 51a 9 0 0100–109.9 49 136a 292a 25 9 0110–119.9 11 0 6 109a 116a 3120–129.9 15 1 2 2 0 0130–139.9 4 3 3 105a 109a 0140–149.9 5 1 3 38 42a 0150–159.9 31 1 1 0 0 4160–169.9 30 1 0 0 2 0170–179.9 0 1 8 0 0 0180–189.9 23 0 0 0 NA NA190–199.9 0 0 1 1 NA NA200–209.9 2 0 0 0 NA NA210–219.9 0 0 0 0 NA NA220–229.9 7 0 0 0 NA NA230–239.9 14 0 0 0 NA NA240–249.9 0 0 0 0 NA NA250–259.9 8 0 0 0 NA NAOthers 15 0 0 13 0 0Total 1,353 207 473 436 339 43MOTVc 67.5 7.5 22.5 47.9 26 7.5EOTVd 105 12 36 76 41 12
NA, not applicable.a Extreme outliers.b Mild outliers.c MOV, mild outlier threshold value.d EOTV, extreme outlier threshold value.
transcripts [21]. Cotton fiber and Arabidopsis leaf trichomes are bothterminally differentiated epidermal cells and share a number ofdevelopmental features [27]. A search for relevant homologues to theArabidopsis trichome gene model was conducted using Blast and thegenes on the cotton gene-rich islands as candidates to query the Ara-bidopsis TAIR-7 database. The results identified three trichome-relatedgenes (Eb1 10−20) located on chromosomes 5 and 10 that are importantfor the development of trichomes in both cotton and Arabidopsis. Acotton fiber homologue on chromosome 5 is related to a gene that isrequired for Arabidopsis trichome morphogenesis and is a componentof the WAVE protein complex, which is an activator of an ARP2/3complex involved in actin nucleation [28–30]. Also located onchromosome 5 is a cotton homologue of Glabra 2 (GL2), a home-odomain protein that that acts downstream of the trichome initiationcomplex [18] to control epidermal cell identity and serves to promoteformation of leaf trichomes, but is required to suppress root hairdevelopment [27,31,32]. R2R3-MYB DNA binding factors play animportant role in trichome development [33,34] and a cotton MYB-like gene located on chromosome 10 is one of more than 35 R2R3-MYBgenes found in cotton fibers [35].
Developmental expression profiles, divided into stage-specificprofiles depending on the temporal regulation of peak gene expres-sion (T. A. Wilkins, unpublished) for a subset of the genes found in thegene-rich islands, were examined to test the strength of the linkbetween the islands and the developmental stages. The expressionprofiles generally agreed with our assignment of gene-rich islands tospecific developmental stages (Fig. 4). For example, 45 of the 66 fiberelongation-associated genes [21] exhibited developmental expressionprofiles consistent with classification as initiation/early expansiongenes. Although the associations with the other gene-rich islands arenot as strong due to limited expression data, the trend observed isconsistent with the assignment of the islands to specific develop-mental stages.
Analysis ofmicroarrayexpressionprofiles fromdevelopingfibers (G.hirsutum) for gene-rich islands (Fig. 4) revealed interesting patterns.The expression profiles of gene-rich islands on chromosomes 5 and 10corresponding to initiation, early, and middle elongation phases (−3through ~14 dpa) exhibited similar patterns but differed in magnitude.Likewise, gene-rich islands on chromosomes 14 and 15 that corre-sponded to later developing stages spanning middle to late elongationand the onset of SCWD synthesis showed similar expression profilesthat differed in magnitude. These patterns clearly divide the gene-richislands into two major groups: (1) elongation and primary cell wallsynthesis islands on chromosomes 5 and 10 in which gene expressionpeaks during the earlier stages of fiber development and (2) islands on
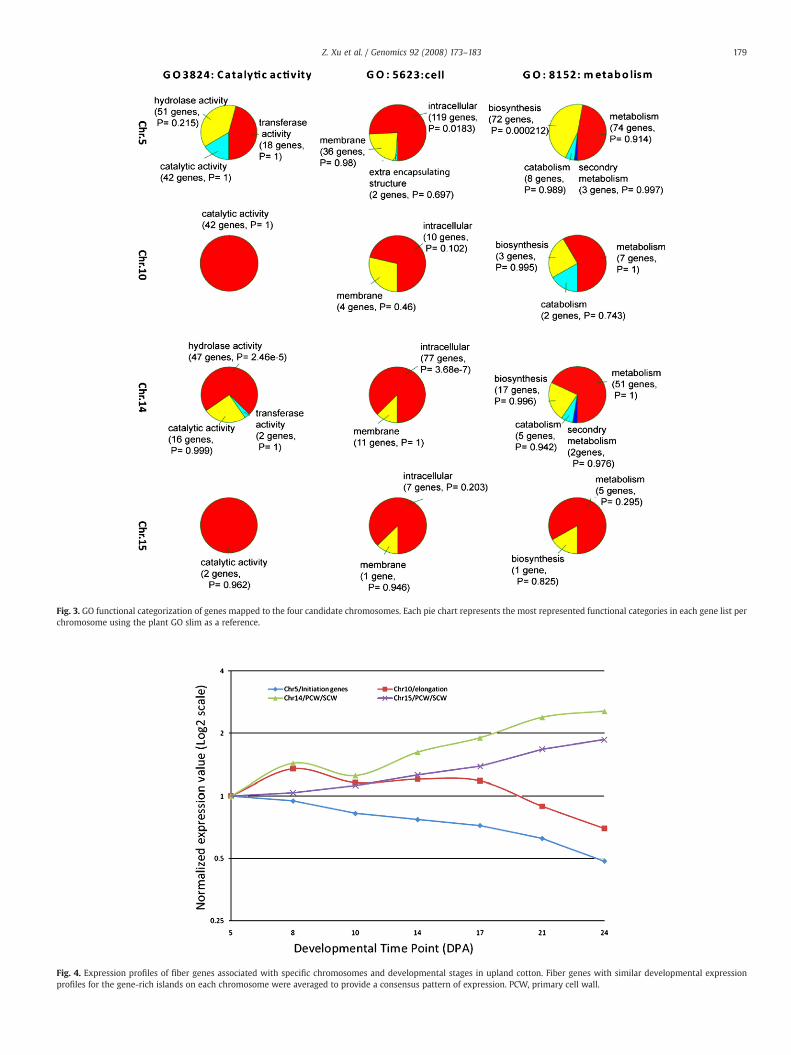
Fig. 3. GO functional categorization of genes mapped to the four candidate chromosomes. Each pie chart represents the most represented functional categories in each gene list perchromosome using the plant GO slim as a reference.
Fig. 4. Expression profiles of fiber genes associated with specific chromosomes and developmental stages in upland cotton. Fiber genes with similar developmental expressionprofiles for the gene-rich islands on each chromosome were averaged to provide a consensus pattern of expression. PCW, primary cell wall.
179Z. Xu et al. / Genomics 92 (2008) 173–183
180 Z. Xu et al. / Genomics 92 (2008) 173–183
chromosomes 14 and 15 that represent the developmental switch fromprimary to secondary cell wall biogenesis [1].
Cotton fiber morphogenesis is characterized by dynamic remodel-ing of the tubulin cytoskeleton at two stages in developing fibers: atthe onset of fiber morphogenesis and again during the transitionbetween primary cell wall biogenesis and elongation and the onset ofSCWD synthesis [3,36]. Temporal regulation of tubulin isotypes thatgovern the level and type of tubulins present are stage-specific [36–38]and this is reflected in the high concentration of various tubulin genesassociated with gene-rich islands on chromosomes 5, 10, and 14.Twenty tubulin genes found in gene-rich islands on chromosomes 5and 10 are differentially expressed during the early stages ofelongation and primary cell wall synthesis.
Microarray expression profiles [39] for fiber genes corresponding toESTs retrieved fromearly staged cDNA libraries and classified as initiation/early expansion genes linked to chromosome 5 revealed temporalexpression patterns consistent with these assignments and designations(Fig. 4). Expression of these known expansion-associated genes [21],including cyclin genes [40], lipid transfer protein 3 [41], and -expansin[21], show similar profiles, with expression higher in fiber before 5 dpaand expression declining steadily through later stages of expansion andelongation. The peak expression of different -expansin isoforms and otherexpansion-associated genes during rapid polar elongation is consistentwith assignment of these genes as elongation genes on chromosome 10.Expansins are particularly important wall-associated proteins thatfunction in the cell wall, loosening during turgor-driven cell expansionto allow for the addition of newly synthesized materials into theextracellular matrix [42,43]. Also linked to turgor-driven expansion isthedevelopmental regulationof anodulin-likeprotein that is amemberoftheaquaporin transmembranewater channel gene familyand functions inwater uptake by the vacuole to create and maintain cellular turgidityduring rapid expansion of developing fibers [37,44].
The gene-rich islands on chromosome 14 contain middle- to late-elongation transcripts involved in elongation and a subset of genes thatare associated with the transition phase between primary and SCWbiogenesis and early entry into SCW synthesis. Among the mostinteresting of these transcripts are annexin and peroxidase. A fiberannexin has been previously linked to the late elongation and earlySCWD stage of fiber development [45] and, based on functional analysisin other species,may play an important role inGolgi-mediated secretionof polysaccharides required for biogenesis of the thick, cellulosic SCWD.Induction of cellulose synthesis during fiber SCW biogenesis has beenimplicatedwith the production of H2O2 thatmay act as a developmentalsignal, triggering the transition from primary to secondary cell wallbiogenesis [46]. Indirect evidence indicates a requirement for H2O2 byperoxidase in formation of SCW macromolecules [47], suggesting animportant role for this cotton peroxidase.
Interestingly, the temporal expression of genes linked to chromo-some 15 no doubt identifies these genes as good candidates for a rolein SCWD biogenesis, but they are mostly annotated as proteins ofunknown function. One very interesting group of annotated SCWgenes on chromosome 15 is a cluster of genes belonging to theubiquitin pathway. There is a growing body of evidence that theubiquitin-dependent proteolytic pathway plays a crucial role inregulating the growth of plant cells [48,49] and, by extension, mayfunction in fiber SCW biogenesis.
Discussion
Development-specific cotton fiber genes locate to gene-rich islands onspecific chromosomes
Although fiber genes for all developmental stages are distributedacross the At and Dt subgenomes of tetraploid cotton, outlier analysisrevealed a significant association of a subset of fiber genes to Atchromosomes 5 and 10 and Dt chromosomes 14 and 15. The association
of thesefiber geneswas not only significant, it was further characterizedby two additional features. First, the genes assigned to individualchromosomes correlated with specific developmental stages, such thatearly and middle-elongation genes were assigned to chromosomes 5and 10, respectively; elongation subsetswere found on chromosome14;and SCWD genes were assigned to chromosome 15. The secondinteresting feature is that the fiber development-related genes werefound in gene-rich islands and there are genomic characteristics offunctional coupling gene clusters in tetraploid cotton. Following theanalysis of 31 completely and incompletely sequenced genomes, thephenomenon of functionally related genes coupling as gene clusters/islands was discovered [50]. Our data in this report show that (1) thereare gene islands/clusters in the cotton genome, (2) gene clusters containgenes functionally related by fiber development stages, and (3) genes ineach cluster have similar expression profiles. This is the first report todemonstrate functional coupling of gene clusters in the cotton genome.
Gene-rich islands are contrasted by gene-poor regions, which mayextend over several hundred kilobases and are primarily composed ofrepetitive DNA and frequently show reduced recombination or norecombination at all. In several instances, gene-rich islands have beenidentified that are characterized by a relatively high density of genessituatedwithin 5 to 10 kb [51]. Similarfindings have been obtained at alarger resolution provided by genetic and cytogenetic maps. About50k of the single- and low-copy markers from a genome-wide mapof barley could be assigned to only 5k of the physical genomecomplement, which indicated the presence of distinct gene space [52].Similar observations were reported from physical mapping studies inwheat using deletion lines [53–55]. However, not all genomes havebeen found to contain gene islands. There were no gene islands foundin the Arabidopsis genome [56], and its gene organization is drasticallydifferent from that of the genomes of Gramineae (rice, maize, andbarley). In general, the larger the genome size, the smaller the islandsare compared to longer gene-poor regions. The genome size oftetraploid upland cotton, estimated at around 2250 Mb [57], isbetween those of rice and maize. Based on the gene density at 10-cMintervals, 10 fiber-gene-rich islands were identified. Because of thesignificant difference between genetic and physical distance, thesedata did not provide sufficient resolution to pinpoint accurately thelocation of the gene-rich islands. However, BAC contigs from the cottonphysical map, bearing the fiber genes found in the gene-rich islandsand having a length of about 37 Mb, accounted for less than 2k of thecotton genome. These results did verify the existence of the gene-richislands. While a pilot project to sequence 500 Mb of a diploid wildspecies (G. raimondii) has been initiated by the JGI (http://www.jgi.doe.gov/sequencing/why/CSP2007/cotton.html), complete sequen-cing of the tetraploid upland cotton (G. hirsutum) remains a remoteprospect. With current resources, however, it may be feasible first tosequence the four chromosomes with the fiber gene-rich islands andthen to sequence the complete genome when additional resourcesbecome available. Gene-rich islands found in the upland cottongenome will open the door for the evolutionary understanding offiber development and genetic manipulation of fiber improvement.The information will facilitate research on fiber genomics that maycontribute to our understanding of the functional and agronomicsignificance of upland cotton. It will also shed light on the geneticmachinery of the development of single-celled trichomes in otherplants.
Sources of cotton EST unigenes and impact on the patterns of theirgenome distribution
Thirty-one cDNA libraries were constructed from 15 researchgroups worldwide, and cotton ESTs from 30 of the cDNA librarieswere collected and assembled using the Program for Assembling andViewing ESTs (PAVE) [24]. All the assembled EST unigenes weredownloaded from http://www.agcol.arizona.edu/pave/cotton/, while
181Z. Xu et al. / Genomics 92 (2008) 173–183
both the 172 fiber elongation ESTs and the marker sequences weredownloaded from NCBI (http://www.ncbi.nlm.nih.gov/). One librarywas not assembled by PAVE, but the functions of most of the ESTsfrom this library were confirmed by both macroarray and RT-PCRanalysis [22]. These libraries were constructed from a variety oftissues, and more than half of the libraries (16) were constructedfrom fibers at various developmental stages. The 31 librariesincluded tetraploid cotton as well as its two diploid progenitors.Most of the cDNA libraries (28) were derived from upland cotton,and they were relatively small, with the library size ranging from 207to 8643 ESTs. Collectively, these G. hirsutum EST collections comprised38k of the total used in the assembly. The remaining ESTs werederived from three more extensively sampled cDNA libraries generatedfrom two diploids (one library from 7–10 dpa of A-genome G. arbor-eum and two libraries of D-genome G. raimondii), which comprised 24and 38k of the total number of ESTs, respectively [24]. Five of the sixfiber-initiation EST libraries were constructed from G. hirsutum. Of the57,598 fiber-initiation ESTs in the six libraries, 61k were derived fromthe D genome (G. raimondii) although chromosome 5, which hadthe most mapped EST unigenes, was from the At genome. Of the54,138 fiber-elongation ESTs in nine elongation libraries, 58k werederived from the A-genome species G. arboreum. However, chromo-somes 10 (At) and 14 (Dt) contained most of the EST unigenes for fiberelongation. As for fiber SCWD, although the EST library came fromtetraploid cotton, chromosome 15 (from Dt subgenome) had the mostSCWD EST unigenes. ESTs were further sorted into three groups as A,D, and AtDt to compare the effects of different EST resources on thegene distribution results. There were no significant differencesobserved among the results from genomes A, D, and AtDt.
Comparison between Arabidopsis trichome genes and cottonfiber-development-related ETS unigenes
Although both Arabidopsis trichome and cotton fiber are ofunicellular and epidermal origin, theirmorphologyand growth patternsvary greatly. After initiation, cotton fiber cells must have uniqueexpression profiles for fast elongation, secondary cell wall deposition,and maturation [27]. This point was verified in our result when theArabidopsis trichome genes were used to Blast against cotton ESTunigenes anchored in the gene-rich islands. Two Arabidopsis trichomegenes were identified that have homologues in chromosome 5 that playimportant roles in cotton fiber/Arabidopsis trichome initiation. One ESTunigene is a homologue of the R2R3-MYB DNA binding factor that playsan important role in trichome development. The result shows that Ar-abidopsis trichome and cotton fiber share similar initiation and earlyelongation processes. And after that, Arabidopsis trichome developmentmay require very few genes to reach its full short life span, but cottonfibers need a lot of genes for full growth.
Unigenes in subgenomes At and Dt
At the subgenome level, the numbers of unigenes located in Atchromosomes from 1 to 13 and in Dt chromosomes from 14 to 26 aresummarized inTable 2. Randomdistributionwas indicated by the t testfor nonrandom distribution between subgenomes At and Dt. The t testwas performed both on all unigenes and on only fiber unigenes.Neither of the tests was significant, indicating that both fiber andnonfiber unigenes were evenly distributed in the At and Dtsubgenomes. These results differ from previous reports [9] statingthatmost QTLs influencing fiber quality and yieldwere located in the Dsubgenome. However, these results were consistent with EST-SSRmapping reports [11], which indicated that both the At and the Dtsubgenomes are equally important to fiber development. These resultsreinforce the contention that the A genome is important to fiberdevelopment, as economically important spinnable fiber first evolvedin the A genome lineage.
Materials and methods
Sources of cDNA libraries
Thirty-one cDNA libraries were developed by 15 research groups inthe cotton research community [22,24], 16 of which were from fibersat different stages; the rest of them were from cotton leaves.
Anchor EST unigenes to chromosomes via Blast analysis
Sequences from BAC-derived clones, genetically mapped DNAmarkers collected from published genetic maps, and 172 fiberelongation ESTs were downloaded from NCBI (http://www.ncbi.nlm.nih.gov/) andwere formatted into a database for Blastn analysis. A totalof 51,107 cotton unigenes [24] were downloaded from http://www.agcol.arizona.edu/pave/cotton/. The Blast program bBlastAllQ wasdownloaded from NCBI to perform the analysis with the criterion fora sequence match based on an E value of 1 × 10⁻¹⁵.
BAC libraries and high-density filters
The two BAC libraries used in this study were constructed from theupland cotton genetic standard TM-1: a BamHI partial digestion withthe vector pOCLD0451 BIBAC library and a HindIII partial digestionwith the vector pBeloBAC1 BAC library [58]. High-density BAC/BIBACfilters were prepared using a Biomek 2000 robotic workstationequipped with a high-density replicating system (HDR) (BeckmanCoulter, Fullerton, CA, USA). Each filter was inoculated with 1536 BACclones using a 4 × 4 matrix pattern with a 384-pin HDR tool. Filterswere inoculated and processed as described by Woo [59].
Anchor EST unigenes to chromosomes via overgo hybridization
EST sequences were used to design an overgo probe for eachsequence contig after it was masked to eliminate known repetitiveregions using RepeatMasker (http://www.repeatmasker.org/). Overgoprimerswere designed by the Overgo 1.02i program [60] (http://www.mouse-genome.bcm.tmc.edu/ webovergo/OvergoInput.asp/). The tar-get sequences of the overgo hybridization were fiber-development-related genes. Prehybridization and hybridization were conductedfollowingWoo's protocol [59]. Filterswerewashed twice in 2 SSC/0.5kSDS and twice in 0.1 SSC/0.5k SDS. All washes were for 20–30 mineach at 65 C. Filters were exposed to X-ray film for 1–3 days.
Outlier analysis
Outlier analysis, including both mild (1.5 interquartile range; IQR)and extreme outliers (3 IQR), was performed following the statisticsmethod [61].
Comparison between Arabidopsis trichome genes and cotton fiber-development-related unigenes
Arabidopsis trichome genes were retrieved from the TAIR database(http://www.arabidopsis.org/) and they were used to Blast (expectedvalue 1 × 10⁻²⁰) against the cotton EST unigenes anchored in the gene-rich islands.
Gene annotation
Gene annotation for fiber genes mapped to chromosomes 5, 10, 14,and 15 was performed by independent analysis using Blast (thresholdE value 1 × 10⁻¹⁵) and the following databases: Unigene db (http://www.ncbi.nlm.nih.gov/), Uniprot db (http://www.pir.uniprot.org/),and Tair7 (http://www.arabidopsis.org/portals/genAnnotation). Thefunctional description of the best hit for each gene was selected to
182 Z. Xu et al. / Genomics 92 (2008) 173–183
annotate the gene. Functional categories for the genes were assignedusing GO. A microarray database of developmental expression profilesfor upland cottonwas searched for profiles corresponding to the genesassigned to chromosomes 5, 10, 14, and 15.
Acknowledgments
We thankDr. Lori Hinze for reviewing themanuscript. This researchwas supported by USDA-ARS CRIS Project 6202-21000-025-00D.
Appendix A. Supplementary data
Supplementary data associated with this article can be found, inthe online version, at doi:10.1016/j.ygeno.2008.05.010.
References
[1] T.A. Wilkins, A.B. Arpat, The cotton fiber transcriptome, Physiol. Plant. 124 (2005)295–300.
[2] H.J. Kim, B.A. Triplett, Cotton fiber growth in planta and in vitro: models for plantcell elongation and cell wall biogenesis, Plant Physiol. 127 (2001) 1361–1366.
[3] T.A. Wilkins, J.A. Jernstedt, Molecular genetics of developing cotton fibers, in: A.M.Basra (Ed.), Cotton Fibers, Hawthorne Press, New York, 1999, pp. 231–267.
[4] S. Tiwari, T. Wilkins, Cotton (Gossypium hirsutum) seed trichomes expand viadiffuse growing mechanism, Can. J. Bot. 73 (1995) 746–757.
[5] M.E. John, G. Keller, Metabolic pathway engineering in cotton: biosynthesisof polyhydroxybutyrate in fiber cells, Proc. Natl. Acad. Sci. USA 93 (1996)12768–12773.
[6] L.B. Smart, F. Vojdani, M. Maeshima, T.A. Wilkins, Genes involved in osmoregula-tion during turgor-driven cell expansion of developing cotton fibers aredifferentially regulated, Plant Physiol. 116 (1998) 1539–1549.
[7] J.F. Wendel, New World tetraploid cottons contain Old World cytoplasm, Proc.Natl. Acad. Sci. USA 86 (1989) 4132–4136.
[8] J.F. Wendel, A. Schnabel, T. Seelanan, Bidirectional interlocus concerted evolutionfollowing allopolyploid speciation in cotton (Gossypium), Proc. Natl. Acad. Sci.USA 92 (1995) 280–284.
[9] A. Jiang, R.J. Wright, K.M. El-Zik, A.H. Paterson, Polyploid formation created uniqueavenues for response to selection in gossypium, Proc. Natl. Acad. Sci. USA 95(1998) 4419–4424.
[10] S. Samuel Yang, F. Cheung, J.J. Lee,M. Ha, N.E.Wei, S.H. Sze, D.M. Stelly, P. Thaxton, B.Triplett, C.D. Town, Z. Jeffrey Chen, Accumulation of genome-specific transcripts,transcription factors and phytohormonal regulators during early stages offiber celldevelopment in allotetraploid cotton, Plant J. 47 (2006) 761–775.
[11] Z. Han, C. Wang, X. Song, W. Guo, J. Gou, C. Li, X. Chen, T. Zhang, Characteristics,development and mapping of Gossypium hirsutum derived EST-SSRs inallotetraploid cotton, Theor. Appl. Genet. 112 (2006) 430–439.
[12] X.B. Li, X.P. Fan, X.L. Wang, L. Cai, W.C. Yang, The cotton ACTIN1 gene is functionallyexpressed in fibers and participates in fiber elongation, Plant Cell 17 (2005)859–875.
[13] H.J. Kim, B.A. Triplett, Cotton fiber germin-like protein. I. Molecular cloning andgene expression, Planta 218 (2004) 516–524.
[14] Y.L. Ruan, D.J. Llewellyn, R.T. Furbank, Suppression of sucrose synthase geneexpression represses cotton fiber cell initiation, elongation, and seed develop-ment, Plant Cell 15 (2003) 952–964.
[15] X.B. Li, L. Cai, N.H. Cheng, J.W. Liu, Molecular characterization of the cottonGhTUB1 gene that is preferentially expressed in fiber, Plant Physiol. 130 (2002)666–674.
[16] M.L. Cedroni, R.C. Cronn, K.L. Adams, T.A. Wilkins, J.F. Wendel, Evolution andexpression ofMYB genes in diploid and polyploid cotton, PlantMol. Biol. 51 (2003)313–325.
[17] S. Wang, J.W. Wang, N. Yu, C.H. Li, B. Luo, J.Y. Gou, L.J. Wang, X.Y. Chen, Control ofplant trichome development by a cotton fiber MYB gene, Plant Cell 16 (2004)2323–2334.
[18] L. Serna, C. Martin, Trichomes: different regulatory networks lead to convergentstructures, Trends Plant Sci. 11 (2006) 274–280.
[19] Y. Wu, A.C. Machado, R.G. White, D.J. Llewellyn, E.S. Dennis, Expression profilingidentifies genes expressed early during lint fibre initiation in cotton, Plant CellPhysiol. 47 (2006) 107–127.
[20] J.J. Lee, O.S. Hassan, W. Gao, N.E. Wei, R.J. Kohel, X.Y. Chen, P. Payton, S.H. Sze, D.M.Stelly, Z.J. Chen, Developmental and gene expression analyses of a cotton nakedseed mutant, Planta 223 (2006) 418–432.
[21] A.B. Arpat, M. Waugh, J.P. Sullivan, M. Gonzales, D. Frisch, D. Main, T. Wood, A.Leslie, R.A. Wing, T.A. Wilkins, Functional genomics of cell elongation indeveloping cotton fibers, Plant Mol. Biol. 54 (2004) 911–929.
[22] S.J. Ji, Y.C. Lu, J.X. Feng, G. Wei, J. Li, Y.H. Shi, Q. Fu, D. Liu, J.C. Luo, Y.X. Zhu, Isolationand analyses of genes preferentially expressed during early cotton fiberdevelopment by subtractive PCR and cDNA array, Nucleic Acids Res. 31 (2003)2534–2543.
[23] J. Rong, C. Abbey, J.E. Bowers, C.L. Brubaker, C. Chang, P.W. Chee, T.A. Delmonte,X. Ding, J.J. Garza, B.S. Marler, C.H. Park, G.J. Pierce, K.M. Rainey, V.K. Rastogi, S.R.
Schulze, N.L. Trolinder, J.F. Wendel, T.A. Wilkins, T.D. Williams-Coplin, R.A.Wing, R.J. Wright, X. Zhao, L. Zhu, A.H. Paterson, A 3347-locus geneticrecombination map of sequence-tagged sites reveals features of genomeorganization, transmission and evolution of cotton (Gossypium), Genetics 166(2004) 389–417.
[24] J.A. Udall, J.M. Swanson, K. Haller, R.A. Rapp, M.E. Sparks, J. Hatfield, Y. Yu, Y. Wu, C.Dowd, A.B. Arpat, B.A. Sickler, T.A. Wilkins, J.Y. Guo, X.Y. Chen, J. Scheffler, E.Taliercio, R. Turley, H. McFadden, P. Payton, N. Klueva, R. Allen, D. Zhang, C. Haigler,C. Wilkerson, J. Suo, S.R. Schulze, M.L. Pierce, M. Essenberg, H. Kim, D.J. Llewellyn,E.S. Dennis, D. Kudrna, R. Wing, A.H. Paterson, C. Soderlund, J.F. Wendel, A globalassembly of cotton ESTs, Genome Res. 16 (2006) 441–450.
[25] R.G. Percy, R.J. Kohel, Qualitative Genetics: Cotton, Wiley, New York, 1999,pp. 319–360.
[26] K. Wang, W. Guo, T. Zhang, Detection and mapping of homologous andhomoeologous segments in homoeologous groups of allotetraploid cotton byBAC-FISH, BMC Genomics 8 (2007) 178.
[27] Guan XueYing, Yu Nan, S. XiaoXia, Wang Shui, Lu Shan, Wang LingJian, C. XiaoYa,Arabidopsis trichome research sheds light on cotton fiber development mechan-isms, Chin. Sci. Bull. 52 (2007) 8.
[28] J. Le, E.L. Mallery, C. Zhang, S. Brankle, D.B. Szymanski, Arabidopsis BRICK1/HSPC300 is an essential WAVE-complex subunit that selectively stabilizes theArp2/3 activator SCAR2, Curr. Biol. 16 (2006) 895–901.
[29] S. Djakovic, J. Dyachok, M. Burke, M.J. Frank, L.G. Smith, BRICK1/HSPC300functions with SCAR and the ARP2/3 complex to regulate epidermal cell shapein Arabidopsis, Development 133 (2006) 1091–1100.
[30] J.F. Uhrig, M. Mutondo, I. Zimmermann, M.J. Deeks, L.M. Machesky, P. Thomas, S.Uhrig, C. Rambke, P.J. Hussey, M. Hulskamp, The role of Arabidopsis SCAR genesin ARP2–ARP3-dependent cell morphogenesis, Development 134 (2007)967–977.
[31] K. Morohashi, M. Zhao, M. Yang, B. Read, A. Lloyd, R. Lamb, E. Grotewold,Participation of the Arabidopsis bHLH factor GL3 in trichome initiation regulatoryevents, Plant Physiol. 145 (2007) 736–746.
[32] H. Motose, R. Tominaga, T. Wada, M. Sugiyama, Y. Watanabe, A NIMA-relatedprotein kinase suppresses ectopic outgrowth of epidermal cells through its kinaseactivity and the association with microtubules, Plant J. 54 (2008) 829–844.
[33] R. Stracke, M. Werber, B. Weisshaar, The R2R3-MYB gene family in Arabidopsisthaliana, Curr. Opin. Plant Biol. 4 (2001) 447–456.
[34] J.L. Riechmann, J. Heard, G. Martin, L. Reuber, C. Z, J. Keddie, L. Adam, O. Pineda, O.J.Ratcliffe, R.R. Samaha, Arabidopsis transcription factors: genome-wide compara-tive analysis among eukaryotes, Science 290 (2000) 2105–2110.
[35] L.L. Loguercio, J.Q. Zhang, T.A. Wilkins, Differential regulation of six novel MYB-domain genes defines two distinct expression patterns in allotetraploid cotton(Gossypium hirsutum L.), Mol. Gen. Genet. 261 (1999) 660–671.
[36] T.A. Wilkins, J.A. Jernstedt, Cotton fibers, in: A.M. Basra (Ed.), Cotton Fibers,Hawthorne Press, New York, 1999, pp. 231–267.
[37] L.B. Smart, F. Vojdani, M. Maeshima, T.A. Wilkins, Genes involved in osmoregula-tion during turgor-driven cell expansion of developing cotton fibers aredifferentially regulated, Plant Physiol. 116 (1998) 1539–1549.
[38] D.C. Dixon, R.W. Seagull, B.A. Triplett, Changes in the accumulation of α- and β–tubulin isotypes during cotton fiber development, Plant Physiol. 105 (1994)1347–1355.
[39] C. An, S. Saha, J.N. Jenkins, B.E. Scheffler, T.A. Wilkins, D.M. Stelly, Transcriptomeprofiling, sequence characterization, and SNP-based chromosomal assignment ofthe EXPANSIN genes in cotton, Mol. Genet. Genomics 278 (2007) 539–553.
[40] R.B. Turley, D.L. Ferguson, Changes of ovule proteins during early fiberdevelopment in a normal and a fiberless line of cotton (Gossypium hirsutumL.), J. Plant Physiol. 149 (1996) 695–702.
[41] D.P. Ma, H.C. Liu, H. Tan, R.G. Creech, J.N. Jenkins, Y.F. Chang, Cloning andcharacterization of a cotton lipid transfer protein gene specifically expressed infiber cells, Biochim. Biophys. Acta 1344 (1997) 111–114.
[42] S.J. McQueen-Mason, S.C. Fry, D.M. Durachko, D.J. Cosgrove, The relationshipbetween xyloglucan endotransglycosylase and in-vitro cell wall extension incucumber hypocotyls, Planta 190 (1993) 327–331.
[43] D.J. Cosgrove, L.C. Li, H.T. Cho, S. Hoffmann-Benning, R.C. Moore, D. Blecker, Thegrowing world of expansins, Plant Cell Physiol. 43 (2002) 1436–1444.
[44] T. Wilkins, Vacuolar H(+)-ATPase 69-kilodalton catalytic subunit cDNA fromdeveloping cotton (Gossypium hirsutum) ovules, Plant Physiol. 102 (1993)679–680.
[45] D.P. Delmer, M. Solomon, S.M. Read, Direct photolabeling with [32P]UDP-glucosefor identification of a subunit of cotton fiber callose synthase, Plant Physiol. 95(1991) 556–563.
[46] T.S. Potikha, C.C. Collins, D.I. Johnson, D.P. Delmer, A. Levine, The involvement ofhydrogen peroxide in the differentiation of secondary walls in cotton fibers, PlantPhysiol. 119 (1999) 849–858.
[47] M.A. Bernards, D.K. Summerhurst, F.A. Razem, Oxidases, peroxidases andhydrogen peroxide: the suberin connection, Phytochem. Rev. 3 (2004) 113–126.
[48] A. Hershko, A. Ciechanover, The ubiquitin system, Annu. Rev. Biochem. 67 (1998)425–479.
[49] Q. Xie, H.S. Guo, G. Dallman, S. Fang, A.M. Weissman, N.H. Chua, SINAT 5 promotesubiquitin-related degradation of NAC 1 to attenuate auxin signals, Nature 419(2002) 167–170.
[50] R. Overbeek, M. Fonstein, M. D'Souza, G.D. Pusch, N. Maltsev, The use of geneclusters to infer functional coupling, Proc. Natl. Acad. Sci. USA 96 (1999)2896–2901.
[51] B. Keller, C. Feuillet, Colinearity and gene density in grass genomes, Trends PlantSci. 5 (2000) 246–251.
183Z. Xu et al. / Genomics 92 (2008) 173–183
[52] G. Kunzel, L. Korzun, A. Meister, Cytologically integrated physical restrictionfragment length polymorphism maps for the barley genome based on transloca-tion breakpoints, Genetics 154 (2000) 397–412.
[53] K.S. Gill, B.S. Gill, T.R. Endo, T. Taylor, Identification and high-density mapping ofgene-rich regions in chromosome group 1 of wheat, Genetics 144 (1996)1883–1891.
[54] L.L. Qi, B. Echalier, S. Chao, G.R. Lazo, G.E. Butler, O.D. Anderson, E.D. Akhunov,J. Dvorak, A.M. Linkiewicz, A. Ratnasiri, J. Dubcovsky, C.E. Bermudez-Kandianis,R.A. Greene, R. Kantety, C.M. La Rota, J.D. Munkvold, S.F. Sorrells, M.E. Sorrells, M.Dilbirligi, D. Sidhu, M. Erayman, H.S. Randhawa, D. Sandhu, S.N. Bondareva, K.S.Gill, A.A. Mahmoud, X.F. Ma, Miftahudin, J.P. Gustafson, E.J. Conley, V. Nduati, J.L.Gonzalez-Hernandez, J.A. Anderson, J.H. Peng, N.L. Lapitan, K.G. Hossain, V.Kalavacharla, S.F. Kianian, M.S. Pathan, D.S. Zhang, H.T. Nguyen, D.W. Choi, R.D.Fenton, T.J. Close, P.E. McGuire, C.O. Qualset, B.S. Gill, A chromosome bin map of16,000 expressed sequence tag loci and distribution of genes among the threegenomes of polyploid wheat, Genetics 168 (2004) 701–712.
[55] M. Erayman, D. Sandhu, D. Sidhu, M. Dilbirligi, P.S. Baenziger, K.S. Gill,Demarcating the gene-rich regions of the wheat genome, Nucleic Acids Res. 32(2004) 3546–3565.
[56] A. Barakat, G. Matassi, G. Bernardi, Distribution of genes in the genome ofArabidopsis thaliana and its implications for the genome organization of plants,Proc. Natl. Acad. Sci. USA 95 (1998) 10044–10049.
[57] K. Arumuganathan, E.D. Earle, Nuclear DNA content of some important plantspecies, Plant Mol. Biol. Rep. 9 (1991) 208–218.
[58] Z. Xu, R.J. Kohel, G. Song, J. Cho, J. Yu, S. Yu, J. Tomkins, J.Z. Yu, An integratedgenetic and physical map of homoeologous chromosomes 12 and 26 in uplandcotton (G. hirsutum L.), BMC Genomics 9 (2008) 108.
[59] S.S. Woo, J. Jiang, B.S. Gill, A.H. Paterson, R.A. Wing, Construction andcharacterization of a bacterial artificial chromosome library of Sorghum bicolor,Nucleic Acids Res. 22 (1994) 4922–4931.
[60] W.W. Cai, J. Reneker, C.W. Chow, M. Vaishnav, A. Bradley, An anchored frameworkBAC map of mouse chromosome 11 assembled using multiplex oligonucleotidehybridization, Genomics 54 (1998) 387–397.
[61] D.S. Moore, G.P. McCabe, Introduction to the Practice of Statistics, Freeman, NewYork, 2002.
[62] A.J. Reinisch, et al., A detailed RFLPmap of cotton,Gossypium hirsutum Gossypiumbarbadense: chromosome organization and evolution in a disomic polyploidgenome, Genetics 138 (1994) 829–847.
[63] Z.W. Shappley, J.N. Jenkins, W.R. Meredith, J.C.M., An RFLP linkage map of uplandcotton, Gossypium hirsutum L, Theor. Appl. Genet. 97 (1998) 756–761.
[64] M. Ulloa, W.R.M., Genetic linkage map and QTL analysis of agronomic and fiberquality traits in an intraspecific population, J. Cotton Sci. 4 (2000) 161–170.
[65] R.J. Kohel, J. Yu, Y.-H. Park, G.R. Lazo, Molecular mapping and characterization oftraits controlling fiber quality in cotton, Euphytica 121 (2001) 163–172.
[66] J. Zhang, W. Guo, T. Zhang, Molecular linkage map of allotetraploid cotton(Gossypium hirsutum L. Gossypium barbadense L.) with a haploid population,Theor. Appl. Genet. 105 (2002) 1166–1174.
[67] M.Q. Wu, X.L. Zhang, Y.C. Nie, D.H. He, Localization of QTLs for yield and fiberquality traits of tetraploid cotton cultivar, Yi Chuan Xue Bao 30 (2003) 443–452.
[68] J.M. Lacape, et al., A combined RFLP-SSR-AFLP map of tetraploid cotton based on aGossypium hirsutum Gossypium barbadense backcross population, Genome 46(2003) 612–626.
[69] M. Mei, et al., Genetic mapping and QTL analysis of fiber-related traits in cotton(Gossypium), Theor. Appl. Genet. 108 (2004) 280–291.
[70] Z.G. Han, W.Z. Guo, X.L. Song, T.Z. Zhang, Genetic mapping of EST-derivedmicrosatellites from the diploid Gossypium arboreum in allotetraploid cotton,Mol. Genet. Genomics 272 (2004) 308–327.
[71] T.B. Nguyen, M. Giband, P. Brottier, A.M. Risterucci, J.M. Lacape, Wide coverage ofthe tetraploid cotton genome using newly developed microsatellite markers,Theor. Appl. Genet. 109 (2004) 167–175.
[72] P.W. Chee, J. Rong, D.Williams-Coplin, S.R. Schulze, A.H. Paterson, EST derived PCR-based markers for functional gene homologues in cotton, Genome 47 (2004)449–462.
[73] M. Ulloa, et al., Chromosomal assignment of RFLP linkage groups harboringimportant QTLs on an intraspecific cotton (Gossypium hirsutum L.) joinmap,J. Hered. 96 (2005) 132–144.
[74] Y.H. Park, et al., Genetic mapping of new cotton fiber loci using EST-derivedmicrosatellites in an interspecific recombinant inbred line cotton population, Mol.Genet. Genomics 274 (2005) 428–441.
[75] Z. Lin, et al., Linkage map construction and mapping QTL for cotton fiber qualityusing SRAP, SSR and RAPD, Plant Breed. 124 (2005) 180–187.
[76] X. Song, K.Wang,W.Guo, J. Zhang, T. Zhang, A comparison of geneticmaps constructedfrom haploid and BC1 mapping populations from the same crossing betweenGossypium hirsutum L. and Gossypium barbadense L, Genome 48 (2005) 378–390.
[77] J.E. Frelichowski Jr., et al., Cotton genome mapping with new microsatellites fromAcala 'Maxxa' BAC-ends, Mol. Genet. Genomics 275 (2006) 479–491.