The roles of ADAMTS metalloproteinases in tumorigenesis and metastasis
Upload
independentCategory
view
2download
0
ORIGINAL ARTICLE
Gene expression profiling of giant cell tumor of bone revealsdownregulation of extracellular matrix components decorinand lumican associated with lung metastasis
M. Lieveld & E. Bodson & G. De Boeck & B. Nouman & A. M. Cleton-Jansen &
E. Korsching & M. S. Benassi & P. Picci & G. Sys & B. Poffyn & N. A. Athanasou &
P. C. W. Hogendoorn & R. G. Forsyth
Received: 1 May 2014 /Revised: 21 August 2014 /Accepted: 3 October 2014# Springer-Verlag Berlin Heidelberg 2014
Abstract Giant cell tumor of bone (GCTB) displays worri-some clinical features such as local recurrence and occasion-ally metastatic disease which are unpredictable by morpholo-gy. Additional routinely usable biomarkers do not exist. Geneexpression profiles of six clinically defined groups of GCTBand one group of aneurysmal bone cyst (ABC) were deter-mined by microarray (n=33). The most promising differen-tially expressed genes were validated by Q-PCR as potentialbiomarkers in a larger patient group (n=41). Correspondingprotein expression was confirmed by immunohistochemistry.Unsupervised hierarchical clustering reveals a metastatic
GCTB cluster, a heterogeneous, non-metastatic GCTB cluster,and a primary ABC cluster. Balanced score testing indicatesthat lumican (LUM) and decorin (DCN) are the most promis-ing biomarkers as they have lower level of expression in themetastatic group. Expression of dermatopontin (DPT) wassignificantly lower in recurrent tumors. Validation of the re-sults was performed by paired and unpaired t test in primaryGCTB and corresponding metastases, which proved that thedifferential expression of LUM and DCN is tumor specificrather than location specific. Our findings show that severalgenes related to extracellular matrix integrity (LUM, DCN,
M. Lieveld (*) : E. Bodson :G. De Boeck :B. Nouman :R. G. ForsythN. Goormaghtigh Institute of Pathology, Ghent, Belgiume-mail: [email protected]
E. Bodsone-mail: [email protected]
G. De Boecke-mail: [email protected]
B. Noumane-mail: [email protected]
R. G. Forsythe-mail: [email protected]
A. M. Cleton-Jansen : P. C. W. HogendoornDepartment of Pathology, Leiden UniversityMedical Center, Leiden,The Netherlands
A. M. Cleton-Jansene-mail: [email protected]
P. C. W. Hogendoorne-mail: [email protected]
E. KorschingInstitute of Bioinformatics, University of Muenster, Muenster,Germanye-mail: [email protected]
M. S. Benassi : P. PicciLaboratorio di Ricerca Oncologica, Istituto Ortopedico Rizzoli,Bologna, Italy
M. S. Benassie-mail: [email protected]
P. Piccie-mail: [email protected]
G. Sys : B. PoffynDepartment of Orthopaedic Surgery, Ghent University Hospital,Ghent, Belgium
G. Syse-mail: [email protected]
B. Poffyne-mail: [email protected]
N. A. AthanasouDepartment of Pathology, Nuffield Department of OrthopaedicSurgery, Nuffield Orthopaedic Centre, Oxford, UK
e-mail: [email protected]
M. LieveldICRH, Ghent University, De Pintelaan 185 UZP114, 9000 Ghent,Belgium
Virchows ArchDOI 10.1007/s00428-014-1666-7
and DPT) are differentially expressed and may serve as bio-markers for metastatic and recurrent GCTB.
Keywords Giant cell tumor of bone . Decorin .
Osteoclastogenesis . Gene expression profiling . Extracellularmatrix
AbbreviationsGCTB Giant cell tumor of boneABC Primary aneurysmatic bone cystECM Extracellular matrixcRNA Copy ribonucleic acidDCN DecorinLUM Lumican, DPT, dermatopontinEPYC EpiphycanZNF14 Zinc finger protein-14CLEC2D C-type lectin domain family 2-member DRPL23 Ribosomal protein L23FRZB Frizzled-related proteinC2orf40 Chromosome 2 open reading frame 40FGFBP2 Fibroblast growth factor binding protein 2CPXM2 Carboxypeptidase X-M14 family-member 2PEG3 Paternally expressed 3TGF-β Transforming growth factor betaNRQ Normalized relative quantityDAB DiaminobenzidineM-CSF Macrophage colony-stimulating factorRANKL Receptor activator of nuclear factor kappa-B
ligandVEGF Vascular endothelial growth factorHGF Hepatocyte growth factor/scatter factorHIF-1α Hypoxia-inducible factor 1-alphaTKR Tyrosine kinase receptorTNF-α Tumor necrosis factor αIL-6 Interleukin-6LIGHT Tumor necrosis factor superfamily, member 14PIGF Placental growth factorFLT-3 Fms-like tyrosine kinase 3HGF Hepatocyte growth factorMET HGF receptorMMP-9 Matrix metalloprotein 9
Introduction
Giant cell tumor of bone (GCTB) is an osteolytic bone tumorwhich occurs most commonly in patients who have reachedskeletal maturity. It usually arises in the epiphysis of longbones and consists of a population of mostly inconspicuousspindle-shaped fibroblast-like stromal cells and more conspic-uous populations of monocytoid cells and osteoclast-like giantcells. The spindle cell component seems to be responsible for
the attraction of blood monocytes, immigration, and differen-tiation of osteoclasts and osteoclast activity [1]. In cell cul-tures, osteoclasts are lost after a few generations [2].
GCTB shows variable behavior in terms of tumor growthand metastatic potential. In most cases, it behaves as a benign,gradually enlarging osteolytic bone tumor but in some cases itshows rapid growth and local aggressiveness: Rarely, meta-static lung nodules of GCTB can develop and malignantchange in GCTB can also occur. Osteolytic and locally ag-gressive characteristics of GCTB can be explained by itscathepsin biology and high degree of RANKL expressionwhich is associated with increased osteoclast formation andactivity [3–5]. Intravascular plugs of GCTB can be found atthe periphery of the tumor, but a clear mechanism for meta-static disease has not yet been elucidated [6, 7].
The treatment of GCTB largely depends on its extension.Most cases are treated by curettage but local recurrence iscommon and extensive ‘en bloc’ resection may be the onlycurable option [8–10]. Anticipating clinical behavior ofGCTB is important in planning appropriate therapy andavoiding repetitive surgical interventions [10–12].
To date, no histological, clinical or radiographic character-istics have clearly been shown to predict the behavior ofGCTB in terms of outcome [6, 13–15]. In contrast, geneexpression profiling has been proven to be of value in identi-fying specific genes that predict tumor behavior. The aim ofthis study was to obtain greater insight into the biologicalbehavior of GCTB through identification of gene expressionprofiles that might act as biomarkers, capable of distinguishingsubgroups of GCTBwith distinctly different clinical behaviors.In addition, we set out to determine whether the biomarkers weidentified are site specific (expressed preferentially in lungmetastasis but not in the primary tumor) or tumor specific(expressed in metastases as well as their primary tumors butnot in non-metastasizing tumors).
Materials and methods
Patient and tissue sample selection
Cases were selected from the archives of the departments ofPathology of Leiden University Medical Center (TheNetherlands) (n=23), the N. Goormaghtigh Institute ofPathology of the Ghent University Hospital (Belgium) (n=6), and the Rizolli Institute Bologna (Italy) (n=4). A total of24 patients with GCTB, five patients with primary ABC andfour patients with GCTB lung metastases were included formicroarray analysis. The heterogenous group of 24 GCTBswas subdivided into five subgroups: conventional GCTB(control group; GCTB-0), GCTB with regressive changes(fibrosis, hemorrhages, and foam cell aggregates; GCTB-R),a high recurrence group (at least third recurrence of GCTB at
Virchows Arch
the same location; GCTB-3R), GCTB located in the distalradius (GCTB-A), and GCTB with secondary ABC (GCTB-ABC). None of these patients were treated with denosumabbefore sampling. The ABC group was used as a secondcontrol group, representing a benign giant cell-rich bone tu-mor distinct from GCTB. There were no solid variants includ-ed in the ABC group. A snap frozen section of the whole tumorsample was made, hematoxylin and eosin stained and exam-ined independently by two pathologists (PCW and RGF) inorder to confirm subsequent diagnoses and to exclude exces-sive contamination by bone or other non-tumoral tissue.Finally, 20 sections (20 μm) of each sample were cut andstored at −80 °C until use for gene expression analysis. Forquantitative polymerase chain reaction (Q-PCR), an additionaleight patients (N. Goormaghtigh Institute of Pathology of theGhent University Hospital (Belgium)) were included: three inthe control group, two in the high recurrence group, two casesof GCTB with secondary ABC, and one patient with GCTBlocated in the distal radius. Biomarkers for lung metastaseswere evaluated in an independent set of 11 samples (the RizolliInstitute Bologna (Italy)): six cases of GCTB-M and theircorresponding primary tumor (GCTB-P); for one lung metas-tasis no primary bone tumor was available.
Microarray analysis
Illumina’s Human-6 v2 Expression BeadChips (Illumina®,Son, The Netherlands) were used. This genome-wide expres-sion platform simultaneously profiles six sample and morethan 48,000 transcript probes per sample, on a single micro-array and 30 to 40 replicates of each bead are used, generatingvery reliable data. The expression beads contain full-length50-mer probes of well characterized genes, gene candidates,and splice variants. These gene-specific probes carry 100,000copies of the probe attached to the bead surface, binding thebiotin labeled copy RNA (cRNA) in the sample. The biotinlabeled cRNA is generated from total RNA, isolated fromeach of the tumor samples. After hybridization to theIllumina’s Human-6 Expression BeadChip Arrays, the gener-ated data were analyzed applying the Illumina’s BeadStudioSoftware.
RNA extraction, cRNA synthesis, and hybridizationof microarray targets
Total RNA was isolated from GCTB tissue, sectioned into20 μm sections using a cryostat, with Trizol® (Invitrogen LifeTechnologies, Carlsbad, CA) and purified using the RNeasy-mini kit (Qiagen, Hilden, Germany), according to the usermanuals. The quantity of RNA was measured with theNanoDrop ND-100 Spectrophotometer (Nanodrop®Technologies Inc., Wilmington, DE), and the quality wasverified on the Agilent 2100 Bioanalyzer (Agilent
Technologies, Palo Alto, CA). Of the quality-checked RNA,200 ng was transposed in biotin labeled amplified cRNA,using the Illumina® TotalPrep RNA Amplification Kit(Ambrion, Inc., Austin, TX). In this way, multiple copies ofbiotin labeled cRNAwere synthesized and, after purification,hybridized to the Illumina’s human −6 V2 Human-6 v2Expression BeadChip Arrays. The arrays were washed,blocked, and stained with streptavidin-Cy3 solution. The fluo-rescent assay signal, generated on each array, was capturedand quantified using the Illumina BeadArray Reader. Outputfiles were exported to the Illumina’s Beadstudio Software foranalysis. Bead signals were computed with weighted averagesof pixel intensities and local background was subtracted.
Statistical analysis
An unsupervised hierarchical cluster analysis, ClustalW, usingcorrelation-based average linkage clustering was applied toassess the relative similarities or dissimilarities in the globalgene expression patterns. The gene expression profiles of thedifferent groups were compared to each other using the bal-anced test method, which can identify the most significant andbiologically relevant markers and rank these according to theirbiological relevance [16]. As a different approach, this meth-odology first test the null hypothesis followed by a second testwith an alternative hypothesis of interest (in our case, twofoldchange inmessenger RNA [mRNA] level). The results of bothtests are depicted in a global R value, being the ration ofp values of the alternative over the null hypothesis. In thismethod, the null hypothesis is rejected, if R>1. The geneswith the highest R values in each group are considered mostrelevant.
Validation by quantitative polymerase chain reaction
RNA extraction
As a complement to the samples used for microarray, eightadditional samples (three for GCTB-0, two for GCTB-3R, onefor GCTB-A, and two GCTB-ABC) were included for Q-PCR (Table 1). Potential biomarkers for GCTB with lungmetastases were evaluated in a supplementary group of 11cases (Table 1). For each sample, 25 mg of tissue wasdisrupted and the lysate was homogenized with a rotar-statorhomogenizer. Total RNAwas extracted with the RNeasy MiniKit (Qiagen, Venlo, The Netherlands) following the manufac-turer’s instructions. This was followed by a DNase treatmentusing RQ1 RNase-Free DNase (Promega, Leiden, TheNetherlands), ensuring that only RNA is present in the sample.After the DNase treatment, first-strand cDNAwas synthesizedusing the iScript cDNA synthesis kit (Biorad LaboratoriesLtd. Hertfordshire, UK) according to the manufacturer’sdirections. The cDNA concentrations in the samples were
Virchows Arch
measured by the NanoDrop ND-100 Spectrophotometer(Nanodrop Technologies Inc., Wilmington, DE). Before ap-plying Q-PCR, cDNA was diluted up to a concentration of20 ng/μl.
Selection of reference genes
The most stable and optimal housekeeping genes for the 41samples were identified, with the geNorm HousekeepingGene Selection Kit (Primerdesign, Southampton, Hants), ac-cording to its instructions.
Primer design
Specific expression primers were designed using Primer-Blast, Oligo 7, and mFold. The selected primers were synthe-sized by Integraded DNA Technologies (Leuven, Belgium).Primer sequences are available on request.
Q-PCR
Q-PCR was performed using the LightCycler® 480(Roche Diagnostics, Vilvoorde, Belgium). All tests were runin duplicate and two non-template controls were included. Thereaction volume in each well contained 9.6 μl Sybr Green mix(Roche Diagnostics), 0.7 μl forward primer (5 μM), 0.7 μlreverse primer (5 μM), 4 μl H2O (Roche Diagnostics), and2 μl cDNA (20 ng/μl). The amplification procedure wasperformed under the following conditions: preincubation at
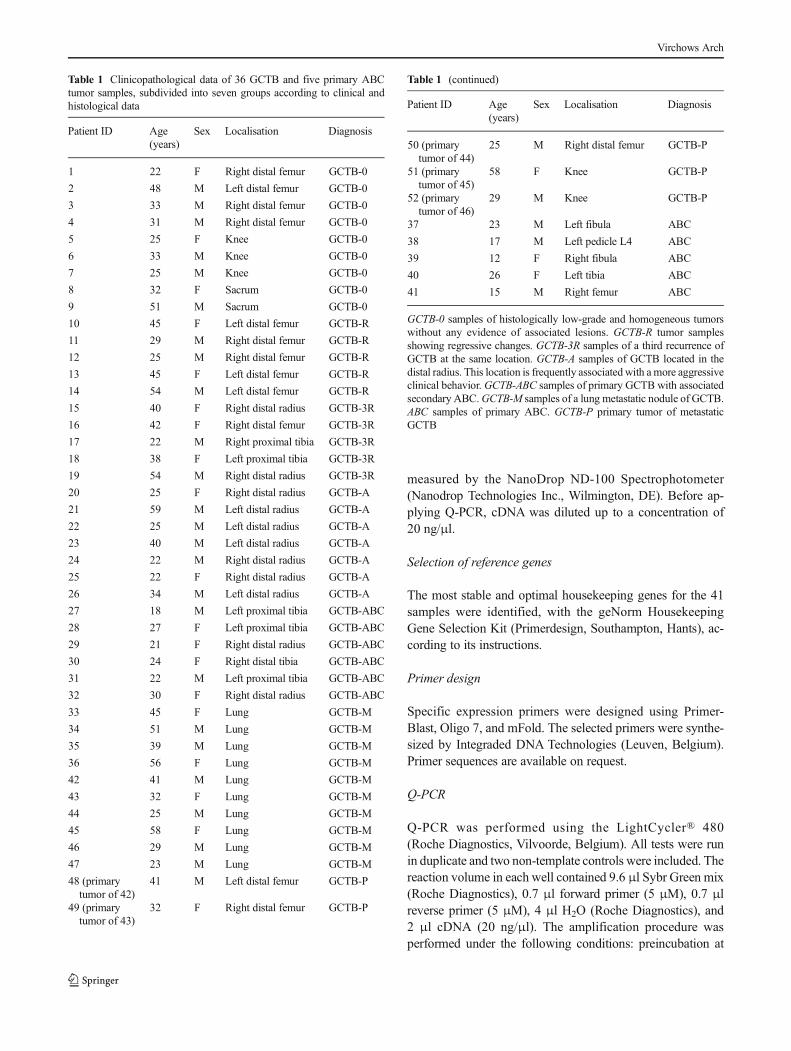
Table 1 Clinicopathological data of 36 GCTB and five primary ABCtumor samples, subdivided into seven groups according to clinical andhistological data
Patient ID Age(years)
Sex Localisation Diagnosis
1 22 F Right distal femur GCTB-0
2 48 M Left distal femur GCTB-0
3 33 M Right distal femur GCTB-0
4 31 M Right distal femur GCTB-0
5 25 F Knee GCTB-0
6 33 M Knee GCTB-0
7 25 M Knee GCTB-0
8 32 F Sacrum GCTB-0
9 51 M Sacrum GCTB-0
10 45 F Left distal femur GCTB-R
11 29 M Right distal femur GCTB-R
12 25 M Right distal femur GCTB-R
13 45 F Left distal femur GCTB-R
14 54 M Left distal femur GCTB-R
15 40 F Right distal radius GCTB-3R
16 42 F Right distal femur GCTB-3R
17 22 M Right proximal tibia GCTB-3R
18 38 F Left proximal tibia GCTB-3R
19 54 M Right distal radius GCTB-3R
20 25 F Right distal radius GCTB-A
21 59 M Left distal radius GCTB-A
22 25 M Left distal radius GCTB-A
23 40 M Left distal radius GCTB-A
24 22 M Right distal radius GCTB-A
25 22 F Right distal radius GCTB-A
26 34 M Left distal radius GCTB-A
27 18 M Left proximal tibia GCTB-ABC
28 27 F Left proximal tibia GCTB-ABC
29 21 F Right distal radius GCTB-ABC
30 24 F Right distal tibia GCTB-ABC
31 22 M Left proximal tibia GCTB-ABC
32 30 F Right distal radius GCTB-ABC
33 45 F Lung GCTB-M
34 51 M Lung GCTB-M
35 39 M Lung GCTB-M
36 56 F Lung GCTB-M
42 41 M Lung GCTB-M
43 32 F Lung GCTB-M
44 25 M Lung GCTB-M
45 58 F Lung GCTB-M
46 29 M Lung GCTB-M
47 23 M Lung GCTB-M
48 (primarytumor of 42)
41 M Left distal femur GCTB-P
49 (primarytumor of 43)
32 F Right distal femur GCTB-P
Table 1 (continued)
Patient ID Age(years)
Sex Localisation Diagnosis
50 (primarytumor of 44)
25 M Right distal femur GCTB-P
51 (primarytumor of 45)
58 F Knee GCTB-P
52 (primarytumor of 46)
29 M Knee GCTB-P
37 23 M Left fibula ABC
38 17 M Left pedicle L4 ABC
39 12 F Right fibula ABC
40 26 F Left tibia ABC
41 15 M Right femur ABC
GCTB-0 samples of histologically low-grade and homogeneous tumorswithout any evidence of associated lesions. GCTB-R tumor samplesshowing regressive changes. GCTB-3R samples of a third recurrence ofGCTB at the same location. GCTB-A samples of GCTB located in thedistal radius. This location is frequently associated with amore aggressiveclinical behavior. GCTB-ABC samples of primary GCTB with associatedsecondary ABC.GCTB-M samples of a lung metastatic nodule of GCTB.ABC samples of primary ABC. GCTB-P primary tumor of metastaticGCTB
Virchows Arch
95 °C for 10 min, 50 cycles of template denaturation at 95 °Cfor 10 s, together with 14 s of primer annealing at gene-specific temperature, and elongation at 72 °C for 12 s. Toverify the specificity of the Q-PCR, a melting curve wasgenerated at the end of each reaction, by elevating the tem-perature from 65 to 95 °C.
Analysis of the Q-PCR results
The raw Q-PCR data were processed and analyzed usingqBaseplus (Biogazelle) identifying first the reference genesfollowed by obtaining normalized relative quantity (NRQ)for every test. For each NRQ, a standard deviation wascalculated.
Statistical analysis was accomplished with the help ofSPSS 17.0 software. To identify a correlation between mostpromising expressed genes and the defined subgroups, t test-ing was applied.
Immunohistochemistry
Immunohistochemistry was performed using independentsubsets of formalin-fixed paraffin-embedded (FFPE) tumorsamples. This set of samples consisted of ten cases ofGCTB associated with regressive changes, five cases ofprimary and recurrent GCTB, three lung metastatic nod-ules, and five cases of GCTB associated with secondaryABC. From each sample, a 4 μm paraffin-embedded slidewas cut, mounted on an electrically charged superfrost plusslide (Menzel-Gläser, Braunschweig), rehydrated, and sub-mitted to antigen retrieval in EDTA (pH 8.0) or citrate (pH6.0). After quenching, the sections were stained with anti-bodies (Abcam, UK) against proteins of interest in a dilu-tion of 1:100 for 1 h at room temperature. Afterwards, thesections were incubated with biotinylated secondary anti-body and subsequently with the streptavidin-HRP (DAKO,Heverlee, Belgium), both for 30 min at room temperature.Finally, the sections were incubated in peroxidase DAB(Diaminobenzidine) (DAKO) solution and counterstainedwith hematoxylin.
Results
Unsupervised hierarchical clustering
ClustalW revealed three major clusters: a metastatic cluster, aprimary ABC cluster, and a large heterogeneous GCTB clus-ter. In the primary ABC cluster, a subcluster containing part ofthe GCTB control cases was present.
Microarray data
An overview of the biologically most relevant markers, iden-tified with the balanced test method is displayed in Table 2. Acomparison of metastatic with non-metastatic cases in thisstudy identified 11 genes which showed significantly lowerexpression in the metastatic group. Of these 11 genes, decorin(DCN) and lumican (LUM) appeared to be the most differen-tially expressed genes; LUM showed 30 times less expression(p value=3E-10), and DCN was 26 (p value=4E-8) times lessexpressed (Fig. 1).
Regarding GCTB recurrence, four genes showed a signif-icant differential expression in the high recurrence group. Thiswas most prominent for dermatopontin (DPT) and zinc fingerprotein-14 (ZNF14); DPTexhibited lower expression whereasZNF14 showed higher expression in the high recurrencegroup.
The search for potential biomarkers that might reflect re-gressive changes in GCTB identified epiphycan (EPYC),which was found to have a higher expression in this group.C-type lectin domain family 2-member D (CLEC2D) andribosomal protein L23 (RPL23) showed significantly lowerexpression in GCTBs exhibiting regressive changes. InGCTBs with secondary ABC, a significant increase in geneexpression of frizzled-related protein (FRZB), chromosome 2open reading frame 40 (C2orf40), fibroblast growth factorbinding protein 2 (FGFBP2), and carboxypeptidase X-M14family-member 2 (CPXM2) were observed.
Gene selection and validation by Q-PCR
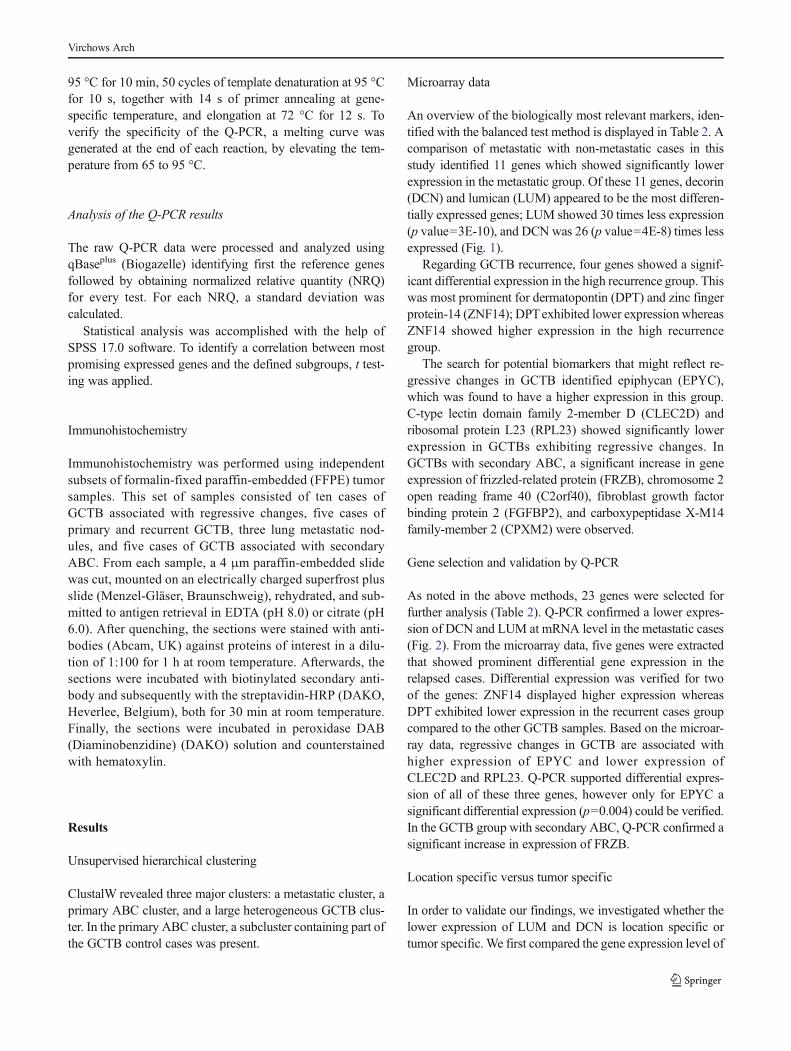
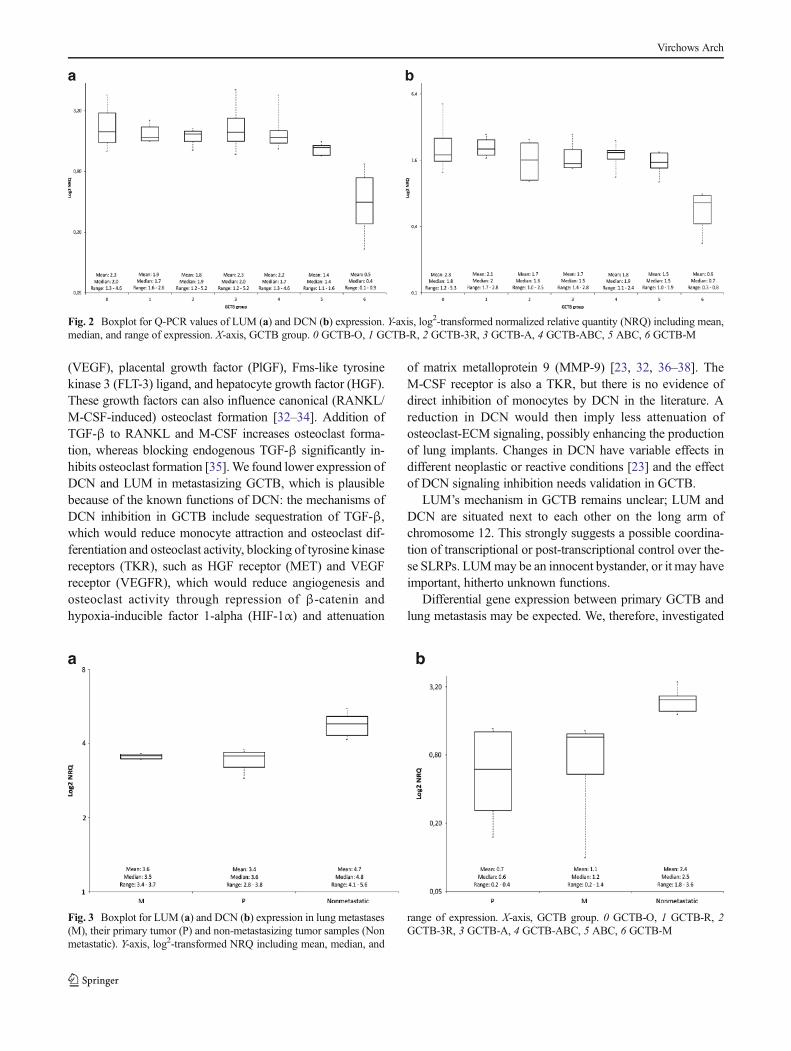
As noted in the above methods, 23 genes were selected forfurther analysis (Table 2). Q-PCR confirmed a lower expres-sion of DCN and LUM at mRNA level in the metastatic cases(Fig. 2). From the microarray data, five genes were extractedthat showed prominent differential gene expression in therelapsed cases. Differential expression was verified for twoof the genes: ZNF14 displayed higher expression whereasDPT exhibited lower expression in the recurrent cases groupcompared to the other GCTB samples. Based on the microar-ray data, regressive changes in GCTB are associated withhigher expression of EPYC and lower expression ofCLEC2D and RPL23. Q-PCR supported differential expres-sion of all of these three genes, however only for EPYC asignificant differential expression (p=0.004) could be verified.In the GCTB group with secondary ABC, Q-PCR confirmed asignificant increase in expression of FRZB.
Location specific versus tumor specific
In order to validate our findings, we investigated whether thelower expression of LUM and DCN is location specific ortumor specific. We first compared the gene expression level of
Virchows Arch
these genes in lung metastases to the expression in primarytumors. We did not found significant differential expressionbetween the lung metastases and their primary located tumorsby applying both the paired t test (DCN, p value=0.9; LUM, pvalue=0.5) and the unpaired t test (DCN, p value=0.9; LUM,p value=0.6). Then the expression of both the lung metastasesand their primary tumors was compared with the group ofnon-metastasizing primary cases of GCTB (GCTB-A, GCTB-0, GCTB-R, GCTB-3R, and GCTB-ABC). We observed asignificant lower differential gene expression in the lung me-tastases compared to the non-metastasizing tumor samples(DCN, p=0.002; LUM, p<0.001). We also found significant-ly lower expression of both genes in the primary tumors withlung metastases compared to the non-metastasizing tumors(DCN, p=0.003; LUM, p<0.001) (Fig. 3).
Immunohistochemistry
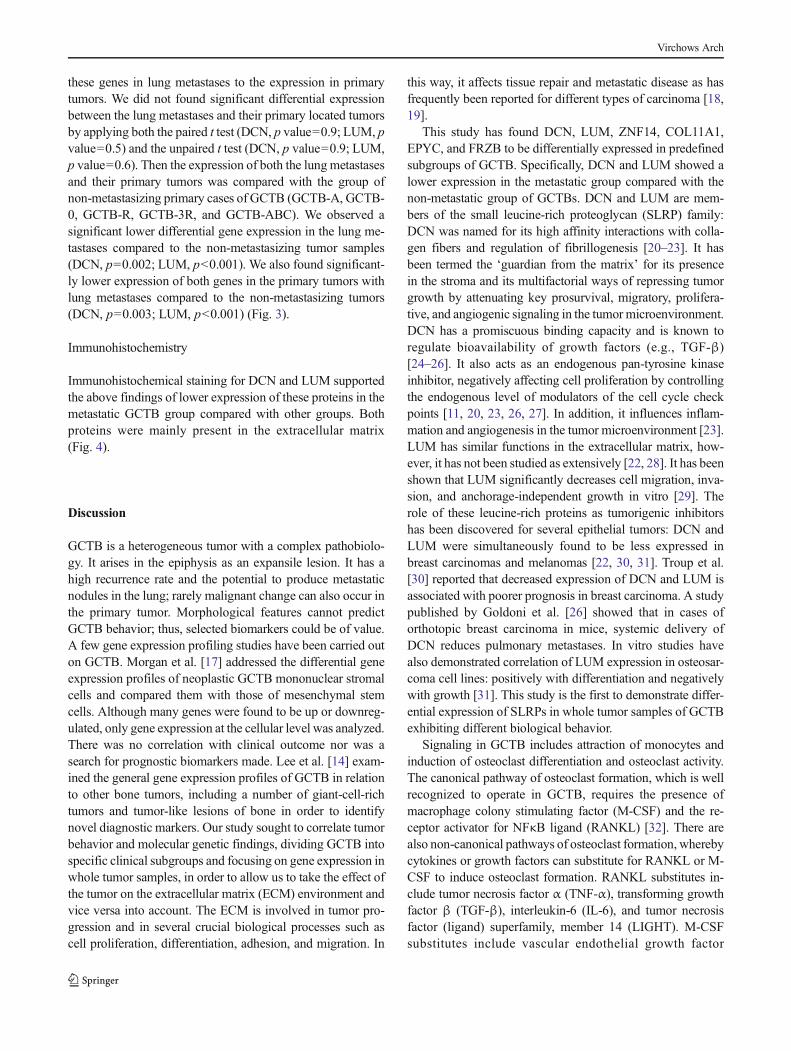
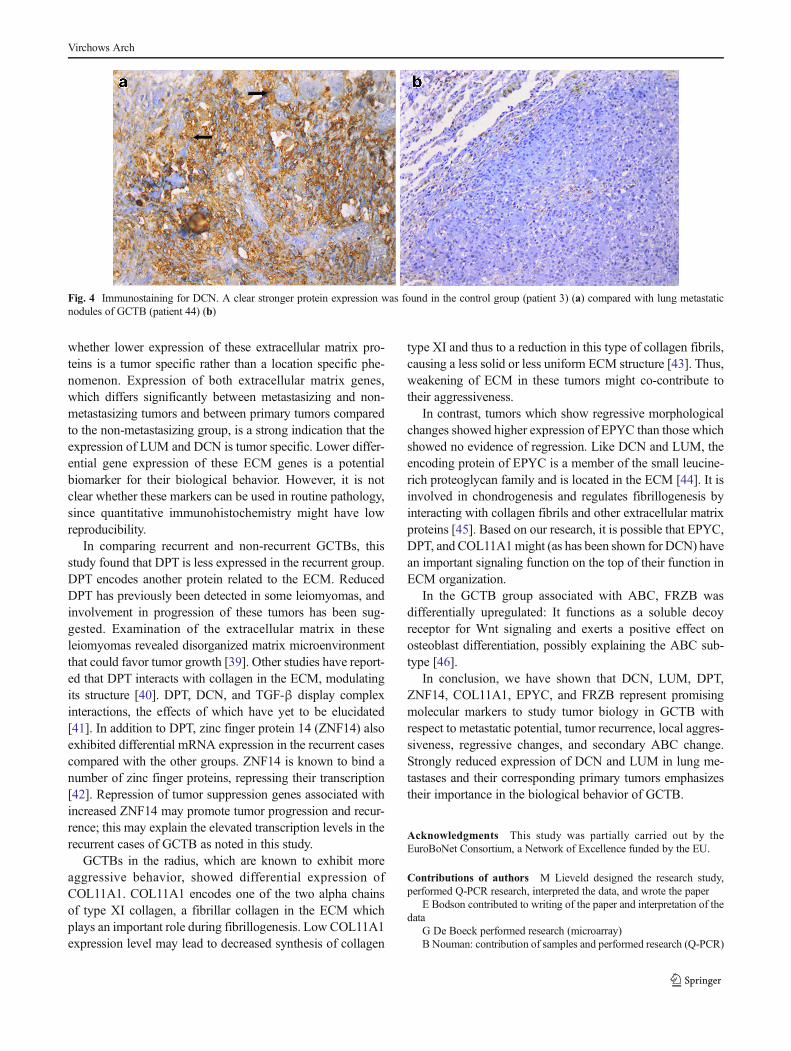
Immunohistochemical staining for DCN and LUM supportedthe above findings of lower expression of these proteins in themetastatic GCTB group compared with other groups. Bothproteins were mainly present in the extracellular matrix(Fig. 4).
Discussion
GCTB is a heterogeneous tumor with a complex pathobiolo-gy. It arises in the epiphysis as an expansile lesion. It has ahigh recurrence rate and the potential to produce metastaticnodules in the lung; rarely malignant change can also occur inthe primary tumor. Morphological features cannot predictGCTB behavior; thus, selected biomarkers could be of value.A few gene expression profiling studies have been carried outon GCTB. Morgan et al. [17] addressed the differential geneexpression profiles of neoplastic GCTB mononuclear stromalcells and compared them with those of mesenchymal stemcells. Although many genes were found to be up or downreg-ulated, only gene expression at the cellular level was analyzed.There was no correlation with clinical outcome nor was asearch for prognostic biomarkers made. Lee et al. [14] exam-ined the general gene expression profiles of GCTB in relationto other bone tumors, including a number of giant-cell-richtumors and tumor-like lesions of bone in order to identifynovel diagnostic markers. Our study sought to correlate tumorbehavior and molecular genetic findings, dividing GCTB intospecific clinical subgroups and focusing on gene expression inwhole tumor samples, in order to allow us to take the effect ofthe tumor on the extracellular matrix (ECM) environment andvice versa into account. The ECM is involved in tumor pro-gression and in several crucial biological processes such ascell proliferation, differentiation, adhesion, and migration. In
this way, it affects tissue repair and metastatic disease as hasfrequently been reported for different types of carcinoma [18,19].
This study has found DCN, LUM, ZNF14, COL11A1,EPYC, and FRZB to be differentially expressed in predefinedsubgroups of GCTB. Specifically, DCN and LUM showed alower expression in the metastatic group compared with thenon-metastatic group of GCTBs. DCN and LUM are mem-bers of the small leucine-rich proteoglycan (SLRP) family:DCN was named for its high affinity interactions with colla-gen fibers and regulation of fibrillogenesis [20–23]. It hasbeen termed the ‘guardian from the matrix’ for its presencein the stroma and its multifactorial ways of repressing tumorgrowth by attenuating key prosurvival, migratory, prolifera-tive, and angiogenic signaling in the tumor microenvironment.DCN has a promiscuous binding capacity and is known toregulate bioavailability of growth factors (e.g., TGF-β)[24–26]. It also acts as an endogenous pan-tyrosine kinaseinhibitor, negatively affecting cell proliferation by controllingthe endogenous level of modulators of the cell cycle checkpoints [11, 20, 23, 26, 27]. In addition, it influences inflam-mation and angiogenesis in the tumor microenvironment [23].LUM has similar functions in the extracellular matrix, how-ever, it has not been studied as extensively [22, 28]. It has beenshown that LUM significantly decreases cell migration, inva-sion, and anchorage-independent growth in vitro [29]. Therole of these leucine-rich proteins as tumorigenic inhibitorshas been discovered for several epithelial tumors: DCN andLUM were simultaneously found to be less expressed inbreast carcinomas and melanomas [22, 30, 31]. Troup et al.[30] reported that decreased expression of DCN and LUM isassociated with poorer prognosis in breast carcinoma. A studypublished by Goldoni et al. [26] showed that in cases oforthotopic breast carcinoma in mice, systemic delivery ofDCN reduces pulmonary metastases. In vitro studies havealso demonstrated correlation of LUM expression in osteosar-coma cell lines: positively with differentiation and negativelywith growth [31]. This study is the first to demonstrate differ-ential expression of SLRPs in whole tumor samples of GCTBexhibiting different biological behavior.
Signaling in GCTB includes attraction of monocytes andinduction of osteoclast differentiation and osteoclast activity.The canonical pathway of osteoclast formation, which is wellrecognized to operate in GCTB, requires the presence ofmacrophage colony stimulating factor (M-CSF) and the re-ceptor activator for NFκB ligand (RANKL) [32]. There arealso non-canonical pathways of osteoclast formation, wherebycytokines or growth factors can substitute for RANKL or M-CSF to induce osteoclast formation. RANKL substitutes in-clude tumor necrosis factor α (TNF-α), transforming growthfactor β (TGF-β), interleukin-6 (IL-6), and tumor necrosisfactor (ligand) superfamily, member 14 (LIGHT). M-CSFsubstitutes include vascular endothelial growth factor
Virchows Arch
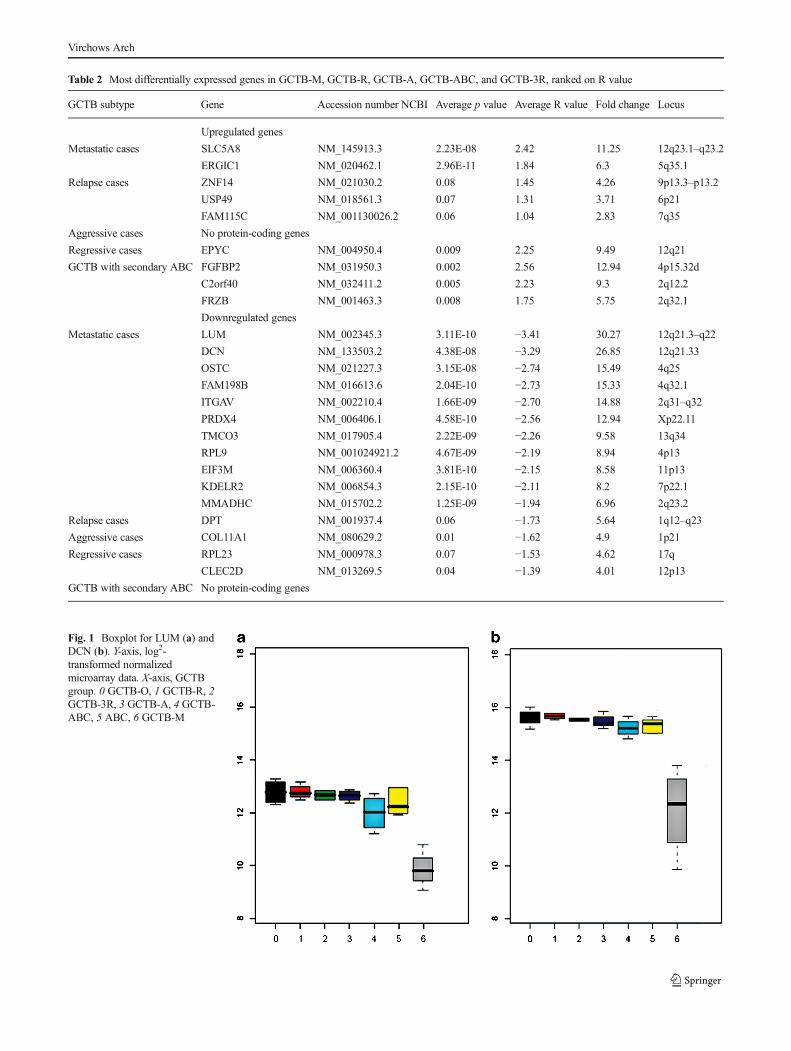
Table 2 Most differentially expressed genes in GCTB-M, GCTB-R, GCTB-A, GCTB-ABC, and GCTB-3R, ranked on R value
GCTB subtype Gene Accession number NCBI Average p value Average R value Fold change Locus
Upregulated genes
Metastatic cases SLC5A8 NM_145913.3 2.23E-08 2.42 11.25 12q23.1–q23.2
ERGIC1 NM_020462.1 2.96E-11 1.84 6.3 5q35.1
Relapse cases ZNF14 NM_021030.2 0.08 1.45 4.26 9p13.3–p13.2
USP49 NM_018561.3 0.07 1.31 3.71 6p21
FAM115C NM_001130026.2 0.06 1.04 2.83 7q35
Aggressive cases No protein-coding genes
Regressive cases EPYC NM_004950.4 0.009 2.25 9.49 12q21
GCTB with secondary ABC FGFBP2 NM_031950.3 0.002 2.56 12.94 4p15.32d
C2orf40 NM_032411.2 0.005 2.23 9.3 2q12.2
FRZB NM_001463.3 0.008 1.75 5.75 2q32.1
Downregulated genes
Metastatic cases LUM NM_002345.3 3.11E-10 −3.41 30.27 12q21.3–q22
DCN NM_133503.2 4.38E-08 −3.29 26.85 12q21.33
OSTC NM_021227.3 3.15E-08 −2.74 15.49 4q25
FAM198B NM_016613.6 2.04E-10 −2.73 15.33 4q32.1
ITGAV NM_002210.4 1.66E-09 −2.70 14.88 2q31–q32
PRDX4 NM_006406.1 4.58E-10 −2.56 12.94 Xp22.11
TMCO3 NM_017905.4 2.22E-09 −2.26 9.58 13q34
RPL9 NM_001024921.2 4.67E-09 −2.19 8.94 4p13
EIF3M NM_006360.4 3.81E-10 −2.15 8.58 11p13
KDELR2 NM_006854.3 2.15E-10 −2.11 8.2 7p22.1
MMADHC NM_015702.2 1.25E-09 −1.94 6.96 2q23.2
Relapse cases DPT NM_001937.4 0.06 −1.73 5.64 1q12–q23
Aggressive cases COL11A1 NM_080629.2 0.01 −1.62 4.9 1p21
Regressive cases RPL23 NM_000978.3 0.07 −1.53 4.62 17q
CLEC2D NM_013269.5 0.04 −1.39 4.01 12p13
GCTB with secondary ABC No protein-coding genes
Fig. 1 Boxplot for LUM (a) andDCN (b). Y-axis, log2-transformed normalizedmicroarray data. X-axis, GCTBgroup. 0 GCTB-O, 1 GCTB-R, 2GCTB-3R, 3 GCTB-A, 4 GCTB-ABC, 5 ABC, 6 GCTB-M
Virchows Arch
(VEGF), placental growth factor (PlGF), Fms-like tyrosinekinase 3 (FLT-3) ligand, and hepatocyte growth factor (HGF).These growth factors can also influence canonical (RANKL/M-CSF-induced) osteoclast formation [32–34]. Addition ofTGF-β to RANKL and M-CSF increases osteoclast forma-tion, whereas blocking endogenous TGF-β significantly in-hibits osteoclast formation [35].We found lower expression ofDCN and LUM in metastasizing GCTB, which is plausiblebecause of the known functions of DCN: the mechanisms ofDCN inhibition in GCTB include sequestration of TGF-β,which would reduce monocyte attraction and osteoclast dif-ferentiation and osteoclast activity, blocking of tyrosine kinasereceptors (TKR), such as HGF receptor (MET) and VEGFreceptor (VEGFR), which would reduce angiogenesis andosteoclast activity through repression of β-catenin andhypoxia-inducible factor 1-alpha (HIF-1α) and attenuation
of matrix metalloprotein 9 (MMP-9) [23, 32, 36–38]. TheM-CSF receptor is also a TKR, but there is no evidence ofdirect inhibition of monocytes by DCN in the literature. Areduction in DCN would then imply less attenuation ofosteoclast-ECM signaling, possibly enhancing the productionof lung implants. Changes in DCN have variable effects indifferent neoplastic or reactive conditions [23] and the effectof DCN signaling inhibition needs validation in GCTB.
LUM’s mechanism in GCTB remains unclear; LUM andDCN are situated next to each other on the long arm ofchromosome 12. This strongly suggests a possible coordina-tion of transcriptional or post-transcriptional control over the-se SLRPs. LUMmay be an innocent bystander, or it may haveimportant, hitherto unknown functions.
Differential gene expression between primary GCTB andlung metastasis may be expected. We, therefore, investigated
Fig. 2 Boxplot for Q-PCR values of LUM (a) and DCN (b) expression. Y-axis, log2-transformed normalized relative quantity (NRQ) including mean,median, and range of expression. X-axis, GCTB group. 0 GCTB-O, 1 GCTB-R, 2 GCTB-3R, 3 GCTB-A, 4 GCTB-ABC, 5 ABC, 6 GCTB-M
Fig. 3 Boxplot for LUM (a) and DCN (b) expression in lung metastases(M), their primary tumor (P) and non-metastasizing tumor samples (Nonmetastatic). Y-axis, log2-transformed NRQ including mean, median, and
range of expression. X-axis, GCTB group. 0 GCTB-O, 1 GCTB-R, 2GCTB-3R, 3 GCTB-A, 4 GCTB-ABC, 5 ABC, 6 GCTB-M
Virchows Arch
whether lower expression of these extracellular matrix pro-teins is a tumor specific rather than a location specific phe-nomenon. Expression of both extracellular matrix genes,which differs significantly between metastasizing and non-metastasizing tumors and between primary tumors comparedto the non-metastasizing group, is a strong indication that theexpression of LUM and DCN is tumor specific. Lower differ-ential gene expression of these ECM genes is a potentialbiomarker for their biological behavior. However, it is notclear whether these markers can be used in routine pathology,since quantitative immunohistochemistry might have lowreproducibility.
In comparing recurrent and non-recurrent GCTBs, thisstudy found that DPT is less expressed in the recurrent group.DPT encodes another protein related to the ECM. ReducedDPT has previously been detected in some leiomyomas, andinvolvement in progression of these tumors has been sug-gested. Examination of the extracellular matrix in theseleiomyomas revealed disorganized matrix microenvironmentthat could favor tumor growth [39]. Other studies have report-ed that DPT interacts with collagen in the ECM, modulatingits structure [40]. DPT, DCN, and TGF-β display complexinteractions, the effects of which have yet to be elucidated[41]. In addition to DPT, zinc finger protein 14 (ZNF14) alsoexhibited differential mRNA expression in the recurrent casescompared with the other groups. ZNF14 is known to bind anumber of zinc finger proteins, repressing their transcription[42]. Repression of tumor suppression genes associated withincreased ZNF14 may promote tumor progression and recur-rence; this may explain the elevated transcription levels in therecurrent cases of GCTB as noted in this study.
GCTBs in the radius, which are known to exhibit moreaggressive behavior, showed differential expression ofCOL11A1. COL11A1 encodes one of the two alpha chainsof type XI collagen, a fibrillar collagen in the ECM whichplays an important role during fibrillogenesis. Low COL11A1expression level may lead to decreased synthesis of collagen
type XI and thus to a reduction in this type of collagen fibrils,causing a less solid or less uniform ECM structure [43]. Thus,weakening of ECM in these tumors might co-contribute totheir aggressiveness.
In contrast, tumors which show regressive morphologicalchanges showed higher expression of EPYC than those whichshowed no evidence of regression. Like DCN and LUM, theencoding protein of EPYC is a member of the small leucine-rich proteoglycan family and is located in the ECM [44]. It isinvolved in chondrogenesis and regulates fibrillogenesis byinteracting with collagen fibrils and other extracellular matrixproteins [45]. Based on our research, it is possible that EPYC,DPT, and COL11A1might (as has been shown for DCN) havean important signaling function on the top of their function inECM organization.
In the GCTB group associated with ABC, FRZB wasdifferentially upregulated: It functions as a soluble decoyreceptor for Wnt signaling and exerts a positive effect onosteoblast differentiation, possibly explaining the ABC sub-type [46].
In conclusion, we have shown that DCN, LUM, DPT,ZNF14, COL11A1, EPYC, and FRZB represent promisingmolecular markers to study tumor biology in GCTB withrespect to metastatic potential, tumor recurrence, local aggres-siveness, regressive changes, and secondary ABC change.Strongly reduced expression of DCN and LUM in lung me-tastases and their corresponding primary tumors emphasizestheir importance in the biological behavior of GCTB.
Acknowledgments This study was partially carried out by theEuroBoNet Consortium, a Network of Excellence funded by the EU.
Contributions of authors M Lieveld designed the research study,performed Q-PCR research, interpreted the data, and wrote the paper
E Bodson contributed to writing of the paper and interpretation of thedata
G De Boeck performed research (microarray)B Nouman: contribution of samples and performed research (Q-PCR)
Fig. 4 Immunostaining for DCN. A clear stronger protein expression was found in the control group (patient 3) (a) compared with lung metastaticnodules of GCTB (patient 44) (b)
Virchows Arch

AM Cleton-Jansen performed research (microarray)E Korsching analyzed the microarray dataMS Benassi and P Picci: contribution of samplesG Sys and B Poffyn: contribution of samplesNA Athanasou: revision and final approval of the articlePCW Hogendoorn: contribution of samples and examination of
samplesRG Forsyth designed the research study and examined samples
Manufacturer’s name Illumina’s Human-6 v2 Expression BeadChips(Illumina®, Son, The Netherlands)
Trizol® (Invitrogen Life Technologies, Carlsbad, CA)RNeasy-mini kit (Qiagen, Hilden, Germany)NanoDrop ND-100 Spectrophotometer (Nanodrop® Technologies
Inc., Wilmington, DE)Agilent 2100 Bioanalyzer (Agilent Technologies, Palo Alto, CA)Illumina® TotalPrep RNA Amplification Kit (Ambrion, Inc., Austin,
TX)RQ1 RNase–Free DNase (Promega, Leiden, The Netherlands)iScript cDNA synthesis kit (Biorad Laboratories Ltd. Hertfordshire,
UK)GeNorm Housekeeping Gene Selection Kit (Primerdesign,
Southampton, Hants)Lightcycler® 480 (Roche Diagnostics, Vilvoorde, Belgium)Sybr Green mix (Roche Diagnostics, Vilvoorde, Belgium)Antibodies (Abcam, UK)Electrically charged superfrost plus slides (Menzel-Gläser,
Braunschweig)Peroxidase DAB (DAKO, Heverlee, Belgium)Streptavidin-HRP (DAKO, Heverlee, Belgium)
Conflict of interest All authors state that they have no conflicts ofinterest.
References
1. Zheng MH, Fan Y, Wysocki SJ et al (1994) Gene expression oftransforming growth factor-beta 1 and its type II receptor in giantcell tumors of bone. Possible involvement in osteoclast-like cellmigration. Am J Pathol 145(5):1095–1104
2. Joyner CJ, Quinn JM, Triffitt JT, Owen ME, Athanasou NA (1992)Phenotypic characterisation of mononuclear and multinucleated cellsof giant cell tumour of bone. Bone Miner 16(1):37–48
3. Lindeman JH, Hanemaaijer R, Mulder A et al (2009) Cathepsin K isthe principal protease in giant cell tumor of bone. Am J Pathol 165:593–600
4. Forsyth RG, De Boeck G, Taminiau AHM et al (2009) CD33+ CD14− phenotype is characteristic of multinuclear osteoclast-like cells ingiant cell tumor of bone. J Bone Miner Res 24(1):70–77
5. da Costa CET, Annels NE, Faaij CMJM, Forsyth RG, HogendoornPCW, Egeler RM (2005) Presence of osteoclast-like multinucleatedgiant cells in the bone and nonostotic lesions of Langerhans cellhistiocytosis. J Exp Med 201(5):687–693
6. Reid R, Banerjee SS, Sciot R (2002)WHO classification of tumors ofbone: giant cell tumor. In: world health organization classification oftumors. Pathology and genetics of tumors of soft tissue and bone.IARC Press, Lyon, pp 310–312
7. Edwards JR, Williams K, Kindblom LG et al (2008) Lymphatics andbone. Hum Pathol 39:49–55
8. Blackley HR, Wunder JS, Davis AM, White LM, Kandel R, Bell RS(1999) Treatment of giant cell tumors of long bones with curettageand bone grafting. J Bone Joint Surg 81:811–820
9. Turcotte RE (2006) Giant cell tumor of bone. Orthop Clin North Am37:35–51
10. Marcove RC, Sheth DS, Brien EW, Huvos AG, Healey JH (1994)Conservative surgery for giant cell tumors of sacrum. The role ofcryosurgery as a supplement to curettage and partial excision. Cancer74:1253–1260
11. Domovitov SV, Healey JH (2010) Primary malignant giant-cell tu-mor of bone has high survival rate. Ann Surg Oncol 17:694–701
12. Balke M, Schremper L, Gebert C et al (2008) Giant cell tumor ofbone: Treatment and outcome of 214 cases. J Cancer Res Clin Oncol134:969–978
13. Bertoni F, Bacchini P, Staals E (2003) Malignancy in giant cell tumorof bone. Cancer 97:2520–2529
14. Lee C, Espinosa I, Jensen KC et al (2008) Gene expression profilingidentifies p63 as a diagnostic marker for giant cell tumor of bone.Mod Pathol 21:531–539
15. Moskovszky L, Dezsö K, Athanasou NA et al (2010) Centrosomeabnormalities in giant cell tumor of bone: Possible association withchromosomal instability. Mod Pathol 23:359–366
16. Moerkerke B, Goetghebeur E (2006) Selecting “significant” differ-entially expressed genes from the combined perspective of the nulland the alternative. J Comput Biol 13:1513–1531
17. Morgan T, Atkins GJ, Trivett MK et al (2005) Molecular profiling ofgiant cell tumor of bone and the osteclastic localization of ligand forreceptor activator of nuclear factor κ B. Am J Pathol 167:117–128
18. Hocking AM, Shinomura T, McQuillan DJ (1998) Leucine-richrepeat glycoproteins of the extracellular matrix. Matrix Biol 17:1–19
19. Pupa SM,Ménard S, Forti S, Tagliabe E (2002) New insights into therole of extracellular matrix during tumor onset and progression. J CellPhysiol 192:259–267
20. Schaefer L, Iozzo RV (2008) Biological functions of the smallleucine-rich proteoglycans: from genetics to signal transduction. JBiol Chem 31:21305–21309
21. Danielson KG, Baribault H, Holmes DF, Graham H, Kadler KE,Iozzo RV (1997) Targeted disruption of decorin leads to abnormalcollagen fibril morphology and skin fragility. J Cell Biol 136:729–743
22. Chakravarti S, Magnuson T, Lass JH, JepsenKJ, LaMantia C, CarrollH (1998) Lumican regulates collagen fibril assembly: Skin fragilityand corneal opacity in the absence of lumican. J Cell Biol 141:1277–1286
23. Neill T, Schaefer L, Iozzo RV (2012) Decorin: a guardian from thematrix. Am J Pathol 181(2):380–387
24. Kaname S, Ruoslahti E (1996) Betaglycan has multiple bindingsites for transforming growth factor-beta 1. Biochem J 315:815–820
25. Cabello-Verrugio C, Brandan E (2007) A novel modulatory mecha-nism of transforming growth factor-β signaling through decorin andLRP-1. J Biol Chem 282:18842–18850
26. Goldoni S, Humphries A, Nyström A et al (2009) Decorin is a novelantagonistic ligand of the Met receptor. J Cell Biol 185:743–754
27. Zhu JX, Goldoni S, Bix G et al (2005) Decorin evokes protractedinternalization and degradation of the epidermal growth factor recep-tor via caveolar endocytosis. J Biol Chem 280:32468–32479
28. Nikitovic D, Katonis P, Tsatsakis A, Karamanos NK, Tzanakakis GN(2008) Lumican, a small leucine-rich proteoglycan. IUBMB Life60(12):818–823
29. Vuillermoz B, Khoruzhenko A, D’OnofrioMF et al (2004) The smallleucine-rich proteoglycan lumican inhibits melanoma progression.Exp Cell Res 296:294–306
30. Troup S, Njue C, Kliewer EVet al (2003) Reduced expression of thesmall leucine-rich proteoglycans, lumican, and decorin is associatedwith poor outcome in node-negative invasive breast cancer. ClinCancer Res 9:207–214
31. Nikitovic D, Berdiaki A, Zafiropoulos A et al (2008) Lumicanexpression is positively correlated with the differentiation and
Virchows Arch
negatively with the growth of human osteosarcoma cells. FEBS J275(2):350–361
32. Knowles HJ, Athanasou NA (2009) Canonical and non-canonicalpathways of osteoclast formation. Histol Histopathol 24(3):337–346
33. Wallenius V, Hisaoka M, Helou K et al (2000) Overexpression of thehepatocyte growth factor (HGF) receptor (Met) and presence of atruncated and activated intracellular HGF receptor fragment in locallyaggressive/malignant human musculoskeletal tumors. Am J Pathol156(3):821–829
34. Taylor RM, Kashima TG, Knowles HJ, Athanasou NA (2012)VEGF, FLT3 ligand, PlGF and HGF can substitute for M-CSF toinduce human osteoclast formation: implications for giant cell tu-mour pathobiology. Lab Invest 92(10):1398–1406
35. Itonaga I, Sabokbar A, Sun SG, Kudo O, Danks L, Ferguson D,Fujikawa Y, Athanasou NA (2004) Transforming growth factor-betainduces osteoclast formation in the absence of RANKL. Bone 34(1):57–64
36. Kumta SM, Huang L, Cheng YY, Chow LT, Lee KM, Zheng MH(2003) Expression of VEGF and MMP-9 in giant cell tumor of boneand other osteolytic lesions. Life Sci 73(11):1427–1436
37. Knowles HJ, Athanasou NA (2008) Hypoxia-inducible factor isexpressed in giant cell tumour of bone and mediates paracrine effectsof hypoxia on monocyte-osteoclast differentiation via induction ofVEGF. J Pathol 215(1):56–66
38. Neill E (2012) T, Painter H, Buraschi S et al. Decorin antagonizes theangiogenic network: concurrent inhibition of Met, hypoxia inducible
factor 1α, vascular endothelial growth factor A, and induction ofthrombospondin-1 and TIMP3. J Biol Chem 287(8):5492–5506
39. Catherino WH, Leppert PC, Stenmark MH et al (2004) Reduceddermatopontin expression is a molecular link between uterineleiomyomas and keloids. Genes Chromosomes Cancer 40:204–217
40. Okamoto O, Fujiwara S, Abe M, Sato Y (1999) Dermatopontininteracts with transforming growth factor β and enhances its biolog-ical activity. Biochem J 337:537–541
41. Okamoto O, Fujiwara S (2006) Dermatopontin, a novel player in thebiology of the extracellular matrix. Connect Tissue Res 47(4):177–189
42. Groner AC, Meylan S, Ciuffi A et al (2010) KRAB-zinc fingerproteins and KAP1 can mediate long-range transcriptional repressionthrough heterochromatin spreading. PLoS Genet 6:e1000869
43. Robin NH,Moran RT,WarmanM,Ala-Kokko L. Stickler Syndrome.GeneReviews. http://www.ncbi.nlm.nih.gov/books/NBK1302/.Accessed Nov 3 2011
44. Johnson HJ, Rosenberg L, Choi HU, Garza S, Höök M, NeamePJ (1997) Characterization of epiphycan, a small proteoglycanwith a leucine-rich repeat core protein. J Biol Chem 272:18709–18717
45. Knudson CB, Knudson W (2001) Cartilage proteoglycans. SeminCell Dev Biol 12:69–78
46. Chung YS, Baylink DJ, Srivastava AK et al (2004) Effects ofsecreted frizzled-related protein 3 on osteoblasts in vitro. J BoneMiner Res 19(9):1395–1402
Virchows Arch
Copyright © 2022 FDOKUMEN