Gene expression pattern in hepatic stem/progenitor cells during rat fetal development using...
11
Gene Expression Pattern in Hepatic Stem/Progenitor Cells During Rat Fetal Development Using Complementary DNA Microarrays Petko M. Petkov, 1,2,4 Jiri Zavadil, 3,5 David Goetz, 1,2 Tearina Chu, 1,2,6 Robert Carver, 1,2,7 Charles E. Rogler, 1,2 Erwin P. Bottinger, 1,3 David A. Shafritz, 1,2 and Mariana D. Dabeva 1,2 To identify new and differentially expressed genes in rat fetal liver epithelial stem/progenitor cells during their proliferation, lineage commitment, and differentiation, we used a high throughput method—mouse complementary DNA (cDNA) microarrays—for analysis of gene expression. The gene expression pattern of rat hepatic cells was studied during their differentiation in vivo: from embryonic day (ED) 13 until adulthood. The differentially regulated genes were grouped into two clusters: a cluster of up-regulated genes comprised of 281 clones and a cluster of down-regulated genes comprised of 230 members. The expression of the latter increased abruptly between ED 16 and ED 17. Many of the overexpressed genes from the first cluster fall into distinct, differentially expressed functional groups: genes related to development, morphogenesis, and differentiation; calcium- and phospholipid-binding proteins and signal transducers; and cell adhesion, migration, and matrix pro- teins. Several other functional groups of genes that are initially down-regulated, then increase during development, also emerged: genes related to inflammation, blood coagulation, detoxification, serum proteins, amino acids, lipids, and carbohydrate metabolism. Twenty-eight genes overexpressed in fetal liver that were not detected in adult liver are suggested as potential markers for identification of liver progenitor cells. In conclusion, our data show that the gene expression program of fetal hepatoblasts differs profoundly from that of adult hepatocytes and that it is regulated in a specific manner with a major switch at ED 16 to 17, marking a dramatic change in the gene expression program during the transition of fetal liver progenitor cells from an undifferentiated to a differentiated state. Supplemen- tary material for this article can be found on the HEPATOLOGY website (http://interscience. wiley.com/jpages/0270-9139/suppmat/index.html). (HEPATOLOGY 2004;39:617– 627.) O ver the years, substantial evidence has accumu- lated suggesting the existence of potential liver stem cells (LSCs) in the adult liver. This evi- dence is indirect, because in all reports the putative LSCs were activated to proliferate and differentiate into liver progenitor cells only when the regenerative capacity of terminally differentiated hepatocytes was compro- mised. 1–3 Because these cells are not under constant re- newal—in contrast to epithelial cells of the intestine or the skin—they escape detection in the quiescent liver. For this reason, a unique specific marker for LSCs in adult liver has not yet been identified, and the LSCs have not yet been isolated. To study liver stem/progenitor cells (LS/PCs), we took a different approach. We began to analyze the gene expression profile of hepatic cells in fetal liver. Around embryonic day (ED) 8.5 in the mouse and 1 day later in the rat, primitive epithelial cells of the ventral foregut come in contact with cardiac mesoderm and fibroblast growth factor signaling, leading to formation of the hepatic diverticulum. 4–6 Subse- quently, cells of the primary liver diverticulum invade the septum transversum and, under the inductive signals of bone morphogenic proteins, proliferate extensively and differenti- ate further. 6 These cells are considered committed hepatic epithelial cells and have been termed hepatoblasts. 4–6 Some of these cells are at a very early stage of their differentiation, and their expression profile could provide clues about the expres- sion pattern of hepatic stem cells. Abbreviations: cDNA, complementary DNA; ED, embryonic day; LSCs, liver stem cells; LS/PCs, liver stem/progenitor cells; SDS, sodium dodecyl sulfate; SSC, saline sodium citrate; mRNA, messenger RNA; RT-PCR, reverse-transcriptase poly- merase chain reaction; Hey1, hairy/enhancer-of-split related with YRPW motif 1; Tnc, tenascin C; EST, expressed sequence tags; Peg3, paternally expressed gene 3; Klf5, Kruppel-like factor 5; Grb10, growth factor receptor bound protein 10; Fah2, four and a half LIM domains 2; TNF, tumor necrosis factor. From the 1 Marion Bessin Liver Research Center, 2 Department of Medicine, and 3 Biotechnology Center and Division of Nephrology, Albert Einstein College of Med- icine, Bronx, NY. Current addresses: 4 Jackson Laboratories, Bar Harbor, ME; 5 Department of Pathology, NYU School of Medicine, New York, NY; 6 Department of Molecular Biology and Biochemistry, Mount Sinai School of Medicine, New York, NY; 7 Enzo Biochemical, Farmington, NY. Received September 30, 2003; accepted December 3, 2003. Supported by National Institutes of Health grants R01 DK59321 (to M.D.D.), R01 DK17609 (to D.A.S.), P30 DK41296 (to D.A.S.), P30 DK56496 (to D.A.S.), and U24 DK058768 (to E.P.B.). P.M.P. and J.Z. contributed equally to this work. Address reprint requests to: Mariana D. Dabeva, Marion Bessin Liver Research Center, Albert Einstein College of Medicine, 1300 Morris Park Avenue, Bronx, NY 10461. E-mail: [email protected]; fax: 718-430-8975. Copyright © 2004 by the American Association for the Study of Liver Diseases. Published online in Wiley InterScience (www.interscience.wiley.com). DOI 10.1002/hep.20088 617
-
Upload
independent -
Category
Documents
-
view
3 -
download
0
Transcript of Gene expression pattern in hepatic stem/progenitor cells during rat fetal development using...

Gene Expression Pattern in Hepatic Stem/ProgenitorCells During Rat Fetal Development Using
Complementary DNA MicroarraysPetko M. Petkov,1,2,4 Jiri Zavadil,3,5 David Goetz,1,2 Tearina Chu,1,2,6 Robert Carver,1,2,7 Charles E. Rogler,1,2
Erwin P. Bottinger,1,3 David A. Shafritz,1,2 and Mariana D. Dabeva1,2
To identify new and differentially expressed genes in rat fetal liver epithelial stem/progenitor cellsduring their proliferation, lineage commitment, and differentiation, we used a high throughputmethod—mouse complementary DNA (cDNA) microarrays—for analysis of gene expression. Thegene expression pattern of rat hepatic cells was studied during their differentiation in vivo: fromembryonic day (ED) 13 until adulthood. The differentially regulated genes were grouped into twoclusters: a clusterofup-regulatedgenes comprisedof281clonesandaclusterofdown-regulatedgenescomprised of 230 members. The expression of the latter increased abruptly between ED 16 and ED17. Many of the overexpressed genes from the first cluster fall into distinct, differentially expressedfunctional groups: genes related to development, morphogenesis, and differentiation; calcium- andphospholipid-binding proteins and signal transducers; and cell adhesion, migration, and matrix pro-teins. Several other functional groups of genes that are initially down-regulated, then increase duringdevelopment, also emerged: genes related to inflammation, blood coagulation, detoxification, serumproteins,aminoacids, lipids,andcarbohydratemetabolism.Twenty-eightgenesoverexpressedinfetalliver that were not detected in adult liver are suggested as potential markers for identification of liverprogenitor cells. In conclusion, our data show that the gene expression program of fetal hepatoblastsdiffers profoundly from that of adult hepatocytes and that it is regulated in a specific manner with amajor switch at ED 16 to 17, marking a dramatic change in the gene expression program during thetransition of fetal liver progenitor cells from an undifferentiated to a differentiated state. Supplemen-tary material for this article can be found on the HEPATOLOGY website (http://interscience.wiley.com/jpages/0270-9139/suppmat/index.html). (HEPATOLOGY 2004;39:617–627.)
Over the years, substantial evidence has accumu-lated suggesting the existence of potential liverstem cells (LSCs) in the adult liver. This evi-
dence is indirect, because in all reports the putative LSCs
were activated to proliferate and differentiate into liverprogenitor cells only when the regenerative capacity ofterminally differentiated hepatocytes was compro-mised.1–3 Because these cells are not under constant re-newal—in contrast to epithelial cells of the intestine orthe skin—they escape detection in the quiescent liver. Forthis reason, a unique specific marker for LSCs in adultliver has not yet been identified, and the LSCs have notyet been isolated.
To study liver stem/progenitor cells (LS/PCs), we took adifferent approach. We began to analyze the gene expressionprofile of hepatic cells in fetal liver. Around embryonic day(ED) 8.5 in the mouse and 1 day later in the rat, primitiveepithelial cells of the ventral foregut come in contact withcardiac mesoderm and fibroblast growth factor signaling,leading to formation of the hepatic diverticulum.4–6 Subse-quently, cells of the primary liver diverticulum invade theseptum transversum and, under the inductive signals of bonemorphogenic proteins, proliferate extensively and differenti-ate further.6 These cells are considered committed hepaticepithelial cells and have been termed hepatoblasts.4–6 Some ofthese cells are at a very early stage of their differentiation, andtheir expression profile could provide clues about the expres-sion pattern of hepatic stem cells.
Abbreviations: cDNA, complementary DNA; ED, embryonic day; LSCs, liverstem cells; LS/PCs, liver stem/progenitor cells; SDS, sodium dodecyl sulfate; SSC,saline sodium citrate; mRNA, messenger RNA; RT-PCR, reverse-transcriptase poly-merase chain reaction; Hey1, hairy/enhancer-of-split related with YRPW motif 1;Tnc, tenascin C; EST, expressed sequence tags; Peg3, paternally expressed gene 3;Klf5, Kruppel-like factor 5; Grb10, growth factor receptor bound protein 10; Fah2,four and a half LIM domains 2; TNF, tumor necrosis factor.
From the 1Marion Bessin Liver Research Center, 2Department of Medicine, and3Biotechnology Center and Division of Nephrology, Albert Einstein College of Med-icine, Bronx, NY. Current addresses: 4Jackson Laboratories, Bar Harbor, ME;5Department of Pathology, NYU School of Medicine, New York, NY; 6Departmentof Molecular Biology and Biochemistry, Mount Sinai School of Medicine, NewYork, NY; 7Enzo Biochemical, Farmington, NY.
Received September 30, 2003; accepted December 3, 2003.Supported by National Institutes of Health grants R01 DK59321 (to M.D.D.),
R01 DK17609 (to D.A.S.), P30 DK41296 (to D.A.S.), P30 DK56496 (toD.A.S.), and U24 DK058768 (to E.P.B.).
P.M.P. and J.Z. contributed equally to this work.Address reprint requests to: Mariana D. Dabeva, Marion Bessin Liver Research
Center, Albert Einstein College of Medicine, 1300 Morris Park Avenue, Bronx, NY10461. E-mail: [email protected]; fax: 718-430-8975.
Copyright © 2004 by the American Association for the Study of Liver Diseases.Published online in Wiley InterScience (www.interscience.wiley.com).DOI 10.1002/hep.20088
617

We speculate that the number of potential stem cellsand their progeny is much higher in the fetal liver than inany of the models developed to date for expansion of ovalcells. Complementary DNA (cDNA) microarrays are apromising means of studying the gene expression patternof LS/PCs in fetal liver—as well as in different models ofliver progenitor cell activation and proliferation—be-cause this method possesses enormous capabilities foranalysis of RNA samples with a large number of cDNAclones printed on the arrays. Therefore, taking into ac-count the high homology between the mouse and ratgenomes, we used rat fetal liver as a source for LS/PCs andmouse cDNA microarrays for analysis of their gene ex-pression pattern to identify genes specifically expressed inthese cells. This analysis was similar to that reported byPlescia and colleagues,7 using a mouse epithelial cell linederived from the liver diverticulum at ED 9.5 that exhib-its the ability to differentiate along the hepatocytic lineagein culture in response to dimethylsulfoxide.8 Based on theexpression profile of LS/PC, we identified major clustersof up- and down-regulated genes during rat liver develop-ment and a group of genes that are differentially expressedin fetal hepatoblasts, which are considered to be LS/PC-specific.
Materials and Methods
Isolation of Fetal, Newborn, and Adult Liver Cells.Cell suspensions from rat fetal liver were prepared as re-ported previously.9 The cells were plated on gelatin-coated dishes at a density of 20 � 106 cells per 10-cmplate and epithelial cells were allowed to attach for 16hours, after which the hematopoietic cells, which do notattach, were removed by washing with phosphate-buff-ered saline (PBS).
Isolation of RNA. RNA was isolated from fetal livercells attached to gelatin coated dishes and from isolatedadult rat hepatocytes, using TRIzol Reagent (Invitrogen/BRL, Carlsbad, CA), precipitated several times with LiCl/ethanol and purified further using the RNeasy kit(Qiagene, Valencia, CA).
cDNA Microarrays. Mouse cDNA microarrays wereobtained from the Functional Genomics Facility, AlbertEinstein College of Medicine. Each chip contained 8976clones originally obtained from Incyte Cenomics(MGEM V1.0 sequence verified set). The array platformis deposited in Gene Expression Omnibus (GEO) datarepository and can be viewed or downloaded under acces-sion number GPL409.
Labeling of cDNAs, Hybridization, and Analysis ofMicroarrays. Target and reference RNAs were labeledwith Cy5 and Cy3, respectively, by synthesizing first-
strand cDNA using a standard protocol (http://microarray1k.aecom.yu.edu/). Prehybridization was car-ried out for 1 hour at 50° C in 35% formamide, 4 � salinesodium phosphate and EDTA (SSPE), 2.5 � Denhardt’s,0.5% sodium dodecyl sulfate (SDS), and 200 mg/mL ofsalmon sperm DNA. Hybridization was performed over-night at 50° C in hybridization solution as above, con-taining 1� blocking solution (poly-dT, tRNA, andmouse Cot1 DNA).
Following hybridization, the slides were washed con-secutively in 2 � SSC/0.1% SDS, 0.2 � saline sodiumcitrate (SSC)/0.1% SDS, and 0.2 � SSC. A custom-builtdual channel laser scanning microscope10 and the Scan-Alyze Version 2.44 software (M. Eisen, Stanford Univer-sity, Palo Alto, CA) were used to generate raw data filescontaining measurements of signal and background fluo-rescence emissions of Cy3 and Cy5, respectively, for eachspot. Normalization of data was performed based on the50th percentile median ratio of all arrays, using the Gene-Spring 4.0 package (Silcone Genetics, Redwood City,CA). Data filtering was based on expression flags (geneexpression presence or absence calls at single experimentaltime points and across the entire experimental set). A genewas considered expressed when the measured intensity ofthe spot signal channel reached a value greater than localspot background plus 2 standard deviations of the averagebackground calculated for the entire particular slide. Sig-nificant differential messenger RNA (mRNA) abundancewas established by Significance Analysis of Microarrayssoftware (Stanford University Statistics and BiochemistryLabs, Stanford, CA), “applying a 5% false discovery rate.”
Three biological repeats were performed for each ofnine experimental time points.
Quantitative Polymerase Chain Reaction. Quanti-tative real-time reverse-transcriptase polymerase chain re-action (RT-PCR) was performed using the ABI Prizm7900 Sequence Detection System (Applied Biosystems,Foster City, CA) in a two-step RT-PCR. All RNAs weretreated with DNAse (Roche Applied Science, Indianapo-lis, IN) and purified through an RNeasy column (Qia-gen). cDNA was synthesized with Superscript II reversetranscriptase (Invitrogen/BRL) as described above. Rat-specific sequences for PCR primers were designed to gen-erate amplicons of 50 to 100 base pairs required forquantitative real-time detection using SYBR Green Mas-ter Mix (Applied Biosystems). The mRNA abundanceswere determined by normalization of the data to the ex-pression levels of glyceraldehyde-3-phosphate dehydroge-nase mRNA.
Reverse Northern Blot Hybridization. Specificmouse cDNA clones of interest were propagated andplasmid DNA was purified using DNeasy (Qiagen).
618 PETKOV ET AL. HEPATOLOGY, March 2004

The plasmid DNAs were digested with EcoRI and 1 �gof DNA loaded on Zeta-Probe blotting membranesusing a Bio-Dot microfiltration apparatus (Bio-Rad,Hercules, CA). cDNAs were labeled with 32P-dCTP,using the RadPrime DNA labeling system (Invitrogen/BRL). The blots were hybridized at 63° C to the highspecific activity probes in QuikHyb (Stratagene, LaJolla, CA) and washed according to instructions fromthe manufacturer.
Results and Discussion
Fetal Liver Epithelial Progenitor CellsTo study the gene expression profile of fetal hepatoblasts,
we developed a procedure to eliminate blood cells from theisolated fetal liver cell suspension by plating them on gelatin-coated dishes overnight and washing out the blood cells (seeMaterials and Methods section above). Hepatoblasts com-
prised more than 90% of the cells attached to the dishes, asjudged by �-fetoprotein expression (Fig. 1). RNA was iso-lated 16 hours after plating the cells, at which time all genesexpressed in hepatoblasts during their isolation remained ac-tive (e.g., alpha-fetoprotein, albumin). Also, genes expressedat later embryonic days did not turn on during attachment(e.g., dipeptidyl-peptidase 4 [DPP4]; see Fig. 1). [We alsoperformed quantitative RT-PCR analysis for a dozen othergenes in the cells, selected from those listed in Table 3, at thetime of their isolation with that after plating for 16 hours ongelatin-coated dishes; no significant differences were found].
Use of Murine cDNA Microarrays to Study theGene Expression Profile of Fetal Rat LiverEpithelial Cells
To screen a large number of expressed genes and iden-tify new and differentially expressed genes in fetal hepa-
Fig. 1. Gene expression in hepatoblasts at the time of isolation. Hepatoblasts were isolated as described in Material and Methods and plated ongelatin coated dishes. During attachment, the cells aggregate, forming clusters. (A) Cytochemical detection of DPPIV is negative; hepatoblasts do notexpress DPPIV before ED 16. (B) All cells in this cluster are positive for �-GT. (C) Negative control (primary antibody omitted) for theimmunocytochemical reactions in D, E and F. (D) Albumin; (E) CK-19 and (F) AFP. Secondary antibodies are alkaline phosphatase conjugated. Vectorred (Vector Biolabs, Burlingame, CA) was used as a substrate. Original magnification in A–E: 400� and F: 200�.
HEPATOLOGY, Vol. 39, No. 3, 2004 PETKOV ET AL. 619
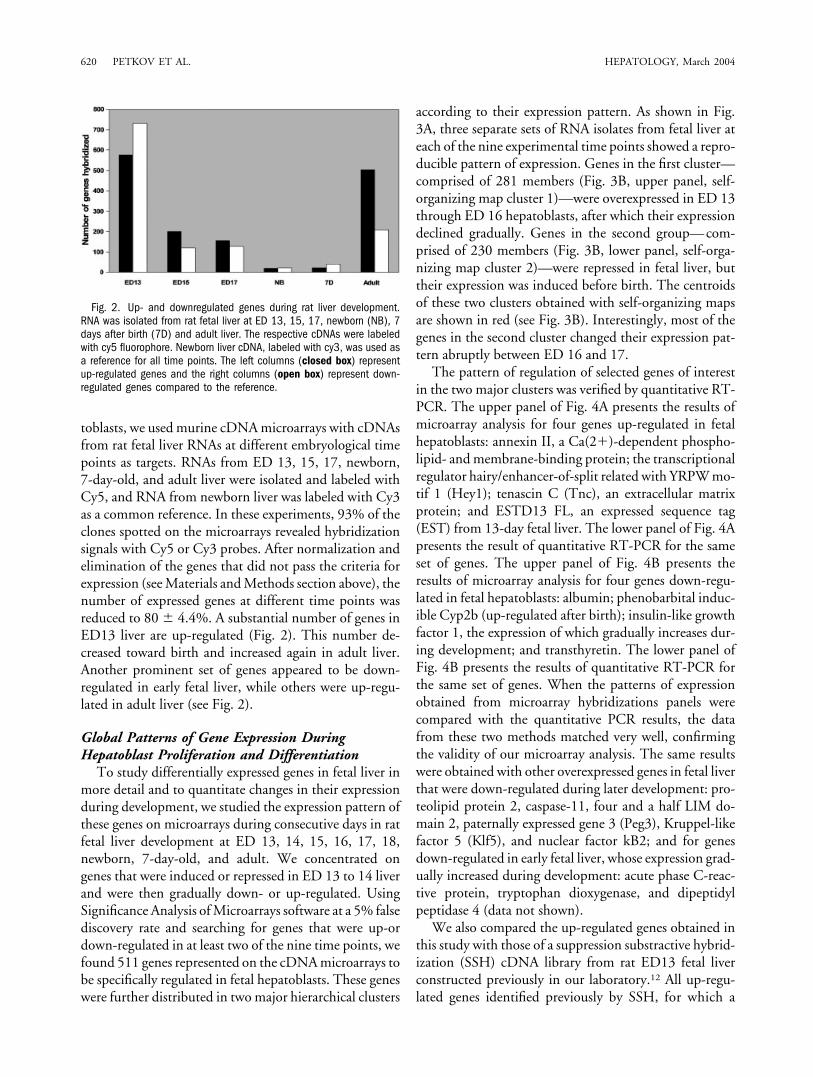
toblasts, we used murine cDNA microarrays with cDNAsfrom rat fetal liver RNAs at different embryological timepoints as targets. RNAs from ED 13, 15, 17, newborn,7-day-old, and adult liver were isolated and labeled withCy5, and RNA from newborn liver was labeled with Cy3as a common reference. In these experiments, 93% of theclones spotted on the microarrays revealed hybridizationsignals with Cy5 or Cy3 probes. After normalization andelimination of the genes that did not pass the criteria forexpression (see Materials and Methods section above), thenumber of expressed genes at different time points wasreduced to 80 � 4.4%. A substantial number of genes inED13 liver are up-regulated (Fig. 2). This number de-creased toward birth and increased again in adult liver.Another prominent set of genes appeared to be down-regulated in early fetal liver, while others were up-regu-lated in adult liver (see Fig. 2).
Global Patterns of Gene Expression DuringHepatoblast Proliferation and Differentiation
To study differentially expressed genes in fetal liver inmore detail and to quantitate changes in their expressionduring development, we studied the expression pattern ofthese genes on microarrays during consecutive days in ratfetal liver development at ED 13, 14, 15, 16, 17, 18,newborn, 7-day-old, and adult. We concentrated ongenes that were induced or repressed in ED 13 to 14 liverand were then gradually down- or up-regulated. UsingSignificance Analysis of Microarrays software at a 5% falsediscovery rate and searching for genes that were up-ordown-regulated in at least two of the nine time points, wefound 511 genes represented on the cDNA microarrays tobe specifically regulated in fetal hepatoblasts. These geneswere further distributed in two major hierarchical clusters
according to their expression pattern. As shown in Fig.3A, three separate sets of RNA isolates from fetal liver ateach of the nine experimental time points showed a repro-ducible pattern of expression. Genes in the first cluster—comprised of 281 members (Fig. 3B, upper panel, self-organizing map cluster 1)—were overexpressed in ED 13through ED 16 hepatoblasts, after which their expressiondeclined gradually. Genes in the second group—com-prised of 230 members (Fig. 3B, lower panel, self-orga-nizing map cluster 2)—were repressed in fetal liver, buttheir expression was induced before birth. The centroidsof these two clusters obtained with self-organizing mapsare shown in red (see Fig. 3B). Interestingly, most of thegenes in the second cluster changed their expression pat-tern abruptly between ED 16 and 17.
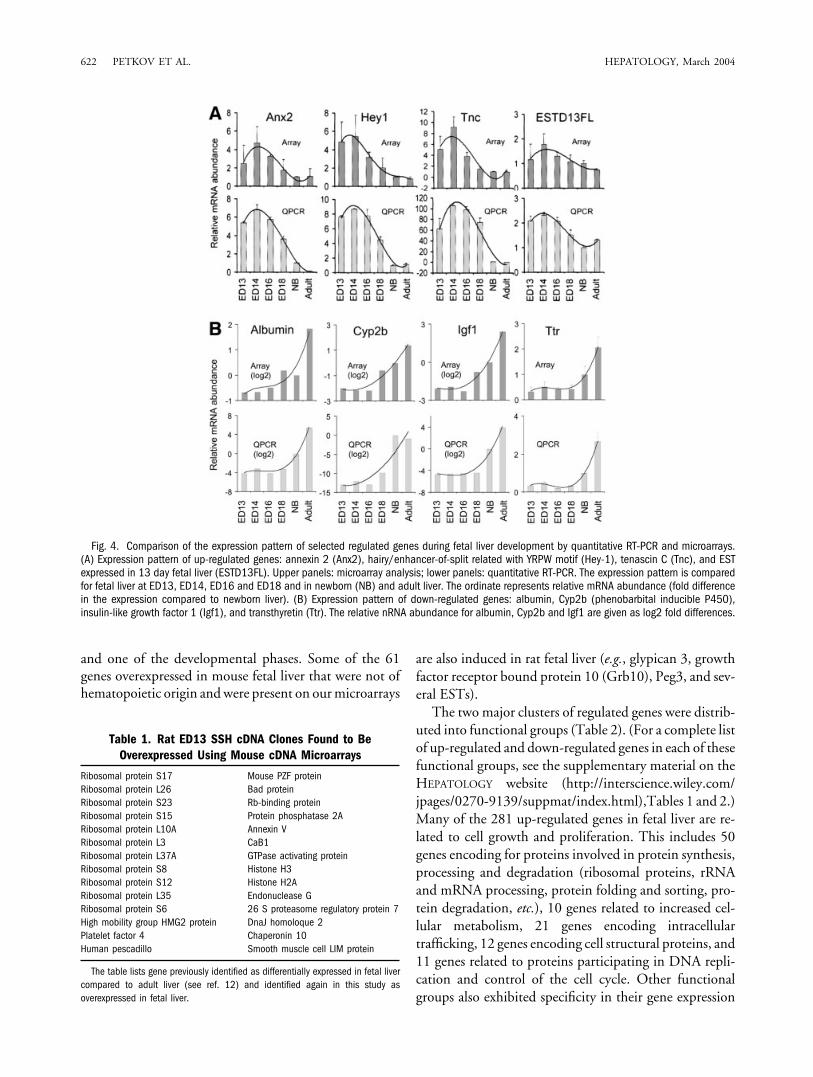
The pattern of regulation of selected genes of interestin the two major clusters was verified by quantitative RT-PCR. The upper panel of Fig. 4A presents the results ofmicroarray analysis for four genes up-regulated in fetalhepatoblasts: annexin II, a Ca(2�)-dependent phospho-lipid- and membrane-binding protein; the transcriptionalregulator hairy/enhancer-of-split related with YRPW mo-tif 1 (Hey1); tenascin C (Tnc), an extracellular matrixprotein; and ESTD13 FL, an expressed sequence tag(EST) from 13-day fetal liver. The lower panel of Fig. 4Apresents the result of quantitative RT-PCR for the sameset of genes. The upper panel of Fig. 4B presents theresults of microarray analysis for four genes down-regu-lated in fetal hepatoblasts: albumin; phenobarbital induc-ible Cyp2b (up-regulated after birth); insulin-like growthfactor 1, the expression of which gradually increases dur-ing development; and transthyretin. The lower panel ofFig. 4B presents the results of quantitative RT-PCR forthe same set of genes. When the patterns of expressionobtained from microarray hybridizations panels werecompared with the quantitative PCR results, the datafrom these two methods matched very well, confirmingthe validity of our microarray analysis. The same resultswere obtained with other overexpressed genes in fetal liverthat were down-regulated during later development: pro-teolipid protein 2, caspase-11, four and a half LIM do-main 2, paternally expressed gene 3 (Peg3), Kruppel-likefactor 5 (Klf5), and nuclear factor kB2; and for genesdown-regulated in early fetal liver, whose expression grad-ually increased during development: acute phase C-reac-tive protein, tryptophan dioxygenase, and dipeptidylpeptidase 4 (data not shown).
We also compared the up-regulated genes obtained inthis study with those of a suppression substractive hybrid-ization (SSH) cDNA library from rat ED13 fetal liverconstructed previously in our laboratory.12 All up-regu-lated genes identified previously by SSH, for which a
Fig. 2. Up- and downregulated genes during rat liver development.RNA was isolated from rat fetal liver at ED 13, 15, 17, newborn (NB), 7days after birth (7D) and adult liver. The respective cDNAs were labeledwith cy5 fluorophore. Newborn liver cDNA, labeled with cy3, was used asa reference for all time points. The left columns (closed box) representup-regulated genes and the right columns (open box) represent down-regulated genes compared to the reference.
620 PETKOV ET AL. HEPATOLOGY, March 2004

clone was present on the microchips, again showedhigher expression on cDNA microarrays (Table 1).
Using cDNA microarray analysis, Kelley-Loughnaneand colleagues13 studied the expression pattern of 8,636
clones in ED 14.5 fetal mouse liver, 14-day postnatalliver, and 6 and 24 hours following partial hepatectomyand identified genes specific for each growth phase andgenes showing dual overexpression during regeneration
Fig. 3. Clustering analysis of 511 genes regulated during fetal rat liver development. Rat liver gene expression profiles were determined at 9 timepoints (ED 13, 14, 15, 16, 17, 18, newborn rat liver, 7 days after birth and adult). 511 genes were identified as significantly regulated. (A)Hierarchical clustering of the 511 genes identifies two major patterns of regulation, up- and downregulation shown in red and green, respectively.Reproducibility of three replicates of this timed analysis (N1, N2, N3) is clearly discernible. (B) The 511 genes were distributed into two groups byself-organizing map (SOM) analysis, revealing characteristic profiles of the two distinct patterns of regulation (red line: centroid). SD of the averageexpression in each cluster (grey line).
HEPATOLOGY, Vol. 39, No. 3, 2004 PETKOV ET AL. 621
and one of the developmental phases. Some of the 61genes overexpressed in mouse fetal liver that were not ofhematopoietic origin and were present on our microarrays
are also induced in rat fetal liver (e.g., glypican 3, growthfactor receptor bound protein 10 (Grb10), Peg3, and sev-eral ESTs).
The two major clusters of regulated genes were distrib-uted into functional groups (Table 2). (For a complete listof up-regulated and down-regulated genes in each of thesefunctional groups, see the supplementary material on theHEPATOLOGY website (http://interscience.wiley.com/jpages/0270-9139/suppmat/index.html),Tables 1 and 2.)Many of the 281 up-regulated genes in fetal liver are re-lated to cell growth and proliferation. This includes 50genes encoding for proteins involved in protein synthesis,processing and degradation (ribosomal proteins, rRNAand mRNA processing, protein folding and sorting, pro-tein degradation, etc.), 10 genes related to increased cel-lular metabolism, 21 genes encoding intracellulartrafficking, 12 genes encoding cell structural proteins, and11 genes related to proteins participating in DNA repli-cation and control of the cell cycle. Other functionalgroups also exhibited specificity in their gene expression
Fig. 4. Comparison of the expression pattern of selected regulated genes during fetal liver development by quantitative RT-PCR and microarrays.(A) Expression pattern of up-regulated genes: annexin 2 (Anx2), hairy/enhancer-of-split related with YRPW motif (Hey-1), tenascin C (Tnc), and ESTexpressed in 13 day fetal liver (ESTD13FL). Upper panels: microarray analysis; lower panels: quantitative RT-PCR. The expression pattern is comparedfor fetal liver at ED13, ED14, ED16 and ED18 and in newborn (NB) and adult liver. The ordinate represents relative mRNA abundance (fold differencein the expression compared to newborn liver). (B) Expression pattern of down-regulated genes: albumin, Cyp2b (phenobarbital inducible P450),insulin-like growth factor 1 (Igf1), and transthyretin (Ttr). The relative nRNA abundance for albumin, Cyp2b and Igf1 are given as log2 fold differences.
Table 1. Rat ED13 SSH cDNA Clones Found to BeOverexpressed Using Mouse cDNA Microarrays
Ribosomal protein S17 Mouse PZF proteinRibosomal protein L26 Bad proteinRibosomal protein S23 Rb-binding proteinRibosomal protein S15 Protein phosphatase 2ARibosomal protein L10A Annexin VRibosomal protein L3 CaB1Ribosomal protein L37A GTPase activating proteinRibosomal protein S8 Histone H3Ribosomal protein S12 Histone H2ARibosomal protein L35 Endonuclease GRibosomal protein S6 26 S proteasome regulatory protein 7High mobility group HMG2 protein DnaJ homoloque 2Platelet factor 4 Chaperonin 10Human pescadillo Smooth muscle cell LIM protein
The table lists gene previously identified as differentially expressed in fetal livercompared to adult liver (see ref. 12) and identified again in this study asoverexpressed in fetal liver.
622 PETKOV ET AL. HEPATOLOGY, March 2004
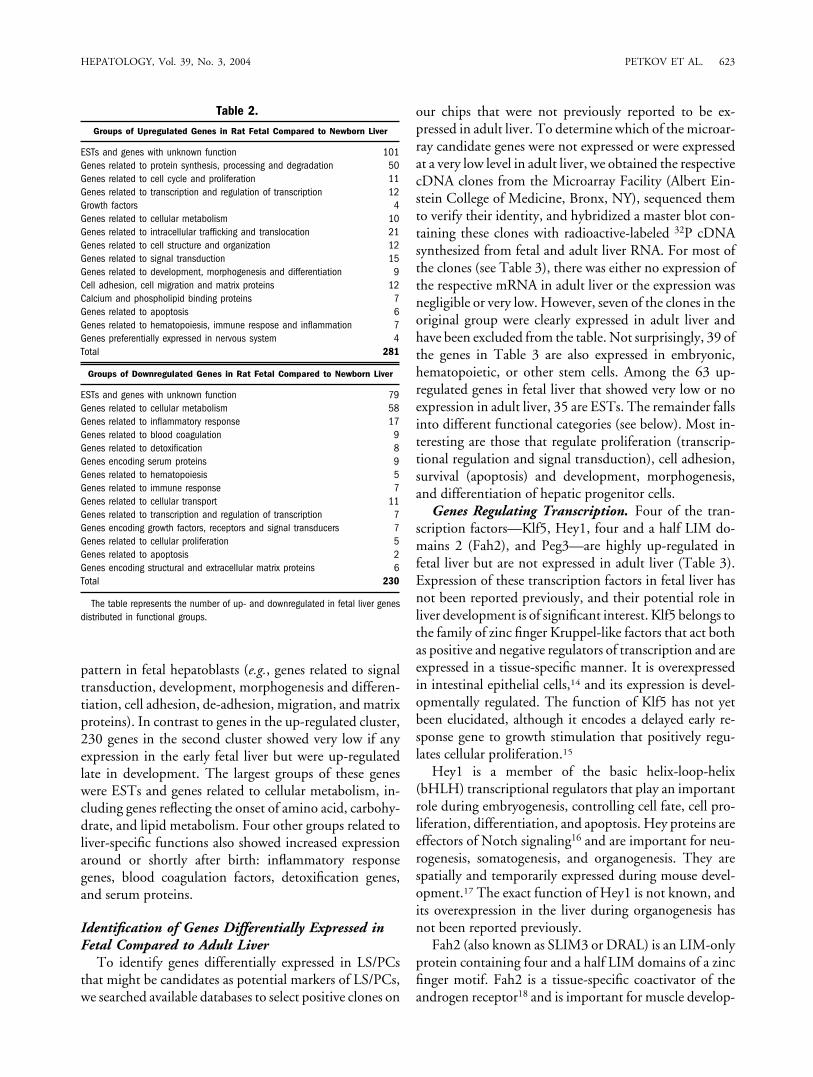
pattern in fetal hepatoblasts (e.g., genes related to signaltransduction, development, morphogenesis and differen-tiation, cell adhesion, de-adhesion, migration, and matrixproteins). In contrast to genes in the up-regulated cluster,230 genes in the second cluster showed very low if anyexpression in the early fetal liver but were up-regulatedlate in development. The largest groups of these geneswere ESTs and genes related to cellular metabolism, in-cluding genes reflecting the onset of amino acid, carbohy-drate, and lipid metabolism. Four other groups related toliver-specific functions also showed increased expressionaround or shortly after birth: inflammatory responsegenes, blood coagulation factors, detoxification genes,and serum proteins.
Identification of Genes Differentially Expressed inFetal Compared to Adult Liver
To identify genes differentially expressed in LS/PCsthat might be candidates as potential markers of LS/PCs,we searched available databases to select positive clones on
our chips that were not previously reported to be ex-pressed in adult liver. To determine which of the microar-ray candidate genes were not expressed or were expressedat a very low level in adult liver, we obtained the respectivecDNA clones from the Microarray Facility (Albert Ein-stein College of Medicine, Bronx, NY), sequenced themto verify their identity, and hybridized a master blot con-taining these clones with radioactive-labeled 32P cDNAsynthesized from fetal and adult liver RNA. For most ofthe clones (see Table 3), there was either no expression ofthe respective mRNA in adult liver or the expression wasnegligible or very low. However, seven of the clones in theoriginal group were clearly expressed in adult liver andhave been excluded from the table. Not surprisingly, 39 ofthe genes in Table 3 are also expressed in embryonic,hematopoietic, or other stem cells. Among the 63 up-regulated genes in fetal liver that showed very low or noexpression in adult liver, 35 are ESTs. The remainder fallsinto different functional categories (see below). Most in-teresting are those that regulate proliferation (transcrip-tional regulation and signal transduction), cell adhesion,survival (apoptosis) and development, morphogenesis,and differentiation of hepatic progenitor cells.
Genes Regulating Transcription. Four of the tran-scription factors—Klf5, Hey1, four and a half LIM do-mains 2 (Fah2), and Peg3—are highly up-regulated infetal liver but are not expressed in adult liver (Table 3).Expression of these transcription factors in fetal liver hasnot been reported previously, and their potential role inliver development is of significant interest. Klf5 belongs tothe family of zinc finger Kruppel-like factors that act bothas positive and negative regulators of transcription and areexpressed in a tissue-specific manner. It is overexpressedin intestinal epithelial cells,14 and its expression is devel-opmentally regulated. The function of Klf5 has not yetbeen elucidated, although it encodes a delayed early re-sponse gene to growth stimulation that positively regu-lates cellular proliferation.15
Hey1 is a member of the basic helix-loop-helix(bHLH) transcriptional regulators that play an importantrole during embryogenesis, controlling cell fate, cell pro-liferation, differentiation, and apoptosis. Hey proteins areeffectors of Notch signaling16 and are important for neu-rogenesis, somatogenesis, and organogenesis. They arespatially and temporarily expressed during mouse devel-opment.17 The exact function of Hey1 is not known, andits overexpression in the liver during organogenesis hasnot been reported previously.
Fah2 (also known as SLIM3 or DRAL) is an LIM-onlyprotein containing four and a half LIM domains of a zincfinger motif. Fah2 is a tissue-specific coactivator of theandrogen receptor18 and is important for muscle develop-
Table 2.
Groups of Upregulated Genes in Rat Fetal Compared to Newborn Liver
ESTs and genes with unknown function 101Genes related to protein synthesis, processing and degradation 50Genes related to cell cycle and proliferation 11Genes related to transcription and regulation of transcription 12Growth factors 4Genes related to cellular metabolism 10Genes related to intracellular trafficking and translocation 21Genes related to cell structure and organization 12Genes related to signal transduction 15Genes related to development, morphogenesis and differentiation 9Cell adhesion, cell migration and matrix proteins 12Calcium and phospholipid binding proteins 7Genes related to apoptosis 6Genes related to hematopoiesis, immune respose and inflammation 7Genes preferentially expressed in nervous system 4Total 281
Groups of Downregulated Genes in Rat Fetal Compared to Newborn Liver
ESTs and genes with unknown function 79Genes related to cellular metabolism 58Genes related to inflammatory response 17Genes related to blood coagulation 9Genes related to detoxification 8Genes encoding serum proteins 9Genes related to hematopoiesis 5Genes related to immune response 7Genes related to cellular transport 11Genes related to transcription and regulation of transcription 7Genes encoding growth factors, receptors and signal transducers 7Genes related to cellular proliferation 5Genes related to apoptosis 2Genes encoding structural and extracellular matrix proteins 6Total 230
The table represents the number of up- and downregulated in fetal liver genesdistributed in functional groups.
HEPATOLOGY, Vol. 39, No. 3, 2004 PETKOV ET AL. 623
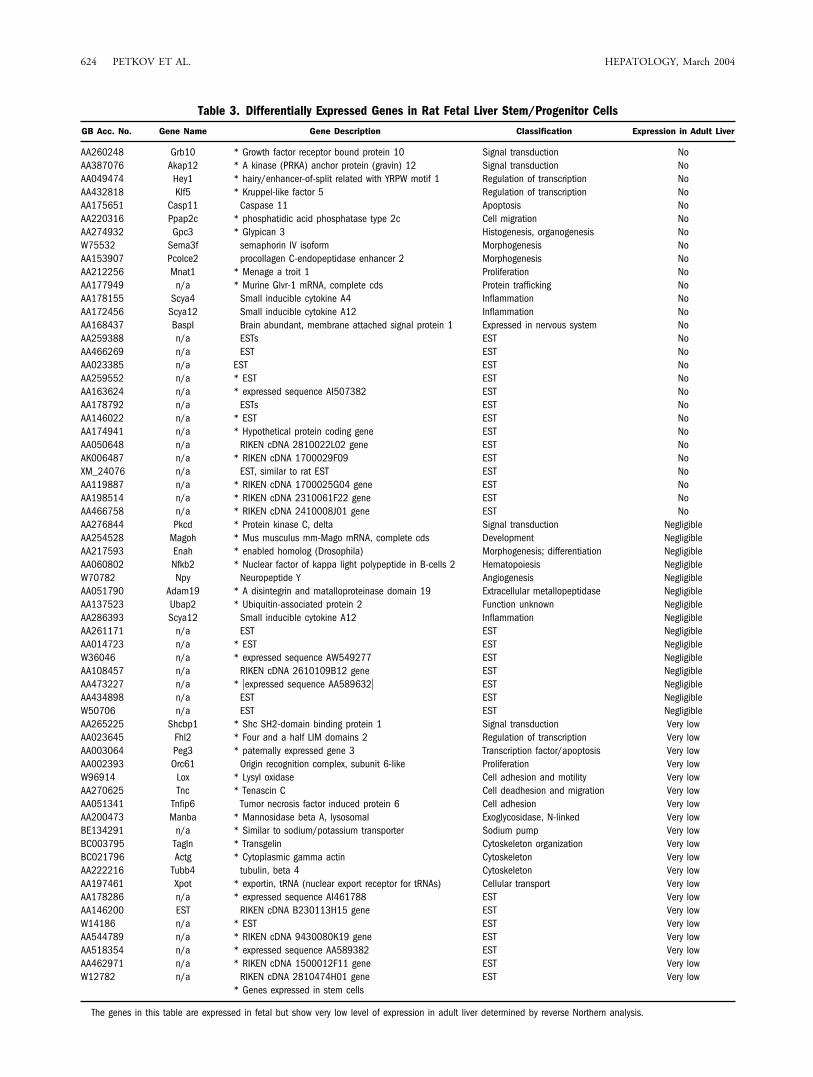
Table 3. Differentially Expressed Genes in Rat Fetal Liver Stem/Progenitor Cells
GB Acc. No. Gene Name Gene Description Classification Expression in Adult Liver
AA260248 Grb10 * Growth factor receptor bound protein 10 Signal transduction NoAA387076 Akap12 * A kinase (PRKA) anchor protein (gravin) 12 Signal transduction NoAA049474 Hey1 * hairy/enhancer-of-split related with YRPW motif 1 Regulation of transcription NoAA432818 Klf5 * Kruppel-like factor 5 Regulation of transcription NoAA175651 Casp11 Caspase 11 Apoptosis NoAA220316 Ppap2c * phosphatidic acid phosphatase type 2c Cell migration NoAA274932 Gpc3 * Glypican 3 Histogenesis, organogenesis NoW75532 Sema3f semaphorin IV isoform Morphogenesis NoAA153907 Pcolce2 procollagen C-endopeptidase enhancer 2 Morphogenesis NoAA212256 Mnat1 * Menage a troit 1 Proliferation NoAA177949 n/a * Murine Glvr-1 mRNA, complete cds Protein trafficking NoAA178155 Scya4 Small inducible cytokine A4 Inflammation NoAA172456 Scya12 Small inducible cytokine A12 Inflammation NoAA168437 BaspI Brain abundant, membrane attached signal protein 1 Expressed in nervous system NoAA259388 n/a ESTs EST NoAA466269 n/a EST EST NoAA023385 n/a EST EST NoAA259552 n/a * EST EST NoAA163624 n/a * expressed sequence AI507382 EST NoAA178792 n/a ESTs EST NoAA146022 n/a * EST EST NoAA174941 n/a * Hypothetical protein coding gene EST NoAA050648 n/a RIKEN cDNA 2810022L02 gene EST NoAK006487 n/a * RIKEN cDNA 1700029F09 EST NoXM_24076 n/a EST, similar to rat EST EST NoAA119887 n/a * RIKEN cDNA 1700025G04 gene EST NoAA198514 n/a * RIKEN cDNA 2310061F22 gene EST NoAA466758 n/a * RIKEN cDNA 2410008J01 gene EST NoAA276844 Pkcd * Protein kinase C, delta Signal transduction NegligibleAA254528 Magoh * Mus musculus mm-Mago mRNA, complete cds Development NegligibleAA217593 Enah * enabled homolog (Drosophila) Morphogenesis; differentiation NegligibleAA060802 Nfkb2 * Nuclear factor of kappa light polypeptide in B-cells 2 Hematopoiesis NegligibleW70782 Npy Neuropeptide Y Angiogenesis NegligibleAA051790 Adam19 * A disintegrin and matalloproteinase domain 19 Extracellular metallopeptidase NegligibleAA137523 Ubap2 * Ubiquitin-associated protein 2 Function unknown NegligibleAA286393 Scya12 Small inducible cytokine A12 Inflammation NegligibleAA261171 n/a EST EST NegligibleAA014723 n/a * EST EST NegligibleW36046 n/a * expressed sequence AW549277 EST NegligibleAA108457 n/a RIKEN cDNA 2610109B12 gene EST NegligibleAA473227 n/a * �expressed sequence AA589632� EST NegligibleAA434898 n/a EST EST NegligibleW50706 n/a EST EST NegligibleAA265225 Shcbp1 * Shc SH2-domain binding protein 1 Signal transduction Very lowAA023645 Fhl2 * Four and a half LIM domains 2 Regulation of transcription Very lowAA003064 Peg3 * paternally expressed gene 3 Transcription factor/apoptosis Very lowAA002393 Orc61 Origin recognition complex, subunit 6-like Proliferation Very lowW96914 Lox * Lysyl oxidase Cell adhesion and motility Very lowAA270625 Tnc * Tenascin C Cell deadhesion and migration Very lowAA051341 Tnfip6 Tumor necrosis factor induced protein 6 Cell adhesion Very lowAA200473 Manba * Mannosidase beta A, lysosomal Exoglycosidase, N-linked Very lowBE134291 n/a * Similar to sodium/potassium transporter Sodium pump Very lowBC003795 Tagln * Transgelin Cytoskeleton organization Very lowBC021796 Actg * Cytoplasmic gamma actin Cytoskeleton Very lowAA222216 Tubb4 tubulin, beta 4 Cytoskeleton Very lowAA197461 Xpot * exportin, tRNA (nuclear export receptor for tRNAs) Cellular transport Very lowAA178286 n/a * expressed sequence AI461788 EST Very lowAA146200 EST RIKEN cDNA B230113H15 gene EST Very lowW14186 n/a * EST EST Very lowAA544789 n/a * RIKEN cDNA 9430080K19 gene EST Very lowAA518354 n/a * expressed sequence AA589382 EST Very lowAA462971 n/a * RIKEN cDNA 1500012F11 gene EST Very lowW12782 n/a RIKEN cDNA 2810474H01 gene EST Very low
* Genes expressed in stem cells
The genes in this table are expressed in fetal but show very low level of expression in adult liver determined by reverse Northern analysis.
624 PETKOV ET AL. HEPATOLOGY, March 2004

ment and myoblast differentiation.19 No function hasbeen assigned for this transcriptional regulator in the liver.We found that Fah2 is expressed at a low level in adultliver and is overexpressed in fetal liver (see Table 3).
Genes Related to Signal Transduction. Several sig-nal transducers not present in adult liver are also up-reg-ulated in fetal liver (see Table 3). Grb10 is highlyexpressed in fetal liver but not in adult liver, and, inter-estingly, is not induced in regenerating rat liver.20 It con-tains a proline-rich N-terminal motif, a central pleckstrinhomology domain and a C-terminal Src homology region2, and SH2 domain, through which it binds autophos-phorylated growth factor receptors upon their activation.Grb10 binds activated insulin receptor, platelet-derivedgrowth factor and epidermal growth factor receptors, andinsulin-like growth factor 1 and 2 receptors and functionspossibly by inhibiting signaling downstream of the recep-tors, sequestering the signaling kinases.21–23 Protein ki-nase C, delta, is the major isoform expressed inhematopoietic cells and is overexpressed in tumors. It isinduced by diacylglycerol and in response to mitogenicand inflammatory stimuli and is implicated in regulationof cell growth/cell cycle progression and apoptosis.24 Akinase anchor protein 12, a kinase scaffold protein notexpressed in adult liver, is also known as testis specificgene A12 or gravin.25 A kinase anchor protein 12 anchorskey signal mediators tethering protein kinase A to its sub-strates.26 Neuropeptide Y is a neurotransmitter and neu-rohormone expressed in the central and peripheralnervous system during development and adulthood.27 Itsoverexpression in fetal liver is intriguing, considering itsrole in promoting proliferation of olfactory neuronal pre-cursor cells through the extracellular signal-regulated ki-nase.28
Genes Related to Cell Adhesion/De-adhesion andMigration. During rapid cell proliferation and organo-genesis, hepatoblasts maintain a dynamic relationshipwith extracellular proteins, and the extracellular matrixhas to be degraded and rebuilt. Most of the genes in thisgroup (Table 3) are enzymes that participate in matrixsynthesis and degradation. Some are not expressed inadult liver, like lysyl oxidase, an extracellular copperdeaminase crosslinking collagen and elastin, and lysoso-mal mannosidase beta A, which is involved in the degra-dation of extracellular N-linked oligosaccharide moietiesof glycoproteins. The “matricellular” protein Tnc, whichis highly expressed during development, cell injury, andoncogenesis, deserves special attention. It is suggested thatby stimulating reorganization of actin stress fibers anddisassembly of focal adhesion complexes, Tnc regulatesthe ability of cells to migrate and differentiate.29 Its highinduction in fetal liver suggests that it has an important
function in liver development; its de-adhesive propertiesmay support proliferation, protect against apoptosis, andmaintain cellular differentiation.
Genes Related to Apoptosis. Liver organogenesis re-quires growth and proliferation of some cells and removalof others by programmed cell death. However, only alimited number of genes related to apoptosis were presenton our chips. mRNAs for tumor necrosis factor (TNF) orTNF-receptor complex proteins were not overexpressed,and it does not seem likely that TNF-induced pro-grammed cell death is active in fetal liver cells. The im-printed Peg3, Peg3/Pw1 (see Table 3), is a multidomainand multifunctional protein and a putative zinc fingerKruppel-type transcription factor involved in the TNF/NF-�B signal transduction pathway.30 Recently, it wasdetermined that Peg3 is a cell death mediator in p53-mediated apoptosis, inducing Bax translocation from thecytosol to mitochondria.31,32 Peg3 is expressed in adultbrain and muscle and in many embryonal tissues; how-ever, its expression in liver was not reported previously.33
As this gene conveys both survival and death signals, itmay play a multifunctional role in fetal liver. Althoughthe function of Peg3 in fetal liver cells was not previouslyreported, it likely functions as a mediator of p53-depen-dent apoptosis.
Caspase-11 is highly induced in fetal liver (Table 3). Itis not constitutively expressed in most tissues but can beinduced in macrophages, lymphocytes, and hepatocytesby pro-inflammatory signals (e.g., lipopolysaccharidesand interferon-�).34 Caspase-11 appears to play a dualrole as an activator of caspase-1, which in turn activatesthe production of pro-inflammatory cytokines interleu-kin-1 and interleukin-1835 and as an activator ofcaspase-3, which in turn triggers apoptosis.36 It is possiblethat caspase-11, which is not expressed in adult liver, is aninitiator of apoptosis in fetal liver.
Genes Related to Development, Morphogenesis,and Differentiation. As expected, many of the genes inthis group (see Table 3) are expressed at very low levels orare not expressed in adult liver, although the function ofmost of these genes remains unknown. Procollagen C-proteinase enhancer is a tenfold enhancer of procollagenCOOH-terminal-proteinase, processing type I collagenand bone morphogenic protein 1, and is suggested to havea pleiotropic effect on tissue morphogenesis and remod-eling.37 Glypican-3 is a cell surface–linked heparin sulfateproteoglycan involved in organogenesis and cell signaling.Glypican-3–deficient mice exhibit developmental over-growth and abnormalities typical of the Simpson-Golabi-Behmel syndrome.38,39 This X-linked proteoglycan isexpressed predominantly in tissues of mesodermal origin,controlling the cellular responses to Bmp440, but its ex-
HEPATOLOGY, Vol. 39, No. 3, 2004 PETKOV ET AL. 625
pression in the developing mouse liver and lung has alsobeen reported.38,39 Adam19, a disintegrin and metallo-proteinase domain 19 (meltrin beta), is a cell surface gly-coprotein functioning in fertilization, heart development,neurogenesis, and protein ectodomain shedding.41,42 Ca-thepsin L is a major excreted protein that is highly ex-pressed in transformed cell lines with strongcollagenolytic and elastinolytic activity and plays a role inepidermal morphogenesis and differentiation.43 Mago-nashi proliferation-associated homolog of Drosophila is aprotein required for normal germ plasm assembly. It is aubiquitously expressed, serum-inducible protein with noclear function.44,45 Sema 3f—Sema domain, immuno-globulin domain, short basic domain, secreted (sema-phorin) 3F—is a member of a semaphoring familyinvolved in signaling through its respective receptor neu-rophilin and guiding axons and neuronal cell migration inthe central nervous system.46 Its function in fetal liver isunknown.
ConclusionsThe gene expression pattern of isolated fetal liver epi-
thelial progenitor cells has been studied during their dif-ferentiation in vivo at ED 13, 14, 15, 16, 17, 18,newborn, 7 days after birth, and adult. The cluster ofup-regulated genes comprised 281 clones showing highexpression in fetal liver that gradually declined towardbirth. The cluster of the down-regulated genes comprised230 members. The expression of the latter increased dra-matically between ED 16 and 17, marking an abruptswitch in the gene expression program during the transi-tion from an undifferentiated to a differentiated state offetal hepatoblasts. In addition, we have identified a groupof fetal liver progenitor cell–specific genes, 39 of whichare found to be expressed in cells of “stem origin.” Someof these differentially expressed genes could be of greatimportance because they may reveal the existence ofnovel, specific pathways of molecular signaling and regu-lation of growth, proliferation, survival, and differentia-tion in fetal hepatoblasts. These genes can also beconsidered as putative markers for identification of tissue-specific stem/progenitor cells in the adult liver.
Acknowledgment: The authors thank Ethel Hurstonfor technical assistance and Emily Bobe for typing themanuscript.
References1. Alison MR, Golding MH, Sarraf CE. Pluripotent liver stem cells: faculta-
tive stem cells located in the biliary tree. Cell Prolif 1996;29:373–402.2. Grisham JW, Thorgeirsson SS. Liver stem cells. In: Potten CS, ed. Stem
Cells. New York: Academic Press Ltd., 1997:233–282.3. Fausto N, Campbell JS. The role of hepatocytes and oval cells in liver
regeneration and repopulation. Mech Dev 2003;120:117–130.
4. DuBois AM. The embryonic liver. In: Rouiller CH, ed. The Liver, Mor-phology, Biochemistry, Physiology. New York: Academic Press Ltd.,1963:1–39.
5. Houssaint E. Differentiation of mouse hepatic primordium. I. An analysisof tissue interactions in hepatocyte differentiation. Cell Differ 1980;9:269–279.
6. Zaret KS. Hepatocyte differentiation: from the endoderm and beyond.Curr Opin Genet Dev 2001;11:568–574.
7. Plescia CP, Rogler CE, Rogler LE. Genomic expression analysis implicatesWnt signaling pathway and extracellular matrix alterations in hepatic spec-ification and differentiation of murine hepatic stem cells. Differentiation2001;68:254–269.
8. Rogler LE. Selective bipotential differentiation of mouse embryonic hepa-toblasts in vitro. Am J Pathol 1997;159:591–602.
9. Dabeva MD, Petkov PM, Sandhu J, et al. Proliferation and differentiationof fetal liver epithelial progenitor cells after transplantation into adult ratliver. Am J Pathol 2000;156:2017–2031.
10. Cheung VG, Morley M, Aguilar F, Massimi A, Kucherlapati R, Childs G.Making and reading microarrays. Nat Genet 1999;21(Suppl 1):15–19.
11. Tusher VG, Tibshirani R, Chu G. Significance analysis of microarraysapplied to the ionizing radiation response. Proc Natl Acad Sci U S A2001;98:5116–5121.
12. Petkov PM, Kim K, Sandhu J, Shafritz DA, Dabeva MD. Identification ofdifferentially expressed genes in epithelial stem/progenitor cells of fetalliver. Genomics 2000;68:197–209.
13. Kelley-Loughnane N, Sabla GE, Ley-Ebert C, Aronow BJ, Bezerra JA.Independent and overlapping transcriptional activation during liver devel-opment and regeneration in mice. HEPATOLOGY 2002;35:525–534.
14. Conkright MD, Wani MA, Anderson KP, Lingrel JB. A gene encoding anintestinal-enriched member of the Kruppel-like factor family expressed inintestinal epithelial cells. Nucleic Acids Res 1999;27:1263–1270.
15. Sun R, Chen X, Yang VW. Intestinal-enriched Kruppel-like factor (Krup-pel-like factor 5) is a positive regulator of cellular proliferation. J Biol Chem2001;276:6897–6900.
16. Iso T, Kedes L, Hamamori Y. HES and HERP families: multiple effectorsof the Notch signaling pathway. J Cell Physiol 2003;194:237–255.
17. Steidl C, Leimeister C, Klamt B, Maier M, Nanda I, Dixon M, Clarke R,et al. Characterization of the human and mouse HEY1, HEY2, and HEYLgenes: cloning, mapping, and mutation screening of a new bHLH genefamily. Genomics 2000;66:195–203.
18. Muller JM, Isele U, Metzger E, Rempel A, Moser M, Pscherer A, Breyer T,et al. FHL2, a novel tissue-specific coactivator of the androgen receptor.EMBO J 2000;19:359–369.
19. Martin B, Schneider R, Janetzky S, Waibler Z, Pandur P, Kuhl M, BehrensJ, et al. The LIM-only protein FHL2 interacts with beta-catenin and pro-motes differentiation of mouse myoblasts. J Cell Biol 2002;159:113–122.
20. Gruppuso PA, Boylan JM, Vaslet CA. Identification of candidate growth-regulating genes that are overexpressed in late gestation fetal liver in the rat.Biochim Biophys Acta 2000;1494:242–247.
21. Ooi J, YajnikV, Immanuel D, Gordon M, Moskow JJ, Buchberg AM,Margolis B. The cloning of Grb10 reveals a new family of SH2 domainproteins. Oncogene 1995;10:1621–1630.
22. Liu F, Roth RA. Grb-IR: a SH2-domain-containing protein that binds tothe insulin receptor and inhibits its function. Proc Natl Acad Sci U S A1995;92:10287–10291.
23. Frantz J D, Giorgetti-Peraldi S, Ottinger EA, Shoelson SE. Human GRB-IR-beta/GRB10: splice variants of an insulin and growth factor receptor-binding protein with PH and SH2 domains. J Biol Chem 1997;272:2659–2667.
24. Brodie C, Blumberg PM. Regulation of cell apoptosis by protein kinase cdelta. Apoptosis 2003;8:19–27.
25. Nauert JB, Klauck TM, Langeberg LK, Scott JD. Gravin, an autoantigenrecognized by serum from myasthenia gravis patients, is a kinase scaffoldprotein. Curr Biol 1997;7:52–62.
26. Lin X, Gelman IH. Calmodulin and cyclin D anchoring sites on theSrc-suppressed C kinase substrate, SSeCKS. Biochem Biophys Res Com-mun 2002;290:1368–1375.
626 PETKOV ET AL. HEPATOLOGY, March 2004

27. Danger JM, Tonon MC, Jenks BG, Saint-Pierre S, Martel JC, Fasolo A,Breton B, et al. Neuropeptide Y: localization in the central nervous systemand neuroendocrine functions. Fundam Clin Pharmacol 1990;4:307–340.
28. Hansel DE, Eipper BA, Ronnett GV. Neuropeptide Y functions as a neu-roproliferative factor. Nature 2001;410:940–943.
29. Murphy-Ullrich JE. The de-adhesion activity of matricellular proteins: isintermediate cell adhesion an adaptive state? J Clin Invest 2001;107:785–790.
30. Relaix F, Wei XJ, Wu X, Sassoon DA. Peg3/Pw1 is an imprinted geneinvolved in the TNF-NFkappaB signal transduction pathway. Nat Genet1998;18:287–291.
31. Deng Y, Wu X. Peg3/Pw1 promotes p53-mediated apoptosis by inducingBax translocation from cytosol to mitochondria. Proc Natl Acad Sci U S A2000;97:12050–12055.
32. Johnson MD, Wu X, Aithmitti N, Morrison R. Peg3/Pw1 is a mediatorbetween p53 and Bax in DNA damage-induced neuronal death. J BiolChem 2002;277:23000–23007.
33. Relaix F, Weng X, Marazzi G, Yang E, Copeland N, Jenkins N, Spence SE,et al. Pw1, a novel zinc finger gene implicated in the myogenic and neuro-nal lineages. Dev Biol 1996;177:383–396.
34. Wang S, Miura M, Jung YK, Zhu H, Li E, Yuan J. Murine caspase-11, anICE-interacting protease, is essential for the activation of ICE. Cell 1998;92:501–509.
35. Schauvliege R, Vanrobaeys J, Schotte P, Beyaert R. Caspase-11 gene ex-pression in response to lipopolysaccharide and interferon-gamma requiresnuclear factor-kappa B and signal transducer and activator of transcription(STAT) 1. J Biol Chem 2002;277:41624–41630.
36. Kang SJ, Wang S, Hara H, Peterson EP, Namura S, Amin-Hanjani S,Huang Z, et al. Dual role of caspase-11 in mediating activation of caspase-1and caspase-3 under pathological conditions. J Cell Biol 2000;149:613–622.
37. Steiglitz BM, Keene DR, Greenspan DS. PCOLCE2 encodes a functionalprocollagen C-proteinase enhancer (PCPE2) that is a collagen-binding
protein differing in distribution of expression and post-translational mod-ification from the previously described PCPE1. J Biol Chem 2002;277:49820–49830.
38. Pellegrini M, Pilia G, Pantano S, Lucchini F, Uda M, Fumi M, Cao A, etal. Gpc3 expression correlates with the phenotype of the Simpson-Golabi-Behmel syndrome. Dev Dyn 1998;213:431–439.
39. Cano-Gauci DF, Song HH, Yang H, McKerlie C, Choo B, Shi W, PullanoR, et al. Glypican-3-deficient mice exhibit developmental overgrowth andsome of the abnormalities typical of Simpson-Golabi-Behmel syndrome.J Cell Biol 1999;146:255–264.
40. Paine-Saunders S, Viviano BL, Zupicich J, Skarnes WC, Saunders SA. DevBiol 2000;225:179–187.
41. Inoue D, Reid M, Lum L, Kratzschmar J, Weskamp G, Myung YM, BaronR, et al. Cloning and initial characterization of mouse meltrin beta andanalysis of the expression of four metalloprotease-disintegrins in bone cells.J Biol Chem 1998;273:4180–4187.
42. Kurohara K, Matsuda Y, Nagabukuro A, Tsuji A, Amagasa T, Fujisawa-Sehara A. Meltrin beta (ADAM19) gene: cloning, mapping, and analysis ofthe regulatory region. Biochem Biophys Res Commun 2000;270:522–527.
43. Troen BR, Gal S, Gottesman MM. Sequence and expression of the cDNAfor MEP (major excreted protein), a transformation-regulated secretedcathepsin. Biochem J 1987;246:731–735.
44. Newmark PA, Mohr SE, Gong L, Boswell RE. Mago nashi mediates theposterior follicle cell-to-oocyte signal to organize axis formation in Dro-sophila. Development 1997;124:3197–3207.
45. Zhao XF, Colaizzo-Anas T, Nowak NJ, Shows TB, Elliott RW, Aplan PD.The mammalian homologue of mago nashi encodes a serum-inducibleprotein. Genomics 1998;47:319–322.
46. Marin O, Yaron A, Bagri A, Tessier-Lavigne M, Rubenstein JL. Sorting ofstriatal and cortical interneurons regulated by semaphorin-neuropilin in-teractions. Science 2001;293:872–875.
HEPATOLOGY, Vol. 39, No. 3, 2004 PETKOV ET AL. 627