Role of adipokines and peroxisome proliferator-activated ...
Upload
independentCategory
view
1download
0
Gene Expression Analysis in Rats Treated with ExperimentalAcetyl-Coenzyme A Carboxylase Inhibitors SuggestsInteractions with the Peroxisome Proliferator-ActivatedReceptor � Pathway
Jeffrey F. Waring, Yi Yang, Christine H. Healan-Greenberg, Andrew L. Adler,Robert Dickinson, Teresa McNally, Xiaojun Wang, Moshe Weitzberg, Xiangdong Xu,Andrew Lisowski, Scott E. Warder, Yu Gui Gu, Bradley A. Zinker, Eric A. Blomme,and Heidi S. CampAbbott Laboratories, Abbott Park, Illinois
Received June 8, 2007; accepted November 15, 2007
ABSTRACTAcetyl CoA carboxylase (ACC) 2, which catalyzes the car-boxylation of acetyl-CoA to form malonyl-CoA, has beenidentified as a potential target for type 2 diabetes and obe-sity. Small-molecule inhibitors of ACC2 would be expectedto reduce de novo lipid synthesis and increase lipid oxida-tion. Treatment of ob/ob mice with compound A-908292 (S)({(S)-3-[2-(4-isopropoxy-phenoxy)-thiazol-5-yl]-1-methyl-prop-2-ynyl}-carbamic acid methyl ester), a small-moleculeinhibitor with an IC50 of 23 nM against ACC2, resulted in areduction of serum glucose and triglyceride levels. However,compound A-875400 (R) ({(R)-3-[2-(4-isopropoxy-phenoxy)-thiazol-5-yl]-1-methyl-prop-2-ynyl}-carbamic acid methylester), an inactive enantiomer of A-908292 (S) with approxi-mately 50-fold less activity against ACC2, also caused a similarreduction in glucose and triglycerides, suggesting that the glu-cose-lowering effects in ob/ob mice may be mediated by other
metabolic pathways independent of ACC2 inhibition. To char-acterize the pharmacological activity of these experimentalcompounds at a transcriptional level, rats were orally dosed for3 days with either A-908292 (S) or A-875400 (R), and geneexpression analysis was performed. Gene expression analysisof livers showed that treatment with A-908292 (S) or A-875400(R) resulted in gene expression profiles highly similar to knownperoxisome proliferator-activated receptor (PPAR)-� activa-tors. The results suggest that, in vivo, both A-908292 (S) andA-875400 (R) stimulated the PPAR-�-dependent signalingpathway. These results were further supported by both an invitro genomic evaluation using rat hepatocytes and immuno-histochemical evaluation using 70-kDa peroxisomal membraneprotein. Overall, the gene expression analysis suggests a plau-sible mechanism for the similar pharmacological findings withactive and inactive enantiomers of an ACC2 inhibitor.
The incidence of type 2 diabetes has dramatically in-creased over the past decade. This epidemic is largely attrib-uted to the proliferation of key risk factors, which include asedentary lifestyle, a high-fat diet, obesity, and the demo-graphic shift to a more aged population. There is ampleevidence that abdominal obesity and physical inactivity con-
tribute significantly to the development of type 2 diabetes(Turkoglu et al., 2003; Steyn et al., 2004). At the cellularlevel, an increase in ectopic fat storage in nonadipose tissuessuch as skeletal muscle, liver, and pancreas is a strong pre-dictor of the development of insulin resistance and type 2diabetes (Sinha et al., 2002; Hulver et al., 2003). In addition,deregulation of fatty acid metabolism also contributes to theoverall development of metabolic syndrome. Thus, targetingkey enzymes that are critically involved in lipid synthesis,lipid oxidation, and/or triglyceride synthesis pathways with
J.F.W. and Y.Y. contributed equally to this work.Article, publication date, and citation information can be found at
http://jpet.aspetjournals.org.doi:10.1124/jpet.107.126938.
ABBREVIATIONS: ACC, acetyl CoA carboxylase; A-908292, {(S)-3-[2-(4-isopropoxy-phenoxy)-thiazol-5-yl]-1-methyl-prop-2-ynyl}-carbamic acidmethyl ester; A-875400, {(R)-3-[2-(4-isopropoxy-phenoxy)-thiazol-5-yl]-1-methyl-prop-2-ynyl}-carbamic acid methyl ester; PPAR, peroxisomeproliferator-activated receptor; LC, liquid chromatography; MS, mass spectrometry; ANOVA, analysis of variance; IVT, In Vitro Technologies;HMGCS2, 3-hydroxy-3-methylglutaryl-CoA synthase; PMP70, 70-kDa peroxisomal membrane protein; A-859610, {3-[2-(4-isopropoxy-phenoxy)-thiazol-5-yl]-1-methyl-prop-2-ynyl}-carbamic acid methyl ester; GW7647, 2-(4-(2-(1-cyclohexanebutyl)-3-cyclohexylureido)ethyl)phenylthio)-2-methylpropionic acid.
0022-3565/08/3242-507–516$20.00THE JOURNAL OF PHARMACOLOGY AND EXPERIMENTAL THERAPEUTICS Vol. 324, No. 2Copyright © 2008 by The American Society for Pharmacology and Experimental Therapeutics 126938/3300851JPET 324:507–516, 2008 Printed in U.S.A.
507
at AbbV
ie on August 13, 2014
jpet.aspetjournals.orgD
ownloaded from

small-molecule inhibitors would probably cause a reductionof fat accumulation in nonadipose tissues, notably in liverand skeletal muscles, and would therefore improve insulinsensitivity and overall lipid profiles.
Acetyl CoA carboxylase (ACC) catalyzes the carboxylationof acetyl-CoA to form malonyl-CoA. Malonyl-CoA, in turn,can be used by fatty acid synthase for de novo lipogenesis andalso acts as a potent allosteric inhibitor of carnitine palmi-toyltransferase 1, a mitochondrial membrane protein thatshuttles long-chain fatty acyl CoAs into the mitochondriawhere they are oxidized (Ruderman and Prentki, 2004). Inrodents and in humans, there are two isoforms of ACC en-coded by distinct genes, but sharing overall 70% amino acididentity. ACC1, a 265-kDa cytosolic protein, is highly ex-pressed in lipogenic tissues, such as liver and adipose tissue,whereas the 280-kDa ACC2 protein is preferentially ex-pressed in oxidative tissues like skeletal muscle, heart, and,to some extent, liver (Abu-Elheiga et al., 1997; Mao et al.,2003). ACC2 has a unique N terminus domain comprised of114 amino acids that represent a putative transmembranedomain thought to be responsible for mitochondrial targeting(Abu-Elheiga et al., 2000). It has been shown that whole-bodyknockout of ACC2 in mice shows a favorable metabolic pro-file; the mice are resistant to high-fat diet-induced obesityand show decreased lipid content in both liver and adipose(Oh et al., 2005). The liver lipid content in the ACC2�/�
mouse was described in Abu-Elheiga et al. (2001).Small-molecule inhibitors of ACC2 have been synthesized
at Abbott Laboratories (Abbott Park, IL). These compoundshave been shown to lower malonyl-CoA in skeletal muscleand to a lesser extent in liver in Sprague-Dawley rats (Gu etal., 2006; Xu et al., 2007). A-859610 is a racemic mixture ofA-908292, the active (S) enantiomer (IC50 � 0.023 �M forhuman ACC2 and �30 �M for human ACC1) and A-875400,the less active (R) enantiomer (IC50 � 1.082 �M for humanACC2 and �30 �M for human ACC1). In a previous study, inob/ob mice, the racemate, A-859610, dosed at 30 mg/kg/day(b.i.d., p.o.) for 2 weeks was shown to lower serum glucose byapproximately 30% (data not shown). We were surprised tofind that in a 2-week repeat-dose study, both the active andinactive enantiomers of A-859610 showed a reduction in glu-cose and triglycerides to a similar extent, indicating a poten-tial off-target effect.
To better characterize the active and inactive enantiomersof A-859610, microarray analysis was performed on ratstreated with either A-908292 (S) or A-875400 (R). The resultssuggest that both compounds behave as activators of theperoxisome proliferator-activated receptor (PPAR)-� path-way in vivo, which is most probably the underlying mecha-nistic basis for glucose and triglyceride lowering in ob/obmice. These results are an example of how gene expressionprofiling can aid in determining the mechanistic action ofcertain pharmacological agents.
Materials and MethodsAnimals and Treatment. ob/ob mice (6–7 weeks of age; The
Jackson Laboratory, Bar Harbor, ME) were acclimated to the animalresearch facilities for 5 days. The ob/ob mice were obtained andtreated as in previous publications (Zinker et al., 2002; Waring et al.,2003). Mice were fed a standard diet of Lab Diet Rodent LaboratoryDiet 5105. The ob/ob mice were dosed with vehicle (n � 10),
A-875400 (R) (n � 9), or A-908292 (S) (n � 9) at 30 mg/kg/day (b.i.d.,p.o.) for 2 weeks. For the malonyl-CoA rat study, normal Sprague-Dawley rats (n � 6) were fasted for 4 h and then orally dosed with 10and 50 mg/kg of either A-908292 (S) or A-875400 (R), followed by oralgavage of high-carbohydrate-enriched meals.
For the gene expression analysis study, Sprague-Dawley rats [Crl:CD(SD)IGS BR] weighing between 201 and 221 g were obtained fromCharles River Laboratories, Inc. (Portage, MI). Rats were fed astandard diet of Lab Diet Rodent Laboratory Diet 5001 pellets (PMINutrition International, Inc., St. Louis, MO). Rats were dosed withvehicle (sterile H2O containing 1% Tween) (n � 3), A-875400 (R) (n �3) or A-908292 (S) (n � 3) at 30 or 100 mg/kg/day b.i.d. for a periodof 3 days. The dose volume for all treatment groups was 4 ml/kg/dose.All rats were fasted overnight after their last treatment and eutha-nized under CO2 anesthesia. In a separate study, Sprague-Dawleyrats [Crl:CD(SD)IGS BR] weighing between 201–221 g were ob-tained from Charles River Laboratories, Inc. Rats were fed a stan-dard diet of Lab Diet Rodent Laboratory Diet 5001 pellets (PMINutrition International, Inc.). Rats were dosed with vehicle (sterileH2O containing 1% Tween) (n � 3) or bezafibrate at 200 mg/kg/dayb.i.d. for a period of 3 days. The dose volume for all treatment groupswas 4 ml/kg/dose. All rats were fasted overnight after their lasttreatment and euthanized under CO2 anesthesia.
All tissues collected for gene expression analysis were immedi-ately flash frozen in liquid nitrogen and subsequently stored at�70°C. For histopathology evaluation, livers from rats were fixed in10% neutral buffered formalin. Blood samples drawn from the ani-mals at necropsy were used to measure serum concentrations oractivities of blood urea nitrogen, creatinine, alanine amino trans-ferase, aspartate amino transferase, gamma glutamyltransferase,alkaline phosphatase, cholesterol, triglycerides, bilirubin, glucose,total protein, albumin, and globulins using an Abbott Aeroset clinicalchemistry analyzer.
For the immunohistochemistry and electron microscopy study,rats were dosed once daily for 5 days with A-875400 (R) (100 mg/kg/day), bezafibrate (200 mg/kg/day), or vehicle [sterile H2O containing1% Tween for A-875400 (R), 0.2% hydroxypropyl methylcellulose forbezafibrate]. Immunohistochemistry samples from rats treated withA-908292 (S) were obtained from the 3-day study used for geneexpression analysis. Experiments were conducted in accordance withthe Guiding Principles in the Use of Animals in Toxicology (Societyof Toxicology, 2002) and approved by the local Institutional AnimalCare and Use Committee.
Malonyl-CoA and ACC2 Activity. Sprague-Dawley rats orob/ob mice were sacrificed; subsequently, liver and soleus musclewere immediately removed and snap frozen in liquid nitrogen. Thetissues were homogenized with a Polytron in the extraction solution(ice-cold 5% 5-sulfosalicylic acid containing 50 �M 1,4-dithioeryth-reitol) with the ratio 1:10 (w/v). The tissue homogenates were cen-trifuged at 14,000g for 15 min at 4°C. The clear supernatants werethen filtered through 0.22-�m pore size filtering discs before beinginjected into the LC/MS system for the detection of the short-chainacyl-CoAs. Assays for determination of human ACC1 and ACC2activity and LC/MS results for malonyl-CoA were as described pre-viously (Gao et al., 2007).
Gene Expression Analysis. Livers were collected from all ratsand flash frozen in liquid nitrogen and subsequently stored at�70°C. Frozen liver samples (approximately 100 mg of tissue persample) were immediately added to 2 ml of TRIzol reagent (Invitro-gen, Carlsbad, CA) and homogenized using a Polytron 300D homog-enizer (Brinkman Instruments, Westbury, NY). One milliliter of thetissue homogenate was transferred to a microfuge tube, and totalRNA was extracted via chloroform extraction followed by nucleic acidprecipitation with isopropanol. The pellet was washed with 75%ethanol and resuspended in molecular biology grade water. Nucleicacid concentration was determined by o.d. 260 nm (Smart-Spec;Bio-Rad Laboratories, Hercules, CA), and RNA integrity was evalu-
508 Waring et al.
ated using an Agilent bioanalyzer (model 2100; Agilent Technologies,Foster City, CA).
Microarray analysis was performed using the standard protocolprovided by Affymetrix Inc. (Santa Clara, CA) and as describedpreviously (Waring et al., 2001b). The microarray scanned image andintensity files (.cel files) were imported into Rosetta Resolver geneexpression analysis software, version 5.0 (Rosetta Inpharmatics, Se-attle, WA). Samples from all individual rats were hybridized to theAffymetrix RAE230A chip. Individual expression profiles fromtreated rats were compared with an in silico pool of expressionprofiles from the vehicle-treated rats. Genes were considered signif-icantly regulated if the p value assigned to the gene by Resolver wasless than or equal to 0.01. Data analysis was also conducted usingDrugMatrix version 3.10 (Iconix Pharmaceuticals, Mountain View,CA) (Ganter et al., 2005). The similarity of gene expression profilesof the test compound and reference compounds from the DrugMatrixdatabase was calculated as the Pearson’s correlation coefficientbased on the common genes shared by the Affymetrix RAE230A andCodelink RU1 (GE Healthcare, Piscataway, NJ). The affect on path-ways was calculated as the percentage of perturbation with a p valuedetermined by hypergeometric distribution.
To detect significant gene expression changes induced by theA-908292 (S) and A-875400 (R), the gene expression ratios from ratstreated at 100 mg/kg/day were analyzed by error-weighted one-wayANOVA with Benjamini and Hochberg multiple testing correctionusing the Rosetta Resolver system. Probes with a false discovery rateless than or equal to 0.01 were considered statistically significant.
In Vitro Studies. Primary rat hepatocytes were obtained asdescribed previously (Waring et al., 2001a). Rat hepatocytes wereplated at a density of 800,000 cells/ml with 10 ml of InVitroGroHepatocyte Medium (In Vitro Technologies, Baltimore, MD), on100-mm BD BioCoat Collagen I Cellware (Becton Dickinson, Bed-ford, MA), at 37°C and 5% CO2. Rat hepatocytes were treated for 24 hwith A-908292 (S) and A-875400 (R) at a concentration of 100 �M,which is the maximum feasible dose due to limited solubility. Thecells were treated with each compound in duplicate. Cells wereharvested for RNA using TRIzol reagent, and microarray analysiswas performed as described above.
The in vitro signature for PPAR-� agonism, which consists of 11genes, was configured by identifying genes consistently regulated byknown peroxisome proliferators in isolated rat hepatocytes. The sig-nature was created using linear discriminant analysis, as describedpreviously (Yang et al., 2006).
Cryopreserved plateable human hepatocytes were obtained fromIn Vitro Technologies (IVT; catalog number M/F00995-P). Hepato-cytes were thawed in a 37°C water bath, than decanted into InVitro-Gro CP Medium (IVT catalog number Z990003). Cell count andviability was determined by Trypan blue exclusion, and cells werediluted in CP medium to a concentration of 0.7 � 106 viable cells/ml.Cells were plated on 12- or 24-well collagen-coated plates, thenplaced in a 37°C, 5% CO2 incubator. After overnight incubation, CPmedium was aspirated off, cells were washed with phosphate-buff-ered saline, and InVitroGro HI Medium (IVT catalog numberZ990012) was added to the wells. Cells were incubated overnight inHI medium and then treated for 24 h with the compounds of interest.After RNA isolation, samples were assayed using the TaqMan EZRT-PCR kit (Applied Biosystems, Foster City, CA; part numberN808-0236). The probes for CYP4A11 are as follows: GGC GTC TCTGTG TAC AAA AGG AA, forward; TGA AGA AGC AGA GGG AGCAAA, reverse; and /56-FAM/TGG CAT TCA GAG CAC CCC ATGGA/3BHQ_1/, TaqMan. The probe sequences for 3-hydroxy-3-meth-ylglutaryl-CoA synthase (HMGCS2) are as follows: GCC TTT TCCCAG GTA CTT GGT, forward; CGC CGG GCA TAC TTT CG, re-verse; and /56-FAM/TGC TGC TCG TCC ACT CGC TCC AG/3BHQ_1/, TaqMan.
The PPAR-� reporter assay is comprised of three constructs: 1) areporter gene, pG5E1bluc, which comprises five gal4 DNA bindingsites fused upstream of the luciferase gene in the vector pGL2 basic
(Promega, Madison, WI) (Hsu et al., 1994); 2) a chimeric PPAR-�construct, pSV40/gal4 DBDneo. In this construct, the DNA bindingdomain of Gal4 is fused to the ligand-binding domain (amino acids167–468); and 3) the plasmid pCMVbgal as a normalization controlto ensure even transfection and cell growth throughout the plate(Lehmann et al., 1995). Plasmids were transfected by electroporationinto HepG2 cells at the following ratio: 9 �g of chimeric PPAR, 9 �gof reporter, and 1 �g of pCMVbgal. The final concentration of plas-mids used was optimized by varying the ratio of chimeric construct toreporter construct to determine the optimum window. Approxi-mately 24 h after electroporation, cells were treated with a knownPPAR-� reference compound GW7647 or with A-875400 (R) orA-908292 (S) at concentrations ranging from 0.003 to 30 �M. Aftercompound incubation for 48 h, cells were washed with PBS, andluciferase activity was performed using the Promega luciferase assay(Promega; catalog number E1500).
Histopathology and Immunohistochemistry Staining for70-kDa Peroxisomal Membrane Protein. For histopathologyevaluation, livers from rats were fixed in 10% neutral buffered for-malin, routinely processed, and embedded in paraffin. Paraffin sec-tions (5 �m) stained with hematoxylin were evaluated.
Histologic slides (5 �m) were also used to evaluate 70-kDa perox-isomal membrane protein (PMP70) expression by immunohisto-chemistry (Colton et al., 2004). In brief, paraffin sections (5-�m-thick) were progressively rehydrated with a series of xylene andalcohol. Antigen retrieval with citrate buffer was performed using arice cooker for 20 min. Immunohistochemistry staining was per-formed using the avidin-biotin complex technique for detection ofantibodies to PMP70. Sections were incubated with the primaryantibody PMP70 (PAI-650; Affinity Bioreagents, Golden, CO) atroom temperature for 1 h at a dilution of 1:500. Biotinylated second-ary antibody (goat anti-rabbit; Vector Laboratories, Burlingame, CA)was applied at room temperature for 30 min at a concentration of1:200. Sections were incubated with DAB Chromagen (Sigma-Al-drich, St. Louis, MO) for 1 min, which gave the optimal color devel-opment. Sections were then counterstained with hematoxylin for 2min and then coverslipped and evaluated.
Electron Microscopy. Specimens of liver collected for ultra-structural pathology were fixed by immersion in Karnovsky’s fixa-tive, pH 7.3. Specimens were postfixed in 1% osmium tetroxide in 0.1M Sorensen’s phosphate buffer, pH 7.3, dehydrated in graded etha-nol and propylene oxide, and embedded in Luft’s epoxy resin. Ultra-thin sections were cut, stained with 2% methanolic uranyl acetatefollowed by Reynolds’ lead citrate, and examined using a LEO 910transmission electron microscope.
Western Blotting. Rat liver sections were suspended in a 1:1mixture of T-PER (Pierce, Rockford, IL) and a lysis buffer, pH 7.5,consisting of HEPES (50 mM), Triton 100 (0.5%), NaCl (150 mM),EDTA (1 mM), and EGTA (1 mM), and supplemented with proteaseinhibitors (Roche, Indianapolis, IN). The tissue was homogenizedand rocked at 4°C for 20 min followed by centrifugation (20,000g).The supernatants were removed, and protein-normalized aliquotswere separated on a Novex 4–12% Bis-Tris SDS-polyacrylamide gelelectrophoresis according to the manufacturer’s protocol (Invitro-gen). The protein was transferred to polyvinylidene difluoride, fol-lowed by blocking with Odyssey blocking buffer (LI-COR Biosciences,Lincoln, NE). The blot was probed with a rabbit polyclonal PMP70antibody (Novus Biologicals Littleton, CO), followed by addition of ananti-rabbit secondary antibody labeled with an IR dye. The blot wasimaged and the bands quantified on the Odyssey Infrared ImagingSystem (LI-COR Biosciences).
ResultsAlkynyl Subseries of ACC2 Inhibitors. Chemical struc-
tures for A-908292 (S) and A-875400 (R) are shown in Fig.1A, along with their respective IC50s against hACC1 and
Activation of PPAR-� by ACC2 Inhibitors 509
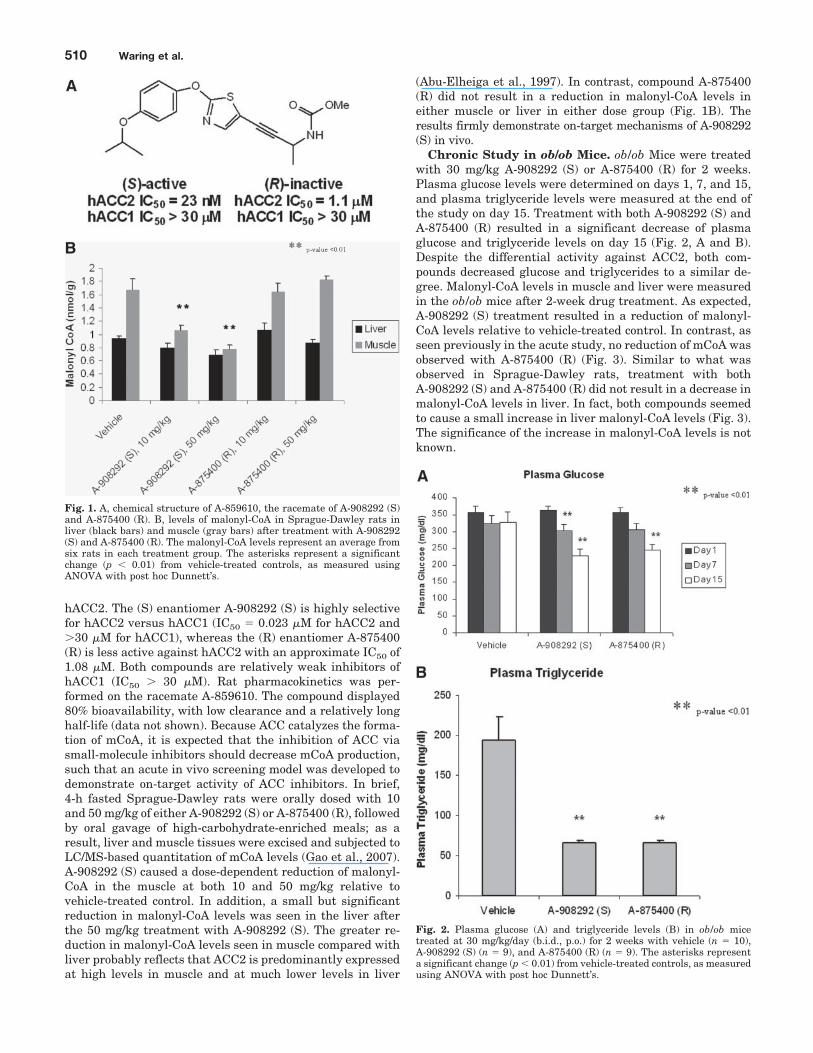
hACC2. The (S) enantiomer A-908292 (S) is highly selectivefor hACC2 versus hACC1 (IC50 � 0.023 �M for hACC2 and�30 �M for hACC1), whereas the (R) enantiomer A-875400(R) is less active against hACC2 with an approximate IC50 of1.08 �M. Both compounds are relatively weak inhibitors ofhACC1 (IC50 � 30 �M). Rat pharmacokinetics was per-formed on the racemate A-859610. The compound displayed80% bioavailability, with low clearance and a relatively longhalf-life (data not shown). Because ACC catalyzes the forma-tion of mCoA, it is expected that the inhibition of ACC viasmall-molecule inhibitors should decrease mCoA production,such that an acute in vivo screening model was developed todemonstrate on-target activity of ACC inhibitors. In brief,4-h fasted Sprague-Dawley rats were orally dosed with 10and 50 mg/kg of either A-908292 (S) or A-875400 (R), followedby oral gavage of high-carbohydrate-enriched meals; as aresult, liver and muscle tissues were excised and subjected toLC/MS-based quantitation of mCoA levels (Gao et al., 2007).A-908292 (S) caused a dose-dependent reduction of malonyl-CoA in the muscle at both 10 and 50 mg/kg relative tovehicle-treated control. In addition, a small but significantreduction in malonyl-CoA levels was seen in the liver afterthe 50 mg/kg treatment with A-908292 (S). The greater re-duction in malonyl-CoA levels seen in muscle compared withliver probably reflects that ACC2 is predominantly expressedat high levels in muscle and at much lower levels in liver
(Abu-Elheiga et al., 1997). In contrast, compound A-875400(R) did not result in a reduction in malonyl-CoA levels ineither muscle or liver in either dose group (Fig. 1B). Theresults firmly demonstrate on-target mechanisms of A-908292(S) in vivo.
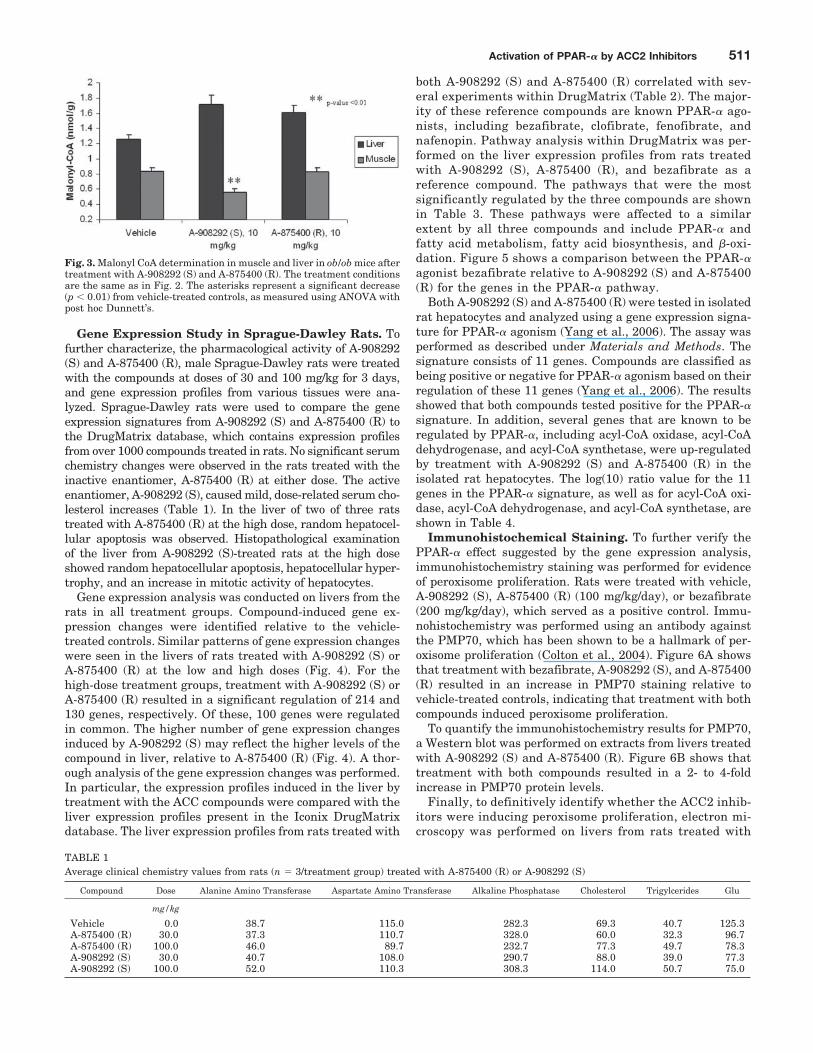
Chronic Study in ob/ob Mice. ob/ob Mice were treatedwith 30 mg/kg A-908292 (S) or A-875400 (R) for 2 weeks.Plasma glucose levels were determined on days 1, 7, and 15,and plasma triglyceride levels were measured at the end ofthe study on day 15. Treatment with both A-908292 (S) andA-875400 (R) resulted in a significant decrease of plasmaglucose and triglyceride levels on day 15 (Fig. 2, A and B).Despite the differential activity against ACC2, both com-pounds decreased glucose and triglycerides to a similar de-gree. Malonyl-CoA levels in muscle and liver were measuredin the ob/ob mice after 2-week drug treatment. As expected,A-908292 (S) treatment resulted in a reduction of malonyl-CoA levels relative to vehicle-treated control. In contrast, asseen previously in the acute study, no reduction of mCoA wasobserved with A-875400 (R) (Fig. 3). Similar to what wasobserved in Sprague-Dawley rats, treatment with bothA-908292 (S) and A-875400 (R) did not result in a decrease inmalonyl-CoA levels in liver. In fact, both compounds seemedto cause a small increase in liver malonyl-CoA levels (Fig. 3).The significance of the increase in malonyl-CoA levels is notknown.
Fig. 1. A, chemical structure of A-859610, the racemate of A-908292 (S)and A-875400 (R). B, levels of malonyl-CoA in Sprague-Dawley rats inliver (black bars) and muscle (gray bars) after treatment with A-908292(S) and A-875400 (R). The malonyl-CoA levels represent an average fromsix rats in each treatment group. The asterisks represent a significantchange (p � 0.01) from vehicle-treated controls, as measured usingANOVA with post hoc Dunnett’s.
Fig. 2. Plasma glucose (A) and triglyceride levels (B) in ob/ob micetreated at 30 mg/kg/day (b.i.d., p.o.) for 2 weeks with vehicle (n � 10),A-908292 (S) (n � 9), and A-875400 (R) (n � 9). The asterisks representa significant change (p � 0.01) from vehicle-treated controls, as measuredusing ANOVA with post hoc Dunnett’s.
510 Waring et al.
Gene Expression Study in Sprague-Dawley Rats. Tofurther characterize, the pharmacological activity of A-908292(S) and A-875400 (R), male Sprague-Dawley rats were treatedwith the compounds at doses of 30 and 100 mg/kg for 3 days,and gene expression profiles from various tissues were ana-lyzed. Sprague-Dawley rats were used to compare the geneexpression signatures from A-908292 (S) and A-875400 (R) tothe DrugMatrix database, which contains expression profilesfrom over 1000 compounds treated in rats. No significant serumchemistry changes were observed in the rats treated with theinactive enantiomer, A-875400 (R) at either dose. The activeenantiomer, A-908292 (S), caused mild, dose-related serum cho-lesterol increases (Table 1). In the liver of two of three ratstreated with A-875400 (R) at the high dose, random hepatocel-lular apoptosis was observed. Histopathological examinationof the liver from A-908292 (S)-treated rats at the high doseshowed random hepatocellular apoptosis, hepatocellular hyper-trophy, and an increase in mitotic activity of hepatocytes.
Gene expression analysis was conducted on livers from therats in all treatment groups. Compound-induced gene ex-pression changes were identified relative to the vehicle-treated controls. Similar patterns of gene expression changeswere seen in the livers of rats treated with A-908292 (S) orA-875400 (R) at the low and high doses (Fig. 4). For thehigh-dose treatment groups, treatment with A-908292 (S) orA-875400 (R) resulted in a significant regulation of 214 and130 genes, respectively. Of these, 100 genes were regulatedin common. The higher number of gene expression changesinduced by A-908292 (S) may reflect the higher levels of thecompound in liver, relative to A-875400 (R) (Fig. 4). A thor-ough analysis of the gene expression changes was performed.In particular, the expression profiles induced in the liver bytreatment with the ACC compounds were compared with theliver expression profiles present in the Iconix DrugMatrixdatabase. The liver expression profiles from rats treated with
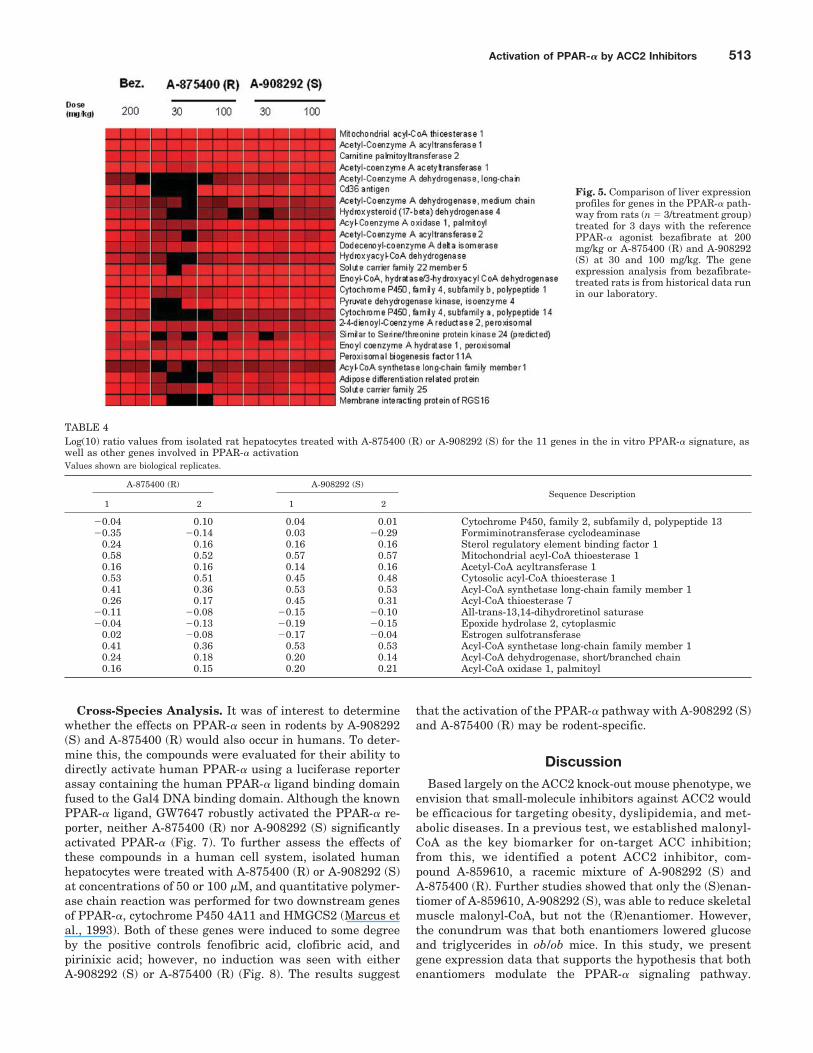
both A-908292 (S) and A-875400 (R) correlated with sev-eral experiments within DrugMatrix (Table 2). The major-ity of these reference compounds are known PPAR-� ago-nists, including bezafibrate, clofibrate, fenofibrate, andnafenopin. Pathway analysis within DrugMatrix was per-formed on the liver expression profiles from rats treatedwith A-908292 (S), A-875400 (R), and bezafibrate as areference compound. The pathways that were the mostsignificantly regulated by the three compounds are shownin Table 3. These pathways were affected to a similarextent by all three compounds and include PPAR-� andfatty acid metabolism, fatty acid biosynthesis, and �-oxi-dation. Figure 5 shows a comparison between the PPAR-�agonist bezafibrate relative to A-908292 (S) and A-875400(R) for the genes in the PPAR-� pathway.
Both A-908292 (S) and A-875400 (R) were tested in isolatedrat hepatocytes and analyzed using a gene expression signa-ture for PPAR-� agonism (Yang et al., 2006). The assay wasperformed as described under Materials and Methods. Thesignature consists of 11 genes. Compounds are classified asbeing positive or negative for PPAR-� agonism based on theirregulation of these 11 genes (Yang et al., 2006). The resultsshowed that both compounds tested positive for the PPAR-�signature. In addition, several genes that are known to beregulated by PPAR-�, including acyl-CoA oxidase, acyl-CoAdehydrogenase, and acyl-CoA synthetase, were up-regulatedby treatment with A-908292 (S) and A-875400 (R) in theisolated rat hepatocytes. The log(10) ratio value for the 11genes in the PPAR-� signature, as well as for acyl-CoA oxi-dase, acyl-CoA dehydrogenase, and acyl-CoA synthetase, areshown in Table 4.
Immunohistochemical Staining. To further verify thePPAR-� effect suggested by the gene expression analysis,immunohistochemistry staining was performed for evidenceof peroxisome proliferation. Rats were treated with vehicle,A-908292 (S), A-875400 (R) (100 mg/kg/day), or bezafibrate(200 mg/kg/day), which served as a positive control. Immu-nohistochemistry was performed using an antibody againstthe PMP70, which has been shown to be a hallmark of per-oxisome proliferation (Colton et al., 2004). Figure 6A showsthat treatment with bezafibrate, A-908292 (S), and A-875400(R) resulted in an increase in PMP70 staining relative tovehicle-treated controls, indicating that treatment with bothcompounds induced peroxisome proliferation.
To quantify the immunohistochemistry results for PMP70,a Western blot was performed on extracts from livers treatedwith A-908292 (S) and A-875400 (R). Figure 6B shows thattreatment with both compounds resulted in a 2- to 4-foldincrease in PMP70 protein levels.
Finally, to definitively identify whether the ACC2 inhib-itors were inducing peroxisome proliferation, electron mi-croscopy was performed on livers from rats treated with
Fig. 3. Malonyl CoA determination in muscle and liver in ob/ob mice aftertreatment with A-908292 (S) and A-875400 (R). The treatment conditionsare the same as in Fig. 2. The asterisks represent a significant decrease(p � 0.01) from vehicle-treated controls, as measured using ANOVA withpost hoc Dunnett’s.
TABLE 1Average clinical chemistry values from rats (n � 3/treatment group) treated with A-875400 (R) or A-908292 (S)
Compound Dose Alanine Amino Transferase Aspartate Amino Transferase Alkaline Phosphatase Cholesterol Trigylcerides Glu
mg/kg
Vehicle 0.0 38.7 115.0 282.3 69.3 40.7 125.3A-875400 (R) 30.0 37.3 110.7 328.0 60.0 32.3 96.7A-875400 (R) 100.0 46.0 89.7 232.7 77.3 49.7 78.3A-908292 (S) 30.0 40.7 108.0 290.7 88.0 39.0 77.3A-908292 (S) 100.0 52.0 110.3 308.3 114.0 50.7 75.0
Activation of PPAR-� by ACC2 Inhibitors 511

A-875400 (R) and A-908292 (S). Bezafibrate was includedas a positive control. Electron microscopy analysis con-firmed that all three compounds resulted in an increased
number of peroxisomes relative to vehicle-treated control.The results for bezafibrate and A-875400 (R) are shown inFig. 6C.
Fig. 4. Heat map showing gene expression changes in liver from Sprague-Dawley rats treated at 30 or 100 mg/kg for 3 days with A-908292 (S) andA-875400 (R). There were three rats per treatment group. Genes shown in red are up-regulated, whereas genes shown in green are down-regulatedrelative to vehicle-treated controls. Average liver drug levels (milligrams per gram) are shown for each animal. Genes shown were regulated 2-fold orgreater in at least two rats, with a p value of 0.01 or lower.
TABLE 2DrugMatrix Reference Compounds that induced gene expression changes in rat liver similar to those induced by A-908292 (S) and A-875400 (R)
Compound Therapeutic Class Compound Activity
Bezafibrate Hypolipidemic agent PPAR-� agonistFenofibrate Hypolipidemic agent PPAR-� agonistPirinixic Acid Hypolipidemic agent PPAR-� agonistClofibrate Hypolipidemic agent PPAR-� agonistNafenopin Hypolipidemic agent PPAR-� agonistRosiglitazone Antidiabetic agent PPAR-� agonistValproic Acid Antiepileptic Voltage-gated Na� channel blocker
TABLE 3Biological pathways significantly impacted by A-875400 (R), A-908292 (S), and bezafibrate in rat liver
Pathway Compound No. of Regulated Genesin Pathway
Total No. of Genesin Pathway Intersection p Value
%
PPAR-� and fatty acid metabolism A-875400 (R) 11 47 23.4 7.0E-6A-908292 (S) 12 47 25.5 1.0E-7Bezafibrate 16 47 34.0 6.2E-12
Bile acid and cholesterol metabolism A-875400 (R) 11 54 20.4 2.9E-5A-908292 (S) 14 54 25.9 7.3E-9Bezafibrate 15 54 27.8 7.5E-10
Regulation of fatty acid biosynthesis A-875400 (R) 10 58 17.2 2.8E-4A-908292 (S) 11 58 19.0 8.4E-6Bezafibrate 12 58 20.7 1.3E-6
Fatty acid biosynthesis A-875400 (R) 4 16 25.0 5.2E-3A-908292 (S) 6 16 37.5 1.5E-5Bezafibrate 6 16 37.5 1.5E-5
�-Oxidation of fatty acid A-875400 (R) 3 22 13.6 4.7E-2A-908292 (S) 4 22 18.2 8.3E-3Bezafibrate 3 22 13.6 4.7E-2
512 Waring et al.
Cross-Species Analysis. It was of interest to determinewhether the effects on PPAR-� seen in rodents by A-908292(S) and A-875400 (R) would also occur in humans. To deter-mine this, the compounds were evaluated for their ability todirectly activate human PPAR-� using a luciferase reporterassay containing the human PPAR-� ligand binding domainfused to the Gal4 DNA binding domain. Although the knownPPAR-� ligand, GW7647 robustly activated the PPAR-� re-porter, neither A-875400 (R) nor A-908292 (S) significantlyactivated PPAR-� (Fig. 7). To further assess the effects ofthese compounds in a human cell system, isolated humanhepatocytes were treated with A-875400 (R) or A-908292 (S)at concentrations of 50 or 100 �M, and quantitative polymer-ase chain reaction was performed for two downstream genesof PPAR-�, cytochrome P450 4A11 and HMGCS2 (Marcus etal., 1993). Both of these genes were induced to some degreeby the positive controls fenofibric acid, clofibric acid, andpirinixic acid; however, no induction was seen with eitherA-908292 (S) or A-875400 (R) (Fig. 8). The results suggest
that the activation of the PPAR-� pathway with A-908292 (S)and A-875400 (R) may be rodent-specific.
DiscussionBased largely on the ACC2 knock-out mouse phenotype, we
envision that small-molecule inhibitors against ACC2 wouldbe efficacious for targeting obesity, dyslipidemia, and met-abolic diseases. In a previous test, we established malonyl-CoA as the key biomarker for on-target ACC inhibition;from this, we identified a potent ACC2 inhibitor, com-pound A-859610, a racemic mixture of A-908292 (S) andA-875400 (R). Further studies showed that only the (S)enan-tiomer of A-859610, A-908292 (S), was able to reduce skeletalmuscle malonyl-CoA, but not the (R)enantiomer. However,the conundrum was that both enantiomers lowered glucoseand triglycerides in ob/ob mice. In this study, we presentgene expression data that supports the hypothesis that bothenantiomers modulate the PPAR-� signaling pathway.
Fig. 5. Comparison of liver expressionprofiles for genes in the PPAR-� path-way from rats (n � 3/treatment group)treated for 3 days with the referencePPAR-� agonist bezafibrate at 200mg/kg or A-875400 (R) and A-908292(S) at 30 and 100 mg/kg. The geneexpression analysis from bezafibrate-treated rats is from historical data runin our laboratory.
TABLE 4Log(10) ratio values from isolated rat hepatocytes treated with A-875400 (R) or A-908292 (S) for the 11 genes in the in vitro PPAR-� signature, aswell as other genes involved in PPAR-� activationValues shown are biological replicates.
A-875400 (R) A-908292 (S)Sequence Description
1 2 1 2
�0.04 0.10 0.04 0.01 Cytochrome P450, family 2, subfamily d, polypeptide 13�0.35 �0.14 0.03 �0.29 Formiminotransferase cyclodeaminase
0.24 0.16 0.16 0.16 Sterol regulatory element binding factor 10.58 0.52 0.57 0.57 Mitochondrial acyl-CoA thioesterase 10.16 0.16 0.14 0.16 Acetyl-CoA acyltransferase 10.53 0.51 0.45 0.48 Cytosolic acyl-CoA thioesterase 10.41 0.36 0.53 0.53 Acyl-CoA synthetase long-chain family member 10.26 0.17 0.45 0.31 Acyl-CoA thioesterase 7
�0.11 �0.08 �0.15 �0.10 All-trans-13,14-dihydroretinol saturase�0.04 �0.13 �0.19 �0.15 Epoxide hydrolase 2, cytoplasmic
0.02 �0.08 �0.17 �0.04 Estrogen sulfotransferase0.41 0.36 0.53 0.53 Acyl-CoA synthetase long-chain family member 10.24 0.18 0.20 0.14 Acyl-CoA dehydrogenase, short/branched chain0.16 0.15 0.20 0.21 Acyl-CoA oxidase 1, palmitoyl
Activation of PPAR-� by ACC2 Inhibitors 513

PPAR-� is a ligand-activated transcription factor belongingto the nuclear receptor superfamily and is known to be acti-vated by numerous compounds, such as the fibrate class ofdrugs used to treat hyperlipidemia or several industrialsplasticizers (Grundy and Vega, 1987). Compounds known toactivate PPAR-� are also referred to as peroxisome prolifera-tors because they cause peroxisome proliferation in rodents.Histopathologic evaluation further supported the findingthat A-908292 (S) and A-875400 (R) induced peroxisome pro-liferation in the rats. Livers from rats treated for 3 days withA-908292 (S) and A-875400 (R) showed increased mitoticactivity and minimal hepatocellular hypertrophy, histologi-cal findings previously reported in studies with rats treatedwith known PPAR-� activators (Baker et al., 2004). Resultsfrom Western blot and immunohistochemical staining dem-
Fig. 6. A, immunohistochemistry staining for PMP70 in liver for ratstreated for 3 or 5 days with vehicle, bezafibrate (200 mg/kg), A-908292 (S)(100 mg/kg), or A-875400 (R) (100 mg/kg). Magnification bars, 25 �m. B,Western blot showing protein levels of PMP70 in livers from rats treatedwith vehicle, A-875400 (R), A-908292 (S), or bezafibrate. The numbersbelow the band indicate PMP70 levels relative to the average of vehicle-treated controls. C, electron microscopy of livers from rats treated withA-875400 (R), bezafibrate, or vehicle. Magnification bars on plates A, C,and E, 10 �m. Bars on plates B, D, and F, 2 �m. Arrowheads, mitochon-dria; full arrows, peroxisomes. A and B, vehicle-treated control (TweenVehicle); C and D, A-875400 (R) (100 mg/kg); E and F, bezafibrate (200mg/kg).
Fig. 7. Activation of a human PPAR-� luciferase reporter construct withGW7647, A-875400 (R), or A-908292 (S) in HepG2 cells. HepG2 cells weretreated at concentrations ranging from 0.003 to 30 �M for A-875400 (R)or A-908292 (S). Cells were treated at concentrations ranging from 0.003to 30 nM for GW7647. The x-axis shows log10 levels of the treatmentcompound. Concentrations of GW7647 are in nanomolar, whereasA-908292 (S) and A-875400 (R) are in micromolar. The y-axis showsluciferase units standardized relative to the internal control, pCMVbgal.
Fig. 8. Real-time polymerase chain reaction analysis for the induction oftwo downstream genes of PPAR-�, cytochrome P450 4A11 (CYP4A11)and HMGCS2 in isolated human hepatocytes treated with vehicle, or thePPAR-� agonists fenofibric acid, clofibrate, and pirinix acid comparedwith A-875400 (R) or A-908292 (S). The graph shows the -fold change ofthe two genes resulting from compound treatment relative to vehicletreated controls. The results shown are the average from an n of 2 foreach treatment group. Error bars, S.D.
514 Waring et al.

onstrated that both A-908292 (S) and A-875400 (R) caused anincrease in the levels of PMP70, a marker for peroxisomeproliferation. Finally, electron microscopy, which allows for adefinitive determination of peroxisome proliferation, con-firmed that both A-908292 (S) and A-875400 (R) inducedperoxisome proliferation in treated rat liver (Cattley, 2002).
The possibility that A-908292 (S) and A-875400 (R) may beactivators of the PPAR-� pathway are consistent with thepharmacology results in ob/ob mice, which showed glucoseand triglyceride lowering observed with both the active andinactive enantiomers. Previous results have shown thatPPAR-� activators can improve glucose homeostasis andlower plasma triglyceride levels in mouse models for type IIdiabetes (Kim et al., 2003). Based on the present data, mostlikely the glucose and triglyceride lowering by the com-pounds are primarily mediated by PPAR-� activation. How-ever, it was interesting to note that there was no furtherlowering of glucose or triglyceride by the active A-908292 (S)compared with A-875400 (R). It is possible that ACC inhibi-tion and PPAR-� activation both converge onto a same met-abolic pathway.
The activation of the PPAR-� pathway by A-908292 (S) andA-875400 (R) could be a result of direct binding and activa-tion of PPAR-� by the compounds, or it could be throughsecondary mechanisms. Secondary mechanisms for activa-tion of PPAR-� have been previously proposed. For instance,Kaikaus et al. (1993) hypothesized that some peroxisomeproliferators act by inhibiting carnitine palmitoyltransferaseI, resulting in increased levels of long-chain dicarboxylic ac-ids, which serve as the inducers of PPAR-�. Other researchhas shown that changes in phosphorylation can result inPPAR-� activation or repression (Burns and Vanden Heuvel,2007). Whether A-908292 (S) and A-875400 (R) are direct orindirect activators of the PPAR-� pathway is unclear; how-ever, the activation does not seem to be solely mediated byACC2 inhibition because A-875400 (R) is a very weak ACC2inhibitor.
Treatment with A-908292 (S) results in an increased num-ber of liver gene expression changes relative to A-875400 (R).This could be due to the lower drug levels in the liver forA-875400 (R) (Fig. 4). However, some of these gene expres-sion changes may be related to inhibition of ACC2. We per-formed ANOVA to identify gene expression changes uniqueto A-908292 (S) relative to A-875400 (R). Approximately 75genes were identified that were significantly differentiallyregulated between the two compounds (data not shown).Many of these genes were expressed sequence tags or belongto the PPAR-� pathway, such as acetyl-CoA acetyltrans-ferase 1 and acetyl-CoA synthetase long-chain family mem-ber 3. Thus, a clear gene expression signature that mightcorrelate with ACC2 inhibition could not be identified.
Analysis of the compounds in vitro showed that both com-pounds activated the PPAR-� pathway in isolated rat hepa-tocytes but did not have the same effect in isolated humanhepatocytes or in a human PPAR-� reporter system. Theresults suggest that interaction with the PPAR-� pathway bythese compounds may be species-specific. These results arein keeping with previous studies, which have shown markedspecies differences in response to peroxisome proliferators(Cattley et al., 1998; Vanden Heuvel, 1999). Studies to un-derstand the underlying cause for the PPAR-� species spec-ificity have identified differences in the promoter regions of
human and rodent PPAR-� target genes and suggest thatadditional coregulators of PPAR-� in rodent and humanhepatocytes may contribute as well (Ammerschlaeger et al.,2004).
In summary, we have used gene expression analysis toidentify a possible mechanism to explain the glucose- andtriglyceride-lowering effects of active and inactive ACC2 in-hibitors. Other studies have shown that gene expressionanalysis can be an extremely useful tool for discerning thepharmacological or toxicological mechanisms of xenobioticagents (Waring et al., 2002; Wang, 2005; Maloney et al.,2007). By using gene expression analysis, we were able toconclude that the metabolic activity of A-908292 (S) andA-875400 (R) were probably mediated, at least partly,through PPAR-� and not solely by ACC2 inhibition. Furtherstudies using inhibitors of ACC2 without the PPAR-� activitywill help to elucidate the role of this target in metabolicdisease syndromes.
Acknowledgments
We thank Michael Liguori, Amy Ditewig, Gerard Gagne, MargeryStark, and Jane Fagerland for technical assistance.
ReferencesAbu-Elheiga L, Almarza-Ortega DB, Baldini A, and Wakil SJ (1997) Human acetyl-
CoA carboxylase 2: molecular cloning, characterization, chromosomal mapping,and evidence for two isoforms. J Biol Chem 272:10669–10677.
Abu-Elheiga L, Brinkley WR, Zhong L, Chirala SS, Woldegiorgis G, and Wakil SJ(2000) The subcellular localization of acetyl-CoA carboxylase 2. Proc Natl Acad SciU S A 97:1444–1449.
Abu-Elheiga L, Matzuk MM, Abo-Hashema KA, and Wakil SJ (2001) Continuousfatty acid oxidation and reduced fat storage in mice lacking acetyl-CoA carboxylase2. Science 291:2613–2616.
Ammerschlaeger M, Beigel J, Klein KU, and Mueller SO (2004) Characterization ofthe species-specificity of peroxisome proliferators in rat and human hepatocytes.Toxicol Sci 78:229–240.
Baker VA, Harries HM, Waring JF, Duggan CM, Ni HA, Jolly RA, Yoon LW, DeSouza AT, Schmid JE, Brown RH, et al. (2004) Clofibrate-induced gene expressionchanges in rat liver: a cross-laboratory analysis using membrane cDNA arrays.Environ Health Perspect 112:428–438.
Burns KA and Vanden Heuvel JP (2007) Modulation of PPAR activ0ity via phos-phorylation. Biochim Biophys Acta 1771:952–960.
Cattley RC (2002) Handbook of Toxicologic Pathology, Academic Press, New York.Cattley RC, DeLuca J, Elcombe C, Fenner-Crisp P, Lake BG, Marsman DS, Pastoor
TA, Popp JA, Robinson DE, Schwetz B, et al. (1998) Do peroxisome proliferatingcompounds pose a hepatocarcinogenic hazard to humans? Regul Toxicol Pharma-col 27:47–60.
Colton HM, Falls JG, Ni H, Kwanyuen P, Creech D, McNeil E, Casey WM, HamiltonG, and Cariello NF (2004) Visualization and quantitation of peroxisomes usingfluorescent nanocrystals: treatment of rats and monkeys with fibrates and detec-tion in the liver. Toxicol Sci 80:183–192.
Ganter B, Tugendreich S, Pearson CI, Ayanoglu E, Baumhueter S, Bostian KA,Brady L, Browne LJ, Calvin JT, Day GJ, et al. (2005) Development of a large-scalechemogenomics database to improve drug candidate selection and to understandmechanisms of chemical toxicity and action. J Biotechnol 119:219–244.
Gao L, Chiou W, Tang H, Cheng X, Camp HS, and Burns DJ (2007) Simultaneousquantification of malonyl-CoA and several other short-chain acyl-CoAs in animaltissues by ion-pairing reversed-phase HPLC/MS. J Chromatogr B Analyt TechnolBiomed Life Sci 853:303–313.
Grundy SM and Vega GL (1987) Fibric acids: effects on lipids and lipoproteinmetabolism. Am J Med 83:9–20.
Gu YG, Weitzberg M, Clark RF, Xu X, Li Q, Zhang T, Hansen TM, Liu G, Xin Z,Wang X, et al. (2006) Synthesis and structure-activity relationships of N-{3-[2-(4-alkoxyphenoxy)thiazol-5-yl]-1-methylprop-2-ynyl}carboxy derivatives as selectiveacetyl-CoA carboxylase 2 inhibitors. J Med Chem 49:3770–3773.
Hsu HL, Wadman I, and Baer R (1994) Formation of in vivo complexes between theTAL1 and E2A polypeptides of leukemic T cells. Proc Natl Acad Sci U S A91:3181–3185.
Hulver MW, Berggren JR, Cortright RN, Dudek RW, Thompson RP, Pories WJ,MacDonald KG, Cline GW, Shulman GI, Dohm GL, et al. (2003) Skeletal musclelipid metabolism with obesity. Am J Physiol Endocrinol Metab 284:E741–E747.
Kaikaus RM, Chan WK, Lysenko N, Ray R, Ortiz de Montellano PR, and Bass NM(1993) Induction of peroxisomal fatty acid beta-oxidation and liver fatty acid-binding protein by peroxisome proliferators: mediation via the cytochromeP-450IVA1 omega-hydroxylase pathway. J Biol Chem 268:9593–9603.
Kim H, Haluzik M, Asghar Z, Yau D, Joseph JW, Fernandez AM, Reitman ML,Yakar S, Stannard B, Heron-Milhavet L, et al. (2003) Peroxisome proliferator-activated receptor-� agonist treatment in a transgenic model of type 2 diabetesreverses the lipotoxic state and improves glucose homeostasis. Diabetes 52:1770–1778.
Activation of PPAR-� by ACC2 Inhibitors 515

Lehmann JM, Moore LB, Smith-Oliver TA, Wilkison WO, Willson TM, and KliewerSA (1995) An antidiabetic thiazolidinedione is a high affinity ligand for peroxisomeproliferator-activated receptor � (PPAR�). J Biol Chem 270:12953–12956.
Maloney A, Clarke PA, Naaby-Hansen S, Stein R, Koopman JO, Akpan A, Yang A,Zvelebil M, Cramer R, Stimson L, et al. (2007) Gene and protein expressionprofiling of human ovarian cancer cells treated with the heat shock protein 90inhibitor 17-allylamino-17-demethoxygeldanamycin. Cancer Res 67:3239–3253.
Mao J, Chirala SS, and Wakil SJ (2003) Human acetyl-CoA carboxylase 1 gene:presence of three promoters and heterogeneity at the 5�-untranslated mRNAregion. Proc Natl Acad Sci U S A 100:7515–7520.
Marcus SL, Miyata KS, Zhang B, Subramani S, Rachubinski RA, and Capone JP(1993) Diverse peroxisome proliferator-activated receptors bind to the peroxisomeproliferator-responsive elements of the rat hydratase/dehydrogenase and fattyacyl-CoA oxidase genes but differentially induce expression. Proc Natl Acad Sci US A 90:5723–5727.
Oh W, Abu-Elheiga L, Kordari P, Gu Z, Shaikenov T, Chirala SS, and Wakil SJ(2005) Glucose and fat metabolism in adipose tissue of acetyl-CoA carboxylase 2knockout mice. Proc Natl Acad Sci U S A 102:1384–1389.
Ruderman N and Prentki M (2004) AMP kinase and malonyl-CoA: targets fortherapy of the metabolic syndrome. Nat Rev Drug Discov 3:340–351.
Sinha R, Dufour S, Petersen KF, LeBon V, Enoksson S, Ma YZ, Savoye M, RothmanDL, Shulman GI, and Caprio S (2002) Assessment of skeletal muscle triglyceridecontent by 1H nuclear magnetic resonance spectroscopy in lean and obese adoles-cents: relationships to insulin sensitivity, total body fat, and central adiposity.Diabetes 51:1022–1027.
Steyn NP, Mann J, Bennett PH, Temple N, Zimmet P, Tuomilehto J, Lindstrom J,and Louheranta A (2004) Diet, nutrition and the prevention of type 2 diabetes.Public Health Nutr 7:147–165.
Turkoglu C, Duman BS, Gunay D, Cagatay P, Ozcan R, and Buyukdevrim AS (2003)Effect of abdominal obesity on insulin resistance and the components of themetabolic syndrome: evidence supporting obesity as the central feature. Obes Surg13:699–705.
Vanden Heuvel JP (1999) Peroxisome proliferator-activated receptors (PPARS) andcarcinogenesis. Toxicol Sci 47:1–8.
Wang Y (2005) Gene expression-driven diagnostics and pharmacogenomics in can-cer. Curr Opin Mol Ther 7:246–250.
Waring JF, Ciurlionis R, Clampit JE, Morgan S, Gum RJ, Jolly RA, Kroeger P, FrostL, Trevillyan J, Zinker BA, et al. (2003) PTP1B antisense-treated mice showregulation of genes involved in lipogenesis in liver and fat. Mol Cell Endocrinol203:155–168.
Waring JF, Ciurlionis R, Jolly RA, Heindel M, and Ulrich RG (2001a) Microarrayanalysis of hepatotoxins in vitro reveals a correlation between gene expressionprofiles and mechanisms of toxicity. Toxicol Lett 120:359–368.
Waring JF, Gum R, Morfitt D, Jolly RA, Ciurlionis R, Heindel M, Gallenberg L,Buratto B, and Ulrich RG (2002) Identifying toxic mechanisms using DNA mi-croarrays: evidence that an experimental inhibitor of cell adhesion molecule ex-pression signals through the aryl hydrocarbon nuclear receptor. Toxicology 181–182:537–550.
Waring JF, Jolly RA, Ciurlionis R, Lum PY, Praestgaard JT, Morfitt DC, Buratto B,Roberts C, Schadt E, and Ulrich RG (2001b) Clustering of hepatotoxins based onmechanism of toxicity using gene expression profiles. Toxicol Appl Pharmacol175:28–42.
Xu X, Weitzberg M, Keyes RF, Li Q, Wang R, Wang X, Zhang X, Frevert EU, CampHS, Beutel BA, et al. (2007) The synthesis and structure-activity relationshipstudies of selective acetyl-CoA carboxylase inhibitors containing 4-(thiazol-5-yl)but-3-yn-2-amino motif: polar region modifications. Bioorg Med Chem Lett 17:1803–1807.
Yang Y, Abel SJ, Ciurlionis R, and Waring JF (2006) Development of a toxicogenom-ics in vitro assay for the efficient characterization of compounds. Pharmacogenom-ics 7:177–186.
Zinker BA, Rondinone CM, Trevillyan JM, Gum RJ, Clampit JE, Waring JF, Xie N,Wilcox D, Jacobson P, Frost L, et al. (2002) PTP1B antisense oligonucleotidelowers PTP1B protein, normalizes blood glucose, and improves insulin sensitivityin diabetic mice. Proc Natl Acad Sci U S A 99:11357–11362.
Address correspondence to: Dr. Jeffrey F. Waring, Molecular and CellularToxicology, Abbott Laboratories, Building AP9A R463, 100 Abbott Park Road,Abbott Park, IL 60064-6125. E-mail: [email protected]
516 Waring et al.
Copyright © 2022 FDOKUMEN