Identification and Expression Analysis of Peroxisome Proliferator-Activated Receptors cDNA in a...
11
© 2008 Zoological Society of Japan ZOOLOGICAL SCIENCE 25: 492–502 (2008) Identification and Expression Analysis of Peroxisome Proliferator-Activated Receptors cDNA in a Reptile, the Leopard Gecko (Eublepharis macularius) Keisuke Kato, Yoshitaka Oka and Min Kyun Park * Department of Biological Sciences, Graduate School of Science, The University of Tokyo, 7-3-1 Hongo, Bunkyo, Tokyo 113-0033, Japan Despite the physiological and evolutionary significance of lipid metabolism in amniotes, the molec- ular mechanisms involved have been unclear in reptiles. To elucidate this, we investigated peroxi- some proliferators-activated receptors (PPARs) in the leopard gecko (Eublepharis macularius). PPARs belong to a nuclear hormone-receptor family mainly involved in lipid metabolism. Although PPARs have been widely studied in mammals, little information about them is yet available from reptiles. We identified in the leopard gecko partial cDNA sequences of PPARα and β, and full sequences of two isoforms of PPARγ. This is the first report of reptilian PPARγ mRNA isoforms. We also evaluated the organ distribution of expression of these genes by using RT-PCR and compet- itive PCR. The expression level of PPARα mRNA was highest in the large intestine, and moderate in the liver and kidney. The expression level of PPARβ mRNA was highest in the kidney and large intestine, and moderate in the liver. Similarly to the expression of human PPARγ isoforms, PPARγa was expressed ubiquitously, whereas the expression of PPARγb was restricted. The highest levels of their expression, however, were observed in the large intestine, rather than in the adipose tissue as in mammals. Taken together, these results showed that the profile of PPARβ mRNA expression in the leopard gecko is similar to that in mammals, and that those of PPAR α and γ are species specific. This may reflect adaptation to annual changes in lipid storage due to seasonal food avail- ability. Key words: lizard, reptile, PPAR INTRODUCTION Reptiles are ectothermic amniotes with lower a meta- bolic rate than endothermic amniotes such as mammals and birds (Brand et al., 1991). Due to their lower metabolic rate, reptiles are highly resistant to fasting and able to endure seasons of restricted food availability. Many studies focusing on the lipid metabolism of reptiles, especially squamates, revealed changes in lipid storage in relation to seasonal food availability, reproduction (Derickson, 1976), or tail regeneration (Shah et al., 1982). In addition, the reptilian molecular mechanism of lipid metabolism is expected to provide insight into the evolution of endothermy from ecto- thermy. The most distinctive difference between endother- mic and ectothermic amniotes is regulatory non-shivering thermogenesis (NST). Although the main organ of regulatory NST is different in mammals and birds, heat is thought to be produced by the uncoupling of oxidative phosphorylation by using the uncoupling protein (UCP), which utilizes free fatty acids in this process (Mozo et al., 2005). In mammals, it has also been shown that leptin injection stimulates the expression of UCP1 (Scarpace et al., 1997). Interestingly, increases in body temperature and resting metabolic rate was also reported in leptin-injected fence lizards (Sceloporus undulatus) (Niewiarowski et al., 2000). These results imply a relationship between UCP expression and lipid metabo- lism and its conservation among amniotes. As the first step to elucidate the molecular mechanism of lipid metabolism in reptiles, we investigated peroxisome proliferators-activated receptors (PPARs) in a squamate species, the leopard gecko (Eublepharis macularius), as a reptilian model. PPARs are a subfamily of the nuclear hormone receptor superfamily involved in a variety of fundamental biological processes, mainly related to lipid metabolism regulation, and include leptins and uncoupling proteins. Three isoforms of PPAR, α, β and γ, which are encoded by separate genes and show different tissue distribution patterns, have been identified (reviewed by Escher and Wahli, 2000). PPARα is mainly involved in the regulation of lipid oxi- dation. This receptor regulates the expression of the perox- isome proliferator responsive genes, including a number of genes implicated in peroxisomal oxidation pathway (Lee et al., 1995). Additionally, a role in controlling the inflammatory response has been suggested (Devchand et al., 1996). No specific functions have been definitely assigned to PPARβ, because of its ubiquitous organ expression. It is thought that this receptor is implicated in basic cellular func- * Corresponding author. Phone: +81-3-5841-4437; Fax : +81-3-5841-4439; E-mail : [email protected] doi:10.2108/zsj.25.492
-
Upload
independent -
Category
Documents
-
view
0 -
download
0
Transcript of Identification and Expression Analysis of Peroxisome Proliferator-Activated Receptors cDNA in a...

© 2008 Zoological Society of JapanZOOLOGICAL SCIENCE 25: 492–502 (2008)
Identification and Expression Analysis of Peroxisome Proliferator-Activated Receptors cDNA in a Reptile,
the Leopard Gecko (Eublepharis macularius)
Keisuke Kato, Yoshitaka Oka and Min Kyun Park*
Department of Biological Sciences, Graduate School of Science, The Universityof Tokyo, 7-3-1 Hongo, Bunkyo, Tokyo 113-0033, Japan
Despite the physiological and evolutionary significance of lipid metabolism in amniotes, the molec-ular mechanisms involved have been unclear in reptiles. To elucidate this, we investigated peroxi-some proliferators-activated receptors (PPARs) in the leopard gecko (Eublepharis macularius). PPARs belong to a nuclear hormone-receptor family mainly involved in lipid metabolism. Although PPARs have been widely studied in mammals, little information about them is yet available from reptiles. We identified in the leopard gecko partial cDNA sequences of PPARα and β, and full sequences of two isoforms of PPARγ. This is the first report of reptilian PPARγ mRNA isoforms. We also evaluated the organ distribution of expression of these genes by using RT-PCR and compet-itive PCR. The expression level of PPARα mRNA was highest in the large intestine, and moderate in the liver and kidney. The expression level of PPARβ mRNA was highest in the kidney and large intestine, and moderate in the liver. Similarly to the expression of human PPARγ isoforms, PPARγa was expressed ubiquitously, whereas the expression of PPARγb was restricted. The highest levels of their expression, however, were observed in the large intestine, rather than in the adipose tissue as in mammals. Taken together, these results showed that the profile of PPARβ mRNA expression in the leopard gecko is similar to that in mammals, and that those of PPAR α and γ are species specific. This may reflect adaptation to annual changes in lipid storage due to seasonal food avail-ability.
Key words: lizard, reptile, PPAR
INTRODUCTION
Reptiles are ectothermic amniotes with lower a meta-bolic rate than endothermic amniotes such as mammals and birds (Brand et al., 1991). Due to their lower metabolic rate, reptiles are highly resistant to fasting and able to endure seasons of restricted food availability. Many studies focusing on the lipid metabolism of reptiles, especially squamates, revealed changes in lipid storage in relation to seasonal food availability, reproduction (Derickson, 1976), or tail regeneration (Shah et al., 1982). In addition, the reptilian molecular mechanism of lipid metabolism is expected to provide insight into the evolution of endothermy from ecto-thermy. The most distinctive difference between endother-mic and ectothermic amniotes is regulatory non-shivering thermogenesis (NST). Although the main organ of regulatory NST is different in mammals and birds, heat is thought to be produced by the uncoupling of oxidative phosphorylation by using the uncoupling protein (UCP), which utilizes free fatty acids in this process (Mozo et al., 2005). In mammals, it has also been shown that leptin injection stimulates the expression of UCP1 (Scarpace et al., 1997). Interestingly,
increases in body temperature and resting metabolic rate was also reported in leptin-injected fence lizards (Sceloporus undulatus) (Niewiarowski et al., 2000). These results imply a relationship between UCP expression and lipid metabo-lism and its conservation among amniotes.
As the first step to elucidate the molecular mechanism of lipid metabolism in reptiles, we investigated peroxisome proliferators-activated receptors (PPARs) in a squamate species, the leopard gecko (Eublepharis macularius), as a reptilian model.
PPARs are a subfamily of the nuclear hormone receptor superfamily involved in a variety of fundamental biological processes, mainly related to lipid metabolism regulation, and include leptins and uncoupling proteins. Three isoforms of PPAR, α, β and γ, which are encoded by separate genes and show different tissue distribution patterns, have been identified (reviewed by Escher and Wahli, 2000).
PPARα is mainly involved in the regulation of lipid oxi-dation. This receptor regulates the expression of the perox-isome proliferator responsive genes, including a number of genes implicated in peroxisomal oxidation pathway (Lee et al., 1995). Additionally, a role in controlling the inflammatory response has been suggested (Devchand et al., 1996).
No specific functions have been definitely assigned to PPARβ, because of its ubiquitous organ expression. It is thought that this receptor is implicated in basic cellular func-
* Corresponding author. Phone: +81-3-5841-4437;Fax : +81-3-5841-4439;E-mail : [email protected]
doi:10.2108/zsj.25.492

PPARs in the Leopard Gecko 493
tions such as lipid synthesis and turnover, and also in cell differentiation (Braissant and Wahli, 1998). Moreover, some information suggests that this isotype plays an important role in osteoclastic bone resorption (Mano et al., 2000) and adipocyte function (Peters et al., 2000).
Finally, PPARγ is a key transcription factor implicated in adipocyte differentiation (Tontonoz et al., 1994b; Chawla et al., 1994), and it is also involved in the inflammatory response (Ricote et al., 1998; Jiang et al., 1998). Two iso-forms, PPARγ1 and γ2, have been identified in several mammals: human (Fajas et al., 1997), rhesus monkey (GenBank accession numbers AF033343, AF033342, AF033103), house mouse (Zhu et al., 1995), Norway rat (Escher et al., 2001), cow (Sundvold et al., 1997), pig (Grindflek et al., 1998), and sheep (Forment et al. 2003). In birds, PPARγ mRNA sequences have been identified in
chicken (Takada et al. 2000) and duck (Ma et al., 1998), and two isoforms (PPARγ1 and 2) were reported in duck (Ma et al., 1998).
In mammals, it has been reported that PPAR subtypes mediate to a large extent the transcriptional regulation of the UCP genes (for review, Villarroya et al, 2007). UCP1 is con-trolled by PPARγ and PPARα in relation to brown adipocyte differentiation and lipid oxidation, respectively. UCP3 is reg-ulated by PPARα and PPARδ in the muscle, heart, and adi-pose tissues. UCP2 is under the tissue-specific control of PPARs in many tissues, including muscle, heart, adipose tissue, pancreatic β-cells, and liver.
In reptiles, partial mRNA sequences of PPARα, β, and γ of the Nile crocodile (Crocodylus niloticus) and PPARγ of a turtle (Trachemys scripta elegans) have been identified (Hughes et al., 1999), but there are no reports of the nucle-
Table 1. Oligonucleotide primers used for RACE, RT-PCR and competitive-PCR
Nucleotide sequencea Used for
PPARγSE01 5’-ACNGARATGCCNTTYTGGCC-3’ degenerate PCRAS01 5’-GGRTTNAGYTGRTCDATRTC-3’ degenerate PCRAS02 5’-AGNGGRTGNAGRCTCATRTC-3’ degenerate PCRSE02 5’-CTCTCACAAGAACTGACCAGACAGC-3’ RT-PCRSE03 5’-GCAGGGTGTGCGGAGACAAAGCTTC-3’ RT-PCRSE04 5’-CGGAGTGCATGCATGTGAAGGCTG-3’ RT-PCRSE05 5’-CATCTATACGCTGCTGGCCTCCATG-3’ RT-PCRSE06 5’-GCCGTCATTATACTCAGTGGAGATCGCCCT-3’ 3’-RACESE07 5’-GATTGTAACGGAGCACGTGCAGCTGTTGCA-3’ 3’-RACEAS03 5’-CTTCTCCTTTTCAGCTTGTGGCATTC-3’ RT-PCRAS04 5’-CAGTAATCCAGGGCGATCTCCACTG-3’ RT-PCRAS05 5’-GTCAAAGGAATGGGAGTGATCGTCC-3’ RT-PCRAS06 5’-GTAGGGTGGAGAGGGGGGCTCCATC-3’ RT-PCRAS07 5’-CTTTGTCTCCGCACACCCTGCATTC-3’ 5’-RACE, competitive PCRAS08 5’-GGCCAGGGCTCTCAGATCAGCAGAC-3’ 5’-RACEAS09 5’-GATCGTCCATTGCAGAAAGGTCCACTGGGC-3’ 5’-RACESE08 5’-GTTTCTCCGGCTGAGTTGAGC-3’ Competitive PCRSE09 5’-GCAACTTCTTCTGCAATGCTAACCAC-3’ Competitive PCRSE10 5’-GCAACTTCTTCTGCAATGCTAACCA
Construction of the competitor CGTTTCTCCGGCTGAGTTGAGC-3’
AS10 5’-CTTTGTCTCCGCACACCCTGCATTCConstruction of the competitor
CTCCATCTTGATTACACTTTGGCAC-3’PPARα
SE01 5’-CARTTYYTNCARGANATGG-3’ degenerate PCRAS01 5’-GANGTRCAYTGGCAGCAGTG-3’ degenerate PCRSE02 5’-GACACTGGTGGCAAAGCTGGTGGCC-3’ 3’-RACESE03 5’-AGCCAGACTCATCCTTGCGGGAAAAACCAG-3’ 3’-RACESE04 5’-GCTAGTCTATGATACAAGTGACCGC-3’ Competitive PCRAS02 5’-AAGGATGAGTCTGGCTTTCACCTTG-3’ Competitive PCRAS03 5’-AAGGATGAGTCTGGCTTTCACCTTG
Construction of the competitor CCATTTCAGAATTTTCTACGCAGTGTTCACC-3’
PPARβSE01 5’-GAYCARYTNCARATGGGNTG-3’ degenerate PCRAS01 5’-AANCCRTTNCCRTTNGCNAC-3’ degenerate PCRSE02 5’-AATCCGCATGAAGCTGGAGTATGAG-3’ Competitive PCRAS02 5’-CCTCGTGCTTTCTTTTTGGTCATGTTG-3’ Competitive PCRAS03 5’-CCTCGTGCTTTCTTTTTGGTCATGT
Construction of the competitor TGCTGGCAACTGATTTCATTTGCTGTC-3’
aAbbreviations for degenerate nucleotides: Y=C or T; R=G or A; N=A,T,G or C.

K. Kato et al.494
otide sequences of squamate PPARs. With regard to their functions, increases in PPARα ligands were observed in the intestine of a python (Python molurus) after refeeding (Astarita et al., 2006), and immunoreactivity of rabbit poly-clonal anti-PPARα antibodies were detected in the liver of a lizard (Podaricis sicula) (Buono et al., 2007).
In this study, we identified cDNAs of PPARα, β, and γ in the leopard gecko and found two isoforms of PPARγ, which contain a 5’-UTR different from that of known PPARγ iso-forms. We also evaluated the distribution of PPAR expres-sion among organs by using RT-PCR and competitive PCR. To compare the expression levels of the two PPARγ iso-
forms, special competitive PCR was performed. In addition, phylogenetic analyses and a reconstruction of the genomic structure of reptilian PPARs were performed by using the green-anole genome database.
MATERIALS AND METHODS
AnimalsAnimals were treated according to the guideline of the Bio-
science Committee at the University of Tokyo. Leopard geckos were bred in the laboratory over several generations in groups of one male and at least two females. One-year-old, fertile male (body weight 80–100 g) and female (60–80 g) leopard geckos were main-
Fig. 1. (A) Nucleotide and deduced amino acid sequences of leopard gecko PPAR γa and γb cDNAs. Only the ORF is shown. Nucleotides (top) are numbered from 5’ to 3’, beginning with the initiator codon (ATG) in the coding region. Amino acid residues (bottom) are numbered beginning with the first methionine residue in the ORF. The C and E/F domains are indicated by solid and dashed underlining, respectively. The regions corresponding to primers designed for competitive PCR are boxed. (B) Schematic illustration of the construction of the competitors designed for competitive PCR.

PPARs in the Leopard Gecko 495
tained at 29°C under a long-day photoperiod (14 h light and 10 h dark). The animals were provided with crickets and water ad libitum. Animals were anesthetized with sodium pentobarbital (25 μg/g body
weight) and killed by rapid decapitation, followed by complete bloodletting. Tissues and organs were immediately excised and fro-zen in liquid nitrogen, and stored at –80°C until use.
Fig. 2. Nucleotide and deduced amino acid sequences of leopard gecko PPARα (A) and PPARβ (B) cDNAs. Nucleotides (top) are numbered from 5’ to 3’. Amino acid residues (bottom) are numbered beginning with the first first deduced amino acid residue in the ORF. Domains are indicated; C and E/F domains are underlined by solid and dashed lines, respectively.
Fig. 3. Comparison of the predicted amino acid sequences of PPARα of the leopard gecko and green anole with homologs from other spe-cies. The amino acid sequences of various PPARα homologs were aligned by using Clustal X. Dots indicate identity of amino acids with those of PPARα of the green anole. Residues conserved among all species are black boxed. Dashes indicate gaps inserted during alignment. Domains are indicated; the C and E/F domains are underlined by solid and dashed lines, respectively.
K. Kato et al.496
RNA preparation and cDNA synthesisTotal RNA was extracted by using Isogen (Nippon Gene,
Tokyo, Japan). The cDNAs used for rapid amplification of cDNA ends (RACE) were synthesized from 1 μg of total RNA by using a Marathon cDNA Amplification Kit (BD Biosciences Clontech, Palo Alto, CA) according to the manufacturer’s instructions. The cDNAs used as templates for RT-PCR were synthesized from 3 μg of dena-tured total RNA by using 5 μM oligo(dT) primer and 100 units of M-MLV reverse transcriptase (Promega, Madison, WI), in 20-μl reac-tion volumes incubated at 38°C for 30 min, followed by 1.5 h at 42°C.
Molecular cloning of the PPARs cDNAs by RACE and RT-PCRPartial cDNAs of PPARs were obtained from male adipose
tissue by RT-PCR using degenerate primers (Table 1). All of the following PCR amplifications were performed in 20-μl reaction volumes containing 1 μM each primer, 0.25 U of TaKaRa Ex Taq (TaKaRa, Shiga, Japan), 250 μM each dNTP, and 1X Ex Taq Buffer (TaKaRa). PCR reaction conditions were 94°C for 5 min; 40 cycles of 94°C for 30 s, 56°C for 30 s, and 72°C for 1 min; and 72°C for 5 min. PCR products were separated by electrophoresis in a 1.5% Tris-acetate-EDTA (TAE) agarose gel and visualized by ethidium bromide staining and a UV transilluminator. DNA fragments were extracted with phenol and directly sequenced. These analyses were repeated independently three times to avoid any PCR amplification errors. The 5’ and 3’ regions of the PPAR γa and γb cDNAs, and
the 3’ region of PPARα, were sequenced by using a Marathon cDNA Amplification Kit with gene-specific primers (Table 1).
In-silico identification of three PPAR genes utilizing the green anole genome database
In the green-anole genome database (GenBank accession number AAWZ00000000), BLASTN searches were performed to identify three PPAR genes, by using the full-length nucleotide sequences of chicken PPARα, β, and γ (GenBank accession num-bers NM_001001464, AF163810, NM_001001460). Putative amino acid sequences of the green anole PPARs were deduced, and the genomic structure of each isoform was reconstructed. The intron/exon boundaries of the three green-anole PPARs were extrapolated from those of the chicken.
Sequence analysisThe Clustal X program (version 1.81) (Thompson et al., 1997)
was used with default settings to align the deduced amino acid sequences of the PPARs of the leopard gecko, green anole, and other representative species. Amino acid identities were calculated with GeneDoc software (version 2.6.002) (Nicholas and Nicholas, 1997).
Phylogenetic analysisThe deduced amino acid sequences of the PPARs of the leop-
ard gecko were aligned with available corresponding sequences
Fig. 4. Comparison of the predicted amino acid sequences of PPARβ of the leopard gecko and green anole with homologs from other spe-cies. The amino acid sequences of various PPARβ homologs were aligned by using Clustal X. Dots indicate identity of amino acids with those of PPARβ of the green anole. Residues conserved among all species are black boxed. Dashes indicate gaps inserted during alignment. Domains are indicated; the C and E/F domains are underlined by solid and dashed lines, respectively.

PPARs in the Leopard Gecko 497
using Clustal X with default settings. Phylogenetic trees were con-structed using the neighbor-joining method (Saitou and Nei, 1987) with default settings in Clustal X. Bootstrap values were calculated from 1000 pseudoreplicates to estimate the robustness of internal branches. Full names of species and GenBank accession numbers of all PPAR sequences are as follows: Gallus gallus (chicken), NM_001001464 (PPARα), NM_204728 (PPARβ), AF163811 (PPARγ); Homo sapiens (human), NM_005036 (PPARα), NM_006238 (PPARβ), NM_138712 (PPARγ); Mus musculus(house mouse), NM_011144 (PPARα), NM011145 (PPARβ), NM_011146 (PPARγ); Rattus norvegicus (Norway rat), NM_013196 (PPARα), NM_013141 (PPARβ), NM_013124 (PPARγ); Bos Taurus(cow), NM_001034036 (PPARα), AF229357 (PPARβ), NM_181024 (PPARγ); Xenopus laevis (Arfican clawed frog), NM_001089813 (PPARα), NM_001087841 (PPARβ), NM_001087843 (PPARγ); Dicentrarchus labrax (European sea bass), AY590300 (PPARα), AY590302 (PPARβ), AY590303 (PPARγ); Sparus aurata (gilthead seabream), AY590299 (PPARα), AY590301 (PPARβ), AY590304 (PPARγ). Human NR1D1 was used as an outgroup (NM_021724).
Expression analysisOne microliter of each RT product was amplified with primers
PPARγSE08 and PPARγAS06 for PPARγa, PPARγSE09 and PPARγAS06 for PPARγb, PPARαSE04 and PPARαAS02 for PPARα, with PPARβSE02 and PPARβAS02 for PPARβ. As negative controls, PCR amplifications were also conducted using
each RNA sample without the RT reaction. The PCR cycling condi-tions for PPARs were 95°C for 5 min; 30 cycles of 95°C for 30 sec, 60°C for 30 sec, and 72°C for 1 min; and 72°C for 5 min. The PCR products were electrophoresed on a 2% TAE agarose gel and stained with ethidium bromide. Each DNA fragment was extracted from the gel and directly sequenced to confirm its identity.
Design of primers for the competitive PCRThe three pairs of primers used for the amplification of targets
and competitor DNAs of the PPAR isoforms were derived from the cDNA sequences for the three genes. The same competitor for PPARγ served to measure either total PPARγa mRNA or PPARγb mRNA. The sequences of these primers are shown in Table 1, and the positions of the primers for PPARγ are illustrated schematically in Fig. 1B. The target sequences of PPAR α, β, γa, and γb were 290, 294, 384, and 380 bp long, respectively, and the competitor sequences were 203, 229, 300, and 325 bp long, respectively.
Construction of competitor cDNAsTo construct competitor DNAs as standards for the quantifica-
tion of mRNA expression levels, amplification of 200 ng of adipose tissue cDNA was performed by PCR with forward (PPARα SE04, PPARβ SE02, PPARγ SE10) and reverse (PPARα AS03, PPARβAS03, PPARγ AS10) primers (total volume 160 μl). PCR reaction conditions were 94°C for 5 min; 40 cycles of 94°C for 30 s, 58°C for 30 s, and 72°C for 1 min; and 72°C for 5 min. The PCR products
Fig. 5. Comparison of the predicted amino acid sequences of PPARγ of the leopard gecko and green anole with homologs from other spe-cies. The amino acid sequences of various PPARγ homologs were aligned using Clustal X. Dots indicate identity of amino acid with those of the PPARγ of the green anole. Residues conserved among all species are black boxed. Dashes indicate gaps inserted during alignment. Domains are indicated; the C and E/F domains are underlined by solid and dashed lines, respectively.

K. Kato et al.498
were separated by electrophoresis in a 1.5% Tris-acetate-EDTA (TAE) agarose gel and visualized by ethidium bromide staining and a UV transilluminator. DNA fragments were extracted with phenol and directly sequenced. The amount of competitor DNA was esti-mated by the absorbance at 260 nm. The solutions were diluted to various concentrations and stored at –27°C until use.
Competitive PCRCompetitive PCR was performed with a fixed amount of the
cDNA sample (25 ng) and various concentrations of the competitor DNA. Ten microliters of the PCR product were electrophoresed on a 2% agarose gel and analyzed. PPAR mRNA expression levels were obtained by comparing the ratio of the band intensities of the target and the competitor. A photograph of the gel was taken with Digital Image Stocker (Toyobo, Osaka, Japan), and the intensities of the bands were analyzed densitometrically using the Scion Image program. The expression levels are given in arbitrary units (a.u.). The average of the expression levels of adipose-tissue cDNA from three individuals was defined as 1 a.u. The lower limits ofquantifi-cation of PPAR α, β, and γ with this method were as little as 10–1, 0.5×10⁻², and 10–2 a.u. mRNA, respectively.
Quantification of the mRNA expression levels of PPARs in various organs
For a comparison of the expression levels of PPARs in various organs, total RNA was extracted, as described above, from various tissues: liver, kidney, large intestine, adipose tissue, and muscle. Three micrograms of total RNA from each tissue was reverse-transcribed. Then, 25 ng of cDNA was subjected to a competitive-PCR assay.
Statistical analysisAnalysis of variance followed by Tukey’s test was used to ana-
lyze the data, with P<0.05 considered as statistically significant.
RESULTS
Molecular identification of PPAR cDNAs from the leopard gecko and green anole
Two full-length isoforms of leopard gecko PPARγ(lgPPARγ) cDNA, lgPPARγa and lgPPARγb (GenBank accession nos. AB360446, AB360447), were isolated from adipose and large intestine tissue, respectively, by dege-nerate PCR and RACE (Fig. 1). The isoforms share an iden-tical ORF of 1431 nucleotides, including a PPARγ coding region for 477 aa residues, a stop codon, and a 3’-UTR of 278 bp. One isoform, PPARγa contains a 5’-UTR of 38 bp, and the other, PPARγb, one of 224 bp. Partial sequences of lgPPAR α and β (GenBank accession nos. AB371074, AB371075) were also isolated by degenerate PCR and RACE from the liver and brain, respectively (Fig. 2). In addi-tion, the entire ORF sequences of PPAR α, β, and γ were identified from the green anole by in-silico analyses.
Comparison of the amino acid sequences of various PPARs
The deduced amino acid sequences of lgPPARs and gaPPARs were compared with those of various vertebrates (Figs. 3, 4, 5). Across the entire ORF, gaPPARs showed high (82–89% for PPARα, 81–92% for PPARβ, 89–94% for PPARγ) identities with their homologs in amniotes and rela-tively low (56–76% for PPARα, 62–65% for PPARβ, 60–74% for PPARγ) identities with those in non-amniotes. When specific domains were considered, stronger conservation among amniotes was observed in the DNA-binding domain
(C domain) (92% for PPARα, 92–98% for PPARβ, 98–100% for PPARγ) and in the ligand-binding domain (E/F domain) (93–97% for PPARα, 89–98% for PPARβ, 93–98% for PPARγ).
Molecular phylogenetic analysisMolecular phylogenetic trees were constructed by a
Fig. 6. Phylogenetic tree of PPARs The tree was constructed by using the neighbor-joining method with Clustal X. Bootstrap values from analysis of 1000 pseudoreplicates are indicated for all nodes on the tree. The scale bar beneath the tree indicates estimated evo-lutionary distance units. Human NR1D1 was used as the outgroup.
Fig. 7. Expression analysis of PPARs in the leopard gecko by RT-PCR. PCR products were analyzed by electrophoresis on a 2% TAE agarose gel with ethidium bromide staining. The authenticity of the RT-PCR products was confirmed by direct sequencing. The possi-bility of genomic contamination was eliminated by negative controls: total RNA samples without the RT reaction (lane RT-, an example showing the results of negative controls for total RNA from the large intestine. M, marker lane.
PPARs in the Leopard Gecko 499
neighbor-joining analysis of amino acid sequences of the entire ORF of PPARs (consensus tree, Fig. 6). The robust-ness of internal nodes was estimated by analysis of 1000 bootstrap pseudoreplicates. As expected, lgPPARγ and gaPPARs each clustered with their chicken homologs, and this result is consistent with phylogenetic trees of verte-brates obtained using other molecular markers.
Expression of lgPPARs in the leopard geckolgPPAR α and β expression was detected in the liver,
kidney, stomach, small intestine, large intestine, and kidney. Expression of these mRNAs was also detected in adipose tissue by RT-PCR with 40 cycles (data not shown). Expres-sion of lgPPARγa mRNA was also detected in the liver, stomach, small intestine, large intestine, kidney and adipose tissue, and that of lgPPARγb mRNA in the stomach, small intestine, large intestine, and kidney (Fig. 7). The auth-enticity of the RT-PCR products was confirmed by direct sequencing. The possibility of genomic contamination was eliminated by amplifying the RT-minus controls; no products were detected in control amplifications of either total RNA or RNA from any of the organs.
To determine the tissue-specific expression patterns of PPARs, we developed a competitive PCR assay. The
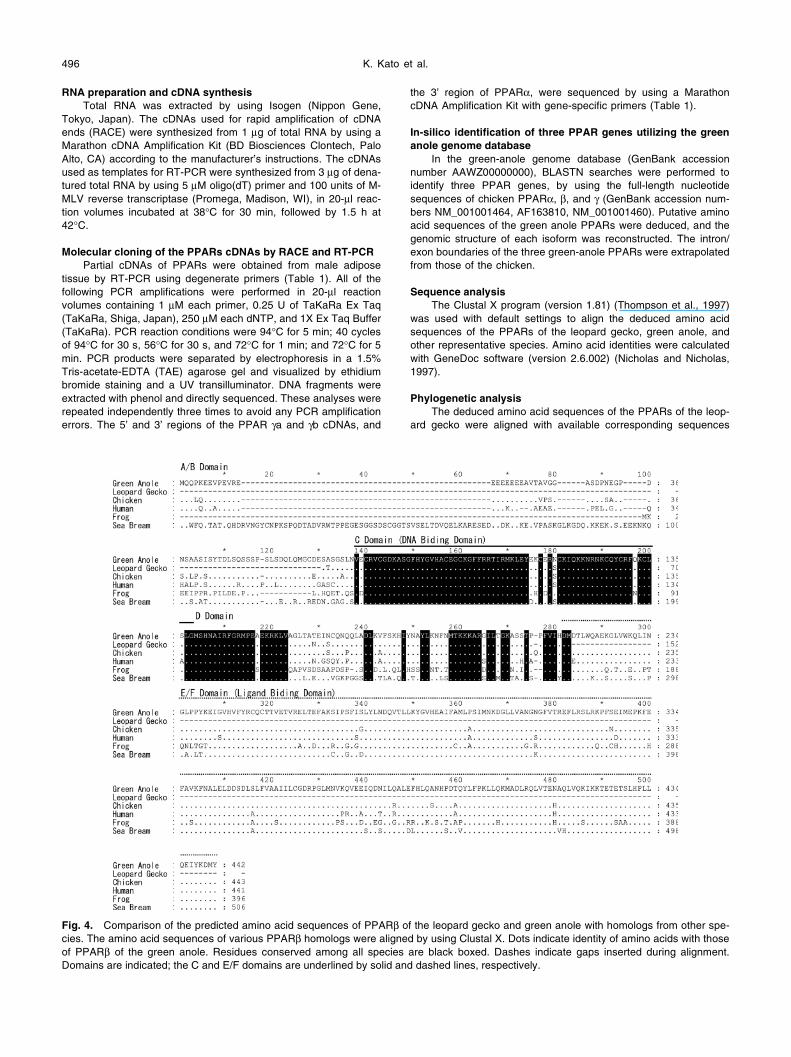
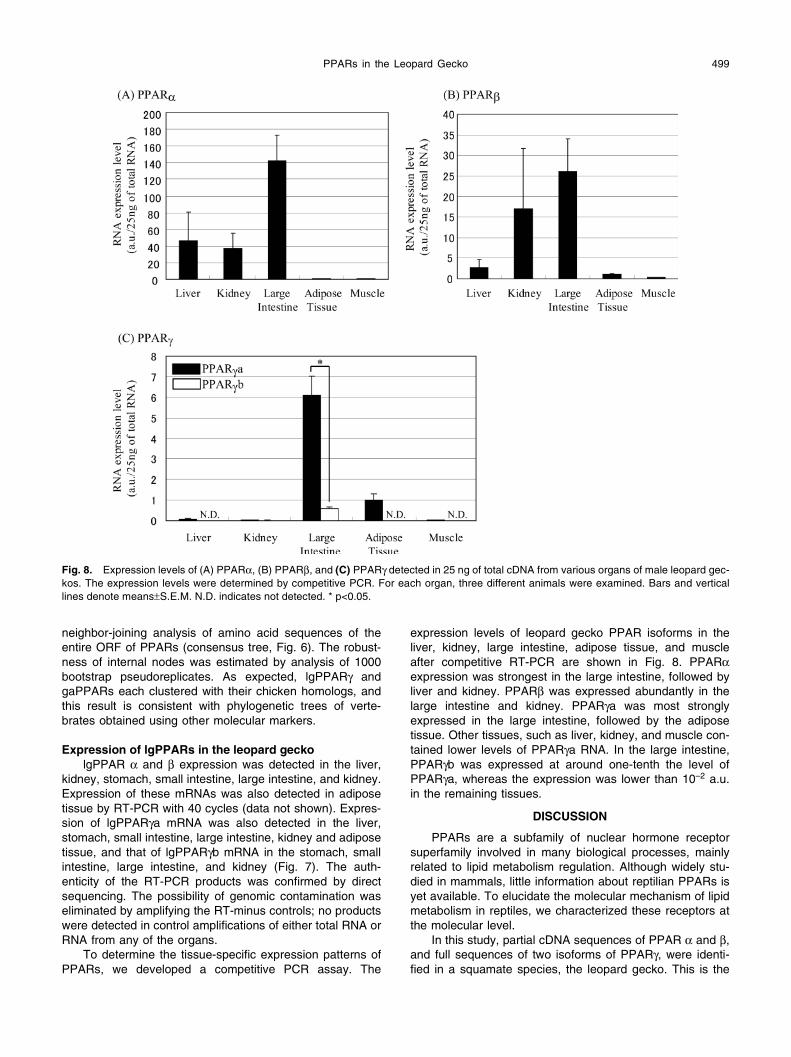
expression levels of leopard gecko PPAR isoforms in the liver, kidney, large intestine, adipose tissue, and muscle after competitive RT-PCR are shown in Fig. 8. PPARαexpression was strongest in the large intestine, followed by liver and kidney. PPARβ was expressed abundantly in the large intestine and kidney. PPARγa was most strongly expressed in the large intestine, followed by the adipose tissue. Other tissues, such as liver, kidney, and muscle con-tained lower levels of PPARγa RNA. In the large intestine, PPARγb was expressed at around one-tenth the level of PPARγa, whereas the expression was lower than 10–2 a.u. in the remaining tissues.
DISCUSSION
PPARs are a subfamily of nuclear hormone receptor superfamily involved in many biological processes, mainly related to lipid metabolism regulation. Although widely stu-died in mammals, little information about reptilian PPARs is yet available. To elucidate the molecular mechanism of lipid metabolism in reptiles, we characterized these receptors at the molecular level.
In this study, partial cDNA sequences of PPAR α and β, and full sequences of two isoforms of PPARγ, were identi-fied in a squamate species, the leopard gecko. This is the
Fig. 8. Expression levels of (A) PPARα, (B) PPARβ, and (C) PPARγ detected in 25 ng of total cDNA from various organs of male leopard gec-kos. The expression levels were determined by competitive PCR. For each organ, three different animals were examined. Bars and vertical lines denote means±S.E.M. N.D. indicates not detected. * p<0.05.

K. Kato et al.500
first report of reptilian PPARγ mRNA isoforms. Compared with the known PPARγ isoforms found in mammals, lgPPAR γa and γb appear not to correspond to mammalian PPARγ2, because their deduced amino acid sequences lack the addi-tional amino acids at the N-terminus. They also seem to be spliced differently from hPPAR γ1, γ3 and γ4, because they do not have the same sequences in their 5’-UTR as hPPAR γ1 and γ3 (Fajas et al., 1998). To predict the promoter usage of PPARγ in the leopard gecko, analysis of the genomic structure using the green anole genome database was per-formed. This revealed the genomic structures of gaPPARs to consist of six coding exons, similar to the mammalian PPAR genes, whereas alternative first exons of PPARγ have not yet been found in the green anole genome database. To elucidate the promoter usage of lgPPAR γa and γb, analysis of their genomic structure in the leopard gecko is required.
The deduced amino acid sequences of the cDNAs dem-onstrated the classic modular structure of members of the nuclear receptor superfamily. The highest degree of identity of the reptilian PPARs with PPARs from other species is found within the DNA-binding domain (C domain) (Table 2). Within the core of this domain (two zinc fingers), reptilian PPARs share approximately 90% identical residues with their mammalian counterparts; reptilian PPARγ shares 100% identical residues with rat and human PPARγ. In addi-tion, the feature that distinguishes PPARs from the other members of the nuclear receptor superfamily, a D-box of three instead of five amino acids, is maintained in the reptil-ian PPARs. This indicates that the DNA-binding properties of the C domain of these receptors are conserved in reptiles.
In the phylogenetic analysis, reptilian PPARs clustered with their avian homologs. Among the clusters of PPARs, the cluster of amniote PPARγ is less divergent than the other clusters of amniote PPARs. This suggests that func-tion of PPARγ is more conserved in amniotes.
To determine the tissue-specific expression patterns of PPARs, we developed a competitive PCR assay. The expression pattern of lgPPARβ is similar to that in the rat (Escher et al., 2001), whereas lgPPARα was distinctively expressed in the large intestine, in contrast to the expres-sion in mammals and fish (Leaver et al., 2005). In the Burmese python (Python molurus), a species of ambush-hunting snake that consumes huge meals after months of fasting and undergoes massive feeding-dependent changes in gastrointestinal hormonal release and gut morphology, the postfeeding response of PPARα ligands (oleoylethano-lamide and fatty-acid ethanolamides) in the intestine was much greater than observed in mammals (Astarita et al., 2006). Considering that the leopard gecko is thought to experience longer intervals between feeding than mammals in the wild, the higher expression of lgPPARα in the large intestine may reflect the feeding-dependent increase of endogenous PPARα ligands.
In the leopard gecko, lgPPARγa shows a pattern similar to that of mammalian PPARγ1, and lgPPARγb was detected in tissues where lgPAPRγa was also expressed in higher amounts. As observed for hPPAR γ1 (Fajas et al., 1997), we found lgPPARγa to be most strongly expressed in the large intestine, followed by adipose tissue. Other tissues, such as liver, kidney, and muscle, contained lower levels of lgPPARγa mRNA. Expression of lgPPARγb was also observed in the
Table 2. Homology of the PPARs
(A) PPARα
Species Total A/B C D E/FReptiles
Green Anole 100 100 100 100 100Leopard Gecko – * – * – * 94 – *
BirdChicken 89 68 92 85 97
MammalsNorway Rat 82 59 92 87 88Human 85 61 92 87 93
AmphibianAfrican Clawed Frog 76 41 84 75 92
FishEuropean Sea Bass 56 18 86 63 66Gilthead Seabream 61 33 87 61 68
(B) PPARβSpecies Total A/B C D E/FReptiles
Green Anole 100 100 100 100 100Leopard Gecko – * – * 98 94 – *Nile Crocodile – * – * – * 92 – *
BirdChicken 92 75 98 92 98
MammalsNorway Rat 81 58 92 84 85Human 85 63 95 85 89
AmphibianAfrican Clawed Frog 62 6 86 54 75
FishEuropean Sea Bass 64 17 89 61 87Gilthead Seabream 65 19 92 62 87
(C) PPARγSpecies Total A/B C D E/FReptiles
Green Anole 100 100 100 100 100Leopard Gecko 94 86 98 97 97
Turtle – * – * 100 97 – *Nile Crocodile – * – * 98 97 – *
BirdChicken 93 81 100 97 98
MammalsNorway Rat 89 74 100 97 93Human 90 74 100 97 95
AmphibianAfrican Clawed Frog 74 61 96 68 83
FishEuropean Sea Bass 60 28 93 73 76Gilthead Seabream 60 27 93 73 76
Levels of similarity among PPAR homologs. Each value is the per-cent amino acid identity between a particular PPAR protein from the green anole and the strict homolog (ortholog) from another species. Shown in different columns are the total similarity and the similarity for each of several domains (A/B, C, D, E/F). These scores were obtained using GeneDoc.* The amino acid sequences of these species are incomplete.

PPARs in the Leopard Gecko 501
large intestine, at around one-tenth the level of lgPPARγa, whereas the expression was lower than 10–2 a.u in the remaining tissues. In mammals, PPARγ is implicated in the inflammatory response (Ricote et al., 1998; Jiang et al., 1998), and its agonist inhibits colon cancer cell growth (Kitamura et al., 1999). Other vertebrates can be compared; in rodents PPARγ1 is ubiquitously expressed, whereas PPARγ2 is expressed exclusively and at lower levels in adipose tissue (Tontonoz et al., 1994a; Escher et al., 2001; Vidal-Puig et al., 1996). In the chicken, sea bream, and plaice, PPARγ is expressed at lower levels in the large intes-tine than in adipose tissue (Meng et al., 2005; Leaver et al., 2005); hence the expression pattern is opposite that found in the leopard gecko. In the African clawed frog, PPARγ is the most abundantly expressed PPAR in adipose tissue, although there are no descriptions of the intestinal expre-ssion of PPARs in this species (Dreyer et al., 1993). These facts indicate that the roles of lgPPAR γa and γb in the large intestine of the leopard gecko may be different from those in other vertebrates.
In conclusion, we identified PPAR α, β, and γ cDNAs in the leopard gecko. We also found novel PPARγ mRNA iso-forms in this species of reptile. We also performed or the first time a quantitative study of PPAR mRNAs, showing the relative expression of these receptors in several organs. The results revealed species-specific mRNA expression patterns of PPARα and the PPARγ isoforms. To clarify the physiolog-ical functions of PPARs in reptiles and their significance for the evolution of endothermy from ectothermy, further stu-dies, especially focused on the relationship of these genes with UCPs, are required.
ACKNOWLEDGMENTS
This work was supported by Grants-in-Aid from the Japan Society for the Promotion of Science.
REFERENCES
Astarita G, Bryan CR, Johnnie BA, Jin F, Janet HK, Albert FB, James WH, Daniele P (2006) Postprandial increase of oleoyle-thanolamide mobilization in small intestine of the Burmese python (Python molurus). Am J Physiol Regul Integr Comp Physiol 290: R1407–1412
Braissant O, Walter W (1998) Differential expression of peroxisome proliferator-activated receptor-a, -b, and -g during rat embryonic development. Endocrinology 139: 2748–2754
Brand MD, Couture P, Else PL, Withers KW, Hulbert AJ (1991) Evo-lution of energy metabolism. Proton permeability of the inner membrane of liver mitochondria is greater in a mammal than in a reptile. Biochem J 275: 81–86
Buono S, Cristiano L, D’Angelo B, Cimini A, Putti R (2007) PPARa mediates the effects of the pesticide methyl thiophanate on liver of the lizard Podarcis sicula. Comp Biochem Physiol C 145: 306–314
Chawla A, Schwarz EJ, Dimaculangan DD, Lazar MA (1994) Peroxisome proliferator-activated receptor (PPAR) g: adipose- predominant expression and induction early in adipocyte differ-entiation. Endocrinology 135: 798–800
Derickson WK (1976) Lipid storage and utilization in reptiles. Am Zool 16: 711–723
Devchand PR, Keller H, Peters JM, Vazquez M, Gonzalez FJ, Wahli W (1996) The PPARa-leukotriene B4 pathway to inflammation control. Nature 384: 39–43
Dreyer C, Keller H, Mahfoudi A, Laudet V, Krey G, Wahli W (1993)
Positive regulation of the peroxisomal beta-oxidation pathway by fatty acids through activation of peroxisome proliferator-activated receptors (PPAR). Biol Cell 77: 67–76
Escher P, Wahli W (2000) Peroxisome proliferator-activated recep-tors: insight into multiple cellular functions. Mutat Res 448: 121–138
Escher P, Braissant O, Basu-Modak S, Michalik L, Wahli W, Desvergne B (2001) Rat PPARs: quantitative analysis in adult rat tissues and regulation in fasting and refeeding. Endocri-nology 142: 4195–4202
Fajas L et al. (1997) The organization, promoter analysis, and expression of the human PPARg gene. J Biol Chem 272: 18779–18789
Fajas L, Fruchart JC, Auwerx J (1998) PPARg3 mRNA: a distinct PPARg mRNA subtype transcribed from an independent pro-moter. FEBS Lett 438: 55–60
Forment P, Fabre S, Dupont J, Pisselet C, Chesneau D, Staels B, Philippo M (2003) Expression and functional role of peroxisome proliferator-activated receptor-γ in ovarian folliculogenesis in the sheep. Biol Reprod 69: 1665–1674
Grindflek E, Sundvold H, Klungland H, Lien S (1998) Characterisa-tion of porcine peroxisome proliferator-activated receptors g1 and g2: detection of breed and age differences in gene expres-sion. Biochem Biophys Res Commun 249: 713–718
Hughes S, Zelus D, Mouchiroud D (1999) Warm-blooded isochore structure in Nile crocodile and turtle. Mol Biol Evol 16: 1521–1527
Jiang C, Ting AT, Seed B (1998) PPARg agonists inhibit production of monocyte inflammatory cytokines. Nature 39: 82–86
Kitamura S, Miyazaki Y, ShinomuraY, Kondo S, Kanayama S, Matsuzawa Y (1999) Peroxisome proliferator-activated receptor gamma induces growth arrest and differentiation markers of human colon cancer cells. Jpn J Cancer Res 90: 75–80
Leaver MJ, Boukouvala E, Antonopoulou E, Diez A, Favre-Krey L, Ezaz MT, Bautista JM, Tocher DR, Krey G (2005) Three perox-isome proliferator-activated receptor isotypes from each of two species of marine fish. Endocrinology 146: 3150–3162
Lee SST, Pineau T, Drago J, Lee EJ, Owens JW, Kroetz DL, Fernandez-Salguero PM, Westphal H, Gonzalez H (1995) Targeted disruption of the alpha isoform of the peroxisome proliferator-activated receptor gene in mice results in abolish-ment of the pleiotropic effects of peroxisome proliferators. Mol Cell Biol 15: 3012–3022
Ma H, Tam QT, Kolattukudy PE (1998) Peroxisome proliferator-activated receptor g1 (PPAR-g1) as a major PPAR in a tissue in which estrogen induces peroxisome proliferation. FEBS Lett 434: 394–400
Mano H, Kimura C, Fuzisawa Y, Kameda T, Watanabe-Mano M, Kaneko H, Kaneda T, Hakeda Y, Kumegawa M (2000) Cloning and function of rabbit peroxisome proliferator-activated receptor d/b in mature osteoclasts. J Biol Chem 275: 8126–8132
Mozo J, Emre Y, Bouillaud F, Ricquier D, Criscuolo F (2005) Ther-moregulation: what role for UCPs in mammals and birds? Bio-sci Rep 25: 227–249
Meng H, Li H, Zhao JG, Gu ZL (2005) Differential expression of per-oxisome proliferator-activated receptors alpha and gamma gene in various chicken tissues. Domest Anim Endocrinol 28: 105–110
Nicholas KB, Nicholas HB Jr, Deerfield DW II (1997) GeneDoc: analysis and visualization of genetic variation. EMBNEW. NEWS 4: 14
Niewiarowski PH, Balk ML, Londraville RL (2000) Phenotypic effects of leptin in an ectotherm: a new tool to study the evolution of life histories and endothermy? J Exp Biol 203: 295–300
Peters JM, Lee SST, Li W, Ward JM, Gavrilova O, Everett C, Reitman ML, Hudson LD, Gonzalez FJ (2000) Growth, adipose, brain, and skin alterations resulting from targeted disruption of

K. Kato et al.502
the mouse peroxisome proliferator-activated receptor b(d). Mol Cell Biol 20: 5119–5128
Ricote M, Li AC, Willson TM, Kelly CJ, Glass CK (1998) The peroxi-some proliferator-activated receptor-g is a negative regulator of macrophage activation. Nature 391: 79–82
Saitou N, Nei M (1987) The neighbor-joining method: a new method for reconstructing phylogenetic trees. Mol Biol Evol 4: 406–425
Scarpace PJ, Matheny M, Pollock BH, Tümer N (1997) Leptin increases uncoupling protein expression and energy expendi-ture. Am J Physiol 273: E226–E230
Shah RV, Kinariwala RV, Ramachandran AV (1982) Changes in the visceral fat bodies associated with haematopoiesis and lipid metabolism, in relation to tail regeneration in the scincid lizard, Mabuya carinata: a histomorphological analysis. Anat Anz 151: 137–143
Sundvold H, Brzozowska A, Lien S (1997) Characterisation of bovine peroxisome proliferator-activated receptors g1 and g2: genetic mapping and differential expression of the two isoforms. Biochem Biophys Res Commun 239: 857–861
Takada I, Yu RT, X HE, Lambert MH, Montana VG, Kleiwer SA, Evans RM, Umesono K (2000) Alteration of a single amino acid in peroxisome proliferator-activated receptor-a (PPARa) gener-ates a PPARd phenotype. Mol Endocrinol 14: 733–740
Thompson JD, Gibson TJ, Plewniak F, Jeanmougin F, Higgins DG (1997) The Clustal X windows interface: flexible strategies for multiple sequence alignment aided by quality analysis tools. Nucl Acids Res 25: 4876–4882
Tontonoz P, Hu E, Graves RA, Budavari AI, Spiegelman BM (1994a) mPPAR gamma 2: tissue-specific regulator of an adipocyte enhancer. Genes Dev 8: 1224–1234
Tontonoz P, Hu E, Spiegelman BM (1994b) Stimulation of adipo-genesis in fibroblasts by PPARg2, a lipid-activated transcription factor. Cell 79: 1147–1156
Vidal-Puig A, Jimenez-Linan M, Lowell BB, Hamann A, Hu E, Spiegelman B, Flier JS, Moller DE (1996) Regulation of PPAR g gene expression by nutrition and obesity in rodents. J Clin Invest 97: 2553–2561
Villarroya F, Iglesias R, Giralt M (2006) Ppars in the control of uncoupling proteins gene expression. PPAR Res 2007: Article ID 74364, 1–12
Zhu Y, Qi C, Korenberg JR, Chen XN, Noya D, Rao MS, Reddy JK (1995) Structural organization of mouse peroxisome proliferator-activated receptor gamma (mPPAR gamma) gene: alternative promoter use and different splicing yield two mPPAR gamma isoforms. Proc Natl Acad Sci USA 92: 7921–7925
(Received December 24, 2007 / Accepted February 20, 2008)