Gelled graphite/gelatin composites for latent heat cold storage
9
(This is a sample cover image for this issue. The actual cover is not yet available at this time.) This article appeared in a journal published by Elsevier. The attached copy is furnished to the author for internal non-commercial research and education use, including for instruction at the authors institution and sharing with colleagues. Other uses, including reproduction and distribution, or selling or licensing copies, or posting to personal, institutional or third party websites are prohibited. In most cases authors are permitted to post their version of the article (e.g. in Word or Tex form) to their personal website or institutional repository. Authors requiring further information regarding Elsevier’s archiving and manuscript policies are encouraged to visit: http://www.elsevier.com/copyright
Transcript of Gelled graphite/gelatin composites for latent heat cold storage
(This is a sample cover image for this issue. The actual cover is not yet available at this time.)
This article appeared in a journal published by Elsevier. The attachedcopy is furnished to the author for internal non-commercial researchand education use, including for instruction at the authors institution
and sharing with colleagues.
Other uses, including reproduction and distribution, or selling orlicensing copies, or posting to personal, institutional or third party
websites are prohibited.
In most cases authors are permitted to post their version of thearticle (e.g. in Word or Tex form) to their personal website orinstitutional repository. Authors requiring further information
regarding Elsevier’s archiving and manuscript policies areencouraged to visit:
http://www.elsevier.com/copyright
Author's personal copy
Gelled graphite/gelatin composites for latent heat cold storage
Nuno Vitorino a, João C.C. Abrantes a,b,⇑, Jorge Ribeiro Frade a
a Dep. of Materials and Ceramic Engineering, CICECO, University of Aveiro, 3810 Aveiro, Portugalb UIDM, ESTG, Polytechnic Institute of Viana do Castelo, 4900 Viana do Castelo, Portugal
h i g h l i g h t s
" The water/graphite suspensions are stabilized with collagen additions." Gelation at room temperatures prevents sedimentation of graphite particles." The gelled graphite suspensions have enhanced thermal conductivity." The thermal response is unchanged upon repeated phase change cycles.
a r t i c l e i n f o
Article history:Received 22 June 2012Received in revised form 19 November 2012Accepted 4 December 2012
Keywords:Shape stabilized compositesPhase change materialsCold storageThermal propertiesFusion kinetics
a b s t r a c t
Aqueous suspensions of graphite were shape stabilized by the additions of collagen and characterized asphase change materials for cold storage with enhanced thermal conductivity. Collagen addition stabilizedthe graphite suspensions in aqueous media without requirements for additional stabilizers or previousfunctionalization. Gelation at room temperatures prevented sedimentation of graphite particles. SEMof dried samples confirmed nearly random distribution of graphite particles. These gelled suspensionswith enhanced thermal conductivity were tested for latent heat cold storage. The thermal responsewas retained upon repeated phase change cycles, and impedance spectroscopy was used to monitor thesecycles. The response time upon phase change was somewhat longer than predicted by taking into accountthe values of thermal diffusivity and the estimated value of Stefan number, probably due to significantinterfacial resistance to heat transfer, combined with discontinuities caused by volume expansion uponphase change.
� 2012 Elsevier Ltd. All rights reserved.
1. Introduction
Modern societies are urged to develop systems and concepts forefficient and rational use of energy, and to seek increasing use ofrenewable energies; this requires energy storage to bridge timeand/or spatial gaps between availability of renewable energiesand consumption, including heat or cold storage, and thermal iner-tia to minimize energy spent on hot water, heating or air condi-tioning. The relevant literature thus shows increasing interest onphase change materials (PCMs) for thermal energy storage, basedon the high latent heat of melting, often considering hot waterapplications, using paraffin waxes, fatty acids, etc. However, thelow thermal conductivity of these materials is ill suited for fast dis-charge, thus requiring strategies for faster thermal response [1],including expanded graphite [2,3], carbon nanotubes [4], etc.
The low efficiency of cold production systems also gives oppor-tunities for phase change cold storage [5–7] to enhance perfor-mance of air-conditioning heat pumps using ice storage subcoolers [8,9], and more recently phase change slurries for cold stor-age applications [10–12]. Water stands out due to its abundance,high latent heat density (�330 MJ m�3), low cost and suitablemelting temperature (�0 �C). The present work was, thus, basedon ice/water as a suitable PCM for cold storage. Still, the lowthermal conductivity of water, mainly in liquid state,(�0.6 W m�1 K�1), also imposes limitations in discharge rate. Avariety of solutions has been tested to improve thermal responseof water-based latent heat cold storage, with emphasis on metallicmacrostructures (fins, plates, etc.), metallic pieces, and also PCMencapsulation to improve the effective area of transfer [13].
In paraffin/organic based latent heat storage, graphite has beenused to improve PCM thermal response due its high thermal con-ductivity. However, this often requires functionalization inwater-based systems or additions of compatibilizers for graphitein water. In addition, the long term applicability is arguable dueto insufficient long term stability of graphite suspensions, bysedimentation. Thus, the present work proposes a facile and
0306-2619/$ - see front matter � 2012 Elsevier Ltd. All rights reserved.http://dx.doi.org/10.1016/j.apenergy.2012.12.014
⇑ Corresponding author at: UIDM, ESTG, Polytechnic Institute of Viana do Castelo,4900-348 Viana do Castelo, Portugal. Tel.: +351 258 819 700; fax: +351 258 827636.
E-mail addresses: [email protected] (N. Vitorino), [email protected](J.C.C. Abrantes), [email protected] (J.R. Frade).
Applied Energy 104 (2013) 890–897
Contents lists available at SciVerse ScienceDirect
Applied Energy
journal homepage: www.elsevier .com/ locate/apenergy
Author's personal copy
inexpensive strategy to prepare water–ice/graphite composites,using collagen as a stabilize agent, to achieve compatibility ofgraphite in aqueous medium and to prevent sedimentation uponrepeated phase change cycles. One expects final costs of <1 € kg�1
for production at industrial scale, based on the costs of precursorsat industrial scale, i.e., <0.5 € kg�1 for graphite [14], and <20 € kg�1
for collagen [15].These composite materials used in cold storage systems can be
employed in plates or rods, in which heat charge and discharge oc-curs by a fluid flow (liquid or gas) across the reservoir surface. Themain drawback of the proposed composite materials are relatedwith volume change during solid–liquid and liquid–solid phasechanges (�10%), which can be critical for the reservoir stability.However, the gelled composites allow their use in fragments, pro-moting a better dimensional adjustment when it comes to thephase change process. With this concept the heat transfer fluidcan contact directly the fragments of phase change materialimproving heat transfer by increasing the contact area betweenPCM and heat transfer fluid. Dehydration of the composite by theheat transfer fluid should be avoided.
2. Materials and method
Graphite (Merck 1.04206.2500) with particle size below 50 lmand bulk density 280 g cm�3 was used to enhance thermal conduc-tivity and collagen (Oxoid LP0008) was used for ready compatibi-lization of graphite powder in water, and also to preventsedimentation upon gelation.
Ball milling (Retsch S1) was used to reduce the average particlesize of graphite particles. Graphite powder was dispersed in colla-gen solution (5 wt.% relative to water mass) with stirring rate of20000 rpm during 15 min (IKA T–25 Ultraturax). The resultinggraphite suspension was then kept under slow stirring, to avoidair incorporation, until gelation.
The homogeneity of graphite distribution was assessed by cryo-genic fracture of frozen samples, and by evaluating differences indensity between resulting fragments, by the Archimedes method[16]. This method was applied to different graphite contents, upto 30 wt.%. Fragments of selected samples were also dried in air,for up to 1 week and then kept at 100 �C for 1 h, to recover the cor-responding porous graphite bodies bonded by dried collagen; thisallowed one to perform microstructural characterization by scan-ning electron microscopy (Hitachi SU1510). Though one also at-tempted to obtain freeze dried samples, these easily collapsed to
loose powders; this may be an indication that graphite/collageninteractions are affected by expansive solidification of water basedsystems.
FTIR spectroscopy (Bruker Tensor 27 FT-IR) was used to charac-terize absorption bands of collagen and graphite precursors, andcorresponding changes upon gelation and after drying, to confirminteractions between graphite and collagen. FTIR spectra for airdried samples (at room temperatures), and freeze dried samples,were obtained to inspect changes in graphite/collagen interactionsrelated to phase change.
DSC (Perkin Elmer (Norwalk, CT) DSC-7, using sapphire as a ref-erence material) measurements were performed on heating from�40 �C to 30 �C, at 5 �C min�1 and 10 �C min�1, to evaluate the ef-fect of additions of collagen on the enthalpy of phase change, andto assess if the corresponding temperature is significantly affected,except for the expected effects of heating rate.
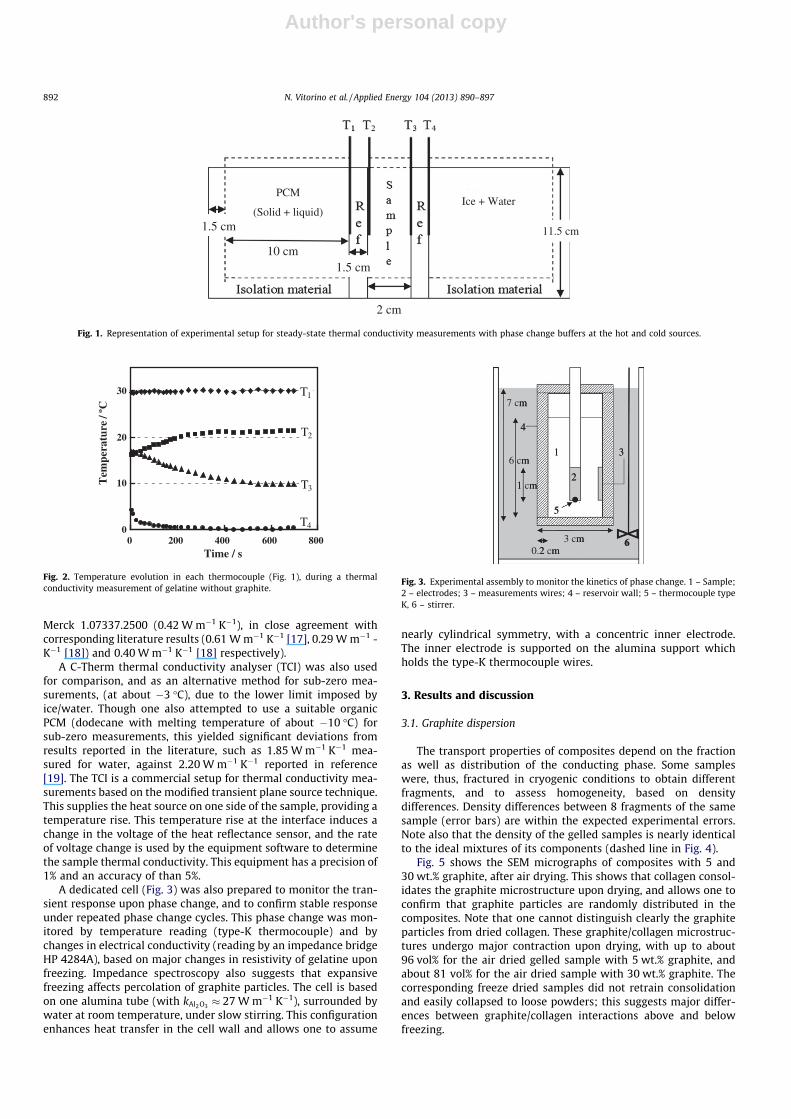
Fig. 1 shows the experimental apparatus developed for thermalconductivity measurements, based on steady-state regime, i.e. uni-form heat flux from the hot source to cold source, across a series ref-erence/sample/reference association, using reference glass plateswith thermal conductivity of 1.18 W m�1 K�1 and 15 mm thickness.Conservation of heat flux (per unit area) through the sample andreference glass plates yields the following steady-state condition:
ksampleDTsample
Lsample¼ kref
DTref
Lrefð1Þ
and thus
ksample ¼kref DTref Lsample
DTsampleLrefð2Þ
where kref represents thermal conductivity of reference glass, Lsample
the sample length, Lref reference length, DTref the sum of tempera-ture differences across the reference glass plates and DTsample thetemperature difference across the sample. Temperature wasmeasured with type K thermocouple. Stable temperature in hot/cold sources was controlled by phase change buffers with a suitabledifference between melting temperatures at the hot and coldsources. In the actual conditions, the cold source was set by ice/water and the hot source by a phase change material (paraffinwax) with melting temperature of 30 �C. Ready convergence to-wards steady state results (Fig. 2) demonstrates the reliability ofthe method. The reliability of the present methods was demon-strated by measurements of standard substances such as water(0.60 W m�1 K�1), glycerine (0.30 W m�1 K�1) and paraffin wax
Nomenclature
cP heat capacity, J kg�1 �C�1
C capacity, Fd diameter, mh heat transfer coefficient, W m�2 K�1
k thermal conductivity, W m�1 K�1
L length/thickness, mR radiusR resistance, XT temperature, �CZ� complex impedance, Z� ¼ Z0 � iZ00
Z0 real part of complex impedance, XZ00 imaginary part of complex impedance, X
Greek symbolsa thermal diffusivity, m2 s�1
q density, kg m�3
/ Stefan number, / ¼ cPDT=k
k latent heat, J kg�1
x angular frequency, rad s�1
SubscriptsAl2O3 aluminacol collagendis dischargeexp experimentale externalel electrodehf high frequencyi internallf low frequencyref referencesample sampletc thermal conduction
N. Vitorino et al. / Applied Energy 104 (2013) 890–897 891
Author's personal copy
Merck 1.07337.2500 (0.42 W m�1 K�1), in close agreement withcorresponding literature results (0.61 W m�1 K�1 [17], 0.29 W m�1 -K�1 [18]) and 0.40 W m�1 K�1 [18] respectively).
A C-Therm thermal conductivity analyser (TCI) was also usedfor comparison, and as an alternative method for sub-zero mea-surements, (at about �3 �C), due to the lower limit imposed byice/water. Though one also attempted to use a suitable organicPCM (dodecane with melting temperature of about �10 �C) forsub-zero measurements, this yielded significant deviations fromresults reported in the literature, such as 1.85 W m�1 K�1 mea-sured for water, against 2.20 W m�1 K�1 reported in reference[19]. The TCI is a commercial setup for thermal conductivity mea-surements based on the modified transient plane source technique.This supplies the heat source on one side of the sample, providing atemperature rise. This temperature rise at the interface induces achange in the voltage of the heat reflectance sensor, and the rateof voltage change is used by the equipment software to determinethe sample thermal conductivity. This equipment has a precision of1% and an accuracy of than 5%.
A dedicated cell (Fig. 3) was also prepared to monitor the tran-sient response upon phase change, and to confirm stable responseunder repeated phase change cycles. This phase change was mon-itored by temperature reading (type-K thermocouple) and bychanges in electrical conductivity (reading by an impedance bridgeHP 4284A), based on major changes in resistivity of gelatine uponfreezing. Impedance spectroscopy also suggests that expansivefreezing affects percolation of graphite particles. The cell is basedon one alumina tube (with kAl2O3 � 27 W m�1 K�1), surrounded bywater at room temperature, under slow stirring. This configurationenhances heat transfer in the cell wall and allows one to assume
nearly cylindrical symmetry, with a concentric inner electrode.The inner electrode is supported on the alumina support whichholds the type-K thermocouple wires.
3. Results and discussion
3.1. Graphite dispersion
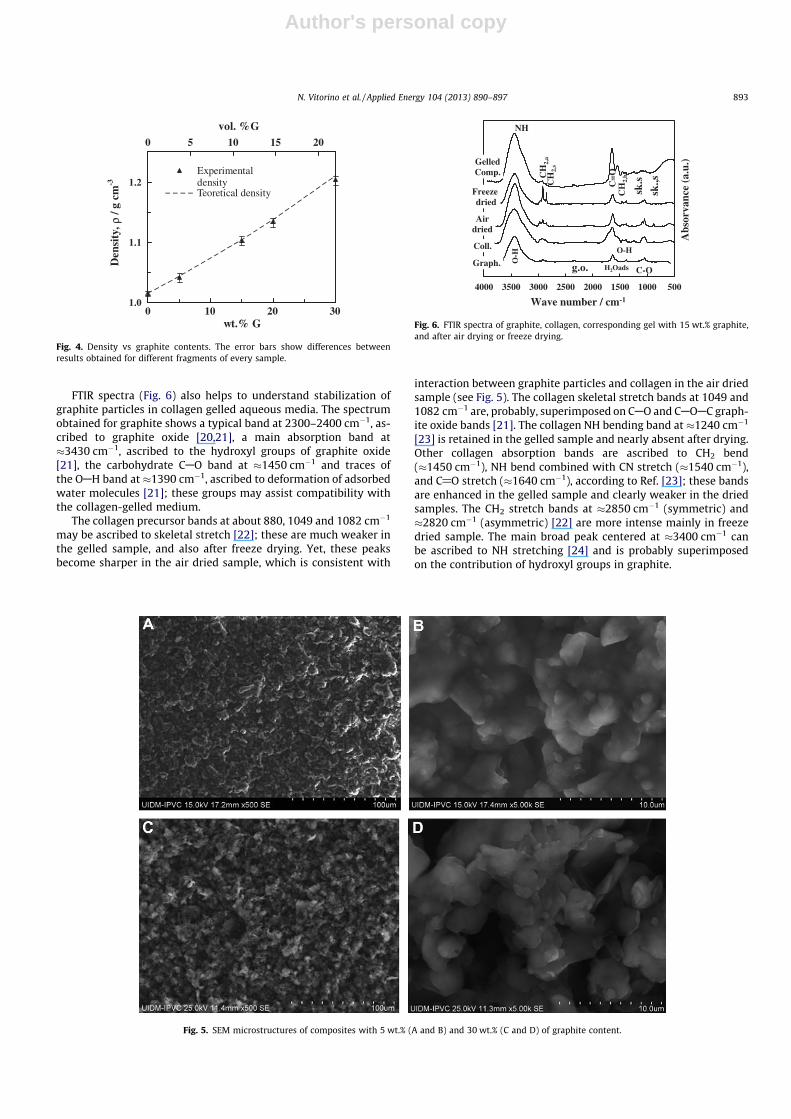
The transport properties of composites depend on the fractionas well as distribution of the conducting phase. Some sampleswere, thus, fractured in cryogenic conditions to obtain differentfragments, and to assess homogeneity, based on densitydifferences. Density differences between 8 fragments of the samesample (error bars) are within the expected experimental errors.Note also that the density of the gelled samples is nearly identicalto the ideal mixtures of its components (dashed line in Fig. 4).
Fig. 5 shows the SEM micrographs of composites with 5 and30 wt.% graphite, after air drying. This shows that collagen consol-idates the graphite microstructure upon drying, and allows one toconfirm that graphite particles are randomly distributed in thecomposites. Note that one cannot distinguish clearly the graphiteparticles from dried collagen. These graphite/collagen microstruc-tures undergo major contraction upon drying, with up to about96 vol% for the air dried gelled sample with 5 wt.% graphite, andabout 81 vol% for the air dried sample with 30 wt.% graphite. Thecorresponding freeze dried samples did not retrain consolidationand easily collapsed to loose powders; this suggests major differ-ences between graphite/collagen interactions above and belowfreezing.
PCM
(Solid + liquid)Ice + Water
2 cm
10 cm
1.5 cm 11.5 cm
1.5 cm
Fig. 1. Representation of experimental setup for steady-state thermal conductivity measurements with phase change buffers at the hot and cold sources.
T1
T2
T3
T40
10
20
30
0 200 400 600 800Time / s
Tem
pera
ture
/ºC
Fig. 2. Temperature evolution in each thermocouple (Fig. 1), during a thermalconductivity measurement of gelatine without graphite.
31
2
5
4
6 3 cm 0.2 cm
6 cm
7 cm
1 cm
31
2
5
4
6 m 2 m
m
m
1 m
Fig. 3. Experimental assembly to monitor the kinetics of phase change. 1 – Sample;2 – electrodes; 3 – measurements wires; 4 – reservoir wall; 5 – thermocouple typeK, 6 – stirrer.
892 N. Vitorino et al. / Applied Energy 104 (2013) 890–897
Author's personal copy
FTIR spectra (Fig. 6) also helps to understand stabilization ofgraphite particles in collagen gelled aqueous media. The spectrumobtained for graphite shows a typical band at 2300–2400 cm�1, as-cribed to graphite oxide [20,21], a main absorption band at�3430 cm�1, ascribed to the hydroxyl groups of graphite oxide[21], the carbohydrate CAO band at �1450 cm�1 and traces ofthe OAH band at �1390 cm�1, ascribed to deformation of adsorbedwater molecules [21]; these groups may assist compatibility withthe collagen-gelled medium.
The collagen precursor bands at about 880, 1049 and 1082 cm�1
may be ascribed to skeletal stretch [22]; these are much weaker inthe gelled sample, and also after freeze drying. Yet, these peaksbecome sharper in the air dried sample, which is consistent with
interaction between graphite particles and collagen in the air driedsample (see Fig. 5). The collagen skeletal stretch bands at 1049 and1082 cm�1 are, probably, superimposed on CAO and CAOAC graph-ite oxide bands [21]. The collagen NH bending band at �1240 cm�1
[23] is retained in the gelled sample and nearly absent after drying.Other collagen absorption bands are ascribed to CH2 bend(�1450 cm�1), NH bend combined with CN stretch (�1540 cm�1),and C@O stretch (�1640 cm�1), according to Ref. [23]; these bandsare enhanced in the gelled sample and clearly weaker in the driedsamples. The CH2 stretch bands at �2850 cm�1 (symmetric) and�2820 cm�1 (asymmetric) [22] are more intense mainly in freezedried sample. The main broad peak centered at �3400 cm�1 canbe ascribed to NH stretching [24] and is probably superimposedon the contribution of hydroxyl groups in graphite.
1.0
1.1
1.2
wt.% G
Den
sity
, ρ /
g cm
-3
0 10 20 30
0 5 10 15 20
vol. %G
ExperimentaldensityTeoretical density
Fig. 4. Density vs graphite contents. The error bars show differences betweenresults obtained for different fragments of every sample.
Fig. 5. SEM microstructures of composites with 5 wt.% (A and B) and 30 wt.% (C and D) of graphite content.
Coll.
sk.,s
sk.s
CH
2,b
C=OCH
2,s
CH
2,a
NH
Freezedried
Air dried
C-O
O-H
H2Oadsg.o.
O-H
Graph.
Gelled Comp.
5001000150020002500300035004000
Abs
orva
nce
(a.u
.)
Wave number / cm-1
Fig. 6. FTIR spectra of graphite, collagen, corresponding gel with 15 wt.% graphite,and after air drying or freeze drying.
N. Vitorino et al. / Applied Energy 104 (2013) 890–897 893
Author's personal copy
3.2. Thermal performance of gelatin graphite composites
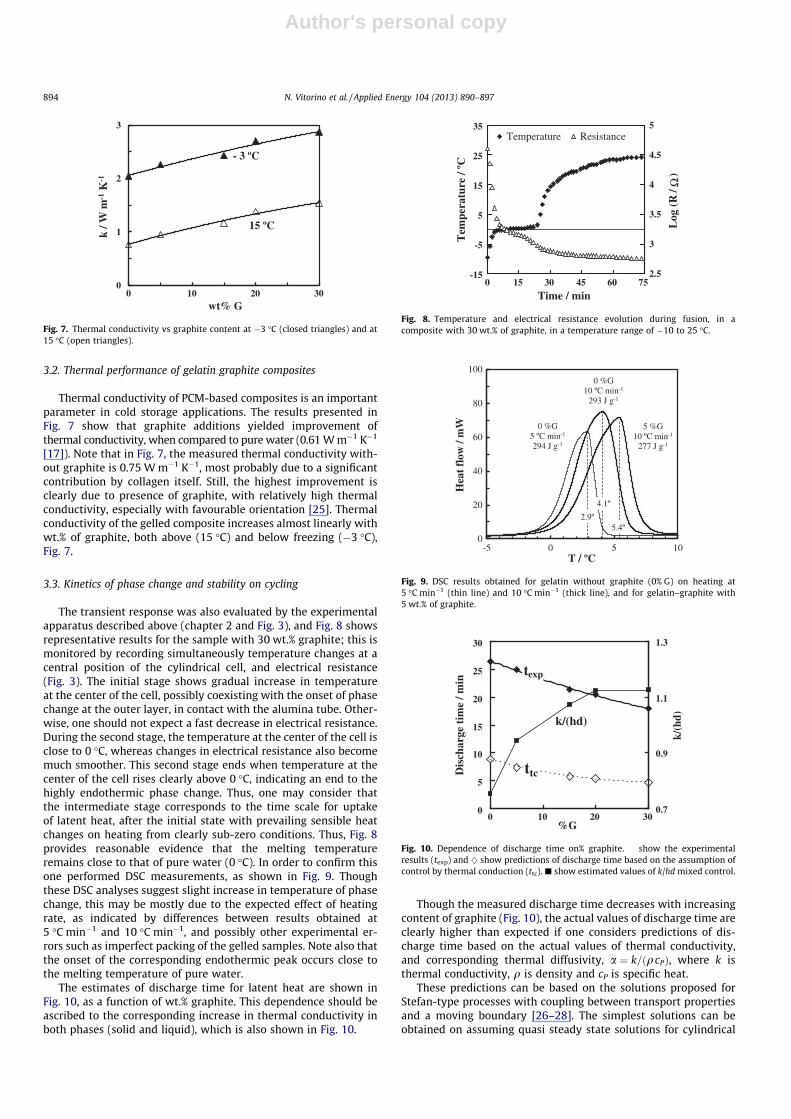
Thermal conductivity of PCM-based composites is an importantparameter in cold storage applications. The results presented inFig. 7 show that graphite additions yielded improvement ofthermal conductivity, when compared to pure water (0.61 W m�1 K�1
[17]). Note that in Fig. 7, the measured thermal conductivity with-out graphite is 0.75 W m�1 K�1, most probably due to a significantcontribution by collagen itself. Still, the highest improvement isclearly due to presence of graphite, with relatively high thermalconductivity, especially with favourable orientation [25]. Thermalconductivity of the gelled composite increases almost linearly withwt.% of graphite, both above (15 �C) and below freezing (�3 �C),Fig. 7.
3.3. Kinetics of phase change and stability on cycling
The transient response was also evaluated by the experimentalapparatus described above (chapter 2 and Fig. 3), and Fig. 8 showsrepresentative results for the sample with 30 wt.% graphite; this ismonitored by recording simultaneously temperature changes at acentral position of the cylindrical cell, and electrical resistance(Fig. 3). The initial stage shows gradual increase in temperatureat the center of the cell, possibly coexisting with the onset of phasechange at the outer layer, in contact with the alumina tube. Other-wise, one should not expect a fast decrease in electrical resistance.During the second stage, the temperature at the center of the cell isclose to 0 �C, whereas changes in electrical resistance also becomemuch smoother. This second stage ends when temperature at thecenter of the cell rises clearly above 0 �C, indicating an end to thehighly endothermic phase change. Thus, one may consider thatthe intermediate stage corresponds to the time scale for uptakeof latent heat, after the initial state with prevailing sensible heatchanges on heating from clearly sub-zero conditions. Thus, Fig. 8provides reasonable evidence that the melting temperatureremains close to that of pure water (0 �C). In order to confirm thisone performed DSC measurements, as shown in Fig. 9. Thoughthese DSC analyses suggest slight increase in temperature of phasechange, this may be mostly due to the expected effect of heatingrate, as indicated by differences between results obtained at5 �C min�1 and 10 �C min�1, and possibly other experimental er-rors such as imperfect packing of the gelled samples. Note also thatthe onset of the corresponding endothermic peak occurs close tothe melting temperature of pure water.
The estimates of discharge time for latent heat are shown inFig. 10, as a function of wt.% graphite. This dependence should beascribed to the corresponding increase in thermal conductivity inboth phases (solid and liquid), which is also shown in Fig. 10.
Though the measured discharge time decreases with increasingcontent of graphite (Fig. 10), the actual values of discharge time areclearly higher than expected if one considers predictions of dis-charge time based on the actual values of thermal conductivity,and corresponding thermal diffusivity, a ¼ k=ðqcPÞ, where k isthermal conductivity, q is density and cP is specific heat.
These predictions can be based on the solutions proposed forStefan-type processes with coupling between transport propertiesand a moving boundary [26–28]. The simplest solutions can beobtained on assuming quasi steady state solutions for cylindrical
15 ºC
- 3 ºC
0
1
2
3
0 10 20 30
k / W
m-1
K-1
wt% G
Fig. 7. Thermal conductivity vs graphite content at �3 �C (closed triangles) and at15 �C (open triangles).
-15
-5
5
15
25
35
0 15 30 45 60 75
Time / min
Tem
pera
ture
/ ºC
2.5
3
3.5
4
4.5
5
Log
(R
/ Ω
)
Temperature Resistance
Fig. 8. Temperature and electrical resistance evolution during fusion, in acomposite with 30 wt.% of graphite, in a temperature range of �10 to 25 �C.
0 %G5 ºC min-1
294 J g-1
0 %G10 ºC min-1
293 J g-1
4.1º
2.9º
5 %G10 ºC min-1
277 J g-1
5.4º0
20
40
60
80
100
-5 0 5 10
Hea
t fl
ow /
mW
T / ºC
Fig. 9. DSC results obtained for gelatin without graphite (0% G) on heating at5 �C min�1 (thin line) and 10 �C min�1 (thick line), and for gelatin–graphite with5 wt.% of graphite.
texp
ttc
k/(hd)
0
5
10
15
20
25
30
0 10 20 30%G
Dis
char
ge t
ime
/ min
0.7
0.9
1.1
1.3
k/(
hd)
Fig. 10. Dependence of discharge time on% graphite. � show the experimentalresults (texp) and } show predictions of discharge time based on the assumption ofcontrol by thermal conduction (ttc). j show estimated values of k/hd mixed control.
894 N. Vitorino et al. / Applied Energy 104 (2013) 890–897
Author's personal copy
symmetry (see Appendix A), yielding the following approximatesolutions for the time required to attain complete discharge oflatent heat:
ta/
d2 ¼ 0:0625 ð3Þ
where / is the relevant Stefan number, / ¼ cPDT=k, where DT is thetemperature difference between external temperature and meltingtemperature, and k is latent heat. As a first approximation one mayestimate typical values of latent heat per kg of gelled graphite/water composite by subtracting the mass fractions of graphite andcollagen, and considering only the fraction of water. This assump-tion is reasonable to account for the fraction of graphite, withlimited interaction with water, and probably also to account forthe addition of collagen, as demonstrated in the literature evenfor cases when the fraction of water is lower than 50% [29]. For amore correct analysis of the impact of collagen and graphite onemeasured the enthalpy of phase change by DSC and obtained about293 J g�1 for gelatin without graphite, 277 J g�1 for gelatin–graphitecomposites with 5 wt.% graphite, and 246 J g�1 for 15% graphite. Ifone subtracts the weight fractions of collagen and graphite oneestimates the corresponding values relative to the mass of waterin these composites, i.e., about 308, 305 and 302 J g�1 of water,for composites with 0, 5 and 15 wt.% of graphite. By comparing withthe latent heat of pure water (334 J g�1) one obtains a decrease inlatent heat of about 8% for gelatin without graphite; this may beinterpreted as the fraction of water molecules with significant inter-action with collagen, as suggested for collagen-based biomaterials[30]. The results obtained for gelatin–graphite composites confirmthat the effects of graphite on latent heat are close to negligible.
Actually, quasi steady state solutions are valid only for low val-ues of Stefan number (/� 1). Thus, one used previous numericalcodes for cylindrical symmetry [28], to obtain the corrected depen-dence of discharge time on Stefan number, diameter and thermaldiffusivity of the phase change material:
ttc ¼d2
a0:0380� 0:00605/þ 0:0625
/
� �ð4Þ
These predictions for discharge time with control by thermalconduction are also shown in Fig. 10, and indicate that the processis far from being exclusively controlled by thermal conduction.
The main contribution for deviations from the expected controlby thermal conduction should not be ascribed to the alumina cellcontainer, mainly based on its superior thermal conductivity(�27 W m�1 K�1), and a relatively thin wall (�3 mm). Thus, onemust consider other limitations, such as transfer from the sur-rounding water (hot source) to alumina (outer interface) and/orfrom alumina to the gelatin medium (inner interface). In addition,significant contraction during defrosting may affect the gelatin/alumina contact or the corresponding heat transfer coefficient.Solutions for mixed control were thus also computed using previ-ously developed codes [28] and allowed one to estimate the rela-tive role of interfacial limitations and heat conduction on heattransfer, as described in Appendix A. Note that prevailing controlby heat conduction corresponds to high values of hd/k.
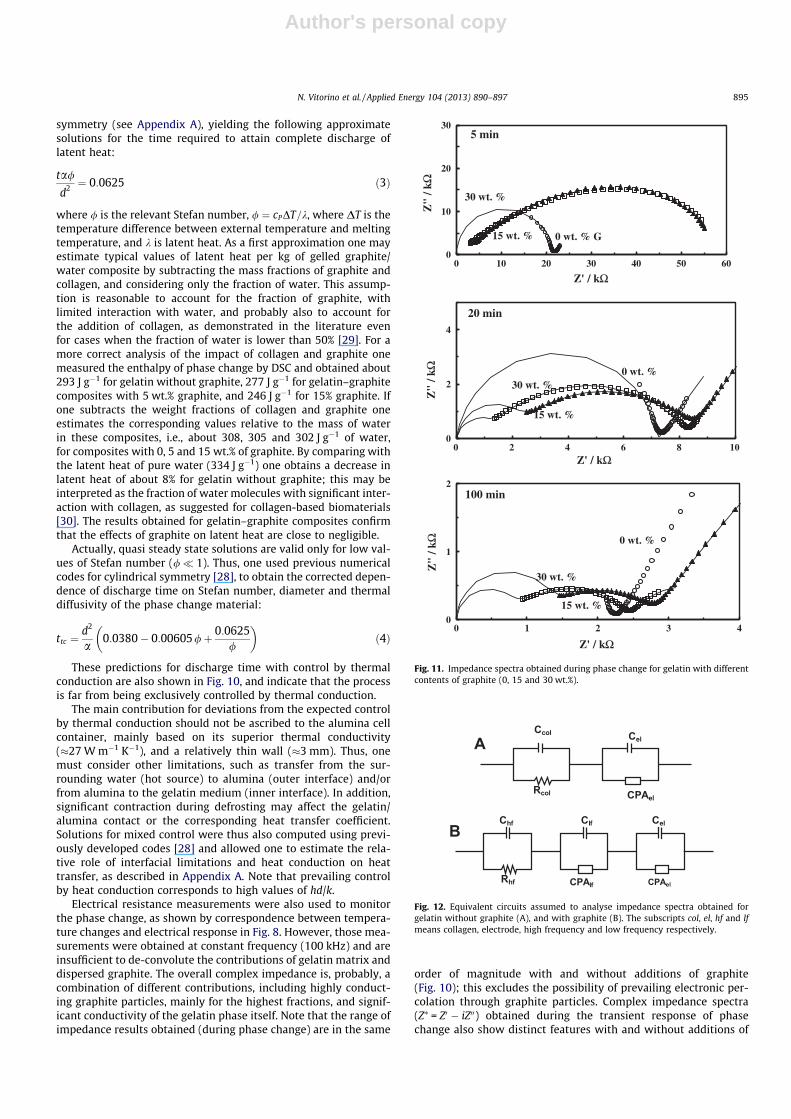
Electrical resistance measurements were also used to monitorthe phase change, as shown by correspondence between tempera-ture changes and electrical response in Fig. 8. However, those mea-surements were obtained at constant frequency (100 kHz) and areinsufficient to de-convolute the contributions of gelatin matrix anddispersed graphite. The overall complex impedance is, probably, acombination of different contributions, including highly conduct-ing graphite particles, mainly for the highest fractions, and signif-icant conductivity of the gelatin phase itself. Note that the range ofimpedance results obtained (during phase change) are in the same
order of magnitude with and without additions of graphite(Fig. 10); this excludes the possibility of prevailing electronic per-colation through graphite particles. Complex impedance spectra(Z⁄ = Z0 � iZ00) obtained during the transient response of phasechange also show distinct features with and without additions of
0 wt. % G
30 wt. %
15 wt. %
0
10
20
30
0 10 20 30 40 50 60
Z"
/ kΩ
Z' / kΩ
5 min
0 wt. %30 wt. %
15 wt. %
0
2
4
0 2 4 6 8 10
Z"
/ kΩ
Z' / kΩ
20 min
0 wt. %
30 wt. %
15 wt. %0
1
2
0 1 2 3 4
Z"
/ kΩ
Z' / kΩ
100 min
Fig. 11. Impedance spectra obtained during phase change for gelatin with differentcontents of graphite (0, 15 and 30 wt.%).
Rcol
Ccol
A Cel
CPAel
Clf
CPAlf CPAel
Cel
Rhf
ChfB
Fig. 12. Equivalent circuits assumed to analyse impedance spectra obtained forgelatin without graphite (A), and with graphite (B). The subscripts col, el, hf and lfmeans collagen, electrode, high frequency and low frequency respectively.
N. Vitorino et al. / Applied Energy 104 (2013) 890–897 895
Author's personal copy
graphite (Fig. 11). For gelatin without graphite, the spectra is rea-sonably well fitted by the equivalent circuit in Fig. 12A, with a typ-ical (RC) contribution and one additional contribution of electrodeprocesses, nearly described by a constant phase angle impedanceKP(ix)p, approaching the so-called Warburg impedance K(ix)�1/2
proposed for electrode processes [31].On adding graphite one sees mainly a very depressed arc
(Fig. 11), which may also be described by constant phase angleimpedance, and the onset of the electrode contribution. Inaddition, one also sees the very beginning of the high frequencycontribution, which cannot be resolved due to experimental limita-tions in the available frequency range (20–106 Hz). Therefore, thespectra obtained for gelatin/graphite samples were fitted by theequivalent circuit shown in Fig. 12B. The intermediate frequencycontribution in Fig. 11 is most affected and was ascribed to the gel-atin matrix. Note also that the high frequency impedance contribu-tion decreases with increasing content of graphite. Yet, the uppergraphite content (30 wt.% or �22 vol%) is still far from ensuringpercolation, as emphasized by series association of contributionsshown in Fig. 10, and the corresponding model equivalent circuit
in Fig. 12. Significant expansion upon phase change may, indeed,affect percolation of graphite particles, making the overall electri-cal resistance more dependent on the poor conductivity of frozengelatin.
The highest rigidity of gelatin with graphite additions may alsoaffect the contact at gelatin/electrode interfaces upon phasechange cycles, thus explaining the difference between resultsobtained with and without additions of graphite at the beginningof phase change (5 min). Similarly, contraction during defrostingmay affect the alumina/gelatin interface, with negative impact onheat transfer at this interface; this may contribute to the differ-ences between the actual experimental results for discharge timeand predictions based on control by thermal conduction only.
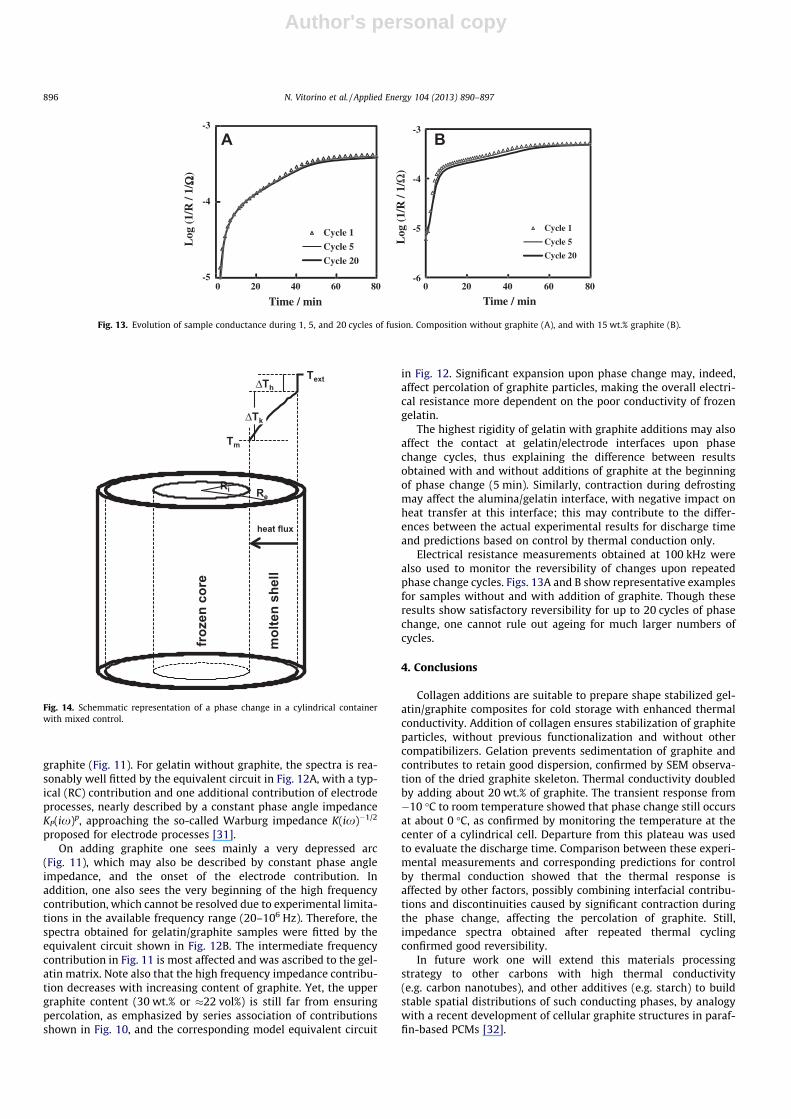
Electrical resistance measurements obtained at 100 kHz werealso used to monitor the reversibility of changes upon repeatedphase change cycles. Figs. 13A and B show representative examplesfor samples without and with addition of graphite. Though theseresults show satisfactory reversibility for up to 20 cycles of phasechange, one cannot rule out ageing for much larger numbers ofcycles.
4. Conclusions
Collagen additions are suitable to prepare shape stabilized gel-atin/graphite composites for cold storage with enhanced thermalconductivity. Addition of collagen ensures stabilization of graphiteparticles, without previous functionalization and without othercompatibilizers. Gelation prevents sedimentation of graphite andcontributes to retain good dispersion, confirmed by SEM observa-tion of the dried graphite skeleton. Thermal conductivity doubledby adding about 20 wt.% of graphite. The transient response from�10 �C to room temperature showed that phase change still occursat about 0 �C, as confirmed by monitoring the temperature at thecenter of a cylindrical cell. Departure from this plateau was usedto evaluate the discharge time. Comparison between these experi-mental measurements and corresponding predictions for controlby thermal conduction showed that the thermal response isaffected by other factors, possibly combining interfacial contribu-tions and discontinuities caused by significant contraction duringthe phase change, affecting the percolation of graphite. Still,impedance spectra obtained after repeated thermal cyclingconfirmed good reversibility.
In future work one will extend this materials processingstrategy to other carbons with high thermal conductivity(e.g. carbon nanotubes), and other additives (e.g. starch) to buildstable spatial distributions of such conducting phases, by analogywith a recent development of cellular graphite structures in paraf-fin-based PCMs [32].
-5
-4
-3
Time / min
Log
(1/
R /
1/ΩΩ
)
Cycle 1
Cycle 5
Cycle 20
-6
-5
-4
-3
0 20 40 60 80 0 20 40 60 80
Log
(1/
R /
1/Ω
)
Time / min
Cycle 1
Cycle 5
Cycle 20
BA
Fig. 13. Evolution of sample conductance during 1, 5, and 20 cycles of fusion. Composition without graphite (A), and with 15 wt.% graphite (B).
Ri Re
froz
en c
ore
mol
ten
shel
l
heat flux
Tm
TextΔTh
ΔTk
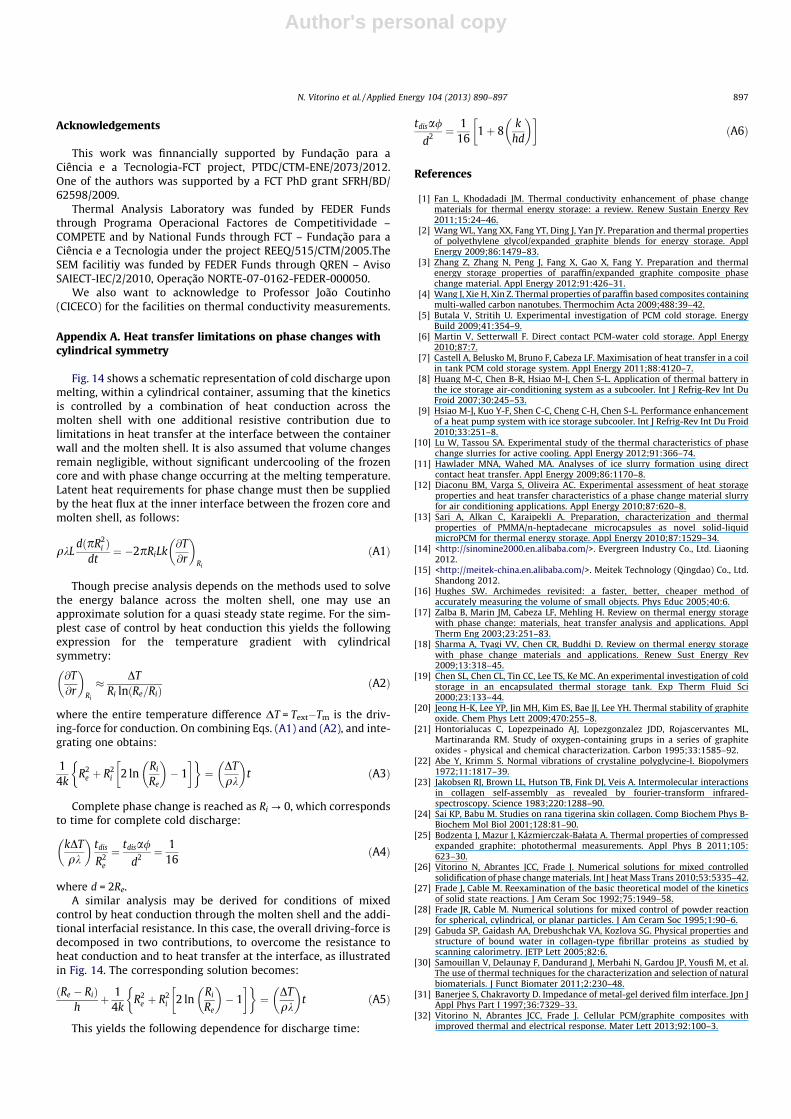
Fig. 14. Schemmatic representation of a phase change in a cylindrical containerwith mixed control.
896 N. Vitorino et al. / Applied Energy 104 (2013) 890–897
Author's personal copy
Acknowledgements
This work was finnancially supported by Fundação para aCiência e a Tecnologia-FCT project, PTDC/CTM-ENE/2073/2012.One of the authors was supported by a FCT PhD grant SFRH/BD/62598/2009.
Thermal Analysis Laboratory was funded by FEDER Fundsthrough Programa Operacional Factores de Competitividade –COMPETE and by National Funds through FCT – Fundação para aCiência e a Tecnologia under the project REEQ/515/CTM/2005.TheSEM facilitiy was funded by FEDER Funds through QREN – AvisoSAIECT-IEC/2/2010, Operação NORTE-07-0162-FEDER-000050.
We also want to acknowledge to Professor João Coutinho(CICECO) for the facilities on thermal conductivity measurements.
Appendix A. Heat transfer limitations on phase changes withcylindrical symmetry
Fig. 14 shows a schematic representation of cold discharge uponmelting, within a cylindrical container, assuming that the kineticsis controlled by a combination of heat conduction across themolten shell with one additional resistive contribution due tolimitations in heat transfer at the interface between the containerwall and the molten shell. It is also assumed that volume changesremain negligible, without significant undercooling of the frozencore and with phase change occurring at the melting temperature.Latent heat requirements for phase change must then be suppliedby the heat flux at the inner interface between the frozen core andmolten shell, as follows:
qkLdðpR2
i Þdt
¼ �2pRiLk@T@r
� �Ri
ðA1Þ
Though precise analysis depends on the methods used to solvethe energy balance across the molten shell, one may use anapproximate solution for a quasi steady state regime. For the sim-plest case of control by heat conduction this yields the followingexpression for the temperature gradient with cylindricalsymmetry:
@T@r
� �Ri
� DTRi lnðRe=RiÞ
ðA2Þ
where the entire temperature difference DT = Text�Tm is the driv-ing-force for conduction. On combining Eqs. (A1) and (A2), and inte-grating one obtains:
14k
R2e þ R2
i 2 lnRi
Re
� �� 1
� �� �¼ DT
qk
� �t ðA3Þ
Complete phase change is reached as Ri ? 0, which correspondsto time for complete cold discharge:
kDTqk
� �tdis
R2e
¼ tdisa/
d2 ¼ 116
ðA4Þ
where d = 2Re.A similar analysis may be derived for conditions of mixed
control by heat conduction through the molten shell and the addi-tional interfacial resistance. In this case, the overall driving-force isdecomposed in two contributions, to overcome the resistance toheat conduction and to heat transfer at the interface, as illustratedin Fig. 14. The corresponding solution becomes:
ðRe � RiÞh
þ 14k
R2e þ R2
i 2 lnRi
Re
� �� 1
� �� �¼ DT
qk
� �t ðA5Þ
This yields the following dependence for discharge time:
tdisa/
d2 ¼ 116
1þ 8k
hd
� �� �ðA6Þ
References
[1] Fan L, Khodadadi JM. Thermal conductivity enhancement of phase changematerials for thermal energy storage: a review. Renew Sustain Energy Rev2011;15:24–46.
[2] Wang WL, Yang XX, Fang YT, Ding J, Yan JY. Preparation and thermal propertiesof polyethylene glycol/expanded graphite blends for energy storage. ApplEnergy 2009;86:1479–83.
[3] Zhang Z, Zhang N, Peng J, Fang X, Gao X, Fang Y. Preparation and thermalenergy storage properties of paraffin/expanded graphite composite phasechange material. Appl Energy 2012;91:426–31.
[4] Wang J, Xie H, Xin Z. Thermal properties of paraffin based composites containingmulti-walled carbon nanotubes. Thermochim Acta 2009;488:39–42.
[5] Butala V, Stritih U. Experimental investigation of PCM cold storage. EnergyBuild 2009;41:354–9.
[6] Martin V, Setterwall F. Direct contact PCM-water cold storage. Appl Energy2010;87:7.
[7] Castell A, Belusko M, Bruno F, Cabeza LF. Maximisation of heat transfer in a coilin tank PCM cold storage system. Appl Energy 2011;88:4120–7.
[8] Huang M-C, Chen B-R, Hsiao M-J, Chen S-L. Application of thermal battery inthe ice storage air-conditioning system as a subcooler. Int J Refrig-Rev Int DuFroid 2007;30:245–53.
[9] Hsiao M-J, Kuo Y-F, Shen C-C, Cheng C-H, Chen S-L. Performance enhancementof a heat pump system with ice storage subcooler. Int J Refrig-Rev Int Du Froid2010;33:251–8.
[10] Lu W, Tassou SA. Experimental study of the thermal characteristics of phasechange slurries for active cooling. Appl Energy 2012;91:366–74.
[11] Hawlader MNA, Wahed MA. Analyses of ice slurry formation using directcontact heat transfer. Appl Energy 2009;86:1170–8.
[12] Diaconu BM, Varga S, Oliveira AC. Experimental assessment of heat storageproperties and heat transfer characteristics of a phase change material slurryfor air conditioning applications. Appl Energy 2010;87:620–8.
[13] Sari A, Alkan C, Karaipekli A. Preparation, characterization and thermalproperties of PMMA/n-heptadecane microcapsules as novel solid-liquidmicroPCM for thermal energy storage. Appl Energy 2010;87:1529–34.
[14] <http://sinomine2000.en.alibaba.com/>. Evergreen Industry Co., Ltd. Liaoning2012.
[15] <http://meitek-china.en.alibaba.com/>. Meitek Technology (Qingdao) Co., Ltd.Shandong 2012.
[16] Hughes SW. Archimedes revisited: a faster, better, cheaper method ofaccurately measuring the volume of small objects. Phys Educ 2005;40:6.
[17] Zalba B, Marin JM, Cabeza LF, Mehling H. Review on thermal energy storagewith phase change: materials, heat transfer analysis and applications. ApplTherm Eng 2003;23:251–83.
[18] Sharma A, Tyagi VV, Chen CR, Buddhi D. Review on thermal energy storagewith phase change materials and applications. Renew Sust Energy Rev2009;13:318–45.
[19] Chen SL, Chen CL, Tin CC, Lee TS, Ke MC. An experimental investigation of coldstorage in an encapsulated thermal storage tank. Exp Therm Fluid Sci2000;23:133–44.
[20] Jeong H-K, Lee YP, Jin MH, Kim ES, Bae JJ, Lee YH. Thermal stability of graphiteoxide. Chem Phys Lett 2009;470:255–8.
[21] Hontorialucas C, Lopezpeinado AJ, Lopezgonzalez JDD, Rojascervantes ML,Martinaranda RM. Study of oxygen-containing grups in a series of graphiteoxides - physical and chemical characterization. Carbon 1995;33:1585–92.
[22] Abe Y, Krimm S. Normal vibrations of crystaline polyglycine-I. Biopolymers1972;11:1817–39.
[23] Jakobsen RJ, Brown LL, Hutson TB, Fink DJ, Veis A. Intermolecular interactionsin collagen self-assembly as revealed by fourier-transform infrared-spectroscopy. Science 1983;220:1288–90.
[24] Sai KP, Babu M. Studies on rana tigerina skin collagen. Comp Biochem Phys B-Biochem Mol Biol 2001;128:81–90.
[25] Bodzenta J, Mazur J, Kázmierczak-Bałata A. Thermal properties of compressedexpanded graphite: photothermal measurements. Appl Phys B 2011;105:623–30.
[26] Vitorino N, Abrantes JCC, Frade J. Numerical solutions for mixed controlledsolidification of phase change materials. Int J heat Mass Trans 2010;53:5335–42.
[27] Frade J, Cable M. Reexamination of the basic theoretical model of the kineticsof solid state reactions. J Am Ceram Soc 1992;75:1949–58.
[28] Frade JR, Cable M. Numerical solutions for mixed control of powder reactionfor spherical, cylindrical, or planar particles. J Am Ceram Soc 1995;1:90–6.
[29] Gabuda SP, Gaidash AA, Drebushchak VA, Kozlova SG. Physical properties andstructure of bound water in collagen-type fibrillar proteins as studied byscanning calorimetry. JETP Lett 2005;82:6.
[30] Samouillan V, Delaunay F, Dandurand J, Merbahi N, Gardou JP, Yousfi M, et al.The use of thermal techniques for the characterization and selection of naturalbiomaterials. J Funct Biomater 2011;2:230–48.
[31] Banerjee S, Chakravorty D. Impedance of metal-gel derived film interface. Jpn JAppl Phys Part I 1997;36:7329–33.
[32] Vitorino N, Abrantes JCC, Frade J. Cellular PCM/graphite composites withimproved thermal and electrical response. Mater Lett 2013;92:100–3.
N. Vitorino et al. / Applied Energy 104 (2013) 890–897 897