A LATENT CLASS ANALYSIS PREDICTIVE MODELING ...
155
University of Mississippi University of Mississippi eGrove eGrove Electronic Theses and Dissertations Graduate School 1-1-2021 A LATENT CLASS ANALYSIS PREDICTIVE MODELING APPROACH A LATENT CLASS ANALYSIS PREDICTIVE MODELING APPROACH TO PROFILE DIVISION I COLLEGIATE ATHLETES FOR NUTRITION TO PROFILE DIVISION I COLLEGIATE ATHLETES FOR NUTRITION AND RELATIVE ENERGY DEFICIENCY IN SPORT (RED-S) AND RELATIVE ENERGY DEFICIENCY IN SPORT (RED-S) CONCERN CONCERN Morgan Delventhal University of Mississippi Follow this and additional works at: https://egrove.olemiss.edu/etd Recommended Citation Recommended Citation Delventhal, Morgan, "A LATENT CLASS ANALYSIS PREDICTIVE MODELING APPROACH TO PROFILE DIVISION I COLLEGIATE ATHLETES FOR NUTRITION AND RELATIVE ENERGY DEFICIENCY IN SPORT (RED-S) CONCERN" (2021). Electronic Theses and Dissertations. 2153. https://egrove.olemiss.edu/etd/2153 This Dissertation is brought to you for free and open access by the Graduate School at eGrove. It has been accepted for inclusion in Electronic Theses and Dissertations by an authorized administrator of eGrove. For more information, please contact [email protected].
-
Upload
khangminh22 -
Category
Documents
-
view
1 -
download
0
Transcript of A LATENT CLASS ANALYSIS PREDICTIVE MODELING ...

University of Mississippi University of Mississippi
eGrove eGrove
Electronic Theses and Dissertations Graduate School
1-1-2021
A LATENT CLASS ANALYSIS PREDICTIVE MODELING APPROACH A LATENT CLASS ANALYSIS PREDICTIVE MODELING APPROACH
TO PROFILE DIVISION I COLLEGIATE ATHLETES FOR NUTRITION TO PROFILE DIVISION I COLLEGIATE ATHLETES FOR NUTRITION
AND RELATIVE ENERGY DEFICIENCY IN SPORT (RED-S) AND RELATIVE ENERGY DEFICIENCY IN SPORT (RED-S)
CONCERN CONCERN
Morgan Delventhal University of Mississippi
Follow this and additional works at: https://egrove.olemiss.edu/etd
Recommended Citation Recommended Citation Delventhal, Morgan, "A LATENT CLASS ANALYSIS PREDICTIVE MODELING APPROACH TO PROFILE DIVISION I COLLEGIATE ATHLETES FOR NUTRITION AND RELATIVE ENERGY DEFICIENCY IN SPORT (RED-S) CONCERN" (2021). Electronic Theses and Dissertations. 2153. https://egrove.olemiss.edu/etd/2153
This Dissertation is brought to you for free and open access by the Graduate School at eGrove. It has been accepted for inclusion in Electronic Theses and Dissertations by an authorized administrator of eGrove. For more information, please contact [email protected].

A LATENT CLASS ANALYSIS PREDICTIVE MODELING APPROACH TO PROFILE
DIVISION I COLLEGIATE ATHLETES FOR NUTRITION AND RELATIVE ENERGY
DEFICIENCY IN SPORT (RED-S) CONCERN
A Dissertation
presented in partial fulfillment of requirements
for the degree of Doctor of Philosophy
in the Department of Nutrition and Hospitality Management
The University of Mississippi
MORGAN L. DELVENTHAL
December 2021

Copyright © 2021 by Morgan L. Delventhal All rights reserved
ii
ABSTRACT
Screening collegiate athletes for nutrition-related concerns and low energy syndromes
such as Relative Energy Deficiency in Sport (RED-S) provides insight for nutrition care and can
lead to necessary referrals in the sports medicine team. Screening may be a part of an athletic
department’s protocol, but there is a lack of consensus on a validated tool for this population.
The goal of this cross-sectional research was to use a Latent Class Analysis (LCA) predictive
modeling approach to determine classes of collegiate athletes who present with nutrition and
RED-S concern. LCA is a person-centered approach, intending to uncover subgroups of a
population with common characteristics. A total of 216 athletes (144 female, 72 male) at a
Division I university competing in various team sports completed a pre-participation nutrition
screening survey prior to participation in athletic sports. Measures such as menstrual function,
bone health, disordered eating, restrictive diets, food insecurity, body image, and nutrition
knowledge were collected. For female athletes, the LCA model provided some clinical relevance
that female athletes can be profiled into a two-class solution, providing practitioners and sports
dietitians insight into profiling athletes who may be at risk for low energy syndromes. For male
athletes, there was not enough evidence that a two-class solution was superior to a one-class
solution, highlighting the need for high-quality low energy syndrome tools to be developed in the
male collegiate athlete population. Future research should consider large sample sizes of athletes
to conduct predictive modeling techniques along with high quality, validated measurement tools.

iii
DEDICATION
To my dad, thank you for giving me the greatest gift I could ask for- believing in me. For
teaching me to work hard, to lead with kindness, to cherish what I have, and to choose faith over
fear. Your life was a testament to true success. You are forever in my heart. I love you.
“I think of my father’s passing and I think of how narrowly we define success. The culture sets
the bar unnaturally, imagining success is linear, objective, externalized terms. You are a success
if you make a fortune, or become famous, or win awards. No, no, success is actually something
else, something more subtle and incremental, something internally true and privately held. I think
of my father’s traumatic life and recognize what a profound success it was for him to simply stay
alive, to shift his lens toward positivity, to smooth the rough edges forged in life’s fires. That
alone was extraordinary. Success is finding a way to grow in the heart of a hopeless landscape.
To that I bow.” -Jeff Brown

iv
LIST OF ABBREVIATIONS AND SYMBOLS
AIC Akaike Information Criterion
BIC Bayesian Information Criterion
BMR Basal Metabolic Rate
CSSD Board Certified Specialist in Sports Dietetics
DE Disordered Eating
EA Energy Availability
ED Eating Disorder
EI Energy Intake
EEE Estimated Energy Expenditure
FFM Fat Free Mass
IOC International Olympic Committee
IBS Irritable Bowel Syndrome
LESS Low Energy Syndrome in Sport
OTS Overtraining Syndrome
NCAA National Collegiate Athletic Association
RD Registered Dietitian
RED-S Relative Energy Deficiency in Sport

v
ACKNOWLEDGMENTS
Thank you to my family and friends for the endless encouragement over the past four
years. To my sister Lauren, thank you for being by my side through it all. I truly would not have
made it through this process without you. You have been my source of inspiration and support
throughout this entire experience. Thank you mom and dad for all of your love. You have
believed in me and encouraged me throughout each step of my academic career. To my family
and sisters, thank you for reminding me of the amazing world outside of research and work. You
have kept me grounded in what is truly important. To my sweet pups Dempsey and Grey, thank
you for all of the cuddles and for warming my feet under my desk as I typed this dissertation.
Thank you to my committee members Dr. Melinda Valliant, Dr. Yunhee Chang, Dr.
Nadeeja Wijayatunga, Dr. Thomas Andre, and Dr. John Bentley for believing in my research and
work. I have learned so much from each of you. Melinda, thank you for allowing me to work
with Ole Miss Athletics for four years. Without your support and encouragement, this would not
be possible. Thank you for supporting me on this journey and for allowing me the space to think
creatively and to pursue this research.
Thank you to the Health and Sport Performance Team, specifically Dr. Shannon
Singletary, Dr. Marshall Crowther, and the team of amazing Athletic Trainers, Strength and
Conditioning Coaches, and Sports Psychologists. Thank you Dr. Heather Landry Shirley for the

vi
opportunity to work with all of the Athletic Trainers who supported and helped in the collection
of pre-participation physical data.
To Kate Callaway, thank you for being the best boss and mentor I could ask for. You
supported the importance of this work and were there for me from the early development of this
research and have supported me until the end. Thank you for guiding me into the sports dietitian
I am today, I am forever grateful.
Thank you to Monica Fowler at the University of Kentucky for introducing me to the
field of sports nutrition during my undergraduate time and for allowing me the opportunity to
work with UK Athletics. You have paved the way for so many.
Thank you to my undergraduate professors Dr. Liz Combs and Dr. Tammy Stephenson
for being an inspiration to me. Your continued support beyond my time at the University of
Kentucky means to world to me. Thank you to every professor at the University of Mississippi I
have learned from in Nutrition and Hospitality Management, Exercise Science, Counselor
Education, and Pharmacy Administration departments. Your hard work and dedication to
teaching have been an inspiration that I will carry into my future.
Thank you to my yoga family at Wildfire Yoga. Your classes have brought me a sense of
peace and calm in the months leading up to my defense. Thank you, Megan, Kelli, and Kylie for
supporting my inner strength and for guiding me in the practice of yoga. I am forever grateful for
you all and hold each of you in my heart.

vii
Thank you to my GRIT family. Tyler, Angie, and Nick, you all created such an amazing
team and made catering so much fun. Thank you for believing in me throughout graduate school.
To all of the athletes and coaches at Ole Miss, thank you for all of the memories and for
trusting me as your dietitian. To the soccer, tennis, baseball, track & field, and rifle athletes,
thank you for making each day so meaningful and filled with joy. Through it all, it has been an
honor to serve you all.
Thank you to the endless student volunteers, interns, and dietetic interns for working so
hard and for helping with all of the day-to-day tasks. You all are incredible. I will never forget
that I have been in your shoes.
To my fellow graduate assistants, doctoral students, and friends at the University of
Mississippi, thank you for the sense of comradery and for all of the fun we managed to fit in.
Game nights, Tuesday trivia, cookouts, and family dinners will always remind me of how we got
through it together. If you look at this in the future, please know that I believe in you and that
you are more capable than you can imagine. Your work will make a difference. Michaela and
Katie, thank you for helping me through this past year and for all of the encouragement as we
leaned on each other to make it through each step of our degrees.
To my 2021 Graduate Writing Group and Dean Kluck, thank you for giving me the final
push to finish this. Your support, accountability, and weekly affirmations have meant so much to
me. I cannot wait to read all of the amazing dissertations each of you will write.

viii
I would not be where I am today without everyone mentioned above who made my time
at the University of Mississippi and the past four years what it was. Thank you from the bottom
of my heart. The opportunity to earn a doctoral degree has been such a gift. I am forever grateful
for this time and that my path crossed with each of you.
ix
TABLE OF CONTENTS
ABSTRACT ................................................................................................................... ii DEDICATION ............................................................................................................... iii LIST OF ABBREVIATIONS AND SYMBOLS ............................................................ iv ACKNOWLEDGEMENTS ............................................................................................ v CHAPTER I: INTRODUCTION..................................................................................... 1 CHAPTER II: REVIEW OF LITERATURE ................................................................... 6 CHAPTER III: METHODS .......................................................................................... 29 BIBLIOGRAPHY ......................................................................................................... 35 LIST OF APPENDICIES .............................................................................................. 48 CHAPTER IV: MANUSCRIPT 1 ................................................................................. 57 CHAPTER V: MANUSCRIPT II ................................................................................ 102 VITA .......................................................................................................................... 142

1
CHAPTER I
INTRODUCTION
Energy deficiency in sports is due to overexercising or underfueling which can occur
with or without intention. Low energy availability (low EA) is the result of the imbalance of
energy availability which disrupts a eucaloric state. This can have detrimental short- and long-
term health and performance-related consequences in athletes. The term “RED-S” or Relative
Energy Deficiency in Sport was devised by the International Olympic Committee (IOC) in 2014
to expand the “female athlete triad” model. In contrast to the female athlete triad, RED-S
includes male athletes and additional health and performance consequences other than bone
health and menstrual dysfunction. The IOC published a 2018 update to the original Consensus
Statement expanding on the pathophysiology of the possible health and performance-related
consequences. Other recent publications have called for the need for an increased focus to be on
RED-S at the Olympic Sports Federations level and for drastic paradigm changes to be made for
the health of female athletes (Ackerman et al., 2020; M. L. Mountjoy, Burke, Stellingwerff, &
Sundgot-Borgen, 2018). There are calls for increasing awareness of RED-S, emphasizing the
importance to athletes’ health and prevention of long-term health consequences (Ackerman et al.,
2020). Furthermore, awareness and education is key for athletes, support staff, and coaches to

2
create a culture of positive beliefs about nutrition and food, the importance of energy for health,
positive body image, and menstrual dysfunction awareness.
Best practices regarding RED-S screening have yet to be developed for athletes in
varying developmental stages from adolescence to masters level athletes. The body of literature
for RED-S has primarily focused on assessment and diagnosis strategies such as the RED-S
Clinical Assessment Tool (CAT) rather than detection and screening (M. Mountjoy et al., 2015).
Early detection of athletes at risk for RED-S through RED-S specific screening may improve
athlete heath, and prevent irreversible damages if the syndrome goes undetected.
The prevalence of RED-S in college athletes is currently unknown at this time. There is
an overall lack of consensus regarding nutrition screening, specifically low EA and RED-S
screening for this population. College athletes may be at a heightened risk for low EA due to
varying levels of nutrition education when entering college, lack of education about fueling for
increased training loads in college, possible toxic training environments, and participation in
sports considered “high-risk” for RED-S and team sports. Additionally, college athletes must
balance school work and sports training and competitions often results in busy schedules.
Athletes may benefit from consultations with registered dietitians (RD) and board-certified
specialists in sports dietetics (CSSD) to determine fueling needs, strategies to meet energy
demands, and careful planning of meals and snacks around schedules.
Athletes who participate in high-risk sports such as aesthetic sports, endurance sports, or
weight category sports are known to be at an increased risk of developing low EA or RED-S, but
the prevalence is understudied and unknown for team sports (M. Mountjoy et al., 2014). College

3
athletics is comprised of various team sports with different sports offered depending on the
college or university. The National Collegiate Athletic Association (NCAA) identifies the
following sports into categories by season include: fall sports that include men’s and women’s
cross country, field hockey, football, men’s and women’s soccer, women’s volleyball, men’s
water polo; winter sports that include men’s and women’s basketball, bowling, fencing, men’s
and women’s gymnastics, men’s and women’s ice hockey, rifle, skiing, men’s and women’s
swimming & diving, men’s and women’s indoor track & field, wrestling; and spring sports that
include baseball, beach volleyball, men’s and women’s golf, men’s and women’s lacrosse,
rowing, softball, men’s and women’s tennis, men’s and women’s outdoor track & field, men’s
volleyball, and women’s water polo.
Current research conducted on female athletes and high-risk sports on the topics of low EA
and low energy syndromes such as RED-S and the Female and Male Athlete Triad has driven the
bulk of research efforts behind RED-S, and has contributed to the defining principles of the
syndrome. With the majority of research on high-risk sports, excluding team sports, the question
that is yet to be answered is how will future findings in team sports contribute and shape the
future of low energy syndromes. Will additional sports not previously considered be classified as
high-risk? Will awareness for the syndrome appear in male sports? How will universities and
colleges screen, assess and treat athletes that present with RED-S? Future research on this topic
should be inclusive of athletes from team sports, of racially diverse backgrounds, and for both
males and females in order to gain additional understanding on this complex syndrome. The aim
of this research is to profile athletes at risk for nutrition-related concern and RED-S in the
collegiate setting, including racially diverse athletes, males and females, and team sport athletes.

4
This research seeks to explore predictive modeling in collegiate athletics, an emerging
method in sport science, with hopes of understanding how athletes may be profiled through
cross-sectional data. The traditional RED-S framework along with additional possible
contributing factors such as nutrition knowledge and food insecurity will be used as indicators,
suggesting how new considerations may impact low energy syndromes. The goal of this study is
to detect student-athletes who may be of nutrition-specific health concern related to Relative
Energy Deficiency in Sport (RED-S) at the time of pre-participation health evaluations through a
latent class analysis predictive model. This study seeks to explore and answer two questions:
1. What conceptual groups exist that distinctly categorize female student-athletes that are of
nutrition-specific health concern related to Relative Energy Deficiency in Sport (RED-
S)?
2. What conceptual groups exist that distinctly categorize male student-athletes that are of
nutrition-specific health concern related to Relative Energy Deficiency in Sport (RED-
S)?
The first question will be answered through a latent class analysis model that identifies
levels of a latent categorical variable through the analysis of observed continuous and categorical
variables. The observed variables include measures consistent with the traditional framework of
RED-S for female athletes such as disordered eating, restrictive diets/dieting, menstruation, bone
health, will be included in this model. Along with the traditional indicators, three additional
measures will be considered. Food insecurity, nutrition knowledge, and body image will be

5
included in the model to explore how the RED-S framework can evolve in the future with
additional research efforts.
The second question will be answered through a latent class analysis model that identifies
levels of a latent categorical variable through the analysis of observed continuous and categorical
variables. The observed variables include measures consistent with the traditional framework of
RED-S for male athletes such as disordered eating, restrictive diets/dieting, and bone health, will
be included in this model. Along with the traditional indicators, three additional measures will be
considered. Food insecurity, nutrition knowledge, and body image will be included in the model
to explore how the RED-S framework can evolve in the future with additional research efforts.

6
CHAPTER II
REVIEW OF LITERATURE
Background on RED-S
RED-S was introduced by the IOC as a “broader, more comprehensive term” in 2014 to
describe the previously known low energy condition of the Female Athlete Triad (M. Mountjoy
et al., 2014). The IOC expert working group developed the 2014 RED-S Consensus Statement to
update the 2005 Female Athlete Triad Consensus Statement in light of new and continued
research on this topic that has evolved in recent years. The Consensus Statement includes current
literature to update and replace the previous documents, risk assessment guidelines, and return-
to-play guidelines to assist in the decision-making process (M. Mountjoy et al., 2014).
RED-S is defined as “impaired physiological function including, but not limited to,
metabolic rate, menstrual function, bone health, immunity, protein synthesis, cardiovascular
health caused by relative energy deficiency” with consideration to both male athletes and female
athletes (M. Mountjoy et al., 2014).. The Triad syndrome was expanded to account for the
multiple physiological effects of low energy beyond the three entities of energy availability,
menstrual function, and bone health.

7
The underlying etiological cause of RED-S is low EA due to the imbalance of energy due
to inadequate energy intake or excess energy expended. EA is calculated using the below
formula (Anne B. Loucks, 2004; Anne B Loucks, Kiens, & Wright, 2011):
𝐸𝑛𝑒𝑟𝑔𝑦𝐴𝑣𝑎𝑖𝑙𝑎𝑏𝑖𝑙𝑖𝑡𝑦(𝐸𝐴) =𝐸𝑛𝑒𝑟𝑔𝑦𝐼𝑛𝑡𝑎𝑘𝑒(𝐸𝐼)(𝑘𝑐𝑎𝑙) − 𝐸𝑥𝑒𝑟𝑐𝑖𝑠𝑒𝐸𝑛𝑒𝑟𝑔𝑦𝐸𝑥𝑝𝑒𝑛𝑑𝑖𝑡𝑢𝑟𝑒(𝐸𝐸𝐸)(𝑘𝑐𝑎𝑙)
𝐹𝑎𝑡𝐹𝑟𝑒𝑒𝑀𝑎𝑠𝑠(𝐹𝐹𝑀)(𝑘𝑔)
Low EA may be influenced by eating disorders (ED) or disordered eating (DE) but is situational
and may occur without any influence from ED/DE (M. Mountjoy et al., 2014).
The ten health consequences of RED-S were initially introduced in the 2014 Consensus
Statement from Mountjoy et. al include menstrual function, bone health, endocrine, metabolic,
hematological, growth and development, psychological, cardiovascular, and gastrointestinal
(2014). Ten potential performance effects of RED-S outlined in the same Consensus Statement
include increased injury risk, decreased training response, impaired judgment, decreased
coordination, irritability, depression, decreased glycogen stores, decreased muscle strength, and
decreased endurance performance (2014). The authors in a 2015 publication include
consideration that the visual representation of a complex syndrome can be difficult, and the
intention of the web figures is mainly to educate athletes and coaches through a simple tool
(Margo Mountjoy et al., 2015). However, it is difficult to visualize the complex interactions of
physiological and psychological and their mechanisms in the figures.
Low Energy Availability
The optimal state of EA is 45kcal/kg fat-free mass per day is recommended for proper
physiological functions, the range of 30-45kcal/kg fat-free mass per day is considered sub-

8
optimal, and less than 30kcal/kg fat-free mass per day is considered low EA and may result in
the impaired processes (D. Logue et al., 2018). The body responds to low EA by downregulating
fundamental body processes and enters “energy-saving mode” to conserve energy with a
decreased basal metabolic rate (BMR) (Keay & Rankin, 2019). The effects of low EA will be
explained in detail through the pathophysiology of RED-S below. Collecting information
regarding LEA in free-living subjects cannot be without error and it has been speculated that the
current methods to determine LEA through the published formula and ranges can lead to
inaccuracies. The pitfalls of collecting LEA information include that a standard protocol does not
exist, the equipment and resources needed to calculate each part, and the errors that may arise
due to the estimations (Burke, Lundy, Fahrenholtz, & Melin, 2018).
Pathophysiology of RED-S
The pathophysiology of RED-S seeks to explain impaired processes associated with the
syndrome (Horn, 2014). Each of the components of RED-S have unique physiological
impairments that affect different bodily processes and systems. The central contributing factor of
these impairments is low EA. While the 2014 IOC Consensus Statement introduced the possible
health consequences of RED-S, the 2018 update to the original Consensus Statement expands on
each of the processes. Although more information is provided, at this time the current literature
on each of the health consequences remains limited to some systems proposed in the original
Consensus Statement. This highlights the need for studies to study the effects of metabolic,
hematological, growth and development, cardiovascular, gastrointestinal, immunological, and
psychological in athletes suspected of RED-S. Menstrual function, endocrine, and bone health
9
have been examined in closer detail due to the parallels with the Triad. While the proposed
health consequences provide information beyond the Triad, practitioners should continue to
examine all of the possible effects of RED-S in the future to determine if other unknown aspects
of health are impacted by RED-S and to confirm that the original proposed health systems are
affected by various athletes from different sports, races, and ages.
Parallels between overtraining Syndrome (OTS) and Relative Energy Deficiency in Sport
(RED-S) are starting to be drawn. In a recent publication, authors explain the pathways,
symptoms and complexities of the syndromes and how researchers may consider the similarities
between the two (Stellingwerff et al., 2021). Both OTS and RED-S identification are based on a
diagnosis of exclusion but share the quality that both conditions affect health and performance
outcomes in athletes. A validated diagnosis method or tool does not currently exist for
overtraining syndrome or RED-S, but both have an overlap of symptoms. Decreased energy
availability and carbohydrate availability may be a confounding factor in overtraining syndrome.
Misdiagnosis of OTS may occur due to lack of awareness of RED-S. If LEA, under-fueling, or
low carbohydrate availability drive under-recovery in those suspected of over-training syndrome
or RED-S, adequate nutrition support is of high importance to prevent detrimental health and
performance outcomes
The pathophysiology of the currently known body systems affected by RED-S will be
outlined in detail below, describing how low EA leads to the disruption of the body system or
process. RED-S remains in its early stages; many physiological mechanisms derive from athletes
suspected of low EA or athletes in energy-deficient states such as eating disorders or disordered

10
eating. This highlights the need for original research to be conducted on athletes suspected of
RED-S to further aid in the understanding of this complex syndrome.
Endocrine and Menstrual Function
In respect to low EA, specific endocrine markers of interest have been studied. These
include hypothalamic releasing factors that include corticotrophin releasing hormone (CRH),
gonadotrophic releasing hormone (GnRH), thyrotropin releasing hormone (TRH). Pituitary
trophic hormones include thyroid stimulating hormone (TSH), adrenocorticotrophic hormone
(ACTH), follicle stimulating hormone (FSH), luteinizing hormone (LH), and growth hormone
(GH). Hormones produced by target organs include estradiol from the ovaries and testes, as well
as thyroid hormones, T3 and T4 (Keay, Francis, & Hind, 2018; Keay & Rankin, 2019). T3 has
been studied as a biomarker of EA, but results have been inconclusive. Female athletes may have
lower levels of T3 if menstrual irregularities are present with low EA, but males may not be
influenced in the same way (D. Logue et al., 2018).
In a state of energy deficiency there is a decrease in insulin and an increase in glucagon,
increases in glycerol and free fatty acids and lower fasting glucose levels (D. Logue et al., 2018).
This is due to the body relying on stored energy requiring processes such as gluconeogenesis and
glycogenolysis to occur for the body to have readily available glucose from non-carbohydrate
sources in a fasted state (Rui, 2014). These physiological metabolic impairments lead to the
outcomes of RED-S, so there is a great need for sex-specific tools to measure and identify
biomarkers that provide insight into the extent of low EA in both male and female athletes (D.
Logue et al., 2018).

11
In a recent 2018 review article focusing on the topic of reproductive hormones and
dietary intake regulating hormones, the authors review studies that include male and female
athletes that present with low EA and low energy states such as anorexia nervosa (K. Elliott-
Sale, A. Tenforde, A. Parziale, B. Holtzman, & K. Ackerman, 2018). The review covers
literature related to metabolic, endocrine, menstrual function, and bone health with are health
consequences in the RED-S model resulting from low EA on reproductive and interrelated
hormonal pathways in the body (M. Mountjoy et al., 2014). Hormones that have been examined
and may be affected by RED-S include adipokines, ghrelin and peptide YY (PYY), oxytocin,
insulin, amyline, incretins, growth hormone, insulin-like growth factor-1 (IGF-1), thyroid
hormones, and cortisol (K. Elliott-Sale et al., 2018). More complex systems like the
hypothalamic-pituitary-gonadal axis and bone health processes such as bone mineral density,
microarchitecture, and turnover makers have also been studied in low EA and RED-S. The
endocrine and metabolic effects relating to RED-S were described by McCall and Ackerman
with an emphasis on specific markers that should be examined using direct measurements
(2019). Ackerman et al also expanded on to other processes such as the hypothalmic-pituitary-
adrenal axis (HPA axis) and the hypothalamic-pituitary-thyroid axis. Hence, the meaurement of
hormonal functions including hinger and satiety hormones in athletes suspected of RED-S may
be helpful (McCall & Ackerman, 2019).
Past research on the hormonal effects of low EA in males is minimal (Burke, Close, et al.,
2018; De Souza, Koltun, & Williams, 2019; A. S. Tenforde, Barrack, Nattiv, & Fredericson,
2016) compared to the vast number of past literature in female athletes (Ackerman et al., 2019;
K. J. Elliott-Sale, A. S. Tenforde, A. L. Parziale, B. Holtzman, & K. E. Ackerman, 2018;

12
Falsetti, Gambera, Barbetti, & Specchia, 2002; Heikura et al., 2018; Keay et al., 2018; Maimoun,
Georgopoulos, & Sultan, 2014; Nose-Ogura et al., 2019).
It is well established that practitioners look at the menstrual function in female athletes to
assess endocrine function. The age of onset menstrual cycle, the state of being eumenorrheic,
amenorrhoeic or oligomenorrheic, and frequency of missed cycles are often analyzed when
assessing menstruation in female athletes. Functional hypothalamic amenorrhea (FHA) is
described by the IOC as “disruption of gonadotropin releasing hormone (GnRH) pulsatility at the
hypothalamus, followed by alterations of LH and follicle stimulating hormone release from the
pituitary and decreased estradiol and progesterone levels” and is the considered the most severe
of menstrual dysfunction requiring intervention (M. Mountjoy et al., 2018). Menstrual disorders
such as FHA must be diagnosed by a healthcare professional through a clinical evaluation. The
2014 Female Athlete Triad Coalition Consensus Statement outlines an amenorrhea algorithm to
follow if an individual is suspected for primary or secondary amenorrhea, and prolonged
oligomenorrhoea with the expertise of a physician or endocrinologist if necessary (De Souza et
al., 2014). This algorithm may be useful for practitioners to use when examining athletes who
may be suspected of menstrual dysfunction.
Related to menstrual function, a study found that higher levels of cortisol have been
observed in females with menstrual dysfunction, and can indicate physiological stress during
intensive training (D. Logue et al., 2018). In junior elite female swimmers, ovarian suppression
impaired athletic performance. Ovarian suppression mainly occurs when the training is carried
out with the body was in a state of energy conservation and this leads to poor performance
(VanHeest, Rodgers, Mahoney, & De Souza, 2014).

13
While some short-term effects of RED-S have been studied, the long-term health effects
are lesser known. In the context of the endocrine system, long-term reproductive health is
currently understudied and remains unknown (M. Mountjoy et al., 2014). Reproduction is closely
related to EA in relation to survival, so the repercussions of long-term reproductive athlete health
such as longitudinal studies related to fertility may be of interest to future researchers (K. J.
Elliott-Sale et al., 2018).
Bone Health
Similarly to endocrine function, bone health is often studied relating to the Triad and low
EA (Barrack, Fredericson, Tenforde, & Nattiv, 2017; Beals & Hill, 2006; A. F. Doyle-Lucas, J.
D. Akers, & B. M. Davy, 2010; Ashley F. Doyle-Lucas, Jeremy D. Akers, & Brenda M. Davy,
2010; K. J. Elliott-Sale et al., 2018; Heikura et al., 2018; Keay et al., 2018; Maimoun et al.,
2014; Nose-Ogura et al., 2019). Physiologically, lower levels of insulin-like growth factor-1
(IGF-1), T3 and T4, and estradiol, contributing to osteoporotic bones (Keay et al., 2018; Keay &
Rankin, 2019). Bone mineral density can be measured using Dual-energy X-ray absorptiometry
(DXA). Practitioners can assess the risk levels of athletes using Z-scores from the DXA and
number of stress fractures (E. Joy et al., 2014). Typically, two or greater stress fractures, one or
greater stress fracture in trabecular bone sites, and a Z-score greater than or equal to two is
indicative of high risk (E. Joy et al., 2014). Unfortunately, many athletes may not notice the
repercussions of low EA and RED-S until an injury such as a stress fracture occurs. Past history
of vitamin D deficiency should also be considered to determine on an individual basis if an
athlete may present with vitamin D deficiency.

14
Metabolic Function
The impairment of metabolic function seen in RED-S is due to the reduction of glucose
utilization, mobilization of fat stores, reduced metabolic rate and lowered production of growth
hormone (A. B. Loucks & Thuma, 2003). The 2018 IOC Consensus Statement update provided
additional information for the metabolic component of RED-S by including possible reductions
in resting metabolic rate (RMR), leptin, T3, IGF-1, and an increase in ghrelin (M. Mountjoy et
al., 2018). Overall, information regarding metabolic alterations due to RED-S at this time is not
well established. Resting metabolic rate may provide some insight into how the body may be
reach an energy deficient state similar to starvation and energy conservation, but direct
relationships have not been established. It is important to note that published guidelines for
testing for markers or metabolic testing in athletes suspected of RED-S is currently unknown and
unavailable for assessment and treatment. A study on male and female ballet dancers found that a
reduced RMR ratio of predicted to measured rate (RMR<0.90) can be used as a surrogate marker
for energy deficiency (Staal, Sjödin, Fahrenholtz, Bonnesen, & Melin, 2018).
Hematological Changes
The interconnected relationship between low EA and iron deficiency has been discussed
in the IOC 2014 Consensus Statement with regards to various aspects of athlete health, but there
are many gaps (M. Mountjoy et al., 2014). Female athletes may experience iron deficiency
anemia at a higher frequency than males due to menstruation, but the direct or indirect
contribution to energy deficiency is not clear. Furthermore, the frequency in which males have
hematological repercussions related to RED-S is not documented at this time. A narrative review

15
on iron considerations for athletes outlines the possibility of impaired iron regulation in athletes
due to RED-S. This could be resulting from a low EA state with possible inadequate dietary
intake and/or iron absorption (M. Sim et al., 2019). Past history of iron deficiency may also be
considered to determine on an individual basis if an athlete may present with iron deficiency or
anemia.
Growth and Development
Athletes of all ages may participate in sporting events and team sports, so it is important
to consider how RED-S may affect athletes of all ages. Youth and adolescent athletes with
reported eating disorders such as anorexia may experience impaired growth and development
through altered GH and IGF-1 levels and restricted linear growth, but it is unknown how
adolescent athletes suspected of RED-S may suffer the health consequence of altered growth and
development (M. Mountjoy et al., 2018).
Psychological Health
Psychological health consequences may precede or be a cause of low EA (M. Mountjoy
et al., 2014). The incidence rates of individuals suspected of RED-S and those with a diagnosed
eating disorders are currently unknown. Various aspects of psychological well-being, mental
health, and diagnosed psychological disorders should be examined when exploring athletes
suspected of RED-S. Athletes with various diagnosed eating disorders and disordered eating
tendencies should be examined for the risk of RED-S and low EA.
Cardiovascular Health

16
Research on RED-S is lacking regarding the relationship between suspected RED-S and
cardiovascular health consequences is lacking. From the current body of literature on athletes
diagnosed with FHA and/or EDs such as anorexia nervosa that are in a severe state of low EA, it
can be noted that endothelial dysfunction, unfavorable lipid profiles, bradycardia, hypotension,
and arrhythmias may occur along with other possible significant cardiovascular changes (M.
Mountjoy et al., 2018). Cardiovascular health consequences should be of high concern to the
sports physician and sports medicine team due to the severity in nature.
Gastrointestinal Health
Athletes in a low EA state or with a diagnosed eating disorder such as anorexia nervosa
may experience varying symptoms related to impaired functioning of the gastrointestinal tract,
with possible symptoms such as delayed gastric emptying, constipation, and increased intestinal
transit time (M. Mountjoy et al., 2018). Gastrointestinal health consequences may include a
broad definition of issues related to impaired functions, so a large gap remains in how to
effectively screen, assess, and treat individuals suspected of RED-S with such health
consequences. Gastrointestinal issues such as irritable bowel syndrome (IBS), Celiac disease,
and other gastrointestinal tract-related diseases may be worth considering when assessing low
EA and RED-S. The relationship between low energy intake due to dietary restrictions and RED-
S should be explored.
Immunological Health

17
Research on the association between altered immune function and RED-S is limited.
However, the 2018 IOC Consensus Statement mentions that there is a possible link between low
EA and immune health consequences (M. Mountjoy et al., 2018). When examining the immune
system related to RED-S, the likelihood of illnesses and infections may be difficult to assess due
to the complex nature related to the immune system.
Performance Related Consequences of RED-S
Associations between various performance-related consequences and surrogates of low
EA have been established, but few studies have directly looked at the impact of low EA on
performance (M. Mountjoy et al., 2018). A variety of indirect mechanisms such as impaired
recovery, acute impairment of key processes such as glycogen storage or protein synthesis,
impairment of optimal muscle mass and function may be impacted by low EA.
Overlap Between Terminology in Low Energy Syndromes and the Athlete Triad
Recently, a new working model similar to the Female Athlete Triad but for male athletes
called “The Male Athlete Triad” was proposed. This new working model looks at how energy
availability, reproduction, and bone health are affected in male athletes, mirroring the Female
Athlete Triad model (De Souza et al., 2019). Male athletes may be more resilient to the effects of
low energy availability, requiring a higher level of severity before disturbances are observed.
Although a key defining factor of RED-S is the inclusion of male athletes, many cited studies in
the 2018 Consensus Statement update regarding the explanation of the ten health consequences

18
of RED-S rely on research conducted solely on female athletes. Further studies should examine
the effects of RED-S on males as well as in females.
A recent narrative review on the Female Athlete Triad, RED-S, and the Male Athlete
Triad explores each of the conditions and their components with brief defining criteria provided
(Statuta, 2020). The term “low-energy syndrome” was used to describe and group the three
syndromes into one for ease of understanding in the review. At this time, the controversy
between what each syndrome is defined as and the inevitable crossover between signs and
symptoms related to each of the syndromes exists. As research emerges in the field, screening,
assessment and diagnosis of said syndromes should be updated and should evolve as best
practices relating to athlete health emerge. The term “low-energy syndrome in sport” (LESS)
may be worth considering for future research for ease of understanding. Due to the complexity of
the interrelated syndromes, the numerous proposed health and performance consequences
outlined in the RED-S infographics, the influence of low EA, and the Male and Female Athletes
Triad models, it can be confusing to researchers studying these similar syndromes.
Nutrition Specific to College Students
The transition time for college students and the adjustment to a new environment can be a
time of new independence (Pancer, Hunsberger, Pratt, & Alisat, 2000). For students living on
campus, a new environment away from home may change eating habits and access to food. A
study across multiple universities found that 19% of first-year students were food insecure and
were at a higher odds of poor sleep quality, disordered eating behaviors, lower grade point
averages (GPA) and higher levels of stress (El Zein et al., 2019). Another study at a large

19
university in the southeastern United States found that 14% of students experience food
insecurity with an emphasis on financial factors such as financial freedom, family support, food
assistance, and other financial and food management skills that played a role in food insecurity
(Gaines, Robb, Knol, & Sickler, 2014). If students have access to food preparation facilities such
as dorm kitchens or community spaces with cooking areas, dietary intake may be positively
impacted. A study on young adults found that the biggest barrier to food preparation was time,
but those who reported frequent food preparation were more likely to meet targets for fat,
calcium, fruits and vegetables, and whole grains as well as less fast-food consumption (Larson,
Perry, Story, & Neumark-Sztainer, 2006). Student-athletes transitioning to college and
universities may also experience common nutrition-related issues as previously mentioned, but
must also balance busy schedules due to sport and increased energy needs. Future studies may
wish to explore if similar food preparation, food insecurity, and financial factors impact this
population.
Nutrition Specific to College Athletes
The National Collegiate Athletic Association (NCAA) is comprised of 1,098 colleges and
universities, 102 athletics conferences, nearly 500,000 college athletes on 19,886 teams in 24
sports across 3 divisions (NCAA, 2021). Student-athletes participating in NCAA athletics in the
United States receive academic support, medical care, access to coaching, facilities, and
equipment at their respective university. Annually, NCAA schools award nearly $3.5 billion
dollars in athletic scholarships with some Division I schools offering additional funds to cover
costs not covered by a scholarship. NCAA Division I and II schools can provide unlimited meals

20
to support the nutritional needs of student-athletes, but only some schools have registered
dietitians (RD), nutritionists, and other health professionals designated to work with athletes. A
study found that nutrition education from a registered dietitian improved energy intake,
macronutrient intake, and nutrition knowledge in 11 NCAA Division I female volleyball athletes
(Valliant, Pittman Emplaincourt, Kieckhaefer Wenzel, & Garner, 2012).
Athletes attending universities and colleges are often 18 to 24 years old, living on their
own away from family for the first time, and are required to balance school work and sport
obligations. Nutritionally this can be a critical time as growth and development of adolescence is
ending, peak bone mass is reached (females age 18, males age 20), and fueling demands for
college levels sports may increase. These factors relate to energy availability and the importance
of meeting nutritional needs for health and performance.
A unique aspect of collegiate athletics is the focus on team sports and the subcultures
within different institutions and individual teams. Body image has been linked to disordered
eating and eating disorder behaviors but is not currently included in the RED-S framework. Body
image was considered with eating disorder behaviors in elite Icelandic athletes, with 17.9% of
the athletes having severe or moderate body image dissatisfaction, and 18.2% of athletes above
the clinical cutoff for body image concern, with more women’s scores being higher than the
men’s overall (Kristjansdottir, Sigurethardottir, Jonsdottir, Thornorsteinsdottir, & Saavedra,
2019). Social media may also play into one’s body image and appearance-related comparisons,
which has been looked at in college females (Hendrickse, Arpan, Clayton, & Ridgway, 2017). In
college athletes body image may be of concern due to weight pressures from peers, teammates,

21
coaches, fans and other individuals. The WPS tool was developed for male collegiate athletes
and the sample included athletes from aesthetic sports such as diving and weight class sports
such as wrestling in which body appearance and weight are a focus. Body image is an important
component to assess because of the relation to dieting behavior and the psychological component
of RED-S that can precede or be a result of RED-S.
It has been speculated that RED-S may occur at an increased rate in high-risk sports, but
if all sports including team sports are not included in the body of literature and work, then the
prevalence may be unknown. To date, there have been further research is needed to investigate
the incidence of RED-S in team sports (M. L. Mountjoy et al., 2018).
Literature on the Method
Nutrition screening and assessments are typically conducted in the clinical healthcare
setting for conditions such as malnutrition, sarcopenia, and critically ill patients. Screening
implies the process of indicating risk factors for a deprived nutrition condition and nutrition
assessment providing the nutrition diagnosis for conditions such as undernutrition in the hospital
setting (Correia, 2018). A review by Charney explains in detail the distinction between screening
and assessment in healthcare, and notes how nutrition screening can facilitate the development of
nutrition assessment programs for best nutrition intervention outcomes (Charney, 2008).
A recent review on questionnaires as measures for low energy availability (LEA) and
relative energy deficiency in sport (RED-S) in athletes found thirteen questionnaires to identify
LEA/RED-S risk (A. Sim & Burns, 2021). The most widely used validated questionnaires were

22
the LEAF-Q and the EDE-Q. The LEAF-Q determines LEA risk but nearly half of the questions
are related to menstrual function so it cannot be used in males. The BEDA-Q was also
mentioned, noting that is only validated in female elite adolescent athletes, the items are not
female-specific and the possibility exists for utilizing the tool in male athletes. The BEDA-Q
measure was also recently used to assess LEA in female athletes (Ackerman et al., 2019). The
current available questionnaires may be effective in identifying intentional energy restriction but
there is a current need for questionnaires that identify unintentional imbalances between energy
intake and estimated energy expenditure
Latent Class Analysis
Latent Class Analysis (LCA) was introduced as a technique to explore latent classes of
individuals in an exploratory manner utilizing a unrestricted model (McCutcheon, 1987). LCA is
an explanatory modeling technique that allows for the grouping of individuals with similar
characteristics (Mori, Krumholz, & Allore, 2020). The aim of this model is to estimate the
probability of each athlete being a member of each latent class. LCA can be a helpful modeling
technique that focuses on individuals rather than indicators. Personal behaviors and
characteristics are used to determine latent profiles based on similar responses to the indicators
and variables of interest (Spurk, Hirschi, Wang, Valero, & Kauffeld, 2020). The goal is to
uncover underlying patterns of shared behavior that are of interest to the researcher.
LCA is useful when the goal is to use an individualized approach while still having the
need to understand the general patient population. Additionally, through the exploration of
numerous subgroup solutions, various statistical and clinical parameters can be utilized to

23
determine the best fitting model. Discretion is necessary to determine the preferred model that
best presents the data, has a reasonable distribution of individuals across the identified
subgroups, has a high certainty of classification and each of the subgroups having clear clinical
characteristics (Kongsted & Nielsen, 2017)
This technique is especially useful or researchers in social sciences to explore patterns of
shared behaviors between samples. These patterns of interest may be missed when individual
variable-centered analyses are conducted. The overarching goal of LCA is to determine
subgroups of individuals who share meaningful and interpretable pattern of responses on the
measures of interest. This person-orientated approach recovers hidden groups in data through the
use of probabilities of individuals belonging to different groups (Ferguson, G. Moore, & Hull,
2019).
An overarching goal of LCA is to identify groups based on responses to a set of observed
indicators. LCA, a finite mixture model has been used to identify subgroups in a range of
substantive areas to characterize heterogeneity in a population with respect to a given
phenomenon. It is a ‘person-centered’ approach that uses a mathematical evaluation of how well
a proposed LCA model represents the data (Nylund-Gibson & Choi, 2018). Additionally, LCA
can be used to develop typologies and is utilized in predictive models. LCA can use a wide
variety of data with differing variances, and is a powerful alternative to other statistical
techniques such as K-means for clustering (Schreiber, 2017).
Analytic algorithms such as LCA allow the use of multiple indicator variables to identify
homogenous subgroups within heterogenous populations can be beneficial for the healthcare
team. Probabilities are generated for membership in all the identified classes in the model,

24
indicating which individuals belong to the determined classes (Sinha, Calfee, & Delucchi, 2020).
Clinical prediction models are expected to benefit sports medicine practice, but only if they are
properly developed and validated. These models may help guide decision making processes in
clinical medicine but are not commonly used in sports medicine (Bullock et al., 2021). A focus
on the methodology, specifically model development, model performance, and validation must
be considered when conducting prediction research.
Collegiate Nutrition Screening Protocols
At this time, a validated and widely used nutrition screening protocol is not available for
college athletes. At the NCAA institutional and university level, screening policies and survey
tools utilized are dependent on individual policies developed by sports medicine athletic
directors, athletic trainers, and nutrition staff if available.
It is unknown at this time if annual screening for low energy syndromes such as RED-S
and the Triad, or for eating disorders is conducted routinely at NCAA institutions. The screening
and diagnosis of RED-S can be subtle and challenging to uncover, so individuals well versed in
the symptomatology should be involved in the screening protocols developed (M. Mountjoy et
al., 2014). The shortcomings of currently published screening tools include that there is a lack of
consensus on what tool to use and the current tools are limited by lack of validation. Many tools
were focused only on males or females and did not target college athletes and team sports.
One of the common screening tools utilized in athletic populations is the Low Energy
Availability in Females Questionnaire (LEAF-Q). The LEAF-Q has shown variable results in

25
identify female athletes at risk of the Female Athlete Triad, but it is limited in the fact that only
female athletes can utilize this screening tool (Melin et al., 2014). A recent review published in
2021 on questionnaires as measures for low EA and RED-S found that the LEAF-Q and Eating
Disorder Examination Questionnaire (EDE-Q) were the most widely used validated
questionnaires, but limitations include that nearly half of the items in the LEAF-Q relate to
menstrual function so it cannot be used in males (A. Sim & Burns, 2021). The LEAF-Q was
recently used to identify young football players at risk for RED-S in Poland, providing insight
into team sports (Łuszczki et al., 2021). The main focus of the EDE-Q is to identify eating
disorder risk as a surrogate marker of RED-S, and fails to address the numerous health
consequences associated with the syndrome. A narrative review on low EA published in 2020
highlights the need for sport and sex-specific screening tools to identify athletes participating in a
variety of sports at risk of RED-S (D. M. Logue et al., 2020).
A review on the Triad and RED-S provides examples of published screening tools,
current recommendations for conducting screening for low energy syndromes, and important
concepts of the syndromes to include in screening (Tayne, Hrubes, Hutchinson, & Mountjoy,
2019). The authors mention that “the pre-participation physical examinations are a provider’s
best chance of detecting a problem before the athlete develops more severe pathology or injury
or before there is a negative impact on performance.” The detrimental health consequences of
RED-S cannot be understated, and during the screening protocol “if the provider notes one
component of RED-S in an athlete, the provider should continue a further, more in-depth
evaluation of history, physical examination, and laboratory investigations.” This

26
recommendation ties back to differentiating the nutrition screening and assessment protocols
previously mentioned.
Eating disorders have been shown to occur in higher incidences in athletes compared to
the general population, so tools specifically created for the athletes should be utilized as an
important component of nutrition screening (Elizabeth Joy, Kussman, & Nattiv, 2016; Sundgot-
Borgen & Torstveit, 2004). The Brief Eating Disorder in Athlete Questionnaire BEDA-Q has
been validated to identify EDs in the female athlete population (M. Martinsen, I. Holme, A. M.
Pensgaard, M. K. Torstveit, & J. Sundgot-Borgen, 2014). A pitfall of ED screening tools can be
that they often include an interview portion and can be lengthy, so with 9 items, the BEDA-Q
may fill the need for an athletic specific short ED screening tool. The use of the BEDA-Q in
male athletes should be investigated since the questions are not sex-specific and the tool has not
been previously used in males.
The association between food insecurity and RED-S is yet to be studied. Furthermore,
food insecurity as a contributing factor to low EA in the athletic population is currently
unknown. The lack of access to nutritious food, or inadequate means to acquire, prepare and
consume food is a substantial barrier to proper nutrition. One study found that food insecurity in
college athletes was found to be significantly correlated with hoarding food and being
preoccupied with food (Poll, Holben, Valliant, & Joung, 2018). Additionally, food insecurity and
lack of finances may also contribute to malnutrition in some populations (Burke, Close, et al.,
2018). Additionally, in the 2018 IOC Consensus Statement on RED-S, authors state that
“cultural, social, psychological, and financial factors contribute to low energy availability” so the

27
food security status and scholarship status in collegiate athletes warrant further investigation (M.
Mountjoy et al., 2018).
A review on nutrition knowledge in athletes highlights the need for future research to use
validated tools to measure nutrition knowledge in athletes and to further solidify the
understanding of the relationship between nutrition knowledge and dietary intake (Heaney,
O'Connor, Michael, Gifford, & Naughton, 2011). Nutrition knowledge has been studied in
relation to low EA in female Australian rules football players with results finding low sports
nutrition knowledge and a 30% risk of low EA in the 30 athletes studied (Condo, Lohman, Kelly,
& Carr, 2019). A study on nutrition knowledge in collegiate athletes found poor nutrition
knowledge scores of 57.6% ± 18.6% on the survey, with the possible impact on performance and
injury risk (Werner, Guadagni, & Pivarnik, 2020). Although nutrition knowledge has not been
studied in relation to low energy syndromes like RED-S, assessing nutrition knowledge may be
an important component of nutrition screening. Baseline nutrition knowledge measurements can
aid in the development of team nutrition education with target interventions. This possible
relationship should be explored to determine if the two concepts are interrelated.
Gaps in the Literature
Throughout the review of literature, gaps in knowledge and shortcoming for the
compressive understanding of this emerging topic have been mentioned. It is important to note
that RED-S was introduced in 2014, so gaps in knowledge for this complex syndrome will
continue to be filled as new research emerges. The overarching gap in research at this time is the
lack of information on racially diverse athletes from a variety of athletic groups, team sport

28
athletes, and male athletes. The updated 2018 Consensus Statement on RED-S by the IOC leaves
final remarks on future directions for scientific researchers, with a focus on the development of
methodology to screen and identify athletes at risk for RED-S that is “scientifically validated and
relevant and applicable in clinical sports practice” (M. Mountjoy et al., 2018). Additionally,
authors identify that a gap remains in the “understanding of RED-S in specific sports with
differing energy demands, performance criteria, ethnicities and cultural perspectives” with the
need for ongoing research efforts on male athletes in addition to female athletes, team sport
athletes participating in a wide array of sports, and athletes from various cultural backgrounds.
Purpose of the Study
The goal of this study is to detect student-athletes who may be of nutrition-specific health
concern related to Relative Energy Deficiency in Sport (RED-S) at the time of pre-participation
health evaluations through a latent class analysis predictive model. The profiling of athletes will
be done through a latent class analysis approach with the goal of the identification of classes of
athletes of concern using probabilities. Due to the lack of a gold standard at this time for
nutrition screening, RED-S screening, and collegiate athlete screening, this model will be
exploratory in nature with no known classes identified a priori.
Furthermore, if classes of athlete of concern are identified, more diagnostic testing can be
done to determine if RED-S is present. With the focus on athlete health and safety, it is vital to
screen, identify and treat athletes in respect to low EA and RED-S to prevent detrimental short-
and long-term health and performance consequences.

29
CHAPTER III
METHODS
Study Design
The study is a quantitative cross-sectional study utilizing a web-based survey software to
explore nutrition-related health concerns including RED-S through nutrition screening in
collegiate athletes. Through the Latent Class Analysis model, individuals were profiled to
determine classes of individuals of concern. The data for this study were generated using
Qualtrics software with electronic administration for the Nutrition Screening Survey (Qualtrics
Provo, UT, 2021).
Recruitment and Data Collection Procedures
All participants were current athletes at the University of Mississippi and 18 years of age
or older. Information collected on each athlete was protected as a part of the student athletes’
personal medical record. Data will be collected and stored in a Health Insurance Portability and
Accountability Act (HIPAA) compliant Box account created by the University of Mississippi
Athletics Health and Sports Performance Center (Box Redwood City, CA, 2021). Surveys that
were administered to athletes will require the use of a unique 4-digit code that will be de-identify
the identity of the athlete for all data storage and research purposes. A master Excel sheet

30
matching the unique 4-digit code to the athletes’ identity will be securely stored in the Box
account and restricted access to individuals deemed necessary for administering the survey. Data
collection occurred during the time of annual preparticipation evaluations concurrent with
ImPACT concussion testing during the summer months before the start of the fall semester.
Athletic Trainers assisted the sports nutrition staff to assure completion of the nutrition
screening. Ethical approval from the University of Mississippi Institutional Review Board was
obtained (Protocol # 22x-017) as well as support from the University of Mississippi Athletics
Department and Health and Sports Performance Center.
Variables and Measurement
Various nutrition and RED-S components were measured through a variety of previously
published screening tools outlined below. Similar survey methodology was used, with reference
to a recent study that conducted a cross-sectional study on patients that presented to the Division
of Sports Medicine at Boston Children’s Hospital (Ackerman et al., 2019). As mentioned in their
study, due to the lack of a validated or standard measure for RED-S, survey measures based on
validated and/or standard questionnaires for each topic as available were used. The measures
used are included in Appendix A.
Low energy availability can be difficult to measure outside of the laboratory setting.
Therefore, a surrogate marker for low energy availability was eating disorder risk, self-reported
history of eating disorders, and self-reported adherence to special diets. Eating disorder risk was
measured through the Brief Eating Disorder in Athlete survey (BEDA-Q) which has 9 questions,
6 pulled from the Eating Disorder Inventory (EDI) survey (Marianne Martinsen, Ingar Holme,

31
Anne Marte Pensgaard, Monica Klungland Torstveit, & Jorunn Sundgot-Borgen, 2014). The
BEDA-Q is scored through a weighted equation score with the six items from the EDI totaling to
a maximum of 18 points with an optimal cutoff score of determined by researchers to classify
athletes as at-risk or not at-risk for disordered eating . Special diet was considered through the
question: Are you currently following or have you ever followed any special dietary
considerations for personal reasons, diagnosed conditions, or religious reasons? (vegan,
vegetarian, gluten-free, dairy-free, religious fasting, paleo, etc.). Number of meals consumed per
day provides insight into if athletes are missing meals and will be assessed through a 24-hour
food recall. While a pre-determined number of meals is dependent on individual energy needs,
literature has shown that not consuming at least 3 meals per day can be indicative of disordered
eating (Adam S Tenforde et al., 2021).
Bone health was assessed through self-reported history of stress fractures including the
number of stress fracture and the site of the stress fracture, with high-risk sites include lumbar
spine, femoral neck, sacrum, and pelvis. Questions regarding bone health originate from the
WHEL Survey (Koltun et al., 2019).
Various questions regarding menstrual function was utilized from the WHEL Survey
(Koltun et al., 2019). Through the display function of Qualtrics, menstrual function questions
will only appear if the female sex is selected in the demographic section. Questions regarding
age of onset menstruation and menstrual irregularity was asked. The goal of these self-reported
questions was to determine if delayed menarche or menstrual irregularity is present and if further
investigation is warranted through a sports medicine physician or endocrinologist.

32
The U.S. Household Food Security Survey includes a traditional 10- or 18-item full
survey for assessing food insecurity. Adapted from the full survey, a two-item food insecurity
screening tool based on Questions 1 & 2 of the U.S. Household Food Security Survey has been
validated for use as a screening tool in the health care setting. It has been found to have levels of
sensitivity across high-risk population subgroups of ≥97 % and a specificity of ≥74 % for food
insecurity (Gundersen, Engelhard, Crumbaugh, & Seligman, 2017). Athletes who screened
positive for food insecurity should be referred for a nutrition consultation with the nutrition staff.
Nutrition knowledge was assessed through the use of the Abridged Nutrition for Sport
Knowledge Questionnaire (A-NSKQ). The A-NSKQ is a valid and reliable brief questionnaire
designed to assess general nutrition knowledge (GNK) and sports nutrition knowledge (SNK) in
athletic populations (Trakman, Forsyth, Hoye, & Belski, 2018). The full questionnaire is
included in the appendix.
Body image was assessed through the Weight Pressures in Sport (WPS) tool developed
for male college athletes. It has been validated for use for detecting various sources of weight
pressures and body image in the college athlete population (Galli, Petrie, Reel, Chatterton, &
Baghurst, 2014; Galli, Reel, Petrie, Greenleaf, & Carter, 2011).
Although there is not a consensus at this time for measuring energy expenditure in free-
living college athletes directly related to calculating EA, it is known that athletes expend energy
beyond that of the average individual. College athletes participate in a variety of team sports
depending on the university or college, the athletic division, and the university budget. This

33
includes both male and female athletes; fall, winter, and spring sports; and varying levels of
intensity and duration of specific sports.
Statistical Analysis
Data were analyzed using a latent class analysis (LCA) model approach to uncover
subpopulation structure for the probability of determining athletes at risk of RED-S. The LCA
model was introduced as a technique to explore latent classes of individuals in an exploratory
manner utilizing a unrestricted model (McCutcheon, 1987). The variables of interest will be
included in the linear mixed model with separate male and female models. This method
characterizes the possible indicator variables of RED-S to unveil the relationship between the
variables of interest and unknown latent classes of individuals who may be of nutrition and
RED-S concern, considering each sex separately.
Latent class analysis is an exploratory modeling technique that allows for the grouping of
individuals with similar characteristics (Mori et al., 2020). The aim of this model is to estimate
the probability of each athlete being a member of each latent class. Due to the difficulty directly
measuring RED-S, this method would help identify the latent variable through the observed
variables that serve as indicators. LCA can be a helpful modeling technique that focuses on
individuals rather than indicators.
LCA Statistical Analysis
There are a number of considerations when determining which latent class model that
best fits the individuals of interest. If many sampling zeros are present in the dataset, sparseness
exists. This differs from structural zeros. If sparseness occurs, it leads to difficulties in model

34
evaluation. Lack of consensus on a general rule of thumb for sample size but it has been
established that LCA models are case sensitive and require large sample sizes into the hundreds.
Determining number of classes, also named class enumeration, involves fitting several
LCA models with differing numbers of latent classes, collecting fit information for each model,
then studying patterns to decide how many classes best describe patterns observed in the data
(Nylund-Gibson & Choi, 2018). Information such as goodness of fit statistics can be analyzed to
evaluate the model fitness. The Akaike Information Criterion (AIC), Bayesian Information
Criterion (BIC), Sample-size adjusted BIC all are considered for goodness of fit. BIC helps in
model selection by penalizing the number of factors, providing insight into the model fit.
The LCA model with the smallest values for AIC, BIC and sample-size adjusted BIC are
considered to be the best fitting model. The solution with the largest loglikelihood is considered
to be better fitting than a model with lower loglikelihood values.
Lo-Mendell-Rubin Adjusted Likelihood Ratio Test (LMR-LMT) compares models with
varying numbers of classes. If p-value < 0.05, the model with one fewer class is a better fit for
the data (Lo, Mendell, & Rubin, 2001). If the p-value is ≥ 0.05, the model would need to be
reclassified with fewer classes. The parametric bootstrapping p-value is also of interest, with a p
value ≥0.05 indicating that the model needs to be reduced in class size.

35
BIBLIOGRAPHY

36
Ackerman, K. E., Holtzman, B., Cooper, K. M., Flynn, E. F., Bruinvels, G., Tenforde, A. S., . . .
Parziale, A. L. (2019). Low energy availability surrogates correlate with health and
performance consequences of Relative Energy Deficiency in Sport. Br J Sports Med,
53(10), 628-633. doi:10.1136/bjsports-2017-098958
Ackerman, K. E., Stellingwerff, T., Elliott-Sale, K. J., Baltzell, A., Cain, M., Goucher, K., . . .
Mountjoy, M. L. (2020). #REDS (Relative Energy Deficiency in Sport): time for a
revolution in sports culture and systems to improve athlete health and performance. Br J
Sports Med, 54(7), 369-370. doi:10.1136/bjsports-2019-101926
Barrack, M. T., Fredericson, M., Tenforde, A. S., & Nattiv, A. (2017). Evidence of a cumulative
effect for risk factors predicting low bone mass among male adolescent athletes. Br J
Sports Med, 51(3), 200-205.
Beals, K. A., & Hill, A. K. (2006). The prevalence of disordered eating, menstrual dysfunction,
and low bone mineral density among US collegiate athletes. International journal of
sport nutrition and exercise metabolism, 16(1), 1-23.
Bullock, G. S., Hughes, T., Sergeant, J. C., Callaghan, M. J., Riley, R., & Collins, G. (2021).
Methods matter: clinical prediction models will benefit sports medicine practice, but only
if they are properly developed and validated. British Journal of Sports Medicine,
bjsports-2021-104329. doi:10.1136/bjsports-2021-104329
Burke, L. M., Close, G. L., Lundy, B., Mooses, M., Morton, J. P., & Tenforde, A. S. (2018).
Relative Energy Deficiency in Sport in Male Athletes: A Commentary on Its Presentation

37
Among Selected Groups of Male Athletes. Int J Sport Nutr Exerc Metab, 28(4), 364-374.
doi:10.1123/ijsnem.2018-0182
Burke, L. M., Lundy, B., Fahrenholtz, I. L., & Melin, A. K. (2018). Pitfalls of Conducting and
Interpreting Estimates of Energy Availability in Free-Living Athletes. Int J Sport Nutr
Exerc Metab, 28(4), 350-363. doi:10.1123/ijsnem.2018-0142
Chapman, J., & Woodman, T. (2016). Disordered eating in male athletes: a meta-analysis.
Journal of Sports Sciences, 34(2), 101-109. doi:10.1080/02640414.2015.1040824
Charney, P. (2008). Nutrition screening vs nutrition assessment: how do they differ? Nutr Clin
Pract, 23(4), 366-372. doi:10.1177/0884533608321131
Condo, D., Lohman, R., Kelly, M., & Carr, A. (2019). Nutritional Intake, Sports Nutrition
Knowledge and Energy Availability in Female Australian Rules Football Players.
Nutrients, 11(5). doi:10.3390/nu11050971
Correia, M. I. T. D. (2018). Nutrition screening vs nutrition assessment: what’s the difference?
Nutrition in Clinical Practice, 33(1), 62-72.
De Souza, M. J., Koltun, K. J., & Williams, N. I. (2019). The Role of Energy Availability in
Reproductive Function in the Female Athlete Triad and Extension of its Effects to Men:
An Initial Working Model of a Similar Syndrome in Male Athletes. Sports medicine.
doi:10.1007/s40279-019-01217-3
De Souza, M. J., Nattiv, A., Joy, E., Misra, M., Williams, N. I., Mallinson, R. J., . . . Matheson,
G. (2014). 2014 Female Athlete Triad Coalition Consensus Statement on treatment and
return to play of the female athlete triad: 1st International Conference held in San

38
Francisco, California, May 2012 and 2nd International Conference held in Indianapolis,
Indiana, May 2013. Br J Sports Med, 48(4), 289-289.
Doyle-Lucas, A. F., Akers, J. D., & Davy, B. M. (2010). Energetic efficiency, menstrual
irregularity, and bone mineral density in elite professional female ballet dancers. J Dance
Med Sci, 14(4), 146-154.
Doyle-Lucas, A. F., Akers, J. D., & Davy, B. M. (2010). Energetic efficiency, menstrual
irregularity, and bone mineral density in elite professional female ballet dancers. Journal
of dance medicine & science : official publication of the International Association for
Dance Medicine & Science, 14(4), 146.
El Zein, A., Shelnutt, K. P., Colby, S., Vilaro, M. J., Zhou, W., Greene, G., . . . Mathews, A. E.
(2019). Prevalence and correlates of food insecurity among US college students: a multi-
institutional study. BMC Public Health, 19(1), 1-12.
Elliott-Sale, K., Tenforde, A., Parziale, A., Holtzman, B., & Ackerman, K. (2018). Endocrine
Effects of Relative Energy Deficiency in Sport. International journal of sport nutrition
and exercise metabolism, 28, 1-15. doi:10.1123/ijsnem.2018-0127
Elliott-Sale, K. J., Tenforde, A. S., Parziale, A. L., Holtzman, B., & Ackerman, K. E. (2018).
Endocrine Effects of Relative Energy Deficiency in Sport. Int J Sport Nutr Exerc Metab,
28(4), 335-349. doi:10.1123/ijsnem.2018-0127
Falsetti, L., Gambera, A., Barbetti, L., & Specchia, C. (2002). Long-Term Follow-Up of
Functional Hypothalamic Amenorrhea and Prognostic Factors. The Journal of Clinical
Endocrinology & Metabolism, 87(2), 500-505. doi:10.1210/jcem.87.2.8195

39
Ferguson, S. L., G. Moore, E. W., & Hull, D. M. (2019). Finding latent groups in observed data:
A primer on latent profile analysis in Mplus for applied researchers. International
Journal of Behavioral Development, 44(5), 458-468. doi:10.1177/0165025419881721
Gaines, A., Robb, C. A., Knol, L. L., & Sickler, S. (2014). Examining the role of financial
factors, resources and skills in predicting food security status among college students.
International journal of consumer studies, 38(4), 374-384.
Galli, N., Petrie, T. A., Reel, J. J., Chatterton, J. M., & Baghurst, T. M. (2014). Assessing the
Validity of the Weight Pressures in Sport Scale for Male Athletes. Psychology of Men &
Masculinity, 15(2), 170-180. doi:10.1037/a0031762
Galli, N., Reel, J. J., Petrie, T., Greenleaf, C., & Carter, J. (2011). Preliminary development of
the weight pressures in sport scale for male athletes. Journal of Sport Behavior, 34(1).
Gundersen, C., Engelhard, E. E., Crumbaugh, A. S., & Seligman, H. K. (2017). Brief assessment
of food insecurity accurately identifies high-risk US adults. Public health nutrition, 20(8),
1367-1371.
Heaney, S., O'Connor, H., Michael, S., Gifford, J., & Naughton, G. (2011). Nutrition knowledge
in athletes: a systematic review. Int J Sport Nutr Exerc Metab, 21(3), 248-261.
doi:10.1123/ijsnem.21.3.248
Heikura, I. A., Uusitalo, A. L. T., Stellingwerff, T., Bergland, D., Mero, A. A., & Burke, L. M.
(2018). Low Energy Availability Is Difficult to Assess but Outcomes Have Large Impact
on Bone Injury Rates in Elite Distance Athletes. International journal of sport nutrition
and exercise metabolism, 28(4), 403-411. doi:10.1123/ijsnem.2017-0313

40
Hendrickse, J., Arpan, L. M., Clayton, R. B., & Ridgway, J. L. (2017). Instagram and college
women's body image: Investigating the roles of appearance-related comparisons and
intrasexual competition. Computers in Human Behavior, 74, 92-100.
Horn, E., Gergen, Nicole, McGarry, Kelly A. (2014). The Female Athlete Triad. Rhode Island
Medical Jornal(November Webpage), 18-21.
Joy, E., De Souza, M. J., Nattiv, A., Misra, M., Williams, N. I., Mallinson, R. J., . . . Borgen, J.
S. (2014). 2014 female athlete triad coalition consensus statement on treatment and return
to play of the female athlete triad. Curr Sports Med Rep, 13(4), 219-232.
doi:10.1249/jsr.0000000000000077
Joy, E., Kussman, A., & Nattiv, A. (2016). 2016 update on eating disorders in athletes: A
comprehensive narrative review with a focus on clinical assessment and management.
British Journal of Sports Medicine, 50(3), 154-162.
Keay, N., Francis, G., & Hind, K. (2018). Low energy availability assessed by a sport-specific
questionnaire and clinical interview indicative of bone health, endocrine profile and
cycling performance in competitive male cyclists. BMJ Open Sport & Exercise Medicine,
4(1), e000424. doi:10.1136/bmjsem-2018-000424
Keay, N., & Rankin, A. (2019). Infographic. Relative energy deficiency in sport: an infographic
guide. British Journal of Sports Medicine, 53(20), 1307-1309. doi:10.1136/bjsports-
2018-100354
Koltun, K. J., Strock, N. C., Southmayd, E. A., Oneglia, A. P., Williams, N. I., & De Souza, M.
J. (2019). Comparison of Female Athlete Triad Coalition and RED-S risk assessment
tools. Journal of Sports Sciences, 37(21), 2433-2442.

41
Kongsted, A., & Nielsen, A. M. (2017). Latent Class Analysis in health research. Journal of
Physiotherapy, 63(1), 55-58.
Kristjansdottir, H., Sigurethardottir, P., Jonsdottir, S., Thornorsteinsdottir, G., & Saavedra, J.
(2019). Body Image Concern and Eating Disorder Symptoms Among Elite Icelandic
Athletes. Int J Environ Res Public Health, 16(15). doi:10.3390/ijerph16152728
Larson, N. I., Perry, C. L., Story, M., & Neumark-Sztainer, D. (2006). Food preparation by
young adults is associated with better diet quality. Journal of the American Dietetic
Association, 106(12), 2001-2007.
Lo, Y., Mendell, N. R., & Rubin, D. B. (2001). Testing the number of components in a normal
mixture. Biometrika, 88(3), 767-778.
Logue, D., Madigan, S. M., Delahunt, E., Heinen, M., Mc Donnell, S. J., & Corish, C. A. (2018).
Low Energy Availability in Athletes: A Review of Prevalence, Dietary Patterns,
Physiological Health, and Sports Performance. Sports Med, 48(1), 73-96.
doi:10.1007/s40279-017-0790-3
Logue, D. M., Madigan, S. M., Melin, A., Delahunt, E., Heinen, M., Donnell, S. M., & Corish,
C. A. (2020). Low Energy Availability in Athletes 2020: An Updated Narrative Review
of Prevalence, Risk, Within-Day Energy Balance, Knowledge, and Impact on Sports
Performance. Nutrients, 12(3). doi:10.3390/nu12030835
Loucks, A. B. (2004). Energy balance and body composition in sports and exercise. Journal of
Sports Sciences, 22(1), 1-14. doi:10.1080/0264041031000140518
Loucks, A. B., Kiens, B., & Wright, H. H. (2011). Energy availability in athletes. Journal of
Sports Sciences, 29(sup1), S7-S15.

42
Loucks, A. B., & Thuma, J. R. (2003). Luteinizing hormone pulsatility is disrupted at a threshold
of energy availability in regularly menstruating women. J Clin Endocrinol Metab, 88(1),
297-311. doi:10.1210/jc.2002-020369
Łuszczki, E., Jagielski, P., Bartosiewicz, A., Kuchciak, M., Dereń, K., Stolarczyk, A., . . .
Oleksy, L. (2021). The LEAF questionnaire is a good screening tool for the identification
of the Female Athlete Triad/Relative Energy Deficiency in Sport among young football
players. PeerJ, 9, e12118. doi:10.7717/peerj.12118
Maimoun, L., Georgopoulos, N. A., & Sultan, C. (2014). Endocrine disorders in adolescent and
young female athletes: impact on growth, menstrual cycles, and bone mass acquisition. J
Clin Endocrinol Metab, 99(11), 4037-4050. doi:10.1210/jc.2013-3030
Martinsen, M., Holme, I., Pensgaard, A. M., Torstveit, M. K., & Sundgot-Borgen, J. (2014). The
development of the brief eating disorder in athletes questionnaire. Med Sci Sports Exerc,
46(8), 1666-1675. doi:10.1249/mss.0000000000000276
Martinsen, M., Holme, I., Pensgaard, A. M., Torstveit, M. K., & Sundgot-Borgen, J. (2014). The
Development of the Brief Eating Disorder in Athletes Questionnaire. Medicine & Science
in Sports & Exercise, 46(8), 1666-1675. doi:10.1249/MSS.0000000000000276
McCall, L. M., & Ackerman, K. E. (2019). Endocrine and Metabolic Repercussions of Relative
Energy Deficiency in Sport (RED-S). Current Opinion in Endocrine and Metabolic
Research.
McCutcheon, A. L. (1987). Latent class analysis: Sage.

43
Melin, A., Tornberg, Å. B., Skouby, S., Faber, J., Ritz, C., Sjödin, A., & Sundgot-Borgen, J.
(2014). The LEAF questionnaire: a screening tool for the identification of female athletes
at risk for the female athlete triad. Br J Sports Med, 48(7), 540-545.
Mori, M., Krumholz, H. M., & Allore, H. G. (2020). Using latent class analysis to identify
hidden clinical phenotypes. Jama, 324(7), 700-701.
Mountjoy, M., Sundgot-Borgen, J., Burke, L., Ackerman, K. E., Blauwet, C., Constantini, N., . . .
Budgett, R. (2018). International Olympic Committee (IOC) Consensus Statement on
Relative Energy Deficiency in Sport (RED-S): 2018 Update. Int J Sport Nutr Exerc
Metab, 28(4), 316-331. doi:10.1123/ijsnem.2018-0136
Mountjoy, M., Sundgot-Borgen, J., Burke, L., Carter, S., Constantini, N., Lebrun, C., . . .
Budgett, R. (2015). Authors’ 2015 additions to the IOC consensus statement: Relative
Energy Deficiency in Sport (RED-S). In: BMJ Publishing Group Ltd and British
Association of Sport and Exercise Medicine.
Mountjoy, M., Sundgot-Borgen, J., Burke, L., Carter, S., Constantini, N., Lebrun, C., . . .
Ljungqvist, A. (2014). The IOC consensus statement: beyond the Female Athlete Triad—
Relative Energy Deficiency in Sport (RED-S). British Journal of Sports Medicine, 48(7),
491-497. doi:10.1136/bjsports-2014-093502
Mountjoy, M., Sundgot-Borgen, J., Burke, L., Carter, S., Constantini, N., Lebrun, C., . . .
Ackerman, K. (2015). RED-S CAT. Relative Energy Deficiency in Sport (RED-S)
Clinical Assessment Tool (CAT). Br J Sports Med, 49(7), 421-423. doi:10.1136/bjsports-
2015-094873

44
Mountjoy, M. L., Burke, L. M., Stellingwerff, T., & Sundgot-Borgen, J. (2018). Relative Energy
Deficiency in Sport: The Tip of an Iceberg. Int J Sport Nutr Exerc Metab, 28(4), 313-
315. doi:10.1123/ijsnem.2018-0149
Nose-Ogura, S., Yoshino, O., Dohi, M., Kigawa, M., Harada, M., Hiraike, O., . . . Saito, S.
(2019). Risk factors of stress fractures due to the female athlete triad: Differences in teens
and twenties. Scand J Med Sci Sports, 29(10), 1501-1510. doi:10.1111/sms.13464
Nylund-Gibson, K., & Choi, A. Y. (2018). Ten frequently asked questions about latent class
analysis. Translational Issues in Psychological Science, 4(4), 440.
Pancer, S. M., Hunsberger, B., Pratt, M. W., & Alisat, S. (2000). Cognitive complexity of
expectations and adjustment to university in the first year. Journal of Adolescent
Research, 15(1), 38-57.
Poll, K. L., Holben, D. H., Valliant, M., & Joung, H.-W. (2018). Food insecurity is associated
with disordered eating behaviors in NCAA division 1 male collegiate athletes. Journal of
American College Health, 1-5.
Rui, L. (2014). Energy metabolism in the liver. Comprehensive Physiology, 4(1), 177-197.
doi:10.1002/cphy.c130024
Schreiber, J. B. (2017). Latent Class Analysis: An example for reporting results. Research in
Social and Administrative Pharmacy, 13(6), 1196-1201.
Sim, A., & Burns, S. F. (2021). Review: questionnaires as measures for low energy availability
(LEA) and relative energy deficiency in sport (RED-S) in athletes. Journal of Eating
Disorders, 9(1), 41. doi:10.1186/s40337-021-00396-7

45
Sim, M., Garvican-Lewis, L. A., Cox, G. R., Govus, A., McKay, A. K., Stellingwerff, T., &
Peeling, P. (2019). Iron considerations for the athlete: a narrative review. European
journal of applied physiology, 119(7), 1463-1478.
Sinha, P., Calfee, C. S., & Delucchi, K. L. (2020). Practitioner’s guide to latent class analysis:
methodological considerations and common pitfalls. Critical care medicine, 49(1), e63-
e79.
Spurk, D., Hirschi, A., Wang, M., Valero, D., & Kauffeld, S. (2020). Latent profile analysis: A
review and “how to” guide of its application within vocational behavior research. Journal
of Vocational Behavior, 120, 103445.
Staal, S., Sjödin, A., Fahrenholtz, I., Bonnesen, K., & Melin, A. (2018). Low RMR ratio as a
Surrogate Marker for Energy Deficiency, the Choice of Predictive Equation Vital for
Correctly Identifying Male and Female Ballet Dancers at Risk. International journal of
sport nutrition and exercise metabolism, 28, 1-24. doi:10.1123/ijsnem.2017-0327
Statuta, S. M. (2020). The female athlete triad, relative energy deficiency in sport, and the male
athlete triad: the exploration of low-energy syndromes in athletes. Current sports
medicine reports, 19(2), 43-44.
Stellingwerff, T., Heikura, I. A., Meeusen, R., Bermon, S., Seiler, S., Mountjoy, M. L., & Burke,
L. M. (2021). Overtraining Syndrome (OTS) and Relative Energy Deficiency in Sport
(RED-S): Shared Pathways, Symptoms and Complexities. Sports Med.
doi:10.1007/s40279-021-01491-0

46
Sundgot-Borgen, J., & Torstveit, M. K. (2004). Prevalence of Eating Disorders in Elite Athletes
Is Higher Than in the General Population. Clinical Journal of Sport Medicine, 14(1), 25-
32. doi:10.1097/00042752-200401000-00005
Tayne, S., Hrubes, M., Hutchinson, M. R., & Mountjoy, M. (2019). Female Athlete Triad and
RED-S. In The Sports Medicine Physician (pp. 395-411).
Tenforde, A. S., Barrack, M. T., Nattiv, A., & Fredericson, M. (2016). Parallels with the Female
Athlete Triad in Male Athletes. Sports Med, 46(2), 171-182. doi:10.1007/s40279-015-
0411-y
Tenforde, A. S., DeLuca, S., Wu, A. C., Ackerman, K. E., Lewis, M., Rauh, M. J., . . . Roberts,
W. (2021). Prevalence and factors associated with bone stress injury in middle school
runners. PM&R.
Trakman, G. L., Forsyth, A., Hoye, R., & Belski, R. (2018). Development and validation of a
brief general and sports nutrition knowledge questionnaire and assessment of athletes’
nutrition knowledge. Journal of the International Society of Sports Nutrition, 15(1), 1-8.
Valliant, M. W., Pittman Emplaincourt, H., Kieckhaefer Wenzel, R., & Garner, B. H. (2012).
Nutrition Education by a Registered Dietitian Improves Dietary Intake and Nutrition
Knowledge of a NCAA Female Volleyball Team. Nutrients, 4(6), 506-516.
VanHeest, J. L., Rodgers, C. D., Mahoney, C. E., & De Souza, M. J. (2014). Ovarian
Suppression Impairs Sport Performance in Junior Elite Female Swimmers. Medicine &
Science in Sports & Exercise, 46(1), 156-166. doi:10.1249/MSS.0b013e3182a32b72
Werner, E. N., Guadagni, A. J., & Pivarnik, J. M. (2020). Assessment of nutrition knowledge in
division I college athletes. Journal of American College Health, 1-8.

47
Wurpts, I. C. (2012). Testing the limits of latent class analysis: Arizona State University.

48
LIST OF APPENDICES

49
APPENDIX A

50
Summary of screening measures for collegiate student-athletes
BEDA-Q
EDI
Dietary Practices
Meals Per Day Bone Health
Menstruation ANSK-Q Food Insecurity
WPS
I feel extremely guilty after overeatinga
I am preoccupied with the desire to be thinnera
I think that my stomach is too biga
I feel satisfied with the shape of my bodya
My parents have expected excellence of mea
As a child, I tried very hard to avoid disappointing my parents and teachersa
Are you currently following or have you ever followed any special dietary considerations for personal reasons, diagnosed conditions, or religious reasons? b
Options:
Vegetarian,
Semi-
Vegetarian,
Vegan,
Gluten-free,
Dairy-free,
Lactose-free,
Paleo,
Ketogenic,
Intermittent
Fasting,
Low carb,
Fasting for
religious
reasons
(Ramadan,
etc.), Low
FOD-MAP
Please list your food intake for the past 24 hours in each of the categories. Do your best to estimate the amounts (i.e. one handful, one fistful), quantity of food items, if you prepared it at home or out (and list restaurant) and as specific as possible.c
Have you ever had a stress fracture? b
How many stress fractures have you had?d
What was the site of your stress fracture(s)?
Options: Lumbar spine
Femoral neck Sacrum Pelvis
How old were you when you first menstruated?e
Is your menstrual cycle currently regular (period at the same time every month)? b
Full questionnaire in Appendix
Within the past 12 months I was worried whether my food would run out before I got money to buy more.f
Within the past 12 months the food I bought just didn't last and I didn't have money to get more.f
In the past year, my coach places an emphasis on team members’ weightg
In the past year, my coach encourages athletes to gain muscle massg
Weigh-ins are held periodically throughout the seasong
Body weight and appearance are important to my coachg
My teammates notice if I put on weightg
Any of my body flaws are readily apparent in my uniformg
The crowd scrutinizes my body and makes me concerned about my weight and appearanceg
In the past year, have you lost weight to meet image requirements for your sport? g
In the past year, have you ever ate in secret?
g
Body weight and appearance are important to my friends outside of sportg
Body weight and appearance are

51
important to my familyg
The leanest athletes are at a distinct performance advantageg
Note. Menstruation column excluded for male athletes Brief Eating Disorder in Athletes Questionnaire (BEDA-Q) Abridged Nutrition for Sport Knowledge Questionnaire (A-NSKQ) Weight Pressures in Sport (WPS) aAnswer choices: always, usually, sometimes, often, never bAnswer choices: yes, no cAnswer choices: Breakfast, Lunch, Dinner, Snacks, Beverages dAnswer choices: 1, 2, 3, 4, 5, >5 eAnswer choices: <10, 10, 11, 12, 13, 14, 15, 16, >16 fAnswer choices: often true, sometimes true, never true gAnswer choices: always, usually, often, sometimes, rarely, never

52
APPENDIX B

53
A-NSKQ Nutrition Knowledge Questionnaire
General Nutrition Knowledge
1. Eating more energy from protein than you need can make you put on fat.
(agree/disagree/not sure)
2. The body needs fat to fight off sickness. (agree/disagree/not sure)
3. Do you think cheddar cheese is high or low in fat? (high/low/not sure)
4. Do you think margarine is high or low in fat? (high/low/not sure)
5. Do you think honey is high or low in fat? (high/low/not sure)
6. The body has a limited ability to use protein for muscle protein synthesis.
(agree/disagree/not sure)
7. Eggs contain all the essential amino acids needed by the body. (agree/disagree/not sure)
8. Thiamine (Vitamin B1) is needed to take oxygen to muscles. (agree/disagree/not sure)
9. Vitamins contain energy (kilojoules/calories). (agree/disagree/not sure)
10. Do you think alcohol can make you put on weight? (yes/no/not sure)
11. “Binge drinking” (also referred to as heavy episodic drinking) is generally defined as:
(a) having two or more standard alcoholic drinks on the same occasion (b) having four to five
or more standard alcoholic drinks on the same occasion (c) having seven to eight or more
standard alcoholic drinks on the same occasion (d) Not sure
Sport Nutrition Knowledge
12. Do you think 1 medium banana has enough carbohydrate for recovery from intense
exercise? Assume the athlete weighs about 70 kg and has an important training session

54
again tomorrow. (enough/not enough/not sure)
13. Do you think 1 cup of cooked quinoa and 1 tin of tuna has enough carbohydrate for
recovery from intense exercise? Assume the athlete weighs about 70 kg and has an
important training session again tomorrow. (enough/not enough/not sure)
14. Do you think 100 g of chicken breast has enough protein to promote muscle growth after a
bout of resistance exercise? (yes/no/not sure)
15. Do you think 1 Cup Baked Beans has enough protein to promote muscle growth after a
bout of resistance exercise? (yes/no/not sure)
16. Do you think 1/2 Cup Cooked Quinoa has enough protein to promote muscle growth after
a bout of resistance exercise? (yes/no/not sure)
17. Eating more protein is the most important dietary change if you want to have more
muscle. (agree/disagree/not sure)
18. Which is a better recovery meal option for an athlete who wants to put on muscle? (a) A
'mass gainer' protein shake and 3 - 4 scrambled eggs (b) Pasta with lean beef and
vegetable sauce, plus a dessert of fruit, yoghurt and nuts (c) A large piece of grilled chicken
with a side salad (lettuce, cucumber, tomato)/ (d) A large steak and fried eggs (e) Not sure
19. When we exercise at a low intensity, our body mostly uses fat as a fuel.
(agree/disagree/not sure)
20. Vegetarian athletes can meet their protein requirements without the use of protein
supplement. (agree/disagree/not sure)
21. The daily protein needs of a 100 kg (220 lb) well trained resistance athlete are closest to:
(a) 100g (1g/kg) (b) 150g (1.5g/kg) (c) 500g (5g/kg) (d) They should eat as much protein as

55
possible (e ) Not sure
22. The optimal calcium intake for athletes aged 15 to 24 years is 500 mg. (agree/disagree/not
sure)
23. A fit person eating a balanced diet can improve their athletic performance by eating more
vitamins and minerals from food. (agree/disagree/not sure)
24. Vitamin C should always be taken by athletes. (agree/disagree/not sure)
25. Athletes should drink water to: (a) keep plasma (blood) volume stable (b) stop dry mouth
(c) allow proper sweating (d) All of the above (e ) Not sure
26. Experts think that athletes should: (a) drink 50 - 100 ml (1.7 - 3.3 fluid ounces) every 15 -
20 minutes (b) suck on ice cubes rather than drinking during practice (c) drink sports drinks
(e.g. powerade) rather than water when exercising (during intense sessions) (d) drink to a
plan, based on body weight changes during training sessions performed in a similar climate
(e) Not sure
27. Before competition, athletes should eat foods that are high in: (a) fluids, fat and
carbohydrate (b) fluids, fiber and carbohydrate (c) fluids and carbohydrate (d) Not sure
28. In events last 60 - 90 minutes, 30- 60 g (1.0 - 2.0 ounces) of carbohydrates should be
consumed per hour. (agree/disagree/not sure)
29. Eating carbohydrates when you exercise will help keep blood sugar levels stable.
(agree/disagree/not sure)
30. Which is the best snack to have during an intense 90-minute training session? (a) A
protein shake (b) A ripe banana (c) 2 Boiled eggs (d) A handful of nuts (e) Not Sure
31. How much protein do you think experts say athletes should have after completing a

56
resistance exercise session? (a) 1.5g/kg body weight (~ 150 – 130 g/ 5.3 –10.6 ounces for
most athletes) (b) 1.0 g/kg body weight (~ 50 - 100 g /1.9 - 2.3 ounces) for most athletes)
(c) 0.3g/kg body weight (~ 15 - 25 g/0.53 - 0.88 ounces) for most athletes) (d) Not sure
32. Supplement labels may sometimes say things that are not true. (agree/disagree/not sure)
33. All supplements are tested to make sure they are safe and don’t have any contamination.
(agree/disagree/not sure)
34. Which supplement does not have enough evidence in relation to improving body
composition or sporting performance? (a) Caffeine (b) Ferulic acid (c) Bicarbonate (d)
Leucine (e) Not Sure
35. The WORLD ANTI-DOPING AGENCY (WADA) bans the use of (a) caffeine (b)
bicarbonate (c) carnitine (d) testosterone (e ) Not Sure

57
CHAPTER IV
MANUSCRIPT 1
A LATENT CLASS ANALYSIS OF FEMALE COLLEGIATE ATHLETES OF NUTRITION
AND RED-S CONCERN
To be submitted to the British Journal of Sports Medicine
Abstract
Relative Energy Deficiency in Sport (RED-S) has been expanded upon creation in 2014
to include a variety of ages and athletes. Female athletes have been the primary focus, but the
collegiate female athlete population needs further investigation. Screening collegiate athletes for
nutrition-related concerns and low energy syndromes provides insight for practitioners and may
lead to necessary referrals in the sports medicine team. Screening may be a part of an athletic
department’s protocol, but there is a lack of consensus on a validated tool for this population.
The goal of this cross-sectional research was to use a Latent Class Analysis (LCA) predictive
modeling approach to determine classes of female collegiate athletes who present with nutrition

58
and RED-S concern. At a Division I university, 144 female athletes competing in various team
sports completed a pre- participation nutrition screening survey. Measures such as menstrual
function, bone health, disordered eating, restrictive diets, food insecurity, body image, and
nutrition knowledge were collected. Some evidence is presented that female athletes can be
profiled into a two-class solution, providing practitioners and sports dietitians insight into
profiling athletes who may be at risk for low energy syndromes. Future research should consider
large sample sizes of athletes to conduct predictive modeling techniques along with high quality,
validated measurement tools.
Summary Box
• Latent class analysis is a predictive modeling technique to determine latent classes of
individuals through continuous or categorical predictors
• Female collegiate athletes participating in team sports should be screened annually for
low energy syndromes such as RED-S
• A validated tool for detecting RED-S in female collegiate athletes is of high importance
Introduction
Relative Energy Deficiency in Sport (RED-S) was introduced in 2014 as a continuation
of the Female Athlete Triad by the International Olympic Committee (IOC) to include a number
of health and performance related consequences of the syndrome and male athletes as well as
females (M. Mountjoy et al., 2014). Additional statements including the 2018 update and
comments from the working group have provided further clarification and information regarding

59
this emerging syndrome (Ackerman et al., 2020; M. Mountjoy et al., 2018; M. Mountjoy et al.,
2015). A 2015 publication on a Clinical Assessment Tool (RED-S CAT) provided practitioners
guidelines for diagnosing the syndrome, but the screening aspect of this syndrome has not been
well established (M. Mountjoy et al., 2015).
The goal of screening differs from the goal of diagnosing because screening implies the
identification of risk factors for a specific nutrition condition, while a nutrition assessment is a
step further towards the goal of a diagnosis (Correia, 2018). When considering if an athlete may
be at risk for RED-S, screening should be done if deemed appropriate by the sports medicine
practitioner. This may be useful in settings such as sports medicine clinics and college or
university athletics programs.
The screening and diagnosis of RED-S can be subtle and challenging to uncover, so
individuals well versed in the symptomatology should be involved in the screening protocols
developed (M. Mountjoy et al., 2014). The shortcomings of currently published screening tools
include that there is a lack of consensus on what tool to use and the current tools are limited by
lack of validation. Many tools developed focus on either males or females entirely, are not
targeted to college athletes and team sports. Additionally, in the population of college athletes, a
current gold standard for nutrition screening is not established.
It is well established that practitioners look at menstrual function in female athletes to
assess endocrine function. The age of onset menstrual cycle, the state of being eumenorrheic,
amenorrhoeic or oligomenorrheic, and frequency of missed cycles are often analyzed when
assessing menstruation in female athletes. Functional hypothalamic amenorrhea (FHA) is
described by the IOC as “disruption of gonadotropin releasing hormone (GnRH) pulsatility at the

60
hypothalamus, followed by alterations of LH and follicle stimulating hormone release from the
pituitary and decreased estradiol and progesterone levels” and is the considered the most severe
of menstrual dysfunction requiring intervention (M. Mountjoy et al., 2018). Menstrual disorders
such as FHA must be diagnosed by a healthcare professional through a clinical evaluation. The
2014 Female Athlete Triad Coalition Consensus Statement outlines an amenorrhea algorithm to
follow if an individual is suspected for primary or secondary amenorrhea, and prolonged
oligomenorrhoea with the expertise of a physician or endocrinologist if necessary (De Souza et
al., 2014). This algorithm may be useful for practitioners to use when examining athletes who
may be suspected of menstrual dysfunction. Related to menstrual function, a study found that
higher levels of cortisol have been observed in females with menstrual dysfunction, and can
indicate physiological stress during intensive training (D. Logue et al., 2018). In junior elite
female swimmers, researchers found that ovarian suppression impaired athletic performance,
especially when training occurred when the body was in a state of energy conservation so
performance was sacrificed (VanHeest et al., 2014).
While some short-term effects of RED-S have been studied, the long-term health effects
are lesser known. In the context of the endocrine system, long-term reproductive health is
currently understudied and remains unknown (M. Mountjoy et al., 2014). Reproduction is closely
related to EA in relation to survival, so the repercussions of long-term reproductive health should
be explored (K. J. Elliott-Sale et al., 2018).
Athletes attending universities and colleges are often 18 to 24 years old, living on their
own away from family for the first time, and are required to balance school work and sport
obligations. Nutritionally this can be a critical time as growth and development of adolescence is

61
ending, peak bone mass is reached and fueling demands for college levels sports may increase.
These factors relate to energy availability and the importance of meeting nutritional needs for
health and performance. Although RED-S and low energy syndromes may be present in college
athletes, the current RED-S framework should be critically examined to determine if all 10
health and 10 performance consequences present in this population. Furthermore, the framework
should continue to evolve and expand as this syndrome changes over time. This may include
considering additional health considerations. This study will examine three additional possible
constructs of RED-S: nutrition knowledge, food insecurity, and body image.
A review on nutrition knowledge in athletes highlights the need for future research to use
validated tools to measure nutrition knowledge in athletes, and to further solidify the
understanding of the relationship between nutrition knowledge and dietary intake (Heaney et al.,
2011). Nutrition knowledge has been studied in relation to low EA in female Australian rules
football players with results finding low sports nutrition knowledge and a 30% risk of low EA in
the 30 athletes studied (Condo et al., 2019). A study on nutrition knowledge in collegiate athletes
found poor nutrition knowledge scores 57.6% ± 18.6%, with the possible impact on performance
and injury risk, (Werner et al., 2020). Although nutrition knowledge has not been studied in
relation to low energy syndromes like RED-S, assessing nutrition knowledge is an important
component of nutrition screening. Baseline nutrition knowledge measurements can aid in the
development of team nutrition education with target interventions. This possible relationship
should be explored to determine if the two concepts are interrelated.

62
At this time, food insecurity has not been studied in relation to RED-S. The lack of access
to nutritious food, or inadequate means to acquire, prepare and consume food is a substantial
barrier to proper nutrition. Food insecurity as a contributing factor to low EA in the athletic
population is currently unknown. In the general population, food insecurity may contribute to
high or low energy intake dependent on quantity, quality, and the food environment. Although
studies for prevalence of food insecurity exist, the relationship between food insecurity and low
EA in athletes is not established at this time. Previous research found that food insecurity in
college athletes was found to be significantly correlated with hoarding food and being
preoccupation with food (Poll et al., 2018). Additionally, food insecurity and lack of finances
may also contribute to impaired nutrition in some populations (Burke, Close, et al., 2018).
Additionally, in the 2018 IOC Consensus Statement on RED-S, authors state that “cultural,
social, psychological, and financial factors contribute to low energy availability” so the food
security status and scholarship status in collegiate athletes warrant further investigation (M.
Mountjoy et al., 2018).
Body image has been linked to disordered eating and eating disorder behaviors but is not
currently included in the RED-S framework. Body image was considered with eating disorder
behaviors in elite Icelandic athletes, with 17.9% of the athletes having severe or moderate body
image dissatisfaction, and 18.2% of athletes above the clinical cutoff for body image concern,
with more women’s scores being higher than the men’s overall (Kristjansdottir et al., 2019).
Social media may also play into one’s body image and appearance-related comparisons, which
has been looked at in college females (Hendrickse et al., 2017). In college athletes body image
may be of concern due to weight pressures from peers, teammates, coaches, fans and other

63
individuals. The Weight Pressures in Sport (WPS) tool developed for male college athletes has
been validated for use for detecting various sources of weight pressures and body image in the
college athlete population (Galli et al., 2014; Galli et al., 2011). The WPS tool was developed for
male collegiate athletes and the sample included athletes from aesthetic sports such as diving and
weight class sports such as wrestling in which body appearance and weight are a focus. Body
image is an important component to assess because of the relation to dieting behavior and the
psychological component of RED-S that can precede or be a result of RED-S.
A unique aspect of collegiate athletics is the focus on team sports and the subcultures
within different institutions and individual teams. It has been speculated that RED-S may occur
at an increased rate in high-risk sports, but if all sports including team sports are not included in
the body of literature and work, then the prevalence may be unknown. To date, there have been
no research publications investigating the incidence of RED-S in team sports highlighting an
important need for research efforts (M. L. Mountjoy et al., 2018). At this time, a validated and
widely used nutrition screening protocol is not available for college athletes. At the NCAA
institutional and university level, screening policies and survey tools utilized are dependent on
individual policies developed by sports medicine athletic directors, athletic trainers, and nutrition
staff if available.
It is unknown at this time if annual screening for low energy syndromes such as RED-S
and the Triad or for eating disorders is conducted routinely at NCAA institutions. The screening
and diagnosis of RED-S can be subtle and challenging to uncover, so individuals well versed in

64
the symptomatology should be involved in the screening protocols developed (M. Mountjoy et
al., 2014).
The goal of this research is to determine latent classes of female athletes who may be of
nutrition concern related to RED-S. This will be done through a latent class analysis model with
various categorical and continuous indicator variables. A variety of measures considered in the
traditional framework of RED-S such as bone health, menstruation, disordered eating as well as
other measures such as food insecurity and nutrition knowledge may provide insight into
individuals of RED-S concern that can be further investigated.
A Latent Class Analysis (LCA model) was introduced as a technique to explore latent
classes of individuals in an exploratory manner utilizing a unrestricted model (McCutcheon,
1987). LCA is an explanatory modeling technique that allows for the grouping of individuals
with similar characteristics (Mori et al., 2020). The aim of this model is to estimate the
probability of each athlete being a member of each latent class. LCA can be a helpful modeling
technique that focuses on individuals rather than indicators. Personal behaviors and
characteristics are used to determine latent profiles based on similar responses to the indicators
and variables of interest (Spurk et al., 2020). The goal is to uncover underlying patterns of shared
behavior that are of interest to the researcher.
This technique is especially useful or researchers in social sciences to explore patterns of
shared behaviors between samples. These patterns of interest may be missed when individual
variable-centered analyses are conducted (Ferguson et al., 2019). Furthermore, LCA can be
useful in medical disciplines. Syndromic clinical conditions are frequently reliant on rigid, yet
broad definitions. Clinical prediction models are expected to benefit sports medicine practice, but

65
only if they are properly developed and validated. These models may help guide decision making
processes in clinical medicine but are not commonly used in sports medicine (Bullock et al.,
2021). A focus on the methodology, specifically model development, model performance, and
validation must be considered when conducting prediction research. The goal of this research is
to explore the use of such prediction models to uncover latent classes of athletes of RED-S
concern.
Research Question
The goal of this study is to detect student-athletes who may be of nutrition-specific health
concern related to Relative Energy Deficiency in Sport (RED-S) at the time of pre-participation
health evaluations through a latent class analysis predictive model. This study will explore and
answer the following question:
1. What conceptual groups exist that distinctly categorize female student-athletes that are of
nutrition-specific health concern related to Relative Energy Deficiency in Sport (RED-
S)?
The question will be answered through a latent class analysis model that identifies levels of a
latent categorical variable through the analysis of observed continuous and categorical variables.
The observed variables include measures consistent with the traditional framework of RED-S
with the addition of three variables of interest. Eating disorder risk, restrictive diets/dieting,
menstruation, bone health, as well as nutrition knowledge, food insecurity, and body image will

66
be included in this model. This model will examine female student-athletes at a division I
college.
The following hypothesis will be tested:
H1: Female student-athletes can be categorized into classes ranging from low nutrition and RED-S concern to high nutrition and RED-S concern using traditional RED-S framework
indicators and three additional indicators.
Methods
Study Design
The study is a quantitative cross-sectional study utilizing a web-based survey software to
explore nutrition-related health concerns including RED-S through nutrition screening in
collegiate athletes. Through a latent class analysis, individuals will be profiled to determine
classes of individuals of concern. The data for this study will be generated using Qualtrics
software with electronic administration for the Nutrition Screening Survey (Qualtrics Provo, UT,
2021).
Setting
The setting is at a Division I university in the southeast of the United States. Athletes
range from 18-24 years old and participate in a variety of team sports. Team sport female
athletes will be screened with sports outlined in the table below.
Table 1
Study participants and team sports
n Sports

67
Female 144 Basketball, Golf, Rifle, Softball, Soccer, Tennis, Track & Field, Volleyball
Measurement Tools
Nutrition and RED-S components will be measured through a variety of previously
published screening tools outlined below. Similar survey methodology was used as a recent
study that conducted a cross-sectional study on patients that presented to the Division of Sports
Medicine at Boston Children’s Hospital (Ackerman et al., 2019). As mentioned in their
publication, due to the lack of a validated or standard measure for RED-S survey measures were
based on validated and/or standard questionnaires for each topic as available were used. The
measurement tool is included in the Appendix.
Eating disorder and disordered risk will be measured through the Brief Eating Disorder in
Athlete Questionnaire (BEDA-Q) screening tool, restrictive dieting, and number of meals
consumed per day. The BEDA-Q has been used in adolescent female athletes, but it has not been
validated for use in collegiate male and female athletes. Restrictive dieting will be measured
through the question: “Are you currently following or have you ever followed any special dietary
considerations for personal reasons, diagnosed conditions, or religious reasons? (vegan,
vegetarian, gluten free, dairy free, religious fasting, paleo, etc.)” with options including:
“Vegetarian” “Semi-Vegetarian” “Vegan” “Gluten-free” “Dairy-free” “Lactose-free” “Paleo”
“Ketogenic” “Intermittent Fasting” “Low carb” “Fasting for religious reasons (Ramadan, etc.)”

68
“Low FOD-MAP.” While the diets mentioned are not necessarily low-energy diets, the purpose
is to see if any restrictions may be followed for any reason that may lead to energy restriction if
not properly planned. This screening question may provide insight into diets athletes follow for a
variety of reasons. Number of meals consumed per day provides insight into if athletes are
missing meals and will be assessed through a 24-hour food recall. While a pre-determined
number of meals is dependent on individual energy needs, literature has shown that not
consuming at least 3 meals per day can be indicative of disordered eating (Adam S Tenforde et
al., 2021). With low energy availability (LEA) at the core of RED-S, it is more traditionally
measured in a laboratory setting. Through screening forms, it is important to assess possibility of
LEA in collegiate athletes through disordered eating behaviors such as skipping meals or
following a restrictive diet. Dependent on resources, the diagnosis of LEA may need to follow
through more complex equations, body composition testing, and indirect calorimetry testing.
Bone health will be measured through self-reported history of the number of stress
fractures and a follow-up question on high-risk sites (sacrum, pelvis, lumbar spine, femoral
neck).
Menstrual function will be measured through the age of onset menses, which will be
asked through “What age did you get your first period?” and menstrual irregularity which will be
asked through “Does your menstrual cycle appear at the same time every month?” to determine
if evidence of primary or secondary amenorrhea is present. If amenorrhea is suspected,
confirmation through an endocrinologist or OBGYN should follow.
Food insecurity will be measured through the United States Department of Agriculture
(USDA) 2-question measure for food insecurity. The two questions include: “Within the past 12

69
months I was worried whether my food would run out before I got money to buy more” and
“Within the past 12 months the food I bought just didn't last and I didn't have money to get
more” with answer choices as “often true” “sometimes true” or “never true.” The variable was
operationalized through a positive answer to “often true” or “sometimes true” to either question
to be coded as food insecure.
Nutrition knowledge will be measured through the Abridged Nutrition for Sport
Knowledge Questionnaire (ANSK-Q) tool that assesses general nutrition knowledge as well as
sport nutrition knowledge. Items will be scored and individuals will be scored on a range of 0-
100 with higher values indicating higher nutrition knowledge.
Weight pressures in sport will be measured through the Weight Pressures in Sport (WPS)
tool that was developed to assess weight pressures and body image in male collegiate athletes
(Galli et al., 2014; Galli et al., 2011). With no question specific to sex, the tool is appropriate for
use in female athletes as well but has yet to be validated in this population. The authors
recommend a 6-point Likert scale, but the survey included an extra measure of “neutral” or
“neither agree or disagree” increasing the scale to a 7-point Likert scale for athletes that may
have not been comfortable answering questions about coaches, peers, or family. To account for
this, the data was linearly transformed to convert responses in a weighted manner to match the
recommended 6-point scale. The following formula was utilized:
𝑌 = (𝐵 − 𝐴) ∗ (𝑥 − 𝑎)/(𝑏 − 𝑎) + 𝐴
𝑌 = (6 − 1) ∗ (𝑥 − 1)/(7 − 1)+ 1
Data Analysis

70
Data were analyzed through a latent class analysis model (LCA) to determine classes of
individuals who may be of heightened nutrition and RED-S concern. This exploratory modeling
technique is often utilized in the psychological or health science field as an approach to patient-
centered analysis. The LCA technique was introduced in 1987 as a method to determine classes
of individuals (McCutcheon, A.C., 1987). Data were analyzed with Mplus software (Muthén, L.
K., & Muthén, B. O., 2021). A conceptual map of the model is outlined below with each of the
indictor variables with C latent classes.
Figure 1: Proposed Latent Class Analysis Model for Collegiate Female Athletes
There are a number of considerations when determining which latent class model that
best fits the individuals of interest. If many sampling zeros are present in the dataset, sparseness
exists. This differs from structural zeros. If sparseness occurs, it leads to difficulties in model
evaluation. Lack of consensus on a general rule of thumb for sample size but it has been
established that LCA models are case sensitive and require large sample sizes into the hundreds.

71
Determining number of classes, also named class enumeration, involves fitting several
LCA models with differing numbers of latent classes, collecting fit information for each model,
then studying patterns to decide how many classes best describe patterns observed in the data
(Nylund-Gibson & Choi, 2018). Information such as goodness of fit statistics can be analyzed to
evaluate the model fitness. The Akaike Information Criterion (AIC), Bayesian Information
Criterion (BIC), Sample-size adjusted BIC all are considered for goodness of fit. BIC helps in
model selection by penalizing the number of factors, providing insight into the model fit.
The LCA model with the smallest values for AIC, BIC and sample-size adjusted BIC are
considered to be the best fitting model. The solution with the largest loglikelihood is considered
to be better fitting than a model with lower loglikelihood values.
Lo-Mendell-Rubin Adjusted Likelihood Ratio Test (LMR-LMT) compares models with
varying numbers of classes. If p-value < 0.05, the model with one fewer class is a better fit for
the data (Lo et al., 2001). If the p-value is ≥ 0.05, the model would need to be reclassified with
fewer classes. The parametric bootstrapping p-value is also of interest, with a p value ≥0.05
indicating that the model needs to be reduced in class size.
Results
The descriptive statistics of the data of interest is in Table 2, providing insight into some
variables of interest. The average age for onset of menstruation for the female athletes sampled
was 13.26 years old. Nutrition knowledge scores for this population were 38.175, indicating poor
knowledge.
Table 2

72
Descriptive Statistics for Female Participants
N Minimum Maximum Mean Std. Deviation
Variance
Restrictive Diet
144 0 1 0.19 0.397 0.158
Number of Meals Per Day
144 1 3 2.83 0.392 0.154
Eating Disorder Inventory (EDI)
144 0 15 4.64 3.148 9.911
Age Onset Menses
144 10 17 13.26 1.491 2.224
Irregular Menstrual Cycle
144 0 1 0.26 0.438 0.192
Stress Fractures
144 0 5 0.26 0.697 0.486
Food Insecurity
144 0 1 0.12 0.324 0.105
Nutrition Knowledge
144 2.857 77.143 38.175 14.735 217.110
Body Image
144 1 4.333 2.126 0.722 0.521
To test the classification of female collegiate athletes, a latent class analysis was run on
144 participants. The number of optimal classes in the data set are determined by the researcher
based on a number of criteria. The best fitting LCA model is determined based on fit statistics
such as Bayesian Information Criterion (BIC), adjusted BIC, and Akaike Information Criterion

73
(AIC), as well as interpretability, and non-information-criterion such as the Lo-Mendell-Rubin
fit index, Vuong-Lo-Mendell-Rubin (VLMR), and the Bootstrapped likelihood ratio test
(BLRT).
The following fit information for the two- and three-class models is included in Table 3:
Table 3
Latent class analysis model fit criteria
Model Number of
classes
Loglikelihood Entropy AIC BIC Adjusted BIC
Number of free
parameters
VLMR Lo-Mendell-Rubin
Bootstrapped LRT
BLRT
1 2 -1770.732 0.851 3591.464 3665.709 3586.603 25 0.6764 0.6764 0.000*
2 3 -1570.654 1.000 3211.309 3315.252 3204.503 35 0.7858 0.7858 0.000*
Note. *p<.05 Akaike information criterion (AIC) Bayesian information criterion (BIC) Vuong-Lo-Mendell-Rubin (VLMR) Likelihood ratio test (LRT) Bootstrapped likelihood ratio test (BLRT)
The analysis provided information regarding two and three-class models that emerged
from the data. The first model provided insight into profiling female student-athletes into a two-
class solution with no errors. The three-class solution provided model fit information, but class
enumeration was not trustworthy due to a higher-class size and model error. The three-class
model showed poor absolute model fit and poor relative fit. The two-class model identified the
following counts for the latent classes based on the estimated model:
Table 4
Two-class latent class assignment results

74
Latent Class Number of individuals
Percentage of
individuals
1 23 15.972%
2 121 84.028%
The three-class model identified the following counts for the latent classes based on the
estimated model:
Table 5
Three-class latent class assignment results
Latent Class Number of individuals
Percentage of
individuals
1 23 15.972%
2 115 79.861%
3 6 4.167%
Fit Indices
A practitioner’s guide was utilized to examine the following information of fit indices,
model testing, and model characteristics (Sinha et al., 2020). When analyzing a latent class
analysis for fit indices, several considerations should be looked at. For smaller sample sizes of
less than 300, both Akaike information criteria (AIC) and Bayesian information criteria (BIC)
should be considered. A decreasing value indicates better model fit. Through the fit statistics
table, Table 3, AIC and BIC are an index of model fit, balance the complexity of the model
against the sample size.

75
Model Testing
Comparing models with varying classes is also an important consideration for LCA. The
VLMR test compares a model with k classes to one with k-1 classes. If the p-value is greater
than 0.05, like in this circumstance, clinical relevance may be worth considering. Additionally,
the Lo-Mendel-Rubin test and BLMR can be considered.
Model Characteristics
Number of classes, class size, and separation are considered with looking at LCA model
characteristics. Entropy is a measure of class separation between the latent classes with values
above 0.80 considered a good fit. Table 3 provides two and three-class model values, but it is
important to consider that higher values do not necessarily mean that a model is the best fit and
may indicate an overfit model. The two-class model provides an acceptable value. When
considering the number of classes and class size, a small class size of less than 15% of the
sample is a concern. The two-class model revealed a class size just above that value. If a class
contains less than 15%, it is possible whether outliers of a single indicator may be determining
the class. In the three-class model, the smaller classes are less likely to be externally
generalizable than models with fewer, well-distributed classes and the classes contain less than
10% of the sample which is indicative of a poor fit.
Class Characteristics
Tables 6 through 9 provide insight into the two- and three-class models. The results in
probability scale tables outline the categorical variables of interest in the model and the model
results table outlines the continuous variables. The results of the table do not provide distinction
between classes two and three on a variable level. If variables distinctly were consistent between

76
groups, then there would be shared characteristics in the participants. While latent class 1 in the
two-class model had high reported restrictive dieting, disordered eating, stress fractures, and
body image concern, with low nutrition knowledge scores; there was not a clear distinction into
the other group.
Table 6
Results in probability scale two-class latent class female model
Latent Class 1 Restrictive Diet
Estimate Standard Error
Estimate/Standard Error
P-Value
Category 1
0.812 0.124 6.559 0.000
Category 2
0.188 0.124 1.517 0.129
Irregular Menses
Estimate Standard Error
Estimate/Standard Error
P-Value
Category 1
0.664 0.394 2.261 0.024
Category 2
0.336 0.294 1.142 0.253
Food Insecurity
Estimate Standard Error
Estimate/Standard Error
P-Value
Category 1
0.623 0.127 4.923 0.000
Category 2
0.377 0.127 2.978 0.003
Latent Class 2
Estimate Standard Error
Estimate/Standard Error
P-Value

77
Restrictive Diet
Category 1
0.804 0.042 19.376 0.000
Category 2
0.196 0.042 4.718 0.000
Irregular Menses
Estimate Standard Error
Estimate/Standard Error
P-Value
Category 1
0.759 0.080 9.515 0.000
Category 2
0.241 0.080 3.017 0.003
Food Insecurity
Estimate Standard Error
Estimate/Standard Error
P-Value
Category 1
0.925 0.047 19.909 0.000
Category 2
0.065 0.047 1.378 0.168
Table 7
Model results two-class latent class female model
Latent Class 1 Means
Estimate Standard Error
Estimate/Standard Error
P-Value
Meals Per Day
2.549 0.254 10.027 0.000
BEDAQ EDI
8.551 6.180 1.384 0.166
Age Menses
12.350 0.400 30.873 0.000

78
Stress Fractures
0.050 0.049 1.033 0.307
Nutrition Knowledge
34.873 3.614 9.649 0.000
Body Image
3.087 0.376 8.216 0.000
Variances
Meals Per Day
0.136 0.029 4.777 0.000
BEDAQ EDI
6.690 6.468 1.034 0.301
Age Menses
2.036 0.366 5.561 0.000
Stress Fractures
0.474 0.176 2.697 0.007
Nutrition Knowledge
213.357 22.038 9.681 0.000
Body Image
0.327 0.304 1.076 0.282
Latent Class 2 Means
Estimate Standard Error
Estimate/Standard Error
P-Value
Meals Per Day
2.892 0.039 74.767 0.000
BEDAQ EDI
3.833 0.450 8.525 0.000
Age Menses
13.452 0.271 49.709 0.000
Stress Fractures
0.300 0.078 3.845 0.000

79
Nutrition Knowledge
38.855 1.767 21.993 0.000
Body Image
1.927 0.267 7.217 0.000
Variances
Meals Per Day
0.136 0.029 4.777 0.000
BEDAQ EDI
6.690 6.468 1.034 0.301
Age Menses
2.036 0.366 5.561 0.000
Stress Fractures
0.474 0.176 2.697 0.007
Nutrition Knowledge
213.357 22.038 9.681 0.000
Body Image
0.327 0.304 1.076 0.282
Table 8
Results in probability scale three-class latent class female model
Latent Class 1 Restrictive Diet
Estimate Standard Error
Estimate/Standard Error
P-Value
Category 1
0.826 0.079 10.452 0.000
Category 2
0.174 0.079 2.200 0.028

80
Irregular Menses
Estimate Standard Error
Estimate/Standard Error
P-Value
Category 1
0.652 0.099 6.567 0.000
Category 2
0.348 0.099 3.502 0.000
Food Insecurity
Estimate Standard Error
Estimate/Standard Error
P-Value
Category 1
0.826 0.079 10.452 0.000
Category 2
0.174 0.079 2.200 0.028
Latent Class 2 Restrictive Diet
Estimate Standard Error
Estimate/Standard Error
P-Value
Category 1
0.800 0.037 21.449 0.000
Category 2
0.200 0.037 5.362 0.000
Irregular Menses
Estimate Standard Error
Estimate/Standard Error
P-Value
Category 1
0.765 0.040 19.360 0.000
Category 2
0.235 0.040 5.362 0.000
Food Insecurity
Estimate Standard Error
Estimate/Standard Error
P-Value
Category 1
0.887 0.030 30.040 0.000

81
Category 2
0.113 0.030 3.828 0.000
Latent Class 3 Restrictive Diet
Estimate Standard Error
Estimate/Standard Error
P-Value
Category 1
0.833 0.153 5.452 0.000
Category 2
0.167 0.153 1.092 0.275
Irregular Menses
Estimate Standard Error
Estimate/Standard Error
P-Value
Category 1
0.667 0.192 3.472 0.001
Category 2
0.333 0.192 1.733 0.083
Food Insecurity
Estimate Standard Error
Estimate/Standard Error
P-Value
Category 1
1.000 0.000 0.000 1.000
Category 2
0.000 0.000 0.000 1.000
Table 9
Model results three-class latent class female model
Latent Class 1
Means
Estimate Standard Error
Estimate/Standard Error
P-Value
Meals Per Day
1.957 0.043 46.011 0.000
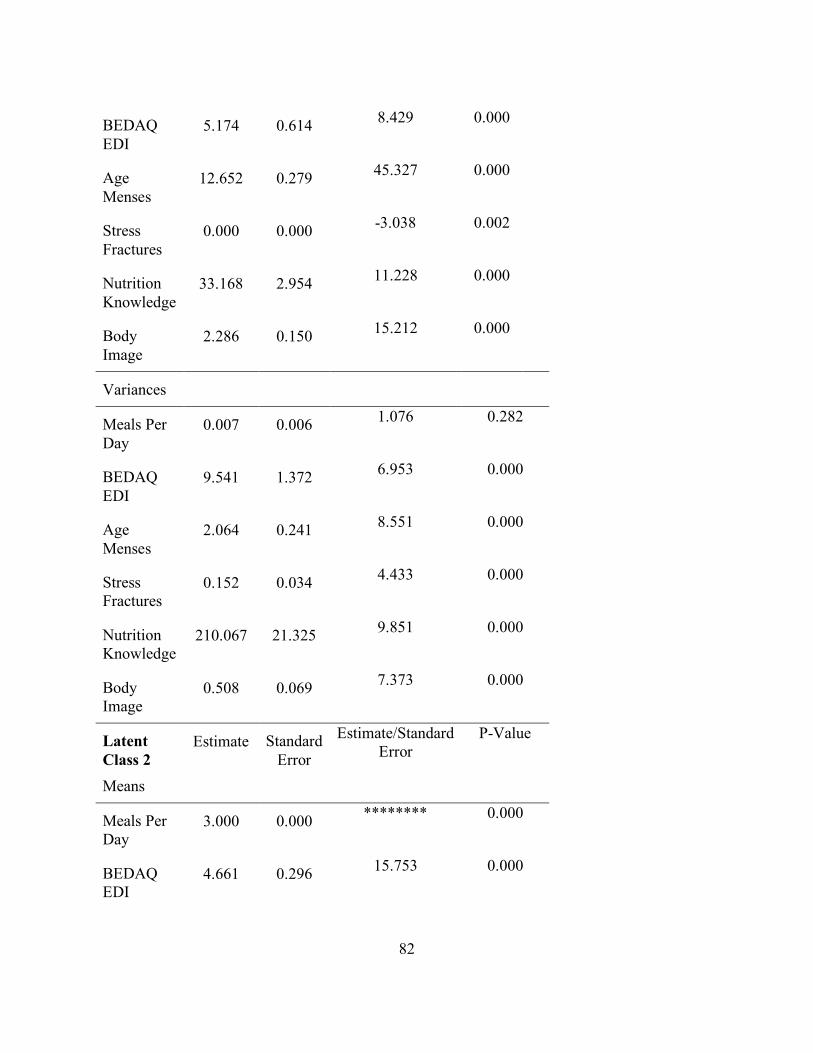
82
BEDAQ EDI
5.174 0.614 8.429 0.000
Age Menses
12.652 0.279 45.327 0.000
Stress Fractures
0.000 0.000 -3.038 0.002
Nutrition Knowledge
33.168 2.954 11.228 0.000
Body Image
2.286 0.150 15.212 0.000
Variances
Meals Per Day
0.007 0.006 1.076 0.282
BEDAQ EDI
9.541 1.372 6.953 0.000
Age Menses
2.064 0.241 8.551 0.000
Stress Fractures
0.152 0.034 4.433 0.000
Nutrition Knowledge
210.067 21.325 9.851 0.000
Body Image
0.508 0.069 7.373 0.000
Latent Class 2 Means
Estimate Standard Error
Estimate/Standard Error
P-Value
Meals Per Day
3.000 0.000 ******** 0.000
BEDAQ EDI
4.661 0.296 15.753 0.000

83
Age Menses
13.313 0.135 98.271 0.000
Stress Fractures
0.165 0.035 4.758 0.000
Nutrition Knowledge
38.908 1.358 28.654 0.000
Body Image
2.111 0.067 31.375 0.000
Variances
Meals Per Day
0.007 0.006 1.076 0.282
BEDAQ EDI
9.541 1.372 6.953 0.000
Age Menses
2.064 0.241 8.551 0.000
Stress Fractures
0.152 0.034 4.433 0.000
Nutrition Knowledge
210.067 21.325 9.851 0.000
Body Image
0.508 0.069 7.373 0.000
Latent Class 3 Means
Estimate Standard Error
Estimate/Standard Error
P-Value
Meals Per Day
3.000 0.000 ******** 0.000
BEDAQ EDI
2.166 0.684 3.122 0.002
Age Menses
14.677 0.610 24.040 0.000

84
Stress Fractures
3.001 0.412 7.262 0.000
Nutrition Knowledge
43.318 5.965 7.262 0.000
Body Image
1.787 0.196 9.101 0.000
Variances
Meals Per Day
0.007 0.006 1.076 0.282
BEDAQ EDI
9.541 1.372 6.953 0.000
Age Menses
2.064 0.241 8.551 0.000
Stress Fractures
0.152 0.034 4.433 0.000
Nutrition Knowledge
210.067 21.325 9.851 0.000
Body Image
0.508 0.069 7.373 0.000
Note. ******** indicates that the estimate/standard error value was not computed.
When a one-class model was conducted, few model characteristic statistics are provided
by the statistical software Mplus. Fit indices for a one-class model include an AIC of 3639.257, a
BIC of 3683.804, and an adjusted BIC of 3636.340. For the one-class model compared to the
two-class model, AIC is higher, BIC is higher, and Adjusted BIC is higher. The values are close,
but the two-class model performs better for these values. Other considerations include that
sample size of female athletes included in the model is into the hundreds, but is low for LCA and
there is some difficulty in interpreting the overall model fit criteria. Due to limited theory for this

85
population, given the current model there is some evidence to show that a two-class soltion is
better than a one-class solution. Therefore, H1 is supported and the null hypothesis can be
rejected.
Discussion
Main Findings
This study aimed to profile female student-athletes in collegiate athletics for nutrition and
RED-S concern. Categorical and continuous indicators consistent with the RED-S framework
and new considerations such as food insecurity, nutrition knowledge, and body image were
included in the model with the goal of uncovering an unknown latent variable of classes. At a
Division I university, 144 female student-athletes completed a pre-participation physical
evaluation that included a cross-sectional nutrition screening survey. Data from the evaluation
was utilized in a latent class analysis predictive model. RED-S is an emerging syndrome with
few studies in the population of team sport athletes and collegiate athletes.
Descriptive statistics outlined in Table 1 provide some insight into the indicators of interest.
For females, the mean age of onset menses was 13.26 ± 1.491 with a range of age 10 to 17. The
mean nutrition knowledge score was 38.175 ± 14.735, indicating poor nutrition knowledge. The
results of the statistical analysis provide information to support a two-class model solution to
profile the athletes of interest into separate latent classes.
Energy Availability
With consideration to previous RED-S research and the goal of screening, energy
availability has been typically assessed through disordered eating and eating disorder risk. At this
time no validated tool has been specifically designed for the collegiate athlete population, with
86
very few available for the female athlete population. The BEDA-Q tool has been utilized in the
female athlete population, specifically for adolescents, when screening for disordered eating
related to RED-S. This tool was utilized in this study due to the short length of the questionnaire
and the ease of distribution without the need for an interview, which is common in disordered
eating and eating disorder screening tools. When considering disordered eating risk, other
surrogate markers were also considered due to the lack of energy availability measurements in a
laboratory setting and the lack of validated tools for the college population. Number of meals per
day and restrictive dieting were also considered to also consider low energy availability.
Clinical Application
A main consideration of this topic is the complexity of RED-S and the difficulty of
screening athletes for a syndrome when limited tools exist for athletes of consideration that have
not been typically studied. College athletes that are not considered traditionally high risk are
often overlooked in the research. The questions that still stands at this time is does the traditional
RED-S framework apply to athletes outside of high-risk classification. Additionally, what
additional factors beyond the traditional framework may contribute to RED-S and low energy
syndromes and which of them may be specific to college athletes. Food insecurity, body image,
and nutrition knowledge were included in the LCA model to expand beyond the traditional
framework. As research evolves, the conceptual model for RED-S may change. An aim of this
study was to explore RED-S and low energy syndromes in a new population: non-high risk
collegiate athletes. Some findings were of interest beyond the LCA profiling.
Of the 144 female athletes included in the study, 19.4% followed a restrictive diet, 16.7%
reported eating less than 3 meals per day, 20.2% reported starting their menstrual cycle at or after

87
age 15, 25.7% had an irregular menstrual cycle, 17.4% reported at least one stress fracture,
11.8% had food insecurity, and 77.1% scored less than a 50 out of 100 on nutrition knowledge.
From the reported frequencies, it is important to note that many of the athletes have nutrition and
RED-S related issues of concern that need clinical consideration and further investigation
through consultations and referrals.
Specific to the statistical modeling technique, LCA has been previously utilized in the
healthcare setting as a clinical tool. Predictive modeling techniques as well as machine learning
have potential to assist clinicians. This exploratory study highlights a number of clinical
considerations and offers a starting point for others in the field to explore LCA and predictive
modeling techniques to explore RED-S.
Class Characteristics
In Tables 6 through 9, individual characteristics based on the indicator variables included
in the model did not clearly define class characteristics. This provides insight into the indicator
variables. A future model may consider using different tools to measure some of the RED-S
variables of interest. Additionally, for the variable meals per day, the estimate/standard error
value was not computed. This indicates model disruption at the three-class level. This may
indicate that the value could not be estimated due to the variable being similar across
participants. While some validated tools currently exist for female athletes, there is still a need
for high-quality validated tools for the college athlete population. This research provides a
starting point for other researchers to consider utilizing predictive modeling for RED-S and
highlights the need for more research.
Other Considerations
88
When a researcher is considering model fit and the number of classes for a population of
interest, their expertise regarding clinical insight is important. Classes should be separate from a
clinical standpoint through the discretion of the researcher. To prevent bias, the best fitting
model should be determined before linking the variables of interest to the classes identified. It is
possible that a 1-class model may be the best fit for a population and latent classes may not be
possible to distinguish using the indicators selected. As LCA is utilized in varying disciplines,
the application of LCA algorithms will evolve through understanding best conditions,
interpreting the information to the field, and clinical investigation.
There is evidence of poor model fit for the three-class solution due to two errors that
occurred. First, one or more logit thresholds approached extreme values of -15.000 and 15.000
and were fixed to stabilize model estimation. This resulted in parameters with 0 standard errors
and unknown z-score and p-values. Second, the standard errors of the model parameter estimates
may not be trustworthy for some parameters due to a non-positive definite first-order derivative
product matrix. This may be indicative of model nonidentification. This is likely due to poor
class enumeration with a higher class number. The sample size is likely the culprit for this
model. There are no guidelines for calculating sample size requirement a priori with
recommendations suggesting the larger the better, and into the hundreds. Smaller sample sizes
may perform well for estimating two-classes as long as the indicators are of high quality. There
is a suggestion that a three-class model may require up to 12 high quality indicators to perform
well if the sample size is under 200 (Wurpts, 2012). If indicators are of low quality, sample size
is recommended to be at least N = 500 for 12, and if N =1000 if there are 6 low quality
indicators. Some possible recommendations if working with a smaller sample size is to include a
89
higher number and quality of indicators and adding a covariate. Sample size may be limited in a
university setting with a range of athletes depending on athletic conference, division, and school
funding and size.
Another consideration for LCA is zero variances. Due to data sparseness with the BEDA-
Q disordered eating indicator, an alternate value from the tool was used. The EDI sum of 6
values was used in place of a binary, yes or no classification to reduce data sparseness and to
raise variance values away from zero. The BEDA-Q may need to be reconsidered for use in the
college athletic population because it at this time has only been validated in adolescent female
athletes. Results from the BEDA-Q tool include that only one athlete screened positive for eating
disorder risk, leading to a close to zero variance in the data set. This presents valuable
information that highlights a need for screening tools specific to male athletes and college
athletes and a validated tool specific to this population. Future research efforts should ensure the
model has few missing values relative to sample size and the sample size is large enough for
indicators of interest.
The main consideration at this time is the lack of validated nutrition screening surveys for
the collegiate athlete population. While some RED-S surveys may be in progress, at this time
there is a need for comprehensive nutrition screening tools with a focus on RED-S to be created
specific to this population. Utilizing a validated screening tool with a LCA approach may have
resulted in a model with more use of interpretation. This exploratory approach of LCA modeling
may provide health care practitioners valuable information in the future if the measures are
reliable and validated for the population of interest.
Strengths and Limitations

90
A strength of this study is that it provided insight into a predictive modeling technique to
identify classes of athletes who may be of nutrition and RED-S concern. This technique may
prove to be useful in the future to provide sports medicine practitioners and sports dietitians
information. This would ideally be used in the first step of a treatment plan to then move forward
with additional diagnostic tests such as the DEXA, bloodwork, body composition testing, and
additional consultations and interviews to make the diagnosis of RED-S. This would be helpful
in settings with limited sports medicine staff or high patient loads where each individual may not
be able to be diagnostically tested. As previously mentioned, the goal of screening differs from
the goal of diagnosing. All the individuals screened for RED-S may not present with diagnostic
criteria for RED-S, but the opposite end of the spectrum of flagging athletes of concern prior to
detrimental outcomes is worth the time and effort.
A predictive screening approach is proactive in nature rather than the reactive approach
of treating individuals when they present with RED-S symptoms. Ultimately this approach may
flag individuals of concern before decremental health and psychological outcomes appear such
as stress fractures. With athlete health and wellbeing in mind, practitioners should consider
predictive model screening as a piece of their healthcare practice. Another strength of this study
is that it is one of the few studies that explores RED-S screening and the first study to do so in
the collegiate setting.
A limitation of this study is that it is a cross-sectional study so athletes are only measured
at one point in time. Using screening data from incoming and returning athletes at the time of
pre-participation physicals does not account for athletes who may present with nutrition concerns
or RED-S throughout the duration of the academic year. A possible solution is multiple time

91
points of screening which could then be used in a longitudinal LCA model. It is necessary to
have practitioners well-versed in RED-S symptomology to be diligent about detecting behaviors
of concern and impaired health outcomes related to the syndrome. Another limitation is the
sample size. Future research should consider high sample sizes when utilizing LCA. Finally, the
study just examined the energy intake portion of EA due to the lack of tools available to capture
energy expenditure through survey or screening tools.
Conclusion
This research provided insight into a predictive modeling technique for a complex
syndrome in female collegiate athletes. The bulk of RED-S research is conducted on female
athletes, but few studies exist in the collegiate population. Additionally, predictive modeling has
not be utilized for this syndrome. This person-centered approach is exploratory in nature and
differs from most clustering techniques. This profiling technique differs from traditional
screening methodology. The evidence is premature to determine how this person-centered
approach of LCA will aid in the detection, prevention, and care of athletes. As further research
emerges, more insight may lead to the impact of athlete care through preventative measures.
The goal of this research was to employ an exploratory and predictive modeling
technique to profile athletes at risk for nutrition and RED-S concern. A two-class model was
determined the best fit to uncover classes of individuals of concern. It was difficult to explore the
class characteristics related to the indicator variables. With more accurate and validated tools,
this modeling technique may provide insight into a cost-effective and timely technique to
identify individuals of concern at pre-participation evaluations. Additionally, screening
information from multiple universities or universities with larger student-athlete populations may

92
provide a more stable LCA model to allow for higher class enumeration. Nutrition and RED-S
screening should be the first step before diagnosis to allow for the allocation of time and
resources to athletes of identified concern. Future studies should consider sport specific surveys
due to differing dynamics in individual and team sports. In the colligate setting, a RED-S
screening tool and eventually a RED-S diagnostic tool with consideration to female and team
sport athletes is of high importance. Overall, this predictive modeling technique provides some
insight into individual athletes who may need to be monitored and evaluated for RED-S. It is
important to note that many of the athletes have nutrition and RED-S related issues of concern
that need clinical consideration and further investigation through consultations and referrals
through the reported frequencies. Three additional indicators of RED-S were included in the
model, providing additional considerations beyond the RED-S framework. As research emerges,
the RED-S framework may need to be restructured but further studies should examine food
insecurity, nutrition knowledge, and body image and RED-S. At this time, a validated screening
tool and RED-S protocol for distribution is of high importance in the collegiate setting but until
one is validated, predictive modeling through models such as LCA may provide insight to best
detect athletes of RED-S concern.

93
LIST OF REFERENCES

94
Ackerman, K. E., Holtzman, B., Cooper, K. M., Flynn, E. F., Bruinvels, G., Tenforde, A. S., . . .
Parziale, A. L. (2019). Low energy availability surrogates correlate with health and
performance consequences of Relative Energy Deficiency in Sport. Br J Sports Med,
53(10), 628-633. doi:10.1136/bjsports-2017-098958
Ackerman, K. E., Stellingwerff, T., Elliott-Sale, K. J., Baltzell, A., Cain, M., Goucher, K., . . .
Mountjoy, M. L. (2020). #REDS (Relative Energy Deficiency in Sport): time for a
revolution in sports culture and systems to improve athlete health and performance. Br J
Sports Med, 54(7), 369-370. doi:10.1136/bjsports-2019-101926
Bullock, G. S., Hughes, T., Sergeant, J. C., Callaghan, M. J., Riley, R., & Collins, G. (2021).
Methods matter: clinical prediction models will benefit sports medicine practice, but only
if they are properly developed and validated. British Journal of Sports Medicine,
bjsports-2021-104329. doi:10.1136/bjsports-2021-104329
Burke, L. M., Close, G. L., Lundy, B., Mooses, M., Morton, J. P., & Tenforde, A. S. (2018).
Relative Energy Deficiency in Sport in Male Athletes: A Commentary on Its Presentation
Among Selected Groups of Male Athletes. Int J Sport Nutr Exerc Metab, 28(4), 364-374.
doi:10.1123/ijsnem.2018-0182
Condo, D., Lohman, R., Kelly, M., & Carr, A. (2019). Nutritional Intake, Sports Nutrition
Knowledge and Energy Availability in Female Australian Rules Football Players.
Nutrients, 11(5). doi:10.3390/nu11050971
Correia, M. I. T. D. (2018). Nutrition screening vs nutrition assessment: what’s the difference?
Nutrition in Clinical Practice, 33(1), 62-72.

95
De Souza, M. J., Nattiv, A., Joy, E., Misra, M., Williams, N. I., Mallinson, R. J., . . . Matheson,
G. (2014). 2014 Female Athlete Triad Coalition Consensus Statement on treatment and
return to play of the female athlete triad: 1st International Conference held in San
Francisco, California, May 2012 and 2nd International Conference held in Indianapolis,
Indiana, May 2013. Br J Sports Med, 48(4), 289-289.
Elliott-Sale, K. J., Tenforde, A. S., Parziale, A. L., Holtzman, B., & Ackerman, K. E. (2018).
Endocrine Effects of Relative Energy Deficiency in Sport. Int J Sport Nutr Exerc Metab,
28(4), 335-349. doi:10.1123/ijsnem.2018-0127
Ferguson, S. L., G. Moore, E. W., & Hull, D. M. (2019). Finding latent groups in observed data:
A primer on latent profile analysis in Mplus for applied researchers. International
Journal of Behavioral Development, 44(5), 458-468. doi:10.1177/0165025419881721
Galli, N., Petrie, T. A., Reel, J. J., Chatterton, J. M., & Baghurst, T. M. (2014). Assessing the
Validity of the Weight Pressures in Sport Scale for Male Athletes. Psychology of Men &
Masculinity, 15(2), 170-180. doi:10.1037/a0031762
Galli, N., Reel, J. J., Petrie, T., Greenleaf, C., & Carter, J. (2011). Preliminary development of
the weight pressures in sport scale for male athletes. Journal of Sport Behavior, 34(1).
Heaney, S., O'Connor, H., Michael, S., Gifford, J., & Naughton, G. (2011). Nutrition knowledge
in athletes: a systematic review. Int J Sport Nutr Exerc Metab, 21(3), 248-261.
doi:10.1123/ijsnem.21.3.248
Hendrickse, J., Arpan, L. M., Clayton, R. B., & Ridgway, J. L. (2017). Instagram and college
women's body image: Investigating the roles of appearance-related comparisons and
intrasexual competition. Computers in Human Behavior, 74, 92-100.

96
Kristjansdottir, H., Sigurethardottir, P., Jonsdottir, S., Thornorsteinsdottir, G., & Saavedra, J.
(2019). Body Image Concern and Eating Disorder Symptoms Among Elite Icelandic
Athletes. Int J Environ Res Public Health, 16(15). doi:10.3390/ijerph16152728
Lo, Y., Mendell, N. R., & Rubin, D. B. (2001). Testing the number of components in a normal
mixture. Biometrika, 88(3), 767-778.
Logue, D., Madigan, S. M., Delahunt, E., Heinen, M., Mc Donnell, S. J., & Corish, C. A. (2018).
Low Energy Availability in Athletes: A Review of Prevalence, Dietary Patterns,
Physiological Health, and Sports Performance. Sports Med, 48(1), 73-96.
doi:10.1007/s40279-017-0790-3
Logue, D. M., Madigan, S. M., Melin, A., Delahunt, E., Heinen, M., Donnell, S. M., & Corish,
C. A. (2020). Low Energy Availability in Athletes 2020: An Updated Narrative Review
of Prevalence, Risk, Within-Day Energy Balance, Knowledge, and Impact on Sports
Performance. Nutrients, 12(3). doi:10.3390/nu12030835
McCutcheon, A. L. (1987). Latent class analysis: Sage.
Melin, A., Tornberg, Å. B., Skouby, S., Faber, J., Ritz, C., Sjödin, A., & Sundgot-Borgen, J.
(2014). The LEAF questionnaire: a screening tool for the identification of female athletes
at risk for the female athlete triad. Br J Sports Med, 48(7), 540-545.
Mori, M., Krumholz, H. M., & Allore, H. G. (2020). Using latent class analysis to identify
hidden clinical phenotypes. Jama, 324(7), 700-701.
Mountjoy, M., Sundgot-Borgen, J., Burke, L., Ackerman, K. E., Blauwet, C., Constantini, N., . . .
Budgett, R. (2018). International Olympic Committee (IOC) Consensus Statement on
Relative Energy Deficiency in Sport (RED-S): 2018 Update. Int J Sport Nutr Exerc
Metab, 28(4), 316-331. doi:10.1123/ijsnem.2018-0136

97
Mountjoy, M., Sundgot-Borgen, J., Burke, L., Carter, S., Constantini, N., Lebrun, C., . . .
Ljungqvist, A. (2014). The IOC consensus statement: beyond the Female Athlete Triad—
Relative Energy Deficiency in Sport (RED-S). British Journal of Sports Medicine, 48(7),
491-497. doi:10.1136/bjsports-2014-093502
Mountjoy, M., Sundgot-Borgen, J., Burke, L., Carter, S., Constantini, N., Lebrun, C., . . .
Ackerman, K. (2015). RED-S CAT. Relative Energy Deficiency in Sport (RED-S)
Clinical Assessment Tool (CAT). Br J Sports Med, 49(7), 421-423. doi:10.1136/bjsports-
2015-094873
Mountjoy, M. L., Burke, L. M., Stellingwerff, T., & Sundgot-Borgen, J. (2018). Relative Energy
Deficiency in Sport: The Tip of an Iceberg. Int J Sport Nutr Exerc Metab, 28(4), 313-
315. doi:10.1123/ijsnem.2018-0149
NCAA. 2021. Retrieved April 20, 2021, from https://www.ncaa.org.
Nylund-Gibson, K., & Choi, A. Y. (2018). Ten frequently asked questions about latent class
analysis. Translational Issues in Psychological Science, 4(4), 440.
Poll, K. L., Holben, D. H., Valliant, M., & Joung, H.-W. (2018). Food insecurity is associated
with disordered eating behaviors in NCAA division 1 male collegiate athletes. Journal of
American College Health, 1-5.
Sim, A., & Burns, S. F. (2021). Review: questionnaires as measures for low energy availability
(LEA) and relative energy deficiency in sport (RED-S) in athletes. Journal of Eating
Disorders, 9(1), 41. doi:10.1186/s40337-021-00396-7
Sinha, P., Calfee, C. S., & Delucchi, K. L. (2020). Practitioner’s guide to latent class analysis:
methodological considerations and common pitfalls. Critical care medicine, 49(1), e63-
e79.

98
Spurk, D., Hirschi, A., Wang, M., Valero, D., & Kauffeld, S. (2020). Latent profile analysis: A
review and “how to” guide of its application within vocational behavior research. Journal
of Vocational Behavior, 120, 103445.
Tenforde, A. S., DeLuca, S., Wu, A. C., Ackerman, K. E., Lewis, M., Rauh, M. J., . . . Roberts,
W. (2021). Prevalence and factors associated with bone stress injury in middle school
runners. PM&R.
VanHeest, J. L., Rodgers, C. D., Mahoney, C. E., & De Souza, M. J. (2014). Ovarian
Suppression Impairs Sport Performance in Junior Elite Female Swimmers. Medicine &
Science in Sports & Exercise, 46(1), 156-166. doi:10.1249/MSS.0b013e3182a32b72
Werner, E. N., Guadagni, A. J., & Pivarnik, J. M. (2020). Assessment of nutrition knowledge in
division I college athletes. Journal of American College Health, 1-8.
Wurpts, I. C. (2012). Testing the limits of latent class analysis: Arizona State University.

99
APPENDIX

100
Summary of screening measures for female student-athletes
BEDA-Q
EDI
Dietary Practices
Meals Per Day Bone Health
Menstruation ANSK-Q Food Insecurity
WPS
I feel extremely guilty after overeatinga
I am preoccupied with the desire to be thinnera
I think that my stomach is too biga
I feel satisfied with the shape of my bodya
My parents have expected excellence of mea
As a child, I tried very hard to avoid disappointing my parents and teachersa
Are you currently following or have you ever followed any special dietary considerations for personal reasons, diagnosed conditions, or religious reasons? b
Options:
Vegetarian,
Semi-
Vegetarian,
Vegan,
Gluten-free,
Dairy-free,
Lactose-free,
Paleo,
Ketogenic,
Intermittent
Fasting,
Low carb,
Fasting for
religious
reasons
(Ramadan,
etc.), Low
FOD-MAP
Please list your food intake for the past 24 hours in each of the categories. Do your best to estimate the amounts (i.e. one handful, one fistful), quantity of food items, if you prepared it at home or out (and list restaurant) and as specific as possible.c
Have you ever had a stress fracture? b
How many stress fractures have you had?d
What was the site of your stress fracture(s)?
Options: Lumbar spine
Femoral neck Sacrum Pelvis
How old were you when you first menstruated?e
Is your menstrual cycle currently regular (period at the same time every month)? b
Full questionnaire in Appendix
Within the past 12 months I was worried whether my food would run out before I got money to buy more.f
Within the past 12 months the food I bought just didn't last and I didn't have money to get more.f
In the past year, my coach places an emphasis on team members’ weightg
In the past year, my coach encourages athletes to gain muscle massg
Weigh-ins are held periodically throughout the seasong
Body weight and appearance are important to my coachg
My teammates notice if I put on weightg
Any of my body flaws are readily apparent in my uniformg
The crowd scrutinizes my body and makes me concerned about my weight and appearanceg
In the past year, have you lost weight to meet image requirements for your sport? g
In the past year, have you ever ate in secret?
g
Body weight and appearance are important to my friends outside of sportg
Body weight and appearance are

101
important to my familyg
The leanest athletes are at a distinct performance advantageg
Note. Brief Eating Disorder in Athletes Questionnaire (BEDA-Q) Abridged Nutrition for Sport Knowledge Questionnaire (A-NSKQ) Weight Pressures in Sport (WPS) aAnswer choices: always, usually, sometimes, often, never bAnswer choices: yes, no cAnswer choices: Breakfast, Lunch, Dinner, Snacks, Beverages dAnswer choices: 1, 2, 3, 4, 5, >5 eAnswer choices: <10, 10, 11, 12, 13, 14, 15, 16, >16 fAnswer choices: often true, sometimes true, never true gAnswer choices: always, usually, often, sometimes, rarely, never
Latent Class Analysis Syntax Title: Dissertation Female New Model LCA; Variable: names = RESdiet Meals BEDAQEDI Agemens Irrmens SF FoodIns ANSKQ WPS; usevariables = RESdiet Meals BEDAQEDI Agemens Irrmens SF FoodIns ANSKQ WPS; categorical = RESdiet Irrmens FoodIns; classes = c(3); Analysis: type = mixture; STARTS = 0; LRTSTARTS = 0 0 300 20; Savedata: file = Female_Model_Mplus_save_test.txt; save = cprob; format = free; Output: tech11 tech14;

102
CHAPTER V
MANUSCRIPT II
A LATENT CLASS ANALYSIS OF MALE COLLEGIATE ATHLETES OF NUTRITION
AND RED-S CONCERN
To be submitted to the Journal of American College Health
Abstract
Relative Energy Deficiency in Sport (RED-S) has been expanded upon creation in 2014
to include a variety of ages and athletes. The traditional female athlete triad was expanded to
include male athletes in the RED-S definition as well. Research on the male athlete population
needs further investigation. The goal of this cross-sectional research was to use a Latent Class
Analysis (LCA) predictive modeling approach to determine classes of male collegiate athletes
who present with nutrition and RED-S concern. At a Division I university, 72 male athletes
competing in various team sports completed a pre- participation nutrition screening survey.
Measures such as bone health, disordered eating, restrictive diets, food insecurity, body image,
and nutrition knowledge were collected. At this time, there is a lack of evidence presented to
support that male athletes can be profiled into a two-class solution. In order to provide
practitioners and sports dietitians insight into profiling athletes who may be at risk for low
energy syndromes, larger samples of male athletes should be collected when utilizing LCA.

103
Future research should consider large sample sizes of athletes to conduct predictive modeling
techniques along with high quality, validated measurement tools. This research highlights the
need for more research on low energy syndromes in male collegiate team sport athletes.
Keywords: Relative Energy Deficiency in Sport (RED-S), Collegiate Athletes, Nutrition
Screening, Latent Class Analysis
Main Text Introduction
The National Collegiate Athletic Association (NCAA) is comprised of 1,098 colleges and
universities, 102 athletics conferences, nearly 500,000 college athletes on 19,886 teams in 24
sports across 3 divisions (NCAA, 2021). Student-athletes participating in NCAA athletics in the
United States receive academic support, medical care, access to coaching, facilities, and
equipment at their respective university. Annually, NCAA schools award nearly $3.5 billion
dollars in athletic scholarships with some Division I schools offering additional funds to cover
costs not covered by a scholarship. NCAA Division I and II schools can provide unlimited meals
to support the nutritional needs of student-athletes, but only some schools have registered
dietitians (RD), nutritionists, and other health professionals designated to work with athletes. A
study found that nutrition education from a registered dietitian improved energy intake,
macronutrient intake, and nutrition knowledge in 11 NCAA Division I female volleyball athletes
(Valliant et al., 2012).
When energy availability and fueling demands for sport are not met, a syndrome called
Relative Energy Deficiency in Sport (RED-S) can occur. The syndrome was introduced by the

104
International Olympic Committee (IOC) as a “broader, more comprehensive term” in 2014 to
describe the previously known low energy condition of the Female Athlete Triad (M. Mountjoy
et al., 2014). Various health systems such as bone health, menstrual function, and others along
with performance parameters may be affect by this syndrome. A publication on male athletes and
RED-S suggested looking at additional factors that may be contributing to RED-S beyond just
those for females (Burke, Close, et al., 2018). Male athletes are more likely to suffer from
disordered eating compared to non-athletes (Chapman & Woodman, 2016).
Athletes attending universities and colleges are often 18 to 24 years old, living on their
own away from family for the first time, and are required to balance school work and sport
obligations. Nutritionally this can be a critical time as growth and development of adolescence is
ending, peak bone mass is reached, and fueling demands for college levels sports may increase.
These factors relate to energy availability and the importance of meeting nutritional needs for
health and performance. Although RED-S and low energy syndromes may be present in college
athletes, the current RED-S framework should be critically examined to determine if all 10
health and 10 performance consequences present in this population. Furthermore, the framework
should continue to evolve and expand as this syndrome changes over time. This may include
considering additional health considerations. This study will examine three additional possible
constructs of RED-S: nutrition knowledge, food insecurity, and body image.
A review on nutrition knowledge in athletes highlights the need for future research to use
validated tools to measure nutrition knowledge in athletes, and to further solidify the
understanding of the relationship between nutrition knowledge and dietary intake (Heaney et al.,
2011). Nutrition knowledge has been studied in relation to low EA in female Australian rules

105
football players with results finding low sports nutrition knowledge and a 30% risk of low EA in
the 30 athletes studied (Condo et al., 2019). A study on nutrition knowledge in collegiate athletes
found poor nutrition knowledge scores 57.6% ± 18.6%, with the possible impact on performance
and injury risk, (Werner et al., 2020). Although nutrition knowledge has not been studied in
relation to low energy syndromes like RED-S, assessing nutrition knowledge is an important
component of nutrition screening. Baseline nutrition knowledge measurements can aid in the
development of team nutrition education with target interventions. This possible relationship
should be explored to determine if the two concepts are interrelated.
At this time, food insecurity has not been studied in relation to RED-S. The lack of access
to nutritious food, or inadequate means to acquire, prepare and consume food is a substantial
barrier to proper nutrition. Food insecurity as a contributing factor to low EA in the athletic
population is currently unknown. One study found that food insecurity in college athletes was
found to be significantly correlated with hoarding food and being preoccupation with food (Poll
et al., 2018). Additionally, food insecurity and lack of finances may also contribute to impaired
nutrition in some populations (Burke, Close, et al., 2018). Additionally, in the 2018 IOC
Consensus Statement on RED-S, authors state that “cultural, social, psychological, and financial
factors contribute to low energy availability” so the food security status and scholarship status in
collegiate athletes warrant further investigation (M. Mountjoy et al., 2018).
Body image has been linked to disordered eating and eating disorder behaviors but is not
currently included in the RED-S framework. Body image was considered with eating disorder
behaviors in elite Icelandic athletes, with 17.9% of the athletes having severe or moderate body
image dissatisfaction, and 18.2% of athletes above the clinical cutoff for body image concern,

106
with more women’s scores being higher than the men’s overall (Kristjansdottir et al., 2019).
Social media may also play into one’s body image and appearance-related comparisons, which
has been looked at in college females (Hendrickse et al., 2017). In college athletes body image
may be of concern due to weight pressures from peers, teammates, coaches, fans and other
individuals. The Weight Pressures in Sport (WPS) tool developed for male college athletes has
been validated for use for detecting various sources of weight pressures and body image in the
college athlete population (Galli et al., 2014; Galli et al., 2011). The WPS tool was developed for
male collegiate athletes and the sample included athletes from aesthetic sports such as diving and
weight class sports such as wrestling in which body appearance and weight are a focus. Body
image is an important component to assess because of the relation to dieting behavior and the
psychological component of RED-S that can precede or be a result of RED-S.
A unique aspect of collegiate athletics is the focus on team sports and the subcultures
within different institutions and individual teams. It has been speculated that RED-S may occur
at an increased rate in high-risk sports, but if all sports including team sports are not included in
the body of literature and work, then the prevalence may be unknown. To date, there have been
no research publications investigating the incidence of RED-S in team sports highlighting an
important need for research efforts (M. L. Mountjoy et al., 2018).
At this time, a validated and widely used nutrition screening protocol is not available for
college athletes. At the NCAA institutional and university level, screening policies and survey
tools utilized are dependent on individual policies developed by sports medicine athletic
directors, athletic trainers, and nutrition staff if available.

107
It is unknown at this time if annual screening for low energy syndromes such as RED-S
and the Triad or for eating disorders is conducted routinely at NCAA institutions. The screening
and diagnosis of RED-S can be subtle and challenging to uncover, so individuals well versed in
the symptomatology should be involved in the screening protocols developed (M. Mountjoy et
al., 2014). The shortcomings of currently published screening tools include that there is a lack of
consensus on what tool to use and the current tools are limited by lack of validation. Many tools
developed focus on either males or females entirely, are not targeted to college athletes and team
sports. A narrative review on low EA published in 2020 highlights the need for sport and sex-
specific screening tools to identify athletes participating in a variety of sports at risk of RED-S
(D. M. Logue et al., 2020).
A Latent Class Analysis (LCA model) was introduced as a technique to explore latent
classes of individuals in an exploratory manner utilizing a unrestricted model (McCutcheon,
1987). LCA is an explanatory modeling technique that allows for the grouping of individuals
with similar characteristics (Mori et al., 2020). The aim of this model is to estimate the
probability of each athlete being a member of each latent class. LCA can be a helpful modeling
technique that focuses on individuals rather than indicators. Personal behaviors and
characteristics are used to determine latent profiles based on similar responses to the indicators
and variables of interest (Spurk et al., 2020). The goal is to uncover underlying patterns of shared
behavior that are of interest to the researcher.
This technique is especially useful or researchers in social sciences to explore patterns of
shared behaviors between samples. These patterns of interest may be missed when individual
variable-centered analyses are conducted (Ferguson et al., 2019). Furthermore, LCA can be
useful in medical disciplines. Syndromic clinical conditions are frequently reliant on rigid, yet

108
broad definitions. Clinical prediction models are expected to benefit sports medicine practice, but
only if they are properly developed and validated. These models may help guide decision making
processes in clinical medicine but are not commonly used in sports medicine (Bullock et al.,
2021). A focus on the methodology, specifically model development, model performance, and
validation must be considered when conducting prediction research.
Research Question
The goal of this study is to detect student-athletes who may be of nutrition-specific health
concern related to Relative Energy Deficiency in Sport (RED-S) at the time of pre-participation
health evaluations through a latent class analysis predictive model. This study seeks to explore
and answer the following question:
1. What conceptual groups exist that distinctly categorize male student-athletes that are of
nutrition-specific health concern related to Relative Energy Deficiency in Sport (RED-
S)?
This question will be answered through a latent class analysis model that identifies levels of a
latent categorical variable through the analysis of observed continuous and categorical variables.
The observed variables include measures consistent with the traditional framework of RED-S for
male athletes such as disordered eating, restrictive diets/dieting, and bone health, will be
included in this model. Along with the traditional indicators, three additional measures will be
considered. Food insecurity, nutrition knowledge, and body image will be included in the model
to explore how the RED-S framework can evolve in the future with additional research efforts.
The following hypothesis will be tested:

109
H1: Male student-athletes can be categorized into classes ranging from low nutrition and RED-S concern to high nutrition and RED-S concern using traditional RED-S framework indicators and
three additional new indicators.
Materials and Methods
Study Design
This study is a quantitative cross-sectional study utilizing a web-based survey software to
explore nutrition-related health concerns including RED-S through nutrition screening in
collegiate athletes. Through a latent class analysis, individuals will be profiled to determine
classes of individuals of concern. The data for this study will be generated using Qualtrics
software with electronic administration for the Nutrition Screening Survey (Qualtrics Provo, UT,
2021).
Setting
The setting is at a Division I university in the southeast of the United States. Athletes
range from 18-24 years old and participate in a variety of team sports. Team sport female
athletes will be screened with sports outlined in the table below.
Table 1
Study participants and team sports
n Sports
Male 72 Baseball, Basketball, Tennis, Track & Field
Measurement Tools

110
Due to the lack of consensus on RED-S screening tools, no current validated screening
tools for this population, and the subtle nature of low energy syndromes and how they may be
detected through screening forms, no current tool was available for use. Various nutrition and
RED-S components will be measured through a variety of previously published screening tools
outlined below. Similar survey methodology was used, with reference to a recent study that
conducted a cross-sectional study on patients that presented to the Division of Sports Medicine at
Boston Children’s Hospital (Ackerman et al., 2019). As mentioned in their study, due to the lack
of a validated or standard measure for RED-S, survey measures based on validated and/or
standard questionnaires for each topic as available were used. The survey tools are outlined in
the Appendix.
Eating disorder and disordered risk will be measured through self-reported history of a
diagnosed eating disorder, self-reported history of professional counseling for eating problems
(disordered eating), and the BEDA-Q screening tool. The BEDA-Q has been used in adolescent
female athletes, but it has not been validated for use in collegiate male and female athletes.
Restrictive dieting will be measured through the question: “Are you currently following or have
you ever followed any special dietary considerations for personal reasons, diagnosed conditions,
or religious reasons? (vegan, vegetarian, gluten free, dairy free, religious fasting, paleo, etc.)”
with options including: “Vegetarian” “Semi-Vegetarian” “Vegan” “Gluten-free” “Dairy-free”
“Lactose-free” “Paleo” “Ketogenic” “Intermittent Fasting” “Low carb” “Fasting for religious
reasons (Ramadan, etc.)” “Low FOD-MAP.” While the diets mentioned are not necessarily low-
energy diets, the purpose is to see if any restrictions may be followed for any reason that may
lead to energy restriction if not properly planned. This screening question may provide insight
into diets athletes follow for a variety of reasons. Number of meals consumed per day provides

111
insight into if athletes are missing meals and will be assessed through a 24-hour food recall.
While a pre-determined number of meals is dependent on individual energy needs, literature has
shown that not consuming at least 3 meals per day can be indicative of disordered eating (Adam
S Tenforde et al., 2021). With low energy availability (LEA) at the core of RED-S, it is more
traditionally measured in a laboratory setting. Through screening forms, it is important to assess
possibility of LEA in collegiate athletes through eating disorders/disordered eating and dieting
with the diagnosis of LEA at a later time through more complex equations, body composition
testing, and indirect calorimetry.
Bone health will be measured through self-reported history of number of stress fractures,
and if answered yes to having history of a stress fracture, a follow-up question on high-risk sites
(sacrum, pelvis, lumbar spine, femoral neck) will be asked.
Food insecurity will be measured through the United States Department of Agriculture
(USDA) 2-question measure for food insecurity. The two questions include: “Within the past 12
months I was worried whether my food would run out before I got money to buy more” and
“Within the past 12 months the food I bought just didn't last and I didn't have money to get
more” with answer choices as “often true” “sometimes true” or “never true.” If the athlete
answered with the choice of “often true” or “sometimes true” that indicated a positive screen for
food insecurity.
Nutrition knowledge will be measured through the Abridged Nutrition for Sport
Knowledge Questionnaire ANSK-Q tool that assesses general nutrition knowledge as well as
sport nutrition knowledge. Items will be scored and individuals will be scored on a range of 0-
100 with higher values indicating higher nutrition knowledge.

112
Weight pressures in sport will be measured through the Weight Pressures in Sport (WPS)
tool that was developed to assess weight pressures and body image in male collegiate athletes
(Galli et al., 2014; Galli et al., 2011). With no questions specific to sex, the tool is appropriate for
use in female athletes as well but has yet to be validated in this population. The authors
recommend a 6-point Likert scale, but the survey included an extra measure of “neutral”
increasing the scale to a 7-point Likert scale. To account for this, the data underwent a linear
transformation to convert responses in a weighted manner to match the recommended 6-point
scale. The following formula was utilized:
𝑌 = (𝐵 − 𝐴) ∗ (𝑥 − 𝑎)/(𝑏 − 𝑎) + 𝐴
𝑌 = (6 − 1) ∗ (𝑥 − 1)/(7 − 1)+ 1
Statistical Analysis
A latent class analysis approach will determine classes of individuals who may present
with nutrition related and RED-S concerns. Mplus statistical software will be utilized to discover
underlying latent classes of individuals (Muthén, L. K., & Muthén, B. O., 2021). This
exploratory modeling technique is often utilized in the psychological or health science field as an
approach to patient-centered analysis. The LCA technique was introduced in 1987 as a method to
determine classes of individuals (McCutcheon, A.C., 1987). A conceptual map of the model is
outlined below with each of the indictor variables on the top and the covariate sex off to the side
with C latent classes.

113
Figure 1: Proposed Latent Class Analysis Model for Collegiate Male Athletes
LCA Statistical Analysis
There are a number of considerations when determining which latent class model that
best fits the individuals of interest. If many sampling zeros are present in the dataset, sparseness
exists. This differs from structural zeros. If sparseness occurs, it leads to difficulties in model
evaluation. Lack of consensus on a general rule of thumb for sample size but it has been
established that LCA models are case sensitive and require large sample sizes into the hundreds.
Determining number of classes, also named class enumeration, involves fitting several
LCA models with differing numbers of latent classes, collecting fit information for each model,
then studying patterns to decide how many classes best describe patterns observed in the data
(Nylund-Gibson & Choi, 2018). Information such as goodness of fit statistics can be analyzed to
evaluate the model fitness. The Akaike Information Criterion (AIC), Bayesian Information
Criterion (BIC), Sample-size adjusted BIC all are considered for goodness of fit. BIC helps in
model selection by penalizing the number of factors, providing insight into the model fit.

114
The LCA model with the smallest values for AIC, BIC and sample-size adjusted BIC are
considered to be the best fitting model. The solution with the largest loglikelihood is considered
to be better fitting than a model with lower loglikelihood values.
Lo-Mendell-Rubin Adjusted Likelihood Ratio Test (LMR-LMT) compares models with
varying numbers of classes. If p-value < 0.05, the model with one fewer class is a better fit for
the data (Lo et al., 2001). If the p-value is ≥ 0.05, the model would need to be reclassified with
fewer classes. The parametric bootstrapping p-value is also of interest, with a p value ≥0.05
indicating that the model needs to be reduced in class size.
Results
The descriptive statistics of the data of interest is included in Table 2. From the male
athletes included in the study, the average nutrition knowledge score was a 30.00 out of 100,
indicating poor nutrition knowledge. The average number of stress fractures was less than 1 at
0.56.
Table 2
Descriptive Statistics for Male Participants
N Minimum Maximum Mean Std. Deviation
Variance
Restrictive Diet
72 0 1 0.08 0.278 0.077
Number of Meals Per Day
72 0 3 2.76 0.569 0.324
Eating Disorder Inventory (EDI)
72 0 16 4.31 2.881 8.300

115
Stress Fractures
72 0 4 0.56 0.870 0.757
Food Insecurity
72 0 1 0.22 0.419 0.175
Nutrition Knowledge
72 0 68.571 30 18 324.001
Body Image
72 1 4.472 2.647 0.990 0.980
To test the classification of collegiate athletes, a latent class analysis was run on 72
participants. The number of optimal classes in the data set are determined by the researcher
based on a number of criteria. The best fitting LCA model is determined based on fit statistics
such as Bayesian Information Criterion (BIC), adjusted BIC, and AIC, as well as interpretability,
and non-information-criterion such as the Lo-Mendell-Rubin fit index and the Bootstrapped
likelihood ratio test (BLRT).
The following fit information for the two and three-class models are included in Table 3:
Table 3
Latent class analysis model fit criteria
Model Number of
classes
Loglikelihood Entropy AIC BIC Adjusted BIC
Number of free
parameters
VLRT Lo-Mendell-Rubin
Bootstrapped LRT
BLRT
1 2 -782.480
0.800 1604.961 1650.494
1587.481 20 0.1169 0.1169 0.000*
2 3 -762.898
0.977 1581.795 1645.542
1557.323 28 0.3734 0.3803 0.000*
Note. *p<.05 Akaike information criterion (AIC) Bayesian information criterion (BIC) Vuong-Lo-Mendell-Rubin (VLMR) Likelihood ratio test (LRT) Bootstrapped likelihood ratio test (BLRT)

116
The analysis provided information regarding two and three-class models that emerged
from the data. The first model provided insight into profiling male student-athletes into a two-
class solution with no errors. The three-class solution provided model fit information, but class
enumeration was not trustworthy due to a higher class size and model error. The three-class
model showed poor absolute model fit and poor relative fit.
Table 4
Two class latent class assignment results
Latent Class Number of individuals
Percentage of
individuals
1 38 52.778%
2 34 49.752%
The three-class model identified the following counts for the latent classes based on the
estimated model:
Table 5
Three class latent class assignment results
Latent Class Number of individuals
Percentage of
individuals
1 3 4.167%
2 60 83.333%
3 9 12.500%
Class Characteristics

117
Tables 6 through 9 provide insight into the two- and three-class models. The results in
probability scale tables outline the categorical variables of interest in the model and the model
results table outlines the continuous variables. The results of the table do not provide distinction
between classes two and three on a variable level. If variables distinctly were consistent between
groups, then there would be shared characteristics in the participants.
Table 6
Results in probability scale two-class latent class male model
Latent Class 1 Restrictive Diet
Estimate Standard Error
Estimate/Standard Error
P-Value
Category 1
0.917 0.046 19.891 0.000
Category 2
0.083 0.046 1.793 0.073
Food Insecurity
Estimate Standard Error
Estimate/Standard Error
P-Value
Category 1
0.900 0.051 17.481 0.000
Category 2
0.100 0.051 1.952 0.051
Latent Class 2 Restrictive Diet
Estimate Standard Error
Estimate/Standard Error
P-Value
Category 1
0.916 0.049 18.521 0.000
Category 2
0.084 0.049 1.699 0.089

118
Food Insecurity
Estimate Standard Error
Estimate/Standard Error
P-Value
Category 1
0.641 0.091 7.079 0.000
Category 2
0.359 0.091 3.957 0.000
Table 7
Model results two-class latent class male model
Latent Class 1 Means
Estimate Standard Error
Estimate/Standard Error
P-Value
Meals Per Day
2.765 0.107 25.871 0.000
BEDAQ EDI
3.003 0.340 8.835 0.000
Stress Fractures
0.629 0.169 3.748 0.000
Nutrition Knowledge
32.565 3.309 9.841 0.000
Body Image
1.871 0.134 13.920 0.000
Variances
Meals Per Day
0.319 0.120 2.671 0.008
BEDAQ EDI
6.285 1.735 3.624 0.000
Stress Fractures
0.741 0.179 4.141 0.000
Nutrition Knowledge
312.137 43.020 7.256 0.000

119
Body Image
0.291 0.051 5.711 0.000
Latent Class 2 Means
Estimate Standard Error
Estimate/Standard Error
P-Value
Meals Per Day
2.763 0.091 30.479 0.000
BEDAQ EDI
5.764 0.558 10.324 0.000
Stress Fractures
0.474 0.133 3.574 0.000
Nutrition Knowledge
27.129 2.837 9.563 0.000
Body Image
3.517 0.123 28.636 0.000
Variances
Meals Per Day
0.319 0.120 2.671 0.008
BEDAQ EDI
6.285 1.735 3.624 0.000
Stress Fractures
0.741 0.179 4.141 0.000
Nutrition Knowledge
312.137 43.020 7.256 0.000
Body Image
0.291 0.051 5.711 0.000
Table 8
Results in probability scale three-class latent class male model
Latent Class 1
Estimate Standard Error
Estimate/Standard Error
P-Value

120
Restrictive Diet
Category 1
1.000 0.000 0.000 1.000
Category 2
0.000 0.000 0.000 1.000
Food Insecurity
Estimate Standard Error
Estimate/Standard Error
P-Value
Category 1
0.667 0.274 2.434 0.015
Category 2
0.333 0.274 1.214 0.225
Latent Class 2 Restrictive Diet
Estimate Standard Error
Estimate/Standard Error
P-Value
Category 1
0.900 0.039 23.179 0.000
Category 2
0.100 0.039 2.579 0.010
Food Insecurity
Estimate Standard Error
Estimate/Standard Error
P-Value
Category 1
0.766 0.055 13.958 0.000
Category 2
0.234 0.055 4.260 0.000
Latent Class 3 Restrictive Diet
Estimate Standard Error
Estimate/Standard Error
P-Value
Category 1
1.000 0.000 0.000 0.000

121
Category 2
0.000 0.000 0.000 1.000
Food Insecurity
Estimate Standard Error
Estimate/Standard Error
P-Value
Category 1
0.891 0.109 8.145 0.000
Category 2
0.109 0.109 0.998 0.318
Table 9
Model results three-class latent class male model
Latent Class 1 Means
Estimate Standard Error
Estimate/Standard Error
P-Value
Meals Per Day
0.667 0.273 2.442 0.015
BEDAQ EDI
3.997 0.951 4.202 0.000
Stress Fractures
1.334 0.548 2.433 0.015
Nutrition Knowledge
32.364 15.471 2.092 0.036
Body Image
2.156 0.579 3.727 0.000
Variances
Meals Per Day
0.128 0.029 4.348 0.000
BEDAQ EDI
8.029 2.122 3.784 0.000
Stress Fractures
0.258 0.057 4.490 0.000

122
Nutrition Knowledge
312.440 38.640 8.086 0.000
Body Image
0.956 0.104 9.191 0.000
Latent Class 2 Means
Estimate Standard Error
Estimate/Standard Error
P-Value
Meals Per Day
2.850 0.046 61.343 0.000
BEDAQ EDI
4.473 0.371 12.052 0.000
Stress Fractures
0.251 0.060 4.182 0.000
Nutrition Knowledge
30.936 2.252 13.716 0.000
Body Image
2.672 0.128 20.891 0.000
Variances
Meals Per Day
0.128 0.029 4.348 0.000
BEDAQ EDI
8.029 2.122 3.784 0.000
Stress Fractures
0.258 0.057 4.490 0.000
Nutrition Knowledge
312.440 38.640 8.086 0.000
Body Image
0.956 0.104 9.191 0.000
Latent Class 3 Means
Estimate Standard Error
Estimate/Standard Error P-Value

123
Meals Per Day
2.891 0.105 27.637 0.000
BEDAQ EDI
3.300 1.015 3.250 0.001
Stress Fractures
2.306 0.260 8.883 0.000
Nutrition Knowledge
23.045 5.289 4.357 0.000
Body Image
2.649 0.335 7.916 0.000
Variances
Meals Per Day
0.128 0.029 4.348 0.000
BEDAQ EDI
8.029 2.122 3.784 0.000
Stress Fractures
0.258 0.057 4.490 0.000
Nutrition Knowledge
312.440 38.640 8.086 0.000
Body Image
0.956 0.104 9.191 0.000
Fit Indices
When analyzing a latent class analysis for fit indices, several considerations should be
looked at. For smaller sample sizes of less than 300, both Akaike information criteria (AIC) and
Bayesian information criteria (BIC) should be considered. A decreasing value indicates better
model fit. Through the fit statistics table, Table 3, AIC and BIC are an index of model fit,
balance the complexity of the model against the sample size.
Model Testing

124
Comparing models with varying classes is also an important consideration for LCA. The
VLMR test compares a model with k classes to one with k-1 classes. If the p-value is greater
than 0.05, like in this circumstance, clinical relevance may be worth considering. Additionally,
the Lo-Mendel-Rubin test and BLMR can be considered.
Model Characteristics
Number of classes, class size, and separation are considered with looking at LCA model
characteristics. Entropy is a measure of class separation between the latent classes with values
above 0.80 considered a good fit. Table 3 provides two and three-class model values, but it is
important to consider that higher values do not necessarily mean that a model is the best fit and
may indicate an overfit model. The two-class model provides an acceptable value. When
considering the number of classes and class size, a small class size of less than 15% of the
sample is a concern. The two-class model revealed a class size well above that, with individuals
close to being split in half. If a class contains less than 15%, it is possible whether outliers of a
single indicator may be determining the class. In the three-class model, the smaller classes are
less likely to be externally generalizable than models with fewer, well-distributed classes and the
classes contain less than 10% of the sample which is indicative of a poor fit.
When a one-class model was conducted, few model characteristic statistics are provided
by the statistical software Mplus. Fit indices for a one-class model include an AIC of 1624.117, a
BIC of 1651.437, and an adjusted BIC of 1613.630. For the one-class model compared to the
two-class model, AIC is lower, BIC is lower, and Adjusted BIC is higher. The values are
extremely close, and due to the lack of other model fit criteria it is difficult to differentiate what
the best-fitting model is for this population. Due to the small sample size of male athletes
included in the model and the difficulty in interpreting the model fit criteria, more information is

125
needed at this time to definitely conclude that a two-class solution is superior to a one-class
solution. Therefore, H1 cannot be supported and we fail to reject the null hypothesis.
Discussion
Main Findings
This study aimed to profile male student-athletes in collegiate athletics for nutrition and
RED-S concern. Categorical and continuous indicators consistent with the RED-S framework
and new considerations such as food insecurity, nutrition knowledge, and body image were
included in the model with the goal of uncovering an unknown latent variable of classes. At a
Division I university, 72 male student-athletes completed a pre-participation physical evaluation
that included a cross-sectional nutrition screening survey. Data from the evaluation was utilized
in a latent class analysis predictive model. RED-S is an emerging syndrome with few studies in
the population of team sport athletes and collegiate athletes. Very limited information is
available for male athletes, especially male collegiate team sport athletes, regarding RED-S.
Descriptive statistics outlined in Table 1 provide some insight into the indicators of interest.
For males, the mean number of meals consumed per day was 2.760 ± 0.569. The mean nutrition
knowledge score was 30.000 ± 18.000, indicating poor nutrition knowledge. The results of the
statistical analysis provide information to support a two-class model solution to profile the
athletes of interest into separate latent classes. A practitioner’s guide was utilized to examine the
following information of fit indices, model testing, and model characteristics (Sinha et al., 2020).
Class Characteristics
In Tables 6 through 9, individual characteristics based on the indicator variables included
in the model did not clearly define class characteristics. This provides insight into the indicator
variables. A future model may consider using different tools to measure some of the RED-S

126
variables of interest. This highlights the need for high quality variables to measure RED-S health
and performance parameters in male athletes. Due to the lack of tools available for this
population, this study provides some insight into predictive modeling for this topic and
population as a starting point for other researchers.
Energy Availability
With consideration to previous RED-S research and the goal of screening, energy
availability has been typically assessed through disordered eating and eating disorder risk. At this
time no validated tool has been specifically designed for the collegiate athlete population, with
very few available for the female athlete population. The BEDA-Q tool has been utilized in the
female athlete population, specifically for adolescents, when screening for disordered eating
related to RED-S. This tool was utilized in this study due to the short length of the questionnaire
and the ease of distribution without the need for an interview, which is common in disordered
eating and eating disorder screening tools. When considering disordered eating risk, other
surrogate markers were also considered due to the lack of energy availability measurements in a
laboratory setting and the lack of validated tools for the college population. Number of meals per
day and restrictive dieting were also considered to also consider low energy availability.
Clinical Application
A main consideration of this topic is the complexity of RED-S and the difficulty of
screening athletes for a syndrome when limited tools exist for athletes of consideration that have
not been typically studied. College athletes that are not considered traditionally high risk are
often overlooked in the research. The questions that still stands at this time is does the traditional
RED-S framework apply to athletes outside of high-risk classification. Additionally, what
additional factors beyond the traditional framework may contribute to RED-S and low energy

127
syndromes and which of them may be specific to college athletes. Food insecurity, body image,
and nutrition knowledge were included in the LCA model to expand beyond the traditional
framework. As research evolves, the conceptual model for RED-S may change. An aim of this
study was to explore RED-S and low energy syndromes in a new population: non-high risk
collegiate athletes. Some findings were of interest beyond the LCA profiling.
Of the 72 male athletes included in the study, 8.3% followed a restrictive diet, 18.1%
reported eating less than 3 meals per day, 36.1% reported at least one stress fracture, 22.2% had
food insecurity, and 87.5% scored less than a 50 out of 100 on nutrition knowledge. From the
reported frequencies, it is important to note that many of the athletes have nutrition and RED-S
related issues of concern that need clinical consideration and further investigation through
consultations and referrals.
Specific to the statistical modeling technique, LCA has been previously utilized in the
healthcare setting as a clinical tool. Predictive modeling techniques as well as machine learning
have potential to assist clinicians. This exploratory study highlights a number of clinical
considerations and offers a starting point for others in the field to explore LCA and predictive
modeling techniques to explore RED-S.
Other Considerations
When a researcher is considering model fit and the number of classes for a population of
interest, their expertise regarding clinical insight is important. Classes should be separate from a
clinical standpoint through the discretion of the researcher. To prevent bias, the best fitting
model should be determined before linking the variables of interest to the classes identified. It is
possible that a 1-class model may be the best fit for a population and latent classes may not be
possible to distinguish using the indicators selected. In this model, a higher sample size and

128
higher quality indicator variables were necessary to distinctly categorize the male athletes into
latent classes. Additionally, specific variables were difficult to extract and name to each profile.
As LCA is utilized in varying disciplines, the application of LCA algorithms will evolve through
understanding best conditions, interpreting the information to the field, and clinical investigation.
There is evidence of poor model fit for the three-class solution due to two errors that
occurred. First, one or more logit thresholds approached extreme values of -15.000 and 15.000
and were fixed to stabilize model estimation. This resulted in parameters with 0 standard errors
and unknown z-score and p-values. Second, the standard errors of the model parameter estimates
may not be trustworthy for some parameters due to a non-positive definite first-order derivative
product matrix. This may be indicative of model nonidentification. This is likely due to poor
class enumeration with a higher-class number. The sample size is likely the culprit for this
model. With only 72 participants, a higher-class model can be difficult to interpret. There are no
guidelines for calculating sample size requirement a priori with recommendations suggesting the
larger the better, and into the hundreds. Smaller sample sizes may perform well for estimating
two-classes as long as the indicators are of high quality. There is a suggestion that a three-class
model may require up to 12 high quality indicators to perform well if the sample size is under
200 (Wurpts, 2012). If indicators are of low quality, sample size is recommended to be at least N
= 500 for 12, and if N =1000 if there are 6 low quality indicators. Some possible
recommendations if working with a smaller sample size is to include a higher number and
quality of indicators and adding a covariate. Sample size may be limited in a university setting
with a range of athletes depending on athletic conference, division, and school funding and size.
Especially in male athletes, many coaches and support staff may be biased towards male athletes

129
not being of RED-S concern. This warrants further investigation in male team sport athletes
beyond those considered at risk.
Another consideration for LCA is zero variances. Due to data sparseness with the BEDA-
Q disordered eating indicator, an alternate value from the tool was used. The EDI sum of 6
values was used in place of a binary, yes or no classification to reduce data sparseness and to
raise variance values away from zero. The BEDA-Q may need to be reconsidered for use in the
college athletic population because it at this time has only been validated in adolescent female
athletes. Results from the BEDA-Q tool include that only no male athletes screened positive for
eating disorder risk, leading to zero variance in the data set. This presents valuable information
that highlights a need for screening tools specific to male athletes and college athletes and a
validated tool specific to this population to determine true eating disorder risk. Future research
efforts should ensure the LCA model has few missing values relative to sample size and the
sample size is large enough for indicators of interest.
The main consideration at this time is the lack of validated nutrition screening surveys for
the collegiate athlete population. While some RED-S surveys may be in progress, at this time
there is a need for comprehensive nutrition screening tools with a focus on RED-S to be created
specific to this population. Utilizing a validated screening tool with a LCA approach may have
resulted in a model with more use of interpretation. This exploratory approach of LCA modeling
may provide health care practitioners valuable information in the future if the measures are
reliable and validated for the population of interest.
Strengths and Limitations
A strength of this study is that it provided insight and a starting point into a predictive
modeling technique to identify classes of athletes who may be of nutrition and RED-S concern.

130
This technique may prove to be useful in the future to provide sports medicine practitioners and
sports dietitians information. This would ideally be used in the first step of a treatment plan to
then move forward with additional diagnostic tests such as the DEXA, bloodwork, body
composition testing, and additional consultations and interviews to make the diagnosis of RED-
S. This would be helpful in settings with limited sports medicine staff or high patient loads
where each individual may not be able to be diagnostically tested. As previously mentioned, the
goal of screening differs from the goal of diagnosing. All the individuals screened for RED-S
may not present with diagnostic criteria for RED-S, but the opposite end of the spectrum of
flagging athletes of concern prior to detrimental outcomes is worth the time and effort.
Another strength of this study is that it is one of the few studies that explores RED-S
screening and the first study to do so in the collegiate setting. Male athletes are rarely studied and
athletes of concern may not be identified as a result of bias, so an approach such as LCA may
provide evidence of the grouping of individuals of concern into a class based on indictors used.
A limitation of this study is that the athletes were only measured at one point in time at
pre-participation physicals. Using screening data from incoming and returning athletes at the
time of pre-participation physicals does not account for athletes who may present with nutrition
concerns or RED-S throughout the duration of the academic year. A possible solution is multiple
time points of screening which could then be used in a longitudinal LCA model. It is necessary
to have practitioners well-versed in RED-S symptomology to be diligent about detecting
behaviors of concern and impaired health outcomes related to the syndrome, especially for male
athletes who may not traditionally be considered at risk. Another limitation is the sample size.
Future research should consider higher sample sizes when utilizing LCA if participants are
accessible.

131
Another limitation is that a screening tool for male athletes is not available at this time.
For female athletes, menstrual function is commonly used, but there are no validated, equivalent
measures at this time. As the body of literature expands, considering male athlete endocrine
function through a screening tool is of high importance.
Conclusion
This research provided insight into a predictive modeling technique for a complex
syndrome in male collegiate athletes. This person-centered approach is exploratory in nature and
differs from most clustering techniques. This approach can be utilized when the aim is on the
individual, and when exploring an unknown latent variable which can be common in healthcare
or sports science.
The goal of this research was to employ an exploratory and predictive modeling
technique to profile athletes at risk for nutrition and RED-S concern. A two-class model was not
determined the best fit to uncover classes of individuals of concern, leading to the conclusion
that the model fit criteria did not provide enough evidence that male athletes included in the
model could be profiled into distinct classes. With more accurate and validated tools, this
modeling technique may provide insight into a cost-effective and timely technique to identify
individuals of concern at pre-participation evaluations. Additionally, screening information from
multiple universities or universities with larger student-athlete populations may provide a more
stable LCA model to allow for higher class enumeration. Male athletes may be difficult to study
and screen because staff may not consider male team sport athletes of concern. Nutrition and
RED-S screening should be the first step before diagnosis to allow for the allocation of time and
resources to athletes of identified concern. Future studies should consider sport specific surveys
due to differing dynamics in individual and team sports. In the colligate setting, a RED-S

132
screening tool and eventually a RED-S diagnostic tool with consideration to male and team sport
athletes is of high importance. Overall, this predictive modeling technique provides insight into
individual athletes who may need to be monitored and evaluated for RED-S. Three additional
indicators of RED-S were included in the model, providing insight into additional considerations
beyond the RED-S framework. At this time, a validated screening tool and RED-S protocol for
distribution is of high importance in the collegiate setting but until one is validated, predictive
modeling through models such as LCA may provide insight to best detect athletes of RED-S
concern.

133
LIST OF REFERENCES

134
Ackerman, K. E., Holtzman, B., Cooper, K. M., Flynn, E. F., Bruinvels, G., Tenforde, A. S., . . .
Parziale, A. L. (2019). Low energy availability surrogates correlate with health and
performance consequences of Relative Energy Deficiency in Sport. Br J Sports Med,
53(10), 628-633. doi:10.1136/bjsports-2017-098958
Bullock, G. S., Hughes, T., Sergeant, J. C., Callaghan, M. J., Riley, R., & Collins, G. (2021).
Methods matter: clinical prediction models will benefit sports medicine practice, but only
if they are properly developed and validated. British Journal of Sports Medicine,
bjsports-2021-104329. doi:10.1136/bjsports-2021-104329
Burke, L. M., Close, G. L., Lundy, B., Mooses, M., Morton, J. P., & Tenforde, A. S. (2018).
Relative Energy Deficiency in Sport in Male Athletes: A Commentary on Its Presentation
Among Selected Groups of Male Athletes. Int J Sport Nutr Exerc Metab, 28(4), 364-374.
doi:10.1123/ijsnem.2018-0182
Chapman, J., & Woodman, T. (2016). Disordered eating in male athletes: a meta-analysis.
Journal of Sports Sciences, 34(2), 101-109. doi:10.1080/02640414.2015.1040824
Condo, D., Lohman, R., Kelly, M., & Carr, A. (2019). Nutritional Intake, Sports Nutrition
Knowledge and Energy Availability in Female Australian Rules Football Players.
Nutrients, 11(5). doi:10.3390/nu11050971
De Souza, M. J., Koltun, K. J., & Williams, N. I. (2019). The Role of Energy Availability in
Reproductive Function in the Female Athlete Triad and Extension of its Effects to Men:
An Initial Working Model of a Similar Syndrome in Male Athletes. Sports medicine.
doi:10.1007/s40279-019-01217-3

135
Elliott-Sale, K. J., Tenforde, A. S., Parziale, A. L., Holtzman, B., & Ackerman, K. E. (2018).
Endocrine Effects of Relative Energy Deficiency in Sport. Int J Sport Nutr Exerc Metab,
28(4), 335-349. doi:10.1123/ijsnem.2018-0127
Falsetti, L., Gambera, A., Barbetti, L., & Specchia, C. (2002). Long-Term Follow-Up of
Functional Hypothalamic Amenorrhea and Prognostic Factors. The Journal of Clinical
Endocrinology & Metabolism, 87(2), 500-505. doi:10.1210/jcem.87.2.8195
Ferguson, S. L., G. Moore, E. W., & Hull, D. M. (2019). Finding latent groups in observed data:
A primer on latent profile analysis in Mplus for applied researchers. International
Journal of Behavioral Development, 44(5), 458-468. doi:10.1177/0165025419881721
Galli, N., Petrie, T. A., Reel, J. J., Chatterton, J. M., & Baghurst, T. M. (2014). Assessing the
Validity of the Weight Pressures in Sport Scale for Male Athletes. Psychology of Men &
Masculinity, 15(2), 170-180. doi:10.1037/a0031762
Galli, N., Reel, J. J., Petrie, T., Greenleaf, C., & Carter, J. (2011). Preliminary development of
the weight pressures in sport scale for male athletes. Journal of Sport Behavior, 34(1).
Hackney, A. C., Lane, A. R., Register-Mihalik, J., & Oʼleary, C. B. (2017). Endurance Exercise
Training and Male Sexual Libido. Med Sci Sports Exerc, 49(7), 1383-1388.
doi:10.1249/mss.0000000000001235
Heaney, S., O'Connor, H., Michael, S., Gifford, J., & Naughton, G. (2011). Nutrition knowledge
in athletes: a systematic review. Int J Sport Nutr Exerc Metab, 21(3), 248-261.
doi:10.1123/ijsnem.21.3.248
Heikura, I. A., Uusitalo, A. L. T., Stellingwerff, T., Bergland, D., Mero, A. A., & Burke, L. M.
(2018). Low Energy Availability Is Difficult to Assess but Outcomes Have Large Impact

136
on Bone Injury Rates in Elite Distance Athletes. International journal of sport nutrition
and exercise metabolism, 28(4), 403-411. doi:10.1123/ijsnem.2017-0313
Hendrickse, J., Arpan, L. M., Clayton, R. B., & Ridgway, J. L. (2017). Instagram and college
women's body image: Investigating the roles of appearance-related comparisons and
intrasexual competition. Computers in Human Behavior, 74, 92-100.
Keay, N., Francis, G., & Hind, K. (2018). Low energy availability assessed by a sport-specific
questionnaire and clinical interview indicative of bone health, endocrine profile and
cycling performance in competitive male cyclists. BMJ Open Sport & Exercise Medicine,
4(1), e000424. doi:10.1136/bmjsem-2018-000424
Kristjansdottir, H., Sigurethardottir, P., Jonsdottir, S., Thornorsteinsdottir, G., & Saavedra, J.
(2019). Body Image Concern and Eating Disorder Symptoms Among Elite Icelandic
Athletes. Int J Environ Res Public Health, 16(15). doi:10.3390/ijerph16152728
Lo, Y., Mendell, N. R., & Rubin, D. B. (2001). Testing the number of components in a normal
mixture. Biometrika, 88(3), 767-778.
Logue, D. M., Madigan, S. M., Melin, A., Delahunt, E., Heinen, M., Donnell, S. M., & Corish,
C. A. (2020). Low Energy Availability in Athletes 2020: An Updated Narrative Review
of Prevalence, Risk, Within-Day Energy Balance, Knowledge, and Impact on Sports
Performance. Nutrients, 12(3). doi:10.3390/nu12030835
Maimoun, L., Georgopoulos, N. A., & Sultan, C. (2014). Endocrine disorders in adolescent and
young female athletes: impact on growth, menstrual cycles, and bone mass acquisition. J
Clin Endocrinol Metab, 99(11), 4037-4050. doi:10.1210/jc.2013-3030
McCutcheon, A. L. (1987). Latent class analysis: Sage.

137
Melin, A., Tornberg, Å. B., Skouby, S., Faber, J., Ritz, C., Sjödin, A., & Sundgot-Borgen, J.
(2014). The LEAF questionnaire: a screening tool for the identification of female athletes
at risk for the female athlete triad. Br J Sports Med, 48(7), 540-545.
Mori, M., Krumholz, H. M., & Allore, H. G. (2020). Using latent class analysis to identify
hidden clinical phenotypes. Jama, 324(7), 700-701.
Mountjoy, M., Sundgot-Borgen, J., Burke, L., Ackerman, K. E., Blauwet, C., Constantini, N., . . .
Budgett, R. (2018). International Olympic Committee (IOC) Consensus Statement on
Relative Energy Deficiency in Sport (RED-S): 2018 Update. Int J Sport Nutr Exerc
Metab, 28(4), 316-331. doi:10.1123/ijsnem.2018-0136
Mountjoy, M., Sundgot-Borgen, J., Burke, L., Carter, S., Constantini, N., Lebrun, C., . . .
Ljungqvist, A. (2014). The IOC consensus statement: beyond the Female Athlete Triad—
Relative Energy Deficiency in Sport (RED-S). British Journal of Sports Medicine, 48(7),
491-497. doi:10.1136/bjsports-2014-093502
Mountjoy, M. L., Burke, L. M., Stellingwerff, T., & Sundgot-Borgen, J. (2018). Relative Energy
Deficiency in Sport: The Tip of an Iceberg. Int J Sport Nutr Exerc Metab, 28(4), 313-
315. doi:10.1123/ijsnem.2018-0149
Nose-Ogura, S., Yoshino, O., Dohi, M., Kigawa, M., Harada, M., Hiraike, O., . . . Saito, S.
(2019). Risk factors of stress fractures due to the female athlete triad: Differences in teens
and twenties. Scand J Med Sci Sports, 29(10), 1501-1510. doi:10.1111/sms.13464
Nylund-Gibson, K., & Choi, A. Y. (2018). Ten frequently asked questions about latent class
analysis. Translational Issues in Psychological Science, 4(4), 440.

138
Poll, K. L., Holben, D. H., Valliant, M., & Joung, H.-W. (2018). Food insecurity is associated
with disordered eating behaviors in NCAA division 1 male collegiate athletes. Journal of
American College Health, 1-5.
Sim, A., & Burns, S. F. (2021). Review: questionnaires as measures for low energy availability
(LEA) and relative energy deficiency in sport (RED-S) in athletes. Journal of Eating
Disorders, 9(1), 41. doi:10.1186/s40337-021-00396-7
Spurk, D., Hirschi, A., Wang, M., Valero, D., & Kauffeld, S. (2020). Latent profile analysis: A
review and “how to” guide of its application within vocational behavior research. Journal
of Vocational Behavior, 120, 103445.
Tenforde, A. S., Barrack, M. T., Nattiv, A., & Fredericson, M. (2016). Parallels with the Female
Athlete Triad in Male Athletes. Sports Med, 46(2), 171-182. doi:10.1007/s40279-015-
0411-y
Tenforde, A. S., DeLuca, S., Wu, A. C., Ackerman, K. E., Lewis, M., Rauh, M. J., . . . Roberts,
W. (2021). Prevalence and factors associated with bone stress injury in middle school
runners. PM&R.
Valliant, M. W., Pittman Emplaincourt, H., Kieckhaefer Wenzel, R., & Garner, B. H. (2012).
Nutrition Education by a Registered Dietitian Improves Dietary Intake and Nutrition
Knowledge of a NCAA Female Volleyball Team. Nutrients, 4(6), 506-516.
Werner, E. N., Guadagni, A. J., & Pivarnik, J. M. (2020). Assessment of nutrition knowledge in
division I college athletes. Journal of American College Health, 1-8.

139
APPENDIX

140
Summary of screening measures for male student-athletes
BEDA-Q
EDI
Dietary Practices
Meals Per Day Bone Health ANSK-Q Food Insecurity
WPS
I feel extremely guilty after overeatinga
I am preoccupied with the desire to be thinnera
I think that my stomach is too biga
I feel satisfied with the shape of my bodya
My parents have expected excellence of mea
As a child, I tried very hard to avoid disappointing my parents and teachersa
Are you currently following or have you ever followed any special dietary considerations for personal reasons, diagnosed conditions, or religious reasons? b
Options:
Vegetarian,
Semi-
Vegetarian,
Vegan,
Gluten-free,
Dairy-free,
Lactose-free,
Paleo,
Ketogenic,
Intermittent
Fasting,
Low carb,
Fasting for
religious
reasons
(Ramadan,
etc.), Low
FOD-MAP
Please list your food intake for the past 24 hours in each of the categories. Do your best to estimate the amounts (i.e. one handful, one fistful), quantity of food items, if you prepared it at home or out (and list restaurant) and as specific as possible.c
Have you ever had a stress fracture? b
How many stress fractures have you had?d
What was the site of your stress fracture(s)?
Options: Lumbar spine
Femoral neck Sacrum Pelvis
Full questionnaire in Appendix
Within the past 12 months I was worried whether my food would run out before I got money to buy more.e
Within the past 12 months the food I bought just didn't last and I didn't have money to get more.e
In the past year, my coach places an emphasis on team members’ weightf
In the past year, my coach encourages athletes to gain muscle massf
Weigh-ins are held periodically throughout the seasonf
Body weight and appearance are important to my coachf
My teammates notice if I put on weightf
Any of my body flaws are readily apparent in my uniformf
The crowd scrutinizes my body and makes me concerned about my weight and appearancef
In the past year, have you lost weight to meet image requirements for your sport? f
In the past year, have you ever ate in secret? f
Body weight and appearance are important to my friends outside of sportf
Body weight and appearance are important to my familyf
The leanest athletes are at a distinct performance advantagef
Note. Brief Eating Disorder in Athletes Questionnaire (BEDA-Q)

141
Abridged Nutrition for Sport Knowledge Questionnaire (A-NSKQ) Weight Pressures in Sport (WPS) aAnswer choices: always, usually, sometimes, often, never bAnswer choices: yes, no cAnswer choices: Breakfast, Lunch, Dinner, Snacks, Beverages dAnswer choices: 1, 2, 3, 4, 5, >5 eAnswer choices: often true, sometimes true, never true fAnswer choices: always, usually, often, sometimes, rarely, never
Latent Class Analysis Syntax Title: Dissertation Male New Model LCA; Variable: names = RESdiet Meals BEDAQEDI SF FoodIns ANSKQ WPS; usevariables = RESdiet Meals BEDAQEDI SF FoodIns ANSKQ WPS; categorical = RESdiet FoodIns; classes = c(2); Analysis: type = mixture; STARTS = 0; LRTSTARTS = 0 0 300 20; Savedata: file = Male_Model_Mplus_save_test.txt; save = cprob; format = free; Output: tech11 tech14;
142
VITA
Morgan Delventhal, MS, RD, CSSD Academic Preparation University of Mississippi, Oxford, Mississippi Doctor of Philosophy, 2019-2021; Field of Study: Nutrition and Hospitality Management Major: Nutrition Concentration: Sports Nutrition University of Mississippi, Oxford, Mississippi Master of Science, 2017-2019; Field of Study: Nutrition and Hospitality Management Major: Nutrition University of Kentucky, Lexington, Kentucky Bachelor of Science, 2013-2017; Field of Study: Dietetics and Human Nutrition Major: Dietetics (Coordinated Program) Dietetic Internship Rotations: January-August 2017, Foodservice, University of Kentucky Dining, Community Nutrition, University of Kentucky Athletics, Medical Nutrition Therapy, Baptist Health Madisonville Professional Credentials and Experience Licenses/Credentials/Certifications Licenses/Credentials Registered Dietitian (RD), ID: 86090133. Academy of Nutrition and Dietetics, January 2018-Present. Board Certified Specialist in Sports Dietetics (CSSD), ID: 86090133. Academy of Nutrition and Dietetics, March 2020-March 2025. Certifications

143
International Society for the Advancement of Kinanthropometry (ISAK) Level 1
Anthropometrist, University of Mississippi, 2018. Electronic Learning Endorsement Program (eEP) Online Course Training, University of Mississippi, (May 2020). Professional Positions Graduate Instructor, The University of Mississippi, University, MS NHM 319: Foundations in Sports Nutrition (2021)
Graduate Assistant Sports Dietitian, The University of Mississippi, University, MS Ole Miss Athletics (2017-2021)
Team Dietitian: Baseball, Soccer, Men’s Tennis, Women’s Tennis, Rifle, Track & Field (2017-2021) Student Volunteer Coordinator: August 2017- May 2019 Gillom Olympic Sport Fueling Station Manager: 2017-2021
Baseball Fueling Station Manager: 2020 Scholarly and Creative Activities/Accomplishments Presentations Non-Refereed Poster Presentations Delventhal M, Valliant MW, Callaway K, Franks C, Slatniske M. Comparison of ADP and
ISAK body composition assessment in D1 collegiate athletes. SCAN Annual Conference Symposium, Phoenix, AZ, April 26, 2019.
Guest Lectures Health Promotion (HP 313) Guest Lecture. The Career of a Sports Dietitian and Nutrition Related to Injury Recovery. September 2020. The University of Mississippi.
Invited Guest Speaking Student Dietetic and Nutrition Association (SDNA) Guest Speaker. SDNA Alumni Panel. November 2020. The University of Kentucky. Student Dietetics Association (SDA) Guest Speaker. The Career Path of a Sports Nutrition Graduate Assistant. October 2017. The University of Mississippi. Professional Association Memberships and Service

144
Academy of Nutrition and Dietetics (2014-Present)
• Sports and Human Performance Nutrition (SHPN) (2018-Present)
Collegiate and Professional Sports Dietitian Association (CPSDA) (2015-Present)
• Research and Education Committee American Society of Nutrition (ASN) (March 2020-March 2021) Instruction and Advisement a. Courses Taught (University of Mississippi, 2018-2021) University of Mississippi, Fall 2021 NHM 319 Foundations in Sports Nutrition (graduate instructor) University of Mississippi, Spring 2018 (March-May 2018) NHM 311 Introduction to Nutrition (graduate instructor)